
ANTI-PROFILE METHODS FOR ANOMALY CLASSIFICATION
40
+ ANTI-PROFILE METHODS FOR ANOMALY CLASSIFICATION Héctor Corrada Bravo Wikum Dinalankara Center for Bioinformatics and Computational Biology University of Maryland, College Park
Transcript of ANTI-PROFILE METHODS FOR ANOMALY CLASSIFICATION

+
ANTI-PROFILE METHODS FOR ANOMALY CLASSIFICATION
Héctor Corrada Bravo Wikum Dinalankara
Center for Bioinformatics and Computational Biology University of Maryland, College Park
+Anomaly Detection
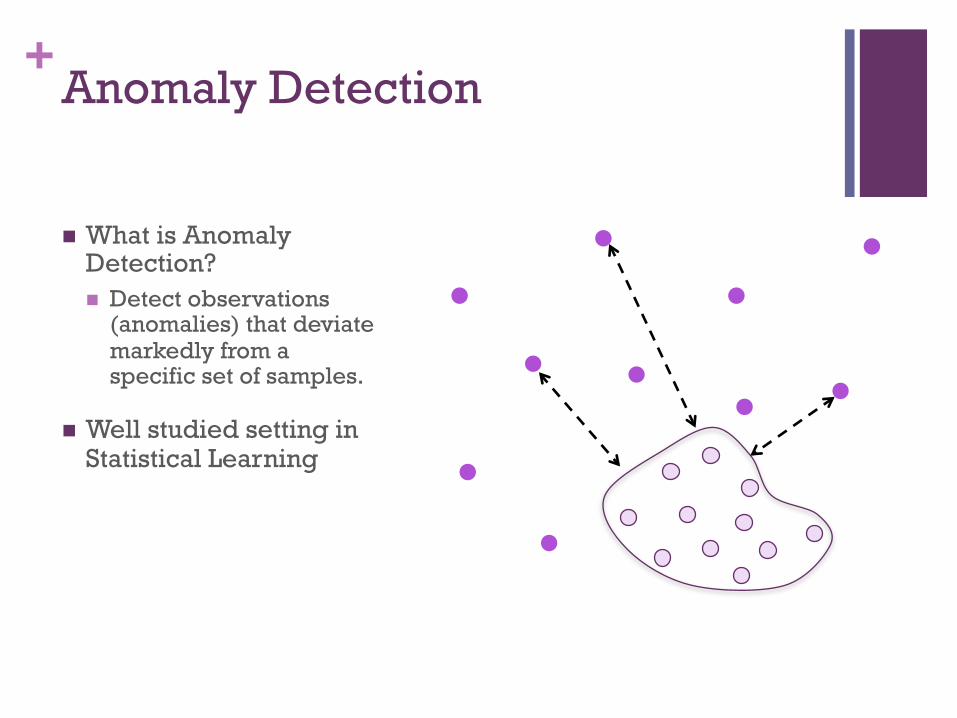
! What is Anomaly Detection? ! Detect observations
(anomalies) that deviate markedly from a specific set of samples.
! Well studied setting in Statistical Learning

+Anomaly Detection
! What is Anomaly Detection? ! Detect observations
(anomalies) that deviate markedly from a specific set of samples.
! Wide variety of applications: ! Intrusion and fraud detection
! Medical and health records
! Sensor networks

+Anomaly Detection
! What is Anomaly Detection? ! Detect observations
(anomalies) that deviate markedly from a specific set of samples.
! Many approaches: ! Nearest-neighbor methods
! Probabilistic methods
! Classification methods(e.g. SVM)
+Anomaly Classification
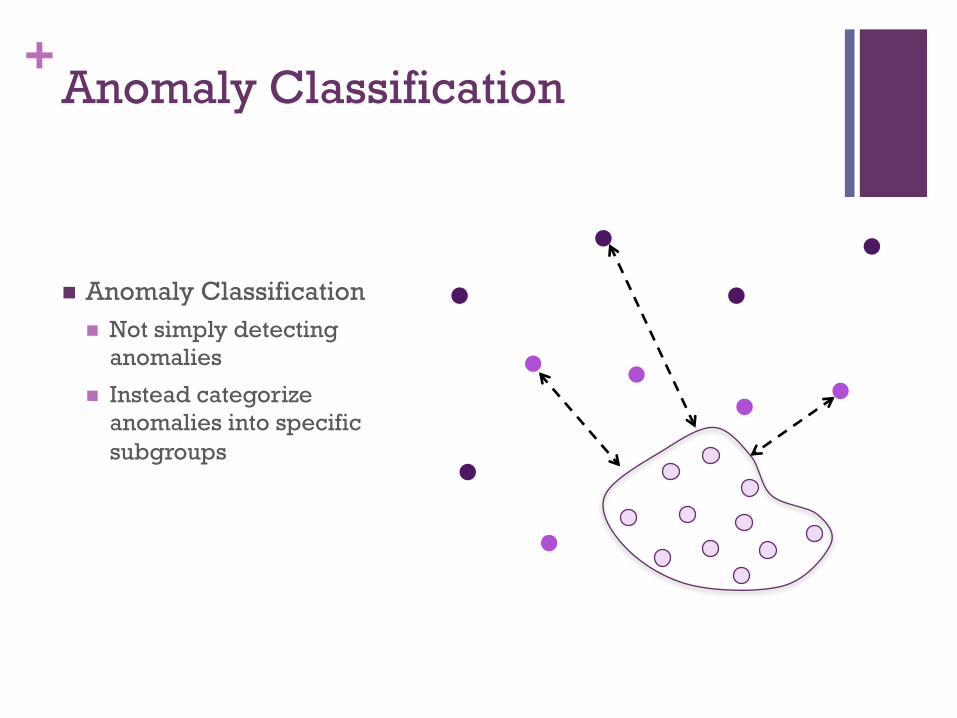
! Anomaly Classification ! Not simply detecting
anomalies
! Instead categorize anomalies into specific subgroups
+Anti-Profile Methods for Anomaly Classification
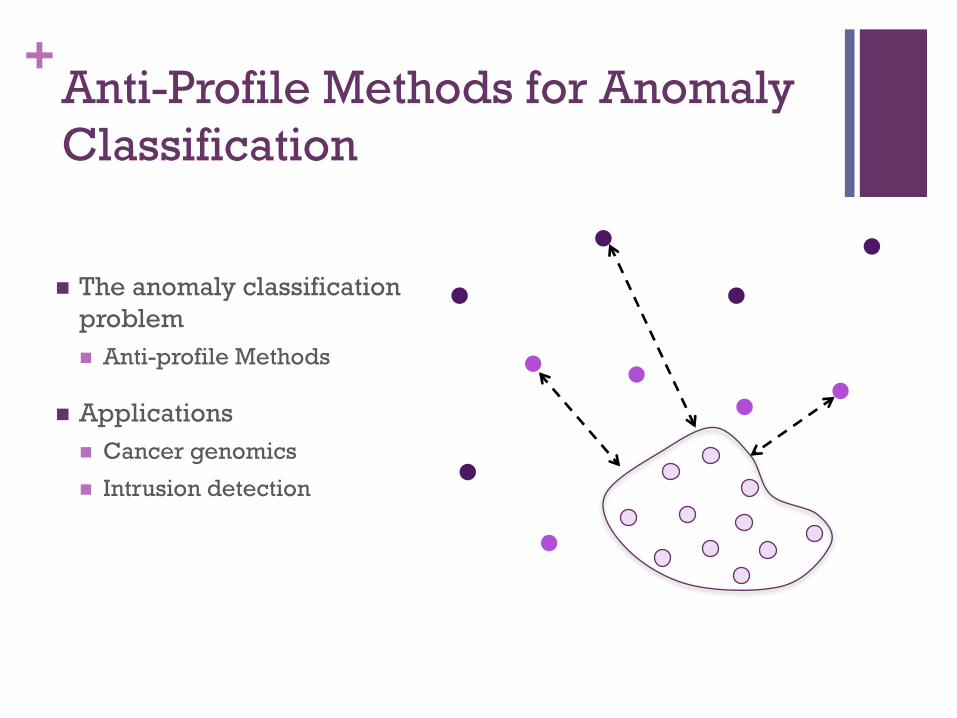
! The anomaly classification problem ! Anti-profile Methods
! Applications ! Cancer genomics
! Intrusion detection

+Our Motivation: Cancer Screening
+Cancer Screening
! Early cancer screening helps treatment and improves survival rate
! However, significant issues exist: ! Costly ! Inconvenient and invasive procedures
! Genomic methods are proposed as alternative to address these issues ! Microarray based methods have been used to develop gene
signatures ! Not very successful in the clinic due low reproducibility
+Cancer Screening
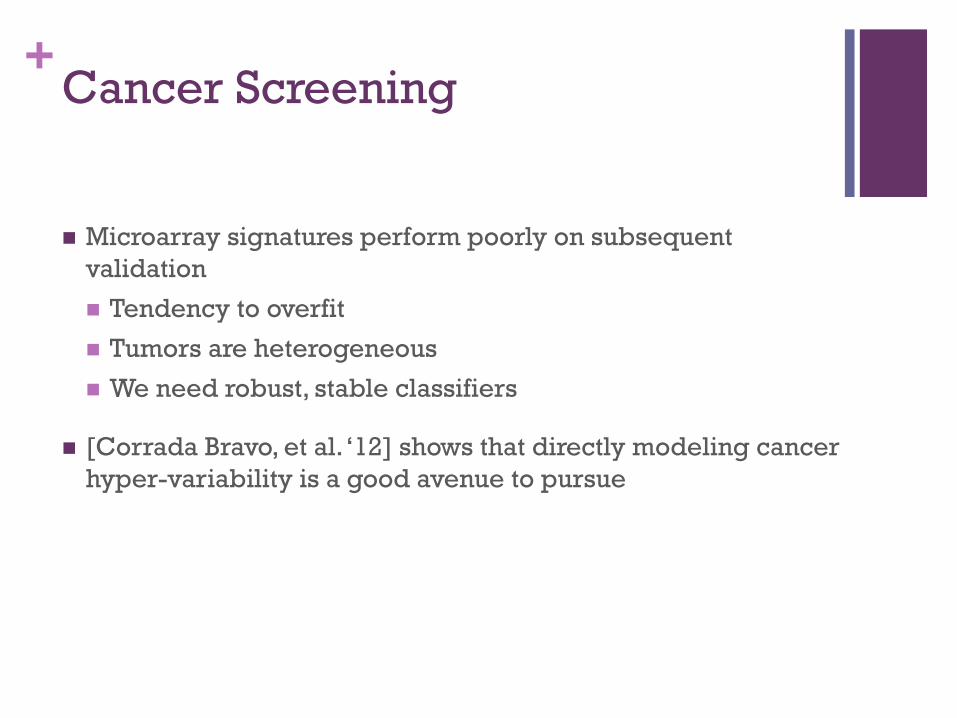
! Microarray signatures perform poorly on subsequent validation
! Tendency to overfit
! Tumors are heterogeneous
! We need robust, stable classifiers
! [Corrada Bravo, et al. ‘12] shows that directly modeling cancer hyper-variability is a good avenue to pursue
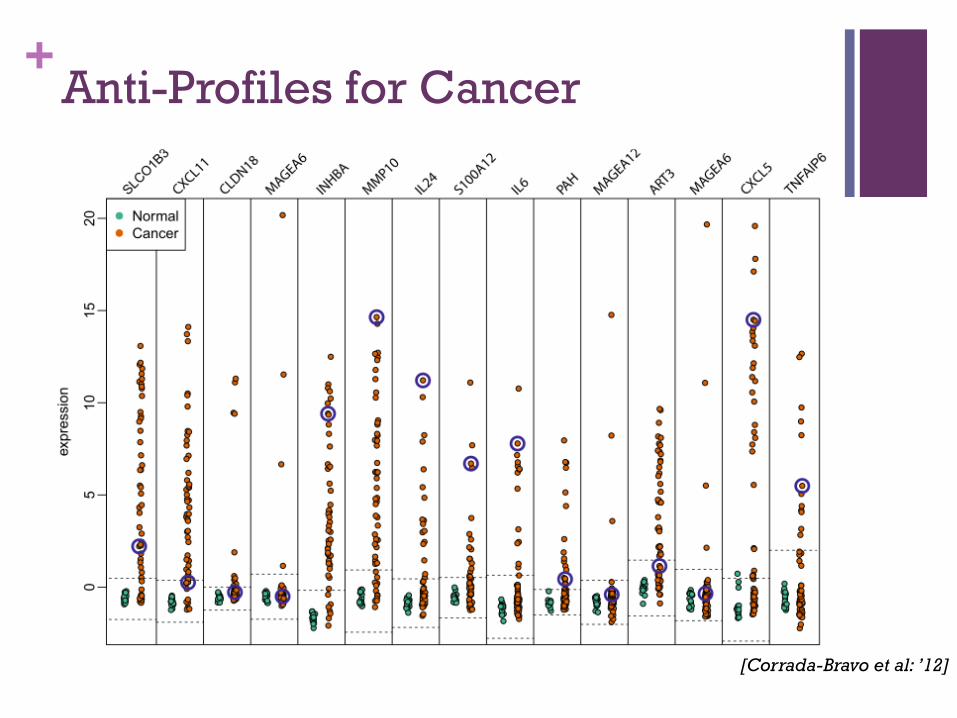
+Anti-Profiles for Cancer
[Corrada-Bravo et al: ’12]

+Anti-Profile Score
! Feature selection:
! Sgc = standard deviation of cancers, feature g
! Sgn = standard deviation of normals, feature g
! Rank features by rg
! Cutoffs for each feature: ! cutoff = median of normals ± 5 × median absolute deviation of normals
! Score: ! For a tumor sample, count the number of features lying outside cutoff
rg = log2SgcSgn
[Corrada-Bravo et al: ’12]

+Anti-Profiles for Cancer
[Corrada-Bravo et al: ’12]

+Anti-Profile Score
! Colon cancer anti-profile scoring:
[Corrada-Bravo et al: ’12]

+Universal Anti-Profile
[Corrada-Bravo et al: ’12]

+Anti-Profile Score
! Anti-Profiles are robust and stable tumor/normal classifiers ! Based on idea of deviation from normal expression (anomaly
detection)
! Open question: can we use this to distinguish between tumors (anomaly classification)?
+Anti-Profile Methods for Tumor Prognosis and Diagnosis W. Dinalankara and H. Corrada Bravo. In preparation.

+Tumor Progression ! Normals make a cohesive group, tumors deviate
! Cancers deviate more than Adenomas (benign tumors)
Adrenocortical Tumors
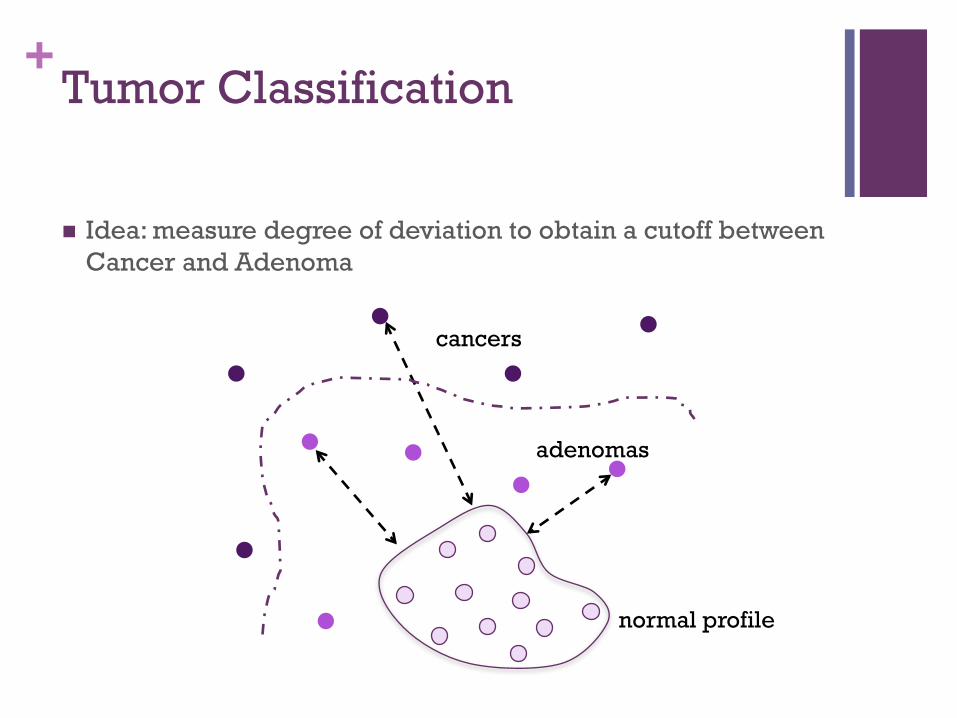
+Tumor Classification
! Idea: measure degree of deviation to obtain a cutoff between Cancer and Adenoma
normal profile
cancers
adenomas

+Adrenocortical Tumors
! Distribution of ratio of variance (log scale)

+Adrenocortical Tumors
! Prediction using anti-profile scores
(probeset selection: 100 highest ranked features from universal anti-profile signature)

+Tumor Progression
! Anti-profiles can distinguish samples along progression spectrum ! Based on deviation from normality
! Hypothesis: this can help predict clinical outcomes like survival and relapse
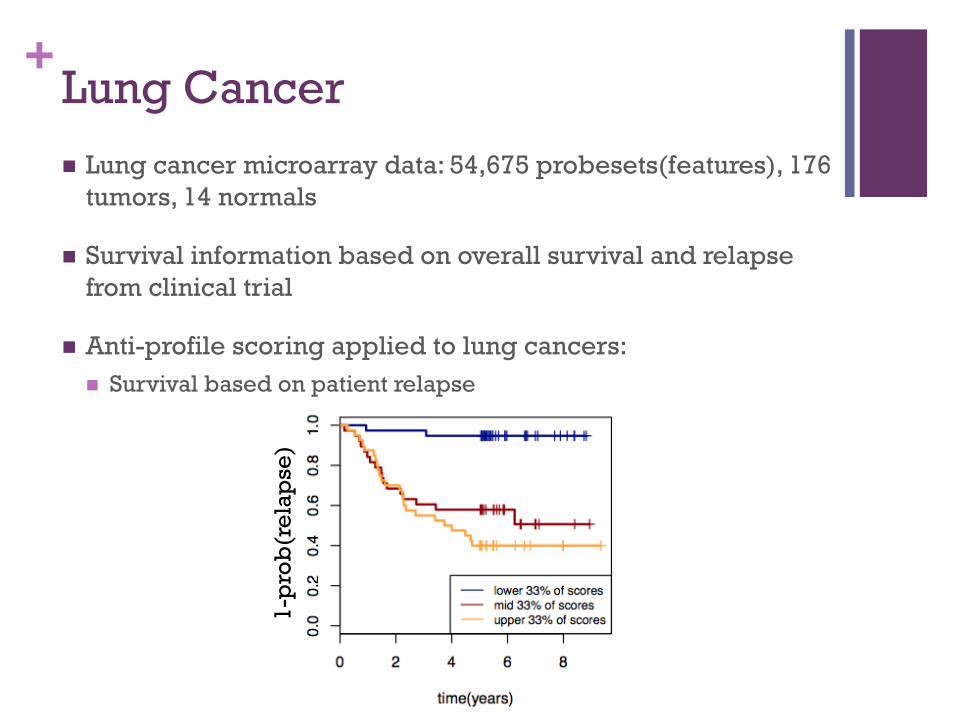
+Lung Cancer ! Lung cancer microarray data: 54,675 probesets(features), 176
tumors, 14 normals
! Survival information based on overall survival and relapse from clinical trial
! Anti-profile scoring applied to lung cancers: ! Survival based on patient relapse
1-p
rob
(rel
apse
)

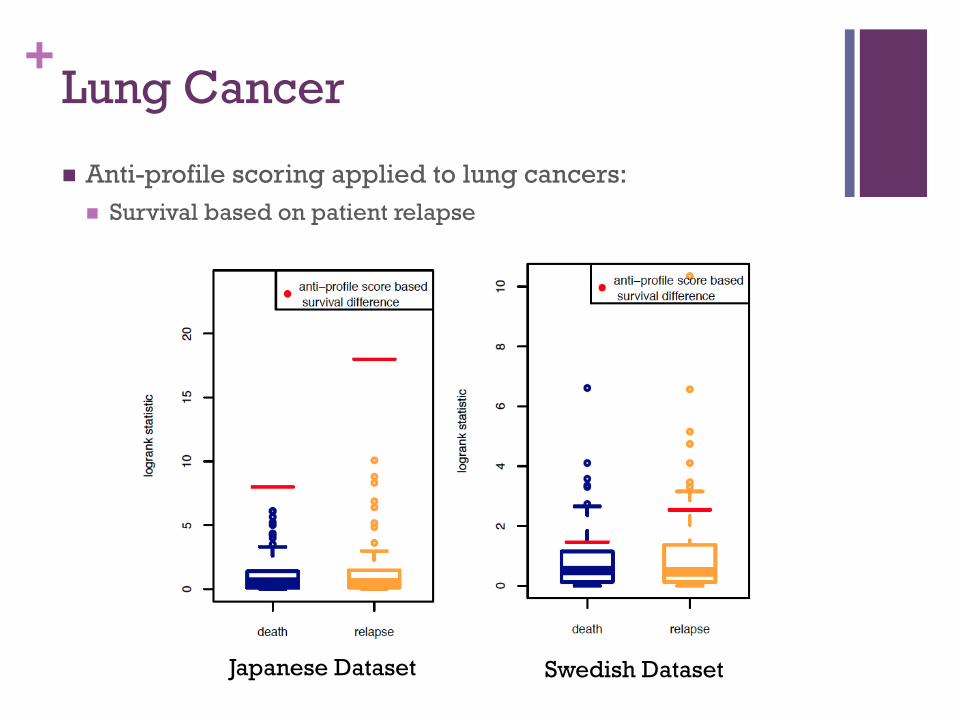
+Lung Cancer ! Anti-profile scoring applied to lung cancers:
! High risk-low risk classification based on relapse within 5 years
Japanese Dataset Swedish Dataset
Source: National Cancer Center Research Institute, Japan
Source: Uppsala University, Sweden
! High Risk – Low Risk grouping ! High Risk : death/relapse occurs within n years
! Low Risk: no death/relapse within n years
+Lung Cancer
! Anti-profile scoring applied to lung cancers: ! Survival based on patient relapse
Japanese Dataset Swedish Dataset

+Tumor Progression
! Anti-profiles can distinguish samples along progression spectrum ! Based on deviation from normality
! Hypothesis: this can help predict clinical outcomes like survival and relapse ! For lung cancer, anomaly classification with universal anti-profile
genes can detect high relapse probability

+Beyond Anti-Profile Score Similarity-based kernel methods
+Single Class SVM
! Support vector classifier to learn a single class
! Measures distance from the boundary of the single class
! Used for anomaly detection

+Single Class SVM
! Anti-Profile Tumor classification is an anomaly classification problem
! Model normal class, measure deviation from boundary
! Single class SVM performs this with a non-linear boundary via kernel methods
wTφ(x)− ρ = 0
normals
anomalies

+Lung Cancer: Single Class SVM Results
! Decision values from single class SVM ! Survival based on patient relapse
1-p
rob
(rel
apse
)
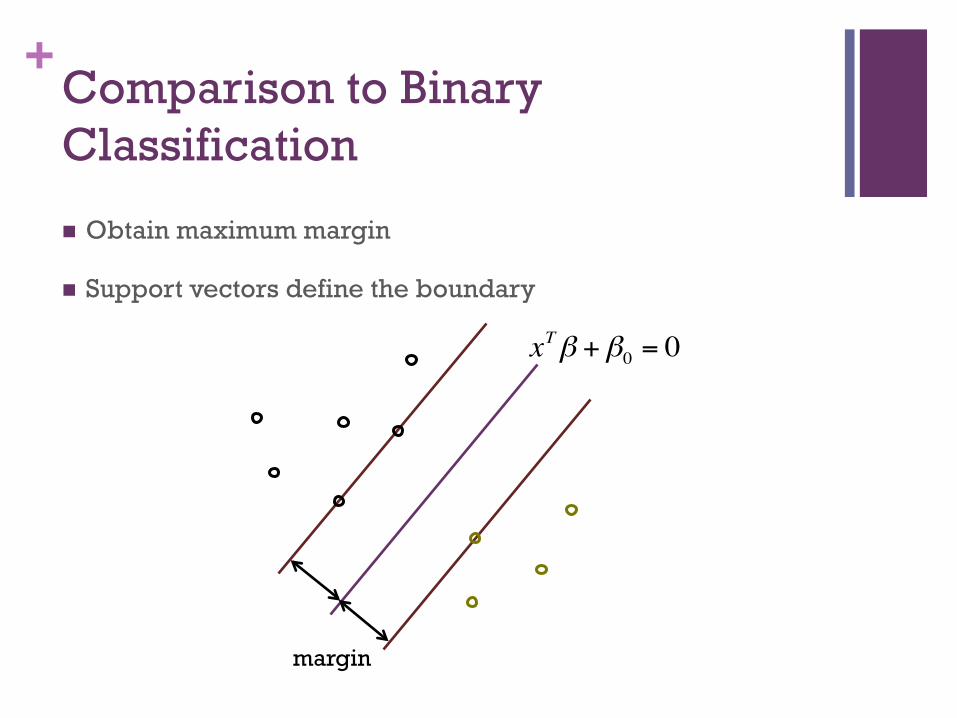
+Comparison to Binary Classification
! Obtain maximum margin
! Support vectors define the boundary
xTβ +β0 = 0
margin

+Lung Cancer: Single Class SVM Results
! Training and testing sets drawn with resampling from dataset 1
! AUC obtained using high risk-low risk classification (based on patient relapse within 5 years)

+Single Class SVM: Issues
! Single Class SVM: difficult to obtain a cutoff
! Regular SVM cannot use normals

+Single Class SVM: Issues
! Solution : Anti-Profile SVM(apSVM) ! Use both normals and tumors for fitting SVM
! Classification function in a functional space spanned by representers of only the normal samples
! Perform binary SVM classification in the projected space
! Equivalent to projecting the tumors samples (in RKHS) onto sub-space defined by normals

+Anti-Profile SVM (apSVM)
! Regular SVM solution:
! Replace K with indirect kernel:
! Ks = kernel matrix between tumors and normals
! Kn = kernel matrix between normals
K~= Ks
TKn−1Ks
αi −12i=1
n
∑ αij=1
n
∑i=1
n
∑ α j yiyjk xi, x j( )maximize
normals
cancers
adenoma
direct similarity
indirect similarity

+Lung Cancer: Applying the apSVM

+Thyroid Methylation : Applying the apSVM
! Methylation values for 384 sites from normal, adenoma and cancer thyroid samples

+Thyroid Methylation : Applying the apSVM

+Stability of the apSVM
! The apSVM uses fewer tumor samples to define the boundary
! The less support vectors an SVM uses, the more stable
! If a large portion of the training samples become support vectors, removing any sample would change the decision boundary
Lung Cancer Thyroid Cancer

+Lung Cancer: Applying the apSVM
! Cross-dataset performance:
Training Dataset
Feature Selec1on
Single Class SVM (AUC)
Regular SVM (AUC)
apSVM (AUC)
Tes1ng Dataset
Dataset 1 Tumor vs. normal t sta1s1cs 0.76 0.24 0.57 Dataset 2
(Japanese Dataset) High risk vs. Low risk t sta1s1cs 0.74 0.61 0.73 (Swedish Dataset)
Universal ap genes 0.75 0.57 0.57
Dataset 2 Tumor vs. Normal t-‐sta1s1cs 0.73 0.44 0.45 Dataset 1
(Swedish Dataset) High risk vs. Low risk t-‐sta1s1cs 0.75 0.3 0.69 (Japanese Dataset)
Universal ap genes 0.74 0.51 0.55

+Non-linear Anti-Profile Methods for Anomaly Classification
! Summary ! Single-class SVM using anti-profile genes is accurate and stable
! Performs very well across datasets
! The apSVM outperforms standard SVM methods on single datasets
! apSVM still lacks robustness when comparing across datasets


