Anteprima Tipografia 2013 EN def - Camera di Commercio Udine · dya ˘ics f ec˘ ic ad sc ia phe˘...
57
Centro studi e ricerche economiche e sociali Veneto 2013 Economic report
Transcript of Anteprima Tipografia 2013 EN def - Camera di Commercio Udine · dya ˘ics f ec˘ ic ad sc ia phe˘...

Centro studi e ricerche economiche e sociali
Veneto 2013Economic report

��w e�teri�g its 14th year �f pub�icati��� this rep�rt �� the ec����y �f the Ve�et� regi�� is ��ce agai� ac���w�edged as a� i�p�rta�t eve�t i� the regi��a� ec����ic i�f�r�ati�� age�da� The Ve�et�� �i�e Ita�y� is �ivi�g thr�ugh days �f �a �r i�stituti��a� eve�ts that wi�� trace the �ut�i�e f�r the c��i�g years! the start �f a �ew �egis�ature� the e�ecti�� �f a �ew Preside�t �f the Ita�ia� Repub�ic� a�d the app�i�t�e�t �f a �ew G�ver��e�t� At the sa�e ti�e� the Ve�et� regi�� is faci�g seri�us ec����ic difficu�ties� which are putti�g a huge strai� �� e�terprises a�d threate�i�g s�cia� c�hesi��� I�dividua�s� busi�esses a�d i�stituti��s are ca��ed up�� t� �a�e i�p�rta�t decisi��s a�d it is theref�re i�p�rta�t that they have a�� the i�f�r�ati�� they �eed ab�ut the state a�d dy�a�ics �f ec����ic a�d s�cia� phe���e�a at a ��ca� �eve�� the pr�gress �ade a�d the pr�b�e�s t� be tac��ed� Shad�ws are sti�� ����i�g �ver ec����ic perf�r�a�ce i� 2013! the recessi�� is easi�g but �� e�d is i� sight yet� Ec����ic i�dicat�rs are sh�wi�g �� c�ear sig�s �f rec�very i� b�th i�dustria�ised a�d e�ergi�g c�u�tries� Ce�tra� ba��s are geared t� �ai�tai�i�g expa�si��ary ���etary c��diti��s b�th i� Eur�pe a�d i� the U�ited States� whi�e i� ��st c�u�tries� restrictive fisca� p��icies wi�� c��ti�ue t� pursue budgetary c��s��idati��� Gr�wth f�recasts f�r the g��ba� ec����y i� 2013 have bee� revised d�w�wards� D��i�ated by great u�certai�ty ab�ut h�w the s�vereig� debt crisis wi�� u�f��d� the �ut���� f�r the eur� /��e is ��derate�y �egative� GDP is expected t� register a s�ight dr�p i� 2013 (10�3%)� a�d severa� fact�rs wi�� c��ti�ue t� weigh �� d��estic de�a�d! credit c��diti��s are sti�� tight4 private c��su�pti�� is sti�� burde�ed by high u�e�p��y�e�t� s�uggish wage gr�wth� i�f�ati�� a�d high h�useh��d debt4 private i�vest�e�t is fa��i�g� 5verc��i�g the recessi�� i� Ita�y wi�� be a dau�ti�g cha��e�ge! i� 2013� Ita�ia� GDP is esti�ated t� shri�� by 0�6 perce�t� I� this c��text� the ec����y �f the Ve�et� is expected t� have a rather f�at perf�r�a�ce� Acc�rdi�g t� the �atest f�recasts� regi��a� GDP wi�� shri�� by 0�4 perce�t a�d the ���y drivi�g f�rce wi�� be exp�rts (73�7%)� The c��tributi�� �f private c��su�pti�� a�d i�vest�e�t wi�� be �egative� as b�th wi�� rec�rd a further dr�p� U�e�p��y�e�t wi�� rise s�ight�y� but it is �i�e�y that �a�y w�r�ers receivi�g te�p�rary u�e�p��y�e�t be�efits wi�� ��se their �bs! i� this case� the �u�ber �f pe�p�e see�i�g a �b c�u�d reach 12 perce�t �f the �ab�ur f�rce i� 2013� There are �a�y �bstac�es a�d it is bec��i�g i�creasi�g�y difficu�t t� �ay the f�u�dati��s f�r a c��p�ete rec�very �f the regi��a� ec����y� C��pa�ies �eed t� f�cus �� pr�ducti�� qua�ity a�d �� �ew f�reig� �ar�ets as we�� as t� �i� f�rces with ��e a��ther i� �rder t� tra�sfer ���w�edge a�d i���vati��� I� this c��text� the Cha�ber �f C���erce syste� has pr�ve� t� be a re�iab�e part�er i� supp�rti�g busi�esses i� the dia��gue with Pub�ic Ad�i�istrati�� t� sti�u�ate gr�wth a�d �verc��e the dead��c� �f ec����ic s�uggish�ess� Ve�ice� :arch 2013
A;ESSA�DR5 BIA�CHI Preside�t� U�i��ca�ere Ve�et�

U�i��ca�ere Ve�et�
2

The ec����y �f the Ve�et� i� 2012 a�d �ut���� f�r 2013
3
C��te�ts Rec�very de�ayed� the ���gest crisis ever i� the Ve�et� .......... 5 1. I�ter�ati��a� ec����ic c��text........................................... 9 2. �ati��a� ec����ic c��text .................................................12 3. Ve�et� ec����y .................................................................15
Foreign trade ............................................................................................................... 18
Production structure .................................................................................................. 23
Labour market ............................................................................................................. 26
Agriculture ................................................................................................................... 30
Manufacturing ............................................................................................................. 32
Construction ................................................................................................................ 35
Trade............................................................................................................................. 37
Credit ............................................................................................................................ 39
Tourism ........................................................................................................................ 42
Transport sector ......................................................................................................... 44
Innovative and technological services ..................................................................... 46
Artisan firms and small enterprises .......................................................................... 49 4. F�cus� the crisis �f the Ve�et� pr�ducti�� syste� a�a�y$ed
thr�ugh the fi�a�cia� state�e�ts �f %�i�t st�c& c��pa�ies a�d �i�ited �iabi�ity c��pa�ies ...........................................51

U�i��ca�ere Ve�et�
4
This report was drawn up by the Study Centre of the Veneto’s Regional Association of Chambers of Commerce (Unioncamere Veneto) based on the information and data available at 15 March 2013. Coordination and supervision
Gi�va��a Gu//� Serafi�� Piti�gar� A�t��e��a Trevisa�at� Texts, tables and charts
Chiara Car�et Bert�ssi Gi�va��a Gu//� Giu�ia Pava� Serafi�� Piti�gar� A�t��e��a Trevisa�at� Acknowledgements
Ba�ca d’Ita�ia Ca�era di C���erci� di Be��u�� CEAV – Cassa Edi�e Artigia�a Ve�eta C��fartigia�at� de� Ve�et� CRES:E Ec��;ab Research �etw�r� U�iversity �f Padua 1 Ec����ic Scie�ces Dept� Ve�et� Agric��tura Ve�et� ;av�r�
F�r further i�f�r�ati�� �� the c��te�ts �f the pub�icati��� p�ease c��tact! Unioncamere Veneto Centro studi e ricerche economiche e sociali via delle Industrie, 19/d – 30175 Venice Tel: 041 0999311 – Fax: 041 0999303 email: [email protected] web site: www.unioncameredelveneto.it
Pri�ted by! Tipografia Grafiche Vianello – Treviso
Circu�ati��! 500 copies Reproduction of this publication is authorised for non-commercial purposes and with mention of the source. A hardcopy of the report is available on request from the Study Centre of Unioncamere Veneto; the electronic version can be downloaded from the website www.unioncamereveneto.it

The ec����y �f the Ve�et� i� 2012 a�d �ut���� f�r 2013
5
Rec�very de�ayed� the ���gest crisis ever i� the Ve�et� How will 2013 be for the Veneto and Italy? Is the worst finally over or is another year of suffering in store for us? No one knows yet, but it will certainly be a difficult and in some ways a crucial year for the regional and national economy. In 2012, many had once again fuelled the illusion, especially during the summer, that a turnaround in the economic cycle was near and that a recovery in production was just around the corner. Forecasts made by entrepreneurs had led all analysts (including ourselves) to the conclusion that the real economy was poised to start growing again. The year ended instead worse than expected leaving 2013 a heavy burden. What happened? To be honest, 2012 had not started off well at all. Production, sales and orders had racked up negative results already in the early months of the year. Then, between July and August, some more favourable results and encouraging forecasts had fuelled hopes for an easing of the recession and a strengthening of economic activity in the following months. However, the weakening of the international economy, the faltering of Europe’s major economies (France, Germany and the United Kingdom), the lack of beneficial effects from the liberalisation on consumption and investments and the record high reached by the tax burden resulted in a new economic collapse towards the end of 2012, bringing the national and regional economy to below 2009 levels. In essence, what economists call a double dip recession materialized. It refers to a particular type of recession in which the economy starts to grow again for a time after an initial negative peak and then crashes again. The trend of the recession that started in 2008 indeed seems to follow this pattern especially when looking at the charts illustrating the trends of national and regional GDP.
340,000
345,000
350,000
355,000
360,000
365,000
370,000
375,000
I II III IV I II III IV I II III IV I II III IV I II III IV
2008 2009 2010 2011 2012
Source: Istat data processed by Unioncamere Veneto
Chart 1 – Italy. Quarterly GDP trend (seasonally and calendar adjusted data in millions of euro, year of reference: 2005). Years 2008-2012

U�i��ca�ere Ve�et�
6
However, according to some economic indicators, the beginning of 2013 seems to be characterized by moderately favourable signals from financial markets indicating that the worst phase of the international cycle has been left behind. The subsiding of tensions on financial markets as a result of the measures taken by central banks launched last summer, the progress made in solving the crisis in Europe, the favourable trend of prices on major stock markets and the easing of tensions on commodities markets are important signals, which could boost economic activity, even though the effects will not be immediate. It is rather difficult that these signals will translate into stronger global demand in the short term and it will take some time before Europe can benefit from these in full. Early in the year, the world macroeconomic scenario is still very uncertain and it is extremely unlikely that forecasts will point to a full economic recovery in 2013, which is shaping up as yet another year without growth. According to the latest forecasts of the International Monetary Fund released in
January, w�r�d GDP is expected to grow by 3.5 percent. This would be largely due to stable economic activity in advanced countries (+1.4%) and to a slight recovery in emerging markets (+5.5%). It would be coupled by a gradual recovery
in w�r�d trade, which is expected to grow by 3.8 percent in 2013, thanks to more buoyant exchanges at an international level.
In the U�ited States, the rate of GDP growth in 2013 is expected to be in line
with that of 2012 (+2%), while growth in .apa� will be well below that of the previous year (+1.2%). Neither the US nor the European demand (as illustrated further below) will be able to lead the way in driving global growth as will be the case of the major
emerging economies instead. In Chi�a, GDP growth is expected to reach 8.2
percent in 2013, while I�dia will grow at a rate of 5.9 percent. In Bra$i�, GDP is
expected to increase by 3.5 per cent, while Russia’s will expand by 3.7 percent.
3.9
1.8
-0.6
1.4
0.4
4.3
9.3
7.9
2.73.2
2.32.0
-0.4
-2.1
3.6
7.8
4.5
1.0
3.5
2.0
1.2
-0.2
-1.0
3.7
8.2
5.9
3.5
4.1
3.0
0.71.0
0.5
3.8
8.5
6.4
4.0
-4
-2
0
2
4
6
8
10
World United States Japan Euro area Italy Russia China India Brazil
2011 2012 2013 2014
Source: FMI data processed by Unioncamere Veneto (WEO Update, January 2013)
Chart 2 – Percentage variation of GDP.
Years 2011-2014

The ec����y �f the Ve�et� i� 2012 a�d �ut���� f�r 2013
7
As a result of the great uncertainty about how the sovereign debt crisis will unfold, the outlook for the euro zone is moderately negative. GDP is expected to register a slight drop in 2013 (-0.2%). Several factors will continue to weigh on domestic demand: credit conditions are still tight; private consumption is still burdened by high unemployment, sluggish wage growth, inflation and high household debt; private investment is falling. In 2013, however, as the problems posed by the crisis will be successfully addressed, including through the resolute implementation of the agreed policies, there will be space for a stabilization of the economic situation in the first half of the year, with weak growth in the second half, which is absolutely inadequate to offset the negative start. There will continue to be differences in growth due to the differing needs for structural adjustment, the cost of financing and the sustainability of public
spending in each country. In 2013, Ger�a�y will register a 0.6 percent increase
in GDP and Fra�ce a 0.3 percent increase. On the contrary, the major countries
of the Mediterranean, i.e., Italy and Spai�, will still be in recession in 2013.
In line with other economies on the outskirts of Europe, Ita�y too will encounter major challenges in overcoming the 2012 recession. According to ISTAT, the fall in GDP, which started in the third quarter of 2011, is expected to continue to a lesser extent until the second quarter of 2013: the current crisis would hence last more than the one in 2008-09 (5 quarters) and the one in 1992-93 (6 quarters).
2011 2012 2013 2014
Ita�y
ISTAT March 2013 0.4 -2.4 - -
G�ver��e�t September 2012 - -2.4 -0.2 1.1
UE C���issi�� November 2012 - -2.3 -0.5 0.8
Ba�& �f Ita�y Jenaury 2013 - -2.0 -1.0 0.7
Ref. Jenaury 2013 - -2.3 -1.3 0.8
Pr��eteia February 2013 - -2.1 -0.6 1.3
C��fi�dustria Dicember 2012 - -2.1 -1.1 0.6
4ECD November 2012 - -2.2 -1.0 0.6
I5F Jenaury 2013 - -2.1 -1.0 0.5
Citigr�up -2.5 -2.1 -0.2
5erri�� 6y�ch -2.5 -1.2 -
5�rga� Sta��ey -2.5 -1.0 -
Ve�et�
Istat November 2012 1.0 - - -
Pr��eteia February 2013 1.0 -1.9 -0.4 1.7
Source: cited source processed by Unioncamere Veneto Despite the expected recovery in the second half of the year, the performance of
GDP will remain negative in 2013. Forecasts are pointing to a 1 perce�t c��tracti�� �� a� a��ua� basis, as estimated by the OECD, IMF and Bank of Italy. Based on the most recent forecasts, the impact of exports (+2.2%) will not
Tab�e 1 – Italy and the Veneto. Percentage variation of GDP in real terms: comparison of forecasts. Years 2011-2014

U�i��ca�ere Ve�et�
8
be enough to offset the negative trends in both investment (-2.3%) and household consumption (-1.9%). The forecast scenario, however, is still pervaded by several elements of uncertainty concerning both the international situation and domestic factors related to the appointment of the new national government after the parliamentary elections of 24-25 February 2013 and the start of the new legislature. In the face of continued weakness in the domestic demand components, one crucial element for the Italian economy is the performance of world trade, which in turn is strongly dependent on the evolution of the international economic cycle. In addition, the financial difficulties of families and rising unemployment associated with the length of the recession could result in a downward revision of forecasts. The failure of the business cycle to recover will be reflected in the performance of public finance. The net borrowing of Public Administration (-3% of GDP in 2012) is expected to record a further drop in 2013, reaching -2.5 percent, while the primary surplus (+2.5% in 2012) should reach 3 percent in 2013. The deficit-to-GDP ratio will rise again in 2013 to 129.7 percent due to very limited growth in nominal GDP and begin to shrink in 2014, benefiting from the improvement in the primary balance and economic recovery. Clearly, a sharper slowdown in the Italian economy could frustrate measures already taken to rein in public finances, forcing the next government to pass a new budget law to stay the course of debt reduction.
In this context, the ec����y �f the Ve�et� will very likely register a negative
trend in 2013 as well. According to the most recent forecasts (February 2013), the Ve�et� wi�� register a 0.4 perce�t dr�p i� GDP, in line with that of neighbouring regions of Northeast Italy. The reduction will be the result of the negative trend in investment (-2.3%) and household consumption (-1.2%). The contribution of exports will be positive (+3.7%). The gradual recovery in production will not allow for a turnaround in employment (-0.5%) and unemployment, which also reflects the increase in people looking for a job in 2013, is expected to reach 8.3 percent.
I�dicat�rs7 Ve�et� ��rth East Ita�y
GDP -0.4 -0.4 -0.6
Household consumption -1.2 -1.0 -1.5
Gross fixed investment -2.3 -2.4 -2.6
Imports 1.2 0.4 -0.8
Exports 3.7 2.7 2.1
Labour units -0.5 -0.6 -0.8
Unemployment rate (%) 8.3 7.8 11.7
* % variation of chain-linked values (year 2005)
Source: Prometeia (February 2013)
Tab�e 2 – Forecast scenario in 2013:
comparison between the Veneto, the North
East and Italy

The ec����y �f the Ve�et� i� 2012 a�d �ut���� f�r 2013
9
1. I�ter�ati��a� ec����ic c��text After recovery in 2010 following the “Great Recession” and the slowdown of 2011, the global economy weakened again in 2012.
According to the International Monetary Fund, w�r�d GDP increased by 3.2 percent compared with 3.9 percent in 2011 and 5.1 percent in 2010 (Chart 3). The global economy was weighed down by several factors of uncertainty associated with the effects of fiscal consolidation in advanced economies and a weak economy, especially in Europe. These are all elements heralding a risk-riddled recovery scenario. Growth is being increasingly driven by emerging economies and developing countries, but among these, the main countries have experienced a slowdown that has reduced the growth differential with advanced economies (Chart 4). At this stage, world trade has not provided any valuable support: it too has suffered from the negative effects (+2.8%), much lower than the variation in 2011 (+5.9%). International flows already slowed down by mid-year and weakened further in the following months due to the contraction of imports in Europe and in the Asian economies, which were severely impacted not only by weak demand in the advanced economies, but also by cooling domestic demand. In many countries, high and rising unemployment rates further depressed the levels of confidence and spending. Inadequate and ineffective economic policy choices also contributed to reducing levels of confidence.
5.13.9
3.2
12.6
5.9
2.8
-15
-10
-5
0
5
10
15
2005 2006 2007 2008 2009 2010 2011 2012
GDP World Trade (volume)
Source: FMI data processed by Unioncamere Veneto (WEO Update, January 2013)
In 2012, growth in advanced economies remained weak (+1.3%), though with
differences. In the U�ited States, the expansive monetary policy implemented by the Fed favoured a moderate recovery (+2.3%), which was below expectations though. There were still continued difficulties in domestic demand, burdened by the continued reduction of indebtedness in the private and public sectors. In
Chart 3 – World GDP trends and world trade volume (% var. over previous year). Years 2005-2012

U�i��ca�ere Ve�et�
10
.apa�, the recovery progressively lost steam (GDP recorded a +2%), due to the stagnation of private and public consumption and to the negative contribution of
net exports. In the U�ited 8i�gd��, economic activity remained almost stable (-0.2%), after weak growth in 2011 (+0.9%) (Table 3). In the European Union, the policy change of the ECB, which anticipated the possibility of “unlimited” purchases of government bonds of countries in difficulty, has eased tensions in financial markets, while fiscal tightening has continued: the decline in demand, associated with the unfavourable economic outlook and the ongoing adjustment in the budgets of households and enterprises, have increasingly contributed to the weak growth in bank loans.
-2
0
2
4
6
8
I II III IV I II III IV I II III IV
2011 2012 2013
World Advanced economies Emerging economies
Source: FMI data processed by Unioncamere Veneto (WEO Update, January 2013)
In 2012, the eur� $��e economy was sluggish. The difficulties of the economically marginal countries were matched by the first signs of weakness in Germany during the year. The restrictive fiscal policies imposed on both Europe’s Mediterranean countries and France and Germany’s opposition to strong measures to stimulate growth have resulted in a slowdown of the German economy, fuelled also by the weakening of the global cycle. According to Eurostat, the euro zone closed 2012 with a 0.6 decrease, down by 0.8 percentage points over the previous year. The four largest economies in the area were all in trouble: Germany, Europe’s locomotive, began to suffer the effects of the crisis and slowed down, recording a slight increase (+0.7%) that many of its European partners envy. France recorded zero growth, while Italy (-2.4%) and Spain (-1.4%) remained in a severe recession. In 2012, Italy had the third worst performance among its 27 European partners; only Portugal (-3.2%) and Greece (-6.4%) did worse. The situation is difficult: suffice it to consider that among the world’s top twenty economies (by GDP value at current prices), Italy (eighth in the ranking) and Spain (thirteenth) will be the only countries to still be in a situation of economic recession (negative outlook for 2013).
Economic activity in key e�ergi�g ec����ies continued to slow down, reflecting the negative impact of the international economy, which only in some
Chart 4 – Trend in global GDP (% var. over
the previous quarter). 1st quarter 2011-4th
quarter 2013
The ec����y �f the Ve�et� i� 2012 a�d �ut���� f�r 2013
11
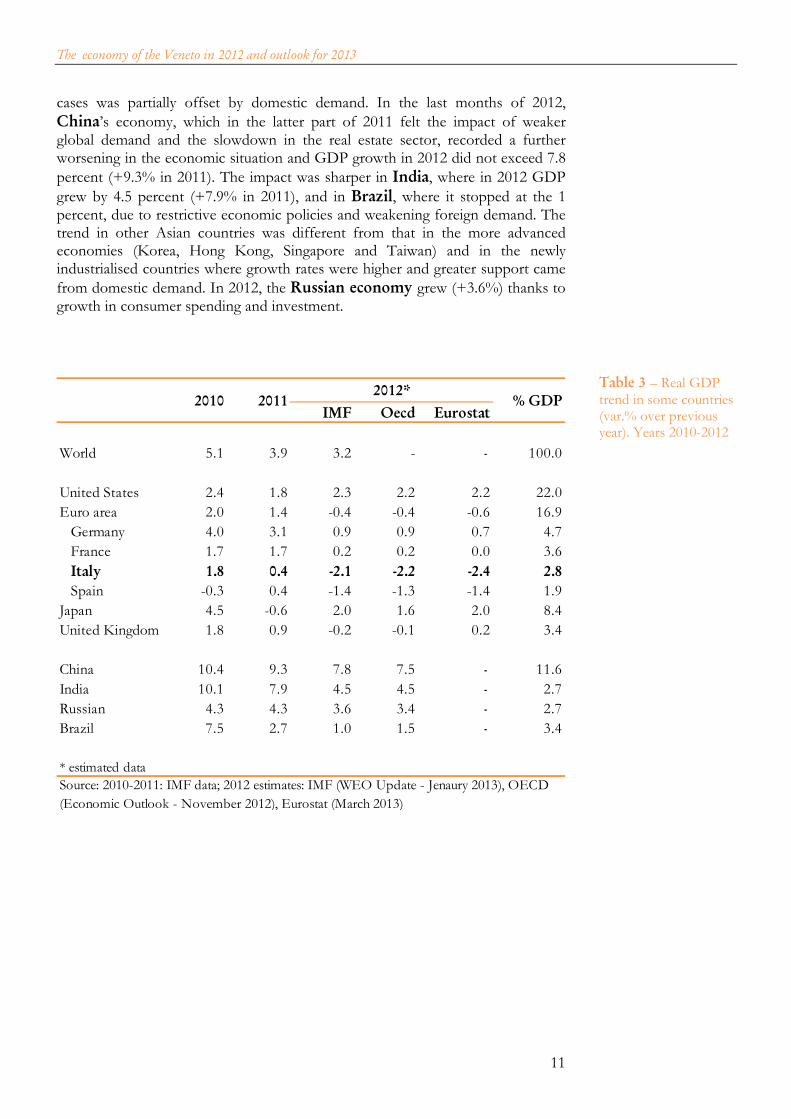
cases was partially offset by domestic demand. In the last months of 2012,
Chi�a’s economy, which in the latter part of 2011 felt the impact of weaker global demand and the slowdown in the real estate sector, recorded a further worsening in the economic situation and GDP growth in 2012 did not exceed 7.8
percent (+9.3% in 2011). The impact was sharper in I�dia, where in 2012 GDP
grew by 4.5 percent (+7.9% in 2011), and in Bra$i�, where it stopped at the 1 percent, due to restrictive economic policies and weakening foreign demand. The trend in other Asian countries was different from that in the more advanced economies (Korea, Hong Kong, Singapore and Taiwan) and in the newly industrialised countries where growth rates were higher and greater support came
from domestic demand. In 2012, the Russia� ec����y grew (+3.6%) thanks to growth in consumer spending and investment.
I5F 4ecd Eur�stat
World 5.1 3.9 3.2 - 1 100.0
United States 2.4 1.8 2.3 2.2 2.2 22.0
Euro area 2.0 1.4 -0.4 -0.4 -0.6 16.9
Germany 4.0 3.1 0.9 0.9 0.7 4.7
France 1.7 1.7 0.2 0.2 0.0 3.6
Ita�y 1.8 0.4 :2.1 :2.2 :2.4 2.8
Spain -0.3 0.4 -1.4 -1.3 -1.4 1.9
Japan 4.5 -0.6 2.0 1.6 2.0 8.4
United Kingdom 1.8 0.9 -0.2 -0.1 0.2 3.4
China 10.4 9.3 7.8 7.5 1 11.6
India 10.1 7.9 4.5 4.5 1 2.7
Russian 4.3 4.3 3.6 3.4 1 2.7
Brazil 7.5 2.7 1.0 1.5 1 3.4
* estimated data
Source: 2010-2011: IMF data; 2012 estimates: IMF (WEO Update - Jenaury 2013), OECD
(Economic Outlook - November 2012), Eurostat (March 2013)
20127% GDP2010 2011
Tab�e 3 – Real GDP trend in some countries (var.% over previous year). Years 2010-2012

U�i��ca�ere Ve�et�
12
2. �ati��a� ec����ic c��text In 2012, Italy experienced a new recession, the second in five years, characterised by a collapse of domestic demand. In addition, the uncertainty of economic policies, stringent lending conditions and the impact of fiscal consolidation hit hard consumption and investment. This led to a collapse in imports, while exports boosted demand thanks to sales in countries outside the EU. Therefore, net exports eased the fall in real GDP and the trade balance recorded a deficit (-2.8 billion euro) significantly lower than in previous years.
According to the latest ISTAT estimates, Ita�ia� GDP i� 2012 (with values
linked to reference year 2005), shru�& by 2.4 perce�t compared with the year before1, recording a sharp drop compared to the +0.4 percent in 2011 and finally wiping out the recovery registered in 2010 (+1.7%). The contraction in 2012 is comparable to the Great Recession of 2008-2009, especially considering that GDP dropped in volume slightly below the level recorded in 2009. On a cyclical basis, the last quarter registered -0.9 percent, the worst since the first quarter of 2009. The recession was only briefly mitigated during the summer but then returned in the fall in all its gravity. The sixth consecutive quarter of contraction in economic activity was in fact even worse compared with the previous quarters. The decline, certified by ISTAT (-2.4%), was much worse than both the euro zone average (-0.6%) and the EU27 average (-0.3%). Slight growth in Germany and zero growth in France left the Italian economy without the driving force of exports to these two major economies. In addition, the economic slowdown of Italy’s European partners and Japan, weak growth in the U.S. and the euro’s appreciation against the US dollar did not facilitate the sale of Italian products outside the single currency area and dissolved the fragile summer recovery in orders and sales. Looking at the regional level, Prometeia statistics for 2012 reveal that the recession was less pronounced in the North-West (-1.9%), North-East and Centre (both 2%). It was more severe in the southern regions, which suffered a fall in GDP of 2.5 percent (Table 4).
Broken down by sect�r, the slowdown of national GDP was the result of the sharp decline in the value added in all sectors: particularly marked for construction (-6.3%), agriculture, forestry and fishing (-4.4%) and industry in the strict sense (-3.5%), and less for services (-1.2%).
The weakening of production was mainly due to the sharp decline in gr�ss fixed capita� f�r�ati�� (-8%), followed by the more moderate drop that had characterized 2011 (-1.8%), as a result of deterioration in the outlook for demand and worsening financing conditions. The reduction was seen in all components, with a decline of 12.2 percent in investment in transportation, 10.6 percent in machinery and equipment and 6.2 percent in construction. In 2012, employment difficulties and weak real wage trends led to a decline in
h�useh��d fi�a� c��su�pti�� equal to -4.3 percent, after being stable in 2011
1 The contraction in Italian GDP is in line with previous forecasts made by leading research institutes in late 2012 and early 2013. After estimating a 1.7 percent contraction in GDP for 2012, the OECD revised its estimate for Italy in December, bringing it down to -2.2 percent. In January 2013, the IMF forecast a slightly less sharp decrease in Italian GDP in 2012 (-2.1%) compared with its estimates in autumn, equal to -2.3 percent. This was also the case of the latest forecasts of the European Commission, which indicate a 2.2 percent contraction in Italy, while it was -2.3 percent in the fall.

The ec����y �f the Ve�et� i� 2012 a�d �ut���� f�r 2013
13
(+0.1%). The decline in household consumption was particularly marked for goods (-7%), while spending on services decreased by 1.4 percent. In terms of spending items, the sharpest contractions regarded clothing and footwear (-10.2%) and transportation (-8.5%).
The spe�di�g �f Pub�ic Ad�i�istrati�� and of private social institutions decreased by 2.9 and 1 percent respectively. According to ISTAT estimates, in 2012, net foreign demand was the only source of support to growth, accounting for 3 percentage points, while domestic demand was negative (excluding inventories), amounting to -4.8 percentage points, as was the case of the variation in inventories with -0.6 percentage points.
In terms of f�reig� de�a�d, 2012 recorded a slowdown in exports, which grew by 3.7 percent, compared with a drop in imports of 5.6 percent, as a result of weak domestic demand. The performance of Italian exports suffered from marked differences between geographic regions: those directed to the EU market stagnated in the second half of 2011 and decreased during 2012, while sales to non-EU markets more than recovered compared with the situation before the Great Recession. Unemployment in Italy continued to be high. On average, in 2012, the unemployment rate stood at 10.7 percent, 2.3 percentage points higher than in
2011, while the total �ab�ur u�its (LU)2 decreased by 1.1 percent. The decline was sharper among employees (-1.2%) compared with the self-employed (-0.9%). The decrease in labour units affected all sectors, with drops of 5.4 percent in construction, 3.5 percent in agriculture, forestry and fishing, and 1.9 percent for industry in the strict sense, while employment was stable in services. The much more limited decrease in the latter sector is due to increases recorded in financial and insurance, professional, scientific and technical activities and in the arts and entertainment industry. As was the case in 2011, in 2012 employment-related problems contributed to the
greater recourse to temporary unemployment benefit (cassa i�tegra/i��e guadag�i - CIG). In 2012, over 1 billion hours of temporary unemployment benefit (equivalent to 661 thousand workers) were authorised, i.e., an increase of 12.1 percent compared with 2011 (973 million hours). In detail, more than 335 million hours were authorised for ordinary CIG (+46.2%), over 400 million for extraordinary CIG (-5.5%) and almost 355 million for special CIG (+10.9%). Last year, these figures involved over 2 million workers in various capacities (counting also a single day of CIG).
I�c��e fr�� e�p��y�e�t and gross wages were stationary in 2012. Per capita wages and salaries registered a 2.1 percent increase in industry in the strict sense and in construction and 0.6 percent in services, while there was no variation in agriculture.
According to the latest ISTAT estimates, pub�ic fi�a�ces were improving: in 2012 the net borrowing of Public Administration compared to GDP amounted to -3 percent, an improvement of 0.8 percentage points compared with that recorded in 2011. In absolute terms, net borrowing decreased by about 12,400 million euro, falling to -47,446 million.
2 The labour unit is the amount of work done by a full-time employee in a year, or the equivalent amount of work done by part-time workers or persons working two jobs. This concept is no longer linked to a single natural person, but is equal to the number of hours per year corresponding to a full-time job. This number may differ according to the different type of work. The labour units are calculated net of hours of temporary
unemployment benefits (cassa i�tegra/i��e guadag�i 1 CIG).

U�i��ca�ere Ve�et�
14
Total reve�ue of Public Administration (equal to 48.1% of GDP) increased by 2.4 percent compared to the previous year. Current revenues recorded a 3.1 percent increase (reaching 47.7% of GDP). In particular, indirect taxes rose by 5.2
per cent, buoyed mainly by the Single Municipal Tax (i�p�sta �u�icipa�e u�ica - IMU) and by the increase of excise duties on mineral oils. The same growth rate was registered for direct taxes, mainly due to the increase in income tax (IRPEF), regional surtax on income tax and substitute tax on withholding tax, interest and other income from capital, which reflects changes in the taxation of financial
income. Actual social security contributions were stable (-0.1%). The overall tax burde�3 stood at 44 percent, up 1.4 percentage points compared to 2011. The contraction of capital revenue (-44%) is to be ascribed mainly to the reduction of capital taxes (-80.3%), due to the loss of one-off payments of substitute tax for the realignment of book values to international accounting standards (IAS), which had fuelled revenue in 2011.
GDPH�useh��d
C��su�pti��
AA.PP & ISP
C��su�pti��
Gr�ss fixed
i�vest�e�tExp�rt 77 I�p�rt77
Piedmont -2.1 -4.2 -1.1 -9.0 2.9 -8.6
Lombardy -1.8 -3.8 -0.9 -8.3 3.7 -8.0
Ve�et� :1.9 :4.0 :1.0 :8.5 1.6 :7.8Emilia Romagna -2.2 -3.8 -0.7 -8.5 3.1 -5.4
Tuscany -2.0 -4.0 -1.0 -8.9 6.9 1.0
North-West -1.9 -3.9 -1.0 -8.6 3.5 -7.8
North-East -2.0 -3.9 -0.9 -8.6 1.1 -6.7
Centre -2.0 -3.8 -0.9 -9.2 6.3 -6.7
South and Islands -2.5 -4.3 -1.2 -9.9 7.8 -4.0
Ita�y :2.4 :4.3 :2.9 :8.0 3.7 :5.6
* National data are Istat estimates, data for regions and areas are Prometeia forecasts
** Istat provisional data
Source: Istat (national public accounts and coeweb), Prometeia (scennarios for local economies - February 2013)
3 Amount of direct, indirect, and capital taxes and of social security contributions compared to GDP.
Tab�e 4 – Main economic indicators in a
number of Italian regions (% var. over previous
year)*. Year 2012

The ec����y �f the Ve�et� i� 2012 a�d �ut���� f�r 2013
15
3. Ve�et� ec����y The weakness of the national economic cycle, combined with the recessionary effects of fiscal consolidation measures, made the economy come to a screeching halt. According to the latest estimates released by Prometeia, in 2012, regional GDP recorded a marked contraction of -1.9 percent compared to the previous year, wiping out the growth of 2010 (+1%) and 2011 (+1.7%) and reaching levels slightly above those of 2009 levels (Chart 5).
100.5
102.3
103.3
101.4
101.9
103.7104.1
101.6
96
100
104
108
112
2000 2001 2002 2003 2004 2005 2006 2007 2008 2009 2010 2011 2012*
Veneto Italy
*for Veneto GDP the source is Prometeia
Source: Istat data processed by Unioncamere Veneto
The fall of GDP was generalized across the entire country. In comparison with its main competitor regions, the Veneto region showed a slightly better performance than Emilia-Romagna (-2.2%), Piedmont (-2.1%) and Tuscany (-2%), while it was slightly worse compared with Lombardy (-1.8%).
2000 2008 2009 2010 2011 20127
abs��ute va�ue
GDP (mln of euro) 113,182 145,923 141,852 144,621 147,903 147,069
Labour units (thousand) 2,186 2,357 2,275 2,272 2,290 2,250
Employees unit (thousand) 1,520 1,714 1,657 1,607 1,635 1,608
Income from employment (mln of euro) 43,431 62,258 61,258 61,246 63,206 62,585
Average annual population (thousand) 4,497 4,859 4,899 4,925 4,950 4,962
per capita va�uesGDP at market prices per inhabitant (euro) 25,169 30,032 28,955 29,364 29,882 29,636
GDP at market prices per labour units (euro) 51,783 61,908 62,364 63,645 64,601 65,369
Domestic final consumption per inhabitant (euro) 17,971 22,160 21,928 22,347 .... ....
Income from employment for employees unit (mln of euro) 28,582 36,334 36,962 38,105 38,654 38,929
*source data Prometeia
… data not available yet
Source: Istat (national public accounts), Prometeia (scennarios for local economies - February 2013) data processed by Unioncamere Veneto
Chart 5 – GDP trend for the Veneto and Italy (index number: base 2000 = 100). Years 2000-2012
Tab�e 5 – The Veneto. Main aggregate of national public accounts (values in current euro and per capita). Years 2000, 2008-2012

U�i��ca�ere Ve�et�
16
The contraction in regional GDP was the result of the negative impact of
domestic demand (-4.5%). Gr�ss fixed i�vest�e�ts suffered a sharp drop (-8.5%) due to the worsening of lending conditions, to delayed payments by local authorities as a result of the stability pact and to deteriorating demand forecasts. The reduction in spending - attributable to the higher tax burden and difficult
labour market conditions - led to a decline in h�useh��d fi�a� c��su�pti�� (-4%), while the budget laws needed for the consolidation of public finances cut
the fi�a� c��su�pti�� �f Pub�ic Ad�i�istrati��s a�d �f private s�cia� i�stituti��s (-1%). The downsizing of household consumption was particularly intense in the durable goods sector, but it did not spare either food or services.
At a time of great crisis for the domestic market, f�reig� de�a�d has been an important yet insufficient driver for growth. Looking at the individual items which
c��tributed t� GDP variati��, trade with foreign countries was the only positive component (2.5 percentage points), while the contribution of household consumption (-2.4 percentage points) and investment (-1.7 percentage points) was negative (Chart 6). However, foreign demand has not been a growth factor for the regional economic cycle: the positive contribution to the trade balance was largely the result of the fall in imports rather than increased exports, and was equivalent to the share of the recession that the regional economy “exports” to the rest of the world.
-8
-6
-4
-2
0
2
4
2008 2009 2010 2011 2012
Foreign net demand
Changes in supplies
Gross fixed investment
AA.PP & ISP consumption
Household consumption
GDP
Source: Istat and Prometeia data processed by Unioncamere Veneto (February 2013)
According to provisional data released by ISTAT4, in 2012, the Veneto’s exports were weak, rising by 1.6 percent, against a 7.8 percent drop in imports. In 2012
the Veneto’s trade ba�a�ce was positive, amounting to 13.6 billion euros. The situations of the production structure and labour market fully reflect the
recessive trend of the regional economy. In 2012, the number of active busi�esses decreased by 1.2 percent compared to the previous year5. There was also an increase in the number of businesses that filed for bankruptcy, which amounted to over 8,000, i.e., +7.5 percent. The number of businesses that filed
4 For further information refer to the paragraph “Foreign trade”. 5 For further information refer to the paragraph “Production structure”.
Chart 6 – The Veneto. Contributing factors for
the growth of GDP (values in percent and
trend variation). Years 2008-2012

The ec����y �f the Ve�et� i� 2012 a�d �ut���� f�r 2013
17
for insolvency proceedings amounted to 1,221 (of which 1,021 bankruptcies), i.e., -8.3 percent compared to 2011.
In 2012, e�p��y�e�t recorded a further negative balance of more than 15 thousand units because there were less new hires compared to layoffs. The latter were characterized by a negative trend in resignations, which were offset by a significant increase in layoffs in small businesses. In 2012, there was also a greater recourse to temporary unemployment benefits: 103 million authorised hours (about 63 thousand workers involved), compared with 87 million the year before6.
With regard to income formation, in 2012, it is estimated that the added va�ue over basic prices decreased by 1.6 percent over the previous year. The construction sector continued its negative trend (-5.6%) for the sixth year in a row, while, after growing in 2011, the manufacturing industry registered a further drop (-3.3%). Services also declined, though to a lesser degree (-0.6%), while agriculture showed a slight increase (+0.5%). The data thus show a regional system caught in a new serious recession: construction and manufacturing companies are suffering greatly, while the agriculture and services sectors are holding on. Although it is the only positive component, exports may no longer be a decisive factor in the economic cycle. The internal market is at a standstill and, if the situation does not turn around quickly, 2013 will be yet another negative year for the regional economy, with all the consequences at the various levels, first and foremost employment.
The crisis a�d the difficu�ties �f h�useh��ds The international economic crisis has had a huge impact on the labour market and on the income and consumption of the Veneto’s households. According to ISTAT, in 2011 the disp�sab�e i�c��e �f h�useh��ds in the Veneto region amounted to 99,550 million euros, a 3.3 percent increase in nominal terms compared to 2008. According to an estimate of Unioncamere Veneto, however, the indicator, measured at constant 2008 prices, was down by 0.4 percent compared to pre-crisis levels*. Also in 2011, the disp�sab�e i�c��e per capita �f h�useh��ds amounted to 20,113 euros, a 1.4 percent increase at current prices, placing the Veneto in third place in the list of Italian regions. In real terms, i.e., at constant 2008 prices, the same indicator decreased by 2.2 percent during the crisis. The decrease in disposable income has slowed the growth of consumption: in the 2008-2011 period, average h�useh��d spe�di�g at curre�t prices decreased by 2.4 percent, while, when measured at constant 2008 prices, it dropped by 5.9 percent. In 2011, with 2,903 euros, the Veneto maintained second place in the ranking of average ���th�y expe�diture, after Lombardy and well above the national average of 2,488 euros. The decline in the purchasing power of households has led to an increase of the at:ris&:�f:p�verty rate (ratio of people living with an equivalised disposable income lower than or equal to 60% of the median equivalised income to the total resident population). From 2008 to 2011, in the Veneto, the at-risk-poverty rate increased by two tenths of a percentage point, affecting 10.9 percent of residents (10.7% in 2008, 10.5% in 2010). In Italy, the situation was even worse: about 1 out of every 5 people was at risk of poverty, an increase of about 1 percentage point since 2008. * The estimate was obtained using 2008 as the base year and applying the deflator of household consumption on a
regional basis to the current values.
6 For further information refer to the paragraph “Labour market”.

U�i��ca�ere Ve�et�
18
F�reig� trade Within the framework of a long and difficult crisis, one of the few reassuring signals has so far been the performance of foreign demand. However, while exports have been - and are still - a key component of regional growth, it is clear that these alone are hardly sufficient to pull the Veneto’s economy out of crisis, as evidenced by the decline recorded in 2012.
In 2012, Italy registered a very wea& p�sitive tre�d i� f�reig� trade (+3.7% year-on-year), with goods sold totalling 390 billion euros. The slowdown in export flows and the decline in imports (-5.6%) resulted in a positive trade balance of 11 billion euros, reversing the negative trends of previous years (in 2011 the deficit amounted to over 24 billion euros).
2011 (a) 2012 (b) var.% 2011 (a) 2012 (b) var.%
Lombardy 124,844 114,874 -8.0 104,218 108,080 3.7 -6,793
Ve�et� 40B737 37B575 :7.8 50B318 51B128 1.6 13B553Emilia Romagna 29,967 28,337 -5.4 47,961 49,462 3.1 21,125Piedmont 29,062 26,554 -8.6 38,557 39,686 2.9 13,132Tuscany 22,135 22,362 1.0 30,271 32,368 6.9 10,006Lazio 33,686 29,519 -12.4 17,094 17,958 5.1 -11,561Friuli-Venezia Giulia 7,115 6,810 -4.3 12,575 11,450 -8.9 4,641
North-West 165,837 152,871 -7.8 150,117 155,341 3.5 2,469North-East 84,404 78,723 -6.7 117,655 118,960 1.1 40,237Centre 65,947 61,497 -6.7 60,705 64,526 6.3 3,029South 30,809 25,537 -17.1 27,037 26,972 -0.2 1,435Islands 28,748 31,650 10.1 16,038 19,454 21.3 -12,196Other or n.a. 25,683 28,480 10.9 4,352 4,472 2.8 -24,008
Ita�y 401B428 378B759 :5.6 375B904 389B725 3.7 10B966
(a) definitive data; (b) provisional data
Source: Istat data processed by Unioncamere Veneto
Ba�a�ceI�p�rts Exp�rts
At the ��ca� �eve�B the positive trend in exports was well above the national average for the major islands (+21.3%) and Central Italy (+6.3%). The regions of the North-West and North-East recorded positive yet weak results (+3.5% and +1.1% respectively), while sales remained stable in Southern Italy (-0.2%). In 2012, the regions that contributed most to the growth of foreign sales (accounting for almost 80% of the increase in Italian exports) were Lombardy (+3.7%), Sicily (+21.2%), Tuscany (+6.9%), Emilia-Romagna (+3.1%) and Sardinia (+21.5%). The growth of the other regions in foreign markets was: Umbria (+7.6%), Puglia (+7.3%), Marche (+6%), Lazio (+5.1%) and Liguria (+4.1%). Significant decreases were recorded by Basilicata (-17.5%) and Friuli-Venezia Giulia (-8.9%). In this context, the Veneto, while representing one of the most export-oriented
Tab�e 6 – Italy. Trade flows in a number of
Italian regions (million of euros). Years 2011 and
2012

The ec����y �f the Ve�et� i� 2012 a�d �ut���� f�r 2013
19
regions in Italy7 and after two years of strong recovery, recorded markedly sluggish export flows. In 2012, exports of goods - though the only component of
GDP that held in this difficult economic situation - recorded wea& gr�wth (+1.6%)8, while domestic demand collapsed. Foreign sales, however, did not contribute to stimulating the regional economic cycle: the positive trade balance (surplus of 13.6 billion euros) was mainly due to a fall in imports (-7.8% compared to 2011, reaching a provisional value of 37.6 billion euros), and it is equivalent - so to speak - to the portion of the region’s recession exported to the rest of the world, by buying fewer products abroad. Even in the face of a limited absorption capacity of the domestic market in the last decade, in recent years, companies have increasingly turned to foreign markets to find opportunities for growth. Indeed, the internationalisation propensity of the Veneto’s enterprises in 2012 was almost unchanged compared to the previous
year: the degree �f trade �pe��ess (the sum of imports and exports accounted
for 60.3% of the regional GDP) and the pr�pe�sity t� exp�rt (exports accounted for 34.8% of GDP) showed a production system that was dynamic on foreign markets, but no longer in the take-off phase.
3.40.7 0.7 1.9
3.2
-0.2 -0.80.7
-30
-20
-10
0
10
20
30
I II III IV I II III IV I II III IV I II III IV I II III IV
2008 2009 2010 2011 2012
Istat* VenetoCongiuntura
* The variation in 2012 is calculated on provisional dataSource: Istat and VenetoCongiuntura data processed by Unioncamere Veneto
In 2012, the Veneto’s exports reached 51.1 bi��i�� eur�s, an increase of just 809 million euros over 2011 in absolute terms. The dynamics of regional sales abroad gradually weakened during the year (Chart 7). Both ISTAT data and the results of
the Ve�et�C��giu�tura survey conducted quarterly by Unioncamere Veneto on a sample of 2,000 Veneto manufacturing firms with at least 10 employees showed a slowdown in trade with foreign countries in 2012. Specifically, the export turnover of the Veneto in the first quarter increased by 3.2 percent on an annual basis,
7 In 2012, although the weight of the Veneto’s foreign trade compared to the national total slightly decreased (13.1%), the region came after Lombardy (27.7%), retaining second place in the list of Italian regions that contribute most to Italian exports, followed by Emilia Romagna (12.7%), Piedmont (10.2%) and Tuscany (8.3%). 8 Since the final figures are not available, the 2012/11 variation is calculated by comparing the provisional data with final data consistent with the data published by ISTAT.
Chart 7 – The Veneto. Export trends (% var. vs. same quarter of previous year). Years 2008-2012

U�i��ca�ere Ve�et�
20
before declining slightly (-0.2% in the second quarter and -0.8% in the third) and recorded a weak growth (+0.7%) in the October-December period. A comparison with the provisional data released by ISTAT also shows a weakening of exports during the year. In particular, there was a 3.4 percent rise in the first quarter, followed by weak growth in the following quarters (+0.7% in the second and third quarter, and +1.9% in the last quarter)9.
An analysis of the desti�ati�� �ar&ets of the Veneto’s goods (Table 7) in 2012 shows that the EU27 area received 56.7 percent of regional exports, compared with 43.3 percent of non-EU markets. However, the exports of manufactured goods are proving to be increasingly dynamic towards countries outside the European Union, recording a 6.7 percent increase in value, against a drop in the supply of goods in EU markets (-1.9%). The decline in sales registered in the countries most heavily affected by austerity plans (Spain and Greece) was compounded by the slowdown in exports towards
Ger�a�y and Fra�ce, that are considered the driving force of the Veneto’s sales. While in 2012 these two countries continued to be the Veneto’s leading trade partners (with sales of 7 and 5.1 billion euros respectively), the turnover from the export of manufactured goods decreased by 1.7 and 2.1 percent respectively. In recent years, cross-border business has been increasingly directed towards new markets in the developing world, which have not been spared by the crisis either.
Trade flows to the BRICS c�u�tries10 decreased in 2012: exports of goods manufactured in the Veneto fell to 4 billion euros (-6.3% compared to 2011). In
particular, Chi�a reduced the purchases of manufactured goods from the Veneto by over one-quarter (down to 1.3 billion euros). In 2012, the Asian giant, also because of the slowdown in global demand, started to purchase less manufactured goods and especially goods related to industrial activity and infrastructure. In particular, there was a drop in the sale of special purpose machinery, leather and tanned hides, machines for general use, pharmaceutical preparations, basic precious and other non-ferrous metals, nuclear fuels, engines, generators and transformers, and equipment for the distribution and control of electricity. By contrast, exports to the Chinese market in some sectors of the fashion industry continued to grow strongly (especially gold jewellery, eyewear and clothing). The weakening of purchases in China undermined the Veneto’s exports to Asian economies. The sale of manufactured goods to East Asia fell by 8.3 percent (3.8 billion euros), while exports to Central Asia grew by 7 percent (812 million euros),
despite the decrease of exports to I�dia (-7% fall to € 420 million euros). These drops were offset by higher sales to other countries. For example, there
was a rise in the export of manufactured goods to Swit$er�a�d (+24.3%), driven
by sales of non-monetary gold, Russia (+10.7%), the U�ited Arab E�irates (+9.4%), .apa� (+22.2%), Saudi Arabia (+16.6%), and S�uth Africa (+32.7%). Sales to North America continued to maintain high rates: the exports of goods manufactured in the Veneto rose by 10.9 percent. In particular, the
purchases of the Veneto’s goods rose in the U�ited States (+11.1%, € 3.3 billion
9 The correlation coefficient calculated between the quarterly variation of foreign sales for the years 2009-
2012 recorded in the Ve�et�C��giu�tura survey and the variation based on the export data released by ISTAT equals 0.97. As a result, the data from the Unioncamere Veneto survey can be considered to be a sound substitute source for export flow trends in the region. 10 BRICS is an acronym used in international economics to identify five countries (Brazil, Russia, India, China and South Africa) that share some similar features, including the state of developing economies, a large population and abundant strategic natural resources; in the last decade they witnessed a strong growth in GDP and in their share of world trade.

The ec����y �f the Ve�et� i� 2012 a�d �ut���� f�r 2013
21
euros) and in Ca�ada (+9.9%, 474 million euros). Thanks also to the growth of
sales in Bra$i� (+2%), foreign sales to Central and South America continued to grow (+15.2%), reaching 1.7 billion euros.
C�u�tries 2011 (a) 2012 (b) var.% c��p.%
1 Germany 9,273 7,399 -20.2 22.5
2 China 4,005 3,506 -12.5 10.6
3 France 1,861 1,894 1.8 5.8
4 Spain 1,892 1,631 -13.8 5.0
5 Netherlands 1,409 1,417 0.6 4.3
6 Austria 1,498 1,381 -7.8 4.2
7 Belgium 1,322 1,262 -4.5 3.8
8 Romania 1,290 1,260 -2.3 3.8
9 Switzerland 705 773 9.6 2.3
10 United Kingdom 803 709 -11.7 2.2
Ue 27 24,027 21,208 -11.7 64.4
Extra Ue 27 12,592 11,717 -7.0 35.6
BRICS 5,691 5,236 -8.0 15.9
T�ta� 36B619 32B925 :10.1 100.0
1 Germany 6,813 6,699 -1.7 13.5
2 France 5,221 5,113 -2.1 10.3
3 United States 2,938 3,263 11.1 6.6
4 Switzerland 2,053 2,551 24.3 5.1
5 United Kingdom 2,320 2,422 4.4 4.9
6 Spain 2,246 2,044 -9.0 4.1
7 Russia 1,484 1,643 10.7 3.3
8 Austria 1,724 1,642 -4.7 3.3
9 Romania 1,391 1,341 -3.6 2.7
10 China 1,762 1,288 -26.9 2.6
Ue 27 28,701 28,152 -1.9 56.7
Extra Ue 27 20,187 21,542 6.7 43.3
BRICS 4,347 4,073 -6.3 8.2
T�ta� 48B889 49B694 1.6 100.0
Source: Istat data processed by Unioncamere Veneto
(a) definitive data; (b) provisional data
I�p�rt
Exp�rt
*In 2012, 97.2% of Veneto exports and 87.6% of Veneto import consists of manufactured goods.
Broken down by main types �f pr�duct11, 2012 was characterised by a weak trend in regional exports, which were influenced by the decline in some important sectors. Among the sectors that had an impact on foreign sales are machinery, the top item of the Veneto’s exports, which dropped by 2.1 percent compared to 2011. The value of this sector fell below the 10 billion euro mark (19.5% of total sales) (Table 8). Other electrical equipment, which account for 5.3 percent of regional goods sold, marked a 2.1 percent decline in value. Other important products for the regional economy recorded a smaller decrease: footwear (-3.8%,
11 This product classification aggregates the Ateco 2007 codes to highlight the leading sectors and areas of the Veneto’s foreign trade.
Tab�e 7 – The Veneto. Top 10 countries by origin of imports and destination of regional exports* (million of euros). Years 2011 and 2012

U�i��ca�ere Ve�et�
22
dropping to 2.1 billion euros), rubber or plastic products (-3.1%), yarns and fabrics (- 9.3%). Some highly specialised sectors of the Veneto’s manufacturing industry were able to grow, albeit very little. Among the sectors whose value is above the 2-billion-euro mark are the metallurgical industry, which recorded a 5.1 percent increase to 3.4 billion euros, metalwork (+2.1%, 2.9 billion euros), clothing (+3.9%, 2.7 billion euro) and eyewear (+6.2%, 2.6 billion euro). There were signs of significant increases only for food (+10.1%), chemicals, pharmaceuticals and synthetic fibres (+8.1%), jewellery (+9.7%) and beverages (+9.1%).
Pr�ducts 2010 (a) 2011 (a) 2012 (b) var.% c��p. %
1 Machinery 8,608 10,170 9,957 -2.1 19.5
2 Metallurgy 2,441 3,229 3,394 5.1 6.6
3 Metalwork 2,649 2,873 2,934 2.1 5.7
4 Clothing 2,558 2,636 2,739 3.9 5.4
5 Other electrical equipment 2,480 2,789 2,729 -2.1 5.3
6 Eyewear 2,242 2,482 2,636 6.2 5.2
7 Food 1,866 2,157 2,374 10.1 4.6
8 Tanning and leather processing 1,944 2,191 2,242 2.3 4.4
9 Furniture 2,056 2,174 2,230 2.6 4.4
10 Chemical Pharmaceuticals, synthetic fibers 1,855 2,032 2,197 8.1 4.3
11 Footwear 2,047 2,192 2,107 -3.8 4.1
12 Means of trasport and parts productions 2,268 1,927 1,992 3.4 3.9
13 Jewelry 1,486 1,557 1,708 9.7 3.3
14 Rubber and plastic products 1,559 1,698 1,646 -3.1 3.2
15 Beverages 1,312 1,491 1,627 9.1 3.2
16 Household appliances 1,185 1,226 1,263 3.0 2.5
17 Yarns and Fabrics 1,199 1,343 1,217 -9.3 2.4
18 Paper and printing 981 999 1,036 3.7 2.0
19 Other manifactured products 912 938 963 2.6 1.9
20 Agriculture and fishing 833 819 820 0.1 1.6
21 Electronic, medical and measuring equipment 795 805 775 -3.7 1.5
22 Other services 481 550 552 0.5 1.1
23 Knitwear 457 495 514 3.8 1.0
24 Cut, shaped and finished stones 409 425 460 8.2 0.9
25 Glass and glass products 406 427 409 -4.1 0.8
26 Refined petroleum products 290 386 298 -22.8 0.6
27 Wood 235 248 246 -0.9 0.5
28 Mining and quarrying products 57 60 61 1.3 0.1
T�ta� 45B613 50B318 51B128 1.6 100.0
(a) definitive data; (b) provisional dataSource: Istat data processed by Unioncamere Veneto
A look at i�p�rts shows that the decline in value was much sharper in the European Union (-11.7%) compared to non-EU markets (-7%). In 2012, the ranking of the main countries from which manufactured goods were imported continued to be led by Germany (over 7 billion euros), which now accounts for almost one quarter of the Veneto’s imports in spite of a severe 20.2% decrease. China remained in second place (3.5 billion euros), a decrease of incoming trade flows of 12.5 percent compared to 2011. There was a generalized decrease in almost all sectors. In particular, means of transport and parts production, the top import from abroad, fell by 7.8 percent, dropping to 37.6 billion euros. A decrease was also recorded by metallurgical products (-7.8%), chemical and pharmaceutical products (-8.5%), food products (-8.2%), and clothing, agriculture and machinery.
Tab�e 8 – The Veneto. Export by type of
product, classified by value (million of euros).
Years 2010-2012

The ec����y �f the Ve�et� i� 2012 a�d �ut���� f�r 2013
23
Pr�ducti�� structure Year 2012 was so far the worst year of the crisis in terms of the number of
businesses closed. According to data provided by Infocamere on the �u�ber �f busi�esses created a�d c��sed, i.e., the demographic changes in registrations
and closures (net of closures ex �ffici�), ab�ut 90 e�terprises a day we�t �ut �f busi�ess (5,207 more compared to 2011, i.e., a negative variation of almost
20%), totalling a �egative ba�a�ce �f 2B815 busi�esses on an annual basis (Chart 8). This result is the worst since the beginning of the decade and among all Italian regions; it is also the result of the trend in new-born businesses. Registrations of new firms decreased by 3.6 percent compared to the year before, standing at less than 30,000, the lowest in recent years. Only year 2009, the worst year since the beginning of the crisis, had recorded a greater loss, which, however, was fully recovered in the following two years. Based on the variations recorded by the Companies Register during the year, at
year-end 2012 the number of registered c��pa�ies a��u�ted t� 500B011,
down by 5,456 units, i.e., 1.1 perce�t �ess compared to 2011.
1,646 2,794 5,358 4,106 4,627 1,236 132
-1,021
3,357 3,481
-2,815
-4,000
-2,000
0
2,000
4,000
6,000
8,000
10,000
15,000
20,000
25,000
30,000
35,000
40,000
2002 2003 2004 2005 2006 2007 2008 2009 2010 2011 2012
Balance (right scale) Subscription (left scale) Cessation* (left scale)
* Since 2006 cessation have been calculated net of all compulsory cancellations occurred during the year.** Net of the new class of legal form: "Physical Person".
Source: Infocamere-Movimprese data processed by Unioncamere del Veneto
**
The downward trend also affected the active busi�esses, which suffered a
decline of more than 5,600 units, equal to :1.2 perce�t in relative terms,
amounting to slightly more than 450 th�usa�d u�its. A look at the changes in the stock reveals the severity of the crisis for industry (-3.1% including construction) and agriculture (-1.8%). This decrease has consolidated a long-term trend, as shown also by the data of the last agricultural census of 201012. By contrast, the tertiary sector was able to weather the economic crisis, posting an overall stable business activity.
12 According to the final data made public by ISTAT, the 2010 census recorded 119,384 businesses as opposed to 191,069 in 2000 census and 224,704 in 1982.
Chart 8 – The Veneto. Company registrations, closures and the balance of companies registered. Years 2002-2012

U�i��ca�ere Ve�et�
24
A detailed examination of individual ec����ic sect�rs (Table 9) reveals that the sharpest negative trend was registered by the construction industry (-3.5%), which was heavily hit by the housing crisis and the credit crunch. The data also confirmed that a de-industrialization process is underway in the economic fabric as a result of the sharp slowdown in industrial production, which is mainly due to the collapse in domestic demand. Compared to 2011, manufacturing lost more than 1,600 active units (-2.8%) and more than 13,000 units in 10 years (one-fifth of industries have been lost since 2002).
Registered Active
2011 2012 2011 2012
Ec����ic sect�rAgricolture, forestry and fishing 77,817 76,434 77,353 75,972 -1.8 -1.8
Mining 309 300 259 248 -2.9 -4.2
Manufacturing industry 64,575 62,896 57,484 55,872 -2.6 -2.8
Public utilities (energy, gas, water, environment) 1,180 1,353 1,085 1,258 14.7 15.9
Construction 78,194 75,949 74,029 71,405 -2.9 -3.5
Trade and repair of motor vehicles motorcycles 112,306 111,453 104,710 103,767 -0.8 -0.9
Transport services, logistics and storage 15,539 15,328 14,363 14,114 -1.4 -1.7
Accommodation and catering 32,413 32,750 28,394 28,581 1.0 0.7
Media and communication services 9,449 9,520 8,689 8,754 0.8 0.7
Financial Services & Insurance 9,279 9,369 8,908 9,000 1.0 1.0
Real estate 32,004 32,220 29,327 29,469 0.7 0.5
Advanced support services for businesses 17,163 17,334 15,682 15,858 1.0 1.1
Rental business, tourist services and supp. Business 10,389 10,634 9,655 9,857 2.4 2.1
Private education and training services 1,778 1,805 1,680 1,698 1.5 1.1
Health, social care and private health services 1,796 1,898 1,652 1,751 5.7 6.0
Services to the person 4,178 4,227 3,684 3,738 1.2 1.5
Other activities 18,909 18,885 18,481 18,434 -0.1 -0.3
Unclassified Companies 18,189 17,616 492 486 -3.2 -1.2
6ega� f�r�Corporations 109,222 109,634 83,203 83,608 0.4 0.5
Partnerships 113,163 110,830 95,639 93,880 -2.1 -1.8
Individual firms 273,313 269,646 270,158 265,708 -1.3 -1.6
Cooperatives 5,834 5,846 3,792 3,839 0.2 1.2
Other forms 3,935 4,015 3,135 3,227 2.0 2.9
T�ta�7 505B467 500B011 455B927 450B299 :1.1 :1.2
Source: Infocamere-Movimprese data processed by Unioncamere Veneto
Registered Active
var.% 12C11
* From the second quarter of 2012 due to the new Services Directive in the analysis of companies there is a new class of legal form "Physical
Person" that has been included only in the total and not by sector and by legal form to allow proper comparability with the 'previous year. The
total variation, even though it includes this new class, does not change because of this consistency irrelevant.
A further analysis of �a�ufacturi�g fir�s (Table 10) shows that all sectors recorded more or less marked contractions, except for repairs, maintenance and installation of machinery, which showed a positive trend (+5.1% compared to 2011); this sector belongs to manufacturing according to the new ISTAT classification of economic activities, but in fact it falls under the services sector. More specifically, the greatest losses occurred in the wood and furniture (-4.2%), electrical and electronic machinery (-4.1%) and marble, glass, and ceramics (-4%) industries. The drop was not as sharp in the following sectors: fashion and metal and metal products (-3.2% respectively), machinery and mechanical equipment (-3%), transport (-2.7%), chemical and pharmaceutical (-2.6%) and rubber and plastic products (-2.4%). Though to a lesser extent, also the variations in the paper and printing (-1.7%) and food, beverages and tobacco (-1.1%) industries were negative. The sector that showed a stronger positive trend was public utilities: it was driven by the renewable energy segment and recorded a 15.9 percent increase in active
Tab�e 9 – The Veneto. Registered and active
companies by sector and legal form (absolute value and % var. over previous
year). Years 2011 and 2012

The ec����y �f the Ve�et� i� 2012 a�d �ut���� f�r 2013
25
companies. The tertiary sector registered a positive trend with substantial increases in healthcare and social services (+6%), followed by the rental business, tourism services and services to companies (+2.1%), services to persons (+1.5%), advanced services to business and educational services (both +1.1%) and financial and insurance services (+1%). The only negative items in the services sector were transport and logistics, which in 2012 recorded a further decline of 1.7 percent, and trade (-0.9%), which was hit hard by the sharp drop in consumption.
Registered Active
2011 2012 2011 2012
Food, beverage and tobacco 4,076 4,032 3,689 3,648 -1.1 -1.1
Textile, clothing and footwear 11,913 11,519 10,224 9,899 -3.3 -3.2
Wood and furniture 10,021 9,682 8,971 8,595 -3.4 -4.2
Paper, print and furniture 2,502 2,461 2,235 2,197 -1.6 -1.7
Chemical, pharmaceutical and oil industries 705 687 604 588 -2.6 -2.6
Rubber and plastic 1,646 1,617 1,443 1,408 -1.8 -2.4
Marble, glass, ceramics and non metal products 3,325 3,196 2,942 2,825 -3.9 -4.0
Metal and metal products 13,367 12,967 12,163 11,778 -3.0 -3.2
Electrical and electronics machinery 3,548 3,429 3,105 2,977 -3.4 -4.1
Machine tools 4,851 4,697 4,175 4,050 -3.2 -3.0
Means of transport 1,138 1,107 971 945 -2.7 -2.7
Repair and maintenance machinery and equipment installation 2,588 2,723 2,507 2,635 5.2 5.1
Other manufacturing enterprises 4,895 4,779 4,455 4,327 -2.4 -2.9
T4TA6 64B575 62B896 57B484 55B872 :2.6 :2.8
Source: Infocamere-Movimprese data processed by Unioncamere Veneto
Registered Active
var.% 12C11Ec����ic Sect�r
Looking at the number of enterprises by �ega� f�r�, it can be seen that the transformation of the enterprise base towards more structured forms of companies continued in 2012. The number of joint-stock companies registered an increase of 0.5 percent compared to 2011, while partnerships and sole proprietorships both witnessed a decline of 1.8 percent and 1.6 percent respectively. In sharp contrast to 2011, the number of cooperatives recorded an increase of 1.2 percent.
E�terprises �w�ed by w��e�B y�u�g pe�p�e a�d f�reig�ers According to data released by Infocamere, in 2012 the number of busi�esses �w�ed by w��e� and f�reig�ers in the Veneto registered a positive balance between registrations and closures of 4,557 and 1,282 businesses respectively. This result, however, failed to make up for the sharp contraction in the enterprise base, since the weight of these business categories was small compared to the total number of enterprises in the Veneto: only 9.2 percent for businesses owned by young people under age 35 and 8.4 percent for businesses owned by foreigners. In contrast to previous years, businesses owned by w��e� closed the year with a slight decrease (-103 units). Broken down by sector, women-owned businesses were concentrated mainly in trade (25.3%) and in agriculture and related activities (18.8%). The enterprises owned by young people and foreigners operated mainly in the commercial sector (24.5% and 28.6% respectively) and construction (23.9% and 33.5%).
Tab�e 10 – The Veneto. Registered and active companies by manufacturing sector (abs. value and % var. over previous year). Years 2011 and 2012

U�i��ca�ere Ve�et�
26
6ab�ur �ar&et
In 2012, the drop in production levels and consumption of households inevitably had pretty severe repercussions on the labour market. According to calculations
by Veneto Lavoro based on Silv data13, 2012 closed with a �egative e�p��y�e�t ba�a�ce �f �ver 15B000 %�bs, a sharp drop compared to 2011 (-8,700 units) and 2010 (-7,200 units), but far better than in 2009 (-43,400 units). The trend in employment during the year showed cyclical variations, which followed the same pattern of the last four years, characterized by an improvement in the first half and a sharp slowdown in the last of months of the year. The first two quarters of 2012 showed a favourable trend with a positive employment balance (+32.1 and +12.5 thousand units respectively), while the last two quarters registered a decline in jobs (- 60,500 units in total), which was much more marked in the last three months. However, this decrease is physiological considering that the year-end coincides with the administrative closure of contracts, especially those for temporary workers.
The �egative e�p��y�e�t ba�a�ce is attributable in particular to a marked decline in the volume of new hires (from 660.7 to 615,900 units, accounting for -6.8%), which was not offset by the negative trend in terminations (down from 669.4 to 631.8 thousand units, equal to -5.6%).
-120,000
-100,000
-80,000
-60,000
-40,000
-20,000
0
20,000
40,000
giu
lug
ago
set
ott
no
vdic
gen
feb
mar
apr
mag giu
lug
ago
set
ott
no
vdic
gen
feb
mar
apr
mag giu
lug
ago
set
ott
no
vdic
gen
feb
mar
apr
mag giu
lug
ago
set
ott
no
vdic
gen
feb
mar
apr
mag giu
lug
ago
set
ott
no
vdic
2008 2009 2010 2011 2012
Agriculture Manufacturing Services
* * net domestic work and intermittent workSource: Silv data processed by Veneto Lavoro
With regard to labour demand by sector, the trend was positive only for agriculture (+5%). The other sectors showed a decrease in hiring, particularly in construction (-20.1%) and industry (-17.5%), while the service sector registered a 3.1 percent decrease. The same trend was also seen in terminations, resulting in a
13 Silv (Sistema informativo lavoro veneto - Veneto Labour Market Information System) enables monitoring labour market trends in the Veneto, with reference to employees and insourced workers for which it is
mandatory to notify the beginning of the work contract (so-called c���ab�ra/i��i a pr�gett� - project-based
contracts, c���ab�ra/i��i c��rdi�ate e c��ti�uative - coordinated and continued collaboration, “�i�i1c�c�c�”). For more information, refer to www.venetolavoro.it.
Chart 9 – The Veneto. Position of employees*
by macro sector (cumulative var.
compared to 26 June 2008, daily data).
June 2008 - Dec. 2012

The ec����y �f the Ve�et� i� 2012 a�d �ut���� f�r 2013
27
net positive employment balance in services (+2.3 thousand units) and agriculture (+0.2 thousand). In industry and construction, the balances continued to be negative (-11.1 and -7.2 thousand), though lower than in 2011 (Chart 9). The drop in new hires affected almost equally both the Italian and foreign component, while the decrease in the hiring of men (-10.9%) was worse than that of women (-2.5%). Net balances showed the largest contractions in employment for men (-13.3 thousand, compared to -2.5 thousand units for women). Broken down by type of contract, both new hires and terminations recorded contractions. The balances were negative, especially for fixed-term contracts (including administration) and apprenticeship (-15.1 thousand units), while that of permanent contracts was more modest (-800 units).
2011 2012var.%
12C112011 2012
var.%
12C112011 2012
T�ta� 660.7 615.9 -6.8 669.4 631.8 -5.6 -8.7 -15.9
Ge�der
Female 321.6 313.7 -2.5 324.3 316.2 -2.5 -2.7 -2.5
Male 339.1 302.3 -10.9 345.1 315.6 -8.5 -6.0 -13.3
�ati��a�ity
Italian 476.5 445.7 -6.5 488.2 459.6 -5.9 -11.7 -13.9
Foreign 184.3 170.3 -7.6 181.3 172.2 -5.0 3.0 -1.9
Sect�r
Agriculture 49.9 52.4 5.0 49.8 52.2 4.8 0.1 0.2
Industry 153.3 126.5 -17.5 156.4 137.6 -12.0 -3.1 -11.1
Construction 36.9 29.5 -20.1 44.1 36.7 -16.8 -7.2 -7.2
Services 420.6 407.6 -3.1 419.2 405.3 -3.3 1.4 2.3
Type �f c��tract
Indefinitely 102.7 90.8 -11.6 98.0 91.6 -6.5 4.7 -0.8
Apprenticeship 41.0 34.3 -16.3 46.3 38.6 -16.6 -5.3 -4.3
Temporary 394.3 385.0 -2.4 400.7 394.4 -1.6 -6.4 -9.4
Administering 122.6 106.0 -13.5 124.3 107.4 -13.6 -1.7 -1.4
* net domestic work and intermittent work
Source: Veneto Lavoro-Silv data processed by Unioncamere Veneto
Ba�a�ceRecruit�e�t C��sures
In 2012, after the sharp slowdown of 2011, the authorised hours of CIG showed a further increase, from 87 to almost 103 million (+18.2%), which was especially evident in the second half of the year. The value was, however, lower than in 2010 (124.5 million hours). The increase in hours of temporary unemployment benefits (CIG) is largely attributable to ordinary CIG (over 28 million compared to 20 in 2011, +40.2%) and to special CIG (39.7 million against 30.2 of 2011, +31.5%). Extraordinary CIG decreased (35.1 million as opposed to 36.8 in 2011, -4.7%). Increased recourse to temporary unemployment benefits was matched by the
increase in the number of c��pa�y crises14, from 1,063 units in 2011 to 1,502 in 2012. At the same time, the number of workers affected by subsequent extraordinary CIG measures and/or layoffs increased (+67.1%, involving more than 34 thousand workers, as opposed to 20.8 thousand in 2011). As to the
14 This is a formal procedure to announce a company crisis: it is started with a communication from the company to trade union representatives, INPS (Italy’s National Social Security Institute) and the Provincial Commission for Labour Issues.
Tab�e 11 – The Veneto. Recruitment, terminations and balance of employees* by gender, citizenship and industry (in thousands). Years 2011 and 2012

U�i��ca�ere Ve�et�
28
number of workers �ade redu�da�t, the figure rose by 4.7 percent. This trend was the result, on the one hand, of a sharp decline in collective redundancies (-25.5%) and, on the other, of a significant increase in individual lay-offs (+20.5%), which confirmed the increased difficulties being experienced by small businesses. The economic survey of Unioncamere Veneto also confirms the negative employment trend in 2012. As to manufacturing firms, the average annual contraction amounted to 0.9 percent, slightly worse than in 2011 (-0.5%). The decrease affected all business sizes: micro-enterprises (up to 9 employees) registered -0.8 percent and larger enterprises (10 employees or more) -0.9 percent. At a sector level, the wood and furniture (-2.7%), marble, glass and ceramics (-2.3%) and food industries (-1.6%) all had a negative performance. The only sectors to record slightly positive employment trends were the mechanical equipment and metal products sectors (both +0.3%).
The Ve�et�C��giu�tura’s economic survey showed a significant decline in employment in construction (-1.7%) and an increase in trade (+0.9%).
90
92
94
96
98
100
102
I II III IV I II III IV I II III IV I II III IV I II III IV
2008 2009 2010 2011 2012
Enterprises with up to 9 employees
Enterprises with 10 or more employees
Source: Unioncamere Veneto - Veneto Congiuntura Research
According to ISTAT, in the Veneto region, the �u�ber �f e�p��yed pe�p�e a��u�ted t� 2.1 �i��i�� in 2012, stable15 compared to 2011, as were the national average and the figure for the North-East. Broken down by sector, the number of employed people grew only in trade (+9.7%) and agriculture (+7.5%). The other sectors registered decreases: construction (-3.2%), services (-2.7%) and
industry (-2.4%). The e�p��y�e�t rate, i.e. persons in employment as a percentage of the population of working age (15- 64 years) amounted to 65
percent, in line with the 2011 figure (64.9%). The u�e�p��y�e�t rate was equal to 6.6 percent, down by 1.6 percentage points compared to 2011, less alarming than Italy’s national figure (+10.7%). However, the marked increase in
pe�p�e see&i�g e�p��y�e�t (+33.9%), which reached 150,000 units (compared to 112 thousand units in 2011), is worrying.
15 Calculations obtained from Infocamere data, integrated with INPS data, showed stable employment in the Veneto’s businesses in the private sector, confirming very negative results in the construction and manufacturing sectors.
Chart 10 – The Veneto. Employment in
manufacturing enterprises by size (index number:
2008 base = 100). Years 2008-2012

The ec����y �f the Ve�et� i� 2012 a�d �ut���� f�r 2013
29
2011 2012 var. % 2011 2012 var. % 2011 2012 var. %
Labour force 2,246 2,286 1.8 5,360 5,450 1.7 25,075 25,642 2.3
Total Employees 2,134 2,136 0.1 5,091 5,087 -0.1 22,967 22,899 -0.3
Agriculture 70 75 7.5 179 186 3.9 850 849 -0.2
Industry 617 602 -2.4 1,370 1,334 -2.7 4,692 4,608 -1.8
Construction 173 167 -3.2 378 365 -3.3 1,847 1,754 -5.0
Commerce 413 453 9.7 990 1,032 4.3 4,517 4,651 3.0
Services 862 839 -2.7 2,174 2,170 -0.2 11,061 11,037 -0.2
Looking for employment 112 150 33.9 269 363 34.9 2,108 2,744 30.2
Source: Istat data processed by Unioncamere Veneto
Ve�et� ��rth:East Ita�y
Y�uth employment is a major emergency at both the national and regional level. According to ISTAT, in the Veneto in 2012, the employment rate for young people under 29 years of age was equal to 42 percent, a steady decline since 2007 (then 52%). By contrast, the number of employed people aged over 55 years registered strong growth, resulting in a 42.8% rate (31% in 2007). These trends are determined by two factors: on the one hand, the ageing of the population in working age due to the low demand for labour and the lower need to replace those in employment; on the other, the phenomenon of temporary work contracts that are creating increasingly unstable working conditions for young people. The result has been a tightening of the economic system which, with the lack of young workers, is wasting the opportunity to introduce new working approaches, technologies and innovations, creating a system that hinders competitiveness.
The e�trepre�eurs’ e�p��y�e�t f�recasts f�r 2012 were c��fir�ed The actual results confirm the forecasts made by entrepreneurs and recorded by the Exce�si�r survey �� the e�p��y�e�t �eeds �f e�terprises carried out by Unioncamere. The Veneto’s entrepreneurs, influenced by the worsening of the economy, predicted a drop in employment of nearly 8,000 jobs (-0.7%) in 2012, which is the balance between the 60,000 new hires (rate of entry of +5.1%), of whom 20,000 seasonal, and 68,000 planned lay-offs (exit rate of +5.8%). This proves the reliability of the Excelsior survey, which at a national level is one of the most important sources of information on the labour market and a useful tool to bring together labour demand and supply. Also broken down by sect�r, the Excelsior forecasts have proven to be reliable: job flows were expected to decline in all sectors and they did, though at differing rates compared to what actually happened. Indeed, while equal employment balances had been forecast for both industry and services, in actual fact, the services sector shrank less than the manufacturing sector. Skilled workers in the trade and services sectors (clerks
and waiters) are the ��st s�ught:f�r %�b pr�fi�es and account for 29.7 percent of estimated new hires, followed by technical occupations (14.8%) and unskilled occupations (13.3%). These are followed by specialised workers (12.8%), white-collar workers (11.7%), plant operators and semi-skilled workers (10.3%), the intellectual, scientific and highly specialized professions (7.1%) and managers (0.3%). The hiring expectations by level of education showed, instead, high school graduates (39.5%) in first place, followed by staff without specific training (32.5%), qualified staff (14.6%) and graduates (13.3%).
Tab�e 12 – Italy, the North-East and the Veneto. Labour force by industry (in thousands). Years 2011 and 2012

U�i��ca�ere Ve�et�
30
Agricu�ture In a year characterised by great concerns about agricultural production due to abnormal weather trends during the summer season, with very high temperatures and a prolonged period of drought, the total turnover of the Veneto’s agricultural
sector held out nevertheless. The va�ue �f pr�ducti�� in 2012 stood at 5.3 billion euros, a level very similar to, if not slightly higher than the previous year (+0.5%). This result was mainly due to the upward performance of markets: the percentage changes at constant prices were all negative and showed a decrease in the quantity produced of agricultural crops, mainly because of the drought, while animal husbandry registered a drop in production at somewhat lower levels. Taking into account the production values at current prices, it is possible to note the effect of growing market trends, which were registered mainly in the second half of 2012 when it was clear that the main agricultural crops around the world would witness significant drops in quantities produced.
current prices constant prices
Hebaceous crops -5 ÷ -7% -12 ÷ -14%
Woody crops +2 ÷ +4% -8 ÷ -10%
Farming product +3 ÷ +5% -1 ÷ -3%
Gr�ss �utput 0 F G1% :5 F :7%
Source: Istat data estimated by Veneto Agricoltura A detailed analysis of the economic and production results achieved in 2012 by individual crops and livestock shows the effect of the summer drought on
cerea�s, whose production grew for autumn-winter cereals (wheat 26%, durum wheat +11% and barley +6%), while it decreased for spring and summer cereals (maize -35%, rice -10%). Maize continued to be the leading crop in the Veneto region with 270,000 hectares (+10%). The area under wheat increased, while there was a drop in the hectares planted with durum wheat (-5%), barley (-9%) and rice (-15%). As a whole, cereals benefited from significant increases in prices in domestic and international markets during the second half of 2012, reversing the disappointing start of the year. As for i�dustria� cr�ps, hectares planted with sugar beet increased (+39%), which led to a rise in production (+23%) despite the decline in yield (-12%). Soy suffered from the summer drought and registered a significant drop in production (-43%), partly due to the contraction in surface planted (-11%), but benefited from rather high market prices especially at the start of the new marketing year. The production of tobacco (-37%), sunflower (-13%) and rape (-16%) decreased as well.
Potatoes and vegetab�es confirmed the surfaces of the previous year, registering a slight increase in production value (+1.2%). The market trends varied during the
Tab�e 13 – The Veneto. Trend in gross
agricultural production (% var. over previous
year). Year 2012

The ec����y �f the Ve�et� i� 2012 a�d �ut���� f�r 2013
31
year depending on the species and varieties: the average annual price decreased for radicchio (-8%) and potatoes (-15%), but showed increases for lettuce (+18%) and strawberries (+24%). The summer drought also affected the production of
the main fruit cr�ps (apples -5%, pears -12%, and peaches -13%). However, the lower supply and good quality of the product allowed for more favourable market prices, after the disappointing commercial results of previous years.
The Veneto’s wi�es grapes a�d wi�e recorded a significant contraction both in terms of grape production (-4.6%) and wine (-7%) due to abnormal weather trends, but the contraction in offer led to a rise in grape prices (+10% on average) for the third consecutive year and to an excellent performance in wine prices.
Mixed but generally positive results were recorded for a�i�a� husba�dry. The price of milk, whose production has been stable for some years now at around 11 million tons, shrank by about 5 percent after increasing the previous year. The commercial performance of beef and pork (+10% and +5% respectively) was positive, while poultry prices were stable and the price of eggs registered a substantial increase. However, the sharp increase in the price of maize and soybeans in the second half of the year significantly reduced the profitability of
animal farms. The trend of sea fishi�g in the Veneto region, as recorded at regional fish markets, remained virtually unchanged in quantity compared to the previous year (-0.2%), while turnover witnessed a dramatic decrease (-11.7%). The production crisis that hit the Veneto’s Consortia for the Management and Protection of Bivalve Molluscs in the Venice Maritime District (Co.Ge.Vo.) seems to have been weathered and an 83.3 percent increase was registered in the production of bivalve molluscs.
The number of far�s registered with the Veneto’s Chambers of Commerce continued to fall; in 2012 the figure dropped to 72,400 units, a decrease of 1.9 percent compared to 2011, anyhow less than the national average (-2.4%). The Veneto’s food sector also recorded a slight decline in the number of active enterprises, which decreased by 1.1 percent in 2012, down to about 3,650 units. This decrease was less significant than that suffered by the manufacturing sector (-2.8%).
There was a significant increase in the number of pe�p�e e�p��yed i� agricu�ture (according to ISTAT, +7.5% in 2012), while the food industry showed a loss of jobs, which, according to the Unioncamere Veneto survey, was 1.6 percent higher than the average for the entire industrial sector (-0.9%).
It is worth noting that in 2012 the deficit of the trade ba�a�ce of the Veneto’s food products recorded a substantial improvement (751 million euros compared to 1.1 billion in 2011), due to the significant increase in exports (+7.9%, especially attributable to the good performance of food and beverages, i.e., 4.8 billion euros of goods sold) and the stability of imports (stable at about 5.6 billion euros of goods purchased).

U�i��ca�ere Ve�et�
32
5a�ufacturi�g 2012 was a bad year for manufacturing, which recorded a significant slowdown in production levels. Overall production volumes dropped sharply compared to those recorded in 2011 and were close to those of 2009.
According to the Ve�et�C��giu�tura16 survey, in 2012, the regi��a� i�dustria� pr�ducti�� i�dex registered an average annual trend of -4.3 percent. The indicator recorded the greatest difficulties between April and June, reaching the -5.3 percent mark, and closed the year with significant yet less marked negative changes (Table 14).
1C2012 2C2012 3C2012 4C2012
Sect�r
Food, beverage and tobacco 0.8 0.2 -0.4 -1.5
Textile, clothing and footwear -6.8 -10.2 -5.2 -4.8
Wood and forniture -8.4 -7.7 -6.9 -6.7
Paper, print and furniture -7.0 -7.1 -4.4 -3.0
Rubber and plastic -1.0 -4.5 -4.7 -2.0
Marble, glass, ceramics and non-metal products -8.2 -8.6 -7.0 -6.4
Metal and metal products -2.7 -6.5 -6.3 -2.1
Machine tools -0.5 -3.2 -4.9 -3.7
Electrical and electronics machinery -4.4 -6.9 -4.5 -2.7
Means of transport -6.3 -3.3 -6.6 -6.1
Other manufacturing enterprises -0.5 -2.2 -3.5 0.3
5ai� gr�upi�g �f I�dustries
Capital goods -2.0 -3.4 -4.8 -4.5
Intermediate goods -4.1 -7.3 -5.8 -3.0
Consumer goods -4.0 -4.1 -3.9 -3.3
C�ass si$e
2 - 9 employees -7.7 -8.2 -7.0 -7.9
10-49 employees -5.2 -4.8 -5.1 -3.5
50-249 employees -2.4 -5.4 -4.1 -1.9
250 or more employees 1.2 -3.5 -3.6 -4.5
T�ta� :3.6 :5.3 :4.9 :3.4
Source: Unioncamere Veneto - Veneto Congiuntura Research The drop in production levels affected businesses of all sizes, but, once again, small enterprises were the most affected by the downturn. Micro-enterprises (2-9 employees) recorded a sharp drop in production (-7.7% on an annual basis), with significant and constant quarterly contractions during the year. There was a less marked decrease in small and medium-sized enterprises, which in 2012 posted a decrease in production of -4.6 and -3.5 percent respectively. Large enterprises, however, showed a more moderate decrease in production (-2.6%), due to the good performance in the first quarter of the year.
16 The Ve�et�C��giu�tura survey, conducted every quarter on a regional sample of over 2,500 manufacturing firms with at least 2 employees, is the main source of information for the economic analysis of manufacturing firms for both its scope of observation and the rigour of the method adopted (see www.venetocongiuntura.it).
Tab�e 14 – The Veneto. Trend in industrial
production by activity, field of industry and
company size (% var. over the same quarter of
previous year). Year 2012

The ec����y �f the Ve�et� i� 2012 a�d �ut���� f�r 2013
33
Broken down by sector, the negative trend was mainly due to industries that produce intermediate goods (-5.1%), a decrease of 2.2 percentage points compared to 2011. The decline in production was more modest, but still negative in the fields of consumer and capital goods (-3.8% and -3.7% respectively). Considering individual sectors, those hit hard by the crisis were marble, glass and ceramics (-7.5%), wood and furniture (-7.4%) and fashion (-6.8%). Instead, the production trends in food, beverages and tobacco industries remained rather stable during the year (-0.2%).
The results of the Ve�et�C��giu�tura survey are in line with the data disclosed by the Tuscany and Piedmont regional branches of Unioncamere, which recorded variations in production of -4.3 and -4.7 percent respectively. Lombardy recorded a more moderate decrease (-3.8%).
-4.3
-3.8
-4.3
-4.7
-6
-5
-4
-3
-2
-1
0
Veneto Lombardy Tuscany Piedmont*
* Enterprises with 2 or more employees
Source: Italian Unioncamere and Regional Unioncamere data processed by Unioncamere Veneto
The fall in production was also confirmed by the decrease in the capacity uti�i$ati�� rate indicator (Chart 12), whose average annual rate was 70.3 percent of full operating capacity, 3.3 percentage points less than in 2011.
In addition to production, the tur��ver of the Veneto’s manufacturing industry
suffered from the negative effects of the crisis. According to Ve�et�C��giu�tura data, total revenues were down by 3.7 percent on an annual basis, reversing the
positive trend recorded in 2011. Unfortunately, also f�reig� sa�es - the only driving force of the Veneto’s industry - came to a standstill: in 2012 sales abroad grew very little (+0.7%), marking a significant slowdown compared to 2011 when they had returned to pre-crisis levels (+6.7%) (Chart 13).
There was also a slowdown in �rders (-4.6%), which confirmed that a possible recovery for the Veneto’s manufacturing industry will be further delayed. This trend is mainly due to a sharp decline in domestic orders, which posted a -5.8 percent. The decline in orders from foreign markets was less marked (-0.5%), though significantly worse compared to 2011 (when they were up by 4.4%).
These trends inevitably affected e�p��y�e�t, which in 2012 recorded a slight yet constant decrease (-0.9%) in each quarter of the year (-0.8% between January and March and -1.3% at year-end).
Chart 11 – Italy. Trend of industrial production in a number of Italian regions (% var. over the previous year). Year 2012

U�i��ca�ere Ve�et�
34
60
65
70
75
80
85
90
70
80
90
100
110
120
130
I II III IV I II III IV I II III IV I II III IV I II III IV I II III IV
2007 2008 2009 2010 2011 2012
production (left scale)
seasonally adjusted production (left scale)
level of use of the system (right scale)
Source: Unioncamere Veneto - Veneto Congiuntura Research
100
120
140
160
180
200
I II III IV I II III IV I II III IV I II III IV I II III IV I II III IV
2007 2008 2009 2010 2011 2012
turnover foreign sales
Source: Unioncamere Veneto - Veneto Congiuntura Research
Chart 13 – The Veneto. Trend in turnover and
foreign sales for companies with less
than 10 employees (based index: 2005=100).
Years 2007-2012
Chart 12 – The Veneto. Trend of industrial
production (raw and seasonally-adjusted index based on 2005=100) and
capacity utilization rate for companies with less
than 10 employees. Years 2007-2012

The ec����y �f the Ve�et� i� 2012 a�d �ut���� f�r 2013
35
C��structi�� In 2012, the crisis in construction continued. The sector has been hit by a long
and very consistent recession. The final data on the trend in the c��structi�� �ar&et, according to estimates drawn up by Cresme for the CEAV-Unioncamere Veneto observatory on the construction market, showed that the period between 2008 and 2012 was the worst crisis since the Second World War, with a drop of -14.2 percent in real terms and -22.8 percent in constant values (net of inflation). In 2012, the construction sector in the Veneto reaped investment of slightly over 13.7 billion euros, as opposed to 16 billion euros in 2008. In four years, the market lost about 2.3 billion euros in investment.
2008 2012var. %
12C08
c��p. %
2008
c��p. %
2012
�ew Bui�di�gs 8B974 6B299 :29.8 56.0 45.8residential buildings 4,872 3,469 -28.8 30.4 25.2
non-residential private buildings 2,506 1,243 -50.4 15.6 9.0
non-residential public buildings 361 301 -16.6 2.3 2.2
civil engineering 1,235 1,286 4.1 7.7 9.4
Re��vati�� 7B046 7B454 5.8 44.0 54.2residential buildings 3,457 3,887 12.4 21.6 28.3
non-residential private buildings 2,204 2,639 19.7 13.8 19.2
non-residential public buildings 447 270 -39.6 2.8 2.0
civil engineering 938 658 -29.9 5.9 4.8
T�ta� i�vest�e�ts 16B020 13B753 :14.2 100.0 100.0
Source: data processing and forecasting by CRESME on behalf of the CEAV-Unioncamere Veneto observatory Evidence of the crisis can be found in the transformation of the market make-up. In 2008, new constructions accounted for 56 percent of investments; in 2012 renovations were the main market. In four years, this market not only declined in terms of investment, but the structure of demand also changed dramatically, with a significant contraction in some traditional segments, such as new non-residential private buildings, which in four years saw its business halved, or new residential buildings, which lost almost 29 percent in investment. The rise in renovations, a countercyclical phenomenon already experienced in the
previous crisis following the ‘:a�i Pu�ite’ scandal in the 1990s, can also be
associated to the effect of the “pia�� case” - literally, housing plan - which at 31 December 2012 registered nearly 50,000 applications. However, despite the limited yet positive trend in renovations, the continuing crisis has aggravated the employment situation. According to ISTAT data on labour force, in 2012, there was a decrease of 5,400 employees in the building industry, amounting to an annual decrease of 3.2 percent. In the 2008-2012 period, the overall loss of people employed in the sector amounted to over 13,650 employees, a decrease of 7.6 percent. The crisis is first and foremost a crisis that has hit enterprises and over the last year it has been felt most dramatically, although not by all types of enterprises. In fact, looking at the data on the number of artisan and non-artisan
active busi�esses by legal form, there was a decrease in the total number of firms (-3.5% compared to 2011), but some forms of business have been growing
Tab�e 15 – The Veneto. Investment in the market of reference (millions of euros in current value). Years 2008 and 2012

U�i��ca�ere Ve�et�
36
strongly, such as joint-stock companies in the artisan sector (+2.3%) and artisan cooperatives and consortia (+8.3%) (Table 16). By contrast, one-man businesses in the non-artisan sector are caught in a serious crisis (-14.8% in the last year). As already seen in previous years, better structured companies and companies joined by forms of cooperation have proven to better tackle the crisis. This element can be useful in defining a strategy for the market in the future.
2010 2011 2012Var. %
2012C2011
Var. %
2012C2010
Corporations 2,258 2,426 2,482 2.3 9.9
Partnerships 7,956 7,769 7,530 -3.1 -5.4
Individual firms 47,799 46,949 45,409 -3.3 -5.0
Other forms* 61 60 65 8.3 6.6
T�ta� 58B074 57B204 55B486 :3.0 :4.5
Corporations 9,675 9,726 9,486 -2.5 -2.0
Partnerships 3,222 3,155 2,973 -5.8 -7.7
Individual firms 2,788 3,158 2,691 -14.8 -3.5
Other forms* 807 786 775 -1.4 -4.0
T�ta� 16B492 16B825 15B925 :5.3 :3.4
T�ta� 74B566 74B029 71B411 :3.5 :4.2
* "Other forms" include cooperatives and consortia
Source: Infocamere-Movimprese data processed by Unioncamere Veneto
Artisan
Non-artisan
Against the backdrop of a major economic slowdown, the CEAV-Unioncamere Regional Observatory underscored that the crisis was felt more intensely especially by non-artisan businesses in the second part of 2011 and at the beginning of 2012, while the trend was less severe - though negative - for artisan businesses. The figures for the last two quarters of 2012 suggest a partial “recovery” and rebalancing of the unfavourable situation, which, if well supported by government incentives for building renovation and renewable energy, could register an easing of the negative phase in the near future and later benefit from a much-awaited recovery in the industry. In this context it should also be noted that the housing plan laid down by Regional Law No. 13/2011 has created opportunities especially for small firms, limiting the crisis that could have had even more severe effects, as in other Italian regions where these measures have not met with the same success. However, an essential role in curbing the crisis and creating positive prospects for the sector has been played by the renewal of measures like the regional housing plan (which expires in November 2013) and the national incentives for renewable energy sources and building renovation, which after June 2013 will return to the previous limits, thus making renovation works less appealing for potentially interested parties.
Tab�e 16 – The Veneto. Active artisan and non-
artisan building enterprises by legal status.
Years 2010-2012

The ec����y �f the Ve�et� i� 2012 a�d �ut���� f�r 2013
37
Trade In 2012, the impact of austerity policies on family budgets and the fall of
household disposable income led to a sharp drop in retai� sa�es despite the contraction in savings. At a national level, the free fall in consumption reached - if not exceeded - the negative level recorded in 2009, which was a difficult year. According to ISTAT data, the decline in retail sales in Italy affected the entire sector, although it was more marked in the sales of non-food products, compared to food products, which is a sign of the widespread difficulties encountered by Italian families who have been forced to cut waste and to just buy basic necessities. This downward spiral also heavily impacted on the Veneto where, according to
the data of the Ve�et�C��giu�tura survey, the trend in retai� sa�es was very negative. In 2012, sales recorded an average annual contraction of -5.8 percent, higher than the already serious level recorded in 2009 (-5.3%).
The �egative ba�a�ce �f c��su�pti�� affected all types of products and, like at the national level, the poor performance of non-food products (-6.8%) was
higher than that of food products (-4.7%). Also with regard to the si$e variab�e, the decrease in sales was widespread and affected all businesses: small and medium-sized retailers recorded a 6.4 percent decrease and supermarkets a 5.5 percent decrease (Chart 14).
-5.8
-3.8
0.4
-1.3
-2.9
-7.1
-3.1
-5.8
-2.7
-4.3-3.6
-9.3
-3.6
-10.0
-5.2
-8.4
-12
-8
-4
0
4
I II III IV I II III IV
2011 2012
Source: Unioncamere Veneto - Veneto Congiuntura Research
Food items
Non food products
-3.3 -4.2
-2.6
-7.4
-3.5
-9.4
-4.9
-7.7
0.5
-2.0
-3.5 -3.5
-0.8
-8.3
-5.2
-7.9
I II III IV I II III IV
2011 2012
Small/Medium scale retail trade
Large scale retail trade
The indicator relating to orders also recorded a sharp slowdown on an annual basis (-5.8%). In addition to the difficult economic situation, the negative trend in consumption was affected by rising prices. According to ISTAT, the average annual variation of
the �IC i�dex (national index of consumer prices for the entire community including tobacco) stood at 3 percent nationally and 2.9 percent at the regional level, a slight increase compared to 2011 when these same values were +2.8 and +2.5 percent respectively. With reference to spending items (Chart 15), in the Veneto the highest rates of
Chart 14 – The Veneto. Trend in retail sales by product and business size (% var. vs. same quarter of previous year). Years 2011 and 2012

U�i��ca�ere Ve�et�
38
growth in prices were registered in the costs for housing, water, electricity and fuel (+7%), transportation (+6.8%) and alcoholic beverages and tobacco (+5.7%). More moderate increases of less than 3 percent were recorded for the other items. The only spending item, which did not contribute to inflation, remaining stable, was recreation, entertainment and culture, while prices for communications were down by 1.1 percent.
-1.1
0.2
0.6
1.5
1.7
2.1
2.3
2.5
2.6
2.9
5.7
6.8
7.0
-1.5
0.4
0.0
1.5
2.6
2.3
2.1
2.5
2.2
3.0
5.9
6.5
7.1
-2 0 2 4 6 8
Communications
Recreation, entertainment and culture
Sanitary service and expenses for health
Accommodation services and restaurants
Clothing and footwear
Other goods and service
Furniture, household items and services
Food and alcoholic beverages
Instruction
General index (include tobacco)
Alcoholic beverages and tobacco
Transportation
Housing, water, electricity and fuel
Italy Veneto
Source: Istat data processed by Unioncamere Veneto
The decline in the car �ar&et that started in 2008 continued in 2012. According to Unrae (National Union of Foreign Motor Vehicle Dealers) data, in the Veneto, new registrations suffered a -20.3 percent drop, almost 27,266 cars less than in 2011 (Table 17). The industry’s crisis involved the entire country, although the change at the national level (-19.8%) was slightly lower compared to the Veneto. Compared to other Italian regions, the regional decrease was less than that of Tuscany (-37.8%) and Lombardy (-23.9%), but higher than that of Emilia Romagna (-20%) and Piedmont (-14.8%).
2011 2012var.%
12C11
Lombardy 328,335 249,738 -23.9
Piedmont 174,175 148,356 -14.8
Tuscany 169,374 105,387 -37.8
Emilia Romagna 143,005 114,416 -20.0
Ve�et� 134B478 107B212 :20.3
Ita�y 1B748B979 1B402B823 :19.8
Source: Ministry of Trasport data processed by UNRAE, last updated: 28 February 2013
Tab�e 17 – Italy. Car registrations by
region. Years 2011 and 2012
Chart 15 – The Veneto. National index of
consumer prices for the entire community (NIC)
(% var. over previous year).
Year 2012

The ec����y �f the Ve�et� i� 2012 a�d �ut���� f�r 2013
39
Credit
The contraction of �e�di�g by the banking system that started in the second half of the previous year continued in 2012. As a whole, this activity registered a 2 percent reduction at the regional level and 2.2 percent at the national level. There are two main reasons for this negative trend: first, the current economic and financial crisis, which is progressively paralysing both production and consumption; second, the behaviour of banks, restricted by strict prudential rules (Basel II and, ultimately, Basel III), and a significant increase in non-performing loans.
By splitting loans by destination, it can be observed that loans to h�useh��ds17 were slightly down (-0.7% in the Veneto and -0.8% at national level) (Chart 16). This means that the decrease in the loans due to repayments was almost entirely offset by the granting of new loans as a result of a general deterioration of the income and wealth of households caused by the crisis. It is likely that the new demand for loans was even higher, but that the prudence of banks in granting
loans did not make it possible to meet the entire demand ex a�te. By contrast, the reduction of loans to busi�esses18 was higher by 2.5 percent for companies in the Veneto and 3 percent for Italian companies.
45.0
501.6
500
510
520
43
44
45
46
mar11 giu11 set11 dic11 mar12 giu12 set12 dic12
Veneto Italy
103.6
963.6
925
955
985
1,015
101
104
107
110
mar11 giu11 set11 dic11 mar12 giu12 set12 dic12
Source: Bank of Italy data processed by Unioncamere Veneto
Private c��su�ers E�terprises
This situation has exacerbated the current difficulties of the Veneto’s production system, in which regional differences have now become blurred and the disastrous effects of the crisis have not spared even the most economically dynamic areas. The demand for credit for new investments has decreased everywhere and the provision of loans has dropped because of the fear of new insolvencies.
17 The aggregate refers to private consumers, private social institutions and entities not classifiable by the reporting bodies. 18 The aggregate refers to the production sector composed of non-financial businesses (joint-stock companies and partnerships) and income-generating families (one-man businesses).
Chart 16 – Italy and the Veneto. Trend in bank loans to businesses and consumers (values in billions of euros). March 2011 - Dec. 2012

U�i��ca�ere Ve�et�
40
The only exceptions were innovative companies who do business with foreign countries: they were able to respond to the crisis and expand production, placing it mainly on the markets abroad. The economic and financial stability brought about by this strategy has allowed them to obtain the necessary credit on satisfactory terms from both the banking system and other financial sources (including international). However, the number of such successfully innovative companies is still quite limited, while the great majority of SMEs have suffered the entire brunt of the crisis (including the financial burden). From an economic point of view, it is up to companies to eliminate the obstacles and grasp opportunities that still exist in market niches by offering innovative goods and services at an affordable price, possibly even with public support. The banking system could encourage these trends with a better selection of credit in favour of investments in innovation. Unfortunately, the evaluation of credit capacity is still based too much on statistical “rating” techniques, which, while effectively detecting the probability of “default” of past performance, are not able to predict future performance of new
investment. It must be noted that the credit cru�ch does not eliminate the risk of bad and doubtful debts, but actually increases it.
An analysis of the loans to businesses by busi�ess sect�r (Chart 17) shows that in 2012, in a context of overall contraction in lending, the distribution of loans remained almost unchanged. In particular, in the Veneto, the share of loans to the service sector grew slightly (45.8%), while the percentages of industry (33.5%) and construction (15%) decreased. By size, in the Veneto, there was a further increase in the already large share of companies with at least 20 employees (78.9%), while in Italy the percentage - already higher than in the Veneto - remained unchanged (81.2%).
33.5
15.0
45.8
21.1
78.9
28.2
16.8
50.4
18.8
81.2
0
20
40
60
80
100
Industrial activity* Construction Services Enterprises with lessthan 20 employees
Enterprises with 20employees
* include section Ateco 2007 between B and E Source: Bank of Italy data processed by Unioncamere Veneto
Veneto Italy
While loans from the banking system decreased, dep�sits increased by an overall 5.3 percent in the Veneto and 5.9 percent nationally. This means that lenders have directed the increased money inflow to other forms of use, probably to government bonds, given the high interest rates offered on public debt and the fact that the risk of these investments has dropped as a result
Chart 17 – Italy and the Veneto.
Trend in loans to production activities
broken down by sector and business size
(comp.%). December 2012

The ec����y �f the Ve�et� i� 2012 a�d �ut���� f�r 2013
41
of the corrective measures in public finances at the end of 2011 and during 2012. However, bank loans to the economy continued to be higher than bank deposits. The greatest increase however was registered by household deposits (+7.3% for the Veneto and +6.1% for Italy) (Chart 18). Clearly, despite the economic difficulties, the preference goes to keeping a larger share of one’s own savings in cash in bank deposits for any needs that may arise. By contrast, corporate deposits decreased slightly in the Veneto (-0.7%), while they increased at the national level (+5%).
67.7
802.2
600
650
700
750
800
850
45
50
55
60
65
70
75
mar11 giu11 set11 dic11 mar12 giu12 set12 dic12
Veneto Italy
20.9
224.2
200
206
212
218
224
230
18
19
20
21
22
mar11 giu11 set11 dic11 mar12 giu12 set12 dic12
Source: Bank of Italy data processed by Unioncamere Veneto
Private c��su�ers E�terprises
S�a�� busi�esses a�d difficu�t access t� credit The causes of the drop in investment include the tightened credit supply to small businesses in Northeast Italy. According to Banca d’Italia data processed by Fondazione Impresa, i� the 2011:2012 peri�dB ��a�s t� s�a�� busi�esses (performing loans) fe�� by 3.8 bi��i�� eur�s (-6.7%), from 53.8 billion to 50 billion euros. The credit crunch, however, continued with greater intensity during 2012 and gradually intensified in the last months of the year (albeit with some exceptions) until the peak of -6.3 percent was reached in September 2012. At the territorial level, greater contractions were recorded in the South, but also i� the �ai� regi��s �f the ��rth the decrease i� ��a�s was sig�ifica�tB particu�ar�y i� the Ve�et� regi�� (:7.7%), Emilia-Romagna (-7.5%) and Lombardy (-7.3%), with values above the Italian average (-7.1%). The data was confirmed by surveys of the 4bservat�ry �� credit t� s�a�� busi�esses conducted by Fondazione Impresa. In the last six months (October 2012-March 2013), there was a slight decline in the share of firms that applied for loans and a sharp increase in the difficulty to access credit. Compared to the previous six months (April-September 2012), the share �f s�a�� busi�ess �w�ers wh� tur�ed t� ba�&s fe�� fr�� 46.2 t� 44.8 perce�t while the share �f th�se wh� e�c�u�tered difficu�ties i� gai�i�g access t� ��a�s we�t fr�� 44.3 t� 49.8 perce�t. The excessive demand for guarantees was the main difficulty for access to credit (43.2%), followed by bank charges (27.3%) and interest rates considered too high (15.9%).
Chart 18 – Italy and the Veneto. Trend in bank deposits to businesses and consumers (in billions of euros). March 2011 - Dec. 2012

U�i��ca�ere Ve�et�
42
T�uris� In 2012, the trend of arrivals and overnight stays in the Veneto region reflected the crisis. In fact, tourism mirrors all the distinctive traits of this historic moment and the analysis of the data shows the behavioural evolution of society and world economic players in these early years of the century. For years now, it is clear that we are at a crossroad, where choosing one path rather than another involves a strategic decision that impacts on the future. The final numbers of the Veneto’s tourist flows showed impressive results, considering that the levels continued to be very high: the 0.3 percent increase in
arrivals was equal to over 15.8 �i��i�� visit�rs and represents a further milestone, while the decrease of 1.7 percent recorded in the number of guests,
equal to 62.4 �i��i�� �ver�ight stays, was second only to the record set last year (Table 18). These data summarise two opposite tendencies: on the one hand, the increasing appeal of the territory on foreign customers (+2.2% in visitors and +2.7% in guests)19, in particular from Germany and non-European countries - above all guests from emerging economies; on the other hand the declining performance of Italy’s domestic market due to the unfavourable national socio-economic situation, which led to a 2.9 percent fall in arrivals and 8.7 percent fall in guests. The decrease in Italian guests must not to be confused with disaffection or lack of appeal: that is a pattern observed in all regions20 resulting from the loss of purchasing power of households and the decrease in consumption. This is why in these times of crisis the foreign market becomes decisive in bringing respite to a sector, which would otherwise be suffering greatly (the share of foreign visitors increased from 62 to 64.8%)21. According to preliminary estimates of Banca d’Italia, the tourism revenue generated by foreigners in the Veneto in 2012 grew by 5.4 percent, exceeding the 5-billion-euro threshold for the first time. The region remained firmly in third place in the ranking of Italian regions, after Lazio and Lombardy, but the gap is gradually eroding22. The hotel industry was substantially stable in arrivals (+0.1%), but showed a significant drop in overnight stays (-1.4%), mainly due to less Italian guests (-6.7%, or 743 thousand less guests), at levels that have never been so low. The situation was no better in the non-hotel sector where the slight increase in visitors (+0.8%) was overshadowed by -1.9 percent in the number of guests. Here, too,
19 Preliminary data from the World Tourism Organization reported 1,035,000 international travellers, an increase of 3.8 percent over 2011. Despite the turbulent global economic and political situation for 2013, further growth, though slower, is expected. Europe remains the most appealing continent (+3%). 20 It is estimated that in the first eight months of 2012, throughout Italy, the decrease regarded as much as 9.6 percent of arrivals and 11.5 percent of guests. National Tourism Observatory, press communiqué of 7 December 2012. 21 Tuscany too, a region with a strong international vocation, showed the same trend, bringing its share of the foreign market for the first time to 52.2 percent of the total flow (data on the first nine months of 2012). 22 There are currently no estimates on the 2012 tourism revenue, so we will only provide here the survey data of the International Center of Studies on the Tourist Economy (CISET) of Ca’ Foscari for 2011, according to which tourism in the Veneto yielded a turnover of 11 billion euros, accounting for 8.2 percent of the regional GDP, 13 percent of domestic consumption and a half million labour units. The sector employs 15 percent of people in employment, namely 10.5 percent of all those employed in tourism in Italy. The report highlights the versatility of the sector that goes beyond hotels and restaurants (worth 30% of the tourism-related GDP) including trade, which accounts for 17.1 percent, the rental of buildings 15.3 percent, agribusiness 9.5 percent, crafts 7.7 percent, cultural and recreational activities 6.7 percent and transportation 6.5 percent. Veneto Region, Press Release No. 233 of 14 February 2013

The ec����y �f the Ve�et� i� 2012 a�d �ut���� f�r 2013
43
the negative sign was due to the drop in Italian visitors and guests at -3.7 and -10.5 percent respectively. This general scenario showed a positive trend in agritourism lodgings, which closed with ample growth margins (+8.6% in arrivals and +8.5% in guests) and with good results also among Italian visitors (+5%). The figures reveal also that value for money is an essential prerequisite for foreign tourists. There was an increase in the demand for hotels offering greater comfort (+2.5% in arrivals and +1.9% in overnight stays) and for those of medium quality (+1.9% in arrivals and +2.9 in overnight stays), while lower quality hotels continued to decline, according to a now well-established trend (-3.5% and -4.6%)23. In addition to agritourism lodgings, there was also great interest for other types of accommodation, which recorded strong growth (+14.6% in overnight stays). The average stay further contracted due to the “Italian” effect, dropping to 3.9 days (for the first time, the length of stay of domestic and foreign tourists was the same). It was stable in the hotel sector (2.7), while it decreased in the non-hotel sector (6.8). A look at vacation destinations reveals widespread difficulties, except for lakeside resorts, which showed a certain liveliness, recording increases in arrivals (+0.8%) and above all in overnight stays (+4.9% ). Heritage cities were in line with the previous year, while seaside and spa resorts declined (-3.7 and -4.1% in overnight stays respectively). Mountain resorts registered a sharp decrease (-9.3%), as these are unsurprisingly areas that have a low appeal abroad24. Finally, it is interesting to note that against the backdrop of a widespread decrease in the length of holidays, lakeside resorts improved their performance and were popular both with Italians and foreigners.
arriva� stay a.s.* Ita�ia� f�reig� t�ta�
Acc���dati�� faci�itieshotel 10,980,783 29,564,348 2.7 -6.7 1.7 -1.4
extra hotel 4,837,742 32,787,309 6.8 -10.5 3.6 -1.9
Districtheritage cities 8,184,947 17,848,346 2.2 -3.4 1.7 0.1
lake 2,213,251 11,276,120 5.1 -3.6 6.8 4.9
seaside 3,835,747 25,512,082 6.7 -11.4 1.2 -3.7
mountains 957,678 4,844,405 5.1 -12.3 4.3 -9.3
spa resorts 626,902 2,870,704 4.6 -7.5 0.6 -4.1
T�ta� 15B818B525 62B351B657 3.9 :8.7 2.7 :1.7
*average stay
Source: Regione Veneto (SIRT) data processed by Unioncamere Veneto
var. % prese�ces �f 20112012
23 All hotel facilities recorded a minus sign for the overnight stays of Italians, but the greatest drop was registered in 1 and 2-star hotels (-8.5%). 24 In 2012, a positive trend was recorded among foreign tourists (+4.3% in visitors and overnight stays) in the mountains, but the main catchment area, despite increases in recent years, continues to be domestic tourists (over 70%) and therefore was more exposed to the crisis. As to spa resorts, the situation is rather different: the dwindling number of foreigners resulting from competition from other markets led to focus efforts on drawing Italian guests, who now account for the largest share (in 1997 foreigners represented 57.8%, now they fail to reach 35).
Tab�e 18 – The Veneto. Tourist flow by type of accommodation and destination. Year 2012

U�i��ca�ere Ve�et�
44
Tra�sp�rt sect�r Transportation is the activity that links the regional system to the rest of the world and is of strategic importance for the economic internationalization of an area. The territorial organization of logistics, made of technological hubs of networks and flows, is a necessary complement of logistics at a business level. Roads, railways, ports, airports and freight villages are all crucial actors, which must be engaged in an ongoing dialogue with companies that operate internationally. The fall in production levels recorded by the regional economic system in 2012 inevitably impacted on the transportation sector. Provisional data released by Aiscat concerning the total number of kilometres
travelled by vehicles entering the regional highway �etw�r& in 2012 showed a drop in mobility (-5.7%) compared to the previous year, reaching 12.931 million vehicles/km. The decrease was significant for both heavy vehicles (-5.4%) and light vehicles (-5.8%).
The Veneto’s rai� �etw�r&, which covers 1,188 km of railway lines (7% of the national network), registered a very high level of mobility in 2012 (152,620 passengers a day and 65,824 travel card holders).
As to airp�rts, the fall in industrial production had an impact on cargo traffic. According to Assaeroporti data, in 2012, the Veneto’s airports experienced a 4.6 percent drop in tons of freight (Table 19). On the other hand, despite the difficult scenario, the trend in passenger traffic at the Veneto’s airports continued to be dynamic. In particular, the Venice airport system, which includes the Venice and Treviso airports, recorded over 10.5 million total passengers in 2012 (+8.9% over the previous year, movements -3.3%) , confirming its already well-established position as the third largest Italian airport following Rome and Milan. The new flights opened during the year gave further impetus to connections between Venice and the world.
Ve�ice, with nearly 8.2 million passengers (-4.6% year-on-year), ranks fifth among Italian airports after Rome, Milan’s two airports (Malpensa and Linate) and the low-cost airport of Bergamo. Excluding the operations transferred from Treviso airport between June and early December 2011, the adjusted growth in passenger traffic of Venice airport in 2012 was +12.3 percent. The analysis of national and international traffic flows confirmed once again the airport’s international relevance, with 78 percent of passengers flying between Venice and European and intercontinental destinations, compared to an average of 58% for the Italian airport system. It should be noted that passengers departing from Venice who continued on flights to final destinations in the world registered an increase of 9 percent in 2012 over the previous year, underscoring the dynamism and the international vocation of the catchment area. In particular, taking into account traffic flows (direct and indirect) between Venice and BRICS countries (Brazil, Russia, India, China, and South Africa) there was a 27 percent increase in 2012 compared to 2011, with over 450 thousand passengers.
Trevis� airport closed 2012 with more than 2.3 million passengers, an increase of 116.6 percent compared to 2011 (+101% in movements). In looking at this figure, it should be borne in mind that between June and early December 2011 the airport’s operations had been moved to Venice for works: considering the passengers carried by scheduled carriers operating normally in Treviso, traffic recorded a -1.4 percent decrease over the previous year.

The ec����y �f the Ve�et� i� 2012 a�d �ut���� f�r 2013
45
Ver��a airp�rtB which is mainly a passenger airport, also suffered due to the crisis. The airport closed 2012 with 3.2 million passengers, down 5.5 percent on an annual basis. Bucking the trend, international traffic grew by 3.1 percent (over 2 million international passengers). International connections fared well, growing by 3.3 percent and the trend in the charter sector was positive, recording an increase of 2.8 percent in 2012, mainly due to a slow but steady recovery of connections to Egypt and Tunisia. Currently the connections from Verona are about a hundred, including direct and connecting flights, which make it possible to reach the most important cities in North and South America, Asia and Africa. The crisis that Italian airlines are experiencing led Verona to record a 20 percent decrease in domestic traffic, only partly offset by the growth of the international traffic. It was mainly the result of the suspension of WindJet flights and the restructuring of Meridiana fly-Air Italy.
Abs��.
va�ue
var.%
12C11
Abs��.
va�ue
var.%
12C11
Abs��.
va�ue
var.%
12C11
Venice-Treviso* 104,512 7.5 10,522,213 8.9 40,940 -4.2
Treviso - Antonio Canova 20,279 100.9 2,333,758 116.6 53 -94,0
Venice - Marco Polo 84,233 -3,3 8,188,455 -4.6 40,887 -2.4
Verona - Valerio Catullo 36,015 -4,7 3,198,788 -5,5 4,992 -7,2
T�ta� 140B527 4.1 13B721B001 5.2 45B932 :4.6
Source: Assaeroporti data processed by Unioncamere Veneto
Airp�rt
Carg� (t��s)Passe�gersG��ds (t��s)
* aggregate data of Venezia-Treviso airport system. The airport of Treviso was closed from June 1st to 4th
December 2011 and the assets were transferred to the Venice airport.
The performance of maritime traffic was also disappointing (Table 20). The final
2012 data for the p�rt �f Ve�ice showed a slight decrease (-3.6%) in total tonnage - in line with the main domestic and foreign ports - while liquid and dry bulk traffic did well with positive peaks in the handling of crude oil (+4.6 %), coal (+50%) and minerals (+3.1%). The handling of steel products and project cargo (large, heavy cargo) - of which the port of Venice has the exclusive for the North Adriatic - grew by 1.5 percent. There was a decline also in container handling (-6.6% yoy). Despite this decline and a very critical scenario for traffic worldwide, the port of Venice, with nearly 430,000 containers (TEUs) handled in 2012, confirmed its position in second place among the North Adriatic ports, after Koper. The Napa ports (Venice, Trieste, Ravenna, Koper and Rijeka) reached a total of 1.8 million TEUs and 118.7 million tons of cargo. Passenger traffic was also impacted: less ferries landed (-10.8%) and there was also a slight decrease in cruise passengers (-2.1%). Positive results were recorded by the Veneto’s main freight villages. In 2012, the
Quadra�te Eur�pa freight vi��age, in line with the data of the previous year, handled nearly 7 million tons of cargo, divided between containers, semi-trailers, swap bodies and traditional carriages; 13,366 incoming trains were recorded. The
Padua freight vi��age closed 2012 with a positive result: traffic recorded a 26 percent increase in TEUs compared to 2011 (exceeding 200,000 TEUs handled). Overall, more than 250 thousand containers were handled by the freight village and the greatest increase was recorded by containers for exports: an encouraging
Tab�e 19 – The Veneto. Traffic data (movements, passengers and freight) in airports. Year 2012

U�i��ca�ere Ve�et�
46
sign for the economy of the North-East and a further confirmation of how strategic the activities and location of this freight village are for the local businesses.
2011 20127Var.%
12C11
54VE5E�T 4F G44DS (t��s) 26B301B207 25B356B448 :3.6
liquid bulk cargo 11,212,813 11,110,631 -0.9
dry bulk cargo 6,585,860 6,457,772 -1.9
other break bulk cargo 8,502,533 7,778,063 -8.5
54VI5E�T 4F C4�TAI�ERS 458B363 428B126 :6.6
54VI5E�T 4F PASSA�GERS 2B239B751 1B998B960 :10.8
cruise passangers 1,777,073 1,739,501 -2.1
SHIP ARRIVED 4B147 3B747 :9.6
* Temporary data traffic
Source: Port of Venice data processed by Unioncamere Veneto
I���vative a�d tech����gica� services In an economic environment characterized by a deterioration and downsizing in
the regional production system, the field of i���vative a�d tech����gica� services is a gradually expanding business segment. Companies operating in this
area, for which the acronym KIBS (��w��edge1i�te�sive busi�ess services)25 is used, are specialized in the production of high knowledge content that they co-produce with their customers: they are playing an increasingly important role in support of innovation processes within a given economic fabric.
The main economic activity of these companies is the creati��B accu�u�ati�� a�d distributi�� �f &��w�edgeI these enterprises belong to a group of diverse economic sectors26 and favour the rapid circulation of technological knowledge between different industries. A recent survey conducted by the University of Padua27 revealed some important features of this production segment: companies belonging to KIBS sectors are on average younger, have young human resources
25 The acronym KIBS is used to both indicate the set of services and the organizations that provide them, be they businesses or institutional entities. 26 According to the definition given by the Eur�pea� :��it�ri�g Ce�tre �� Cha�ge, KIBS comprise all IT services, all R&D activities, and a wide selection of activities that the ISTAT classification of economic activities defines as “services to businesses”. Authors concerned with defining the boundaries of the KIBS universe may add one or more sectors or sub-sectors to the list. However, as suggested by one influential scholar in the literature of the service economy, the issue of boundaries cannot be solved simply by adding an entire sector to the list because, in fact, the presence of KIBS can be observed in any industry that offers
busi�ess t� busi�ess services, such as, for example, the logistics services sector or the financial services industry. However, the contrary is also true: each sector of the “traditional” list includes firms that fully meet the definition of KIBS and others that differ greatly. It must therefore be concluded that the grouping of information technology, research and (other) business services is simply an elective container of services with a high knowledge content. 27 The research study, sponsored by Fondazione Cassa di Risparmio di Padova e Rovigo and carried out at the Department of Economic and Business Sciences, University of Padua, involved 505 companies in the Veneto operating in the business consulting and professional firms, ICT, design and marketing sectors.
Tab�e 20 – Movement of cargo, containers and
passengers through the Port of Venice.
Years 2011 and 2012

The ec����y �f the Ve�et� i� 2012 a�d �ut���� f�r 2013
47
with high levels of education, use their customers and suppliers as a source of learning, operate beyond the regional market, cooperate with other KIBS’s in the production of services and have created innovation in the last three years. According to research sponsored by EbicomLAB-Confcommercio Treviso and carried out by the EconLab Research Network using Infocamere data, in the
Veneto, almost 28B600 ��ca� u�its �perate i� 8IBS sect�rs, employing over
150 th�usa�d e�p��yees, mainly located near major production centres. Padua ranks first in terms of number (7,020 local units), followed by Treviso (5,340 units) and Verona (5,062). Two thirds of these KIBS businesses were established after year 2000 and they can be split evenly between business consulting services (6,925 units), planning and design (8,702) and ICT (8,575). A residual part deals with communication and marketing (4,016), while only 368 units with research and development. The latter figure reveals one of the structural weaknesses of the regional system and, more generally, of the Italian system: there are still few companies that are doing research and development and produce knowledge and innovation. This has detrimental consequences for the competitiveness of the production fabric. Another estimate of the number of companies operating in KIBS sectors emerges from a study sponsored by Unioncamere Veneto and carried out by the University of Padua on the changes in the regional entrepreneurial system in the 2001-2011 period28. The analysis focused on three of the main production areas of the Veneto: the Riviera del Brenta footwear district, the Belluno eyewear district and the Vicenza gold district. According to the study, based on Infocamere data,
there are ab�ut 21 th�usa�d e�terprises i� the Ve�et� �perati�g i� 8IBS sect�rs and in the decade their number has grown significantly29. In particular, the study compared the performance of businesses active in specialised districts and that of KIBS enterprises over the past decade. In all three districts examined, given a decrease in the number of manufacturing enterprises, the number of KIBS’s registered a sharp increase (Chart 19, Chart 20, Chart 21). Although KIBS’s do not generate sales or have a number of employees comparable with those in specialized manufacturing businesses, it is interesting to note that in all the areas analyzed, their number now exceeds that of specialised companies in the production districts. It is easy to surmise that this wide range of services has met - especially in the jewellery and eyewear districts - with a large enough demand from sectors other than those corresponding to the district.
28 For further information, refer to Unioncamere Veneto (2012), Crisi e trasf�r�a/i��i dei distretti i�dustria�i ve�eti� Gi�ie��i� �cchia�i e ca�/ature a c��fr��t� (Crisis a�d tra�sf�r�ati�� �f the Ve�et�’s i�dustria� districts� A c��paris�� a�d c��trast �f ewe��ery� eyewear a�d f��twear)� Research papers No. 16. 29 Since the number is based on the registered offices of the businesses, the data is consistent with that found in the EbicomLAB-Confcommercio Treviso study, which calculated the local units of enterprises (or locations).

U�i��ca�ere Ve�et�
48
607
907
500
600
700
800
900
1000
2002 2003 2004 2005 2006 2007 2008 2009 2010 2011
Enterprises footwear district
KIBS district
403
555
300
400
500
600
700
800
900
2002 2003 2004 2005 2006 2007 2008 2009 2010 2011
Enterprises eyewear district
KIBS district
669
3,915
600
1,100
1,600
2,100
2,600
3,100
3,600
4,100
2002 2003 2004 2005 2006 2007 2008 2009 2010 2011
Enterprises goldsmith district
KIBS district
Chart 19 – The Veneto. Number of companies in
the footwear and KIBS sectors active in the
district. Years 2002-2011
Chart 20 – The Veneto. Number of companies in
the eyewear and KIBS sectors active in the
district. Years 2002-2011
Chart 21 – The Veneto. Number of companies in
the jewellery and KIBS sectors active in the
district. Years 2002-2011

The ec����y �f the Ve�et� i� 2012 a�d �ut���� f�r 2013
49
Artisa� fir�s a�d s�a�� e�terprises
In 2012, the number of active artisa� e�terprises in the Veneto amounted to 138,484 units. The downward trend of the last four years (-0.5% in 2008, -2.2% in 2009, -0.4% in 2010 and -1.1% in 2011) was further confirmed in 2012 with a reduction in the number of firms by more than 2,700 units (-1.9%).
Looking at the sect�r – specific performance (Table 21), one can easily see that the two leading sectors (manufacturing and construction, which together account for nearly 70% of all small businesses active in Veneto) experienced a further decline: -2.7 percent in manufacturing and -3 percent in construction. There was a decline in the number of firms active in other crafts, albeit to a lesser extent. A negative performance was recorded in trade and motor vehicle repairs (-1.4%), transportation services (-2.5%) and services to persons (-3.5%). Contractions were also sharp among the firms active in mining (-4.9%) and financial and insurance services (-10%), which however account for a very small number of firms. The number of businesses in agriculture and services to businesses remained stable.
2011 2012 % v.a.
Agricolture, forestry and fishing 1,458 1,455 -0.2 -3 1.1
Extraction 81 77 -4.9 -4 0.1
Manufacturing industries 37,832 36,806 -2.7 -1,026 26.6
Public utilities (energy, gas, water, environment) 258 256 -0.8 -2 0.2
Construction 57,204 55,480 -3.0 -1,724 40.1
Trade and repair of motor vehicles and motorcycles 6,933 6,833 -1.4 -100 4.9
Transport services, logistics and storage 10,035 9,787 -2.5 -248 7.1
Accommodation and catering service 3,898 4,020 3.1 122 2.9
Media and communication services 962 1,019 5.9 57 0.7
Financial and insurance services 20 18 -10.0 -2 0.0
Real estate 31 38 22.6 7 0.0
Advanced support services for businesses 2,185 2,183 -0.1 -2 1.6
Rental business, tourist services and business supp. 3,150 3,360 6.7 210 2.4
Private education and training services 182 193 6.0 11 0.1
Health, social care and private health services 108 120 11.1 12 0.1
Services to the person 571 551 -3.5 -20 0.4
Other activities 16,102 16,023 -0.5 -79 11.6
Unclassified companies 206 254 23.3 48 0.2
6ega� f�r�Corporations 7,854 8,150 3.8 296 5.9
Partnerships 29,500 28,765 -2.5 -735 20.8
Individual firms 103,602 101,307 -2.2 -2,295 73.2
Cooperatives and other forms 260 251 -3.5 -9 0.2
T�ta�7 141B216 138B484 :1.9 :2B732 100.0
Source: Infocamere-Movimprese data processed by Unioncamere Veneto
Active c��pa�ies Var. 2012C2011C��p. %
* From the second quarter of 2012 due to the new Services Directive in the analysis of companies there is a new class of legal form
"Physical Person" that has been included only in the total and not by sector and by legal to allow proper comparability with the previous
year. The total variation, even though it includes this new class, does not change because of this consistency irrelevant.
Some categories of the service sector, however, showed a positive performance: the rental business, tourist services and support to businesses grew by 6.7 percent,
Tab�e 21 – The Veneto. Artisan firms active by sector and by legal status. Years 2011 and 2012

U�i��ca�ere Ve�et�
50
media and communication services by 5.9 percent and accommodation services and catering services30 by 3.1 percent.
With regard to the �ega� f�r� of the firms, growth was registered, once again, only among joint-stock companies (+3.8%). Decreases were recorded instead for partnerships (-2.5%), co-operatives and other forms of business (-3.5%), as well as for individual enterprises (-2.2%), which, despite repeated reductions continue to be the most common legal form in regional crafts (73.1% of the total).
According to the survey of Confartigianato del Veneto, pr�ducti�� recorded a significant decrease (-14.7%) across all sectors – although to different extents. The worst changes were recorded in construction (-18%) and services to business
(-14.7%). In line with the decline in production, tur��ver registered a decrease
(-16.7%) as well. 4rders in manufacturing companies dropped by 11.4 percent.
Pr�ducti��7 Tur��ver 4rders77
Manufacturing industries -9.2 -11.4 -11.4
Building Trade/Constructions -18.0 -21.3
Services for enterprises -14.7 -16.5
Services for people -11.4 -12.3
T�ta� : a�� sect�r :14.7 :16.7 :11.4
** refers only to manufacturing companies
Source: Osservatorio Congiunturale sull'artigianato Veneto - Confartigianato Imprese Veneto
* for industrial companies (manufacturing and building trade) production data are shown; for services
demand-related data are shown
In terms of e�p��y�e�t, downward values continued to be recorded, confirming the trend of the past four years. In 2012, the decline in employment amounted to 4.5 percent. The fall affected all sectors, albeit to differing degrees: -3.2 percent in manufacturing, -5.6 in services and -7.2 percent in the construction sectors.
Sect�rs 2008 2009 2010 2011 2012
Foodstuff -2.1 0.7 4.2 0.3 -3.0
Textiles, clothing, footwear -4.5 -6.8 -3.3 0.8 -5.6
Wood -4.7 -5.2 -4.7 -2.1 -5.6
Graphics -3.5 -3.8 -0.1 -3.5 -5.4
Ceramic, chemical products, glass -5.4 -5.6 -0.6 1.0 -1.2
Mechanics -2.8 -8.7 0.5 0.4 -1.9
Other manufactured products -4.8 -4.3 -5.1 -1.6 -3.5
T�ta� 5a�ufacturi�g :3.7 :6.3 :1.0 :0.1 :3.2
Building -8.6 -6.1 -5.9 -4.4 -9.4
Plant engineering -1.2 -3.0 0.0 -2.2 -4.7
T�ta� C��structi�� :5.6 :4.8 :3.3 :3.4 :7.2
Servicing for cars and motorcycles -3.2 -0.1 0.3 0.7 -4.5
Services for people and other services -1.3 -3.1 -1.6 0.1 -5.3
Transport 1.8 -2.4 2.9 3.9 -7.0
T�ta� Services :0.9 :2.1 0.2 1.3 :5.6
T�ta� :3.7 :5.2 :1.3 :0.6 :4.5
Source: Confartigianato Veneto - Bs consulting 30 Under Law No. 443/1985 which governs crafts, this sector includes primarily businesses active in the “preparation of take-away food, ice cream parlours and pastry shops”.
Tab�e 22 – The Veneto. Leading economic
indicators for craft firms and small enterprises (% var. over previous
year). Year 2012
Tab�e 23 – The Veneto. Employment in
artisan firms (% var. over previous
year). Years 2008-2012

The ec����y �f the Ve�et� i� 2012 a�d �ut���� f�r 2013
51
4. F�cus� the crisis �f the Ve�et� pr�ducti�� syste� a�a�y$ed thr�ugh the fi�a�cia� state�e�ts �f %�i�t st�c& c��pa�ies a�d �i�ited �iabi�ity c��pa�ies
Since October 2009, the Study Ce�tre �f U�i��ca�ere Ve�et� has operated
an 4bservat�ry �� c�rp�rate fi�a�cia� state�e�ts to monitor the economic and financial performance of companies in the Veneto (for now only joint stock companies and limited liability companies) and the issues concerning them. The analysis of the aggregated financial statements makes it possible to integrate the context-specific information provided by official statistics, so as to obtain an overview of the performance of companies by company size, by sector of economic activity and by territory (regional, provincial and municipal). After publishing two reports on the issue (Research Papers No. 12/2009 “The Veneto seen through the financial statements of enterprises” and No. 14/2011 “The financial statements of the Veneto’s companies”), the Observatory aims to step up its analysis and monitoring activities through the publication of periodic reports and statistical indicators. The first issue has already been released (available on the Unioncamere Veneto website) and the second report is in the pipeline. The first report provided an analysis of aggregate corporate financial statements for the 2007-2011 period, i.e., it compared the results disclosed by the Veneto’s companies for the year immediately before the crisis (2007) with those of 2011 (latest data available). However, since the data from the last fiscal year are not yet final, it was decided to provide a brief commentary, with some specific insights concerning the performance of the Veneto’s enterprises in the face of crisis. Now, in the presence of the final data, an effort was made to highlight the main economic and financial indicators with a more analytical review of their consistency, both in cyclical and structural terms. Both the analyses presented in this section and those contained in the reports use
the Ji�.ba�a�ce” database of Infocamere, which aggregates all financial statements of joint stock companies and limited liability companies and sorts them by size, sector and area. It is worth noting that pursuant to Article 2435 of the Italian Civil Code only limited companies are required to file their financial statements with the Companies Register of the Chamber of Commerce of the province where they are headquartered. This assessment considers only such information. Partnerships and sole proprietorships are therefore excluded: since they are not required to submit any financial statements, they are not easy to investigate and relevant information concerning them can only be gathered through very expensive and specific sample surveys. However, it can be assumed that the trend registered for all joint stock companies and limited liability companies is also indicative of the situation of the entire business system, because:
− limited companies are generally larger sized than other forms of companies and their total value added is estimated at about half that of all firms;
− ISTAT estimates on national accounts and the performance of the companies are based on all legal forms, but with far smaller samples;
− the legal form of the company is not usually predictive of an enterprise’s economic performance.

U�i��ca�ere Ve�et�
52
Through the analysis of the aggregated financial statements available in the “in.balance” database, it was possible to reconstruct the situation of joint stock companies and limited liability companies in the Veneto and in Italy from 2007 to 2011 and to examine the response of businesses to the crisis. The aggregate results of the financial statements for the entire system (all economic sectors, with the sole exception of finance and insurance, public administration and family-run businesses) are presented in Tables 24 and 25.
Veneto Italy Veneto Italy
Active
Fixed assets 90,269 1,903,673 124,536 1,800,036
- Credits after financial year 2,989 64,445 3,800 69,839
- Tangible 47,339 752,429 72,519 893,903
- Intangible assets 7,511 194,341 9,818 222,724
- Financial assets 32,430 892,458 38,399 613,569
Current assets 139,102 1,745,015 158,054 1,761,931
- Stocks 52,637 545,350 61,390 554,107
- Deferred liquidity 75,745 1,043,424 83,221 1,046,167
· Credits within one year 71,576 977,127 77,257 963,251
· Short term financial assets 1,867 39,408 2,959 48,775
· Prepayments and accrued income 2,301 26,885 2,592 30,118
- Immediate liquidity 10,720 156,241 13,444 161,657
TOTAL (Capital) 229,408 3,649,068 282,590 3,562,007
Passive
Equity 65,127 1,278,659 90,620 1,138,143
Consolidated liabilities 43,756 697,285 53,464 771,657
- TFR 5,681 70,671 6,004 63,270
- Debts after financial year 38,076 626,614 47,459 708,387
Current liabilities 120,525 1,673,057 137,441 1,644,053
- Provisions for risks and charges 2,947 119,694 4,845 83,872
- Debts within one year 114,861 1,510,958 129,183 1,485,422
- Accruals and deferred income 2,717 42,405 3,413 74,759
TOTAL (Capital acquired) 229,408 3,649,068 282,590 3,562,007
Source: Infocamere (in.balance) data processed by Unioncamere Veneto
2007 2011BALANCE SHEET
Tab�e 24 - The Veneto and Italy. Aggregate
balance sheet of joint stock companies and
limited liability companies, except Ateco sections K,
O and T (in millions of euros).
Years 2007 and 2011

The ec����y �f the Ve�et� i� 2012 a�d �ut���� f�r 2013
53
Veneto Italia Veneto Italia
VALUE OF PRODUCTION 214,627 2,491,716 228,616 2,480,099
of which: Revenues from sales 204,940 2,350,341 220,475 2,371,858
EXTERNAL COSTS OF PRODUCTION 172,048 1,987,907 183,055 1,986,277
- materials 120,481 1,325,321 126,852 1,333,537
- services 44,380 552,546 47,314 543,498
- Leases and rentals 6,510 68,922 6,994 70,530
- Changes in inventories of materials -1,750 -14,459 -1,033 -6,126
- Other expenses 2,427 55,577 2,928 44,838
ADDED VALUE 42,579 503,809 45,562 493,822
Personnel costs 25,345 290,059 29,450 303,969
EBITDA (Earnings Before Interest, Taxes, Depreciation and Amortization)17,233 213,749 16,112 189,853
Depreciation, amortization and write-downs 6,556 99,320 8,269 120,970
EBIT (Earnings Before Interests and Taxest) 10,677 114,429 7,843 68,883
Other income - net financial -1,328 -7,568 -806 -9,163
Net revaluations - financial write-downs -821 -7,204 -1,029 -30,298
INCOME FROM ORDINARY ACTIVITIES 8,528 99,657 6,008 29,422
Other income - extraordinary charges 622 15,166 543 4,876
PROFIT BEFORE TAX 9,150 114,823 6,551 34,298
Taxes on corporate income 4,595 52,694 3,843 39,019
NET INCOME FOR THE YEAR 4,555 62,091 2,708 -4,721
Source: Infocamere (in.balance) data processed by Unioncamere Veneto
2007 2011INCOME
The raw data, duly reclassified according to financial and economic criteria, provides the following highlights for the period under review:
− fixed assets grew in the Veneto region by as much as 38 percent, while in Italy they decreased by 5.4 percent. The reasons are twofold: on the one hand, in the Veneto fixed capital is proportionally lower (compared to the total invested capital) than the national average (due to more labour-intensive methods of production in the Veneto’s enterprises); on the other hand, the first anti-crisis decree (Italian Law Decree No. 185 of 29 November 2008) gave the chance to adjust the value of existing capital goods and pay a lower tax rate on them;
− current assets increased by a smaller percentage (+3.6%) at the regional level and even less at the national level (+1%). This means that, despite the crisis, the Veneto’s enterprises showed a more dynamic performance with greater flows of short-term assets;
− current liabilities, on the other hand, remained unchanged at the regional level (+14%), while they registered a slight decrease at the national level (-1.7%);
− the shareholders’ equity of the Veneto’s enterprises grew considerably (+39.1%), mainly as a result of the aforementioned value adjustments; at the national level it decreased by 11 percent;
− the value of production was more favourable for the Veneto (+6.5%) than for Italy (-0.5%). Therefore, the Veneto’s entrepreneurs have shown greater ability in fuelling their turnover even in times of crisis;
− value added has also grown correspondingly in the Veneto (+7%) and decreased nationally (-2%);
Tab�e 25 - The Veneto and Italy. Aggregate income statement (profit and loss account) of joint-stock companies and limited liability companies, except Ateco sections K, O and T (in millions of euros). Years 2007 and 2011

U�i��ca�ere Ve�et�
54
− the above showed that the net result for the year was still positive for the Veneto’s companies – albeit eroded by the crisis, while it was negative for Italy as a whole.
When looking at the overall ec����ic situati��, the main key performance indicators contained in the financial statements showed a crisis-induced downward trend for the Veneto region only in economic terms, while in financial terms there was no contraction (at least at current values); moreover value adjustments were made to fixed assets already present in the enterprises, mostly to write them up. In general, this was not the case for Italy, which, in addition to posting a negative final result for 2011, recorded a decrease in overall activity as well as in the assets previously accumulated.
However, in order to better assess the economic and financial structura� situati�� of the enterprises, reference should be made to the main fi�a�cia� i�dicat�rs, which, regardless of the trends of individual items, allow us to determine whether enterprises are performing well or not. Obviously, there are many indicators, but Table 26 shows the ones considered most relevant for a comprehensive assessment of the Veneto’s production system.
Veneto Italy Veneto Italy
Capital strength:
equity / capital acquired 28.4 35.0 32.1 32.0
Balance short-term financial (current ratio):
current assets / current liabilities 104.3 115.4 107.2 115.0
Return on invested capital:
ROA = (EBITDA + financial income) / capital invested 6.0 4.6 3.7 3.0
Return on equity:
ROE = Net income / equity 7.5 5.1 3.1 -0.4
Tax rate:
taxes on business income / profit before taxes 50.2 45.9 58.7 113.8
Labor productivity:
added value / cost of staff 168.0 173.7 154.7 162.5
Productivity of capital:
a) value added / capital invested 18.6 13.8 16.1 13.9
b) (added value - financial expenses) / equity 58.8 34.6 46.7 39.2
Source: Infocamere (in.balance) data processed by Unioncamere Veneto
2007 2011INDEX
The first two indicators of the table summarize the fi�a�cia� p�siti�� of Veneto and Italian enterprises taking into account their financial soundness (i.e., the companies’ ability to cover future losses) and their short-term financial equilibrium (i.e., the companies’ ability to meet their commitments within the next 12 months - also through the elimination of stocks). This is an important aspect, which is essential also for the assessment of a company’s credit standing by banks. It can be observed that the financial situation of the enterprises in the Veneto, though markedly improved compared to the onset of the crisis, has only reached the national average: in fact this is no real improvement, because the Veneto started from a disadvantageous position. According to these indicators, the financial soundness can be considered satisfactory, as the theoretically ideal value is approximately one-third (33.3%) (i.e., debt double the shareholders’ equity). The ratio of current assets to current
Tab�e 26 - The Veneto and Italy.
Main indicators of the aggregate income
statement of joint stock companies and limited
liability companies, except Ateco sections K, O and
T (percentage values). Years 2007 and 2011

The ec����y �f the Ve�et� i� 2012 a�d �ut���� f�r 2013
55
liabilities, however, should be a little higher (roughly around 130%) to avoid having to liquidate stocks almost completely.
As to pr�fitabi�ity, which was hit hard by the crisis, it is clear that the reduction has been bearable for the Veneto’s production system, while the same cannot be said for the national system, which started from an already modest situation in 2007 and featured even a slight drop in ROE in 2011. This means that the crisis has eroded the income for all businesses, but those that had been recording better performance levels have been able to limit the impact (probably due to a better ability to react through innovation and internationalization), unlike the others that have suffered most heavily from the market crisis and have seen their margins become narrower and almost vanish, also because of the heavy tax burden, as will be seen shortly. More specifically, the return on assets (ROA) for the Veneto was good and slightly lower than ROE. This can be considered a favourable condition, which has not occurred at the national level. Without going into complex details that would require a much more comprehensive study, it can be pointed out that the
prevalence of ROE over ROA shows a beneficial effect of fi�a�cia� �everage, due to the fact that the return on corporate investment is higher than the cost of debt capital acquired. If that fails to happen – like in the rest of Italy – profitability becomes an issue, and in the medium to long term that can undermine the companies’ willingness to invest, resulting in the closing of the business. The current tax system further exacerbates this trend.
Directly linked to profitability is the problem of corporate taxati��, which greatly reduces the companies’ gross income (before tax). The latter must be very high to ensure that the providers of own capital (entrepreneurs and shareholders) have some margin. The closer the gross income is to zero, the more the tax rate increases, because many costs are not deductible and the regional tax on production (IRAP) is also applied to a substantial part of the cost of labour. Indeed, given a nominal rate of 31.4 per cent (corporate income tax- IRES + IRAP provided for by tax laws), the actual tax rate (i.e., the rate of taxation on income earned) was 50.2 percent for the Veneto in 2007 and 58.7 percent in 2011. Nation-wide, the situation was even worse because it went from 45.9 percent in 2007 to as much as 113.8 percent last year. In other words, Italian companies as a
whole have paid ��re taxes tha� what they have ear�ed and, what is more,
eve� e�terprises i� the red have paid taxes - simply because they have had much lower revenues. Although in the Veneto the tax burden was lower because of the proportionally higher incomes of businesses, the fact remains that in previous periods there have been even higher rates (e.g., 61.4% in 2001) and that the highest rates of taxation are borne by smaller businesses, as has been pointed out in previous analyses by UnionCamere Veneto. Moreover, it should be underscored that the relatively more favourable fiscal situation of the Veneto’s enterprises should not lead to underestimate the fact that:
− corporate taxation is very high and well above the nominal level, which is already high compared to other European countries;
− IRAP does not exist in the tax systems of other advanced countries;
− the rate measured regards the overall system of enterprises, but SMEs and especially micro-enterprises with lower incomes are subject to much higher actual rates and also in the Veneto enterprises that post losses have to pay IRAP and IRES on costs that are not tax deductible (including most of those relating to bank interest paid).
As already proposed in other studies on financial statements, in addition to a general reduction in rates, measures should be taken to:

U�i��ca�ere Ve�et�
56
− drastically cut charges and expenses that are not deductible for tax purposes (and in particular those relating to debt interest, which increases worsen the cost of borrowed capital, particularly in this period of “credit crunch”);
− reduce the taxable base of IRAP, at least the portion weighing on the cost of labour, which makes no sense, has no counterpart in any other advanced country and also violates Article 53 of the Constitution, which sets forth criteria for the progressivity of taxes.
It is a fact that e�i�i�ati�g taxes �� ear�i�gs rei�vested i� the c��pa�y a�d i� i���vati�� a�d the i�pr�ve�e�t �f hu�a� capita� would be essential for economic growth. There is a growing number of scholars who advocate taxation only on the distribution of dividends to shareholders, i.e., when the business income is actually received by those entitled to it.
Finally, some comments on pr�ductivity. Since the Veneto’s production system is labour intensive, labour productivity has continued to be below the national average - even more so because of the crisis. It should also be noted that the indicator used here (value added/labour cost) is different than the one used in macro-economic accounting (value added/number of hours worked or number of units of full-time work). Indeed, the denominator in the former indicator captures also the quality of human resources – higher quality is usually better paid; while the denominator in the latter indicator is based on labour units and expresses an undifferentiated quantity. If, therefore, according to the financial statement indicator, the value is unfavourable for the Veneto, it means that poor labour productivity does not depend on an increased use of unqualified staff, but may be the result of an excess of labour, of a lower efficiency in the production processes, or even of the offering of goods and services at lower prices. Greater insight into these causes would require investigations that go well beyond the assessment of financial ratios, but it is worth noting that the Veneto’s
pr�ductivity �f capita� is higher than the Italian average. Therefore, other things being equal, it is obvious that the greater intensity of labour causes a lower productivity of labour and a higher productivity of capital. It follows that it is especially important to inject new capital through investment in innovation and the improvement of human capital, to increase the productivity of labour.