Antenna Characterization for Bluetooth-Based Travel … · 3 Antenna Characterization for...
40
Antenna Characterization for Bluetooth-based Travel Time Data Collection J. David Porter 1 , David S. Kim 1 , Mario E. Magaña 2 , Panupat Poocharoen 2 , Carlos Antar Gutierrez Arriaga 3 1 School of Mechanical, Industrial and Manufacturing Engineering 204 Rogers Hall Oregon State University Corvallis, Oregon 97331 2 School of Electrical Engineering and Computer Science 1148 Kelley Engineering Center Oregon State University Corvallis, Oregon 97331 3 Graduate Intern Technical Intel Corporation 1900 Prairie City Rd. Folsom, CA, 95630 J. David Porter (Corresponding Author) Associate Professor School of Mechanical, Industrial and Manufacturing Engineering 204 Rogers Hall Oregon State University Corvallis, Oregon 97331 (V) 541-737-2246 (F) 541-737-2600 [email protected]
Transcript of Antenna Characterization for Bluetooth-Based Travel … · 3 Antenna Characterization for...
Antenna Characterization for Bluetooth-based Travel Time Data
Collection
J. David Porter1, David S. Kim
1, Mario E. Magaña
2, Panupat Poocharoen
2, Carlos Antar
Gutierrez Arriaga3
1School of Mechanical, Industrial and Manufacturing Engineering
204 Rogers Hall
Oregon State University
Corvallis, Oregon 97331
2School of Electrical Engineering and Computer Science
1148 Kelley Engineering Center
Oregon State University
Corvallis, Oregon 97331
3Graduate Intern Technical
Intel Corporation
1900 Prairie City Rd.
Folsom, CA, 95630
J. David Porter (Corresponding Author)
Associate Professor
School of Mechanical, Industrial and Manufacturing Engineering
204 Rogers Hall
Oregon State University
Corvallis, Oregon 97331
(V) 541-737-2246
(F) 541-737-2600

2
ABSTRACT
Several approaches for travel time data collection based on the reading of time-stamped media
access control addresses from Bluetooth-enabled devices have been reported in the literature
recently. This new approach offers a number of advantages over more conventional methods,
including lower costs of hardware and software, the volume of data that can be collected over
time, and ease of implementation.
A fundamental component that may affect the quantity and the quality of the travel time
samples collected with a Bluetooth-based system is the antenna type utilized. Antenna
characteristics such as polarization and gain must be matched to specific application
environments to optimize the performance of a Bluetooth reader unit. However, experimental
data that focuses on antenna characterization as it relates to the use of Bluetooth technology to
assess the performance of transportation facilities is lacking.
In this study, five different types of antennas were characterized to assess their suitability
to support a Bluetooth-based travel time data collection system. The results indicate that
vertically polarized antennas with gains between 9dBi and 12dBi are good candidates for travel
time data collection. Also, different antenna types are better suited to different uses of the
Bluetooth-based system. If the main focus is the collection of travel time data, then an antenna
with a lower sampling rate may provide more accurate travel time samples.
KEYWORDS
Antenna, Bluetooth, gain, MAC address, polarization, travel time.

3
Antenna Characterization for Bluetooth-based Travel Time Data
Collection
1.0 INTRODUCTION
One approach for improving mobility and the efficiency of the transportation system is to
improve the operations and management of the existing transportation infrastructure. A
fundamental performance measure related to mobility and transportation efficiency is travel time.
Without reliable measures of performance, the management of the transportation system
becomes much more difficult. Having accurate travel time estimates will also help in the
evaluation of proposed highway or transit facilities.
Travel time data collection based on the reading of time-stamped media access control
(MAC) addresses from Bluetooth (BT) enabled devices has been in use for several years
(Wasson et al., 2008). A basic setup to collect travel time data via BT includes a reader unit and
an antenna. This approach for collecting travel time data offers a number of advantages over
more conventional methods, including lower costs of hardware and software, large volumes of
data that can be collected over time (depends on the level of market penetration of Bluetooth
technology), and ease of implementation. The latter advantage makes this data collection method
suitable for temporary or permanent deployment along different types of travel corridors,
including interstate highways, and principal and minor arterial roadways.
Several applications in which time-stamped MAC addresses collected from BT-enabled
devices have been employed to estimate the performance of a system have been reported.
Wasson et al. (2008) conducted a study in the greater Indianapolis area to estimate freeway and
arterial travel times. Haseman et al. (2010) calculated travel delay times in a rural interstate

4
highway work zone along I-65 in Northwestern Indiana, assessed driver diversion rates, and
developed proposed metrics for a state transportation agency to evaluate work zone mobility
performance. Barceló et al. (2010) assessed the quality of the data collected from BT mobile
devices for travel time forecasting and to estimate time dependent origin-destination (OD)
matrices. Quayle et al. (2010) measured arterial travel performance (i.e., segment travel time,
average running speed, and OD) in a study conducted in Portland, Oregon. Day et al. (2010)
evaluated signal coordination by combining high resolution signal data with travel time
measurement from BT device MAC address matching. Using this technique, optimal offsets
were calculated for a Saturday plan on a four-intersection signalized corridor, and the operational
impacts were estimated. Haghani et al. (2010) compared floating car data with BT sensor data
and concluded that the latter can be used as “ground-truth” for evaluating other sources of travel
time and other ITS applications.
1.1 Research Motivation
There are several factors that may affect the quantity and the quality of the time-stamped MAC
address data collected with a BT-based system. These factors may be associated with the
firmware/software implementation or with the hardware components used (e.g., the type of BT
chipset). An important decision that needs to be made in the hardware category is the type of
antenna to use. Antenna characteristics, such as polarization and gain, must be matched to
specific application environments to optimize the performance of a BT reader unit.
Very few studies exist in the literature that have thoroughly investigated the effects of
antenna properties on the accuracy of the travel time samples obtained with a BT-based travel
time data collection system. Puckett & Vickich (2010) tested various configurations of antennas

5
with BT readers to assess the system’s effective read range. Omnidirectional antennas with gains
of 1 decibel (dB), 3dB, and 5dB, and a Yagi antenna with a gain of 13dB were tested. The results
showed that the most consistent capture rate was when the received signal strength index (RSSI)
level sensed from BT-enabled devices was no less than -80dBm. Also, a moderate increase in the
effective range (and resulting capture rate) was observed when the omnidirectional antenna with
a 5dB gain was used. Malinovskiy et al. (2011) tested several antennae configurations and BT
readers in a one mile long corridor and compared the detection rate error of their BT-based
system versus an automatic license plate based system. Two omnidirectional antennas with gains
of 7decibel isotropic (dBi) and 9 dBi, respectively, and one directional antenna with a gain of 12
dBi were tested. The directional antenna had a 35 degree vertical and horizontal half-beam
width. Their results showed that a pair of BT detectors mounted on opposing sides of the
roadway at each end of the corridor, one using the 7dBi antenna and the other the 9dBi antenna,
resulted in the lowest error compared to the other combinations of mounting locations and
antennae.
Given the small sample of prior work found and the fact that the emphasis of these
studies was not to better understand the effect of antenna type, it is evident that experimental
data that focuses on antenna characterization as it relates to the use of BT technology to assess
the performance of transportation facilities is still lacking. Antennas are fundamental
components of any wireless data collection system and do significantly affect its performance if
not selected carefully. In the context of travel time data collection using BT technology, for
example, the size of the coverage area defines how many times a single MAC address will be
detected in a single pass. To produce MAC address matches, a decision has to be made as to

6
which single detections at two consecutive detectors will be used to calculate a travel time
sample for a segment. This decision could bias the resulting travel time estimation error.
In this study, five different types of antennas were first characterized to understand how
their main properties (i.e., polarization and gain) influence the performance of a single BT
reader. Next, the five antennae were used to collect travel time samples on a 0.75 mile four-lane
road segment in Salem, Oregon. The results indicate that the quantity and the quality (e.g.,
percentage of duplicates) of the MAC addresses read with each antenna type are different. The
volume of unique MAC addresses collected during the testing period were compared to traffic
volumes collected over the same time period via inductive loop detectors.
The remainder of the article is organized as follows: Section 2 explains the main
components of the BT-based travel time data collection system, including the BT reader unit,
antennas, and the installation locations of the BT readers for testing. Section 3 presents the
experimental approach used and the results obtained from characterizing five different types of
antennas with a single BT reader. Section 4 explains the experimental approach used and the
results obtained from collecting travel time samples with the five different antennas types using
two BT readers. Finally, section 5 presents the conclusions of the study.
2.0 BLUETOOTH TRAVEL TIME DATA COLLECTION SYSTEM
In this section, the main components of the BT-based travel time data collection system used in
this study are described. The BT reader is presented first, followed by a description of the salient
features of each antenna tested. The last subsection explains the characteristics of the sites where
the BT reader units and antennae were installed and tested.

7
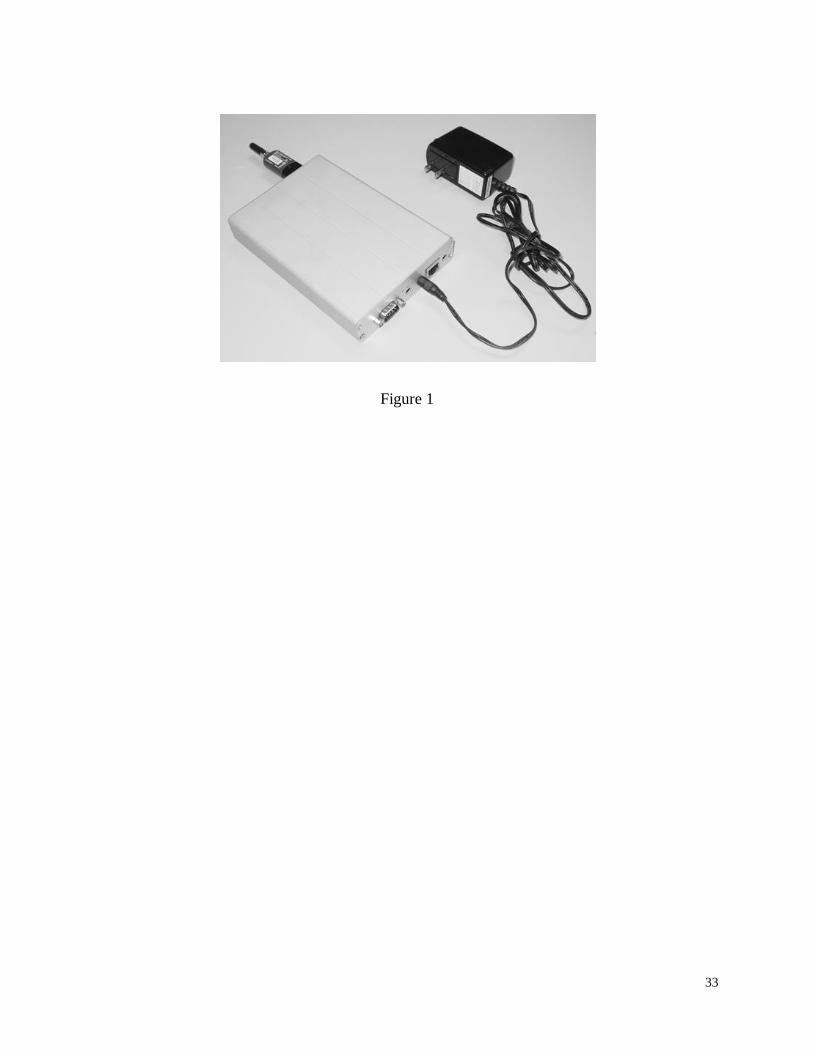
2.1 Bluetooth Reader
The BT reader used to collect travel time data is depicted in Figure 1. The BT reader is a
fundamental component of the BT-based travel time data collection system and is capable of
performing several functions, including:
Collecting MAC addresses wirelessly from BT-enabled portable devices under a full
spectrum of environmental and traffic conditions. To protect citizens’ privacy, the BT
reader’s software removes the first five characters and the last character from the
MAC addresses collected.
Adding a time-stamp to partial MAC addresses collected so that travel time samples
can be calculated.
Storing a large quantity of partial time-stamped MAC addresses in internal memory
before this information is extracted.
************************
Take in Figure 1
************************
The BT reader was assembled from commercially available components. Internally, it is
equipped with an ALIX WIFI board (Ituner Networks Corporation, 2011) which provides several
interfaces, including a 10/100 Base T Ethernet port for network connectivity, an external
memory slot for a compact flash card, a DB9 serial port, and dual USB ports. A class 1 type
external BT adapter (Sena Technologies, 2011) is connected to the ALIX WIFI board via one of
the USB ports. The external BT adapter has a transmission output power of approximately 79.43

8
milliwatts (+19 dBm). The BT reader may be powered with a DC jack or by using a power over
Ethernet (POE) injector. The ALIX WIFI board is protected by an extruded aluminum enclosure
to minimize the potential of damage resulting from the accumulation of dust and/or moisture.
The operating system employed by the BT reader is the Linux distribution Voyage Linux (kernel
2.6.26).
2.2 Antennas
There were two main factors considered in the antenna selection process: polarization and gain.
Polarization refers to the orientation of the electric field vector in the radiated wave. For
example, Figure 2a depicts the orientation of the electric field (E-field) vector for an antenna
with horizontal polarization (e.g., an antenna for TV reception). This antenna will not radiate and
will not receive a wave polarized perpendicular to its electrical vector (Vizmuller, 1995).
Gain is a measure of the directionality of the antenna. Antenna gain is defined as the
power output, in a particular direction, compared to that produced in any direction by a perfect
omnidirectional antenna (i.e., isotropic antenna). For example, if an antenna has a gain of 3dB,
that antenna improves upon the isotropic antenna in that direction by 3dB or a factor of two
(Stallings, 2005). Figure 2b depicts a comparison between the ideal concept of an isotropic
antenna (Gain = 1) and a directional antenna with a value of gain greater than one along the
horizontal axis.
************************
Take in Figure 2
************************

9
Five different antennas with different polarization and gain characteristics were selected
for testing. Table 1 presents the most important specifications of each antenna.
************************
Take in Table 1
************************
Table 2 shows pictures of the antennas, their vertical and horizontal cross-sectional
coverage patterns, and their manufacturers.
************************
Take in Table 2
************************
2.3 BT Reader Test Locations
The BT-based data collection system used in this study consisted of two BT readers located 0.75
miles apart on Oregon Route 221 (Wallace Road NW) on the west side of the city of Salem,
Oregon. The posted speed limit on this road segment is 45 miles per hour. The approximate
location of the BT readers on Route 221 is depicted in Figure 3.
************************
Take in Figure 3
************************

10
The BT reader labeled as “Reader 1” in Figure 3 was installed at a test site operated by
the intelligent transportation systems (ITS) unit of the Oregon Department of Transportation
(ODOT). This test site is equipped with inductive loop detectors that provide traffic flow volume
data to facilitate performance assessment of other technologies that the ODOT ITS unit needs to
evaluate. The BT reader labeled as “Reader 2” in Figure 3 was installed inside a control box
located behind a beacon sign. Both BT readers could be accessed remotely via a cellular router.
Since the BT reader installed at the beacon sign was located only 0.75 miles southeast from the
BT reader installed at the test site, it was assumed that the traffic count data observed every 15
minutes was similar at both sites. Observations of traffic indicate that the number of vehicles
turning off of the test segment is very low relative to the overall traffic volume.
Figure 4a and Figure 4b show examples of how the two BT readers and their antennas
were installed at the test site and at the beacon sign, respectively. Antennas were mounted
approximately 15 feet above the ground at both locations.
************************
Take in Figure 4
************************
3.0 ANTENNA CHARACTERIZATION DATA COLLECTION AND ANALYSIS
In this section, the experimental approach used and the results obtained from characterizing five
different types of antennas to understand how their main properties (i.e., polarization and gain)
influence the performance of a single BT reader are discussed. All five antennas were tested at
the test site (i.e., Reader 1). The performance of the antennas was evaluated using MAC address
data in conjunction with traffic volume data.

11
3.1 Experimental Design
The experimental design used was a single factor experiment (i.e., antenna type) with an unequal
number of trials per antenna type. The order in which the five antennas were tested was
randomized and the BT reader unit with a specific antenna was installed for a period of between
three and seven days. The reason some antennas were tested more days than others was either
because they were installed right before a weekend or because ODOT personnel were not
available to assist with antenna installation. The coverage patterns of all the antennas tested
covered all traffic lanes (i.e., two lanes in each direction).
The fraction read was the main antenna performance measure and was computed as
follows:
)directions both (in volume traffic Total
read addresses MACunique Totalread Fraction (1)
Both metrics used to calculate the fraction read were collected over the same test period.
Also, it was assumed that the fraction of vehicles with active BT devices present was the same
over the periods that each antenna was tested. This assumption was validated by comparing the
performance of the same antenna for non-overlapping time periods.
In addition to the fraction read, the average number of reads per MAC address over the
test period was computed as follows:
read addresses MACunique Total
)duplicates (including read addresses MACTotaladdress MACper reads Avg. (2)

12
This measure is indicative of the total volume of data collected, and a higher fraction
read measure combined with a relatively low average reads per MAC address measure is ideal.
3.2 Data Collection and Processing
Two data sources were utilized to characterize the performance of the antennas. The first data
source was a file containing the time-stamped MAC addresses collected by the BT reader and
antenna combination during the test period. A sample of the raw data collected by the BT reader
unit is depicted in Figure 5. The fields of each record in the file are comma separated. The first
field displays the MAC address of the mobile BT-enabled device captured by the BT reader unit;
the second field displays the date; the third field displays the time; the last field displays the
MAC address of the BT reader.
************************
Take in Figure 5
************************
The second data source was traffic flow volume data corresponding to the period each
antenna was tested. In each lane adjacent to the BT reader (at the test site only), inductive loop
detectors were present and collecting traffic flow volume data (i.e., counts for every 15 minute
period).
MAC addresses whose counts were greater than 100 over the time an antenna was tested
were removed, since these addresses were (very likely) not collected from passing vehicles. In
some periods, the same MAC address was read thousands of time. Counts of unique MAC

13
addresses read by each antenna during the testing period were tabulated for the 15-minute
periods used for traffic counts, so that this data could be compared to the corresponding traffic
flow volume data collected.
3.4 Results
The test results showed that the quantity and the quality (e.g., percentage of duplicates) of the
MAC addresses read with each antenna type were different. Table 3 presents six pieces of
information for each antenna, i.e., the fraction read, the average number of reads per MAC
address, the total traffic volume during the testing period, the average traffic volume during the
testing period, the total number of hours the antenna was tested, and whether or not the testing
period included the weekend (i.e., Saturday and Sunday). The antennas in Table 3 are ordered
from highest to lowest with respect to fraction read.
The data shows that the average traffic volume along the test corridor was very consistent
throughout the week. As mentioned before, the data presented in Table 3 excludes those MAC
addresses that were read more than 100 times over the test period. MAC addresses whose total
count was more than 100 most likely were collected from devices located inside nearby
apartment/houses, pedestrians, cyclists, or parked vehicles in the vicinity of the BT reader unit.
************************
Take in Table 3
************************
A Chi-squared test was conducted to test the null hypothesis that the performance
measure fraction read is the same for all antennas tested. This null hypothesis was rejected with

14
a P-value of close to zero, which indicates that differences in antenna performance do exist. The
Marascuillo procedure was applied to examine significant differences with respect to the
performance measure fraction read at a 95% confidence level between all pairs of antennas. The
results are shown in Table 4 (ordered from highest to lowest with respect to fraction read),
where a “1” in a cell indicates a significant difference in the fraction read between the two
antennas being compared.
************************
Take in Table 4
************************
Antenna 1 (Omnidirectional) has a significantly higher fraction read than any other
antenna, and antenna 4 with the second highest fraction read, is significantly better than all
antennas except antenna 1. There is about equal performance between antennas 3 and 5, with
antenna 2 having the worst overall performance. The two best performing antennas were both
vertically polarized antennas, but differed in gain and the shape of their coverage pattern.
The average number of reads per MAC address varied widely among the antennas. There
is no clear correlation between this measure and the polarization and gain characteristics of the
antennas tested. However, the omnidirectional antenna, which had the best overall fraction read
performance, had the third lowest average reads per MAC address. Thus, it does not appear that
a better fraction read measure will necessarily come with an increase in data volume.
To better understand the behavior of the BT reader unit and antenna combination with
respect to the performance measure fraction read, additional data analysis was conducted. For
the purposes of modeling and data analysis, it is important to understand the characteristics of the

15
fraction read probability distribution. The probability that a MAC address is read from a passing
vehicle depends on:
1. The probability that the vehicle contains an active BT device, and
2. The probability that the BT reader captures the MAC address from this BT device
during device inquiry in the limited time the vehicle is in the antenna coverage area.
If these probabilities are consistent over time (as assumed) and reading of MAC
addresses from different BT devices is independent, then the number of MAC addresses read
from a given number of vehicles will be binomially distributed. If it is assumed that the number
of MAC addresses read is binomially distributed, analyses and plots of the data should produce
results consistent with this assumption. Figure 6 shows a plot of the fraction read for a 15 minute
time period versus the traffic count for that same 15 minute time period for antenna 4 (i.e., Yagi
antenna). Assuming the overall fraction read is equal to the probability that a MAC address is
read from a passing vehicle, the dotted black lines in Figure 6 represent +/- two standard
deviations from the expected fraction read.
************************
Take in Figure 6
************************
Approximately 94% of the fraction read values plotted in Figure 6 fall within +/- two
standard deviations from the expected fraction read. Under the binomial assumption,
approximately 95% of the fraction read should fall within +/- two standard deviations from the

16
expected fraction read. Other antennas produced similar results with slightly lower percentages
within +/- two standard deviations from the expected fraction read except antenna 5, which
displayed much higher variability over time.
One critical assumption made is that the fraction of vehicles with active BT is constant.
To provide additional evidence that the fraction of vehicles containing active BT devices does
not fluctuate significantly over time, Chi-squared tests were applied to test the null hypothesis
that the fraction read is the same for non-overlapping 24 hour time periods using the same
antenna. Since the antenna type stays the same, differences in the performance measure fraction
read may be attributed to differences in the fraction of BT devices in vehicles passing the BT
reader unit. This null hypothesis was clearly rejected for antenna 5, which displayed much higher
variability over time. The P-value for this statistical test for antenna 1 was 0.033, and was greater
than 0.05 for all other antennas except antenna 5 (i.e., the null hypothesis for antenna 1 would be
rejected at a 95% confidence level but not at a 97% confidence level, and the null hypothesis
would not be rejected at a 95% confidence level for antennas 2, 3, and 4).
4.0 COLLECTION AND ANALYSIS OF TRAVEL TIME SAMPLES
In this section, the experimental approach used and the results obtained from collecting travel
time samples with different types of antennas are discussed. In this part of the study, all five
antennas were tested using the two BT readers installed along Oregon Route 221.
4.1 Collection and Processing of Experimental Data
Both BT readers were equipped with the same antenna type and collected MAC addresses for
two separate periods of between three and seven days. The reason for the different testing
durations is the same as mentioned in section 3.1.

17
The order of the tests was randomized. During the same periods that the antennas were
tested, probe vehicle runs were also conducted. Each of the five antenna types was tested twice
on Oregon Route 221 and 20 probe vehicle runs were conducted by two drivers in a single day
within each testing period, for a total of 10 days worth of probe vehicle runs (or 200 probe
vehicle runs). The probe vehicles runs were used to assess the accuracy of the travel time
estimates computed from the data collected by the two BT readers. The probe vehicle contained
an active BT device with a known MAC address and a clock synchronized with the BT readers.
The time that the probe vehicle passed each BT reader was recorded. A line drawn from the BT
reader and perpendicular to the road was used as the location where the vehicle passed the BT
reader.
For each time period that a specific antenna was tested, the following performance
measures were computed:
Traffic volume.
The number of travel time samples computed from the collected data.
The percentage of travel time samples obtained with respect to traffic volume.
The average percent difference in travel times (between BT reader 1 and BT reader 2)
between the probe vehicle and the travel times computed for the probe vehicle from
collected MAC address data.
The average absolute percent difference in travel times (between BT reader 1 and BT
reader 2) between the probe vehicle and the travel times computed for the probe
vehicle from collected MAC address data.

18
4.2 Computing Travel Time Samples from MAC Address Data
The general procedure for computing travel time samples from collected MAC address data
implemented in software consisted of the following steps:
1. Identify all MAC addresses detected by each BT reader.
2. Eliminate those MAC addresses not detected by both BT readers.
3. For data from a single BT reader, organize the MAC address data into “groups.”
4. Compute travel time samples from the groups of MAC addresses for each BT reader.
A group is defined as a collection of data records with the same MAC address sorted
sequentially by time, where the time between any adjacent records is no greater than a fixed
threshold. Groups of MAC addresses are defined for individual BT readers and they represent
the number of times a single MAC address was captured as a vehicle traveled through the BT
reader’s antenna coverage area. For this analysis, 30 seconds was the time threshold defining a
group. This value is less than the smallest reasonable travel time between the BT readers located
on Oregon Route 221 and greater than the time a vehicle traveling at the speed limit would be in
the coverage area of an antenna. Three times were obtained for each MAC address group. These
were the earliest, latest, and average of the earliest and latest times in the group (referred to as
the average group time). Examples of these times are depicted in Figure 7. It is possible (and
was seen frequently) for a group to consist of a single record. In this case, the earliest, latest, and
average of the earliest and latest times were all the same time.

19
************************
Take in Figure 7
************************
To compute travel time samples from groups of MAC addresses, a second threshold
value of two minutes was utilized. This threshold value was the maximum time difference
between the average group times. The two minute threshold worked well since there was little or
no congestion on Oregon Route 221 and two minutes is the approximate time to complete a
round trip passing both BT readers twice. Two groups that exceeded this threshold were not used
to compute travel time samples. This prevented the generation of extremely large travel time
samples from groups of the same MAC address occurring on different days, or on different trips
for the same vehicle in the same day.
4.3 Results
Results for the percentage of the traffic volume for which a travel time sample was obtained (i.e.,
the sampling rate) are shown in Table 5. With the exception of antenna 4 (i.e., Yagi), this
percentage was very consistent for the same antenna type over different time periods, which
indicates that uncontrollable factors such as climatic conditions and interference from unknown
sources had little impact on antenna performance. The performance of antenna 4 is sensitive to
orientation and inconsistencies in this installation parameter may have contributed to the
differences seen over different time periods. The antennas in Table 5 are ordered from highest to
lowest with respect to weighted average percentage match.

20
The results indicate that antenna 5 is clearly the best performing antenna with respect to
generating travel time samples. Antenna 4 also performed well, but showed inconsistencies over
time periods which are not well understood.
While a high sampling rate value is desirable, the accuracy of the collected travel time
samples is perhaps a more critical performance measure. When computing travel time samples
from groups of MAC addresses, different methods for computing samples exist that differ in
what time stamp in a group of MAC address is utilized. The following five methods were
examined:
1. BT reader 1 Group Average Time – BT reader 2 Group Average Time
2. BT reader 1 Group First Time – BT reader 2 Group First Time
3. BT reader 1 Group First Time – BT reader 2 Group Last Time
4. BT reader 1 Group Last Time – BT reader 2 Group First Time
5. BT reader 1 Group Last Time – BT reader 2 Group Last Time
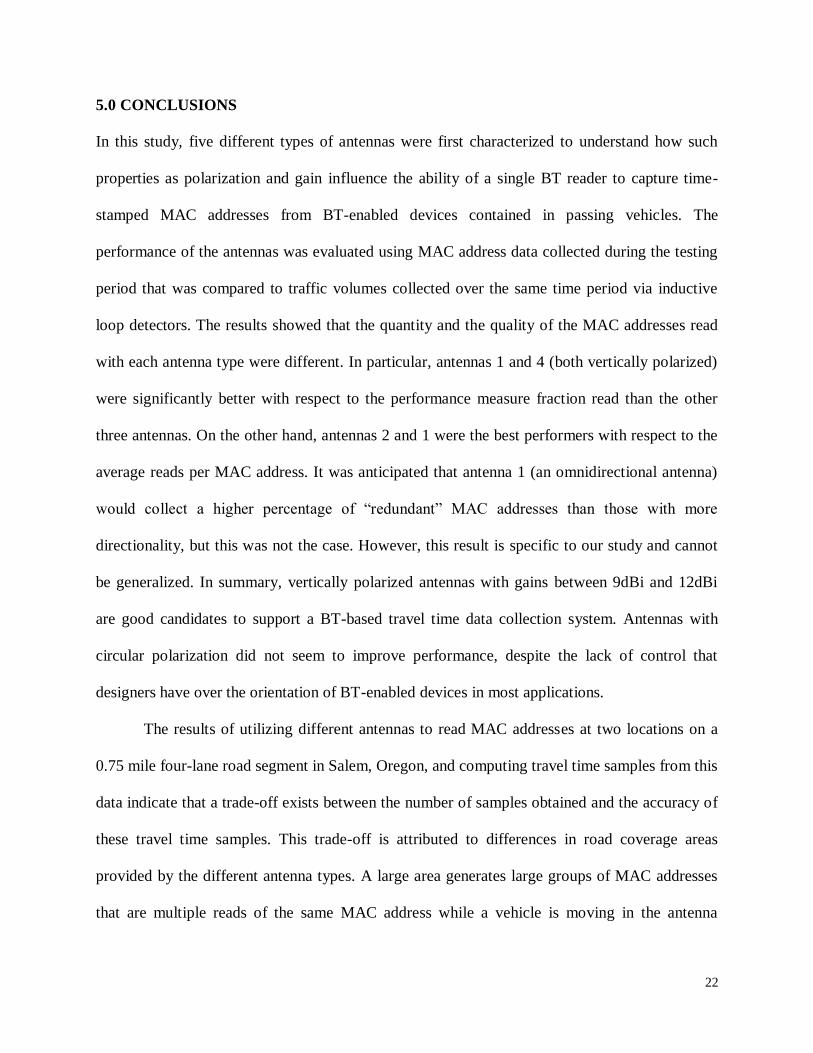
Table 6 shows the accuracy results of travel time samples obtained using the most
accurate method for an antenna type during its corresponding testing time period. Accuracy was
determined by comparing the estimated travel time derived from MAC addresses to the average
travel times recorded by the probe vehicle for each antenna during the testing period. Both the
average errors and average absolute errors (shaded rows in Table 6) were computed as the
percent difference from the manually recorded probe vehicle travel times. The antennas in Table
6 are ordered from highest to lowest with respect to the response weighted average percentage
match.

21
The most accurate method for computing travel time samples was to utilize the difference
in average group times. The other methods generated much larger average errors. The lowest
error percentage was generated by antenna 2. This antenna also had the lowest sampling rate.
Figure 8 shows that a trade-off exists between the sampling rate and the accuracy of the
travel time samples collected. This is attributed to differences in the road coverage area realized
by the different antenna types.
************************
Take in Table 5
************************
************************
Take in Table 6
************************
************************
Take in Figure 8
************************
22
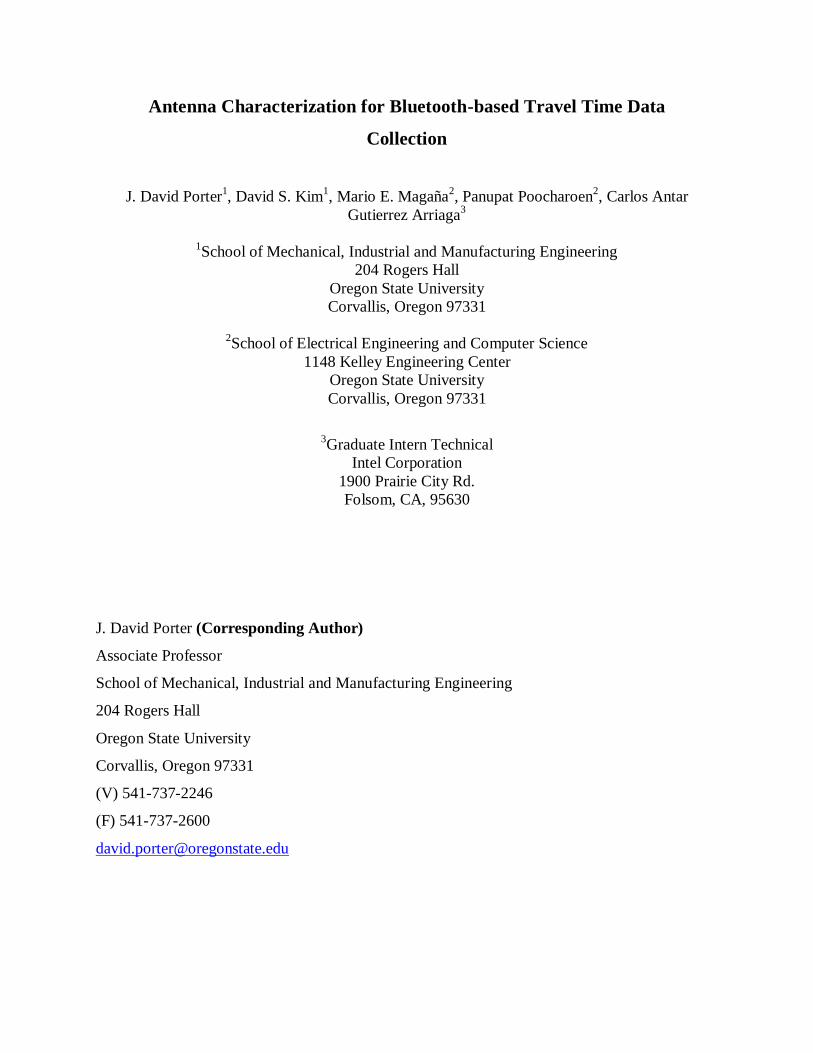
5.0 CONCLUSIONS
In this study, five different types of antennas were first characterized to understand how such
properties as polarization and gain influence the ability of a single BT reader to capture time-
stamped MAC addresses from BT-enabled devices contained in passing vehicles. The
performance of the antennas was evaluated using MAC address data collected during the testing
period that was compared to traffic volumes collected over the same time period via inductive
loop detectors. The results showed that the quantity and the quality of the MAC addresses read
with each antenna type were different. In particular, antennas 1 and 4 (both vertically polarized)
were significantly better with respect to the performance measure fraction read than the other
three antennas. On the other hand, antennas 2 and 1 were the best performers with respect to the
average reads per MAC address. It was anticipated that antenna 1 (an omnidirectional antenna)
would collect a higher percentage of “redundant” MAC addresses than those with more
directionality, but this was not the case. However, this result is specific to our study and cannot
be generalized. In summary, vertically polarized antennas with gains between 9dBi and 12dBi
are good candidates to support a BT-based travel time data collection system. Antennas with
circular polarization did not seem to improve performance, despite the lack of control that
designers have over the orientation of BT-enabled devices in most applications.
The results of utilizing different antennas to read MAC addresses at two locations on a
0.75 mile four-lane road segment in Salem, Oregon, and computing travel time samples from this
data indicate that a trade-off exists between the number of samples obtained and the accuracy of
these travel time samples. This trade-off is attributed to differences in road coverage areas
provided by the different antenna types. A large area generates large groups of MAC addresses
that are multiple reads of the same MAC address while a vehicle is moving in the antenna

23
coverage area. It is not apparent from the data which record within a group best represents the
point at which the vehicle is closest to the BT reader. This highlights the importance of
developing methods to filter MAC address data effectively. If this can be performed effectively,
then ideally only the MAC address records that represent the time a vehicle is the closest to the
BT reader will be used to compute travel times.
The results also indicate that different antenna types will be suited to different uses of the
BT readers. If the main focus is the collection of travel time data, as in this research, a lower
sampling rate (smaller coverage area) combined with more accurate travel time samples may be
desired.
6.0 ACKNOWLEDGMENT
We would like to thank the Oregon Transportation Research and Education Consortium
(OTREC) and the Oregon Department of Transportation (ODOT) Research section for funding
this work. We would also like to thank Galen McGill from the ODOT ITS Unit and June Ross
from the ODOT Research section. Special thanks go out to Adam Bradford, Tony Owens and
Gary Binning for assisting with setting up the antennas at the test site and for their invaluable
technical support.

24
7.0 REFERENCES
Barceló, J., Montero, L., Marqués, L., & Carmona, C. (2010). Travel time forecasting and
dynamic origin–destination estimation for freeways based on Bluetooth traffic monitoring.
Transportation Research Record, 2175, 19-27.
Day, C.M., Haseman, R., Premachandra, H., Brennan Jr., T.M., Wasson, J.S., Sturdevant, J.S., &
Bullock, D.M. (2010). Evaluation of arterial signal coordination: methodologies for
visualizing high-resolution event data and measuring travel time. Transportation Research
Record, 2192, 37-49.
Haghani, A., Hamedi, M., Sadabadi, K.F., Young, S., & Tarnoff, P. (2010). Data collection of
freeway travel time ground truth with Bluetooth sensors. Transportation Research Record,
2160, 60-68.
Haseman, R.J., Wasson, J.S., & Bullock, D.M. (2010). Real-time measurement of travel time
delay in work zones and evaluation metrics using Bluetooth probe tracking. Transportation
Research Record, 2169, 40-53.
Ituner Networks Corporation (2011). Retrieved from http://www.mini-box.com/ALIX.
Malinovskiy, Y., Lee, U., Wu, Y., & Wang, Y. (2011). Investigation of Bluetooth-based travel
time estimation error on a short corridor. Proceedings of the 90th Annual Meeting of the
Transportation Research Board, Washington, D.C.
Puckett, D.D., & Vickich, M.J. (2010). Bluetooth-Based Travel Time/Speed Measuring Systems
Development. Report No. UTCM 09-00-17, Texas Transportation Institute, College
Station, Texas.

25
Quayle, S.M., Koonce, P., DePencier, D., Bullock, D.M. (2010). Arterial performance measures
using media access control readers: Portland, Oregon, pilot study. Transportation Research
Record, 2192, 185-193.
Sena Technologies, Inc (2011). Retrieved from
http://www.sena.com/products/industrial_bluetooth/ud100.php.
Stallings, W. (2005). Wireless Communications & Networks. Upper Saddle, NJ: Pearson
Education, Inc.
Vizmuller, P. (1995). RF Design Guide: Systems, Circuits, and Equations. Boston, MA: Artech
House, Inc.
Wasson, J.S., Sturdevant, J.R., Bullock, D.M. (2008). Real-Time Travel Time Estimates Using
Media Access Control Address Matching. ITE Journal, Vol. 78, No.6, pp. 20-23.

26
LIST OF TABLES
TABLE 1 Main Specifications of the Antennas Tested
TABLE 2 Antenna Pictures, Coverage Patterns and Manufacturers
TABLE 3 Fraction Read Performance from the Antenna Tests
TABLE 4 Pair-wise Comparison of Antenna with Respect to Fraction Read Performance
TABLE 5 Performance of Antennas with Respect to Sampling Rate
TABLE 6 Performance of Antennas with Respect to Accuracy of Travel Time Samples
LIST OF FIGURES
FIGURE 1 Bluetooth reader.
FIGURE 2 Concepts of polarization and gain.
FIGURE 3 Locations of BT readers on Oregon Route 221.
FIGURE 4 Installation of BT readers on Oregon Route 221.
FIGURE 5 Raw MAC address data collected by the BT reader unit.
FIGURE 6 Fraction read versus traffic volume for antenna 4 (Yagi).
FIGURE 7 Examples of earliest, latest and average group times for MAC addresses in a group.
FIGURE 8 Trade-off between the accuracy of travel time samples and sampling rate.

27
Table 1
Antennas
1 2 3 4 5
Directionality Omni Directional Directional Directional
Directional
(Wide Pattern)
Frequency
Range (MHz)
2400-2500 2400-2500 2400-2485 2400-2483 2400-2483
Polarization Linear
Vertical
Dual (both
vertical and
horizontal)
Right Hand Circular
Linear Vertical
Linear Vertical
Maximum
Gain (dBi)
9 11 12 12 8.6

28
Table 2
Antenna Picture Antenna Coverage Patterns Manufacturer
1
L-com, Inc.,
Antenna model #:
HG2409UDT-PRO, http://www.l-com.com
2
L-com, Inc., Antenna model #:
RE11DP,
http://www.l-com.com
3
Laird Technologies, Antenna model #:
CP24-12,
http://www.lairdtech.com
4
L-com, Inc.,
Antenna model #: HG2412SY,
http://www.l-com.com
5
Superpass™,
Antenna model #:
SPDG13H22,
www.superpass.com

29
Table 3
Antennas
1 4 3 5 2
Fraction
Read 0.109 0.097 0.090 0.090 0.082
Average
Reads Per
MAC
Address
6.8 8.3 7.1 8.2 3.4
Total
Traffic
Volume1
85,936 89,280 54,645 48,189 39,374
Average
Traffic
Volume2
10,742 11,032 10,929 10,219 11,672
Hours
Tested 168.25 167.25 98.0 95.25 70.25
Included
Weekend? Yes Yes No Yes No
1 Total vehicle count (over testing period).
2 Average vehicles per day (over testing period).

30
Table 4
Antenna # 1 4 3 5 2
1 0 1 1 1 1
4 0 1 1 1
3 0 0 1
5 0 1
2 0

31
Table 5
5 4 1 3 2
8/17 - 8/20 7/27 - 7/30 8/24 - 8/27 9/10 - 9/15 7/30 - 8/3 8/27 - 8/31 8/31 - 9/3 9/7 - 9/10 8/8 - 8/10 8/20 - 8/24
Traffic
Volume
(TV)
40,164 40,955 39,278 65,371 49,995 48,177 53,148 40,047 24,416 48,610
Number of
unique
MAC
addresses
detected
by DCU11
4,046 4,506 3,423 4,899 4,420 4,496 4,872 3,462 1,963 3,619
Number of
Travel
Time
Samples
(TTS)2
3,837 3,916 3,898 4,987 3,839 3,693 4,125 2,847 1,398 2,781
TTS as
Percentage
of TV
9.55% 9.56% 9.92% 7.63% 7.68% 7.67% 7.76% 7.11% 5.73% 5.72%
Weighted
Avg. %
Match
9.56% 8.49% 7.67% 7.48% 5.72%
1 Only counts the MAC address of a Bluetooth-enabled device in a passing car once during the test period. 2 Repeat occurrences of the a MAC address detected at DCU1 were accounted for if the specific MAC address was also detected at DCU2
32
Table 6
2 1 3 5 4
8/8 - 8/10 8/20 - 8/24 7/30 - 8/3 8/27 - 8/31 8/31 - 9/3 9/7 - 9/10 8/17 - 8/20 7/27 - 7/30 8/24 - 8/27 9/10 - 9/15
Calculation
Method First-First Avg-Avg Avg-Avg Avg-Avg Avg-Avg Last-Last Avg-Avg Avg-Avg Avg-Avg Avg-Avg
Absolute
Average
Error
4.02% 4.08% 3.26% 6.61% 4.38% 5.88% 6.38% 6.06% 8.05% 7.82%
Maximum 11.32% 7.94% 8.16% 13.28% 9.84% 15.29% 15.79% 16.42% 21.05% 16.45%
Minimum 0.00% 0.00% 0.00% 1.85% 0.00% 0.00% 0.00% 0.00% 1.27% 0.94%
Standard
Deviation 3.25% 2.96% 2.51% 3.69% 3.53% 5.15% 5.25% 5.55% 6.74% 5.24%
Combined
Absolute
Avg Error
4.06% 4.91% 5.02% 6.22% 7.91%
Average
Error 0.17% -2.86% -1.21% -7.08% -3.22% -6.02% 0.08% -3.63% -1.10% -7.68%
Standard
Deviation 5.38% 4.27% 4.13% 3.83% 4.95% 4.51% 8.20% 8.03% 11.67% 6.64%
33
Figure 1

34
Figure 2

35
Figure 3

36
Figure 4
(a) (b)
Antenna

37
Figure 5

38
Figure 6
0.00
0.10
0.20
0.30
0.40
0.50
0.60
0.70
0 50 100 150 200 250 300 350 400
Traffic Count (15 Minute Time Period)
Fraction Read (15 minute interval) Antenna 4 (6/15/10 - 6/22/10)

39
Figure 7
0:0D:EC:7 9/12/2010 20:49:19
0:0D:EC:7 9/12/2010 20:49:24
0:0D:EC:7 9/12/2010 20:49:33
0:0D:EC:7 9/12/2010 20:49:37
0:0D:EC:7 9/12/2010 20:49:42
0:0D:EC:7 9/12/2010 20:49:47
Group
Earliest time
Latest time
Average group time

40
Figure 8
0%
1%
2%
3%
4%
5%
6%
7%
8%
9%
0% 2% 4% 6% 8% 10%
Trav
el T
ime
Err
or
Sampling Rate (Travel Samples as % of Traffic Volume)
Avg % Error vs. Sampling Rate