ANTECEDENT PROXIMITY VALUES STRATIFIED...
9
I - ANTECEDENT PROXIMITY VALUES STRATIFIED FOR A SEVERE AND NON-SEVERE CONVECTIVE SAMPLE: A PRELIMINARY INVESTIGATION Robert P. Harnack and Joseph R. Cermak III Department of Meteorology Cook College-New Jersey Agricultural Experiment Station Rutgers, The State University of New Jersey New Brunswick, New Jersey Abstract A pilot study was undertaken to try a methodology for devel- oping a dynamic climatology for the severe thunderstorm envi- ronment and to determine differences on severe local storms (SELS) days from non-SELS convective days in the Northeast- ern U.S. Calculations of81 mainly kinematic/dynamic variables are made at mandatOlY upper levels. The 24 cases used for each sample are drawn from the period 1979-1986. The area studied includes much of the lower elevations of the Mid-Atlan- tic and New England states. Only SELS events occurring within 3 hours after standard upper-air sounding times (0000 and 1200 UTC) are added to the SELS sample. Calculations of each variable are made at a reference point located near the reported severe convective location for SELS events and at Trenton, New Jersey for the non-SELS events. A t-test is per- formed to determine if there was a significant difference between the two samples for each variable. The significance testing reveals that 21 of the 81 variables had sample mean differences that are significant at the ten percent level or better. Compared to the non-SELS convective sample, the SELS environment tended to be a bit warmer and drier in the lower troposphere, had a steeper lapse rate in the mid-troposphere, had more convergent lower-tropospheric winds, had less cyclonic flow in the mid-troposphere, and had slowerflow speed in the upper-troposphere. The absolute differ- ences tended to be small even for variables having significant sample differences, indicating that the environment above the boundary layer just prior to a severe convective event is only marginally different to that for ordinary convection for the variables tested. 1. Introduction Severe Local Storms (SELS) are defined as convective events which have at least one of the following: 1) surface wind speed greater than or equal to 50 kt, 2) presence of hail greater than or equal to 19 mm (3/4 in.) in diameter, or 3) presence of a tornado. Such storms often have a direct impact on human lives and property, so various diagnostic studies have been carried out using parameters that have been identified or proposed as pre- cursors to severe weather outbreaks. These parameters include stability measures, wind shear statistics, locations of jet max- ima, strength and location of low-level convergence zones, and other various kinematic and dynamic fields. The latter have included wind divergence, vorticity advection, thermal advec- tion, and moisture advection. These studies have mainly focused on the Midwest-Great Plains regions where SELS most fre- 2 quently occur. The present study uses various kinematic/ dynamic fields and applies them to portions of the Northeastern United States for investigating environmental conditions occur- ring with severe wind/tornado events. There are several reasons for continuing to study SELS using data from the synoptic scale data network. First, forecasts related to convective phenomena have room for improvement. Second, traditional associations between parameters and SELS, such as the Miller (1972) checklist, need modification in the less baroclinic environments of summer, as suggested by Mad- dox and Doswell (1982a). Lastly, a closer scrutiny of severe weather from a kinematic and dynamic point of view can improve predictability if it is shown that certain fields correlate well with severe events. Since National Weather Service (NWS) offices and other forecasters now have the ability to compute the fields examined in this study, they can improve prediction of SELS occurrences if important signatures can be found. The fields used in this study are increasingly used operationally, though guideline or critical values have not been proposed. The small sample used in this study will not immediately change this situation, however, the methodology employed here consti- tutes a framework on which to build such a result in the future. As such, this effort is a pilot study on which to build a different kind of climatology, that of dynamic processes that relate to the environment in which SELS develop. Like any climatology it should be geographically and seasonally stratified. The North- east U.S. region is used in this study, but the small number of cases precluded seasonal stratification. The choice of variables to examine in conjunction with SELS occurrences should be based on physical considerations. Factors for deep, moist convection have been identified as: 1) sufficient low-level moisture, 2) sufficient instability of prevailing air mass, and 3) presence of a lifting mechanism in the lower troposphere. Given that deep, moist convection can develop, additional fac- tors that can affect SELS potential are: 1) the degree of instability, 2) presence of an elevated, lower tropospheric inversion (lid), and 3) the nature of the vertical wind profile. The choice of processes to examine in a SELS study should be based on these factors, on findings in previous SELS studies, and/or on theoretical considerations such as quasi-geostrophic diagnostics (e.g., omega equation). This implies that a large number of variables can justifiably be examined in conjunction with SELS occurrence. Though most convective studies note that a combination of ingredients is needed for SELS development, many of the stud- ies emphasize just one or a few. Lower tropospheric warm
Transcript of ANTECEDENT PROXIMITY VALUES STRATIFIED...

I -
ANTECEDENT PROXIMITY VALUES STRATIFIED FOR A SEVERE AND NON-SEVERE CONVECTIVE SAMPLE: A PRELIMINARY INVESTIGATION
Robert P. Harnack and Joseph R. Cermak III
Department of Meteorology Cook College-New Jersey Agricultural Experiment Station
Rutgers, The State University of New Jersey New Brunswick, New Jersey
Abstract
A pilot study was undertaken to try a methodology for developing a dynamic climatology for the severe thunderstorm environment and to determine differences on severe local storms (SELS) days from non-SELS convective days in the Northeastern U.S. Calculations of81 mainly kinematic/dynamic variables are made at mandatOlY upper levels. The 24 cases used for each sample are drawn from the period 1979-1986. The area studied includes much of the lower elevations of the Mid-Atlantic and New England states. Only SELS events occurring within 3 hours after standard upper-air sounding times (0000 and 1200 UTC) are added to the SELS sample. Calculations of each variable are made at a reference point located near the reported severe convective location for SELS events and at Trenton, New Jersey for the non-SELS events. A t-test is performed to determine if there was a significant difference between the two samples for each variable.
The significance testing reveals that 21 of the 81 variables had sample mean differences that are significant at the ten percent level or better. Compared to the non-SELS convective sample, the SELS environment tended to be a bit warmer and drier in the lower troposphere, had a steeper lapse rate in the mid-troposphere, had more convergent lower-tropospheric winds, had less cyclonic flow in the mid-troposphere, and had slowerflow speed in the upper-troposphere. The absolute differences tended to be small even for variables having significant sample differences, indicating that the environment above the boundary layer just prior to a severe convective event is only marginally different to that for ordinary convection for the variables tested.
1. Introduction
Severe Local Storms (SELS) are defined as convective events which have at least one of the following:
1) surface wind speed greater than or equal to 50 kt, 2) presence of hail greater than or equal to 19 mm (3/4 in.)
in diameter, or 3) presence of a tornado.
Such storms often have a direct impact on human lives and property, so various diagnostic studies have been carried out using parameters that have been identified or proposed as precursors to severe weather outbreaks. These parameters include stability measures, wind shear statistics, locations of jet maxima, strength and location of low-level convergence zones, and other various kinematic and dynamic fields. The latter have included wind divergence, vorticity advection, thermal advection, and moisture advection. These studies have mainly focused on the Midwest-Great Plains regions where SELS most fre-
2
quently occur. The present study uses various kinematic/ dynamic fields and applies them to portions of the Northeastern United States for investigating environmental conditions occurring with severe wind/tornado events.
There are several reasons for continuing to study SELS using data from the synoptic scale data network. First, forecasts related to convective phenomena have room for improvement. Second, traditional associations between parameters and SELS, such as the Miller (1972) checklist, need modification in the less baroclinic environments of summer, as suggested by Maddox and Doswell (1982a). Lastly, a closer scrutiny of severe weather from a kinematic and dynamic point of view can improve predictability if it is shown that certain fields correlate well with severe events. Since National Weather Service (NWS) offices and other forecasters now have the ability to compute the fields examined in this study, they can improve prediction of SELS occurrences if important signatures can be found. The fields used in this study are increasingly used operationally, though guideline or critical values have not been proposed. The small sample used in this study will not immediately change this situation, however, the methodology employed here constitutes a framework on which to build such a result in the future. As such, this effort is a pilot study on which to build a different kind of climatology, that of dynamic processes that relate to the environment in which SELS develop. Like any climatology it should be geographically and seasonally stratified. The Northeast U.S. region is used in this study, but the small number of cases precluded seasonal stratification.
The choice of variables to examine in conjunction with SELS occurrences should be based on physical considerations. Factors for deep, moist convection have been identified as:
1) sufficient low-level moisture, 2) sufficient instability of prevailing air mass, and 3) presence of a lifting mechanism in the lower troposphere.
Given that deep, moist convection can develop, additional factors that can affect SELS potential are:
1) the degree of instability, 2) presence of an elevated, lower tropospheric inversion
(lid), and 3) the nature of the vertical wind profile.
The choice of processes to examine in a SELS study should be based on these factors, on findings in previous SELS studies, and/or on theoretical considerations such as quasi-geostrophic diagnostics (e.g., omega equation). This implies that a large number of variables can justifiably be examined in conjunction with SELS occurrence.
Though most convective studies note that a combination of ingredients is needed for SELS development, many of the studies emphasize just one or a few. Lower tropospheric warm
-
Volume 20 Number I October, 1995
thermal advection was found to have played a significant role in convective cases examined by Maddox and Doswell (1982b), Johns (1984), and Schwartz et al. (1987). Low-level convergence was emphasized, among other factors , by Johns (1984), Livingston and Wilson (1986), and Heideman and Fritsch (1988); while Kloth and Davies-Jones (1980), McNulty (1978) and Whitney (1977) highlighted jet stream location and characteristics as related to convective episodes. The low to mid-level moisture field and related advection was a focus in explaining the characteristics of observed convection in the study of Conway and Carbone (1989), in the convective lid study of Graziano and Carlson (1987), and in the forecasting study of Colquhoun (1987) . A few studies have employed Q-vector diagnostics using the theory of Hoskins et al. (1978) to find the initial source of lift for convection. These include Grumm and Siebers (1988) using numerical model data and Barnes (1985) for an individual case. Barnes (1986) later found that convergent midtropospheric Q-vectors, implying large-scale forced low-level lifting, were common in the 32 convective events he studied. Characteristics of the wind profile, including wind shear, have received considerable attention in relation to severe weather occurrence especially in the studies of Brooks et al. (1994), Johns (1984), Doswell (1988), and Stone (1988) . Stability indices have long been used in diagnostic and predictive studies for convection. Of the more recent studies where stability has been a prime focus, the investigations of Stone (1988) and Davies (1988) are noteworthy. Increasingly, though, recent studies are showing the direct importance of thermodynamic instability and lower tropospheric wind shear characteristics on severe thunderstorm occurrence, especially that associated with the 'supercells' . Much of this literature is discussed in Moller et al. (1994).
The procedures used here follow that of Harnack and Quinlan (1987) to some extent, but a more comprehensive list of variables is examined and a non-SELS sample is employed for comparison. The earlier study emphasized precursor (i.e., 3-15 h prior) and concurrent (plus or minus 3 h) conditions to SELS in the Northeast U.S. Three variables: 850 and 300-mb jet streak quadrant, 500-mb vorticity advection, and four stability indices were used to assess their association with SELS. They found that 500-mb positive vorticity advection at 0000 UCT was not present for 58% of the SELS events which occurred within three hours of 0000 UCT. Mean values of the SWEAT index (222) and the Total-Totals stability index (46) prior to SELS occurrence were below the threshold levels typically quoted for severe weather, especially those for the Midwest U.S. The average Lifted Index (LI) value (-I) was the most consistent, among the stability indices, with other studies. Lowlevel (850-mb) and upper-level (300-mb) jet streak configurations were examined. The general conclusion was that the rightentrance region of the 300-mb jet (54% of total cases) and the left-entrance region of the 850-mb jet (38% of total cases) are the most favorable quadrants for placement of severe convection. The majority (71 %) of severe weather occurred to the right of the 300-mb jet axis and to the left of the 850-mb jet axis (73%). Tornadoes occurred to the left of the 850-mb jet axis 80% of the time while 60% occurred to the right of the 300-mb jet axis.
While synoptic pattern (climatological) studies of the SELS environment have contributed significantly to SELS forecasting (e.g., Johns 1984; Miller 1972; David 1977; Doswell 1980), values of many important variables, such as advections and divergence, coincident to SELS occurrence are lacking. The current study is motivated by the fact that previous studies of SELS which employed a wide range of kinematic and dynamic
3
fields have, for the most part, been case studies. An exception to this is the study of Giordano and Fritsch (1991), which includes a comparison between selected environmental conditions (mainly pressure, temperature, moisture, wind/wind shear, and synoptic positioning) for strong tornadoes and flash flood producing rainstorms. The main differences reported between the two samples is that low-level moisture is greater for the rainstorms, and low-level wind shear and upper-level wind speeds are greater for the tornado cases. The sample used for their study consisted of events occurring at widely varying time lags from upper-air sounding times. This has the advantage of increasing the sample size but introduces an important inhomogeneity into the sample of cases.
The present study narrows the convective events to a threehour time period at the expense of having a much larger sample drawn from the period used. An important objective of this pilot study is to start a more systematic examination of some important large-scale kinematic/dynamic processes near the time of SELS occurrence. In particular it is desirable to compare aggregate values and frequencies of variables for SELS cases to those for non-SELS to see if there are important differences between the two samples.
Mandatory level data from 850, 700, 500, 300, 250, and 200 mb are used to generate many kinematic/dynamic fields. The procedures that are followed, especially the use of only upperair mandatory level data, meant that important boundary-layer processes are neglected. These processes are apt to contribute to most SELS occurrences and to be dominant in some. However, to the extent that forecasters use upper-air pressure level data to assess SELS potential, the results obtained may be useful as augmentation to surface or vertical profile based studies.
2. Methodology
Upper-air data for 27 stations in the Eastern U.S. are collected (Fig. 1). The dates used (24) for the SELS sample are selected using the publication Storm Data (National Climatic Data Center 1979-1986). These days span the years 1979-1986. The domain used for this study includes all or part of the following
Fig. 1. Upper-air stations used.
4
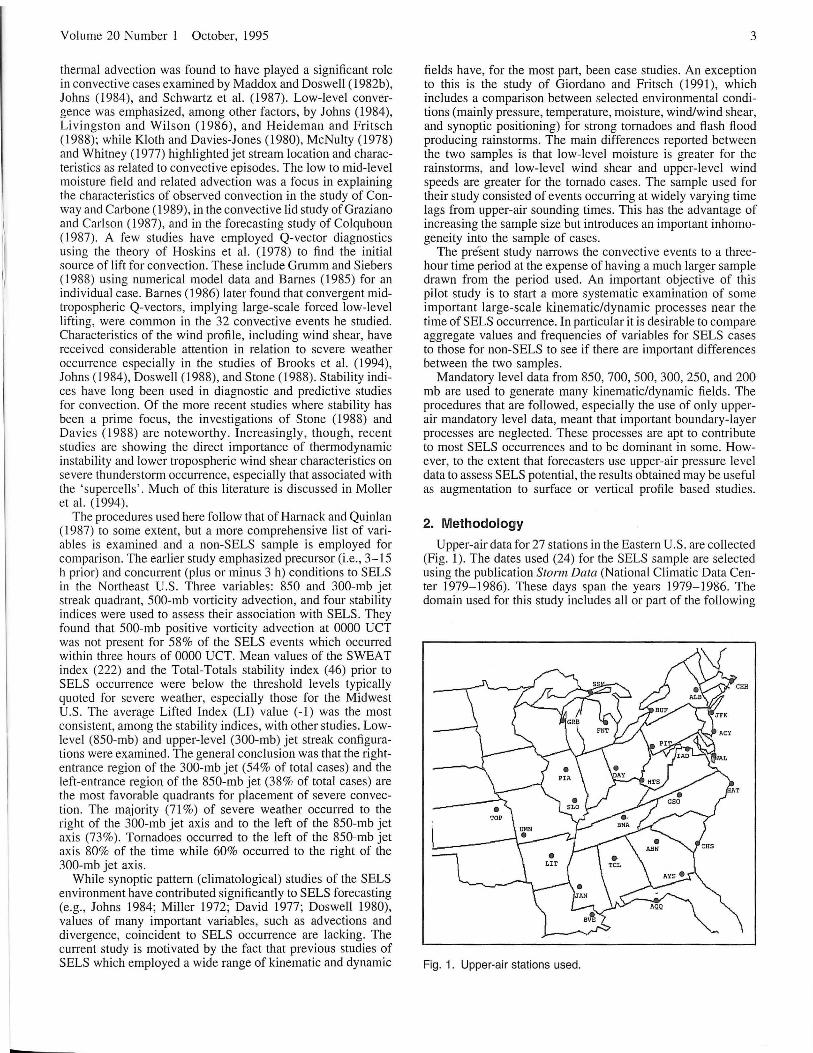
Fig. 2. Domain of study (hatched area).
states: Maryland, Pennsylvania, Delaware, New Jersey, Virginia, New York, Connecticut, Rhode Island, Massachusetts, and Vermont (Fig. 2).
A case is considered for the SELS sample if all of the following criteria are met:
1) A convective event occurred in the Northeastern domain indicated and in the period 1979-86.
2) The event occurred in any month from April through October.
3) During a thunderstorm, winds> 50 kt were reported (or implied by damage) or a tornado was reported
4) The event occurred within the following time frames: 1200-1500 UTC or 0000-0300 UTC (within 3 h after regularly-scheduled upper-air soundings).
Hail days are not considered for use in this study. Previous studies indicate that conditions for hail include unique thermodynamic conditions among severe weather types, such as the height of the freezing level, which is not considered here. In the period examined, 24 defined cases are found. These are listed in Table 1.
The non-SELS cases used for comparison are selected using the following criteria:
1) There is a VIP level 3 or 4 reported in an area approximately 80 by 80 nautical miles centered on Trenton, New Jersey in the period 2230 to 0230 UTe. The manually digitized radar (MDR) data used was obtained from the Croft and Shulman (1989) study.
2) There is no VIP levelS or 6 reported in the same region and time period.
3) There are no SELS reported on the same date in the SELS domain.
4) The total non-SELS sample is limited to 24 and constrained to have a similar monthly distribution as the SELS sample. These dates are all from 1981-82 and are also shown in Table 1.
National Weather Digest
Table 1. Listing of SELS and non-SELS events constituting the two samples. Latitude (ON)/longitude (OW) location and type of SELS (W= wind, T= tornado) are shown. All nonSELS events are referenced to the same location: Trenton, New Jersey. See text for additional explanation.
SELS CASES
Date Latitude Longitude
Jun 28, 1979 Jun 30, 1979 Aug 10, 1979 Sep 29, 1979 Apr 10, 1980 Ju122, 1980 Ju131, 1980 Aug 12, 1980 Ju109, 1981 Ju127, 1981 May 02, 1982 Aug 24, 1982 Aug 09, 1983 Sep 01, 1983 Ju118, 1984 Aug 03, 1984 Aug 30, 1984 Jul 01, 1985 Ju110, 1985 Aug 08, 1985 Jun 01, 1986 Ju127, 1986 Sep 24, 1986 Sep 27, 1986
40.8 40.5 39.0 39.4 40.6 43.9 43.0 38.7 44.8 40.8 40.4 39.6 43.1 43.0 43.0 42.8 42.8 40.9 39.0 42.5 44.1 40.0 39.5 40.5
76.1 76.0 77.0 75.8 77.0 71.0 72.0 75.5 69.0 75.5 75.9 76.3 73.7 76.2 76.5 76.2 73.2 76.5 76.2 73.0 72.1 76.2 74.9 74.1
NON-SELS CASES
May 12, 1981 May 30, 1981 Jun 15, 1981 Ju102, 1981 Ju105, 1981 Ju114, 1981 Ju121 , 1981 Aug 10, 1981 Aug 12, 1981 Aug 16, 1981 Aug 29, 1981 Sep 09, 1981
Sep 13, 1981 Sep 19, 1981 Sep 28, 1981 Jun 02, 1982 Jun 05, 1982 Jun 18, 1982 Ju115, 1982 Ju121, 1982 Aug 03, 1982 Aug 12, 1982 Aug 18, 1982 Aug 21, 1982
Type
W W W W T W W W W WfT T W W W T W W WfT W W W W T W
The criteria are designed so that convective, non-severe cases would be found. The area around Trenton, New Jersey is chosen since this is approximately in the center of the study domain. The diagnostic calculations for the non-SELS cases are appropriately made and aggregated for the Trenton location.
The calculations of the various fields was done using the Upper-Air Diagnostics Program (UA) developed by Foster (1988). This program uses upper-air data from six levels (850, 700, 500, 300, 250, and 200 mb) to calculate 81 kinematic/ dynamic fields. The UA program is chosen because it is comprehensive in the number of fields calculated and most of its fields have physical significance to SELS development, many of which have been cited in the literature via case studies. This program is available at most National Weather Service offices.
There are several well publicized difficulties on the use of the standard upper-air network for this type of study, the main
Volume 20 Number 1 October, 1995
one being a sparsity of data. The data used for the calculations are from the National Weather Service network of upper-air stations. These stations are located up to 400 krn from one another. For use in the VA program the data is interpolated to a grid network in a horizontal resolution of about 120 krn which can lead to the missing of mesoscale features crucial to SELS development. Once fields are calculated, the VA program applies a smoothing feature to the fields. Again, smaller scale, low amplitude features are eliminated. Also, it is well known that even small errors in observations can lead to much larger errors in derivative fields, especially for winds. By using multiple cases, it is hoped that at least commonly-occun'ing largescale signatures in the aggregate fields will emerge despite errors and variability for individual cases. A third limitation is the use of mandatory level data only. Since SELS development are contingent upon physical processes throughout the troposphere, the calculations performed may miss them. The use of multiple days to study the large-scale severe weather environment is stressed.
Table 2 lists the fields calculated via the VA program and employed in this study. The fields include heights, temperature, mixing ratio, dew point temperature, and winds for the six mandatory levels plus advections for scalar fields. In addition, wind and moisture divergence; vorticity, vorticity advection and vertical difference of vorticity advection; plus Q-vectors and Q-vector divergence, thicknesses, vertical temperatures differences, equivalent potential temperature, and Laplacian of temperature advection are included. Many of the variables calculated in the VA program have an obvious connection to convective processes, such as temperature/moisture advection and the divergence fields. Some relate to quasi-geostrophic (QG) vertical motion forcing such as the Laplacian of temperature advection and the vertical difference of horizontal vorticity advection. Others are like a proxy for temperature, moisture, stability, or QG forcing such as thickness, equivalent potential temperature, vertical temperature differences, and vorticity advection. And still others are non-traditional measures of temperature, moisture, or vertical motion forcing. Such is the case for Q-vectors.
Q-vector diagnostics combine the effects of vorticity advection and thermal advection on vertical motion. Converging midtropospheric Q-vectors imply lower-level QG induced upward vertical motion (Durran and Snellman 1987).
The differential vorticity advection and Laplacian of temperature advection are from the fully-scaled QG omega equation which relates these fields to vertical motion. Vorticity advection at 500 mb is a traditional field for forecasters to examine, though erroneous conclusions about vertical velocity may result. Though there are good arguments for not using individual terms of the QG omega equation in assessing vertical motion, this study is not calculating vertical motion, but is rather assessing the difference between SELS and non-SELS cases over a wide range of fields. Alsb, individual terms of the omega equation and simplifications to same (e.g., vorticity advection at 500 mb) are in use operationally and have been used in published studies. Research on their reliability for forecasting severe weather in other than individual cases is sorely needed.
After the calculations are performed for each SELS case, the values for the four points (120 krn apart on a square grid) surrounding the SELS location are arithmetically averaged and saved. By this procedure the SELS location would be no farther than about 70 krn from the nearest grid point. In general, the movable VA grid is approximately centered over the SELS location before the calculations are performed. It is not feasible to place a grid point exactly over the SELS location with the
5
Table 2. Variables calculated for each case giving the type and levels (mb) considered.
temperature (850, 700, 500, 300, 250, 200) mean layer temperature (850/500, 700/300) thickness (850/700, 850/500, 700/500, 700/300) dew point (850, 700, 500) mixing ratio (850, 700 ,500) wind direction (850, 700, 500, 300, 250, 200) wind speed (850, 700, 500, 300, 250, 200) height (850, 700, 500, 300, 250, 200) temperature advection (850, 700, 500, 300, 250, 200) geostrophic temperature advection (700, 500) differentiq) temperature advection (700/500) Laplacian of temperature advection (850, 700, 500) moisture advection (850, 700, 500) moisture convergence (850, 700, 500) horizontal wind divergence (850, 700, 500, 300, 250, 200) absolute vorticity (850, 700, 500, 300, 250, 200) geostrophic absolute vorticity (700, 500) horizontal absolute vorticity advection (850, 700, 500, 300) potential vorticity (700, 500) differential absolute vorticity advection (850/700, 700/500,
500/300) equivalent potential temperature advection (850, 700) Q-vector divergence (700, 500) temperature difference (700/500) layer stability (700/500)
program employed. The SELS location for single severe weather events is placed at the location listed in Storm Data . For multiple severe events in close spatial (within 75 krn) and temporal (within 3 h) proximity, which constituted a single case, the SELS location is interpolated to the approximate centroid of the occurrences. For the non-SELS sample, Trenton, New Jersey (as discussed earlier) is the reference point for all calculations.
The next step in the procedure is comparing the calculations for the two samples and performing significance testing, following Panofsky and Brier (1968). The mean and standard deviation for the 24 SELS and 24 non-SELS cases are computed for each of the VA program variables. The t-statistic is calculated for each variable using 23 degrees offreedom. The null hypothesis is: for each variable there is no difference between the SELS and non-SELS sample means. The computed t-statistic is compared to the t-distribution value appropriate to reject this hypothesis with 90, 95, 98, and 99 percent confidence (corresponding to 10, 5, 2, and 1 percent significance levels).
3. Results
Selected results are shown in two ways. First, the results of the significance testing is shown in table form for those variables in which a significant difference for the means is found between the SELS and non-SELS samples. Second, for some of these variables histograms are presented so that the 24-member sample frequency distributions may be compared. Composite maps are not shown since they, in general, tend to smooth out features in the fields of individual cases due to the spatial variability present between cases.
Table 3 shows the list of variables for which there is a significant difference (10 percent level or better) between SELS and non-SELS sample means. The sample means and standard

I
L
6 National Weather Digest
Table 3. Listing of those variables in which there is a statistically significant difference, at the ten percent level or better, in sample means between the SELS and non-SELS groups. A standard t-test is used with 23 degrees of freedom.
Level(mb) Variable mean 850 temperature (C) 16.2 850 dew point (C) 9.7 850 mixing ratio (g kg - ') 9.6 850 Lapl. of temp. adv.
(10- 2 C m-2 h- ') -5.1 850 moisture convergence
(g kg - ' h- ' x 10) 9.2 850 moisture advection
(g kg - ' h-' x 10) 6.4 850 absolute vorticity
(10 - 4 s-') 9.1 850 equiv. pot. temp. adv.
(C h-') 2.5 700 horizontal wind div.
(10 - 5 s - ') -4.8 700 abs.vort. (10- 4 s - ') 8.5 700 mixing ratio (g kg - ') 5.3 700/500 temp. diff. (C) 15.7 700 geost. temp. adv.
(10- 2 C h-') .1 700 geost. vort. (10-4 s-') 9.2 500 abs. vort. (10 - 4 s - ') 8.3 500 Lapl. of temp. adv.
(10 - 2 C m- 2 h- ') 1.8 500/300 differential abs. vort. adv.
(10- 4 S - 2) -2.0 300 wind spd. (m s - ') 18.4 250 wind spd . (m s-') 19.5 200 wind spd. (m s - ') 21.4 200 horizontal wind div.
(10- 5 s-') -5.0
deviations along with the lowest (best) significance level passed are shown. The overall result is that the vast majority of variables tested did not have significant sample differences, since only 21 of the total of 81 variables are significant at the ten percent level or better. Of the total of 21 listed, the direction of the difference between the two sample means is in the expected sense (or a least not in an unexpected sense) for 9 of them based on physical considerations and prior studies. This includes higher lower-tropospheric temperature indications (850-mb temperature, 850-mb equivalent potential temperature advection and 700-mb geostrophic temperature advection) , larger moisture advection indication (850-moisture advection, 850-mb moisture convergence), drier 700-mb mixing ratio, a larger lapse rate (700/500-mb temperature difference), and a more negative 700-mb divergence (i.e., convergence) for the SELS sample. Surprising significant differences are found for 850-mb dew point and mixing ratio, since the SELS sample mean indicates drier conditions compared to the non-SELS sample. A hint of this possibility is suggested by the Giordano and Fritsch (1991) study which showed drier conditions in the 850-700 mb layer for the strong tornado cases. Since the 850-mb equivalent potential temperature advection is significantly higher for the SELS sample, the parcel buoyancy is likely to be increasing in the SELS environment. The 200-mb wind divergence variable has significant sample differences, however surprisingly the non-SELS mean indicates "divergence" while the SELS mean shows "convergence". This is unexpected and
SELS NON-SELS
Std. dev. mean Std. dev. Sig. level
2.8 14.3 2.3 2 5.1 13.1 3.2 2 2.3 11.8 2.1 1
26.2 11.4 5.1
31.5 -1 0.1 42.5 10
13.1 -3.3 11.1 2
1.8 9.9 1.0 10
5.1 -1.1 5.2 5
6.6 -.5 9.7 10 1.7 9.4 .9 5 1.6 6.5 1.9 5 1.2 14.9 1.1 5
.3 0.0 .2 10
.2 9.5 .1 1 1.5 9.6 1.1 1
5.6 - .5 1.6 10
14.6 5.1 12.4 10 8.8 24.9 9.7 5 9.8 27.9 10.9 1 9.7 29.3 11 .2 2
19.4 5.0 12.4 5
is rejected on physical grounds, at least until this result is confirmed by additional study on a larger sample. The reported result may be a statistical artifact from a combination of a modest sample size and large divergence value errors that occur even with small wind vector errors.
The Laplacian of temperature advection at 850 mb, which is one of the two important terms of the QG-omega equation, is significantly lower (and is negative) for the SELS sample, indicating a contribution toward sinking motion on the largescale. At 500 mb the SELS sample has a positive value for the Laplacian of temperature advection, and it is significantly higher than for the non-SELS sample. These results are suspicious and need to be confirmed by additional study.
An interesting result is that four vorticity variables passed significance testing (850, 700 and 500-mb absolute vorticity, and 700-mb geostrophic vorticity), with the mean vorticity being lower for the SELS sample in each instance. This is a bit puzzling, but perhaps the reason is that SELS events in the Northeast U.S. during summer (21 of the 24 cases are from June-August) tend to occur downstream from long-wave ridges . If true, the vorticity values would tend to be lower even though the SELS events are associated with mid-tropospheric shortwave vorticity maxima. The study of Giordano and Fritsch (1991), which indicated a high percentage of Northeast summer SELS events associated with mid-tropospheric west to northwest flow, implies this possibility. The 500-300 mb vorticity advection difference is also significant, with the SELS sample
Volume 20 Number 1 October, 1995
having a mean negative value, while the non-SELS mean value is positive. The former value implies a contribution toward large-scale sinking motion while the latter implies a contribution toward rising motion. It is noted that the standard deviations are quite large and that the implications apply to the upper troposphere. Nevertheless, the findings are a bit surprising.
Three of the significant variables involve upper-tropospheric wind speed (at 300, 250, 200 mb). In each instance the SELS sample means are lower than those for the non-SELS sample, a result which seems contrary to other studies on the severe convective environment. Inspection of composite isotach and wind vector maps (not shown) using a moving 'origin' for each level and sample shows that there is cyclonic shear over the reference point for both samples but it is much larger for the SELS sample. Also, the reference point (SELS location for the SELS sample) is located in the theoretically 'divergent' rightrear quadrant of a quasi-straight west-southwesterly oriented jet streak for the SELS sample composite. For the non-SELS sample composite the reference point (Trenton, New Jersey) is in advance of a more distinctive trough, but a distinctive jet streak is lacking. The implication is that SELS cases are more likely to occur when and where upper-tropospheric divergence is strongly implied in conjunction with a propagating jet streak on a nearly straight jet axis, with SELS occurrence preferentially favored in the right-rear quadrant of the jet streak. As mentioned earlier, calculated upper-tropospheric divergence values are similar at 300 and 250 mb for the two samples, but the SELS sample had slightly negative divergence (i.e., convergence) at 200 mb. We speculate that the apparent lack of consistency in divergence indications is due to the large sensitivity of divergence calculations to wind observation errors especially for lower wind speeds of summer so that a better indication of wind divergence is synoptic positioning rather than the calculations from gridded wind values.
Histograms of the frequency distribution for the SELS and non-SELS samples are made for each environmental variable. Only a small subset of the 21 'significant' variables are shown. As Table 3 suggests, the absolute difference between sample means is generally small even when statistical significance is achieved. However, a few of the variables have interesting frequency distribution differences between the two samples,
# of cases
15-
o SELS
~ NON SELS
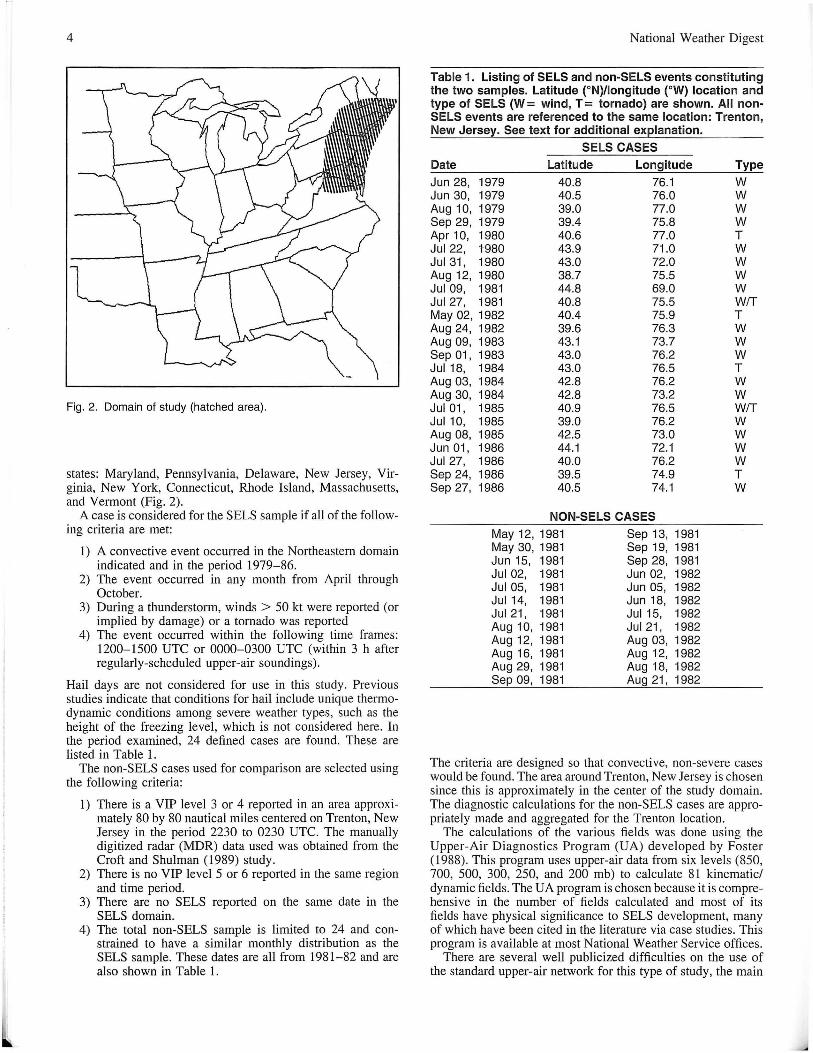
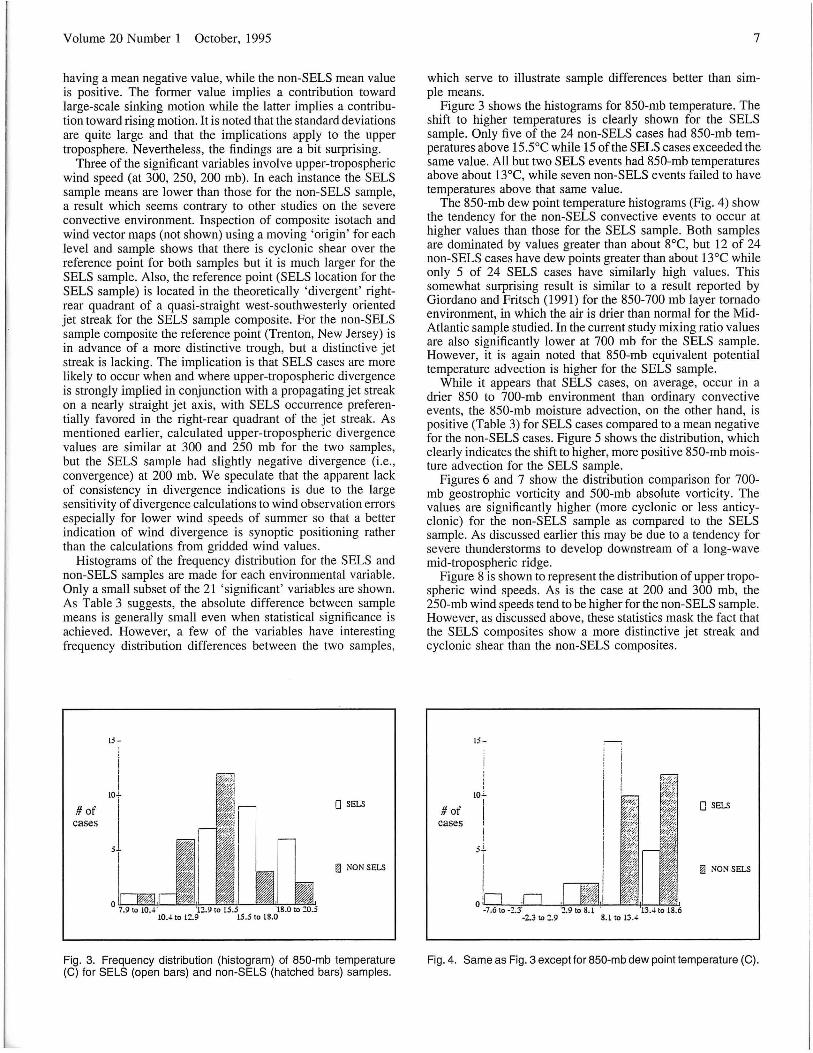
Fig. 3. Frequency distribution (histogram) of 850-mb temperature (C) for SELS (open bars) and non-SELS (hatched bars) samples.
7
which serve to illustrate sample differences better than simple means.
Figure 3 shows the histograms for 850-mb temperature. The shift to higher temperatures is clearly shown for the SELS sample. Only five of the 24 non-SELS cases had 850-mb temperatures above 15.5°e while 15 of the SELS cases exceeded the same value. All but two SELS events had 850-mb temperatures above about l3oe, while seven non-SELS events failed to have temperatures above that same value.
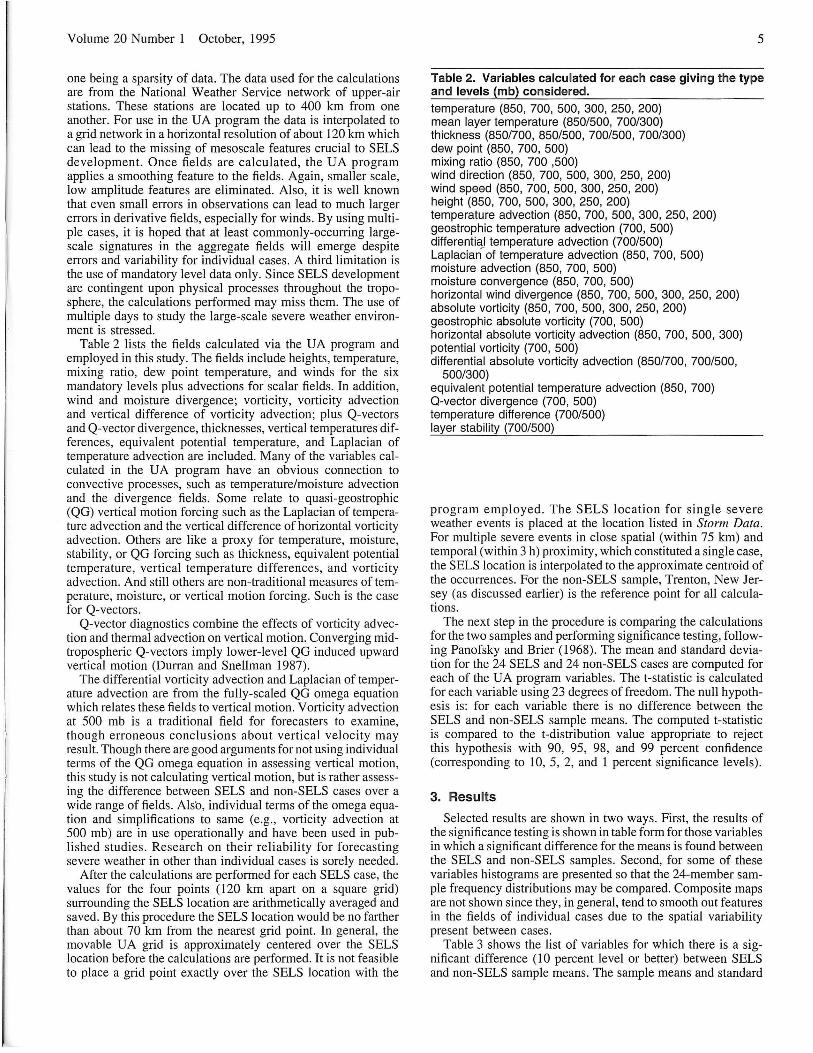
The 850-mb dew point temperature histograms (Fig. 4) show the tendency for the non-SELS convective events to occur at higher values than those for the SELS sample. Both samples are dominated by values greater than about 8°C, but 12 of 24 non-SELS cases have dew points greater than about l30e while only 5 of 24 SELS cases have similarly high values. This somewhat surprising result is similar to a result reported by Giordano and Fritsch (1991) for the 850-700 mb layer tornado environment, in which the air is drier than normal for the MidAtlantic sample studied. In the current study mixing ratio values are also significantly lower at 700 mb for the SELS sample. However, it is again noted that 850-mb equivalent potential temperature advection is higher for the SELS sample.
While it appears that SELS cases, on average, occur in a drier 850 to 700-mb environment than ordinary convective events, the 850-mb moisture advection, on the other hand, is positive (Table 3) for SELS cases compared to a mean negative for the non-SELS cases. Figure 5 shows the distribution, which clearly indicates the shift to higher, more positive 850-mb moisture advection for the SELS sample.
Figures 6 and 7 show the distribution comparison for 700-mb geostrophic vorticity and 500-mb absolute vorticity. The values are significantly higher (more cyclonic or less anticyclonic) for the non-SELS sample as compared to the SELS sample. As discussed earlier this may be due to a tendency for severe thunderstorms to develop downstream of a long-wave mid-tropospheric ridge.
Figure 8 is shown to represent the distribution of upper tropospheric wind speeds. As is the case at 200 and 300 mb, the 250-mb wind speeds tend to be higher for the non-SELS sample. However, as discussed above, these statistics mask the fact that the SELS composites show a more distinctive jet streak and cyclonic shear than the non-SELS composites.
1.5-
1O.i..
# of I o SELS
cases j
! 5~
~ NON SELS
-2.3 to :.9 8.1 to 13A
Fig. 4. Same as Fig. 3 except for 850-mb dew point temperature (C).

8
# of cases
o SELS
III NON SELS
Fig. 5. Same as Fig. 3 except for 850-mb moisture (mixing ratio) advection (g kg·1 h·1 X 10).
# of cases
6.7 to 8.0
o SELS
~ NON SELS
9.3 to 10.6
Fig. 7. Same as Fig. 3 except for 500-mb absolute vorticity (10.4 s·1).
4. Conclusion and Discussion
An important objective of this study is to start a more systematic study of the large-scale upper-level environment, including use of some dynamiclkinematic variables, in place just prior to severe weather occurrence in coastal portions of the Northeastern United States. By comparing mean values of upperlevel variables for severe weather cases to those for non-severe convective cases the variables which may be most important for producing/predicting the former are identified. Considering that mostly 'weak' SELS cases are included (six tornado cases of F1 and F2 intensity and 18 cases with implied wind gusts mostly less than 50 m S·I) and that comparisons are being made with other convective cases, it is by no means certain that any significant differences would be found between samples. However, 21 of 81 variables tested had significant differences at the ten percent level or better using a standard t-test.
The most important differences found in this study are that the lower-tropospheric SELS environment is warmer, drier, and more convergent; the mid-troposphere is more unstable, but less cyclonic; and the upper-troposphere has weaker flow as compared to the non-SELS convective environment. Based on
# of cases
National Weather Digest
o SELS
!1l NON SELS
Fig . 6. Same as Fig. 3 except for 700-mb geostrophic vorticity (10.4 s·1).
#of cases
14.7" 24.3
o SELS
Ii:l NON SELS
33.8 "43.4
Fig. 8. Same as Fig. 3 except for 250-mb wind speed (m S·1).
physical considerations and other reported studies these differences are not surprising except for the finding of significantly weaker flow in the upper-troposphere for the SELS sample. This aspect will be investigated further in the future to determine if the result is simply sample specific or if lower wind speeds are a marker for some other characteristic of the SELS synoptic environment.
The finding of drier conditions at 850 mb yet larger moisture and equivalent potential temperature advection for the SELS sample is interesting and implies that the lower-tropospheric environment is moistening just prior to SELS occurrence. It is again noted that the Giordano and Fritsch (1991) study involving the strong tornado environment showed drier than normal lower-tropospheric conditions. They did not calculate advections.
Variables related more to dynamic lifting such as vorticity advection and temperature advection (and derivatives of same) generally did not show significant sample differences, but in the three instances where there were significant differences, the difference in implied QG-forced lifting favored the non-SELS sample (e.g., 500-300 mb vorticity advection difference) for

Volume 20 Number 1 October, 1995
at least two of them. In addition, Q-vector divergence is not significantly different between samples, therefore, no obvious conclusion regarding large-scale dynamic lift, as a severe weather discriminator, can be made. Likewise calculated uppertropospheric divergence is not larger for the SELS sample, since the non-SELS sample had significantly larger divergence at 200 mb.
H should be noted that, overall, the absolute differences between sample means is not large, even for variables passing the t-test, while standard deviations are often large. Taken together this indicates that the frequency distribution has a large overlap between the two samples for most variables and that there is large case to case variability.
As a pilot study using a somewhat different kind of methodology for studying the severe convective storm environment and employing variables such as those involving advections and divergences, it succeeds in showing a new way to identify possible critical differences in the SELS environment that may be useful to the forecaster or to the SELS researcher. The principal short comings of the study are the relatively small sample sizes used (24), the use of only mandatory upper-level data, and the lack of use of wind shear statistics and extensive thermodynamic indices.
Plans are underway to expand the study to a larger number of cases, different geographical regions, incorporate data from the boundary layer as well as from between mandatory levels, and incorporate shear/thermodynamic variables while still employing the dual sample approach used here as well as the use of dynamically oriented variables.
Acknowledgments
The authors thank Jim Hayes and Michael Ehrenberg for assistance in data gathering for this study. In addition, the authors would like to thank the following individuals for reviewing this manuscript and suggesting modifications: Michael Cammarata and Donald Baker. This research is conducted under the auspices of the New Jersey Agricultural Experiment Station, who supplies overhead and salary compensation to the principal author.
Authors
Robert Harnack received his B.S. degree from Rutgers University (197 I), a M.S . from the University of Maryland (1973), and a Ph.D. from the University of Maryland (1976). All degrees are in meteorology . He is currently Professor of Meteorology at Rutgers University, where he has been on the faculty since 1975. He teaches six meteorology courses per year and conducts research in synoptic and mesoscale climatology.
Joseph (Rob) Cermak received his B.S . degree in meteorology from Rutgers University (1992) where he presently works as a Teaching Assistant and Programming Assistant while completing requirements for the M.S . degree in meteorology. His primary interest is in convective storm research.
References
Barnes, S. L., 1985: Omega diagnostics as a supplement to LFM/ MOS guidance in weakly forced convective situations. Man. Wea. Rev. , 113, 2122-2139.
_____ , 1986: Analysis of quasi-geostrophic forcing during the AIMCS Project, NOAA Tech. Memo, ERL ESG-27, 31 pp. [Available from NOAA Environmental Research Laboratory, Boulder, Co.]
9
Brooks, H. E., C. A. Doswell III, and R. B. Wilhelmson, 1994: The role of mid-tropospheric winds in the evolution and maintenance of low-level mesocyclones. Mon. Wea. Rev., 122, 126-136.
Colquhoun, J. R., 1987: A decision tree method of forecasting thunderstorms, severe thunderstOIIDs and tornadoes. Wea. Forecasting, 2, 337-350.
Conway, J. W., and R. E. Carbone, 1989: The generation and propagation of a nocturnal squall line part I: observations and implications for mesoscale predictability. Mon. Wea. Rev., 118, 26-48.
Croft, P. J., and M. D. Shulman, 1989: A five-year radar climatology of convective precipitation for New Jersey. Int. 1. Climate, 9,581-600.
David, C. L., 1977: A study of upper air parameters at the time of tornadoes. Mon. Wea. Rev., 104, 540-545.
Davies, J. , 1988: The surface Cross Totals Index: An alternative for diagnosing instability using hourly sLllface data. Natl. Wea. Dig., 13:4, 16-22.
Doswell, C. A., III, 1980: Synoptic-scale environments associated with high plains severe thunderstorms. Bull. Amer. Meteor. Soc., 61 , 1388-1400.
_____ , 1988: On the use of hodographs-vertical wind profile information in severe storms forecasting. NOAA Tech. Memo. NWS NSSFC-14, 18pp. [Available from National Severe Storms Forecast Center, Kansas City, MO.]
DUITan, D. R., and L. W. Snellman, 1987: The diagnosis of synoptic-scale vertical motion in an operational environment. Wea. Forecasting , 2, 17-31.
Foster, M. J., 1988: Upper-air analyses and quasi-geostrophic diagnostics for personal computers. Unpublished Tech. Memo., 35pp. [Available from Scientific Services Division, Southern Region, National Weather Service, Fort Worth, TX.]
Giordano, L. A. , and 1. M. Fritsch, 1991: Strong tornadoes and flash-flood-producing rainstorms during the warm season in the Mid-Atlantic region. Bull. Amer. Meteor. Soc., 6, 437-455.
Graziano, R. H., and T. N. Carlson, 1987: A statistical evaluation of lid strength on deep convection. Wea. Forecasting, 2, 127-135.
Grumm, R. H. , and A. L. Siebers, 1988: Operational Q-vector analysis for heavy precipitation forecasting. 1. Appl. Meteor., 28, 216-241.
Harnack, R. P., and 1. S. Quinlan, 1987: Association of jet streaks and vorticity advection pattern with severe thunderstorms in the Northeastern United States. Natl. Wea. Dig., 14:1, 5-12.
Heideman, K. F., and J. M. Fritsch, 1988: Forcing mechanisms and other characteristics of significant summertime precipitation. Wea. Forecasting, 3, 115-129.
Hoskins, B. J. , I. Draghici, and H. C. Davies, 1978: A new look at the omega-equation. Quart. 1. Roy. Meteor. Soc., 104, 31-38.
Johns, R. H. , 1984: A synoptic climatology of northwest-flow severe weather outbreaks. Part II: Meteorological parameters and synoptic patterns. Mon. Wea. Rev. , 109, 460-471.
Kloth, C. M., and R. P. Davies-Jones, 1980: The relationship of the 300-mb jet stream to tornado occurrence. NOAA Tech. Memo ERL NSSL-88, 62 pp. [Available from NSSL, 1313 Halley Cir., Norman, OK.]
Livingston, R. L., and L. F. Wilson, 1986: Relating antecedent surface conditions to violent tornado producing thunderstorms. Proc. 12th Con! on Weather Analysis and Forecasting, 229-234. Amer. Meteor. Soc.

L
10
Maddox, R. A., and C. A Doswell III, 1982a: Forecasting severe thunderstorms: A brief consideration of some accepted techniques. Nat!. Wea. Dig., 7:2, 26-29.
----, and , 1982b: An examination of jet stream configurations, 500-mb vorticity advection and low-level thermal advection patterns during extended periods of intense convection. Mon. Wea. Rev., 109, 184-196.
McNulty, R. P., 1978: On upper tropospheric kinematics and severe weather occurrence. Mon. Wea. Rev., 106, 662-672.
Miller, R. C., 1972: Notes on analysis and severe storm forecasting procedures of the Air Force Global Weather Central. Tech. Rep. 200 (Rev.) Air Weather Service, 190 pp. [Available from AWS, Scott AFB , IL.]
Moller, A. R., C. A. Doswell III, M. P. Foster, and G. R. Woodall, 1994: The operational recognition of supercell thunderstorm environments and storm structures. Wea. Forecasting, 9, 327-347.
National Weather Digest
National Climatic Data Center, 1979-1986: Storm Data, Vols. 31-38.
Panofsky, H. A , and G. W. Brier, 1968: Some Applications of Statistics to Meteorology, The Pennsylvania State University, University Park, PA, pp. 59-64.
Schwartz, B. E. , D. M. Rodgers, and S. Hawes, 1987: The use and interpretation of numerical weather prediction model output in identifying synoptic-scale environments associated with development of mesoscale convective systems. Wea. Forecasting, 2, 50-69.
Stone, H. M. , 1988: Relationship of wind shear, buoyancy and radar tops to' severe weather. NOAA Tech. Memo. NWS ER-80, 14pp. [Available from NWS Eastern Region Headquarters, Bohemia, NY.]
Whitney, L. E , Jr., 1977: Relationship of the SUbtropical jet stream to severe local storms. Mon. Wea. Rev., 105, 398-412.
Reserve Your Copy Today at a Special NWA Member Price
The Severe Local Storm Forecasting Primer, John S. Sturtevant, Editor. Includes a comprehensive introduction to the science of Forecasting Severe Local Storms. It provides a compilation of pertinent literature. This is a must have book for anyone that has even the remotest interest in Severe Weather. This book is in such demand that the first printing is already sold out. Reserve your copy today! A long waiting list already exists. Shipping will start in late November 1995.
Key Features: • Focused on severe weather forecasting techniques and guidelines. • Field guide to forecasting severe local storm occurrence. • Survey of recent literature regarding severe thunderstorm structure, detection and forecasting. • Quick, ready reference handbook for experienced forecasters, and will greatly benefit new forecasters whose
knowledge of severe thunderstorm structure and forecasting may be quite limited.
1995/c. This soft-cover text has 220 printed pages, 65 illustrations and a 22 page bibliography. P r ice: $ 40.00 US; NWA members $ 34.00 US. Prices include shipping within US. Send prepaid orders to: Attn: TSLSFP, Weather Scratch Meteorological Services, 140 South Kirkman Street, Florence, AL 35630-4312. Make US checks or money orders payable to: Weather Scratch. Visa and Mastercard orders add card number, expiration date and an additional $l.75 US per book. Please allow 4-6 weeks for delivery after 1 December 1995.