Antagonism between Bacteriostatic and Bactericidal ...aac.asm.org/content/58/8/4573.full.pdf ·...
10
Antagonism between Bacteriostatic and Bactericidal Antibiotics Is Prevalent Paolo S. Ocampo, a,c Viktória Lázár, b Balázs Papp, b Markus Arnoldini, c,d Pia Abel zur Wiesch, e Róbert Busa-Fekete, f Gergely Fekete, b Csaba Pál, b Martin Ackermann, c,d Sebastian Bonhoeffer a Institute of Integrative Biology, ETH Zürich, Zürich, Switzerland a ; Synthetic and Systems Biology Unit, Biological Research Centre, Hungarian Academy of Sciences, Szeged, Hungary b ; Department of Environmental Microbiology, Eawag, Dübendorf, Switzerland c ; Institute of Biogeochemistry and Pollutant Dynamics, ETH Zürich, Zürich, Switzerland d ; Division of Global Health Equity, Brigham and Women’s Hospital/Harvard Medical School, Boston, Massachusetts, USA e ; Linear Accelerator Laboratory, University of Paris-Sud, CNRS, Orsay, France f Combination therapy is rarely used to counter the evolution of resistance in bacterial infections. Expansion of the use of combi- nation therapy requires knowledge of how drugs interact at inhibitory concentrations. More than 50 years ago, it was noted that, if bactericidal drugs are most potent with actively dividing cells, then the inhibition of growth induced by a bacteriostatic drug should result in an overall reduction of efficacy when the drug is used in combination with a bactericidal drug. Our goal here was to investigate this hypothesis systematically. We first constructed time-kill curves using five different antibiotics at clinically rel- evant concentrations, and we observed antagonism between bactericidal and bacteriostatic drugs. We extended our investigation by performing a screen of pairwise combinations of 21 different antibiotics at subinhibitory concentrations, and we found that strong antagonistic interactions were enriched significantly among combinations of bacteriostatic and bactericidal drugs. Fi- nally, since our hypothesis relies on phenotypic effects produced by different drug classes, we recreated these experiments in a microfluidic device and performed time-lapse microscopy to directly observe and quantify the growth and division of individual cells with controlled antibiotic concentrations. While our single-cell observations supported the antagonism between bacterio- static and bactericidal drugs, they revealed an unexpected variety of cellular responses to antagonistic drug combinations, sug- gesting that multiple mechanisms underlie the interactions. T he problem of antibiotic resistance requires a solution that relies on more than just the development of new drugs. Patho- gens have been unrelenting in evolving mechanisms by which to survive in the face of every drug put on the market. Combination therapy, i.e., the concurrent application of two or more antibiot- ics, provides an appealing approach that demands closer assess- ment as a tool to combat this problem. In the treatment of impor- tant infectious diseases such as HIV infection, tuberculosis, and malaria, combination therapy has become the standard approach precisely to delay the evolution of drug resistance (1–4). In con- trast, for common acute bacterial infections, combinations of drugs are prescribed in only a very limited number of cases and with a different rationale (5). In those specific instances, two drugs are prescribed for their synergistic effects, that is, for the fact that their combined effects exceed the sum of their individual effects. Drug synergy has been demonstrated to result in more-efficient clearance of infections and to achieve clearance at lower drug con- centrations (6). Examples of such cases include fusidic acid and rifampin for the treatment of methicillin-resistant Staphylococcus aureus infections and trimethoprim and sulfamethoxazole for the treatment of otitis media (7, 8). Furthermore, recent theoretical work indicates that synergistic drugs can prevent treatment failure even when bacteria resistant to one of the drugs are present at the beginning of therapy (9). Just as synergy can be exploited to improve treatment, it is necessary to avoid combinations of drugs that inhibit each other and may prolong infections. Antagonism, when a drug hinders the effect of another drug, was reported early in the history of antibi- otics and continues to function as a warning against indeterminate treatment (10). In a study of patients with pneumococcal menin- gitis, 30% of those treated with penicillin alone failed treatment and died, while 79% of comparable patients who were treated with the same dosage of penicillin plus chlortetracycline, an antibiotic that antagonizes penicillin, died (11, 12). Despite these findings, an increasing number of laboratory studies indicate that antagonistic drug combinations merit more investigation as clinical options (13). Recent work in this area suggests that the different types of interactions have significant effects on the selection and maintenance of drug resistance muta- tions. Using a direct competition experiment, Chait and col- leagues demonstrated how a hyperantagonistic drug combination was able to select against a bacterial population resistant to one of the drugs and instead favored the completely sensitive wild type (14). Furthermore, the rate of adaptation of laboratory bacteria to multiple drugs has been shown to correlate with the degree of synergism between individual antibiotics (15). Although antago- nistic drug combinations are currently eschewed in clinical set- tings, these studies suggest that antagonism between antibiotics may aid in devising treatment strategies specifically aimed at de- laying the emergence of resistance. Received 5 February 2014 Returned for modification 15 April 2014 Accepted 21 May 2014 Published ahead of print 27 May 2014 Address correspondence to Paolo S. Ocampo, [email protected]. C. Pál, M. Ackermann, and S. Bonhoeffer contributed equally to this article. Supplemental material for this article may be found at http://dx.doi.org/10.1128 /AAC.02463-14. Copyright © 2014, American Society for Microbiology. All Rights Reserved. doi:10.1128/AAC.02463-14 August 2014 Volume 58 Number 8 Antimicrobial Agents and Chemotherapy p. 4573– 4582 aac.asm.org 4573 on July 6, 2018 by guest http://aac.asm.org/ Downloaded from
Transcript of Antagonism between Bacteriostatic and Bactericidal ...aac.asm.org/content/58/8/4573.full.pdf ·...
Antagonism between Bacteriostatic and Bactericidal Antibiotics IsPrevalent
Paolo S. Ocampo,a,c Viktória Lázár,b Balázs Papp,b Markus Arnoldini,c,d Pia Abel zur Wiesch,e Róbert Busa-Fekete,f Gergely Fekete,b
Csaba Pál,b Martin Ackermann,c,d Sebastian Bonhoeffera
Institute of Integrative Biology, ETH Zürich, Zürich, Switzerlanda; Synthetic and Systems Biology Unit, Biological Research Centre, Hungarian Academy of Sciences, Szeged,Hungaryb; Department of Environmental Microbiology, Eawag, Dübendorf, Switzerlandc; Institute of Biogeochemistry and Pollutant Dynamics, ETH Zürich, Zürich,Switzerlandd; Division of Global Health Equity, Brigham and Women’s Hospital/Harvard Medical School, Boston, Massachusetts, USAe; Linear Accelerator Laboratory,University of Paris-Sud, CNRS, Orsay, Francef
Combination therapy is rarely used to counter the evolution of resistance in bacterial infections. Expansion of the use of combi-nation therapy requires knowledge of how drugs interact at inhibitory concentrations. More than 50 years ago, it was noted that,if bactericidal drugs are most potent with actively dividing cells, then the inhibition of growth induced by a bacteriostatic drugshould result in an overall reduction of efficacy when the drug is used in combination with a bactericidal drug. Our goal here wasto investigate this hypothesis systematically. We first constructed time-kill curves using five different antibiotics at clinically rel-evant concentrations, and we observed antagonism between bactericidal and bacteriostatic drugs. We extended our investigationby performing a screen of pairwise combinations of 21 different antibiotics at subinhibitory concentrations, and we found thatstrong antagonistic interactions were enriched significantly among combinations of bacteriostatic and bactericidal drugs. Fi-nally, since our hypothesis relies on phenotypic effects produced by different drug classes, we recreated these experiments in amicrofluidic device and performed time-lapse microscopy to directly observe and quantify the growth and division of individualcells with controlled antibiotic concentrations. While our single-cell observations supported the antagonism between bacterio-static and bactericidal drugs, they revealed an unexpected variety of cellular responses to antagonistic drug combinations, sug-gesting that multiple mechanisms underlie the interactions.
The problem of antibiotic resistance requires a solution thatrelies on more than just the development of new drugs. Patho-
gens have been unrelenting in evolving mechanisms by which tosurvive in the face of every drug put on the market. Combinationtherapy, i.e., the concurrent application of two or more antibiot-ics, provides an appealing approach that demands closer assess-ment as a tool to combat this problem. In the treatment of impor-tant infectious diseases such as HIV infection, tuberculosis, andmalaria, combination therapy has become the standard approachprecisely to delay the evolution of drug resistance (1–4). In con-trast, for common acute bacterial infections, combinations ofdrugs are prescribed in only a very limited number of cases andwith a different rationale (5). In those specific instances, two drugsare prescribed for their synergistic effects, that is, for the fact thattheir combined effects exceed the sum of their individual effects.Drug synergy has been demonstrated to result in more-efficientclearance of infections and to achieve clearance at lower drug con-centrations (6). Examples of such cases include fusidic acid andrifampin for the treatment of methicillin-resistant Staphylococcusaureus infections and trimethoprim and sulfamethoxazole for thetreatment of otitis media (7, 8). Furthermore, recent theoreticalwork indicates that synergistic drugs can prevent treatment failureeven when bacteria resistant to one of the drugs are present at thebeginning of therapy (9).
Just as synergy can be exploited to improve treatment, it isnecessary to avoid combinations of drugs that inhibit each otherand may prolong infections. Antagonism, when a drug hinders theeffect of another drug, was reported early in the history of antibi-otics and continues to function as a warning against indeterminatetreatment (10). In a study of patients with pneumococcal menin-gitis, 30% of those treated with penicillin alone failed treatment
and died, while 79% of comparable patients who were treated withthe same dosage of penicillin plus chlortetracycline, an antibioticthat antagonizes penicillin, died (11, 12).
Despite these findings, an increasing number of laboratorystudies indicate that antagonistic drug combinations merit moreinvestigation as clinical options (13). Recent work in this areasuggests that the different types of interactions have significanteffects on the selection and maintenance of drug resistance muta-tions. Using a direct competition experiment, Chait and col-leagues demonstrated how a hyperantagonistic drug combinationwas able to select against a bacterial population resistant to one ofthe drugs and instead favored the completely sensitive wild type(14). Furthermore, the rate of adaptation of laboratory bacteria tomultiple drugs has been shown to correlate with the degree ofsynergism between individual antibiotics (15). Although antago-nistic drug combinations are currently eschewed in clinical set-tings, these studies suggest that antagonism between antibioticsmay aid in devising treatment strategies specifically aimed at de-laying the emergence of resistance.
Received 5 February 2014 Returned for modification 15 April 2014Accepted 21 May 2014
Published ahead of print 27 May 2014
Address correspondence to Paolo S. Ocampo, [email protected].
C. Pál, M. Ackermann, and S. Bonhoeffer contributed equally to this article.
Supplemental material for this article may be found at http://dx.doi.org/10.1128/AAC.02463-14.
Copyright © 2014, American Society for Microbiology. All Rights Reserved.
doi:10.1128/AAC.02463-14
August 2014 Volume 58 Number 8 Antimicrobial Agents and Chemotherapy p. 4573– 4582 aac.asm.org 4573
on July 6, 2018 by guesthttp://aac.asm
.org/D
ownloaded from
In response to the slow development of new antimicrobials,there is renewed interest in old drugs that have fallen out of usedue to toxicity or drawbacks in efficacy (16). One approach thatcould be implemented to return these drugs to the clinic is to usean old drug in combination with a current drug (17). The advan-tages of synergism and the diverse nontrivial effects of antagonismwill play a central role in determining how best to implementcombination therapy in clinical settings.
In order to exploit the potential benefits of combination ther-apy, we need a better understanding of the circumstances underwhich synergism versus antagonism is expected. Determininghow a broader spectrum of drugs interact at inhibitory concentra-tions and delineating the mechanisms responsible for these effectscould allow for a more-prudent application of antibiotics thatmaintains clinical capability and does not sacrifice the future util-ity of these drugs.
In this study, we asked whether basic pharmacodynamic prop-erties of all antibiotics can help predict which pairs would result inantagonism. A widely recognized characteristic of antibiotics isthat they are either bacteriostatic and inhibit growth without kill-ing the cells or are bactericidal and result in cell killing (18). Thus,if bactericidal drugs are most potent with actively growing cells, ashypothesized more than 50 years ago (19, 20), then the inhibitionof growth induced by a bacteriostatic drug should result in a re-duction of drug efficacy. To test this hypothesis, we determinedthe types of interaction between five different drugs at inhibitoryconcentrations by estimating death rates using time-kill curves.We then extended our observations and employed screeningmethods to identify effects across pairs of 21 different drugs atsubinhibitory concentrations. Since our hypothesis relies on thedecreased antibiotic susceptibility of slowly growing cells and theability of some drugs to influence this state, we repeated our ex-periments at the level of individual cells using time-lapse micros-copy, in microfluidic devices, to investigate the cellular dynamicsunderlying combined effects of antibiotics.
MATERIALS AND METHODSHigh-throughput combination screening experiments. We selected 21antibiotics with a wide range of mechanisms of action, including drugsthat target cell wall, nucleic acid, protein, and folic acid biosynthesis (Ta-ble 1). Fresh antibiotic solutions were prepared from powder stocks on aweekly basis and were filter sterilized before use. All experiments wereconducted in Escherichia coli K-12 (BW25113) in minimal medium sup-plemented with 0.2% glucose and 0.1% Casamino Acids. Combinationscreens were performed in 384-well plates, using a liquid-handling ro-botic system (Hamilton Star workstation) to improve reproducibility.The culture volume was 50 �l. Each plate contained two different 6-by-6dose-matrix blocks (one antibiotic in combination with two other antibi-otics), with 4 replicates each. For each pair of antibiotics, we combined 6different concentrations of the agents in a serially diluted two-dimen-sional dose matrix, with dose points being centered on the 50% effectiveconcentration (EC50) for each antibiotic. The lowest concentration foreach agent was 0 and the highest was above the 90% effective concentra-tion (EC90) (Table 1). In addition to the dose-matrix blocks, each plateincluded 18 wells containing medium without antibiotics (control wells).
Antibiotic sensitivity screens were performed by growing cells over-night (optical density at 600 nm [OD600], 4) at 30°C, with shaking at 300rpm, and diluting the cells to an OD equivalent to 0.04. Next, using aliquid-handling robotic system, cells were transferred into 384-well assayplates (in the presence of antibiotics) to yield 4 � 104 cells/well. Assayplates were incubated for 18 h at 30°C, with shaking at 300 rpm. Bacterialgrowth was monitored by measuring the optical density (OD600) of theliquid cultures at a single time point. Preliminary experiments showedthat a single reading of optical density after 18 h of incubation showedstrong linear correlation with the area under the growth curve (a descrip-tor of overall inhibitory effect that covers the entire growth period) (21).Briefly, this was determined using parallel cultures of E. coli grown in ten384-well microtiter plates under previously stated conditions. Opticaldensity (OD600) was measured every hour for 24 h, and the areas under thegrowth curves were determined using custom MATLAB scripts. For anumber of different ending time points (e.g., 11, 12, and 13 h), we used alinear regression model to consider whether the last OD measurementspredicted the areas under the growth curves (384 � 10 � 3,840 datapoints). Plates were prepared as multiple (up to 6) biological replicates,
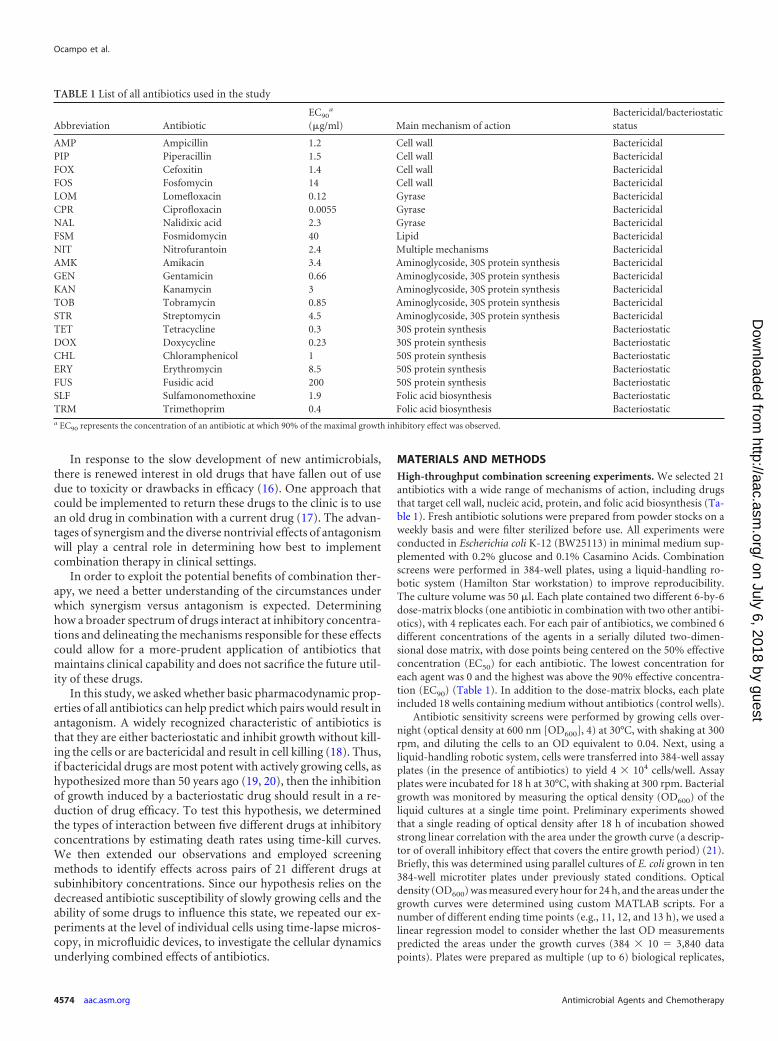
TABLE 1 List of all antibiotics used in the study
Abbreviation AntibioticEC90
a
(�g/ml) Main mechanism of actionBactericidal/bacteriostaticstatus
AMP Ampicillin 1.2 Cell wall BactericidalPIP Piperacillin 1.5 Cell wall BactericidalFOX Cefoxitin 1.4 Cell wall BactericidalFOS Fosfomycin 14 Cell wall BactericidalLOM Lomefloxacin 0.12 Gyrase BactericidalCPR Ciprofloxacin 0.0055 Gyrase BactericidalNAL Nalidixic acid 2.3 Gyrase BactericidalFSM Fosmidomycin 40 Lipid BactericidalNIT Nitrofurantoin 2.4 Multiple mechanisms BactericidalAMK Amikacin 3.4 Aminoglycoside, 30S protein synthesis BactericidalGEN Gentamicin 0.66 Aminoglycoside, 30S protein synthesis BactericidalKAN Kanamycin 3 Aminoglycoside, 30S protein synthesis BactericidalTOB Tobramycin 0.85 Aminoglycoside, 30S protein synthesis BactericidalSTR Streptomycin 4.5 Aminoglycoside, 30S protein synthesis BactericidalTET Tetracycline 0.3 30S protein synthesis BacteriostaticDOX Doxycycline 0.23 30S protein synthesis BacteriostaticCHL Chloramphenicol 1 50S protein synthesis BacteriostaticERY Erythromycin 8.5 50S protein synthesis BacteriostaticFUS Fusidic acid 200 50S protein synthesis BacteriostaticSLF Sulfamonomethoxine 1.9 Folic acid biosynthesis BacteriostaticTRM Trimethoprim 0.4 Folic acid biosynthesis Bacteriostatica EC90 represents the concentration of an antibiotic at which 90% of the maximal growth inhibitory effect was observed.
Ocampo et al.
4574 aac.asm.org Antimicrobial Agents and Chemotherapy
on July 6, 2018 by guesthttp://aac.asm
.org/D
ownloaded from
and those with quality control problems (e.g., growth in control wells wasunusually low or showed large variations or an agent failed to substantiallyinhibit growth at high concentrations or strongly inhibited growth at evenlow doses) were omitted from further analysis.
We had two reasons to study antibiotic interactions in a standardminimal medium at a relatively low temperature (30°C). First, because theculture volume in our study was 50 �l, evaporation was a potential con-cern. To minimize such a confounding effect, 30°C appeared to be anoptimal solution. Second, our experimental setting was similar to that of aprior study (22), allowing direct comparison of the results of the twostudies.
Data processing and bias correction steps. To overcome any mea-surement bias caused by within-plate inhomogeneity, we processed theraw optical density data as follows. We included 18 control wells on eachplate, containing medium without antibiotics and inoculated with E. coli.We used these wells both to set a baseline for zero inhibition and toestimate and to eliminate within-plate systematic biases. First we cali-brated OD values by applying the transformation ODcalibrated � OD �(0.40449 � OD3), to account for the nonlinear association between ODand cell density at high cell densities (parameters of the calibration for-mula were derived as in reference 23). Then we calculated relative inhibi-tion values based on the initial OD (maximum inhibition) and the averageOD of antibiotic-free control wells (maximum growth). To estimate andto eliminate within-plate spatial effects, first we fitted a linear trend to thecontrol wells to eliminate spatial gradients. Next, for the residuals, weemployed Gaussian process regression (24) to eliminate the remainingsystematic spatial biases using the control wells. Both steps for bias cor-rection were carried out in MATLAB.
Identification of interacting antibiotic pairs. Synergistic effects be-tween combinations of chemicals, resulting in increased benefits or in-creased toxicity, have important implications across the fields of biomed-icine (25, 26). Correspondingly, many approaches have been devised toquantify drug interactions (27). To assess antagonism and synergy be-tween pairs of antibiotics, we used the Loewe additivity model (28), whichassumes that a drug does not interact with itself. Geometrically, Loeweadditivity can be represented as lines of equally effective dosages (isoboles)in the two-dimensional linear concentration space for the two drugs. De-viation of the shape of the isoboles from linearity indicates either synergy(concave isoboles) or antagonism (convex isoboles). To identify interac-tions for each pair of antibiotics, first we merged data from replicate dose-matrix blocks located on the same 384-well plates. Next we fitted sigmoi-dal dose-response curves (Hill equation) to the single-agent responsesusing a maximum likelihood fitting procedure. Based on the single-agentresponse curves for the two antibiotics, we calculated the dose-responserelationship for the antibiotic combination expected with the Loewe ad-ditivity model. To quantify interactions, we determined the concavity ofthe set of isoboles inferred from the combination measurements for agiven antibiotic pair (“observed” isoboles). To achieve this, we used amathematical transformation to “bend” the linear isoboles expected un-der the Loewe additivity model to approximate most closely the observedisoboles (see the report by Cokol and colleagues for a similar approach[29]). The transformation relies on a single parameter to describe theconcavity of the observed isoboles, which we used as a measure of antibi-otic interaction. This score is zero in the absence of interaction, negativefor antagonistic pairs, and positive for synergistic pairs. Finally, interac-tion scores (B) for each antibiotic pair were calculated by taking the me-dian scores obtained from biological replicates (i.e., independent plates).
Measurement errors of interaction screens were estimated by testing 5antibiotics for interactions with themselves in multiple replicates (29).Because under Loewe additivity a drug shows no interaction with itself,deviation of the interaction score from zero provides an estimate of theexperimental error of interaction measurements. Thus, we consideredtwo antibiotics as significantly interacting when the score was significantlydifferent from the mean score for self-self antibiotic combinations. Forcalculation of EC50 values, we followed established protocols (30). EC50
refers to the concentration of drug that induces growth inhibition halfwaybetween the baseline and maximum values after the specified exposuretime.
Antibiotics and concentrations for time-kill and time-lapse micros-copy experiments. Determination of the clinical utility of exploiting dif-ferent interactions between pairs of antibiotics will require extensive test-ing across organisms, sites of infection, and the drugs used for particularinfections. In contrast, we consider our work a proof-of-principle study,and future work should confirm potential clinical implications. Althoughsome of the antibiotics we used have advanced derivatives in the clinic, thechoice of the drugs we used was based on two criteria, i.e., (i) the avail-ability of very detailed literature on the molecular mechanism of actionand (ii) the possibility for comparison with the results of an older study(22). Similarly, the antibiotic concentrations used do not reflect clinicalrecommendations. For example, although the concentration of erythro-mycin used in our time-kill and time-lapse microscopy experiments ishigher than that achievable in blood, this drug was included to illustratethe effect of antagonism between a drug at an inhibitory concentrationand a second drug at a subinhibitory concentration. Although the MIC forerythromycin in E. coli MG1655 is well above the concentration we used(500 to 1,000 �g/ml), we were interested in determining whether a sub-inhibitory concentration of this drug was sufficient to antagonize the kill-ing effect of a second drug whose concentration was above the MIC.
Time-kill curves. Determination of the MICs for the antibiotics usedin the time-kill and time-lapse microscopy studies was carried out using abroth dilution protocol similar to that recommended by the Clinical andLaboratory Standards Institute (LB medium was used instead of Mueller-Hinton broth) (31). The concentrations of the drugs used in the followingexperiments represent fractions of the MICs: 25 �g/ml streptomycin andnalidixic acid (2� MIC), 12.5 �g/ml tetracycline (0.83� MIC), 10 �g/mltrimethoprim, (0.66� MIC), and 200 �g/ml erythromycin (0.4� MIC).
Overnight cultures of E. coli MG1655 were diluted 1:10,000 into freshprewarmed LB broth and were incubated for 2 h. A further 1:2 dilutionwas performed before introduction into flasks containing either a singleantibiotic or a pair of bactericidal and bacteriostatic antibiotics. These werethen incubated at 37°C with shaking and aeration. Samples were taken at1-h intervals for up to 5 h. Cell densities for each sample were estimatedfrom colony counts by dilution in phosphate-buffered saline and platingon LB agar. Each time-kill experiment was performed twice.
Time-lapse microscopy. Specific details of the microfluidic systemused in this study, the mother machine, have been described previously(32). In brief, this device consists of 4,000 growth channels arranged atright angles against a large trench, through which growth medium ispassed. Nutrients then diffuse into the channels and flush out growingcells as they emerge from these channels. An automated microscope stageallows for the monitoring of multiple fields of view, spanning the entiredevice. This method results in the continuous observation of the growthand division of a large number of individual cells as they experience dif-ferent antibiotic-containing environments, as well as their survival ordeath after the drug has been removed.
Time-lapse microscopy experiments were conducted as follows. E. coliMG1655 cultures were grown overnight in LB broth at 37°C. On thefollowing day, 100 �l of culture was diluted in 10 ml of fresh prewarmedLB broth and then was incubated for 2 h at 37°C, with shaking. Eightmilliliters of the resulting culture was centrifuged at 10,000 rpm for 5 to 7min and resuspended in 20 �l of fresh LB broth; 10 �l of the cell suspen-sion was then injected into the mother machine, and the experiment wasinitiated when more than 80% of the channels were filled with cells viadiffusion. A syringe pump was used to pass fresh LB broth supplementedwith bovine serum albumin (BSA) and salmon sperm DNA through thedevice at a rate of 2 ml/h. BSA and salmon sperm DNA are blocking agentsthat are used to bind to the surface of the microfluidic device to preventthe formation of air bubbles and excessive adhesion of the cells to thechannels. Images were acquired from 15 to 25 fields of view at 6-minintervals by using an automated Olympus BX81 microscope with an
Antagonistic Antibiotic Interactions
August 2014 Volume 58 Number 8 aac.asm.org 4575
on July 6, 2018 by guesthttp://aac.asm
.org/D
ownloaded from
UPLFN100�O2PH/1.3 phase-contrast oil lens. Samples and the micro-scope were held at 37°C with a cube-and-box incubation system (LifeImaging Services, Reinach, Switzerland). After at least 4 h of growth in LBbroth, the medium was switched to LB broth containing BSA, salmonsperm, and either one or two antibiotics. Cells were exposed to this me-dium for at least 20 h before being switched back to fresh LB broth sup-plemented with BSA and salmon sperm DNA for up to 10 h. Each exper-iment involved fields scanned continuously for at least 30 h.
The resulting time-lapse images were then analyzed with a custom-designed plug-in for ImageJ, to provide information on cell size and divi-sion rates during the three different phases of the experiment. The firststep of the analysis consists of defining the length of the cell abutting theend of the channel. The increasing length of the growing cell over succeed-ing frames is tracked and recorded; division events are also registeredbased on cell length. Manual verification and annotation were performedafter every experiment. In this way, we were able to extract quantitativeinformation on an individual cell’s elongation and division rates. We alsotracked the proportion of cells that survived treatment exposure and wereable to divide again upon the return to an antibiotic-free environment.The occurrence of filamentation during exposure to the antibiotics eryth-romycin and nalidixic acid led to elongated cells being pulled out of theirgrowth channels during flow. For this reason, only channels containingcells that could be followed for the entirety of the experiment were con-sidered in the analysis.
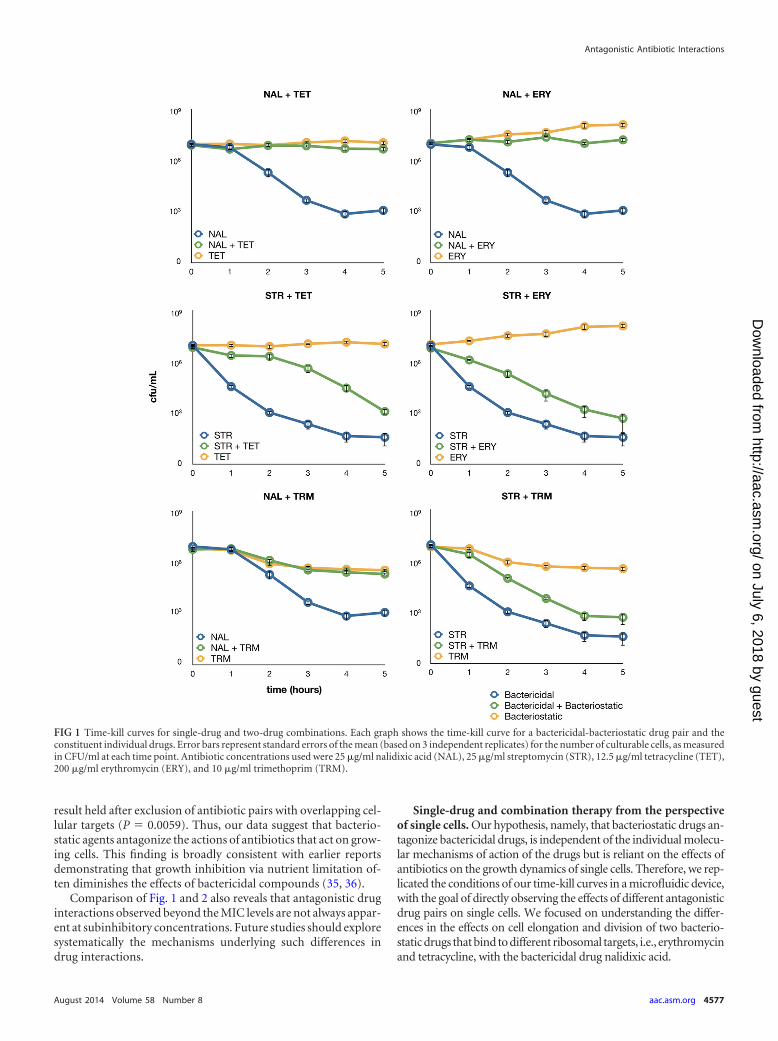
RESULTSTime-kill curves. To quantify interactions between antibiotics atclinically relevant concentrations, we measured death rates at in-hibitory drug levels based on time-kill curves. We tested everypossible bactericidal-bacteriostatic pair among five antibiotics atconcentrations above the MIC. The antibiotics used in the time-kill experiments were selected for their differing mechanisms ofaction and because, to the best of our knowledge, there are noreports of cross-resistance mutations for these drugs in E. coli.
In the presence of a bactericidal drug that alone is capable ofclearing a bacterial population, the addition of a bacteriostaticdrug resulted in a decrease in killing rates and a significant numberof survivors at the end of the experiment (Fig. 1). We also notedthat the degree of antagonism differed depending on the bacteri-cidal drug employed in the experiment. Acquisition of a resistancemutation over the course of the time-kill curve experiment couldbe a confounding effect explaining the reduced death rate ob-served in bacterial cultures treated with a bactericidal-bacterio-static pair. In order to control for this possibility, the coloniesobtained at the end of every time-kill curve experiment were rep-lica plated on antibiotic-containing plates. We found no evidencefor the evolution of single-drug or multidrug resistance in anyreplicate, to any of the drugs used in the experiment (data notshown). These time-kill curves provide confirmation that the an-tagonistic interactions found between drugs at inhibitory concen-trations manifest as decreases in the rate of killing and the pres-ence of significant proportions of sensitive bacteria at the end ofthe experiment.
Systematic exploration of interactions between bactericidaland bacteriostatic antibiotics. We expanded our observations ofinteractions between drugs to a total of 21 antibacterial com-pounds. These antibiotics cover a wide range of mechanisms ofaction, and many of them are widely employed clinically. Theirmain targets include DNA synthesis, translational machinery, andcell wall, folic acid, and lipid biosynthesis (Table 1). We systemat-ically measured the effects of all pairs of antibiotics on E. coli K-12growth rates. Specifically, for each pair of antibiotics, we com-
bined 6 different concentrations of the agents in a two-dimen-sional dose matrix, with dose points being centered on each anti-biotic’s half-maximal effective concentration (EC50). We used theLoewe additivity model to assess interactions between antibiotics(33). In contrast to other models, this model measures drug-druginteractions based on deviation from a drug-with-itself reference.According to the Loewe additivity model, if the modes of actionof two drugs are the same, then the drugs show no interaction.Lines of equal effective dosages (isoboles) are represented inthe two-dimensional linear concentration space of the twodrugs. Deviation of these lines from a linear model indicatessynergism (concave) or antagonism (convex). We introducedseveral correction steps to overcome potential measurementbiases due to plate inhomogeneity, and we also developed a rigor-ous statistical framework to assess the significance of interactions.Following a previously developed method, we quantified isoboleshapes by measuring concavity (using B interaction scores), whereB � 0 indicates independent effects of the two drugs (linearity)and B � 0 and B � 0 indicate antagonism and synergism, respec-tively (see Materials and Methods). In this work, we focus onstudying the properties of antagonistic antibiotic pairs only; syn-ergism will be studied elsewhere.
Using a statistical criterion to identify significant interactions(see Materials and Methods), we found that 61% of the 204 anti-biotic pairs showed antagonism. The reliability of our results wasconfirmed by comparison with a previous systematic drug com-bination screen performed in E. coli (22). Despite the substantialdifferences in the protocols and the underlying assumptions of themodels used in the two studies, interaction scores were well cor-related (Spearman’s rho, 0.529; P � 0.0001) and antagonistic pairsidentified in the previous study tended to have especially lowscores in our screen (Mann-Whitney U test, P � 0.0001). Further-more, our high-throughput survey correctly identified a well-characterized antagonism between ciprofloxacin and tetracycline(34).
The distribution of antagonism is highly nonrandom on themap of interactions. We compared the B scores for antibiotic in-teractions in two groups, i.e., antibiotic pairs that target the sameand different cellular subsystems. The comparison revealed that Bscores were especially low for antibiotic pairs targeting differentcellular subsystems (Mann-Whitney U test, P � 0.0001). In linewith the expectations of the Loewe model, antibiotic pairs target-ing the same cellular subsystem rarely showed strong antagonism.
More strikingly, combinations of 30S protein synthesis andcell wall biosynthesis inhibitors, 50S protein synthesis and gyraseinhibitors, and cell wall biosynthesis and folic acid synthesis in-hibitors frequently showed antagonism (P � 0.05 for each com-bination, Fisher’s exact test). A common property of these com-binations is that a bacteriostatic compound is combined with abactericidal agent. To minimize the chance of erroneous classifi-cation, we used only E. coli-specific information for bactericidal/bacteriostatic classifications (Table 1). To test more generallywhether antagonism was enriched in bacteriostatic-bactericidalcombinations, we categorized antibiotic pairs according to indi-vidual antibiotic killing properties, which led to three majorgroups, namely, bactericidal-bactericidal, bactericidal-bacterio-static, and bacteriostatic-bacteriostatic pairs. Strikingly, we foundthat antibiotic pairs with exceptionally low B interaction scores,denoting a high degree of antagonism, were nearly always bacte-ricidal-bacteriostatic (P � 0.0016, Fisher’s exact test) (Fig. 2). This
Ocampo et al.
4576 aac.asm.org Antimicrobial Agents and Chemotherapy
on July 6, 2018 by guesthttp://aac.asm
.org/D
ownloaded from
result held after exclusion of antibiotic pairs with overlapping cel-lular targets (P � 0.0059). Thus, our data suggest that bacterio-static agents antagonize the actions of antibiotics that act on grow-ing cells. This finding is broadly consistent with earlier reportsdemonstrating that growth inhibition via nutrient limitation of-ten diminishes the effects of bactericidal compounds (35, 36).
Comparison of Fig. 1 and 2 also reveals that antagonistic druginteractions observed beyond the MIC levels are not always appar-ent at subinhibitory concentrations. Future studies should exploresystematically the mechanisms underlying such differences indrug interactions.
Single-drug and combination therapy from the perspectiveof single cells. Our hypothesis, namely, that bacteriostatic drugs an-tagonize bactericidal drugs, is independent of the individual molecu-lar mechanisms of action of the drugs but is reliant on the effects ofantibiotics on the growth dynamics of single cells. Therefore, we rep-licated the conditions of our time-kill curves in a microfluidic device,with the goal of directly observing the effects of different antagonisticdrug pairs on single cells. We focused on understanding the differ-ences in the effects on cell elongation and division of two bacterio-static drugs that bind to different ribosomal targets, i.e., erythromycinand tetracycline, with the bactericidal drug nalidixic acid.
FIG 1 Time-kill curves for single-drug and two-drug combinations. Each graph shows the time-kill curve for a bactericidal-bacteriostatic drug pair and theconstituent individual drugs. Error bars represent standard errors of the mean (based on 3 independent replicates) for the number of culturable cells, as measuredin CFU/ml at each time point. Antibiotic concentrations used were 25 �g/ml nalidixic acid (NAL), 25 �g/ml streptomycin (STR), 12.5 �g/ml tetracycline (TET),200 �g/ml erythromycin (ERY), and 10 �g/ml trimethoprim (TRM).
Antagonistic Antibiotic Interactions
August 2014 Volume 58 Number 8 aac.asm.org 4577
on July 6, 2018 by guesthttp://aac.asm
.org/D
ownloaded from
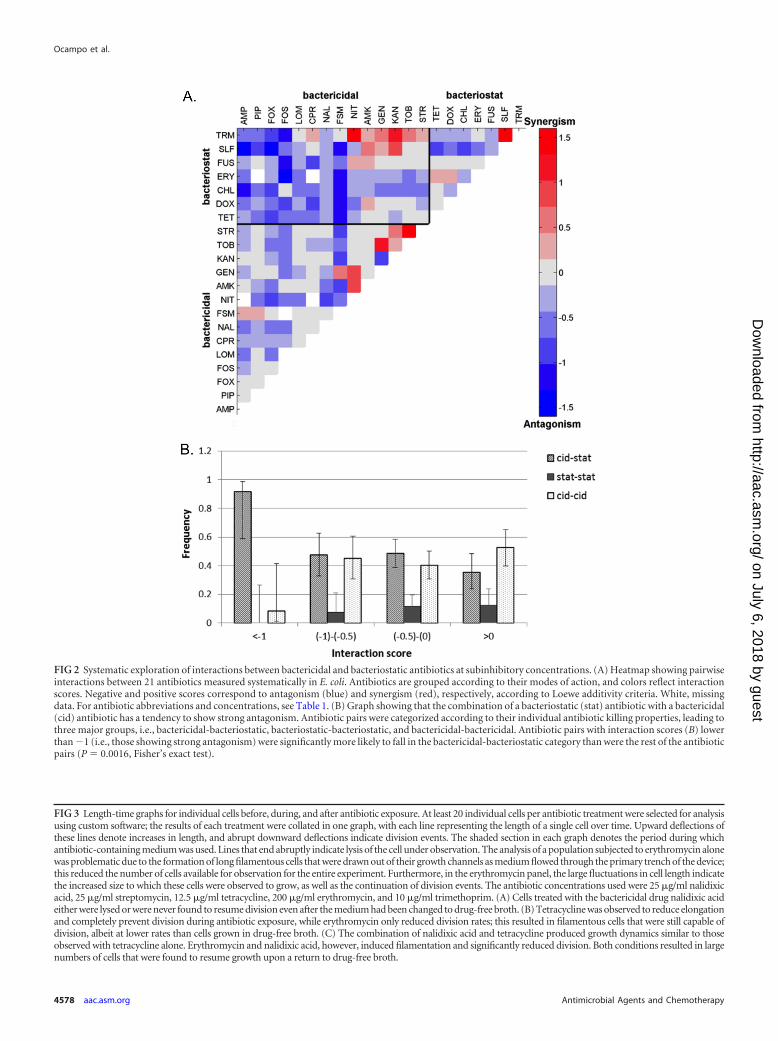
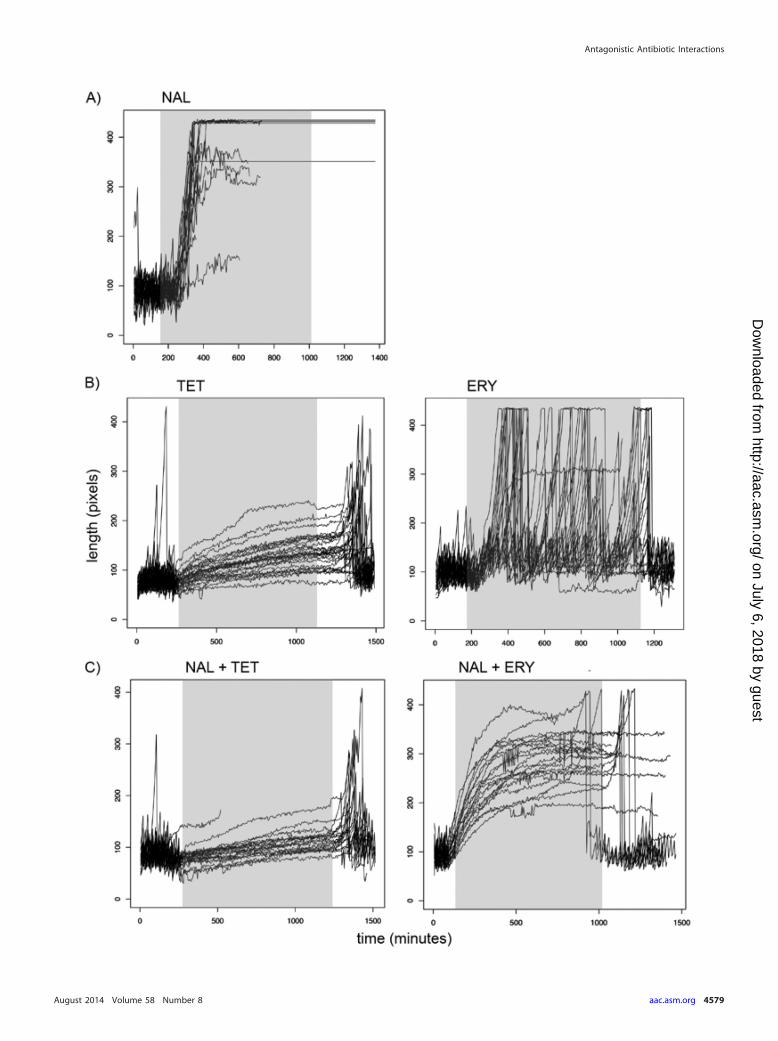
FIG 3 Length-time graphs for individual cells before, during, and after antibiotic exposure. At least 20 individual cells per antibiotic treatment were selected for analysisusing custom software; the results of each treatment were collated in one graph, with each line representing the length of a single cell over time. Upward deflections ofthese lines denote increases in length, and abrupt downward deflections indicate division events. The shaded section in each graph denotes the period during whichantibiotic-containing medium was used. Lines that end abruptly indicate lysis of the cell under observation. The analysis of a population subjected to erythromycin alonewas problematic due to the formation of long filamentous cells that were drawn out of their growth channels as medium flowed through the primary trench of the device;this reduced the number of cells available for observation for the entire experiment. Furthermore, in the erythromycin panel, the large fluctuations in cell length indicatethe increased size to which these cells were observed to grow, as well as the continuation of division events. The antibiotic concentrations used were 25 �g/ml nalidixicacid, 25 �g/ml streptomycin, 12.5 �g/ml tetracycline, 200 �g/ml erythromycin, and 10 �g/ml trimethoprim. (A) Cells treated with the bactericidal drug nalidixic acideither were lysed or were never found to resume division even after the medium had been changed to drug-free broth. (B) Tetracycline was observed to reduce elongationand completely prevent division during antibiotic exposure, while erythromycin only reduced division rates; this resulted in filamentous cells that were still capable ofdivision, albeit at lower rates than cells grown in drug-free broth. (C) The combination of nalidixic acid and tetracycline produced growth dynamics similar to thoseobserved with tetracycline alone. Erythromycin and nalidixic acid, however, induced filamentation and significantly reduced division. Both conditions resulted in largenumbers of cells that were found to resume growth upon a return to drug-free broth.
FIG 2 Systematic exploration of interactions between bactericidal and bacteriostatic antibiotics at subinhibitory concentrations. (A) Heatmap showing pairwiseinteractions between 21 antibiotics measured systematically in E. coli. Antibiotics are grouped according to their modes of action, and colors reflect interactionscores. Negative and positive scores correspond to antagonism (blue) and synergism (red), respectively, according to Loewe additivity criteria. White, missingdata. For antibiotic abbreviations and concentrations, see Table 1. (B) Graph showing that the combination of a bacteriostatic (stat) antibiotic with a bactericidal(cid) antibiotic has a tendency to show strong antagonism. Antibiotic pairs were categorized according to their individual antibiotic killing properties, leading tothree major groups, i.e., bactericidal-bacteriostatic, bacteriostatic-bacteriostatic, and bactericidal-bactericidal. Antibiotic pairs with interaction scores (B) lowerthan �1 (i.e., those showing strong antagonism) were significantly more likely to fall in the bactericidal-bacteriostatic category than were the rest of the antibioticpairs (P � 0.0016, Fisher’s exact test).
Ocampo et al.
4578 aac.asm.org Antimicrobial Agents and Chemotherapy
on July 6, 2018 by guesthttp://aac.asm
.org/D
ownloaded from
Antagonistic Antibiotic Interactions
August 2014 Volume 58 Number 8 aac.asm.org 4579
on July 6, 2018 by guesthttp://aac.asm
.org/D
ownloaded from
Using a device designed to track the elongation and division ofhundreds of individual cells over a long period (32), we began bygrowing E. coli cells in rich medium without antibiotics for at least4 h, to determine the baseline rates of these cellular processes. Thiswas followed by exposure to a single drug or pairs of drugs for atleast 16 h. Media were then switched back to drug-free broth for atleast four more hours.
By analyzing the resulting time-lapse images, we capturedquantitative information on the rates of cell elongation and divi-sion of single cells as they were subjected to different antibioticssingly or in antagonistic pairs. Furthermore, we monitored thefates of hundreds of cells from every condition to assess viabilityafter withdrawal of antibiotic-containing media. While every cellexposed to bactericidal drugs either was lysed or did not resumegrowth by the end of the experiment, at least 30% and up to morethan 80% of individual cells treated with bactericidal-bacterio-static drug pairs maintained cellular integrity and resumed divi-sion after replacement of antibiotic-free medium (see Table S1 inthe supplemental material).
We selected at least 20 individual cells per condition for de-tailed analysis using custom software. We measured each individ-ual cell’s elongation rate, number of cell length doublings perhour, and division rate (number of divisions per hour). Figure 3depicts the lengths of cells for each condition across the entireduration of the experiment. The graphs reveal qualitative differ-ences in cellular responses to different antibiotic treatments. Ourtime-lapse images revealed contrasting responses to the bacterio-static drugs tetracycline and erythromycin. As reported previ-ously, we found that tetracycline exposure reduced cell elongationand decreased the rate of cell division (24). Erythromycin, how-ever, reduced only the rate of division, resulting in filamentouscells that continued to divide. The maximum length depicted inour plots was constrained by the length of the growth channel inthe microfluidic device, and we were thus unable to measure theactual size of antibiotic-induced filaments.
To determine whether the strong reductions in elongation anddivision observed with tetracycline could similarly antagonize an-other bactericidal antibiotic with an unrelated mechanism of ac-tion, we also combined tetracycline with the bactericidal antibi-otic streptomycin and repeated the analysis. The resulting growthdynamics are depicted in Fig. S1 in the supplemental material.
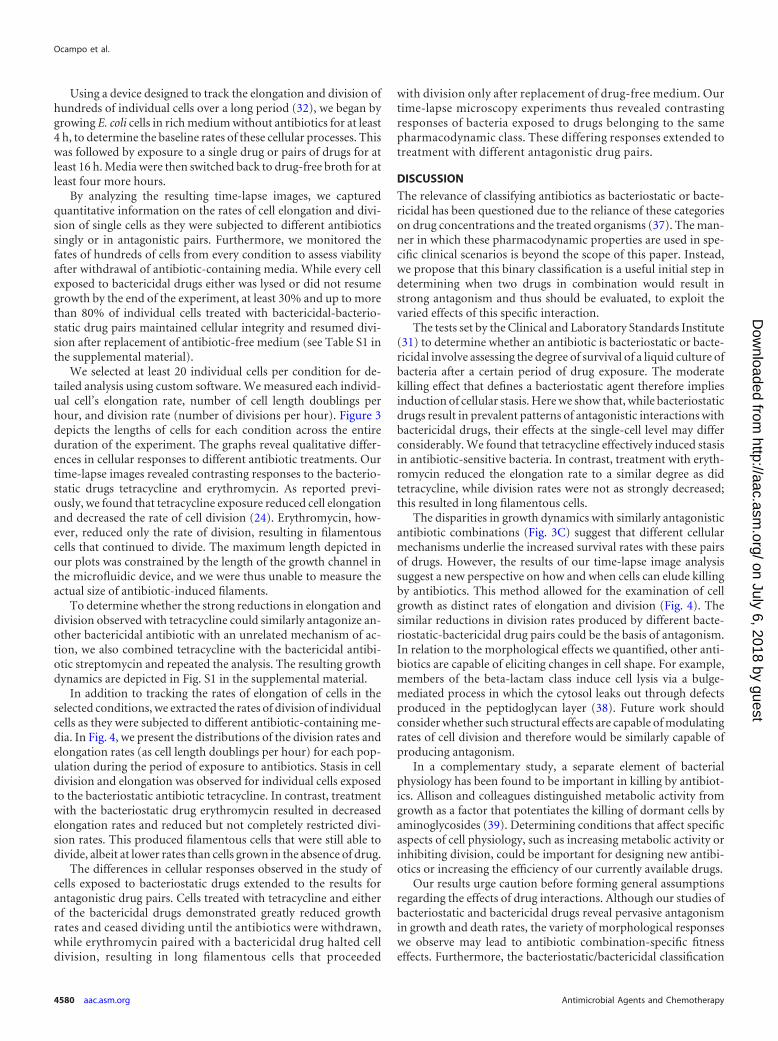
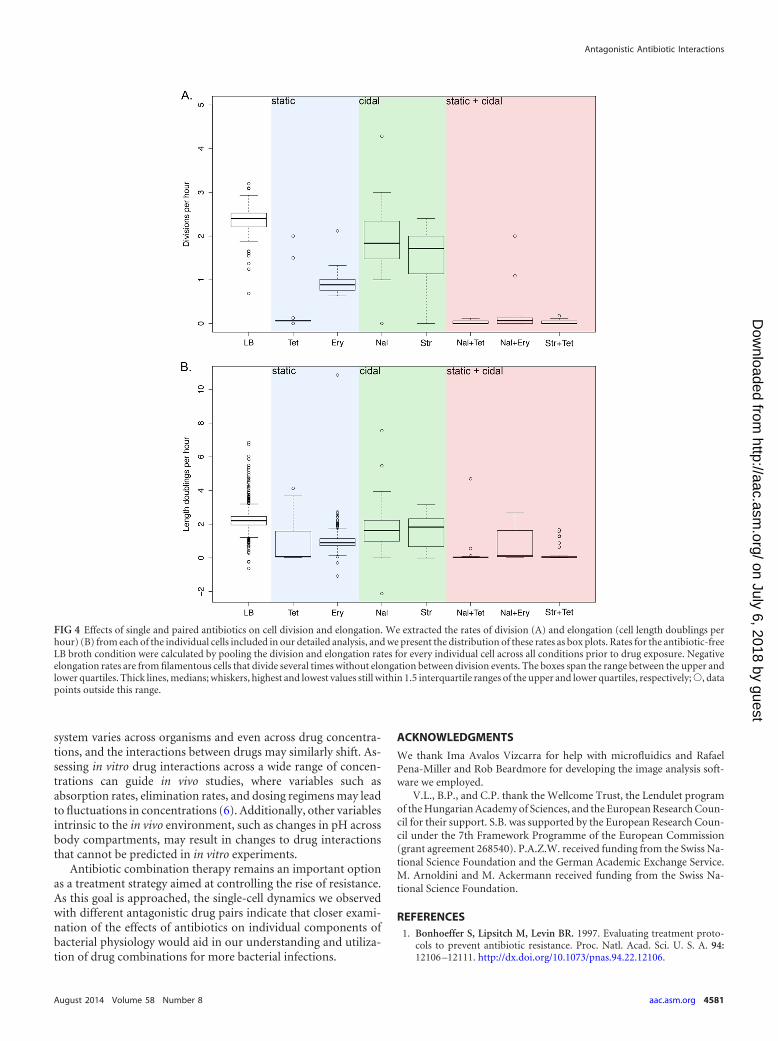
In addition to tracking the rates of elongation of cells in theselected conditions, we extracted the rates of division of individualcells as they were subjected to different antibiotic-containing me-dia. In Fig. 4, we present the distributions of the division rates andelongation rates (as cell length doublings per hour) for each pop-ulation during the period of exposure to antibiotics. Stasis in celldivision and elongation was observed for individual cells exposedto the bacteriostatic antibiotic tetracycline. In contrast, treatmentwith the bacteriostatic drug erythromycin resulted in decreasedelongation rates and reduced but not completely restricted divi-sion rates. This produced filamentous cells that were still able todivide, albeit at lower rates than cells grown in the absence of drug.
The differences in cellular responses observed in the study ofcells exposed to bacteriostatic drugs extended to the results forantagonistic drug pairs. Cells treated with tetracycline and eitherof the bactericidal drugs demonstrated greatly reduced growthrates and ceased dividing until the antibiotics were withdrawn,while erythromycin paired with a bactericidal drug halted celldivision, resulting in long filamentous cells that proceeded
with division only after replacement of drug-free medium. Ourtime-lapse microscopy experiments thus revealed contrastingresponses of bacteria exposed to drugs belonging to the samepharmacodynamic class. These differing responses extended totreatment with different antagonistic drug pairs.
DISCUSSION
The relevance of classifying antibiotics as bacteriostatic or bacte-ricidal has been questioned due to the reliance of these categorieson drug concentrations and the treated organisms (37). The man-ner in which these pharmacodynamic properties are used in spe-cific clinical scenarios is beyond the scope of this paper. Instead,we propose that this binary classification is a useful initial step indetermining when two drugs in combination would result instrong antagonism and thus should be evaluated, to exploit thevaried effects of this specific interaction.
The tests set by the Clinical and Laboratory Standards Institute(31) to determine whether an antibiotic is bacteriostatic or bacte-ricidal involve assessing the degree of survival of a liquid culture ofbacteria after a certain period of drug exposure. The moderatekilling effect that defines a bacteriostatic agent therefore impliesinduction of cellular stasis. Here we show that, while bacteriostaticdrugs result in prevalent patterns of antagonistic interactions withbactericidal drugs, their effects at the single-cell level may differconsiderably. We found that tetracycline effectively induced stasisin antibiotic-sensitive bacteria. In contrast, treatment with eryth-romycin reduced the elongation rate to a similar degree as didtetracycline, while division rates were not as strongly decreased;this resulted in long filamentous cells.
The disparities in growth dynamics with similarly antagonisticantibiotic combinations (Fig. 3C) suggest that different cellularmechanisms underlie the increased survival rates with these pairsof drugs. However, the results of our time-lapse image analysissuggest a new perspective on how and when cells can elude killingby antibiotics. This method allowed for the examination of cellgrowth as distinct rates of elongation and division (Fig. 4). Thesimilar reductions in division rates produced by different bacte-riostatic-bactericidal drug pairs could be the basis of antagonism.In relation to the morphological effects we quantified, other anti-biotics are capable of eliciting changes in cell shape. For example,members of the beta-lactam class induce cell lysis via a bulge-mediated process in which the cytosol leaks out through defectsproduced in the peptidoglycan layer (38). Future work shouldconsider whether such structural effects are capable of modulatingrates of cell division and therefore would be similarly capable ofproducing antagonism.
In a complementary study, a separate element of bacterialphysiology has been found to be important in killing by antibiot-ics. Allison and colleagues distinguished metabolic activity fromgrowth as a factor that potentiates the killing of dormant cells byaminoglycosides (39). Determining conditions that affect specificaspects of cell physiology, such as increasing metabolic activity orinhibiting division, could be important for designing new antibi-otics or increasing the efficiency of our currently available drugs.
Our results urge caution before forming general assumptionsregarding the effects of drug interactions. Although our studies ofbacteriostatic and bactericidal drugs reveal pervasive antagonismin growth and death rates, the variety of morphological responseswe observe may lead to antibiotic combination-specific fitnesseffects. Furthermore, the bacteriostatic/bactericidal classification
Ocampo et al.
4580 aac.asm.org Antimicrobial Agents and Chemotherapy
on July 6, 2018 by guesthttp://aac.asm
.org/D
ownloaded from
system varies across organisms and even across drug concentra-tions, and the interactions between drugs may similarly shift. As-sessing in vitro drug interactions across a wide range of concen-trations can guide in vivo studies, where variables such asabsorption rates, elimination rates, and dosing regimens may leadto fluctuations in concentrations (6). Additionally, other variablesintrinsic to the in vivo environment, such as changes in pH acrossbody compartments, may result in changes to drug interactionsthat cannot be predicted in in vitro experiments.
Antibiotic combination therapy remains an important optionas a treatment strategy aimed at controlling the rise of resistance.As this goal is approached, the single-cell dynamics we observedwith different antagonistic drug pairs indicate that closer exami-nation of the effects of antibiotics on individual components ofbacterial physiology would aid in our understanding and utiliza-tion of drug combinations for more bacterial infections.
ACKNOWLEDGMENTS
We thank Ima Avalos Vizcarra for help with microfluidics and RafaelPena-Miller and Rob Beardmore for developing the image analysis soft-ware we employed.
V.L., B.P., and C.P. thank the Wellcome Trust, the Lendulet programof the Hungarian Academy of Sciences, and the European Research Coun-cil for their support. S.B. was supported by the European Research Coun-cil under the 7th Framework Programme of the European Commission(grant agreement 268540). P.A.Z.W. received funding from the Swiss Na-tional Science Foundation and the German Academic Exchange Service.M. Arnoldini and M. Ackermann received funding from the Swiss Na-tional Science Foundation.
REFERENCES1. Bonhoeffer S, Lipsitch M, Levin BR. 1997. Evaluating treatment proto-
cols to prevent antibiotic resistance. Proc. Natl. Acad. Sci. U. S. A. 94:12106 –12111. http://dx.doi.org/10.1073/pnas.94.22.12106.
FIG 4 Effects of single and paired antibiotics on cell division and elongation. We extracted the rates of division (A) and elongation (cell length doublings perhour) (B) from each of the individual cells included in our detailed analysis, and we present the distribution of these rates as box plots. Rates for the antibiotic-freeLB broth condition were calculated by pooling the division and elongation rates for every individual cell across all conditions prior to drug exposure. Negativeelongation rates are from filamentous cells that divide several times without elongation between division events. The boxes span the range between the upper andlower quartiles. Thick lines, medians; whiskers, highest and lowest values still within 1.5 interquartile ranges of the upper and lower quartiles, respectively;Œ, datapoints outside this range.
Antagonistic Antibiotic Interactions
August 2014 Volume 58 Number 8 aac.asm.org 4581
on July 6, 2018 by guesthttp://aac.asm
.org/D
ownloaded from
2. Hand K. 2006. Tuberculosis: pharmacological management. Hosp.Pharm. 13:81– 85.
3. Mocroft A, Vella S, Benfield TL, Chiesi A, Miller V, Gargalianos P,d’Arminio Monforte A, Yust I, Bruun JN, Phillips AN, Lundgren JD,EuroSIDA Study Group. 1998. Changing patterns of mortality acrossEurope in patients infected with HIV-1. Lancet 352:1725–1730. http://dx.doi.org/10.1016/S0140-6736(98)03201-2.
4. WHO. 2010. WHO guidelines for the treatment of malaria, 2nd ed. WHO,Geneva, Switzerland.
5. Gilbert DN, Moellering RC, Eliopoulos GM, Chambers HF, Saag MS(ed). 2010. The Sanford guide to antimicrobial therapy, 40th ed. Antimi-crobial Therapy, Inc., Sperryville, VA.
6. Cottarel G, Wierzbowski J. 2007. Combination drugs, an emerging op-tion for antibacterial therapy. Trends Biotechnol. 25:547–555. http://dx.doi.org/10.1016/j.tibtech.2007.09.004.
7. Forrest GN, Tamura K. 2010. Rifampin combination therapy for non-mycobacterial infections. Clin. Microbiol. Rev. 23:14 –34. http://dx.doi.org/10.1128/CMR.00034-09.
8. Cunha BA. 2004. Therapeutic implications of antibacterial resistance incommunity-acquired respiratory tract infections in children. Infection32:98 –108. http://dx.doi.org/10.1007/s15010-004-3065-5.
9. Ankomah P, Johnson PJT, Levin BR. 2013. The pharmaco –, populationand evolutionary dynamics of multi-drug therapy: experiments with S.aureus and E. coli and computer simulations. PLoS Pathog. 9:e1003300.http://dx.doi.org/10.1371/journal.ppat.1003300.
10. Johansen HK, Jensen TG, Dessau RB, Lundgren B, Frimodt-Moller N.2000. Antagonism between penicillin and erythromycin against Strepto-coccus pneumoniae in vitro and in vivo. J. Antimicrob. Chemother. 46:973–980. http://dx.doi.org/10.1093/jac/46.6.973.
11. Cates JE, Christie RV, Garrod LP. 1951. Penicillin-resistant subacutebacterial endocarditis treated by a combination of penicillin and strepto-mycin. Br. Med. J. 1:653– 656.
12. Garrod L. 1972. Causes of failure in antibiotic treatment. Br. Med. J.4:473– 476. http://dx.doi.org/10.1136/bmj.4.5838.473.
13. Yeh PJ, Hegreness MJ, Aiden AP, Kishony R. 2009. Drug interactionsand the evolution of antibiotic resistance. Nat. Rev. Microbiol. 7:460 – 466.http://dx.doi.org/10.1038/nrmicro2133.
14. Chait R, Craney A, Kishony R. 2007. Antibiotic interactions that select againstresistance. Nature 446:668–671. http://dx.doi.org/10.1038/nature05685.
15. Hegreness M, Shoresh N, Damian D, Hartl D, Kishony R. 2008.Accelerated evolution of resistance in multidrug environments. Proc.Natl. Acad. Sci. U. S. A. 105:13977–13981. http://dx.doi.org/10.1073/pnas.0805965105.
16. Nitzan O, Supornitzky U, Kennes Y, Chazan B, Raz R, Colodner R. 2010.Is chloramphenicol making a comeback? Isr. Med. Assoc. J. 12:371–374.
17. Falagas ME, Grammatikos AP, Michalopoulos A. 2008. Potential ofold-generation antibiotics to address current need for new antibiotics.Expert Rev. Anti Infect. Ther. 6:593– 600. http://dx.doi.org/10.1586/14787210.6.5.593.
18. Wilson G, Miles A. 1964. Topley and Wilson’s principles of bacteriologyand immunity, 5th ed. Edward Arnold, London, United Kingdom.
19. Jawetz E, Gunnison J. 1953. Antibiotic synergism and antagonism: anassessment of the problem. Pharmacol. Rev. 5:175–192.
20. Jawetz E, Gunnison J, Coleman VR. 1954. Observations on the mode ofaction of antibiotic synergism and antagonism. J. Gen. Microbiol. 10:191–198. http://dx.doi.org/10.1099/00221287-10-2-191.
21. Lázár V, Pal Singh G, Spohn R, Nagy I, Horváth B, Hrtyan M,Busa-Fekete R, Bogos B, Méhi O, Csörgo B, Pósfai G, Fekete G,Szappanos B, Kégl B, Papp B, Pál C. 2013. Bacterial evolution of anti-biotic hypersensitivity. Mol. Syst. Biol. 9:700. http://dx.doi.org/10.1038/msb.2013.57.
22. Yeh P, Tschumi AI, Kishony R. 2006. Functional classification of drugs
by properties of their pairwise interactions. Nat. Genet. 38:489 – 494. http://dx.doi.org/10.1038/ng1755.
23. Warringer J, Blomberg A. 2003. Automated screening in environmentalarrays allows analysis of quantitative phenotypic profiles in Saccharomycescerevisiae. Yeast 20:53– 67. http://dx.doi.org/10.1002/yea.931.
24. Rasmussen CE, Williams CKI. 2006. Gaussian processes for machinelearning. MIT Press, Cambridge, MA.
25. Drusano GL, D’Argenio DZ, Preston SL, Barone C, Symonds W, LaFonS, Rogers M, Prince W, Bye A, Bilello JA. 2000. Use of drug effectinteraction modeling with Monte Carlo simulation to examine the impactof dosing interval on the projected antiviral activity of the combination ofabacavir and amprenavir. Antimicrob. Agents Chemother. 44:1655–1659.http://dx.doi.org/10.1128/AAC.44.6.1655-1659.2000.
26. Drusano GL, D’Argenio DZ, Symonds W, Bilello PA, McDowell J,Sadler B, Bye A, Bilello JA. 1998. Nucleoside analog 1592U89 and humanimmunodeficiency virus protease inhibitor 141W94 are synergistic invitro. Antimicrob. Agents Chemother. 42:2153–2159.
27. Greco WR, Bravo G, Parsons JC. 1995. The search for synergy: a criticalreview from a response surface perspective. Pharmacol. Rev. 47:331–385.
28. Loewe S. 1953. The problem of synergism and antagonism of combineddrugs. Arzneimittelforschung 3:285–290.
29. Cokol M, Chua HN, Tasan M, Mutlu B, Weinstein ZB, Suzuki Y,Nergiz ME, Costanzo M, Baryshnikova A, Giaever G, Nislow C, MyersCL, Andrews BJ, Boone C, Roth FP. 2011. Systematic exploration ofsynergistic drug pairs. Mol. Syst. Biol. 7:544. http://dx.doi.org/10.1038/msb.2011.71.
30. Lehar J, Zimmerman GR, Krueger AS, Molnar RA, Ledell JT, HeilbutAM, Short GF, III, Giusti LC, Nolan GP, Magid OA, Lee MS, Borisy AA,Stockwell BR, Keith CT. 2007. Chemical combination effects predictconnectivity in biological systems. Mol. Syst. Biol. 3:80. http://dx.doi.org/10.1038/msb4100116.
31. Clinical and Laboratory Standards Institute. 2006. Methods for dilutionantimicrobial susceptibility tests for bacteria that grow aerobically; ap-proved standard—7th ed. Clinical and Laboratory Standards Institute,Wayne, PA.
32. Wang P, Robert L, Pelletier J, Dang WL, Taddei F, Wright A, Jun S.2010. Robust growth of Escherichia coli. Curr. Biol. 20:1099 –1103. http://dx.doi.org/10.1016/j.cub.2010.04.045.
33. Loewe S. 1928. Die quantitiven Probleme der Pharmakologie. Ergeb.Physiol. 27:47–187. http://dx.doi.org/10.1007/BF02322290.
34. Bollenbach T, Quan S, Chait R, Kishony R. 2009. Nonoptimal microbialresponse to antibiotics underlies suppressive drug interactions. Cell 139:707–718. http://dx.doi.org/10.1016/j.cell.2009.10.025.
35. Cozens RM, Tuomanen E, Tosch W, Zak O, Suter J, Tomasz A. 1986.Evaluation of the bactericidal activity of -lactam antibiotics on slowlygrowing bacteria cultured in the chemostat. Antimicrob. Agents Che-mother. 29:797– 802. http://dx.doi.org/10.1128/AAC.29.5.797.
36. Eng RHK, Padberg FT, Smith SM, Tan EN, Cherubin CE. 1991. Bac-tericidal effects of antibiotics on slowly growing and nongrowing bacteria.Antimicrob. Agents Chemother. 35:1824 –1828. http://dx.doi.org/10.1128/AAC.35.9.1824.
37. Pankey G, Sabath L. 2004. Clinical relevance of bacteriostatic versusbactericidal mechanisms of action in the treatment of Gram-positive bac-terial infections. Clin. Infect. Dis. 38:864 – 870. http://dx.doi.org/10.1086/381972.
38. Yao Z, Kahne D, Kishony R. 2012. Distinct single-cell morphologicaldynamics under -lactam antibiotics. Mol. Cell 48:705–712. http://dx.doi.org/10.1016/j.molcel.2012.09.016.
39. Allison K, Brynildsen M, Collins J. 2011. Metabolite-enabled eradicationof bacterial persisters by aminoglycosides. Nature 473:216 –220. http://dx.doi.org/10.1038/nature10069.
Ocampo et al.
4582 aac.asm.org Antimicrobial Agents and Chemotherapy
on July 6, 2018 by guesthttp://aac.asm
.org/D
ownloaded from