Answers: Making Spatial Decisions Using ArcGIS...
20
1 Answers: Making Spatial Decisions Using ArcGIS Pro: A Workbook In this answer guide, the authors have provided sample answers to many of the quantitative questions posed in the book; the answers can vary by 1 percent to 2 percent. The authors have provided images to illustrate some answers, as well as guidance for a couple of the deliverables.
Transcript of Answers: Making Spatial Decisions Using ArcGIS...

1
Answers:MakingSpatialDecisionsUsingArcGISPro:AWorkbook
Inthisanswerguide,theauthorshaveprovidedsampleanswerstomanyofthe
quantitativequestionsposedinthebook;theanswerscanvaryby1percentto2percent.The
authorshaveprovidedimagestoillustratesomeanswers,aswellasguidanceforacoupleof
thedeliverables.

2
Module1
Hazardousemergencydecisions
Project1:AnexplosivesituationinSpringfield,Virginia
Q2Whatisthespatialcoordinatesystemoftheproject,andisitanappropriatecoordinatesystemformeasurements?
NAD_1983_StatePlane_Virginia_North_FIPS_4501_Feet.
Deliverable3:Anonlinewebmapshowingcriticalfacilities,trafficpatterns,anddrivetimesSpringfieldHazardsEvacuation
http://arcg.is/2len7c4
Project2:SkirtingthespillinMecklenburgCounty,NorthCarolina
Q2Whatisthespatialcoordinatesystemoftheproject?NAD_1983_UTM_Zone17N
Q3Howmuchofthenearbyareamustbeevacuated?Ithasbeendeterminedthat15,626householdsmustbeevacuated.

3
Deliverable3:Anonlinewebmapshowingcriticalfacilities,trafficpatterns,anddrivetimes
ChlorineSpillMecklenburg,NorthCarolinahttp://arcg.is/2letjk9

4
Module2
Hurricanedamagedecisions
Project1:CoastalfloodingfromHurricaneKatrina
Q5Whatisthesumofthecounts?1,295,380
Q6Completethistable.Type of Land Percentage Acres
Water 9.4% 27,198.7
Developed 15.3% 44,299.7
Barren 1.4% 4,031.1
Forest 11.8% 34,249.0
Agriculture 6.8% 19,691.5
Wetlands 55.1% 158,718.5
HurricaneKatrinaDamagehttp://arcg.is/2kEF0Ca

5
Project2:HurricaneWilmastormsurge
Q5Completethistableonyourworksheet.Type of Land Percentage Acres
Water 9.0% 313.8
Developed 69.9% 2,410.0
Barren 2.5% 85.8
Scrub/Grass 7.2% 253.3
Wetlands 12.5% 436.4
KeyWestdamage,HurricaneWilmahttp://arcg.is/2lnuAUx

6
Module3
Lawenforcementdecisions
Project1:Crimeinthenation’scapital
Q4Writeareportaboutthedistributionofcrimebypolicedistrictandbythethree-minutedrivetimearoundthepolicestations.Describeboththespatialdistributionandspatialstatisticsinyourreport.
TheFirst,Third,andSecondDistrictshavethehighestpercentageofcrime,with17
percent,16percent,and15percent,respectively.TheFourthandFifthDistrictsareinthe
middle,eachwith14percent,andtheSixthandSeventhDistrictsarethelowest,with12
percentand10percent,respectively.
Q8Usethehexagonmaptolookforlocalvariationsofhigh-riskautotheft.Includethisinformationinyourreport.
ThegriddedmapshowsthatautotheftismostprevalentintheThirdDistrict.
Washington,DC,crimeanalysishttp://arcg.is/2lnwzs3

7
Project2:AnalyzingcrimeinSanDiego,California
Q4Continueyourreporttothepolicedepartmentbyanalyzingwhichtransitstationshavethemostcrimereported.
Thewalk-timeareasontheloopontherailnearthewaterhavethemostcrime.The
distributionofthecrimeisconcentric,slowlyincreasingoutwardfrommotorvehicletheftto
assaulttoburglary.
Q5Incorporatethepatternofdistributionofthesethreecrimes(assault,burglary,andmotorvehicletheft)inyourreport.
ThegriddedmapshowsadefiniteconcentrationofautotheftinthecenterofSan
Diego.
8
Module4
Compositeimages
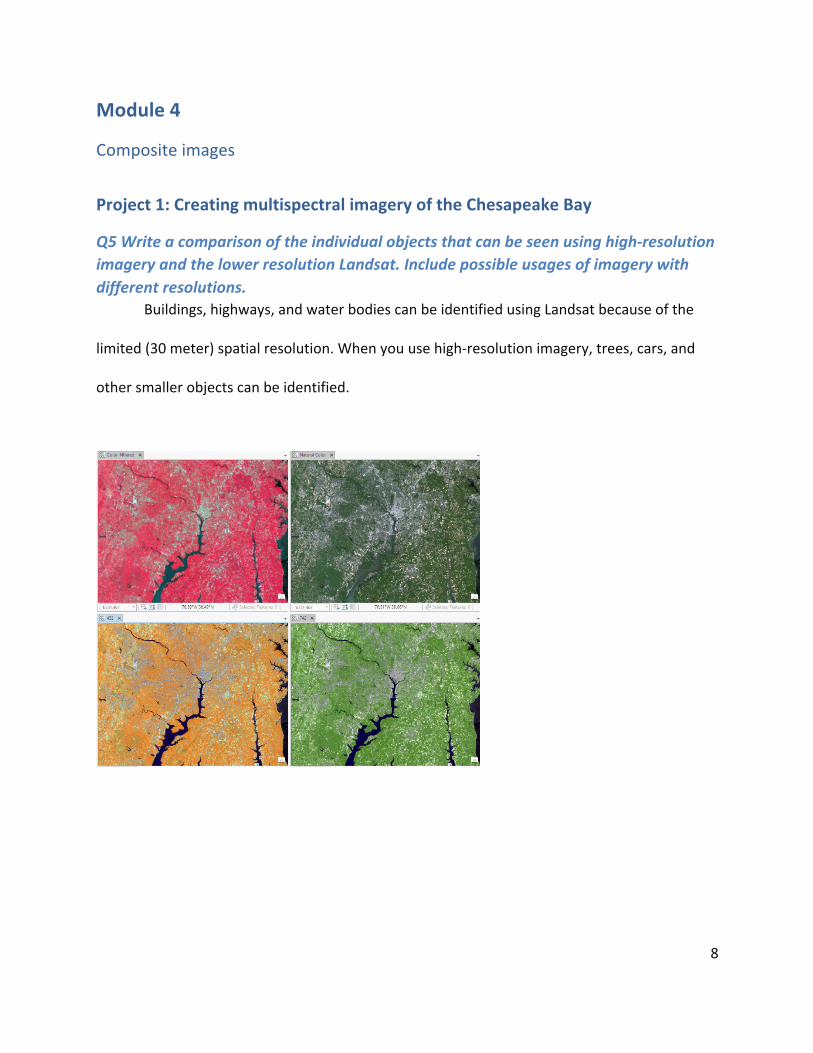
Project1:CreatingmultispectralimageryoftheChesapeakeBay
Q5Writeacomparisonoftheindividualobjectsthatcanbeseenusinghigh-resolutionimageryandthelowerresolutionLandsat.Includepossibleusagesofimagerywithdifferentresolutions. Buildings,highways,andwaterbodiescanbeidentifiedusingLandsatbecauseofthe
limited(30meter)spatialresolution.Whenyouusehigh-resolutionimagery,trees,cars,and
othersmallerobjectscanbeidentified.

9
Project2:MultispectralcompositebandsoftheLasVegasarea

10
Module5
CalculatingunsupervisedclassificationoftheChesapeakeBayUnsupervisedclassification
Q7DescribethedifferencebetweentheoriginalReclassedandthepost-processedReclassdmf2bc.Discusstheprosandconsofpost-processing.
Post-processingprovidesa“cleaner”classification,andtherearefewernonclassified
pixels.Contiguouspatternsareeasiertodiscern.However,post-processinginvolveschanging
thevaluesofsomepixels,andthatintroducesthepossibilityoferror.
Watershed Water Developed Forest Crop/Pasture
Potomac 5.9% 29% 32.1% 33.1%
Patuxent 5.8% 13.9% 28.7% 22/5%
Severn 8.5% 8.5% 24.2% 14.5%

11
Project2:CalculatingunsupervisedclassificationofLasVegas,NevadaWatershed Evergreen Developed Shrub/Scrub Barren
Las Vegas Wash 10.1% 4.8% 7.5% 77.6%
Detrital Wash 7.9% 0% 16.9% 75.2%

12
Module6
Supervisedclassification
Project1:CalculatingsupervisedclassificationoftheChesapeakeBay
Q5.Fillinthetablewiththepercentageofeachtypeoflandcoverinthethreewatersheds.Watershed Water Developed Forest Crop/Pasture
Potomac 3.3% 37.8% 28.3% 30.6%
Patuxent 4.5% 17.7% 40.3% 37.8%
Severn 4.5% 31.2% 44.15% 20/1%
Q6.Enterthevaluesinthefollowingchart.Youmustretrievethedatafrommodule5fortheunsupervisedclassificationvalues.
Watershed Water
Unsup
Water
Sup
Developed
Unsup
Developed
Sup
Forest
Unsup
Forest
Sup
Crop/Pasture
Unsup
Crop/Pasture
Sup
Potomac 11.6% 3.3% 24.9% 37.8% 46.9% 28.3% 16.6% 30.6%
Patuxent 16.2% 4.5% 34.7% 17.7% 65.3% 40.3% 23.2% 37.8%
Severn 20.8% 4.5% 13.9% 31.2% 55% 44.1% 10.2% 20.1%

13
Project2:CalculatingsupervisedclassificationofLasVegas,Nevada
Q5Completethistable.Watershed Evergreen Developed Shrub/Scrub Barren
Las Vegas Wash 11.6% 20.1% 23.3% 45%
Detrital Wash 11.2% 15.2% 15% 58.65%
Q6Enterthevaluesinthefollowingchart.Youmustretrievetheunsupervisedvaluesfrommodule5.
Watershed Evergreen
Unsup
Evergreen
Sup
Developed
Unsup
Developed
Sup
Shrub/Scrub
Unsup
Shrub/Scrub
Sup
Barren
Unsup
Barren
Sup
Las Vegas Wash
10.1% 11.6% 4.8% 20.1% 7.5% 23.3% 77.6% 45%
Detrital Wash
7.9% 11.2% 0% 15.2% 16.9% 15% 75.2% 58.6%

14
Module7
Basiclidarskills
Project1:BasiclidarskillsusingBaltimore,Maryland,data
Q3Whatistherangeofelevation?Therangeofelevationis−288.87to416.86feet.
Q6Writeabriefparagraphaboutthedata,includingthenumberofpoints,verticalunit,spatialreference,classificationcodes,andreturnvalues.
Thereare3,566,042pointswithaverticalunitoffeet.ThespatialreferenceisNAD1983
StatePlaneMarylandFIPS1900Feet.TheclassificationcodesareClass1–Unassigned,Class2–
Ground,Class7–Noise,Class12–Overlap,andClass18–Outliers.Thereturnvaluesarefirst
throughfifthreturn.

15
Project2:SanFrancisco,California
Q3Whatistherangeofelevation?Therangeofelevationis35.28to263.98meters.
Q6Writeabriefparagraphdescribingthedata,includingthenumberofpoints,theverticalunit,thespatialreference,classificationcodes,andreturnvalues.
Thereare4,290,588pointswithaverticalunitofmeters.ThespatialreferenceisNAD
1983UTMZone10N.TheclassificationcodesareClass1–Unassigned,Class2–Ground,Class7–
Noise,Class9–Water,andClass10–Reserved.Thereturnsarefirstthroughfourthreturn.

16
Module8
Locationofsolarpanels
Project1:JamesMadisonUniversity,Harrisonburg,Virginia
Q3Whichareaswouldbethebestforinstallingsolarpanels?Theredareas?Theblueareas?
Theredareaswouldbethebestplacetoinstallthesolarpanels.

17
Project2:UniversityofSanFrancisco,SanFrancisco,California
Q3Judgingbythesolarinsolationdisplay,whichareaswouldreceivethemaximuminsolationforsolarpanelplacement?
Theredareaswouldreceivethemaximuminsolationforthesolarpanelplacement.

18
Module9
Forestvegetationheight
Project1:GeorgeWashingtonNationalForest,Virginia
Q3Whatisthetown'slocationrelativetoGWNF?Whatistotheeast?Tothesouth?ThetownofHarrisonburgistotheeast,andStauntonistothesouth.
Q5WhatistheunitforElevation,andwhatarethelowestandhighestelevationsrepresentedintheDEM?
ThehighestelevationoftheDEMis3,226.92feet,andthelowestelevationis1,569.55
feet.
Q7WhatistheunitforElevation,andwhatarethelowestandhighestelevationsrepresentedintheDSM?
ThehighestelevationoftheDSMis3,226feet,andthelowestelevationis1,622feet.
Q8Whatarethelowestandhighestvaluesintheheightraster?Thelowestelevationintheheightrasteris−6feet,andthehighestis1,270feet.
Q9Howmanycellshaveavalueofover196feet?Therearesixcellswithavalueofover196feet.

19
Q10Howmanycellshaveavalueoflessthan0?Thereare836cellswithavalueoflessthan0.
Project2:MichauxStateForest,Pennsylvania
Q3InwhatrangeofmountainsistheLASdataframelocated?TheLASdataisinthePineyMountains.
Q5Whatarethelowestandhighestvaluesintheheightraster?Thelowestelevationis6feet,andthehighestis1,260feet.
Q6Howmanycellshaveavalueofover196feet?

20
Threecellshaveavalueofover196ft.
Q7Howmanycellshaveavalueoflessthan0?Thereare11,455cellswithavalueoflessthan0.
Q8Describethedistributionofthecellsthatarelessthan0.Thecellslessthan0seemtoberandom.

![[Arcgis] Riset ArcGIS JS & Flex](https://static.fdocuments.us/doc/165x107/55cf96d7550346d0338e2017/arcgis-riset-arcgis-js-flex.jpg)

![Python and ArcGIS Enterprise - static.packt-cdn.com€¦ · Python and ArcGIS Enterprise [ 2 ] ArcGIS enterprise Starting with ArcGIS 10.5, ArcGIS Server is now called ArcGIS Enterprise.](https://static.fdocuments.us/doc/165x107/5ecf20757db43a10014313b7/python-and-arcgis-enterprise-python-and-arcgis-enterprise-2-arcgis-enterprise.jpg)