Answers and Teachers’ Notes - nzmathsnzmaths.co.nz/sites/default/files/FIO/financial-lit4.pdf ·...
57
Answers and Teachers’ Notes contents Introduction to financial literacy 2 Answers 5 Teachers’ Notes 14
Transcript of Answers and Teachers’ Notes - nzmathsnzmaths.co.nz/sites/default/files/FIO/financial-lit4.pdf ·...

Answers and Teachers’ Notes
con
ten
ts Introduction to financial literacy 2
Answers 5
Teachers’ Notes 14

intr
odu
ctio
n t
o fi
nan
cial
lit
erac
y
The Figure It Out Financial Literacy books provide teachers with valuable classroom resources that will support and enhance the delivery of the New Zealand Curriculum (2007).
The books introduce students to real-life scenarios that require financial understanding. The main characters, their peers, and their families face a range of choices involving money, and they model financial competency in their approach to setting goals and making decisions. The characters have some great ideas, and they apply enterprising thinking and processes when making their ideas happen. During the activities, students will see enterprising attributes in action and, while doing so, will gain understandings of economic and financial ideas that will support their evaluations of, or recommendations for, the decisions that the characters need to make. Students will learn that making good financial decisions is trickier than it may at first seem.
Many of the activities in the books are cross-curricular, using mathematics and statistics concepts alongside those of social sciences and other learning areas such as English and technology. The activities provide opportunities for students to exercise skills, such as those involved in statistical literacy, and learn about the processes and understandings covered in the curriculum. The characters, in thinking about and applying enterprising skills and attributes to their situation, also demonstrate the range of key competencies outlined on pages 12–13 of The New Zealand Curriculum.
Learning areas
The New Zealand Curriculum identifies learning areas that describe what the students will come to know and do.
Future-focused issues are a rich source of learning opportunities. They encourage the making of connections across the learning areas, values, and key competencies, and they are relevant to students’ futures. Issues embedded in the Figure It Out Financial Literacy books include:
• sustainability – exploring the long-term impact of social, cultural, scientific, technological, economic, or political practices on society and the environment;
• citizenship – exploring what it means to be a citizen and to contribute to the development and well-being of society;
• enterprise – exploring what it is to be innovative and entrepreneurial.
Learning areas also offer opportunities to:
• develop students’ knowledge and understandings in relation to economic shifts of the day;
• develop students’ financial capability, positioning them to make well-informed financial decisions throughout their lives.
See The New Zealand Curriculum, page 39
Enterprising attributes
The Ministry of Education has devised fifteen enterprising attributes that link to the key competencies for its Education for Enterprise initiative. They engage students in processes that are important for personal and business success. In the Figure It Out Financial Literacy books, students can see these attributes in action. The attributes are:
Thinking:
• generating, identifying, and assessing opportunities
• identifying, assessing, and managing risks
• generating and using creative ideas and processes
• identifying, solving, and preventing problems
• monitoring and evaluating
2
Managing self:
• matching personal goals and capabilities to an undertaking
• using initiative and drive
Relating to others:
• working with others and in teams
• negotiating and influencing
• being fair and responsible
Participating and contributing:
• identifying, recruiting, and managing resources
• being flexible and dealing with change
• planning and organising
Using language, symbols, and text:
• collecting, organising, and analysing information
• communicating and receiving ideas and information.
These attributes represent many of the competencies that the business community is now expecting from new employees, and they are characteristics that students need to practise to be successful in their own lives. As your students work through the Figure It Out financial literacy activities, you could challenge them to find examples of where these enterprising attributes have been applied by the characters. They could also consider how the application of these could benefit themselves, their family, and their community.
The Figure It Out Financial Literacy books will inspire students to look for their own opportunities, challenging them to apply the same enterprising attributes that the characters in the series have done. The Ministry of Education’s Education for Enterprise initiative can be found at www.tki.org.nz/r/education_for_enterprise/index_e.php
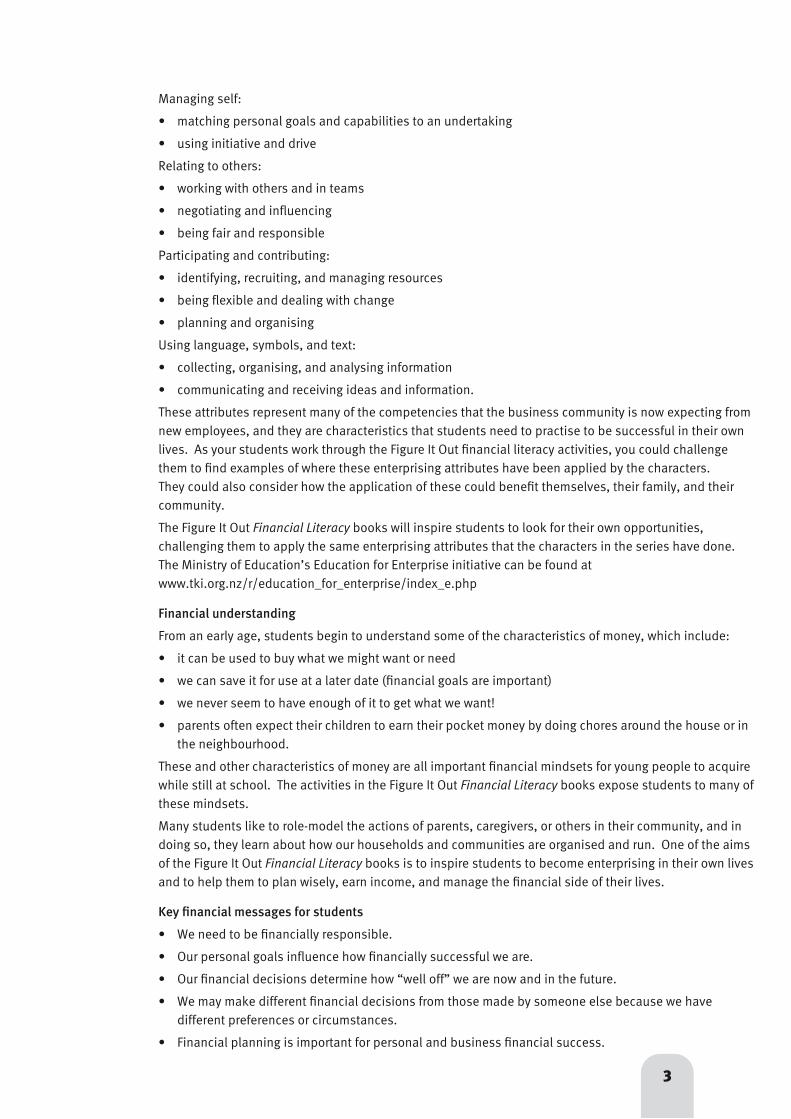
Financial understanding
From an early age, students begin to understand some of the characteristics of money, which include:
• it can be used to buy what we might want or need
• we can save it for use at a later date (financial goals are important)
• we never seem to have enough of it to get what we want!
• parents often expect their children to earn their pocket money by doing chores around the house or in the neighbourhood.
These and other characteristics of money are all important financial mindsets for young people to acquire while still at school. The activities in the Figure It Out Financial Literacy books expose students to many of these mindsets.
Many students like to role-model the actions of parents, caregivers, or others in their community, and in doing so, they learn about how our households and communities are organised and run. One of the aims of the Figure It Out Financial Literacy books is to inspire students to become enterprising in their own lives and to help them to plan wisely, earn income, and manage the financial side of their lives.
Key financial messages for students
• We need to be financially responsible.
• Our personal goals influence how financially successful we are.
• Our financial decisions determine how “well off” we are now and in the future.
• We may make different financial decisions from those made by someone else because we have different preferences or circumstances.
• Financial planning is important for personal and business financial success.
3

• We need to consider risk before we make a financial decision.
• We can spend now, save and spend later, or invest our savings.
• The law guides us to make legitimate financial decisions.
• There is a consequence for each financial decision we make; a good financial decision brings benefits.
Number Framework Stages (Numeracy Development Projects [NDP])
The Number Framework Links section for the pages in this book refer to the stages of the Number Framework that are appropriate for the activity.
The relevant stages are:
Stage 7: Advanced multiplicative–early proportional
Stage 8: Advanced proportional.
4

Answers Financial Literacy: Young Entrepreneurs
Levels 4–4+
setting the scene
Criteria for the award will vary.
Page 1 Young Entrepreneur of the Year
5
Pages 2–8
activity one (page 2)
1. a. $634.50
b. Answers will vary. For example, signage, a till or money box, transport to shops, a stall or tent to sell from, wrapping for jars, plastic bags for customers, bank account fees
c. Answers will vary. For example, she might be able to buy some of the equipment second- hand.
2. a. $49. (0.07 x $700)
b. $62.42 per month for 11 months, with a final payment of $62.38; or $62.40 per month for 11 months, with a final payment of $62.60; ($749 ÷ 12)
c. Answers will vary. She could be trying to keep her outgoings lower while she is getting established (although she would end up paying more interest overall).
3. a. Definitions may vary.
i. Unpaid balance: the amount remaining on a
Charu in a Pickle
loan at particular point before or after interest is added or repayments subtracted.
ii. Interest portion: the part of the repayment that the bank charges you for lending you the money.
iii. Principal portion: the part of the repayment that you are paying back from the amount you borrowed.
b. The interest portions get lower and the principal portions get higher. This happens because every month the interest is charged on the remaining balance, which gets lower and lower. Her monthly payment stays the same, so more gets paid off the principal.
4. Fair and Square Finance (12 x $62.20 – $0.07 = $746.33 or [11 x $62.20] + [1 x $62.13] = $746.33). Over a year, Charu would pay $2.67 more to Credit Services ($749). With Fair and Square Finance, Charu could also pay off the loan faster and therefore reduce the amount of interest.
5. Answers and scenarios will vary. For example, if Charu borrows $700 from Grandad and pays him at least $62.20 a month for the first 6 months and the rest over no more than 6 months at 15% per annum, she will be better off than if she borrows from the loan companies, as shown in the spreadsheet below. Note that the spreadsheet works on unrounded numbers but shows as (rounded) currency.
Month (end) Unpaid balance Repayment Interest portion Principal portion
6
7
8
9
10
11
12
$326.80
$268.69
$209.84
$150.27
$89.94
$28.87
$0.00
Total
$62.20
$62.20
$62.20
$62.20
$62.20
$29.23
$340.23
$4.09
$3.36
$2.62
$1.88
$1.12
$0.36
$13.43
$58.12
$58.84
$59.58
$60.32
$61.08
$28.87
A B
1234
56
78
9
C D E
6
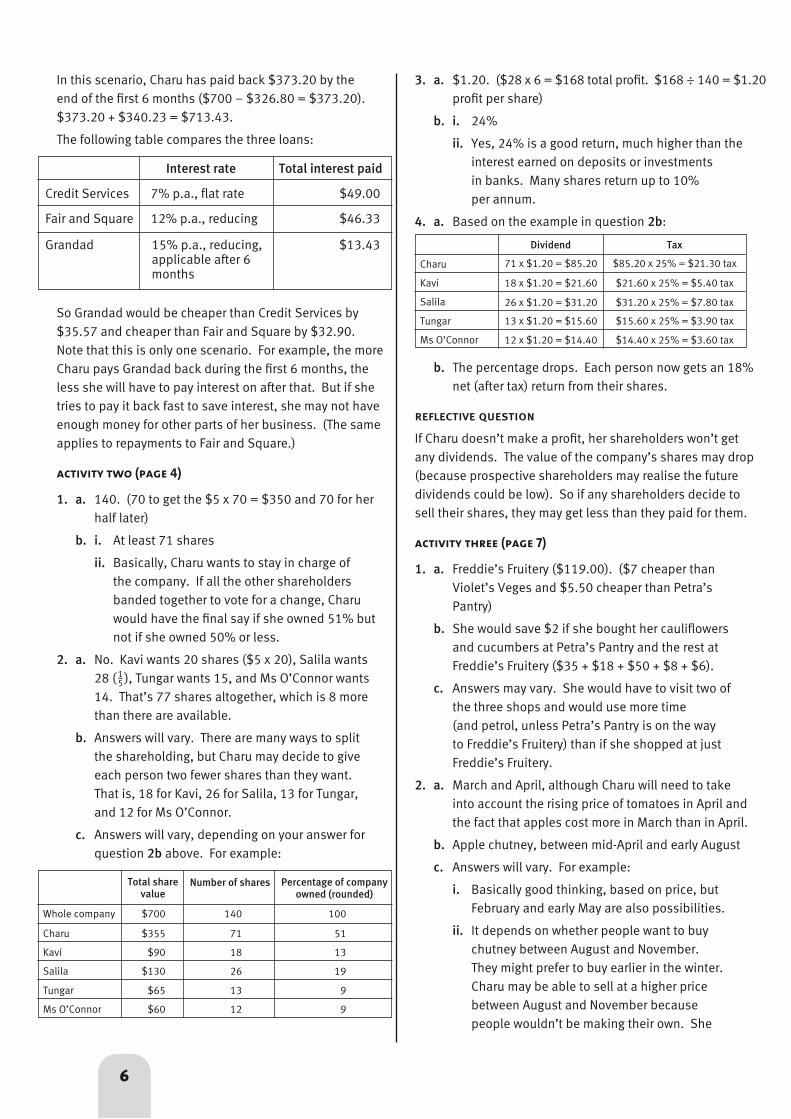
In this scenario, Charu has paid back $373.20 by the end of the first 6 months ($700 – $326.80 = $373.20). $373.20 + $340.23 = $713.43.
The following table compares the three loans:
So Grandad would be cheaper than Credit Services by $35.57 and cheaper than Fair and Square by $32.90. Note that this is only one scenario. For example, the more Charu pays Grandad back during the first 6 months, the less she will have to pay interest on after that. But if she tries to pay it back fast to save interest, she may not have enough money for other parts of her business. (The same applies to repayments to Fair and Square.)
activity two (page 4)
1. a. 140. (70 to get the $5 x 70 = $350 and 70 for her half later)
b. i. At least 71 shares
ii. Basically, Charu wants to stay in charge of the company. If all the other shareholders banded together to vote for a change, Charu would have the final say if she owned 51% but not if she owned 50% or less.
2. a. No. Kavi wants 20 shares ($5 x 20), Salila wants 28 ( ), Tungar wants 15, and Ms O’Connor wants 14. That’s 77 shares altogether, which is 8 more than there are available.
b. Answers will vary. There are many ways to split the shareholding, but Charu may decide to give each person two fewer shares than they want. That is, 18 for Kavi, 26 for Salila, 13 for Tungar, and 12 for Ms O’Connor.
c. Answers will vary, depending on your answer for question 2b above. For example:
Interest rate Total interest paid
Credit Services 7% p.a., flat rate $49.00
Fair and Square 12% p.a., reducing $46.33
3. a. $1.20. ($28 x 6 = $168 total profit. $168 ÷ 140 = $1.20 profit per share)
b. i. 24%
ii. Yes, 24% is a good return, much higher than the interest earned on deposits or investments in banks. Many shares return up to 10% per annum.
4. a. Based on the example in question 2b:
15
Total share value
Number of shares Percentage of company owned (rounded)
Whole company
Charu
Kavi
Salila
Tungar
Ms O’Connor
$700
$355
$90
$130
$65
$60
140
71
18
26
13
12
100
51
13
19
9
9
b. The percentage drops. Each person now gets an 18% net (after tax) return from their shares.
reflective question
If Charu doesn’t make a profit, her shareholders won’t get any dividends. The value of the company’s shares may drop (because prospective shareholders may realise the future dividends could be low). So if any shareholders decide to sell their shares, they may get less than they paid for them.
activity three (page 7)
1. a. Freddie’s Fruitery ($119.00). ($7 cheaper than Violet’s Veges and $5.50 cheaper than Petra’s Pantry)
b. She would save $2 if she bought her cauliflowers and cucumbers at Petra’s Pantry and the rest at Freddie’s Fruitery ($35 + $18 + $50 + $8 + $6).
c. Answers may vary. She would have to visit two of the three shops and would use more time (and petrol, unless Petra’s Pantry is on the way to Freddie’s Fruitery) than if she shopped at just Freddie’s Fruitery.
2. a. March and April, although Charu will need to take into account the rising price of tomatoes in April and the fact that apples cost more in March than in April.
b. Apple chutney, between mid-April and early August
c. Answers will vary. For example:
i. Basically good thinking, based on price, but February and early May are also possibilities.
ii. It depends on whether people want to buy chutney between August and November. They might prefer to buy earlier in the winter. Charu may be able to sell at a higher price between August and November because people wouldn’t be making their own. She
Dividend
Charu
Kavi
Salila
Tungar
Ms O’Connor
71 x $1.20 = $85.20
Tax
$85.20 x 25% = $21.30 tax
18 x $1.20 = $21.60 $21.60 x 25% = $5.40 tax
26 x $1.20 = $31.20 $31.20 x 25% = $7.80 tax
13 x $1.20 = $15.60 $15.60 x 25% = $3.90 tax
12 x $1.20 = $14.40 $14.40 x 25% = $3.60 tax
Grandad 15% p.a., reducing, $13.43 applicable after 6 months

activity one (page 9)
1. Graph c. Explanations will vary. You could eliminate graph d immediately because the last dot goes up
Pages 9–12 Keep Your Shirt On
7
will need to keep accurate records and reassess for the following year.
iii. It depends on whether the bulk price was much cheaper than the 5 or 10 kg price. Onions do eventually sprout and could be wasted.
reflective questions
Answers will vary.
• Prices of goods and services can change depending on the availability of the raw materials, the products themselves, or the time of year, which can affect demand.
• Prices can rise or fall depending on the season and the quantity available for sale.
• Prices of products or services that depend on the time of year usually do go in cycles.
b. The fixed cost of advertising and the computer design program need to be spread across all the T-shirts. To get a rate per day, divide the fixed cost by the 10 days. To get a rate per T-shirt, divide this daily rate by 8 because Whana is printing 8 T-shirts a day.
3. a. Answers will vary. The right-hand rule shows that after all the fixed costs have been met from the sale of the first T-shirt, the remaining T-shirts are cheaper to produce. The left-hand
and that doesn’t fit the chart information. The numbers in the chart don’t go down evenly as in graph a or in matching pairs as in graph b. Graph c does fit the data pattern.
2. a. Answers may vary. $5 may not cover his costs, and it certainly gives too low a return for one-off T-shirts. Also, only 5 people indicated they wouldn’t pay $10, which is double $5.
b. 8 or 9. (8 of the 9 who would pay $40 will be the same 8 who would pay $50.)
activity two (page 10)
1. Cost of basic T-shirt, ink and stencil, preparation and design time, printing and tidy-up
2. a. The cost of the computer design program and of advertising, once he has paid for it
b. Fixed costs are rent, computer design program, computer use, advertising.
3. a. 8. (40 minutes preparation and design time, 20 minutes printing and tidy-up time)
b. $12.50. (T-shirt and ink and stencil)
activity three (page 11)
1. Answers may vary. People might buy his T-shirts for Christmas presents or because it’s almost summer time.
2. a. Fixed costs
Item
Rent of garage
Computer design program
Rate per day
Variable costs
Per T-shirt @ 8 T-shirts per day
$10.00 $1.25
$8.00 $1.00
$12.00 $1.50
$2.00
Item Per T-shirt
Use of computer and printer
Advertising
Basic T-shirt
$0.25
Ink and stencil
Printing time at $10 per hr
Design time at $10 per hr
$10.00
$2.50
$3.33
$6.67
rule spreads out the cost across all 8 T-shirts produced in a day.
If Whana can screenprint 8 T-shirts per day, every day, the left-hand rule is best because it is simpler. However, if he is interrupted and doesn’t get all 8 T-shirts printed, the right-hand rule is best.
b. The right-hand graph matches the $26.50 per T-shirt rule. The left-hand graph matches the $54.50 for the first T-shirt rule.

8
activity one (page 13)
1. Answers may vary. A middleman is someone who handles a commodity between its producer and its consumer. (In this case, Whana would be the middleman’s consumer. If he buys the T-shirts direct, he is cutting out the middleman and thereby reducing his costs.)
2. Gracias T-shirts has the cheapest. In each case, to get the New Zealand dollar value, divide the cost of the T-shirt by the exchange rate given: for Typhoon, HK$18 ÷ 4.76 = $3.78; for Gracias, 21 pesos ÷ 6.99 = $3.00; for Sanbaidee, 35 000 kips ÷ 10 014 = $3.50; for Tiger, 9 ringitts ÷ 2.24 = $4.02.
3. Yes, they do. The Sanbaidee T-shirts from Laos are now the cheapest at $336 ($3.50 x 80 + $56), with the Gracias ones next at $348 ($3 x 80 + $108). The Typhoon ones would cost $350.40 ($3.78 x 80 + $48) and the Tiger ones would cost $353.60 ($4.02 x 80 + $32).
4. a. $5.62. (NZ$4.20 cost [includes freight] + 19% + 12.5% of that total)
b. Yes. It would cost him $10 to buy a basic T-shirt locally, so he would pay less using imported T-shirts.
activity two (page 14)
1. a. Answers will vary. For example, paying in T-shirts improves Whana’s cash flow, but it still takes him time to print the T-shirts.
Pages 13–14
Pages 15–18
New Zealand Made?
activity (page 15)
1. Answers will vary. For example, more people might want to buy calves (demand), there might be fewer calves for sale than last year (supply), or the cost of feeding the cows might be higher than last year, so it has cost more to keep the mothers healthy so that they produce quality calves.
Price is determined by supply (how many calves are for sale) and demand (how many people want to buy them). Supply factors include:
• the birth rate of calves per cow, which is affected by the health of the cows (for example, the quantity and quality of grass available can affect them)
• the number of calves that dairy farmers keep back for themselves.
Demand factors include:
• the history of how profitable it has been to raise calves in previous years
• the expected returns for the season, including sale price and costs.
Beefing up Business
4. a. $41.10 (using rounding) per T-shirt (GST inclusive), based on $36.50 per T-shirt ($26.50 costs + $10 profit, plus 12.5% GST). (Remember that his “wages” are part of his costs, not part of the profit. Note that GST is payable once a business’s income reaches a certain level.)
b. $800. ($10 x 80 T-shirts)
reflective questions
Answers may vary.
A spreadsheet would be useful because it allows Whana to change costs and/or prices and see what happens as a result. (This is called “if–then” analysis.) The spreadsheet can also display the information graphically, which can be useful to see trends and patterns.
If Whana prices his T-shirts at the top end of the market, he may not sell enough to cover his costs and make a profit.
b. Answers may vary. Over 10 days, the garage rental would be $100 and the cost of using the computer and printer $120. Not paying for these saves Whana only $2.75 per T-shirt ($220 ÷ 80). At $36.50 per T-shirt if bought in New Zealand, that would mean 6 T-shirts ($220 ÷ $36.50) or, if Whana doesn’t include any profit on the shirts he makes for Dad, 8 T-shirts ($220 ÷ $26.50). However, if he buys his T-shirts from Laos, he could sell them for about $32 to get a $10 profit. So he could give Dad 7 T-shirts ($220 ÷ $32) or 10 if he gives them to Dad at cost ($220 ÷ $22).
2. Answers will vary. For example, to be successful, Whana will need to sell all his T-shirts, he will need to make sure all his customers pay for the T-shirts (no bad debts), and his equipment must not break down.
reflective question
Answers will vary. For example, if they haven’t put any money aside from the profit they thought they were getting (including what they owed for tax), they may have no money to pay the tax bill when it catches up with them and the business may have to borrow extra money or close down.
9
Pages 19–21
activity one (page 19)
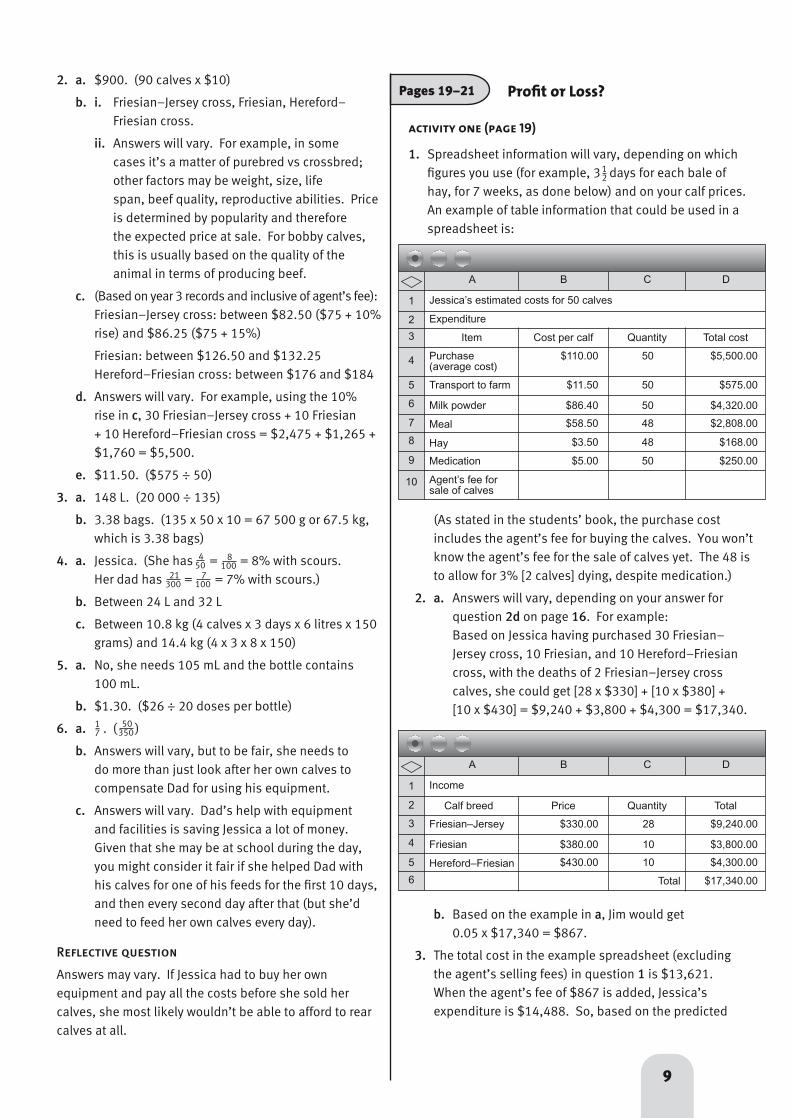
1. Spreadsheet information will vary, depending on which figures you use (for example, 3 days for each bale of hay, for 7 weeks, as done below) and on your calf prices. An example of table information that could be used in a spreadsheet is:
Profit or Loss?2. a. $900. (90 calves x $10)
b. i. Friesian–Jersey cross, Friesian, Hereford– Friesian cross.
ii. Answers will vary. For example, in some cases it’s a matter of purebred vs crossbred; other factors may be weight, size, life span, beef quality, reproductive abilities. Price is determined by popularity and therefore the expected price at sale. For bobby calves, this is usually based on the quality of the animal in terms of producing beef.
c. (Based on year 3 records and inclusive of agent’s fee): Friesian–Jersey cross: between $82.50 ($75 + 10% rise) and $86.25 ($75 + 15%)
Friesian: between $126.50 and $132.25 Hereford–Friesian cross: between $176 and $184
d. Answers will vary. For example, using the 10% rise in c, 30 Friesian–Jersey cross + 10 Friesian + 10 Hereford–Friesian cross = $2,475 + $1,265 + $1,760 = $5,500.
e. $11.50. ($575 ÷ 50)
3. a. 148 L. (20 000 ÷ 135)
b. 3.38 bags. (135 x 50 x 10 = 67 500 g or 67.5 kg, which is 3.38 bags)
4. a. Jessica. (She has = = 8% with scours. Her dad has = = 7% with scours.)
b. Between 24 L and 32 L
c. Between 10.8 kg (4 calves x 3 days x 6 litres x 150 grams) and 14.4 kg (4 x 3 x 8 x 150)
5. a. No, she needs 105 mL and the bottle contains 100 mL.
b. $1.30. ($26 ÷ 20 doses per bottle)
6. a. . ( )
b. Answers will vary, but to be fair, she needs to do more than just look after her own calves to compensate Dad for using his equipment.
c. Answers will vary. Dad’s help with equipment and facilities is saving Jessica a lot of money. Given that she may be at school during the day, you might consider it fair if she helped Dad with his calves for one of his feeds for the first 10 days, and then every second day after that (but she’d need to feed her own calves every day).
Reflective question
Answers may vary. If Jessica had to buy her own equipment and pay all the costs before she sold her calves, she most likely wouldn’t be able to afford to rear calves at all.
17
b. Based on the example in a, Jim would get 0.05 x $17,340 = $867.
3. The total cost in the example spreadsheet (excluding the agent’s selling fees) in question 1 is $13,621. When the agent’s fee of $867 is added, Jessica’s expenditure is $14,488. So, based on the predicted
Jessica’s estimated costs for 50 calves1
2
3
4
5
6
7
8
9
Expenditure
Item Cost per calf Quantity Total cost
Purchase (average cost)
Transport to farm
Milk powder
Meal
Hay
Medication
Agent’s fee for sale of calves
$110.00
$11.50
$86.40
$58.50
$3.50
$5.00
A B C D
50
50
50
48
48
50
$5,500.00
$575.00
$4,320.00
$2,808.00
$168.00
$250.00
10
(As stated in the students’ book, the purchase cost includes the agent’s fee for buying the calves. You won’t know the agent’s fee for the sale of calves yet. The 48 is to allow for 3% [2 calves] dying, despite medication.)
2. a. Answers will vary, depending on your answer for question 2d on page 16. For example: Based on Jessica having purchased 30 Friesian– Jersey cross, 10 Friesian, and 10 Hereford–Friesian cross, with the deaths of 2 Friesian–Jersey cross calves, she could get [28 x $330] + [10 x $380] + [10 x $430] = $9,240 + $3,800 + $4,300 = $17,340.
Income
A B
1
2
3
4
5
C
Calf breed Price Quantity Total
Friesian–Jersey
Friesian
Hereford–Friesian
$330.00
$380.00
$430.00
D
28
10
10
$9,240.00
$3,800.00
$4,300.00
Total $17,340.00
450
8100
21300
7100
50350
6
12

10
sale figures and fees in the 2a–b answers, and including the costs for the 2 dead calves, Jessica will make $17,340 – $14,488 = $2,852. This equates to $2,852 ÷ 48 = $59.42 per live calf.
4. Answers will vary.
• Changing breeds will probably make little difference to Jessica’s profit, depending on which breed any calves that die are. The extra money she pays to buy the dearer calves is about the same amount as the extra money she receives when she sells those calves.
• Jessica could increase her profit by raising more calves, but she will need more money “up front” to buy them.
• She cannot cut her costs because the calves need to be cared for properly or they will die or be less healthy, which affects the sale price/profit margin.
activity two (page 21)
1. The pattern is cyclic, which means that the pattern repeats; in this scenario, the pattern repeats each year. In November each year, Jessica sells the calves and pays the stock agent his selling fee. The sharp rises are the money she banks from selling the calves. Between November and July each year, the graph is rising slowly. Jessica has no outgoings (no dips), and her only income is the interest her money is earning while it stays in the bank. The dips are when Jessica has to spend money on buying calves, feed, and medicine.
2. Answers will vary, depending on how you allocate the costs from July to November (the time in which Jessica has to feed and care for her calves – her outgoings). See the example spreadsheet and assumptions below.
Assumptions
1. Account earns 8% per annum (0.66% interest each month)
2. Monthly calf-care costs of $2,012 ($7,546 ÷ 3.75; see the notes on page 44.)
3. July = total cost of purchase of calves, plus transport (see page 20, question 1); month calf-care costs
4. November = 1 week calf-care; sale of calves – fee (see page 20, question 2)
The graph below, based on the figures in this spreadsheet for year 4, is the graph on page 21 of the students’ book extrapolated out to 4 years.
$14,000
$12,000
$10,000
$8,000
$6,000
$4,000
$2,000
$0
Jan
MarMay
July
SeptNov
Balance in Jessica’s Account
$16,000
Jan
MarMay
July
SeptNov Ja
nMar
MayJu
lySept
Nov
Year 1
$18,000
$20,000
Jan
MarMay
July
SeptNov Ja
n
Bal
ance
Year 2 Year 3 Year 4

11
3. Answers will vary. Jessica wants to earn as much as possible by raising as many calves as possible. Her biggest constraints are how much money she will have available to buy calves in July each year and how much room and equipment there is on the farm for her to raise the calves (her father raises about 300 calves each year; if Jessica extends her number by 10 each year, that may well be all that the farm and current equipment can handle).
Jessica shouldn’t spend all her November sales money on new calves. She needs to leave enough to pay for feed and medicine, and she will also want to see her base savings grow. To project, using a spreadsheet, you would need to make some very broad assumptions. For example, assuming that Jessica makes about $59.40 (see page 20, question 3) profit per calf (allowing for 3% death rate) and gets 8% per annum interest on this amount for the 6 months before she needs to buy calves again the following July, the calves cost about $110.00 on average to buy, and she increases her calf numbers by 10 each year, her December figures could look like this:
Pages 22–28
activity one (page 22)
1. a. Answers will vary. For example, there are always set-up costs that you’ll need to pay before you make any sales (income).
b. $0.00
c. Answers will vary. For example, computers, company cars, and furniture are assets; loans and creditors are liabilities.
2. Discussion will vary. For Mike, profit will be the money he makes after all his customers have paid their bills and he has paid all his costs and expenses. Loss will be the amount of money he owes for costs and expenses after all his customers have paid their bills. The main risk for Mike is if he has to pay for parts before he has been paid by his customers or if his customers don’t pay in full and he still has to pay for the parts he used.
activity two (page 23)
1. a. Answers will vary. For example, it would be difficult to work out how much people expected to get for their money.
b. Answers will vary. For example, he could have specified what each item might cost and any special deal combinations.
2. a. Answers will vary. Mike should target as his customers: boys – because they are willing to spend more; 13-year-olds – because they are willing to spend more; girls – because their preferred options (flag and water bottle and holder) would be easy and quick to add whereas speedometers and gears (boys’ preferred options) are more complex.
b. Answers will vary. Boys tend to want to speed more than girls do. Many boys want the performance accessories that make bicycles go faster, handle better, or record speed. More girls than boys may prefer practical options that are about comfort and safety. However, Mike needs to also cater for girls who want speed and for boys who want comfort and safety. He should provide a performance package to target people who want their bicycles to go fast and a comfort and safety package for people who see their bicycle as a practical mode of transport.
On Your Bike, Mike
1
2
3
4
Calves sold Total money, after calves sold, at end of year
Year 4
Year 5
$17,861.52
$22,021.18
Year 6 $26,941.23
5
6
Year 7 $32,652.08
Year 8 $39,125.96
48
58
68
78
87
Note that, for year 8, the 3% death rate rounds to 3 deaths. Also note that, in real time, interest rates and average profit per calf would vary over time.
Reflective question
Answers will vary. If Jessica does have about $39,126 in her bank account in December of the year before she goes to university (she won’t be using any of it to buy and raise more calves while she is at university), then she will most likely think that the time she put into raising calves was very worthwhile. If she didn’t have that money, she might have to take out a student loan, which would take her quite a few years to pay back once she graduated.
So, on the plus side, she would have money for university without borrowing and she would have learned to manage money. On the minus side, raising the calves might affect her schoolwork, which could impact on what she is able to study at university, and there is also the trade-off (opportunity cost) of other things she might have had to
give up to look after the calves, such as sport, trips away, and other social events.
A B C

12
Part Mike needs to add on. That’s (33%) of what he pays.
Activity Three (page 24)
1. a. None of them are exactly 25% because the prices to Mike are all whole dollars. (For most of the lower amounts and the handlebars, the prices are rounded up to the nearest dollar, but for the $27.90 carrier and the other amounts over $45, the price to Mike is more than 25% off.)
b. No. He will need to add more than 25% to bring it back to the retail price.
2. a. Combo 1: people who are safety-conscious (flag) and want comfort (seat and water)
Combo 2: People interested in making their bike go as fast as possible (gears, special handlebars, speedometer), but more cheaply than they might pay elsewhere
b. Combo 1: $11 ($6 on parts plus $5 time)
Combo 2: $32 ($12 parts plus $20 time)
c. Answers will vary. For example, a sporty option: water bottle and holder and speedometer; a performance option: gears, handlebars, pedals, grips; bicycle makeover: the lot!
activity four (page 25)
1. Cash flow is having money available to pay bills when they are due. Maintenance services are small jobs that give Mike cash in hand to pay bills.
2. a. $17.40. ($14.90 + $2.50)
b. $2.70. ($1 + $1.70 [rounded up])
c. $43.20. ($39.90 + $3.30 [rounded down])
d. $29.90. ($24.90 + $5)
e. $13.70. ($12 + $1.70 [rounded up]
f. $54.60. ($47.90 + $6.70 [rounded up])
activity five (page 26)
1. a. Yes. He has $185.80 in the bank and the amount he wants to pay out is $140 ($30 advertising + $95 creditors + $15 wages)
b. No. He needs to use some of Uncle Lance’s $50 loan.
Mike pays Full retail price
2. a. If Eric doesn’t pay at all, the full opportunity cost to Mike’s business is $170. $138.00 of this is the fixed cost because he cannot write off the cost of the parts – he has to pay for them regardless; he also loses the opportunity of earning $12 mark-up on parts and $20 for his time.
b. i. $38.25
ii. $34. ($38.25 – $4.25 GST or $170 x 20%; $204 – $170 = $34)
c. Answers will vary. It depends on whether Eric’s father had agreed to pay for the mean machine special before Eric got Mike to do the work on his bike. If so, it also depends on whether Eric asked his dad to pay Mike or just forgot. If Eric got the work done without permission and doesn’t have the money to pay for it at the moment, his father should be discussing with him how he could earn the money to pay back his father (including the extra costs). If he had permission but forgot to ask his father for the $170 to pay Mike, then he should at least earn the extra money it has cost his father.
activity six (page 28)
1. a. Tipene: $13. ($42.90 – $29.90)
Julie: $0.00
Cody: $5.20. ($100.00 – $94.80)
Kim: $3.10. ($31.00 – $27.90)
Damien: $15. ($122.80 – $107.80)
b. He made more out of the parts. His labour earned him a total of $36.30, and the mark-up on the parts earned him $67.40 ($6.90 + $22.80 + $7.90 + $29.80). (However, Damien has only paid half of his bill ($61.40), and it will cost Mike $78 for the parts. If this turns out to be a bad debt, he will get nothing for his labour and it will cost him $16.60 for the unpaid parts. He also has to pay the $1.00 for the puncture patch and glue for Julie’s bike.)
c. Mike will lose money, both the actual cost for parts (patches and glue) and the opportunity cost of charging for labour. However, this small loss could be made up for by the goodwill generated because customers might return to Mike for larger, more profitable jobs.
13
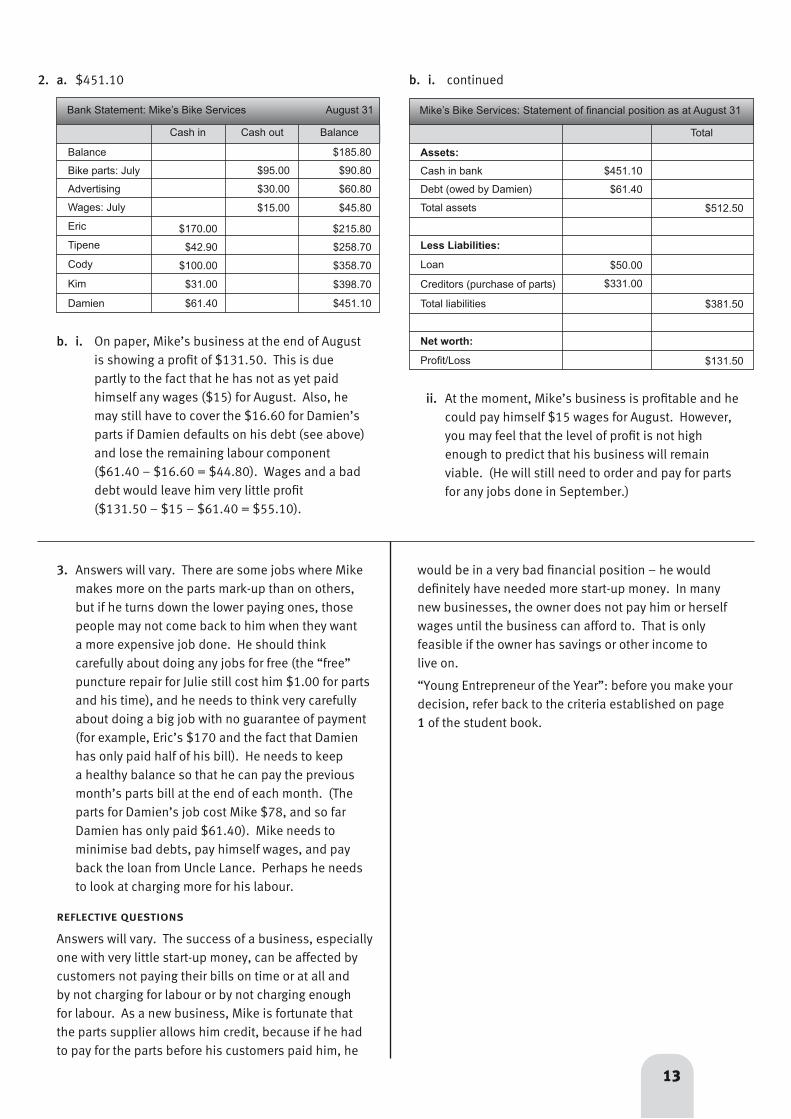
2. a. $451.10
Balance
Bike parts: July
$185.80
Balance
Bank Statement: Mike’s Bike Services
Advertising
Wages: July
Eric
Tipene
Cody
Kim
Damien
Cash out
$95.00
$30.00
$15.00
$90.80
$60.80
$45.80
$215.80
$258.70
$358.70
$398.70
$451.10
Cash in
$170.00
$42.90
$100.00
$61.40
$31.00
Assets:
Cash in bank $451.10
Total
Mike’s Bike Services: Statement of financial position as at August 31
Debt (owed by Damien)
Total assets
Less Liabilities:
Loan
Creditors (purchase of parts)
Total liabilities
$61.40
$512.50
$50.00
$331.00
$381.50
Net worth:
Profit/Loss $131.50
b. i. On paper, Mike’s business at the end of August is showing a profit of $131.50. This is due partly to the fact that he has not as yet paid himself any wages ($15) for August. Also, he may still have to cover the $16.60 for Damien’s parts if Damien defaults on his debt (see above) and lose the remaining labour component ($61.40 – $16.60 = $44.80). Wages and a bad debt would leave him very little profit ($131.50 – $15 – $61.40 = $55.10).
ii. At the moment, Mike’s business is profitable and he could pay himself $15 wages for August. However, you may feel that the level of profit is not high enough to predict that his business will remain viable. (He will still need to order and pay for parts for any jobs done in September.)
3. Answers will vary. There are some jobs where Mike makes more on the parts mark-up than on others, but if he turns down the lower paying ones, those people may not come back to him when they want a more expensive job done. He should think carefully about doing any jobs for free (the “free” puncture repair for Julie still cost him $1.00 for parts and his time), and he needs to think very carefully about doing a big job with no guarantee of payment (for example, Eric’s $170 and the fact that Damien has only paid half of his bill). He needs to keep a healthy balance so that he can pay the previous month’s parts bill at the end of each month. (The parts for Damien’s job cost Mike $78, and so far Damien has only paid $61.40). Mike needs to minimise bad debts, pay himself wages, and pay back the loan from Uncle Lance. Perhaps he needs to look at charging more for his labour.
reflective questions
Answers will vary. The success of a business, especially one with very little start-up money, can be affected by customers not paying their bills on time or at all and by not charging for labour or by not charging enough for labour. As a new business, Mike is fortunate that the parts supplier allows him credit, because if he had to pay for the parts before his customers paid him, he
b. i. continued
August 31
would be in a very bad financial position – he would definitely have needed more start-up money. In many new businesses, the owner does not pay him or herself wages until the business can afford to. That is only feasible if the owner has savings or other income to live on.
“Young Entrepreneur of the Year”: before you make your decision, refer back to the criteria established on page 1 of the student book.
Teachers’ Notes
14
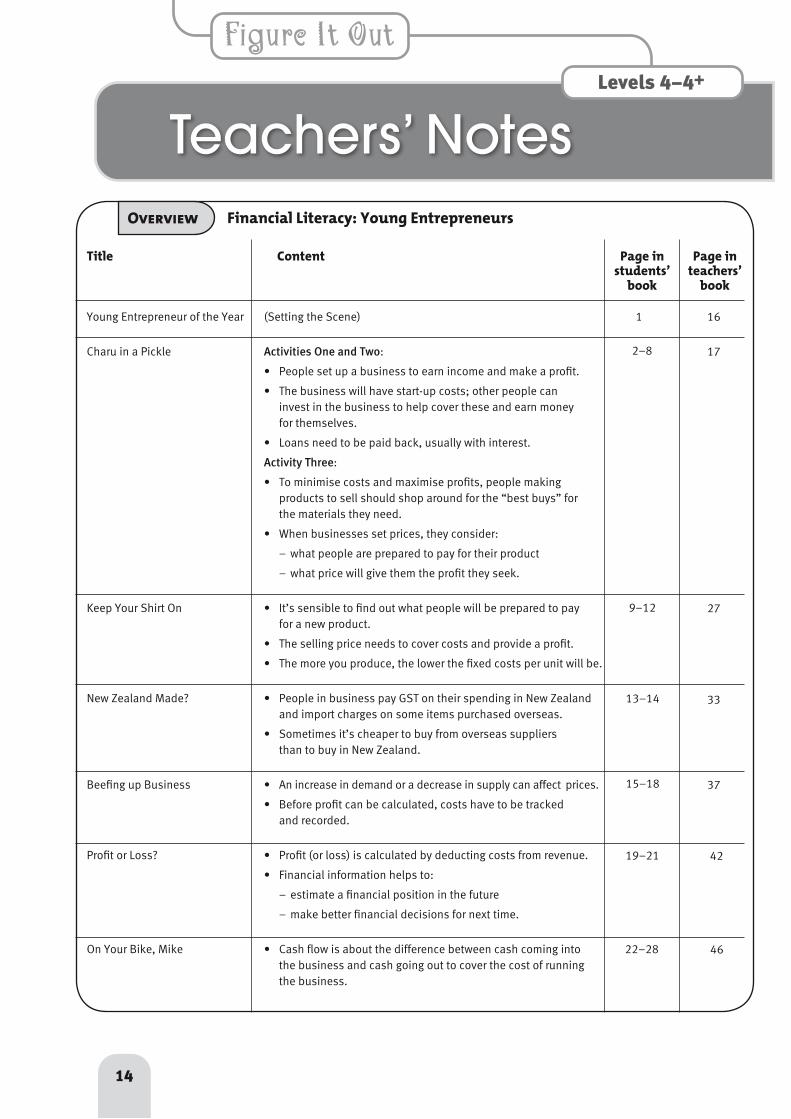
Young Entrepreneur of the Year (Setting the Scene)
Charu in a Pickle Activities One and Two:
• People set up a business to earn income and make a profit.
• The business will have start-up costs; other people can invest in the business to help cover these and earn money for themselves.
• Loans need to be paid back, usually with interest.
Activity Three:
• To minimise costs and maximise profits, people making products to sell should shop around for the “best buys” for the materials they need.
• When businesses set prices, they consider:
– what people are prepared to pay for their product
– what price will give them the profit they seek.
Keep Your Shirt On • It’s sensible to find out what people will be prepared to pay for a new product.
• The selling price needs to cover costs and provide a profit.
• The more you produce, the lower the fixed costs per unit will be.
New Zealand Made? • People in business pay GST on their spending in New Zealand and import charges on some items purchased overseas.
• Sometimes it’s cheaper to buy from overseas suppliers than to buy in New Zealand.
Beefing up Business • An increase in demand or a decrease in supply can affect prices.
• Before profit can be calculated, costs have to be tracked and recorded.
Profit or Loss? • Profit (or loss) is calculated by deducting costs from revenue.
• Financial information helps to:
– estimate a financial position in the future
– make better financial decisions for next time.
On Your Bike, Mike • Cash flow is about the difference between cash coming into the business and cash going out to cover the cost of running the business.
Overview Financial Literacy: Young Entrepreneurs
Title Content Page in students’
book
Page in teachers’
book
1 16
2–8
9–12
13–14
19–21
22–28
17
27
33
42
46
Levels 4–4+
15–18 37

15
Introduction to the Notes for Young Entrepreneurs
Use of headings
The notes that follow for the various activities, games, and investigations in the level 4–4+ Figure It Out Financial Literacy book have headings and sub-headings such as Financial Language, Financial Understanding, and Mathematics and Statistics. These are designed to help you focus on the parts of the notes that are most useful to you as you help your students work through the students’ book. Where appropriate, extra investigations and tasks are suggested.
Context for financial understanding
See the notes for Setting the Scene, on the next page.
The mathematics and statistics in Young Entrepreneurs
Numeracy links are provided for students at stages 7–8 on the Number Framework. All the students in your class should be involved in the financial literacy, social sciences, and other learning area discussions and tasks.
The financial literacy focus of these activities means that your involvement as the teacher is essential, particularly before you set any of the tasks to be completed independently. Prior teaching and discussion will enable your students to complete the work with understanding.
As in all numeracy work, students benefit greatly from sharing and discussing their ideas. This discussion is important in supporting their conceptual understanding.
Students will have various ways of solving problems or presenting the process they have used and the solution. You should acknowledge successful ways of solving questions or problems, and where more effective or efficient processes can be used, encourage the students to consider other ways of solving a particular problem.
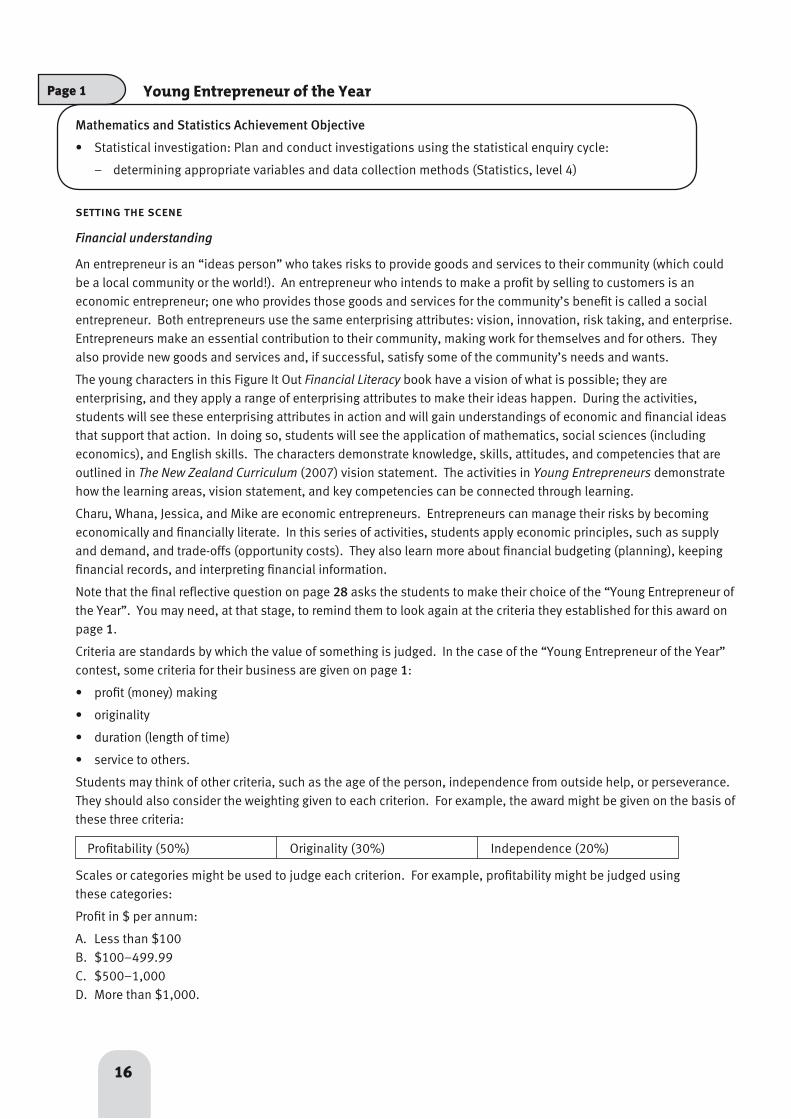
Page 1 Young Entrepreneur of the Year
16
setting the scene
Financial understanding
An entrepreneur is an “ideas person” who takes risks to provide goods and services to their community (which could be a local community or the world!). An entrepreneur who intends to make a profit by selling to customers is an economic entrepreneur; one who provides those goods and services for the community’s benefit is called a social entrepreneur. Both entrepreneurs use the same enterprising attributes: vision, innovation, risk taking, and enterprise. Entrepreneurs make an essential contribution to their community, making work for themselves and for others. They also provide new goods and services and, if successful, satisfy some of the community’s needs and wants.
The young characters in this Figure It Out Financial Literacy book have a vision of what is possible; they are enterprising, and they apply a range of enterprising attributes to make their ideas happen. During the activities, students will see these enterprising attributes in action and will gain understandings of economic and financial ideas that support that action. In doing so, students will see the application of mathematics, social sciences (including economics), and English skills. The characters demonstrate knowledge, skills, attitudes, and competencies that are outlined in The New Zealand Curriculum (2007) vision statement. The activities in Young Entrepreneurs demonstrate how the learning areas, vision statement, and key competencies can be connected through learning.
Charu, Whana, Jessica, and Mike are economic entrepreneurs. Entrepreneurs can manage their risks by becoming economically and financially literate. In this series of activities, students apply economic principles, such as supply and demand, and trade-offs (opportunity costs). They also learn more about financial budgeting (planning), keeping financial records, and interpreting financial information.
Note that the final reflective question on page 28 asks the students to make their choice of the “Young Entrepreneur of the Year”. You may need, at that stage, to remind them to look again at the criteria they established for this award on page 1.
Criteria are standards by which the value of something is judged. In the case of the “Young Entrepreneur of the Year” contest, some criteria for their business are given on page 1:
• profit (money) making
• originality
• duration (length of time)
• service to others.
Students may think of other criteria, such as the age of the person, independence from outside help, or perseverance. They should also consider the weighting given to each criterion. For example, the award might be given on the basis of these three criteria:
Scales or categories might be used to judge each criterion. For example, profitability might be judged using these categories:
Profit in $ per annum:
A. Less than $100 B. $100–499.99 C. $500–1,000 D. More than $1,000.
Profitability (50%) Originality (30%) Independence (20%)
Mathematics and Statistics Achievement Objective
• Statistical investigation: Plan and conduct investigations using the statistical enquiry cycle:
– determining appropriate variables and data collection methods (Statistics, level 4)

17
These categories ignore important factors, such as initial capital and the nature of the business (for example, high or low turnover). Note that making a profit is necessary if a business is to provide goods and services and employment to others in their community in the longer term.
Students will need to combine their weightings with their criteria and categories. For example, a score for originality might be:
Pages 2–8 Charu in a Pickle
Mathematics and Statistics Achievement Objectives
• Number strategies and knowledge:
– Use a range of multiplicative strategies when operating on whole numbers
– Understand addition and subtraction of fractions, decimals, and integers
– Find fractions, decimals, and percentages of amounts expressed as whole numbers, simple fractions, and decimals (Number and Algebra, level 4)
• Equations and expressions:
– Form and solve simple linear equations (Number and Algebra, level 4)
Number Framework LinksStudents need to be strong multiplicative thinkers to solve the problems in these activities. They need to be working at stage 7 at least, although some of the questions involve proportional reasoning at stage 8. For example, calculating interest payments involves using a percentage (decimal fraction) as an operator and finding what fraction of the company each person owns involves the part–whole construct of fractions.
activity one
Financial language
Business, income, profit, loan. (See the full glossary at the end of these teachers’ notes.)
Financial understanding
In this scenario, Charu puts her cooking skills to work to earn a profit. She investigates setting up a chutney business, but first she budgets for what she will need to pay out in costs. Through her business, students will explore how businesses are set up and run. They will also examine where the money could come from to start up her business.
The scenario introduces a range of financial ideas and business terminology that your students need to understand if they are to work independently on the activities. You may choose to teach these ideas first and then use the pages as application of the ideas and processes. Alternatively, you could work through the activities with your students in co-operative groups, teaching ideas as they arise. This is arguably a better approach because the students can apply their real-life experiences in developing the ideas.
Let the students read the first page together without answering the questions. Leave defining unknown words until the scenario is discussed.
Ask: What is Charu trying to do in this story? She is trying to set up a business (an economic organisation that produces goods and services for a profit). In Charu’s case, the goods are jars of chutney.
Why would she do that? To earn income. The money you earn from working and from other sources, such as profits from a business or interest on money saved, is all part of a person’s income. Charu also has a real interest in cooking and in setting up a business; given both those aspects, she should follow her dreams and give it a go. That is how she will learn about herself, her capabilities, and her skills.
Will all the money Charu earns from sales be income? That is, does it all get paid to her? No, she will have to pay other people money for things she buys from them to run her business. Money paid out to others will be for her business start-up costs and her ongoing operating expenses.
0.3 x 3 = 0.9 (overall score)
for 30% weighting mostly original

18
Why are Charu’s outgoings highest when she starts her business? She needs to buy equipment and ingredients to get the business going. Some of these expenses are “one-offs”, such as pots and cooking utensils, and some costs will occur each time she makes a batch of chutney, for example, the fruit for the ingredients.
Start-up capital is the money Charu needs to get the business going. Where might she get this capital? Charu may already have money herself in her savings that she is prepared to invest in her business. However, if she does think about using her own money, she needs to consider the opportunity cost – might she be better off using someone else’s money and keeping her own separate? If she doesn’t have enough capital, she might borrow money from someone else or from a bank. Note: Loans are liabilities, not capital.
If she borrows money, how does that work? Charu will need to pay that money back. She will probably also need to pay interest, that is, as well as paying back the money she has borrowed, she will pay some extra money to the lender for the use of their money.
What might change the amount of interest Charu pays back? The amount of money she borrows, the interest rate charged, and the amount of time it takes to repay the loan:
• The more Charu borrows, the more interest she pays.
• Interest rates can vary. They can vary according to the length of time for which you want to borrow the money, for example, a 6 month loan may be more expensive than a 2 year loan. Also, different banks and other lenders can and do lend at different rates. It pays to shop around for the best deal. Interest rates are written as a percentage and give a time period over which the interest is charged. For example, 10% p.a. means ten percent (one-tenth) charged per annum (every year).
• The period of time she has the money for before she pays it back will affect the amount of interest she pays. If she has it for 3 years, she will usually pay interest throughout that time. In fact, if her repayments are very low, she might end up paying interest on the interest. This is called compound interest.
Why is it important for Charu to create a budget? So she can plan what her income and expenses might look like ahead of time. Financial planning is important for personal and business financial success. This avoids her trying something that won’t work and tests whether a business is viable and potentially profitable. A budget enables Charu to identify, manage, and assess risk.
For Charu to see this business venture through, she needs to apply initiative, drive, and planning. Without these, the chance of success is reduced. (Things still happen, but are they what the business person wants to happen?)
After these discussions, the class could work through questions 1 and 2 together (see the Mathematics and Statistics section on page 20). Some aspects of question 3 may need to be discussed before the students work independently in small groups on that question. See below and also, mainly for extension, the comments on spreadsheet construction in the Mathematics and Statistics section for this activity. The students should be able to work independently in small groups on question 4. Refer to the Answers for ideas on discussing which bank gives the best deal.
Question 5 involves a further comparison. Discuss the reasons why Charu may or may not take Grandad’s offer. Central to any financial discussion are the key financial messages for students. Charu knows that a good financial decision will bring benefits; she will be looking to choose the one that brings the most benefit to her business. She realises that interest payments are an expense, an additional cost that has to be taken into account, and she discovers that an inverse relationship exists between the time taken to repay a loan and the amount repaid each week, month, and so on.
The students might use a spreadsheet, as shown in question 3, to explore Grandad’s scenario under different repayment options. Keeping the repayment amounts simple helps them to recognise the inverse relationship. You may need to point out that the “unpaid balance” amounts in the spreadsheet in question 3 (and in the
Amount borrowed ($)
Amount borrowed ($)
Amount paid back ($)
Interest
19
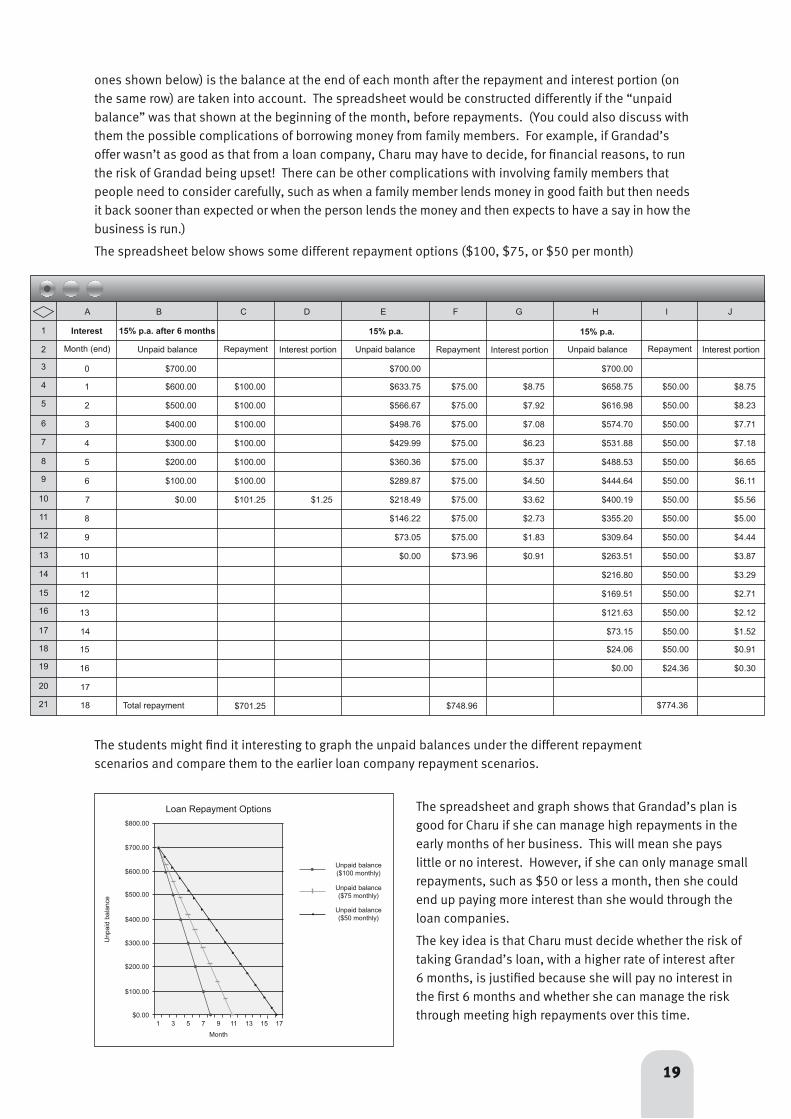
ones shown below) is the balance at the end of each month after the repayment and interest portion (on the same row) are taken into account. The spreadsheet would be constructed differently if the “unpaid balance” was that shown at the beginning of the month, before repayments. (You could also discuss with them the possible complications of borrowing money from family members. For example, if Grandad’s offer wasn’t as good as that from a loan company, Charu may have to decide, for financial reasons, to run the risk of Grandad being upset! There can be other complications with involving family members that people need to consider carefully, such as when a family member lends money in good faith but then needs it back sooner than expected or when the person lends the money and then expects to have a say in how the business is run.)
The spreadsheet below shows some different repayment options ($100, $75, or $50 per month)
Month (end)
15% p.a. after 6 months
Repayment
0
1
2
3
4
5
6
$700.00
$600.00
$500.00
$400.00
$300.00
$200.00
$100.00
$0.00
$100.00
$100.00
$100.00
$100.00
$100.00
$100.00
$101.25 $1.25
A
1
3
4
5
6
7
8
9
10
B C
15% p.a.
$700.00
$633.75
$566.67
$498.76
$429.99
$360.36
$289.87
$218.49
ED
Interest portion
$8.75
$7.92
$7.08
$6.23
$5.37
$4.50
$3.62
15% p.a.
$700.00
$658.75
$616.98
$574.70
$531.88
$488.53
$444.64
$400.19
HG
Repayment
$75.00
$75.00
$75.00
$75.00
$75.00
$75.00
$75.00
F
Interest portion
$8.75
$8.23
$7.71
$7.18
$6.65
$6.11
$5.56
J
Repayment
$50.00
$50.00
$50.00
$50.00
$50.00
$50.00
$50.00
I
7
8
9
10
11
12
13
11
12
13
14
15
16
17
$146.22
$73.05
$0.00
$2.73
$1.83
$0.91
$355.20
$309.64
$263.51
$216.80
$169.51
$121.63
$73.15
$75.00
$75.00
$73.96
$5.00
$4.44
$3.87
$3.29
$2.71
$2.12
$1.52
$50.00
$50.00
$50.00
$50.00
$50.00
$50.00
$50.0014
15
16
18
19
20
$24.06
$0.00
$0.91
$0.30
$50.00
$24.36
17
21 $774.3618 $701.25 $748.96Total repayment
The students might find it interesting to graph the unpaid balances under the different repayment scenarios and compare them to the earlier loan company repayment scenarios.
The spreadsheet and graph shows that Grandad’s plan is good for Charu if she can manage high repayments in the early months of her business. This will mean she pays little or no interest. However, if she can only manage small repayments, such as $50 or less a month, then she could end up paying more interest than she would through the loan companies.
The key idea is that Charu must decide whether the risk of taking Grandad’s loan, with a higher rate of interest after 6 months, is justified because she will pay no interest in the first 6 months and whether she can manage the risk through meeting high repayments over this time.
2 Unpaid balance Unpaid balance Unpaid balanceInterest portion
Loan Repayment Options
Month
$800.00
$700.00
$600.00
$500.00
$400.00
$300.00
$200.00
$100.00
$0.001 3 5 7 9 11 13 15 17
Unp
aid
bala
nce
Unpaid balance($100 monthly)
Unpaid balance($75 monthly)
Unpaid balance($50 monthly)
Interest

20
Month (end) Repayment Interest portion
0
1
2
3
4
5
6
$700.00
$696.75
$693.46
$690.13
$686.75
$683.34
$679.88
$676.38
$12.00
$12.00
$12.00
$12.00
$12.00
$12.00
$12.00
A
2
3
4
5
6
7
8
9
B C D
7
8
9
10
11
12
13
10
11
12
13
14
15
16 14
15
16
17
18
19 17
20 18 $12.00$634.85
Unpaid balance1
$8.75
$8.71
$8.67
$8.63
$8.58
$8.54
$8.50
$672.83 $12.00 $8.45
$669.24 $12.00 $8.41
$665.61 $12.00 $8.37
$661.93 $12.00 $8.32
$658.20 $12.00 $8.27
$654.43 $12.00 $8.23
$650.61 $12.00 $8.18
$646.74 $12.00 $8.13
$642.83 $12.00 $8.08
$638.86 $12.00 $8.04
$7.99
19
20
21
22
23 21
22
23
24
25
26 24
27 $288.00
$630.79 $12.00 $7.94
$626.67 $12.00 $7.88
$622.50 $12.00 $7.83
$618.28 $12.00 $7.78
$614.01 $12.00 $7.73
$609.69 $12.00 $7.68
Mathematics and statistics
Allow the students to work through question 1 co-operatively and then share their answers. These can be checked independently against those given in the Answers section.
Question 2 involves the calculation of interest. Students will need to understand how to:
1. calculate a percentage of an amount
2. enter formulae into a spreadsheet so that the computer calculates the interest for them.
Begin with the Credit Services scenario in which a flat rate of 7 percent per annum (p.a.) interest is charged. Strip diagrams, ratio tables, and double number lines provide useful graphical aids to solve proportional reasoning problems, such as finding percentages.
Consider the task of calculating 7 percent per annum interest on $700. A double number line representation would look like this:
$0
0%
$?
7%
$700
100%
Amount
Percentage
In this case, students need to establish some benchmarks for calculation. For example, finding 10 percent and halving that to find 5 percent gives boundaries for estimating 7 percent (between $35 and $70).
$0
0%
$35
5%
$700
100%
Amount
Percentage10%
$70
Another all too common scenario is where the monthly repayment is so low that very little money ends up being paid off the principal after quite a long period of time (and in some cases, the interest ends up being more than the repayment amount, so the principal grows!). For example, if Charu borrowed $700 and repaid it at $12 a month at 12 percent per annum, at the end of 2 years she would have paid $288 and still owe $609.69, as shown in this spreadsheet:
You also could have a useful discussion about the advantages and disadvantages of an interest-only loan. For someone just setting up a business and with limited income, the smaller payments could help them stay viable until they are established and have a better cashflow. However, there are disadvantages as well. For example, if Charu had an interest-only loan for the first 2 years at, say, 10 percent, at the end of that time she would have paid the loan company $700 x 10% x 2 = $140, but she would still owe just as much as when she started, that is, $700, which she would still be paying interest on while she is repaying the principal.

21
Alternatively, finding 1 percent, possibly by finding one-tenth of 10 percent, gives the required benchmark for calculating 7 percent. This is called a unit-rate strategy, that is, 1 percent is $7, so 7 percent is $49 (1:7 is the unit rate).
$0
0% 7%
$700
100%
Amount
Percentage
$49
$7
1%
This unit-rate strategy is just like the standard algorithm, for example, 700 x = £because 700 ÷ 100 x 7 = 7 x 7 = 49.
Ratio table and strip diagram representations of the same problem might look like this:
7100
Percentage (%) Amount ($)100 700
1 77 49
100%$700
$71%
$49 7%
It’s important for students to realise that interest is charged in addition to the amount borrowed, so Charu has to pay back both the borrowed amount and the interest. So paying the loan back in a one year scenario for Credit Services looks like this:
Total to pay back equals $700 + $49 = $749
$700 $49
$749
$749
Dividing by 12 gives the monthly repayments.
Question 2c involves an additional step in that Charu will pay 2 x 7% = 14% interest on $700 if she chooses to repay it over 24 months.
For question 3, the students need to understand tables of repayments and the concepts of interest and principal repayments. On any loan, part of a repayment is straight interest, paid to the bank for the privilege of using their money for a given time. Part of the repayment will be principal. The principal is the amount still owing to the bank from the original money borrowed, so as the loan progresses, more of the borrowed money is paid off. This means that the interest accrues on a decreasing amount of principal as the loan progresses. The repayments are usually fixed, so the proportion of principal paid off increases as the months go by, whereas the amount of interest decreases. One way to illustrate this is take a simpler scenario. Suppose that someone takes out a $48 loan at an interest rate of 25 percent per month. They pay off $20 per month.
Month 1
$48 $12
$20
$40
interest
interest
repaymentprincipalunpaid balance
Month 2
$40 $10 interest
repayment$30
Month 3
$30 $7.50 interest
$17.50 $20
$20
repayment

22
Students do not need to understand how the spreadsheet in question 3 was developed, although this provides excellent opportunities for extension. It’s important for the students to realise that 12 percent per annum interest applies at a rate of 1 percent per month.
Ask Why is this figure $7.00?
Month (end) Unpaid balance Repayment Interest portion Principal portion
0
1
$700.00
$644.80 $62.20 $55.20
A B
123
C D E
Fair and Square Finance charges 12 percent per annum or 12 percent over 12 months. Therefore we can do the same calculation using 1 percent per month. The spreadsheet has calculated 1 percent of $700. (This was done using the function =B2*0.01)
Ask Why are these figures $644.80 (instead of $700) and $55.20?
Month (end) Unpaid balance Repayment Interest portion Principal portion
0
1
$700.00
$62.20 $7.00
A B
123
C D E
2 $589.05 $62.20 $6.45 $55.754
$7.00
$55.20$644.80
The spreadsheet has worked out (using the function =C3–D3) how much of the $62.20 repayment ($55.20) went towards paying off principal. This amount was then taken off the unpaid balance (using the function =B2–E3) to get $644.80. Find out if the students can see the cyclic nature of the spreadsheet by challenging them to work out how the amounts $6.45 and $55.75 were calculated and why the unpaid balance in B4 is $589.05.
Social Sciences Links
Achievement objectives:
• Understand how people make decisions about access to and use of resources (Social Studies, level 3)
• Understand how exploration and innovation create opportunities and challenges for people, places, and environments (Social Studies, level 4)
The main resource in this activity that creates opportunities and challenge is money. Have the students discuss:
– how the different interest rates might affect Charu’s decisions about access to and use of resources
– how the cost of money has impacted on her budget. Could she make some different decisions? For example, does she need to spend $180 on a gas stove? Could she simply use the stove at home? Is this fair, and who and how could she pay for access to this resource?
There are other areas that can also be explored, such as the cost of accessing money.
activity two
Financial language
Shares, dividend, start-up capital
Financial understanding
In this activity, Charu explores other sources of money to start her business. She decides to raise money through a share issue. The capital she raises through these shares means that she
23
has shareholders (co-owners of her business). If she makes a profit, she will pay them a dividend (a share of the profit based on the number of shares owned).
Charu collects, organises, and analyses information as she looks for the best way to finance her business. She will also be negotiating with and influencing those people interested in being shareholders in her business. Having good financial information to give them will be very important to her success.
Some students may have prior knowledge about shares; others may not. Ask: Charu is going to issue shares in her company. What does that mean? In return for providing Charu with money to use as capital, some people or organisations will own part of her company. These people or companies are known as shareholders.
Why do people buy shares in companies? Shares can be bought and sold. Sometimes, like houses, their value goes up; sometimes their value goes down.
What causes the price of shares to go up and down on the share market? The value of shares is a sign of what buyers and sellers think they are worth. Usually, companies that make good profits and pay their shareholders a reasonable part of these profits have shares that increase in value. The part of the profits paid to shareholders for each share is called a dividend.
Before the students attempt questions 3 and 4, discuss the term “profit” with them. This is the amount of money a business has left over from their revenue after it has paid its expenses. Profits paid out as dividends are usually allocated to shareholders on a “per share” basis. Deciding how much each shareholder gets paid is another example of proportional reasoning. Also note that, although for some people profit is the motivation for setting up a business, equally important for others is the incentive to take an idea or personal talents and see if they will sell in the marketplace.
Mathematics and statistics
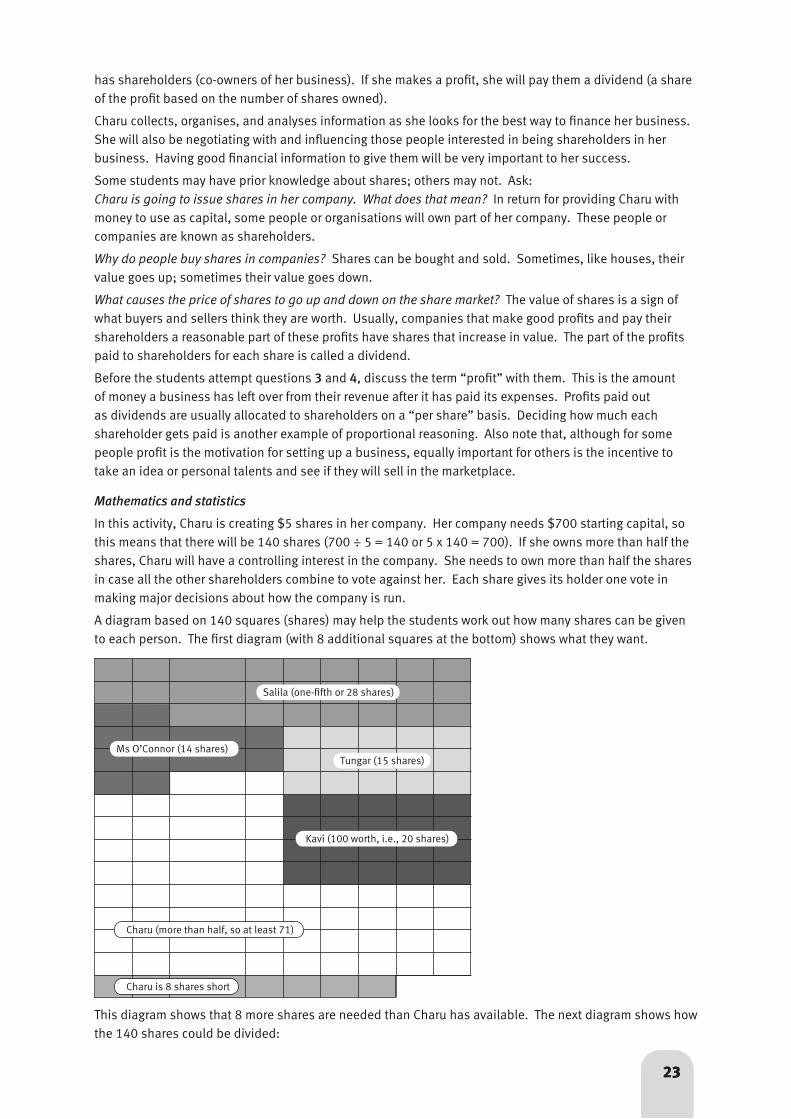
In this activity, Charu is creating $5 shares in her company. Her company needs $700 starting capital, so this means that there will be 140 shares (700 ÷ 5 = 140 or 5 x 140 = 700). If she owns more than half the shares, Charu will have a controlling interest in the company. She needs to own more than half the shares in case all the other shareholders combine to vote against her. Each share gives its holder one vote in making major decisions about how the company is run.
A diagram based on 140 squares (shares) may help the students work out how many shares can be given to each person. The first diagram (with 8 additional squares at the bottom) shows what they want.
This diagram shows that 8 more shares are needed than Charu has available. The next diagram shows how the 140 shares could be divided:
Salila (one-fifth or 28 shares)
Ms O’Connor (14 shares)Tungar (15 shares)
Kavi (100 worth, i.e., 20 shares)
Charu (more than half, so at least 71)
Charu is 8 shares short

24
The students’ decisions about how to allocate the shares affect their answers to what percentage of the company each person owns. These percentages are best calculated using number of shares rather than the value of the shares. For example, Kavi’s $100 in shares equates to 20 shares at $5.00 each. Twenty out of 140 shares is one-seventh (1 ÷ 7 = 0.1429), so if Kavi is able to buy 20 shares, he would own 14.3 percent of the company.
To work out how much each shareholder gets paid in dividends, the students might use two different types of strategy and compare the amounts they come up with.
The first way is to find the unit rate per share. There are 140 shares and an expected profit of 6 x $28 = $168 in the year. So each share should be allocated 168 ÷ 140 = $1.20. The amount paid to each person is $1.20 multiplied by the number of shares they own. So if Charu owns 71 shares, she gets 71 x $1.20 = $85.20.
The other strategy is based on the fraction of the shares each person owns. If Charu owns 71 shares, she will receive x $168.00 = $85.20. The first strategy uses a rate strategy (1 : 1.2 as 70 : 85.20), and the second strategy uses a fraction as an operator.
Discuss with the students what tax means. Most will know that their parents pay tax to the government on the money they earn. This means that a part of each dollar earned is taken by the government in tax to provide services like health, education, and superannuation. This part is known as the tax rate because it can be expressed as a comparison between money earned and money taken as tax. Tax is often expressed as “x cents in the dollar”, which can be expressed symbolically as x :1 (for example, $0.31 tax for each 1 [dollar] earned).
Calculating how much tax each shareholder will pay on their dividends is another problem that involves a fraction as an operator. The tax rate set for this activity is 25 percent. 25 percent is a fraction, , that can be more simply expressed as . So Charu, with 71 shares, will pay x $85.20 = $21.30.
reflective question
Financial understanding
If Charu doesn’t make a profit, it means that her business expenses are greater than the sales revenue from the business. To pay for the expenses, she will have to use her loan and, if that’s still not enough, her start-up capital (from shares sold). Making a loss is normal when a business first starts up, but if Charu’s cash flow is insufficient to continue running the business on an ongoing basis, then she would have to close down, knowing that some of her suppliers, her grandad, and her shareholders may not get their money back. Bankruptcy is a big risk in starting up a business. The shareholders are the last to be paid back.
Salila (26)
Ms O’Connor (12)Tungar (13)
Kavi (18)
Charu (71)
14
71140
25100
14

25
Social Sciences Links
Achievement objective:
• Understand how the ways in which leadership of groups is acquired and exercised have consequences for communities and societies (Social Studies, level 4)
Have the students discuss how Charu is attempting to acquire leadership of her company (community) and what consequences this will have for:
– herself
– her shareholders
– the company.
activity three
Financial language
Costs, price, profits, sales revenue, operating costs (business expenses)
Financial understanding
For business success, Charu will want to make decisions that maximise her profit. Profit = sales revenue – cost of sales.
In this activity, through Charu’s business decisions, students explore the concept of “shopping around” and minimising business expenses. Charu has to set her prices for her chutneys; the prices set in her budgets must make a profit. She may also discover that if people really like her chutney, she can charge a higher price.
Charu’s actions of shopping around and setting prices to maximise profits are good business practice. This involves her in planning and organising, being flexible, and dealing with change, all of which are attributes that support good business practice.
Discuss with the students What might be the advantages and disadvantages of Charu “shopping around” to buy her fruit and vegetables at the best price from different stores?
The advantage is that potentially Charu might save money by getting the best deals from each market. The disadvantage is that she will use up time and transport going to three markets instead of one.
Another consequence is that Charu won’t establish a business relationship between herself and a single supplier. Such a relationship can help establish “goodwill”, which may mean the supplier provides extra goods and services free of charge or provides a discount for loyalty. A single supplier is more likely to provide continued supply of fruit and vegetables in times of scarcity than multiple suppliers.
Get the students to work co-operatively through question 1 and to check their answers from the Answers section. Discuss the chart of fruit and vegetable prices. Ask Why are the prices cheaper in the first half of the year than they are in the second half of the year?
The prices of fruit and vegetables, like most goods and services, are determined by supply and demand. In the first half of the year, fruit and vegetables grow well and many fruits are picked during that time. This means that supply is high, with lots of fruit and vegetables for sale, usually at very reasonable prices. In the second half of the year, fewer fruit and vegetables are available for sale and prices tend to be higher. Some of these products are imported from countries in the northern hemisphere, so the transport costs are higher.
The demand for fruit and vegetables varies little across the year. Some people store fruit and vegetables by freezing and bottling (canning) during the first half of the year when prices are lower, so the quantity demanded is slightly higher at these times. People won’t store fruit and vegetables unless it is cheaper to do so.

26
Question 2 is suitable for small discussion groups. The students may need prompting to weigh up the advantages and disadvantages of Charu buying her fruit and vegetables at the cheapest time.
Charu’s decision about when to buy her ingredients is about managing price and availability risks. She will look at these risks and weigh up the advantages and the disadvantages of buying her ingredients at different times.
reflective question
Financial understanding
The supply and demand of goods determines their prices. This means that if there is a large demand relative to supply, prices will rise. Conversely, if there is a low demand relative to supply, prices will fall.
Advantages Disadvantages
Lower costs Storing fruit and vegetables (space, risk)
Focus only on making chutney No income from selling for a while (rather than selling)
So prices can move up or down because demand and supply are changing all the time. This is easily seen in the supermarket. For example, one week, kiwifruit will be selling for $1.99 kg (during picking season when export rejects are sold on the local market), then prices rise after the picking season and are around $4.00 kg, even though they are still export rejects! As another example, a puzzle that cost a lot 3 years ago when demand was high may now be cheap because most people have one and demand is low. Also, when the price was high, more businesses would want to make that type of puzzle to “cash in” on the high prices. This extra supply would have brought the price down. The unit cost of the puzzle would also have reduced because of the large scale of production.
The price of many goods and services go in cycles, known as market cycles. Fruit and vegetables are one example because their supply is dependent on the growing seasons. Historically, house prices have tended to go up and flatten out or marginally decrease in cycles of about 7 years. Trendy items such as new technology, label fashion, and toys are also cyclic.
Increased supply often results in lower per-unit production costs because of mass production; the cost of producing commonly used technology such as cellphones or computers is a good example of “economies of scale”.
Social Sciences Links
Achievement objective:
• Understand how producers and consumers exercise their rights and meet their responsibilities (Social Studies, level 4)
Have the students discuss who the producers and consumers are in this activity, what some of their rights and responsibilities are, and how these impact on each other. (For example, quality of product: if the quality is poor, this will have flow-on impacts on Charu’s business.)
Supply
Low (little available) High (lots available)
Moderate prices Low prices
High prices Moderate prices
Low (little wanted)
High (lots wanted)Dem
and
Customers may want to buy chutney all year round

27
Pages 9–12 Keep Your Shirt On
Mathematics and Statistics Achievement Objectives
• Number strategies and knowledge:
– Use a range of multiplicative strategies when operating on whole numbers
– Understand addition and subtraction of fractions, decimals, and integers
– Find fractions, decimals, and percentages of amounts expressed as whole numbers, simple fractions, and decimals (Number and Algebra, level 4)
• Patterns and relationships:
– Generalise properties of multiplication and division with whole numbers
– Use graphs, tables, and rules to describe linear relationships found in number and spatial patterns (Number and Algebra, level 4)
• Statistical investigation: Plan and conduct investigations using the statistical enquiry cycle:
– gathering, sorting, and displaying multivariate category, measurement, and time-series data to detect patterns, variations, relationships, and trends (Statistics, level 4)
Number Framework Links Students need to be strong multiplicative thinkers to solve the problems in this activity. They need to be working at stage 7 at least, although some of the questions involve proportional reasoning at stage 8. For example, calculating tax payments involves using a percentage (decimal fraction) as an operator.
activity one
Financial language
Profit margins
Financial understanding
In this activity, students follow Whana’s thinking in pricing his T-shirts. Whana knows he has a good product, so he’s keen to find out what people are prepared to pay for it. He anticipates that this price will cover his costs and provide him with a profit. He also does his maths and can see that if he can sell more, his fixed costs per unit will fall, allowing him to have higher profit margins.
Whana is still at the planning and organising stage of his business. By analysing these figures and setting the best price for his market, he is identifying, managing, and assessing risks.
Students who have taken part in enterprising activities soon learn about the theory of supply and demand: once students take their products to market, they can see whether the quantity they supplied was too small for the price ticket they put on the goods. If they have a long queue and the product is snapped up, then they will conclude the price was too low. Equally, if the students have products for sale and the goods sit unsold, they very quickly drop the price to clear their stock of goods! Students understand supply and demand at a practical level, but communicating the principles of supply and demand often trips them up. One of the issues is the time frame. For their own market day, there is a fixed quantity on sale, and therefore demand determines the market price on the day. However, if they have time to produce more, the quantity to be supplied is a variable, influencing the potential market price. Deciding what quantity to take to market is a very difficult decision for students to make; if the quantity is too small, they have lost the opportunity of earning higher sales revenue, and hence a higher profit, and if the quantity is too large, they may even make a loss! Pricing is one of the hardest decisions to make because it involves some “guesstimates” about what people will buy at what prices.
Activity One looks at the relationship between the price ticket on the item and the quantity demanded for that item. Introduce this by choosing a semi-valuable item (for example, a music CD or a set of felt pens) and offering to sell it to the students at a certain price. Collecting, organising, and analysing information, including setting the price, is an important part of business planning.

28
Say: I am offering this (item) to you for 10 cents. Put your hand up if you’d be willing to buy it at that price. (Some students will want to buy 10 at that price!)
Price offered Quantity to be purchased by class
$0.10$0.20…
3025…
Demand for T-shirts
Total quantity demanded
Pric
e ($
)
0 10
0
10
20
30
40
50
60
20 30 40 50 60 70 80 90 100
Begin a table that shows the quantities that students would like to buy of the item at each price point. Tell the students that they are all potential buyers (purchasers).
T-shirt prices Purchases Gross revenue
$5
$10
100
95
A B
123
C
$12
$15
72
64
45
$20
$22
51
42
67
$25 288
$500
$950$864
$960$1,020
$924$700
$30$35
$40$50
9 16 $48010 9 $315
11 9 $36012 8 $400
Keep offering the item at increasing price points, for example, 50 cents, $1.00, $5.00, $20.00, $50.00). Record each of the “total quantity demanded” by willing buyers as the price increases. Graph the pattern on a scatterplot. Ask: What does this graph show?
As the advertised price increases, the number of willing buyers goes down, as does the quantity they indicate they want to purchase. (Note: The word quantity is critical, so encourage the students to use it, for example, quantity supplied, quantity demanded). Ask Why do people want to buy 30 of the item at 10 cents, but only one person wants to buy the item at $100?
At 10 cents, it’s a good “buy”, that is, it costs much less than you would pay elsewhere. At $100, it’s a bad “buy” because it can be bought much cheaper elsewhere.
Get the students to read through and attempt Activity One, which looks at a similar demand curve to ascertain the potential demand for Whana’s T-shirts. Market research is a part of the financial planning undertaken when setting up a business. It’s pointless for a business to produce goods or services that cannot be sold at a price that adds to the business’s profit. Note: The expected total revenue can be calculated by multiplying the quantity demanded by the price.
Another interesting way of presenting this data is by considering how the gross revenue depends on the price, not just the quantity demanded.

29
Price of each T-shirt ($)
Rev
enue
($)
0
0
200
400
600
800
1 000
1 200
20 40 60
Graphing this data and identifying any local maximum will clearly show at what price Whana needs to set his T-shirts to maximise his revenue:
Question 2 encourages students to consider the fact that businesses must balance the supply of their product with the demand for it. Whana aims to sell at a price that equates his quantity supplied with the quantity demanded and at a price that covers the cost of producing his T-shirts plus a fair profit. There’s no point in Whana selling 100 T-shirts at $5.00 each if it costs more than $500 to make those T-shirts. His research indicates that 8 or 9 percent of people would buy his T-shirts at $30.00 each. Acting in a financially responsible way for a business involves selling enough of their product at a price that makes a reasonable profit so that the business is able to continue.
Mathematics and statistics
To interpret the graphs in question 1, the students need to identify the rate of change between price and quantity. That is, how much extra quantity of product could be sold if the price was reduced by $1.00. Note that the students can also calculate the expected change in revenue by changing the price by $1.00 because revenue is calculated by multiplying price by quantity. Sometimes this decision to reduce price increases total revenue; at other times, it reduces total revenue – it depends how potential customers react to your price change! This rate of change between, in this case, price and quantity, is a critical concept in developing pre-calculus thinking.
The students should accept or reject the graphs by looking for connections between the pattern of points and the table of the quantity of purchases. For example, graph a shows a linear pattern of points. The slope of a line passing through the points is constant, so the difference between the number of purchases for each unit increase in price should be constant.
Students may also work from the table to the possible graph. The last few price points in the table show very similar numbers of purchases. This would show in a scatterplot as zero slope, that is, a horizontal arrangement of points. Graphs b and c reflect this pattern of points. Graph b shows a relation that makes a pattern of steps. This would represent a table in which there are several places where an increase in price has no effect on the number of buyers. This is not the case in Whana’s table, so graph c is the most likely. The students could check this by entering Whana’s table into a spreadsheet and using the graphing tool to create a scatterplot.
If the students have difficulty with this graphing question, they could use spreadsheets to develop the connections between number patterns in tables and the slope of points on a graph. Get the students to create scatterplots for the following tables and connect the patterns in numbers with the slope of the lines connecting the points. Tell them which values go on the vertical scale and which values go on the horizontal scale.

30
1015
5
2025
4060
20
80100
1015
5
2025
8060
100
4020
1015
5
2025
8050
80
5050
1015
5
2025
7040
110
2010
Social Sciences Links
Achievement objectives:
• Understand that people make decisions about access to and use of resources (Social Studies, level 3)
• Understand how exploration and innovation create opportunities and challenges for people, places, and environments (Social Studies, level 4)
Have the students discuss how price impacts on a buyer’s access to resources (in this case, Whana’s T-shirts). Ask: Does price influence your buying decisions? Is it always a good idea to see price as a guide to the quality and desirability of a product?
activity two
Financial understanding
In this activity, students consider what are the one-off costs to get the business up and running and what are ongoing costs. They then consider what are fixed costs for any day and variable costs for that day. Classifying costs into fixed and variable is another important way for a businessperson to collect, organise, and analyse information. This helps with pricing decisions.
Mathematics and statistics
To help the students consider the difference between fixed and variable costs, you could set up the scenario that you are going to sell bubbles. You will need a bowl, a bubble wand, water, and detergent (bubble liquid). Act out creating bubbles and selling them to class members. Ask:
What is likely to happen if I want to sell 1 000 bubbles today? The bowl will need to be refilled several times and filled with water and bubble liquid.
What does it cost me to make each bubble? The cost of the water, the bubble mixture, the bowl, the wand, and your time.
Suppose I made only 500 bubbles. Would my costs be the same? No, you would use less water, bubble liquid, and time, but the cost of the bowl and wand would be the same.
Now suppose the cost of water, bubble liquid, and my time is 10 cents for each bubble. What is the cost of the bowl and the wand for each bubble? That depends on how many bubbles you make. That cost has to be spread out over what you charge for all of the bubbles.
Is it cheaper to make 1 000 bubbles than 500 bubbles? No, it costs more because you use more water, bubble liquid, and time.
Is the cost per bubble the same? Why? No, the cost per bubble decreases as more bubbles are made because the cost of the bowl and wand is “spread out” over all the bubbles.
In financial terms, some of my bubble-making costs are fixed and some are variable. Variable means they change with the volume of production. Which of my costs do you think are fixed and which are variable? The cost of the bowl and the wand is fixed. The costs of the water, the bubble liquid, and time are variable.
Now that they have this background, let the students attempt Activity Two.
The calculation of production costs for Whana’s T-shirts is complex. Question 3b seeks to simplify this calculation by excluding the fixed cost. The extra cost of producing the “next” item is referred to as the marginal cost. Students should recognise that the variable costs per T-shirt involved here are the cost of the T-shirt ($10.00) and ink and stencil ($2.50).

31
All other costs are fixed for a day because Whana has to pay them no matter how many T-shirts he makes on that day. Whana will have to decide which is the best quantity to produce on any one day, given the information provided.
Social Sciences Links
Achievement objective:
• Understand how people make decisions about access to and use of resources (Social Studies, level 3)
Have the students discuss why Whana’s dad is charging for the use of the garage and computer. Is this fair? Will this influence Whana’s use of these resources?
activity three
Financial language
Advertising, marketing
Financial understanding
In this activity, students learn about advertising and setting selling prices. Advertising is one of the marketing decisions a business makes. The other marketing decisions they make are how they will package their goods, price their goods, and the place they will sell their goods at or through.
Marketing involves a lot of planning and organising. If planning and organising the campaign is done well, it will influence people to buy the product. For marketing to be successful, the business person needs to generate and use creative ideas and processes in creating the campaign. They also need to communicate these and be open to ideas and information from other sources.
Businesses advertise for two main reasons: to make potential customers aware that they exist to sell a product or products and to create demand for these. Whana’s timing of his production before Christmas shows that he is using the opportunity of increased demand for gifts to market his T-shirts.
The students also need to consider whether Whana’s time is a fixed or variable cost. Because he pays himself as a casual worker based on the number of hours he works, his wages are a variable cost. For businesses that employ people on wages or salaries for fixed times, these costs are fixed because they must be paid no matter how much is produced or sold.
As noted in the students’ book for question 4 a–b, income tax on Whana’s profit has not been included in this exercise for the sake of simplicity. However, you might want to explain to the students that businesses usually allow for that extra tax when setting the prices that will bring them the profit they want to earn. With regard to the goods and services tax (GST), most businesses in New Zealand display prices that have the GST included. However, this is not always the case, and the students should be aware that GST is sometimes added on to the price, particularly in the sale of land and land agents’ fees. A business that is GST registered can claim back from the Inland Revenue any GST they pay on goods and services used to make their product. So most firms budget in net (before tax) amounts.
Mathematics and statistics
Assuming that Whana consistently produces 8 T-shirts per day allows the fixed costs to be spread out across all 8 T-shirts. The term “rate” refers to a multiplicative relationship between two measures, in this case cost (in dollars) and product (T-shirts). In calculating the cost per T-shirt, the students are working out the unit rate, that is, the cost for each T-shirt. The most difficult of these calculations are those involving time because three measures are involved: time, wages, and T-shirts. For example, printing and tidying up takes Whana 20 minutes per T-shirt, and 20 minutes is one-third of an hour. Whana pays himself $10.00 per hour, so the cost of printing and tidying up per T-shirt is one-third of $10.00, which is $3.33.
Question 2b also involves spreading out the cost of the advertising and computer program over all 10 days and 80 T-shirts.
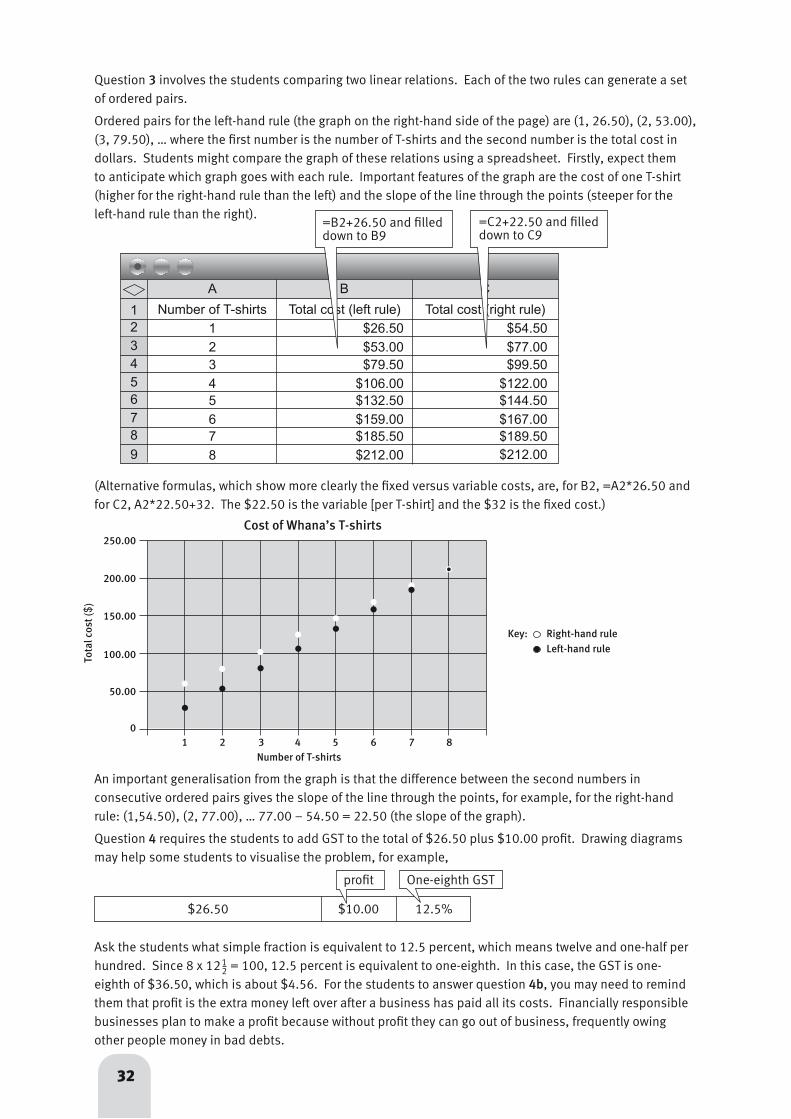
32
Question 3 involves the students comparing two linear relations. Each of the two rules can generate a set of ordered pairs.
Ordered pairs for the left-hand rule (the graph on the right-hand side of the page) are (1, 26.50), (2, 53.00), (3, 79.50), … where the first number is the number of T-shirts and the second number is the total cost in dollars. Students might compare the graph of these relations using a spreadsheet. Firstly, expect them to anticipate which graph goes with each rule. Important features of the graph are the cost of one T-shirt (higher for the right-hand rule than the left) and the slope of the line through the points (steeper for the left-hand rule than the right).
Number of T-shirts Total cost (left rule) Total cost (right rule)
1
2
$26.50
$53.00
A B
12
C
3
4
$79.50
$106.0055
6
$132.50
$159.00
67
7 $185.508
$54.50
$77.00$99.50
$122.00$144.50
$167.00$189.50
89 $212.00 $212.00
4
=B2+26.50 and filled down to B9
(Alternative formulas, which show more clearly the fixed versus variable costs, are, for B2, =A2*26.50 and for C2, A2*22.50+32. The $22.50 is the variable [per T-shirt] and the $32 is the fixed cost.)
Cost of Whana’s T-shirts
Tota
l cos
t ($)
50.00
100.00
150.00
200.00
250.00
An important generalisation from the graph is that the difference between the second numbers in consecutive ordered pairs gives the slope of the line through the points, for example, for the right-hand rule: (1,54.50), (2, 77.00), … 77.00 – 54.50 = 22.50 (the slope of the graph).
Question 4 requires the students to add GST to the total of $26.50 plus $10.00 profit. Drawing diagrams may help some students to visualise the problem, for example,
$26.50 $10.00 12.5%
profit One-eighth GST
Ask the students what simple fraction is equivalent to 12.5 percent, which means twelve and one-half per hundred. Since 8 x 12 = 100, 12.5 percent is equivalent to one-eighth. In this case, the GST is one-eighth of $36.50, which is about $4.56. For the students to answer question 4b, you may need to remind them that profit is the extra money left over after a business has paid all its costs. Financially responsible businesses plan to make a profit because without profit they can go out of business, frequently owing other people money in bad debts.
12
=C2+22.50 and filled down to C9
3
01 2 3 4 5 6 7 8
Key: Right-hand ruleLeft-hand rule
Number of T-shirts

33
Pages 13–14 New Zealand Made?
Mathematics and Statistics Achievement Objectives
• Number strategies and knowledge:
– Use a range of multiplicative strategies when operating on whole numbers
– Understand addition and subtraction of fractions, decimals, and integers
– Find fractions, decimals, and percentages of amounts expressed as whole numbers, simple fractions, and decimals (Number and Algebra, level 4)
• Patterns and relationships:
– Use graphs, tables, and rules to describe linear relationships found in number and spatial patterns (Number and Algebra, level 4)
Number Framework LinksStudents undertaking this activity need to be at stage 7 or above. They will be required to solve rate problems involving decimal multipliers, so they will be working towards advanced proportional thinking (stage 8).
Rate problems involve a multiplicative relationship between two measurements. In the case of exchange rates, the measurements are the values of two different currencies. When we say the exchange rate for converting New Zealand dollars into Australian dollars is 0.92, we mean that NZ$1.00 is exchanged for A$0.92 (92 Australian cents).
reflective question
The first reflective question focuses on the power of spreadsheets for calculating costs and prices. Spreadsheets are a modern electronic form of the paper ledgers kept by bookkeepers before computers. The great advantage of spreadsheets over paper ledgers is that they calculate amounts automatically and allow for if–then predictions. If–then predictions are situations where something is changed and the effect is looked at. For instance, consider the effect if Whana charges $12.00 per hour for his work rather than $10.00. A new paper ledger would be needed each time something is changed. With a spreadsheet, all entries can be altered and returned to their former “default” (status quo) easily.
Spreadsheets are also very useful because you can quickly and easily draw “pictures” (graphs) of your data. Many people find it easier to see patterns from pictures than from lists of numbers in a table.
Social Sciences Links
Achievement objective:
• Understand how producers and consumers exercise their rights and meet their responsibilities (Social Studies, level 4)
Have the students discuss what rights Whana will have to consider for his customers when he is marketing his T-shirts, for example, the quality of the product, including accurate graphics and text.
activity one
Financial language
Tax, suppliers, import, freight, Customs, exchange rate
Financial understanding
Whana’s keenness to “shop around” for the best prices for his materials demonstrates good business decision making. He also sees the benefits of using overseas suppliers for buyers of large-scale production, that is, lower production costs. In his investigations, he collects, organises, and analyses a range of financial information. Whana also learns that it is necessary to be compliant with the law.

34
Mathematics and statistics
To attempt these pages, the students need to have worked through the previous four pages of Whana’s story (pages 9–12) because answers from these pages are used to make further calculations. The students may not be aware of the term “middleman” that is used on these pages. A middleman is a person who brokers a deal between two parties or on-sells items he/she has bought to someone else without doing anything to the items. A middleman adds to the cost of items by taking a cut for arranging the sale and purchase. In Whana’s case, he would pay a middleman if he bought overseas-made T-shirts from someone in New Zealand.
Many students will have experience with exchange rates through travelling abroad. Use currencies that they are familiar with to introduce the idea. For example, Australia’s dollar is usually worth more than New Zealand’s dollar. That means it costs more than NZ$1.00 to buy A$1.00 and less than A$1.00 to buy NZ$1.00. (This means that NZ$1.00 will buy less than A$1.00.) Exchange rates are given as decimal amounts, accepting that the decimal places are not always obvious. For example, the rate a bank sells Australian dollars to a customer in exchange for New Zealand dollars might be 0.8751, meaning that the customer receives 87.51 Australian cents for each New Zealand dollar (or 0.8751 Australian dollars). Built into these rates is a bank fee that masks the relationship between these two rates.
To simplify matters, suppose it took one-and-a-half New Zealand dollars to buy one Australian dollar and there were no commission charges, and you have Australian dollars to sell. The bank would tell you it will buy A$1.00 for NZ$1.50. This means the bank will give you $NZ1.50 for every A$1.00 you give them. This could be shown as:
$NZ $NZ
$A
The reverse of this is to think of what the New Zealand bank would have as a “sell” rate for Australian dollars, that is, how many Australian dollars could be bought for NZ$1.00. The left-hand dotted line above shows that NZ$1.00 buys only two-thirds of A$1.00 ( is the reciprocal of or 1 ). So the “sell” rate for Australian dollars is 0.67, that is, for NZ$1.00, you will only get 67 Australian cents.
Inverse flow diagrams are another common and helpful way of expressing this somewhat difficult concept. The multiply/divide functions demonstrate the inverse relationship of buying and selling.
23
32
$A $NZ
32x 1.5
÷ 1.5
$A $NZ
x
÷ 32 (or x )2
3
or
The students can use their calculators (1 ÷ 1.5 = 0.6) to check that this calculation is the same as multiplying by two-thirds.
Fluctuations in exchange rates are a significant risk for any business involved in exporting or importing. A higher New Zealand dollar means that exporters suffer because the price they earn overseas is worth fewer New Zealand dollars. Importers prefer a higher New Zealand dollar because it makes the goods they bring into the country cheaper in New Zealand dollars. A lower dollar has the opposite effect.
Question 2 requires the students to calculate what a T-shirt from each country will cost in New Zealand dollars. For example, the exchange rate table says the NZ$1.00 buys HK$4.76. The cost of the T-shirt is HK$18.00. The problem can be modelled using a double number line:
0
0 4.76
?
18.00
$NZ
$HK
1.00
12
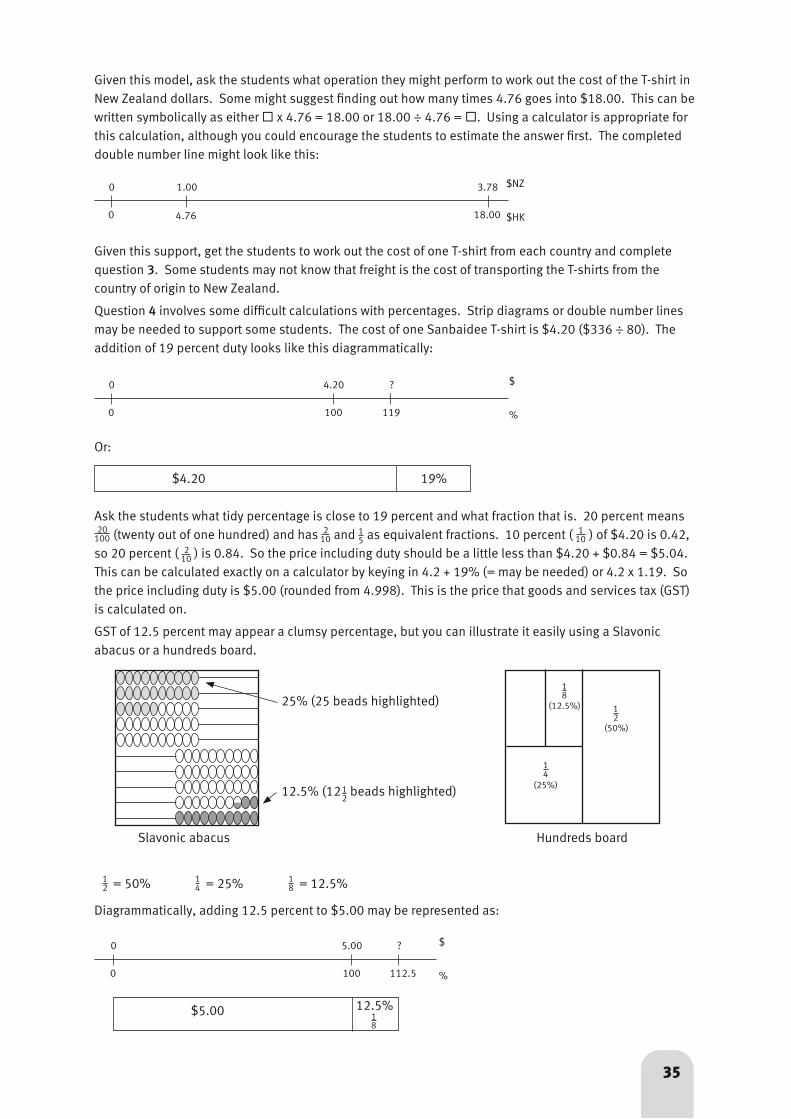
35
Given this model, ask the students what operation they might perform to work out the cost of the T-shirt in New Zealand dollars. Some might suggest finding out how many times 4.76 goes into $18.00. This can be written symbolically as either ® x 4.76 = 18.00 or 18.00 ÷ 4.76 = ®. Using a calculator is appropriate for this calculation, although you could encourage the students to estimate the answer first. The completed double number line might look like this:
Given this support, get the students to work out the cost of one T-shirt from each country and complete question 3. Some students may not know that freight is the cost of transporting the T-shirts from the country of origin to New Zealand.
Question 4 involves some difficult calculations with percentages. Strip diagrams or double number lines may be needed to support some students. The cost of one Sanbaidee T-shirt is $4.20 ($336 ÷ 80). The addition of 19 percent duty looks like this diagrammatically:
0
0
?
119
$
%
4.20
100
Or:
$4.20 19%
Ask the students what tidy percentage is close to 19 percent and what fraction that is. 20 percent means (twenty out of one hundred) and has and as equivalent fractions. 10 percent ( ) of $4.20 is 0.42, so 20 percent ( ) is 0.84. So the price including duty should be a little less than $4.20 + $0.84 = $5.04. This can be calculated exactly on a calculator by keying in 4.2 + 19% (= may be needed) or 4.2 x 1.19. So the price including duty is $5.00 (rounded from 4.998). This is the price that goods and services tax (GST) is calculated on.
GST of 12.5 percent may appear a clumsy percentage, but you can illustrate it easily using a Slavonic abacus or a hundreds board.
15
20100
210
210
110
25% (25 beads highlighted)
12.5% (12 beads highlighted)12
Diagrammatically, adding 12.5 percent to $5.00 may be represented as:
= 50% 12 = 25% 1
4 = 12.5% 18
0
0
?
112.5
$
%
5.00
100
$5.00 12.5%18
0
0 4.76
3.78
18.00
$NZ
$HK
1.00
Slavonic abacus
12
(50%)
14
(25%)
18
(12.5%)
Hundreds board

36
Encourage the students to estimate/calculate the GST component. This might be done in several ways, for example:
10 percent of $5.00 is 0.50, 5 percent of $5.00 is 0.25, so 2.5 percent of $5.00 is 0.125, so 12.5 percent is 0.50 + 0.125 = 0.625 (62.5 cents).
of 500 is a bit more than 0.60 because 8 x 0.60 = $4.80.
A calculator can be used to get the exact amount: 4.998 + 12.5% is $5.62 rounded down. If you used the rounded import duty amount ($4.998 rounded to $5) and then did your GST calculation on that amount and rounded it (5.652 to 5.63), the result would be a 1 cent difference. This seems a small amount, but small “errors” such as this can compound very quickly into big ones; 1 cent might not seem very much, but for larger orders (for a big firm, for example), the end result might be a larger tax bill than necessary. For multi-step problems, encourage your students to analyse each step separately and then do the final calculation in one go, rounding only the last step to minimise error.
Social Sciences Links
Achievement objective:
• Understand how people and consumers exercise their rights and meet their responsibilities (Social Studies, level 4)
Have the students discuss the following:
– In this situation, Whana is a consumer. What rights and responsibilities does he have?
– Whana is looking at buying from overseas. Will his rights as a consumer be different? How might this impact on his decision?
18
activity two
Financial understanding
This activity introduces the idea of barter, in which two or more people exchange goods or services with each other. Barter preceded money historically as the mechanism for settling transactions and is still common today. Internet and newspapers facilitate trading using either money or the goods as a currency. In this scenario, Whana’s dad is bartering the use of his garage and computer for some of the T-shirts that Whana produces. The advantage for Whana in this arrangement is that it cuts down the amount of money he needs initially to make the T-shirts because he doesn’t need cash to pay his rent and computer costs. The disadvantage is that the rent still costs him in time and materials. This cost could be easily forgotten. This also illustrates the limitations of barter in that there has to be a “coincidence” of wants between Whana and his dad. If Dad didn’t want Whana’s T-shirts, Whana would have had to pay for the use of the garage and computer.
Whana would be more financially responsible if he were to calculate the real cost of his rent (about $10 per day) rather than calculating how many T-shirts he can afford to barter for these goods and services. Any decision he makes about giving his father a more favourable deal is then based on sound information to determine the “real cost” rather than making an emotional decision.
reflective question
Failure to pay taxes is a major reason for the demise of many small businesses. Financially responsible businesses factor the cost of taxation into the prices they charge. The implications of failing to pay taxes are usually only realised long-term, when the business is audited (their accounts checked) by Inland Revenue. Audits sometimes reveal taxation that hasn’t been paid, and unwary business owners can end up with large bills that were unexpected.
37
Pages 15–18 Beefing Up Business
Mathematics and Statistics Achievement Objectives
• Number strategies and knowledge:
– Use a range of multiplicative strategies when operating on whole numbers
– Understand addition and subtraction of fractions, decimals, and integers
– Find fractions, decimals, and percentages of amounts expressed as whole numbers, simple fractions, and decimals (Number and Algebra, level 4)
• Equations and expressions:
– Form and solve simple linear equations (Number and Algebra, level 4)
• Statistical literacy:
– Evaluate statements made by others about the findings of statistical investigations and probability activities (Statistics, level 4)
Number Framework LinksStudents undertaking this activity need to be at stage 7 or better. They will be required to solve problems involving percentages and metric conversions, so they will need to have a reasonable understanding of equivalent fractions. Knowledge of how to use a computer spreadsheet, including entering formulae, is important.
Social Sciences Links
Achievement objectives:
• Understand how people make decisions about access to and use of resources (Social Studies, level 3)
Have the students discuss how Whana’s dad might be influencing Whana’s decisions about access to resources, such as the garage.
• Understand how exploration and innovation create opportunities and challenges for people, places, and environments (Social Studies, level 4)
Have the students discuss:
– What opportunities has Whana created through his innovation?
– What challenges has he had?
Context
For rural students, the raising of lambs and calves will be very familiar. City students may need some background information about raising calves to help them in interpreting the context. Calf raising is basically about taking 3-day-old calves and raising them until they are weaned and able to survive on grass, water, and perhaps meal for food. The calves are then on-sold to beef farms that raise them until they are mature or to dairy farms as potential milk cows. Some dairy farms do their own calf raising, sometimes on blocks called “run-offs” dedicated to the purpose.
Students who are unfamiliar with the context may struggle to come up with reasons why the price of calves might fluctuate from year to year. You can help them with this by connecting Jessica’s scenario to the earlier scenarios in the book where price was determined by supply and demand. Ask the students to hypothesise why these might vary in respect to calves. The supply of calves depends mostly on the fertility of cows and the interest of dairy farmers in having calves born. Poor weather can reduce fertility, and poor forecasts of the price for calves can reduce farmers’ interest in producing them. Demand for calves is also determined by weather and projections of prices. Dry winters and springs can mean that feed on the farm will be short. This also affects the ability of beef-raising farms to take on stock and lowers the demand for 4-month-old calves.

38
For many potential calf rearers, particularly small-volume businesses, poor projections of returns mean the returns do not justify the risks and work required. The price of different breeds of calves is dependent on demand. Some breeds, like Herefords, are more popular because of their superior potential as beef cattle.
Financial language
The following financial terms occur during the story:
Agent/broker: A person who arranges exchanges of goods and services for a fee
Savings: The money people put aside from their income for future needs
Percentages: Fractions out of 100 that are commonly used to compare and to scale amounts, for example, comparing shooting statistics in sport or interest rates on savings
Profit: The amount of money left over from sales once the costs of producing the goods and services are met
Loss: The opposite of profit: the shortfall in money when a business’s costs are higher than its revenue (money made from sales)
Spreadsheet: A computer ledger used to keep financial accounts and other calculations
Account: A contract with a bank to hold or borrow money
Balance: The amount of money either in an account or borrowed from it (negative balance)
Trends and patterns: Happenings over time that allow future events to be predicted, for example, prices of stock
Investment: Savings or the purchase of an asset with the hope of future returns, for example, buying a rental property or business.
Financial understanding
Jessica’s goals show that she is becoming financially responsible. She understands that her decisions now will impact on her future choices. By earning income and saving now, she will be able to finance her own learning at university. Jessica is also demonstrating business understanding and financial maturity as she investigates the financial side of her business.
Jessica is matching her personal goals and capabilities to an undertaking. She demonstrates initiative and drive by running this business to earn money to pay for her university study, thus taking responsibility for managing herself. She uses the opportunities available to her through her farming background, including the use of facilities and the advice and expertise of her parents and her stock agent. She plans her transactions carefully, particularly monitoring her cash flow and managing resources so that she can raise the greatest number of calves possible for her. She works in a small team with her father and communicates effectively with him to identify and solve potential problems.
activity
Mathematics and statistics
To calculate the answers to question 2c, students need to calculate a percentage of an amount. For example, the price of a Friesian calf in year 3, including the agent’s fee, was $115 ($1,150 ÷ 10). Jim Hogan projects that prices will be 10 to 15 percent higher. Important knowledge for students is that percentage means “out of one hundred”, so the 10 or 15 is applied to every 100 dollars. Ten out of 100 is one-tenth, so 10 percent of $115 is one-tenth of $115. Division by 10 is also a critical idea here.
The effect of dividing by 10 can be shown on a calculator by keying in 1150 ÷ 10 = = = (some calculators may require ÷ 10 to be repeated). The resulting number has digits shifted one place to the right.
Thousands Hundreds Tens Ones Tenths Hundredths
1 1 5 0
1 1 5
1 1 5
1 1 5

39
Using this idea, 10 percent of $115 can be calculated as $115 ÷ 10 = $11.50. Since 5 percent is half of 10 percent, 5 percent of $115 is half of $11.50 = $5.75. Another important idea is that the calf prices in year 4 will be between 110 percent and 115 percent of the year 3 prices. Percentages of the same amount can be added, so 115 percent of something is 100% + 10% + 5% of that something. This process can be shown on a double number line as shown below:
0
0 5%
$115.00
100%
$5.75$11.50
10% 110%
$126.50
115%
$132.25
$
%
With these representations, students should be able to calculate the potential prices for calves in year 4.
Question 2d requires them to budget for purchasing 50 calves for no more than $5,500. Important questions you might ask the students include:
What will the average price per calf be? That is, the price if each calf cost the same, the middle price. $5,500 ÷ 50 = $110
What does that tell you about how many of each breed Jessica can buy? Friesian and Hereford–Friesian cross calves are dearer than this average, so a purchase of one of these must be balanced by purchasing Friesian–Jersey cross calves that are cheaper than the average. Jessica will need to buy more Friesian–Jersey cross calves to balance her budget.
How might you use a table or spreadsheet to organise the possibilities to help meet the budget? A spreadsheet can be set up that allows you to try “if–then” scenarios.
Breed Price Number
Friesian-Jersey $82.50
$126.50
A B
123
C
$176.005
30
1010
Total cost
4
=B2*C2
FriesianHereford-Friesian
Cost
D
$2,475.00
$1,265.00$1,760.00$5,500.00
6
=sum(D2:D4)
Using this spreadsheet, different scenarios can be explored, such as increases in calf prices by 15 percent and buying different numbers of each breed.
Question 2e involves a rate problem, that is, a multiplicative relationship between two measures. In this case, the measures are cost, in dollars, and number of calves. Most proportional reasoning problems like this can be represented by double number lines. This visual representation helps students to summarise the conditions of the problem and solve it using progressive steps. A double number line for 2e is given below.
0
0
1
$575.00
50
$11.50$57.50
5
Dollars
Calves
Some students are likely to need support in determining how to structure the operations to solve the problems in question 3. Diagrammatic support can help. Question 3a is a rate problem and can therefore be represented using a double number line or ratio table. The rate involved is between litres of milk and kilograms of powder. Students will need to use the metric conversion: 1 kilogram equals 1 000 grams (kilo means 1 000). As a ratio table, the problem can be represented progressively as:

40
Powder (g)
20 000135
Milk (L)
?1
Powder (g)
13 500135
Milk (L)
1001
so
6 750 50
20 250 150
20 000 ?
Powder (g)
20 250135
Milk (L)
1501
so
270 2
19 980 148
The problem can be solved efficiently by dividing 20 000 grams by 135 grams, the unit rate, that is, 1 litre : 135 grams. However, as both ratio tables and double number lines allow students to express the problem even if they are unsure of a strategy, they can make progress without using division. The students’ strategies are also more likely to involve mental calculation rather than rote procedures.
Question 4 involves comparison of two fractions as percentages. It is common to express two or more fractions as equivalent fractions with a denominator of 100, otherwise known as percentages. Both Jessica’s and her father’s scours rates are easily determined by a scaling operation.
Jessica calves 50 x 2 = 100%
scours 4 x 2 = 8 so she has 8 out of 100 or 8% with scours
Dad calves 300 ÷ 3 = 100%
scours 21 ÷ 3 = 7 so he has 7 out of 100 or 7% with scours
This can also be expressed as fractions, as shown in the Answers:
= =
Formulating the operations to perform is the biggest obstacle to students solving questions 4b and 4c. Encourage the students to draw diagrams if they need to think through which operations are involved. Examples might be:
8100
450
21300
7100
6–8 cups per calf
So 4 x 6 = 24 or 4 x 8 = 32 litres per day.
Question 4c can be modelled in a similar way:
8 x 150 g per calf = 1 200 g
So 4 x 1 200 g = 4 800 grams = 4.8 kg (per day).
3 x 4.8 = 14.4 kg of powder over the 3 days.

41
Question 5 also requires some knowledge of the metric system. One millilitre is one-thousandth of a litre. Five millilitres is about the contents of one level teaspoon. Question 5a is a double rate problem that relates calves to doses and millilitres to days. As such, it can be modelled by a ratio table:
Calves Doses Millilitres Days
1 5 mL 35 mL 135 mL 105 mL 37
So Jessica is 5 millilitres of penicillin short. If 100 millilitres cost $26.00, then 5 millilitres is one-twentieth of that because 20 x 5 mL = 100 mL. $26.00 ÷ 20 can be performed mentally in a number of ways:
$26 ÷ 10 = $2.60, $2.60 ÷ 2 = $1.30; or $26 ÷ 2 = $13, $13 ÷ 10 = $1.30; or $1.00 ÷ 20 = $0.05 (5 Cents), so $26.00 ÷ 20 = $26 x $0.05 = $1.30.
Question 6 involves expressing a ratio of fraction terms. To do that, it is important to identify the parts and the whole.
The ratio of calves is 50:300 (Jessica’s to Dad’s). So diagrammatically, the herd of calves looks like this:
x 360o = 51.4o
Jessica
Dad
Calves on the Farm 50350
So Jessica’s fraction of the whole herd is one-seventh (not one-sixth, as is the common error). As well as feeding her own calves, Jessica should probably help her father feed his calves in return for her use of the farm facilities. The degree of compensation is discretionary, but the students might want to consider on which days of the week Jessica might be more able to help her father. For example, apart from holidays, Monday to Friday are school days (and she still will have to feed her own calves on those days), so it may be easier for her to help on the weekends.
Social Sciences Links
Achievement objectives:
• Understand how producers and consumers exercise their rights and meet their responsibilities (Social Studies, level 4)
• Understand how people seek and have sought economic growth through business, enterprise, and innovation (Social Studies, level 5)
Have the students discuss:
– How is Jessica seeking economic growth?
– What flow-on economic growth impacts will Jessica’s enterprise have?

42
Pages 19–21 Profit or Loss?
Mathematics and Statistics Achievement Objectives
• Number strategies and knowledge:
– Use a range of multiplicative strategies when operating on whole numbers
– Understand addition and subtraction of fractions, decimals, and integers
– Find fractions, decimals, and percentages of amounts expressed as whole numbers, simple fractions, and decimals (Number and Algebra, level 4)
• Patterns and relationships:
– Use graphs, tables, and rules to describe linear relationships found in number and spatial patterns (Number and Algebra, level 4)
Financial understanding
The success of any business depends on its ability to earn more money from selling its goods and services than it costs to produce them. If the costs exceed the sales revenue, then the business makes a loss. A continuous loss in the long term means a business is not viable and ceases to trade.
Enterprising people collect, organise, and analyse all the information they need so that they can make informed business decisions. By doing this, Jessica is able to recruit and manage the “right” resources she needs to run the business, which helps her to make sound financial decisions and to plan and organise business activities.
activity one
Mathematics and statistics
Pages 19–21 require the students to calculate Jessica’s calf-raising costs and compare them to the money she makes by selling the calves for more than she originally paid. If possible, encourage the students to use a computer spreadsheet because this removes the burden of routine calculation and allows them to focus on the main variables that mean the difference between profit and loss.
A simple way to set up the spreadsheet is to divide it up into two sections, income and expenditure. The income section itemises all the sources of money Jessica has from selling the calves. The expenditure section itemises all of Jessica’s costs. Inserting formulae makes calculation of totals easy, especially if the students use the Copy and Drag or Fill Down function to save re-typing formulae. Students may need instruction in formatting cells and the syntax of formulae. The Format menu on a spreadsheet file will give the students access to a variety of formatting options, such as formatting figures as numbers, currency, or other styles.

43
The most useful formulae for Jessica’s spreadsheet are the Sum function and multiplication:
The #VALUE! in the spreadsheet above refers to the fact that the agent’s fees are calculated by a formula using 5 percent (one-twentieth) of the sale price. Because we have yet to work out the sale price, there is a value missing, and so the formula cannot complete its calculation.
On the right-hand side of the expenditure columns, the students should create income columns:
Finally, the students should link the income and expenditure sections of the spreadsheets in two ways, by calculating the agent’s fees and by working out the profit or loss.
13
Contains the formula, =B6*C6. * means times, so whatever is in B6 and C6 is multiplied together and the answer put in D6.
Sum will total all the numbers in cells D5 to D11.
=G5*H5
Adds up the amounts in cells I 5 to I 7
Profit/Loss = income – expenditure: =I 8–D12
Agent’s fees = sale price x 5%: =I 8*0.05 (0.05 is 5%)

44
Financial understanding
Question 4 asks students to consider how Jessica might improve her profits. Students might consider that the dearest breed of calf, Herefords, are about $100.00 more to buy when young than Friesian–Jerseys, yet return only $100.00 more when sold. Given the extra money required initially to buy the calves, there is no gain for Jessica in buying the more expensive breed. In fact, she is marginally better off buying only Friesian–Jerseys (unless they prove to be the one more prone to die as calves). The profit per calf is very similar, irrespective of breed, so the only way for Jessica to make more money is to buy and raise more calves. The costs of raising calves are mostly fixed because keeping the calves in good health is essential for ethical reasons and to maximise sale price.
Social Sciences Links
Achievement objectives:
• Understand that events have causes and effects (Social Studies, level 4)
• Understand how producers and consumers exercise their rights and meet their responsibilities (Social Studies, level 4)
Have the students discuss what impacts Jessica’s enterprise could have on environmental sustainability and what she will have to consider to reduce the impacts on her father’s farm (for example, waste removal, intensive use of land resource).
activity two
Mathematics and statistics
This activity requires students to look for trends in time-series data. In this case, the data contains two variables, time (in months) and balance (in dollars). The trend in the graph on page 21 is seasonal, so one year’s graph is a scaled translation of the previous year. This can be explained by the fact that Jessica does the same thing from year to year (see the explanation and the graph in the Answers).
To model activities such as that in question 2, you have to make assumptions. The students might make their own assumptions and choose their own model. However, if they find this difficult, the model outlined here might help to get them started.
It is not unreasonable to assume that Jessica’s weekly (and hence monthly) costs for feeding and caring for the calves after they are purchased are approximately the same. When the calves are younger, they require milk and possibly medicine; when they are older, they require only meal (and grass) and, later, hay. Jessica buys the calves in mid-July and sells them in early November, a period of approximately 15 weeks. Her total calf-care costs from page 20, question 1, are $7,546 ($4,320 + $2,808 + $168 + $250), which is approximately $503 per week ($7,546 ÷ 15) or $2,012 per month ($7,546 ÷ 3.75).
So, assumptions the students might make include:
• July will be an expensive month in which Jessica must purchase the calves, pay for transport, and feed them for approximately half of the month. Her outgoings for that month might be something like: purchasing calves ($5,500) + transport ($575) + calf-care ($1,006) = $7,081
• Calf-care costs August–October: $2,012 x 3 = $6,036
• For November, 1 week’s calf-care costs, $503, and agent’s fees, $867, (so she will receive $17,340 – $867 = $16,473)
• At the beginning of each month, Jessica will receive 8% ÷ 12 (0.66%) interest on the balance at the end of the previous month (so the interest she receives in February is based on the January balance).
The spreadsheet and its corresponding graph in the Answers uses these assumptions, along with the designated interest rate.

45
However, the point is not whether the figures at the end of each month can be exactly calculated but rather that the students have a viable model for what each monthly balance might look like. Encourage them to make their own estimates rather than giving them the figures in the model above.
To model the situation with a spreadsheet, the students will need to reflect these assumptions in their spreadsheet formulae. So for each month, the formula in the cells should take the previous balance and multiply it by 1 + 0.08 ÷ 12 (8 percent divided by 12 months), for example, for February, =B2+B2*0.08/12.
For July, Jessica will earn interest on her June balance but will pay her July expenses (as above). So the formula, assuming the June balance is in B7, would be: =B7+B7*0.08/12–7081.
For the months August to October, Jessica will earn interest on the previous month’s balance but will pay out that month’s share of feed. So the formula, assuming the July balance is in B8, would be of the form: =B8+B8*0.08/12–2012.
For November, Jessica earns interest on her previous month’s balance, pays 1 week’s share of the feed, and earns $16,473 for the sale of the calves (sale price less agent’s fees). So assuming that October’s balance is in B11, the formula would be =B11+B11*0.08/12–503+16473.
In December, Jessica only earns interest on her November balance, so the formula will be =B12+B12*0.08/12.
Based on the information in the model above, the complete spreadsheet for the year is as shown in the Answers for question 2.
Question 3 involves students in making several assumptions about how many calves Jessica will raise. It is unlikely that she will be able to raise 300 calves even if she could afford to buy them in June because this would interfere with her studies. Assuming that she increases her profit by taking on 10 more calves per year, the projected balance in her account (based on an interest rate of 8 percent per annum and an average profit per live calf of $59.40) can be calculated using a spreadsheet in this way:
Calves sold Total money
A B C
Yr 4
58Yr 5
68Yr 6
$22,021.18
$26,941.23
48 $17,861.52
78Yr 7 $32,652.08
87Yr 8 $39,125.96
See the comments in the Answers about death rates and real-time costs.
Social Sciences Links
Achievement objectives:
• Understand that events have causes and effects (Social Studies, level 4)
• Understand how economic decisions impact on people, communities, and nations (Social Studies, level 5)
Have the students discuss:
Jessica is making and will make many economic decisions while she is raising calves. How will these impact on:
– her “free” time and lifestyle now?
– her future?
– the choices she can make both now and in the future?
12
456
3=C2*1.04+B3*59.40
The formula in C3 is filled down.

46
Pages 22–28 On Your Bike, Mike
Mathematics and Statistics Achievement Objectives
• Number strategies and knowledge:
– Use a range of multiplicative strategies when operating on whole numbers
– Understand addition and subtraction of fractions, decimals, and integers
– Find fractions, decimals, and percentages of amounts expressed as whole numbers, simple fractions, and decimals (Number and Algebra, level 4)
• Patterns and relationships:
– Use graphs, tables, and rules to describe linear relationships found in number and spatial patterns (Number and Algebra, level 4)
• Statistical investigation: Plan and conduct investigations using the statistical enquiry cycle:
– gathering, sorting, and displaying multivariate category, measurement, and time-series data to detect patterns, variations, relationships, and trends
– comparing distributions visually (Statistics, level 4)
• Statistical literacy:
– Evaluate statements made by others about the findings of statistical investigations and probability activities (Statistics, level 4)
Financial language
Cash advance, assets, liabilities, net worth, profit, loss, risk, mark-up, cash flow, creditors’ schedule, financial position, wage, debt, balance.
Financial understanding
The series of activities based on Mike’s business explores the idea of cash flow and assets and liabilities and the net worth of a business. Businesses need accessible cash to pay expenses. Some businesses have high cash flow, which means a large amount of money is paid to the business in a short time. This is usually matched by a large volume of money paid out by the business for the purchase of goods and services it needs for production. Supermarkets and fast food outlets are good examples of businesses with high cash flow.
Mike experiences having an unpaid account that puts his business at risk. Identifying, assessing, and managing risks is an essential attribute to have if people and their businesses are to succeed in the longer term.
activity one
Financial understanding
Other businesses often have long periods of time between earning sales revenue. These businesses need to manage their cash flow so that they have money available to pay costs like wages and rent. Cash flow might be managed by having a good amount of capital to set up the business or by borrowing money from a bank. Aeroplane/car manufacturers, caterers, and real estate agencies are examples of businesses that have irregular cash flow, relying on one-off big sales for their income.
Liabilities are any debt to a business. The loan from Mike’s uncle is an example of a liability, but things such as the outstanding payments for hire purchase or unpaid rents are other types of liabilities. Assets are things belonging to the business that are of value. Assets may take the form of cash, items of equipment, buildings, vehicles, and in this scenario, Mike’s toolkit.
A business needs to manage cash flow, its ability to pay bills, and the balance between its assets and liabilities. With a debt of $50.00 and an asset of $50.00 in cash, Mike has a balance of zero because paying off the debt cancels the liability, reducing his assets to nothing.

47
From previous activities in this book, students should know the meaning of profit (the money left over from selling goods or services once the costs of production are taken off). A loss is the opposite of a profit, where the costs of production are greater than the revenues from sales. Obviously, firms that make regular profits tend to have a positive balance between assets and liabilities, whereas those that make regular losses may have a negative balance. Sustainable and financially responsible businesses make a profit.
All businesses deal with risks. Risks are dangers to the profitable running of a business. Risks are many and varied, from sickness of workers, to bad debts, to unavailability of raw materials, to changes to financial costs like interest and international exchange rates.
Social Sciences Links
Achievement objective:
• Understand how people pass on and sustain culture and heritage for different reasons and that this has consequences for people (Social Studies, level 4)
Have the students discuss how Uncle Lance has sustained and passed on part of Mike’s heritage. (The answer could be that he has taught him to ride a bike [passed on part of his heritage] and continues to sustain this interest in bikes [through the gift of tools and lending him start-up money].)
activity two
Financial understanding / Mathematics and statistics
This activity considers the importance of using surveys to find out the demand for products or services prior to producing them. This is an important tool for managing risk through identifying potentially poor demand and then tailoring the product to the wants and needs of buyers.
Mike’s survey is simple and targets the demographics of his customers (that is, gender, age) and specific item preference. Linking these two things allows Mike to develop packages that meet the general needs of customers. Mike may have missed out on potential sales through failing to personalise the survey. Asking people for their name and allowing them an “other” option under the item preferences may have given him data on other useful products to offer.
Using either a computer spreadsheet or database to enter the survey results would allow Mike to look for relationships in the multivariate data. Multivariate means that there are several variables, that is, gender, age, item preference, payment maximum. The graphs shown are designed to make the relationships more explicit than a tabular format rather than to display relationships already identified.
The first graph shows a trend that boys are prepared to spend more money on their bicycle modifications than girls. In this case, the spatial features of the graph are more important than the numerical information. Each bar represents a proportion of responses from a given range of spending. It is these proportions that are significant.
The second graph also uses a proportional representation for each age group. Encourage your students to look for the main patterns in the data rather than to read the percentages for individual bars and to consider what these patterns mean for Mike’s business. In general, older students are willing to spend more on modifying their bicycles than younger students. So Mike can opt to go for a large number of smaller sales to young bicycle owners or a lower number of larger sales to older students.
Graphs three and four present category data (data grouped into classified categories). The categories are the items preferred by the respondents. While it is important for students to read the graphs, in the sense that they can tell how many of the boys or girls surveyed prefer a given item, it is more important for them to look for more global trends in the displays. The items preferred by boys are mainly about performance of the bicycle to improve its speed or handling. The girls, on the other hand, are more concerned with items that improve the appearance, safety, and comfort of the bicycle.

48
Social Sciences Links
Achievement objective:
• Understand how people make decisions about access to and use of resources (Social Studies, level 3)
Have the students discuss how the information in the data will impact on Mike’s decisions about the use of and access to the resources he is planning to make and sell.
The retail price is:
$ retail price
The wholesale price is:
$ wholesale price
$ wholesale price Mark-up
activity three
Financial understanding
This activity is about the difference between wholesalers and retailers. Wholesalers sell their products to other businesses called retailers who, in turn, sell the products to their customers at a “mark-up”. A mark-up means an amount over and above what the business pays the wholesaler. In this activity, Mike is acting as a “middleman” (see New Zealand Made?, page 13, although there the term is used in an overseas-buying context).
In considering why Mike is offering combo deals, students will have to refer back to the data from the customer surveys. In general, boys were willing to spend more than girls, with boys preferring performance items and girls preferring appearance and safety. Combo 1 is targeted mainly at female consumers, and the price is close to the amount that 18 out of 30 (60 percent) of girl respondents were prepared to pay (see graph on page 23). (The cost for the combo is $55, and 16 girls were prepared to pay up to $50. The good deal may persuade them to pay the extra $5.) Combo 2 is performance oriented and is targeted at boys who are prepared to pay more for the items. Mike could consider age-specific combos. To do this, he would need to relate age to item preference. This may or may not provide other options. Younger riders may prefer items that are too expensive given the amount they are able to spend.
While many options for combos are possible, the survival of Mike’s business depends on him meeting the needs of consumers, the people who will use his services.
Mathematics and statistics
The discount that Mike is offered is 25 percent off normal retail. Twenty-five percent (out of 100) is one-quarter. Encourage the students to use rounding and estimation to work out whether the discount is 25 percent on each item. For example, the price of pedals is $29.90, which is about $30.00. One-quarter of $30.00 is $7.50, so the wholesale price should be about $22.50 ($30.00 – $7.50). Mike is being charged $23.00, so the discount is not quite 25 percent for this item.
The relationship between wholesale price and mark-up to the retail price is potentially confusing. Strip diagrams are a useful way to show the relationship.
To bring the price up to retail price again, Mike needs to add on one-third of what he pays (wholesale price):
Students who have initial difficulty accepting this generalisation may be more easily convinced if they calculate a few examples from the activity. For example, a flag costs $12.00 wholesale and one-third of $12.00 is $4.00, so if Mike is to add on 25 percent mark-up, the retail price will be $16.00. The suggested retail price is $15.90, which is almost $16.00.

49
Social Sciences Links
Achievement objective:
• Understand how producers and consumers exercise their rights and meet their responsibilities (Social Studies, level 4)
Have the students discuss what different rights and responsibilities Mike has when he is acting as a “middleman”.
activity four
Financial understanding
This activity involves cash flow as discussed above. Mike believes that maintenance work will be regular and ongoing and therefore provide a steady flow of money into the business. In deciding what to charge for each repair, students need to factor in Mike’s time, the cost of parts, and possibly the inconvenience of getting to the location of the bike (which may be considered under time). So replacement of gears, which takes 40 minutes, incurs a labour charge of two-thirds of $10.00 = $6.66 (since 40 minutes is two-thirds of an hour) or $6.70 rounded. The parts cost is $47.90, and Mike may consider that there should be an extra service charge unless the bike is brought to him. Alternatively, he may charge for the time it takes him to get to the site of the bike.
Social Sciences Links
Achievement objective:
• Understand how people make decisions about access to and use of resources (Social Studies, level 3)
Have the students discuss how the information in the chart will impact on Mike’s decisions about how much to charge.
activity five
Financial understanding
Students are required to interpret financial statements in this activity. They need to know that balance refers to the amount of money held in a bank account. Balances can be positive, where the owner has money in the account, or negative, where the owner owes the bank money.
The visible part of the bank statement shows amounts being deposited from Mike’s clients (Mere, Leon, Ms Hennessy) paying their bills. The creditors’ schedule shows the liability Mike has accumulated by purchasing parts from the wholesaler to complete the jobs. The third statement of financial position reconciles both his assets (deposits) and his liabilities (debts). Note that in most businesses, the accounts from creditors are usually due either within 7 days or by the 20th of the month following the invoice. Mike pays his creditors in August, which probably means he fits the latter category. If he had to pay within 7 days and he himself had not been paid, this would have serious implications for the viability of his business.
In answering question 1a, students need to consider Mike’s cash flow. While technically he has enough money in his bank account to pay the bills, he would be using the loan from his uncle to do so, leaving himself little money in case of an emergency. The business would be in a much riskier position than previously. Mike has to decide whether the risk of reducing his balance is outweighed by the benefits of advertising and his personal well-being from earning money. All business owners are responsible for taking care of their own personal well-being.
Question 2 explores the effect on a business when debts are not honoured. Bad debts have a negative effect on a business in two ways. Firstly, they cost the business materials and time that is not paid for that could have been used on a paying customer. Secondly, they cost the business in the time and energy trying to get the debtor to pay up. To avoid this wasted time, Mike hires a professional debt collector. The cost of the collection in this case is born by the debtor, Eric.

50
Question 2c raises ethical questions about incurring debts without the ability to pay for them. Eric’s dad may well be angry that Eric has used Mike’s services without checking with him first. Alternatively, Eric may have discussed the matter with his dad before getting the work done, and the failure to pay could have been an oversight or due to a cash-flow problem in the household.
Mathematics and statistics
The debt collector’s fee is 20 percent or one-fifth of the original bill. A “mean machine special” combo costs $170.00. One-fifth is double one-tenth, so 20 percent of $170.00 can be calculated as 10 percent of $170.00 = $17.00, so 20 percent of $170.00 = $34.00 (double $17.00).
GST is 12.5 percent or one-eighth of the collector’s fee. This can be calculated by repeated halving: 50% of $34.00 = $17.00, 25% of $34.00 = $8.50, 12.5% of $34.00 = $4.25.
So the total fee for collection is $34.00 + $4.25 = $38.25.
Social Sciences Links
Achievement objective:
• Understand that events have causes and effects (Social Studies, level 4)
Have the students consider that Mike is now forming business relationships with the people at school as a supplier of goods and services. Discuss how this might impact on him and on his customers. (This will involve questions around doing business with friends, bad debts, and the “social” cost of business.)
activity six
Financial understanding
In an “income and expenditure statement”, income refers to money coming into the business as sales are made. In this situation, the word “income” is interchangeable with the word “revenue”. Expenditure is money going out of the business to meet the costs of producing the goods and services.
Mathematics and statistics
To answer question 1a, students need to find the difference between the parts cost and the total charge because the bill is made up of only these components. For example, to replace the pedals involves a $42.90 – $29.90 = $13.00 difference. Mike is charging $10.00 per hour for his labour, so that is equivalent to 1.3 hours (1 hour and 18 minutes). To compare the money Mike made from parts and labour, the students will need to recall the mark-up on his parts. These figures are shown on page 24. For example, the mark-up on pedals is $29.90 – $23.00 = $6.90 so, in this case, Mike made far more on his labour.
To complete the bank statement for question 2a, students need to consider all of Mike’s jobs, including Eric’s, advertising costs, wages, and the parts payment for July. For question 2b, they also need to recognise that delaying the payment of parts for August until September artificially inflates Mike’s bank balance. A true record of his finances (a statement of financial position) takes into account both his assets and debts. This comparison highlights the fact that a business can appear to be in good heart on the surface, but the true state of their finances is only known when all assets and liabilities are known. Encourage the students to do a statement of financial position for August, as shown for July in Activity Five. Have them consider the impact on Mike’s business if he had to pay for his August parts the same month.
Mike’s bank and financial position statements are found in the Answers section. Point out to the students that the $30.00 cost of advertising is a one-off cost that is not met by any one job but may serve his business well in the future. Note also that, although the August statement logs only the $95 for parts purchased in July, Mike still owes the importer for parts purchased in August. Also, he has also received only half of his payment for Damien’s job.

51
reflective question
See the comments in the Answers section.
In considering whether Mike’s business is profitable, the students need to evaluate the effect of paying for parts in the month following purchase and having unpaid or partly paid accounts (in this case, Damien’s half payment). Ask Do Mike’s costs reflect the actual costs that month? If Mike had paid his July parts bill in July, his bank balance would have been $185.80– $95 = $90.80. His income for August was $405.30, and his expenditure, including advertising, parts, and wages, was $376 ($30 + $331 + $15). So although Mike’s business seems profitable enough for him to pay himself wages, he will need to manage his cash flow so that he has money in the bank to pay any upcoming bills for parts and advertising. For example, if Mike only got small jobs in September, he still has to pay his August parts bill. He can’t afford to take on jobs where the payment is not made in cash on completion.
Social Sciences Links
Achievement objective:
• Understand that events have causes and effects (Social Studies, level 4)
This activity builds on the previous activity. Have the students discuss the possible social implications in the school community of giving free puncture repairs to Julie. (Other friends could be angry that they had to pay. Mike might suddenly be everyone’s “friend” – would these people really be friends?)
Ask: Is it a good idea to mix business with friends/people you know? What are the possible social aspects?
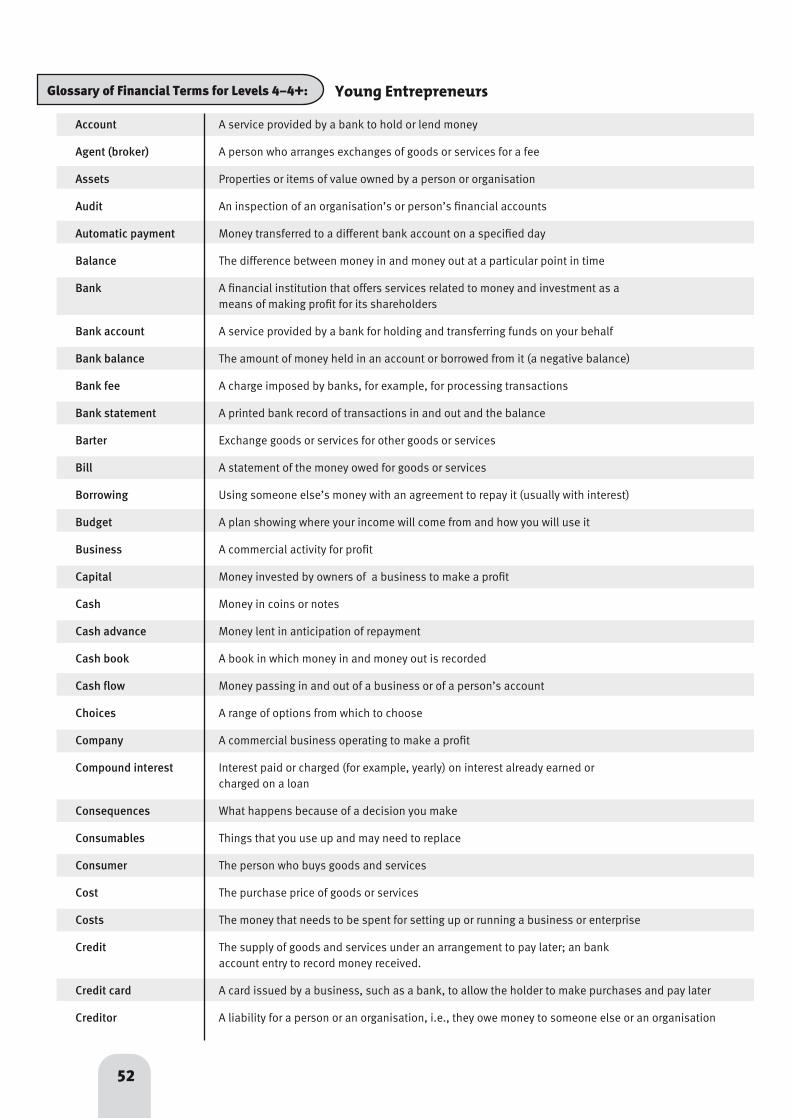
52
Account A service provided by a bank to hold or lend money
Agent (broker) A person who arranges exchanges of goods or services for a fee
Assets Properties or items of value owned by a person or organisation
Audit An inspection of an organisation’s or person’s financial accounts
Automatic payment Money transferred to a different bank account on a specified day
Balance The difference between money in and money out at a particular point in time
Bank A financial institution that offers services related to money and investment as a means of making profit for its shareholders
Bank account A service provided by a bank for holding and transferring funds on your behalf
Bank balance The amount of money held in an account or borrowed from it (a negative balance)
Bank fee A charge imposed by banks, for example, for processing transactions
Bank statement A printed bank record of transactions in and out and the balance
Barter Exchange goods or services for other goods or services
Bill A statement of the money owed for goods or services
Borrowing Using someone else’s money with an agreement to repay it (usually with interest)
Budget A plan showing where your income will come from and how you will use it
Business A commercial activity for profit
Capital Money invested by owners of a business to make a profit
Cash Money in coins or notes
Cash advance Money lent in anticipation of repayment
Cash book A book in which money in and money out is recorded
Cash flow Money passing in and out of a business or of a person’s account
Choices A range of options from which to choose
Company A commercial business operating to make a profit
Compound interest Interest paid or charged (for example, yearly) on interest already earned or charged on a loan
Consequences What happens because of a decision you make
Consumables Things that you use up and may need to replace
Consumer The person who buys goods and services
Cost The purchase price of goods or services
Costs The money that needs to be spent for setting up or running a business or enterprise
Credit The supply of goods and services under an arrangement to pay later; an bank account entry to record money received.
Credit card A card issued by a business, such as a bank, to allow the holder to make purchases and pay later
Creditor A liability for a person or an organisation, i.e., they owe money to someone else or an organisation
Glossary of Financial Terms for Levels 4–4+: Young Entrepreneurs

53
Glossary of Financial Terms for Levels 4–4+: Young Entrepreneurs
Currency A system of money in general use in a particular country
Customs The government department that administers and collects duties levied on imported goods
Cycle Where changes, for example, in a price, follows the same pattern of rising then falling then rising again over time
Debit Account entry to record money withdrawn or spent
Debt What you owe other people or organisations
Debt collector A person who collects debts owed to a person or an organisation
Decision Selection from a range of choices
Default Failure to repay a loan
Demand The quantity of goods and services that people would willingly buy at a particular price
Deposit Money put into an account, for example, at the bank or electronically
Discount A deduction from the usual price of something
Dividend Part of a company’s profits paid to shareholders
Earn Obtain income for labour or services or else as interest or profit
Earnings Income earned
Enterprise A project or undertaking, especially a bold one; a business or company
Entrepreneur A person who sets up a business, taking on greater than normal financial risks in order to do so
Exchange rate The value of one currency for the purposes of converting it to another currency
Expenditure Money spent
Expenses The costs of doing a job or task
Expensive Costing a lot of money
Fees A charge for services
Finance Money secured for a new venture
Financial plan A plan of future income and spending, based on money you expect to earn
Financial position The positive or negative state of a person’s finances at a point in time
Financial records Records of income and expenditure and the financial position for a person or a business
Fixed budget A definite amount of money available for a particular purpose
Fixed costs Costs that do not change regardless of circumstances, within a given period of time
Fixed term A definite period of time for which money is invested
Flat rate An interest rate that stays the same for the loan term, regardless of the amount still owed
Freight cost The cost of transportation of goods
Gift Money or objects given without payment or conditions
Goal What you set out to achieve
Goods Items made or produced for sale

54
Goodwill The ‘value’ of the established reputation of a business (regarded as a measurable asset)
GST Goods and services tax: a government levy added to the cost of most goods, services, and transactions
Guarantee Promise of replacement if a product is faulty
High return Higher than normal dividend or interest rate on money invested
High risk A higher chance of losing money invested
Hire purchase Buying something by making regular payments for it while you use it
Import duty The government levy that has to be paid on goods purchased from another country
Imports Goods or services purchased from another country
Income Money you earn from work or get from other sources
Inheritance Money or objects given or left to a person on the death of the previous owner
Insurance Payment for protection of property in case of loss or damage
Interest Money that you earn from saving or investing; the extra money that you pay for borrowing money
Interest rates The percentages of interest currently being paid or charged by banks or other financial institutions
Interest-only A payment of interest owing, with no repayment of principal (the money borrowed)
Inventory A complete list of stock or unsold goods
Invest To put money into financial endeavours with the expectation of earning income
Investment Money committed with the expectation of financial returns
Investor Someone who puts money into financial schemes, businesses, shares, or property with the expectation of making a profit
Inland Revenue A government organisation that collects taxes and payments from individuals, companies, and Department (IRD) organisations
Labour Physical work, usually as a means of earning money
Ledger A paper or computer record of financial accounts
Liability An item that you are financially obliged to pay for
Limited budget A restricted amount of money needed or available for a particular purpose
Loan Money that you borrow and have to pay back
Loss The shortfall in income when a business’s costs are higher than its revenue
Low return A small dividend or low interest rate on money invested
Low risk Very little chance of losing money invested
Lump sum A single payment made at one time
Medium return An average level of dividend on money invested
Medium risk Some chance of losing money invested
Middleman A person who buys goods from producers and sells them on to retailers or consumers
Minimum amount The lowest amount of money that can be paid or invested
Glossary of Financial Terms for Levels 4–4+: Young Entrepreneurs
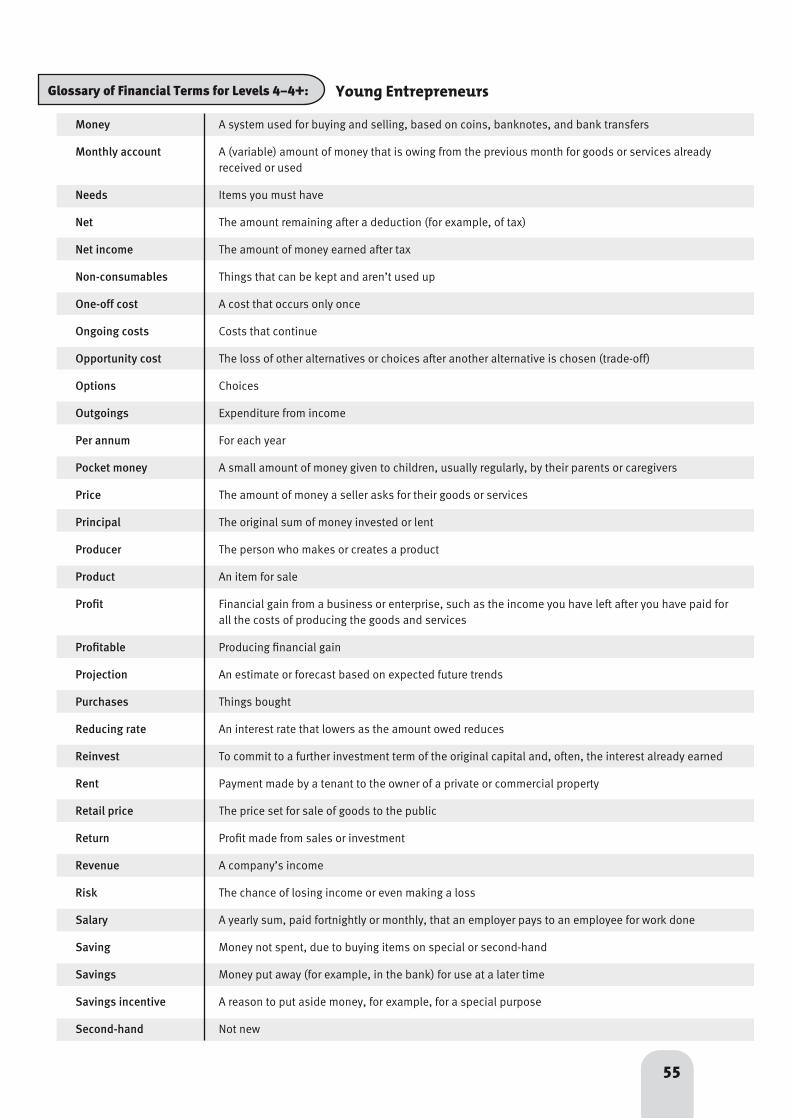
Money A system used for buying and selling, based on coins, banknotes, and bank transfers
Monthly account A (variable) amount of money that is owing from the previous month for goods or services already received or used
Needs Items you must have
Net The amount remaining after a deduction (for example, of tax)
Net income The amount of money earned after tax
Non-consumables Things that can be kept and aren’t used up
One-off cost A cost that occurs only once
Ongoing costs Costs that continue
Opportunity cost The loss of other alternatives or choices after another alternative is chosen (trade-off)
Options Choices
Outgoings Expenditure from income
Per annum For each year
Pocket money A small amount of money given to children, usually regularly, by their parents or caregivers
Price The amount of money a seller asks for their goods or services
Principal The original sum of money invested or lent
Producer The person who makes or creates a product
Product An item for sale
Profit Financial gain from a business or enterprise, such as the income you have left after you have paid for all the costs of producing the goods and services
Profitable Producing financial gain
Projection An estimate or forecast based on expected future trends
Purchases Things bought
Reducing rate An interest rate that lowers as the amount owed reduces
Reinvest To commit to a further investment term of the original capital and, often, the interest already earned
Rent Payment made by a tenant to the owner of a private or commercial property
Retail price The price set for sale of goods to the public
Return Profit made from sales or investment
Revenue A company’s income
Risk The chance of losing income or even making a loss
Salary A yearly sum, paid fortnightly or monthly, that an employer pays to an employee for work done
Saving Money not spent, due to buying items on special or second-hand
Savings Money put away (for example, in the bank) for use at a later time
Savings incentive A reason to put aside money, for example, for a special purpose
Second-hand Not new
55
Glossary of Financial Terms for Levels 4–4+: Young Entrepreneurs

56
Secure Certain to remain safe; risk-free
Selling price The amount of money set as the purchase price for customers
Services Work done for a person, group, or community
Share An equal part of a company’s capital
Share market A place where shares are bought and sold
Shareholder An owner of shares in a company
Special offers Prices that are lower than the usual ones (financial incentives)
Spending Paying for goods or services
Spreadsheet A computer ledger used to keep financial records and other calculations
Start-up costs The costs of beginning a business or enterprise
Start-up money Money needed to begin a business or enterprise
Stock A supply of goods or materials available for sale or use (inventory); the capital raised by a company through the sale of shares
Supplier A person or company who makes available particular goods or services
Supply The quantity of goods and services that people would willingly sell at a particular price
Tax An amount of money deducted from personal income or business profit and paid to the government, or an amount added to the cost of some goods, services, and transactions
Tax rates The percentage of income paid to the IRD, depending on income levels or profit
Term deposit A sum of money placed in a bank or other account for a set period of time
Term deposit rates The amount of interest currently being paid on this type of investment
Term investment Money invested for a set period of time
Trade-off What you are prepared to give up to get what you want (opportunity cost)
Transaction An exchange between buyer and seller, usually of money for what is purchased
Transfer Move from one bank account to another
Trends Happenings over time that allow future events to be predicted
Trust fund A means by which trustees look after assets under certain conditions
Variable costs Costs that change depending on various factors, such as the quantity produced
Wages Money that an employer pays to an employee at an hourly rate (less tax) for work done
Wants What you’d like to have but don’t really need
Will A legal document containing instructions for what to do with a person’s money or possessions after their death
Withdrawal Money you take out of an account, for example, at the bank or at an AT
Glossary of Financial Terms for Levels 4–4+: Young Entrepreneurs
Page 1 Tempting Tangrams
Achievement Objectives
• describe the features of 2-dimensional and 3-dimensional objects, using the language of geometry (Geometry, level 3)
• apply the symmetries of regular polygons (Geometry, level 4)
• find perimeters, areas, and volumes of everyday objects (including irregular and composite shapes), and state the precision (limits) of the answer (Measurement, level 5)
• classify objects, numbers, and ideas (Mathematical Processes, developing logic and reasoning, level 4)
activity
The tangram is a deceptively simple geometrical puzzle. The pieces are easy to make using card and scissors but can be combined in ways that challenge both students and adults. This activity focuses on the areas of the different pieces relative to each other and to the completed square.
57
ackn
ow
ledg
men
ts The Ministry of Education and Learning Media would like to thank Vince Wright, The University of Waikato School Support Services, for developing these teachers’ notes.
Thanks also to Kathie Willis, Enterprise Learning Associates, for reviewing the material; Dianne Prendergast, Lauriston School, for her financial enterprise contribution; Rhys Hill, Centre for Educational Development, Massey University, for his social sciences input; and Liz Stone, Shepston Editing Services, Auckland, and Esther Kiernan, Wellington, for their mathematics review of the answers and notes.
The photographs on the cover are by Adrian Heke and the photographs for the side strips on pages 14 and 15 are by Mark Coote. The original photograph used for the sidestrip on page 2 was supplied by David Bettany. The remaining side strip photographs are by Bunkhouse graphic design.
The photographs and all illustrations are copyright © Crown 2007.
Series Editor: Susan Roche Designer: Bunkhouse graphic design
Published 2007 for the Ministry of Education by Learning Media Limited, Box 3293, Wellington, New Zealand. www.learningmedia.co.nz
Copyright © Crown 2007 All rights reserved. Enquiries should be made to the publisher.
Note: Teachers may copy these notes for educational purposes.
The Answers and Teachers’ Notes are available online at www.tki.org.nz/r/maths/curriculum/figure/level_3_e.php
Dewey number 510 ISBN 978 0 7903 2645 0 Item number 32645 PDF ISBN 978 0 7903 2644 3 Students’ book item number 32643