
ANRITSU CORPORATION · ANRITSU CORPORATION ... document before using the equipment. • Keep this...
152
Document No.: M-W3528AE-6.0 ANRITSU CORPORATION • For safety and warning information, please read this manual before attempting to use the equipment. • Additional safety and warning information is provided within the MS2690A/MS2691A/MS2692A Signal Analyzer Operation Manual (Mainframe Operation) or MS2830A Signal Analyzer Operation Manual (Mainframe Operation). Please also refer to this document before using the equipment. • Keep this manual with the equipment. MX269028A WLAN (802.11) Measurement Software Operation Manual Operation Sixth Edition
Transcript of ANRITSU CORPORATION · ANRITSU CORPORATION ... document before using the equipment. • Keep this...
Document No.: M-W3528AE-6.0
ANRITSU CORPORATION
• For safety and warning information, please read this manual before attempting to use the equipment.
• Additional safety and warning information is provided within the MS2690A/MS2691A/MS2692A Signal Analyzer Operation Manual (Mainframe Operation) or MS2830A Signal Analyzer Operation Manual (Mainframe Operation). Please also refer to this document before using the equipment.
• Keep this manual with the equipment.
MX269028A WLAN (802.11) Measurement
Software Operation Manual
Operation
Sixth Edition
ii
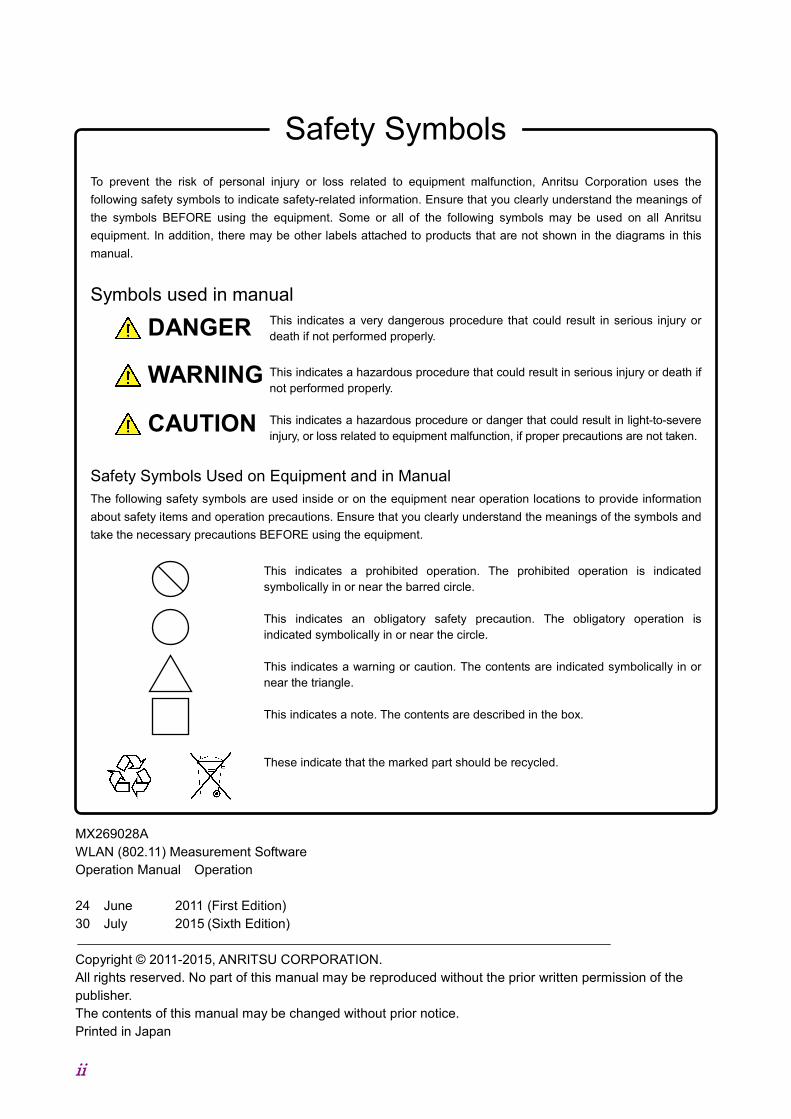
Safety Symbols To prevent the risk of personal injury or loss related to equipment malfunction, Anritsu Corporation uses the following safety symbols to indicate safety-related information. Ensure that you clearly understand the meanings of the symbols BEFORE using the equipment. Some or all of the following symbols may be used on all Anritsu equipment. In addition, there may be other labels attached to products that are not shown in the diagrams in this manual.
Symbols used in manual This indicates a very dangerous procedure that could result in serious injury or death if not performed properly.
This indicates a hazardous procedure that could result in serious injury or death if not performed properly. This indicates a hazardous procedure or danger that could result in light-to-severe injury, or loss related to equipment malfunction, if proper precautions are not taken.
Safety Symbols Used on Equipment and in Manual The following safety symbols are used inside or on the equipment near operation locations to provide information about safety items and operation precautions. Ensure that you clearly understand the meanings of the symbols and take the necessary precautions BEFORE using the equipment.
This indicates a prohibited operation. The prohibited operation is indicated symbolically in or near the barred circle.
This indicates an obligatory safety precaution. The obligatory operation is
indicated symbolically in or near the circle. This indicates a warning or caution. The contents are indicated symbolically in or
near the triangle. This indicates a note. The contents are described in the box. These indicate that the marked part should be recycled.
MX269028A WLAN (802.11) Measurement Software Operation Manual Operation 24 June 2011 (First Edition) 30 July 2015 (Sixth Edition) Copyright © 2011-2015, ANRITSU CORPORATION. All rights reserved. No part of this manual may be reproduced without the prior written permission of the publisher. The contents of this manual may be changed without prior notice. Printed in Japan
DANGER
WARNING
CAUTION

iii
Equipment Certificate Anritsu Corporation guarantees that this equipment was inspected at shipment and meets the published specifications.
Anritsu Warranty • During the warranty period, Anritsu Corporation will repair or exchange this
software free-of-charge if it proves defective when used as described in the operation manual.
• The warranty period is 6 months from the purchase date. • The warranty period after repair or exchange will remain 6 months from
the original purchase date, or 30 days from the date of repair or exchange, depending on whichever is longer.
• This warranty does not cover damage to this software caused by Acts of God, natural disasters, and misuse or mishandling by the customer.
In addition, this warranty is valid only for the original equipment purchaser. It is not transferable if the equipment is resold. Anritsu Corporation shall assume no liability for injury or financial loss of the customer due to the use of or a failure to be able to use this equipment.
Anritsu Corporation Contact In the event that this equipment malfunctions, contact an Anritsu Service and Sales office. Contact information can be found on the last page of the printed version of this manual, and is available in a separate file on the CD version.

iv
Notes On Export Management This product and its manuals may require an Export License/Approval by the Government of the product's country of origin for re-export from your country. Before re-exporting the product or manuals, please contact us to confirm whether they are export-controlled items or not. When you dispose of export-controlled items, the products/manuals need to be broken/shredded so as not to be unlawfully used for military purpose.
v
Software End-User License Agreement (EULA) Please read this Software End-User License Agreement (hereafter this EULA) carefully before using (includes executing, copying, registering, etc.) this software (includes programs, databases, scenarios, etc., used to operate, set, etc., Anritsu electronic equipment). By reading this EULA and using this software, you are agreeing to be bound by the terms of its contents and Anritsu Corporation (hereafter Anritsu) hereby grants you the right to use this Software with the Anritsu-specified equipment (hereafter Equipment) for the purposes set out in this EULA. 1. Grant of License and Limitations
1. Regardless of whether this Software was purchased from or provided free-of-charge by Anritsu, you agree not to rent, lease, lend, or otherwise distribute this Software to third parties and further agree not to disassemble, recompile, reverse engineer, modify, or create derivative works of this Software.
2. You may make one copy of this Software for backup purposes only.
3. You are not permitted to reverse engineer this software.
4. This EULA allows you to install one copy of this Software on one piece of Equipment.
2. Disclaimers To the extent not prohibited by law, in no
event shall Anritsu be liable for personal injury, or any incidental, special, indirect or consequential damages whatsoever, including, without limitation, damages for loss of profits, loss of data, business interruption or any other commercial damages or losses, arising out of or related to your use or inability to use this Software.
3. Limitation of Liability a. If a fault (bug) is discovered in this Software,
preventing operation as described in the operation manual or specifications whether or not the customer uses this software as described in the manual, Anritsu shall at its own discretion, fix the bug, or exchange the software, or suggest a workaround, free-of-charge. However, notwithstanding the above, the following items shall be excluded from repair and warranty.
i) If this Software is deemed to be used for purposes not described in the operation manual or specifications.
ii) If this Software is used in conjunction with other non-Anritsu-approved software.
iii) Recovery of lost or damaged data. iv) If this Software or the Equipment has been
modified, repaired, or otherwise altered without Anritsu's prior approval.
v) For any other reasons out of Anritsu's direct control and responsibility, such as but not limited to, natural disasters, software virus infections, etc.
b. Expenses incurred for transport, hotel, daily allowance, etc., for on-site repairs by Anritsu engineers necessitated by the above faults shall be borne by you.
c. The warranty period for faults listed in article 3a above covered by this EULA shall be either 6 months from the date of purchase of this Software or 30 days after the date of repair, whichever is longer.
vi
4. Export Restrictions You may not use or otherwise export or
re-export directly or indirectly this Software except as authorized by Japanese and United States law. In particular, this software may not be exported or re-exported (a) into any Japanese or US embargoed countries or (b) to anyone on the Japanese or US Treasury Department's list of Specially Designated Nationals or the US Department of Commerce Denied Persons List or Entity List. By using this Software, you warrant that you are not located in any such country or on any such list. You also agree that you will not use this Software for any purposes prohibited by Japanese and US law, including, without limitation, the development, design and manufacture or production of missiles or nuclear, chemical or biological weapons of mass destruction.
5. Termination Anritsu shall deem this EULA terminated if
you violate any conditions described herein. This EULA shall also be terminated if the conditions herein cannot be continued for any good reason, such as violation of copyrights, patents, or other laws and ordinances.
6. Reparations If Anritsu suffers any loss, financial or
otherwise, due to your violation of the terms of this EULA, Anritsu shall have the right to seek proportional damages from you.
7. Responsibility after Termination Upon termination of this EULA in
accordance with item 5, you shall cease all use of this Software immediately and shall as directed by Anritsu either destroy or return this Software and any backup copies, full or partial, to Anritsu.
8. Dispute Resolution If matters of dispute or items not covered by
this EULA arise, they shall be resolved by negotiations in good faith between you and Anritsu.
9. Court of Jurisdiction This EULA shall be interpreted in
accordance with Japanese law and any disputes that cannot be resolved by negotiation described in Article 8 shall be settled by the Japanese courts.
vii
Cautions against computer virus infection • Copying files and data Only files that have been provided directly from Anritsu or generated
using Anritsu equipment should be copied to the instrument. All other required files should be transferred by means of USB or
CompactFlash media after undergoing a thorough virus check. • Adding software Do not download or install software that has not been specifically
recommended or licensed by Anritsu. • Network connections Ensure that the network has sufficient anti-virus security protection in
place.

viii
CE Conformity Marking Anritsu affixes the CE conformity marking on the following product(s) in accordance with the Council Directive 93/68/EEC to indicate that they conform to the EMC and LVD directive of the European Union (EU).
CE marking
1. Product Model Software: MX269028A WLAN (802.11) Measurement
Software 2. Applied Directive and Standards When the MX269028A WLAN (802.11) Measurement Software is installed
in the MS2690A/MS2691A/MS2692A or MS2830A, the applied directive and standards of this unit conform to those of the MS2690A/MS2691A/ MS2692A or MS2830A main frame.
PS: About main frame
Please contact Anritsu for the latest information on the main frame types that the MX269028A can be used with.
ix
C-Tick Conformity Marking Anritsu affixes the C-Tick mark on the following product(s) in accordance with the regulation to indicate that they conform to the EMC framework of Australia/New Zealand.
C-Tick marking
1. Product Model
Software: MX269028A WLAN (802.11) Measurement Software
2. Applied Directive and Standards When the MX269028A WLAN (802.11) Measurement Software is installed
in the MS2690A/MS2691A/MS2692A or MS2830A, the applied directive and standards of this unit conform to those of the MS2690A/MS2691A/MS2692A or MS2830A main frame.
PS: About main frame Please contact Anritsu for the latest information on the main frame
types that the MX269028A can be used with.

x
I
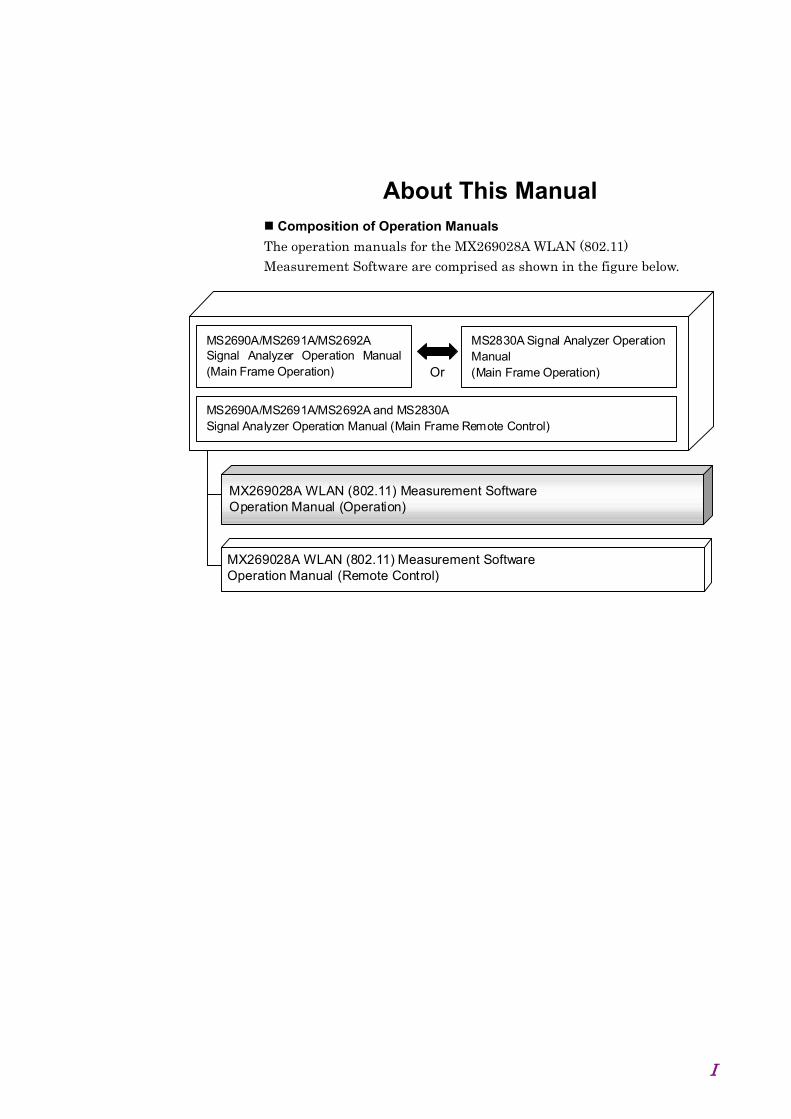
About This Manual Composition of Operation Manuals
The operation manuals for the MX269028A WLAN (802.11) Measurement Software are comprised as shown in the figure below.
MX269028A WLAN (802.11) Measurement Software Operation Manual (Operation)
MX269028A WLAN (802.11) Measurement Software Operation Manual (Remote Control)
MS2690A/MS2691A/MS2692A Signal Analyzer Operation Manual (Main Frame Operation)
MS2690A/MS2691A/MS2692A and MS2830A Signal Analyzer Operation Manual (Main Frame Remote Control)
MS2830A Signal Analyzer Operation Manual (Main Frame Operation) Or
II
• Signal Analyzer Operation Manual (Mainframe Operation) • Signal Analyzer Operation Manual (Mainframe Remote Control) These manuals describe basic operating methods, maintenance procedures, common functions, and common remote control of the signal analyzer mainframe.
• WLAN (802.11) Measurement Software Operation Manual (Operation) <This document>
This manual describes basic operating methods, and functions of the WLAN (802.11) Measurement Software.
As for signal analyzer hardware and its basic functions and operation outline, refer to “MS2690A/MS2691A/MS2692A Signal Analyzer Operation Manual (Mainframe Operation)” or “MS2830A Signal Analyzer Operation Manual (Mainframe Operation)”.
• WLAN (802.11) Measurement Software Operation Manual (Remote Control)
This manual describes remote control of the WLAN (802.11) Measurement Software.
As for signal analyzer application’s basic remote control functions and its definitions of common commands, refer to “MS2690A/MS2691A/MS2692A and MS2830A Signal Analyzer Operation Manual (Mainframe Remote Control)”.
Convention Used in This Manual Throughout this document, the use of MS269x Series is assumed unless otherwise specified. If using MS2830A, change MS269xA to read MS2830A.
In this document, indicates a panel key.
III
1
2
3
4
5
6
Appendix
Index
Table of Contents
About This Manual ....................................... I
Chapter 1 Overview ................................... 1-1 1.1 Product Overview ...................................................... 1-2 1.2 Product Configuration ................................................ 1-3 1.3 Specifications ............................................................. 1-5
Chapter 2 Preparation ............................... 2-1 2.1 Part Names ................................................................ 2-2 2.2 Signal Path Setup ...................................................... 2-11 2.3 Application Startup and Selection .............................. 2-12 2.4 Initialization and Calibration ....................................... 2-13
Chapter 3 Measurement ............................ 3-1 3.1 Basic Operation ......................................................... 3-2 3.2 Setting Frequency ...................................................... 3-5 3.3 Setting Level .............................................................. 3-7 3.4 Capturing IQ Data and Parameter of
WLAN IQproducer .................................................... 3-9 3.5 Setting Common Items .............................................. 3-12 3.6 Setting Measurement Items ....................................... 3-17 3.7 Setting Marker............................................................ 3-48 3.8 Setting Trigger ........................................................... 3-54 3.9 EVM ........................................................................... 3-56 3.10 Constellation Display ................................................. 3-59 3.11 EVM vs Subcarrier Display ........................................ 3-61 3.12 EVM vs Symbol Display ............................................. 3-62 3.13 EVM vs Chip Display ................................................. 3-63 3.14 Phase Error vs Chip Display ...................................... 3-64 3.15 Spectral Flatness Display .......................................... 3-65 3.16 Eye Diagram Display ................................................. 3-68 3.17 Summary Display ....................................................... 3-69 3.18 Power vs Time Setting ............................................... 3-73 3.19 Saving Measurement Results .................................... 3-75

IV.
Chapter 4 Digitize Function ...................... 4-1 4.1 Saving IQ Data........................................................... 4-2 4.2 Replay Function ......................................................... 4-7
Chapter 5 Performance Test ..................... 5-1 5.1 Overview of Performance Test .................................. 5-2 5.2 Performance Test Items ............................................ 5-3
Chapter 6 Other Functions ....................... 6-1 6.1 Selecting Other Functions ......................................... 6-2 6.2 Setting Title ................................................................ 6-2 6.3 Erasing Warmup Message ........................................ 6-2
Appendix A Error Messages ...................... A-1
Appendix B Default Value List ................... B-1
Index .......................................................... Index-1

Chapter 1 Overview
1-1
1
Overview
This chapter provides an overview of the MX269028A WLAN (802.11) Measurement Software and describes the product configuration.
1.1 Product Overview .............................................................. 1-2 1.2 Product Configuration ........................................................ 1-3
1.2.1 Standard configuration .......................................... 1-3 1.2.2 Applicable parts ..................................................... 1-3 1.2.3 Options .................................................................. 1-4
1.3 Specifications ..................................................................... 1-5
Chapter 1 Overview
1-2
1.1 Product Overview The MS269xA Series and MS2830A Signal Analyzer enables high-speed, high-accuracy, and simple measurements of transmission characteristics of base stations and mobile stations for various mobile communications types. The MS269xA Series and MS2830A Signal Analyzer is equipped with high-performance signal analyzer and spectrum analyzer functions as standard, with optional measurement software allowing modulation analysis functionality supporting various digital modulation modes.
The MX269028A WLAN (802.11) Measurement Software (hereafter “this application”) is a software option for measuring the RF characteristics of WLAN specified by the IEEE 802.11 standard.
Note: In order to use this application for MS2830A, the following are required:
• MS2830A-005/105 Analysis Bandwidth Extension to 31.25 MHz
Note: In MS2830A-040, only measurements up to 3.6 GHz are supported.
This application supports the following measurements.
• Modulation accuracy • Transmitter power measurement • Carrier frequency • Transmitter power vs. time measurement
1.2 Product Configuration
1-3
1
Overview
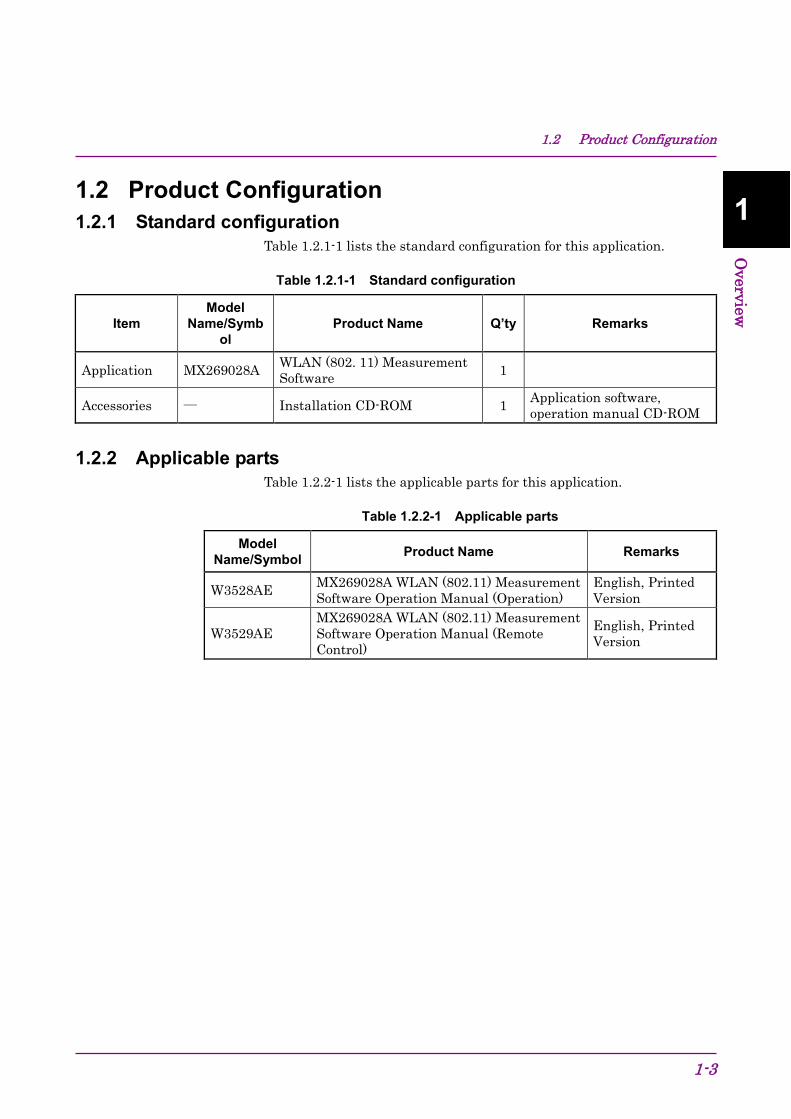
1.2 Product Configuration 1.2.1 Standard configuration
Table 1.2.1-1 lists the standard configuration for this application.
Table 1.2.1-1 Standard configuration
Item Model
Name/Symbol
Product Name Q’ty Remarks
Application MX269028A WLAN (802. 11) Measurement Software 1
Accessories ― Installation CD-ROM 1 Application software, operation manual CD-ROM
1.2.2 Applicable parts Table 1.2.2-1 lists the applicable parts for this application.
Table 1.2.2-1 Applicable parts
Model Name/Symbol Product Name Remarks
W3528AE MX269028A WLAN (802.11) Measurement Software Operation Manual (Operation)
English, Printed Version
W3529AE MX269028A WLAN (802.11) Measurement Software Operation Manual (Remote Control)
English, Printed Version
Chapter 1 Overview
1-4
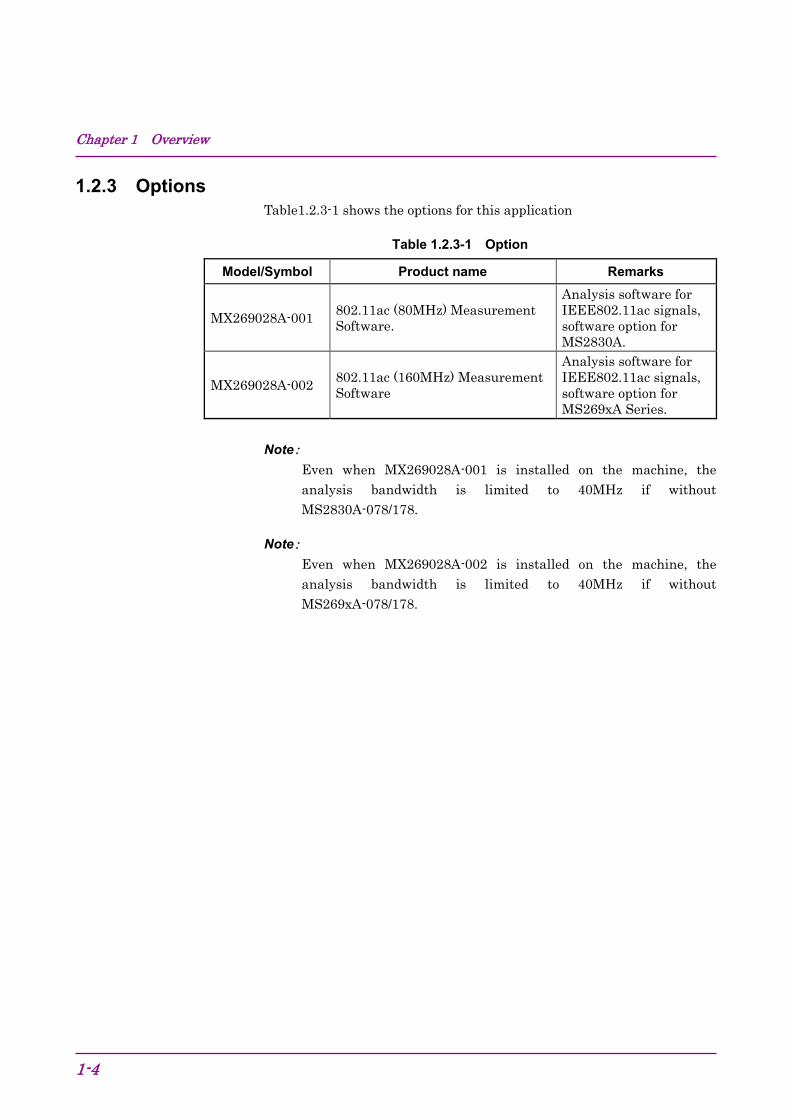
1.2.3 Options Table1.2.3-1 shows the options for this application
Table 1.2.3-1 Option
Model/Symbol Product name Remarks
MX269028A-001 802.11ac (80MHz) Measurement Software.
Analysis software for IEEE802.11ac signals, software option for MS2830A.
MX269028A-002 802.11ac (160MHz) Measurement Software
Analysis software for IEEE802.11ac signals, software option for MS269xA Series.
Note:
Even when MX269028A-001 is installed on the machine, the analysis bandwidth is limited to 40MHz if without MS2830A-078/178.
Note: Even when MX269028A-002 is installed on the machine, the analysis bandwidth is limited to 40MHz if without MS269xA-078/178.
1.3 Specifications
1-5
1
Overview
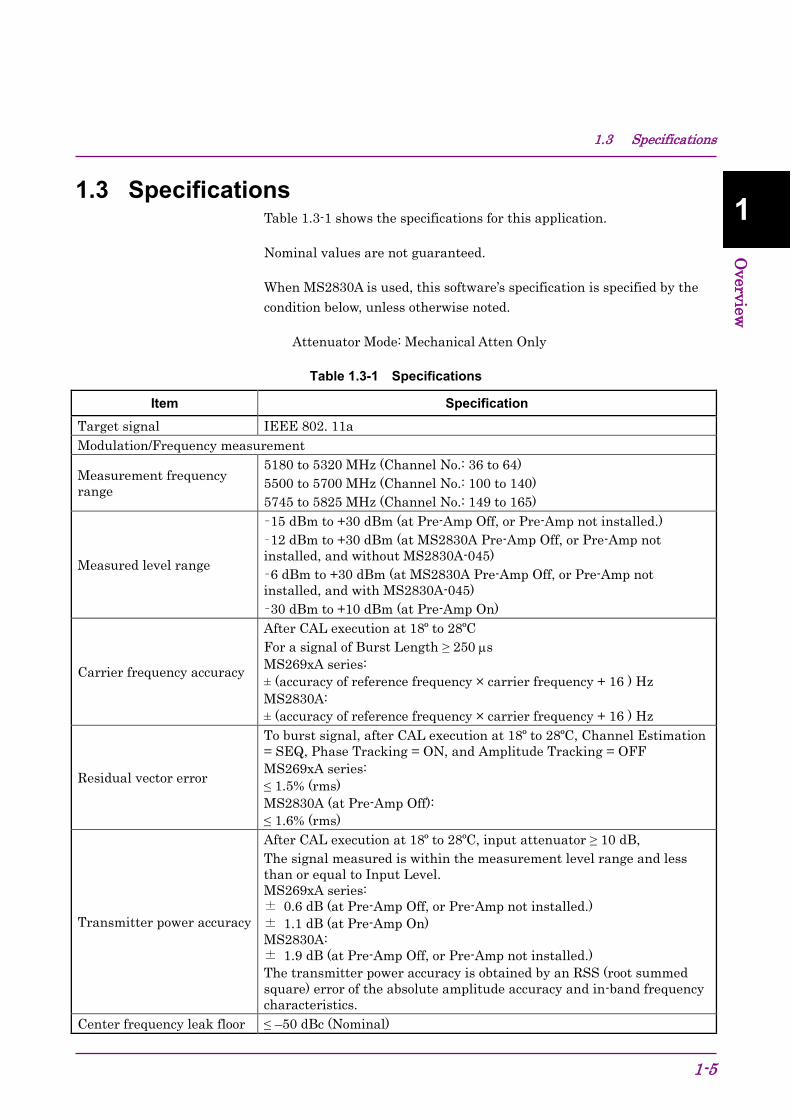
1.3 Specifications Table 1.3-1 shows the specifications for this application.
Nominal values are not guaranteed.
When MS2830A is used, this software’s specification is specified by the condition below, unless otherwise noted.
Attenuator Mode: Mechanical Atten Only
Table 1.3-1 Specifications
Item Specification Target signal IEEE 802. 11a Modulation/Frequency measurement
Measurement frequency range
5180 to 5320 MHz (Channel No.: 36 to 64) 5500 to 5700 MHz (Channel No.: 100 to 140) 5745 to 5825 MHz (Channel No.: 149 to 165)
Measured level range
–15 dBm to +30 dBm (at Pre-Amp Off, or Pre-Amp not installed.) –12 dBm to +30 dBm (at MS2830A Pre-Amp Off, or Pre-Amp not installed, and without MS2830A-045) –6 dBm to +30 dBm (at MS2830A Pre-Amp Off, or Pre-Amp not installed, and with MS2830A-045) –30 dBm to +10 dBm (at Pre-Amp On)
Carrier frequency accuracy
After CAL execution at 18º to 28ºC For a signal of Burst Length ≥ 250 µs MS269xA series: ± (accuracy of reference frequency × carrier frequency + 16 ) Hz MS2830A: ± (accuracy of reference frequency × carrier frequency + 16 ) Hz
Residual vector error
To burst signal, after CAL execution at 18º to 28ºC, Channel Estimation = SEQ, Phase Tracking = ON, and Amplitude Tracking = OFF MS269xA series: ≤ 1.5% (rms) MS2830A (at Pre-Amp Off): ≤ 1.6% (rms)
Transmitter power accuracy
After CAL execution at 18º to 28ºC, input attenuator ≥ 10 dB, The signal measured is within the measurement level range and less than or equal to Input Level. MS269xA series: ± 0.6 dB (at Pre-Amp Off, or Pre-Amp not installed.) ± 1.1 dB (at Pre-Amp On) MS2830A: ± 1.9 dB (at Pre-Amp Off, or Pre-Amp not installed.) The transmitter power accuracy is obtained by an RSS (root summed square) error of the absolute amplitude accuracy and in-band frequency characteristics.
Center frequency leak floor ≤ –50 dBc (Nominal)
Chapter 1 Overview
1-6
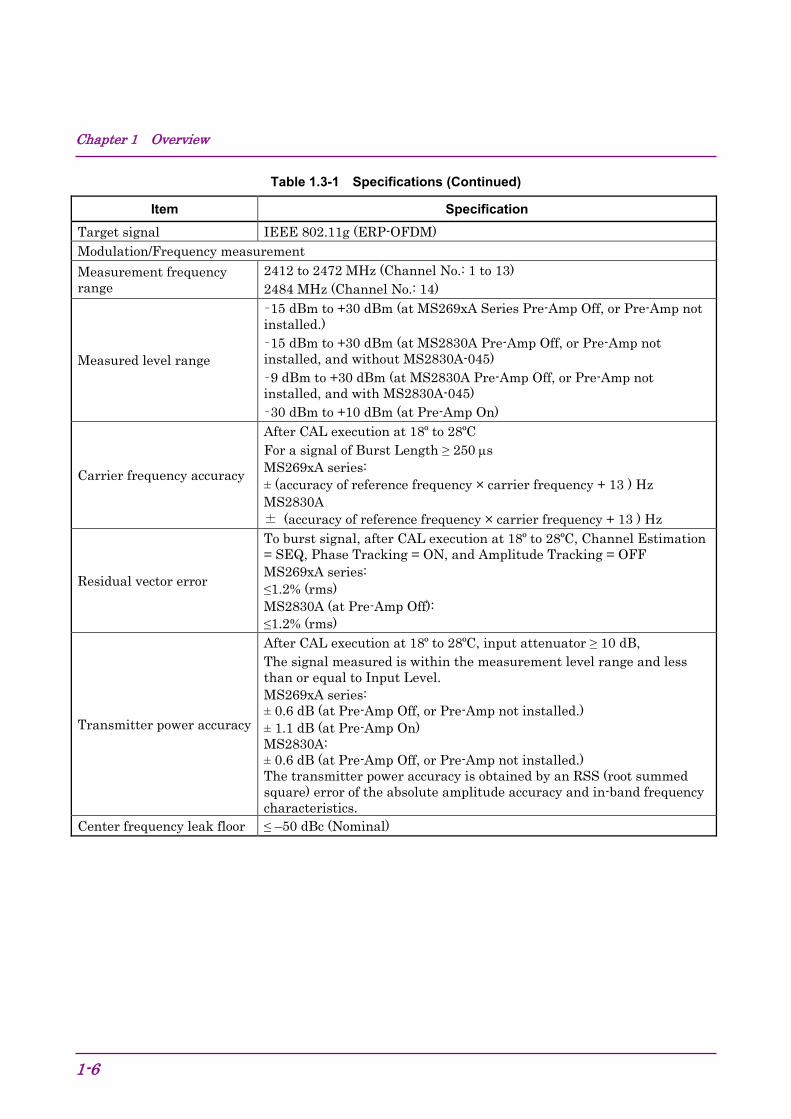
Table 1.3-1 Specifications (Continued)
Item Specification Target signal IEEE 802.11g (ERP-OFDM) Modulation/Frequency measurement Measurement frequency range
2412 to 2472 MHz (Channel No.: 1 to 13) 2484 MHz (Channel No.: 14)
Measured level range
–15 dBm to +30 dBm (at MS269xA Series Pre-Amp Off, or Pre-Amp not installed.) –15 dBm to +30 dBm (at MS2830A Pre-Amp Off, or Pre-Amp not installed, and without MS2830A-045) –9 dBm to +30 dBm (at MS2830A Pre-Amp Off, or Pre-Amp not installed, and with MS2830A-045) –30 dBm to +10 dBm (at Pre-Amp On)
Carrier frequency accuracy
After CAL execution at 18º to 28ºC For a signal of Burst Length ≥ 250 µs MS269xA series: ± (accuracy of reference frequency × carrier frequency + 13 ) Hz MS2830A ± (accuracy of reference frequency × carrier frequency + 13 ) Hz
Residual vector error
To burst signal, after CAL execution at 18º to 28ºC, Channel Estimation = SEQ, Phase Tracking = ON, and Amplitude Tracking = OFF MS269xA series: ≤1.2% (rms) MS2830A (at Pre-Amp Off): ≤1.2% (rms)
Transmitter power accuracy
After CAL execution at 18º to 28ºC, input attenuator ≥ 10 dB, The signal measured is within the measurement level range and less than or equal to Input Level. MS269xA series: ± 0.6 dB (at Pre-Amp Off, or Pre-Amp not installed.) ± 1.1 dB (at Pre-Amp On) MS2830A: ± 0.6 dB (at Pre-Amp Off, or Pre-Amp not installed.) The transmitter power accuracy is obtained by an RSS (root summed square) error of the absolute amplitude accuracy and in-band frequency characteristics.
Center frequency leak floor ≤ –50 dBc (Nominal)
1.3 Specifications
1-7
1
Overview
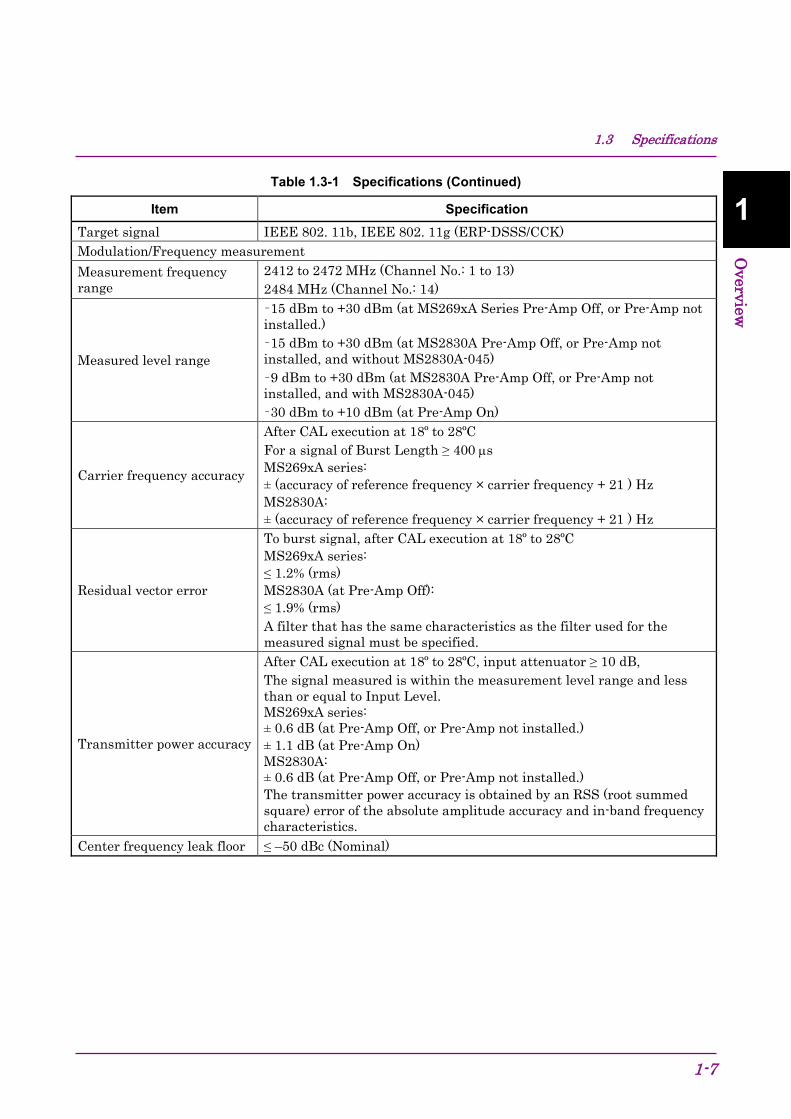
Table 1.3-1 Specifications (Continued)
Item Specification Target signal IEEE 802. 11b, IEEE 802. 11g (ERP-DSSS/CCK) Modulation/Frequency measurement Measurement frequency range
2412 to 2472 MHz (Channel No.: 1 to 13) 2484 MHz (Channel No.: 14)
Measured level range
–15 dBm to +30 dBm (at MS269xA Series Pre-Amp Off, or Pre-Amp not installed.) –15 dBm to +30 dBm (at MS2830A Pre-Amp Off, or Pre-Amp not installed, and without MS2830A-045) –9 dBm to +30 dBm (at MS2830A Pre-Amp Off, or Pre-Amp not installed, and with MS2830A-045) –30 dBm to +10 dBm (at Pre-Amp On)
Carrier frequency accuracy
After CAL execution at 18º to 28ºC For a signal of Burst Length ≥ 400 µs MS269xA series: ± (accuracy of reference frequency × carrier frequency + 21 ) Hz MS2830A: ± (accuracy of reference frequency × carrier frequency + 21 ) Hz
Residual vector error
To burst signal, after CAL execution at 18º to 28ºC MS269xA series: ≤ 1.2% (rms) MS2830A (at Pre-Amp Off): ≤ 1.9% (rms) A filter that has the same characteristics as the filter used for the measured signal must be specified.
Transmitter power accuracy
After CAL execution at 18º to 28ºC, input attenuator ≥ 10 dB, The signal measured is within the measurement level range and less than or equal to Input Level. MS269xA series: ± 0.6 dB (at Pre-Amp Off, or Pre-Amp not installed.) ± 1.1 dB (at Pre-Amp On) MS2830A: ± 0.6 dB (at Pre-Amp Off, or Pre-Amp not installed.) The transmitter power accuracy is obtained by an RSS (root summed square) error of the absolute amplitude accuracy and in-band frequency characteristics.
Center frequency leak floor ≤ –50 dBc (Nominal)
Chapter 1 Overview
1-8
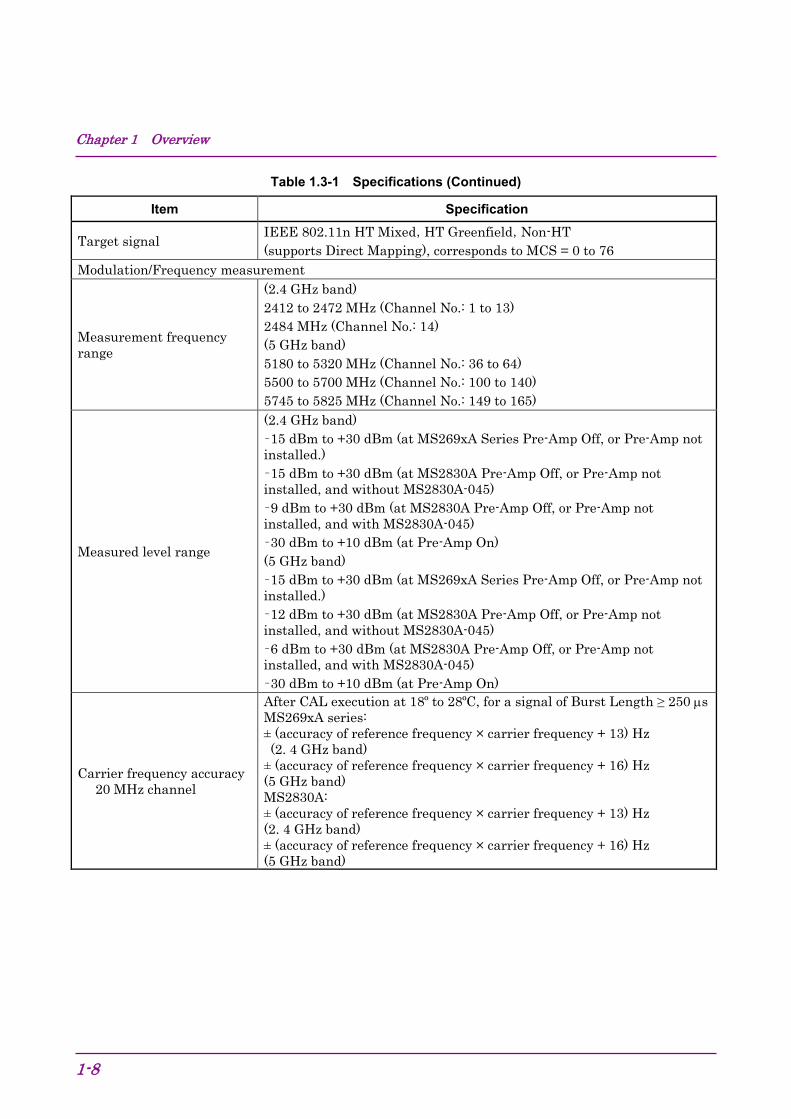
Table 1.3-1 Specifications (Continued)
Item Specification
Target signal IEEE 802.11n HT Mixed, HT Greenfield, Non-HT (supports Direct Mapping), corresponds to MCS = 0 to 76
Modulation/Frequency measurement
Measurement frequency range
(2.4 GHz band) 2412 to 2472 MHz (Channel No.: 1 to 13) 2484 MHz (Channel No.: 14) (5 GHz band) 5180 to 5320 MHz (Channel No.: 36 to 64) 5500 to 5700 MHz (Channel No.: 100 to 140) 5745 to 5825 MHz (Channel No.: 149 to 165)
Measured level range
(2.4 GHz band) –15 dBm to +30 dBm (at MS269xA Series Pre-Amp Off, or Pre-Amp not installed.) –15 dBm to +30 dBm (at MS2830A Pre-Amp Off, or Pre-Amp not installed, and without MS2830A-045) –9 dBm to +30 dBm (at MS2830A Pre-Amp Off, or Pre-Amp not installed, and with MS2830A-045) –30 dBm to +10 dBm (at Pre-Amp On) (5 GHz band) –15 dBm to +30 dBm (at MS269xA Series Pre-Amp Off, or Pre-Amp not installed.) –12 dBm to +30 dBm (at MS2830A Pre-Amp Off, or Pre-Amp not installed, and without MS2830A-045) –6 dBm to +30 dBm (at MS2830A Pre-Amp Off, or Pre-Amp not installed, and with MS2830A-045) –30 dBm to +10 dBm (at Pre-Amp On)
Carrier frequency accuracy 20 MHz channel
After CAL execution at 18º to 28ºC, for a signal of Burst Length ≥ 250 µs MS269xA series: ± (accuracy of reference frequency × carrier frequency + 13) Hz (2. 4 GHz band) ± (accuracy of reference frequency × carrier frequency + 16) Hz (5 GHz band) MS2830A: ± (accuracy of reference frequency × carrier frequency + 13) Hz (2. 4 GHz band) ± (accuracy of reference frequency × carrier frequency + 16) Hz (5 GHz band)
1.3 Specifications
1-9
1
Overview
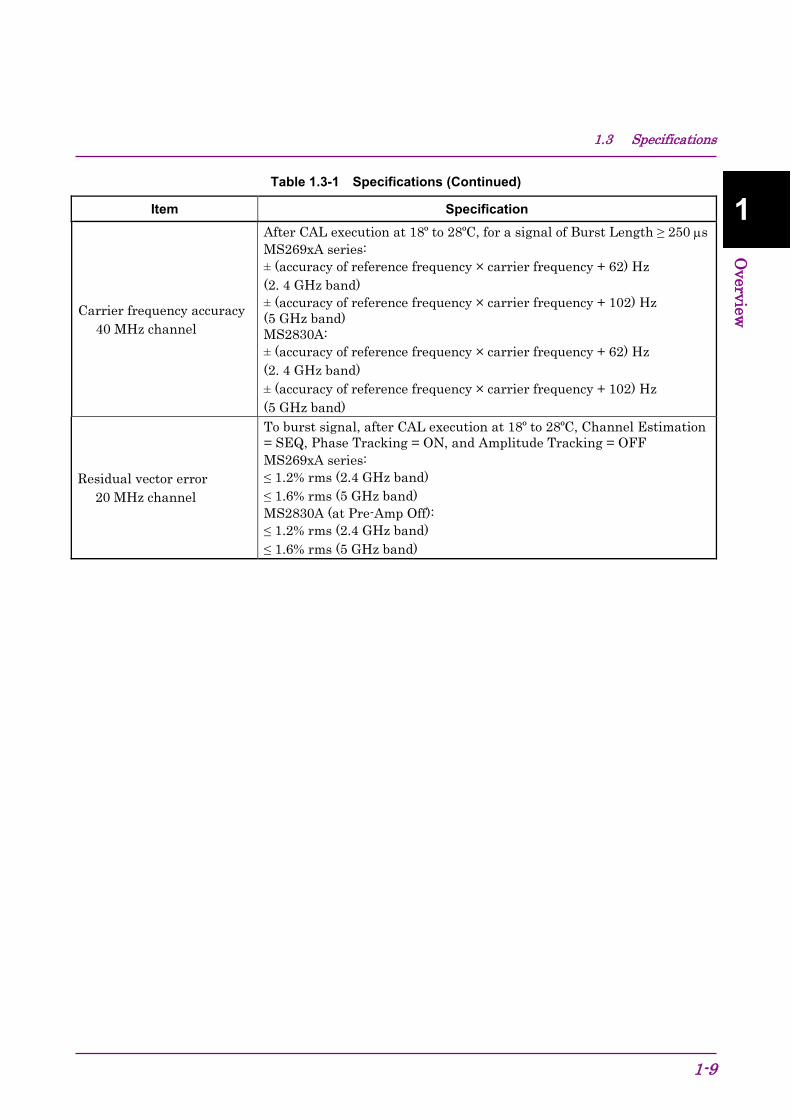
Table 1.3-1 Specifications (Continued)
Item Specification
Carrier frequency accuracy 40 MHz channel
After CAL execution at 18º to 28ºC, for a signal of Burst Length ≥ 250 µs MS269xA series: ± (accuracy of reference frequency × carrier frequency + 62) Hz (2. 4 GHz band) ± (accuracy of reference frequency × carrier frequency + 102) Hz (5 GHz band) MS2830A: ± (accuracy of reference frequency × carrier frequency + 62) Hz (2. 4 GHz band) ± (accuracy of reference frequency × carrier frequency + 102) Hz (5 GHz band)
Residual vector error 20 MHz channel
To burst signal, after CAL execution at 18º to 28ºC, Channel Estimation = SEQ, Phase Tracking = ON, and Amplitude Tracking = OFF MS269xA series: ≤ 1.2% rms (2.4 GHz band) ≤ 1.6% rms (5 GHz band) MS2830A (at Pre-Amp Off): ≤ 1.2% rms (2.4 GHz band) ≤ 1.6% rms (5 GHz band)
Chapter 1 Overview
1-10
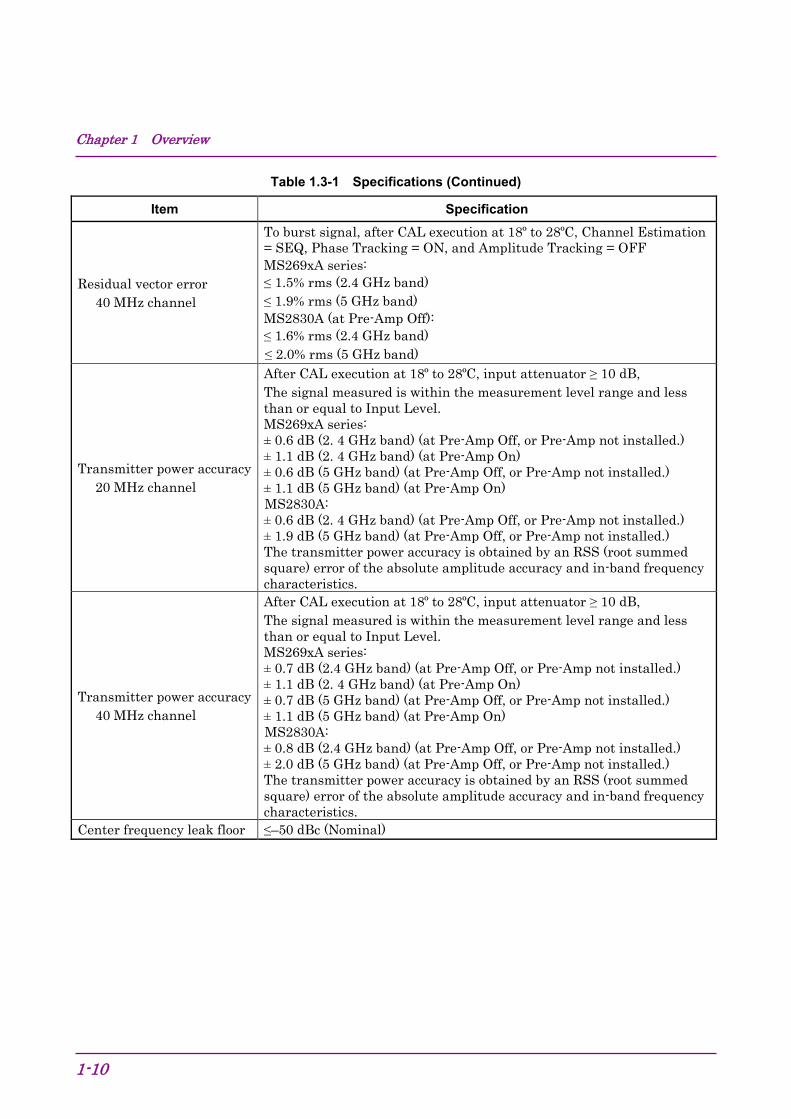
Table 1.3-1 Specifications (Continued)
Item Specification
Residual vector error 40 MHz channel
To burst signal, after CAL execution at 18º to 28ºC, Channel Estimation = SEQ, Phase Tracking = ON, and Amplitude Tracking = OFF MS269xA series: ≤ 1.5% rms (2.4 GHz band) ≤ 1.9% rms (5 GHz band) MS2830A (at Pre-Amp Off): ≤ 1.6% rms (2.4 GHz band) ≤ 2.0% rms (5 GHz band)
Transmitter power accuracy 20 MHz channel
After CAL execution at 18º to 28ºC, input attenuator ≥ 10 dB, The signal measured is within the measurement level range and less than or equal to Input Level. MS269xA series: ± 0.6 dB (2. 4 GHz band) (at Pre-Amp Off, or Pre-Amp not installed.) ± 1.1 dB (2. 4 GHz band) (at Pre-Amp On) ± 0.6 dB (5 GHz band) (at Pre-Amp Off, or Pre-Amp not installed.) ± 1.1 dB (5 GHz band) (at Pre-Amp On) MS2830A: ± 0.6 dB (2. 4 GHz band) (at Pre-Amp Off, or Pre-Amp not installed.) ± 1.9 dB (5 GHz band) (at Pre-Amp Off, or Pre-Amp not installed.) The transmitter power accuracy is obtained by an RSS (root summed square) error of the absolute amplitude accuracy and in-band frequency characteristics.
Transmitter power accuracy 40 MHz channel
After CAL execution at 18º to 28ºC, input attenuator ≥ 10 dB, The signal measured is within the measurement level range and less than or equal to Input Level. MS269xA series: ± 0.7 dB (2.4 GHz band) (at Pre-Amp Off, or Pre-Amp not installed.) ± 1.1 dB (2. 4 GHz band) (at Pre-Amp On) ± 0.7 dB (5 GHz band) (at Pre-Amp Off, or Pre-Amp not installed.) ± 1.1 dB (5 GHz band) (at Pre-Amp On) MS2830A: ± 0.8 dB (2.4 GHz band) (at Pre-Amp Off, or Pre-Amp not installed.) ± 2.0 dB (5 GHz band) (at Pre-Amp Off, or Pre-Amp not installed.) The transmitter power accuracy is obtained by an RSS (root summed square) error of the absolute amplitude accuracy and in-band frequency characteristics.
Center frequency leak floor ≤–50 dBc (Nominal)
1.3 Specifications
1-11
1
Overview
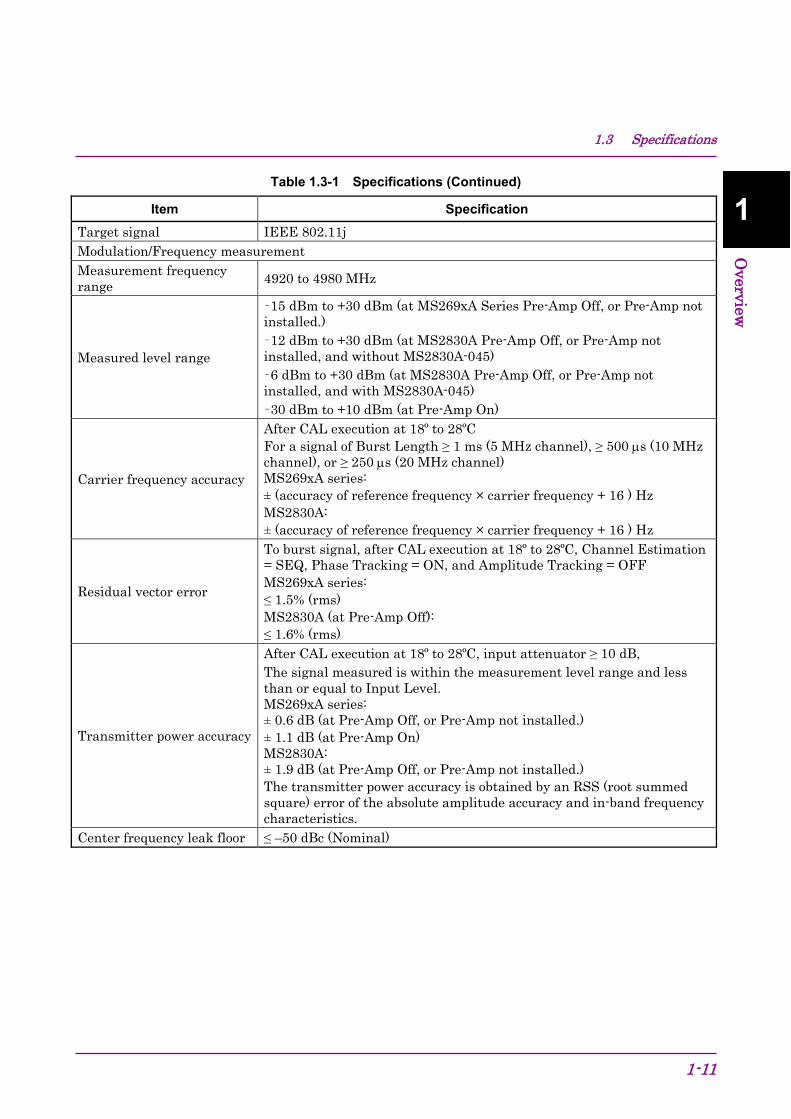
Table 1.3-1 Specifications (Continued)
Item Specification Target signal IEEE 802.11j Modulation/Frequency measurement Measurement frequency range 4920 to 4980 MHz
Measured level range
–15 dBm to +30 dBm (at MS269xA Series Pre-Amp Off, or Pre-Amp not installed.) –12 dBm to +30 dBm (at MS2830A Pre-Amp Off, or Pre-Amp not installed, and without MS2830A-045) –6 dBm to +30 dBm (at MS2830A Pre-Amp Off, or Pre-Amp not installed, and with MS2830A-045) –30 dBm to +10 dBm (at Pre-Amp On)
Carrier frequency accuracy
After CAL execution at 18º to 28ºC For a signal of Burst Length ≥ 1 ms (5 MHz channel), ≥ 500 µs (10 MHz channel), or ≥ 250 µs (20 MHz channel) MS269xA series: ± (accuracy of reference frequency × carrier frequency + 16 ) Hz MS2830A: ± (accuracy of reference frequency × carrier frequency + 16 ) Hz
Residual vector error
To burst signal, after CAL execution at 18º to 28ºC, Channel Estimation = SEQ, Phase Tracking = ON, and Amplitude Tracking = OFF MS269xA series: ≤ 1.5% (rms) MS2830A (at Pre-Amp Off): ≤ 1.6% (rms)
Transmitter power accuracy
After CAL execution at 18º to 28ºC, input attenuator ≥ 10 dB, The signal measured is within the measurement level range and less than or equal to Input Level. MS269xA series: ± 0.6 dB (at Pre-Amp Off, or Pre-Amp not installed.) ± 1.1 dB (at Pre-Amp On) MS2830A: ± 1.9 dB (at Pre-Amp Off, or Pre-Amp not installed.) The transmitter power accuracy is obtained by an RSS (root summed square) error of the absolute amplitude accuracy and in-band frequency characteristics.
Center frequency leak floor ≤ –50 dBc (Nominal)
Chapter 1 Overview
1-12
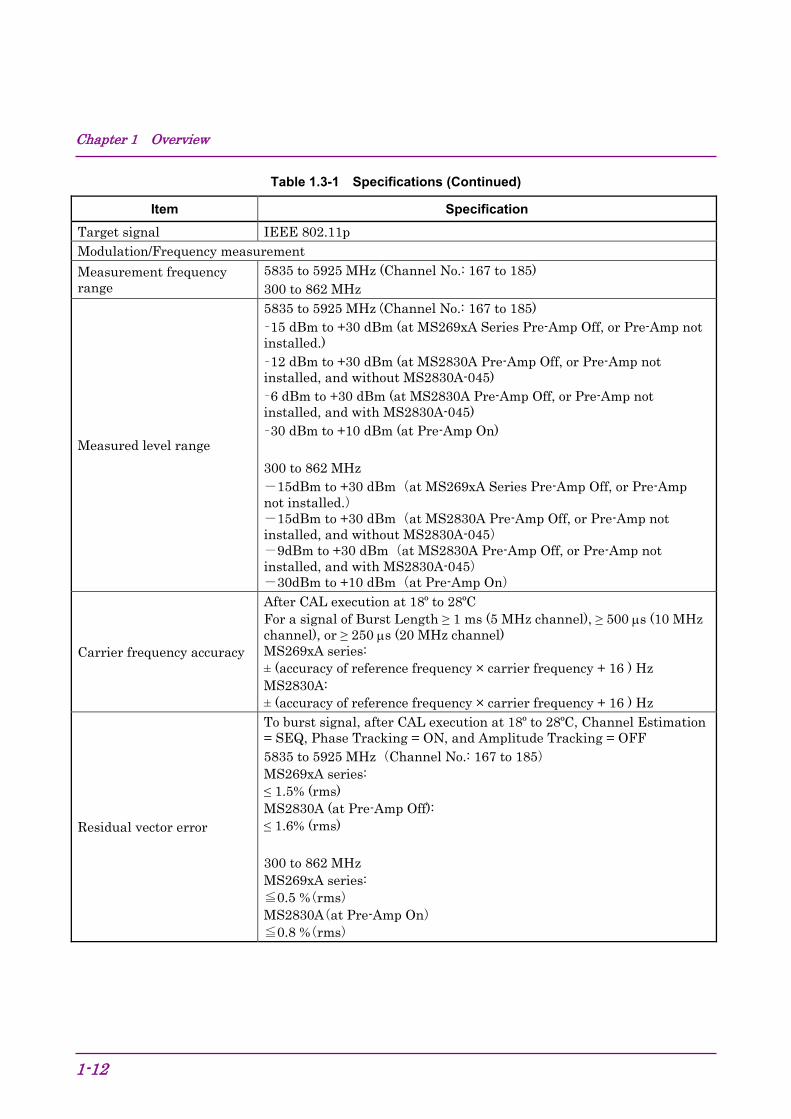
Table 1.3-1 Specifications (Continued)
Item Specification Target signal IEEE 802.11p Modulation/Frequency measurement Measurement frequency range
5835 to 5925 MHz (Channel No.: 167 to 185) 300 to 862 MHz
Measured level range
5835 to 5925 MHz (Channel No.: 167 to 185) –15 dBm to +30 dBm (at MS269xA Series Pre-Amp Off, or Pre-Amp not installed.) –12 dBm to +30 dBm (at MS2830A Pre-Amp Off, or Pre-Amp not installed, and without MS2830A-045) –6 dBm to +30 dBm (at MS2830A Pre-Amp Off, or Pre-Amp not installed, and with MS2830A-045) –30 dBm to +10 dBm (at Pre-Amp On) 300 to 862 MHz -15dBm to +30 dBm (at MS269xA Series Pre-Amp Off, or Pre-Amp not installed.) -15dBm to +30 dBm (at MS2830A Pre-Amp Off, or Pre-Amp not installed, and without MS2830A-045) -9dBm to +30 dBm (at MS2830A Pre-Amp Off, or Pre-Amp not installed, and with MS2830A-045) -30dBm to +10 dBm (at Pre-Amp On)
Carrier frequency accuracy
After CAL execution at 18º to 28ºC For a signal of Burst Length ≥ 1 ms (5 MHz channel), ≥ 500 µs (10 MHz channel), or ≥ 250 µs (20 MHz channel) MS269xA series: ± (accuracy of reference frequency × carrier frequency + 16 ) Hz MS2830A: ± (accuracy of reference frequency × carrier frequency + 16 ) Hz
Residual vector error
To burst signal, after CAL execution at 18º to 28ºC, Channel Estimation = SEQ, Phase Tracking = ON, and Amplitude Tracking = OFF 5835 to 5925 MHz (Channel No.: 167 to 185) MS269xA series: ≤ 1.5% (rms) MS2830A (at Pre-Amp Off): ≤ 1.6% (rms) 300 to 862 MHz MS269xA series: ≦0.5 %(rms) MS2830A(at Pre-Amp On) ≦0.8 %(rms)

1.3 Specifications
1-13
1
Overview
Table 1.3-1 Specifications (Continued)
Item Specification Target signal IEEE 802.11p (Continued) Modulation/Frequency measurement
Transmitter power accuracy
After CAL execution at 18º to 28ºC, input attenuator ≥ 10 dB, The signal measured is within the measurement level range and less than or equal to Input Level. MS269xA series: ± 0.6 dB (at Pre-Amp Off, or Pre-Amp not installed.) ± 1.1 dB (at Pre-Amp On) MS2830A: 300 to 862 MHz ±0.7 dB (at Pre-Amp Off, or Pre-Amp not installed.) 5835 to 5925 MHz (Channel No.: 167 to 185) ± 1.9 dB (at Pre-Amp Off, or Pre-Amp not installed.) The transmitter power accuracy is obtained by an RSS (root summed square) error of the absolute amplitude accuracy and in-band frequency characteristics.
Center frequency leak floor ≤ –50 dBc (Nominal)
Chapter 1 Overview
1-14
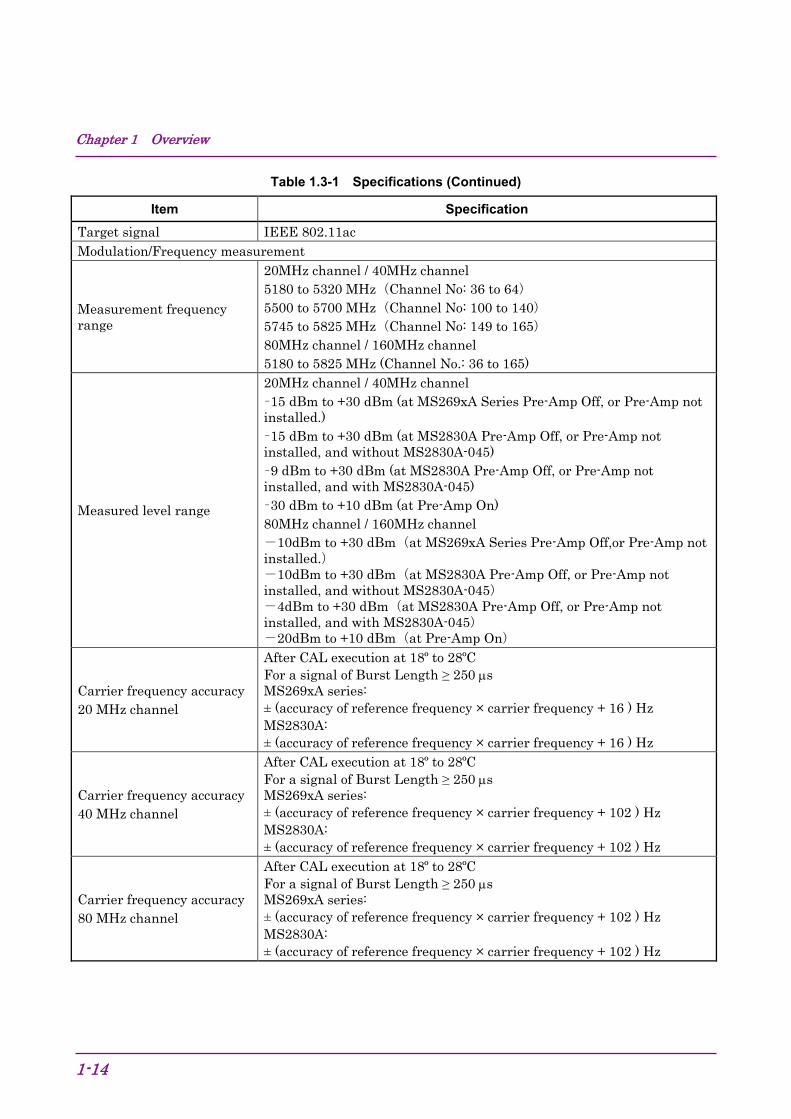
Table 1.3-1 Specifications (Continued)
Item Specification Target signal IEEE 802.11ac Modulation/Frequency measurement
Measurement frequency range
20MHz channel / 40MHz channel 5180 to 5320 MHz (Channel No: 36 to 64) 5500 to 5700 MHz (Channel No: 100 to 140) 5745 to 5825 MHz (Channel No: 149 to 165) 80MHz channel / 160MHz channel 5180 to 5825 MHz (Channel No.: 36 to 165)
Measured level range
20MHz channel / 40MHz channel –15 dBm to +30 dBm (at MS269xA Series Pre-Amp Off, or Pre-Amp not installed.) –15 dBm to +30 dBm (at MS2830A Pre-Amp Off, or Pre-Amp not installed, and without MS2830A-045) –9 dBm to +30 dBm (at MS2830A Pre-Amp Off, or Pre-Amp not installed, and with MS2830A-045) –30 dBm to +10 dBm (at Pre-Amp On) 80MHz channel / 160MHz channel -10dBm to +30 dBm (at MS269xA Series Pre-Amp Off,or Pre-Amp not installed.) -10dBm to +30 dBm (at MS2830A Pre-Amp Off, or Pre-Amp not installed, and without MS2830A-045) -4dBm to +30 dBm (at MS2830A Pre-Amp Off, or Pre-Amp not installed, and with MS2830A-045) -20dBm to +10 dBm (at Pre-Amp On)
Carrier frequency accuracy 20 MHz channel
After CAL execution at 18º to 28ºC For a signal of Burst Length ≥ 250 µs MS269xA series: ± (accuracy of reference frequency × carrier frequency + 16 ) Hz MS2830A: ± (accuracy of reference frequency × carrier frequency + 16 ) Hz
Carrier frequency accuracy 40 MHz channel
After CAL execution at 18º to 28ºC For a signal of Burst Length ≥ 250 µs MS269xA series: ± (accuracy of reference frequency × carrier frequency + 102 ) Hz MS2830A: ± (accuracy of reference frequency × carrier frequency + 102 ) Hz
Carrier frequency accuracy 80 MHz channel
After CAL execution at 18º to 28ºC For a signal of Burst Length ≥ 250 µs MS269xA series: ± (accuracy of reference frequency × carrier frequency + 102 ) Hz MS2830A: ± (accuracy of reference frequency × carrier frequency + 102 ) Hz
1.3 Specifications
1-15
1
Overview
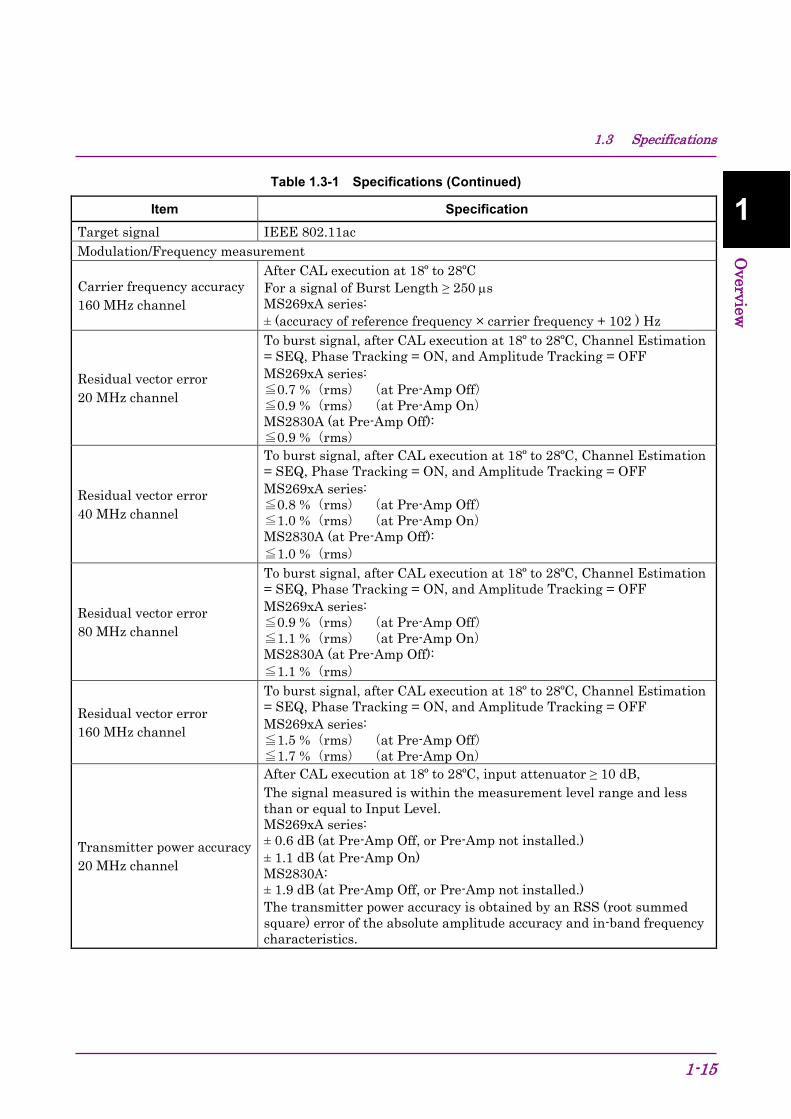
Table 1.3-1 Specifications (Continued)
Item Specification Target signal IEEE 802.11ac Modulation/Frequency measurement
Carrier frequency accuracy 160 MHz channel
After CAL execution at 18º to 28ºC For a signal of Burst Length ≥ 250 µs MS269xA series: ± (accuracy of reference frequency × carrier frequency + 102 ) Hz
Residual vector error 20 MHz channel
To burst signal, after CAL execution at 18º to 28ºC, Channel Estimation = SEQ, Phase Tracking = ON, and Amplitude Tracking = OFF MS269xA series: ≦0.7 %(rms) (at Pre-Amp Off) ≦0.9 %(rms) (at Pre-Amp On) MS2830A (at Pre-Amp Off): ≦0.9 %(rms)
Residual vector error 40 MHz channel
To burst signal, after CAL execution at 18º to 28ºC, Channel Estimation = SEQ, Phase Tracking = ON, and Amplitude Tracking = OFF MS269xA series: ≦0.8 %(rms) (at Pre-Amp Off) ≦1.0 %(rms) (at Pre-Amp On) MS2830A (at Pre-Amp Off): ≦1.0 %(rms)
Residual vector error 80 MHz channel
To burst signal, after CAL execution at 18º to 28ºC, Channel Estimation = SEQ, Phase Tracking = ON, and Amplitude Tracking = OFF MS269xA series: ≦0.9 %(rms) (at Pre-Amp Off) ≦1.1 %(rms) (at Pre-Amp On) MS2830A (at Pre-Amp Off): ≦1.1 %(rms)
Residual vector error 160 MHz channel
To burst signal, after CAL execution at 18º to 28ºC, Channel Estimation = SEQ, Phase Tracking = ON, and Amplitude Tracking = OFF MS269xA series: ≦1.5 %(rms) (at Pre-Amp Off) ≦1.7 %(rms) (at Pre-Amp On)
Transmitter power accuracy 20 MHz channel
After CAL execution at 18º to 28ºC, input attenuator ≥ 10 dB, The signal measured is within the measurement level range and less than or equal to Input Level. MS269xA series: ± 0.6 dB (at Pre-Amp Off, or Pre-Amp not installed.) ± 1.1 dB (at Pre-Amp On) MS2830A: ± 1.9 dB (at Pre-Amp Off, or Pre-Amp not installed.) The transmitter power accuracy is obtained by an RSS (root summed square) error of the absolute amplitude accuracy and in-band frequency characteristics.
Chapter 1 Overview
1-16.
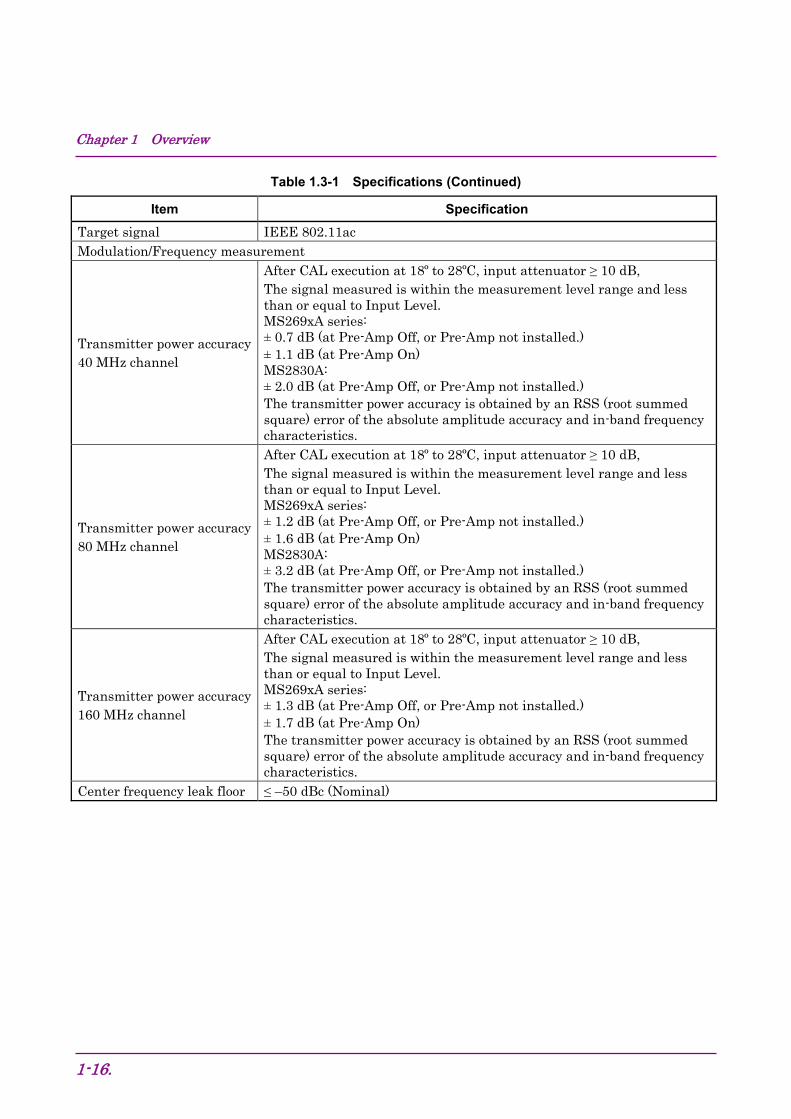
Table 1.3-1 Specifications (Continued)
Item Specification Target signal IEEE 802.11ac Modulation/Frequency measurement
Transmitter power accuracy 40 MHz channel
After CAL execution at 18º to 28ºC, input attenuator ≥ 10 dB, The signal measured is within the measurement level range and less than or equal to Input Level. MS269xA series: ± 0.7 dB (at Pre-Amp Off, or Pre-Amp not installed.) ± 1.1 dB (at Pre-Amp On) MS2830A: ± 2.0 dB (at Pre-Amp Off, or Pre-Amp not installed.) The transmitter power accuracy is obtained by an RSS (root summed square) error of the absolute amplitude accuracy and in-band frequency characteristics.
Transmitter power accuracy 80 MHz channel
After CAL execution at 18º to 28ºC, input attenuator ≥ 10 dB, The signal measured is within the measurement level range and less than or equal to Input Level. MS269xA series: ± 1.2 dB (at Pre-Amp Off, or Pre-Amp not installed.) ± 1.6 dB (at Pre-Amp On) MS2830A: ± 3.2 dB (at Pre-Amp Off, or Pre-Amp not installed.) The transmitter power accuracy is obtained by an RSS (root summed square) error of the absolute amplitude accuracy and in-band frequency characteristics.
Transmitter power accuracy 160 MHz channel
After CAL execution at 18º to 28ºC, input attenuator ≥ 10 dB, The signal measured is within the measurement level range and less than or equal to Input Level. MS269xA series: ± 1.3 dB (at Pre-Amp Off, or Pre-Amp not installed.) ± 1.7 dB (at Pre-Amp On) The transmitter power accuracy is obtained by an RSS (root summed square) error of the absolute amplitude accuracy and in-band frequency characteristics.
Center frequency leak floor ≤ –50 dBc (Nominal)
Chapter 2 Preparation
2-1
2
Preparation
This chapter describes the preparations required for using the application you are using. Refer to the MS2690A/MS2691A/MS2692A Signal Analyzer Operation Manual (Mainframe Operation) or MS2830A Signal Analyzer Operation Manual (Mainframe Operation) for common features not included in this manual.
2.1 Part Names ................................................................... 2-2 2.1.1 Front panel ....................................................... 2-2 2.1.2 Rear panel ........................................................ 2-8
2.2 Signal Path Setup ....................................................... 2-11 2.3 Application Startup and Selection ............................... 2-12
2.3.1 Launching application ..................................... 2-12 2.3.2 Selecting application....................................... 2-12
2.4 Initialization and Calibration ........................................ 2-13 2.4.1 Initialization ..................................................... 2-13 2.4.2 Calibration ...................................................... 2-13
Chapter 2 Preparation
2-2
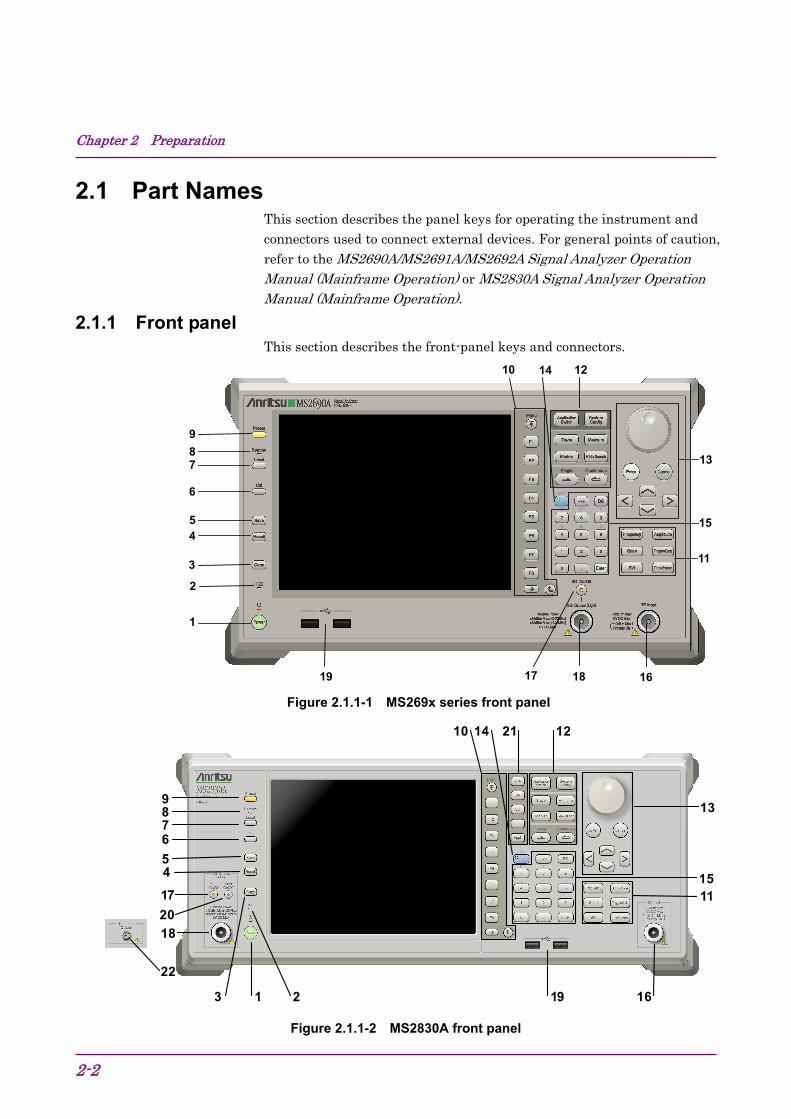
2.1 Part Names This section describes the panel keys for operating the instrument and connectors used to connect external devices. For general points of caution, refer to the MS2690A/MS2691A/MS2692A Signal Analyzer Operation Manual (Mainframe Operation) or MS2830A Signal Analyzer Operation Manual (Mainframe Operation).
2.1.1 Front panel This section describes the front-panel keys and connectors.
1
2
3
4 5
6
7 8
9
19 17 18 16
11
13
10 12 14
15
Figure 2.1.1-1 MS269x series front panel
9 8 7 6
5 4
3 2 1
17
20
18
19 16
1115
13
10 21 12 14
22
Figure 2.1.1-2 MS2830A front panel
2.1 Part Names
2-3
2
Preparation
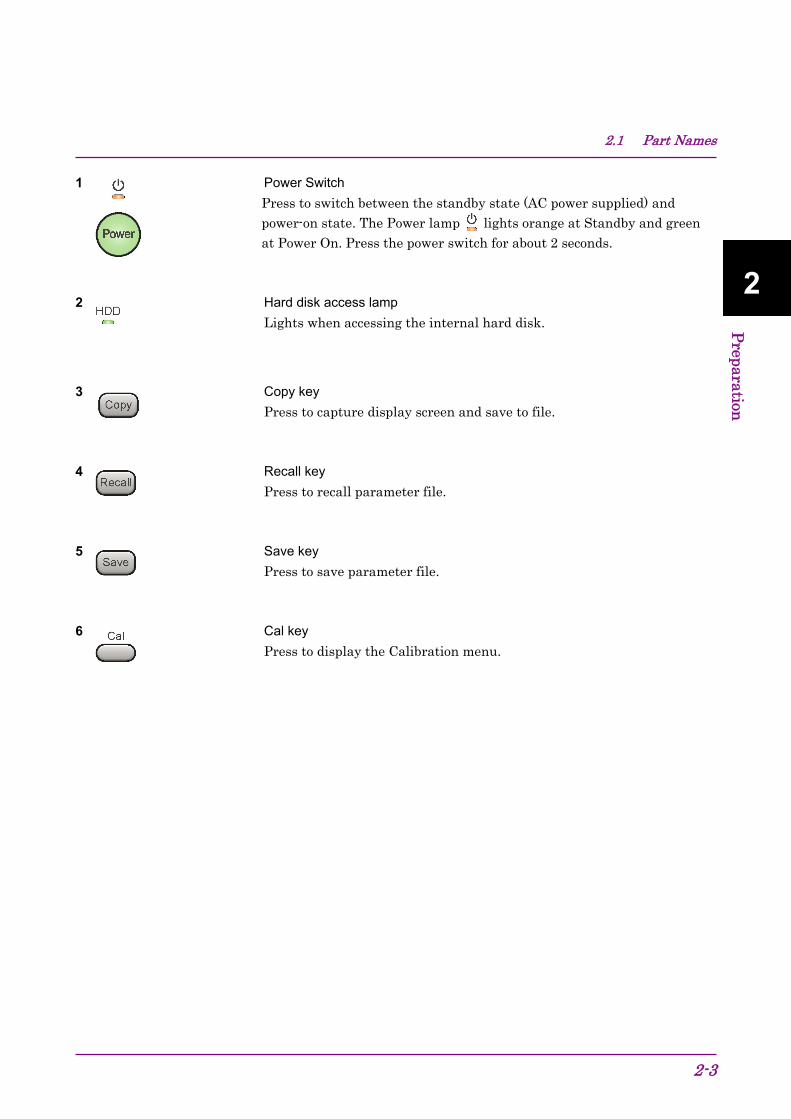
1 Power Switch
Press to switch between the standby state (AC power supplied) and power-on state. The Power lamp lights orange at Standby and green at Power On. Press the power switch for about 2 seconds.
2 Hard disk access lamp
Lights when accessing the internal hard disk.
3 Copy key
Press to capture display screen and save to file.
4 Recall key
Press to recall parameter file.
5 Save key
Press to save parameter file.
6 Cal key
Press to display the Calibration menu.
Chapter 2 Preparation
2-4
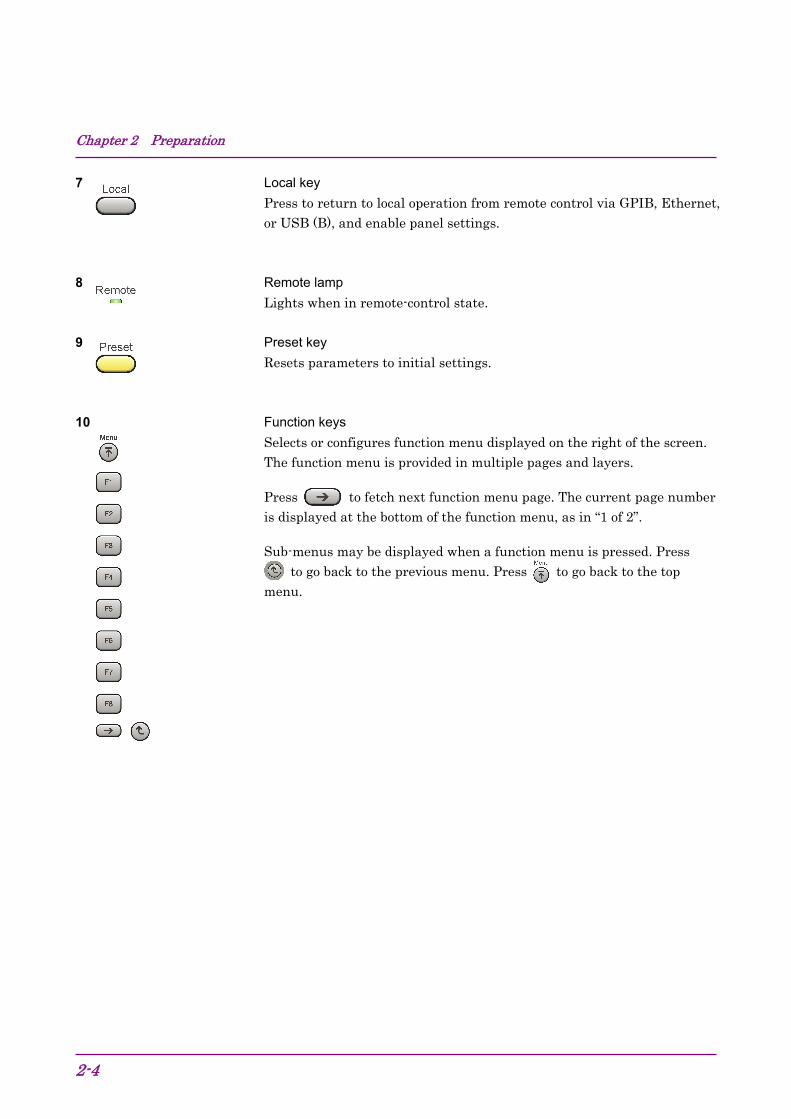
7 Local key
Press to return to local operation from remote control via GPIB, Ethernet, or USB (B), and enable panel settings.
8 Remote lamp
Lights when in remote-control state.
9 Preset key
Resets parameters to initial settings.
10 Function keys
Selects or configures function menu displayed on the right of the screen. The function menu is provided in multiple pages and layers.
Press to fetch next function menu page. The current page number is displayed at the bottom of the function menu, as in “1 of 2”.
Sub-menus may be displayed when a function menu is pressed. Press to go back to the previous menu. Press to go back to the top
menu.
2.1 Part Names
2-5
2
Preparation
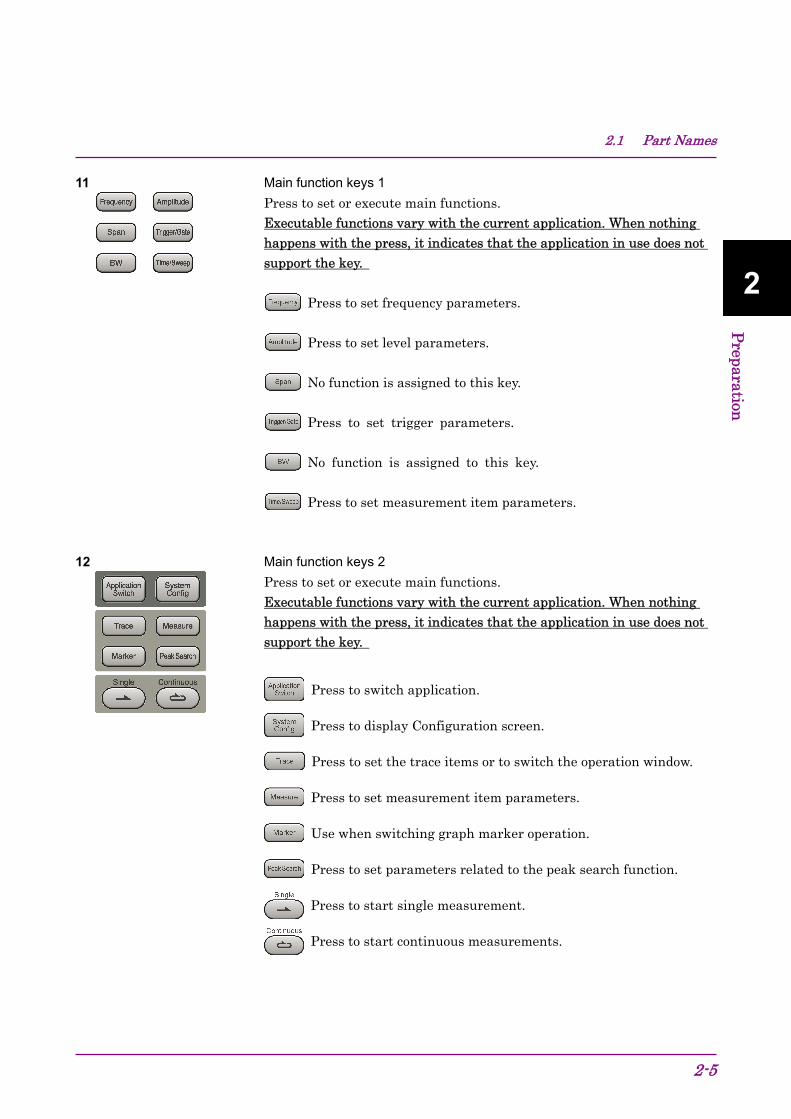
11 Main function keys 1
Press to set or execute main functions. Executable functions vary with the current application. When nothing happens with the press, it indicates that the application in use does not support the key.
Press to set frequency parameters.
Press to set level parameters.
No function is assigned to this key.
Press to set trigger parameters.
No function is assigned to this key.
Press to set measurement item parameters.
12 Main function keys 2
Press to set or execute main functions. Executable functions vary with the current application. When nothing happens with the press, it indicates that the application in use does not support the key.
Press to switch application.
Press to display Configuration screen.
Press to set the trace items or to switch the operation window.
Press to set measurement item parameters.
Use when switching graph marker operation.
Press to set parameters related to the peak search function.
Press to start single measurement.
Press to start continuous measurements.
Chapter 2 Preparation
2-6
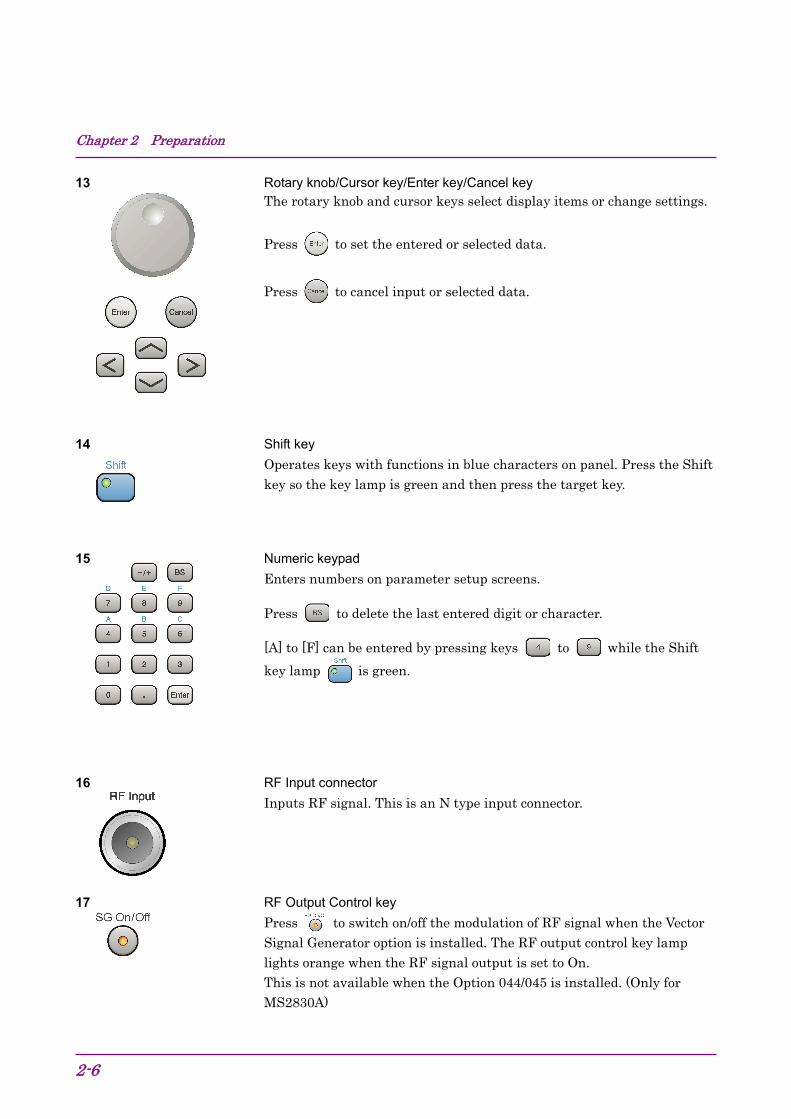
13 Rotary knob/Cursor key/Enter key/Cancel key The rotary knob and cursor keys select display items or change settings.
Press to set the entered or selected data.
Press to cancel input or selected data.
14 Shift key
Operates keys with functions in blue characters on panel. Press the Shift key so the key lamp is green and then press the target key.
15 Numeric keypad
Enters numbers on parameter setup screens.
Press to delete the last entered digit or character.
[A] to [F] can be entered by pressing keys to while the Shift
key lamp is green.
16 RF Input connector
Inputs RF signal. This is an N type input connector.
17 RF Output Control key
Press to switch on/off the modulation of RF signal when the Vector Signal Generator option is installed. The RF output control key lamp lights orange when the RF signal output is set to On.
This is not available when the Option 044/045 is installed. (Only for MS2830A)
2.1 Part Names
2-7
2
Preparation
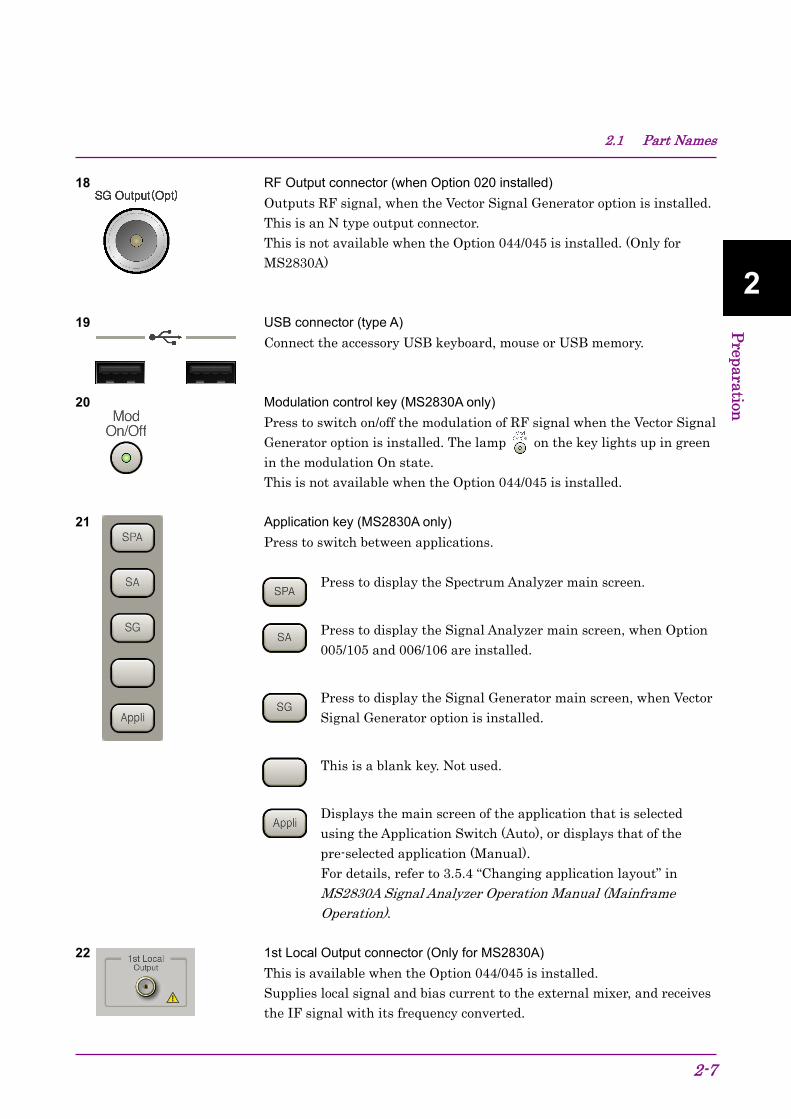
18 RF Output connector (when Option 020 installed)
Outputs RF signal, when the Vector Signal Generator option is installed. This is an N type output connector. This is not available when the Option 044/045 is installed. (Only for MS2830A)
19 USB connector (type A)
Connect the accessory USB keyboard, mouse or USB memory.
20 Modulation control key (MS2830A only)
Press to switch on/off the modulation of RF signal when the Vector Signal Generator option is installed. The lamp on the key lights up in green in the modulation On state. This is not available when the Option 044/045 is installed.
21 Application key (MS2830A only)
Press to switch between applications.
Press to display the Spectrum Analyzer main screen.
Press to display the Signal Analyzer main screen, when Option 005/105 and 006/106 are installed.
Press to display the Signal Generator main screen, when Vector Signal Generator option is installed.
This is a blank key. Not used.
Displays the main screen of the application that is selected using the Application Switch (Auto), or displays that of the pre-selected application (Manual).
For details, refer to 3.5.4 “Changing application layout” in MS2830A Signal Analyzer Operation Manual (Mainframe Operation).
22 1st Local Output connector (Only for MS2830A)
This is available when the Option 044/045 is installed. Supplies local signal and bias current to the external mixer, and receives the IF signal with its frequency converted.

Chapter 2 Preparation
2-8
2.1.2 Rear panel This section describes the rear-panel connectors.
1 2 6 3 4 5 7 8 9 10 11
12
Figure 2.1.2-1 MS269x series rear panel
12
1198106714413 2 1 16 1517
Figure 2.1.2-2 MS2830A rear panel
2.1 Part Names
2-9
2
Preparation
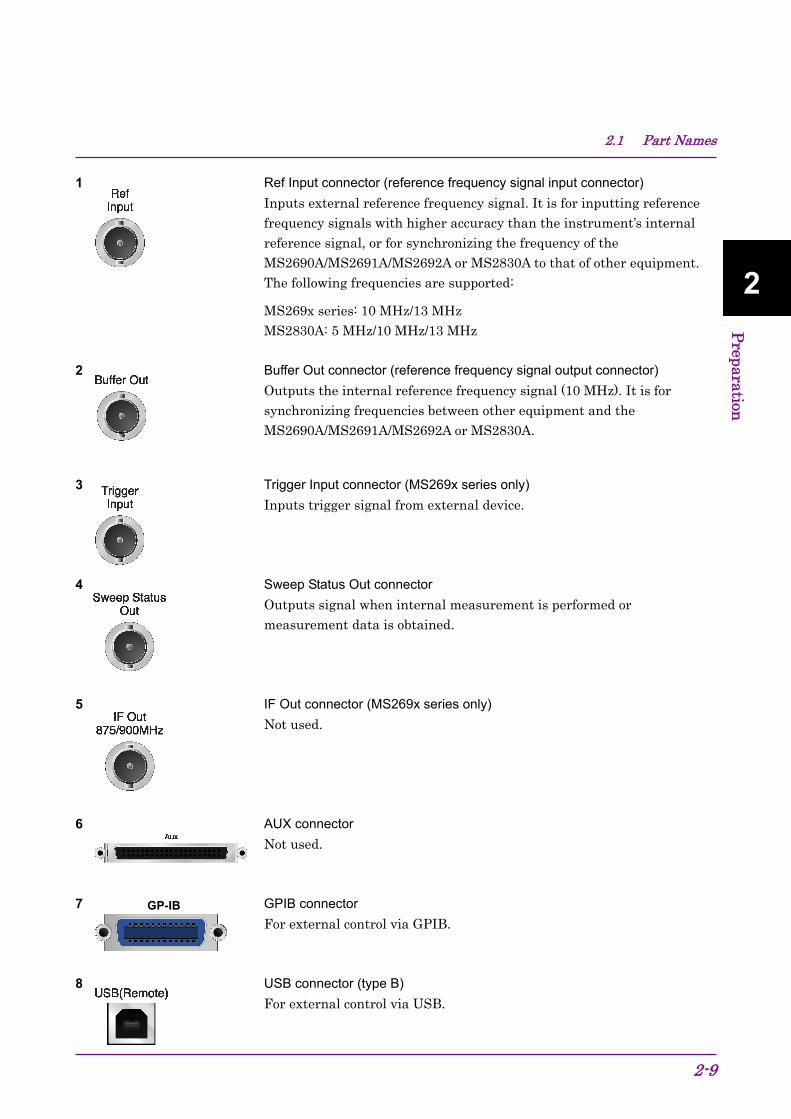
1 Ref Input connector (reference frequency signal input connector)
Inputs external reference frequency signal. It is for inputting reference frequency signals with higher accuracy than the instrument’s internal reference signal, or for synchronizing the frequency of the MS2690A/MS2691A/MS2692A or MS2830A to that of other equipment. The following frequencies are supported:
MS269x series: 10 MHz/13 MHz MS2830A: 5 MHz/10 MHz/13 MHz
2 Buffer Out connector (reference frequency signal output connector)
Outputs the internal reference frequency signal (10 MHz). It is for synchronizing frequencies between other equipment and the MS2690A/MS2691A/MS2692A or MS2830A.
3 Trigger Input connector (MS269x series only)
Inputs trigger signal from external device.
4 Sweep Status Out connector
Outputs signal when internal measurement is performed or measurement data is obtained.
5 IF Out connector (MS269x series only)
Not used.
6 AUX connector
Not used.
7 GPIB connector
For external control via GPIB.
8 USB connector (type B)
For external control via USB.
GP-IB
Chapter 2 Preparation
2-10
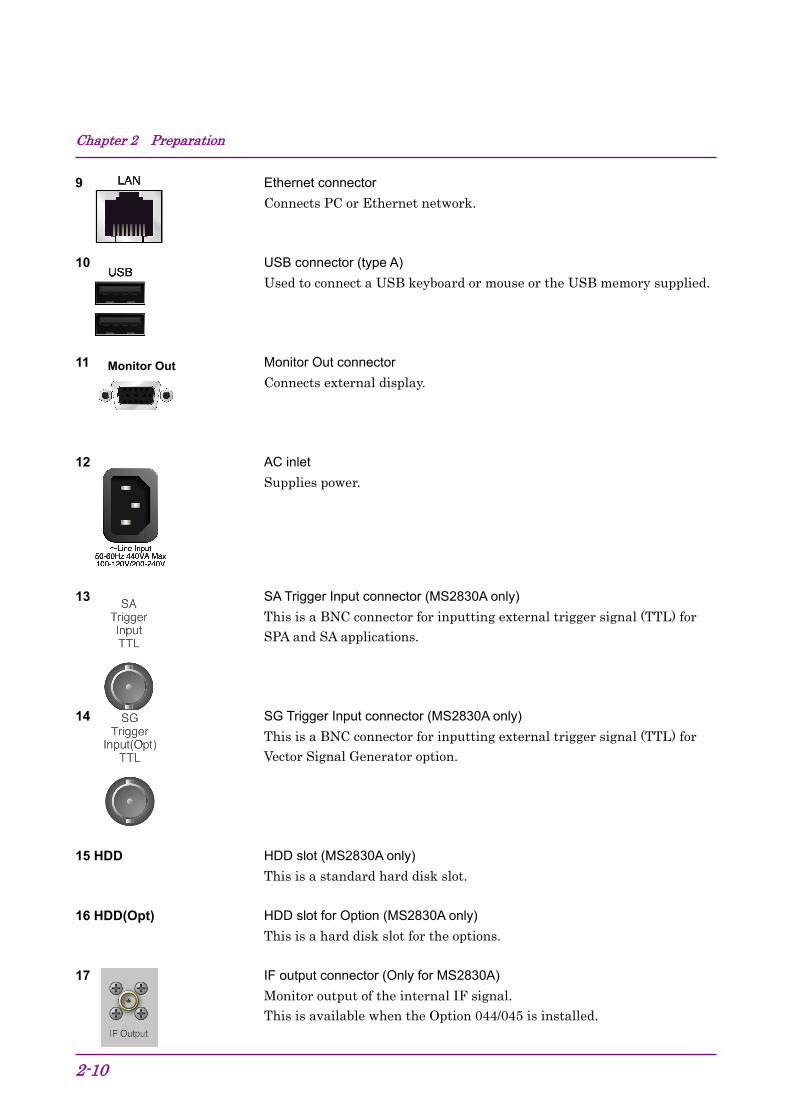
9 Ethernet connector
Connects PC or Ethernet network.
10 USB connector (type A)
Used to connect a USB keyboard or mouse or the USB memory supplied.
11 Monitor Out connector
Connects external display.
12 AC inlet
Supplies power.
13 SA Trigger Input connector (MS2830A only)
This is a BNC connector for inputting external trigger signal (TTL) for SPA and SA applications.
14 SG Trigger Input connector (MS2830A only)
This is a BNC connector for inputting external trigger signal (TTL) for Vector Signal Generator option.
15 HDD HDD slot (MS2830A only)
This is a standard hard disk slot.
16 HDD(Opt) HDD slot for Option (MS2830A only)
This is a hard disk slot for the options.
17 IF output connector (Only for MS2830A)
Monitor output of the internal IF signal. This is available when the Option 044/045 is installed.
Monitor Out
2.2 Signal Path Setup
2-11
2
Preparation
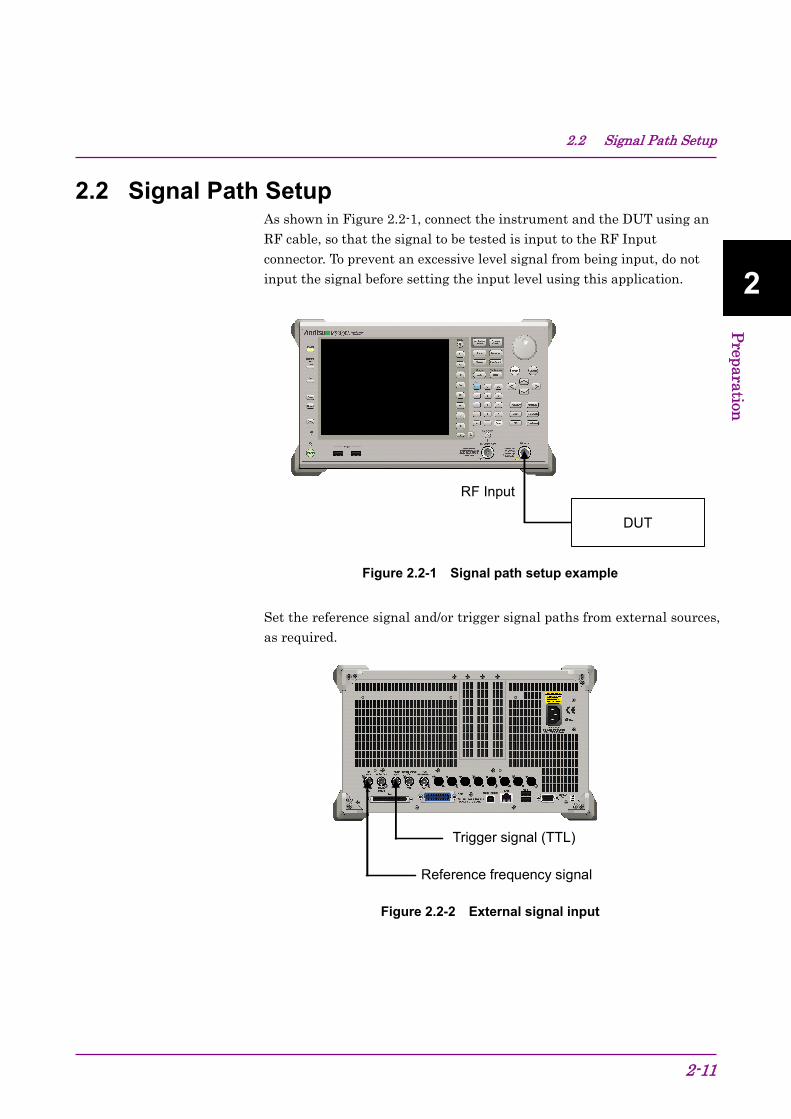
2.2 Signal Path Setup As shown in Figure 2.2-1, connect the instrument and the DUT using an RF cable, so that the signal to be tested is input to the RF Input connector. To prevent an excessive level signal from being input, do not input the signal before setting the input level using this application.
RF Input
DUT
Figure 2.2-1 Signal path setup example
Set the reference signal and/or trigger signal paths from external sources, as required.
Trigger signal (TTL)
Reference frequency signal
Figure 2.2-2 External signal input
Chapter 2 Preparation
2-12
2.3 Application Startup and Selection To use this application, it is necessary to load (start up) and select the application.
2.3.1 Launching application The application startup procedure is described below.
Note:
The XXX indicates the application name currently in use.
<Procedure>
1. Press to display the Configuration screen.
2. Press (Application Switch Settings) to display the Application Switch Registration screen.
3. Press (Load Application Select), and move the cursor to “XXX” in the Unloaded Applications list. If “XXX” is displayed in the Loaded Applications list, this means that the application is already loaded. If “XXX” appears in neither the Loaded Applications nor Unloaded Applications list, this means that the application has not been installed.
4. Press (Set) to load the application. If “XXX” is displayed in the Loaded Applications list, this means that the application is already loaded.
2.3.2 Selecting application The selection procedure is described below.
<Procedure>
1. Press to display the Application Switch menu.
2. Press the menu function key displaying “XXX”.
The application can also be selected with mouse, by clicking “XXX” on the task bar.
2.4 Initialization and Calibration
2-13
2
Preparation
2.4 Initialization and Calibration This section describes the parameter settings and the preparations required before starting measurement.
2.4.1 Initialization After selecting this application, first perform initialization. Initialization returns the settable parameters to their default value in order to clear the measurement status and measurement results.
Note:
When another software application is switched to or this application is unloaded (ended), the application keeps the parameter settings at that time. The parameter values that were last set will be applied when this application is selected next time.
The initialization procedure is as follows.
<Procedure>
1. Press to display the Preset function menu.
2. Press (Preset).
2.4.2 Calibration Perform calibration before performing measurement. Calibration sets the level accuracy frequency characteristics for the input level to flat, and adjusts level accuracy deviation caused by internal temperature fluctuations. Calibration should be performed when first performing measurement after turning on power, or if beginning measurement when there is a difference in ambient temperature from the last time calibration was performed.
<Procedure>
1. Press to display the Application Cal function menu.
2. Press (SIGANA All).
For details on calibration functionality only executable with this instrument, refer to the MS2690A/MS2691A/MS2692A Signal Analyzer Operation Manual (Mainframe Operation) or MS2830A Signal Analyzer Operation Manual (Mainframe Operation).

Chapter 2 Preparation
2-14.

Chapter 3 Measurement
3-1
3
Measu
remen
t
This chapter describes the measurement function, the parameter contents and the setting methods for this application.
3.1 Basic Operation ............................................................ 3-2 3.1.1 Screen layout .................................................... 3-2 3.1.2 Main function menu .......................................... 3-3 3.1.3 Performing measurement ................................. 3-4
3.2 Setting Frequency ......................................................... 3-5 3.3 Setting Level ................................................................. 3-7 3.4 Capturing IQ Data and Parameter of WLAN
IQproducer .................................................................... 3-9 3.4.1 Setting capture time ........................................ 3-10 3.4.2 Averaging IQ data ........................................... 3-10 3.4.3 Reading WLAN IQproducer Parameter File ... 3-11
3.5 Setting Common Items ............................................... 3-12 3.6 Setting Measurement Items ........................................ 3-17
3.6.1 Modulation Analysis ........................................ 3-18 3.6.2 Power vs Time measurement ......................... 3-40 3.6.3 Adjacent Channel Leakage Power
measurement (ACP) ....................................... 3-45 3.6.4 Occupied Bandwidth measurement (OBW) ... 3-45 3.6.5 Spectrum Emission Mask (SEM) .................... 3-46 3.6.6 Spurious Emission measurement ................... 3-47
3.7 Setting Marker ............................................................. 3-48 3.7.1 Setting markers for Modulation Analysis ........ 3-48 3.7.2 Setting markers for Power vs Time
measurement .................................................. 3-52 3.8 Setting Trigger ............................................................ 3-54 3.9 EVM ............................................................................ 3-56 3.10 Constellation Display .................................................. 3-59 3.11 EVM vs Subcarrier Display ......................................... 3-61 3.12 EVM vs Symbol Display .............................................. 3-62 3.13 EVM vs Chip Display .................................................. 3-63 3.14 Phase Error vs Chip Display ....................................... 3-64 3.15 Spectral Flatness Display ........................................... 3-65 3.16 Eye Diagram Display .................................................. 3-68 3.17 Summary Display ........................................................ 3-69 3.18 Power vs Time Setting ................................................ 3-73 3.19 Saving Measurement Results ..................................... 3-75
Chapter 3 Measurement
3-2
3.1 Basic Operation 3.1.1 Screen layout
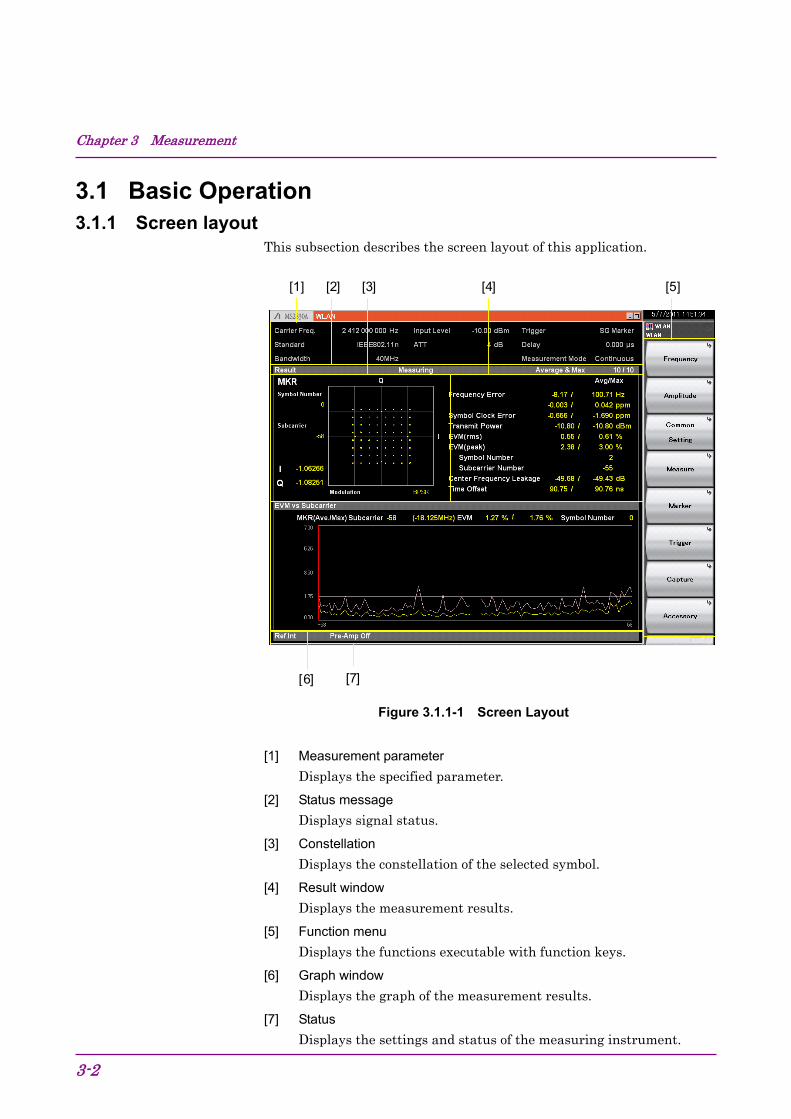
This subsection describes the screen layout of this application.
[1]
[6]
[2] [3] [4] [5]
[7]
Figure 3.1.1-1 Screen Layout
[1] Measurement parameter Displays the specified parameter.
[2] Status message Displays signal status.
[3] Constellation
Displays the constellation of the selected symbol.
[4] Result window
Displays the measurement results.
[5] Function menu
Displays the functions executable with function keys.
[6] Graph window
Displays the graph of the measurement results.
[7] Status
Displays the settings and status of the measuring instrument.
3.1 Basic Operation
3-3
3
Measu
remen
t
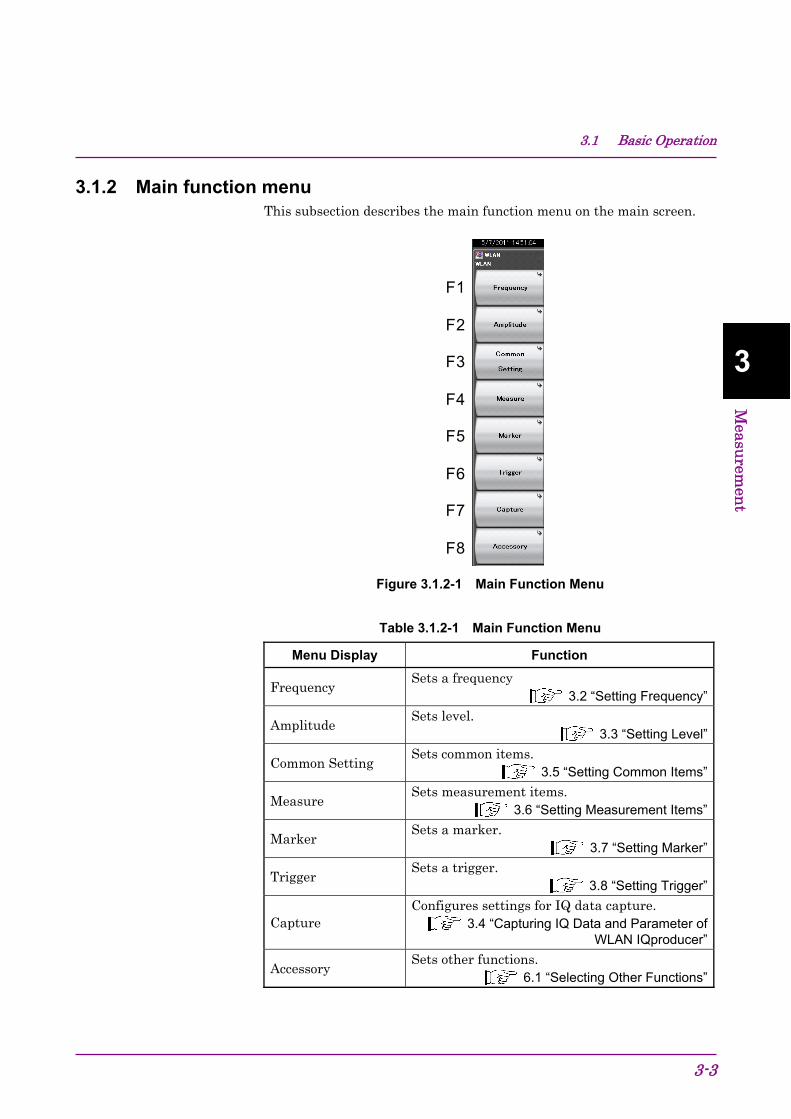
3.1.2 Main function menu This subsection describes the main function menu on the main screen.
F1
F2
F3
F4
F5
F6
F7
F8
Figure 3.1.2-1 Main Function Menu
Table 3.1.2-1 Main Function Menu
Menu Display Function
Frequency Sets a frequency
3.2 “Setting Frequency”
Amplitude Sets level.
3.3 “Setting Level”
Common Setting Sets common items.
3.5 “Setting Common Items”
Measure Sets measurement items.
3.6 “Setting Measurement Items”
Marker Sets a marker.
3.7 “Setting Marker”
Trigger Sets a trigger.
3.8 “Setting Trigger”
Capture Configures settings for IQ data capture.
3.4 “Capturing IQ Data and Parameter of WLAN IQproducer”
Accessory Sets other functions.
6.1 “Selecting Other Functions”
Chapter 3 Measurement
3-4
3.1.3 Performing measurement There are two measurement modes: single and continuous. Measurement is performed once in the single measurement mode, and continuously in the continuous measurement mode.
Single Measurement Items are measured only for the measurement count (Storage Count) before measurement is stopped. The input signal is captured once for each measurement.
<Procedure>
1. Press .
Continuous Measurement The selected measurement items are continuously measured for the measurement count (Storage Count). The input signal is captured once for each measurement. Measurement will continue even if parameters are changed or the window display is changed. Measurement will be stopped if another application is selected or if the Replay function is executed.
<Procedure> 1. Press .
Note:
The two measurement modes are not available when the Replay function is executed. For the Replay function, analysis starts when the IQ data file is specified.
4.2 “Replay Function”

3.2 Setting Frequency
3-5
3
Measu
remen
t
3.2 Setting Frequency This section describes how to configure the settings related to frequency. Pressing (Frequency) on the main function menu displays the Frequency function menu. Pressing displays the Frequency function menu and opens the Carrier Frequency dialog box.
Note:
You cannot set a frequency when the Replay function is executed.
Carrier Frequency
■Summary
Sets a carrier frequency.
■Setting range:
100 MHz to the upper limit of the main unit
Channel Map
■Summary
Displays the Channel Map selection window. ■Options
None Directly sets a frequency.
2.4GHz band Sets a channel map of 2.4 GHz band.
5GHz Band Sets a channel map of 5 GHz band. Note:
5GHz Band cannot be set when MS2830A-040 is installed.
Channel Number
■Summary
Sets the carrier frequency by channel number. Displayed when 2.4 GHz Band or 5 GHz Band is selected in the Channel Map.
■Setting range
When Channel Map is 2.4GHz Band: 1 to 14 When Channel Map is 5GHz Band: 0 to 200
Chapter 3 Measurement
3-6
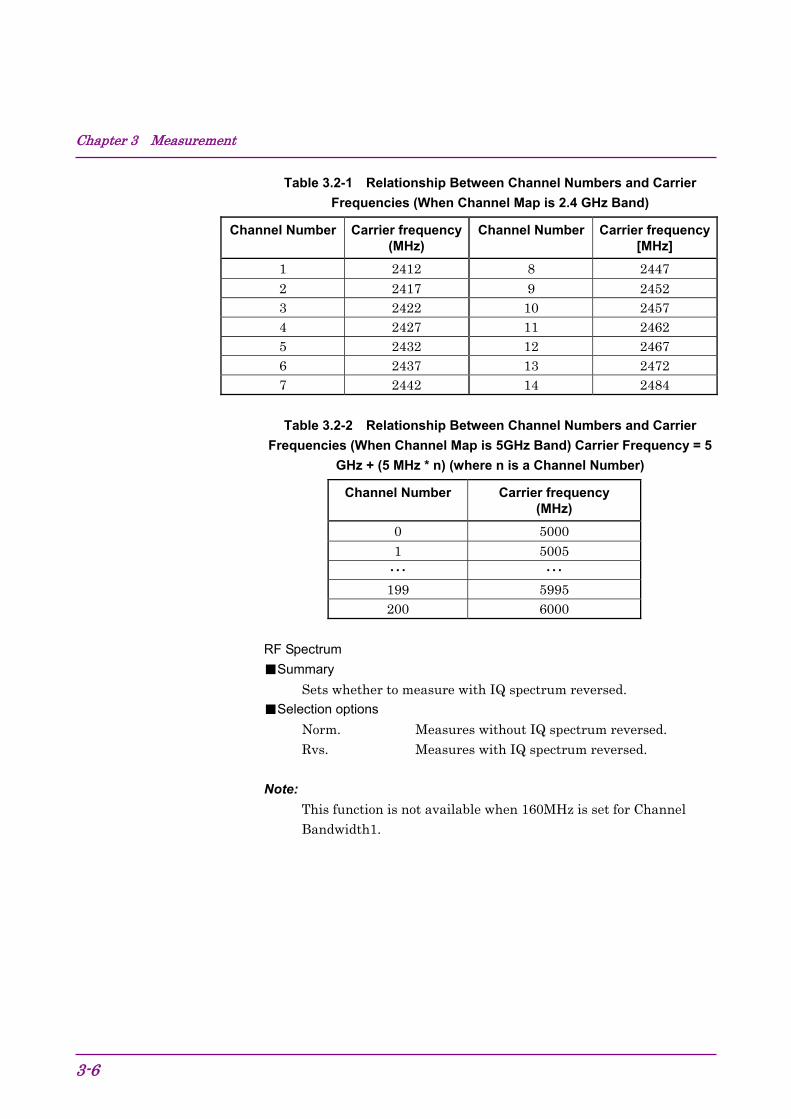
Table 3.2-1 Relationship Between Channel Numbers and Carrier
Frequencies (When Channel Map is 2.4 GHz Band)
Channel Number Carrier frequency (MHz)
Channel Number Carrier frequency [MHz]
1 2412 8 2447 2 2417 9 2452 3 2422 10 2457 4 2427 11 2462 5 2432 12 2467 6 2437 13 2472 7 2442 14 2484
Table 3.2-2 Relationship Between Channel Numbers and Carrier
Frequencies (When Channel Map is 5GHz Band) Carrier Frequency = 5
GHz + (5 MHz * n) (where n is a Channel Number)
Channel Number Carrier frequency (MHz)
0 5000 1 5005
・・・ ・・・ 199 5995 200 6000
RF Spectrum
■Summary
Sets whether to measure with IQ spectrum reversed. ■Selection options
Norm. Measures without IQ spectrum reversed. Rvs. Measures with IQ spectrum reversed.
Note:
This function is not available when 160MHz is set for Channel Bandwidth1.
3.3 Setting Level
3-7
3
Measu
remen
t
3.3 Setting Level This section describes how to configure the settings related to level. Pressing (Amplitude) on the main function menu displays the Amplitude function menu. Pressing displays the Amplitude function menu and opens the Input Level dialog box.
Note:
You cannot set a level when the Replay function is executed.
Input Level
■Summary
Sets the input level from the target DUT.
■Setting range
When Pre-Amp is On: (–80.00 + Offset Value) to (10. 00 + Offset Value) dBm When Pre Amp is Off: (–60.00 + Offset Value) to (30. 00 + Offset Value) dBm
Lowest ATT Setting
■Summary
Changes the lower limit of the attenuator that is automatically set according to the Input Signal setting.
■Setting range
4dB: Sets the lower limit of the attenuator to 4 dB. 0dB: Sets the lower limit of the attenuator to 0 dB.
Auto Range
■Summary
Sets an optimal Input Level automatically according to the input signal.
Pre-Amp
■Summary
Sets the Pre-Amp Mode On/Off.
■Selection options
On Enables Pre-Amp. Off Disables Pre-Amp.
Chapter 3 Measurement
3-8
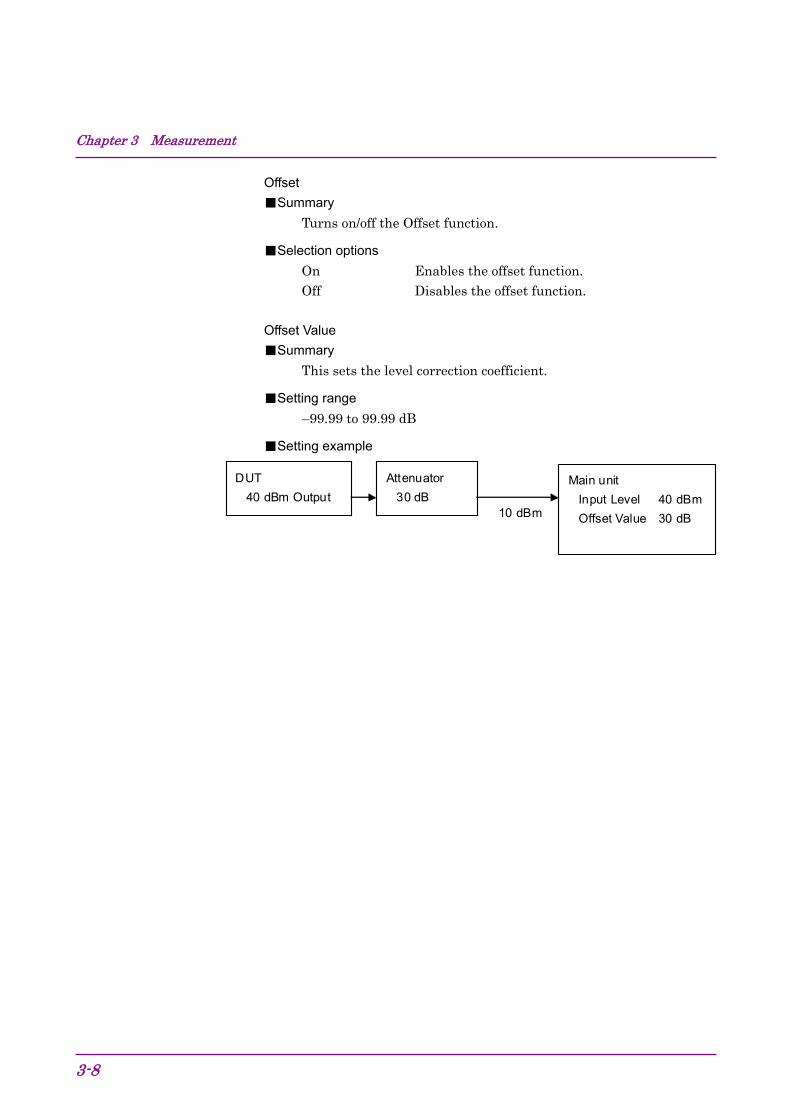
Offset
■Summary
Turns on/off the Offset function.
■Selection options
On Enables the offset function. Off Disables the offset function.
Offset Value
■Summary
This sets the level correction coefficient.
■Setting range
–99.99 to 99.99 dB
■Setting example
DUT
40 dBm Output
Attenuator
30 dB Main unit
Input Level 40 dBm
Offset Value 30 dB 10 dBm
3.4 Capturing IQ Data and Parameter of WLAN IQproducer
3-9
3
Measu
remen
t
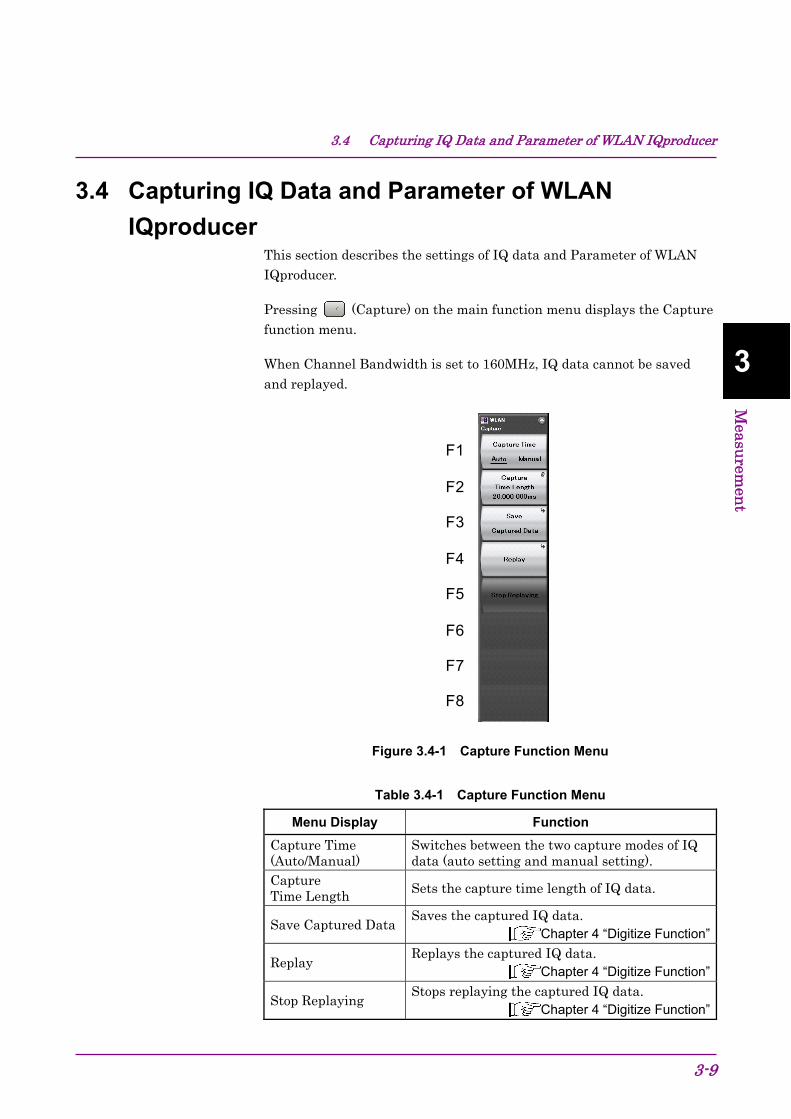
3.4 Capturing IQ Data and Parameter of WLAN
IQproducer This section describes the settings of IQ data and Parameter of WLAN IQproducer.
Pressing (Capture) on the main function menu displays the Capture function menu.
When Channel Bandwidth is set to 160MHz, IQ data cannot be saved and replayed.
F1
F2
F3
F4
F5
F6
F7
F8
Figure 3.4-1 Capture Function Menu
Table 3.4-1 Capture Function Menu
Menu Display Function
Capture Time (Auto/Manual)
Switches between the two capture modes of IQ data (auto setting and manual setting).
Capture Time Length Sets the capture time length of IQ data.
Save Captured DataSaves the captured IQ data.
Chapter 4 “Digitize Function”
Replay Replays the captured IQ data.
Chapter 4 “Digitize Function”
Stop Replaying Stops replaying the captured IQ data.
Chapter 4 “Digitize Function”
Chapter 3 Measurement
3-10
3.4.1 Setting capture time This subsection describes how to set the capture mode from Capture Time and the Capture Time Length from Capture Time Length.
Auto
The data necessary to measure one burst for each one measurement is always captured. The Auto mode is set by default for this application.
Manual
In this mode, the capture length of each measurement can be specified manually.
If Capture Time Length is specified, the Manual mode is automatically used.
When using the Replay function, this application cannot call the Spectrum Analyzer's Adjacent Channel Leakage Power (ACP), Occupied Bandwidth (OBW), or Spurious Emission measurements.
3.4.2 Averaging IQ data The averaging method differs according to the capture time mode.
Capture of the signal starts at the trigger timing according to the Capture Time settings. After the measurement is completed, capture of another signal starts at the next trigger timing. The average and maximum values are calculated from the measurement results at each storage count. The data captured in multiple measurements are not necessarily consecutive.
The storage count and the capture count are the same in single measurement. In continuous measurement, the average and maximum values are calculated from the last data of the storage count after measurement has been performed the number of times corresponding to the storage count.
3.4 Capturing IQ Data and Parameter of WLAN IQproducer
3-11
3
Measu
remen
t
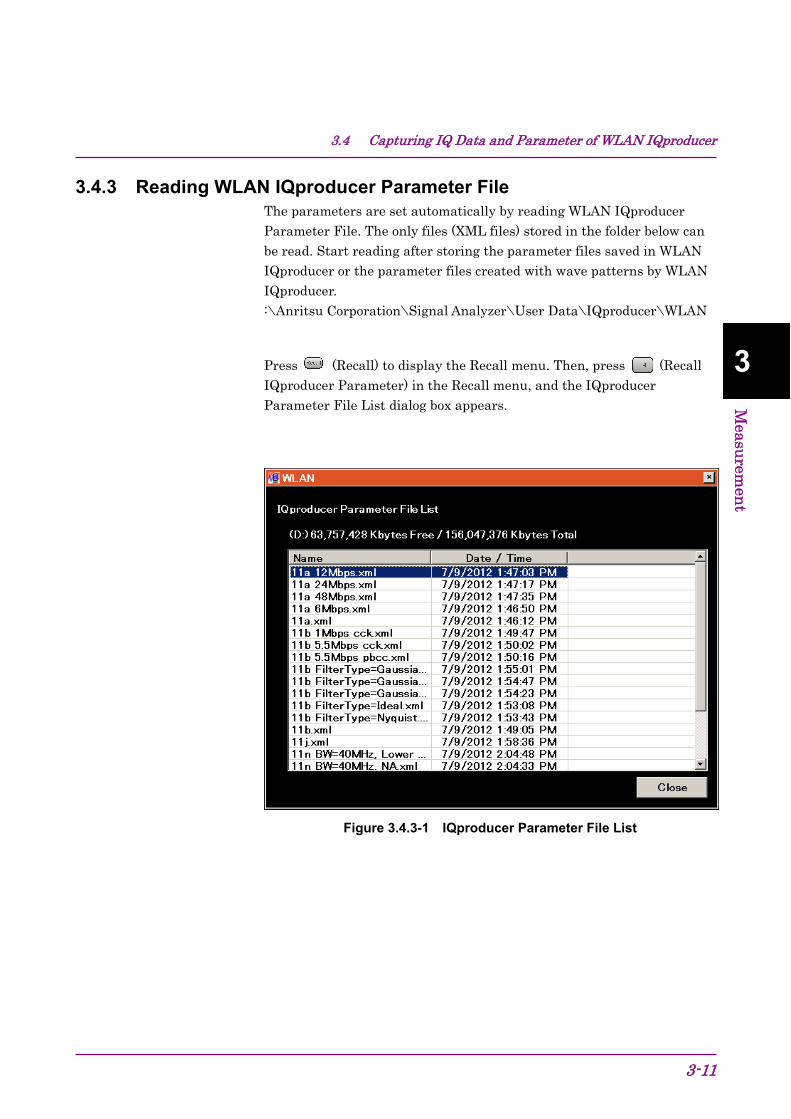
3.4.3 Reading WLAN IQproducer Parameter File The parameters are set automatically by reading WLAN IQproducer Parameter File. The only files (XML files) stored in the folder below can be read. Start reading after storing the parameter files saved in WLAN IQproducer or the parameter files created with wave patterns by WLAN IQproducer. :\Anritsu Corporation\Signal Analyzer\User Data\IQproducer\WLAN
Press (Recall) to display the Recall menu. Then, press (Recall IQproducer Parameter) in the Recall menu, and the IQproducer Parameter File List dialog box appears.
Figure 3.4.3-1 IQproducer Parameter File List

Chapter 3 Measurement
3-12
3.5 Setting Common Items This section describes the settings for the common items. Pressing (Common Setting) on the main function menu displays the Common Setting function menu.
WLAN Standard
■Summary
Selects the WLAN Standard to be measured.
■Selection options
The input signals are analyzed as the following signals: IEEE802.11a IEEE802.11b IEEE802.11g (ERP-DSSS/CCK) IEEE802.11g (ERP-OFDM) IEEE802.11g (DSSS-OFDM) IEEE802.11n IEEE802.11j IEEE802.11p IEEE802.11ac (MX269028A-x01 or MX269028A-x02 is installed)
Measuring Object
■Summary
Selects whether the measurement target signal is burst or continuous signal.
■Selection options
Burst Analyzes the input signal as a burst signal. Cont. Analyzes an input signal as a continuous signal.
Note:
When the WLAN Standard is IEEE802.11ac, this is fixed to Burst and cannot be changed.

3.5 Setting Common Items
3-13
3
Measu
remen
t
Channel Bandwidth
■Summary
Sets Channel Bandwidth of the measurement target signal.
■Selection options
WLAN Standard: 802.11j, 802.11p 5MHZ Analyzes signal as a 5-MHz band. 10MHZ Analyzes signal as a 10-MHz band. 20MHZ Analyzes signal as a 20-MHz band. WLAN Standard: 802.11n 20MHZ Analyzes signal as a 20-MHz band. 40MHZ Analyzes signal as a 40-MHz band. 40MHz (Upper)
Analyzes the measurement target signal as 40 MHz Upper 20 MHz. The center frequency matches the center of 40 MHz.
40MHz (Lower) Analyzes the measurement target signal as 40 MHz Lower 20 MHz. The center frequency matches the center of 40 MHz.
Chapter 3 Measurement
3-14
WLAN Standard: 802.11ac ・ With MS269xA-078/178 installed 20MHz Analyzes signal as a 20-MHz band. 40MHz Analyzes signal as a 40-MHz band. 80MHz Analyzes signal as an 80-MHz band. 160MHz Analyzes signal as a 160-MHz band (MS269xA only ・ Others 20MHz Analyzes signal as a 20-MHz band. 40MHz Analyzes signal as a 40-MHz band.
Note:
This is not available when the selected WLAN Standard is: 802. 11a, 802. 11b, 802. 11g (ERP-OFDM), 802. 11g (DSSS-OFDM), or 802. 11g (ERP-DSSS/CCK).
Automatically set to 10 MHz when WLAN Standard is changed to 802. 11j or 802. 11p.
Automatically set to 20 MHz when WLAN Standard is changed to 802. 11n.
Automatically set to 20 MHz when Measuring Object is changed to Continuous.
40MHz (Upper) and 40MHz (Lower) is not selectable when Measuring Object is set to Continuous.
MS269xA-004/104 are not usable for MX269028A-001/-002.
3.5 Setting Common Items
3-15
3
Measu
remen
t
PPDU Format
■Summary
Sets the PPDU format of the measurement target signal.
■Selection options
WLAN Standard: 802.11n
Non‐HT Analyzes the format of the signal as Non‐HT.
HT‐Mixed Analyzes the format of the signal as HT-Mixed. HT‐Greenfield Analyzes the format of the signal as HT‐
Greenfield. WLAN Standard: 802.11ac
VHT Analyzes the format of the signal as VHT.
Note:
This is not available when the selected WLAN Standard is set other than 802. 11n. The format is fixed to VHT for 802.11ac.
This is not available when Measuring Object is Continuous; it is fixed to HT‐Mixed.
You cannot set to Non‐HT when Channel Bandwidth is 40 MHz (Upper) or 40 MHz (Lower).
When Non‐HT is selected, if the Channel Bandwidth is changed to 40 MHz (Upper) or 40 MHz (Lower), the setting is automatically changed to HT-Mixed.
Detail Setting
■Summary
Sets the more detailed modulation analysis parameters. For details, refer to 3.6.1 “Modulation Analysis”.
Chapter 3 Measurement
3-16
Burst Interval
■Summary
Sets the burst interval of the measurement target signal. The burst interval is the time interval between one burst rising and the next one.
■Setting range
0.3 ms to 1000 ms, or ≤Capture Time Length/2, whichever smaller.
◆ IEEE802.11ac is selected as WLAN Standard ・ Channel Bandwidth is set to 20MHz, 40MHz 0.3 ms to 1000 ms or ≤ Capture Time Length/2, whichever smaller. ・ When Channel Bandwidth is set to 80MHz, 160MHz 0.3 ms to 250 ms or ≤ Capture Time Length/2, whichever smaller.
Note:
This command is not available when Measuring Object is Continuous.
Burst Threshold
■Summary
Sets the threshold to detect the burst of the measurement target signal.
■Setting range
0 dB to 60 dB Note:
This command is not available when Measuring Object is Continuous.
3.6 Setting Measurement Items
3-17
3
Measu
remen
t
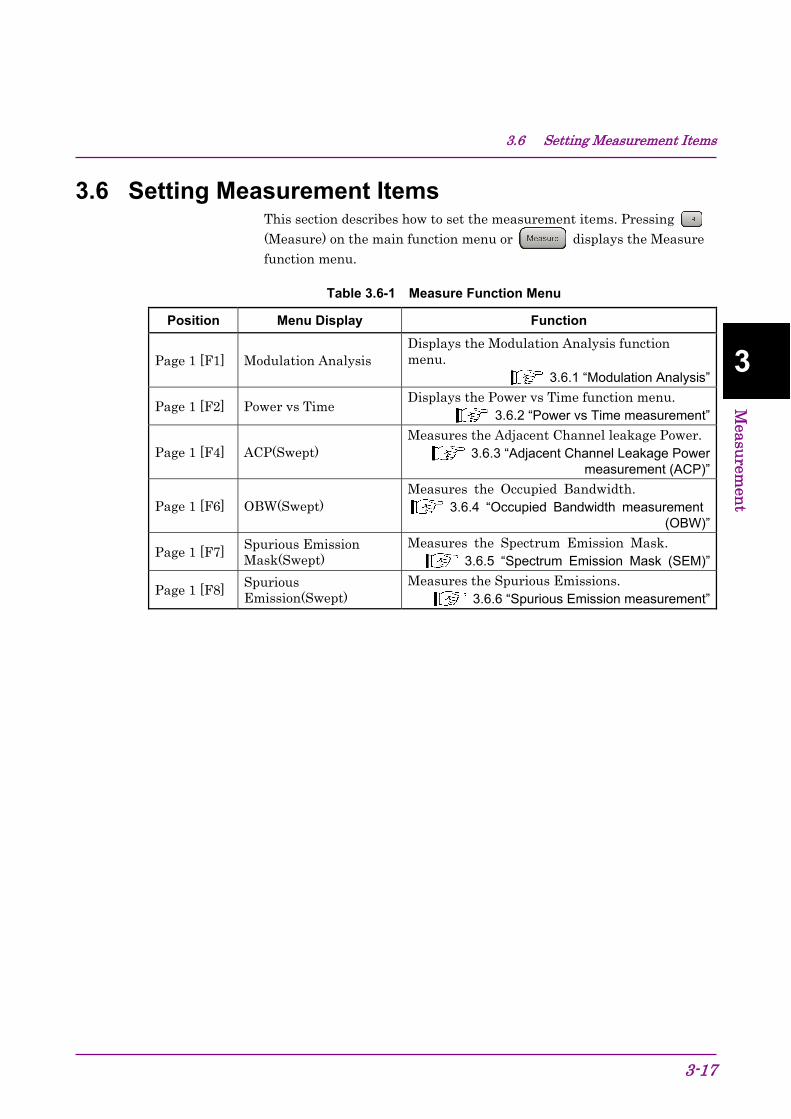
3.6 Setting Measurement Items This section describes how to set the measurement items. Pressing (Measure) on the main function menu or displays the Measure function menu.
Table 3.6-1 Measure Function Menu
Position Menu Display Function
Page 1 [F1] Modulation Analysis Displays the Modulation Analysis function menu.
3.6.1 “Modulation Analysis”
Page 1 [F2] Power vs Time Displays the Power vs Time function menu.
3.6.2 “Power vs Time measurement”
Page 1 [F4] ACP(Swept) Measures the Adjacent Channel leakage Power.
3.6.3 “Adjacent Channel Leakage Power measurement (ACP)”
Page 1 [F6] OBW(Swept) Measures the Occupied Bandwidth.
3.6.4 “Occupied Bandwidth measurement (OBW)”
Page 1 [F7] Spurious Emission Mask(Swept)
Measures the Spectrum Emission Mask. 3.6.5 “Spectrum Emission Mask (SEM)”
Page 1 [F8] Spurious Emission(Swept)
Measures the Spurious Emissions. 3.6.6 “Spurious Emission measurement”
Chapter 3 Measurement
3-18
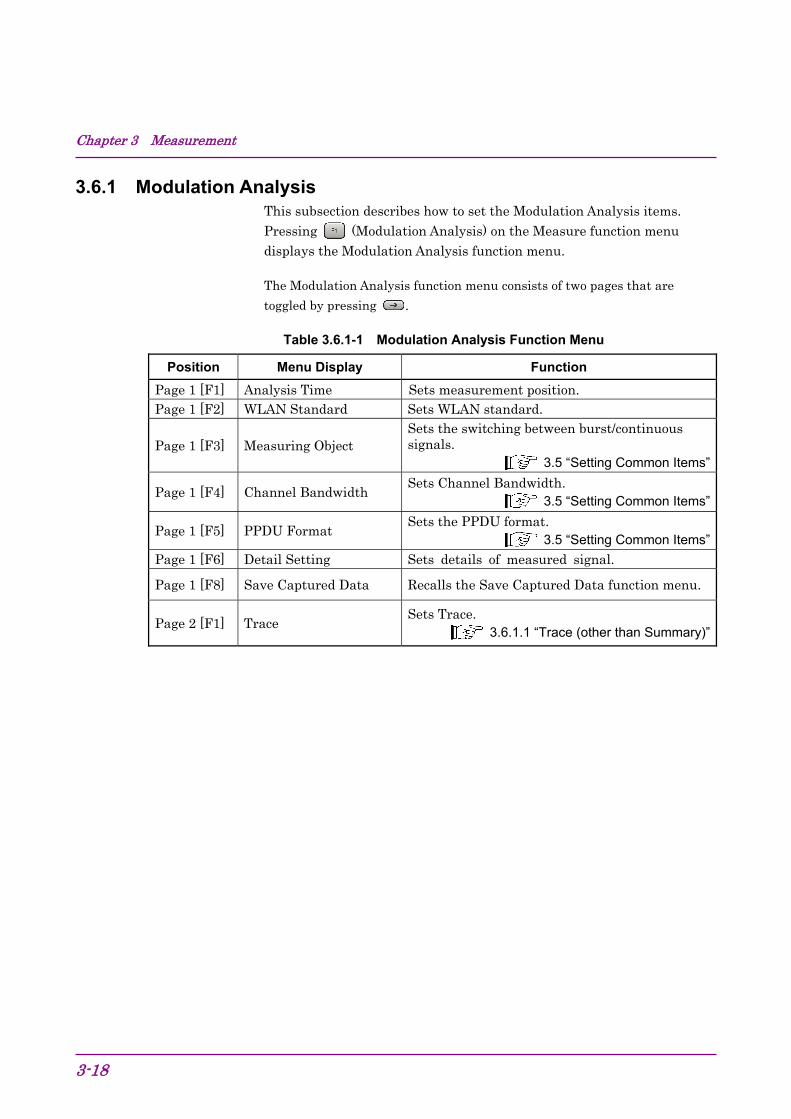
3.6.1 Modulation Analysis This subsection describes how to set the Modulation Analysis items. Pressing (Modulation Analysis) on the Measure function menu displays the Modulation Analysis function menu.
The Modulation Analysis function menu consists of two pages that are
toggled by pressing .
Table 3.6.1-1 Modulation Analysis Function Menu
Position Menu Display Function
Page 1 [F1] Analysis Time Sets measurement position. Page 1 [F2] WLAN Standard Sets WLAN standard.
Page 1 [F3] Measuring Object Sets the switching between burst/continuous signals.
3.5 “Setting Common Items”
Page 1 [F4] Channel Bandwidth Sets Channel Bandwidth.
3.5 “Setting Common Items”
Page 1 [F5] PPDU Format Sets the PPDU format.
3.5 “Setting Common Items”
Page 1 [F6] Detail Setting Sets details of measured signal.
Page 1 [F8] Save Captured Data Recalls the Save Captured Data function menu.
Page 2 [F1] Trace Sets Trace.
3.6.1.1 “Trace (other than Summary)”
3.6 Setting Measurement Items
3-19
3
Measu
remen
t
Analysis Length Setup
■Summary
Sets whether the symbol length to be measured is set manually or automatically. The automatic setting decodes the SIGNAL field to get the burst length, and then analyzes the burst to the end.
■Selection options
Manual Sets the target signal's symbol (chip) length automatically.
Auto Sets the target signal's symbol (chip) length manually.
Note:
This command is not available when Measuring Object is Continuous.
When 802.11b or 802.11g is selected (ERP-DSSS/CCK), this is not available when Target Field is set to Preamble. However, it is available when WLAN Standard is 802.11ac.
Chapter 3 Measurement
3-20
Analysis Length
■Summary
Sets the Modulation Analysis length.
■Setting range
When WLAN Standard is 802.11a, 802.11g (ERP-OFDM), 802.11g
(DSSS-OFDM), 802.11j, or 802.11p:
2 to (1367 – Analysis Offset) or (the maximum number of symbols in the Burst Interval* – Analysis Offset), whichever smaller.
When WLAN Standard is 802.11b or 802.11g (ERP-DSSS/CCK), and Target
Field is PSDU:
11 to (220000 – Analysis Offset) or (the maximum number of chips in the Burst Interval* – Analysis Offset), whichever smaller.
When WLAN Standard is 802.11n or 802.11ac:
2 to (5000 – Analysis Offset) or (the maximum number of symbols in the Burst Interval* – Analysis Offset), whichever smaller.
3.6 Setting Measurement Items
3-21
3
Measu
remen
t
Note:
This is not available when Analysis Length Setup is Auto.
*: The maximum number of symbols (chips) in the Burst Interval is:
((Burst Interval × 10e3) – Tpreamble) / Ldataunit
where the unit for the Burst Interval is ms. The values of Tpreamble and Ldataunit are: When using 802.11a, 802.11g (ERP-OFDM), 802.11j (Channel Bandwidth = 20 MHz), or 802.11p (Channel Bandwidth = 20 MHz): Tpreamble =20 s, Ldataunit =4 s When using 802.11j (Channel Bandwidth = 10 MHz) or 802.11p (Channel Bandwidth = 10 MHz): Tpreamble =40 s, Ldataunit =8 s When using 802.11j (Channel Bandwidth = 5 MHz) or 802.11p (Channel Bandwidth = 5 MHz): Tpreamble =80 s, Ldataunit =16 s When using 802.11b or 802.11g (ERP-DSSS/CCK): Tpreamble =192 s, Ldataunit =0.0909 s When using 802.11g (DSSS-OFDM): Tpreamble =204 s, Ldataunit =4 s When using 802.11n and other than Non-HT: Tpreamble =48 s, Ldataunit =4 s When using 802.11n and Non-HT:
Tpreamble =20 s, Ldataunit =4 s
When using 802.11ac:
Tpreamble =68 s, Ldataunit =4 s
Chapter 3 Measurement
3-22
Analysis Offset
■Summary
Sets the measurement start position of Modulation Analysis.
If WLAN Standard is 802.11a, 802.11g (ERP-OFDM), 802.11n, or 802.11ac, the analysis start position is based on the start of the PSDU.
If WLAN Standard is 802.11b or 802.11g (ERP-DSSS/CCK), and
Target Field is Preamble, the analysis start position is based on the start of the PLCP preamble.
If WLAN Standard is 802.11b or 802.11g (EPR-DSSS/CCK), and
Target Field is PSDU, the analysis start position is based on the start of the PSDU.
■Setting range
When WLAN Standard is 802.11a, 802.11g (ERP-OFDM), 802.11g
(DSSS-OFDM), 802.11j, or 802.11p:
0 to (1367 or the maximum number of symbols in the Burst Interval*), whichever smaller – 2
When WLAN Standard is 802.11b or 802.11g (ERP-DSSS/CCK), and Target
Field is PSDU:
0 to (220000 or the maximum number of chips in the Burst Interval*), whichever smaller – 11
When WLAN Standard is 802.11b or 802.11g (ERP-DSSS/CCK), and Target
Field is Preamble:
0 to 1300 or (the maximum number of chips in the Burst Interval* ), whichever smaller – 11
When WLAN Standard is 802.11n or 802.11ac:
0 to (5000 or the maximum number of symbols in the Burst Interval*), whichever smaller – 2
Note:
This command is not available when Measuring Object is Continuous.
* For the maximum number of symbols (chips) in the Burst Interval, see Analysis Length.
3.6 Setting Measurement Items
3-23
3
Measu
remen
t
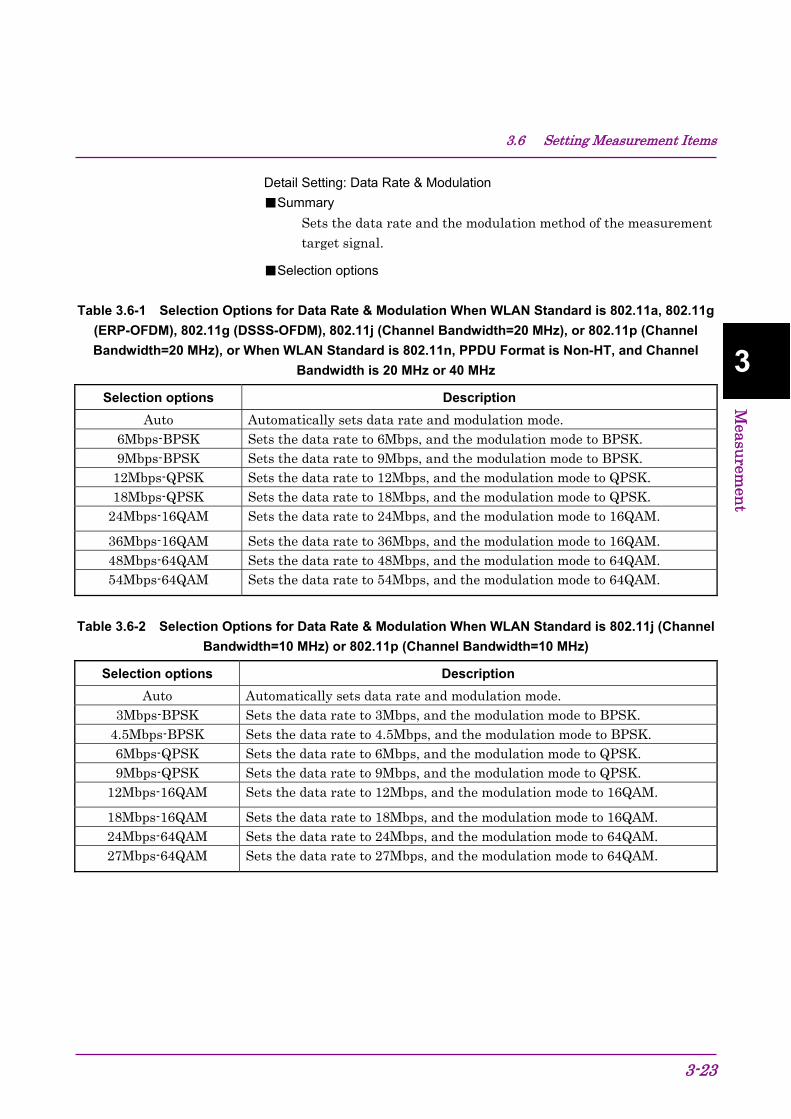
Detail Setting: Data Rate & Modulation
■Summary
Sets the data rate and the modulation method of the measurement target signal.
■Selection options
Table 3.6-1 Selection Options for Data Rate & Modulation When WLAN Standard is 802.11a, 802.11g
(ERP-OFDM), 802.11g (DSSS-OFDM), 802.11j (Channel Bandwidth=20 MHz), or 802.11p (Channel
Bandwidth=20 MHz), or When WLAN Standard is 802.11n, PPDU Format is Non-HT, and Channel
Bandwidth is 20 MHz or 40 MHz
Selection options Description
Auto Automatically sets data rate and modulation mode. 6Mbps-BPSK Sets the data rate to 6Mbps, and the modulation mode to BPSK. 9Mbps-BPSK Sets the data rate to 9Mbps, and the modulation mode to BPSK.
12Mbps-QPSK Sets the data rate to 12Mbps, and the modulation mode to QPSK. 18Mbps-QPSK Sets the data rate to 18Mbps, and the modulation mode to QPSK.
24Mbps-16QAM Sets the data rate to 24Mbps, and the modulation mode to 16QAM.
36Mbps-16QAM Sets the data rate to 36Mbps, and the modulation mode to 16QAM. 48Mbps-64QAM Sets the data rate to 48Mbps, and the modulation mode to 64QAM. 54Mbps-64QAM Sets the data rate to 54Mbps, and the modulation mode to 64QAM.
Table 3.6-2 Selection Options for Data Rate & Modulation When WLAN Standard is 802.11j (Channel
Bandwidth=10 MHz) or 802.11p (Channel Bandwidth=10 MHz)
Selection options Description
Auto Automatically sets data rate and modulation mode. 3Mbps-BPSK Sets the data rate to 3Mbps, and the modulation mode to BPSK.
4.5Mbps-BPSK Sets the data rate to 4.5Mbps, and the modulation mode to BPSK. 6Mbps-QPSK Sets the data rate to 6Mbps, and the modulation mode to QPSK. 9Mbps-QPSK Sets the data rate to 9Mbps, and the modulation mode to QPSK.
12Mbps-16QAM Sets the data rate to 12Mbps, and the modulation mode to 16QAM.
18Mbps-16QAM Sets the data rate to 18Mbps, and the modulation mode to 16QAM. 24Mbps-64QAM Sets the data rate to 24Mbps, and the modulation mode to 64QAM. 27Mbps-64QAM Sets the data rate to 27Mbps, and the modulation mode to 64QAM.
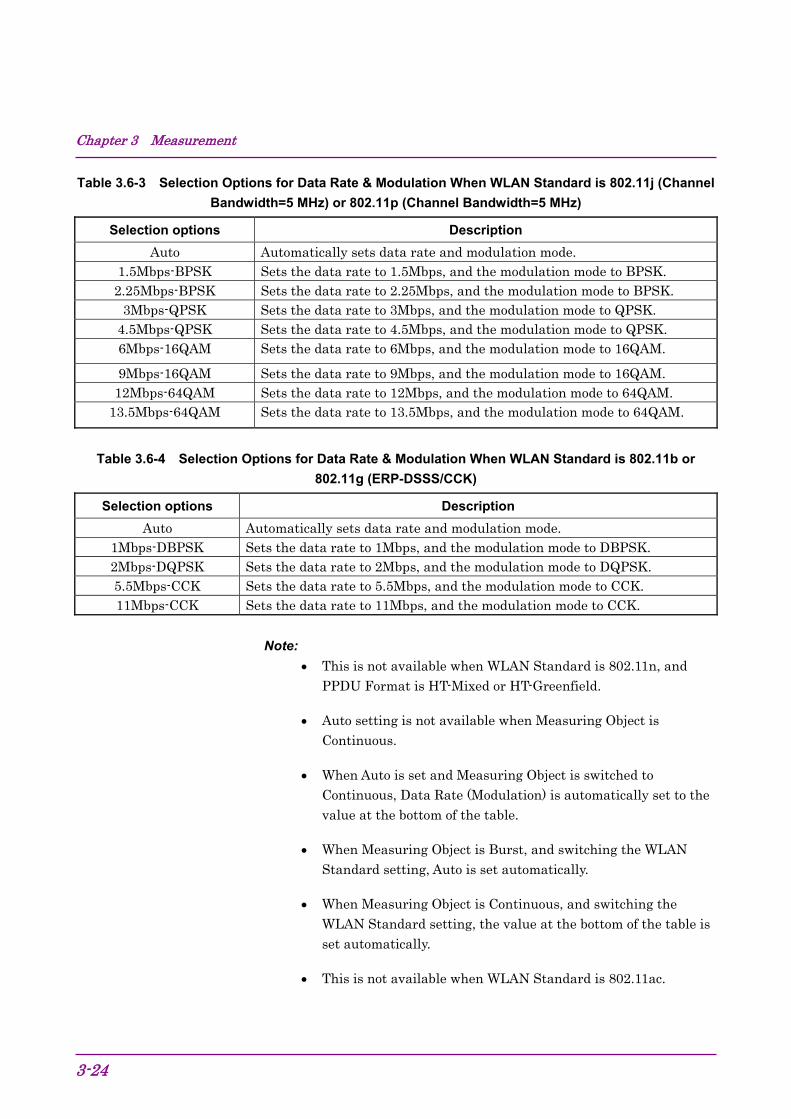
Chapter 3 Measurement
3-24
Table 3.6-3 Selection Options for Data Rate & Modulation When WLAN Standard is 802.11j (Channel
Bandwidth=5 MHz) or 802.11p (Channel Bandwidth=5 MHz)
Selection options Description
Auto Automatically sets data rate and modulation mode. 1.5Mbps-BPSK Sets the data rate to 1.5Mbps, and the modulation mode to BPSK.
2.25Mbps-BPSK Sets the data rate to 2.25Mbps, and the modulation mode to BPSK. 3Mbps-QPSK Sets the data rate to 3Mbps, and the modulation mode to QPSK.
4.5Mbps-QPSK Sets the data rate to 4.5Mbps, and the modulation mode to QPSK. 6Mbps-16QAM Sets the data rate to 6Mbps, and the modulation mode to 16QAM.
9Mbps-16QAM Sets the data rate to 9Mbps, and the modulation mode to 16QAM. 12Mbps-64QAM Sets the data rate to 12Mbps, and the modulation mode to 64QAM.
13.5Mbps-64QAM Sets the data rate to 13.5Mbps, and the modulation mode to 64QAM.
Table 3.6-4 Selection Options for Data Rate & Modulation When WLAN Standard is 802.11b or
802.11g (ERP-DSSS/CCK)
Selection options Description
Auto Automatically sets data rate and modulation mode. 1Mbps-DBPSK Sets the data rate to 1Mbps, and the modulation mode to DBPSK. 2Mbps-DQPSK Sets the data rate to 2Mbps, and the modulation mode to DQPSK. 5.5Mbps-CCK Sets the data rate to 5.5Mbps, and the modulation mode to CCK. 11Mbps-CCK Sets the data rate to 11Mbps, and the modulation mode to CCK.
Note:
This is not available when WLAN Standard is 802.11n, and PPDU Format is HT-Mixed or HT-Greenfield.
Auto setting is not available when Measuring Object is Continuous.
When Auto is set and Measuring Object is switched to Continuous, Data Rate (Modulation) is automatically set to the value at the bottom of the table.
When Measuring Object is Burst, and switching the WLAN Standard setting, Auto is set automatically.
When Measuring Object is Continuous, and switching the WLAN Standard setting, the value at the bottom of the table is set automatically.
This is not available when WLAN Standard is 802.11ac.
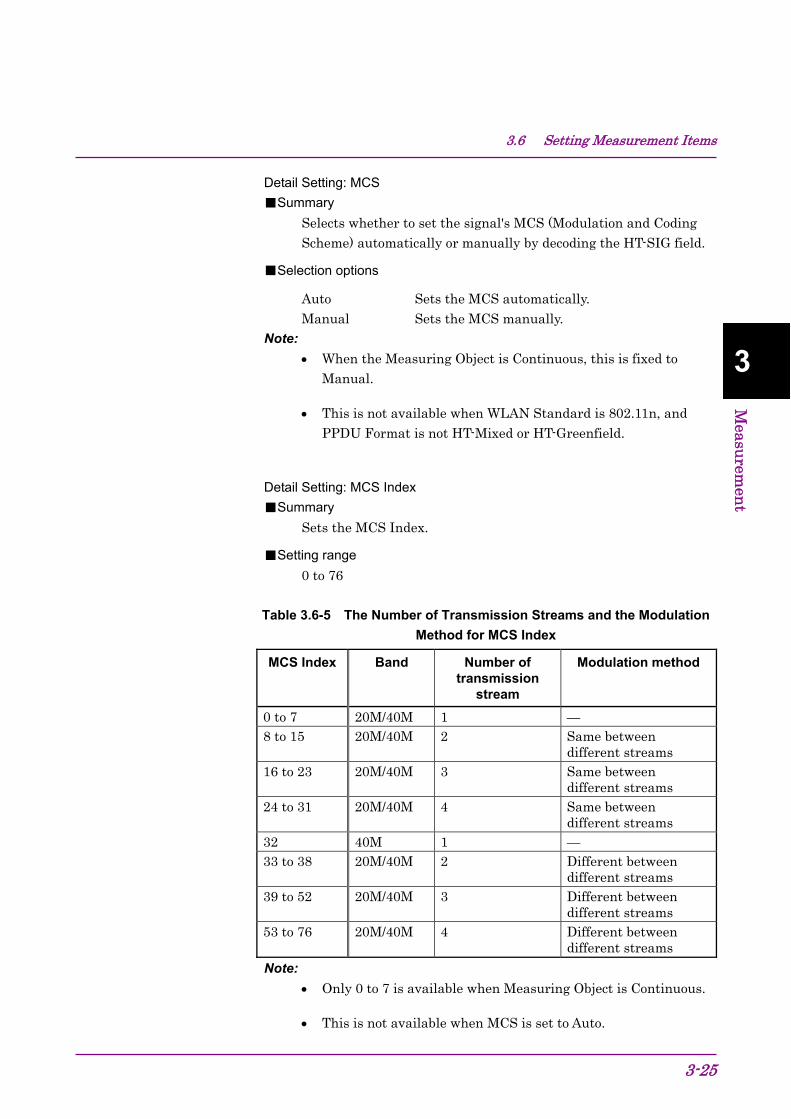
3.6 Setting Measurement Items
3-25
3
Measu
remen
t
Detail Setting: MCS
■Summary
Selects whether to set the signal's MCS (Modulation and Coding Scheme) automatically or manually by decoding the HT-SIG field.
■Selection options
Auto Sets the MCS automatically. Manual Sets the MCS manually.
Note:
When the Measuring Object is Continuous, this is fixed to Manual.
This is not available when WLAN Standard is 802.11n, and PPDU Format is not HT-Mixed or HT-Greenfield.
Detail Setting: MCS Index
■Summary
Sets the MCS Index.
■Setting range
0 to 76
Table 3.6-5 The Number of Transmission Streams and the Modulation
Method for MCS Index
MCS Index Band Number of transmission
stream
Modulation method
0 to 7 20M/40M 1 — 8 to 15 20M/40M 2 Same between
different streams 16 to 23 20M/40M 3 Same between
different streams 24 to 31 20M/40M 4 Same between
different streams 32 40M 1 — 33 to 38 20M/40M 2 Different between
different streams 39 to 52 20M/40M 3 Different between
different streams 53 to 76 20M/40M 4 Different between
different streams
Note:
Only 0 to 7 is available when Measuring Object is Continuous.
This is not available when MCS is set to Auto.
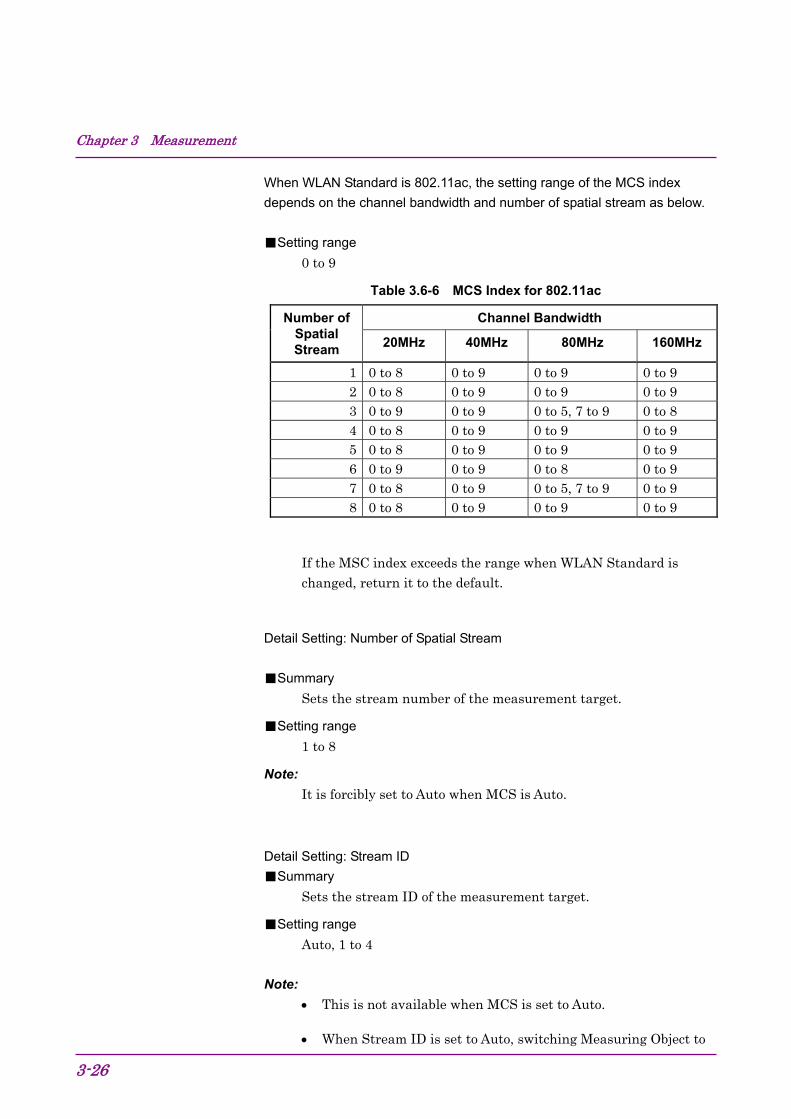
Chapter 3 Measurement
3-26
When WLAN Standard is 802.11ac, the setting range of the MCS index
depends on the channel bandwidth and number of spatial stream as below.
■Setting range
0 to 9
Table 3.6-6 MCS Index for 802.11ac
Number of Spatial Stream
Channel Bandwidth
20MHz 40MHz 80MHz 160MHz
1 0 to 8 0 to 9 0 to 9 0 to 9 2 0 to 8 0 to 9 0 to 9 0 to 9 3 0 to 9 0 to 9 0 to 5, 7 to 9 0 to 8 4 0 to 8 0 to 9 0 to 9 0 to 9 5 0 to 8 0 to 9 0 to 9 0 to 9 6 0 to 9 0 to 9 0 to 8 0 to 9 7 0 to 8 0 to 9 0 to 5, 7 to 9 0 to 9 8 0 to 8 0 to 9 0 to 9 0 to 9
If the MSC index exceeds the range when WLAN Standard is changed, return it to the default.
Detail Setting: Number of Spatial Stream
■Summary
Sets the stream number of the measurement target.
■Setting range
1 to 8
Note:
It is forcibly set to Auto when MCS is Auto.
Detail Setting: Stream ID
■Summary
Sets the stream ID of the measurement target.
■Setting range
Auto, 1 to 4
Note:
This is not available when MCS is set to Auto.
When Stream ID is set to Auto, switching Measuring Object to

3.6 Setting Measurement Items
3-27
3
Measu
remen
t
Continuous automatically sets the Stream ID to 1.
Table 3.6-7 Setting Range According to MCS Index Settings
MCS Index Setting range
0 to 7 Auto / 1 8 to 15 Auto / 1 / 2 16 to 23 Auto / 1 / 2 / 3 24 to 31 Auto / 1 / 2 / 3 / 4 32 Auto / 1 33 to 38 Auto / 1 / 2 39 to 52 Auto / 1 / 2 / 3 53 to 76 Auto / 1 / 2 / 3 / 4
When IEEE802.11ac is WLAN Standard, the setting range of Stream ID is as
below.
■Setting range
1 to 8
It is forcibly set to Auto when Number of Spatial Stream is set to Auto.
Detail Setting: Preamble Format
■Summary
Sets the preamble format of the measurement target signal.
■Selection options
Auto Analyzes the preamble format automatically. Long Analyzes the preamble format as Long.
Short Analyzes the preamble format as Short. Note:
This is available only when WLAN Standard is 802.11b, 802.11g (ERP-DSSS/CCK), or 802.11g (DSSS-OFDM).
This command is not available when Measuring Object is Continuous.
Chapter 3 Measurement
3-28
Detail Setting: Guard Interval
■Summary
Sets the guard interval of the measurement target signal.
■Selection options
Auto Analyzes the guard interval automatically. Long Analyzes the guard interval as Long.
Short Analyzes the guard interval as Short. Note:
This is only available when WLAN Standard is 802.11n, and PPDU Format is HT-Mixed or HT-Greenfield. However, it is available when WLAN Standard is 802.11ac.
This command is not available when Measuring Object is Continuous.
Detail Setting: EVM Calculation Method
■Summary
Sets the calculation method for EVM when WLAN Standard is 802.11b or 802.11g (ERP-DSSS/CCK).
■Selection options
IEEE Std 802.11-1999 Calculates EVM based on IEEE Std 802.
11-1999. IEEE Std 802. 11-2007 Calculates EVM based on IEEE Std 802.
11-2007. Note:
This is available only when WLAN Standard is 802.11b or 802.11g (ERP-DSSS/CCK).
3.6 Setting Measurement Items
3-29
3
Measu
remen
t
Detail Setting: Target Field
■Summary
Selects whether to measure in Preamble or PSDU when WLAN Standard is 802.11b or 802.11g (ERP-DSSS/CCK).
■Selection options
PSDU Starts the measurement at the beginning of PSDU.
Preamble Starts the measurement at the beginning of Preamble.
Note:
This is available only when WLAN Standard is 802.11b or 802.11g (ERP-DSSS/CCK).
This command is not available when Measuring Object is Continuous.
Detail Setting: Channel Estimation
■Summary
Sets the target of the channel estimation.
■Selection options
Seq only Channel estimation is made for long training sequences.
Seq & Data Channel estimation is made for all packets. Note:
This is not available when WLAN Standard is 802.11b or 802.11g (ERP-DSSS/CCK).
This is not available when Measuring Object is Continuous; in that case, the setting is fixed to Seq & Data.
Chapter 3 Measurement
3-30
Detail Setting: Amplitude Tracking
■Summary
Sets the amplitude tracking On/Off.
■Selection options
Off Disables the amplitude correction.
On Enables the amplitude correction. Note:
This is not available when WLAN Standard is 802.11b or 802.11g (ERP-DSSS/CCK).
Detail Setting: Phase Tracking
■Summary
Sets the phase tracking On/Off.
■Selection options
Off Disables the phase correction.
On Enables the phase correction. Note:
This is not available when WLAN Standard is 802.11b or 802.11g (ERP-DSSS/CCK).
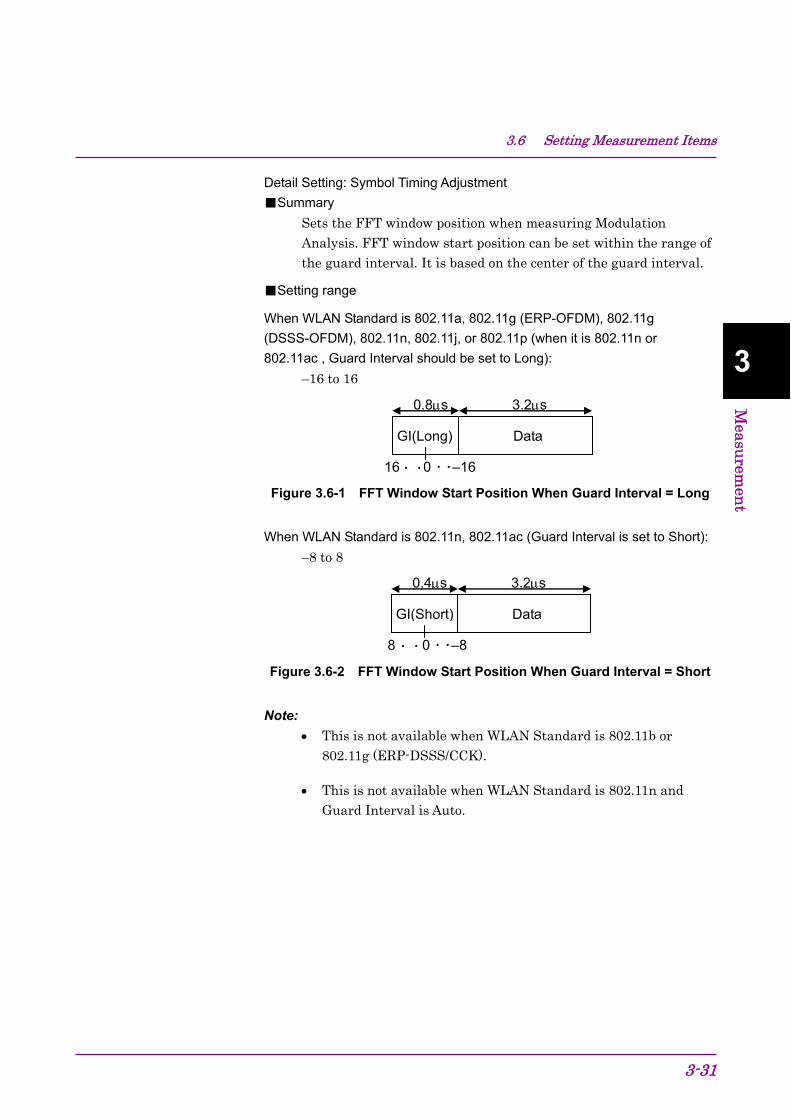
3.6 Setting Measurement Items
3-31
3
Measu
remen
t
Detail Setting: Symbol Timing Adjustment
■Summary
Sets the FFT window position when measuring Modulation Analysis. FFT window start position can be set within the range of the guard interval. It is based on the center of the guard interval.
■Setting range
When WLAN Standard is 802.11a, 802.11g (ERP-OFDM), 802.11g
(DSSS-OFDM), 802.11n, 802.11j, or 802.11p (when it is 802.11n or
802.11ac , Guard Interval should be set to Long):
–16 to 16
・ ・
GI(Long) Data
0 –1616 ・ ・
0.8s 3.2s
Figure 3.6-1 FFT Window Start Position When Guard Interval = Long
When WLAN Standard is 802.11n, 802.11ac (Guard Interval is set to Short):
–8 to 8
・ ・
GI(Short) Data
0 –88 ・ ・
0.4s 3.2s
Figure 3.6-2 FFT Window Start Position When Guard Interval = Short
Note:
This is not available when WLAN Standard is 802.11b or 802.11g (ERP-DSSS/CCK).
This is not available when WLAN Standard is 802.11n and Guard Interval is Auto.
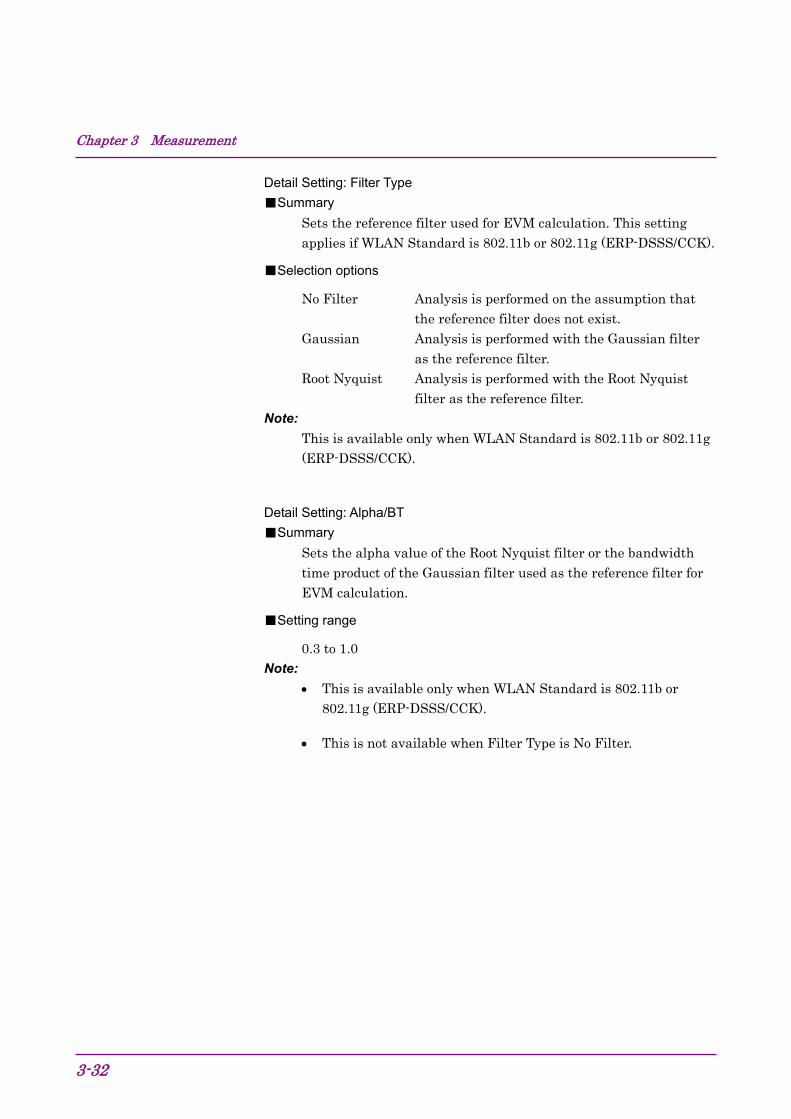
Chapter 3 Measurement
3-32
Detail Setting: Filter Type
■Summary
Sets the reference filter used for EVM calculation. This setting applies if WLAN Standard is 802.11b or 802.11g (ERP-DSSS/CCK).
■Selection options
No Filter Analysis is performed on the assumption that the reference filter does not exist.
Gaussian Analysis is performed with the Gaussian filter as the reference filter.
Root Nyquist Analysis is performed with the Root Nyquist filter as the reference filter.
Note:
This is available only when WLAN Standard is 802.11b or 802.11g (ERP-DSSS/CCK).
Detail Setting: Alpha/BT
■Summary
Sets the alpha value of the Root Nyquist filter or the bandwidth time product of the Gaussian filter used as the reference filter for EVM calculation.
■Setting range
0.3 to 1.0 Note:
This is available only when WLAN Standard is 802.11b or 802.11g (ERP-DSSS/CCK).
This is not available when Filter Type is No Filter.
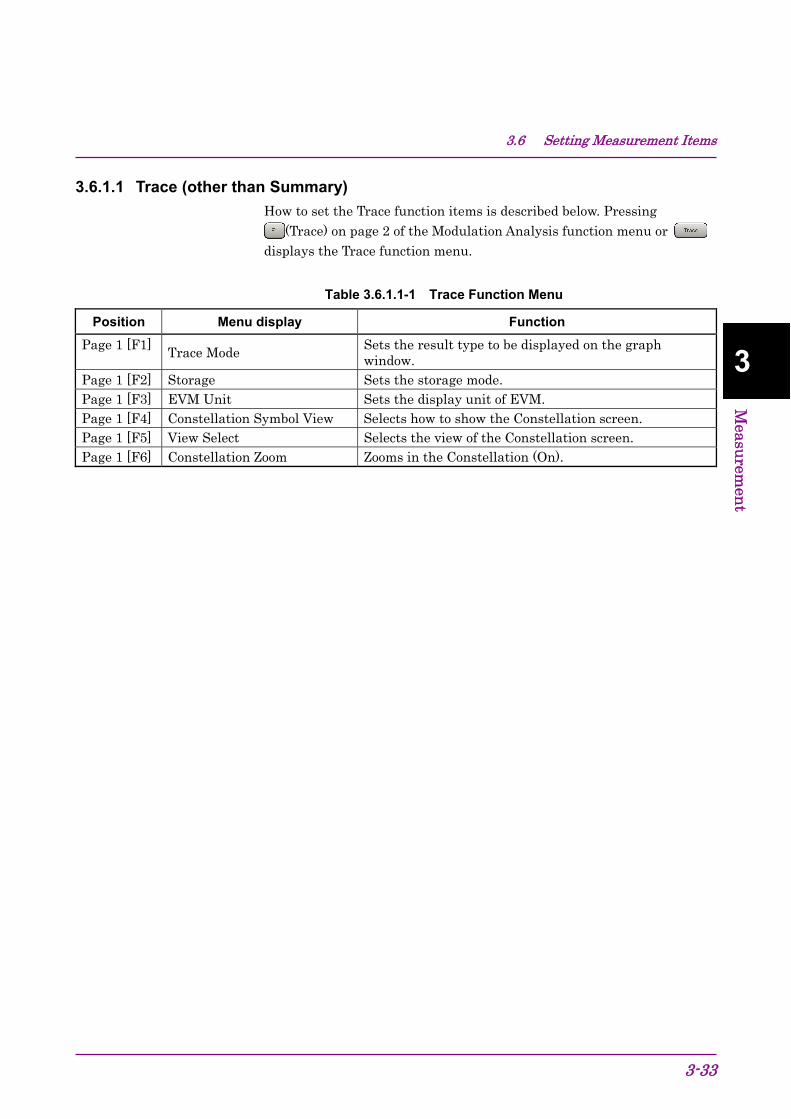
3.6 Setting Measurement Items
3-33
3
Measu
remen
t
3.6.1.1 Trace (other than Summary)
How to set the Trace function items is described below. Pressing (Trace) on page 2 of the Modulation Analysis function menu or
displays the Trace function menu.
Table 3.6.1.1-1 Trace Function Menu
Position Menu display Function
Page 1 [F1] Trace Mode Sets the result type to be displayed on the graph window.
Page 1 [F2] Storage Sets the storage mode. Page 1 [F3] EVM Unit Sets the display unit of EVM. Page 1 [F4] Constellation Symbol View Selects how to show the Constellation screen. Page 1 [F5] View Select Selects the view of the Constellation screen. Page 1 [F6] Constellation Zoom Zooms in the Constellation (On).
Chapter 3 Measurement
3-34
Trace Mode
■Summary
Sets the result type to be displayed on the graph window.
Note:
Setting this function switches the structure of the Trace function menu.
■Selection options EVM vs Subcarrier Displays EVM vs Subcarrier in the graph window. EVM vs Symbol
Displays EVM vs Symbol in the graph window. Spectral Flatness Displays Spectral Flatness in the graph window. EVM vs Chip
Displays EVM vs Chip in the graph window. Phase Error vs Chip
Displays Phase Error vs Chip in the graph window. Eye Diagram
Displays Eye Diagram in the graph window. Summary
Displays numeric results such as EVM or SIGNAL field decoding results in the graph window.
Note:
Constellation is not displayed when Trace Mode is set to Summary.
Scale: EVM Scale
■Summary
Sets vertical scale of an EVM graphical result.
■Setting range
Sets the upper limit for the EVM scale. in %: 0.1 to 100.0%, in dB: – 60 to 0 dB
Note:
This setting is not available when Trace Mode is set to Summary or Eye Diagram.
3.6 Setting Measurement Items
3-35
3
Measu
remen
t
Scale: Flatness Scale
■Summary
Sets a scale of Spectral Flatness.
■Setting range
Amplitude Sets the upper and lower limit values of Amplitude in Spectral Flatness (1.0 to 100.0 dB).
Phase Sets the upper and lower limit values of Phase in Spectral Flatness (1.0 to 180.0 degrees).
Group Delay Sets the upper and lower limit values of Group Delay in Spectral Flatness (1 ns to 1 s).
Scale: Phase Error vs Chip
■Summary
Sets the scale of the Phase Error vs Chip.
■Setting range
1.0 degree to 180.0 degree
EVM vs Subcarrier Symbol View
■Summary
Selects how to show the EVM vs Subcarrier graph.
■Selection options
Each Show a subcarrier EVM for each symbol. Averaged Show the subcarrier EVM for the average of all
symbols. Note:
This is only available when Trace Mode is set to EVM vs Subcarrier.
Graph View
■Summary
Selects how to show the average and maximum values of the graph.
■Selection options
Ave. Displays only the average EVM. Ave.&Max Displays the average and maximum EVMs.
Note:
This is only available when Storage Mode is set to Average & Max.
Chapter 3 Measurement
3-36
Storage
■Summary
Sets the storage mode.
■Selection options
Mode Sets the storage mode. Count Sets the measurement count.
Storage: Mode
■Summary
Sets the storage mode.
■Selection options
Off Updates the data every time it measures. Average Displays the average value every time it
measures.
Average & Max Displays the average value and maximum value every time it measures.
Storage: Count
■Summary
Sets the measurement count.
■Setting range
2 to 9999
EVM Unit
■Summary
Sets the unit of EVM.
■Selection options
% Sets the unit of EVM to %. dB Sets the unit of EVM to dB.
Constellation Symbol View
■Summary
Selects how to show the Constellation screen.
■Selection options
Each Displays Constellation for each symbol. Displays the Constellation for the symbol specified in the Symbol Number of Marker.
All Displays Constellation for all symbols. Note:
This is not available when WLAN Standard is 802.11b or 802.11g (ERP-DSSS/CCK).

3.6 Setting Measurement Items
3-37
3
Measu
remen
t
View Select
■Summary
Selects the view of the Constellation screen.
■Selection options
Total Displays all subcarriers Data Displays data subcarriers only
Pilot Displays pilot subcarriers only
One Subcarrier Displays the marked subcarriers only
OutSide Pair Displays the subcarriers at both ends only Note:
This is not available when WLAN Standard is 802.11b or 802.11g (ERP-DSSS/CCK).
Spectral Flatness Type
■Summary
Sets the display type for the spectral flatness graph.
■Selection options
Amplitude Displays Amplitude of Spectral Flatness.
Phase Displays Phase of Spectral Flatness.
Group Delay Displays Group Delay of Spectral Flatness.
Constellation Zoom
■Summary
Selects whether to zoom in the Constellation screen.
■Selection options
On Zooms in the Constellation screen. Off Does not zoom in the Constellation screen.
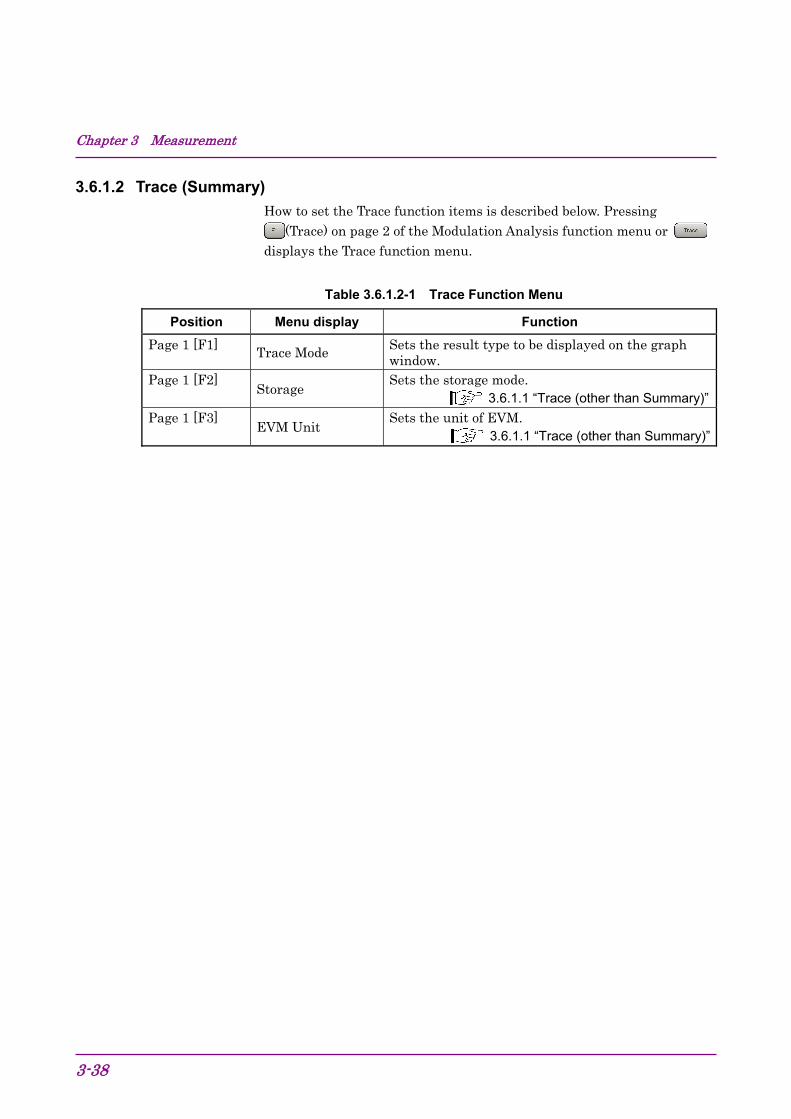
Chapter 3 Measurement
3-38
3.6.1.2 Trace (Summary)
How to set the Trace function items is described below. Pressing (Trace) on page 2 of the Modulation Analysis function menu or
displays the Trace function menu.
Table 3.6.1.2-1 Trace Function Menu
Position Menu display Function
Page 1 [F1] Trace Mode Sets the result type to be displayed on the graph window.
Page 1 [F2] Storage
Sets the storage mode. 3.6.1.1 “Trace (other than Summary)”
Page 1 [F3] EVM Unit
Sets the unit of EVM. 3.6.1.1 “Trace (other than Summary)”

3.6 Setting Measurement Items
3-39
3
Measu
remen
t
Trace Mode
■Summary
Sets the result type to be displayed on the graph window.
Note:
Setting this function switches the structure of the Trace function menu.
■Selection options EVM vs Subcarrier Displays EVM vs Subcarrier in the graph window. EVM vs Symbol
Displays EVM vs Symbol in the graph window. Spectral Flatness Displays Spectral Flatness in the graph window. EVM vs Chip
Displays EVM vs Chip in the graph window. Phase Error vs Chip
Displays Phase Error vs Chip in the graph window. Eye Diagram
Displays Eye Diagram in the graph window. Summary
Displays numeric results such as EVM or SIGNAL field decoding results in the graph window.
Note:
Constellation is not displayed when Trace Mode is set to Summary.

Chapter 3 Measurement
3-40
3.6.2 Power vs Time measurement This subsection describes how to set the Power vs Time items. Pressing
(Power vs Time) in the Measure menu displays the Power vs Time function menu.
The Power vs Time function menu consists of two pages. Press to toggle between the pages.
Power vs Time is not available when WLAN Standard is 802.11ac.
Table 3.6.2-1 Power vs Time Function Menu
Position Menu display Function
Page 1 [F1] Analysis Time Sets measurement position.
Page 1 [F2] WLAN Standard Sets WLAN Standard.
3.5 “Setting Common Items”
Page 1 [F3] Measuring Object Sets the switching between burst/continuous signals.
3.5 “Setting Common Items”
Page 1 [F4] Channel Bandwidth Sets Channel Bandwidth.
3.5 “Setting Common Items”
Page 1 [F5] PPDU Format Sets the PPDU format.
3.5 “Setting Common Items”
Page 1 [F6] Signal Setup Sets the synchronization method of the target signal.
Page 2 [F1] Trace Sets the trace.
Analysis Length
■Summary
Displays the range of the Power vs Time measurement. When Preamble Search and Ramp Down Detection are both Off, the Power vs Time waveform for the range specified in Analysis Length is displayed.
■Setting range
0.02 ms to 50 ms or Burst Interval, whichever smaller.
Note:
This is not available when either Preamble Search or Ramp-down Detection is On.
3.6 Setting Measurement Items
3-41
3
Measu
remen
t
Signal Setup
■Summary
Sets the synchronization method of the burst signal.
■Selection options
Preamble Search Sets whether to detect the burst start position by synchronizing with the Preamble.
Ramp-down Detection Sets whether to adjust the burst end point detection by detecting the burst falling.
Detection Level Sets the threshold of the Ramp-down Detection.
Detection Offset After the synchronization, displays the waveform with offsets added to the synchronization timing.
Signal Setup: Preamble Search
■Summary
Sets whether to detect the burst start position by synchronizing with the Preamble.
■Selection options
On Detects the burst start position by synchronizing with the Preamble. Also, gets the burst length by decoding the SIGNAL field.
Off Detects the start position from the burst power without synchronizing with the Preamble.
Note:
This is not available when Measuring Object is Continuous; in that case, it is automatically set to Off.
Chapter 3 Measurement
3-42
Signal Setup: Ramp-down Detection
■Summary
Sets whether to adjust the burst end point detection by detecting the burst falling.
■Selection options
On Adjusts the burst end point detection by detecting the burst falling.
Off Does not adjust the burst end point detection by detecting the burst falling. The end point shown by Power vs Time depends on the settings for Analysis Length and Preamble Search.
Note:
This is not available when Measuring Object is Continuous; in that case, it is automatically set to Off.
Signal Setup: Detection Level
■Summary
Sets the threshold of the Ramp-down Detection.
■Setting range
–20 to 0 dBm
Signal Setup: Detection Offset
■Summary
After the synchronization, displays the waveform with offsets added to the synchronization timing.
■Setting range
–2.0 to 2.0 s

3.6 Setting Measurement Items
3-43
3
Measu
remen
t
3.6.2.1 Trace
How to set the Trace function items is described below. Pressing (Trace ) on page 2 of the Power vs Time function menu or displays the Trace function menu.
Table 3.6.2.1-1 Trace function menu
Position Menu Display Function
Page 1 [F1] Trace Mode Sets type of result displayed in a graph window.
Page 1 [F2] Storage
Sets the storage mode.
3.5 “Setting Common Items”
Page 1 [F3] Display Reference Level Changes the reference value of the waveform display.
Page 1 [F4] Transient Time Scale Sets the display range for the horizontal axis. Page 1 [F5] Transient Ref. Power Sets the reference transmission power. Page 1 [F6] Smoothing Filter Sets whether to perform smoothing against the
waveform display.
Trace Mode
■Summary
Sets type of result displayed in a graph window.
■Selection options Burst
Displays the waveform of one burst. One burst may not be displayed when Analysis Length is not set correctly, or Preamble Search and Ramp-Down Detection are set to Off.
Transient Zooms in the burst rising and falling.
The burst length is (analysis length + preamble length). The burst falling may not be displayed when Analysis Length is not set correctly, or Preamble Search and Ramp-Down Detection are set to Off.
Display Reference Level
■Summary
Sets the reference value of the waveform display.
■Selection options Max Sets the reference value of the waveform display to the
maximum instantaneous power.
Ave. Sets the reference value of the waveform display to the average power.
Chapter 3 Measurement
3-44
Transient Time Scale
■Summary
Sets the reference value of the waveform display.
■Setting range
8.0 s to 40.0 s
Note:
This command is not available when Measuring Object is Continuous.
This is not available when Trace Mode is Burst.
Transient Ref. Power
■Summary
Sets the range for calculating the reference value of the waveform display.
■Selection options Total Sets the reference value to the transmission power of the
whole burst. Ramp Sets the reference value to the transmission power within
the range of rising/falling waveform display. Note:
This is available only when WLAN Standard is 802.11b or 802.11g (ERP-DSSS/CCK).
This command is not available when Measuring Object is Continuous.
This is not available when Trace Mode is Burst.
Smoothing Filter
■Summary
Sets whether to perform smoothing against the waveform display.
■Selection options On Enables smoothing. Off Disables smoothing.
3.6 Setting Measurement Items
3-45
3
Measu
remen
t
3.6.3 Adjacent Channel Leakage Power measurement (ACP) This subsection describes the ACP function key. Pressing (ACP (Swept)) in the Measure menu recalls the ACP function of the Spectrum Analyzer function. Settings of Carrier Frequency, Input level, Offset, Offset Value and Pre-Amp are automatically reflected on the corresponding parameters. Recall Current Application described in Section 3.6.2 “Recalling parameters” of the MS2690A/MS2691A/MS2692A Signal Analyzer Operation Manual (Signal Analyzer Function Operation) or MS2830A Signal Analyzer Operation Manual (Signal Analyzer Function Operation) cannot be executed when this function is being recalled.
ACP (Swept)
■Summary
The ACP function of the Spectrum Analyzer function is called, and the adjacent channel leakage power is measured according to the handed over parameter settings.
3.6.4 Occupied Bandwidth measurement (OBW) This subsection describes the OBW function key. Pressing (OBW (Swept)) in the Measure menu recalls the OBW function of the Spectrum Analyzer function. Settings of Carrier Frequency, Input level, Offset, Offset Value and Pre-Amp are automatically reflected on the corresponding parameters. Recall Current Application described in Section 3.6.2 “Recalling parameters” of the MS2690A/MS2691A/MS2692A Signal Analyzer Operation Manual (Signal Analyzer Function Operation) or MS2830A Signal Analyzer Operation Manual (Signal Analyzer Function Operation) cannot be executed when this function is being recalled.
OBW (Swept)
■Summary
The OBW function of the Spectrum Analyzer function is called, and the occupied bandwidth is measured according to the handed over parameter settings.

Chapter 3 Measurement
3-46
3.6.5 Spectrum Emission Mask (SEM) This subsection describes the SEM function key. Pressing (Spurious Emission Mask (Swept)) in the Measure menu recalls the Spectrum Emission Mask function of the Spectrum Analyzer function. Settings of Carrier Frequency, Input level, Offset, Offset Value and Pre-Amp are automatically reflected on the corresponding parameters. Recall Current Application described in Section 3.6.2 “Recalling parameters” of the MS2690A/MS2691A/MS2692A Signal Analyzer Operation Manual (Signal Analyzer Function Operation) or MS2830A Signal Analyzer Operation Manual (Signal Analyzer Function Operation) cannot be executed when this function is being recalled.
Spectrum Emission Mask (Swept)
■Summary
Recalls the Spectrum Emission Mask function of the Spectrum Analyzer function and measures the spectrum emission mask for the reflected parameter settings.
3.6 Setting Measurement Items
3-47
3
Measu
remen
t
3.6.6 Spurious Emission measurement This subsection describes the Spurious Emission function key. Pressing
(Spurious Emission (Swept)) in the Measure menu recalls the Spurious Emission function of the Spectrum Analyzer function. Settings of Carrier Frequency, Input level, Offset, Offset Value and Pre-Amp are automatically reflected on the corresponding parameters. Recall Current Application described in Section 3.6.2 “Recalling parameters” of the MS2690A/MS2691A/MS2692A Signal Analyzer Operation Manual (Signal Analyzer Function Operation) or MS2830A Signal Analyzer Operation Manual (Signal Analyzer Function Operation) cannot be executed when this function is being recalled.
Spurious Emission (Swept)
■Summary
Recalls the Spurious Emission function of the Spectrum Analyzer function and measures the spurious emissions for the reflected parameter settings.
Chapter 3 Measurement
3-48
3.7 Setting Marker This section describes how to configure the marker-related settings. Pressing (Marker) on the main function menu or displays the page 1 of the Marker function menu. Also, pressing displays page 2 of the Marker function menu.
The Marker function menu consists of 2 pages that are toggled by pressing .
Note:
You cannot configure marker settings when Trace Mode is set to Summary.
3.7.1 Setting markers for Modulation Analysis Marker
■Summary
Sets the Marker On/Off.
■Selection options
On Enables the marker function. Off Disables the marker function.
3.7 Setting Marker
3-49
3
Measu
remen
t
Subcarrier Number
■Summary
Sets the position of the subcarrier targeted for the marker. ■Setting range
When the Trace Mode is EVM vs Subcarrier, EVM vs Symbol, or Spectral
Flatness:
When WLAN Standard is 802.11a, 802.11g (ERP-OFDM), 802.11g
(DSSS-OFDM), 802.11j, or 802.11p:
–26 to 26 When WLAN Standard is 802.11n:
–26 to 26 (Channel Bandwidth = 20 MHz, PPDU Format = Non-HT)
–28 to 28 (Channel Bandwidth = 20 MHz, PPDU Format ≠ Non-HT)
–58 to 58 (Channel Bandwidth = 40 MHz, PPDU Format = Non-HT)
–58 to 58 (Channel Bandwidth = 40 MHz, PPDU Format ≠ Non-HT)
–60 to 60 (Channel Bandwidth = 40 MHz Upper or 40 MHz Lower)
When WLAN Standard is 802.11ac:
–28 to 28 (Channel Bandwidth = 20 MHz) –58 to 58 (Channel Bandwidth = 40 MHz) –122 to 122 (Channel Bandwidth = 80 MHz) –250 to 250 (Channel Bandwidth = 160 MHz)
Note:
This is available only when WLAN Standard is 802.11a, 802.11g (ERP-OFDM), 802.11g (DSSS-OFDM), 802.11j, 802.11n, 802.11p or 802.11ac.
Symbol Number
■Summary
Sets the position of the symbol targeted for the marker. ■Setting range
0 to Analysis Length – 1 3.6.1 “Modulation Analysis"
Note:
This is available only when WLAN Standard is 802.11a, 802.11g (ERP-OFDM), 802.11g (DSSS-OFDM), 802.11j, 802.11n, or 802.11p.

Chapter 3 Measurement
3-50
Chip Number
■Summary
Sets the position of the chip targeted for the marker. ■Setting range
0 to Analysis Length – 1 3.6.1 “Modulation Analysis"
Note:
This is available only when WLAN Standard is 802.11b or 802.11g (ERP-DSSS/CCK).
Eye Diagram Chip Number
■Summary
Sets the position of the chip targeted for the marker in eye diagram.
■Setting range
0 to Analysis Length – 0. 1 or 999. 9, whichever smaller 3.6.1 “Modulation Analysis"
Note:
This is available only when Trace Mode is set to Eye Diagram.
Peak Search
■Summary
Moves the marker to the maximum level point within the measurement range. When there are multiple maximum level points, the point corresponding to the smallest value (left side of the scale) on the horizontal axis (Subcarrier, or Symbol) is selected.
Next Peak
■Summary
Moves the marker to the next largest level point after the current marker level within the measurement range. When there are multiple points, the point corresponding to the smallest value (left side of the scale) on the horizontal scale is selected. However, if the point is the same value as the marker level, the marker is moved to the next maximum point to the horizontal axis position of the marker.
Dip Search
■Summary
Moves the marker to the minimum level position within the measurement range. When there are multiple points, the point corresponding to the greatest value (right side of the scale) on the horizontal axis is selected.
3.7 Setting Marker
3-51
3
Measu
remen
t
Next Dip
■Summary
Moves the marker to the next smallest level point after the current marker level within the measurement range. When there are multiple points, the point corresponding to the greatest value (right side of the scale) on the horizontal axis is selected. However, if the point is the same value as the marker level, the marker is moved to the next minimum point to the horizontal axis position of the marker.

Chapter 3 Measurement
3-52
3.7.2 Setting markers for Power vs Time measurement Marker
■Summary
Sets the Marker On/Off.
■Selection options
On Enables the marker function. Off Disables the marker function.
Marker Number
■Summary
Sets the position targeted for the marker. ■Setting range
Can be set to the ranges shown in the following table.
Table 3.7.1.2-1 Setting range of Marker Number
Trace Mode
Preamble Search / Ramp-down
Detection
Marker NumberSetting range
Rise Select Fall Select
Burst Either or both On –20.0 s to the detected burst length + 20.0 s
Both Off –20.0 s to LAL + 20.0 s
Transient
Either or both On – TTTS /2 to TTTS /2 The detected burst length – TTTS /2 to the detected burst length + TTTS /2
Both Off – TTTS /2 to TTTS /2 LAL – TTTS /2 to LAL + TTTS /2
* TTTS is the setting for Transient Time Scale, and LAL is the setting for Analysis Length.
3.6.2 “Power vs Time measurement”
Rise Select
■Summary
Sets the marker target to the window that displays burst rising. Note:
This is available only when Trace Mode is set to Transient.
3.7 Setting Marker
3-53
3
Measu
remen
t
Fall Select
■Summary
Sets the marker target to the window that displays burst falling. Note:
This is available only when Trace Mode is set to Transient.
Chapter 3 Measurement
3-54
3.8 Setting Trigger This subsection describes how to configure the trigger-related settings. Pressing (Trigger) on the main function menu or displays the Trigger function menu.
Note:
You cannot set a trigger when the Replay function is executed.
4.2 “Replay Function”
Trigger Switch
■Summary
This sets the trigger synchronization On/Off.
■Selection options
On Enables the trigger function. Off Disables the trigger function.
Trigger Source
■Summary
Sets the trigger source.
■Selection options
Wide IF Video An IF signal with a wide passing band of about 50 MHz is detected, and measurement starts in synchronization with the rise or fall of the detected signal.
External Measurement starts with external trigger signal input.
SG Marker Starts measurement by the timing of internal Vector Signal Generator option.
Trigger Slope
■Summary
Sets the trigger polarity.
■Selection options
Rise Synchronizes with rising edge of the trigger. Fall Synchronizes with falling edge of the trigger.
Wide IF Video Trigger Level
■Summary
Sets the level threshold for detecting the slot.
■Setting range
(–60 + Level Offset Value) to (+50 + Level Offset Value) dBm
3.8 Setting Trigger
3-55
3
Measu
remen
t
Trigger Delay
■Summary
Sets the trigger delay.
■Setting range
-2 to +2 s
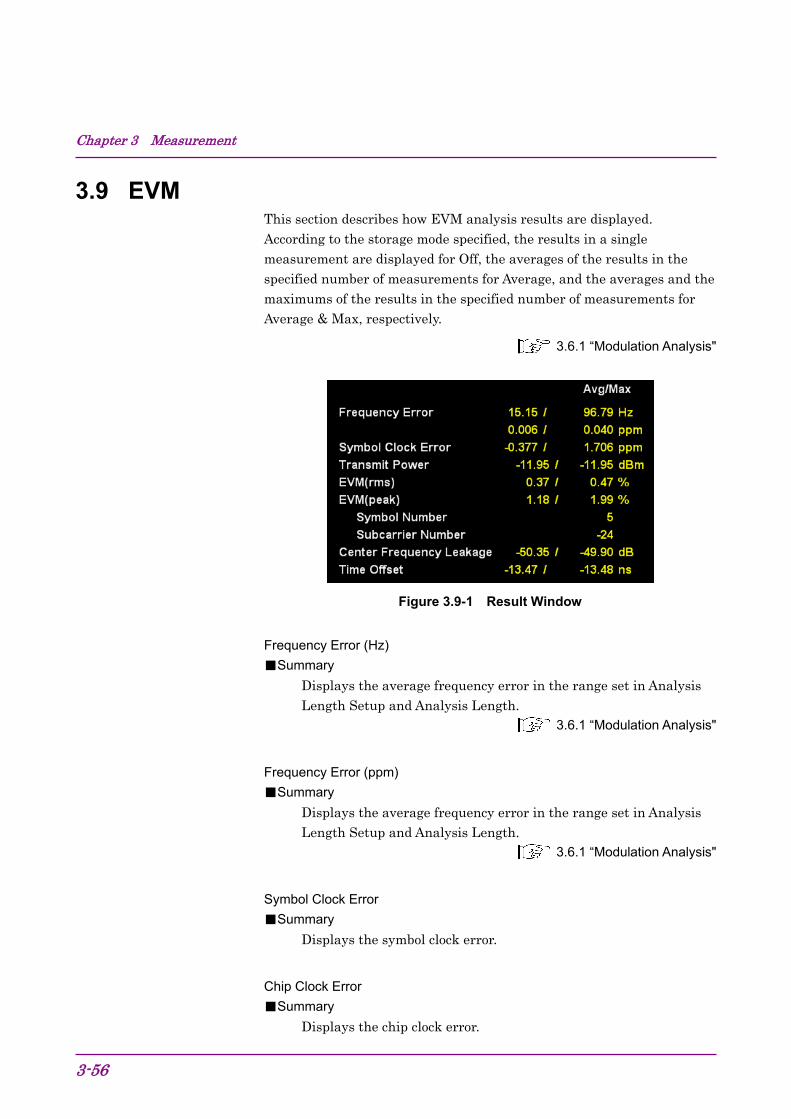
Chapter 3 Measurement
3-56
3.9 EVM This section describes how EVM analysis results are displayed. According to the storage mode specified, the results in a single measurement are displayed for Off, the averages of the results in the specified number of measurements for Average, and the averages and the maximums of the results in the specified number of measurements for Average & Max, respectively.
3.6.1 “Modulation Analysis"
Figure 3.9-1 Result Window
Frequency Error (Hz)
■Summary
Displays the average frequency error in the range set in Analysis Length Setup and Analysis Length.
3.6.1 “Modulation Analysis"
Frequency Error (ppm)
■Summary
Displays the average frequency error in the range set in Analysis Length Setup and Analysis Length.
3.6.1 “Modulation Analysis"
Symbol Clock Error
■Summary
Displays the symbol clock error.
Chip Clock Error
■Summary
Displays the chip clock error.
3.9 EVM
3-57
3
Measu
remen
t
Transmit Power
■Summary
Displays the average RF level in the range set in Analysis Length Setup and Analysis Length.
3.6.1 “Modulation Analysis"
EVM (rms)
■Summary
Displays the average EVM level in the range set in Analysis Length Setup and Analysis Length. Switches between % and dB according to settings of EVM Unit.
3.6.1 “Modulation Analysis"
EVM (peak)
■Summary
Displays the maximum EVM of all subcarriers and all symbols (chips) in the range set in Analysis Length Setup and Analysis Length. Switches between % and dB according to settings of EVM Unit.
3.6.1 “Modulation Analysis"
Symbol Number
■Summary
Displays the symbol number of EVM (peak).
Chip Number
■Summary
Displays the chip number of EVM (peak).
Subcarrier Number
■Summary
Displays the subcarrier number of EVM (peak). Center Frequency Leakage
■Summary
Displays the average center frequency leakage in the range set in Analysis Length Setup and Analysis Length.
3.6.1 “Modulation Analysis"
IQ Origin Offset
■Summary
Displays the average IQ Origin Offset in the range set in Analysis Length Setup and Analysis Length.
3.6.1 “Modulation Analysis"

Chapter 3 Measurement
3-58
Time Offset
■Summary
Displays the time offset between the trigger input and the head of the frame. This is enabled when the trigger function is On.
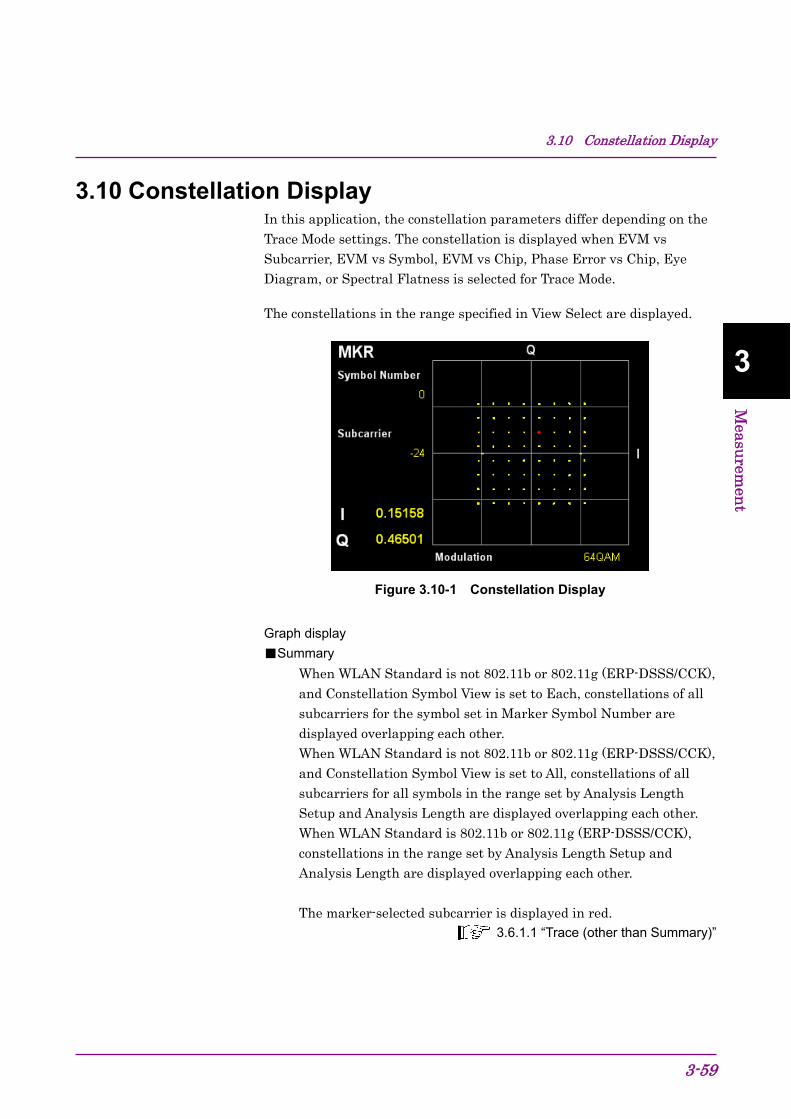
3.10 Constellation Display
3-59
3
Measu
remen
t
3.10 Constellation Display In this application, the constellation parameters differ depending on the Trace Mode settings. The constellation is displayed when EVM vs Subcarrier, EVM vs Symbol, EVM vs Chip, Phase Error vs Chip, Eye Diagram, or Spectral Flatness is selected for Trace Mode.
The constellations in the range specified in View Select are displayed.
Figure 3.10-1 Constellation Display
Graph display
■Summary
When WLAN Standard is not 802.11b or 802.11g (ERP-DSSS/CCK), and Constellation Symbol View is set to Each, constellations of all subcarriers for the symbol set in Marker Symbol Number are displayed overlapping each other.
When WLAN Standard is not 802.11b or 802.11g (ERP-DSSS/CCK), and Constellation Symbol View is set to All, constellations of all subcarriers for all symbols in the range set by Analysis Length Setup and Analysis Length are displayed overlapping each other.
When WLAN Standard is 802.11b or 802.11g (ERP-DSSS/CCK), constellations in the range set by Analysis Length Setup and Analysis Length are displayed overlapping each other.
The marker-selected subcarrier is displayed in red.
3.6.1.1 “Trace (other than Summary)”
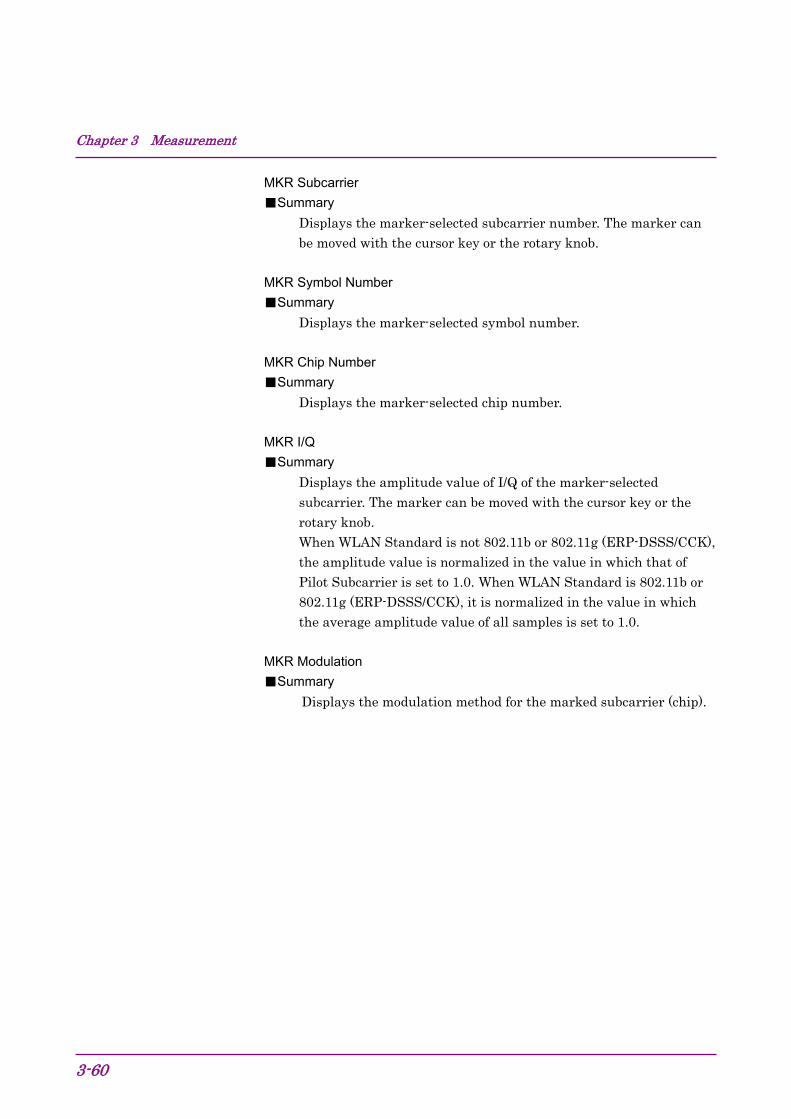
Chapter 3 Measurement
3-60
MKR Subcarrier
■Summary
Displays the marker-selected subcarrier number. The marker can be moved with the cursor key or the rotary knob.
MKR Symbol Number
■Summary
Displays the marker-selected symbol number. MKR Chip Number
■Summary
Displays the marker-selected chip number. MKR I/Q
■Summary
Displays the amplitude value of I/Q of the marker-selected subcarrier. The marker can be moved with the cursor key or the rotary knob. When WLAN Standard is not 802.11b or 802.11g (ERP-DSSS/CCK), the amplitude value is normalized in the value in which that of Pilot Subcarrier is set to 1.0. When WLAN Standard is 802.11b or 802.11g (ERP-DSSS/CCK), it is normalized in the value in which the average amplitude value of all samples is set to 1.0.
MKR Modulation
■Summary
Displays the modulation method for the marked subcarrier (chip).

3.11 EVM vs Subcarrier Display
3-61
3
Measu
remen
t
3.11 EVM vs Subcarrier Display This section describes how EVM for each subcarrier is displayed.
Figure 3.11-1 EVM vs Subcarrier Display
Graph display
■Summary
Displays EVM for each subcarrier. The marker-selected subcarrier is displayed in red. The displayed contents depend on the settings in EVM vs Subcarrier Symbol View and Graph View.
3.6.1.1 “Trace (other than Summary)”
MKR Subcarrier
■Summary
Displays the number for the marker-selected subcarrier and the offset frequency from the center frequency. The marker can be moved with the cursor key or the rotary knob.
MKR EVM
■Summary
Displays the average and maximum EVM values of the marker-selected subcarriers.
MKR Symbol Number
■Summary
Displays the symbol number set in Symbol Number.
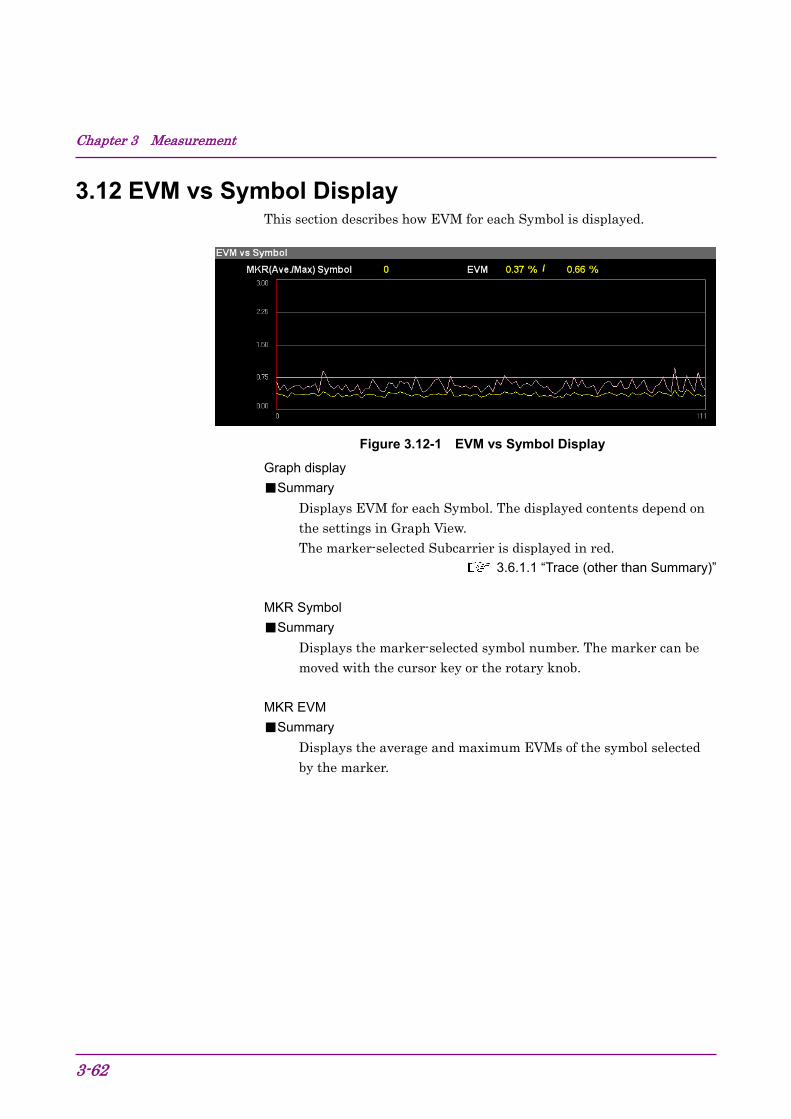
Chapter 3 Measurement
3-62
3.12 EVM vs Symbol Display This section describes how EVM for each Symbol is displayed.
Figure 3.12-1 EVM vs Symbol Display
Graph display
■Summary
Displays EVM for each Symbol. The displayed contents depend on the settings in Graph View.
The marker-selected Subcarrier is displayed in red. 3.6.1.1 “Trace (other than Summary)”
MKR Symbol
■Summary
Displays the marker-selected symbol number. The marker can be moved with the cursor key or the rotary knob.
MKR EVM
■Summary
Displays the average and maximum EVMs of the symbol selected by the marker.
3.13 EVM vs Chip Display
3-63
3
Measu
remen
t
3.13 EVM vs Chip Display This section describes how EVM for each chip is displayed.
Figure 3.13-1 EVM vs Chip Display
Graph display
■Summary
Displays EVM for each chip. The displayed contents depend on the settings in Graph View. The marker-selected Subcarrier is displayed in red.
3.6.1.1 “Trace (other than Summary)”
MKR Chip Number
■Summary
Displays the marker-selected chip number. The marker can be moved with the cursor key or the rotary knob.
MKR EVM
■Summary
Displays the average and maximum EVMs of the chip selected by the marker.
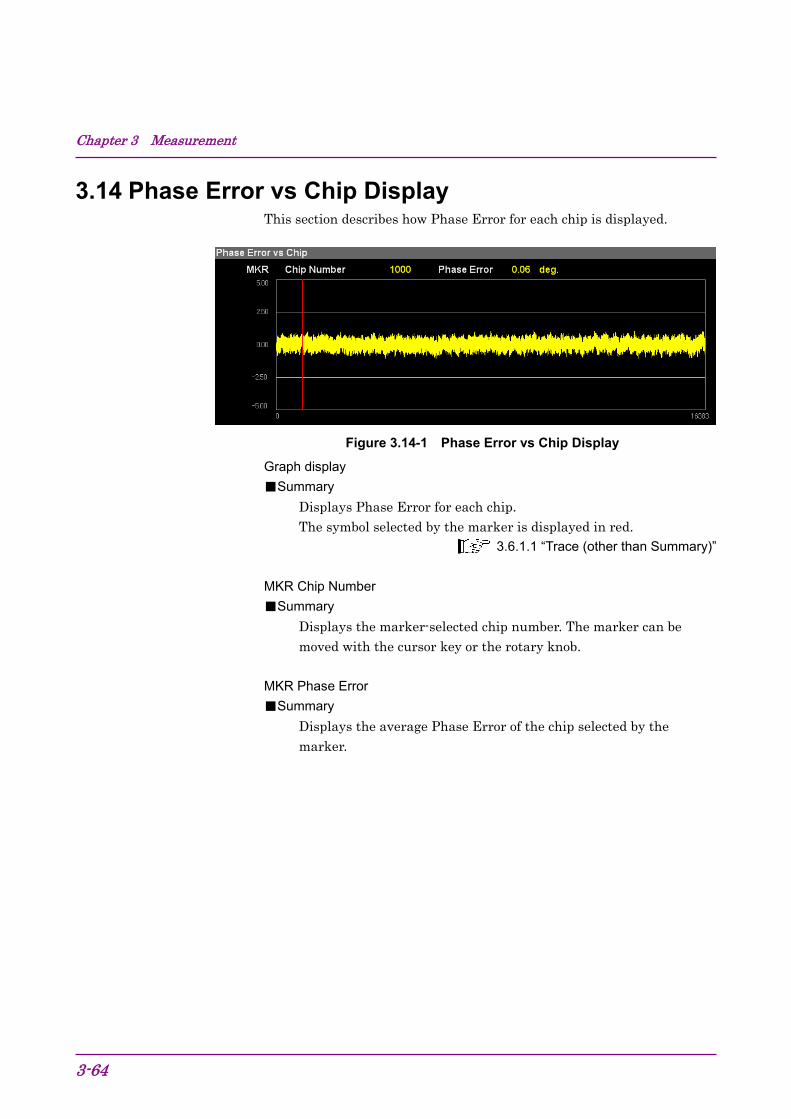
Chapter 3 Measurement
3-64
3.14 Phase Error vs Chip Display This section describes how Phase Error for each chip is displayed.
Figure 3.14-1 Phase Error vs Chip Display
Graph display
■Summary
Displays Phase Error for each chip. The symbol selected by the marker is displayed in red.
3.6.1.1 “Trace (other than Summary)” MKR Chip Number
■Summary
Displays the marker-selected chip number. The marker can be moved with the cursor key or the rotary knob.
MKR Phase Error
■Summary
Displays the average Phase Error of the chip selected by the marker.
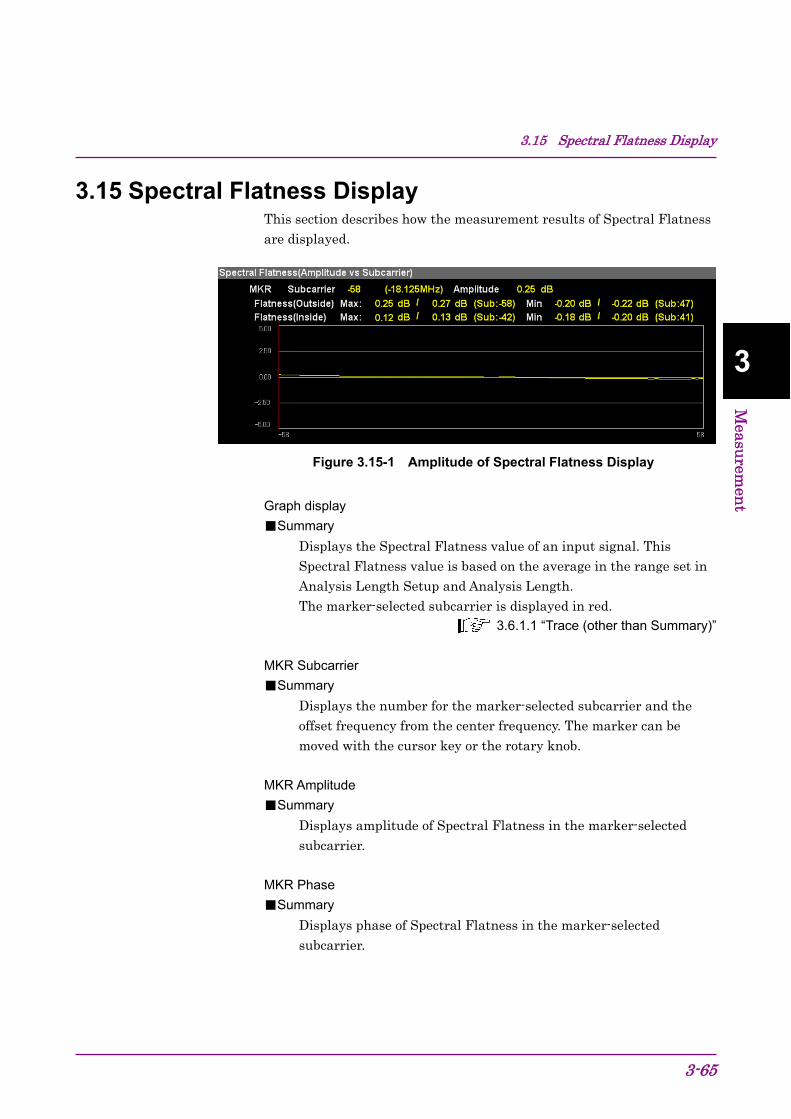
3.15 Spectral Flatness Display
3-65
3
Measu
remen
t
3.15 Spectral Flatness Display This section describes how the measurement results of Spectral Flatness are displayed.
Figure 3.15-1 Amplitude of Spectral Flatness Display
Graph display
■Summary
Displays the Spectral Flatness value of an input signal. This Spectral Flatness value is based on the average in the range set in Analysis Length Setup and Analysis Length. The marker-selected subcarrier is displayed in red.
3.6.1.1 “Trace (other than Summary)” MKR Subcarrier
■Summary
Displays the number for the marker-selected subcarrier and the offset frequency from the center frequency. The marker can be moved with the cursor key or the rotary knob.
MKR Amplitude
■Summary
Displays amplitude of Spectral Flatness in the marker-selected subcarrier.
MKR Phase
■Summary
Displays phase of Spectral Flatness in the marker-selected subcarrier.
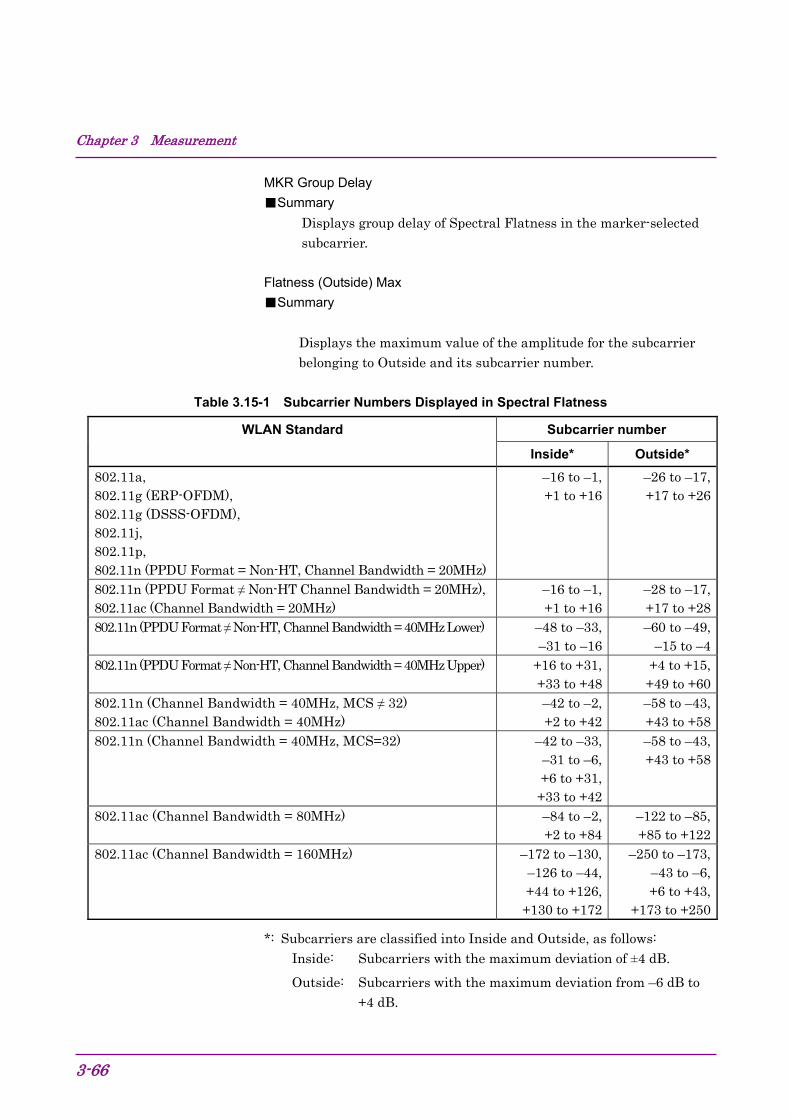
Chapter 3 Measurement
3-66
MKR Group Delay
■Summary
Displays group delay of Spectral Flatness in the marker-selected subcarrier.
Flatness (Outside) Max
■Summary
Displays the maximum value of the amplitude for the subcarrier belonging to Outside and its subcarrier number.
Table 3.15-1 Subcarrier Numbers Displayed in Spectral Flatness
WLAN Standard Subcarrier number
Inside* Outside*
802.11a, 802.11g (ERP-OFDM), 802.11g (DSSS-OFDM), 802.11j, 802.11p, 802.11n (PPDU Format = Non-HT, Channel Bandwidth = 20MHz)
–16 to –1, +1 to +16
–26 to –17,+17 to +26
802.11n (PPDU Format ≠ Non-HT Channel Bandwidth = 20MHz),802.11ac (Channel Bandwidth = 20MHz)
–16 to –1, +1 to +16
–28 to –17,+17 to +28
802.11n (PPDU Format ≠ Non-HT, Channel Bandwidth = 40MHz Lower) –48 to –33, –31 to –16
–60 to –49,–15 to –4
802.11n (PPDU Format ≠ Non-HT, Channel Bandwidth = 40MHz Upper) +16 to +31, +33 to +48
+4 to +15,+49 to +60
802.11n (Channel Bandwidth = 40MHz, MCS ≠ 32) 802.11ac (Channel Bandwidth = 40MHz)
–42 to –2, +2 to +42
–58 to –43, +43 to +58
802.11n (Channel Bandwidth = 40MHz, MCS=32) –42 to –33, –31 to –6, +6 to +31,
+33 to +42
–58 to –43, +43 to +58
802.11ac (Channel Bandwidth = 80MHz) –84 to –2, +2 to +84
–122 to –85,+85 to +122
802.11ac (Channel Bandwidth = 160MHz) –172 to –130, –126 to –44, +44 to +126,
+130 to +172
–250 to –173,–43 to –6,+6 to +43,
+173 to +250
*: Subcarriers are classified into Inside and Outside, as follows: Inside: Subcarriers with the maximum deviation of ±4 dB.
Outside: Subcarriers with the maximum deviation from –6 dB to +4 dB.
3.15 Spectral Flatness Display
3-67
3
Measu
remen
t
Flatness (Outside) Min
■Summary
Displays the minimum value of the amplitude for the subcarrier belonging to Outside and its subcarrier number.
Table 3.15-1 Subcarrier Numbers Displayed in Spectral Flatness
Flatness (Inside) Max
■Summary
Displays the maximum value of the amplitude for the subcarrier belonging to Inside and its subcarrier number.
Table 3.15-1 Subcarrier Numbers Displayed in Spectral Flatness
Flatness (Inside) Min
■Summary
Displays the minimum value of the amplitude for the subcarrier belonging to Inside and its subcarrier number.
Table 3.15-1 Subcarrier Numbers Displayed in Spectral Flatness
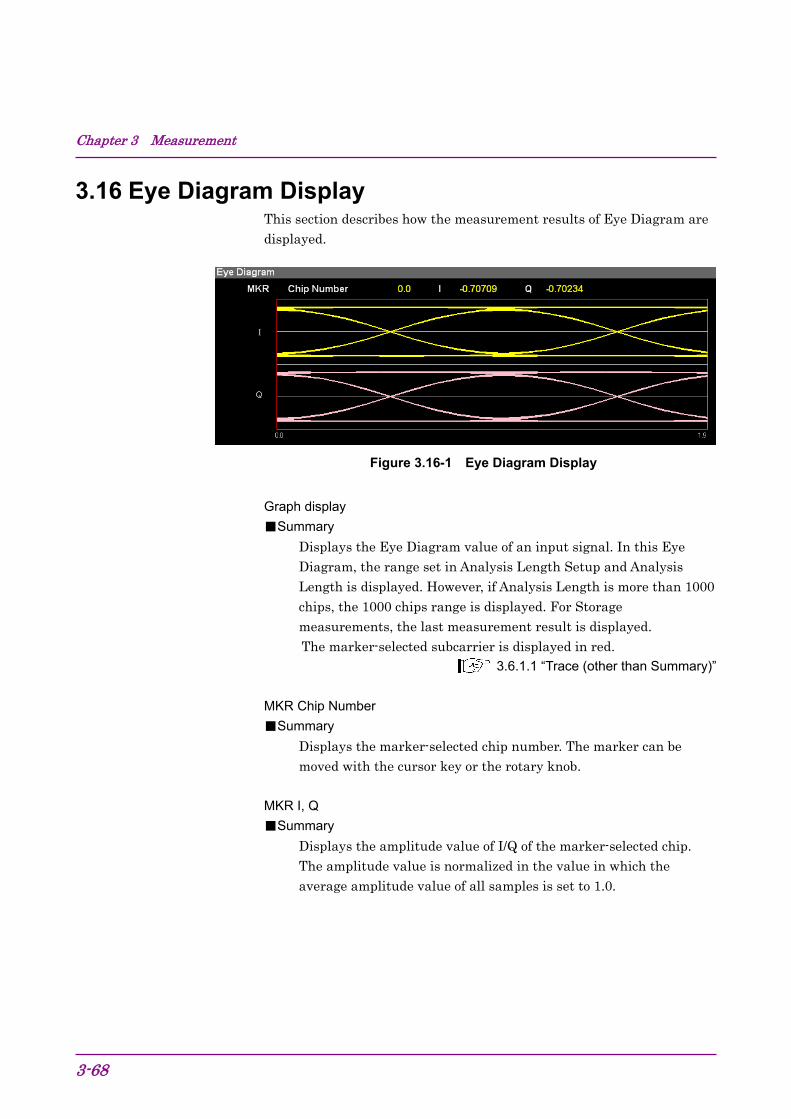
Chapter 3 Measurement
3-68
3.16 Eye Diagram Display This section describes how the measurement results of Eye Diagram are displayed.
Figure 3.16-1 Eye Diagram Display
Graph display
■Summary
Displays the Eye Diagram value of an input signal. In this Eye Diagram, the range set in Analysis Length Setup and Analysis Length is displayed. However, if Analysis Length is more than 1000 chips, the 1000 chips range is displayed. For Storage measurements, the last measurement result is displayed.
The marker-selected subcarrier is displayed in red. 3.6.1.1 “Trace (other than Summary)”
MKR Chip Number
■Summary
Displays the marker-selected chip number. The marker can be moved with the cursor key or the rotary knob.
MKR I, Q
■Summary
Displays the amplitude value of I/Q of the marker-selected chip. The amplitude value is normalized in the value in which the average amplitude value of all samples is set to 1.0.

3.17 Summary Display
3-69
3
Measu
remen
t
3.17 Summary Display This section describes how numeric results such as EVM or SIGNAL field decoding results are displayed.
EVM (rms)
■Summary
Displays the average EVM level in the range set in Analysis Length Setup and Analysis Length.
3.9 “EVM”
Data EVM
■Summary
Displays the average EVM of data subcarrier in the range set in Analysis Length Setup and Analysis Length.
Pilot EVM
■Summary
Displays the average EVM of pilot subcarrier in the range set in Analysis Length Setup and Analysis Length.
EVM (peak)
■Summary
Displays the maximum EVM of all subcarriers and all symbols (chips) in the range set in Analysis Length Setup and Analysis Length.
3.9 “EVM”
SIG EVM(rms)
■Summary
Displays the EVM of signal field. Switches between % and dB according to settings of EVM Unit. Displays only when WLAN Standard is 802.11a.
3.6.1 “Modulation Analysis”
L-SIG EVM(rms)
■Summary
Displays the EVM of L_SIG. Switches between % and dB according to settings of EVM Unit. Displays only when WLAN Standard is 802.11n or 802.11ac.
3.6.1 “Modulation Analysis”
Chapter 3 Measurement
3-70
HT-SIG EVM(rms)
■Summary
Displays the EVM of L_SIG. Switches between % and dB according to settings of EVM Unit. Displays only when WLAN Standard is 802.11n and PPDU Format is HT-Mixed or HT-Greenfield.
3.6.1 “Modulation Analysis”
VHT-SIG-A EVM(rms)
■Summary
Displays the EVM of VHT-SIG-A. Displays only when WLAN Standard is 802.11ac. Displays only when WLAN Standard is 802.11ac.
3.6.1 “Modulation Analysis”
VHT-SIG-B EVM(rms)
■Summary
Displays the EVM of VHT-SIG-B. Switches between % and dB according to settings of EVM Unit. Displays only when WLAN Standard is 802.11ac.
3.6.1 “Modulation Analysis”
Symbol Number
■Summary
Displays the symbol number of EVM (peak).
Chip Number
■Summary
Displays the chip number of EVM (peak).
Subcarrier Number
■Summary
Displays the subcarrier number of EVM (peak).
Quadrature Error
■Summary
Displays the Quadrature Error in the range set in Analysis Length Setup and Analysis Length. Does not display when Channel Bandwidth is 160MHz.

3.17 Summary Display
3-71
3
Measu
remen
t
IQ Gain Imbalance
■Summary
Displays the IQ Gain Imbalance in the range set in Analysis Length Setup and Analysis Length. Does not display when Channel Bandwidth is 160MHz.
Center Frequency Leakage
■Summary
Displays the average center frequency leakage in the range set in Analysis Length Setup and Analysis Length.
IQ Origin Offset
■Summary
Displays the average IQ Origin Offset in the range set in Analysis Length Setup and Analysis Length.
Phase Error
■Summary
Displays the average phase error in the range set in Analysis Length Setup and Analysis Length.
Magnitude Error
■Summary
Displays the average magnitude error in the range set in Analysis Length Setup and Analysis Length.
Detect Parameter
■Summary
Displays information obtained by decoding SIGNAL field or HT-SIG field. For Storage measurements, the last measurement result is displayed.
Detect Parameter: Data Rate
■Summary
Displays data rate obtained by decoding SIGNAL field or HT-SIG field.
Detect Parameter: Modulation
■Summary
Displays modulation method obtained by decoding SIGNAL field or HT-SIG field.
Chapter 3 Measurement
3-72
Detect Parameter: Length
■Summary
Displays the symbol (chip) length for the PSDU field obtained by decoding SIGNAL field or HT-SIG field.
Detect Parameter: GI
■Summary
Displays whether the Guard Interval obtained by decoding HT-SIG field is Long or Short.
Detect Parameter: MCS Index
■Summary
Displays information for MCS obtained by decoding HT-SIG field.
Detect Parameter: Stream ID
■Summary
Displays information for Stream ID obtained by analysis.
Detect Parameter: Preamble
■Summary
Displays whether the Preamble obtained by decoding SIGNAL field is Long or Short.
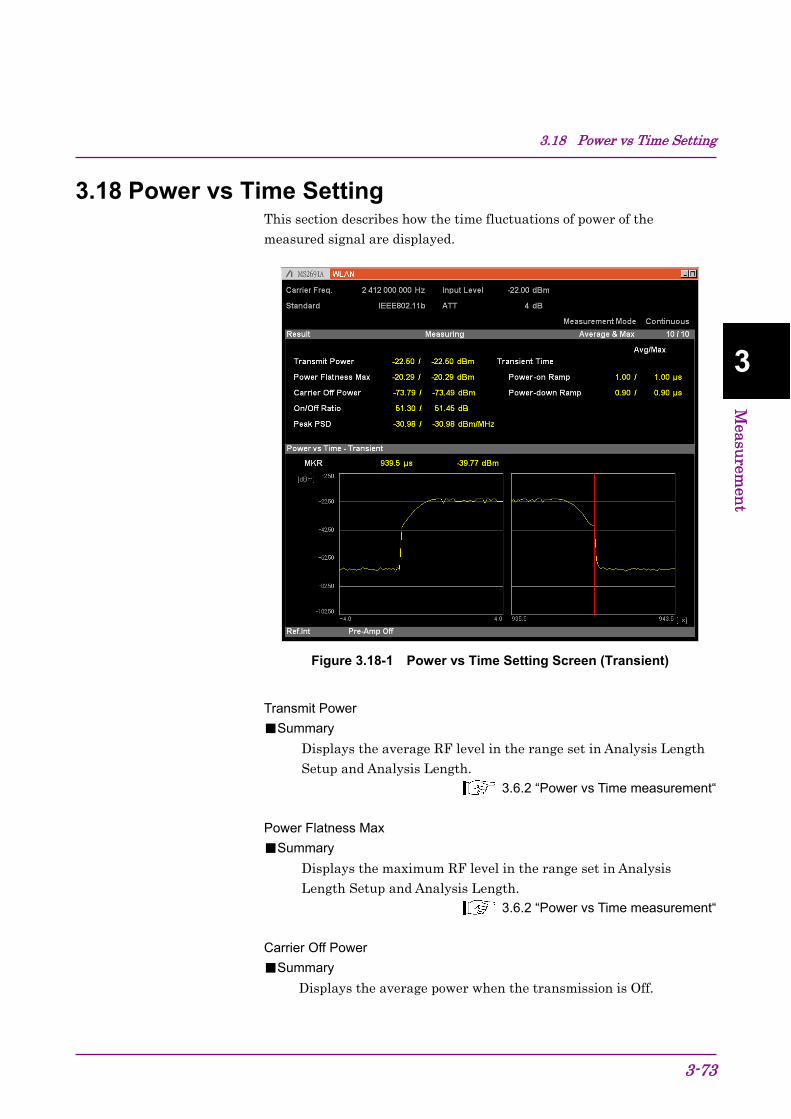
3.18 Power vs Time Setting
3-73
3
Measu
remen
t
3.18 Power vs Time Setting This section describes how the time fluctuations of power of the measured signal are displayed.
Figure 3.18-1 Power vs Time Setting Screen (Transient)
Transmit Power
■Summary
Displays the average RF level in the range set in Analysis Length Setup and Analysis Length.
3.6.2 “Power vs Time measurement“
Power Flatness Max
■Summary
Displays the maximum RF level in the range set in Analysis Length Setup and Analysis Length.
3.6.2 “Power vs Time measurement“
Carrier Off Power
■Summary
Displays the average power when the transmission is Off.

Chapter 3 Measurement
3-74
On/Off Ratio
■Summary
Displays the ratio of the average power between transmission On and Off in dB.
Peak PSD
■Summary
Displays the maximum value of the power spectrum density for 1 MHz band.
Transient Time
■Summary
Displays the burst transition time when WLAN Standard is 802.11b and 802.11g (ERP-DSSS/CCK).
Transient Time: Power-on Ramp
■Summary
Displays the time that the signal transitions from 10% to 90% of the maximum value at the burst rising. The maximum value here means the maximum value among all bursts when Transient Ref. Power is set to Total. It means the maximum value in the range displayed in Transient when Transient Ref. Power is set to Ramp.
Transient Time: Power-down Ramp
■Summary
Displays the time that the signal transitions from 90% to 10% of the maximum value at the burst falling. The maximum value here means the maximum value among all bursts when Transient Ref. Power is set to Total. It means the maximum value in the range displayed in Transient when Transient Ref. Power is set to Ramp.

3.19 Saving Measurement Results
3-75
3
Measu
remen
t
3.19 Saving Measurement Results This section describes how to save measurement results to the internal hard disk or USB memory. Press with the WLAN screen open to display the Save function menu.
Note:
Use the USB memory supplied. Other USB memory may malfunction due to incompatibilities.
F1
F2
F3
F4
F5
F6
F7
F8
Figure 3.19-1 Save Function Menu
Table 3.19-1 Save Function Menu
Menu Display Function
Device Sets the save destination drive. Save as Type This sets the type of file to save. Save All Results Saves measurement results.
Save Application
Saves measurement parameters. MS2690A/MS2691A/MS2692A
Signal Analyzer operation manual or MS2830A Signal Analyzer operation manual
Close Closes the Save function menu.
Chapter 3 Measurement
3-76.
Device
■Summary
Sets the save destination drive.
■Selection options
D, E, F, … All drives except for C
Save as Type
■Summary
This sets the type of file to save.
■Selection options
xml Saves in xml format. csv Saves in csv format.
Save All Results
■Summary This saves the measurement results. The measurement results that can be read by
the :FETCh:EVM[n]?, :READ:EVM[n]?, and :MEASure:EVM[n]? remote
commands are saved. For details on measurement results, see Table 2.7-2
“Responses to Modulation Measurement Results” in the MX269028A WLAN
Measurement Software Operation Manual (Mainframe Remote Control).The saved file is output under the name format of “WLANdate_sequence number.xml”. When measurement results are saved several times on the same date, the sequence number starting from “00” is suffixed to each file name, like “WLANdate_00.xml,” “WLANdate_01.xml,” “WLANdate_02.xml,” …, up to “WLANdate_99.xml.”
The sequential numbers suffixed to a file name are 0 to 99. Since the file number returns to 00 after 99, files with the same name are overwritten.
Files are saved to the following directory of the target drive specified using (Device).
\Anritsu Corporation\Signal Analyzer\User Data\Measurement Results\WLAN
There can be up to 100 XML files and 100 CSV files among the files.
Close
■Summary
Closes the Save function menu.
Chapter 4 Digitize Function
4-1
4
Digitize Function
This chapter describes how to save IQ data to an external memory and replay the stored IQ data.
4.1 Saving IQ Data........................................................... 4-2 4.1.1 Format of data information file ....................... 4-4 4.1.2 Format of data file .......................................... 4-6
4.2 Replay Function ......................................................... 4-7 4.2.1 Starting Replay Function ............................... 4-8 4.2.2 Display During Replay Function Execution ... 4-8 4.2.3 Restriction During Replay Function
Execution ..................................................... 4-9 4.2.4 Conditions for IQ Data Files That
Can Be Replayed ......................................... 4-9 4.2.5 Stopping Replay ............................................ 4-9
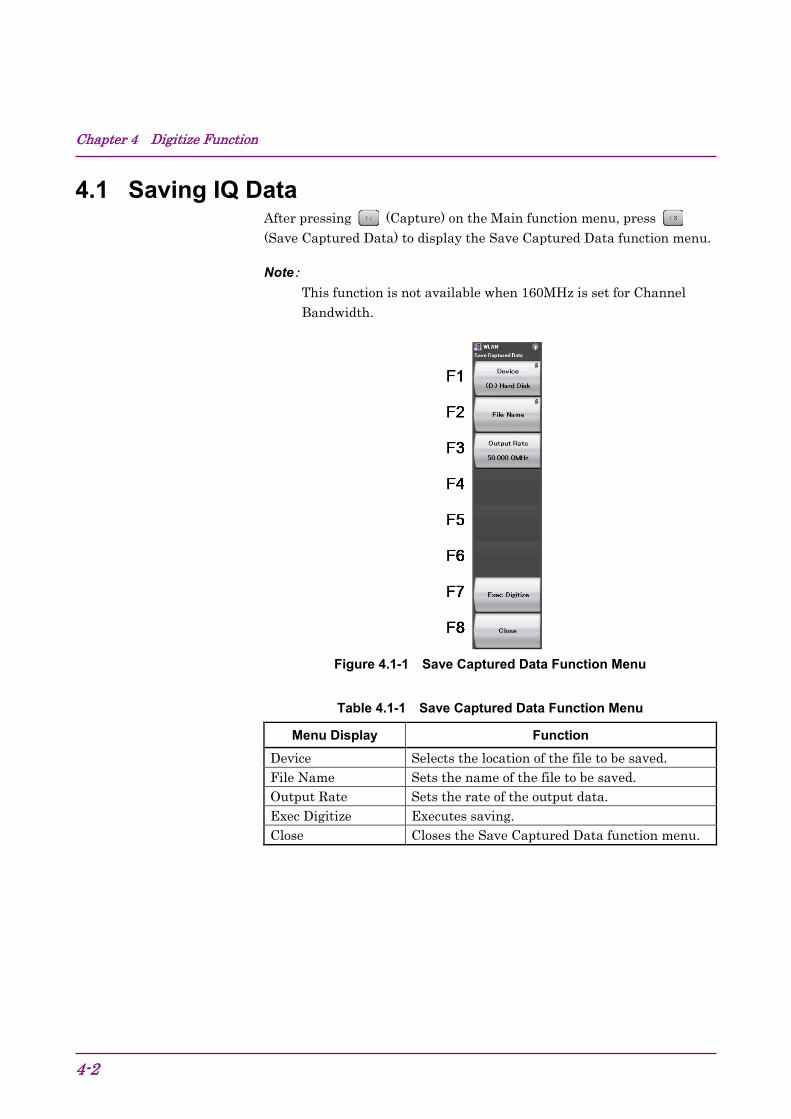
Chapter 4 Digitize Function
4-2
4.1 Saving IQ Data After pressing (Capture) on the Main function menu, press (Save Captured Data) to display the Save Captured Data function menu.
Note: This function is not available when 160MHz is set for Channel Bandwidth.
Figure 4.1-1 Save Captured Data Function Menu
Table 4.1-1 Save Captured Data Function Menu
Menu Display Function Device Selects the location of the file to be saved. File Name Sets the name of the file to be saved. Output Rate Sets the rate of the output data. Exec Digitize Executes saving. Close Closes the Save Captured Data function menu.

4.1 Saving IQ Data
4-3
4
Digitize Function
The IQ data stored in the internal memory at the time of execution of this function is saved to the external memory.
Example: To save IQ data <Procedure> 1. Press Capture ( ) on the main function menu. 2. Press (Save Captured Data). 3. Press Device ( ) on the Save Captured Data function menu to
select a data file for saving the IQ data. 4. Press (File Name) to set the file name. 5. Press (Exec Digitize) to save the IQ data.
When save processing is executed, the following files are created.
・ “[File Name].dgz” Data file (binary format) ・ “[File Name].xml” Data information file (XML format) The IQ data row is saved to the data file. The information on the saved data is saved to the data information file.
If the file name is not specified, a file name with the following format is used: Digitizedate_consecutive-numberHere, consecutive-number is a value in the range from 0 to 99.
Files are saved to the following directory of the target drive specified using Device ( ). \Anritsu Corporation\Signal Analyzer\User Data\Digitized Data\WLAN Up to 100 files can be saved in a folder.
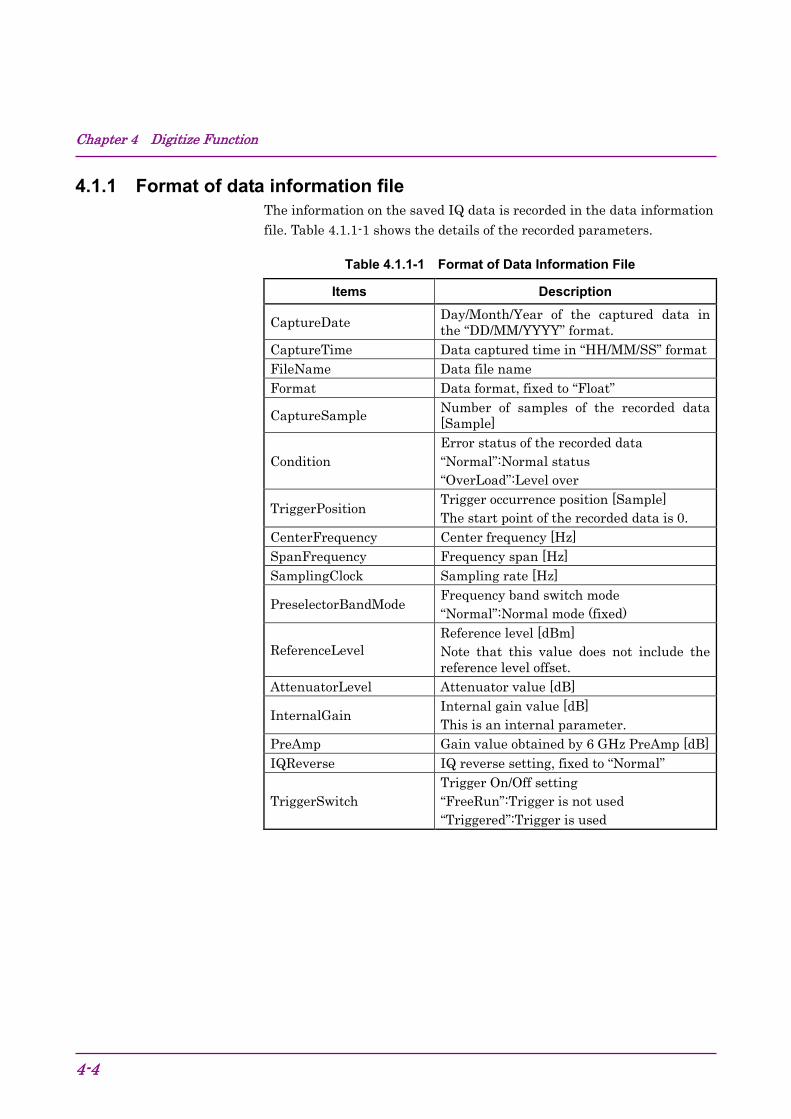
Chapter 4 Digitize Function
4-4
4.1.1 Format of data information file The information on the saved IQ data is recorded in the data information file. Table 4.1.1-1 shows the details of the recorded parameters.
Table 4.1.1-1 Format of Data Information File
Items Description
CaptureDate Day/Month/Year of the captured data in the “DD/MM/YYYY” format.
CaptureTime Data captured time in “HH/MM/SS” format FileName Data file name Format Data format, fixed to “Float”
CaptureSample Number of samples of the recorded data [Sample]
Condition Error status of the recorded data “Normal”:Normal status “OverLoad”:Level over
TriggerPosition Trigger occurrence position [Sample] The start point of the recorded data is 0.
CenterFrequency Center frequency [Hz] SpanFrequency Frequency span [Hz] SamplingClock Sampling rate [Hz]
PreselectorBandMode Frequency band switch mode “Normal”:Normal mode (fixed)
ReferenceLevel Reference level [dBm] Note that this value does not include the reference level offset.
AttenuatorLevel Attenuator value [dB]
InternalGain Internal gain value [dB] This is an internal parameter.
PreAmp Gain value obtained by 6 GHz PreAmp [dB] IQReverse IQ reverse setting, fixed to “Normal”
TriggerSwitch Trigger On/Off setting “FreeRun”:Trigger is not used “Triggered”:Trigger is used
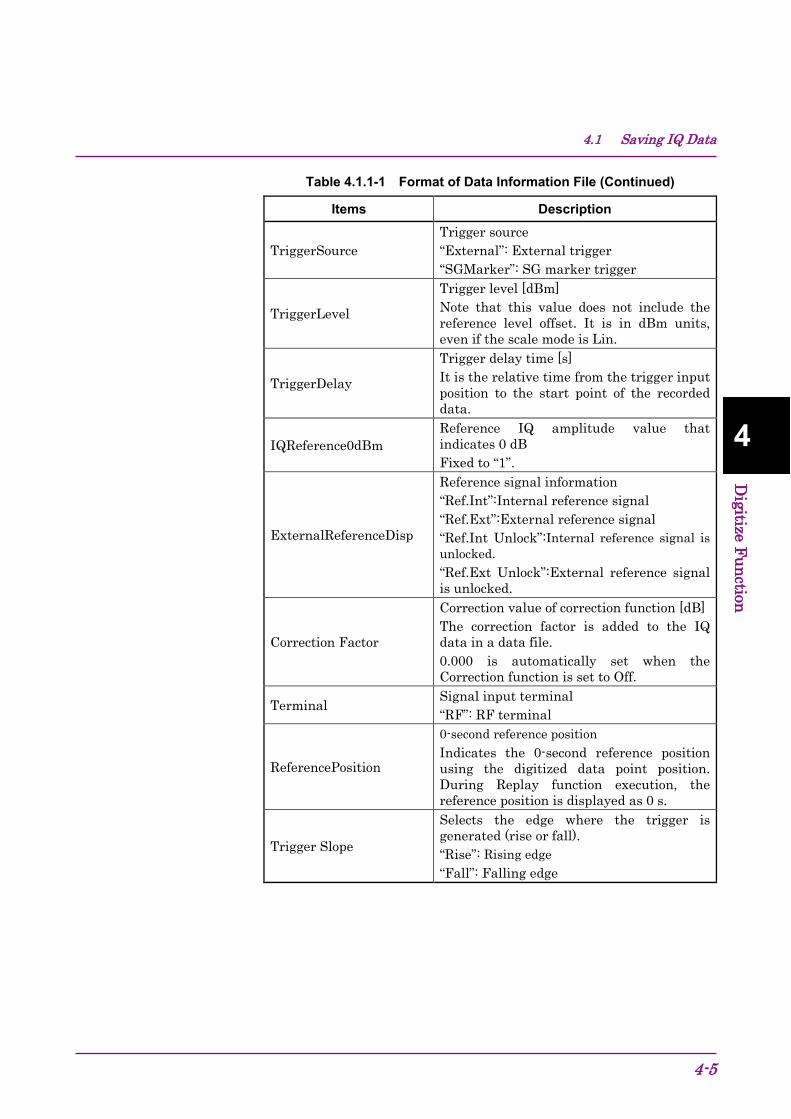
4.1 Saving IQ Data
4-5
4
Digitize Function
Table 4.1.1-1 Format of Data Information File (Continued)
Items Description
TriggerSource Trigger source “External”: External trigger “SGMarker”: SG marker trigger
TriggerLevel
Trigger level [dBm] Note that this value does not include the reference level offset. It is in dBm units, even if the scale mode is Lin.
TriggerDelay
Trigger delay time [s] It is the relative time from the trigger input position to the start point of the recorded data.
IQReference0dBm Reference IQ amplitude value that indicates 0 dB Fixed to “1”.
ExternalReferenceDisp
Reference signal information “Ref.Int”:Internal reference signal “Ref.Ext”:External reference signal “Ref.Int Unlock”:Internal reference signal is unlocked. “Ref.Ext Unlock”:External reference signal is unlocked.
Correction Factor
Correction value of correction function [dB] The correction factor is added to the IQ data in a data file. 0.000 is automatically set when the Correction function is set to Off.
Terminal Signal input terminal “RF”: RF terminal
ReferencePosition
0-second reference position Indicates the 0-second reference position using the digitized data point position. During Replay function execution, the reference position is displayed as 0 s.
Trigger Slope
Selects the edge where the trigger is generated (rise or fall). “Rise”: Rising edge “Fall”: Falling edge

Chapter 4 Digitize Function
4-6
4.1.2 Format of data file The data file is created in binary format. From the beginning of the file, I-phase data and Q-phase data are recorded by 4 bytes. The I-phase data and Q-phase data are recorded as a float type (IEEE real*4).
I-phase data 1 (4Byte) Q-phase data 1 (4Byte) I-phase data 2 (4Byte) Q-phase data 2 (4Byte) I-phase data 3 (4Byte) Q-phase data 3 (4Byte)
Figure 4.1.2-2 Format of Data File
The IQ data can be converted to power based on the following formula:
( )221010 QILogP +=
P: Power [dBm] I: I-phase data Q: Q-phase data
File Header
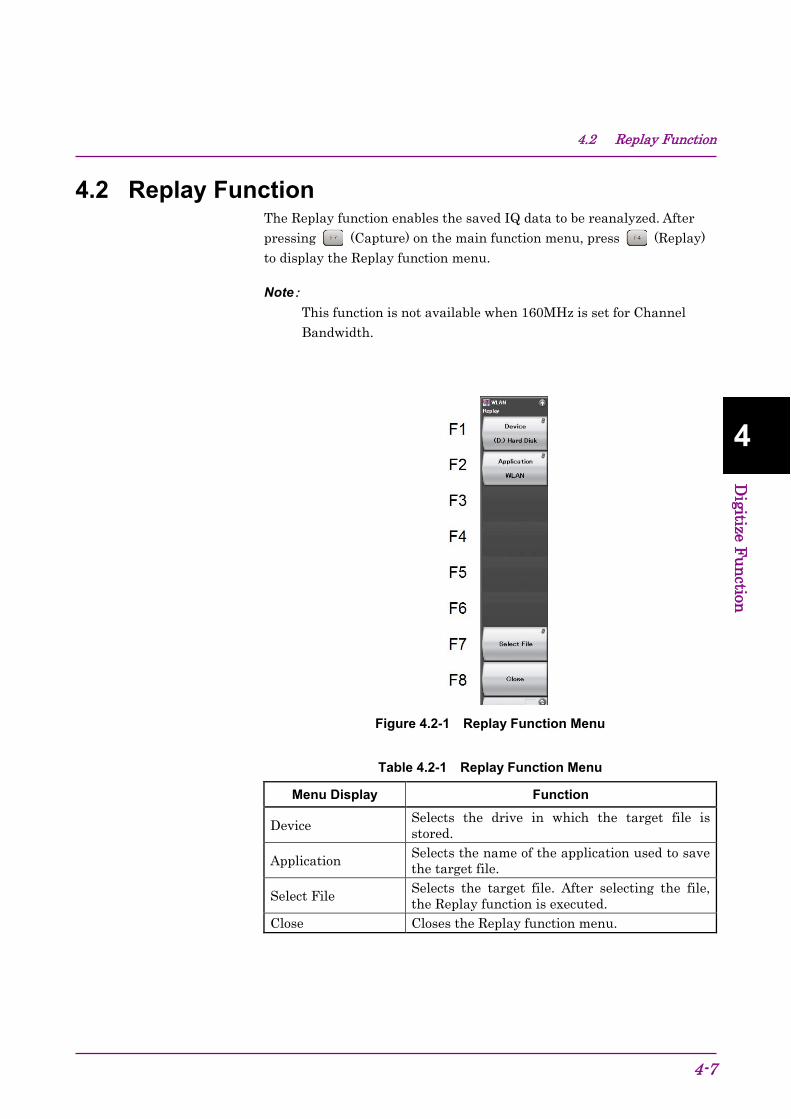
4.2 Replay Function
4-7
4
Digitize Function
4.2 Replay Function The Replay function enables the saved IQ data to be reanalyzed. After pressing (Capture) on the main function menu, press (Replay) to display the Replay function menu.
Note: This function is not available when 160MHz is set for Channel Bandwidth.
Figure 4.2-1 Replay Function Menu
Table 4.2-1 Replay Function Menu
Menu Display Function
Device Selects the drive in which the target file is stored.
Application Selects the name of the application used to save the target file.
Select File Selects the target file. After selecting the file, the Replay function is executed.
Close Closes the Replay function menu.
Chapter 4 Digitize Function
4-8
4.2.1 Starting Replay Function Start the Replay function using the following procedure:
<Procedure> 1. Press Capture ( ) on the main function menu. 2. Press Replay ( ) on the Capture function menu. 3. Press Device ( ) on the Replay function menu and select the drive
in which the target file is stored. 4. Press (Application) and select the application used to save the
target file. 5. Press (Select File) to display the file selection dialog box. The
Replay function starts after selecting a file. Then, is displayed on the screen.
Note: 1 This function is executed only for an IQ data file whose
sampling rate is 50 MHz.
2 Once Replay starts, the settings are initialized except for the parameters specified in Table 4.1.1-1.
4.2.2 Display During Replay Function Execution is displayed if the target IQ data file meets the
following conditions:
• Frequency reference is Unlocked when IQ data is saved. • Level Over occurs when IQ data is saved
4.2 Replay Function
4-9
4
Digitize Function
4.2.3 Restriction During Replay Function Execution The functions shown in Table 4.2.3-1 are disabled when Replay is executed.
Table 4.2.3-1 Functions Restricted During Replay
Function Center Frequency Input Level Pre Amp Trigger Switch Trigger Source Trigger Slope Trigger Delay Continuous Measurement Single Measurement Capture Time Auto/Manual Capture Time Length Wide IF Video Trigger Level Channel Map Channel Number Auto Range Recalling of Spectrum Analyzer using this application.
4.2.4 Conditions for IQ Data Files That Can Be Replayed Table 4.2.4-1 shows the conditions for IQ data files for which replay analysis can be performed.
Table 4.2.4-1 IQ Data File That Can Be Replayed
Items Value Format I, Q (32-bit Float Binary format) Sampling rate 50 MHz Number of samples Modulation Analysis: 130000 or more
4.2.5 Stopping Replay Stop the Replay function using the following procedure:
<Procedure> 1. Press Capture ( ) on the main function menu. 2. Press (Stop Replaying) to stop the Replay function.

Chapter 4 Digitize Function
4-10.
Chapter 5 Performance Test
5-1
5
Perform
ance Test
This chapter describes measurement devices, setup methods, and performance test procedures required for performing performance tests as preventive maintenance.
5.1 Overview of Performance Test .................................. 5-2 5.1.1 Performance test ........................................... 5-2
5.2 Performance Test Items ............................................ 5-3 5.2.1 Testing methods ............................................ 5-3

Chapter 5 Performance Test
5-2
5.1 Overview of Performance Test 5.1.1 Performance test
Performance tests are performed as part of preventive maintenance in order to prevent degradation of the performance of the main frame.
Use performance tests when required for acceptance inspection, routine inspection and performance verification after repairs. Use performance tests when necessary for acceptance inspection, routine inspection and performance verification after repairs. Also perform the following performance tests for acceptance inspection, routine inspection and performance verification after repairs of the main frame.
• Carrier frequency accuracy
• Residual vector error
Perform items deemed critical at regular intervals as preventive maintenance. A cycle for routine tests of once or twice a year is recommended.
If items that do not meet the required level are detected during performance testing, contact an Anritsu Service and Sales office. Contact information can be found on the last page of the printed version of this manual, and is available in a separate file on the CD version.
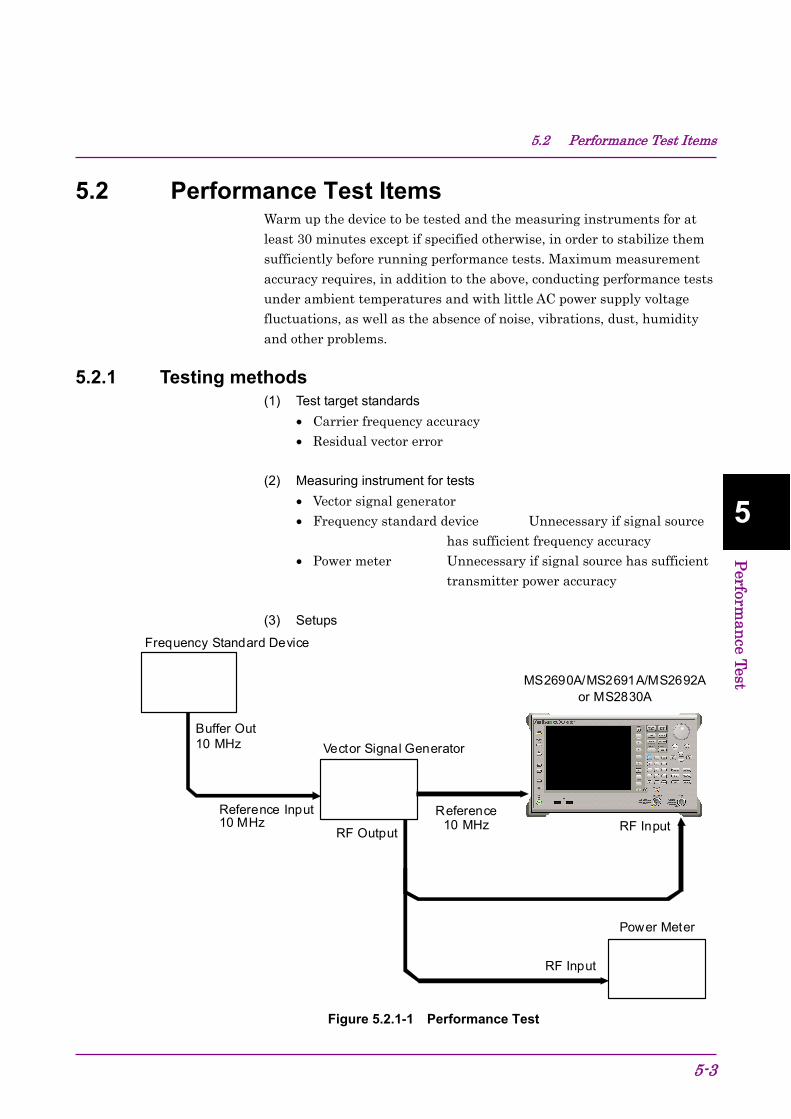
5.2 Performance Test Items
5-3
5
Perform
ance Test
5.2 Performance Test Items Warm up the device to be tested and the measuring instruments for at least 30 minutes except if specified otherwise, in order to stabilize them sufficiently before running performance tests. Maximum measurement accuracy requires, in addition to the above, conducting performance tests under ambient temperatures and with little AC power supply voltage fluctuations, as well as the absence of noise, vibrations, dust, humidity and other problems.
5.2.1 Testing methods (1) Test target standards
• Carrier frequency accuracy
• Residual vector error (2) Measuring instrument for tests
• Vector signal generator
• Frequency standard device Unnecessary if signal source has sufficient frequency accuracy
• Power meter Unnecessary if signal source has sufficient transmitter power accuracy
(3) Setups
Frequency Standard Device
Buffer Out 10 MHz
RF Input Reference Input 10 MHz
Vector Signal Generator
MS2690A/MS2691A/MS2692Aor MS2830A
RF Output
Power Meter
RF Input
Reference10 MHz
Figure 5.2.1-1 Performance Test
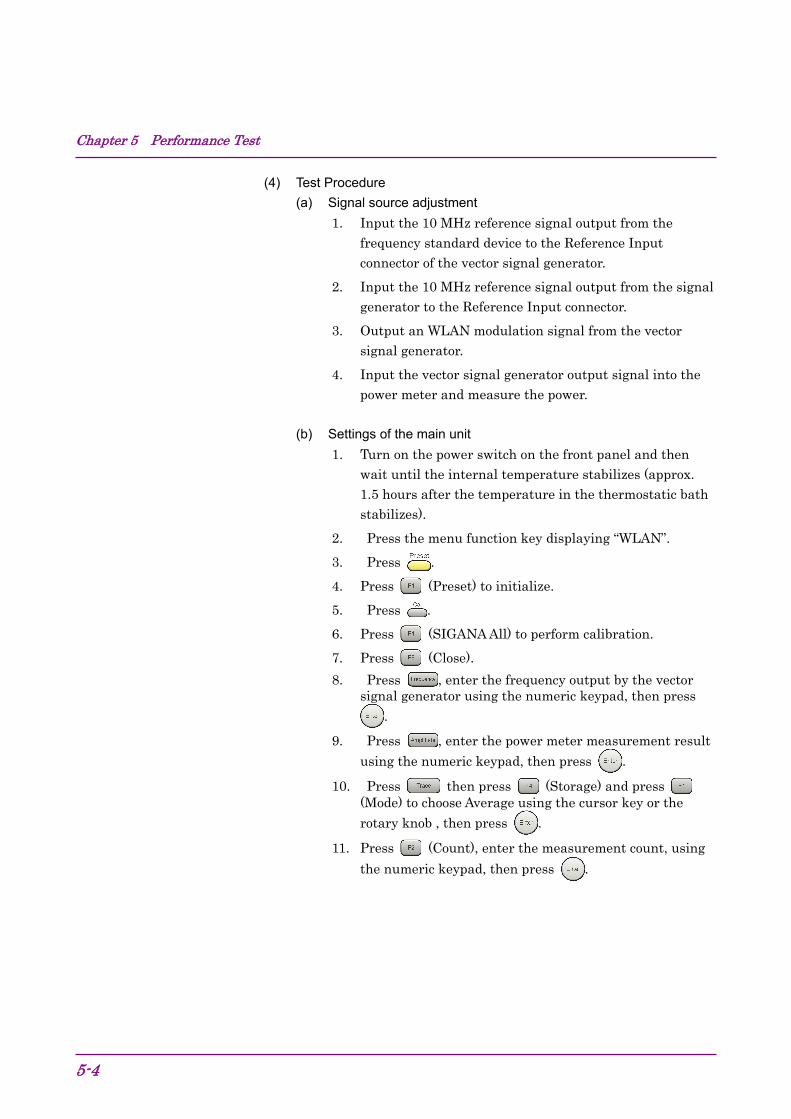
Chapter 5 Performance Test
5-4
(4) Test Procedure
(a) Signal source adjustment
1. Input the 10 MHz reference signal output from the frequency standard device to the Reference Input connector of the vector signal generator.
2. Input the 10 MHz reference signal output from the signal generator to the Reference Input connector.
3. Output an WLAN modulation signal from the vector signal generator.
4. Input the vector signal generator output signal into the power meter and measure the power.
(b) Settings of the main unit
1. Turn on the power switch on the front panel and then wait until the internal temperature stabilizes (approx. 1.5 hours after the temperature in the thermostatic bath stabilizes).
2. Press the menu function key displaying “WLAN”.
3. Press .
4. Press (Preset) to initialize.
5. Press .
6. Press (SIGANA All) to perform calibration.
7. Press (Close).
8. Press , enter the frequency output by the vector signal generator using the numeric keypad, then press
.
9. Press , enter the power meter measurement result
using the numeric keypad, then press .
10. Press then press (Storage) and press (Mode) to choose Average using the cursor key or the
rotary knob , then press .
11. Press (Count), enter the measurement count, using
the numeric keypad, then press .
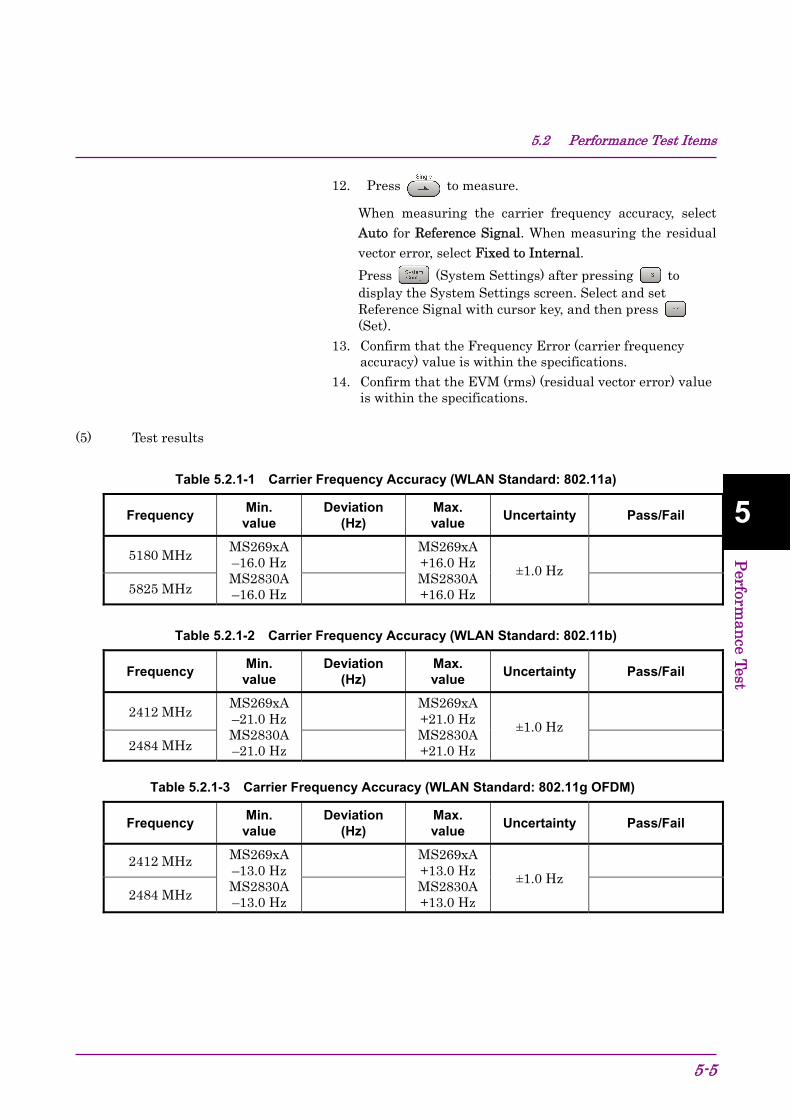
5.2 Performance Test Items
5-5
5
Perform
ance Test
12. Press to measure.
When measuring the carrier frequency accuracy, select Auto for Reference Signal. When measuring the residual vector error, select Fixed to Internal.
Press (System Settings) after pressing to display the System Settings screen. Select and set Reference Signal with cursor key, and then press (Set).
13. Confirm that the Frequency Error (carrier frequency accuracy) value is within the specifications.
14. Confirm that the EVM (rms) (residual vector error) value is within the specifications.
(5) Test results
Table 5.2.1-1 Carrier Frequency Accuracy (WLAN Standard: 802.11a)
Frequency Min. value
Deviation (Hz)
Max. value
Uncertainty Pass/Fail
5180 MHz MS269xA–16.0 Hz MS2830A–16.0 Hz
MS269xA +16.0 Hz MS2830A +16.0 Hz
±1.0 Hz
5825 MHz
Table 5.2.1-2 Carrier Frequency Accuracy (WLAN Standard: 802.11b)
Frequency Min. value
Deviation (Hz)
Max. value
Uncertainty Pass/Fail
2412 MHz MS269xA–21.0 Hz MS2830A–21.0 Hz
MS269xA +21.0 Hz MS2830A +21.0 Hz
±1.0 Hz
2484 MHz
Table 5.2.1-3 Carrier Frequency Accuracy (WLAN Standard: 802.11g OFDM)
Frequency Min. value
Deviation (Hz)
Max. value
Uncertainty Pass/Fail
2412 MHz MS269xA–13.0 Hz MS2830A–13.0 Hz
MS269xA +13.0 Hz MS2830A +13.0 Hz
±1.0 Hz
2484 MHz
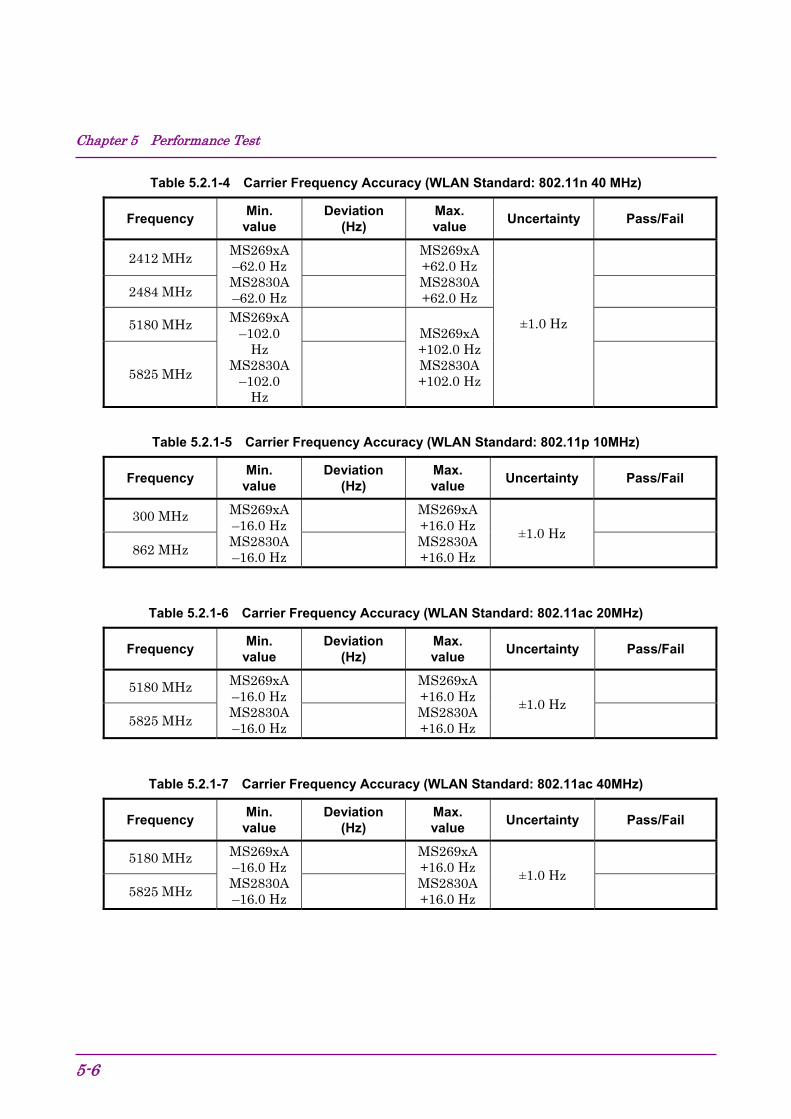
Chapter 5 Performance Test
5-6
Table 5.2.1-4 Carrier Frequency Accuracy (WLAN Standard: 802.11n 40 MHz)
Frequency Min.
value Deviation
(Hz) Max. value
Uncertainty Pass/Fail
2412 MHz MS269xA–62.0 Hz MS2830A–62.0 Hz
MS269xA +62.0 Hz MS2830A +62.0 Hz
±1.0 Hz
2484 MHz
5180 MHz MS269xA–102.0
Hz MS2830A
–102.0 Hz
MS269xA +102.0 Hz MS2830A +102.0 Hz
5825 MHz
Table 5.2.1-5 Carrier Frequency Accuracy (WLAN Standard: 802.11p 10MHz)
Frequency Min. value
Deviation (Hz)
Max. value
Uncertainty Pass/Fail
300 MHz MS269xA –16.0 Hz MS2830A –16.0 Hz
MS269xA +16.0 Hz MS2830A +16.0 Hz
±1.0 Hz
862 MHz
Table 5.2.1-6 Carrier Frequency Accuracy (WLAN Standard: 802.11ac 20MHz)
Frequency Min. value
Deviation (Hz)
Max. value
Uncertainty Pass/Fail
5180 MHz MS269xA –16.0 Hz MS2830A –16.0 Hz
MS269xA +16.0 Hz MS2830A +16.0 Hz
±1.0 Hz
5825 MHz
Table 5.2.1-7 Carrier Frequency Accuracy (WLAN Standard: 802.11ac 40MHz)
Frequency Min. value
Deviation (Hz)
Max. value
Uncertainty Pass/Fail
5180 MHz MS269xA –16.0 Hz MS2830A –16.0 Hz
MS269xA +16.0 Hz MS2830A +16.0 Hz
±1.0 Hz
5825 MHz
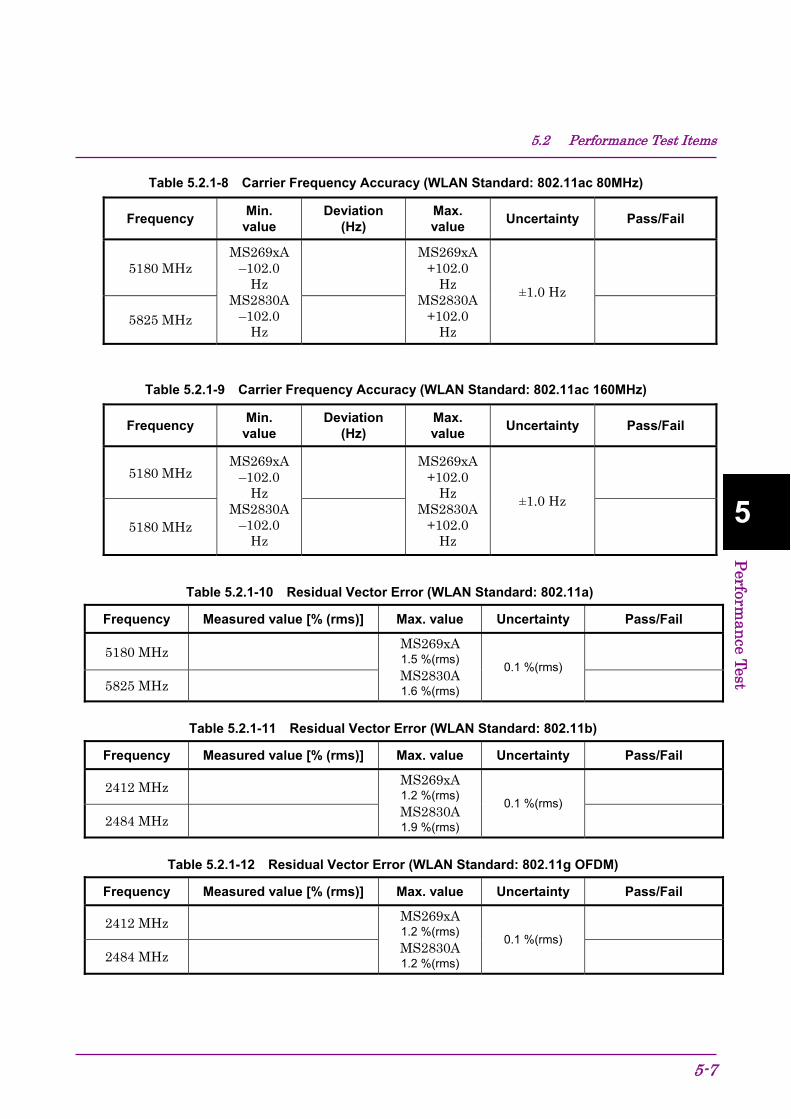
5.2 Performance Test Items
5-7
5
Perform
ance Test
Table 5.2.1-8 Carrier Frequency Accuracy (WLAN Standard: 802.11ac 80MHz)
Frequency Min. value
Deviation (Hz)
Max. value
Uncertainty Pass/Fail
5180 MHz MS269xA
–102.0 Hz
MS2830A–102.0
Hz
MS269xA
+102.0 Hz
MS2830A +102.0
Hz
±1.0 Hz
5825 MHz
Table 5.2.1-9 Carrier Frequency Accuracy (WLAN Standard: 802.11ac 160MHz)
Frequency Min. value
Deviation (Hz)
Max. value
Uncertainty Pass/Fail
5180 MHz MS269xA
–102.0 Hz
MS2830A –102.0
Hz
MS269xA
+102.0 Hz
MS2830A +102.0
Hz
±1.0 Hz
5180 MHz
Table 5.2.1-10 Residual Vector Error (WLAN Standard: 802.11a)
Frequency Measured value [% (rms)] Max. value Uncertainty Pass/Fail
5180 MHz MS269xA 1.5 %(rms) MS2830A 1.6 %(rms)
0.1 %(rms)
5825 MHz
Table 5.2.1-11 Residual Vector Error (WLAN Standard: 802.11b)
Frequency Measured value [% (rms)] Max. value Uncertainty Pass/Fail
2412 MHz MS269xA 1.2 %(rms) MS2830A 1.9 %(rms)
0.1 %(rms)
2484 MHz
Table 5.2.1-12 Residual Vector Error (WLAN Standard: 802.11g OFDM)
Frequency Measured value [% (rms)] Max. value Uncertainty Pass/Fail
2412 MHz MS269xA 1.2 %(rms) MS2830A 1.2 %(rms)
0.1 %(rms)
2484 MHz
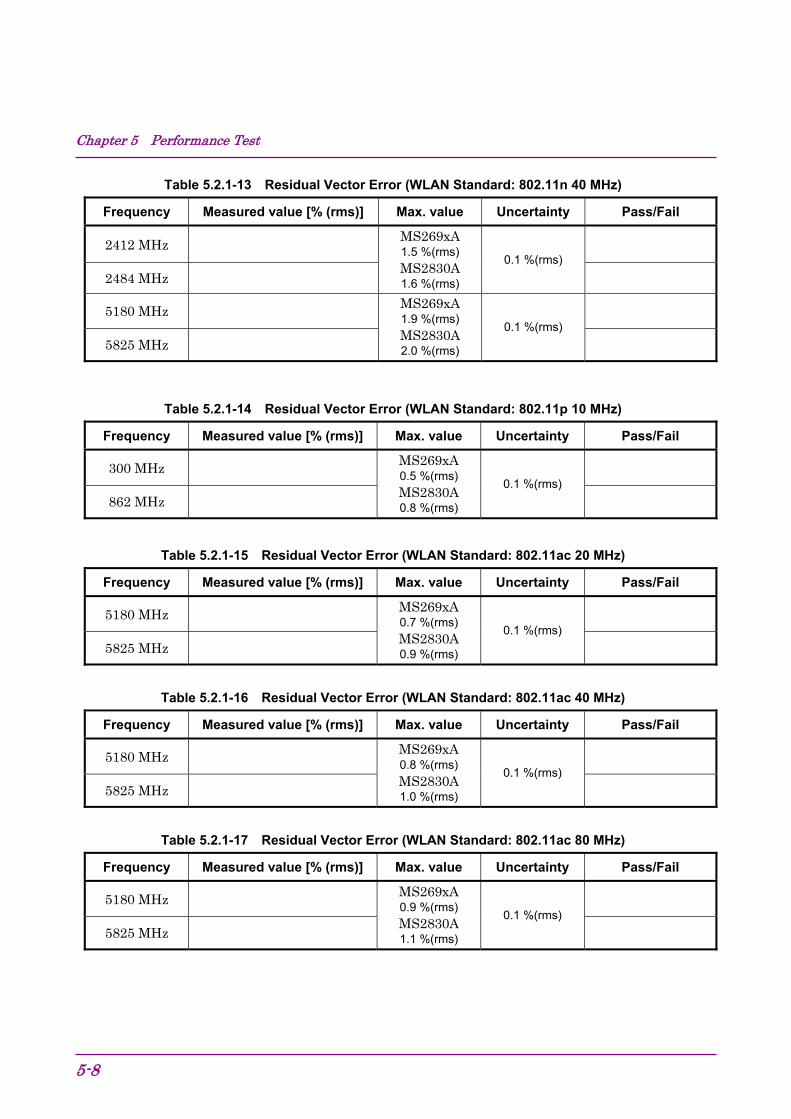
Chapter 5 Performance Test
5-8
Table 5.2.1-13 Residual Vector Error (WLAN Standard: 802.11n 40 MHz)
Frequency Measured value [% (rms)] Max. value Uncertainty Pass/Fail
2412 MHz MS269xA 1.5 %(rms) MS2830A 1.6 %(rms)
0.1 %(rms)
2484 MHz
5180 MHz MS269xA 1.9 %(rms) MS2830A 2.0 %(rms)
0.1 %(rms)
5825 MHz
Table 5.2.1-14 Residual Vector Error (WLAN Standard: 802.11p 10 MHz)
Frequency Measured value [% (rms)] Max. value Uncertainty Pass/Fail
300 MHz MS269xA 0.5 %(rms) MS2830A 0.8 %(rms)
0.1 %(rms)
862 MHz
Table 5.2.1-15 Residual Vector Error (WLAN Standard: 802.11ac 20 MHz)
Frequency Measured value [% (rms)] Max. value Uncertainty Pass/Fail
5180 MHz MS269xA 0.7 %(rms) MS2830A 0.9 %(rms)
0.1 %(rms)
5825 MHz
Table 5.2.1-16 Residual Vector Error (WLAN Standard: 802.11ac 40 MHz)
Frequency Measured value [% (rms)] Max. value Uncertainty Pass/Fail
5180 MHz MS269xA 0.8 %(rms) MS2830A 1.0 %(rms)
0.1 %(rms)
5825 MHz
Table 5.2.1-17 Residual Vector Error (WLAN Standard: 802.11ac 80 MHz)
Frequency Measured value [% (rms)] Max. value Uncertainty Pass/Fail
5180 MHz MS269xA 0.9 %(rms) MS2830A 1.1 %(rms)
0.1 %(rms)
5825 MHz
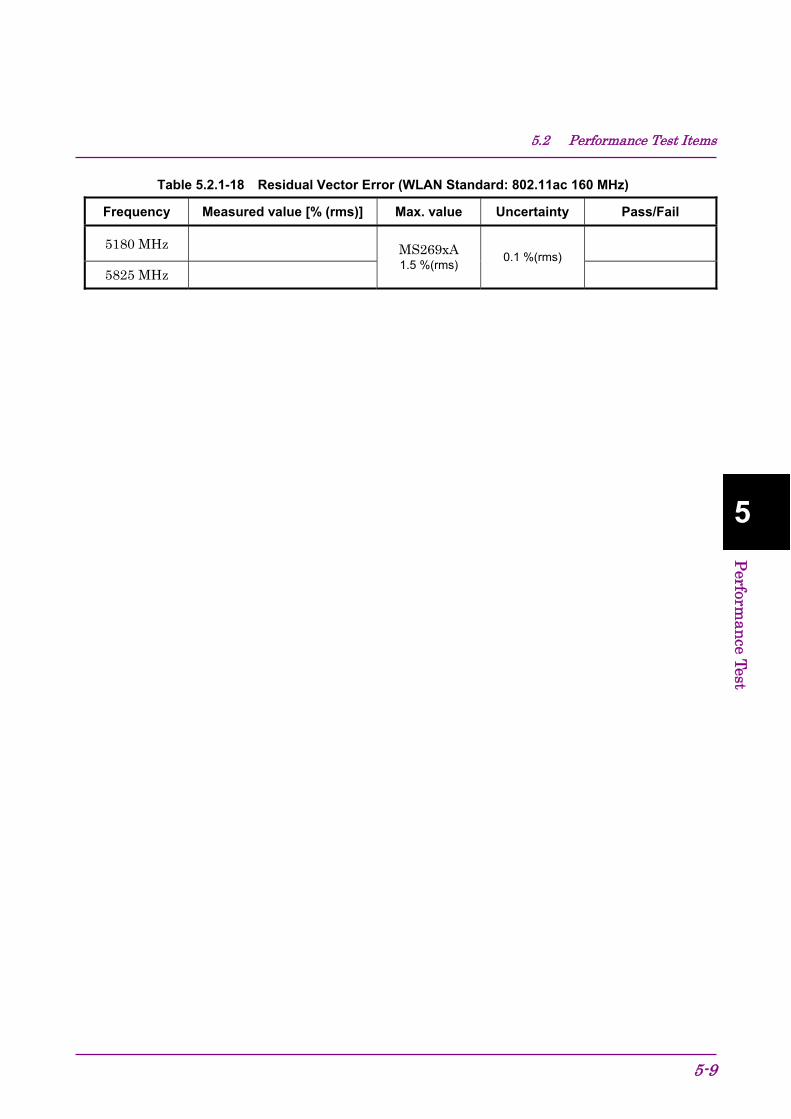
5.2 Performance Test Items
5-9
5
Perform
ance Test
Table 5.2.1-18 Residual Vector Error (WLAN Standard: 802.11ac 160 MHz)
Frequency Measured value [% (rms)] Max. value Uncertainty Pass/Fail
5180 MHz MS269xA 1.5 %(rms)
0.1 %(rms)
5825 MHz

Chapter 5 Performance Test
5-10.

Chapter 6 Other Functions
6-1
6
Oth
er Fu
nction
s
This chapter describes other functions of this application.
6.1 Selecting Other Functions ......................................... 6-2 6.2 Setting Title ................................................................ 6-2 6.3 Erasing Warmup Message ........................................ 6-2
Chapter 6 Other Functions
6-2.
6.1 Selecting Other Functions Pressing (Accessory) on the main function menu displays the Accessory function menu.
Table 6.1-1 Accessory function menu
Function Keys
Menu Display Function
F1 Title Sets the title character string.
F2 Title (On/Off) Displays (On) or hides (Off) the title character string.
F4 Erase Warm Up Message
Erases the warmup message display.
6.2 Setting Title A title of up to 32 characters can be displayed on the screen. (Character strings of up to 17 characters can be displayed on a function menu. The maximum number of characters to be displayed on the top of the function menu varies according to character string.)
<Procedure>
1. Press (Accessory) on the main function menu.
2. Press (Title) to display the character string input screen. Select
a character using the rotary knob, and enter it by pressing .
Enter the title by repeating this operation. When the title is entered,
press (Set).
3. Press (Title) and then select “Off ” to hide the title.
6.3 Erasing Warmup Message The warmup message ( ), which is displayed upon power-on and indicates that the level and frequency are not stable, can be deleted.
<Procedure>
1. Press (Accessory) on the main function menu.
2. Press (Erase Warm Up Message) to erase the warmup message.
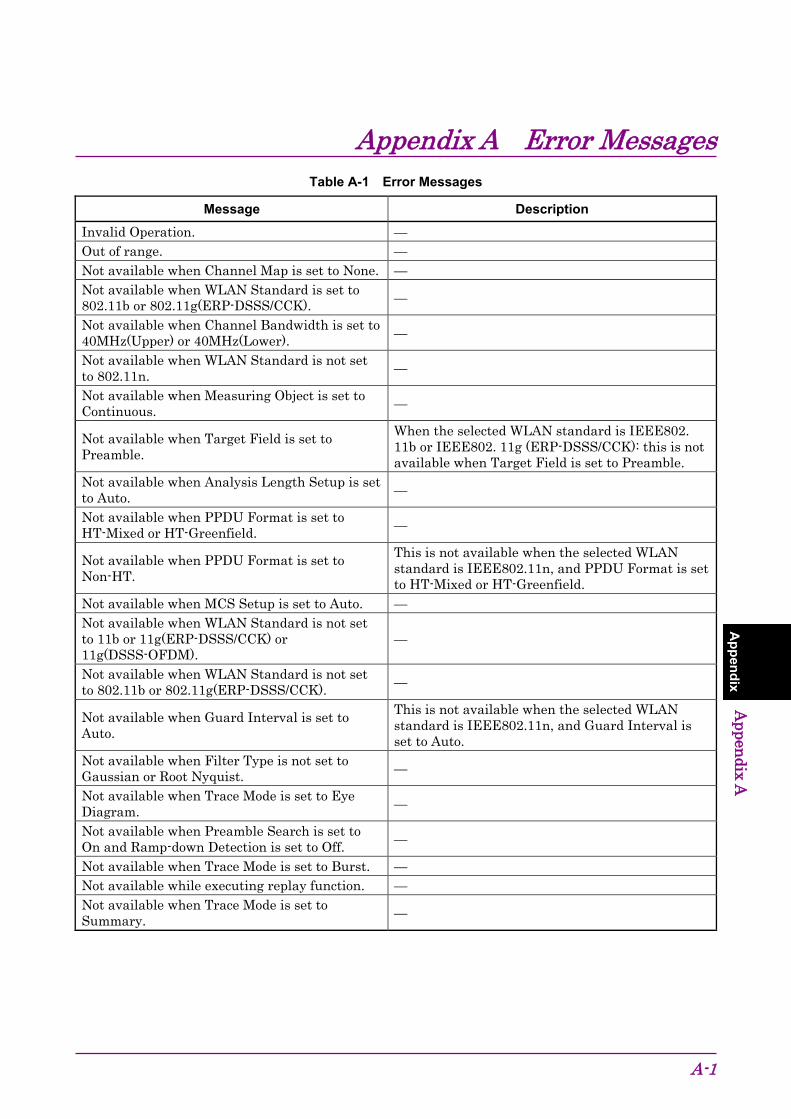
Appendix A Error Messages
A-1
Appendix
Appendix A
Table A-1 Error Messages
Message Description Invalid Operation. — Out of range. — Not available when Channel Map is set to None. — Not available when WLAN Standard is set to 802.11b or 802.11g(ERP-DSSS/CCK). —
Not available when Channel Bandwidth is set to 40MHz(Upper) or 40MHz(Lower). —
Not available when WLAN Standard is not set to 802.11n. —
Not available when Measuring Object is set to Continuous. —
Not available when Target Field is set to Preamble.
When the selected WLAN standard is IEEE802. 11b or IEEE802. 11g (ERP-DSSS/CCK): this is not available when Target Field is set to Preamble.
Not available when Analysis Length Setup is set to Auto. —
Not available when PPDU Format is set to HT-Mixed or HT-Greenfield. —
Not available when PPDU Format is set to Non-HT.
This is not available when the selected WLAN standard is IEEE802.11n, and PPDU Format is set to HT-Mixed or HT-Greenfield.
Not available when MCS Setup is set to Auto. — Not available when WLAN Standard is not set to 11b or 11g(ERP-DSSS/CCK) or 11g(DSSS-OFDM).
—
Not available when WLAN Standard is not set to 802.11b or 802.11g(ERP-DSSS/CCK). —
Not available when Guard Interval is set to Auto.
This is not available when the selected WLAN standard is IEEE802.11n, and Guard Interval is set to Auto.
Not available when Filter Type is not set to Gaussian or Root Nyquist. —
Not available when Trace Mode is set to Eye Diagram. —
Not available when Preamble Search is set to On and Ramp-down Detection is set to Off. —
Not available when Trace Mode is set to Burst. — Not available while executing replay function. — Not available when Trace Mode is set to Summary. —
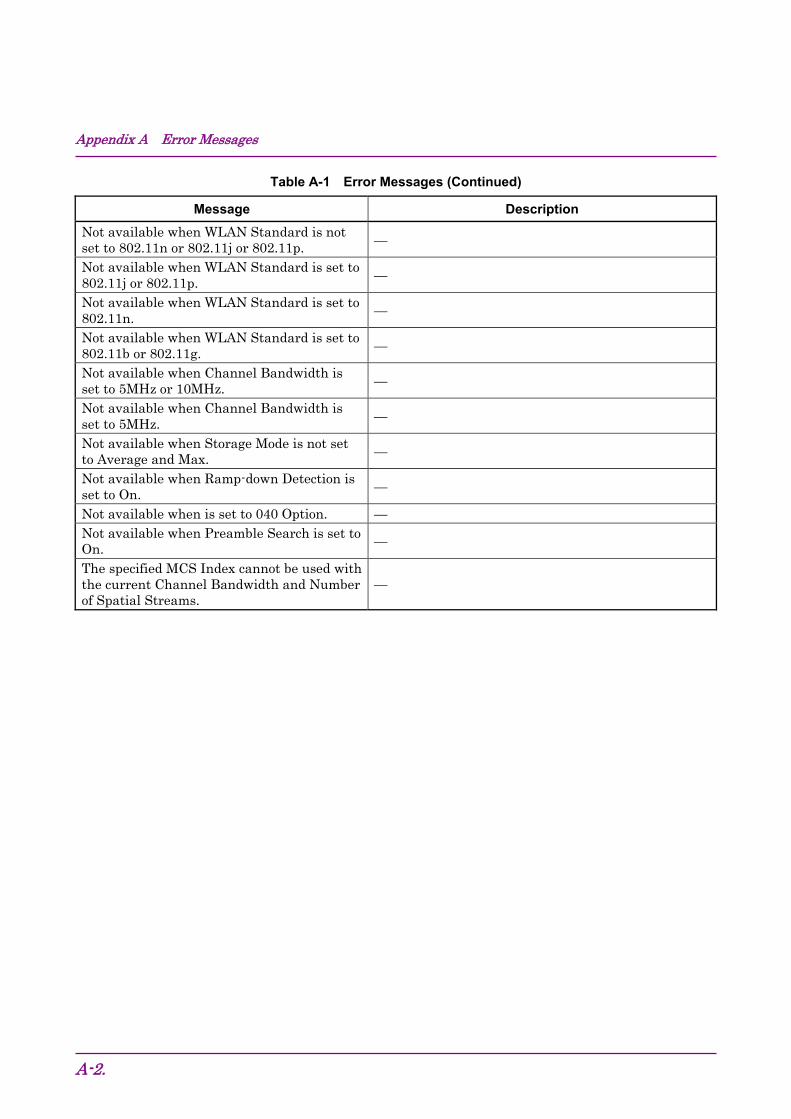
Appendix A Error Messages
A-2.
Table A-1 Error Messages (Continued)
Message Description Not available when WLAN Standard is not set to 802.11n or 802.11j or 802.11p. —
Not available when WLAN Standard is set to 802.11j or 802.11p. —
Not available when WLAN Standard is set to 802.11n. —
Not available when WLAN Standard is set to 802.11b or 802.11g. —
Not available when Channel Bandwidth is set to 5MHz or 10MHz. —
Not available when Channel Bandwidth is set to 5MHz. —
Not available when Storage Mode is not set to Average and Max. —
Not available when Ramp-down Detection is set to On. —
Not available when is set to 040 Option. — Not available when Preamble Search is set to On. —
The specified MCS Index cannot be used with the current Channel Bandwidth and Number of Spatial Streams.
—
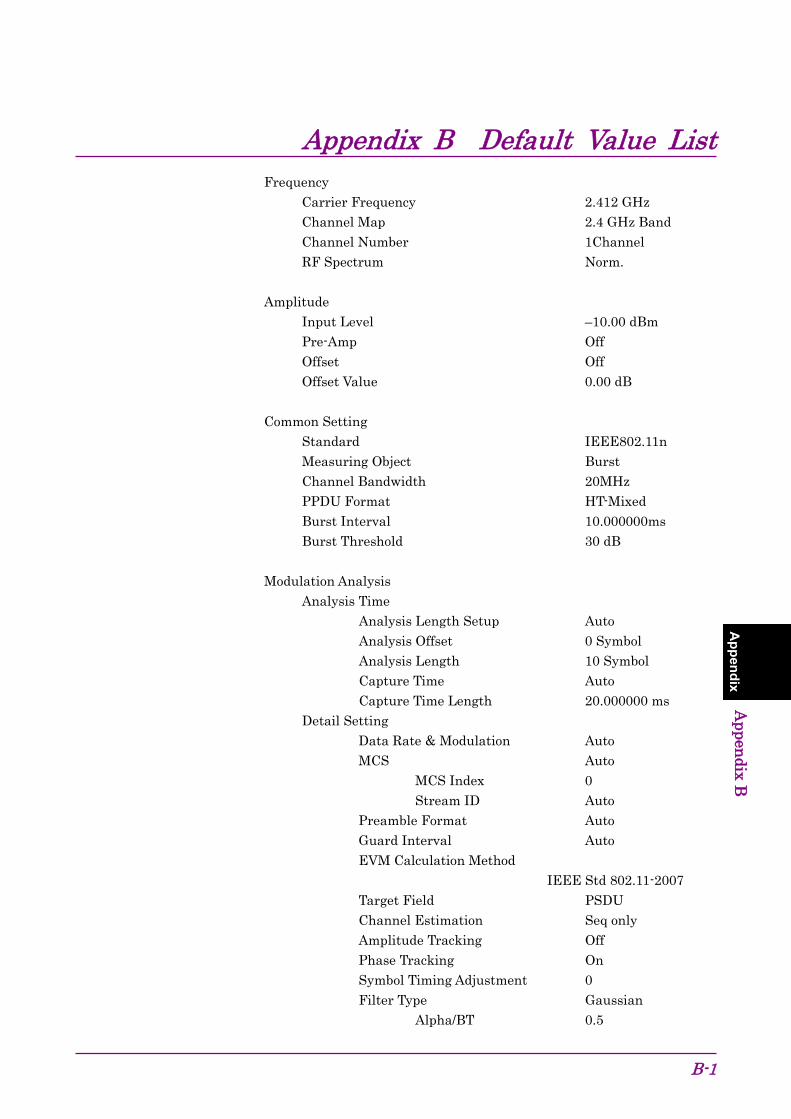
Appendix B Default Value List
B-1
Appendix
Appendix B
Frequency Carrier Frequency 2.412 GHz Channel Map 2.4 GHz Band Channel Number 1Channel RF Spectrum Norm. Amplitude Input Level –10.00 dBm Pre-Amp Off Offset Off Offset Value 0.00 dB Common Setting Standard IEEE802.11n Measuring Object Burst Channel Bandwidth 20MHz PPDU Format HT-Mixed Burst Interval 10.000000ms Burst Threshold 30 dB Modulation Analysis Analysis Time
Analysis Length Setup Auto Analysis Offset 0 Symbol Analysis Length 10 Symbol Capture Time Auto Capture Time Length 20.000000 ms
Detail Setting Data Rate & Modulation Auto MCS Auto MCS Index 0 Stream ID Auto Preamble Format Auto Guard Interval Auto EVM Calculation Method
IEEE Std 802.11-2007 Target Field PSDU Channel Estimation Seq only Amplitude Tracking Off Phase Tracking On Symbol Timing Adjustment 0 Filter Type Gaussian Alpha/BT 0.5
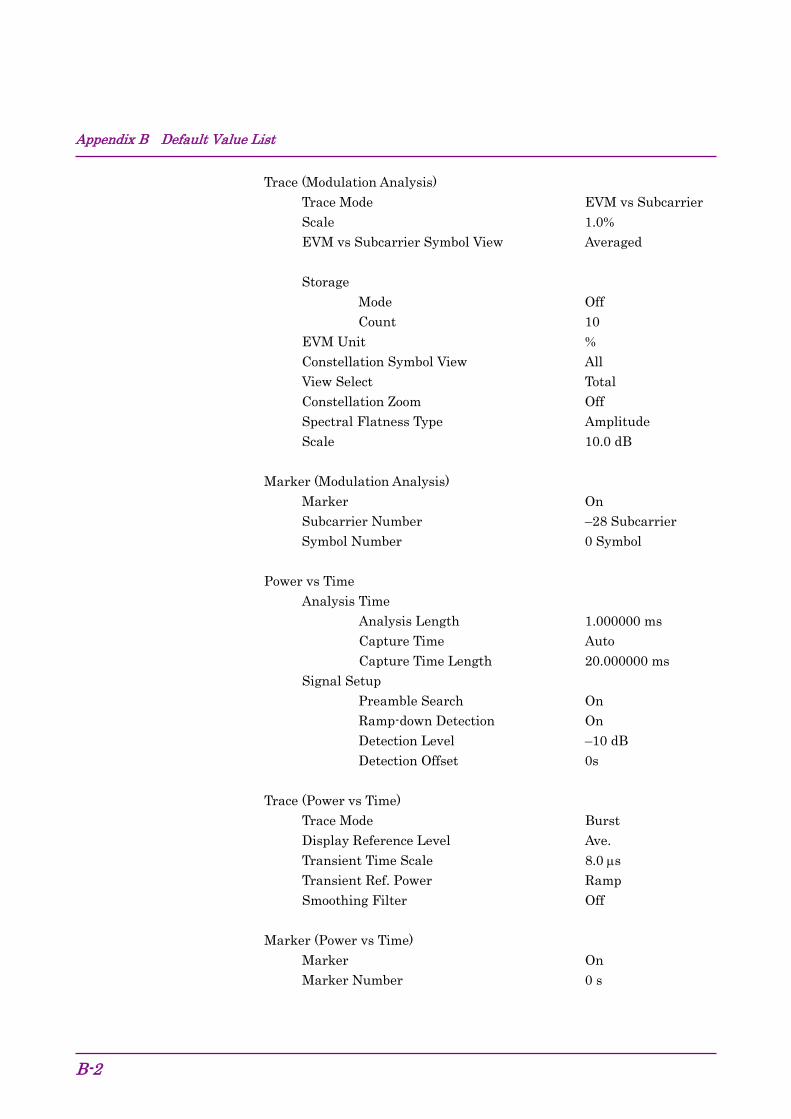
Appendix B Default Value List
B-2
Trace (Modulation Analysis) Trace Mode EVM vs Subcarrier Scale 1.0% EVM vs Subcarrier Symbol View Averaged Storage Mode Off Count 10 EVM Unit % Constellation Symbol View All View Select Total Constellation Zoom Off Spectral Flatness Type Amplitude Scale 10.0 dB Marker (Modulation Analysis) Marker On Subcarrier Number –28 Subcarrier
Symbol Number 0 Symbol
Power vs Time Analysis Time
Analysis Length 1.000000 ms Capture Time Auto Capture Time Length 20.000000 ms
Signal Setup Preamble Search On Ramp-down Detection On Detection Level –10 dB Detection Offset 0s Trace (Power vs Time) Trace Mode Burst Display Reference Level Ave. Transient Time Scale 8.0 µs Transient Ref. Power Ramp Smoothing Filter Off Marker (Power vs Time) Marker On Marker Number 0 s
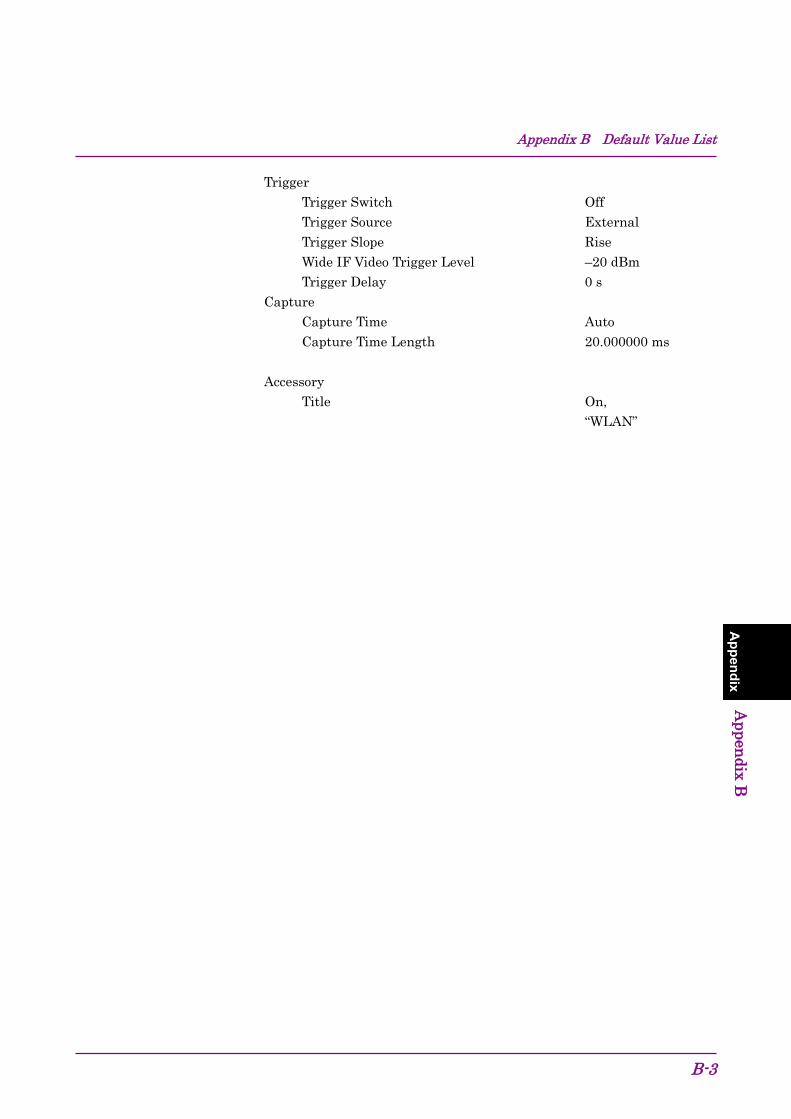
Appendix B Default Value List
B-3
Appendix
Appendix B
Trigger Trigger Switch Off Trigger Source External Trigger Slope Rise Wide IF Video Trigger Level –20 dBm Trigger Delay 0 s Capture Capture Time Auto Capture Time Length 20.000000 ms Accessory
Title On, “WLAN”

Appendix B Default Value List
B-4.
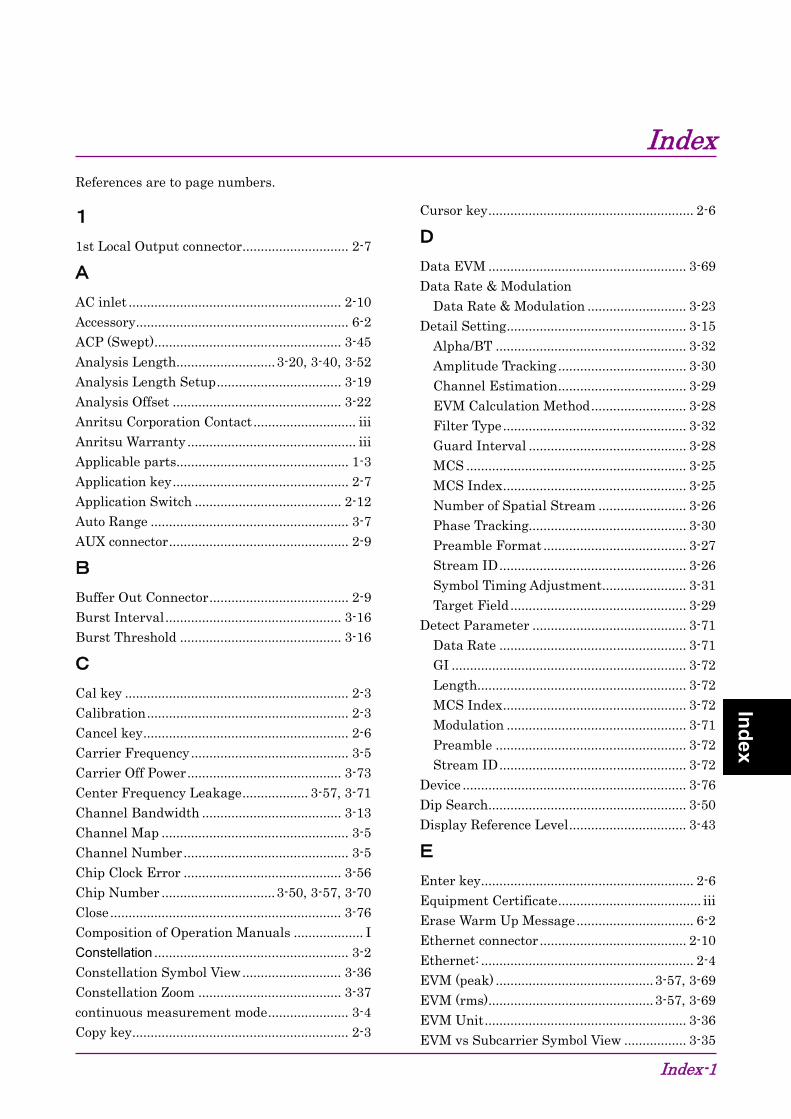
Index
Index-1
Index
References are to page numbers.
1 1st Local Output connector ............................. 2-7
A AC inlet .......................................................... 2-10 Accessory .......................................................... 6-2 ACP (Swept) ................................................... 3-45 Analysis Length ........................... 3-20, 3-40, 3-52 Analysis Length Setup .................................. 3-19 Analysis Offset .............................................. 3-22 Anritsu Corporation Contact ............................ iii Anritsu Warranty .............................................. iii Applicable parts............................................... 1-3 Application key ................................................ 2-7 Application Switch ........................................ 2-12 Auto Range ...................................................... 3-7 AUX connector ................................................. 2-9
B Buffer Out Connector ...................................... 2-9 Burst Interval ................................................ 3-16 Burst Threshold ............................................ 3-16
C Cal key ............................................................. 2-3 Calibration ....................................................... 2-3 Cancel key ........................................................ 2-6 Carrier Frequency ........................................... 3-5 Carrier Off Power .......................................... 3-73 Center Frequency Leakage .................. 3-57, 3-71 Channel Bandwidth ...................................... 3-13 Channel Map ................................................... 3-5 Channel Number ............................................. 3-5 Chip Clock Error ........................................... 3-56 Chip Number ............................... 3-50, 3-57, 3-70 Close ............................................................... 3-76 Composition of Operation Manuals ................... I Constellation ..................................................... 3-2 Constellation Symbol View ........................... 3-36 Constellation Zoom ....................................... 3-37 continuous measurement mode ...................... 3-4 Copy key ........................................................... 2-3
Cursor key ........................................................ 2-6
D Data EVM ...................................................... 3-69 Data Rate & Modulation
Data Rate & Modulation ........................... 3-23 Detail Setting ................................................. 3-15
Alpha/BT .................................................... 3-32 Amplitude Tracking ................................... 3-30 Channel Estimation ................................... 3-29 EVM Calculation Method .......................... 3-28 Filter Type .................................................. 3-32 Guard Interval ........................................... 3-28 MCS ............................................................ 3-25 MCS Index .................................................. 3-25 Number of Spatial Stream ........................ 3-26 Phase Tracking........................................... 3-30 Preamble Format ....................................... 3-27 Stream ID ................................................... 3-26 Symbol Timing Adjustment ....................... 3-31 Target Field ................................................ 3-29
Detect Parameter .......................................... 3-71 Data Rate ................................................... 3-71 GI ................................................................ 3-72 Length......................................................... 3-72 MCS Index .................................................. 3-72 Modulation ................................................. 3-71 Preamble .................................................... 3-72 Stream ID ................................................... 3-72
Device ............................................................. 3-76 Dip Search ...................................................... 3-50 Display Reference Level ................................ 3-43
E Enter key .......................................................... 2-6 Equipment Certificate ....................................... iii Erase Warm Up Message ................................ 6-2 Ethernet connector ........................................ 2-10 Ethernet: .......................................................... 2-4 EVM (peak) ........................................... 3-57, 3-69 EVM (rms) ............................................. 3-57, 3-69 EVM Unit ....................................................... 3-36 EVM vs Subcarrier Symbol View ................. 3-35
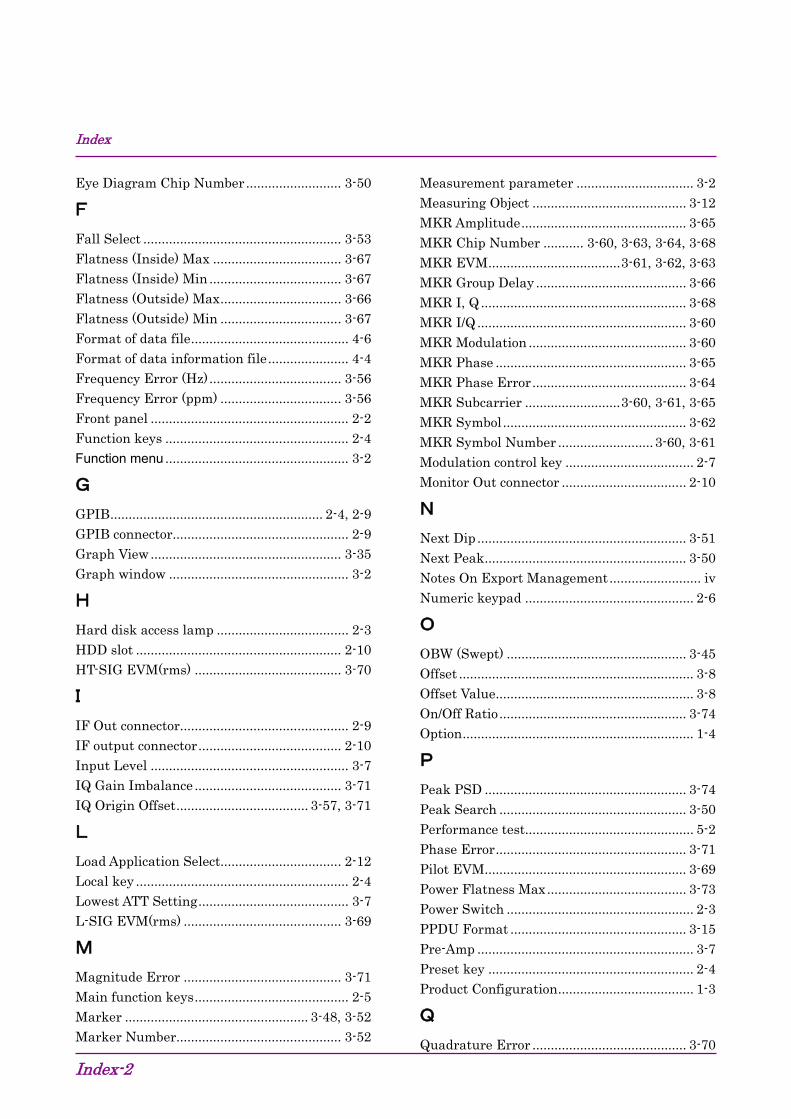
Index
Index-2
Eye Diagram Chip Number .......................... 3-50
F Fall Select ...................................................... 3-53 Flatness (Inside) Max ................................... 3-67 Flatness (Inside) Min .................................... 3-67 Flatness (Outside) Max ................................. 3-66 Flatness (Outside) Min ................................. 3-67 Format of data file ........................................... 4-6 Format of data information file ...................... 4-4 Frequency Error (Hz) .................................... 3-56 Frequency Error (ppm) ................................. 3-56 Front panel ...................................................... 2-2 Function keys .................................................. 2-4 Function menu .................................................. 3-2
G GPIB .......................................................... 2-4, 2-9 GPIB connector ................................................ 2-9 Graph View .................................................... 3-35 Graph window ................................................. 3-2
H Hard disk access lamp .................................... 2-3 HDD slot ........................................................ 2-10 HT-SIG EVM(rms) ........................................ 3-70
I IF Out connector .............................................. 2-9 IF output connector ....................................... 2-10 Input Level ...................................................... 3-7 IQ Gain Imbalance ........................................ 3-71 IQ Origin Offset .................................... 3-57, 3-71
L Load Application Select................................. 2-12 Local key .......................................................... 2-4 Lowest ATT Setting ......................................... 3-7 L-SIG EVM(rms) ........................................... 3-69
M Magnitude Error ........................................... 3-71 Main function keys .......................................... 2-5 Marker .................................................. 3-48, 3-52 Marker Number ............................................. 3-52
Measurement parameter ................................ 3-2 Measuring Object .......................................... 3-12 MKR Amplitude ............................................. 3-65 MKR Chip Number ........... 3-60, 3-63, 3-64, 3-68 MKR EVM .................................... 3-61, 3-62, 3-63 MKR Group Delay ......................................... 3-66 MKR I, Q ........................................................ 3-68 MKR I/Q ......................................................... 3-60 MKR Modulation ........................................... 3-60 MKR Phase .................................................... 3-65 MKR Phase Error .......................................... 3-64 MKR Subcarrier .......................... 3-60, 3-61, 3-65 MKR Symbol .................................................. 3-62 MKR Symbol Number .......................... 3-60, 3-61 Modulation control key ................................... 2-7 Monitor Out connector .................................. 2-10
N Next Dip ......................................................... 3-51 Next Peak ....................................................... 3-50 Notes On Export Management ......................... iv Numeric keypad .............................................. 2-6
O OBW (Swept) ................................................. 3-45 Offset ................................................................ 3-8 Offset Value ...................................................... 3-8 On/Off Ratio ................................................... 3-74 Option ............................................................... 1-4
P Peak PSD ....................................................... 3-74 Peak Search ................................................... 3-50 Performance test.............................................. 5-2 Phase Error .................................................... 3-71 Pilot EVM ....................................................... 3-69 Power Flatness Max ...................................... 3-73 Power Switch ................................................... 2-3 PPDU Format ................................................ 3-15 Pre-Amp ........................................................... 3-7 Preset key ........................................................ 2-4 Product Configuration ..................................... 1-3
Q Quadrature Error .......................................... 3-70
Index
Index-3
Index
R Rear panel ........................................................ 2-8 Recall key ......................................................... 2-3 Ref Input connector ......................................... 2-9 reference frequency signal .............................. 2-9 Remote lamp .................................................... 2-4 Replay Function .............................................. 4-7 Result window ................................................... 3-2 RF Input connector ......................................... 2-6 RF Output connector ....................................... 2-7 RF Output Control key ................................... 2-6 RF Spectrum .................................................... 3-6 Rise Select ...................................................... 3-52 Rotary knob ..................................................... 2-6
S SA Trigger Input connector........................... 2-10 Save All Results ............................................. 3-76 Save as Type .................................................. 3-76 Save key ........................................................... 2-3 Saving IQ Data ................................................ 4-2 Scale
EVM Scale .................................................. 3-34 Flatness Scale ............................................ 3-35 Phase Error vs Chip .................................. 3-35
SG Trigger Input connector .......................... 2-10 Shift key ........................................................... 2-6 SIG EVM(rms) ............................................... 3-69 Signal Setup .................................................. 3-41
Detection Level .......................................... 3-42 Detection Offset ......................................... 3-42 Preamble Search ........................................ 3-41 Ramp-down Detection ............................... 3-42
single measurement mode .............................. 3-4 Smoothing Filter ........................................... 3-44 Software End-User License Agreement (EULA)
.......................................................................... v Specifications ................................................... 1-5 Spectral Flatness Type .................................. 3-37 Spectrum Emission Mask (Swept) ............... 3-46 Spurious Emission (Swept) ........................... 3-47 Standard ........................................................ 3-12 Status ............................................................... 3-2 Status message ................................................ 3-2
Storage ........................................................... 3-36 Count .......................................................... 3-36 Mode ........................................................... 3-36
Subcarrier Number ..................... 3-49, 3-57, 3-70 Sweep Status Out connector ........................... 2-9 Symbol Clock Error ....................................... 3-56 Symbol Number ........................... 3-49, 3-57, 3-70
T Time Offset..................................................... 3-58 Title .................................................................. 6-2 Title (On/Off) ................................................... 6-2 Trace Mode ................................... 3-34, 3-39, 3-43 Transient Ref. Power ..................................... 3-44 Transient Time .............................................. 3-74
Power-down Ramp ......... 3-43, 3-44, 3-52, 3-74 Power-on Ramp .......................................... 3-74
Transient Time Scale .................................... 3-44 Transmit Power .................................... 3-57, 3-73 Trigger Delay ................................................. 3-55 Trigger Input connector .................................. 2-9 trigger signal ........................................... 2-9, 2-11 Trigger Slope .................................................. 3-54 Trigger Source ................................................ 3-54 Trigger Switch ............................................... 3-54
U USB connector ................................................. 2-7
Type A ......................................................... 2-10 Type B ........................................................... 2-9
V VHT-SIG-A EVM(rms) .................................. 3-70 VHT-SIG-B EVM(rms) .................................. 3-70 View Select ..................................................... 3-37
W Wide IF Video Trigger Level ......................... 3-54

Index
Index-4 .


