Annual - TES
100
Annual report 10 People for energy . Energy for future. Future for people.
Transcript of Annual - TES

Ann
ual
repo
rt
10 People for energy.Energy for future.
Future for people.

2
AN
NU
AL
RE
PO
RT
20
10
Ter
moe
lekt
rarn
a Šo
štan
j


4
AN
NU
AL
RE
PO
RT
20
10
Ter
moe
lekt
rarn
a Šo
štan
j

ReliabilitySafety
AvailabilityQuality
DeterminationDevelopment
Knowledge


Lett
er fr
om th
e M
anag
ing D
irect
or
In the maintenance of our equipment
we are tr ying to be better ever y day.
The benchmark of our own progress
is how we help others and how we
contribute ideas. We tr y to inspire
more people to do the same – to be
better ever y day..

8
AN
NU
AL
RE
PO
RT
20
10
Ter
moe
lekt
rarn
a Šo
štan
j

Esteemed colleagues!2010 will be remembered by intensive preparations for the beginning of
construction of replacement Unit 6. After a thorough review of the project, the
European Bank for Reconstruction and Development (EBRD) confirmed that
the replacement Unit 6 is technologically, environmentally and economically
suitable and justified, which was the precondition for approval and provision
of a loan in the amount of EUR 110 million. This highly energy efficient project
will enable us to decrease emissions and consumption of coal after 2014 and, in
turn, further increase our operating efficiency.
The construction of Unit 6 does not only follow TEŠ’s interests; it also consid-
ers the positive effects on the environment in which we operate and live.
Continued production of electricity also means preservation of more than
3,000 jobs in the wider area. Today, more than ever, we can claim that it would
be difficult to find an alternative for the replacement Unit 6, which will generate
up to one third of electricity consumed in Slovenia and ensure safety as well as
independence of the Slovenian energy system. The natural resources available
in Slovenia are limited, while environmental placement is a long-lasting and
frequently unsuccessful process.
The 2010 financial year was successful. Results presented in this report were
made possible by all TEŠ’s employees. Without their commitment and account-
ability such results would be difficult to achieve. In 2010, we generated 3,946
GWh of energy with revenue reaching EUR 242,009,537. Ambitious plans have
also been set for the coming year. Next to standard operations, the key projects
will include the overhauls of Unit 5 and gas turbine, and the beginning of con-
struction work involving the new Unit 6.
The years until the construction of Unit 6 will require additional efforts from
all of us, which will include significant substantive, organisational and logistic
challenges. The contributions of each and every employee will be extremely
important and valuable for this project and I am confident that willpower,
determination and positive attitude can make us achieve all the goals we have
set for our company.
Simon Tot, MSc
M a n a g i n g D i r e c t o r

10
A
NN
UA
L R
EP
OR
T 2
01
0 T
erm
oele
ktra
rna
Šošt
anj
Table of Contents Letter from the Managing Director 71 Introduction 151.1 INTRODUCTION 17
1.2 REPORT OF THE SUPERVISORY BOARD 18
2 Operating highlights in 2010 233 Timeline of Significant developments 294 Business Report 354.1 PRESENTATION OF THE COMPANY 36
4.1.1 Company profile 36
4.1.2 Company’s business activities 37
4.1.3 Corporate governance statement 37
4.1.4 Statement by the Managing Director 37
4.1.5 Statement by the Managing Director (II) 37
4.1.6 Relations with the controlling company and other subsidiaries in the group 38
4.1.7 Ownership links with other companies 39
4.2 COMPANY’S BUSINESS POLICY 39
4.3 MANAGEMENT SYSTEM POLICY 39
4.3.1 Achievement of objectives in the area of quality, environmental management,
occupational safety and health, and information security 39
4.3.2 Occupational safety and health and fire safety 40
4.4 PRODUCTION 40
4.5 MAINTENANCE 41
4.6 MARKET POSITION 42
4.6.1 Characteristics of the economic environment in 2010 42
4.6.2 Sales and customers 43
4.6.3 Purchasing and suppliers 43
4.7 CAPITAL INVESTMENTS 44
4.8 IT 46
4.9 BUSINESS PERFORMANCE ANALYSIS 47
4.9.1 Business operations in 2010 47
4.9.2 Main activities and goals achieved 48
4.9.3 Ensuring solvency 49
4.9.4 Capital adequacy 49
4.9.5 Indebtedness 49
4.10 COMPANY’S RATIOS 50
4.11 RISK MANAGEMENT 52
4.12 PUBLIC RELATIONS 56
4.13 RESEARCH AND DEVELOPMENT 56

4.14 PLANS FOR THE FUTURE 56
4.15 IMPORTANT EVENTS AFTER THE END OF THE YEAR 57
5 Social Responsibility Report 615.1 RESPONSIBILITY TOWARDS EMPLOYEES 62
5.1.1 Human resources 62
5.1.2 Education and training 62
5.2 RESPONSIBILITY TO THE ENVIRONMENT 62
5.3 RESPONSIBILITY TOWARDS THE WIDER COMMUNITY 63
6 Financial report 676.1 AUDITOR'S REPORT 68
6.2 STATEMENT BY THE MANAGING DIRECTOR 70
6.3 INTRODUCTORY NOTES 71
6.3.1 Basis of preparation 71
6.3.2 Significant accounting assumptions and qualitative characteristics of
financial statements 71
6.3.3 Exchange rate and method of translation into local currency 71
6.3.4 Important events after the balance sheet date 71
6.4 ACCOUNTING POLICIES 71
6.5 FINANCIAL STATEMENTS 75
6.5.1 Balance sheet 75
6.5.2 Income statement 77
6.5.3 Cash flow statement (direct method) 78
6.5.4 Statement of changes in equity 79
6.6 NOTES TO THE FINANCIAL STATEMENTS 80
6.6.1 Notes to the balance sheet 80
6.6.2 Notes to the income statement 90
6.6.3 Net operating profit or loss 94
6.6.4 Notes to the cash flow statement 94
6.6.5 Notes to the statement of changes in equity 94
6.7 OTHER DISCLOSURES 95
6.7.1 Information about specific employee categories 95
6.7.2 Guarantees received and given 95
APPENDICES TO THE ANNUAL REPORT 96
Reporting by business and geographical segments 96
Balance sheet by business segments 97
Income statement by business segments 97

12
A
NN
UA
L R
EP
OR
T 2
01
0 T
erm
oele
ktra
rna
Šošt
anj

Reliability
SafetyAvailability
Quality Determination
DevelopmentKnowledge

1

Once we take a decision that we will
really do something for our progress
then this progress is reflected also at
our working place. At that time we
develop the energy needed to achieve
our aims.
Intr
oduc
tion1

16
A
NN
UA
L R
EP
OR
T 2
01
0 T
erm
oele
ktra
rna
Šošt
anj

1.1 INTRODUCTION
Termoelektrarna Šoštanj d.o.o. is the largest thermal production facility in Hold-
ing Slovenske elektrarne Group. Its core activity is the production of electricity
and thermal energy used in district heating. With a net output of 687 MW,
TEŠ produces approximately a third of the country’s energy, and in critical
periods it can meet more than half of the national demand. The average
annual production of electricity ranges between 3,500 and 3,800 GWh.
The average annual production of thermal energy for district heating
of Šalek Valley amounts to 400-450 GWh. The annual production of
electricity and thermal energy require between 3.5 and 4.2 million
tons of coal and approximately 60 million Sm3 of natural gas.
In terms of output, TEŠ is comparable to similar thermal power
plants in Europe, while in terms of unit operating availability it
can even outperform them. The construction of the replacement
Unit 6, a 600 MW production facility, will further contribute to
TEŠ’s efficiency.
The cornerstone of our activities is respect for past achievements,
taking into account our experience and previous work. On the ba-
sis of experience and expertise acquired, TEŠ is oriented towards
the future applying the latest discoveries in our field.
The company’s operations are based on long-term development
plans with a focus on the construction of the replacement Unit 6
with a rated power of 600 MW by the end of 2014.

18
A
NN
UA
L R
EP
OR
T 2
01
0 T
erm
oele
ktra
rna
Šošt
anj
1.2 REPORT OF THE SUPERVISORY BOARD
WRITTEN REPORT OF THE SUPERVISORY BOARDOF THE COMPANY TERMOELEKTRARNA ŠOŠTANJ d. o. o.
Pursuant to provisions of Article 282 of the Companies Act (ZGD-1), the
Supervisory Board of Termoelektrarna Šoštanj d.o.o. hereby informs the
General Meeting of the following:
• the method and extent of examination of the Company’s operations in
the 2010 financial year,
• the Supervisory Board’s position on the auditor’s report,
• the examination and confirmation of the annual report of the company
for 2010,
• the examination of the proposal on allocation of accumulated profit.
In the 2010 financial year, the Supervisory Board was comprised of:
• Djordje ŽEBELJAN, M.Sc. – president,
• Franc ROSEC – vice-president, employee representative,
• Janez KERŽAN, M.Sc. – member.
In the 2010 financial year, the company was represented and managed
by the Managing Director Dr. Uroš ROTNIK until 11 November 2010. At its
12th irregular meeting held on 11 November 2010, the Supervisory Board
dismissed Mr. Rotnik from his post of manager – Managing Director.
From 11 November 2010 onwards, the company was represented and man-
aged by Simon TOT, M.Sc., who was appointed by the Supervisory Board at
its 12th irregular meeting on 11 November 2010.
In the 2010 financial year, the Committee for active supervision of invest-
ment was comprised of the following members: Dr. Dean Besednjak (presi-
dent), Matjaž Janežič, M.Sc., Dr. Vladimir Malenković and Bojan Brešar until 2
November 2010; after this date Bojan Brešar was replaced by Franc Rosec.
The committee met regularly on a weekly basis, oversaw the activities asso-
ciated with the project and regularly reported its findings to the company’s
Supervisory Board and TEŠ’s and HSE’s management.
1. Monitoring and supervision of company operations
In the period under consideration the Supervisory Board monitored and
oversaw the company’s operations on 7 regular, 7 irregular and 5 corre-
spondence meetings.
TEŠ d.o.o. is one of the key components of the HSE Group, which is why
corporate governance is significantly affected by the fact that the company
is 100% owned by HSE d.o.o. Considering the additional fact that TEŠ is the
investor in the largest energy project in Slovenia – replacement Unit 6 – it
is obvious that due to the implications of its activities for the whole HSE
Group, its operations are also monitored by the bodies of the controlling
company. TEŠ’s Supervisory Board is aware of the fact that by issuing a par-
ent guarantee and providing for capital increases, both HSE as well as all of
the HSE Group – through HSE – have accepted a great deal of responsibility
in relation to the investment; a lot of attention is therefore being devoted
to ensuring coordination at the level of the HSE Group. Quick exchange of
key information is enabled by meetings of HSE Group’s managing directors
which are held on a regular basis and contribute significantly to prompt
reaction to changes. In order to allow for the greatest transparency possible,
the founder introduced another mechanism for regular identification/al-
leviation of issues by appointing an active supervision committee in 2009
which reports to the management of HSE and the Supervisory Board of TEŠ
on a weekly basis. In addition, a coordinating financial team of HSE-TEŠ was
appointed which is in charge of coordination of demanding financial activi-
ties on the Replacement Unit 6 project. All of this provides for systematic
and comprehensive oversight of the company’s operations.
The work of the Supervisory Board was focused on careful monitoring of
financial, technical and other information required in order to assess the
adequacy of the company’s operations. While performing its duties, the
Supervisory Board considered the recommendations of the committee for
active supervision of the investment. The latter reports to the Managing Di-
rector of HSE. In this manner the TEŠ’s Supervisory Board, in accordance with
its competences, contributed to the fundamental goal of the company’s sole
owner for the investment to be carried out in the best way possible and the
negative developments to be neutralised.
The key points in relation to the project addressed by the company’s Super-
visory Board in 2010 were:
a. approval of the Contract for construction of the Unit 6 cooling system;
b. approval of a long-term loan taken out with the European Investment
Bank (EIB);
c. approval of the Contract on performance of works for the construction
of a platform and embankment for the cooling tower and transformers
of Unit 6;
d. establishment of a coordinating team of HSE in TEŠ in order to optimise
the financial structure regarding Unit 6 and minimise financing costs;
e. approval of the Guarantee agreement for securing the long-term loan
from EIB;
f. approval for the drawing of the EIB loan in the amount of EUR 110
million.
The Supervisory Board thoroughly examined the bases for adopting deci-
sions as well as compliance with Articles of Incorporation and the company’s
development plan, particularly with respect to the project for the construc-
tion of replacement Unit 6. When performing its supervisory function, the
board also considered the implications of the financial and economic crisis
which required even closer monitoring of operations on all levels. In addi-
tion, the Supervisory Board carefully monitored the company’s liquidity and
solvency management.
Other significant issues addressed by the company’s Supervisory Board in
2010 are:
g. approval of TEŠ’s business plan for 2010 which was adopted by the
founder on 31 March 2010;
h. approval of TEŠ's 2009 annual report on 24 June 2010;
i. quarterly reports on company's operations;
j. approvals for short-term borrowing within the HSE Group (Cash
Management);
k. legal transactions involving the purchase of coal, lease of capacity and
purchase of electricity;
l. dismissal and appointment of the company’s Managing Director.

2. Position on the Auditor’s Report and examination of the 2010 Annual Report of the company
From the independent auditor's report on the 2010 Annual Report it is
evident that the financial statements present fairly, in all material respects,
the financial position of the company and its financial performance and cash
flows for the year 2010, and that the business report is consistent with the
audited financial statements.
Based on careful examination of the Annual Report and on the basis of ex-
planations provided at the Supervisory Board meeting, it is the Supervisory
Board’s assessment that the development goals set by the founder are being
met despite the unstable economic environment and that the company’s
operations were in line with the business plan of TEŠ for 2010 as adopted by
the founder.
Within the scope of annual report examination, the Supervisory Board also
reviewed the report on relations with related companies. Based on explana-
tions received from the management and the auditor's findings that the
information in the report are complete and correct, the Supervisory Board
has no objections to the report of the Managing Director.
Taking into account the review of the auditor’s report and explanations
given at Supervisory Board meetings, the Supervisory Board of TEŠ has no
objections to the auditor’s report. Based on regular monitoring of TEŠ’s
operations, a positive audit opinion, the achieved objectives from the 2010
business plan, and in line with its competences, the Supervisory Board of
the company TEŠ, after final review, raises no objections to and approves the
Annual Report of TEŠ for 2010.
3. Examination of the proposal on allocation of accumulated profit
The Supervisory Board was informed that the net profit for the 2010 financial
year totalled EUR 4,202,405.90, of which EUR 210,120.30 was used for crea-
tion of legal revenue reserves while the remaining, unallocated part in the
amount of EUR 3,992,285.60 represents the company’s accumulated profit.
Based on the company’s strategic objectives and investment policy, the
Supervisory Board of TEŠ agrees with the management’s proposal submit-
ted to the founder that the entire accumulated profit of EUR 3,992,285.60 be
allocated to other revenue reserves.
The Supervisory Board of the company prepared the report in accordance
with Article 282 of the Companies Act. The report is intended for the com-
pany’s General Meeting.
On behalf of the Supervisory Board,
President of the Supervisory Board:
Janez KERŽAN, MSc
Š o š t a n j , 8 J u n e 2 0 1 1

20
A
NN
UA
L R
EP
OR
T 2
01
0 T
erm
oele
ktra
rna
Šošt
anj

ReliabilitySafety
AvailabilityQuality
DeterminationDevelopment
Knowledge

2

Ope
ratin
g
highli
ghts
in 20
102The availability of a worker is a
reflection of his ability, knowledge,
skil ls, motivation and personality
qualities in a mechanical maintenance
of our equipment. It reflects the
impact of what a man knows, can and
wants to realize.

24
A
NN
UA
L R
EP
OR
T 2
01
0 T
erm
oele
ktra
rna
Šošt
anj
Termoelektrarna Šoštanj’s operations in 2010 have been successful despite the
financial and economic crisis. The goals that had been set were achieved and in
many areas exceeded, which is also evident in the net operating profit which was
higher than projected in our business plan. The power plant operated safely and
reliably, without major interruptions.
At Termoelektrarna Šoštanj we are aware that we must continue the chosen path
of development, and that this path is riddled with challenges for which we must
be prepared. Our priorities remain socially responsible activities, successful con-
struction of the 600 MW Unit 6, provision of sufficient financial resources for the
investment and day-to-day operations and further streamlining of operations.
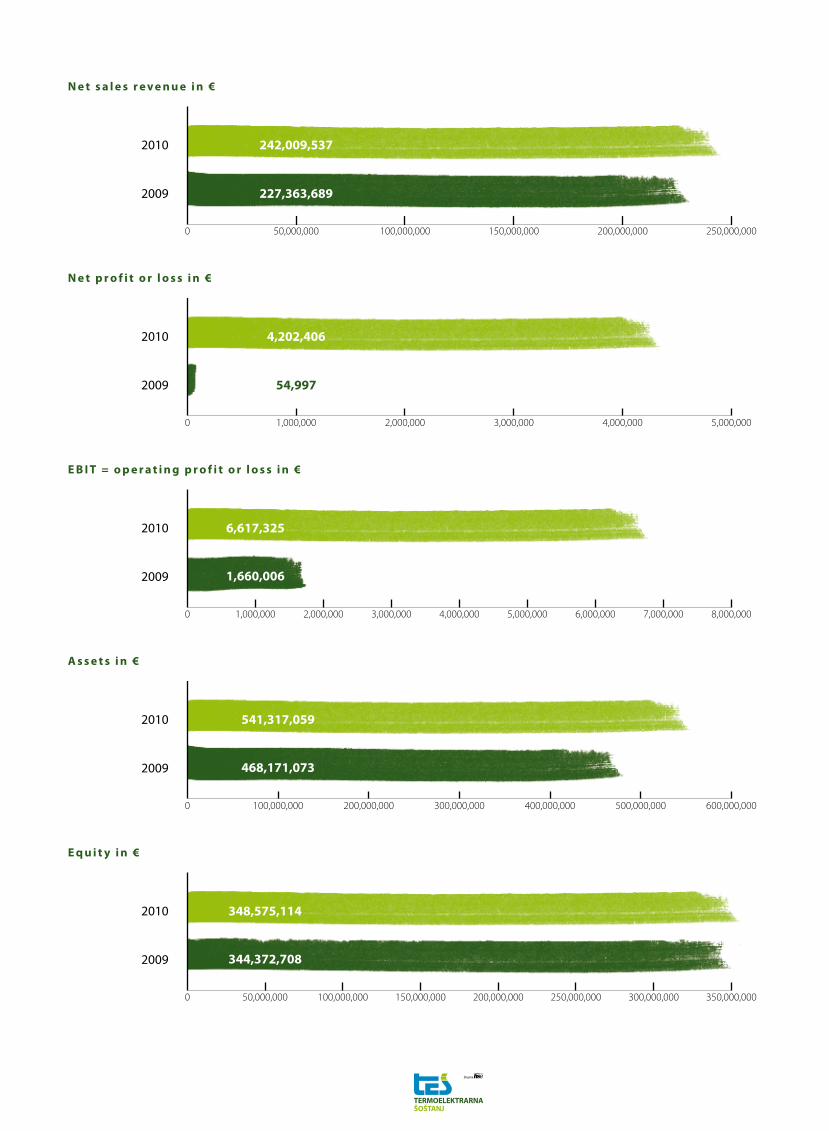
In 2010, TEŠ generated EUR 242,009,537 in net sales revenue. Relative to 2009,
revenue increased by 6% due to greater production and somewhat higher sales
price of electricity.
The company’s net profit (profit after tax) totalled EUR 4,202,406 which is more
than the previous year. This can mostly be attributed to greater quantities of
electricity sold.
Assets in the amount of EUR 541,317,059 increased by 16% in 2010, predomi-
nantly due to investments in the construction of the new Unit 6.
In 2010, TEŠ finalised almost all investments that had been scheduled in the
approved annual plan. We completed the construction of the new telecommu-
nication centre with an office building and several projects aimed at increasing
production reliability (replacement of mill rotors on Unit 5, renovation of the
hydrogen plant) and purchased the urgently required smaller fixed assets. We
continued activities involving the construction of Unit 6, where double the
amount of investments is planned for 2011; the investment will be predomi-
nantly financed by debt capital.
The number of employees at the end of December of 2010 decreased by 10
compared to the previous year.
In 2010, TEŠ sold 3,946 GWh of electricity. This is 5% more than in 2009 when
the overhaul of Units 4 and 3 was performed.
KEY INFORMATION
2010 2009 Index
Net sales revenue in € 242,009,537 227,363,689 106
* domestic market in € 241,915,738 227,268,662 106
* foreign market in € 93,799 95,027 99
Net profit or loss in € 4,202,406 54,997 7,641
Revenue in € 247,461,681 237,345,107 104
EBIT = operating profit or loss in € 6,617,325 1,660,006 399
EBITDA = EBIT + DEPR/AM in € 38,977,039 30,499,239 128
Assets in € 541,317,059 468,171,073 116
Equity in € 348,575,114 344,372,708 101
Cash flows from operating activities 61,515,331 50,301,560 122
Capital investments in € 110,528,944 122,073,795 91
Number of employees at period end 488 498 98
Electricity production in GWh (or coal in TJ) 3,946 3,753 105
N e t s a l e s r e v e n u e i n €
N e t p r o f i t o r l o s s i n €
E B I T = o p e r a t i n g p r o f i t o r l o s s i n €
A s s e t s i n €
E q u i t y i n €
0 50,000,000
227,363,689
242,009,537
2009
2010
100,000,000 150,000,000 200,000,000 250,000,000
54,997
4,202,406
2009
2010
0 1,000,000 2,000,000 3,000,000 4,000,000 5,000,000
6,617,325
2009
2010
1,660,006
0 1,000,000 2,000,000 3,000,000 4,000,000 5,000,000 6,000,000 7,000,000 8,000,000
2009
2010
0 100,000,000 200,000,000 300,000,000 400,000,000 500,000,000 600,000,000
541,317,059
468,171,073
0 50,000,000 100,000,000 150,000,000 200,000,000 250,000,000 300,000,000 350,000,000
348,575,114
344,372,7082009
2010

26
A
NN
UA
L R
EP
OR
T 2
01
0 T
erm
oele
ktra
rna
Šošt
anj
C a s h f l o w s f r o m o p e r a t i n g a c t i v i t i e s
N u m b e r o f e m p l o y e e s a t p e r i o d e n d
E l e c t r i c i t y p r o d u c t i o n i n G W h (o r c o a l i n TJ )
0 10,000,000 20,000,000 30,000,000 40,000,000 50,000,000 60,000,000 70,000,000 80,000,000
61,515,331
50,301,5602009
2010
0 100 200 300 400 500
488
498Leto 2009
Leto 2010
0 500 1,000 1,500 2,000 2,500 3,000 3,500 4,000
3,946
3,7532009
2010

ReliabilitySafety
Availability
Quality Determination
DevelopmentKnowledge

3
Tim
elin
e of
Sig
nifica
nt d
evelo
pmen
ts3Quality is a value which is ver y
impor tant for the progress in the
company. The most impor tant for us is
how to achieve the quality of ser vice
and the safety of employees.

30
A
NN
UA
L R
EP
OR
T 2
01
0 T
erm
oele
ktra
rna
Šošt
anj

In 2010, Open Days at TEŠ were organised each first Thursday of the month.
At these events the visitors were acquainted with the power plant’s
operation, our development plan and the Unit 6 project.
In March, the investment in Unit 6 was also discussed by the
Government of the Republic of Slovenia which, based on
previous briefings on the work done so far, decided to
support the project.
On 19 March, TEŠ’s Supervisory Board approved
the proposed Business plan of the company for
2010. The company member adopted the Busi-
ness plan on 31 March 2011. On 31 March, after
54 years of operation, Unit 1 was perma-
nently shut down.
In April, the 7th strategic conference of
the HSE Group entitled Joining forces to
achieve synergies took place, where it
was emphasised that projects aimed
at lowering greenhouse gas emissions
and increasing the share of renewable
resources in the production portfolio –
one of which is also the Unit 6 project -
are at the forefront of planned, already
started or almost finalised projects.
In April, an additional EUR 200 million
loan was granted by the European In-
vestment Bank (EIB). This will raise EIB’s
share in the financing of the replace-
ment Unit 6 to EUR 550 million.
In April, a team of external reviewers from
TUV SUD - Sava d.o.o. performed an as-
sessment of all four standards integrated in
the unified management system, which was
successfully completed.
On 25 May, the Prime Minister Borut Pahor,
along with the Minister of the Economy and the
Minister of the Environment and Spatial Planning, visited the building site
of the new Unit 6 at TEŠ. During this working visit, the Prime Minister was
acquainted with the project for the construction of the replacement Unit
6 and its role in the HSE Group and in the wider Slovenian energy system.
He declared that the visit had been helpful and pointed out that he had
been provided with an insight into the Unit 6 project and answers to many
questions. At the end of the meeting he summed up that the estimates had
shown that the decision to build a replacement Unit 6 would be beneficial
to the national economy, both in economic and environmental terms.
On 16 May, we celebrated 54 years of TEŠ’s operation. In May, we also began
phased demolition of cooling towers 1 through 3.
In June, the Government of the Republic of Slovenia issued a support letter
for the financing of the EUR 200 million loan from the European Bank for
Reconstruction and Development (EBRD) which is a key document required
for the signing of the financial agreement.
On 20 August 2010, HSE – as the sole company member – reviewed the An-
nual Report of TEŠ for the 2009 financial year and adopted a decision to allo-
cate the accumulated profit of TEŠ for 2009 in the amount of EUR 52,247.10
to other revenue reserves.
In September, demolition of cooling towers 1-3 was completed. At the same
time, the telecommunication centre and our employees were relocated to
the new office building.
On 11 November, the company’s Supervisory Board recalled the previous
managing director and appointed a new one, Mr. Simon Tot, MSc.
In November, we were ranked among TOP 10 in educational management in
2010 and placed second in the Horus competition, a Slovenian competition
for corporate social responsibility.
In November we also signed a guarantee agreement with five guarantor
banks in order to secure EUR 110 million from EIB.

32
A
NN
UA
L R
EP
OR
T 2
01
0 T
erm
oele
ktra
rna
Šošt
anj
ReliabilitySafety
AvailabilityQuality
DeterminationDevelopment
Knowledge

4

Busin
ess
Repo
rt4In l ife we often compete with each
other and then more factors are
crucial. One of them is knowledge
or technical basis of employees and
fur thermore tactics and strategy;
however, determination to do
something is essential. On the way
to our goal we are ready to remove
all obstacles and we see only
determination to act in this way.

36
A
NN
UA
L R
EP
OR
T 2
01
0 T
erm
oele
ktra
rna
Šošt
anj
4.1 PRESENTATION OF THE COMPANY
4.1.1 Company profile
Full company name TERMOELEKTRARNA ŠOŠTANJ d.o.o.
Legal form Limited liability company with a single company member
Address Cesta Lole Ribarja 18, 3325 ŠOŠTANJ
Telephone 03 8993 200
Fax 03 8993 485
Companies Register entry no. 10051100 - Okrožno sodišče v Celju
Nominal capital 203,480,559.00 €
Size Large company
Year of establishment 1956
Bank accounts
Bank: Account no.:
BANKA KOPER 101000038312861
NLB 024260017217937
Nova KBM 045150001707126
UNI CREDIT 290000003080383
Tax number 92189903
VAT ID number SI92189903
Registration number 5040388
Website www.te-sostanj.si
E-mail [email protected]
Economic activity code 35.112
GOVERNING BODIES AS AT 1.1.2010
Managing director dr. Uroš Rotnik
President of the Supervisory Board mag. Djordje ŽebeljanMembers of the Supervisory Board mag. Janez Keržan
Franc Rosec
GOVERNING BODIES AS AT 31.12.2010
Managing director mag. Simon Tot Start 11. 11. 2010
President of the Supervisory Board mag. Djordje Žebeljan Start 24. 8. 2009 End: 23. 8. 2013
Members of the Supervisory Boardmag. Janez Keržan Start 29. 9. 2009 End: 1. 12. 2012
Franc Rosec Start 26. 8. 2009 End: 25. 8. 2013
Ownership structure as at 31.12.2010 (name and interest)
Holding Slovenske elektrarne d.o.o 100.00%
TOTAL 100.00%

4.1.2 Company’s business activities
The company has several registered activities. The core activity is production of
electricity in thermal and nuclear power plants.
4.1.3 Corporate governance statement
The company is managed in accordance with applicable regulations, Articles
of Incorporation adopted by HSE d.o.o. as the sole member of Termoelektrarna
Šoštanj d.o.o. on 14 February 2006 and amended on 15 November 2009, and in
line with the principles of good business practices.
As provided in the Articles of Incorporation, the company member manages
the company directly through its corporate bodies, i.e. the Supervisory Board
and the Managing Director.
4.1.4 Statement by the Managing Director
As the Managing Director of the company Termoelektrarne Šoštanj d.o.o., I
hereby confirm, in accordance with Article 60(a) of the Companies Act, that
the annual report of the company for the year 2010, including the corporate
governance statement, has been prepared and published in accordance with
the Companies Act and Slovene Accounting Standards.
I confirm that the appropriate accounting policies have been applied consist-
ently in the preparation of the financial statements and that the accounting
estimates have been prepared based on the principle of prudence and good
management. The financial statements have been prepared on the going
concern basis.
As the Managing Director of Termoelektrarna Šoštanj d.o.o., I declare that to my
best knowledge:
• the financial report of the company for the year 2010 gives a true and fair
view of the assets and liabilities, financial position and financial performance
of the company, and
• the business report of the company for 2010 presents fairly the development
and operating results of the company and its financial position, including the
description of significant risks.
Simon Tot, MSc
Š o š t a n j , 3 M a y 2 0 1 1
4.1.5 Statement by the Managing Director (II)
As the Managing Director of the company Termoelektrarne Šoštanj d.o.o., I
hereby declare that I have been acquainted with the Corporate Governance
Code for Companies with State Capital Investments (hereinafter: the “Code”) in
2011. It is my estimate that the governance of the company in 2010 was in line
with the recommendations laid down by the Code which was adopted by The
Capital Assets Management Agency of the Republic of Slovenia (CAMARS) and
published on 18 November 2011 on CAMARS’s website (www.auknrs.si).
As the Managing Director of the company Termoelektrarna Šoštanj d.o.o., I
declare, pursuant to Article 73 of the Code, that the company Termoelektrarna
Šoštanj d.o.o. opted to use the CAMARS Code on a voluntary basis.
Simon Tot, MSc
Š o š t a n j , 3 M a y 2 0 1 1

38
A
NN
UA
L R
EP
OR
T 2
01
0 T
erm
oele
ktra
rna
Šošt
anj
4.1.6 Relations with the controlling company and other subsidiaries in the group
Termoelektrarna Šoštanj d.o.o. is part of Holding Slovenske elektrarne Group.
As at 31.12.2010, Holding Slovenske elektrarne d.o.o., based in Ljubljana at Ko-
prska 92, was the company’s sole member, i.e. the controlling company, which
prepared the consolidated annual report 2010 for the group of companies
under its control.
In accordance with Articles 545 and 546 of the Companies Act, the company’s
management submitted a report on relations with the controlling company
and other subsidiaries in the Group, establishing that given the circumstances
known at the time of legal transactions, TEŠ d.o.o. estimates that it had not
been disadvantaged in any such transaction with the controlling company and
parties related to the controlling company and that in 2010 no legal transaction,
act or omission that could be potentially damaging to the company had taken
place as a result of influence exercised by Holding Slovenske elektrarne d.o.o..
HOLDING SLOVENSKEELEKTRARNE d.o.o.
PRODUCTION
Dravske elektrarne Maribor d.o.o. 100 %
Hydroelectricity production
Thermal energy production
Primary sources
INTERNATIONAL NETWORK INVESTMENTS
Soške elektrarne Nova Gorica d.o.o. 100 %
HSE Italia S.r.l. 100%
HSE Balkan Energy d.o.o. 100%
HSE Invest d.o.o. (HSE, DEM, SENG vsak po 25 %)
Soenergetika d.o.o. 25 %
HSE Hungary Kft. 100 %
HSE Adria d.o.o. 100 %
HSE Bulgaria EOOD 100 %
HSE Mak Energy DOOEL 100 %
HSE BiH Energetsko poduzeće d.o.o. Sarajevo 100%
HSE Praga Branch
HSE Bratislava Branch
HSE Beograd Representative O�ce
HSE Bukarešta Representative O�ce
Hidroelektrarne na Sp. Savi d.o.o. 51 %
Termoelektrarna Šoštanj d.o.o. 100 %
Premogovnik Velenje d.d. 77,7 %
HTZ IP d.o.o. 100 % Golte d.o.o.
SAŠA Inkubator d.o.o. 60 %
61,2 %
16,6 %
36 %
26 %
Robinoks d.o.o. 21 %
Sipoteh d.o.o. 42 %
PLP d.o.o. 26 %
Gost d.o.o. 100 %
PV Invest d.o.o. 100 %
RGP d.o.o. 61 %
Jama Škale v zapiranju d.o.o. 100 %
PV Zimzelen d.o.o. 100 %
Termoelektrarna Trbovlje d.o.o. 81,3 %ERICo d.o.o.
Elprom d.o.o. 100 %
30,8 %
2,8 %
Eldom d.o.o. 50 %
23 %

4.1.7 Ownership links with other companies
Erico d.o.o. was established in 1992 as an institution for scientific-research in
the area of environmental studies focused on environmental protection. It was
founded by RLV Velenje, TEŠ and ESO Velenje with the purpose of forming an
institution in the Šalek Valley whose experts from various fields of environmen-
tal studies would prepare, manage, direct and verify environmental rehabilita-
tion measures in the Šalek Valley.
Company Registration no. AddressYear of
establishmentBasic activity
Ownership interest of the controlling company
Net profit in € in 2010*
SUBSIDARIES
Erico d.o.o. 5583055 Koroška cesta 58, Velenje 1.4.1992 74.900 26.00% 106,594
ASSOCIATES
4.2 COMPANY’S BUSINESS POLICY
Mission and strategic goalsTEŠ’s mission is to supply customers with adequate quantities of energy
through production of electricity and thermal energy, thus contributing to
higher quality of work and life of its customers.
TEŠ’s strategy is based on its mission and is future-oriented. TEŠ aims to remain
the largest thermal energy system in Slovenia.
The company’s main objective is optimal use of human, financial and produc-
tion resources in order to achieve reliable, safe, environmentally friendly and
competitive production of electricity and thermal energy based on existing and
newly constructed production sources while taking into account the potential
synergies in the HSE Group.
With the help of the risk management system supporting our efforts to achieve
these goals, we will ensure proper planning, execution and optimisation of all
activities and therefore efficient use of all the required resources.
4.3 MANAGEMENT SYSTEM POLICY4.3.1 Achievement of objectives in the area of quality, environmental management, occupational safety and health, and information security
TEŠ has established an integrated management system which is comprised of:
• a quality management system as required by SIST ISO 9001:2008;
• an environmental management system as required by SIST ISO 14001:2004;
• an occupational safety and health system as required by OHSAS 18001:2007;
and
• an information security management system as required by ISO/IEC
27001:2005.
The performance and efficiency of the management system is determined
on the basis of integrated internal assessments, external assessments carried
out by a certification body, and through achievement of planned objectives.
The external assessment was carried out in April 2010 and covered all four
standards.
The external reviewers estimated that the reviewed management system, in
particular with regard to:
• extent and policy;
• identification and regular monitoring/measurement of risks (jeopardising
information security, environmental safety, occupational health and safety),
safety aspects of the organisation and legal or statutory requirements;
• qualification, experience and competences of employees in relation to the
management system;
• selected and implemented safety controls;
• activities for informing employees about the management system;
• execution of internal assessments and managerial reviews; and
• promoting the process of permanent improvement
is effective and a basis has been provided in order to maintain and improve the
management system.
In 2010 we successfully completed the corporate social responsibility project.
The project covers the following crucial areas: attitude towards employees, the
environment, the wider community and customers and suppliers. As part of
the project, we entered the “Slovenian corporate social responsibility award -
HORUS” competition and placed second in the group of large companies.
In 2007, Erico was transformed into a limited liability company (d.o.o.) whose
members are Gorenje GA d.o.o. (51%), Premogovnik Velenje (23%) and TEŠ
(26%).

40
A
NN
UA
L R
EP
OR
T 2
01
0 T
erm
oele
ktra
rna
Šošt
anj
Development of the management systemIn 2011 we will begin the SIST EN 16001 Energy Management System project.
4.3.2 Occupational safety and health and fire safety
Protection of the working environment is based on the principles of the Oc-
cupational Safety and Health Act which requires the employer to ensure the
safety and health of workers at the workplace.
In accordance with the acquired OHSAS 18001 certificate, the company’s
department for occupational and fire safety has been carrying out regular pre-
ventive measures to ensure a higher level of safety and better health protection
on all organisational levels.
Health safety was ensured in compliance with the Rules concerning preventive
medical examinations of workers (Official Gazette of the Republic of Slovenia,
No. 87/02, 29/03 and 124/06). Targeted periodical and other preventive medical
examinations have been performed.
Statement of safety and risk assessmentThe Statement of safety and risk assessment was regularly updated and ad-
justed according to the actual state.
Due to reorganisation of jobs and other changes, a second review of risk as-
sessment has been initiated, under the scope of which the existing data will be
thoroughly examined and all changes and latest findings in the area of occupa-
tional work and safety considered. The review will be completed in 2011.
4.4 PRODUCTIONElectricity production Despite favourable hydrology of Slovenian rivers, TEŠ produced 3,946 GWh of
electricity in 2010. This is 193 GWh or 5% more than in 2009 when the overhaul
of Units 4 and 3 was performed.
3,738 GWh of electricity was produced from coal and 208 GWh from gas.
N e t e l e c t r i c i t y p r o d u c t i o n b y m o n t h i n 2 010
GWh
0
100
50
januar february march april may june july august september october november december
150
200
250
300
350
B 1–3 B 4 B 5 PT TEŠ total plan

Production of thermal energy In 2010 we have produced 407 GWh of thermal energy used for heating, which
is 5% more than in 2009. The system was supplied reliably and without any
interruptions or outages.
T h e r m a l e n e r g y p r o d u c t i o n b y m o n t h i n 2 010
00
1010
2020
3030
4040
5050
6060
7070
MonthMonth
januaryjanuary februaryfebruary marchmarch aprilapril maymay junejune julyjuly augustaugust septemberseptember octoberoctober novembernovember decemberdecember
Consumption of energy productsIn 2010 we used 3,951 thousand tons of coal, 3,825 thousand tons of which
were used for electricity production and 126 thousand tons for production of
thermal energy. The average calorific value of coal supplied totalled 11,097 kJ/
kg, which is more than in 2009, when the calorific value was 10,894 kJ/kg.
Emission couponsArticle 130(1) of the Environment Protection Act (ZVO-1) provides that on the
basis of a national plan and at the request of the plant operator, the Ministry of
the Environment and Spatial Planning shall determine the overall quantity of
emission coupons attributable to the plant operator in a certain period.
In October 2007, Termoelektrarna Šoštanj received a decision from the Environ-
mental Agency of the Ministry of the Environment and Spatial Planning, accord-
ing to which it was entitled to 21,504,120 CO2 coupons in the period 2008-2012
or 4,300,824 coupons per year.
In 2010 TEŠ emitted 4,775,247 tons of CO2 through production of electricity. In
accordance with the Environment Protection Act, the company was thus obligat-
ed to pay the environment pollution tax (1 coupon per ton of CO2). The company
still has 4,300,824 free coupons at its disposal to settle this tax. The difference in
the amount of 474,423 emission coupons will be purchased from HSE.
The savings in CO2 emissions on account of gas consumption amounted to
140,306 tons, which translates to EUR 1,673,851.
4.5 MAINTENANCEThe plant maintenance strategy is designed to enable the company to achieve
its short-term and long-term objectives.
Short-term objectives include:
• ensuring occupational safety and health of employees at the workplace,
• economical use of materials,
• economical allocation of working hours,
• shorter deadlines for repairs of individual plants,
• prevention of occurrence and recurrence of identical failures through pre-
ventive measures,
• the best possible operational availability of the power plant as a whole,
• environment-friendly electricity and thermal energy production.
Long-term objectives include:
• decrease in our own prices of electricity and thermal energy produced in real
terms,
• competitiveness in the electricity market,
• maintaining the status as producer of electricity and thermal energy based
on processing of lignite,
• ensuring operation until the target service lives of individual units are met
(Units 3 and 4 will continue to operate until Unit 6 is put into service, presum-
ably until the end of 2015; Unit 5 will most likely be designated as a backup
facility from 2015 to 2027).
The strategy is based on our own and experience of others, and is adapted to
modern trends in the industry. The maintenance system is supported by the
MAKSIMO information system. For several years, we have been performing
maintenance by considering the condition of plants and carrying out preven-
tive maintenance (large-scale overhauls). Thanks to optimal utilisation of funds
allocated to maintenance activities, the maintenance strategy has been slowly
changing in favour of maintenance carried out depending on the condition of
plants. This is evident in the frequency of overhauls of individual units, which has
changed from a rigid two-year interval to a four-year interval. It is also evident in
major maintenance works on individual unit assemblies, which are carried out in
addition to the planned overhauls. The precondition for efficient maintenance
GW
h

42
A
NN
UA
L R
EP
OR
T 2
01
0 T
erm
oele
ktra
rna
Šošt
anj
under this strategy and for achieving the above objectives is most of all adequate
management of production plants and experience of technical and maintenance
personnel.
Considering their age and hours of operation, TEŠ’s plants already require fairly
intensive maintenance. Maintenance is performed on the basis of monitoring
of plant operation, operational events, assessment of the remaining service life
through the use of demolition and non-demolition methods of material control,
and in line with requirements for safe and reliable operation as well as accepted
guidelines, i.e. strategy, for plant operation and maintenance.
Overall, EUR 10,363,982 was spent for maintenance of power units, other facilities
and plants, which is 5% more than in 2009. In light of ageing power plants and
therefore increased number of required maintenance activities we can conclude
that the maintenance strategy is solid. Of course, without proper support in the
form of quality procurement activities this would not be possible.
O p e r a t i n g Av a i l a b i l i t y o f U n i t s
The chart shows changes in unit availability. Relative to the previous year,
availability increased which indicates that the maintenance concept is solid and
effective. The plants are namely growing older. Unforeseen technical-techno-
logical episodes on individual units have a direct impact on the maintenance
picture. We are confident that all repairs were performed economically and in
4.6 MARKET POSITION4.6.1 Characteristics of the economic environment in 2010
In 2010, a moderate growth of GDP was recorded, namely of 1.2%, compared to
2009. According to current estimates, in 2010 the GDP amounted to EUR 36,061
million or EUR 17,602 per capita.
As expected, trade with foreign countries increased in 2010. Export increased
by 7.8% and import by 5.6%.
Credit activities of banks remained at a relatively low level.
Prices of industrial products of local manufacturers in the domestic market
increased by 4.2%, while in the Euro zone they increased by 5.6%.
Price of oil moved between USD 77 and USD 90 per barrel.
Inflation stood at 1.9%.
The Slovenian stock exchange index fell by approximately 15%.
According to the exchange rate as at 31.12.2010, 1 euro was worth 1.3362 US
dollars.
In 2010, the unemployment rate increased. At the end of the year it stood at
11.8% which is 2.7 percentage points more than in 2009.
Total production of Slovenian power plants in 2010 amounted to 16,326 GWh
which is 0.4% less than in 2009. Relative to 2009, production in hydropower
plants increased by 1.7%, production in nuclear power plants by 1.4%, while
production in thermal power plants decreased by 1.5%.
The energy sector is currently facing an extraordinary turning point regard-
ing sustainable use of energy. The competitiveness of the Slovenian economy
depends on energy, whereas the quality of people’s lives depends on its price.
In the broader international environment, the efforts to reduce adverse impacts
of human activity on the environment, in which energy plays an important role,
certainly deserve mentioning. In December 2010, an environmental conference
took place in Cancun, Mexico, which outlined future development of the global
environmental policy.
97.0 %
97.6 %
98.2 %
98.8 %
99.4 %
99,54 %99,54 %
20052005 20062006 20072007 20082008 20092009 20102010
99,16 %99,16 % 99,22 %99,22 %
98,77 %98,77 %98,67 %98,67 %
98,50 %98,50 %
accordance with the objective of bringing electricity prices to the optimum
level.

4.6.2 Sales and customers
In 2010, Termoelektrarna Šoštanj generated EUR 242,009,537 in sales revenue.
With the sale of electricity we are participating in the market as a part of our
owner, the company Holding Slovenske elektrarne d.o.o., which is the leading
Slovenian producer and trader of electricity. We are the largest production facil-
ity in the HSE Group.
Holding Slovenske elektrarne d.o.o. is the company’s largest customer and
purchases all of electricity produced, which accounts for 97.2% of total sales.
Thermal energy soldThe sales of thermal energy for the purposes of district heating account for
1.9% of sales. Overall, we have sold 407.1 GWh of thermal energy which is 5%
more than in 2009.
Other salesOther revenue from sales of products and services includes revenue from sale
of fly ash, REA gypsum and slag in Slovenia and abroad, and revenue from leas-
ing of computing capacities.
4.6.3 Purchasing and suppliers
The main objective of purchasing is provision of raw materials, materials, spare
parts, equipment and services required for regular operation at best possible
prices, most favourable terms of payment and delivery, from most reliable
sources and through optimal supply lines. Such an approach enables the com-
pany to achieve its development and strategic goals.
The most important strategic supplier of the company is Premogovnik Velenje.
Purchase of coal for production of electricity and thermal energy accounts for
42% of all purchases. In 2010, 42,455 TJ of coal were used in electricity produc-
tion and 1,392 TJ of coal in thermal energy production.
One of the primary raw materials for production of electricity is also natural
gas. Purchases of materials account for 47% of all purchases. The structure of
purchases is presented below:
1,9 % Revenue from sale of thermal energy
13,8 % Gas
3,9 % Other energy products
0,7 % Other materials
80,3 % Coal
1,3 % Maintenance materials
0,9 % Other sales revenue
97,2 % Revenue from sale of electricity

44
A
NN
UA
L R
EP
OR
T 2
01
0 T
erm
oele
ktra
rna
Šošt
anj
Purchases of services account for 6% of all purchases. The services purchasing
structure is as follows:
Capital investments account for 47% of all purchases. The capital investment
structure is as follows:
4.7 CAPITAL INVESTMENTSSome of the plants at TEŠ are approaching the end of their service lives. Some
have been operating since 1956, when Units 1 and 2 were constructed, while
the most recent have been in operation since 1977, when Unit 5 was con-
structed. Unit 2 was shut down in 2008 and Unit 1 in March 2010. Units 3 and 4
are going to remain in operation until Unit 6 is put into service, presumably by
the end of 2014, while Unit 5 has been designated as a backup facility until 2027.
In 2005 preliminary work began on projects concerning the replacement Unit 6.
Works will be completed with the synchronisation of the generator in 2014.
Unit 6
From an environmental perspective, the decision on construction of the 600 MW
Unit 6, which is already underway, represents the continuation of the envi-
ronmental rehabilitation process which started, with a great deal of attention
devoted to environmental protection, as early as 1983. According to the adopted
strategic development plan (June 2004), the 600 MW Unit 6 will gradually
replace technologically outdated and uneconomic Units 1, 2, 3, 4 and 5. This is a
project of national importance, which was included in the Resolution on the Na-
tional Energy Programme and the Resolution on National Development Projects
for the period 2007-2023. In spring 2009, it was also included in the Green Paper.
Based on the adopted development plan we have started compiling the
required investment documentation. The following documents have been
prepared:
• Pre-feasibility study: Construction of Unit 6 at TEŠ, April 2005
• Investment Project Identification Document, May 2005
• Study entitled “The aspects of incorporation of Unit 6 at TEŠ into the Slov-
enian electricity system”, June 2005
A pre-investment plan for Unit 6 was presented at the HSE strategic conference
in September 2005, where the construction of Unit 6 at TEŠ was ranked among
the priority projects of the HSE Group. All of the above served as a basis for the
preparation of an investment programme for the replacement power plant
facility – Unit 6 at TEŠ. Parallel to the preparation and processing of investment
documents, other procedures and activities have been underway for incorpora-
tion of the planned investment into the energy system and the environment.
On 10 July 2006 we obtained the energy permit.
In October 2009, the investment programme was revised. The main reasons for
the revision were:
• lower contractual value of the main technological equipment for Unit 6,
• lower value of the flue gas desulphurisation plant for Unit 6,
5,3 % Insurance premiums
46,5 % Maintenance services
6,3 % TC centre and of fice building
2,8 % Investments in reliable production
1,2 % Smaller investments, study documents, business-information system
89,8 % Unit 6
48,2 % Other services

• change in the method of electricity evacuation,
• inclusion of complete costs of emission coupons for CO2 emissions after 2012,
• shorter construction time (from 63 months to 60 months), and
• changed costs of financing during the course of construction based on
changed starting points related to the structure and dynamics of sources of
financing.
In October 2009, a revised investment programme (NIP3) was adopted by TEŠ’s
Supervisory Board and discussed by HSE’s Supervisory Board. An important
milestone was reached regarding procedures for the acquisition of a build-
ing permit when on 11 November 2009 an approval regarding environmental
aspects of Unit 6 was obtained.
On 16 February 2011, an Environmental permit for operation of the large com-
bustion plant Unit 6 was obtained, which became effective in March 2011. This
permit means that all the conditions for the issue of a building permit for Unit 6
have been met.
Delivery of equipment and servicesAfter prior approval of the Supervisory Board, TEŠ paid the first instalment to
the supplier of the main technological equipment (MTE) on 2 December 2009,
with which the contract between TEŠ, Alstom Power Centrals and Alstom Power
Systems entered into force (Start date). With the contract entering into force,
the implementation of contractual provisions, such as preparation of detailed
plans required for the building permit, ordering of equipment, the start of
contractual deadlines etc., began.
Since 3 December 2009 (Start date) until the present, all activities regarding the
Main technological equipment have been progressing according to the time
schedule.
Based on the decision by the Government of RS dated 18 March 2010 on the
need to renegotiate, i.e. lower, the price for the MTE, renewed negotiations
took place between April and June 2010 which included improvement of con-
tractual provisions, in particular the price, and the related escalation clauses,
technical-technological improvements and shortened deadlines for comple-
tion. The negotiations resulted in a lower contractual value due to changed
technological equipment and a fixation of 18.5% of the contractual price which
is no longer subjected to an escalation formula. The escalation formula itself
did not change. An Annex 2 to the contract was signed in January 2011.
In November 2009, a tender – Contract notice – entitled “The cooling system
of Unit 6 at TEŠ” was published in the Official Journal of the European Union. A
contract with the best bidder was signed in February 2010.
Activities involving the contractor for the supply of the flue gas desulphurisa-
tion plant are progressing according to the contract and the time schedule.
With regard to preparatory works, selection of the best bidder for the perform-
ance of construction works involving the western importation platform at TEŠ
took place in 2010. A contract was signed with the best bidder. The building
permit was obtained.
A tender for other preparatory construction works (embankment and platform
for the cooling tower and transformers) was published on 25 February 2010 in
the Official Journal of the European Union no. 2010/S 39-057681. The building
permit was obtained on 5 July 2010; the work is progressing according to the
planned time schedule.
In 2009, the final stage of the procedure for the selection of a designer of
project documentation for Unit 6 (BPP + IP) took place. An application for a
building permit for Unit 6 was filed with MESP on 28 December 2010. A proce-
dure for the preparation of IP documentation is also underway; the documen-
tation will be prepared in phases, coinciding with the projected construction
works.
The financing of the project is planned as a combination of equity and debt
financing. Equity sources comprise TEŠ's own resources (profits and available
depreciation) and a capital increase by the controlling company HSE d.o.o. For
the purposes of investment, HSE d.o.o. already provided EUR 122.1 million of
capital increase. Debt capital is planned in the form of long-term loans. In April
2010, a contract for a loan of EUR 440 million was signed with EIB and an annex
to the contract from 2007, under which the amount of the loan was lowered
from EUR 350 million to EUR 110 million. In connection to the issues regard-
ing government grants the plan is for the government to issue a government
guarantee for the EUR 440 million loan, while the investor will provide a bank
guarantee for the EUR 110 million loan. A guarantee agreement with five guar-
antor banks was concluded on 24 November 2010. At the end of January 2011,
all the conditions for drawing of the loan have been met and on 17 February
2011 EIB transferred the EUR 110 million loan to TEŠ. In January 2011, a financial
agreement was signed with EBRD for a EUR 200 million loan.
Telecommunication centre with office buildingThe old office building with a telecommunication centre and both cooling tow-
ers of Units 1-3 at the location foreseen for the construction of Unit 6 had to be
removed in order to provide space for the new plant. The new office building
which also includes a telecommunication centre was completed and an operat-
ing permit was issued by the MESP on 29 November 2010.
Investments in reliable productionInvestments in reliable production predominantly ensure a longer operating
period, i.e. eliminate technological and technical risks related to production.
Absence of these investments would result in the following risks:
• failure of individual production units,
• failure to achieve planned electricity production for the year,
• unreliable supply of electricity,
• unavailability of production units,
• failure to achieve target service lives of production units,
• endangered health and lives of employees at the workplace.

46
A
NN
UA
L R
EP
OR
T 2
01
0 T
erm
oele
ktra
rna
Šošt
anj
Investments in 2010
CAPITAL INVESTMENTS in EUR
Realised in January-December 2010
Depreciation and amortisation
Other own funds Domestic loans TOTAL
NEW BUILDINGS 17,709,036 8,142,399 80,300,000 106,151,435
Unit 6 (including advance for the supply of main tech. equipment)
10,965,883 7,959,151 80,300,000 99,225,034
TC centre with office building 6,735,803 183,248 6,919,051
GCS 5“ 7,350 7,350
INVESTMENTS IN PRODUCTION RELIABILITY 3,059,389 3,059,389
Replacement of the generator on Unit 5 2,399,250 2,399,250
Replacement of mill rotors on Unit 5 216,019 216,019Renovation of the industrial water distribution system
49,111 49,111
Noise reduction at TEŠ 43,889 43,889
Reconstruction of the sewage system 24,804 24,804
Renovation of the compressed air system 89,304 89,304
Overhaul of the hydrogen plant 154,091 154,091
Renovation of the FGD on Unit 4 82,921 82,921
CAPITAL INVESTMENT STUDY DOCUMENTS 123,271 123,271
MINOR CAPITAL INVESTMENTS 866,875 866,875
BUSINESS INFORMATION SYSTEM 327,974 327,974
- INFO - software 129,472 129,472
- INFO - hardware 197,862 197,862
- Completion of the backup computer centre 640 640
TOTAL 22,086,545 8,142,399 80,300,000 110,528,944
4.8 ITTEŠ’s primary process is electricity production which requires high-quality, reli-
able and safe information support. In 2010, all activities were coordinated with
the HSE’s IT department.
SECURITYWe have installed a system for monitoring user registration in the computer
system, tracking changes and follow-up of audit trails. The solution in our
existing IT environment enables audit trails in the areas of active directory, MS
Exchange, file system and MS SQL.
Telecommunication line (TCL)We have set up and tested a back-up operating room where we installed air-
conditioning and double power supply. The TCL was connected to the network.
The server equipment was transferred to the back-up room and connected to
the network.
A new telephone exchange was installed in the room and TEŠ’s telephony
system activated. The new telephone exchange was connected to the new
power supply system which enables easier maintenance in the event of power
outages.
NETWORKAt TEŠ we performed a separation of the process and business network. New
switching equipment was installed and activated in the new office building.
The equipment was connected to all users in the new building.
SERVICE CENTREA joint centre for all three companies – TEŠ, HSE and PV – has been operating at
the TEŠ location since 1 December 2010.
ISO 27001In 2010, we prepared new risk assessments of IT resources and reviewed the
procedures and instructions of the business IT department. We also performed
internal assessments as part of preparations to an external assessment. We have
successfully passed the external assessment and had our quality certificate at-
tested. We also underwent an audit of TEŠ’s information systems.
ODOSODOS provides a system for organisation of documents related to Unit 6 and
separation of agreements and contracts for Unit 6. It also supports access to
documents related to Unit 6.
KOPA ERPWe have complemented the functionality in the area of payment transactions
– SEPA. The new payment system has substantially facilitated and reduced the
cost of payment transactions in the whole EU.
We have also upgraded the programme for investment management with data
on sources. This new functionality enables manual re-entries of accounts and
records of VAT payments arising from loans that have not yet been repaid.
We are also beginning to introduce e-learning which includes planning and mon-
itoring of training. E-learning does not involve a standard but a virtual classroom.

4.9.1 Business operations in 2010
The operations of Termoelektrarna Šoštanj in 2010 were based on the Long-
term contract for the purchase of coal, lease of capacity and purchase of
electricity concluded between TEŠ d.o.o., HSE d.o.o. and Premogovnik Velenje
d.d., the Contract for the purchase of coal, lease of capacity and purchase of
electricity concluded between TEŠ, HSE and Premogovnik Velenje for 2010 that
was signed in December 2010, and Annexes nos. 1, 2 and 3 to this contract as
well as on the Business plan of TEŠ for the year 2010, which was approved by
the Supervisory Board on 19 March 2010. Pursuant to the provisions of Articles
of Incorporation, the company’s sole member approved the business plan for
2010 on 31 March 2010.
In 2010, Termoelektrarna Šoštanj generated a total profit of EUR 5,151,697.
After taking into account the corporate income tax and deferred taxes, the net
profit for the period totals EUR 4,202,406, which is in line with our plans for the
period. The higher net profit was made possible due to larger quantities of
electricity sold which reached the highest level in the past several years.
RevenueIn 2010, the company generated EUR 247,461,681 in revenue, which is 6% more
than planned for 2010 and 4% more than in 2009. The deviation from the plans
is a result of higher revenues from the sale of electricity (larger quantities sold)
and a somewhat higher sales price.
4.9 BUSINESS PERFORMANCE ANALYSIS
R e v e n u e s t r u c t u r e i n 2 010 :
E x p e n s e s t r u c t u r e i n 2 010 :
Expenses In 2010, the company’s expenses totalled EUR 242,276,482 which is 4% more
than planned for 2010 and 2% more than in 2009.
1.8 % Revenue from sale of thermal energy
0.9 % Other sales revenue
2.2 % Other operating revenue
95.1 % Revenue from sale of electricity
0.6 % Financial and other expenses
6.8 % Other operating expenses
13.4 % Write-downs in value
7.8 % Labour costs
7.5 % Costs of services
1.2 % Other costs of material
2.5 % Other energy products
8.8 % Gas
51.2 % Coal

48
A
NN
UA
L R
EP
OR
T 2
01
0 T
erm
oele
ktra
rna
Šošt
anj
Assets and liabilitiesAs at 31.12.2010, the company’s assets totalled EUR 541,317,059. This is a 16%
increase compared to 2009, which is predominantly a result of increased invest-
ments in property, plant and equipment. Taking into account the inflation rate
S t r u c t u r e o f a s s e t s a s a t 31.12 . 2 010 :
S t r u c t u r e o f l i a b i l i t i e s a s a t 31.12 . 2 010 :
Business segmentsIn 2010, all business segments (electricity production, steam and hot water sup-
ply, canteen and social standard) operated with a profit.
4.9.2 Main activities and goals achieved
In its business plan for 2010 the company set specific annual goals, which were
successfully accomplished.
Production of electricity and thermal energyIn 2010, the company’s net electricity production reached 3,946 GWh.
The quantity of electricity produced in 2010 represents 47% of the total HSE
Group output and 33% of Slovenia's total electricity production. Compared
to the previous year, the share in 2010 has increased. Despite favourable
hydrology, Termoelektrarna Šoštanj’s electricity production was 1% higher.
As a consequence, productivity also increased and amounted to 8 GWh per
employee in 2010.
In 2010, the production of thermal energy also increased slightly; 407 GWh of
thermal energy were produced which is 18 GWh more than the previous year.
Sales of electricity and thermal energyThe measurable target for the sale of electricity produced from coal was slightly
exceeded. The quantities of electricity sold were 4% higher than projected and
the revenue from electricity sales was higher by 6%, also due to higher prices of
electricity. The sales of electricity produced from natural gas exceeded plans
both in terms of quantity and value. The sales of thermal energy were 2% lower
than planned for the period.
Ensuring appropriate structure, skills, efficiency and availability of human resourcesAccording to measurable indicators, the target of ensuring appropriate struc-
ture, skills, efficiency and availability of human resources has been achieved.
The trend of decreasing the number of employees continued in 2010, not
only in the segment of permanent employees but also in the total number
of employees which decreased by 10 compared to 2009. As at 31.12.2010, the
company employed 488 people, with the remaining measurable characteristics
in relation to this objective also being met or exceeded. Thus, more than 20
hours of education and training were performed per employee; sick leave was
under 5.5% and the cost of labour as a share of processing costs not higher than
22% (reaching 19%).
1.1 % Other current assets
8.1 % Short-term oper. receivables
2.3 % Inventories
2.7 % Other long-term assets
85.7 % Property, plant and equipment
1.1 % ACDR
27.0 % Short-term liabilities
4.3 % Long-term liabilities
3.2 % Provisions and long-term ARDC
64.4 % Equity
(December 2010/December 2009), which stood at 1.9%, the assets increased by
13% in real terms.

Purchasing of primary resources, spare parts, materials and servicesThe target was achieved by successfully negotiating the most favourable
purchase conditions with suppliers. Purchasing criteria are determined by
assessing supplier competitiveness, quality of products from various suppliers,
executing business analyses of selected and potential suppliers and negotiat-
ing the best possible terms and conditions of delivery.
Ensuring liquidity and cost efficiency of operations
To achieve this goal, the company adopted measures in the area of liquidity
management to be able to settle its liabilities as they fell due. It operated in line
with fundamental principles of long-term and short-term solvency. Revenue
and expenses in 2010 were above planned; the company concluded the finan-
cial year with a profit.
The planned borrowing from EIB to provide finances for Unit 6 could not be
realised, and TEŠ therefore took out a short-term loan within the HSE Group.
4.9.3 Ensuring solvency
The basic task of financial management is to ensure long-term and short-term
solvency, which in turn enables uninterrupted business operations of other
business functions.
TEŠ pursues a financial policy that ensures optimum conduct of business in the
areas of liabilities and receivables management, financing and investing, finan-
cial risk management and cooperation with financial institutions. TEŠ operates
in accordance with business and financial standards and rules laid down in the
Financial Operations, Insolvency Proceedings and Compulsory Dissolution Act.
In 2010, financial operations were focused primarily on provision of funds for
economically viable operations and investments in fixed assets.
Short-term solvency was achieved through efficient management of cash and
systematic planning and monitoring of cash flows. Due to inoperability of the
planned long-term financing sources for Unit 6 (drawing of the loan from the
EIB in the amount of EUR 110 million), the company took out a short-term bridg-
ing loan within the HSE Group.
4.9.4 Capital adequacy
Capital structureThe company’s goal is to secure enough capital with regard to the extent and
type of transactions it enters and the risks it is exposed to. Capital adequacy
is a condition for borrowing and investing capacity and also a consequence of
previous business decisions.
The data in financial reports prove that the company meets the capital ad-
equacy requirements as it disposes of sufficient capital given the extent and
type of business it pursues.
4.9.5 Indebtedness
As at 31.12.2010, the company’s financial liabilities (short- and long-term)
totalled EUR 114,038,328 and accounted for 21% of total liabilities. Of these, 70%
refer to short-term and 30% to long-term loans received. In 2010, the company
took out short-term loans in the HSE Group within the scope of “cash manage-
ment” (outstanding loans as at 31.12.2010 amounted to EUR 80.3 million), while
a short-term revolving credit in the amount of EUR 5 million was drawn from a
commercial bank for the purposes of managing daily liquidity. In the reporting
period, the company did not take out any additional long-term loans, but did
repay a long-term principal in the amount of EUR 10,273,169.
For the purposes of financing the project for construction of Unit 6, drawing
of the first tranche of the loan from EIB in the amount of EUR 110 million was
projected in 2010 which, however, did not materialise. As a consequence, the
maturity of repayment of all short-term bridging loans in the amount of EUR
80.3 million taken out in 2010 within the HSE Group was extended to 2011. The
extension of short-term financing to after 2010 was appropriately authorised by
the Ministry of Finance.
In 2011, drawing of the long-term loan from EIB in the amount of EUR 110 mil-
lion and the long-term loan from EBRD in the amount of EUR 163 million are
projected. With the transfer of the loan from EIB on 17.2.2011 in the amount of
EUR 110 million, the short-term bridging loans taken out within HSE group in
2010 were repaid.

50
A
NN
UA
L R
EP
OR
T 2
01
0 T
erm
oele
ktra
rna
Šošt
anj
EQUITY FINANCING RATE 31/12/2010 31/12/2009
1. Liabilities 541,317,059 468,171,073
2. Equity 348,575,114 344,372,708
Equity financing rate = 2 / 1 64.39 73.56
The company’s equity accounts for 64% of total liabilities. The company’s
operations are financed from own as well as external sources. Compared to
the end of 2009, the equity financing rate decreased due to an increase in debt
sources intended for financing of the investment in replacement Unit 6.
LONG-TERM FINANCING RATE 31/12/2010 31/12/2009
1. Equity 348,575,114 344,372,708
2. Long-term liabilities 23,471,768 33,749,027
3. Provisions and Long-term accrued costs and deferred revenue 17,232,912 22,189,556
4. Total ( 1 + 2 + 3 ) 389,279,794 400,311,291
5. Liabilities 541,317,059 468,171,073
Long-term financing rate = 4 / 5 71.91 85.51
The company financed 72 % of its assets from long-term sources and 28% from
short-term sources. The ratio was lower by 13.6 percentage points due to an
increase in short-term financial liabilities of the company.
OPERATING FIXED ASSETS RATE 31/12/2010 31/12/2009
1. Property, plant and equipment 463,988,911 387,147,501
2. Intangible assets and Long-term accrued revenue and deferred costs 13,553,515 17,919,337
3. Total fixed assets at carrying amount ( 1 + 2 ) 477,542,426 405,066,8384. Assets 541,317,059 468,171,073Operating fixed assets rate = 3 / 4 88.22 86.52
Property, plant and equipment and intangible fixed assets account for 88% of
the company’s assets. The increase in the rate in comparison with 2009 is the re-
sult of an increase in property, plant and equipment (new capital investments).
LONG-TERM ASSETS RATE 31/12/2010 31/12/2009
1. Property, plant and equipment 463,988,911 387,147,501
2. Intangible assets and Long-term accrued revenue and deferred costs 13,553,515 17,919,337
3. Investment property 0 0
4. Long-term investments 60,003 214,136
5. Long-term operating reeivables 129,872 148,503
6. Total ( 1 + 2 + 3 + 4 + 5 ) 477,732,301 405,429,477
7. Assets 541,317,059 468,171,073
Long-term assets rate = 6 / 7 88.25 86.60
The company’s long-term assets account for 88% of its total assets. The calcu-
lated rate for 2010 is higher than the one for 2009. The increase is a result of an
increase in property, plant and equipment.
EQUITY TO OPERATING FIXED ASSETS RATIO 31/12/2010 31/12/2009
1. Equity 348,575,114 344,372,708
2. Property, plant and equipment 463,988,911 387,147,501
3. Intangible assets and Long-term accrued revenue and deferred costs 13,553,515 17,919,337
4. Total fixed assets at carrying amount ( 2 + 3 ) 477,542,426 405,066,838
Equity to operating fixed assets ratio = 1 / 4 0.73 0.85
The ratio represents the relationship between equity and fixed assets. In 2010
the ratio stood at 0.73, meaning that the company used equity to finance the
majority of its most illiquid assets. The ratio decreased compared to 2009.
4.10 COMPANY’S RATIOS

ACID TEST RATIO 31/12/2010 31/12/2009
1. Cash 47,614 2,800
2. Short-term investments 0 1,761,000
3. Total liquid assets ( 1 + 2 ) 47,614 1,763,800
4. Short-term liabilities 146,245,060 64,501,078
Acid test ratio = 3 / 4 0.00 0.03
The acid test ratio shows that as at 31.12.2010 the company had minimum liquid
assets at its disposal.
QUICK RATIO 31/12/2010 31/12/2009
1. Cash 47,614 2,800
2. Short-term investments 0 1,761,000
3. Short-term operating receivables 44,107,479 44,840,166
4. Total ( 1 + 2 + 3 ) 44,155,093 46,603,966
5. Short-term liabilities 146,245,060 64,501,078
Quick ratio = 4 / 5 0.30 0.72
The quick ratio shows whether the company finances current assets solely
through short-term or also through long-term liabilities. The ratio for 2010
stood at 0.30 and is lower than in 2009 due to an increase in short-term finan-
cial liabilities.
CURRENT RATIO 31/12/2010 31/12/2009
1. Current assets 57,006,408 58,947,609
2. Short-term accrued revenue and deferred costs 5,886,619 3,357,931
3. Total (1 + 2) 62,893,027 62,305,540
4. Short-term liabilities 146,245,060 64,501,078
CURRENT RATIO = 3 / 4 0.43 0.97
The current ratio describes the financing of current assets from short-term
liabilities. Due to an increase in short-term financial liabilities, in 2010 the ratio
decreased relative to 2009.
OPERATING EFFICIENCY RATIO 31/12/2010 31/12/2009
1. Operating revenue 247,386,969 236,950,519
2. Costs of goods, materials and services 172,897,147 173,279,588
3. Labour costs 18,927,745 18,607,149
4. Write-downs in value 32,396,123 29,520,836
5. Other operating expenses 16,548,629 13,882,940
6. Total operating expenses ( 2 + 3 + 4 + 5 ) 240,769,644 235,290,513Operating efficiency ratio = 1 / 6 1.03 1.01
In 2010 the company’s operating revenue exceeded its operating expenses by
3%. The value of the ratio increased relative to 2009 due to higher revenues
from the sale of electricity..
NET RETURN ON EQUITY 31/12/2010 31/12/2009
1. Net profit for the period 4,202,406 54,997
2. Average equity 346,473,911 301,615,810
Net return on equity = 1 / 2 0.012 0.000
The company’s operating revenue exceeded its operating expenses by 1.2%
in 2010. The ratio increased relative to 2009 due to better results in the sale of
electricity.

52
A
NN
UA
L R
EP
OR
T 2
01
0 T
erm
oele
ktra
rna
Šošt
anj
EBITDA / INTEREST PAID 31/12/2010 31/12/2009
1. Operating profit or loss 6,617,325 1,660,006
2. Depreciation or amortisation 32,359,714 28,839,233
3. EBITDA ( 1+2 ) 38,977,039 30,499,239
4. Interest paid 1,227,233 1,907,144
EBITDA / interest paid = 3/4 31.76 15.99
TOTAL DEBT/TOTAL ASSETS 31/12/2010 31/12/2009
1. Short-term liabilities 146,245,060 64,501,078
2. Long-term liabilities 23,471,768 33,749,027
3. Long-term accrued costs and deferred revenue 14,454,609 19,584,952
4. Short-term accrued costs and deferred revenue 5,792,205 3,568,229
5. Long-term assets 478,424,032 405,865,533
6. Intangible assets and Long-term accrued revenue and deferred costs (excluding free emission coupons)
651,043 716,041
7. Current assets and short-term accrued revenue and deferred costs 62,893,027 62,305,540
Total debt / total assets = (1+2+3+4)/(5-6+7) 0.35 0.26
The company satisfies the conditions laid down by the European Investment
Bank upon granting of the loan for the construction of Unit 6, i.e. that EBITDA
may not be lower than three-times the interest paid and debts may not exceed
60% of the company’s assets.
4.11 RISK MANAGEMENTTimely identification, regular monitoring and management of risks are a
precondition for effective and efficient achievement of business objectives.
However, it is up to the management personnel to ensure an appropriate rela-
tionship between anticipated profitability and risks, taking into account current
business conditions and circumstances.
The company encounters various risks in its business, but the most prevailing
are as follows:

1. Risks associated with regular operations:Business risks, which relate to the ability to generate revenue and contain costs
as well as to the ability to maintain the value of the company’s assets.
ITEM no.
TYPE OF RISKDESCRIPTION OF
RISKIMPLICATIONS
RISK ASSESSMENTRISK MANAGEMENT TOOLS
PROBABILITY* IMPACT**
1 QuantityPossible production shortfalls in case of
major failuresProduction shortfalls M M
Timely and professional implementation of planned maintenance procedures on existing facilities (regular
preventive maintenance works, major regular inspections - overhauls) and investments in reliable
production
Possible production shortfalls in case of
manipulatory errorsProduction shortfalls S H
Uncertainty of energy products
supplyProduction shortfalls S V
Long-term contracts for the purchase of coal and natural gas
2 MarketPrice of
environmental pollution
Purchase of emission coupons
M M
Introduction of new technologies (construction of replacement Unit 6) - development plan of the HSE
Group for 2004-2013. Purchase of the remaining emission coupons (pollution in excess of received
coupons) is ensured by the parent company.
Price of gas Effect on competitiveness M MSo far, the changes in prices of gas followed the
changes in the prices of electricity; therefore the risk is not managed
Loss of market Loss of revenue S M
Long-term contract for the purchase of coal, lease of capacity and purchase of electricity between TEŠ, HSE
and PV in 2004. The contract lays down standard and additional quantities of coal in GJ that the company
will purchase from PV, while HSE as a buyer purchases all electricity produced by TEŠ at prices agreed in
annual contracts.
3.
Decrease in value of operating
assets
Destruction, outdatedness or
other decreases of operating assets
Production shortfalls resulting in loss of revenue
M M All major assets are insured with an insurance company
4.Information
system
Loss of internet connection, loss
of emmission and imission data, failure
of the operational control system,
unavailability of e-mail, introduction
of a virus
Communication issues, payment transactions
issues, disabled production control, limited operation
and unavailability of e-mail
S M
Risk of disturbances and failures is managed with a system for uninterrupted operation and back-up
location. Risk of data loss is managed with data filing systems. Risk of unauthorised access to data is
managed with a two-level access control system.
* Probabilityisrankedas:H=high,M=medium,L=low
** Impactisrankedas:H=high,M=medium,L=low

54
A
NN
UA
L R
EP
OR
T 2
01
0 T
erm
oele
ktra
rna
Šošt
anj
Financial risks relate to the company’s ability to generate financial income,
control financial expenses, maintain the value of financial assets, control finan-
cial liabilities and ensure long-term solvency.
ITEM no.
TYPE OF RISKDESCRIPTION OF
RISKIMPLICATIONS
RISK ASSESSMENTRISK MANAGEMENT TOOLS
PROBABILITY* IMPACT**
1. CreditTrade receivables
settled only in part or not at all
Shortage of liquid assets S M
The company concludes an annual contract incorporating elements of insurance for receivables
(blank bill of exchange). It also monitors, on a regular basis, all past due outstanding receivables, uses
relevant collection procedures and charges a default interest rate.
2. LiquidityDeficit of liquid
assetsLiabilities not being settled M H
Careful planning of cash flows, maturity matching of receivables and liabilities, provision of financing
sources in line with capital investment projects. Cash available over the lon term is only invested in safe,
highly liquid financial assets in the form of deposits with commercial banks, while daily surpluses are used
in the cash pooling system. Adequate credit lines are set up for short term liquidity management.
3. Interest rateIncrease in interest
ratesHigher financing expenses M M
So far, interest rate fluctuation has been acceptable, therefore, the risk is not managed. In the event of
unfavourable changes in interest rates, the possibility of proper management of the risk will be examined
4. Inflation High inflation rateIncreased cost of materials
and servicesS M
Monitoring of macro-economic policy and conclusion of purchase agreements at fixed prices.
* Probabilityisrankedas:H=high,M=medium,L=low
** Impactisrankedas:H=high,M=medium,L=low
Operational risks mainly relate to the design, implementation and supervi-
sion of the company’s business processes and activities. Risk exposure is low
because the company implemented the ISO 9001 quality management system,
the ISO 14001 environmental management system, the OHSAS 18001 occupa-
tional health and safety system and the ISO 27001 information security man-
agement system. These systems define the implementation of business activi-
ties and processes as well as responsibilities and authorisations. The adequacy
of their implementation is assessed through internal and external audits.
To prevent software and application failures, the company devotes a lot of at-
tention to the development and operation of its information infrastructure.

2. Risks associated with investment activities:Investment risk is the risk of failure to achieve the planned investment dynam-
ics and unsuccessful realisation of investments envisaged in the development
and annual plans of the company which were approved by the parent company.
The most important investment of TEŠ is the construction of replacement Unit
6; therefore the mentioned risks predominantly refer to this investment.
ITEM no.
TYPE OF RISK DESCRIPTION OF RISK IMPLICATIONSRISK ASSESSMENT
RISK MANAGEMENT TOOLSPROBABILITY* IMPACT**
1.
Risk associated
with development
of the Unit 6 project
The contractor fails to complete contractual
work in line with the time schedule.
Prolonged deadline for the construction of Unit 6. Loss of
revenueM M
Cooperation of the investor when selecting sub-contractors. Timely coordination of all participants.
Charging of penalties. Service performance guarantee.
Coordination of individual packages
Prolonged deadline for the construction of Unit 6. Loss of
revenueM M
Supervision and coordination of technical representatives by the company (investor).
Technical specifications of the plant are not
achievedLoss of revenue S M
The investor has the option to decline individual techn. assemblies or partial components of the plant. Charging of
penalties.
Delayed transport of equipment
Delayed delivery of equipment to the construction site
M MPreparation of studies on transport of heavy loads, selection
of the method of transport and securing safe transport by eliminating critical points on the selected route.
2. Credit risk
The investor fails to acquire the source of financing by the the
time the liability is due
1.Unsettled liabilities and suspension of work. 2.Costs of
default interestM H
The financial structure has been set up. In the event the government guarantee for the EUR 440 million loan is be
delayed, a back-up scenario has been planned..
3. Market risk
The MTE contract is tied to an escalation clause
regarding changes in price indices
Increased cost of investment. Liquidity issues in settlement
of indexationH H
Planning of investment as per current prices. Monitoring of all contractually defined price indexes, preparation of
prognoses and simulations and and adjustment of cash flow with regard to the simulation.
The company fails to monitor the price of emissions coupons
Higher own price of electricity S M
The annual contract for the purchase of coal, lease of capacity and purchase of electricity concluded between HSE-TEŠ-PV stipulates that only HSE is to manage the CO2 coupons. If this was not the case, TEŠ would manage the
price of emission coupons by purchasing options and entering into forwards.
4. Liquidity risk
The investor fails to acquire the source of financing by the the
time the liability is due
1.Unsettled liabilities and suspension of work. 2.Costs of
default interestS H
Financial management, mostly by planning future cash flows. Liquidity is managed with bridging loans taken out
within the HSE Group (cash management).
5.Interest rate
riskGrowth in interest rate
Inability to pay interest on the loan
S MWith regard to interest rate risk, a procedure for establishing
a risk management policy using derivatives of a financial institution is underway.
6.Regulatory
riskDelayed acquisition of
permits
Non-fulfillment of conditions for drawing of loans. Non-
fulfillment of contractual provisions by the company
M M
The executive officer in charge of the project and the representative of environmental management are
responsible for regular monitoring of engagement of all parties in procedures involving acquisition of required
permits.
Contractor's erection liability insurance and
liability insurance
High cost of settling the damages
S SThe contractors have concluded proper insurance. A
contract on Erection All Risk insurance for the whole project will be signed.
7. Government
risk
The government does not issue a guarantee
for the EIB loan
The financial structure is not closed
S SThe coordination team for finances (appointed under the
decision of Teš's SB and managing director) will execute procedures to secure other sources of financing.
* Probabilityisrankedas:H=high,M=medium,L=low
** Impactisrankedas:H=high,M=medium,L=low
56
A
NN
UA
L R
EP
OR
T 2
01
0 T
erm
oele
ktra
rna
Šošt
anj
In 2010, PR activities continued in accordance and on the basis of the Annual PR
plan and periodic, detailed four-month PR plans.
The basic PR tools for communication with external and internal public remain
TEŠ’s website, press releases, responses, articles and interviews in various local
and national media, the internal publication Pretok, the electricity sector maga-
zine Naš stik and the HSE Group publication HSE Energija. Communication with
the internal public was also carried out via intranet, e-mail and bulletin boards.
The abovementioned tools were used to inform the target public about the
current developments at TEŠ and our development strategy which includes the
construction of Unit 6.
In 2010, we introduced a new permanent activity, i.e. the Open Day at TEŠ
where the visitors had the opportunity to learn more about the Unit 6 project
and the power plant’s operation. The Open Days at TEŠ took place every first
Thursday of the month.
PR activities in relation to the media follow the mutually agreed strategy of
Holding Slovenske elektrarne Group.
4.12 PUBLIC RELATIONS
4.13 RESEARCH AND DEVELOPMENTAs in previous years, our focus on planned objectives was based on a two-level
approach. The first level represents the preparation of study documents, expert
papers dealing with the operation of technological plants, and preparation
of assessments. In the planning documents, this is referred to as “investments
in upgrading of technological procedures”. In pursuit of these activities we
follow the requirements for ensuring safe and reliable operation of plants,
achieving target service lives, improving efficiency levels and introducing new
technologies as well as using technological equipment that meets the modern
standards.
The second level consists of study documents concerning the company’s devel-
opment over a longer period. Before each major step towards development, it
is necessary to define our vision which is supported by studies of development
of electricity markets, energy resources, broader environmental policies and
practices, and by development of electricity production technologies around
the world.
4.14 PLANS FOR THE FUTUREIn the future, the company intends to further pursue the following long-term
goals:
Production of electricity and thermal energy
• Construction of the 600 MW Unit 6 by the end of 2014
• Provision of ancillary services
• Compliance with environmental regulations
• Annual production of more than 400 GWh of thermal energy
Sales of electricity, thermal energy and other services
• Promotion of sales in accordance with the development policy
• Expansion of the product and service range
Purchasing of primary resources, spare parts, materials and services
• Coal consumption < 1,12 tons/MWh
• Gas consumption < 290 Sm3/MWh
• Liquid fuel consumption < 2000 tons/year
• Limestone consumption < 170,000 tons/year
• Consumption of unprocessed water < 11 mill. m3/year
• Purchase of spare parts, materials and services under most favourable terms
Financial assets for development
• Provision of own resources from sale of products and services (profits,
depreciation)
• Provision of loan financing for investments
• Provision of equity financing for investments
Human resources
• Decrease in number of employees
• Higher education level of employees

On 12 January 2011, a loan agreement with EBRD in the amount of EUR 200 mil-
lion was signed for the purposes of financing the construction of replacement
Unit 6.
On 19 January 2011, an expanded project structure of Unit 6 was approved.
New project managers were appointed, and Mr. Miran Žagar, MSc, became the
project director with Mr. Branko Debeljak, MSc, as his deputy.
At the end of January, all the conditions for drawing of the EUR 110 loan with
EIB were met as Slovenia and Austria had resolved the environmental issues
regarding the cross-border effects of Unit 6. On 17 February 2011, the EIB trans-
ferred the amount of the loan to TEŠ.
On 16 February 2011, an Environmental permit for operation of the large com-
bustion plant Unit 6 was obtained which became effective in March 2011. This
permit means that all the conditions for the issue of a building permit for Unit 6
have been met.
At its 54th correspondence meeting on 3 March 2011, TEŠ’s Supervisory Board
approved the proposed business plan of the company for 2011.
On 5 March 2011 a contract for the purchase of coal, lease of capacity and
purchase of electricity was signed, which defines in detail the rights and obliga-
tions of individual contracting parties (TEŠ, HSE and PV) in sale and processing
of coal into electricity, lease of capacity and purchase and sale of electricity
produced from coal and gas in 2011.
On 17 March 2011 we obtained a final and legally enforceable building permit
for the cooling tower and main technological facility of Unit 6.
4.15 IMPORTANT EVENTS AFTER THE END OF THE YEAR

58
A
NN
UA
L R
EP
OR
T 2
01
0 T
erm
oele
ktra
rna
Šošt
anj

ReliabilitySafety
AvailabilityQuality
Determination
DevelopmentKnowledge

5

Soci
al
Resp
onsib
ility R
epor
t
5Changes are the only constant in
our l ife - this is a fact. Ever ything
in nature grows and changes
constantly, although at first sight it
might not appear so. Adapting to the
environment and to the situation in it
means changing our own biorhythm,
structure, composition . . .
That is namely growth. That is why we
are here.

62
A
NN
UA
L R
EP
OR
T 2
01
0 T
erm
oele
ktra
rna
Šošt
anj
5.1.1 HUMAN RESOURCES
Human resourcesAs at 31.12.2010, the number of employees stood at 488, which is 10 less than at
the end of 2009.
The average age of permanent employees was 45 years and 5 months; their
average length of service was 25 years and 2 months. Both indicators have been
slightly declining.
5.1.2 EDUCATION AND TRAINING
At the moment, 23 employees or 4.63% of all employees are involved in part-
time studies. The average age of employees attending part-time studies is 38.1
years. In 2010, two employees completed their studies and acquired a higher
level of professional education.
In 2010, extensive internal training took place involving preparations for an
energy facilities management exam. The exams were organised internally and
passed by 81 employees. Overall, 249 employees underwent internal training.
278 persons were trained by external contractors. Training predominantly
involved training in the area of occupational safety and fire safety in the area of
noise and vibrations, lift operation and first aid.
5.1 RESPONSIBILITY TOWARDS EMPLOYEES
E d u c a t i o n a l s t r u c t u r e o f e m p l o y e e s a s a t 31.12 . 2 010 :
5.2 RESPONSIBILITY TO THE ENVIRONMENTThe company’s environmental responsibility involves focus on monitoring of
emissions from TEŠ, the quality of air in the surrounding areas and analysis of
increased number of hours where 2XMEV was exceeded. Thanks to this manner
of control and measures, we managed to keep annual and monthly averages of
pollutants, such as NOx, CO, SO2 and dust, under emission thresholds at all large
combustion plants.
In the area of CO2 and contribution to global warming, our efforts were directed
towards construction of replacement Unit 6 which will enable a 30% decrease
in CO2 emissions.
To be able to efficiently exploit combustion residue, we monitored production
in greater detail in accordance with the Slovene Technical Approval (STA) issued
10 % VI
11.1 % VII
0.6 % VIII
12.5 % I–III
28.5 % IV
37.3 % V

in connection with TEŠ’s stabilised material and were able to process 93% of
stabilised material with an adequate amount of gypsum.
In order to decrease the waste of water, this year we focused on obtaining
relevant papers for the construction of a decarbonisation centrifuge for muddy
water which will further contribute to improving the balance of the closed
water circuit.
As part of our environmental permit documentation, our application was
amended with additional requirements for the existing plant comprising units
1-5 and both GTs and separately for a larger modification involving Unit 6. The
draft for the environmental permit for existing plants was studied and added
constructive remarks after which we were issued an environmental permit.
With regard to the environmental permit for Unit 6 certain amendments were
made, namely, the condition of plots was reviewed and revised and some
explanations were provided in relation to the relocation of the outlet into the
river Paka, dust emissions and primary measures. The complete application
also included concise documents containing references with regard to the best
available technologies (BAT) for the combustion plant, cooling system and all
new substance reservoirs. In September, another oral discussion and meeting
at the agency took place with regard to Austria’s interest in the Environmental
Impact Report. In October we also met with the representatives of the Republic
of Austria and presented our intentions and studies on cross-border effects.
The public presentation of the environmental permit for Unit 6 took place in
October in Slovenia and in November in Austria. By the end of the year we also
provided written responses to the concerns of NGOs which were presented at
the public presentation.
In the area of ISO 14001, we revised the environmental aspects, redefined the
environmental programmes and completed the periodic internal assessments.
Special attention was devoted to monitoring of the environmental program
involving reduction of NOx emissions below 7,722 tons which was successful
in all aspects. Since this program does not represent an additional investment,
but only optimisation, regular supervision will remain of key importance in the
future.
5.3 RESPONSIBILITY TOWARDS THE WIDER COMMUNITYAt TEŠ we are aware of our implications for the environment, in which we
operate and which we actively shape. We are aware of this in particular because
of the environmental considerations of electricity production. Therefore, we
have adopted an active role in the development of the town by participating in
various projects and providing financial support. We cooperate with numerous
educational institutions and donate to various art associations; among others
we sponsor the mixed choir Svoboda from Šoštanj, TEŠ Octet, and brass band
“Zarja” from Šoštanj. We also sponsor various sport clubs, such as the Elektra
basketball team and the Šoštanj – Topolšica volleyball team to name just a
few. We actively participate in various humanitarian campaigns, supporting
institutions and individuals. At TEŠ we also demonstrate our social responsibil-
ity through our efforts to introduce new and cleaner technologies. We strive
to produce electricity according to the principles of sustainable development,
which also means application of modern technology with a high yield of
energy products, reliability of electricity supply along with acceptable prices
and the lowest possible levels of environmental pollution as well as a low level
of noise pollution. In the coming years, TEŠ’s development will be characterised
by further incorporation of the principles of sustainable development.

64
A
NN
UA
L R
EP
OR
T 2
01
0 T
erm
oele
ktra
rna
Šošt
anj

ReliabilitySafety
AvailabilityQuality
DeterminationDevelopment
Knowledge

6

Fina
ncia
l re
port6
Our employees always keep promises
and they correctly and punctually
complete agreements. Reliability is
their vir tue and because of it we can
rely on them and on their treatment
in ever y moment.

68
A
NN
UA
L R
EP
OR
T 2
01
0 T
erm
oele
ktra
rna
Šošt
anj
6.1 AUDITOR'S REPORT


70
A
NN
UA
L R
EP
OR
T 2
01
0 T
erm
oele
ktra
rna
Šošt
anj
6.2 STATEMENT BY THE MANAGING DIRECTORAs the Managing Director of Termoelektrarna Šoštanj d.o.o. (TEŠ), I hereby
confirm the financial statements of TEŠ for the financial year 2010, the notes
thereto and the accounting policies applied.
I confirm that the accounting policies have been applied consistently
during the preparation of the financial statements, that the accounting
estimates were prepared according to the principles of prudence and good
management and that the annual report gives a true and fair view of the
financial position of the company and the results of its operations in 2010.
I confirm that the financial statements have been prepared in accordance
with provisions of the Companies Act, Slovene Accounting Standards and
other regulations governing the area of accounting. The financial state-
ments have been prepared on the going concern basis.
Managing Director:
Simon Tot, MSc
Š o š t a n j , 3 M a y 2 0 1 1

6.3 INTRODUCTORY NOTES6.3.1 Basis of preparation
In this report, the financial statements and the notes thereto have been
presented in accordance with the Companies Act (ZGD-1) and Slovene Ac-
counting Standards (2006) and for the financial year 2010, which is equal to
the calendar year. The company has no subsidiaries and does not prepare
consolidated financial statements.
The financial statements were drawn up in EUR and rounded to one unit.
6.3.2 Significant accounting assumptions and qualitative characteristics of financial statements
The financial statements have been prepared by observing the following sig-
nificant accounting assumptions:
• accrual basis,
• going concern,
and required qualitative characteristics:
• going concern;
• consistency of valuation methods,
• prudence,
• recognition of revenue and expenses irrespective of their repayment,
• individual valuation of assets and liabilities.
The qualitative characteristics of the financial statements and conse-
quently of the entire accounting process are essentially understandability,
relevance, reliability and comparability.
TPP Šoštanj is a large company and is therefore obligated to prepare an
annual report at the end of the year. In accordance with provisions of Article
57 of the Companies Act, the report has to be reviewed by an auditor in the
manner and under conditions laid down in the Auditing Act.
6.3.3 Exchange rate and method of translation into local currency
In the balance sheet and the income statement, accounting items ex-
pressed in foreign currencies were converted using the reference exchange
rate of the ECB as at the day of the transaction.
The balance of assets and liabilities expressed in a foreign currency on the
balance sheet date was converted to EUR using the reference exchange rate
of the ECB as at the balance sheet date.
6.3.4 Important events after the balance sheet date1 January 2011 - transition to International Financial Reporting Standards on the
basis of a decision by the company member dated 20 August 2010.
6.4 ACCOUNTING POLICIESRecording and valuation of items in the financial statements applied directly
the provisions of Slovene Accounting Standards (2006) except for valuation of
items for which the standards allow different valuation methods. In such cases,
the company applied valuation methods laid down in the Accounting Rules. In
2010, the same accounting policies have been applied as in previous years.
Intangible assets and long-term deferred costs and accrued revenueThe company's intangible assets comprise investments in the acquired long-
term property rights. These include software licences obtained for the perform-
ance of individual functions over a period that is longer than a year, and CO2
emission coupons.
Long-term property rights have a finite useful life, while the useful life of emis-
sion coupons is indefinite.
After recognition, assets are measured using the cost model.
Their value is subsequently decreased by the amount of the amortisation
charge recorded in the accumulated amortisation account. In the balance
sheet, intangible assets are disclosed at carrying amount, i.e. as the difference
between cost and accumulated amortisation.
On initial recognition, these assets are carried at cost. The cost also includes
import and non-refundable purchase taxes. In accordance with Interpretation 1
to SAS 2 Emission Coupons issued by the Expert Council of the Slovene Institute
of Auditors, emission coupons are carried at 1 euro per coupon.
The company calculates amortisation charge on an individual basis, using the
straight-line method, and by taking into account the useful lives of individual
intangible fixed assets. Amortisation begins when an intangible asset is avail-
able for use.
Long-term accrued revenue and deferred costs include payments made by the
company, being an apartment owner, in the reserve fund which will be used to
cover the costs of future maintenance under the Housing Act.
Property, plant and equipment The company's property, plant and equipment comprise land, buildings,
production and other equipment, as well as immovable property and property,
plant and equipment in the course of construction.
After recognition, all groups of property, plant and equipment are measured
using the cost model.
In the bookkeeping records the cost, as well as accumulated depreciation, are
recorded separately for items of property, plant and equipment, whereas in
the balance sheet they are recorded at carrying amount, i.e. as the difference
between the cost and accumulated depreciation.
After initial recognition, an item of property, plant and equipment is carried at
cost. The cost comprises its purchase price, import duties and non-refundable
purchase taxes, and any directly attributable costs of bringing the asset to
condition necessary for it to be capable of operating in the manner intended by

72
A
NN
UA
L R
EP
OR
T 2
01
0 T
erm
oele
ktra
rna
Šošt
anj
management, especially the costs of transportation and installation. The cost
also includes interest on loans taken out to acquire an item of property, plant
and equipment which had been charged until the asset was ready for use. The
cost is reduced by the amount of discounts received.
Recognition of an item of property, plant and equipment in the bookkeep-
ing records and the balance sheet is reversed if an asset is disposed of. The
difference between the net sales value and the carrying amount of a disposed
of item of property, plant and equipment is recorded as revaluation operating
revenue or expense.
- Subsequent costs related to property, plant and equipment Subsequent costs incurred in relation to an item of property, plant and equip-
ment increase the item’s cost if they increase its future economic benefits in
excess of the benefits originally assessed; subsequent costs allowing for the
extension of the useful life of an item of property, plant and equipment initially
reduce previously accounted for accumulated depreciation.
Repairs or maintenance of items of property, plant and equipment are carried
out to restore or maintain future economic benefits expected on the basis
of the originally assessed standard of assets’ performance. As such, they are
recognised as an expense when incurred.
The anticipated costs of major regular inspections and repairs (overhauls) of
property, plant and equipment are considered as part of property, plant and
equipment. They include repairs that are usually carried out every few years
(periodically) and require substantial resources.
- Depreciation The carrying amount of an item of property, plant and equipment is decreased
through depreciation. Depreciation of an item of property, plant and equipment
begins on the first day of the month after the item has been made available for
use. Spare parts of higher value are treated as items of property, plant and equip-
ment which are depreciated regardless of when they have been put into use.
Depreciation is accounted for using the straight-line method. The items of
property, plant and equipment are depreciated individually. Land is not subject
to depreciation.
On the basis of an assessment of fixed assets in 2001, depreciation rates of
property, plant and equipment were adjusted in 2002 to reflect the esti-
mated useful lives of individual production units. The depreciation rates of
individual types of property and equipment thus differ with regard to the
expected useful lives of individual fixed assets.
The depreciation rates which significantly affect the amount of deprecia-
tion charge per production unit are:
Name Property depreciation rate Production equipment depreciation rate Depreciation rate of production equipment parts (overhauls)
Unit 3 19%
Unit 4 1.28% - 3.75% 1.3% - 10% 16%- 30.8%
Unit 5 1.67% - 5% 1.5% - 7.2% 25%
Gas unit 1 and 2 4% 4% - 6.6% 20%- 47%
Depreciation rates of other items of property, plant and equipment ac-
quired in the current and comparative period are as follows:
• vehicles 10% - 20%
• furniture 12.5% - 20%
• computer equipment 20% - 50%
• other equipment 12.5% - 20%.
- Impairment of property, plant and equipmentImpairment of property, plant and equipment items represents a change in
their carrying amount.
When their carrying amount exceeds their recoverable amount, the items of
property, plant and equipment have to be revalued to account for their impair-
ment. The recoverable amount is the higher of the net sales value or the value
in use.
Financial assetsFinancial assets are assets held by the company to increase its financial revenue
through returns on these assets over the short or long term.
The company classifies financial assets under available-for-sale financial assets.
In the company’s books of account, financial assets are recognised based on
their settlement date (payment date).
After initial recognition, financial assets are carried at cost in the company’s
financial statements.
Based on the envisaged settlement or the reason for holding a financial asset,
these are recorded as long-term or current assets in the balance sheet.
Receivables Operating receivables mostly include receivables from products sold, services
provided and from other assets sold. Depending on their maturity, receivables
are carried as long-term or current assets in the balance sheet.
Receivables of all types are initially carried at amounts arising from relevant
documents (invoices, debit notes, contracts) under the assumption that they
will be collected. Initially recorded receivables may subsequently increase
or decrease by any contractually justified amount, irrespective of received
payments or alternative form of settlement. In the balance sheet, receivables
expressed in a foreign currency are converted at the reference exchange rate of
the ECB for a corresponding currency on the last day of the accounting period.
Advances are recognised in the balance sheet in connection with items to
which they refer. They are presented in net amounts reduced by VAT.
Receivables assumed not to be settled by their due date or in their full amount
are considered doubtful receivables; if they result in legal action, they are
considered disputed receivables. Allowances for receivables are made on an
individual basis.
Deferred tax assetsAs a rule, deferred tax assets are recognised if the amounts are material (sig-
nificant), to the extent it is probable that future taxable profit will be available
against which a deferred tax asset can be used in the future.
Assets (disposal groups) held for sale A disposal group comprises assets whose carrying amount can be reasonably
expected to be obtained primarily through disposal rather than their further
use.
The items of property, plant and equipment and intangible assets which are
valued using the cost model and which qualify for classification as available-
for-sale assets (disposal group) are no longer depreciated or amortised; instead
they are measured at the lower of the two: their carrying amount or fair value
less costs to sell.
InventoriesInventories of materials are comprised of materials in the warehouse, in the
process of completion or processing, or in transit from a supplier if already re-
corded by the company. Materials also include small tools (and packaging) with
a useful life of up to one year, but may also comprise small tools with a useful
life exceeding one year if their individual cost does not exceed EUR 500.
Inventories of materials are initially measured at cost, which is made up of
the purchase price, import duties and other non-refundable purchase taxes,
and indirect purchase expenses. Non-refundable purchase taxes also include
non-refundable value added tax. The purchase price is reduced by discounts
received. The company disposes of the following types of inventories: materials,
small tools and unfinished or semi-finished products. Inventories also include
advances for inventories.
The company uses the weighted average cost formula to assess the value of
materials and small tools inventories and to record costs and expenses.
The FIFO method is only used to reassess the value of coal and gas used, be-
cause coal and gas that are purchased first are used first.
CashCash comprises ready cash, deposit money and cash in transit. Ready cash
comprises cash on hand, which is in the form of banknotes, coins and cheques
received. Deposit money is money in accounts with banks or other financial
institutions that can be used for payments. It comprises readily available cash
and cash available at notice. Cash in transit is cash being transferred from the
cash register to an appropriate account held with a bank or other financial
institution which is not recorded as funds in accounts with those institutions on
the same day.
The carrying amount of an item of cash equals its initial nominal value, which
can change due to changes in foreign exchange rates if cash is denominated in
foreign currencies.
Short-term accruals and deferralsOn the balance sheet date, the items of short-term accrued revenue and
deferred costs comprised short-term deferred costs and short-term accrued
revenue. The amounts of short-term deferred costs and short-term accrued
revenue are justified and evident from relevant documents containing informa-
tion on their inception.
On the balance sheet date, short-term accrued costs and deferred revenue
specifically included accrued costs or expenses and value added tax on ad-
vances paid. They are evident from relevant documents containing information
on their inception or are determined or estimated on the basis of the actual
amount of these costs. If in real terms these items are subsequently changed,
costs incurred up to that moment or regular expenses are adjusted for the
difference.
Equity Equity represents funds provided by company owners as well as the company’s
liability to its owners. It comprises the amounts that the owners have invested
in the company and the amounts that have been generated by the company
through its operations.
Long-term provisions and long-term accrued costs and deferred revenueThe purpose of provisions is to accumulate, in the form of accrued costs or
expenses, the amounts that will be available to cover future costs or expenses
when incurred. Such provisions include provisions for jubilee benefits and
termination benefits on retirement. Provisions are set aside on the basis of a
calculation prepared by a certified actuary.
Long-term accrued cost and deferred revenue items are created on the basis
of assets obtained free of charge for investments in property, plant and equip-
ment and intangible fixed assets. Deferrals made in connection with invest-
ments in property, plant and equipment are credited to operating revenue
based on the amount of depreciation charge.
Long-term accrued cost and deferred revenue items created in connection with
emission coupons are credited to operating revenue based on the allocated
share of coupons received free of charge in a financial year.
LiabilitiesLiabilities can be financial and operating, and short-term and long-term.
On initial recognition, all liabilities are valued at amounts arising from relevant
documents evidencing the receipt of cash or settlement of an operating
liability.
Short-term and long-term liabilities of all kinds are initially carried at amounts
which are evident from the relevant documents, on the assumption that credi-
tors demand their repayment. Liabilities are subsequently increased by accrued
returns (interest, other considerations) if an agreement to that effect has been
concluded with the creditor. Liabilities are reduced by the amounts repaid and
any other settlements that may be agreed upon with the creditor. Long-term
liabilities are also decreased by the portion that will have to be repaid in less
than a year, which is recorded as a short-term liability.
Liabilities are not adjusted for the purchasing power of the national currency
unless they are expressed in a foreign currency and there is a change in the
foreign exchange rate, or if they are expressed in the national currency and the
contracting parties have agreed on the revaluation to maintain the real value
of liabilities.
RevenueRevenue is recognised if the increase in economic benefits during the account-
ing period is associated with an increase in assets or decrease in liabilities and if
such increase can be reliably measured. Revenue is recognised when it can be
reasonably expected that it will result in receipts unless such receipts already
arose when the revenue was recorded. Revenue is comprised of operating,
financial and other revenue.
• Revenue from the sale of own products and services is measured on the ba-
sis of selling prices indicated in invoices and other documents, less discounts
given at the time of the sale or afterwards.

74
A
NN
UA
L R
EP
OR
T 2
01
0 T
erm
oele
ktra
rna
Šošt
anj
• Capitalised own products and services comprise services created within
the company and recognised as property, plant and equipment together
with the materials used.
• Other operating revenue comprises government grants received for the
purpose of acquiring fixed assets, emission coupons received from the
state free of charge (under the Environment Protection Act), and premiums
received for exceeding the disabled persons employment quota laid down in
the Vocational Rehabilitation and Employment of Disabled Persons Act.
• Revaluation operating revenue is revenue recognised upon disposal of
property, plant and equipment, and revenue recorded upon decrease in the
reversal of allowances for short-term receivables.
• Financial revenue is revenue arising in connection with short-term invest-
ments and receivables. Financial revenue is recognised upon settlement of
accounts irrespective of receipts, unless there is reasonable doubt as to its
amount, maturity and recoverability.
• Other revenue comprises extraordinary items. It is disclosed in actual
amounts.
ExpensesExpenses are recognised if decreases in economic benefits during the account-
ing period are associated with a decrease in assets or an increase in liabilities
and the respective change can be reliably measured. Expenses are comprised
of operating, financial and other expenses.
• Operating expenses are recognised upon the purchase of goods or the
completion of services.
• Revaluation operating expenses represent the surplus of the carrying
amount over the selling price of property, plant and equipment, as well as
write-downs of property, plant and equipment and operating receivables.
• Financial expenses are incurred in relation to debts, short-term investments
and short-term receivables. They are recognised when the statements of
account are prepared, regardless of the payments associated with them.
Interest is recognised in proportion to the past year and with regard to the
outstanding amount of the principal and the agreed-upon interest rate.
• Other expenses are comprised of extraordinary items.
TaxationThe company is liable to pay tax under the Value Added Tax Act and the Corpo-
rate Income Tax Act.
Cash flow statementThe cash flow statement is prepared using the direct method.
Statement of changes in equityThe statement of changes in equity is prepared according to Format II, i.e. in
the form of a composite spreadsheet which presents changes in all equity
components.
Statement of other comprehensive incomeStatement of other comprehensive income includes items of revenue and ex-
penses that are not recognised in the income statement but affect the amount
of equity.

6.5 FINANCIAL STATEMENTS6.5.1 Balance sheet
in EURITEM NOTE 31/12/2010 31/12/2009
ASSETS 541,317,059 468,171,073
A. LONG-TERM ASSETS 478,424,032 405,865,533
I. Intangible assets and long-term deferred costs and accrued revenue 1 13,553,515 17,919,337
1. Long-term property rights 13,524,345 17,895,051
5. Other long-term accrued revenue and deferred costs 29,170 24,286
II. Property, plant and equipment 2 463,988,911 387,147,501
1. Land and buildings 42,285,816 41,475,781
a) land 3,711,949 3,343,877
b) buildings 38,573,867 38,131,904
2. Production plant and equipment 183,053,767 207,166,360
3. Other plant and equipment 10,601,405 5,771,805
4. Property, plant and equipment being acquired 228,047,923 132,733,555
a) Property, plant and equipment in the course of construction 157,658,702 51,337,128
b) Advances for acquisition of property, plant and equipment 70,389,221 81,396,427
IV. Long-term investments 3 60,003 214,136
1. Long-term investments, excluding loans 60,003 214,136
b) shares and interests in associates 59,503 59,503
c) other shares and interests 500 154,633
V. Long-term operating receivables 4 129,872 148,503
3. Long-term operating receivables due from others 129,872 148,503
VI. Deferred tax assets 5 691,731 436,056
B. CURRENT ASSETS 57,006,408 58,947,609
I. Assets held for sale (or disposal groups) 6 201,723 201,723
II. Inventories 7 12,649,592 12,141,920
1. Material 12,649,592 12,141,920
III. Short-term investments 8 0 1,761,000
2. Short-term loans 0 1,761,000
b) short-term loans to others 0 1,761,000
IV. Short-term operating receivables 9 44,107,479 44,840,166
1. Short-term operating receivables due from group companies 40,646,748 39,512,292
2. Short-term operating trade receivables 1,804,973 1,527,748
3. Short-term operating receivables due from others 1,655,758 3,800,126
V. Cash 10 47,614 2,800
C. SHORT-TERM ACCRUED REVENUE AND DEFERRED COSTS 11 5,886,619 3,357,931

76
A
NN
UA
L R
EP
OR
T 2
01
0 T
erm
oele
ktra
rna
Šošt
anj
The accompanying notes are an integral part of financial statements and should be read in conjunction with the statements.
in EURITEM NOTE 31/12/2010 31/12/2009
EQUITY AND LIABILITIES 541,317,059 468,171,073
A. EQUITY 12 348,575,114 344,372,708
I. Called-up capital 203,480,559 203,480,559
1. Nominal capital 203,480,559 203,480,559
II. Capital surplus 116,883,008 116,883,008
III. Revenue reserves 24,207,696 23,945,329
1. Legal reserves 1,599,999 1,389,879
5. Other revenue reserves 22,607,697 22,555,450
IV. Revaluation surplus 11,565 11,565
VI. Net profit or loss for the period 3,992,286 52,247B. PROVISIONS AND LONG-TERM ACCRUED COSTS AND DEFERRED REVENUE
17,232,912 22,189,556
1. Provisions for pensions and similar liabilities 13 2,778,303 2,604,604
3. Long-term accrued costs and deferred revenue 14 14,454,609 19,584,952
C. LONG-TERM LIABILITIES 23,471,768 33,749,027
I. Long-term financial liabilities 15 23,465,160 33,738,328
2. Long-term financial liabilities to banks 23,465,160 33,738,328
II. Long-term operating liabilities 16 6,608 10,699
5. Other long-term operating liabilities 6,608 10,699
D. SHORT-TERM LIABILITIES 146,245,060 64,501,078
II. Short-term financial liabilities 17 90,718,257 10,273,169
1. Short-term financial liabilities to group companies 80,445,088 0
2. Short-term financial liabilities to banks 10,273,169 10,273,169
III. Short-term operating liabilities 18 55,526,803 54,227,909
1. Short-term operating liabilities to group companies 24,941,314 24,652,529
2. Short-term trade liabilities 21,252,394 22,946,025
4. Short-term operating liabilities from advances 224 343
5. Other short-term operating liabilities 9,332,871 6,629,012
E. SHORT-TERM ACCRUED COSTS AND DEFERRED REVENUE 19 5,792,205 3,358,704

6.5.2 Income statement
The accompanying notes are an integral part of financial statements and should be read in conjunction with the statements.
in EURITEM NOTE 2010 2009
1. Net sales revenue 1 242,009,537 227,363,689
a) Domestic market 241,915,738 227,268,662
- from relations with group companies 236,048,038 221,862,047
- from relations with others 5,867,700 5,406,615
b) Foreign market 93,799 95,027
3. Capitalised own products and own services 2 15,619 4,210,270
4. Operating revenue 3 5,361,813 5,376,560
- other 5,304,884 5,318,344
- from revaluation 56,929 58,216
GROSS RETURN ON OPERATIONS 247,386,969 236,950,519
5. Costs of goods, materials and services 4 172,897,147 173,279,588
b) Costs of materials 154,614,096 157,291,762
c) Costs of services 18,283,051 15,987,826
6. Labour costs 5 18,927,745 18,607,149
a) Costs of salaries 13,792,705 13,910,400
b) Social security costs 2,986,604 2,956,316
- pension insurance costs 1,927,643 1,910,476
- other social security costs 1,058,961 1,045,840
c) Other labour costs 2,148,436 1,740,433
7. Write-downs in value 32,396,123 29,520,836
a) Depreciation or amortisation 6 32,359,714 28,839,233
b) Operating expenses from revaluation of intangible assets and property plant and equipment
16,803 668,931
c) Revaluation operating expenses associated with operating current assets 19,606 12,672
8. Other operating expenses 7 16,548,629 13,882,940
TOTAL OPERATING EXPENSES 240,769,644 235,290,513
PROFIT OR LOSS ON OVERALL OPERATIONS 6,617,325 1,660,006
10. Financial revenue from loans 3,370 186,148
- to others 3,370 186,148
11. Financial revenue from operating receivables 7,563 8,289
- from others 7,563 8,289
TOTAL FINANCIAL REVENUE 8 10,933 194,437
12. Financial expenses arising from impairment and write-downs of investments 154,133 0
13. Financial expenses for financial liabilities 1,245,863 1,907,144
- financial expenses for loans received from group companies 18,630 0
- financial expenses for loans received from banks 1,227,233 1,907,144
14. Financial expenses for operating liabilities 76,565 1,464
- financial expenses for operating liabilities to group companies 75,713 0
- financial expenses for trade liabilities and bills payable 399 78
- financial expenses for other operating liabilities 453 1,386
TOTAL FINANCIAL EXPENSES 1,476,561 1,908,608
PROFIT OR LOSS ON ORDINARY ACTIVITIES 5,151,697 (54,165)
15. Other revenue 63,779 200,151
16. Other expenses 30,277 2,146
TOTAL PROFIT OR LOSS 5,185,199 143,840
17. Corporate income tax 10 1,238,467 97,157
18. Deferred taxes 10 (255,674) (8,314)
19. NET PROFIT OR LOSS FOR THE PERIOD 4,202,406 54,997

78
A
NN
UA
L R
EP
OR
T 2
01
0 T
erm
oele
ktra
rna
Šošt
anj
STATEMENT OF OTHER COMPREHENSIVE INCOME
6.5.3 Cash flow statement (direct method)
The accompanying notes are an integral part of financial statements and should be read in conjunction with the statements.
in EURITEM 2010 2009
19. NET PROFIT OR LOSS FOR THE PERIOD 4,202,406 54,997
20. Changes in revaluation surplus for IA and PPE 0 0
21. Changes in revaluation surplus of available-for-sale financial assets 0 0
22.Gains and losses associated with translation of fin. statements of entities abroad (impact of changes in foreign exchange rates)
0 0
23. Other components of comprehensive income 0 0
24. TOTAL COMPREHENSIVE INCOME FOR THE ACCOUNTING PERIOD 4,202,206 54,997
in EURITEM 2010 2009
A CASH FLOWS FROM OPERATING ACTIVITIES
a) Cash receipts from operating activities 303,937,979 302,881,699
1. Cash receipts from electricity operations 278,402,873 292,180,949
a) Domestic market 278,402,873 292,180,949
2. Cash receipts from heat operations 5,219,196 5,640,785
3. VAT-related cash receipts 14,990,680 0
4. Other cash receipts from operating activities 5,325,230 5,059,965
b) Cash disbursements for operating activities (242,422,648) (252,580,139)
1. Cash disbursements for electricity operations (169,173,051) (167,317,381)
a) Domestic market (169,173,051) (167,317,381)
2. Cash disbursements for heat operations (3,826,300) (3,732,121)
3. VAT-related cash disbursements (4,760,548) (9,459,577)
4. Cash disbursement for other duties (7,266,532) (18,591,822)
5. Cash disbursements for maintenance, materials and services (33,725,830) (31,467,682)
6. Cash disbursements for salaries and employee profit participation (19,346,783) (18,271,651)
7. Other cash disbursements for operating activities (4,323,604) (3,739,905)
c) Net cash from operating activities 61,515,331 50,301,560
B CASH FLOWS FROM INVESTING ACTIVITIES
a) Cash receipts from investing activities 103,665,370 433,676
1. Receipts from interest and profit participations related to investing activities 3,191 186,130
3. Cash receipts from disposal of property, plant and equipment 58,179 247,546
6. Cash receipts from disposal of short-term investments 103,604,000 0
a) Deposits received 103,604,000 0
b) Cash disbursements from investing activities (233,915,177) (122,951,783)
1. Cash disbursements to acquire intangible assets (111,567) (177,402)
2. Cash disbursements to acquire property, plant and equipment (131,960,610) (121,012,881)
4. Cash disbursements to acquire long-term investments (500)
5. Cash disbursements to acquire short-term investments (101,843,000) (1,761,000)
c) Net cash from investing activities (130,249,807) (122,518,107)
C CASH FLOWS FROM FINANCING ACTIVITIES
a) Cash receipts from financing activities 146,595,000 85,458,800
1. Receipts from paid-in capital 0 85,458,800
3. Cash proceeds from increase in short-term financial liabilities 146,595,000 0
b) Disbursements for financing activities (77,815,710) (13,287,026)
1. Interest paid on financing activities (1,247,541) (1,918,464)
3. Disbursements for repayment of non-current financial liabilities (10,273,169) (11,368,562)
4. Cash repayments of short-term financial liabilities (66,295,000) 0
c) Net cash from financing activities 68,779,290 72,171,774
D CLOSING BALANCE OF CASH 47,614 2,800
x) Net cash flow for the period 44,814 (44,773)
y) Opening balance of cash 2,800 47,573
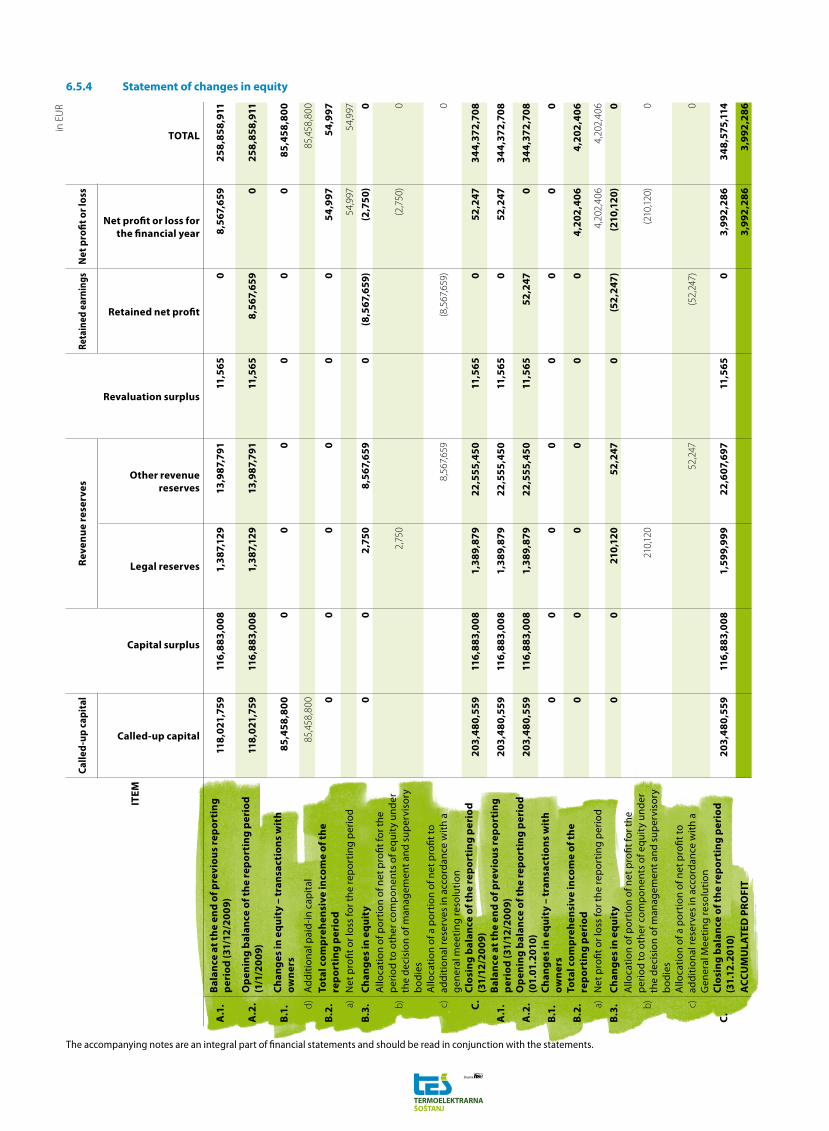
6.5.4 Statement of changes in equity
The accompanying notes are an integral part of financial statements and should be read in conjunction with the statements.
ITEM
Calle
d-u
p ca
pita
l
Capital surplus
Rev
enu
e re
serv
es
Revaluation surplus
Reta
ined
ear
ning
sN
et p
rofi
t or l
oss
TOTAL
Called-up capital
Legal reserves
Other revenue reserves
Retained net profi t
Net profi t or loss for the fi nancial year
A.1
.B
alan
ce a
t th
e en
d o
f pre
vio
us
rep
ort
ing
p
erio
d (3
1/12
/20
09)
118
,021
,759
116,
883,
008
1,38
7,12
913
,987
,791
11,5
650
8,5
67,6
5925
8,8
58,9
11
A.2
.O
pen
ing
bal
ance
of t
he
rep
ort
ing
per
iod
(1
/1/2
009
)11
8,0
21,7
5911
6,88
3,0
081,
387,
129
13,9
87,7
9111
,565
8,5
67,6
590
258
,858
,911
B.1
.C
han
ges
in e
qu
ity
– tr
ansa
ctio
ns
wit
h
ow
ner
s85
,458
,80
00
00
00
085
,458
,80
0
d)A
dd
itio
nal p
aid
-in c
apit
al85
,458
,800
85,4
58,8
00
B.2
.To
tal c
om
pre
hen
sive
inco
me
of t
he
rep
ort
ing
per
iod
00
00
00
54,9
9754
,997
a)N
et p
rofi t
or l
oss
for t
he re
por
ting
per
iod
54,9
9754
,997
B.3
.C
han
ges
in e
qu
ity
00
2,7
508
,567
,659
0(8
,567
,659
)(2
,750
)0
b)
Allo
cati
on o
f por
tion
of n
et p
rofi t
for t
he
per
iod
to o
ther
com
pon
ents
of e
qui
ty u
nd
er
the
dec
isio
n of
man
agem
ent a
nd
sup
ervi
sory
b
od
ies
2,75
0(2
,750
)0
c)A
lloca
tion
of a
por
tion
of n
et p
rofi t
to
add
itio
nal r
eser
ves
in a
ccor
dan
ce w
ith
a g
ener
al m
eeti
ng re
solu
tion
8,56
7,659
(8,5
67,6
59)
0
C.
Clo
sin
g b
alan
ce o
f th
e re
po
rtin
g p
erio
d
(31/
12/2
009
)20
3,4
80,5
5911
6,88
3,0
081,
389,
879
22,5
55,4
5011
,565
052
,247
344
,372
,708
A.1
.B
alan
ce a
t th
e en
d o
f pre
vio
us
rep
ort
ing
p
erio
d (3
1/12
/20
09)
203,
480
,559
116,
883,
008
1,38
9,87
922
,555
,450
11,5
650
52,2
4734
4,3
72,7
08
A.2
.O
pen
ing
bal
ance
of t
he
rep
ort
ing
per
iod
(0
1.01
.201
0)20
3,4
80,5
5911
6,88
3,0
081,
389,
879
22,5
55,4
5011
,565
52,2
470
344
,372
,708
B.1
.C
han
ges
in e
qu
ity
– tr
ansa
ctio
ns
wit
h
ow
ner
s0
00
00
00
0
B.2
.To
tal c
om
pre
hen
sive
inco
me
of t
he
rep
ort
ing
per
iod
00
00
00
4,2
02,4
06
4,2
02,4
06
a)N
et p
rofi t
or l
oss
for t
he re
por
ting
per
iod
4,20
2,40
64,
202,
406
B.3
.C
han
ges
in e
qu
ity
00
210,
120
52,2
470
(52
,247
)(2
10,1
20)
0
b)
Allo
cati
on o
f por
tion
of n
et p
rofi t
for t
he
per
iod
to o
ther
com
pon
ents
of e
qui
ty u
nd
er
the
dec
isio
n of
man
agem
ent a
nd
sup
ervi
sory
b
od
ies
210,
120
(210
,120)
0
c)A
lloca
tion
of a
por
tion
of n
et p
rofi t
to
add
itio
nal r
eser
ves
in a
ccor
dan
ce w
ith
a G
ener
al M
eeti
ng re
solu
tion
52,2
47(5
2,24
7)0
C.
Clo
sin
g b
alan
ce o
f th
e re
po
rtin
g p
erio
d
(31.
12.2
010)
203,
480
,559
116,
883,
008
1,59
9,99
922
,607
,697
11,5
650
3,99
2,2
8634
8,5
75,1
14
AC
CU
MU
LATE
D P
RO
FIT
3,99
2,2
863,
992
,286
in E
UR

80
A
NN
UA
L R
EP
OR
T 2
01
0 T
erm
oele
ktra
rna
Šošt
anj
6.6 NOTES TO THE FINANCIAL STATEMENTS
6.6.1 Notes to the balance sheet
Note 1Intangible assets and long-term accrued revenue and deferred costs EUR 13,553,515
INTANGIBLE ASSETS AND LONG-TERM ACCRUED REVENUE AND DEFERED COSTS in EUR
31/12/2010 31/12/2009 Index
Intangible assets 13,524,345 17,895,051 76
Other long-term accrued revenue and deferred cost items 29,170 24,286 120
TOTAL 13,553,515 17,919,337 76
INTANGIBLE ASSETS in EUR
31. 12. 2010 31. 12. 2009 Index
Licences and other software 621,710 689,080 90
Emission coupons 12,902,635 17,205,971 75
Total 13,524,345 17,895,051 76
The predominant share of intangible assets is comprised of emission coupons. Pursuant to the Environment Protection Act, Ordinance on the National
Plan for the Allocation of Emission Coupons for the period 2008-2012 and Decision on Emission Coupons, the government allocated 21,504,120 emission
coupons to the company free of charge for this period. The quantity of emission coupons divided proportionately by year is 4,300,824 coupons.
In April 2010, the balance of emission coupons decreased by 4,573,225. The coupons were used for settlement of liabilities to the government for emissions
released in 2009. As at 31.12.2010, TEŠ had 12,902,635 coupons left.
Intangible assets include EUR 621,710 worth of licences and other software which are, depending on their useful lives, amortised at a rate of between 7.6%
and 50%.
The company does not have any intangible fixed assets under finance lease or mortgage.
CHANGES IN INTANGIBLE ASSETS in EUR
INTANGIBLE ASSETS LICENCES AND OTHER SOFTWARE EMISSION COUPONS TOTAL
Cost as at 31/12/2009 1,220,721 17,205,971 18,426,692
Acquisitions 129,473 3,468,074 3,597,547
Disposals 0 (7,771,420) (7,771,420)
Cost as at 31/12/2010 1,350,194 12,902,625 14,252,819
Written down value as at 31/12/2009 531,641 531,641
Amortisation 196,842 196,842
Written down value as at 31/12/2010 728,483 728,483
Carrying amount as at 31/12/2009 689,080 17,205,971 17,895,051
Carrying amount as at 31/12/2010 621,710 12,902,625 13,524,335
Note 2
Property, plant and equipment EUR 463,988,911
PROPERTY, PLANT AND EQUIPMENT in EUR
31/12/2010 31/12/2009 Index
Land 3.711.949 3.343.877 111
Buildings 38.573.867 38.131.904 101
Production plant and equipment 183.053.767 207.166.360 88
Other plant and equipment 10.601.405 5.771.805 184
PPE in the course of construction 157.658.702 51.337.128 307
Advances for acquisition of PPE 70.389.221 81.396.427 86
TOTAL PPE 463.988.911 387.147.501 120
The value of assets was assessed by certified appraisers based on the balance as at 31.12.2001. The company checked for potential signs of impairment and
determined there were none.

CH
AN
GES
IN P
RO
PER
TY,
PLA
NT
AN
D E
QU
IPM
ENT
in E
UR
PRO
PERT
Y, P
LAN
T A
ND
EQ
UIP
MEN
TLA
ND
BUIL
DIN
GS
PRO
DU
CTIO
N P
LAN
T A
ND
EQ
UIP
MEN
TO
THER
PLA
NT
AN
D
EQU
IPM
ENT
PPE
IN C
OU
RSE
OF
CON
STRU
CTIO
NA
DVA
NCE
S FO
R AC
QU
ISIT
ION
OF
PPE
TOTA
L
Cost
as
at 3
1/12
/200
93,
343,
877
220,
121,
005
1,01
9,70
6,78
514
,128
,876
51,3
37,1
2881
,396
,427
1,39
0,03
4,09
8
Acq
uisi
tion
s83
,200
403,
595
403,
656
107,4
01,4
141,
622,
400
109,
914,
265
Tran
sfer
from
ong
oing
cap
ital
in
vest
men
ts36
8,07
24,
982,
703
2,15
2,35
66,
022,
509
(13,
525,
640)
0
Oth
er tr
ansf
ers
67,9
82(3
7,982
)12
,599
,606
(12,
629,
606)
0
Dis
pos
als
(83,
200)
(17,8
88,7
70)
(824
,431
)(2
13,9
86)
(153
,806
)(1
9,16
4,19
3)
Rev
alua
tion
3,71
1,94
920
7,21
4,93
81,
021,
506,
287
20,3
03,0
7315
7,65
8,70
270
,389
,221
1,48
0,78
4,17
0
Wri
tten
-dow
n va
lue
as a
t 31
/12/
2009
181,
989,
101
812,
540,
425
8,35
7,07
11,
002,
886,
597
Dep
reci
atio
n3,
880,
621
26,7
36,5
081,
545,
743
32,1
62,8
72
Dis
pos
als
(17,2
28,6
51)
(824
,413
)(2
01,14
6)(1
8,25
4,21
0)
Wri
tten
-dow
n va
lue
as a
t 31
/12/
2010
168,
641,
071
838,
452,
520
9,70
1,66
81,
016,
795,
259
Car
ryin
g am
ount
as
at
31/1
2/20
093,
343,
877
38,1
31,9
0420
7,16
6,36
05,
771,
805
51,3
37,1
2881
,396
,427
387,
147,
501
Car
ryin
g am
ount
as
at
31/1
2/20
103,
711,
949
38,5
73,8
6718
3,05
3,76
710
,601
,405
157,
658,
702
70,3
89,2
2146
3,98
8,91
1
For assets in the course of construction, predominantly referring to the replacement Unit 6, it is planned in the Revised investment program, Audit 3, Ad-
dendum 1 (October 2009), that at a 7% discount rate the net present value of the investment will be positive with the internal rate of return reaching 7.2%.
The company does not have any items of property, plant and equipment under finance lease or mortgage.

82
A
NN
UA
L R
EP
OR
T 2
01
0 T
erm
oele
ktra
rna
Šošt
anj
Acquisition of intangible assets and property, plant and equipment, including advances, was predominantly financed from short-term bridging loans
taken out with HSE Group companies in the amount of EUR 80,300,000 million. The short-term bridging loans from group companies will be repaid in 2011
through drawing of the planned long-term loan from EIB. The company spent EUR 3,269,902 of capital increase, EUR 22,086,545 of depreciation assets and
EUR 4,387,291 of other own funds for financing of investments in fixed assets.
Land 3,711,949 EUR
Increase in the value of land refers to the capitalisation of land purchased for the construction of Unit 6.
Buildings 38,573,867 EUR
The predominant share of the increase in the value of buildings is represented by the transfer of the new office building to fixed assets in the amount of
EUR 4,429,443, initiation of individual projects within the scope of investments in reliable production in the amount of EUR 260,351 (renovation of the
industrial water distribution system, renovation of FGD4) and transfer to fixed assets of other buildings in the amount of EUR 292,910. The value of buildings
decreased due to demolition of the old office building, cooling towers I and II, channel system next to the cooling tower, and additive desulphurisation of
flue gases on Units 1-3 for the purposes of setting up the construction site for Unit 6.
Production plants, machinery and other equipment 193,655,172 EUR
Acquisition of production plants in the amount of EUR 2,152,356 predominantly represents the initiation of investments in reliable production, i.e. invest-
ments in the renovation of FGD plant on Unit 4 and mill rotors. The majority of increases in value of other equipment in the amount of EUR 5,908,527 refer
to transfer to fixed assets of the telecommunication hub equipment and office building.
The value of production plants, machinery and other equipment decreased by the amount of the depreciation charge.
Property, plant and equipment in the course of construction 157,658,702 EUR
The bulk of the increase in fixed assets in the course of construction relates to investments in the construction of Unit 6 in the amount of EUR 97,117,428. In
accordance with the time schedule pursuant to the Contract on planning, supply and construction of the power plant “Šoštanj Unit 6” object (Alstom), TEŠ
invested EUR 73,590,234 million. Other investments in Unit 6 represent investments in flue gas desulphurisation plants, construction of the cooling tower
and other investments, such as advisory, surveying services, preparation of the building permit documentation and investment design.
The estimated value of construction of replacement Unit 6 is EUR 1,189.1 million (Revised NIP, Addendum 1). By the end of 2010, the company concluded
EUR 834.9 million worth of contracts for the supply of main technological equipment, flue gas desulphurisation plant, cooling system and other items.
Larger increases include investments in the TC centre with an office building in the amount of EUR 6,919,051 and investments in reliable production in the
amount of EUR 3,059,389 through which TEŠ manages the risks related to production shortfalls and electricity supply. These investments predominantly
include the replacement of Unit 5 generator, Unit 5 mill rotors and renovation of the hydrogen plant.
In 2010, the amount of capitalised projects totalled EUR 13,214,679. The total value of unfinished projects is EUR 157,658,702.
CHANGES IN INVESTMENTS IN PROPERTY, PLANT AND EQUIPMENT IN COURSE OF CONSTRUCTION in EUR
Unit 5 gas combined
system and GCS 5/gas
Investments in production
reliability
Capital investment documents
Investments in Unit 6
TC centre and office building
Other PPE being acquired
TOTAL
Carrying amount as at 31/12/2009 0 12,236,086 517,035 35,451,549 2,957,262 175,196 51,337,128
Acquisitions 7,350 3,059,389 123,271 97,117,428 6,919,051 174,925 107,401,414Transfer from ongoing capital investments
(7,350) (2,188,577) (19,800) (660,982) (10,337,970) (310,961) (13,525,640)
Other transfers 0 0 0 12,137,949 461,657 0 12,599,606
Disposals 0 0 (43,069) (110,737) 0 0 (153,806)
Carrying amount as at 31/12/2010 0 13,106,898 577,437 143,935,207 0 39,160 157,658,702
Advances for property, plant and equipment EUR 70,389,221
Advances for fixed assets represent advance payments to suppliers for investments in the project for construction of the new Unit 6. They are disclosed in
net amounts. Advances refer to payments to the suppliers (Alstom) under the Contract on planning, supply and construction of the power plant “Šoštanj
Unit 6” facility. The value of advances decreased by the proportionate amount that had already been invoiced, in accordance with already charged deliver-
ies in connection with the project.

Note 3
Long-term investments EUR 60,003
LONG-TERM INVESTMENTS in EUR
31/12/2010 31/12/2009 Index
Interest in associates 59,503 59,503 100
Other interests 500 154,633 0
Total 60,003 214,136 28
Long-term investments are classified as available-for-sale financial assets. The value of long-term investments recorded in the balance sheet represents
their cost.
CHANGES IN LONG-TERM INVESTMENTS EXCLUDING LOANS in EURINVESTMENTS IN SHARES
AND INTERESTS OF ASSOCIATES
OTHER INVESTMENTS IN SHARES AND INTERESTS
TOTAL
Carrying amount as at 31/12/2009 59,503 154,633 214,136
Revaluation 0 (154,133) (154,133)
Carrying amount as at 31/12/2010 59,503 500 60,003
Investments in interests of associates include a 26% ownership interest in the company Erico.
Other interests in the amount of EUR 500 represent investments in the Centre of Excellence Low-carbon Technologies (Center odličnosti nizkoogljične
tehnologije - CO NOT).
Other interests in the amount of EUR 154,133 represent funds invested in holiday homes (Krvavec, Rab, Portorož). The funds were invested and pooled at
EGS Maribor (the legal successor of ELDOM d.o.o. Maribor). On 31.12.2010, the company’s investment in holiday homes in the amount of EUR 154,133 was
impaired due to formally unresolved ownership and management relations and unexpected future cash flows.
Note 4
Long-term operating receivables EUR 129,872
LONG-TERM OPERATING RECEIVABLES in EUR
31/12/2010 31/12/2009 Index
Long-term advances given 96,465 96,465 100
Long-term receivables from apartment buyers 33,407 52,038 64
Total 129,872 148,503 87
Long-term operating receivables are not secured and have not yet fallen due.
LONG-TERM OPERATING RECEIVABLES BY MATURITY
Maturity date Total
before 31/12/2013 from 1/1/2014 to 31/12/2015 after 1/1/2016
Long-term operating receivables from others 24,216 15,379 90,277 129,872
Total 24,216 15,379 90,277 129,872
Note 5
Deferred tax assets EUR 691,731
DEFERRED TAX ASSETS in EUR
31/12/2010 31/12/2009 Index
Deferred tax assets 691,731 436,056 159
Total 691,731 436,056 159
Deferred tax assets are recorded in connection with the creation of long-term provisions for jubilee benefits and termination benefits on retirement, the
amortisation/depreciation rates exceeding those laid down by the Corporate Income Tax Act (ZDDPO-2), and impairment of long-term investments.

84
A
NN
UA
L R
EP
OR
T 2
01
0 T
erm
oele
ktra
rna
Šošt
anj
CHANGES IN DEFERRED TAX ASSETS in EUR
PROVISIONS IMPAIRMENT AMOR./DEPR. TOTAL
Value as at 31/12/2009 436,056 0 0 436,056
Creation, increase 38,233 30,827 228,341 297,401
Utilisation, decrease (41,726) 0 0 (41,726)
Value as at 31/12/2010 432,563 30,827 228,341 691,731
Note 6
Assets (disposal groups) held for sale 201,723 EUR
ASSETS (DISPOSAL GROUPS) HELD FOR SALE in EUR
31/12/2010 31/12/2009 Index
Assets held for sale 201,723 201,723 100
Total 201,723 201,723 100
Assets held for sale include a part of the Crikvenica holiday complex because it can be reasonably expected it will be settled with a sale.
Note 7
Inventories EUR 12,649,592
INVENTORIES in EUR
31/12/2010 31/12/2009 Index
Materials 12,492,529 11,979,902 104
Small tools and packaging 157,063 162,018 97
Total 12,649,592 12,141,920 104
Inventories are mostly comprised of spare parts in the amount of EUR 9,465,488 and maintenance materials in the amount of EUR 2,297,572. These are
needed to repair defects on production equipment as soon as possible, thus ensuring reliable operation. Inventories have increased due to procurement of
strategic spare parts for the Unit 5 desulphurisation plant which will be installed during the first longer shut down of the plant or, at the latest, during the
overhaul of Unit 5.
During the year, EUR 95,981 worth of material was written off from inventory due to changes in quality and value. After the inventory count of materials,
surpluses of EUR 624 and shortages of EUR 137 were determined.
The carrying amount of inventories does not exceed their realisable value.
Note 8
Short-term investments EUR 0
SHORT-TERM INVESTMENTS in EUR
31/12/2010 31/12/2009 Index
Short-term deposits 0 1,761,000
Total 0 1,761,000
At the end of 2010, the company did not record any short-term deposits.

Note 9
Short-term operating receivables EUR 44,107.479
SHORT-TERM OPERATING RECEIVABLES in EUR
31/12/2010 31/12/2009 Index
Short-term trade receivables in Slovenia 42,446,517 41,036,151 103
Short-term foreign trade receivables 5,204 3,889 134
Short-term advances for services in Slovenia not yet rendered 1,152 2,924 39
Short-term receivables associated with financial income 4,147 80,332 5
Short-term receivables from the government 1,632,782 3,695,493 44
Short-term receivables from others 17,677 21,377 83
Total 44,107,479 44,840,166 98
On the balance sheet date, the fair value of operating receivables was equal to their carrying amount.
SHORT-TERM OPERATING RECEIVABLES FROM GROUP COMPANIES in EUR
GROUP COMPANY COUNTRY 31/12/2010 31/12/2009
Holding slovenske elektrarne d.o.o. Slovenia 40,415,618 39,413,604
Premogovnik Velenje d.d. Slovenia 159,036 58,656
HSE Invest d.o.o. Slovenia 2,984 0
HTZ Velenje d.o.o. Slovenia 197 0
Termoelektrarna Trbovlje d.o.o. Slovenia 68,912 38,499
RGP Velenje d.o.o. Slovenia 0 1,533
Total 40,646,747 39,512,292
The major part of receivables from group companies consists of receivables from Holding Slovenske elektrarne d.o.o. in the amount of EUR 40,203,256 for the sale of
electricity which are secured with a blank bill of exchange.
Receivables for thermal energy sold are also secured with a blank bill of exchange. The collateralisation of other receivables is not required due to their specific nature.
BREAKDOWN OF SHORT-TERM RECEIVABLES BY MATURITY in EUR
MATURITY DATE 31/12/2010 31/12/2009
Not yet due 43,960,069 44,593,058
Due - up to 3 months 149,517 167,585
Due - up to 3 to 6 months 4,626 15,331
Due - over 6 months 36,500 92,512
44,150,712 44,868,486
Overdue and outstanding trade receivables represent receivables for thermal energy sold, receivables for apartment rents and receivables from the sale of
fly ash.
CHANGES IN ALLOWANCE FOR RECEIVABLES in EUR
Trade receivables TOTAL
Carrying amount 28,321 28,321
utilisation (4,793) (4,793)
creation 19,607 19,607
Carrying amount 43,135 43,135
Allowances for receivables were predominantly made in relation to lessees of apartments; they were made according to the individual assessment of each receivable.
Note 10
Cash EUR 47,614
CASH in EUR
31/12/2010 31/12/2009 Index
Cash on hand 260 378 69
Cash on bank account 47,354 2,422 1,955
Total 47,614 2,800 1,701

86
A
NN
UA
L R
EP
OR
T 2
01
0 T
erm
oele
ktra
rna
Šošt
anj
Note 11
Short-term accrued revenue and deferred costs EUR 5,886,619
ACCRUED REVENUE AND DEFERRED COSTS in EUR
31/12/2010 31/12/2009 Index
Short-term deferred costs and expenses 223,078 159,499 140
Short-term accrued revenue 5,663,541 3,198,432 177
Total 5,886,619 3,357,931 175
Short-term accrued revenue and deferred costs include deferred costs related to services that were invoiced but not rendered in 2010 and accrued revenue.
The majority of short-term accrued revenue in the amount of EUR 5,659,866 consists of revenue from capacity leased in 2010 and is related to Annex 3 to the con-
tract for the purchase of coal, lease of capacity and purchase of electricity in which the contracting parties agreed to change the amount for the leased capacity in
2010 in order to settle the costs related to the purchase of insufficient CO2 emission coupons in 2010.
Note 12
Equity EUR 348,575,114
The company's total equity comprises nominal capital, capital surplus, revenue reserves, revaluation surplus and temporarily unallocated net profit for the year.
The accounting amount of the company’s nominal capital is determined in the Articles of Incorporation and has been duly registered with the Court. It totals EUR
203,480,559.
Capital surplus totals EUR 116,883,008 and is a result of reversal of the general equity revaluation adjustment.
Revenue reserves in the amount of EUR 24,207,696 comprise legal reserves in the amount of EUR 1,599,999 and other revenue reserves in the amount of EUR
22,607,697.
Revenue reserves increased by EUR 262,367 during the year, with the increase consisting of:
• other revenue reserves in the amount of EUR 52,247 under the decision of the company member regarding the net profit for 2009, and
• legal reserves in the amount of EUR 210,120 under the managing director’s decision and in accordance with the provisions of the Companies Act for the portion
of net profit for 2010.
The specific revaluation adjustment relating to land amounted to EUR 11,565.
Retained earnings from 2009 of EUR 52,247 were allocated to other revenue reserves under the decision of the company member.
The net profit for 2010 in the amount of EUR 4,202,406 has been, in accordance with the provisions of the Companies Act and the managing director’s decision,
allocated to legal revenue reserves in the amount of EUR 210,120; the remaining portion in the amount of EUR 3,992,286 remained unallocated. The remaining net
profit of the financial year represents the accumulated profit.
Note 13
Provisions for pensions and similar liabilities EUR 2,778,303
CHANGES IN PROVISIONS FOR PENSIONS AND OTHER LIABILITIES in EUR
Provisions for jubilee benefits Provisions for termination benefits TOTAL
Carrying amount as at 31/12/2009 987,687 1,616,917 2,604,604
Increases/transfers between accounts 139,717 242,610 382,327
Decreases (117,422) (91,206) (208,628)
Carrying amount as at 31/12/2010 1,009,982 1,768,321 2,778,303
Long-term provisions represent provisions for jubilee benefits and termination benefits on retirement as determined by the actuarial calculation on 31.12.2010.
The actuarial calculation was based on the following assumptions:
• the average salary growth in the Republic of Slovenia of 3.5%, and
• the applied discount interest rate of 4.9% p.a.

Note 14
Long-term accrued costs and deferred revenue EUR 14,454,609
CHANGES IN ACCRUED COSTS AND DEFERRED REVENUE in EUR
ACCRUED COSTS AND DEFERRED REVENUE
Unit 4 flue gas desulp-hurisation plant (go-
vernment budget and EKO fund)
Unit 5 flue gas desulphurisation
plant (government budget)
Unit 4 control system
Emission coupons
Assigned contributions - the disabled
Other ACDR - Unit 6
TOTAL
Carrying amount as at 31/12/2009 4,729,297 1,596,125 129,649 12,902,472 227,409 0 19,584,952
Increases/transfers between accounts 0 0 0 0 49,996 100,000 149,996
Decreases (788,217) (133,011) (14,406) (4,300,824) (43,881) 0 (5,280,339)
Carrying amount as at 31/12/2010 3,941,080 1,463,114 115,243 8,601,648 233,524 100,000 14,454,609
Long-term accrued costs and deferred revenue in the amount of EUR 5,519,437 relate to government grants received for the acquisition of fixed assets. They
are used in proportion to the accumulated depreciation.
Deferrals include emission coupons received free of charge from the state for the period 2008 to 2012. By the end of the year, the balance of emission
coupons decreased by 4,300,824, which represents the proportionate share of free coupons for the year 2010. The proportionate share for individual years
is laid down in the decision on emission coupons issued by the Environmental Agency of the Ministry of the Environment and Spatial Planning.
Deferrals arising from exemption from payment of contributions were created in accordance with the Employment of Disabled Persons Act. They are used
to settle costs indicated in the Act.
Other long-term accrued revenue and deferred costs comprise long-term accrued costs under the sales agreement in place instead of expropriation, for the
purposes of construction of Unit 6 cooling tower.
Note 15
Long-term financial liabilities EUR 23,465,160
LONG-TERM FINANCIAL LIABILITIES in EUR
31/12/2010 31/12/2009 Index
Long-term loans taken out with domestic banks 17,638,890 24,027,778 73
Long-term loans taken out with foreign banks 5,826,270 9,710,550 60
Total 23,465,160 33,738,328 70
Long-term loans are denominated in EUR. In 2010, the nominal interest rates for loans ranged between 0.95% and 6.06%.
MATURITY OF LONG-TERM FINANCIAL LIABILITIES in EUR
Maturity date TOTAL
before 31/12/2013 from 1/1/2014 to 31/12/2015 after 1/1/2016
Long-term financial liabilities to banks 18,604,049 2,777,778 2,083,333 23,465,160
Skupaj 18,604,049 2,777,778 2,083,333 23,465,160
CHANGES IN LONG-TERM FINANCIAL LIABILITIES in EUR
Long-term loans taken out with foreign banks Long-term loans taken out with domestic banks TOTAL
Carrying amount as at 31/12/2009 13,594,830 30,416,667 44,011,497
Repayment of principals (3,884,280) (6,388,888) (10,273,168)
Carrying amount as at 31/12/2010 9,710,550 24,027,779 33,738,329
Short-term portion 3,884,280 6,388,889 10,273,169
Long-term portion 5,826,270 17,638,890 23,465,160
In 2010, repayments of principal amounts and interest were made according to maturity dates and in accordance with existing depreciation/amortisation
plans.
The portion of long-term financial liabilities of EUR 10,273,169, which falls due in 2011, was recorded under short-term financing liabilities.

88
A
NN
UA
L R
EP
OR
T 2
01
0 T
erm
oele
ktra
rna
Šošt
anj
COLLATERALISATION OF FINANCIAL LIABILITIES in EUR
31/12/2010 31/12/2009
Government guarantees 9,710,550 13,594,830
Assignments, pledge of receivables 3,000,000 20,000,000
Bills of exchange 9,027,779 10,416,667
Guarantee by HSE 12,000,000 0
Total 33,738,329 44,011,497
As at 31.12.2010, 28.8% of the TEŠ’s financial liabilities were secured with a government guarantee, 8.9% with assignments or pledged receivables, 26.8%
with bills of exchange and 35.5% with a guarantee by HSE.
In April 2010, Annex no. 1 to the Financial Agreement no. 24.109 (SI) between TEŠ and EIB dated 27.9.2007 was concluded for the amount of EUR 110,000,000
million and a Financial Agreement no. 25.541 (SI) with EIB for the amount of EUR 440,000,000. In order to secure the EUR 110,000,000 loan, an agreement on
issue of guarantee was signed on 24.11.2010 between TEŠ, HSE and five guarantor banks (The bank of Tokyo- Mitshubishi UFJ, Caja Madrid, Intesa SanPaolo,
Societe Generale and UniCredit Bank). On 17.2.2011, after the required conditions had been met, EIB transferred the EUR 110,000,000 loan to TEŠ.
Note16
Long-term operating liabilities EUR 6,608
LONG-TERM OPERATING LIABILITIES in EUR
31/12/2010 31/12/2009 Index
Long-term operating liabilities 6,608 10,699 62
Total 6,608 10,699 62
Long-term operating liabilities include liabilities to the Housing Fund of the Republic of Slovenia and the Slovene Compensation Fund arising from the sale
of apartments under the Housing Act (OG RS 18/91).
MATURITY OF LONG-TERM OPERATING LIABILITIES in EUR
Maturity date TOTAL
before 31/12/2013 from 1/1/2014 to 31/12/2015 after 1/1/2016
Other long-term operating liabilities 6,532 76 0 6,608
Total 6,532 76 0 6,608
Note 17
Short-term financial liabilities EUR 90,718,257
SHORT-TERM FINANCIAL LIABILITIES in EUR
31/12/2010 31/12/2009 Index
Short-term financial liabilities to group companies 80,445,088 0
Short-term portion of long-term loans taken out with domestic banks 6,388,889 6,388,889 100
Short-term portion of long-term loans taken out with foreign banks 3,884,280 3,884,280 100
Total 90,718,257 10,273,169 883
Short-term financial liabilities to banks consist of principals of long-term debts that fall due in 2011 in accordance with loan agreements. In 2010, the inter-
est rates under the concluded contracts for short-term loans ranged between the minimum 1-month EURIBOR + 1.2% mark-up (in June, the interest rate
amounted to 1.664%) and the maximum 3.95% (fixed) rate.
SHORT-TERM FINANCIAL LIABILITIES TO GROUP COMPANIES in EUR
GROUP COMPANY COUNTRY 31/12/2010 31/12/2009
Holding slovenske elektrarne d.o.o. Sloveniija 48,193,825 0
Dravske elektrarne Maribor d.o.o. Sloveniija 32,251,263 0
Total 80,445,088 0
Financial liabilities to group companies represent liabilities for principals in the amount of EUR 80,300,000 and liabilities for interest in the amount of EUR
145,088 which will fall due in 2011.

Note 18
Short-term operating liabilities EUR 55,526,803
SHORT-TERM OPERATING LIABILITIES in EUR
31/12/2010 31/12/2009 Index
Short-term trade liabilities in Slovenia 46,035,181 47,444,195 97
Short-term foreign trade liabilities 137,912 112,841 122
Short-term advances received 224 343 65
Other short-term liabilities for operations for third party account 20,615 41,518 50
Short-term liabilities to employees 1,705,535 1,608,902 106
Short-term liabilities to government and other institutions 7,557,949 4,921,767 154
Short-term interest liabilities 4 0
Other short-term liabilities 69,383 98,343 71
Total 55,526,803 54,227,909 102
SHORT-TERM OPERATING LIABILITIES TO GROUP COMPANIES in EUR
GROUP COMPANY COUNTRY 31/12/2010 31/12/2009
Holding slovenske elektrarne d.o.o. Slovenia 302,173 2,676
HSE Invest d.o.o. Slovenia 451,555 126,289
Premogovnik Velenje d.d. Slovenia 22,939,129 24,450,104
HTZ Velenje d.o.o. Slovenia 14,569 9,842
PV Invest d.o.o. Slovenia 69,091 60,853
Gost Velenje d.o.o. Slovenia 0 2,765
RGP Velenje d.o.o. Slovenia 1,164,797 0
Total 24,941,314 24,652,529
The largest part of liabilities to group companies consists of liabilities to Premogovnik Velenje d.d. for coal supplied between 15 November and the end of
December 2010. As at the balance sheet date, the liabilities have not yet fallen due.
Short-term liabilities to employees are liabilities for salaries and other employment-related receipts for December 2010 in the amount of EUR 1,705,535
which were settled in January 2011.
As at the balance sheet date liabilities to government and other institutions amount to EUR 7,557,949. Here, the carbon tax liability (for CO2 emissions) ac-
counts for the largest part of liabilities. The liability for 2010 totals EUR 4,775,247 (1 coupon per ton of CO2) and must be settled by 30.4.2011 (the company
holds 4,300,824 emission coupons on the emission coupon registry account, and under intangible assets in the balance sheet.) In 2010, the liability arising
from corporate income tax amounted to EUR 1,153,647. Liabilities to government and other institutions also include a VAT liability in the amount of EUR
1,371,227, the liability of the employer for salary-related contributions for December 2010 in the amount of EUR 240,820, and other.
The company normally settles its liabilities in due time; overdue or outstanding liabilities as at 31.12.2010 amount to only EUR 12,718.
Note 19
Short-term accrued costs and deferred revenue EUR 5,792,205
ACCRUED COSTS AND DEFERRED REVENUE in EUR
31/12/2010 31/12/2009 Index
Accrued costs and expenses 5,792,205 3,358,704 172
Total 5,792,205 3,358,704 172
The predominant share of accrued costs and deferred revenue relates to accrued costs of emissions coupons.
Accrued costs include costs of unutilised annual leave at the end of 2010 and total EUR 400,302.

90
A
NN
UA
L R
EP
OR
T 2
01
0 T
erm
oele
ktra
rna
Šošt
anj
6.6.2 Notes to the income statement
Revenue EUR 247,461,681
in EUR
2010 2009 Index
Operating revenue 247,386,969 236,950,519 104
- domestic market 247,293,170 236,855,492 104
- foreign market 93,799 95,027 99
Financial revenue 10,933 194,437 6
Other revenue 63,779 200,151 32
Total revenue 247,461,681 237,345,107 104
Expenses EUR 242,276,482
in EUR
2010 2009 Index
Operating expenses 240,769,644 235,290,513 102
- costs of material and services 172,897,147 173,279,588 100
- labour costs 18,927,745 18,607,149 102
- write-downs in value 32,396,123 29,520,836 110
- other 16,548,629 13,882,940 119
Financial expenses 1,476,561 1,908,608 77
Other expenses 30,277 2,146 1,411
Total expenses 242,276,482 237,201,267 102
Costs by functional group
in EUR
2010 2009 Index
Cost of goods sold or production costs of quantities sold 227,847,783 218,103,573 104
Costs to sell 41,719 42,052 99
General and administrative costs 12,828,114 12,253,015 105
Total 240,717,616 230,398,640 104
Pursuant to SAS 25.25, the costs are broken down by functional group as the income statement was prepared using Format I.
Note 1
Net sales revenue EUR 242,009,537
in EUR
2010 2009 Index
Revenue from sale of electricity 235,234,020 221,088,232 106
Revenue from sale of thermal energy 4,478,110 4,274,878 105
Revenue from sale of services 404,874 568,432 71
Revenue from sale of materials 988,995 654,257 151
Revenue from rents 903,538 777,890 116
Total 242,009,537 227,363,689 106
Net sales revenue is carried at invoiced amounts.
The predominant share of sales revenue (99.1%) was generated through electricity and thermal energy sales.

Note 2
Capitalised own products and services EUR 15,619
in EUR
2010 2009 Index
Capitalised own products and services 15,619 4,210,270 0
Capitalised own products and services represent materials used and internal work performed in investments in reliable production, which have been recog-
nised as increases in value of property, plant and equipment.
Note 3
Other operating revenue EUR 5,361,813
in EUR
2010 2009 Index
Revenue from reversal of provisions 935,633 967,946 97
Revaluation operating revenue 56,928 58,216 98
Other operating revenue 4,369,252 4,350,398 100
Total 5,361,813 5,376,560 100
Revenue from emission coupons in the amount of EUR 4,300,824 which is, under the decision on emission coupons issued by the Ministry of the Environ-
ment and Spatial Planning, recognised in the amount of the proportionate share for 2010, accounts for the largest share of other revenue.
Revenue from reversal of provisions consists of revenue from subsidies and grants for fixed assets in the amount of EUR 935,633 for utilisation of long-term
accrued costs and deferred revenue in accordance with the amount of depreciation charged on property, plant and equipment.
Revaluation operating revenue in the amount of EUR 56,928 represents gains from disposal (sale) of property, plant and equipment and settlement of
impaired receivables.
Note 4
Costs of materials and services EUR 172,897,147
in EUR
2010 2009 Index
Costs of material 151,618,836 150,943,407 100
Costs of energy 86,886 28,859 301
Other costs of material 2,908,374 6,319,496 46
Costs of services related to maintenance of property, plant and equipment 8,504,342 8,303,965 102
Other costs of services 9,778,709 7,683,861 127
Total 172,897,147 173,279,588 100
The predominant share of costs of materials in 2010 relates to consumption of coal as an energy product used for production of electricity and thermal
energy, and contingent costs of coal. In addition to coal, the company also used gas to produce electricity.
During the year, EUR 94,981 worth of material was written off from inventory due to changes in quality and value. After the inventory count of materials,
surpluses of EUR 624 and shortages of EUR 137 were determined.
Costs of services related to maintenance of property, plant and equipment comprise costs of regular maintenance in the amount of EUR 8,504,342.
Costs of intellectual and personal services include EUR 33.231 for costs of annual audit.

92
A
NN
UA
L R
EP
OR
T 2
01
0 T
erm
oele
ktra
rna
Šošt
anj
Note 5
Labour costs EUR 18,927,745
in EUR
2010 2009 Index
Salaries 11,168,404 11,009,864 101
Salary compensation 2,624,301 2,900,537 90
Costs of supplementary insurance 634,971 633,830 100
Other employee remuneration, benefits, reimbursement 2,148,436 1,740,433 123
Employer’s contributions on overall employee receipts 2,351,633 2,322,485 101
Total 18,927,745 18,607,149 102
Labour costs are based on the collective labour agreement and employment contracts. Salaries are comprised of the fixed pay, allowances (for less favour-
able working hours, environment impacts, etc.) and the variable pay which reflects performance.
Salary compensations include compensations for absence resulting from illness, annual leave, training and other. Employees are entitled to compensation
either on the basis of the Employment Relationship Act, collective labour agreement or employment contract.
The costs of supplementary pension insurance relate to the co-funding of the pension scheme by the employer under the contract for establishment of vol-
untary supplementary pension insurance scheme entered into by Termoelektrarna Šoštanj d.o.o. and TPP Šoštanj trade union. The pension scheme labelled
PN1 is managed by the company Kapitalska družba pokojninskega in invalidskega zavarovanja d.d., Ljubljana.
Other employee compensation, benefits and refunds represent annual leave allowances, termination benefits and other.
Note 6
Write-downs in value EUR 32,396,123
DEPRECIATION and AMORTISATION in EUR
2010 2009 Index
Amortisation of intangible assets 196,842 169,993 116
Depreciation of property, plant and equipment 32,162,872 28,669,240 112
Total 32,359,714 28,839,233 112
REVALUATION OPERATING EXPENSES in EUR
2010 2009 Index
Revaluation operating expenses of property, plant and equipment 16,803 668,931 3
Revaluation operating expenses of receivables 19,606 12,672 155
Total 36,409 681,603 5
The depreciation/amortisation charge in 2010 amounts to EUR 32,359,714 and is accounted for using the depreciation/amortisation rates which are based
on the estimated useful lives of assets.
Revaluation operating expenses in the amount of EUR 36,409 refer to:
• disposal of property, plant and equipment in the amount corresponding to their net carrying amount (EUR 16,803). The assets have been disposed of because
they were worn out, and technologically and economically obsolete. The assets were removed from use or disposed of (sold);
• impairment of receivables due to doubts as to their repayment or due to the carrying amount exceeding the expected realisable value of receivables, which
amounted to EUR 19,606.
Note 7
Other operating expenses EUR 16,548,629
in EUR
2010 2009 Index
Charges unrelated to labour costs or other costs 2,791,191 2,721,108 103
Environmental protection expenditures 13,280,492 10,546,607 126
Provisions for jubilee benefits and termination benefits 382,327 542,139 71
Other costs 94,619 73,086 129
Total 16,548,629 13,882,940 119

The predominant share of charges relates to the liability arising from payment of the building site fee in the amount of EUR 2,705,142.
The majority of environmental protection expenditures are represented by emission coupon costs of EUR 9,960,527. The company produced 4,775,247 tons
of CO2 in 2010. In accordance with the Environment Protection Act, the company is obligated to hand over 4,775,247 emission coupons to the government.
The expenses thus include 4,300,824 coupons at the cost of 1 euro and expenses in the amount of EUR 5,659,866 which represent accrued operating ex-
penses for missing emission coupons (474,423) for 2010.
Note 8
Financial revenue EUR 10,933
in EUR
2010 2009 Index
Income from loans given 3,370 186,148 2
Income from operating receivables 7,563 8,289 91
Total 10,933 194,437 6
Income from loans given relates to interest on time deposits with commercial banks. Revenue from operating receivables due from others comprises de-
fault interest arising from late payment of receivables.
Note 9
Financial expenses EUR 1,476,561
in EUR
2010 2009 Index
Expenses for financial liabilities 154,133 0
Expenses for financial liabilities 1,245,863 1,907,144 65
Expenses for operating liabilities 76,565 1,464 5,230
Total 1,476,561 1,908,608 77
The impairment of investments as at 31.12.2010 was recorded due to impairment of an investment in holiday homes (Krvavec, Rab, Portorož) in the amount
of EUR 154,133 due to formally unresolved ownership and management relations and unexpected future cash flows.
The predominant share of financial liabilities is comprised of interest expense of EUR 1,227,233 arising from long-term loans. Interest was accounted for in ac-
cordance with the contract entered into by the lender and the borrower. Financial expenses for loans received from group companies amount to EUR 18,630.
The majority of expenses for financial liabilities in the amount of EUR 75,713 are represented by expenses for operating liabilities in the group.
Note 10
Taxes EUR -982,793
in EUR
2010 2009 Index
Corporate income tax (1,238,467) (97,157) 1,275
Deferred taxes 255,674 8,314 3,075
Total (982,793) (88,843) 1,106
In compliance with the Corporate Income Tax Act, the company prepared a corporate income tax return for the period 1.1.2010 to 31.12.2010. The company
determined that the tax liability for the period amounts to EUR 1,238,467. The applicable income tax rate amounts to 20% and is charged on the tax base
determined in the company’s income tax return.
The basis for creation of deferred tax assets is the amount of long-term provisions created for jubilee benefits and termination benefits on retirement, re-
valuation of long-term investments and depreciation/amortisation rates exceeding the rates determined by the Corporate Income Tax Act. The increase in
deferred tax assets of EUR 255,674 is a result of creation of deferred taxes due to excessive depreciation/amortisation rates and revaluation of investments.

94
A
NN
UA
L R
EP
OR
T 2
01
0 T
erm
oele
ktra
rna
Šošt
anj
6.6.3 Net operating profit or loss
PROFIT OR LOSS OF THE COMPANY AFTER EQUITY RESTATEMENT in EUR
31/12/2010
Net profit or loss 4,202,406
Equity restatement result (6,543,081)
Profit or loss after restatement based on consumer prices (1,9% growth) (2,340,675)
Net profit for the 2010 financial year amounts to EUR 4,202,406.
Had the said restatement been taken into account, the company would record a net loss of EUR 2,340,675.
In 2010, no adjustments took place due to classification of items of other comprehensive income affecting profit or loss.
6.6.4 Notes to the cash flow statement
The cash flow statement for 2010 was prepared in accordance with SAS 26 Format I and comprises all cash receipts and disbursements for the period
1.1.2010. to 31.12.2010.
Cash flows broken down by subgroups:
CASH FLOWS in EUR
2010 2009
Cash flows from operating activities 61,515,331 50,301,560
Cash flows from investment activities (130,249,807) (122,518,107)
Cash flows from financing activities 68,779,290 72,171,774
Net cash flow for the period 44,814 (44,773)
The cash flow statement shows that net cash from operating activities totalled EUR 61,515,331. The entire amount was used to cover disbursements arising from
investing and financing activities. For the company to be able to cover all disbursements related to investing activities it took out short-term bridging loans within
the HSE Group as it was unable to use the planned long-term financing sources (EIB loan).
6.6.5 Notes to the statement of changes in equity
The statement of changes in equity is prepared according to Format II, i.e. in the form of a composite spreadsheet which presents changes in all equity components.
The composite spreadsheet containing changes in equity shows:
Value
Balance of equity as at 1/1/2010 344,372,708
Total comprehensive income for the reporting period Net profit or loss for the period 4,202,406
Changes in equityAllocation of portion of net profit for 2009 to other revenue
reserves52,247
Creation of legal reserves 210,120
Balance of equity as at 31/1/2010 348,575,114
Presentation of accumulated profit/loss
The accumulated profit for 2010 represents the net profit decreased by the created legal reserves and totals EUR 3,992,286. The company member decides
on allocation of accumulated profit.
ACCUMULATED PROFIT in EUR
2010
Net profit or loss for the current year 4,202,406
Increase in revenue reserves in accordance with a resolution of management and supervisory board (other revenue reserves)
(210,120)
Accumulated profit 3,992,286
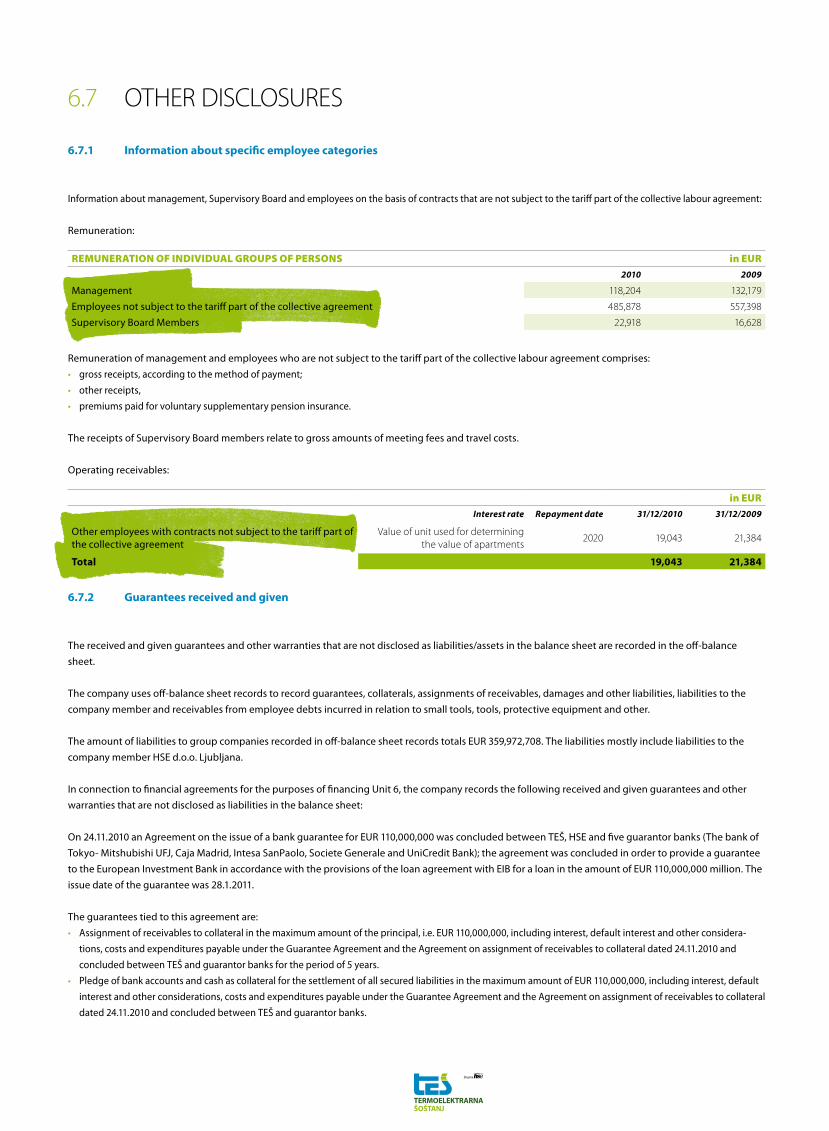
6.7 OTHER DISCLOSURES
6.7.1 Information about specific employee categories
Information about management, Supervisory Board and employees on the basis of contracts that are not subject to the tariff part of the collective labour agreement:
Remuneration:
REMUNERATION OF INDIVIDUAL GROUPS OF PERSONS in EUR
2010 2009
Management 118,204 132,179
Employees not subject to the tariff part of the collective agreement 485,878 557,398
Supervisory Board Members 22,918 16,628
Remuneration of management and employees who are not subject to the tariff part of the collective labour agreement comprises:
• gross receipts, according to the method of payment;
• other receipts,
• premiums paid for voluntary supplementary pension insurance.
The receipts of Supervisory Board members relate to gross amounts of meeting fees and travel costs.
Operating receivables:
in EUR
Interest rate Repayment date 31/12/2010 31/12/2009
Other employees with contracts not subject to the tariff part of the collective agreement
Value of unit used for determining the value of apartments
2020 19,043 21,384
Total 19,043 21,384
6.7.2 Guarantees received and given
The received and given guarantees and other warranties that are not disclosed as liabilities/assets in the balance sheet are recorded in the off-balance
sheet.
The company uses off-balance sheet records to record guarantees, collaterals, assignments of receivables, damages and other liabilities, liabilities to the
company member and receivables from employee debts incurred in relation to small tools, tools, protective equipment and other.
The amount of liabilities to group companies recorded in off-balance sheet records totals EUR 359,972,708. The liabilities mostly include liabilities to the
company member HSE d.o.o. Ljubljana.
In connection to financial agreements for the purposes of financing Unit 6, the company records the following received and given guarantees and other
warranties that are not disclosed as liabilities in the balance sheet:
On 24.11.2010 an Agreement on the issue of a bank guarantee for EUR 110,000,000 was concluded between TEŠ, HSE and five guarantor banks (The bank of
Tokyo- Mitshubishi UFJ, Caja Madrid, Intesa SanPaolo, Societe Generale and UniCredit Bank); the agreement was concluded in order to provide a guarantee
to the European Investment Bank in accordance with the provisions of the loan agreement with EIB for a loan in the amount of EUR 110,000,000 million. The
issue date of the guarantee was 28.1.2011.
The guarantees tied to this agreement are:
• Assignment of receivables to collateral in the maximum amount of the principal, i.e. EUR 110,000,000, including interest, default interest and other considera-
tions, costs and expenditures payable under the Guarantee Agreement and the Agreement on assignment of receivables to collateral dated 24.11.2010 and
concluded between TEŠ and guarantor banks for the period of 5 years.
• Pledge of bank accounts and cash as collateral for the settlement of all secured liabilities in the maximum amount of EUR 110,000,000, including interest, default
interest and other considerations, costs and expenditures payable under the Guarantee Agreement and the Agreement on assignment of receivables to collateral
dated 24.11.2010 and concluded between TEŠ and guarantor banks.

96
A
NN
UA
L R
EP
OR
T 2
01
0 T
erm
oele
ktra
rna
Šošt
anj
Due to new arrangements regarding collateral between banks taking part in the financing of the Unit 6 investment, the collateral under the loan agree-
ment that TEŠ concluded with Unicredit and SID banka on 21.12.2007 was changed. On 24.11.2010, Annex no.1 was concluded under which HSE d.o.o. was
included in the loan agreement as a guarantor. Under this contract, HSE d.o.o.’s guarantee covers 80% of the loan. As at 31.12.2010, the balance of the loan
stood at EUR 15,000,000; the liabilities under this contract and annex expire in 2013.
Other guarantees tied to the said loan agreement are:
• Assignment of receivables to collateral in the maximum amount of the principal, i.e. EUR 30,000,000, including interest and default interest and any other consid-
erations, costs and expenditures payable under the loan agreement TEŠ concluded with UniCredit and SIB banka. The agreement on assignment of receivables
was concluded on 24.11.2010 and is valid until 31.12.2013.
• Pledge of bank accounts and cash as collateral for full repayment and settlement of secured liabilities in the maximum amount of the principal, i.e. EUR
30,000,000, including interest and default interest and any other considerations, costs and expenditures payable under the loan agreement TEŠ concluded with
UniCredit and SIB banka. The agreement on pledge of bank accounts and cash was signed on 24.11.2010 and is valid until 31.12.2013.
APPENDICES TO THE ANNUAL REPORT
REPORTING BY BUSINESS AND GEOGRAPHICAL SEGMENTS
Accounting information about operations is presented according to business and geographical segments.
A geographical segment consists of countries in a given area. Considering that the company’s operations are limited to the geographical segment of the
Republic of Slovenia, such information is not disclosed separately.
A business segment is an autonomous organisational unit which is responsible for the achievement of operating results. It is a market-oriented part of the
company’s organisational structure and generates profit or loss through its operations. Information used for reporting by business segment is based on
data collected for external reporting purposes and additionally on data collected by the company for internal reporting purposes.
The company has the following business segments:
Business segment Major products and services of the business segment
Electricity production electricity
Steam and hot water supply heat, sanitary water
Canteen meals, restaurant services
Social standard leasing of apartments and holiday capacities
Criteria for allocation of revenue and expenses are as follows:
• revenue is normally allocated directly,
• expenses are always allocated directly. Indirect expenses (general costs of production and specialist departments are allocated to business segments on the
basis of a key).
The assets and liabilities allocated to segments contain items that are directly attributable to the segment as well as items that can be attributed to the seg-
ment on justifiable grounds.

Balance sheet by business segments
in EUR
TEŠ TOTAL Electricity production BS Steam and hot water supply BS Other business segments
TOTAL ASSETS 541,317,059 536,846,356 2,605,702 1,865,001
Long-term assets 478,424,032 476,092,625 722,131 1,609,276
Current assets 57,006,408 54,871,316 1,879,576 255,516
Accrued revenue and deferred costs 5,886,619 5,882,415 3,995 209
TOTAL LIABILITIES 541,317,059 534,496,465 3,847,009 2,973,585
Equity 348,575,114 342,919,632 2,953,475 2,702,007
Provisions and long-term accrued costs and deferred revenue
17,232,912 17,128,298 47,577 57,037
Long-term liabilities 23,471,768 23,465,160 0 6,608
Short-term liabilities 146,245,060 145,216,932 839,826 188,302
Accrued costs and deferred revenue 5,792,205 5,766,443 6,131 19,631
Receivables/liabilities by business segments 2,349,891 (1,241,307) (1,108,584)
Income statement by business segments
in EUR
TEŠ TOTAL Electricity production BS Steam and hot water supply BS Other business segments
Sales revenue 242,009,537 236,950,958 4,534,406 524,173
Other revenue 6,292,632 5,396,757 877 894,998
TOTAL REVENUE 248,302,169 242,347,715 4,535,283 1,419,171
TOTAL EXPENSES 243,116,970 237,458,015 4,369,912 1,289,043
Total taxes (982,793) (920,545) (38,468) (23,780)
PROFIT OR LOSS 4,202,406 3,969,155 126,903 106,348
Note: in the income statement presented by business segment, revenue
and expenses also include internal sales.
Concept, design and photography:
Marinšek & Marinšek
Print:
Eurograf
July 2011
Termoelektrarna Šoštanj d. o. o.Cesta Lole Ribarja 18 / SI - 3325 Šoštanj
T: +386 (0)3 899 31 00 / F: +386 (0)3 899 34 85E: [email protected] / W: te-sostanj.si


In these days when we are witnessing
constant business changes and a shor t
reaction time and quick decisions are
demanded from us, the knowledge has
the maximum power. It provides us the
freedom while doing our profession
and provides unlimited oppor tunities
for professional growth.
20