ANNUAL - Taupo District Council · This summary includes highlights from our annual report and...
20
ANNUAL REPORT SUMMARY 2016/17
Transcript of ANNUAL - Taupo District Council · This summary includes highlights from our annual report and...

ANNUALREPORT SUMMARY
2016/17

WELCOMEWELCOME TO THE SUMMARY OF OUR 2016/17 ANNUAL REPORT.
The specific dislosures in this summary have been extracted from
the full Annual Report, which was adopted by Council with an
unmodified opinion dated 26 September 2017.
The summary has been examined for consistency with the full
Annual Report 2016/17 and audited by Audit New Zealand on behalf
of the Auditor-General.
This summary was authorised by the Chief Executive and the Group
Manager of Finance and Strategy on 26 September 2017.
This summary cannot be expected to provide a complete
understanding of Council’s financial and service performance,
financial position and cashflows as the full Annual Report 2016/17.
The full Annual Report is available from the Council offices or can be
downloaded at www.taupo.govt.nz.

3
TAUPŌ DISTRICT COUNCIL ANNUAL REPORT SUMMARY 2016/17
Council has $1.1 billion in assets including land, infrastructure and buildings as at 30 June 2016.
These include:
COUNTING THE ASSETS
420
57
38
street litter /recycling bins
social housing units mainly occupied by elderly people
km of cycleways
97,708m2746kmpipes supplying drinking water439
• six sports grounds• three cemeteries • 54 playgrounds
reserves including:
of parking
3 swimming pools
&x
libraries
1x• landfill • museum • airport • events centre (Taupō Events Centre) • entertainment centre (Great Lake
Centre)gymnasium2 1&
5 transferstations
482kmpipes for wastewater
(includes service connections)
781kmof roads
4,381
297250 122
20
ELEVEN
56
26
streetlights
kms of footpath
kms of pipes for stormwater
for wastewater reticulation
(includes 64 septic tank effluent pump stations)
25bridges
39km culverts
water treatment plants
(includes the isolated Taupo South/
Rainbow Point water treatment plant)
wastewater treatment plants
public toilets
for water supply
boosting(includes new AC
Baths pump station)
pum
pst
ation
s
community halls
14fitness centres

TAUPŌ DISTRICT COUNCIL ANNUAL REPORT SUMMARY 2016/17
MAYOR AND CHIEF EXECUTIVE OFFICER’S REPORT
Welcome to the summary of our Annual Report for the 2016/17 year.
This summary includes highlights from our annual report and outlines the key projects and initiatives we undertook on behalf of the community over the past 12 months. It shows how we performed as an organisation, analyses our expenditure and celebrates our achievements.
4
Council’s long-term district strategy looks to guide
us to achieve our goals around promoting economic
development, protecting our water resources,
maintaining our infrastructure assets and keeping rates
and debt affordable. Essentially, our role is to ensure the
Taupō District remains a great place to live, something
we take great pride in doing.
We have remained focused throughout the 2016/17
year on undertaking a range of projects that allow us to
achieve these goals.
We continued our upgrade of intersections in Taupō’s
CBD, as well as improving shared paths to ensure
everyone can easily make the most of our district’s
natural features. To help protect our most important
natural asset we continued with our installation of
stormwater filtering devices to reduce the amount of
sediment, oil and litter entering Lake Taupō.
We saw strong building growth across the year with
over 200 more Certificates of Compliance issued on
the previous year. A lot of this growth was in lakeside
settlements that have been traditionally popular for
visitor populations in summer months. In order to
ensure our infrastructure supports growing permanent
populations such as Kinloch and Acacia Bay we have
commenced investigatory work and installed new water
infrastructure for a more reliable source of drinking
water in these areas.
Fiscally, we performed well during the year and were on
track with the financial strategy set out in our 2015-25
Long-term Plan. This allowed us to finish the 2016/17
year with $8 million less debt than had been projected
in the 2015-25 Long-term Plan and helped us to limit
rate increases slightly less than was forecast in the
long-term plan. Our prudent financial management
also led us to retain our AA credit rating from Standard
and Poor’s, the highest rating that can be attained by
councils.
Council staff around the district should be commended
for their efforts in implementing projects and work on
Council’s behalf. They are fantastic ambassadors for our
district and work hard to look after the place we love.
Looking ahead we will continue to work towards
delivering the projects and strategies signalled in our
2015-25 Long-term Plan, as well as ensuring our $1.1
billion of assets are maintained for our residents and
visitors. We will represent our community’s interests
both regionally and nationally, while working as
efficiently as possible to ensure rates are as affordable.
All that we do will be to ensure the Taupō District
remains a great place to live.
David Trewavas JPMayor
Gareth GreenChief Executive

5
TAUPŌ DISTRICT COUNCIL ANNUAL REPORT SUMMARY 2016/17
OUR LONG TERM DISTRICT STRATEGYIn our 2015-2025 Long-term Plan we set ourselves five key areas to build on the strong foundation we have created. Here are some highlights from each of those areas that helped us move closer to our goals in 2016/17.
ENSURE TAUPŌ DISTRICT REMAINS A GREAT PLACE TO LIVE
PROMOTE ECONOMIC DEVELOPMENT
PROTECTING OUR WATER RESOURCES AND USING THEM WISELY
MAINTAINING OUR QUALITY INFRASTRUCTURE
KEEP RATES AND DEBT AFFORDABLE

TAUPŌ DISTRICT COUNCIL ANNUAL REPORT SUMMARY 2016/17
6
ENSURE TAUPŌ DISTRICT REMAINS A GREAT PLACE TO LIVE
• Continued our upgrade
of intersections
throughout the Taupō
CBD and revitalised
gardens along the busy
stretch of Tongariro
Street.
• The shared path
between Wharewaka
and Five Mile Bay was
officially opened during
the year, allowing
pedestrians, cyclists,
wheelchairs and buggies
to share the popular
route along the lake
front.
• Over 200 more
Certificates of
Compliance were issued
on the previous year,
with Council’s GoBuild
app helping not only
inspectors, but also
builders and property
owners to book and
complete inspections
quicker.

7
TAUPŌ DISTRICT COUNCIL ANNUAL REPORT SUMMARY 2016/17
During the year we continued to invest in a number of key activities aimed at promoting the Taupō District as a great place to live, work and play.
• Continued attracting business, investment
and providing economic development
services through Enterprise Great Lake
Taupō.
• We continued to provide leadership and
support by promoting our district as a
holiday and visitor destination through the
activities of Destination Great Lake Taupō.
• Retained a strong focus on attracting and
retaining quality events through our inhouse
events team.
• Continued providing funding to Go Tongariro
and Towncentre Taupō to assist with
promoting and growing vibrant central
business districts.
PROMOTEECONOMICDEVELOPMENT

TAUPŌ DISTRICT COUNCIL ANNUAL REPORT SUMMARY 2016/17
8
PROTECTING OUR WATER RESOURCES AND USING THEM WISELY
The protection of water resources such as Lake Taupō and the Waikato River is an important focus and we continued our relationship with central government, Waikato Regional Council (WRC) and iwi in this area. • Various investigative work has been
undertaken to ensure a reliable supply
of fresh water for Kinloch and Acacia Bay
into the future. This year an additional
water main was installed between Kinloch
reservoir and Boojum Dell and various sites
have been evaluated for a potential water
treatment plant in Acacia Bay.
• We continued with the installation of
stormwater filtering devices that prevent
sediment, oil and litter from entering Lake
Taupō.
9
TAUPŌ DISTRICT COUNCIL ANNUAL REPORT SUMMARY 2016/17
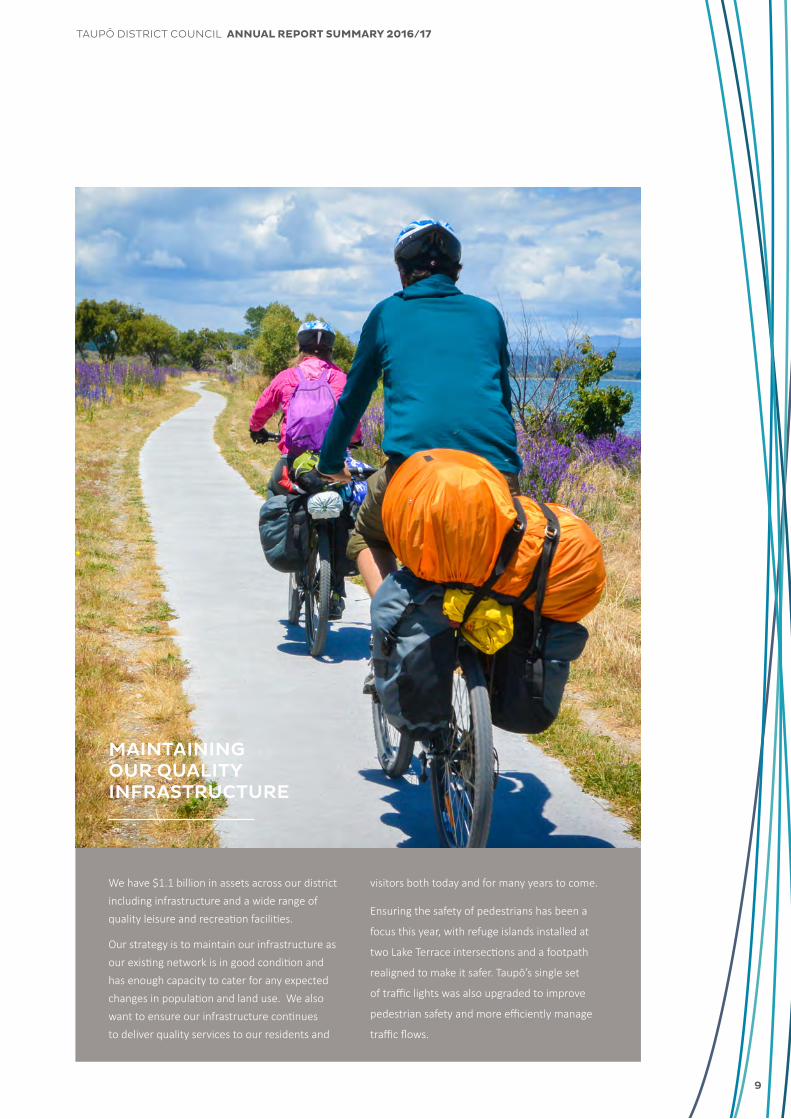
MAINTAINING OUR QUALITY INFRASTRUCTURE
We have $1.1 billion in assets across our district
including infrastructure and a wide range of
quality leisure and recreation facilities.
Our strategy is to maintain our infrastructure as
our existing network is in good condition and
has enough capacity to cater for any expected
changes in population and land use. We also
want to ensure our infrastructure continues
to deliver quality services to our residents and
visitors both today and for many years to come.
Ensuring the safety of pedestrians has been a
focus this year, with refuge islands installed at
two Lake Terrace intersections and a footpath
realigned to make it safer. Taupō’s single set
of traffic lights was also upgraded to improve
pedestrian safety and more efficiently manage
traffic flows.

TAUPŌ DISTRICT COUNCIL ANNUAL REPORT SUMMARY 2016/17
10
OUR FINANCIAL PERFORMANCE
KEEPING RATES AND DEBT AFFORDABLE Council continues to contribute to its Financial Strategy adopted as part of its 2015-25 Long-term Plan.

11
TAUPŌ DISTRICT COUNCIL ANNUAL REPORT SUMMARY 2016/17
LOOKING AFTER THE ASSETS WE HAVE WHILE MAINTAING LEVELS OF SERVICEOur district is still relatively
young, this means that many of
our infrastructure assets are in
good condition and will not need
renewing or upgrading for many
years.
We must all pay our fair share of
the use of these assets each year to
ensure intergenerational equity is
achieved, and that we don’t create
a financial burden for current or
future generations. By rating for
depreciation and holding this as
cash reserves to fund for future
renewals programmes, we are
projecting a large build up of cash
reserves by 2025.
KEEPING RATES AFFORDABLE AND SUSTAINABLECouncil’s main source of operating
revenue is from rates, both general
and targeted. In the 2015-25
Long-term Plan projected rates
increases were between 2 and 3
per cent (after adjusting for growth
in rateable properties) over the 10
years of the plan. We have now
completed the second year of the
2015-25 Long-term Plan where
rates increases had originally been
forecast at 2.42 per cent. However,
the actual rates increase for 2016-
17 was just 1.1 per cent.
In preparing the 2017-18 Annual
Plan, rates increases were set at
2.40 per cent, lower than that
forecast in the 2015-25 Long-term
Plan of 2.54 per cent.
PRUDENT MANAGEMENT OF OUR INVESTMENTS AND BORROWINGSCouncil’s credit rating has been maintained at AA by international credit rating agency Standard and Poor’s. This rating reflects the prudent financial management of Taupō District Council and is the highest rating that can be held by a council within New Zealand.
DEBTClosing debt position at 30 June 2017 was $146m. The 2015-25 Long-term Plan projected that at the end of this year debt would be $154m. However, after additional repayments were made and reported in the Annual Report 2014-15, this was re-forecast when preparing the 2016-17 Annual Plan to $146m. The 2017-18 Annual Plan forecasts debt to be at $144m by June 2018.
LIMITS ON RATES AND DEBTSTo meet all of these goals, Council proposed three limits on rates and debt, and has operated within these limits for 2016/17. These were:• Total rates revenue must not exceed 80 per cent of operating
revenues• Rates increases may not exceed forecast Local Government
Consumer Index (LCGI) + 1.0 per cent.• Gross external borrowing may not be more than 200 per cent of
annual operating income.

TAUPŌ DISTRICT COUNCIL ANNUAL REPORT SUMMARY 2016/17
12
OUR PERFORMANCEWe set ourselves 128 measures in our Long-term Plan which we use to report back on our service performance across our 10 groups of activities. This page shows the percentage of targets achieved. Detailed reporting on the individual measures is included in our full annual report
COMMUNITY SERVICES
TOTAL NON-FINANCIAL
PERFORMANCE MEASURES
82%ACHIEVED
74%ACHIEVED
WATER
WASTEWATER
DEMOCRACY AND PLANNING
TRANSPORT
SOLID WASTE
INVESTMENTS
COMMUNITY FACILITIES
STORM WATER
ECONOMICDEVELOPMENT
52%ACHIEVED
92%ACHIEVED
67%ACHIEVED
60%ACHIEVED
75%ACHIEVED
100%ACHIEVED
81%ACHIEVED
100%ACHIEVED
77%ACHIEVED

13
TAUPŌ DISTRICT COUNCIL ANNUAL REPORT SUMMARY 2016/17
SUMMARY OF FINANCIAL STATEMENTS
STATEMENT OF FINANCIAL POSTION
OVERVIEWCouncil’s actual surplus of $24.347m is $19.774m more
than the $4.573m surplus planned. The explanations below
address this variance.
REVENUECouncil’s operating revenue was $27.086m ahead of
plan, this is due to the following operational areas being
ahead of plan: rates $0.426m, development and financial
contributions $1.453m, fees and charges $1.877m, finance
revenue $0.366m, vested and first time recognition assets
$6.367m, gain on sale of properties $4.036m and gain on
sale of other property, plant and equipment $1.081m,
dividends $0.237m, gain on the revaluation of investment
properties $1.365m, realised and unrealised gains on financial investments $0.979m, revaluation of derivatives $8.804m, revaluation of forestry assets $0.838m and other income $0.407m. These gains are offset by subsidies and grants $1.197m behind plan.
EXPENSESCouncil’s expenses are $7.312m higher than plan. Removing the impact of the impairment of Lake Terrace office $2.735m and the loss on valuation of financial assets $0.086m, gives operational losses of $4.491m which is made up of depreciation $1.251m, interest on debt $0.254m, loss on disposal of property, plant and equipment $3.127m and operational expenses $0.242m all above plan offset by employment benefit expenses $0.383m below plan.
EQUITYCouncil’s Statement of Financial Position presents a healthy picture, our asset base is remaining stable and our level of borrowings is decreasing, currently at $146m.
ASSETSInvestments including cash are $24.178m higher than plan, trade and other receivables are $0.101m higher than plan, inventory is $0.944m higher than plan, prepayments are $0.846m higher than plan and noncurrent assets held for sale $7.659m higher than plan.
Investment properties are $8.506m lower than plan, property, plant and equipment, intangibles and forestry were $20.477m less than plan due to the revaluation of roading
assets $7.731m lower than plan and land and building assets $5.429m lower than plan in 2015/16, capital expenditure was $8.6m behind forecast for the last two financial years. Disposals and impairments were $5.5m (not budgeted), vested and first time recognition assets were $6.4m higher than plan and the forestry valuation was $0.868m higher than plan.
LIABILITIESTrade and other payables $1m higher than plan, derivative financial instrument liabilities are $3.044m higher than plan due to fair valuation changes in current and prior year. Borrowings $0.5m higher than plan mainly due to less supplementary repayments made than planned.
These financial statements are extracted from the full Annual Report. That report was prepared in accordance with generally accepted accounting practice in New Zealand and was prepared under Tier 1 Public Benefit Entity International Public Sector Accounting Standards (NZ PBE IPSAS). The prior year comparative figures for Council and Group have been restated to reflect a prior period error in the valuation of investment properties in 2015/16. This has affected the Statement of Comprehensive Revenue and Expense, the Statement of Changes in Net Assets/Equity and the Statement of Financial Position. The information in this summary financial report has been prepared in accordance with PBE FRS43: Summary Financial Statements. The summary financial statements do not include all the disclosures provided in the full financial statements and cannot be expected to provide as complete an understanding as provided in the full financial statements. The financial statements are presented in New Zealand dollars and values are rounded to the nearest thousand dollars. The functional currency of Taupō District Council and Group is New Zealand dollars

TAUPŌ DISTRICT COUNCIL ANNUAL REPORT SUMMARY 2016/17
14
Council Council Council Group Group
Actual Budget Actual Actual Actual
(Restated) (Restated)
2017 2017 2016 2017 2016
$000 $000 $000 $000 $000
Revenue 108,847 81,761 91,055 109,650 92,140
Expenses 75,491 68,433 81,151 76,698 82,337
Finance expense 9,009 8,755 9,786 9,009 9,786
Net surplus/(deficit) before tax 24,347 4,573 118 23,943 17
Tax (expense)/credit - - - 18 28
Net Surplus after tax 24,347 4,573 118 23,961 45
Attributable to:
Taupō District Council 24,347 4,573 118 24,025 108
Non-controlling interest - - - (64) (63)
Net surplus/(deficit) for the year 24,347 4,573 118 23,961 45
Property, plant and equipment revaluations 11,316 19,047 23,240 11,948 23,877
Financial assets at fair value through other compre-hensive revenue (11) - (151) (11) (151)
plus tax on equity items - - - (172) (56)
Total other comprehensive revenue 11,305 19,047 23,089 11,765 23,670
Total comprehensive revenue and expense 35,652 23,620 23,207 35,726 23,715
Attributable to:
Taupō District Council 35,652 23,620 23,207 35,560 23,706
Minority interest - - - 166 9
Total recognised revenue and expenses 35,652 23,620 23,207 35,726 23,715
STATEMENT OF COMPREHENSIVE REVENUE AND EXPENSESFOR THE YEAR ENDED 30 JUNE 2017

15
TAUPŌ DISTRICT COUNCIL ANNUAL REPORT SUMMARY 2016/17
Council Council Council Group Group
Actual Budget Actual Actual Actual
(Restated) (Restated)
2017 2017 2016 2017 2016
$000 $000 $000 $000 $000
Revenue 108,847 81,761 91,055 109,650 92,140
Expenses 75,491 68,433 81,151 76,698 82,337
Finance expense 9,009 8,755 9,786 9,009 9,786
Net surplus/(deficit) before tax 24,347 4,573 118 23,943 17
Tax (expense)/credit - - - 18 28
Net Surplus after tax 24,347 4,573 118 23,961 45
Attributable to:
Taupō District Council 24,347 4,573 118 24,025 108
Non-controlling interest - - - (64) (63)
Net surplus/(deficit) for the year 24,347 4,573 118 23,961 45
Property, plant and equipment revaluations 11,316 19,047 23,240 11,948 23,877
Financial assets at fair value through other compre-hensive revenue (11) - (151) (11) (151)
plus tax on equity items - - - (172) (56)
Total other comprehensive revenue 11,305 19,047 23,089 11,765 23,670
Total comprehensive revenue and expense 35,652 23,620 23,207 35,726 23,715
Attributable to:
Taupō District Council 35,652 23,620 23,207 35,560 23,706
Minority interest - - - 166 9
Total recognised revenue and expenses 35,652 23,620 23,207 35,726 23,715
Council Council Council Group Group
Actual Budget Actual Actual Actual
2017 2017 2016 2017 2016
(Restated) (Restated)
$000 $000 $000 $000 $000
Equity at start of the year 1,023,825 1,035,033 1,000,618 1,031,368 1,007,653
Total comprehensive revenue and expense previously reported 35,652 23,620 23,207 35,726 23,715
Balance at 30 June 1,059,477 1,058,653 1,023,825 1,067,094 1,031,368
Components of Equity
Accumulated funds 782,836 787,284 770,992 784,179 772,657
Council created reserves 112,394 91,173 98,813 112,394 98,813
Revaluation reserves 164,247 180,196 154,020 167,136 156,679
Non-controlling interest - - - 3,385 3,219
Total Equity 1,059,477 1,058,653 1,023,825 1,067,094 1,031,368
STATEMENT OF CHANGES IN EQUITYFOR THE YEAR ENDED 30 JUNE 2017
STATEMENT OF FINANCIAL POSITIONAS AT 30 JUNE 2017
Council Council Council Group Group
Actual Budget Actual Actual Actual
2017 2017 2016 2017 2016
(Restated) (Restated)
$000 $000 $000 $000 $000
Current assets 116,135 69,120 77,748 117,153 78,774Non-current assets 1,124,636 1,166,663 1,136,610 1,133,019 1,144,599Total assets 1,240,771 1,235,783 1,214,358 1,250,172 1,223,373
Current liabilities 33,264 60,986 33,809 33,970 34,359Non-current liabilities 148,030 116,144 156,724 149,108 157,646Total liabilities 181,294 177,130 190,533 183,078 192,005
Equity 1,059,477 1,058,653 1,023,825 1,063,709 1,028,149Non-controlling interest - - - 3,385 3,219Total equity 1,059,477 1,058,653 1,023,825 1,067,094 1,031,368

TAUPŌ DISTRICT COUNCIL ANNUAL REPORT SUMMARY 2016/17
Council Council Group Group
Actual Actual Actual Actual
2017 2016 2017 2016
$000 $000 $000 $000
Major contracts 25,874 28,353 25,874 28,353
Non-cancellable operating leases 949 925 949 925Total commitments 26,823 29,278 26,823 29,278
16
CASHFLOW STATEMENTFOR THE YEAR ENDED 30 JUNE 2016
KEY MANAGEMENT PERSONNEL COMPENSATION
COMMITMENTS
ADDITIONAL DISCLOSURES
Council Council Council Group Group
Actual Budget Actual Actual Actual
2017 2017 2016 2017 2016
$000 $000 $000 $000 $000
Net cash from operating activities 24,711 19,415 22,302 24,400 22,562Net cash from investing activities (17,431) (16,987) (24,552) (17,123) (24,605)Net cash from financing activities (1,864) (5,103) (1,960) (1,864) (1,960)Net increase (decrease) in cash held 5,416 (2,675) (4,210) 5,413 (4,003)
Council Council
Actual Actual
2017 2016
$000 $000
Mayor and Councillors
Remuneration 460 451
Full time equivalent members 11 11
Senior Leadership Group, including the Chief Executive
Remuneration 1,319 1,261
Full time equivalent members* 7 5Total key management personnel compensation 1,779 1,712Total full-time equivalent personnel 18 16
*note as at the 30 June 2017 there were nine actual members of the Senior Leadership Group.

17
TAUPŌ DISTRICT COUNCIL ANNUAL REPORT SUMMARY 2016/17
Council may be subject to claims relating to weather tightness building defects. As at the date of this report the Weathertight Home Resolution Service (WHRS) is investigating one claim affecting one property in the Taupō District (2016 One WHRS claim) which is likely to be accepted into the Government’s Financial Assistance Package (FAP) scheme, the maximum financial exposure to Council is estimated at $100,000. Any leaky building claims made against Council after 1 July 2009 are not covered by our insurers.
In April 2013, the Ministry of Education (MOE) initiated High Court proceedings against Carter Holt Harvey (CHH) and others alleging inherent defects in the cladding sheets and cladding systems manufactured and prepared by CHH. Subsequently, in December 2016, CHH commenced third party proceedings against 48 Councils, including Taupō District Council alleging a breach of duty in the processing of building consents, undertaking building inspections and issuing Code Compliance Certificates.
The Councils have applied for orders setting aside and striking out CHH’s claims against them. The MOE’s claim against CHH is for 833 school buildings, 40 of which are located within the Taupō District. At present there is insufficient information to conclude on potential liability and claim quantum, if any.
In addition to the weather tightness building defect claim, there are a further eight unresolved potential legal and insurance claims against Council as at 30 June 2017 (2016 - 18 claims).
All matters present some contingent liability risk related to building or resource consents, property damage, or other aspects of Council’s operations which the claimants believe has caused them loss. It is not possible for Council to quantify a maximum financial exposure for these claims. Council has notified its insurers where relevant and will seek to limit actual liability, if indeed there is any liability at all.
Due to recent earthquakes in Canterbury, Council needs to assess whether there is any risk to buildings in the Taupō District.
Council has begun the task of evaluating its own buildings, commencing with the buildings of highest risk to human life, to determine if they may be earthquake prone, the buildings assessed so far comply for the intended use. The issue of contingent liability, if any, is unquantifiable.
Council has also disclosed contingent liabilities in relation to the Local Government Funding Agency, land slide, land subsidence, erosion, flooding and status of certain reserve lands in relation to iwi ownership, please refer to note 33 of the full Annual Report for details
OTHER CONTINGENCIES
PRIOR YEAR ERROR CORRECTION
EVENTS AFTER BALANCE DATE
The Council and Group has adjusted its comparative year financial statements for the year ended 30 June 2016 for the correction of a prior period error.When the investment property revaluation was completed in the 2016/17 year it was discovered that an error in hectarage was made in the valuation of a piece of land in the 2015/16 valuation, in effect double counting a portion of
land. This means that the gain on revaluation of investment properties and the asset value was overstated in 2015/16 by $5.259m. This figure is an estimate based on the dollar per hectare of the original valuation in June 2016. The financial statements for 2016, which are presented as comparative information in the 30 June 2017 financial statements, have been restated to correct this error.
There were no significant events after balance date that require reporting.

TAUPŌ DISTRICT COUNCIL ANNUAL REPORT SUMMARY 2016/17
18

19
TAUPŌ DISTRICT COUNCIL ANNUAL REPORT SUMMARY 2016/17

46 Horomatangi Street, Taupō[p] +64 7 376 0899 [f] +64 7 378 0118[e] [email protected]