Annual Shareholders' Meeting of Biotest AG...
35
VISION FOCUS TEAM SPIRIT VISION. FOCUS. TEAM SPIRIT . Annual Shareholders' Meeting of Biotest AG Frankfurt/Main, 12 May 2016
Transcript of Annual Shareholders' Meeting of Biotest AG...

VISION FOCUS TEAM SPIRITVISION. FOCUS. TEAM SPIRIT. Annual Shareholders' Meeting of Biotest AG
Frankfurt/Main, 12 May 2016

Disclaimer
• This document contains forward-looking statements on overall economic development as well as on the business, earnings, financial and asset situation of Biotest AG and its subsidiaries. These statements are based on current plans, p ,estimates, forecasts and expectations of the company and thus are subject to risks and elements of uncertainty that could result in deviation of actual developments from expected developments.
• The forward-looking statements are only valid at the time of publication. Biotest does not intend to update the forward-looking statements and assumes no obligation to do so.
• All comparative figures relate to the corresponding last year´s period, unless stated otherwise.
2Company Presentation Biotest AG

Biotest Group FY 2015
• Sales FY 2015: € 589.6 million, +1.3%
EBIT FY 2015: € -71.8 million
• Re-focusing on core business
Li it ti f R&D i t t i l l tib d i li ft t• Limitation of R&D investments in monoclonal antibody pipeline after not
meeting the primary endpoint in BT-061 study
• Q4 2015 EBIT: € 10.2 million (above guidance*)
• Biotest Next Level is on track with respect to timeline and budget
• Positive results for IgM Concentrate, Pentaglobin® and marketing approval for
Zutectra® early use
3Company Presentation Biotest AG
• Start of change process*November 10, 2015

Financials - FY 2015
4Company Presentation Biotest AG

Sales developmentInfluence of cooperation agreement on sales and EBIT (€ million)
8.5 2.5600
500.8
589.6582.0
• Decreasing influence of
17.416.7
16.2
400
500440.0422.0
• Decreasing influence ofcooperation agreement
484.6
573.5 587.1300 Cooperation agreementBiotest
404.6 423.3484.6
100
200Biotest products
0
100
2011 2012 2013 2014 2015
5Company Presentation Biotest AG
2011 2012 2013 2014 2015
4.1% 3.8% 3.2% 1.5% 0.4% cooperation agreements in % of sales

Sales growth
700589.6
+1.3%
Sales by region (€ million)
500
600582.0
Middle East
Other Asia & Pacific
118.2152.3
26.9 42.5
300
400North/South
America
& Africa118.2
135.9
152.3
108.7
• Solid growth in Germany
• Strong plasma sales in the US
200
300
Rest of Europe188.1 169.7
• Strong plasma sales in the US
• Good development in Asia
0
100
FY 2014 FY 2015
Germany106.0 123.3
FY 2014 FY 2015
6Company Presentation Biotest AG

EBIT and adjusted EBIT
2014 20152014 2015
EBIT (€ million) 53.4 -71.8
Impairment and one time effects* - 77.2
Biotest Next Level costs** 15.4 23.3
Monoclonal antibodies 38.2 50.1
Idle capacity costs (Boca & Dreieich) 16.2 12.4
EBIT adjusted 123.2 91.2
* € 2.8 million are recognised in monoclonal antibodies
** R&D costs related to the BNL project are included in BNL costs
7Company Presentation Biotest AG

Balance sheet
Fi i l iti f th Bi t t G (€ illi )Financial position of the Biotest Group (€ million)
Assets Equity and Liabilities
1.000 962.71,032.6
962.71,032.6
353.3
,
600
800 Current assets
Non-current assets
Current liabilities
412.3480.2375.9353.3
400
Non-current liabilities
Equity423.5586 8
679.3 424.6
200Equity ratio
at December 31 2015: 42 8%
128.9
586.8
125.80
8
12/31/2014 12/31/201542.8%
12/31/2014 12/31/2015
Company Presentation Biotest AG

Cash flow from operating activities January – December 2015 (in € million)
2014 2015
Operating CF before changes in working capital 91.1 31.0
Cash flow from changes in working capital -77.3 28.5
Interest and taxes paid -25.2 -21.4
Cash flow from operating activities -11.4 38.1
Company Presentation 9Biotest AG

Sales and EBIT - Q1 2016
160
Sales and EBIT (€ million)
120
140
160147.1142.5 +3.2%
80
100
EBIT 0.1 EBIT 8 6
40
60EBIT 0.1 EBIT 8.6
0
20
Q1 / 2015 Q1 / 2016
10Biotest AGCompany Presentation

Strategic Targets of Biotest
11Company Presentation Biotest AG

Strategic targets of Biotest
Re-Focus on plasma business
Strengthen US profitabilityStrengthen US profitability
Expansion project Biotest Next Level
- Broadening of product portfolio- Broadening of product portfolio- Doubling of production capacity
Adjustment of R&D programmeAdjustment of R&D programme- Focus on IgG Next Gen, IgM Concentrate, Fibrinogen and Haemophilia- Monoclonal antibodies: minimize expenses, continue activities solely up to
next milestone to enable partneringnext milestone to enable partnering
Continue of "partnering-strategy" in selected areas
Company Presentation 12Biotest AG

Global IgG (i.v. + s.c.) market forecast
Exp. annual growthCAGR 2015e – 2023e300
USA Europe RoW
RoW 10.5%
Europe 6%150
200
250
size
in to
ns
Europe 6%
NorthAmerica 4.5%
50
100
150
IgG m
arket
World 6-7%0
2015e 2016e 2017e 2018e 2019e 2020e 2021e 2022e 2023e
• The global IgG market is expected to grow to ~270 tons by 2023.• Expected annual growth is highest in ROW countries.
Company Presentation Biotest AG
Sources: Biotest Market Research based on MRB (2013), PPTA (2015), UBS (18 Feb 2015)
13

Global FVIII market forecastVolume perspective
12.000
14.000
U)
pd FVIII re FVIII SA re FVIII LA Exp. Annual GrowthCAGR 2013–2020e
8.000
10.000
t size (M
M I
Recombinant total 5%
Recombinant SA 1%
2 000
4.000
6.000
Marke Recombinant SA 1%
Plasmatic 2%
0
2.000
2013 2014e 2015e 2016e 2017e 2018e 2019e 2020eTotal FVIII 4%
• The global FVIII volume is expected to grow by 4% p.a. in the period up to 2020.• The plasmatic segment will grow by 2% p.a. in volume until 2020. In the recombinant
segment, growth will predominantly come from the new long-acting preparations.segment, growth will predominantly come from the new long acting preparations.
Note: SA = short-acting, LA = long-actingSource: Biotest Market Research
14Biotest AGCompany Presentation

Strengthen US profitability
Biotest Pharmaceuticals Corporation (BPC) and Kedrion Biopharma Inc., New Jersey signed in January 2016 a cooperation contract on marketing & l f Bi i ®& sales of Bivigam®
• Kedrion will take over exclusively the marketing & selling of Bivigam ® in the US
The manufacturing capacity utilization will be significantly increased
I f fit bilit i 2016 b USD 4 5 illiIncrease of profitability, in 2016 by USD 4-5 million
Company Presentation 15Biotest AG

Biotest Next Level
Company Presentation Biotest AG 16

Biotest Next Level • Product portfolio expansion:p p
3 products out of one litre plasma 5 products out of one litre plasma
• Improved, more efficient production process
• Capacity expansion: 5.5t 13t immunoglobulins
f f
gross profit :
~400 €/l
IgM &Fib i
Increase of profitability
gross profit :~90 €/l
~250 €/l
~160 €/l
~200 €/l
~200 €/l
Fibri-nogen
Company Presentation 17Biotest AG
turnover / litre plasma
cost / litre plasma
turnover / litre plasma
cost / litre plasma

Biotest Next LevelLab building and plasma receiving building
Lab building• Virology• Virus validation
Plasma receiving building • Sorting area• -30°C storage capacity
18Biotest AGCompany Presentation
g p y

Biotest Next LevelAs per April 2015
Company Presentation 19Biotest AG

Biotest Next LevelOn track in terms of timeline and budget (March 2016)
Company Presentation 20Biotest AG

Development of Product Portfolioand R&D Programme
Biotest AGCompany Presentation 21

Biotest product and R&D portfolio
Lifecycle projects• Zutectra Early Treatment• Cytotect• Haemoctin 2000
• IgG Next GenerationBNL programme • IgM Concentrate
• Fibrinogen• Albumin
Early development• Haemophilia A
Therapeuticp
Partnering projects • BT-061BT 062
• BT-063Ci i
Company Presentation 22Biotest AG
g p j• BT-062 • Civacir

IgG Next Generation
• Global commercialisation planned
• New efficient production process with high Ig yield established
• "Master product" for the Biotest Next Level production plant
Clinical developmentp
• Phase III clinical development (EU/US) planned to start in H2 2016 in two indications
• An additional phase III study in a neurological indication is currently under evaluation - finalization of study design is planned for Q3 2016
23Company Presentation Biotest AG

IgM Concentrate Severe Community Acquired Pneumonia (sCAP)
Community acquired pneumonia (CAP) is a leading cause of illness and death worldwide1
Mortality rates have not changed significantly over the past several
Chest radiograph
y g g y pdecades despite the availability of improved broad-spectrum antibiotics
CIGMA t dObjectives
Evaluation of the efficacy and safety of IgM Concentrate in patients with sCAP
CIGMA study
Primary Endpoint / Key Secondary EndpointsIncrease of ventilator free days (VFD)s28-day all cause mortality y y
Key inclusion criteriaPneumonia has been acquired outside the hospital or diagnosed within 72 hours after hospital admission
1: Wunderink 2014, N Engl J Med 370;6
Company Presentation 24Biotest AG
Patient receiving adequate antibiotic treatment for pneumonia

IgM ConcentrateCIGMA – summary incl. post hoc analyses
5.6% 16.7% 16.6%
Stratification (baseline level)*
Mortality delta
27 8% 30.5% 30.9%40%
)
y(active to placebo) p=0.030 p=0.042p=0.465
%27.8%22.2%
13.9% 14.3%20
30
orta
lity
(% 54 % relativereduction
54 % relativereduction
0
10
All ti t CRP ≥ 70 /L
Mo
All patientsall cause mortality
(N=160)
CRP ≥ 70 mg/L (N=124)
IgM ≤ 0.8 g/L (N=111)
* Descriptive p-values from a Fisher's Exact Test with a significance level of 0.05 have been calculated for subgroups.CRP = C-Reactive Protein
25Biotest AGCompany Presentation

IgM Concentrate
Attractive market potential
• S C it A i d P i• Severe Community Acquired Pneumonia
− Market size in sCAP approx. 350,000 patients worldwide*− Sales potential approx. € 500 million p.a.
Potential upside indication
• Common Variable Immunodeficiency Disease (CVID)− e.g. IgM deficiency
* Source: Biotest market research
26Company Presentation Biotest AG

Pentaglobin®
Encouraging results in lung transplantation
• In lung transplantation donor specific antibodies (DSAs) are risk factors for mortality d t d h i ft j tiand acute and chronic graft rejection
• Patients treated with Pentaglobin (a IgM/ IgA enriched immunoglobulin ) with early DSAs de elopment after l ng transplantation had a significantl higher s r i alDSAs development after lung transplantation had a significantly higher survival rate than patients treated with therapeutic plasma exchange (standard therapy)
• Published data by the Hannover Medical School*• Published data by the Hannover Medical School> 70% reduction of relative mortality rate after one year
> Mortality risk caused by DSA after lung transplantation was significantly> Mortality risk caused by DSA after lung transplantation was significantly reduced with Pentaglobin® (First generation IgM/ IgA enriched immunoglobulin)
Company Presentation Biotest AG 27
*: Ius.F et al. Transplantation, 2015 Dec 28

Fibrinogen Development for congenital and acquired fibrinogen deficiencies
• Fibrinogen plays an essential role in blood clotting
• In the case of congenital fibrinogen deficiency patients can not produce sufficient or any fibrinogen
• In acquired fibrinogen deficiency, patients lose fibrinogen because of heavy bleeding, for example due to severe injuries and surgery
Phase I/III StudyCongenital fibrinogen deficiency
Phase III StudyAcquired fibrinogen deficiency
Phase I: completed
Phase III: ongoingOn demand prophylaxis/treatment
caused by major surgery associated with excessive blood loss
28Biotest AGCompany Presentation
On-demand prophylaxis/treatmentplanning phase

Next generation Haemophilia A therapeutic
D l t f bi t F t VIII l l l t d t th• Development of a recombinant Factor VIII closely related to the wild type Factor VIII with improved characteristics such as half life extension and lowered immunogenicity
• Preventing inhibitor development
• Extension of treatment intervals
Human cell line with
Next Gen FVIII
Albumin binding
Extended half life
high yield
ReducedImmunogenicity
therapeuticbindinghalf-life
Tolerance inducing
Immunogenicity
modification
29Biotest AGCompany Presentation

BT-062 Indatuximab Ravtansine Overview
• Combination of antibody and cytotoxic agent targets cancer cellstargets cancer cells
• Multiple myeloma: all patients recruited, treatment ongoing; report on study data expected in Q4 2016*expected in Q4 2016
• Solid tumours: breast and bladder cancer; phase I completed, recruitment in extension h iphase ongoing
• 11/15 = 73% showed a response ( ≥ PR) to treatment11/15 73% showed a response ( ≥ PR) to treatment• 8 patients are on treatment without progressive disease for more than 8 months
30Company Presentation Biotest AG
•Pomalidomide/Dexamethasone Amendment

BT-063 in Systemic Lupus Erythematosus (SLE)
Clinical proof of concept study phase IIa study no 990*Clinical proof of concept study phase IIa study no. 990*Patients with moderate to severe SLE on stable medication with joint and cutaneousmanifestationsDuration: 3 months treatment + 4 months follow upDuration: 3 months treatment + 4 months follow up
12 patients, 50 mg 12 patients, XY mg
erim
ly
sis
6 patients, Placebo 6 patients, PlaceboInte
Ana
lSt d d i tStudy endpoints: • Primary: Incidence of adverse events, changes of safety parameter • Secondary: Improvement of joints, improvement of skin, SLEDAI**
Status: • Last patient recruited in part I of the study
R lt f i t i l i f t I f th t d t d f Q3 2016
31Company Presentation Biotest AG
• Results of interim analysis from part I of the study expected for Q3 2016* ClinicalTrials.gov Identifier-No.: NCT02554019; ** SLEDAI: SLE Disease Activity Index

BT-063Role of Interleukin-10 (IL-10) in Immuno-Oncology
Background
• IL-10 levels are often elevated in serum and tumor microenvironment of cancer ti t 1patients1
• Increased IL-10 serum levels correlate with poor survival2
• Elevated IL-10 serum levels are expected to inhibit the effects of new immuno-Elevated IL 10 serum levels are expected to inhibit the effects of new immunotherapies like checkpoint inhibitors (PD-1, PD-L1), TLR agonists, cancer vaccines
Combining immune stimulatory treatments with anti IL 10 therapy (BT 063) has theCombining immune-stimulatory treatments with anti-IL-10 therapy (BT-063) has the potential to strongly increase the therapeutic success in cancer patients
• Sound scientific rationale• Evidence from preclinical models• Evidence from preclinical models • High interest in anti-IL-10 treatment by academia and industry
Company Presentation
1: Sato T. et al., Immunol Res (2011); Fayad L. et al., Blood (2001); 2: Zhao S. et al., PLOS One (2015)
Biotest AG 32

Outlook & Summary
Biotest AGCompany Presentation 33
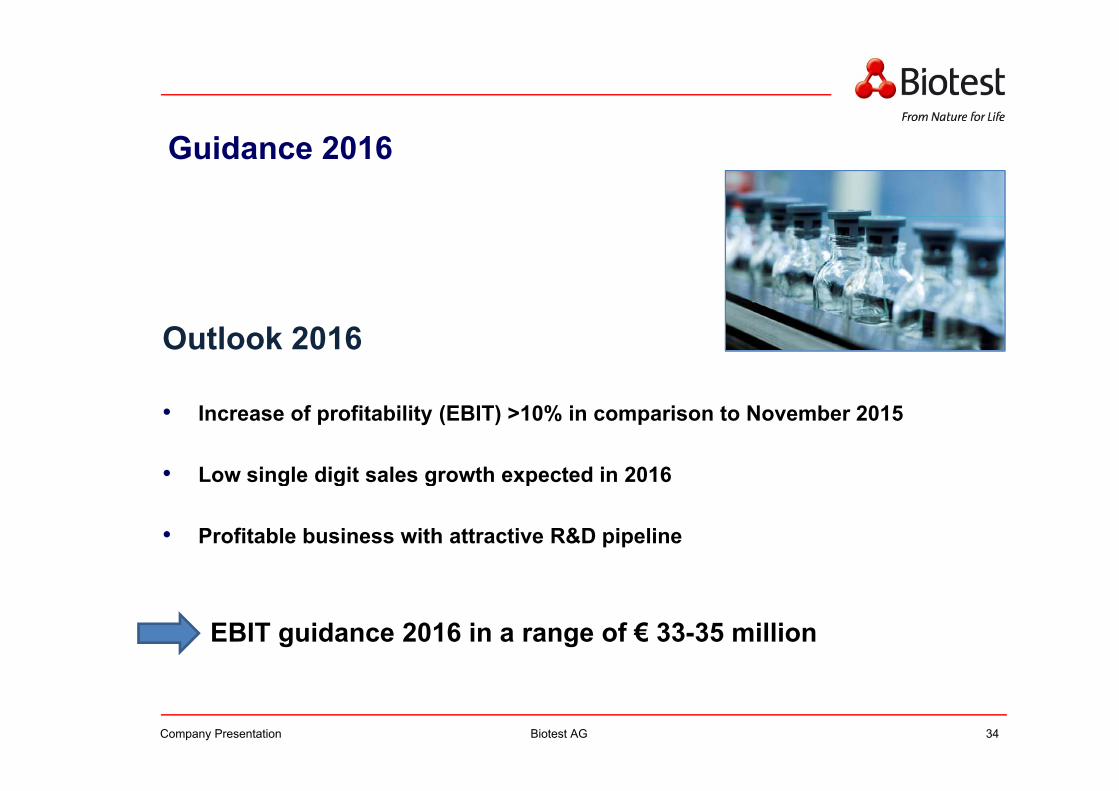
Guidance 2016
Outlook 2016
• Increase of profitability (EBIT) >10% in comparison to November 2015
• Low single digit sales growth expected in 2016g g g p
• Profitable business with attractive R&D pipeline
EBIT guidance 2016 in a range of € 33-35 million
34Company Presentation Biotest AG

Contact Financial Calendar 2016Financial Calendar 2016
Financial Calendar 2016 Investor Relations Public RelationsFinancial Calendar 2016
11 Aug 2016 6M Report 2016
10 Nov 2016 9M Report 2016
Investor Relations Public Relations.Dr. Monika Buttkereit Dirk Neumüller
Phone: +49-6103-801-4406 Phone: [email protected] [email protected]
Company Presentation Biotest AG 35