Annual Shareholders Meeting 2014 - Total.com · Annual Shareholders’ Meeting 2014 – 31 2010...
36
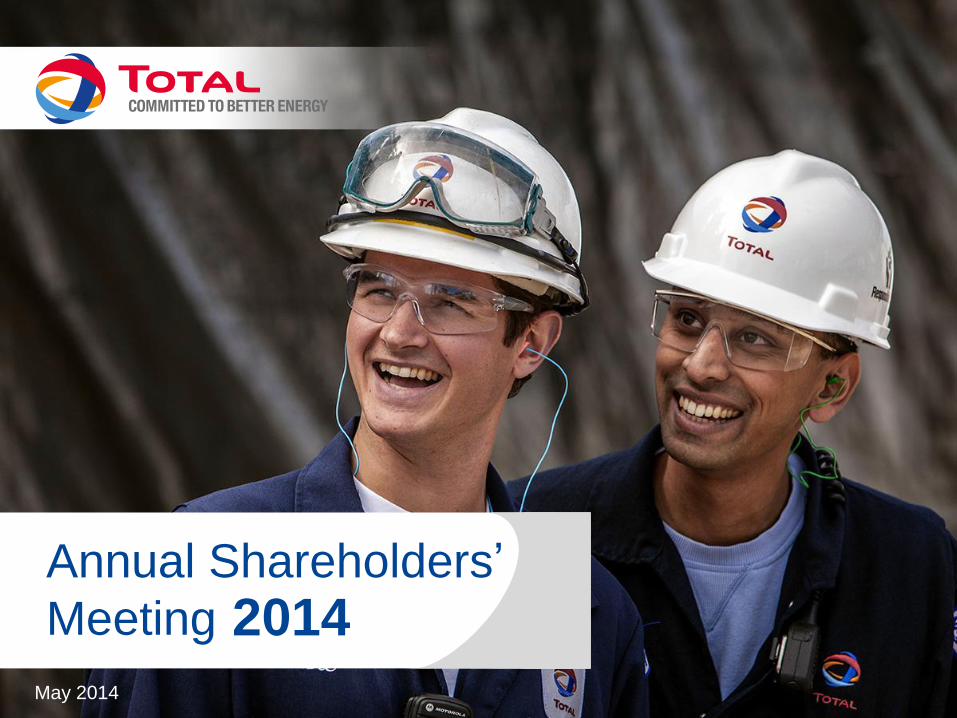
Annual Shareholders’ Meeting 2014 – www.total.com 1 May 2014 Annual Shareholders’ Meeting 2014
Transcript of Annual Shareholders Meeting 2014 - Total.com · Annual Shareholders’ Meeting 2014 – 31 2010...
Annual Shareholders’ Meeting 2014 – www.total.com 1 May 2014
Annual Shareholders’
Meeting 2014

Annual Shareholders’ Meeting 2014 – www.total.com 2
ZONE D’IMAGE
Results Patrick de La Chevardière

Annual Shareholders’ Meeting 2014 – www.total.com 3
% decrease in TRIR, a safety indicator
Mboe/d production
% reserve replacement rate
B$ adjusted net income
% return on equity
14
2013 key figures
2.3
119
14.3
15
Committed to a responsible strategy for long term growth
Annual Shareholders’ Meeting 2014 – www.total.com 4
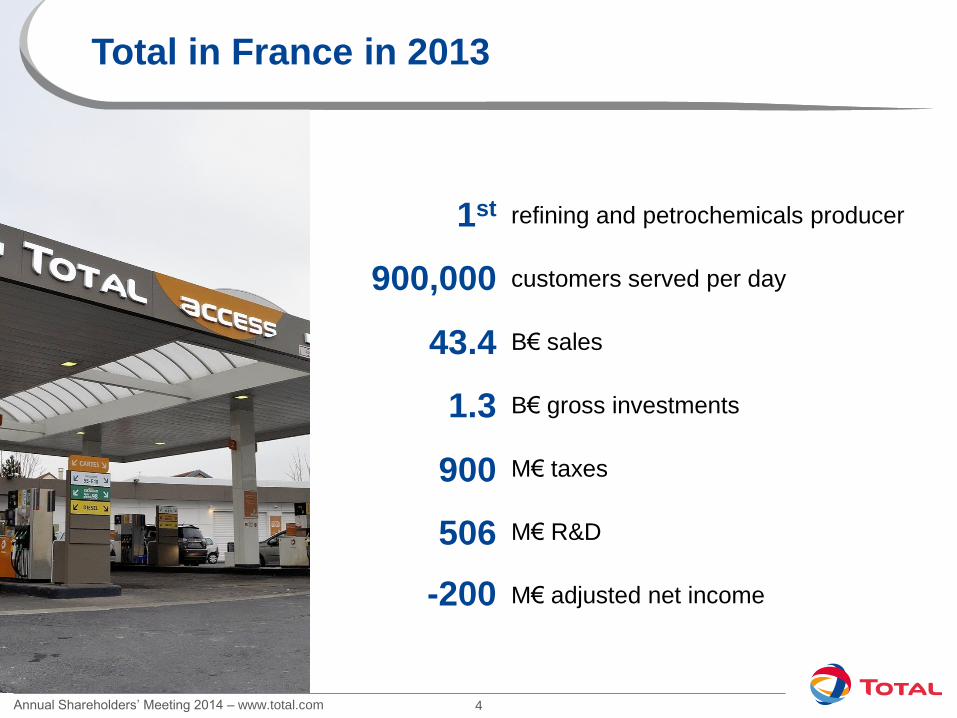
Total in France in 2013
refining and petrochemicals producer
customers served per day
B€ sales
B€ gross investments
M€ taxes
M€ R&D
M€ adjusted net income
1st
900,000
43.4
1.3
900
506
-200

Annual Shareholders’ Meeting 2014 – www.total.com 5
2013 environment
60 65 70 75 80 85 90 95
100 105 110 115 120 125 130 135 140
2011 2012 2013 0
2
4
6
8
10
12
14
16
18
20
109 $/b 16 $/Mbtu in Asia
11 $/Mbtu in Europe
4 $/Mbtu in USA
100
115
2011 2012 2013
20
10
Gas Brent
Stable and supportive oil and gas prices

Annual Shareholders’ Meeting 2014 – www.total.com 6
Competitive 2013 results in a challenging context
Refining & Chemicals 9% ROACE
Modernizing Antwerp
Starting-up Satorp in Jubail, Saudi Arabia
Marketing & Services 16% ROACE
Expanding in high-growth markets
Sunpower growing profitably
Upstream 14% ROACE
Delivering resilient results despite one-offs
Launching major projects
Acquiring promising new assets, notably in Brazil
13% Goup ROACE in 2013
14.3 B$
Other
Adjusted net income

Annual Shareholders’ Meeting 2014 – www.total.com 7
• Balanced mix: Oil (51%) / Gas (49%)
• Effective geographical distribution
• Decline rate of 3-4% per year
2.3 Mboe/d production in 2013
Oil production by geographical area
Gas production by geographical area
Well-balanced distribution of production
3% Asia-Pacific
45% Africa
7% Americas
14% Europe
3% CIS
28% Middle East
19% Asia-Pacific
20% Europe
17% CIS
19% Middle East
14% Americas
11% Africa

Annual Shareholders’ Meeting 2014 – www.total.com 8
Adding giant projects for the long term
New resources
2013 FID
Moho Nord
Yamal Fort Hills
Milestone year for FIDs and new resources
Elk-Antelope Egina
Libra
Annual Shareholders’ Meeting 2014 – www.total.com 9
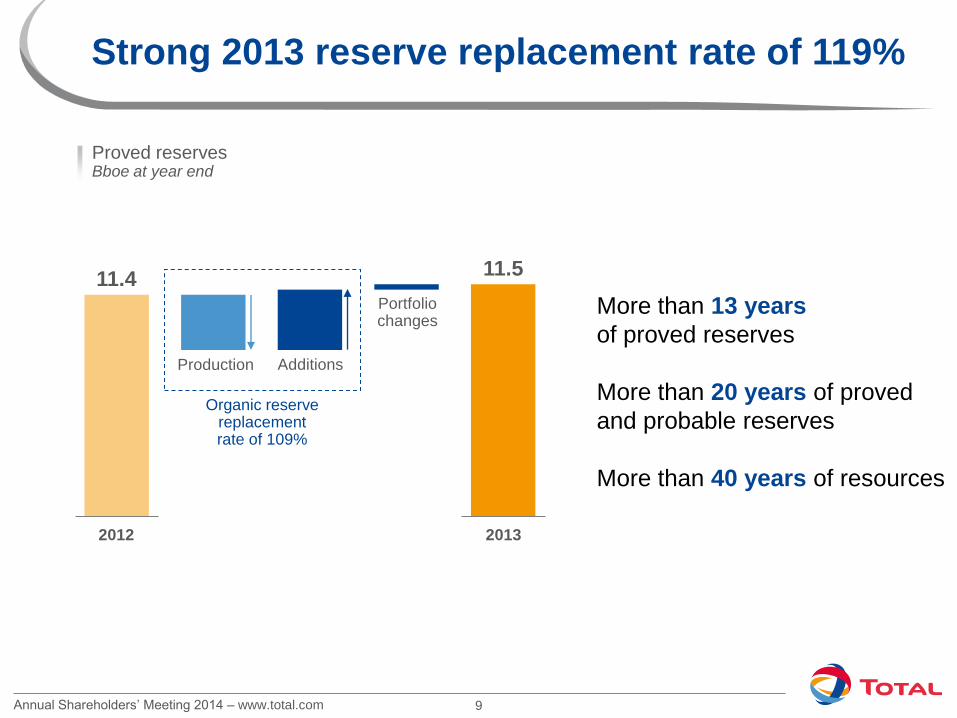
Strong 2013 reserve replacement rate of 119%
Proved reserves Bboe at year end
Production Additions
11.4 Portfolio changes
Organic reserve replacement rate of 109%
11.5
2013 2012
More than 13 years
of proved reserves
More than 20 years of proved
and probable reserves
More than 40 years of resources
Annual Shareholders’ Meeting 2014 – www.total.com 10
2011 2012 2013
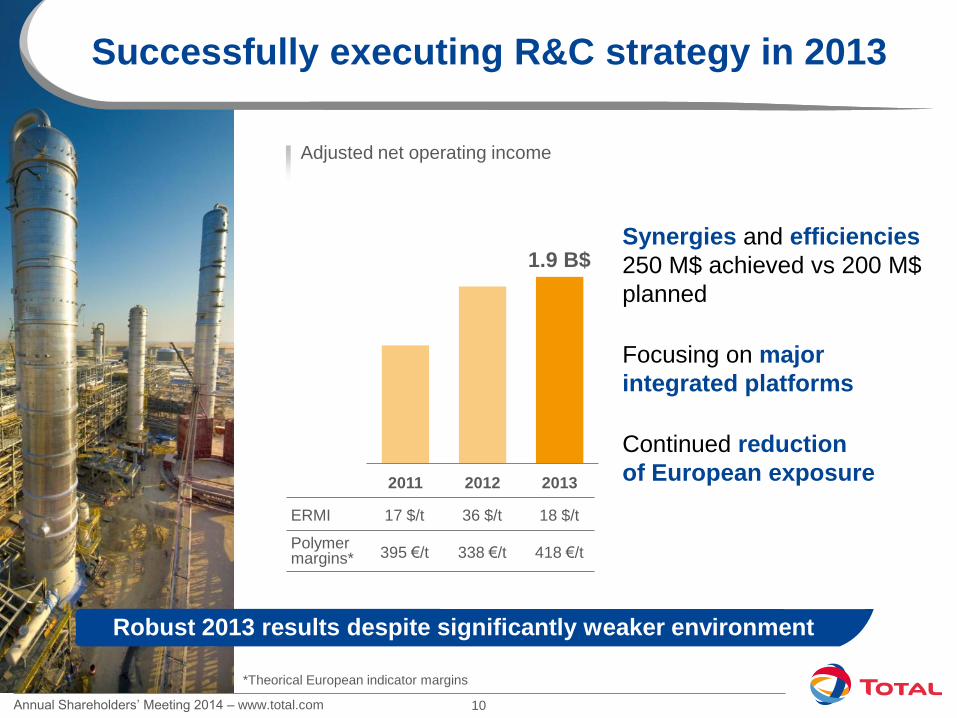
Successfully executing R&C strategy in 2013
Synergies and efficiencies
250 M$ achieved vs 200 M$
planned
Focusing on major
integrated platforms
Continued reduction
of European exposure
1.9 B$
ERMI
395 €/t 338 €/t 418 €/t Polymer margins*
17 $/t 36 $/t 18 $/t
Adjusted net operating income
Robust 2013 results despite significantly weaker environment
*Theorical European indicator margins
Annual Shareholders’ Meeting 2014 – www.total.com 11
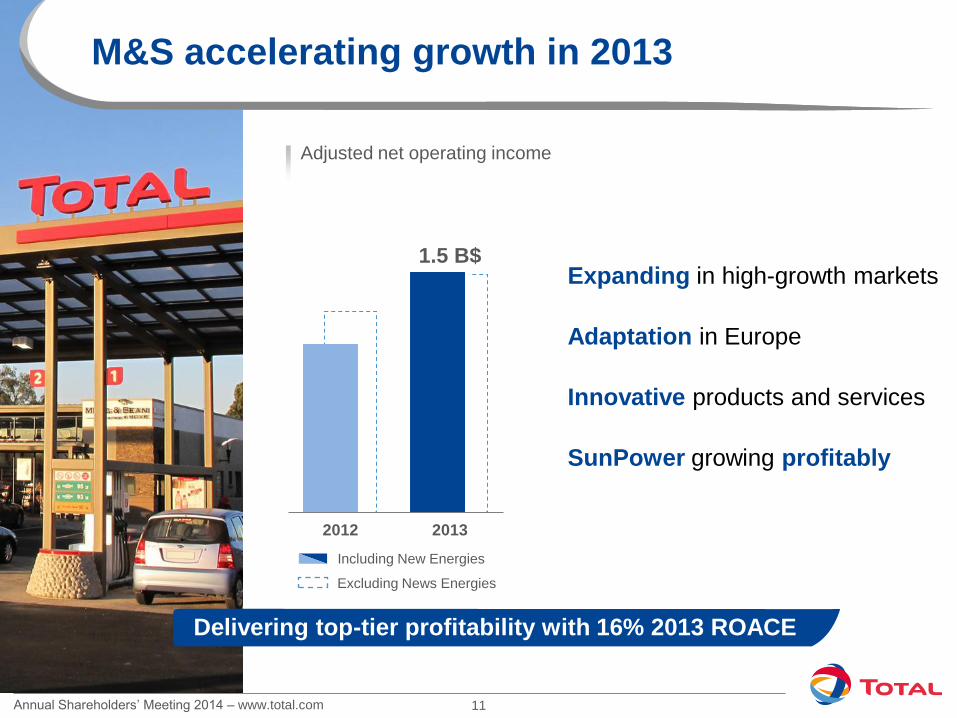
M&S accelerating growth in 2013
Expanding in high-growth markets
Adaptation in Europe
Innovative products and services
SunPower growing profitably
Excluding News Energies
Including New Energies
Delivering top-tier profitability with 16% 2013 ROACE
2012 2013
Adjusted net operating income
1.5 B$
Annual Shareholders’ Meeting 2014 – www.total.com 12
2013 cash flow allocation
Strong financial position throughout intensive investment phase
Cash flow allocation B$
Pending shareholder AGM approval
Net asset sales = asset sales (including transactions with minority interests) - acquisitions *
**
28 B$ peak organic investment
in line with budget
2.4 B$ net asset sales* not including
3.2 B$ Usan & Block 15/06
23% gearing within target range
of 20-30%
7 B$ dividend, 4Q increase
effective 2014**
Net asset sales
Change in net debt
Cash flow from operations
31 B$
Organic
investment
2013
Dividend
Annual Shareholders’ Meeting 2014 – www.total.com 13
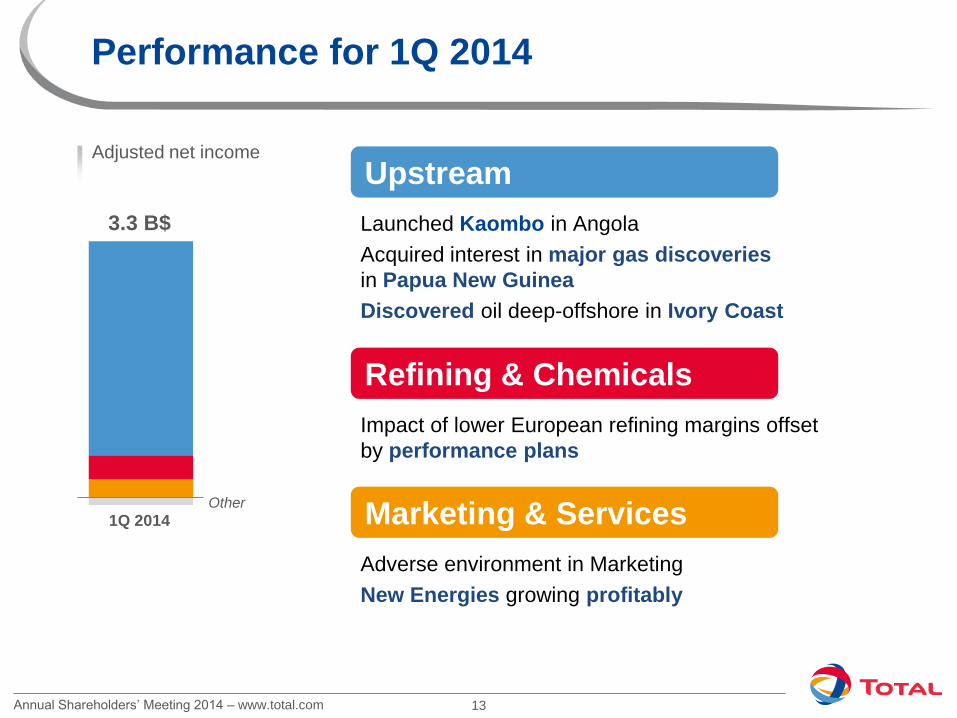
Refining & Chemicals
Impact of lower European refining margins offset
by performance plans
Marketing & Services
Adverse environment in Marketing
New Energies growing profitably
Performance for 1Q 2014
Adjusted net income
Upstream
Launched Kaombo in Angola
Acquired interest in major gas discoveries
in Papua New Guinea
Discovered oil deep-offshore in Ivory Coast
1T 2014
3.3 B$
Other
1Q 2014
Annual Shareholders’ Meeting 2014 – www.total.com 14
ZONE D’IMAGE
Corporate Governance Christophe de Margerie
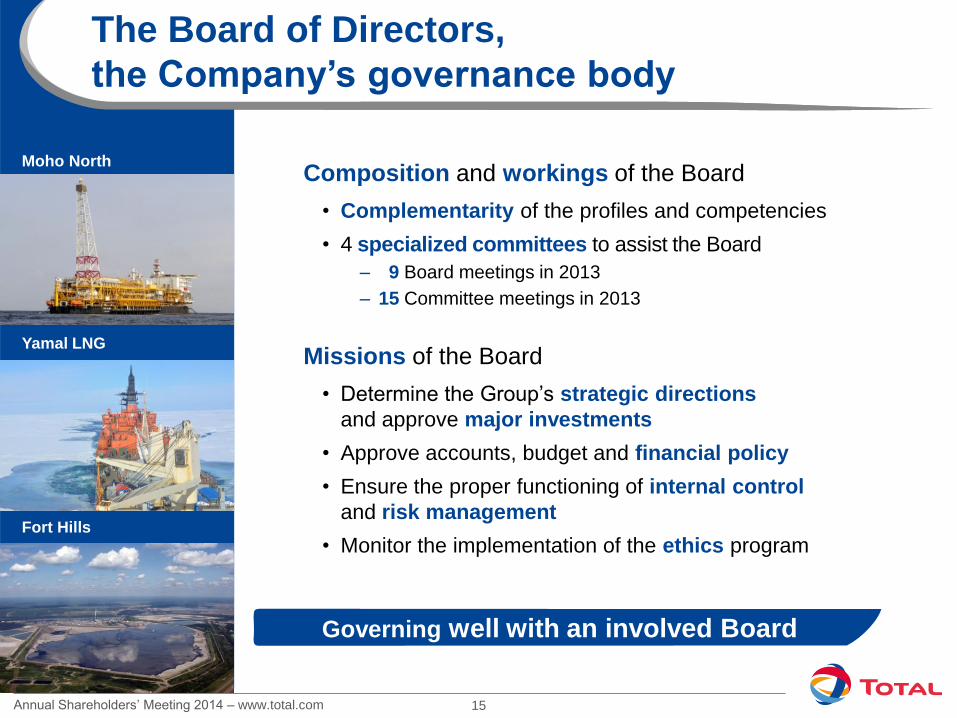
Annual Shareholders’ Meeting 2014 – www.total.com 15
Composition and workings of the Board
• Complementarity of the profiles and competencies
• 4 specialized committees to assist the Board
‒ 9 Board meetings in 2013
‒ 15 Committee meetings in 2013
Missions of the Board
• Determine the Group’s strategic directions
and approve major investments
• Approve accounts, budget and financial policy
• Ensure the proper functioning of internal control
and risk management
• Monitor the implementation of the ethics program
The Board of Directors,
the Company’s governance body
Yamal LNG
Fort Hills
Moho North
Governing well with an involved Board
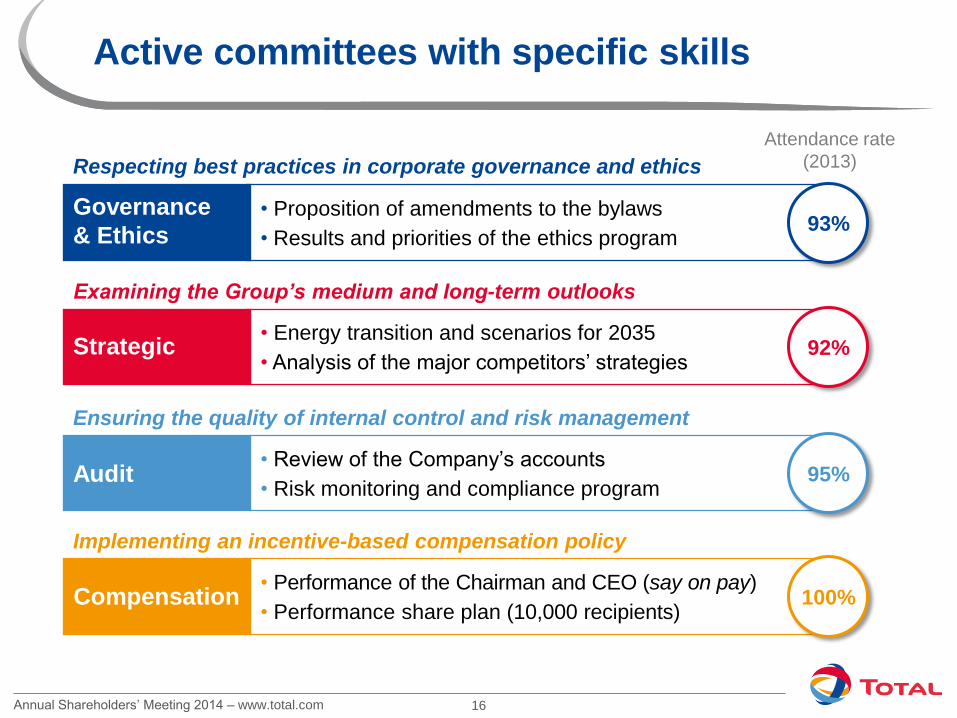
Annual Shareholders’ Meeting 2014 – www.total.com 16
• Proposition of amendments to the bylaws
• Results and priorities of the ethics program 93%
Strategic • Energy transition and scenarios for 2035
• Analysis of the major competitors’ strategies
Compensation • Performance of the Chairman and CEO (say on pay)
• Performance share plan (10,000 recipients)
Audit • Review of the Company’s accounts
• Risk monitoring and compliance program
Active committees with specific skills
Respecting best practices in corporate governance and ethics
Examining the Group’s medium and long-term outlooks
Ensuring the quality of internal control and risk management
Implementing an incentive-based compensation policy
92%
100%
Attendance rate
(2013)
95%
Governance
& Ethics
Annual Shareholders’ Meeting 2014 – www.total.com 17
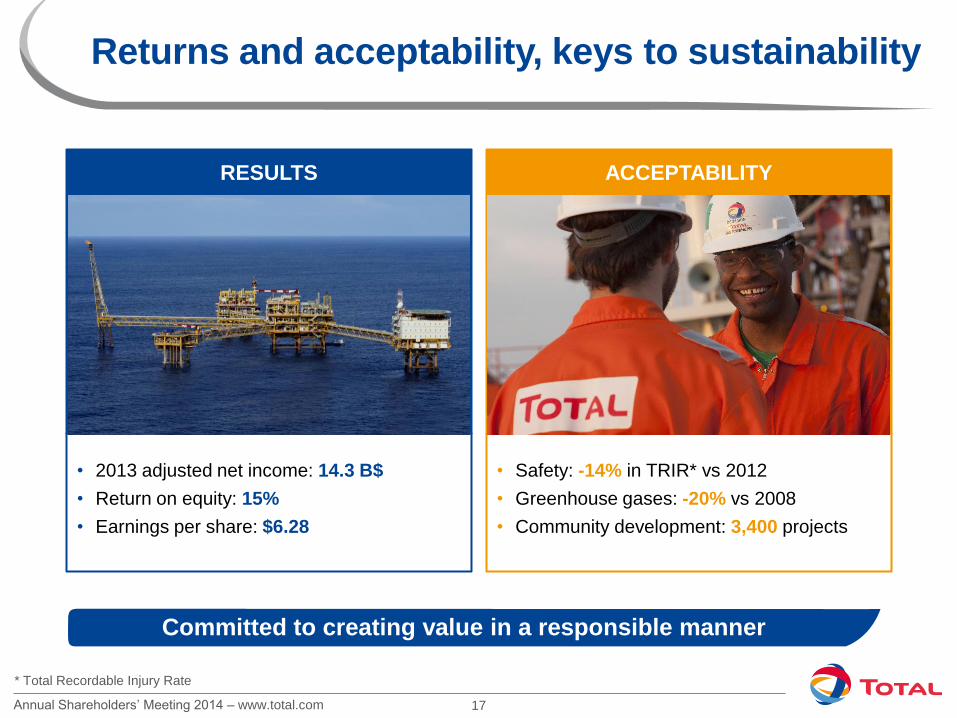
Returns and acceptability, keys to sustainability
Committed to creating value in a responsible manner
• 2013 adjusted net income: 14.3 B$
• Return on equity: 15%
• Earnings per share: $6.28
RESULTS
• Safety: -14% in TRIR* vs 2012
• Greenhouse gases: -20% vs 2008
• Community development: 3,400 projects
ACCEPTABILITY
* Total Recordable Injury Rate

Annual Shareholders’ Meeting 2014 – www.total.com 18
Shareholding structure in 2013
31.4% Rest
of Europe
9.4% Rest
of world
30.9% North America
28.3% France
By geographical area
8.1% Individual
shareholders
4.9% Group
employees 87% Institutional shareholders
By shareholder type
An estimated 500,000 French individual shareholders
Annual Shareholders’ Meeting 2014 – www.total.com 19
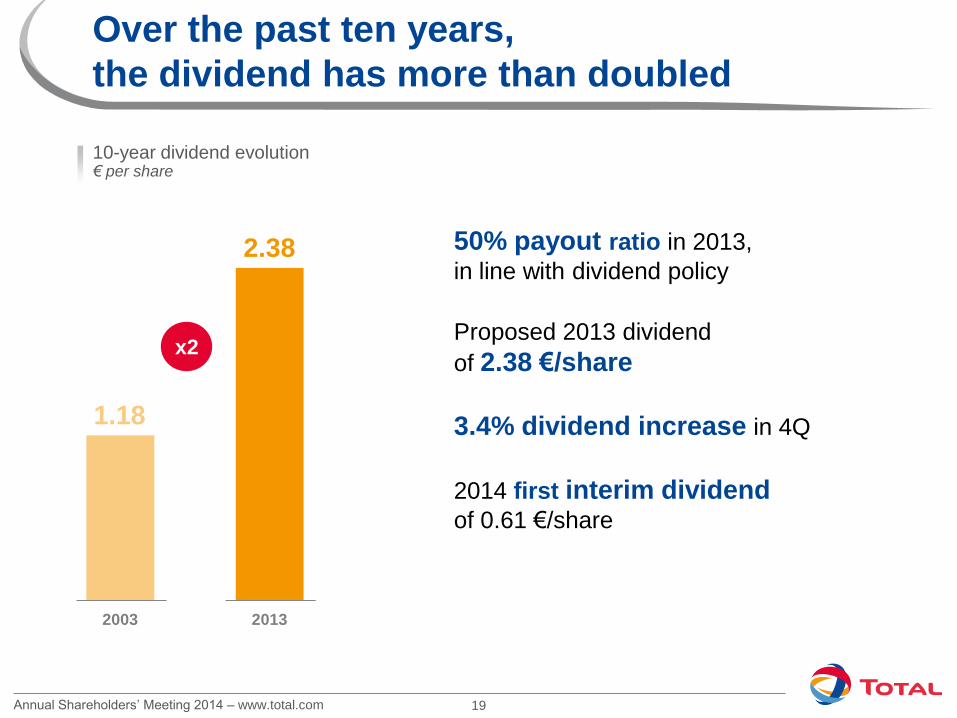
Over the past ten years,
the dividend has more than doubled
10-year dividend evolution € per share
2003 2013
x2
2.38
1.18
50% payout ratio in 2013,
in line with dividend policy
Proposed 2013 dividend
of 2.38 €/share
3.4% dividend increase in 4Q
2014 first interim dividend
of 0.61 €/share
Annual Shareholders’ Meeting 2014 – www.total.com 20
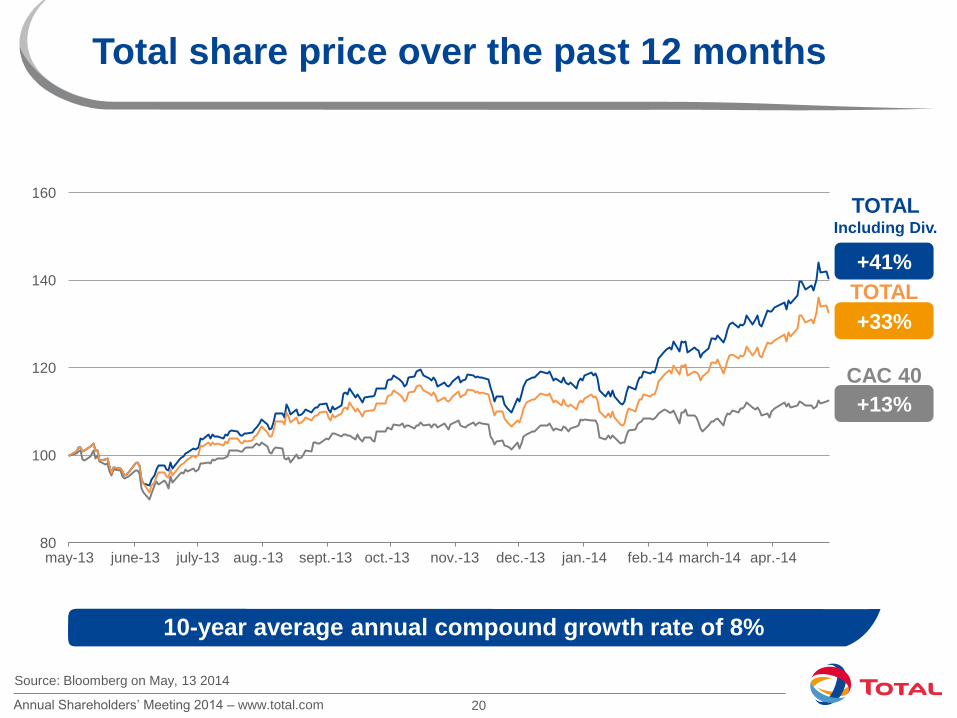
80
100
120
140
160
May-13 Jun-13 Jul-13 Aug-13 Sep-13 Oct-13 Nov-13 Dec-13 Jan-14 Feb-14 Mar-14 Apr-14
Total share price over the past 12 months
+13%
CAC 40
+41%
TOTAL Including Div.
+33%
TOTAL
Source: Bloomberg on May, 13 2014
may-13 june-13 july-13 aug.-13 sept.-13 oct.-13 nov.-13 dec.-13 jan.-14 feb.-14 march-14 apr.-14
10-year average annual compound growth rate of 8%
Annual Shareholders’ Meeting 2014 – www.total.com 21
ZONE D’IMAGE
Compensation Patrick de La Chevardière
Annual Shareholders’ Meeting 2014 – www.total.com 22
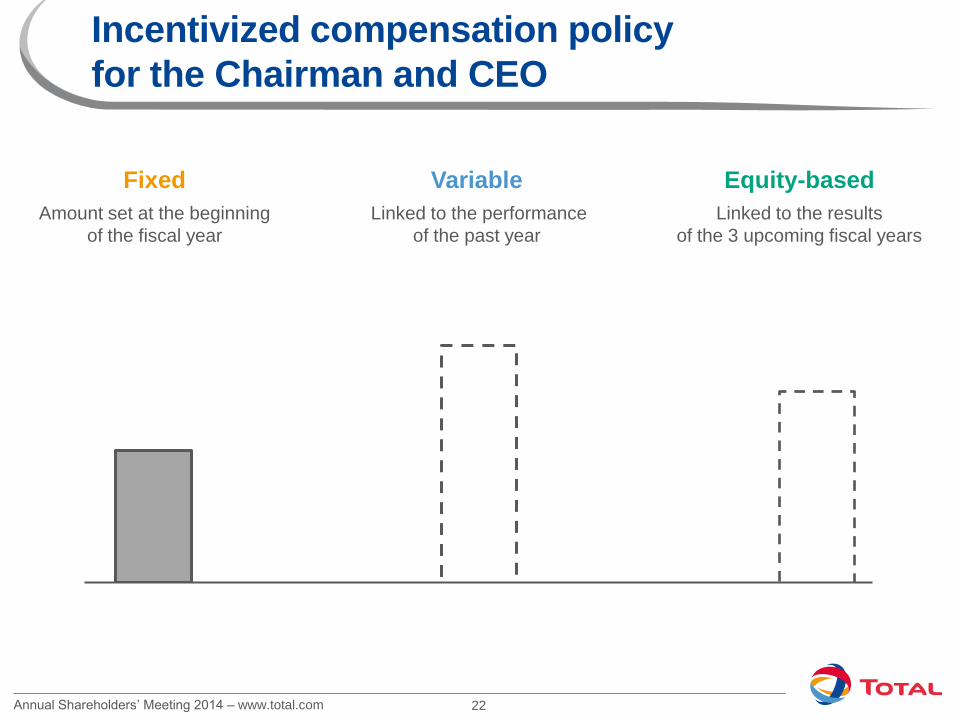
Incentivized compensation policy
for the Chairman and CEO
Fixed
Amount set at the beginning
of the fiscal year
Variable
Linked to the performance
of the past year
Equity-based
Linked to the results
of the 3 upcoming fiscal years

Annual Shareholders’ Meeting 2014 – www.total.com 23
Fixed compensation due for 2013
A stable and consistent amount
Unchanged
since 2010
€1,500,000
Fixed
Reviewed periodically by the Compensation Committee and annually by the Board
Criteria taken into account:
• Level of responsibilities assumed
• Practices among CAC 40 companies
Annual Shareholders’ Meeting 2014 – www.total.com 24
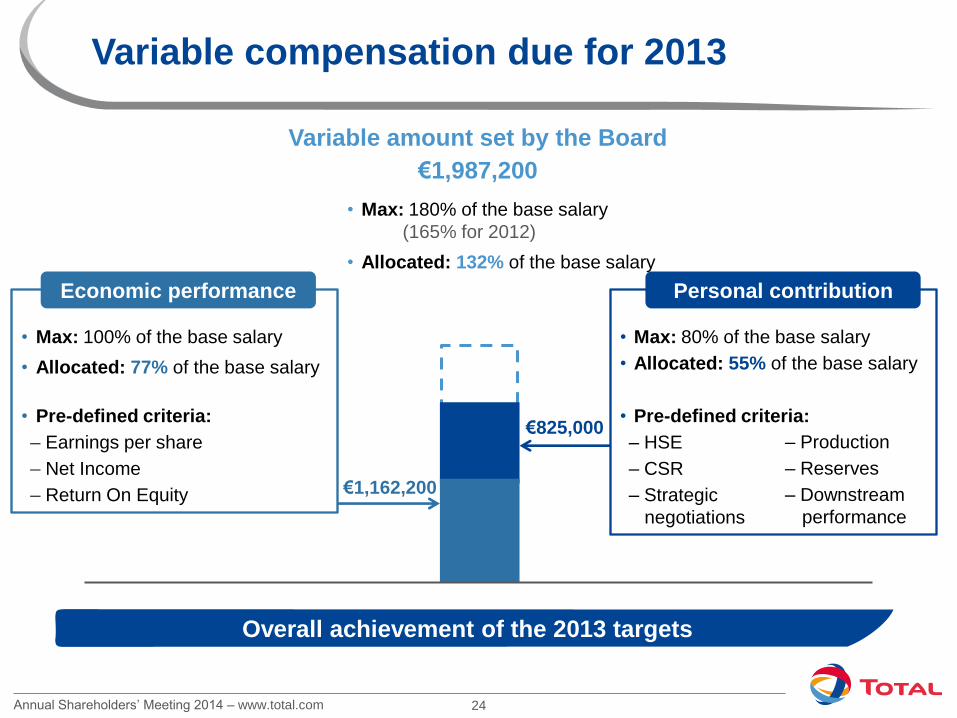
Variable compensation due for 2013
Overall achievement of the 2013 targets
Variable amount set by the Board
€1,987,200
• Max: 80% of the base salary
• Allocated: 55% of the base salary
• Pre-defined criteria:
– HSE
– CSR
– Strategic
negotiations
• Max: 100% of the base salary
• Allocated: 77% of the base salary
• Pre-defined criteria:
– Earnings per share
– Net Income
– Return On Equity
Economic performance
€825,000
€1,162,200
– Production
– Reserves
– Downstream
performance
• Max: 180% of the base salary
(165% for 2012)
• Allocated: 132% of the base salary
Personal contribution

Annual Shareholders’ Meeting 2014 – www.total.com 25
Long-term compensation: performance shares
under the 2013 plan
In line with shareholders’ interests
Conditional award
of performance shares
Definitive award
depending on target attainment
End of holding
requirement
Holding period
– 2 years –
Max.
53,000 shares
Vesting period
– 3 years – 2013, 2014 and 2015
2016 2018 2013
Profitability criteria
• ROE (for half of the shares)
• ROACE (for the other half)

Annual Shareholders’ Meeting 2014 – www.total.com 26
Compensation of the Chairman and CEO
for 2013
A compensation based on performance
Fixed
Amount unchanged
since 2010
€1,500,000
Paid in 2013
Variable
Linked to the
2013 performance
€1,987,200
Paid in April 2014
Equity-based
Linked to the 2013, 2014
and 2015 results
53,000 shares max.
Definitively awarded in 2016
Max. 180%
132%

Annual Shareholders’ Meeting 2014 – www.total.com 27
ZONE D’IMAGE
Outlook Christophe de Margerie

Annual Shareholders’ Meeting 2014 – www.total.com 28
Oil & gas demand growing over the long term
Industry challenge to satisfy demand
2012 2030 2012 2030
Existing supply
Sanctioned projects
+5% CAGR
Potential projects
Decline ~55 Mb/d of incremental production
+0.6% CAGR
250
500
100
Oil supply-demand Mb/d
LNG supply-demand Mt/y
Oil demand
LNG demand
Annual Shareholders’ Meeting 2014 – www.total.com 29
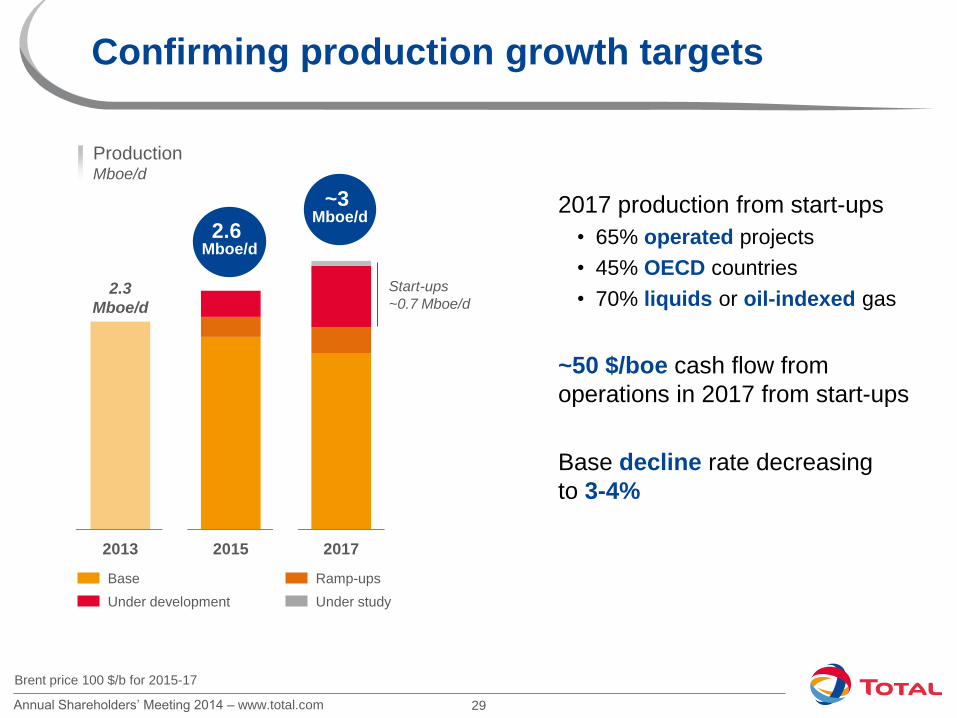
Confirming production growth targets
Production Mboe/d
Brent price 100 $/b for 2015-17
2017 production from start-ups
• 65% operated projects
• 45% OECD countries
• 70% liquids or oil-indexed gas
~50 $/boe cash flow from
operations in 2017 from start-ups
Base decline rate decreasing
to 3-4%
2013 2015 2017
~3 Mboe/d
2.6 Mboe/d
2.3
Mboe/d
Under development Under study
Ramp-ups Base
Start-ups
~0.7 Mboe/d

Annual Shareholders’ Meeting 2014 – www.total.com 30
High-potential 2014 exploration program
2014 big cat and elephant wells
Drilling >15 high-impact wells, targeting ~1 Bboe risked net share

Annual Shareholders’ Meeting 2014 – www.total.com 31
2010 2015
R&C on track to achieve 2015 ROACE target
ROACE based on 2010 environment
ERMI 27 $2010/t, mid-cycle for petrochemicals, $/€ 1.33
2011-2013 2015 2014
10% in 2013
11.5% in 2014
+1.5%
Major projects
on main
platforms +0.5%
Specialty
chemicals
+2.5%
Portfolio
changes
+2.5%
Synergies
Efficiencies
400 M$
in 2014 out
of 650 M$
2015 target
Cepsa
Dunkirk
Resins
Fertilizers
Carling
Port Arthur
Normandy
Qatar
Satorp
Daesan
Antwerp
6%
13%
Annual Shareholders’ Meeting 2014 – www.total.com 32
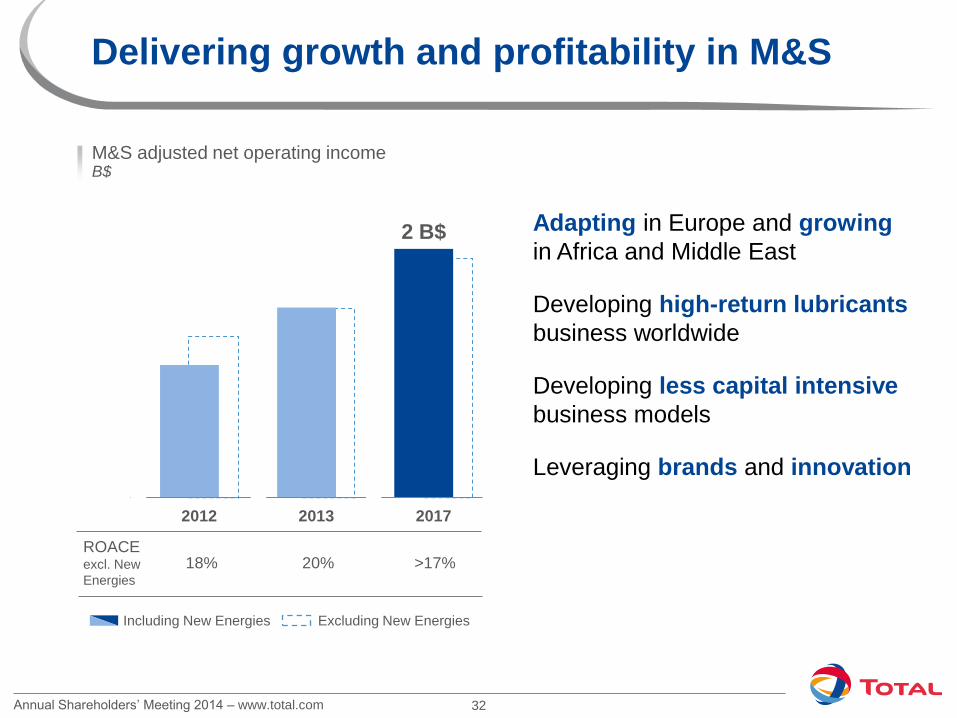
Delivering growth and profitability in M&S
M&S adjusted net operating income B$
Adapting in Europe and growing
in Africa and Middle East
Developing high-return lubricants
business worldwide
Developing less capital intensive
business models
Leveraging brands and innovation
Excluding New Energies Including New Energies
2012 2013 2017 2017 2012 2013
2 B$
ROACE excl. New
Energies
18% 20% >17%

Annual Shareholders’ Meeting 2014 – www.total.com 33
Mobilizing all teams on cost reduction
Cost discipline vital for sustainable investments
• No progress without behavioral change
Controlling project costs
• Focusing on pre-sanction process standardized designs, “fit for purpose”...
• Optimizing contractual strategy and purchasing open book, lump sum…
• Effective local content
Reducing operating costs
• Launching cost saving plan throughout company
• Systematic bottom-up analysis
• Strict accountability for cost management
Controlling Capex, reducing Opex
no compromise on safety
R&C 15% reduction of non-manpower fixed costs
E&P ~4 B$ Capex reduction on Kaombo
M&S SunPower reduced cost/watt >40% over 2 years

Annual Shareholders’ Meeting 2014 – www.total.com 34
On track to deliver free cash flow growth
* 2015-17 in a Brent 100 $/b scenario and ERMI 30 $/t, free cash flow = cash flow from operations - net investments
Free cash flow driving competitive shareholder return
Growing cash flow from operations
• Strong production growth
• Cash accretive Upstream start-ups
• Increasing contribution of Downstream
Controlling Capex and reducing
Opex
Strengthening financial position
2013 2015 2017
Free cash flow* B$
2013 dividend
15
10
5
Annual Shareholders’ Meeting 2014 – www.total.com 35
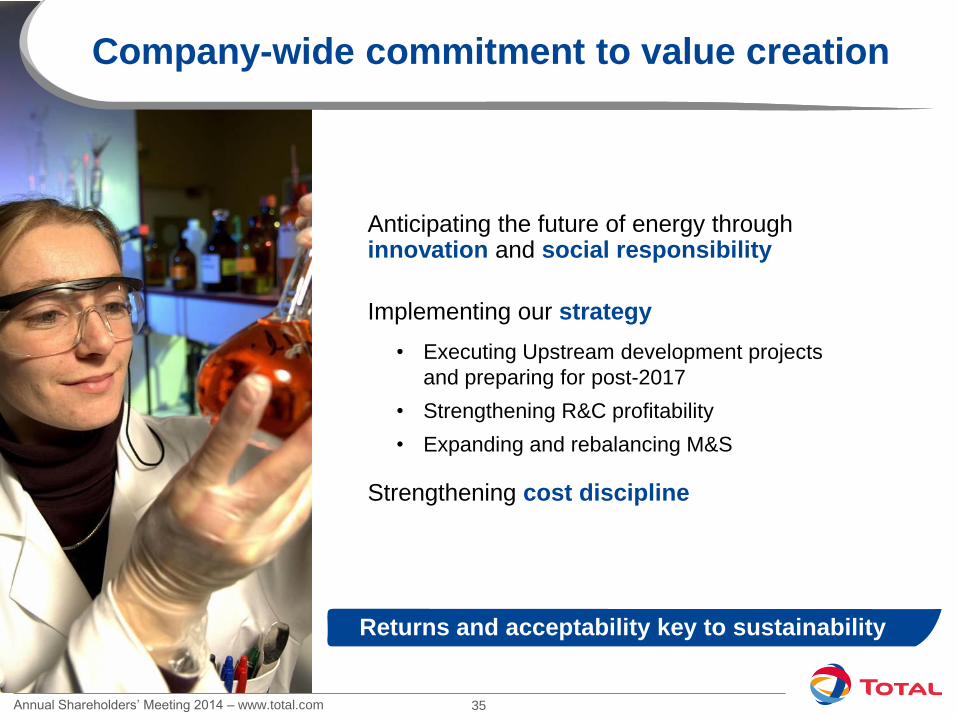
Anticipating the future of energy through innovation and social responsibility
Implementing our strategy
• Executing Upstream development projects
and preparing for post-2017
• Strengthening R&C profitability
• Expanding and rebalancing M&S
Strengthening cost discipline
Returns and acceptability key to sustainability
Company-wide commitment to value creation
Annual Shareholders’ Meeting 2014 – www.total.com 36
Disclaimer
This document may contain forward-looking information on the Group (including
objectives and trends), as well as forward-looking statements within the meaning of the
Private Securities Litigation Reform Act of 1995, notably with respect to the financial
condition, results of operations, business, strategy and plans of TOTAL. These data do
not represent forecasts within the meaning of European Regulation No. 809/2004.
Such forward-looking information and statements included in this document are based
on a number of economic data and assumptions made in a given economic, competitive
and regulatory environment. They may prove to be inaccurate in the future, and are
subject to a number of risk factors that could lead to a significant difference between
actual results and those anticipated, including currency fluctuations, the price of
petroleum products, the ability to realize cost reductions and operating efficiencies
without unduly disrupting business operations, environmental regulatory considerations
and general economic and business conditions. Certain financial information is based on
estimates particularly in the assessment of the recoverable value of assets and potential
impairments of assets relating thereto.
Neither TOTAL nor any of its subsidiaries assumes any obligation to update publicly any
forward-looking information or statement, objectives or trends contained in this document
whether as a result of new information, future events or otherwise. Further information
on factors, risks and uncertainties that could affect the Company’s financial results or the
Group’s activities is provided in the most recent Registration Document filed by the
Company with the French Autorité des Marchés Financiers and annual report on Form
20-F filed with the United States Securities and Exchange Commission (“SEC”).
Financial information by business segment is reported in accordance with the internal
reporting system and shows internal segment information that is used to manage and
measure the performance of TOTAL. Performance indicators excluding the adjustment
items, such as adjusted operating income, adjusted net operating income, and adjusted
net income are meant to facilitate the analysis of the financial performance and the
comparison of income between periods. These adjustment items include:
(i) Special items
Due to their unusual nature or particular significance, certain transactions qualified as
"special items" are excluded from the business segment figures. In general, special
items relate to transactions that are significant, infrequent or unusual. However, in
certain instances, transactions such as restructuring costs or asset disposals, which are
not considered to be representative of the normal course of business, may be qualified
as special items although they may have occurred within prior years or are likely to occur
again within the coming years.
(ii) Inventory valuation effect
The adjusted results of the Refining & Chemicals and Marketing & Services segments
are presented according to the replacement cost method. This method is used to assess
the segments’ performance and facilitate the comparability of the segments’
performance with those of its competitors.
In the replacement cost method, which approximates the LIFO (Last-In, First-Out)
method, the variation of inventory values in the statement of income is, depending on the
nature of the inventory, determined using either the month-end price differentials
between one period and another or the average prices of the period rather than the
historical value. The inventory valuation effect is the difference between the results
according to the FIFO (First-In, First-Out) and the replacement cost.
(iii) Effect of changes in fair value
The effect of changes in fair value presented as an adjustment item reflects for some
transactions differences between internal measures of performance used by TOTAL’s
management and the accounting for these transactions under IFRS.
IFRS requires that trading inventories be recorded at their fair value using period-end
spot prices. In order to best reflect the management of economic exposure through
derivative transactions, internal indicators used to measure performance include
valuations of trading inventories based on forward prices.
Furthermore, TOTAL, in its trading activities, enters into storage contracts, which future
effects are recorded at fair value in Group’s internal economic performance. IFRS
precludes recognition of this fair value effect.
The adjusted results (adjusted operating income, adjusted net operating income,
adjusted net income) are defined as replacement cost results, adjusted for special items,
excluding the effect of changes in fair value.
Cautionary Note to U.S. Investors – The SEC permits oil and gas companies, in their
filings with the SEC, to separately disclose proved, probable and possible reserves that
a company has determined in accordance with SEC rules. We may use certain terms in
this presentation, such as resources, that the SEC’s guidelines strictly prohibit us from
including in filings with the SEC. U.S. investors are urged to consider closely the
disclosure in our Form 20-F, File N° 1-10888, available from us at 2, Place Jean Millier –
Arche Nord Coupole/Regnault - 92078 Paris-La Défense Cedex, France, or at our
website: www.total.com. You can also obtain this form from the SEC by calling 1-800-
SEC-0330 or on the SEC’s website: www.sec.gov.