
Annual SARs by Study Category, TIR and D: Patterns and Significance Presenter: Charlie Petrosky CSS...
19
Annual SARs by Study Category, TIR and D: Patterns and Significance Presenter: Charlie Petrosky CSS Annual Meeting Apr 2 nd 2010
-
Upload
solomon-mcbride -
Category
Documents
-
view
217 -
download
1
Transcript of Annual SARs by Study Category, TIR and D: Patterns and Significance Presenter: Charlie Petrosky CSS...

Annual SARs by Study Category, TIR and D:
Patterns and Significance
Presenter: Charlie Petrosky
CSS Annual Meeting Apr 2nd 2010

Chapter 4 Overview Snake River spring/summer Chinook & steelhead Estimate & compare annual SARs for hatchery &
wild groups of smolts with different hydrosystem experiences (T0, C0, C1)
Evaluate effectiveness of transportation relative to in-river migration – annual SAR ratios between T0 & C0 fish (TIR)
Estimate differential delayed mortality (D) between transported (T0) and in-river (C0) fish
Evaluate effects of bypass via annual SAR ratios between C0 and C1 fish
Evaluate TIR patterns relative to in-river survival (SR)

Smolt transportation
Pre-2006: transported most collected smolts at LGR, LGS, LMN
2006-2009: bypassed early, transported mid- & late season
1994-2009: wide range of in-river conditions (flow & spill)

Study Categories C0 – Pass all Snake River collector/transport dams
(LGR, LGS, LMN) via combination of spill and turbine routes • i.e., C0 fish not detected at any transport dam• Pass primarily via spill when spill provided• Represent in-river migrants from run-at-large (most years)
C1 – Pass one or more transport dams via bypass system• 2006-2009 management – early migrants• Bypass needed to estimate in-river survival (SR)
T0 – Transported the first time fish is collected at LGR, LGS or LMN• Represent transport management strategy

SAR by Study Category PIT tag in tributaries or hatcheries upstream of
LGR SAR = (LGR adults)/(LGR smolts)
• LGR adults ~ count data• LGR smolts ~ mark-recapture (CJS) estimate• Bootstrap 90% CI
Wild spring/summer Chinook, 1994-2007 Hatchery spring/summer Chinook, 1997-2007
• Spring: Dworshak, Rapid R., Catherine Cr.• Summer: Imnaha, McCall• MY 2008 additional hatcheries (LSRCP, IPC)
Wild steelhead, 1997-2006 Hatchery Steelhead, 1997-2006
• MY 2008 initiated increased marking (LSRCP, IPC)

Wild Chinook SARs << NPCC 2%-6% SAR goal General pattern: SAR(C0) ~ SAR(T0) > SAR(C1)
• Exception, low flow, low spill years
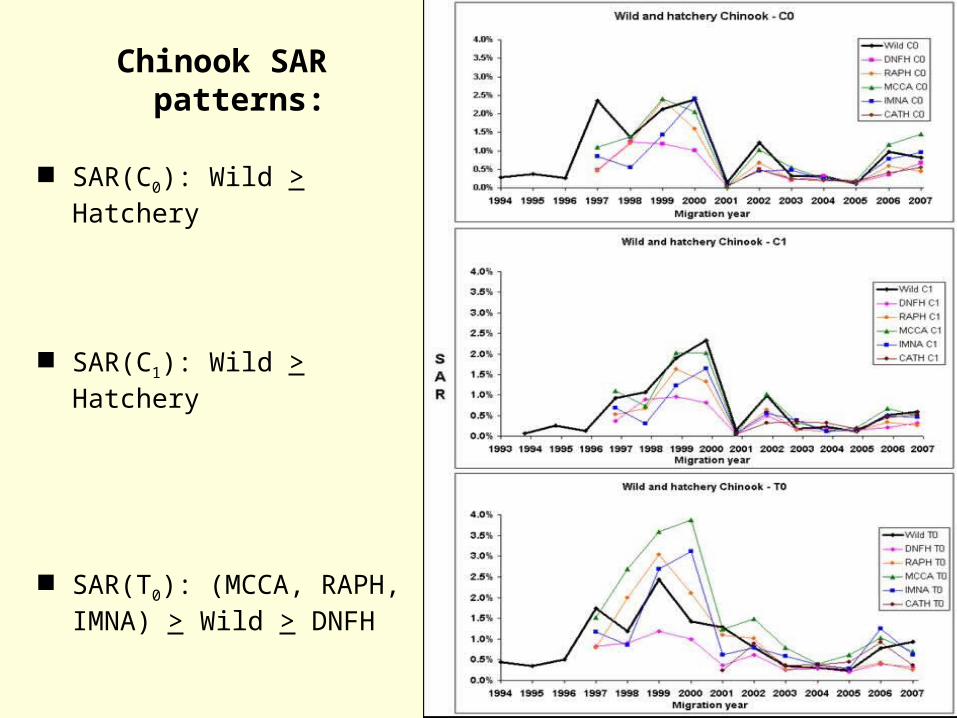
Chinook SAR patterns:
SAR(C0): Wild > Hatchery
SAR(C1): Wild > Hatchery
SAR(T0): (MCCA, RAPH, IMNA) > Wild > DNFH

Wild Steelhead SARs << NPCC 2%-6% SAR goal General pattern: SAR(T0) > SAR(C0) > SAR(C1)
• Exceptions, 1998 & 2006
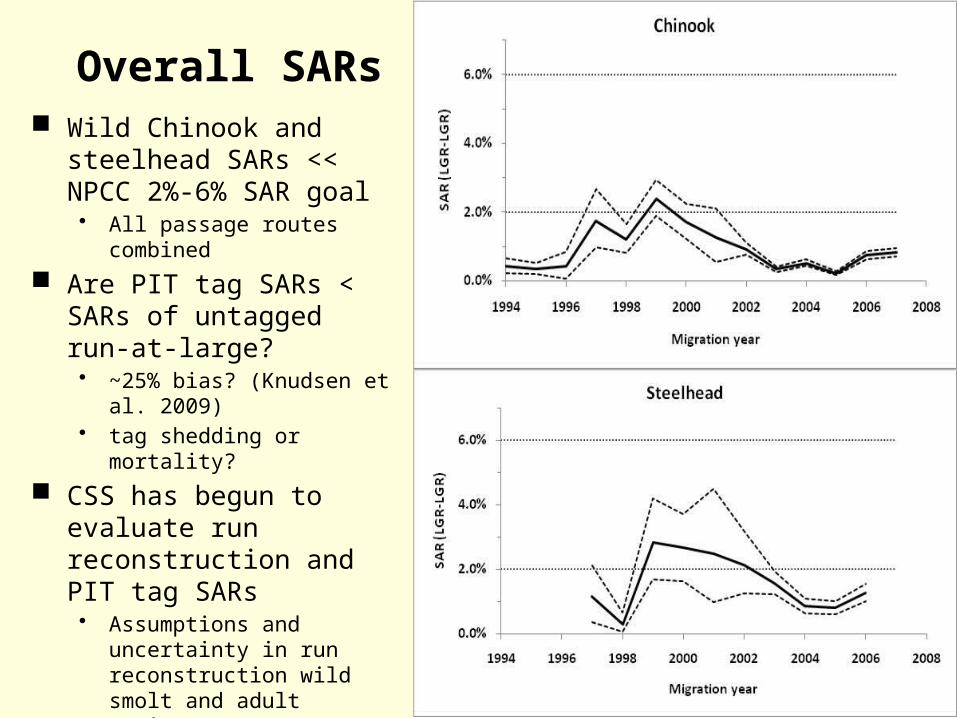
Overall SARs Wild Chinook and
steelhead SARs << NPCC 2%-6% SAR goal• All passage routes
combined
Are PIT tag SARs < SARs of untagged run-at-large?• ~25% bias? (Knudsen et
al. 2009)• tag shedding or mortality?
CSS has begun to evaluate run reconstruction and PIT tag SARs• Assumptions and
uncertainty in run reconstruction wild smolt and adult estimates
• Directed studies at hatcheries
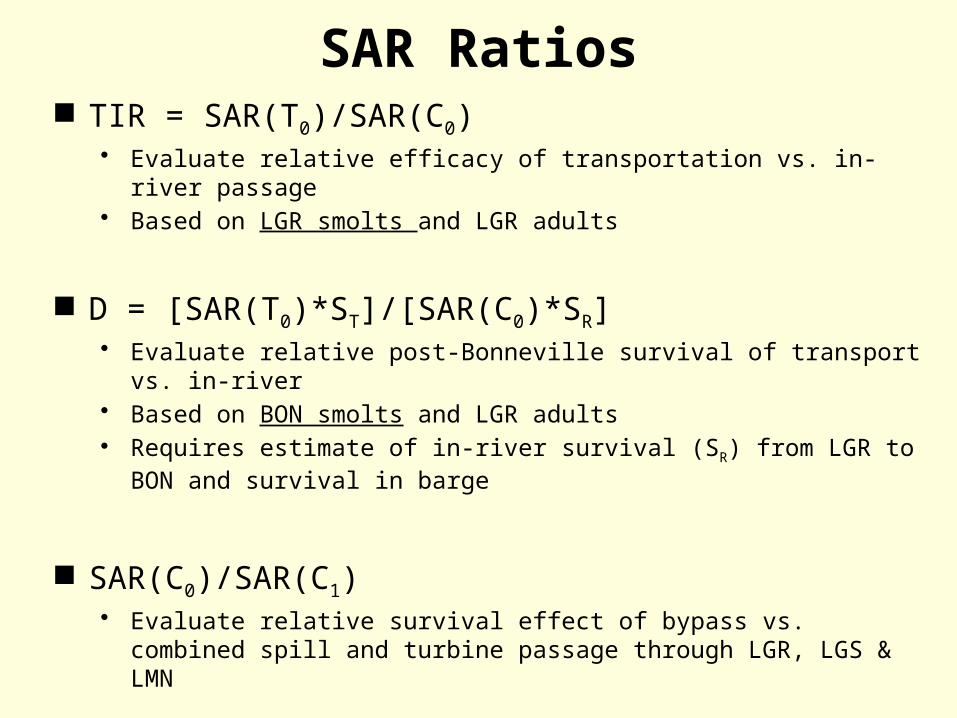
SAR Ratios TIR = SAR(T0)/SAR(C0)
• Evaluate relative efficacy of transportation vs. in-river passage• Based on LGR smolts and LGR adults
D = [SAR(T0)*ST]/[SAR(C0)*SR]• Evaluate relative post-Bonneville survival of transport vs. in-river• Based on BON smolts and LGR adults• Requires estimate of in-river survival (SR) from LGR to BON and
survival in barge
SAR(C0)/SAR(C1)• Evaluate relative survival effect of bypass vs. combined spill and
turbine passage through LGR, LGS & LMN
Bootstrapped 90% CI for all annual SAR ratios
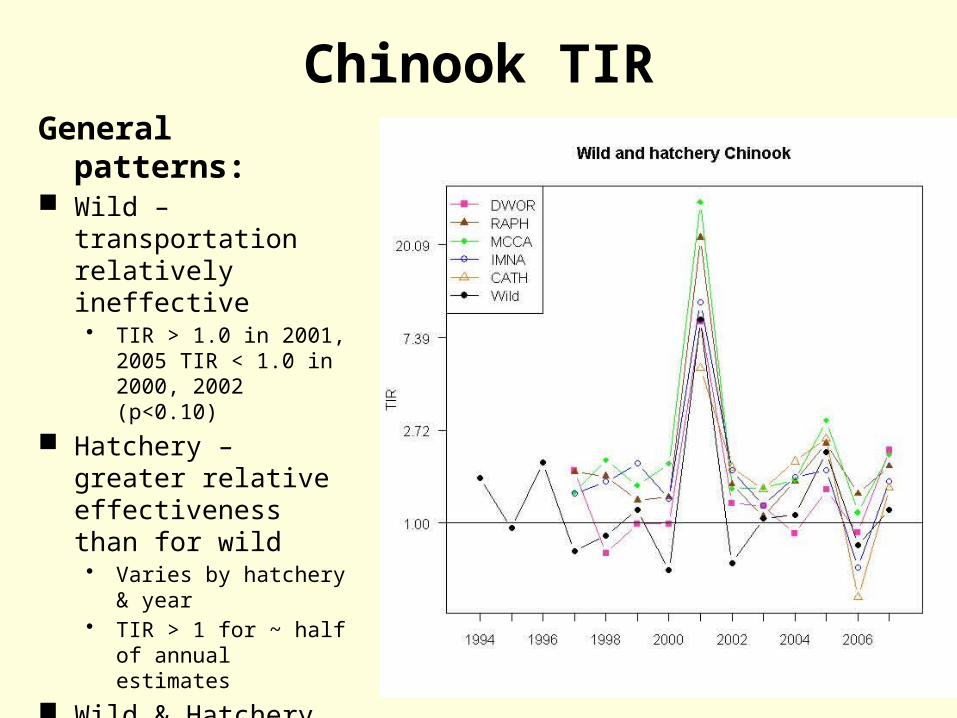
Chinook TIRGeneral
patterns: Wild –
transportation relatively ineffective• TIR > 1.0 in 2001,
2005 TIR < 1.0 in 2000, 2002 (p<0.10)
Hatchery – greater relative effectiveness than for wild• Varies by hatchery &
year• TIR > 1 for ~ half of
annual estimates
Wild & Hatchery TIR track closely across years

Steelhead TIRGeneral
patterns:
Wild – relative transport effectiveness• TIR > 1.0 in 6/10
years• TIR < 1.0 in 1998
(p<0.10)
Hatchery – relative transport effectiveness• TIR > 1 in 4/10 years
Wild & Hatchery TIR track closely across years

Chinook DGeneral
patterns:
Wild D ~ 0.54 (w/o 2001)• D < 1.0 in 7/14 years
D > 1 in zero of 14(p<0.10)
Hatchery D – greater than wild D• Varies by hatchery &
yearD < 1 in 11/51 annual estimatesD > 1 in 6/51 estimates (p<0.10)
Wild & Hatchery D track closely across years

Steelhead DGeneral
patterns:
Wild D ~ 1.0• D < 1 in 2/10 years
and D > 1 in 3/10 years (p<0.10)
Hatchery D – similar wild D• D < 1 in 3/10 years
and D > 1 in 1/10 years (p<0.10)
Wild & Hatchery D estimates differ somewhat between years

Ratio SAR(C0)/SAR(C1)
General patterns:
SAR(C0) > SAR(C1)
Negative bypass effect on SARs for Wild & Hatchery Chinook & Steelhead

Why difference in relative transportation effects between
Chinook and steelhead? Is TIR related to in-
river conditions and smolt survival?• Wild Chinook annual
SR ~ 50% (range 23% - 61%), 1997-2006
• Wild steelhead annual SR ~ 37% (range 4% - 58%), 1997-2006
Regression analysis: association of TIR and SR for wild Chinook & steelhead
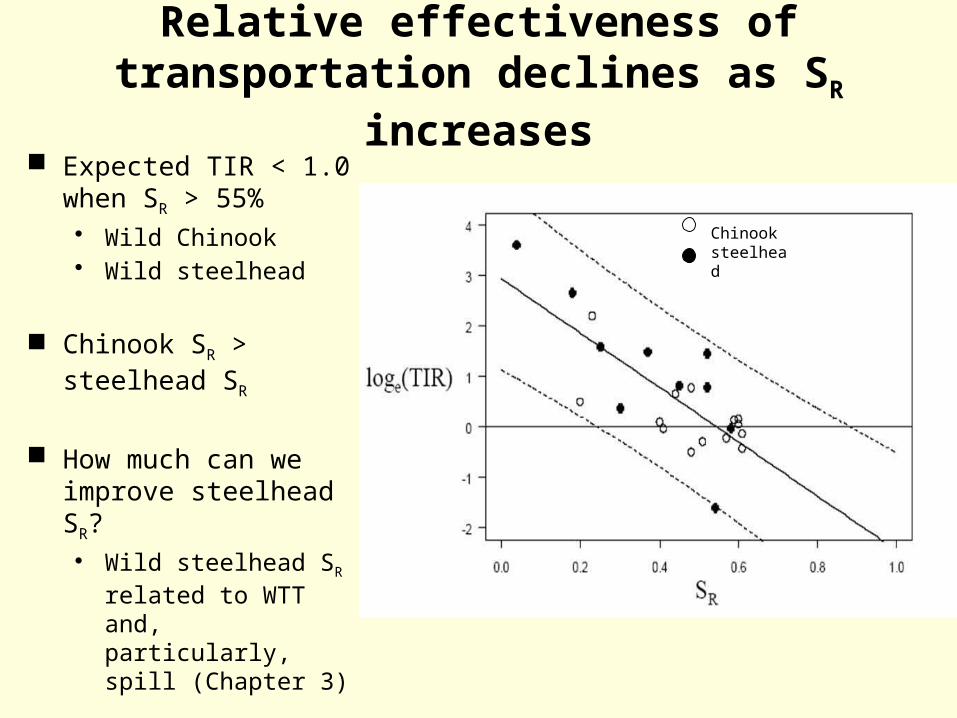
Relative effectiveness of transportation declines as SR
increases Expected TIR < 1.0
when SR > 55% • Wild Chinook• Wild steelhead
Chinook SR > steelhead SR
How much can we improve steelhead SR?• Wild steelhead SR
related to WTT and, particularly, spill (Chapter 3)
Chinook Steelhead
Chinooksteelhead

Chapter 4 Summary Annual SARs << NPCC 2-6% SAR goal
• Snake River wild Chinook & steelhead • T0, C0 and C1 and combined
Significant negative bypass effect on SARs• SAR(C0) > SAR(C1), Wild & Hatchery, Chinook & Steelhead
TIRs of both wild Chinook and steelhead variable across years and associated with in-river survival
Relative effectiveness of transportation declines as in-river survival (SR) increases• TIR steelhead > TIR Chinook• SR Chinook > SR steelhead
• SR is function of in-river conditions (WTT and spill)
• How much can we improve SR?

Questions?


![Tir y Gafel Annual Monitoring Report 2011 for web[1]lammas.org.uk/wp-content/uploads/2013/04/Tir-y-Gafel... · Page 3 of 12 11..1. Framework for this report This is the second annual](https://static.fdocuments.us/doc/165x107/5fb31f63b7a489679515f46c/tir-y-gafel-annual-monitoring-report-2011-for-web1-page-3-of-12-111-framework.jpg)


