Annual Rheumatology & Therapeutics Review for...
95
Annual Rheumatology & Therapeutics Review for Organizations & Societies
Transcript of Annual Rheumatology & Therapeutics Review for...

Annual Rheumatology &
Therapeutics Review for
Organizations & Societies
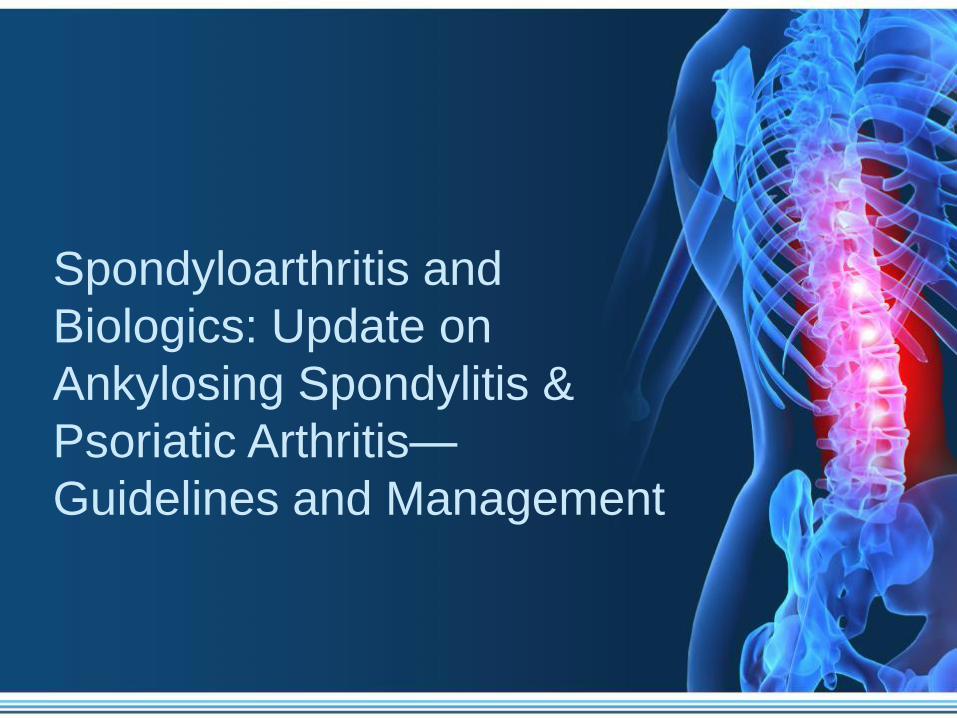
Spondyloarthritis and
Biologics: Update on
Ankylosing Spondylitis &
Psoriatic Arthritis—
Guidelines and Management
Spondyloarthritis
• A family of related diseases that cause inflammation in spine, peripheral joints, and tendon/ligament insertion sites (enthesium)
• Spondyloarthritis includes:
– Psoriatic arthritis
– Ankylosing spondylitis
– Undifferentiated spondyloarthritis
• (axial spondyloarthritis, peripheral spondyloarthritis)
– Reactive arthritis
– Inflammatory bowel disease associated arthritis
Differences Between Psoriatic Arthritis (PsA)
and Rheumatoid Arthritis (RA)
• PsA is an inflammatory joint disease with marked
phenotypic diversity
– Musculoskeletal features
– Cutaneous
– Gastrointestinal
– Ocular manifestations
• Comorbidities
– Obesity
– Type 2 diabetes
– Hypertension
– Cardiovascular disease
– Mortality
Important Characteristics of PsA
• Psoriasis precedes inflammatory joint disease in 70 to
85 % of patients
• Equally common in men and women
• Reported prevalence of inflammatory joint manifestations
among patients with psoriatic skin lesions varies widely
– 6.25% (2000 US study) to 48% (2002 Swedish study)
– Estimated at 20-30%
• Worldwide prevalence of PsA .03 to 1 %
• Familial and genetic considerations

Synovio-entheseal complex (SEC) Concept
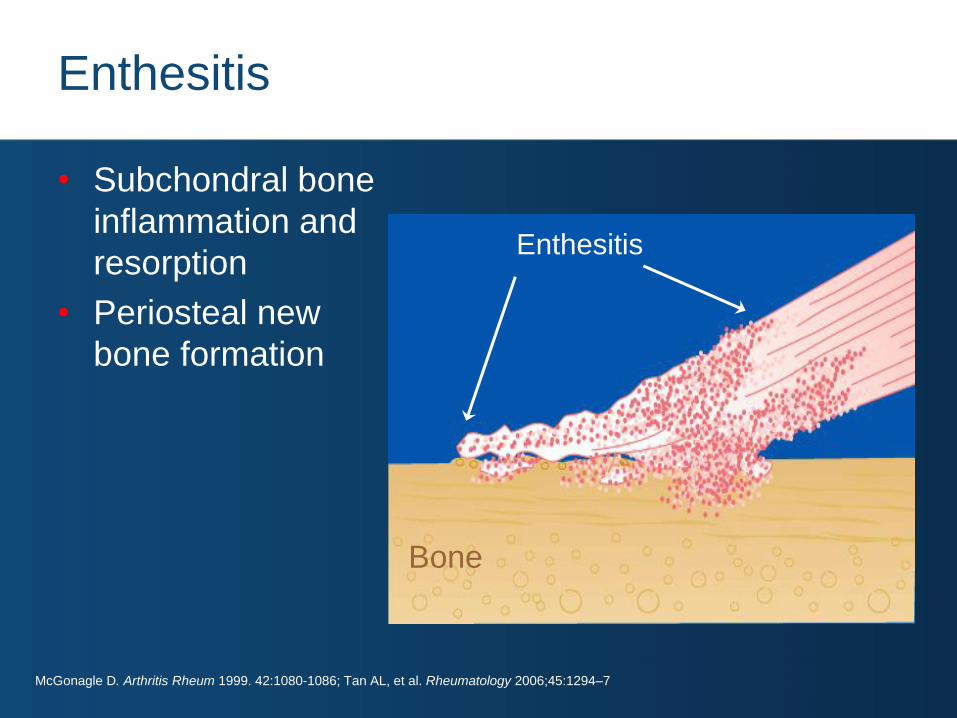
• Subchondral bone
inflammation and
resorption
• Periosteal new
bone formation
Bone
Enthesitis
Enthesitis
McGonagle D. Arthritis Rheum 1999. 42:1080-1086; Tan AL, et al. Rheumatology 2006;45:1294–7
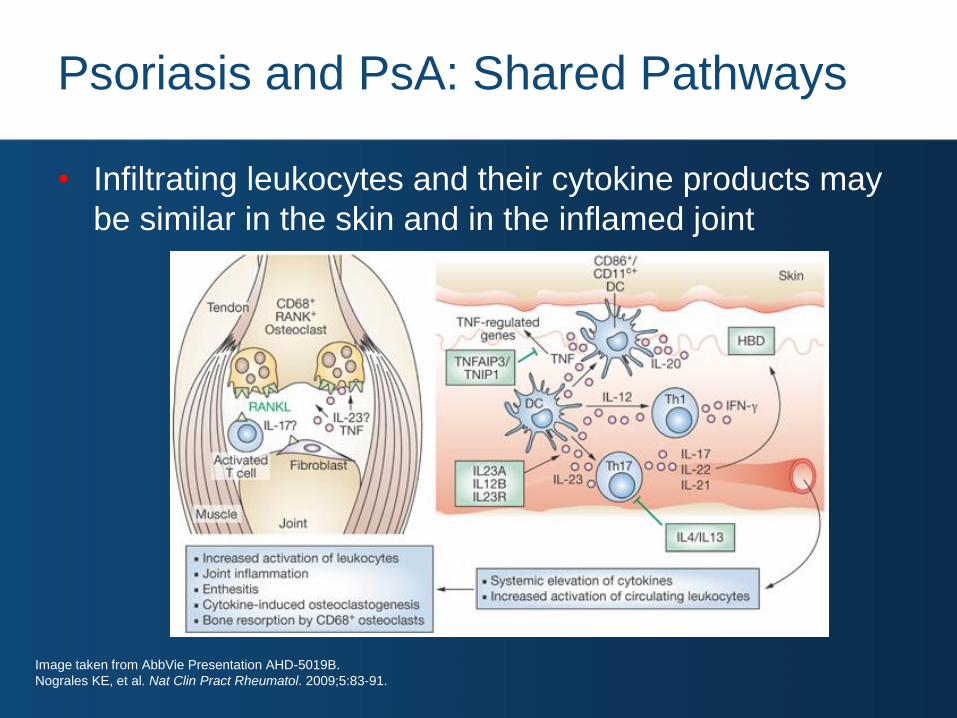
Psoriasis and PsA: Shared Pathways
• Infiltrating leukocytes and their cytokine products may
be similar in the skin and in the inflamed joint
Image taken from AbbVie Presentation AHD-5019B.
Nograles KE, et al. Nat Clin Pract Rheumatol. 2009;5:83-91.
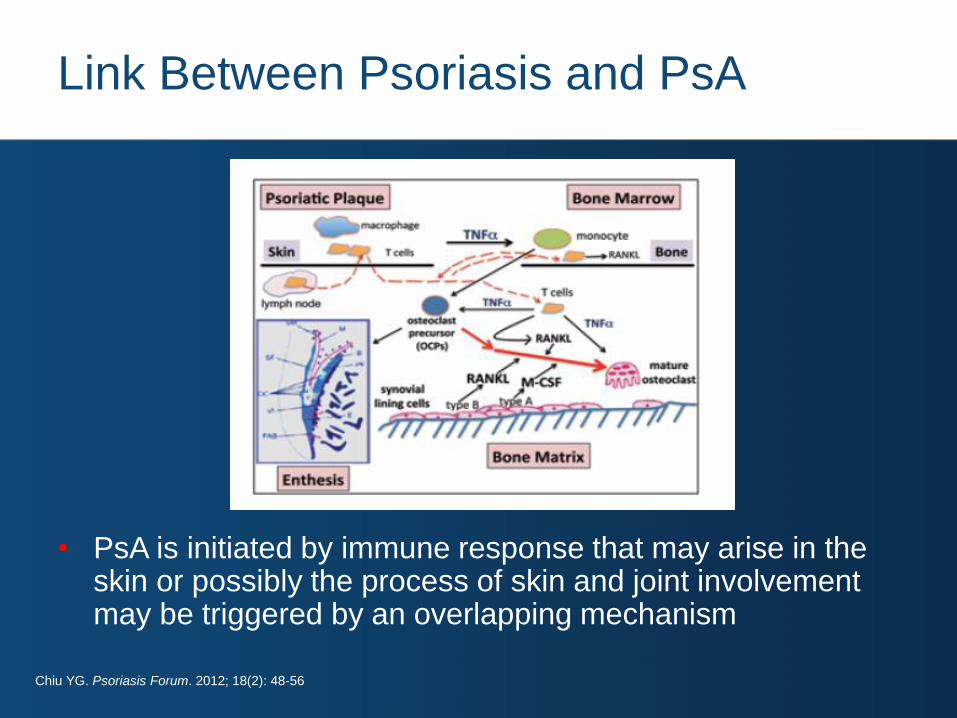
Link Between Psoriasis and PsA
• PsA is initiated by immune response that may arise in the skin or possibly the process of skin and joint involvement may be triggered by an overlapping mechanism
Chiu YG. Psoriasis Forum. 2012; 18(2): 48-56
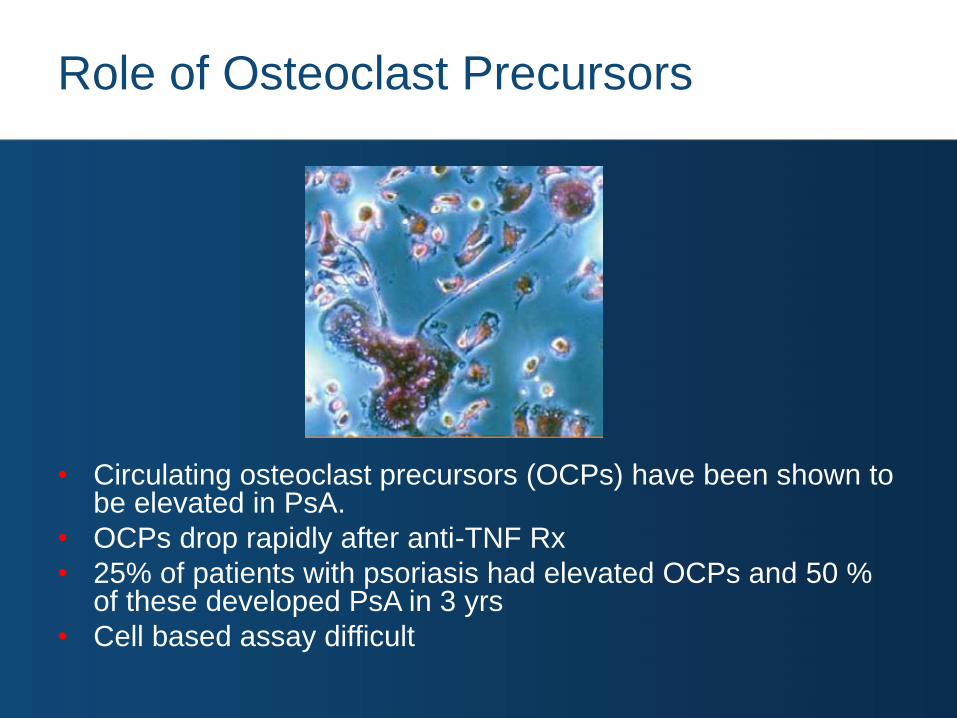
Role of Osteoclast Precursors
• Circulating osteoclast precursors (OCPs) have been shown to be elevated in PsA.
• OCPs drop rapidly after anti-TNF Rx
• 25% of patients with psoriasis had elevated OCPs and 50 % of these developed PsA in 3 yrs
• Cell based assay difficult
The New Axial and Peripheral
Spondyloarthropathy Criteria

In patients with ≥3 months back pain
and age at onset <45 years
Sacroiliitis on imaging* plus ≥1 SpA feature†
HLA-B27 plus
≥2 other SpA features OR
van der Heijde D et al. ACR 2009, Philadelphia #1790; Rudwaleit M, et al.
Ann Rheum Dis 2009; 68:770; Rudwaleit M, et al. Ann Rheum Dis 2009; 68:777.
ASAS Classification Criteria for Axial Spondyloarthritis
(SpA) and Update of TNFi Treatment Recommendations
• *Sacroiliitis on imaging – Active (acute) inflammation on
MRI highly suggestive of sacroiliitis associated with SpA or definite radiographic sacroiliitis, according to mod NY criteria
• †SpA features – Inflammatory back pain
– Arthritis
– Enthesitis (heel)
– Uveitis
– Dactylitis
– Psoriasis
– Crohn‘s/colitis
– Good response to NSAIDs
– Family history for SpA
– HLA-B27
– Elevated CRP
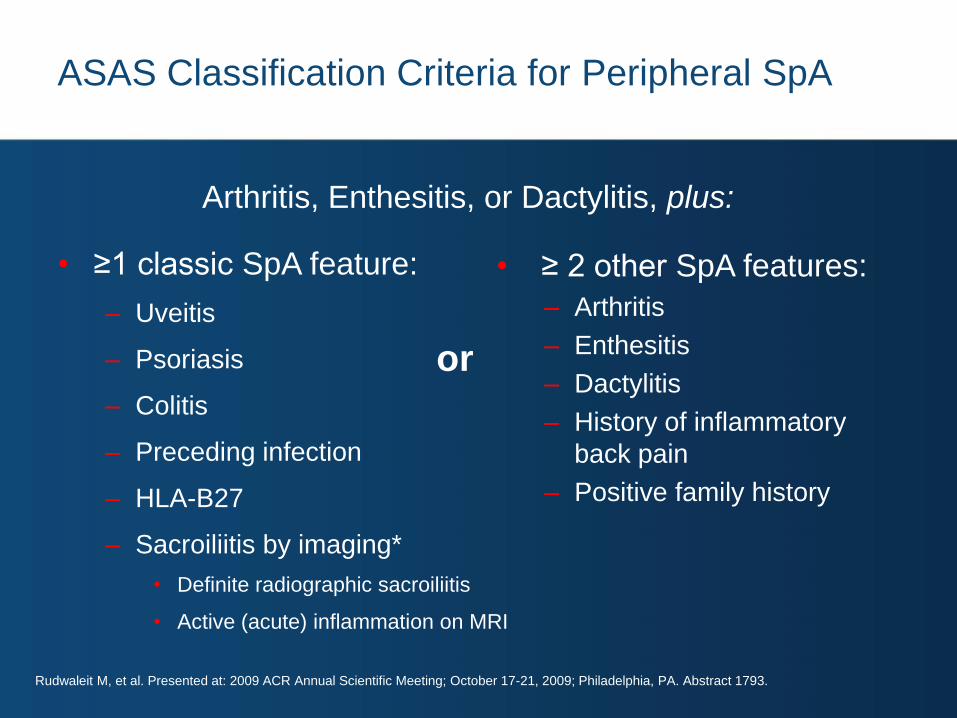
ASAS Classification Criteria for Peripheral SpA
• ≥1 classic SpA feature:
– Uveitis
– Psoriasis
– Colitis
– Preceding infection
– HLA-B27
– Sacroiliitis by imaging*
• Definite radiographic sacroiliitis
• Active (acute) inflammation on MRI
• ≥ 2 other SpA features:
– Arthritis
– Enthesitis
– Dactylitis
– History of inflammatory
back pain
– Positive family history
or
Arthritis, Enthesitis, or Dactylitis, plus:
Rudwaleit M, et al. Presented at: 2009 ACR Annual Scientific Meeting; October 17-21, 2009; Philadelphia, PA. Abstract 1793.

Psoriatic Arthritis
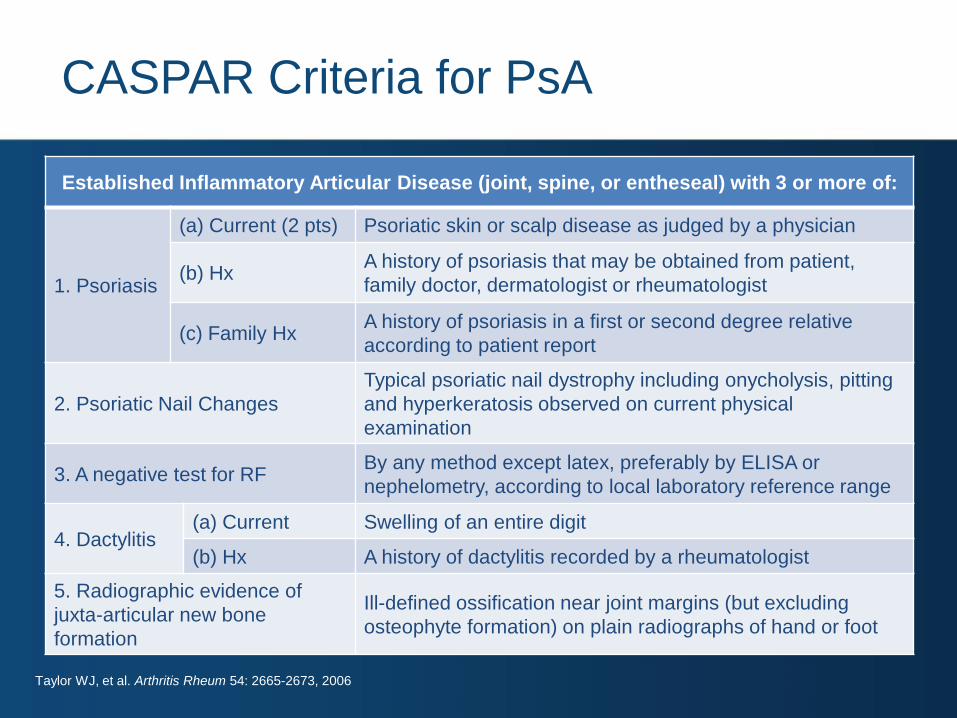
CASPAR Criteria for PsA
Established Inflammatory Articular Disease (joint, spine, or entheseal) with 3 or more of:
1. Psoriasis
(a) Current (2 pts) Psoriatic skin or scalp disease as judged by a physician
(b) Hx A history of psoriasis that may be obtained from patient,
family doctor, dermatologist or rheumatologist
(c) Family Hx A history of psoriasis in a first or second degree relative
according to patient report
2. Psoriatic Nail Changes
Typical psoriatic nail dystrophy including onycholysis, pitting
and hyperkeratosis observed on current physical
examination
3. A negative test for RF By any method except latex, preferably by ELISA or
nephelometry, according to local laboratory reference range
4. Dactylitis (a) Current Swelling of an entire digit
(b) Hx A history of dactylitis recorded by a rheumatologist
5. Radiographic evidence of
juxta-articular new bone
formation
Ill-defined ossification near joint margins (but excluding
osteophyte formation) on plain radiographs of hand or foot
Taylor WJ, et al. Arthritis Rheum 54: 2665-2673, 2006
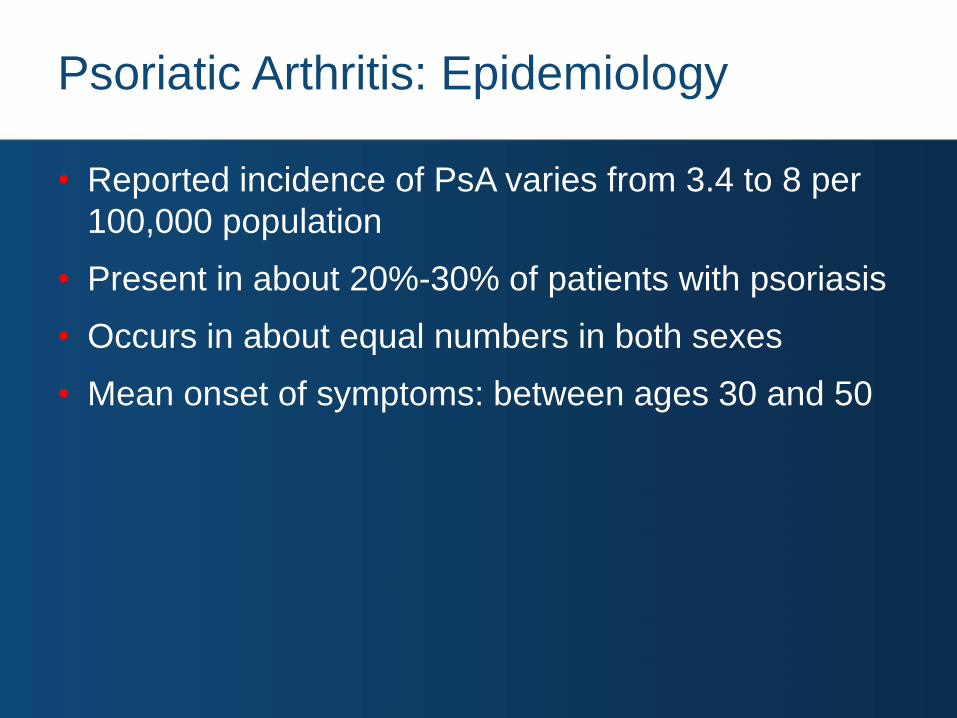
Psoriatic Arthritis: Epidemiology
• Reported incidence of PsA varies from 3.4 to 8 per
100,000 population
• Present in about 20%-30% of patients with psoriasis
• Occurs in about equal numbers in both sexes
• Mean onset of symptoms: between ages 30 and 50
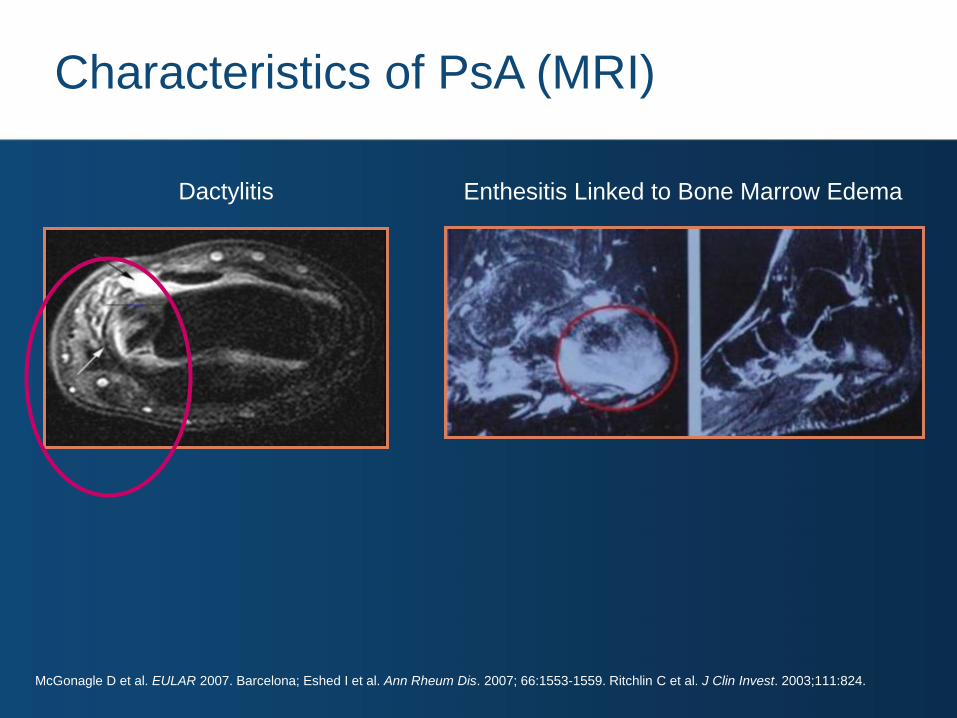
Characteristics of PsA (MRI)
Dactylitis Enthesitis Linked to Bone Marrow Edema
McGonagle D et al. EULAR 2007. Barcelona; Eshed I et al. Ann Rheum Dis. 2007; 66:1553-1559. Ritchlin C et al. J Clin Invest. 2003;111:824.
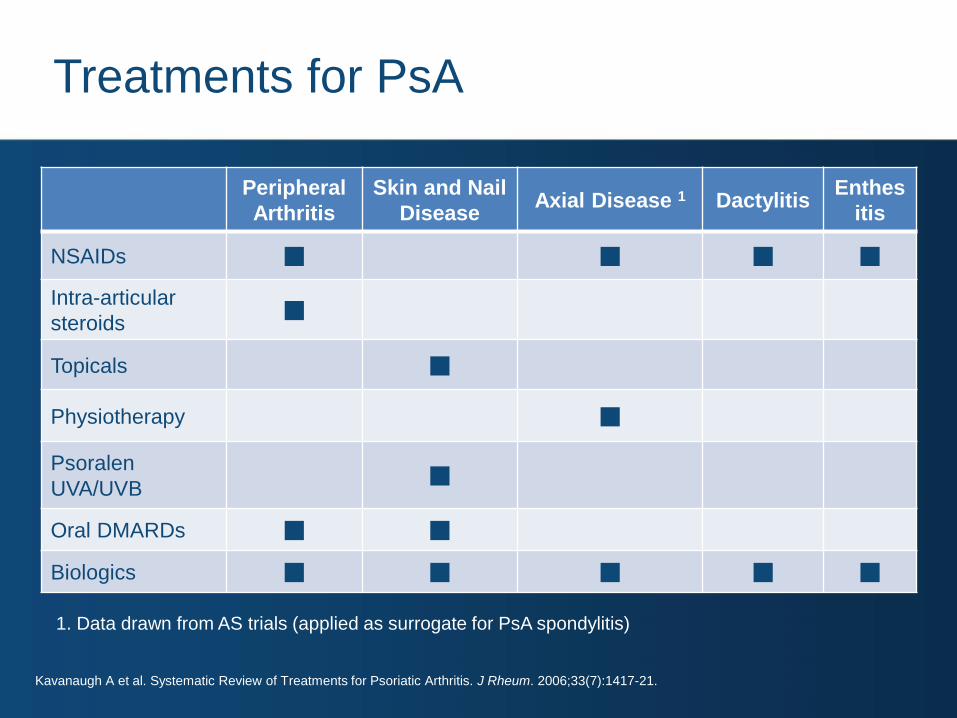
Treatments for PsA
1. Data drawn from AS trials (applied as surrogate for PsA spondylitis)
Kavanaugh A et al. Systematic Review of Treatments for Psoriatic Arthritis. J Rheum. 2006;33(7):1417-21.
Peripheral
Arthritis
Skin and Nail
Disease Axial Disease 1 Dactylitis
Enthes
itis
NSAIDs ■ ■ ■ ■
Intra-articular
steroids ■
Topicals ■
Physiotherapy ■
Psoralen
UVA/UVB ■
Oral DMARDs ■ ■
Biologics ■ ■ ■ ■ ■
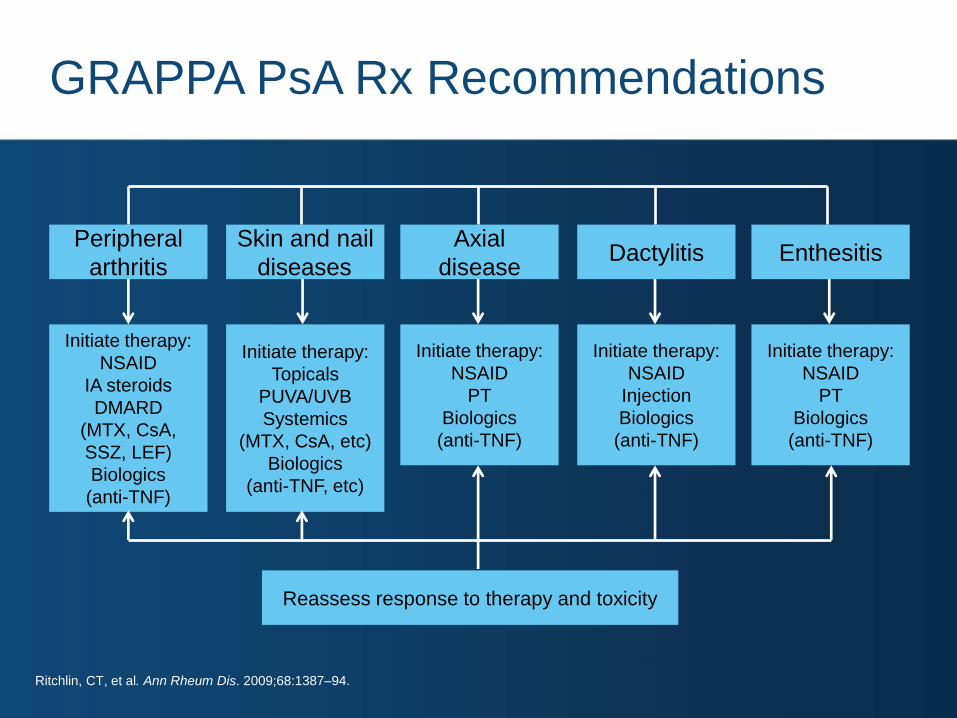
GRAPPA PsA Rx Recommendations
Ritchlin, CT, et al. Ann Rheum Dis. 2009;68:1387–94.
Peripheral
arthritis
Skin and nail
diseases
Axial
disease Dactylitis Enthesitis
Initiate therapy:
NSAID
IA steroids
DMARD
(MTX, CsA,
SSZ, LEF)
Biologics
(anti-TNF)
Initiate therapy:
Topicals
PUVA/UVB
Systemics
(MTX, CsA, etc)
Biologics
(anti-TNF, etc)
Initiate therapy:
NSAID
PT
Biologics
(anti-TNF)
Initiate therapy:
NSAID
Injection
Biologics
(anti-TNF)
Initiate therapy:
NSAID
PT
Biologics
(anti-TNF)
Reassess response to therapy and toxicity
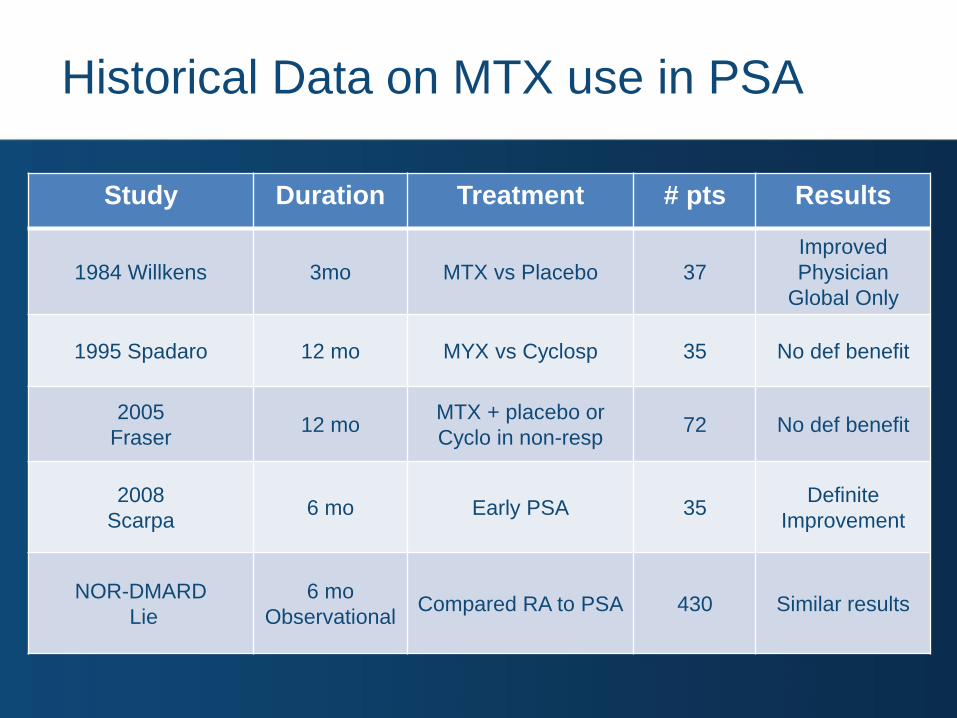
Historical Data on MTX use in PSA
Study Duration Treatment # pts Results
1984 Willkens 3mo MTX vs Placebo 37
Improved
Physician
Global Only
1995 Spadaro 12 mo MYX vs Cyclosp 35 No def benefit
2005
Fraser 12 mo
MTX + placebo or
Cyclo in non-resp 72 No def benefit
2008
Scarpa 6 mo Early PSA 35
Definite
Improvement
NOR-DMARD
Lie
6 mo
Observational Compared RA to PSA 430 Similar results
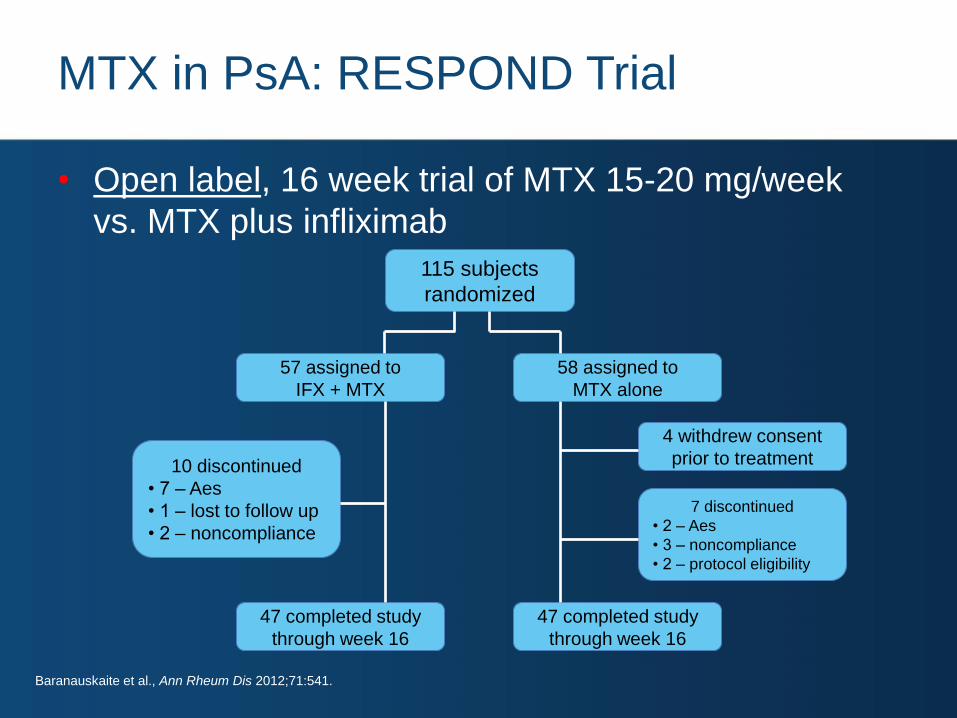
MTX in PsA: RESPOND Trial
• Open label, 16 week trial of MTX 15-20 mg/week
vs. MTX plus infliximab
Baranauskaite et al., Ann Rheum Dis 2012;71:541.
115 subjects
randomized
57 assigned to
IFX + MTX
58 assigned to
MTX alone
47 completed study
through week 16
47 completed study
through week 16
4 withdrew consent
prior to treatment 10 discontinued
• 7 – Aes
• 1 – lost to follow up
• 2 – noncompliance
7 discontinued
• 2 – Aes
• 3 – noncompliance
• 2 – protocol eligibility
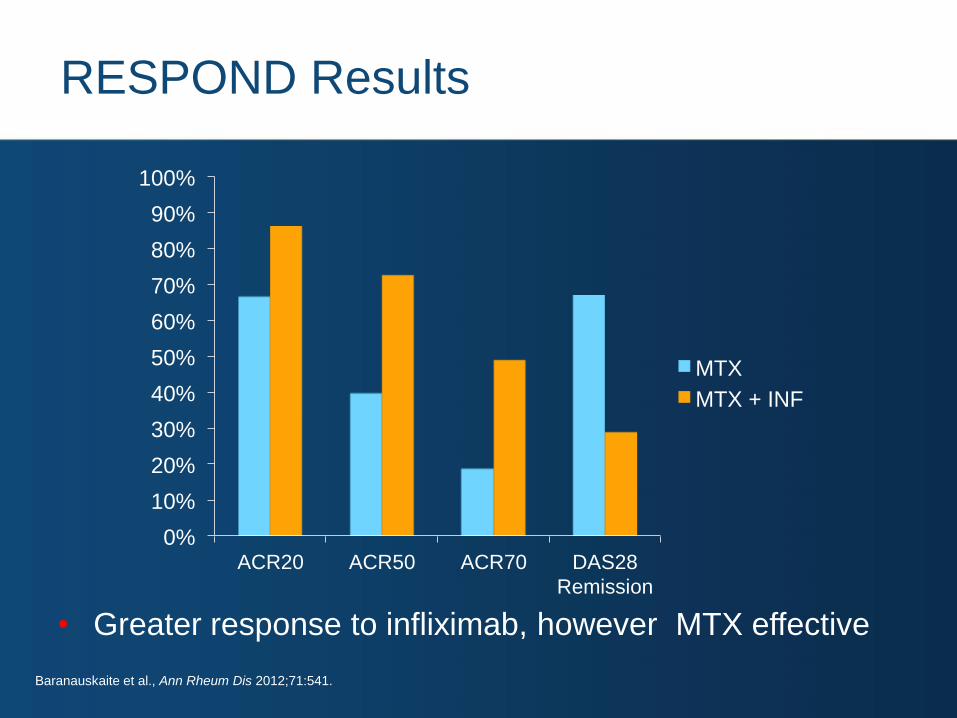
RESPOND Results
Baranauskaite et al., Ann Rheum Dis 2012;71:541.
• Greater response to infliximab, however MTX effective
0%
10%
20%
30%
40%
50%
60%
70%
80%
90%
100%
ACR20 ACR50 ACR70 DAS28
Remission
MTX
MTX + INF
Response at Week 16
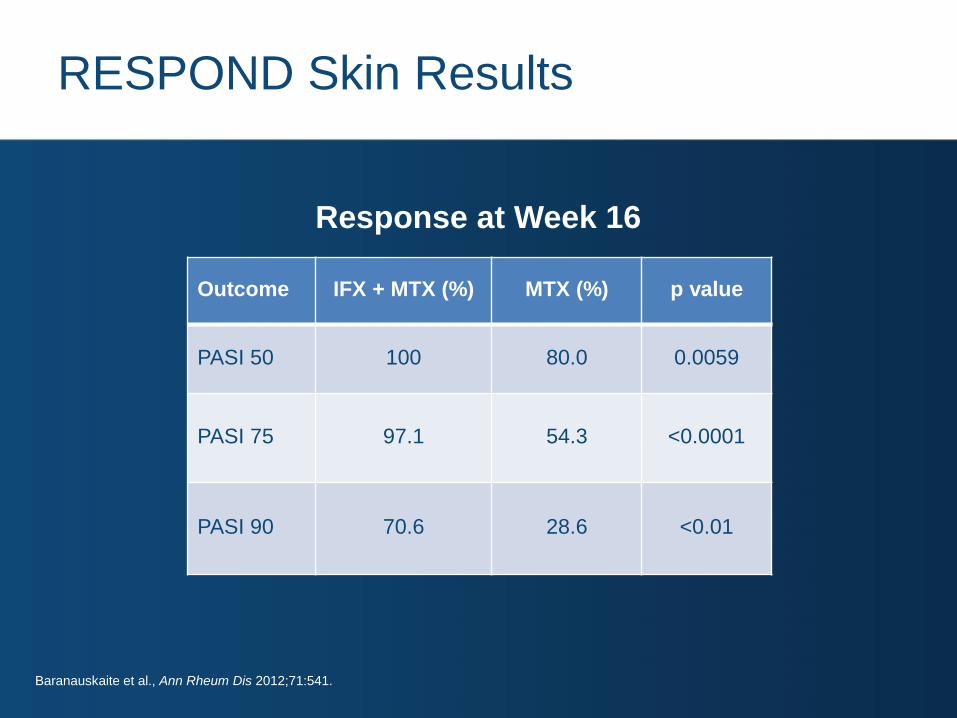
RESPOND Skin Results
Baranauskaite et al., Ann Rheum Dis 2012;71:541.
Outcome IFX + MTX (%) MTX (%) p value
PASI 50 100 80.0 0.0059
PASI 75 97.1 54.3 <0.0001
PASI 90 70.6 28.6 <0.01

MTX in Psoriatic Arthritis (MIPA) Trial
• Inclusion
– Synovitis in ≥ 1 joint
– Psoriasis skin/nails
• Exclusion
– Other arthropathies
– Recent steroids/DMARDS
– Contra-indications to MTX
• Intervention
– Methotrexate
(target 15mg/wk)
– Matching placebo
• Primary outcome
– Psoriatic Arthritis Response
Criteria
• Secondary outcomes
– Patient Global Assessments
– Assessor Global Assessments
– HAQ & Pain
– Tender & Swollen Joint
Counts
– ESR & CRP
– Composite Measures (ACR20)
Kingsley et al., Rheumatology 2012;51:1368.
Hypothesis: Methotrexate improves disease activity and function in
psoriatic arthritis
Design: 6-month RCT comparing methotrexate with placebo

MIPA Flowchart
Screened
462
Randomized
221
Not Entered
241
Ineligible: 148
- Previous methotrexate: 69
- Inactive arthritis: 47
- Concomitant disease: 21
- Diagnostic uncertainty: 11
Non-consent: 93
Allocated to Active
109
Allocated to Placebo
112
Follow Up
Lost to followed up (23)
- Adverse Events: 4
- Worse disease: 7
- Patient choice: 12
Discontinued Intervention (12)
- Adverse Events: 3
- Worse disease: 7
- Patient choice: 2
Follow Up
Lost to followed up (21)
- Adverse Events: 5
- Worse disease: 3
- Patient choice: 13
Discontinued Intervention (14)
- Adverse Events: 4
- Worse disease: 7
- Patient choice: 3
Analysed
Intention to Treat: 109 (100%)
Valid Complaint Completer: 67 (61%)
Excluded from analysis: (7)
Analysed
Intention to Treat: 112 (100%)
Valid Complaint Completer: 61 (54%)
Excluded from analysis: (16) Kingsley et al., Rheumatology 2012;51:1368.
Initial
NS
NS
NS
NS
3 months 6 months
Initial 3 months 6 months
Methotrexate Placebo
Initial 3 months 6 months
Initial 3 months 6 months
Swollen Joint Count
ESR HAQ
Tender Joint Count12
10
8
6
4
2
17
151311
9
75
1.5
1.3
1.1
0.9
0.7
0.5
25
20
15
10
MIPA Results
• Joint Counts, ESR and HAQ
Kingsley et al., Rheumatology 2012;51:1368.
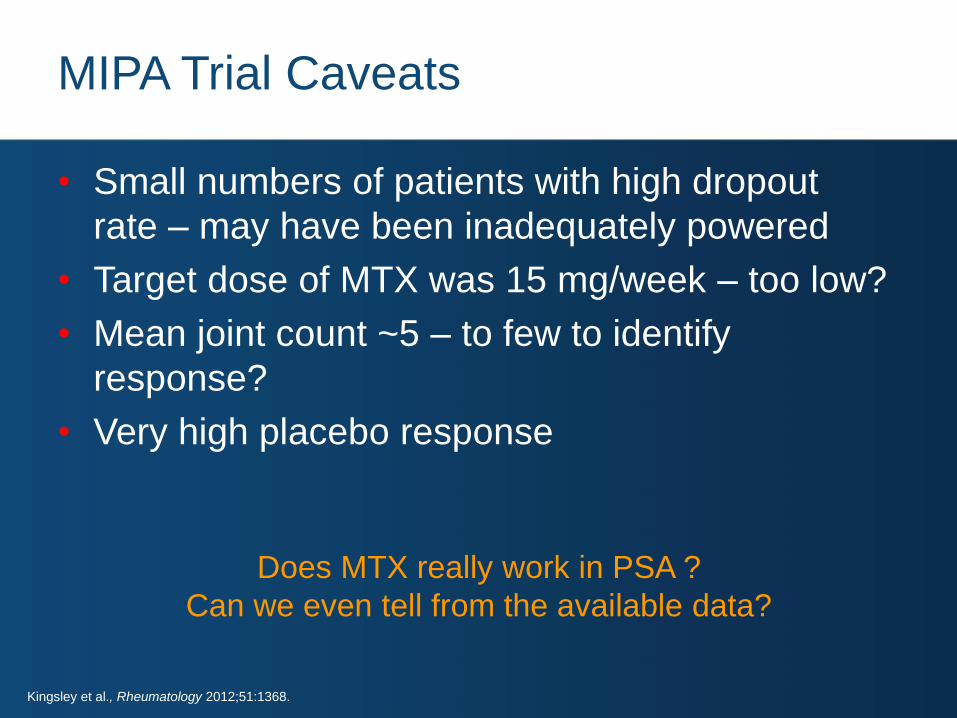
MIPA Trial Caveats
• Small numbers of patients with high dropout
rate – may have been inadequately powered
• Target dose of MTX was 15 mg/week – too low?
• Mean joint count ~5 – to few to identify
response?
• Very high placebo response
Does MTX really work in PSA ?
Can we even tell from the available data?
Kingsley et al., Rheumatology 2012;51:1368.
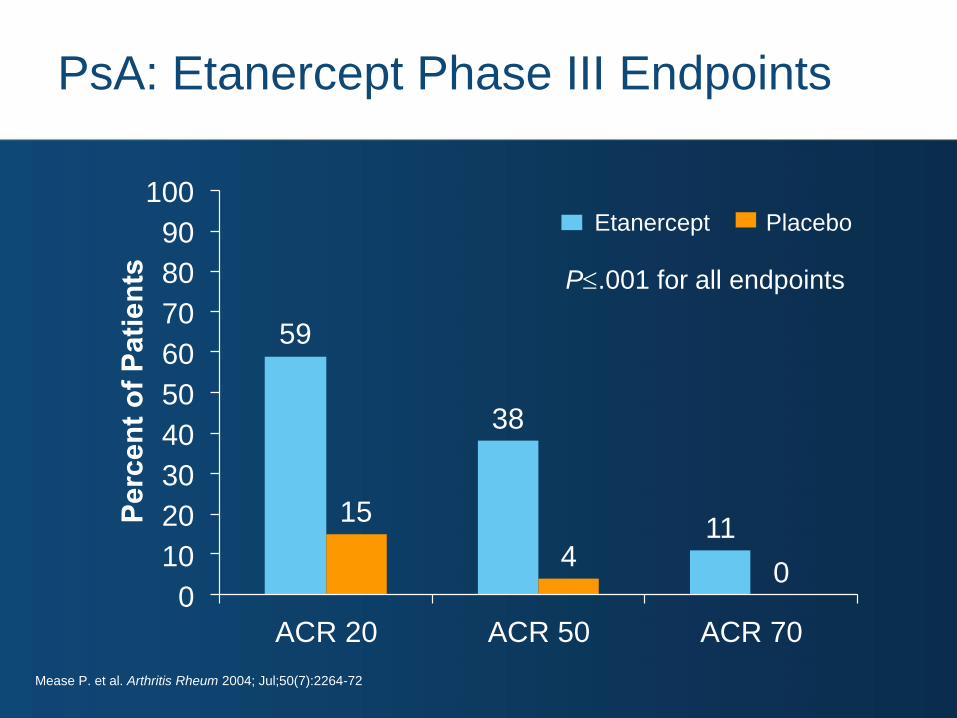
59
38
11 15
4 0
0
10
20
30
40
50
60
70
80
90
100
ACR 20 ACR 50 ACR 70
Perc
en
t o
f P
ati
en
ts
P.001 for all endpoints
Etanercept Placebo
PsA: Etanercept Phase III Endpoints
Mease P. et al. Arthritis Rheum 2004; Jul;50(7):2264-72

With MTX Without MTX
*P.001
19 13
62 58
0
10
20
30
40
50
60
70
80
90
100
Pe
rce
nt
of
Pa
tie
nts
* *
Placebo Etanercept
PsA: Etanercept Phase III +/- MTX
Mease P. et al. Arthritis Rheum 2004; Jul;50(7):2264-72
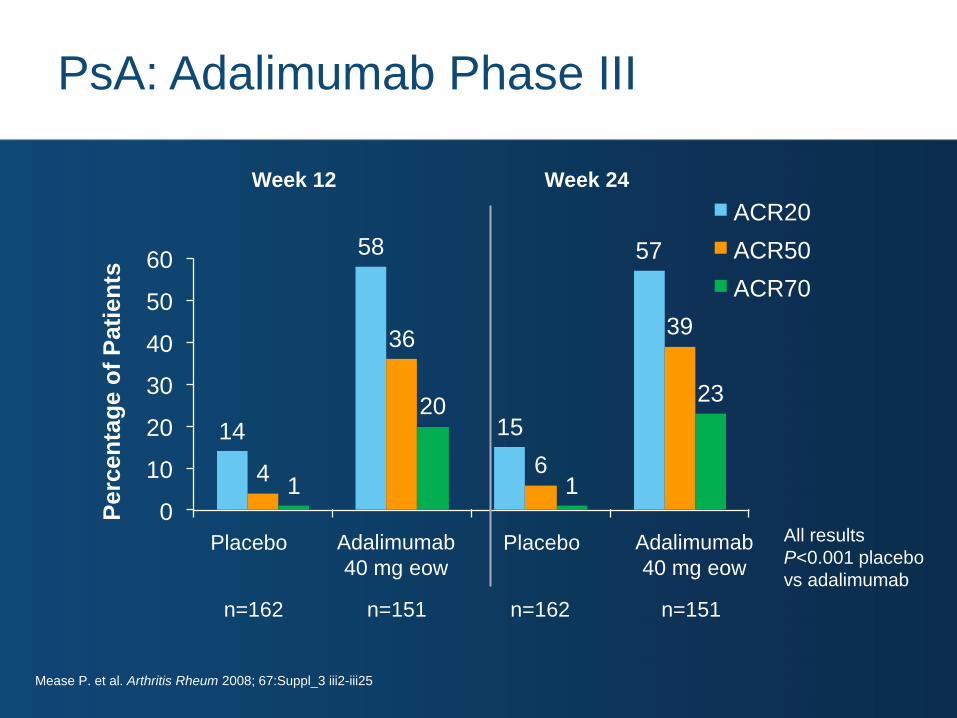
PsA: Adalimumab Phase III
14
58
15
57
4
36
6
39
1
20
1
23
0
10
20
30
40
50
60
ACR20
ACR50
ACR70
All results
P<0.001 placebo
vs adalimumab
Perc
en
tag
e o
f P
ati
en
ts
Week 12 Week 24
n=162 n=162 n=151 n=151
Placebo Adalimumab
40 mg eow
Placebo Adalimumab
40 mg eow
Mease P. et al. Arthritis Rheum 2008; 67:Suppl_3 iii2-iii25
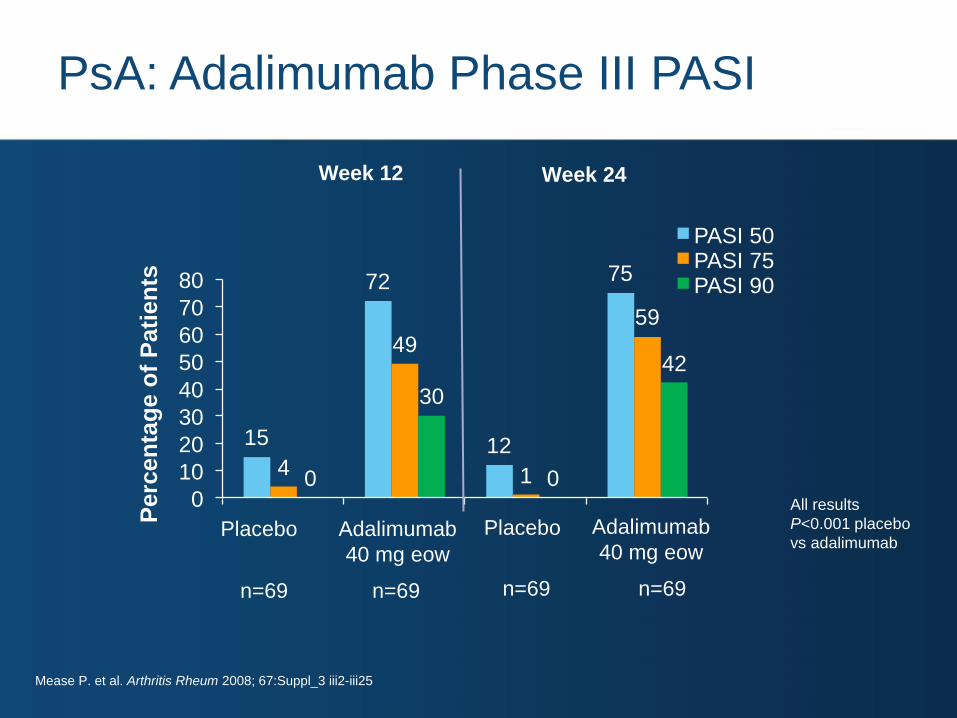
PsA: Adalimumab Phase III PASI
15
72
12
75
4
49
1
59
0
30
0
42
0
10
20
30
40
50
60
70
80
PASI 50 PASI 75 PASI 90
Perc
en
tag
e o
f P
ati
en
ts
Week 12 Week 24
n=69 n=69 n=69 n=69
All results
P<0.001 placebo
vs adalimumab Placebo Adalimumab
40 mg eow
Placebo Adalimumab
40 mg eow
Mease P. et al. Arthritis Rheum 2008; 67:Suppl_3 iii2-iii25
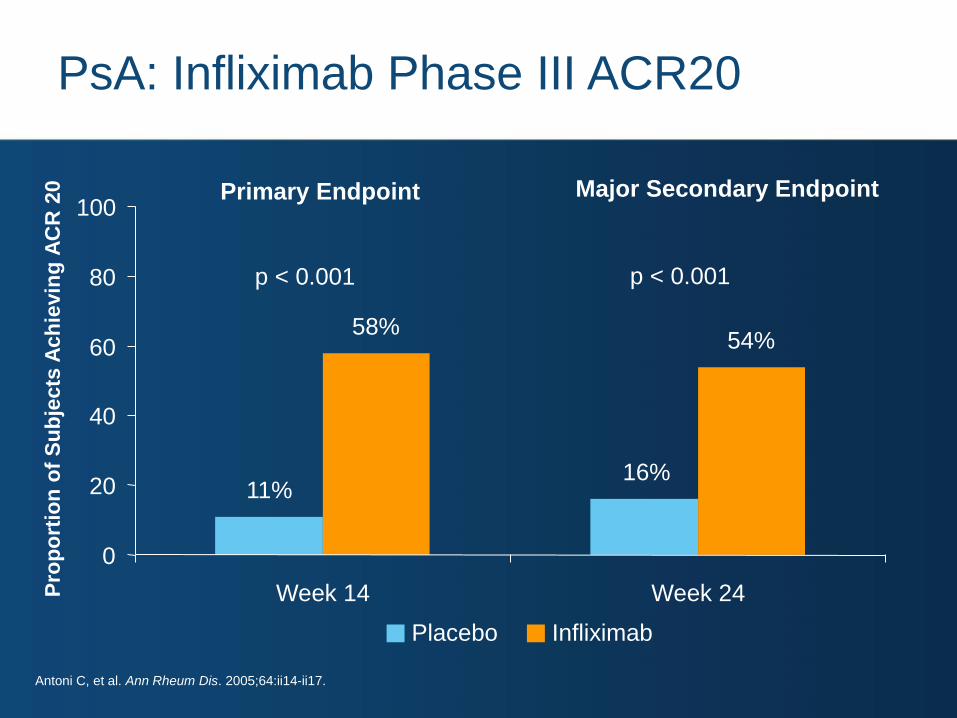
16% 11%
54% 58%
0
20
40
60
80
100
Week 14 Week 24 Pro
po
rtio
n o
f S
ub
jects
Ach
ievin
g A
CR
20
p < 0.001 p < 0.001
Primary Endpoint Major Secondary Endpoint
PsA: Infliximab Phase III ACR20
Placebo Infliximab
Antoni C, et al. Ann Rheum Dis. 2005;64:ii14-ii17.
Pe
rce
nt A
CR
20
Re
sp
on
de
rs
100
75
50
25
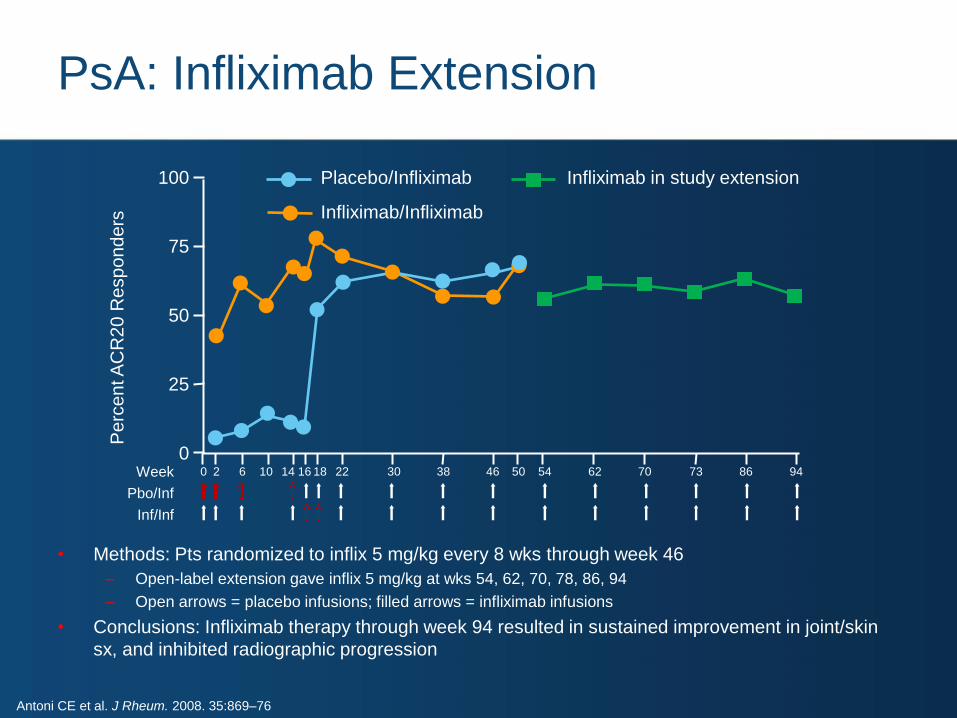
0 Week
Pbo/Inf
Inf/Inf
94 86 73 70 62 54 50 46 38 30 22 18 16 14 10 6 2 0
Placebo/Infliximab Infliximab in study extension
Infliximab/Infliximab
PsA: Infliximab Extension
• Methods: Pts randomized to inflix 5 mg/kg every 8 wks through week 46
– Open-label extension gave inflix 5 mg/kg at wks 54, 62, 70, 78, 86, 94
– Open arrows = placebo infusions; filled arrows = infliximab infusions
• Conclusions: Infliximab therapy through week 94 resulted in sustained improvement in joint/skin
sx, and inhibited radiographic progression
Antoni CE et al. J Rheum. 2008. 35:869–76
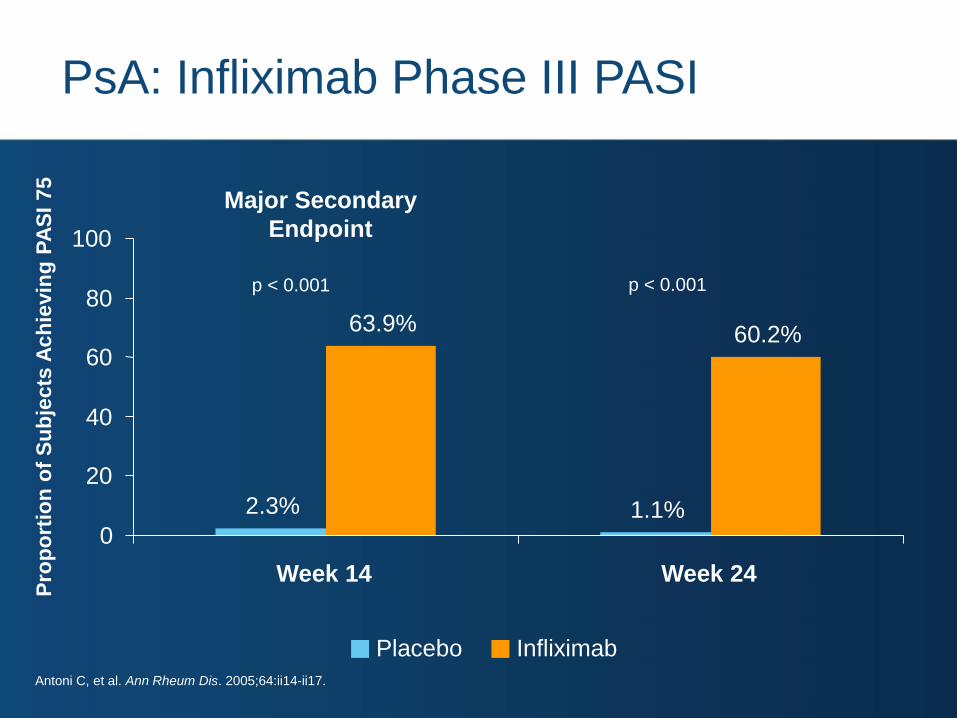
2.3% 1.1%
63.9% 60.2%
0
20
40
60
80
100
Week 14 Week 24
Pro
po
rtio
n o
f S
ub
jects
Ach
ievin
g P
AS
I 75
p < 0.001 p < 0.001
Major Secondary
Endpoint
Placebo Infliximab
PsA: Infliximab Phase III PASI
Antoni C, et al. Ann Rheum Dis. 2005;64:ii14-ii17.

37.2% 33.7% 35.0%
20.4% 22.2%
42.0%
0
20
40
60
80
100
Baseline Week 14 Week 24
Pro
po
rtio
n o
f S
ub
jects
wit
h E
nth
eso
path
y
p = 0.016 p = 0.002
Placebo Infliximab
PsA: Infliximab Phase III Enthesitis
Antoni C, et al. Ann Rheum Dis. 2005;64:ii14-ii17.
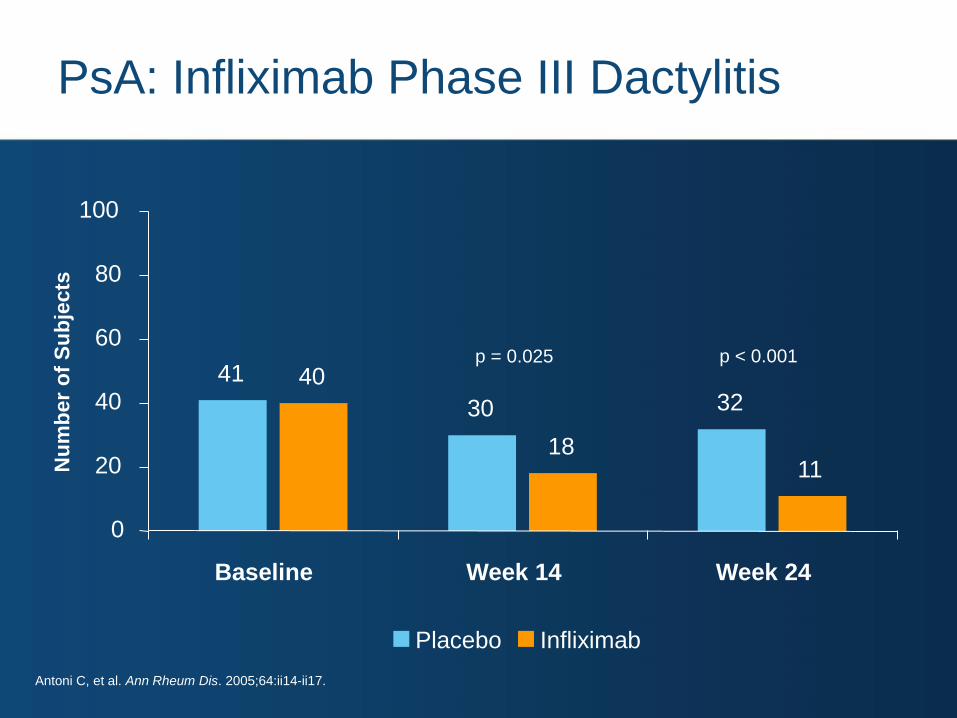
32 30
41
11 18
40
0
20
40
60
80
100
Baseline Week 14 Week 24
Placebo Infliximab
Nu
mb
er
of
Su
bje
cts
p = 0.025 p < 0.001
PsA: Infliximab Phase III Dactylitis
Antoni C, et al. Ann Rheum Dis. 2005;64:ii14-ii17.
4
51 32
66
0102030405060708090
100
Week 24 Week 104
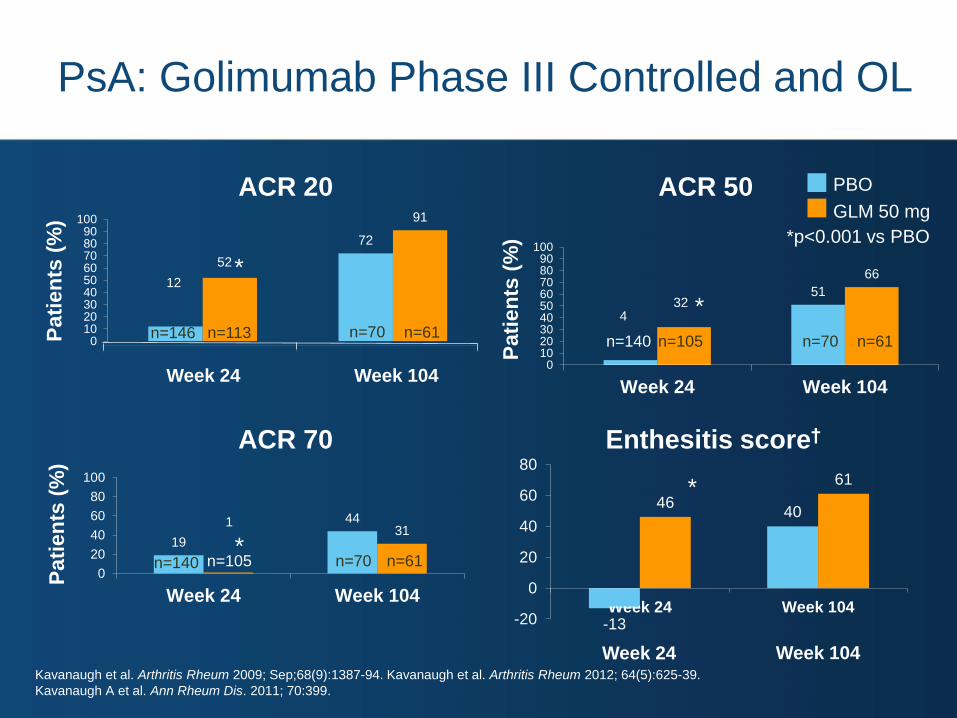
ACR 20 ACR 50
ACR 70
n=140 n=70 n=61
GLM 50 mg
PBO
Pati
en
ts (
%)
Pati
en
ts (
%)
Pati
en
ts (
%) *p<0.001 vs PBO
*
*
*
n=105
Enthesitis score†
Week 24 Week 104
*
Week 24 Week 104
12
72
52
91
0102030405060708090
100
n=113 n=146 n=70 n=61
19
44 1 31
0
20
40
60
80
100
Week 24 Week 104
n=140 n=70 n=61 n=105
-13
40 46
61
-20
0
20
40
60
80
Week 24 Week 104
PsA: Golimumab Phase III Controlled and OL
Kavanaugh et al. Arthritis Rheum 2009; Sep;68(9):1387-94. Kavanaugh et al. Arthritis Rheum 2012; 64(5):625-39.
Kavanaugh A et al. Ann Rheum Dis. 2011; 70:399.

1
72
56
69
0
20
40
60
80
100
Week 24 Week 104
Pati
en
ts (
%)
GLM 50 mg
PBO
*p<0.001 vs PBO
*
n=102
n=73 n=66 n=43
PASI 75
PsA: Golimumab PASI 75 Response
Noh JW, et al EULAR 2010, OP0025. Cantini F, et al. Biologics: Targets and Therapy, 2013; 7:1-6 .
Kavanaugh et al. Arthritis Rheum 2012; 64(5):625-39.
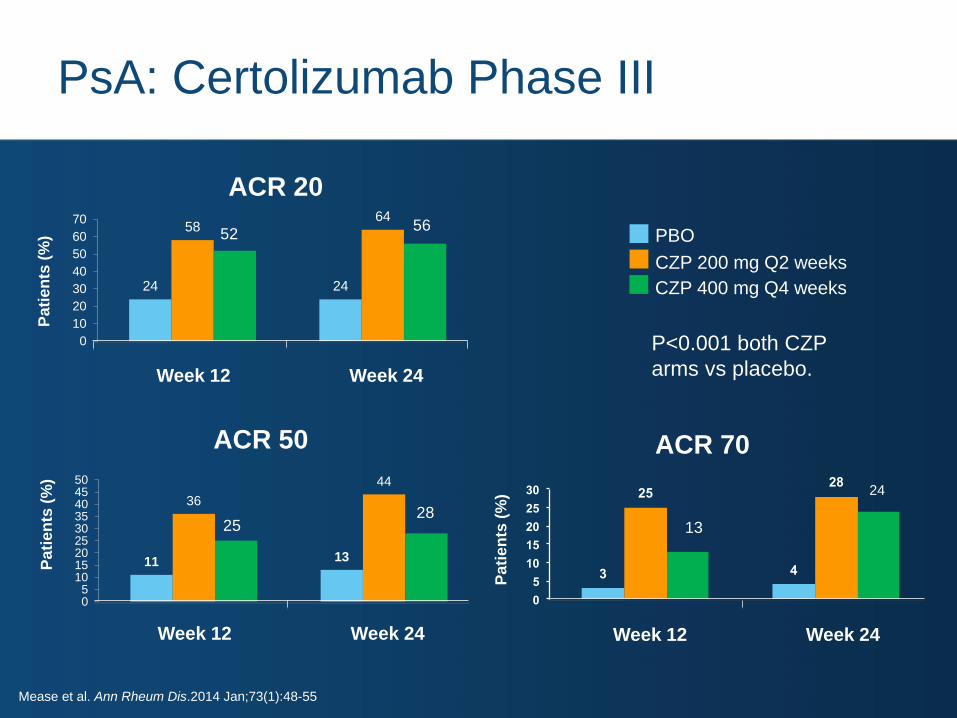
24 24
58 64
0
10
20
30
40
50
60
70
ACR 20
ACR 70 ACR 50
CZP 200 mg Q2 weeks
PBO
Pa
tien
ts (
%)
Pa
tien
ts (
%)
Week 12 Week 24
11 13
36
44
05
101520253035404550
Week 12 Week 24
Pa
tie
nts
(%
)
3 4
25 28
0
5
10
15
20
25
30
Week 12 Week 24
CZP 400 mg Q4 weeks
52 56
25 28
13
24
P<0.001 both CZP
arms vs placebo.
PsA: Certolizumab Phase III
Mease et al. Ann Rheum Dis.2014 Jan;73(1):48-55
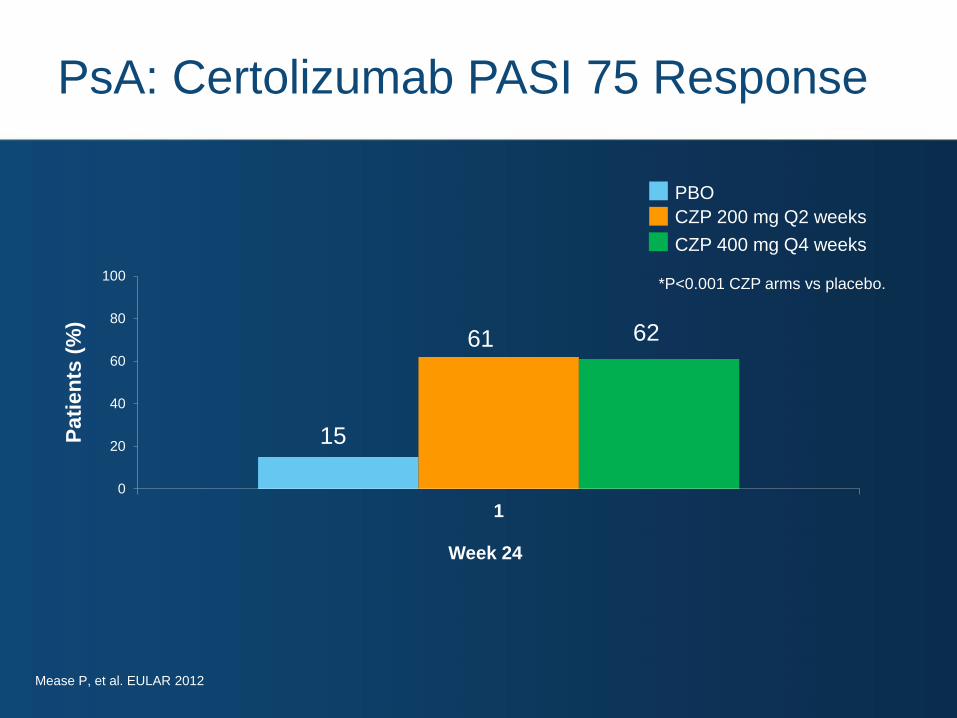
15
62
0
20
40
60
80
100
1
Pati
en
ts (
%)
Week 24
CZP 200 mg Q2 weeks
PBO
CZP 400 mg Q4 weeks
61
*P<0.001 CZP arms vs placebo.
PsA: Certolizumab PASI 75 Response
Mease P, et al. EULAR 2012
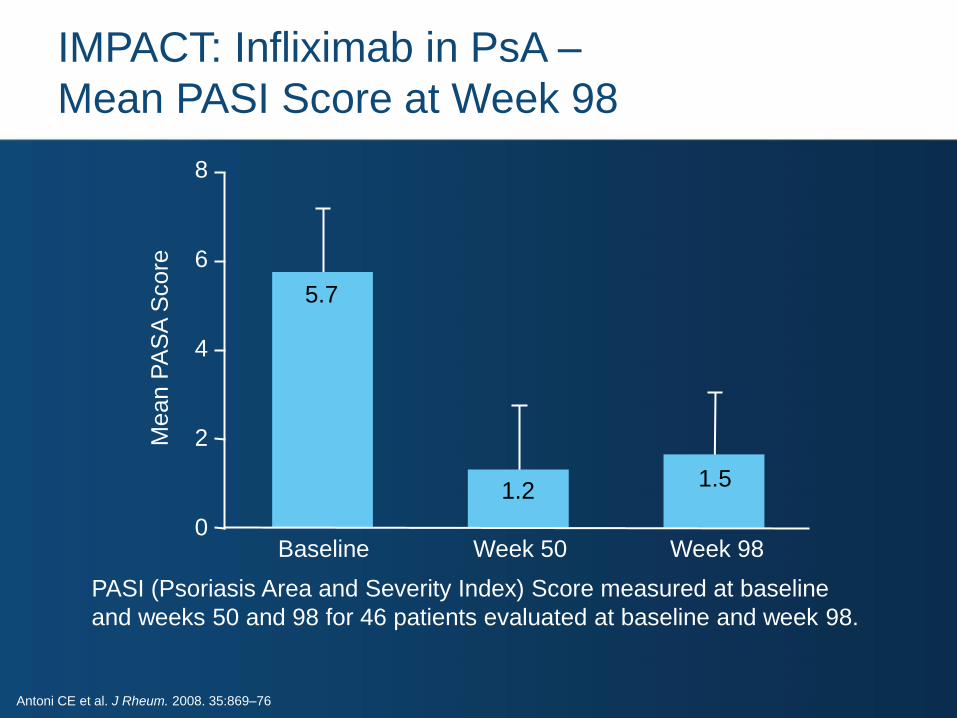
IMPACT: Infliximab in PsA –
Mean PASI Score at Week 98
PASI (Psoriasis Area and Severity Index) Score measured at baseline
and weeks 50 and 98 for 46 patients evaluated at baseline and week 98.
Baseline Week 50 Week 98
5.7
1.2 1.5
0
2
4
6
8 M
ean P
AS
A S
core
Antoni CE et al. J Rheum. 2008. 35:869–76

IMPACT 2 – Total vdH-Sharp Score in PsA:
Mean Change at Weeks 24 and 54
• In placebo-controlled trial, pts received infliximab at wks 16, 18 and 22, then every 8 wks
• All pts received infliximab from week 24
Change f
rom
Baselin
e in
Tota
l vdH
-S S
core
P<0.001 0.82
0.53
-0.7
-0.94 -1.2
-1
-0.8
-0.6
-0.4
-0.2
0
0.2
0.4
0.6
0.8
1
Week 24 Week 54
Placebo (n=100) Infliximab 5 mg/kg (n=100)
Van der Heijde D et al. Ann Rheum Dis. 2005; 64:ii61-ii64.
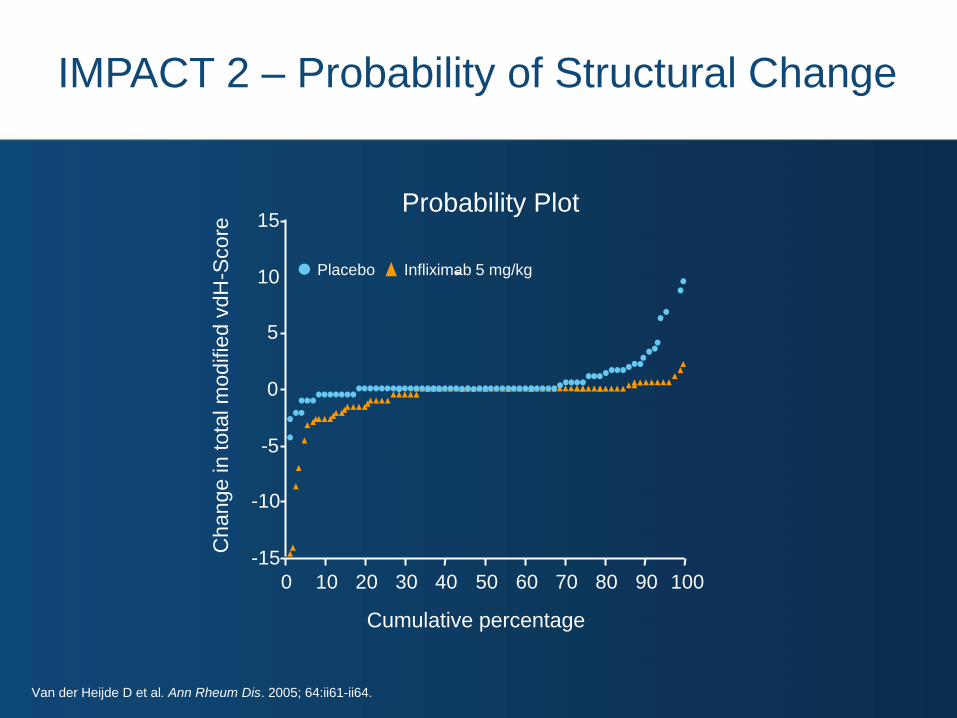
IMPACT 2 – Probability of Structural Change
Cumulative percentage
Change in tota
l m
od
ifie
d v
dH
-Score
-15
-10
Placebo Infliximab 5 mg/kg
-5
0
5
10
15
0 10 20 30 40 50 60 70 80 90 100
Probability Plot
Van der Heijde D et al. Ann Rheum Dis. 2005; 64:ii61-ii64.
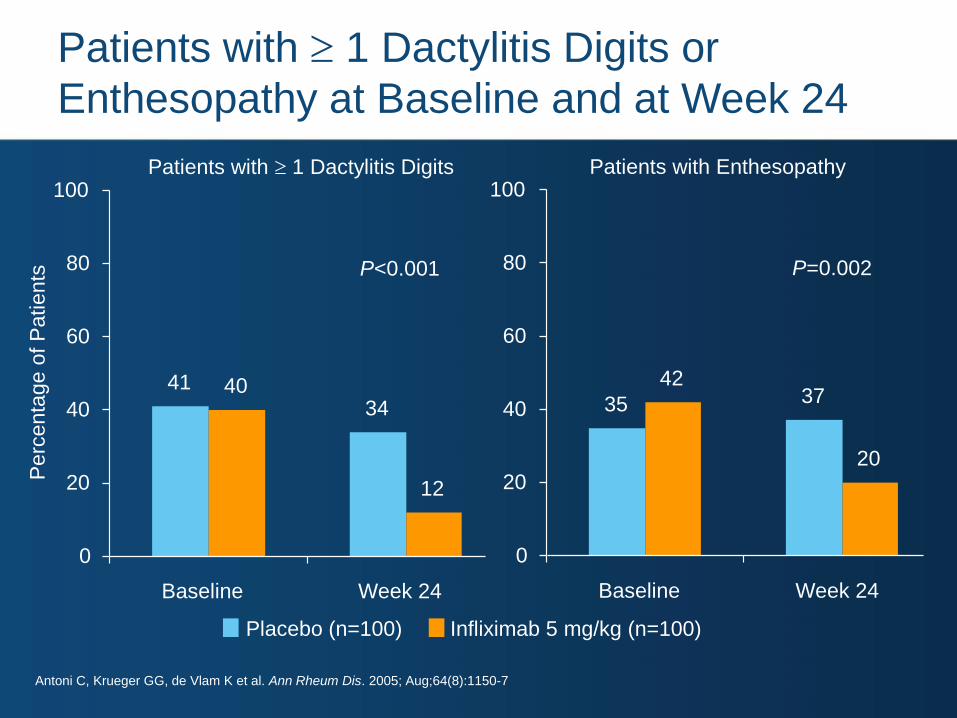
Patients with 1 Dactylitis Digits or
Enthesopathy at Baseline and at Week 24
P<0.001
Patients with 1 Dactylitis Digits
P=0.002
Patients with Enthesopathy
Perc
enta
ge o
f P
atients
Placebo (n=100) Infliximab 5 mg/kg (n=100)
41
34 40
12
0
20
40
60
80
100
Baseline Week 24
35 37 42
20
0
20
40
60
80
100
Baseline Week 24
Antoni C, Krueger GG, de Vlam K et al. Ann Rheum Dis. 2005; Aug;64(8):1150-7
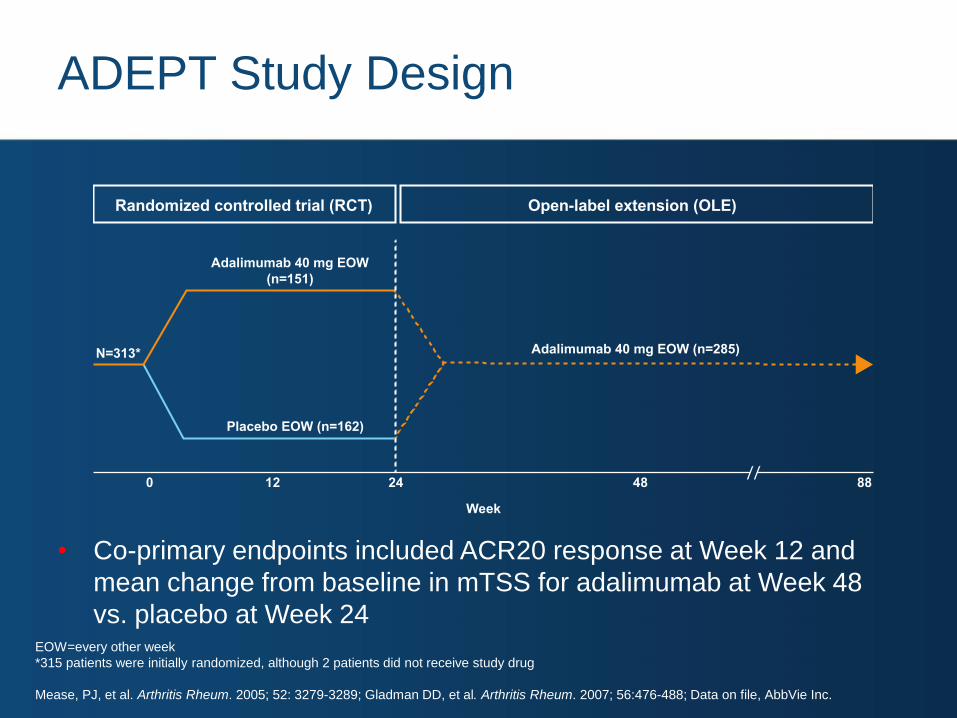
ADEPT Study Design
• Co-primary endpoints included ACR20 response at Week 12 and
mean change from baseline in mTSS for adalimumab at Week 48
vs. placebo at Week 24
Adalimumab 40 mg EOW
(n=151)
Randomized controlled trial (RCT) Open-label extension (OLE)
Adalimumab 40 mg EOW (n=285)
Placebo EOW (n=162)
Week
0 12 24 48 88
N=313*
EOW=every other week
*315 patients were initially randomized, although 2 patients did not receive study drug
Mease, PJ, et al. Arthritis Rheum. 2005; 52: 3279-3289; Gladman DD, et al. Arthritis Rheum. 2007; 56:476-488; Data on file, AbbVie Inc.
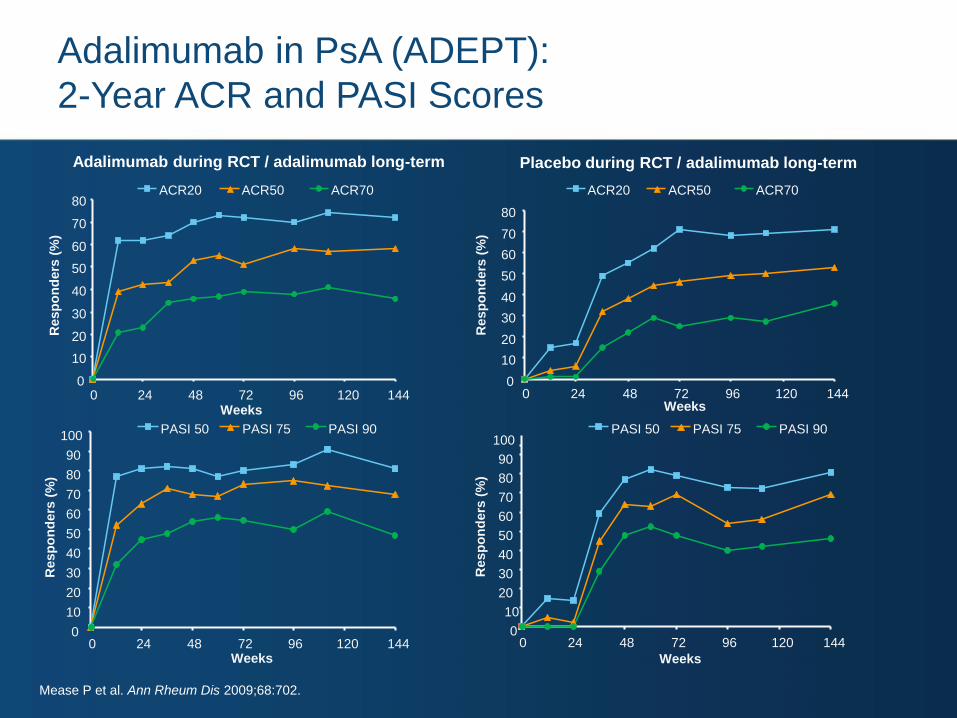
Adalimumab in PsA (ADEPT):
2-Year ACR and PASI Scores
Adalimumab during RCT / adalimumab long-term Placebo during RCT / adalimumab long-term
2-year extension study: 277 subjects from 313 originally enrolled in RCT
0
10
20
30
40
50
60
70
80
90
100
0 24 48 72 96 120 144
Weeks
Resp
on
ders
(%
)
PASI 50 PASI 75 PASI 90
0
10
20
30
40
50
60
70
80
90
100
0 24 48 72 96 120 144 Weeks
Resp
on
ders
(%
)
PASI 50 PASI 75 PASI 90
0
10
20
30
40
50
60
70
80
0 24 48 72 96 120 144 Weeks
Resp
on
ders
(%
)
ACR20 ACR50 ACR70
0
10
20
30
40
50
60
70
80
0 24 48 72 96 120 144 Weeks
Resp
on
ders
(%
)
ACR20 ACR50 ACR70
Mease P et al. Ann Rheum Dis 2009;68:702.
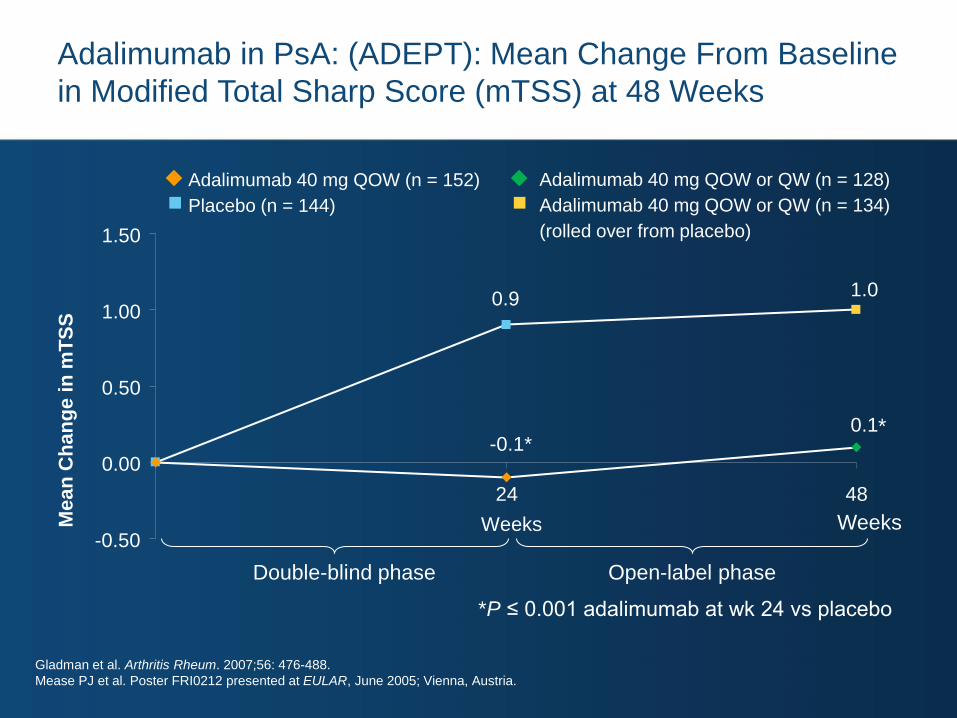
*P ≤ 0.001 adalimumab at wk 24 vs placebo
Open-label phase Double-blind phase
Adalimumab 40 mg QOW (n = 152)
Placebo (n = 144)
Adalimumab 40 mg QOW or QW (n = 128)
Adalimumab 40 mg QOW or QW (n = 134)
(rolled over from placebo)
*
Weeks
0.9 1.0
-0.1* 0.1
-0.50
0.00
0.50
1.00
1.50
24 48
Weeks Me
an
Ch
an
ge
in
mT
SS
Gladman et al. Arthritis Rheum. 2007;56: 476-488.
Mease PJ et al. Poster FRI0212 presented at EULAR, June 2005; Vienna, Austria.
Adalimumab in PsA: (ADEPT): Mean Change From Baseline
in Modified Total Sharp Score (mTSS) at 48 Weeks
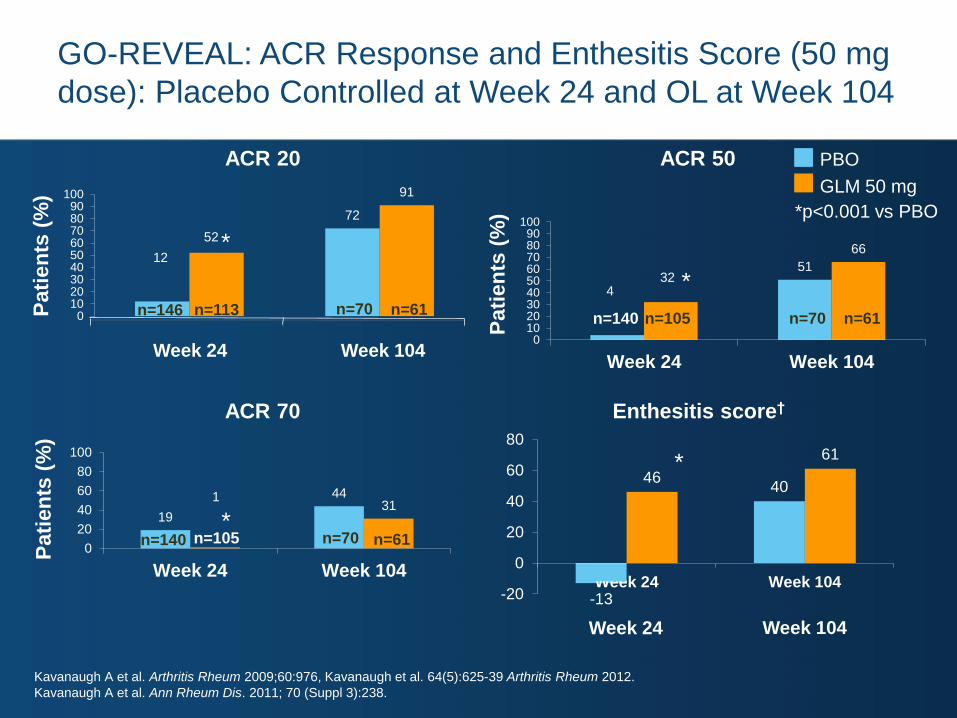
GO-REVEAL: ACR Response and Enthesitis Score (50 mg
dose): Placebo Controlled at Week 24 and OL at Week 104
4
51 32
66
0102030405060708090
100
Week 24 Week 104
ACR 20 ACR 50
ACR 70
n=140 n=70 n=61
GLM 50 mg
PBO
Pati
en
ts (
%)
Pati
en
ts (
%)
Pati
en
ts (
%) *p<0.001 vs PBO
*
*
*
n=105
Enthesitis score†
Week 24 Week 104
*
Week 24 Week 104
12
72
52
91
0102030405060708090
100
n=113 n=146 n=70 n=61
19
44 1 31
0
20
40
60
80
100
Week 24 Week 104
n=140 n=70 n=61 n=105
-13
40 46
61
-20
0
20
40
60
80
Week 24 Week 104
Kavanaugh A et al. Arthritis Rheum 2009;60:976, Kavanaugh et al. 64(5):625-39 Arthritis Rheum 2012.
Kavanaugh A et al. Ann Rheum Dis. 2011; 70 (Suppl 3):238.

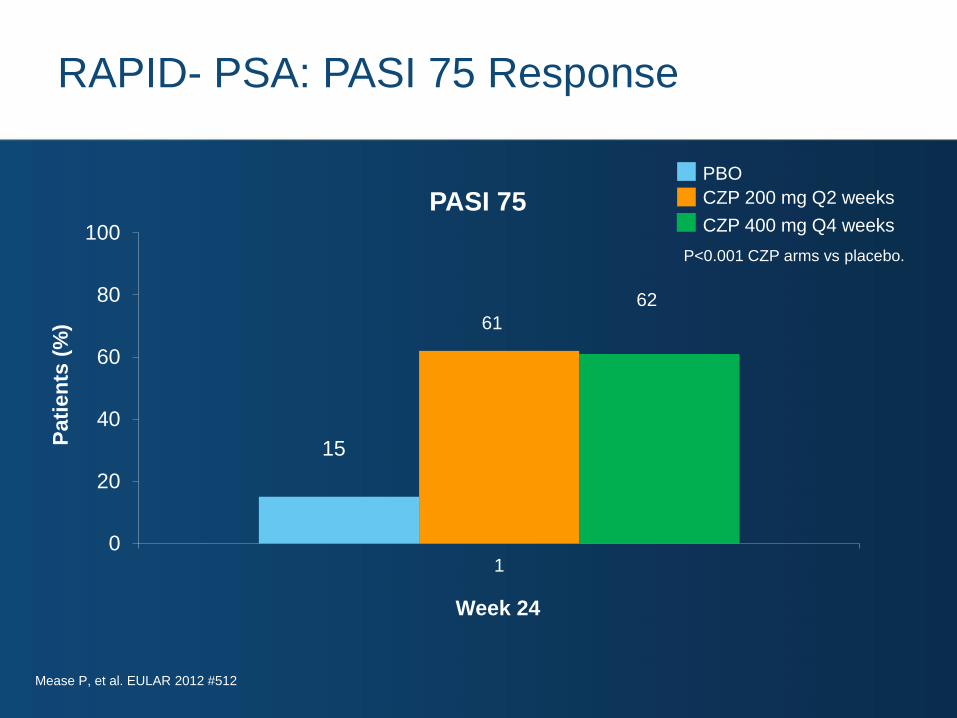
RAPID- PSA: PASI 75 Response
15
62
0
20
40
60
80
100
1
Pati
en
ts (
%)
PASI 75
Week 24
CZP 200 mg Q2 weeks
PBO
CZP 400 mg Q4 weeks
61
* *
P<0.001 CZP arms vs placebo.
Mease P, et al. EULAR 2012 #512
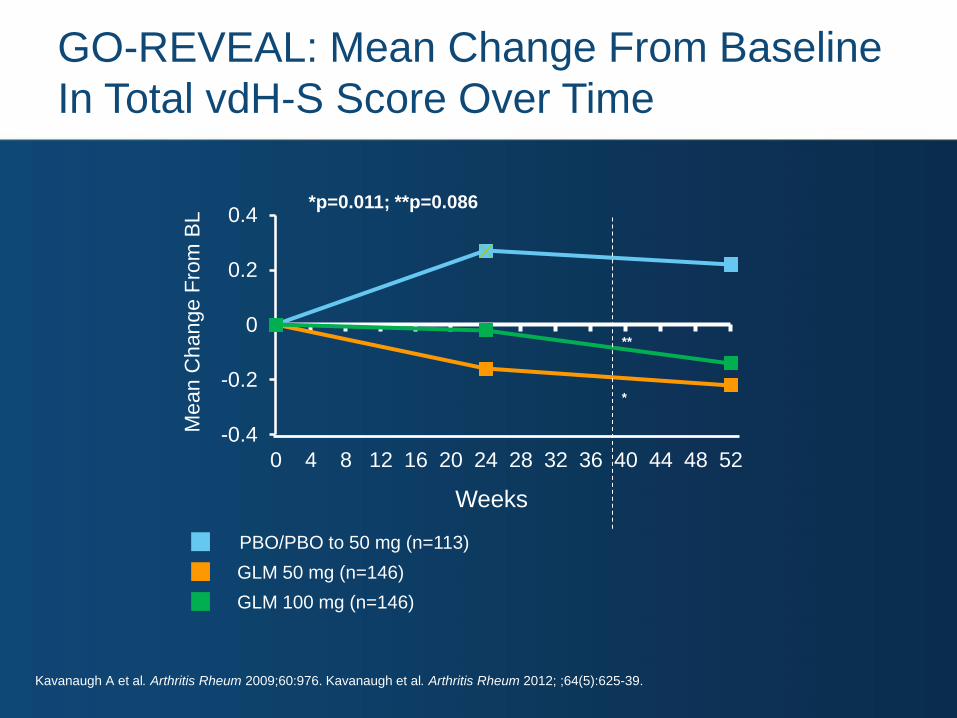
Kavanaugh A et al. Arthritis Rheum 2009;60:976. Kavanaugh et al. Arthritis Rheum 2012; ;64(5):625-39.
GO-REVEAL: Mean Change From Baseline
In Total vdH-S Score Over Time
-0.4
-0.2
0
0.2
0.4
0 4 8 12 16 20 24 28 32 36 40 44 48 52
Weeks
Mean C
hange F
rom
BL
GLM 100 mg (n=146)
GLM 50 mg (n=146)
PBO/PBO to 50 mg (n=113)
*
**
*p=0.011; **p=0.086
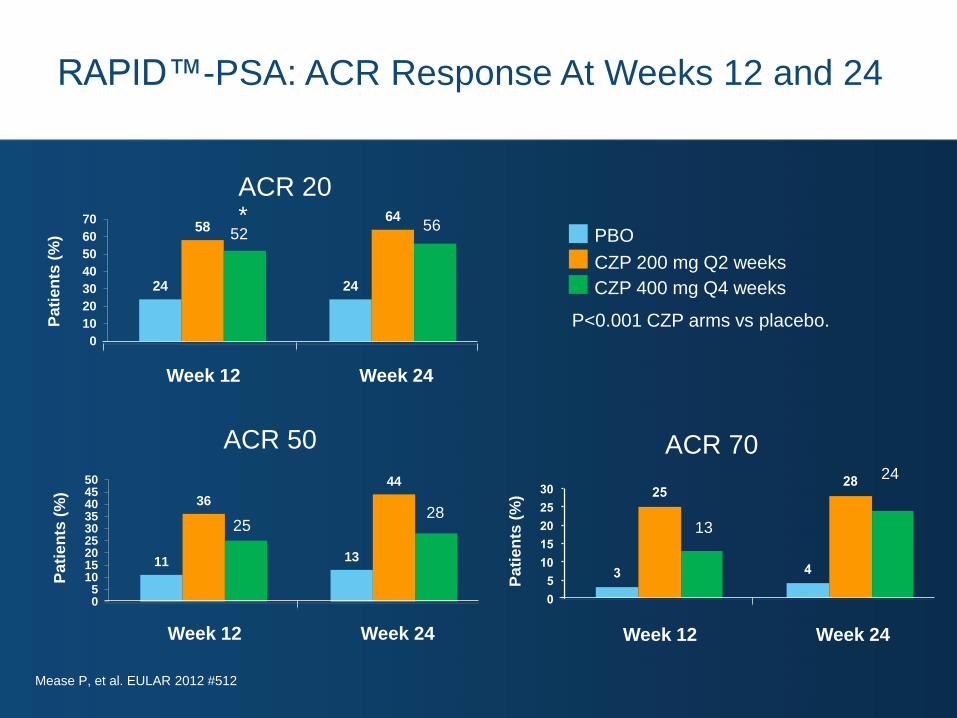
3 4
25 28
0
5
10
15
20
25
30
24 24
58 64
0
10
20
30
40
50
60
70
ACR 20
ACR 70 ACR 50
CZP 200 mg Q2 weeks
PBO
Pa
tien
ts (
%)
Pa
tie
nts
(%
)
*
Week 12 Week 24
11 13
36
44
05
101520253035404550
Week 12 Week 24
Pa
tien
ts (
%)
Week 12 Week 24
CZP 400 mg Q4 weeks
52 56
25 28
13
24
P<0.001 CZP arms vs placebo.
Mease P, et al. EULAR 2012 #512
RAPID™-PSA: ACR Response At Weeks 12 and 24
RAPID- PSA: PASI 75 Response
15
62
0
20
40
60
80
100
1
Pati
en
ts (
%)
PASI 75
Week 24
CZP 200 mg Q2 weeks
PBO
CZP 400 mg Q4 weeks
61
P<0.001 CZP arms vs placebo.
Mease P, et al. EULAR 2012 #512
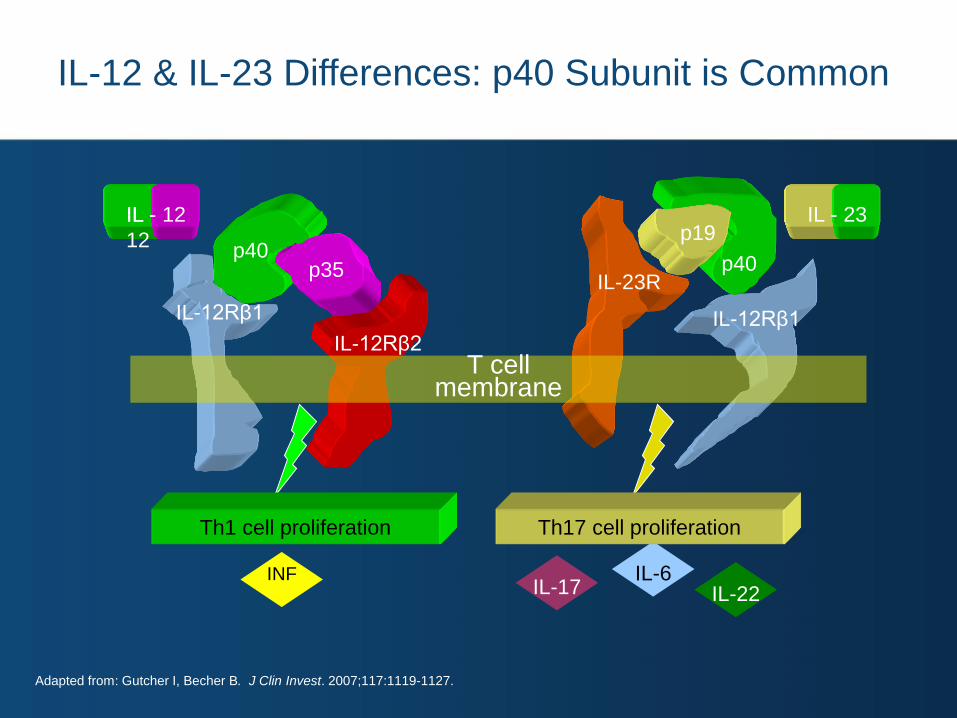
IL-12 & IL-23 Differences: p40 Subunit is Common
IL - 23
IL-17
INF
IL -
12
IL - 12
p40 p35 p40
IL-12Rβ2 IL-12Rβ1
IL-23R
T cell membrane
IL-6
IL-22
Th1 cell proliferation Th17 cell proliferation
p19
IL-12Rβ1
Adapted from: Gutcher I, Becher B. J Clin Invest. 2007;117:1119-1127.
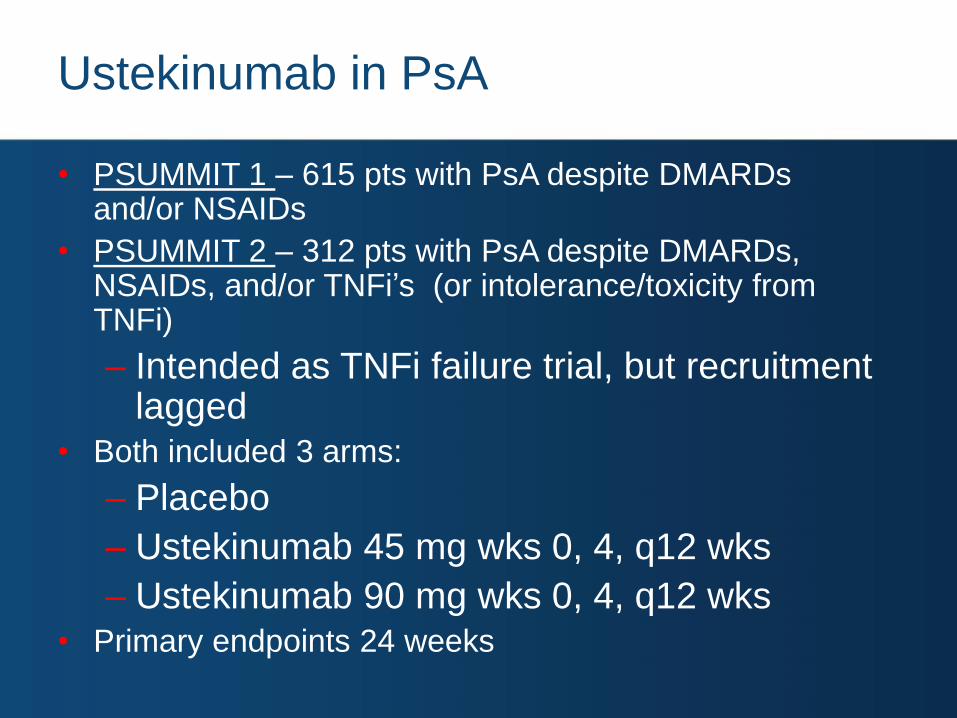
Ustekinumab in PsA
• PSUMMIT 1 – 615 pts with PsA despite DMARDs and/or NSAIDs
• PSUMMIT 2 – 312 pts with PsA despite DMARDs, NSAIDs, and/or TNFi’s (or intolerance/toxicity from TNFi)
– Intended as TNFi failure trial, but recruitment lagged
• Both included 3 arms:
– Placebo
– Ustekinumab 45 mg wks 0, 4, q12 wks
– Ustekinumab 90 mg wks 0, 4, q12 wks • Primary endpoints 24 weeks
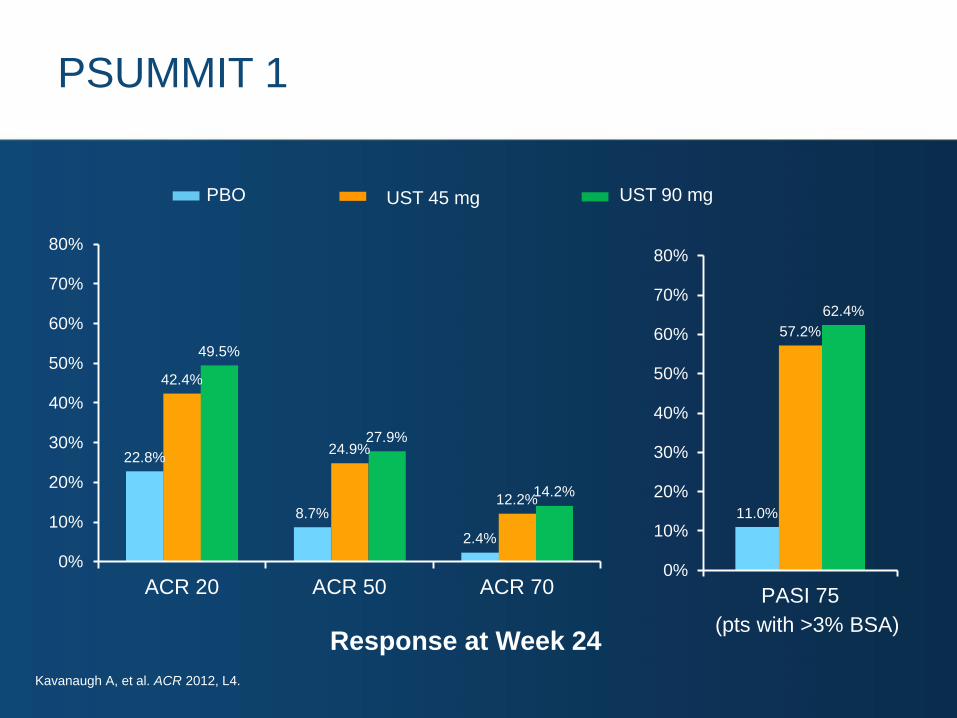
PSUMMIT 1
11.0%
57.2%
62.4%
0%
10%
20%
30%
40%
50%
60%
70%
80%
PASI 75
PBO
UST 45 mg UST 90 mg
Response at Week 24
22.8%
8.7%
2.4%
42.4%
24.9%
12.2%
49.5%
27.9%
14.2%
0%
10%
20%
30%
40%
50%
60%
70%
80%
ACR 20 ACR 50 ACR 70
(pts with >3% BSA)
Kavanaugh A, et al. ACR 2012, L4.
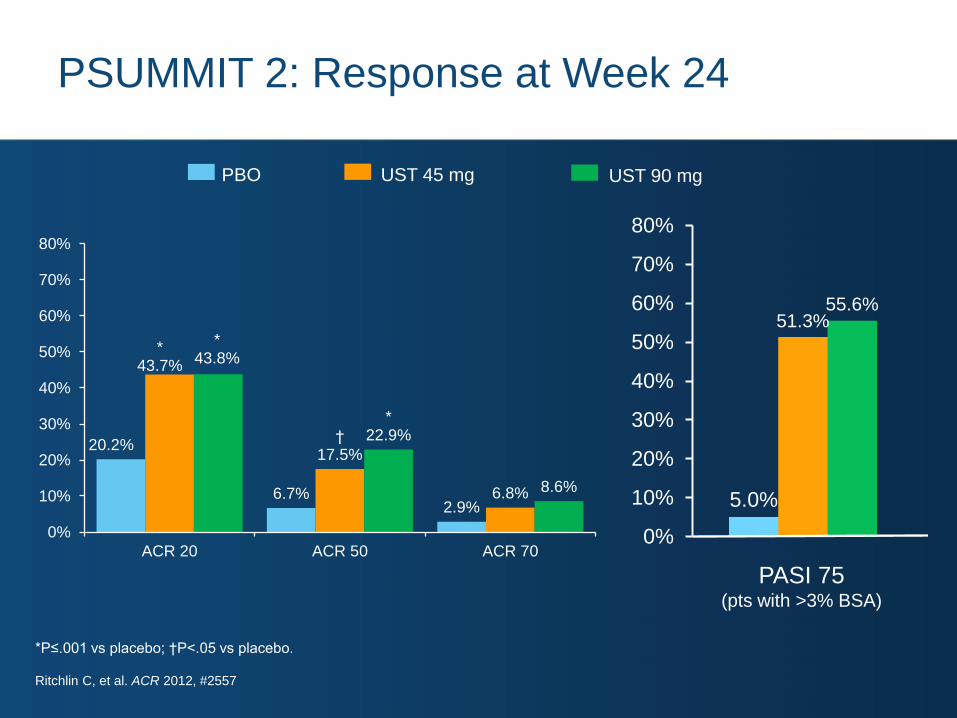
PSUMMIT 2: Response at Week 24
PBO
UST 45 mg UST 90 mg
20.2%
6.7% 2.9%
* 43.7%
† 17.5%
6.8%
* 43.8%
* 22.9%
8.6%
0%
10%
20%
30%
40%
50%
60%
70%
80%
ACR 20 ACR 50 ACR 70
5.0%
51.3% 55.6%
0%
10%
20%
30%
40%
50%
60%
70%
80%
PASI 75 (pts with >3% BSA)
*P≤.001 vs placebo; †P<.05 vs placebo.
Ritchlin C, et al. ACR 2012, #2557
O
O
O
O
OO
O
S
N
NH
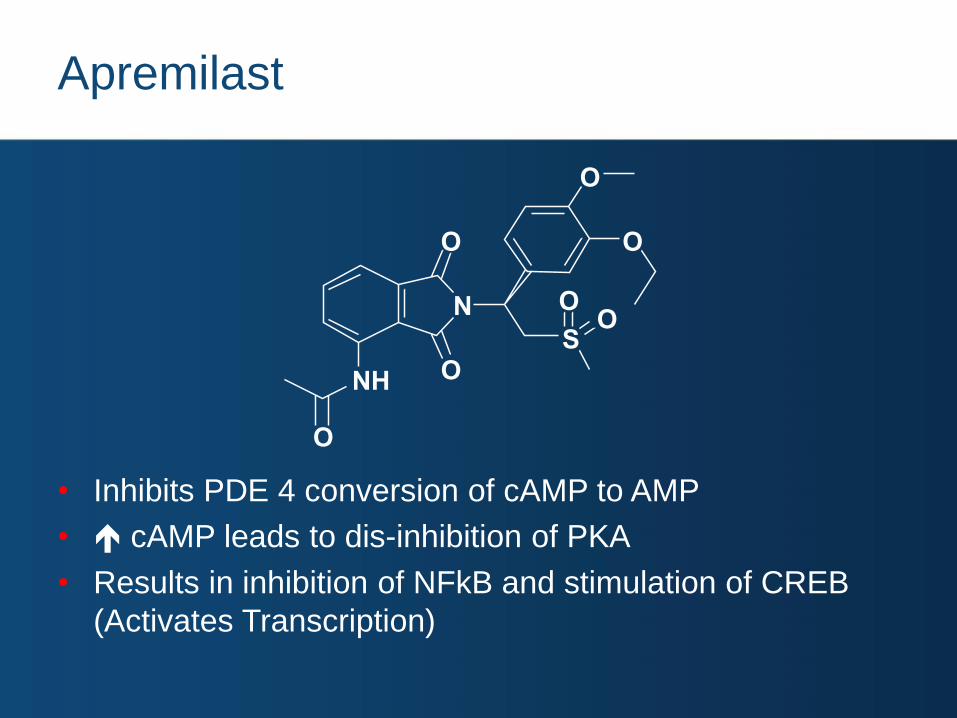
Apremilast
• Inhibits PDE 4 conversion of cAMP to AMP
• cAMP leads to dis-inhibition of PKA
• Results in inhibition of NFkB and stimulation of CREB
(Activates Transcription)
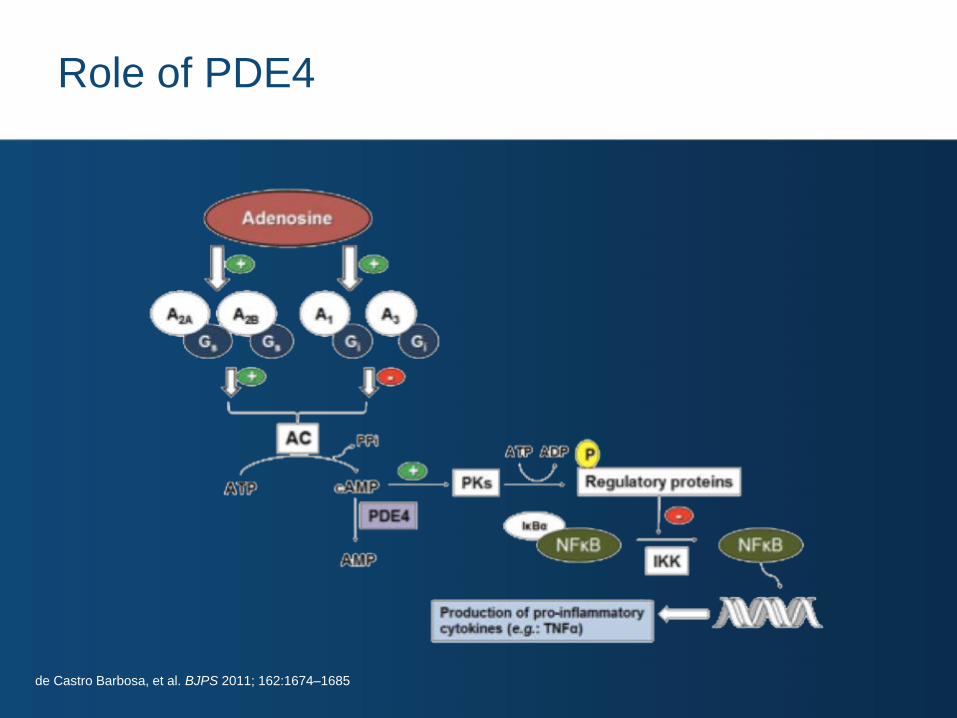
Role of PDE4
de Castro Barbosa, et al. BJPS 2011; 162:1674–1685
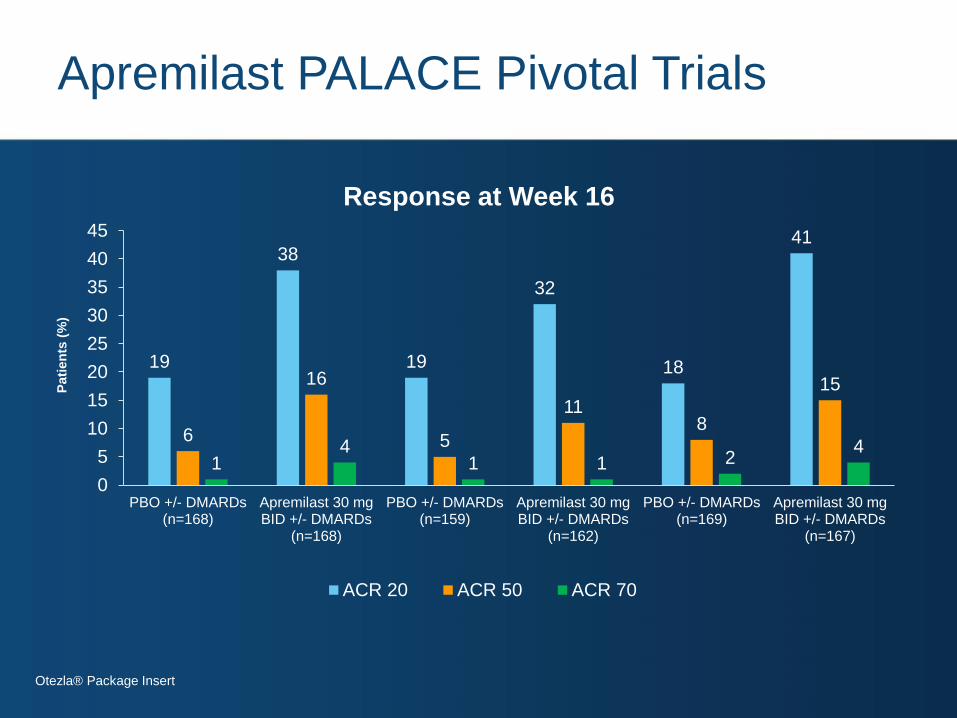
Apremilast PALACE Pivotal Trials
19
38
19
32
18
41
6
16
5
11 8
15
1 4
1 1 2 4
0
5
10
15
20
25
30
35
40
45
PBO +/- DMARDs(n=168)
Apremilast 30 mgBID +/- DMARDs
(n=168)
PBO +/- DMARDs(n=159)
Apremilast 30 mgBID +/- DMARDs
(n=162)
PBO +/- DMARDs(n=169)
Apremilast 30 mgBID +/- DMARDs
(n=167)
Pati
en
ts (
%)
Response at Week 16
ACR 20 ACR 50 ACR 70
Otezla® Package Insert
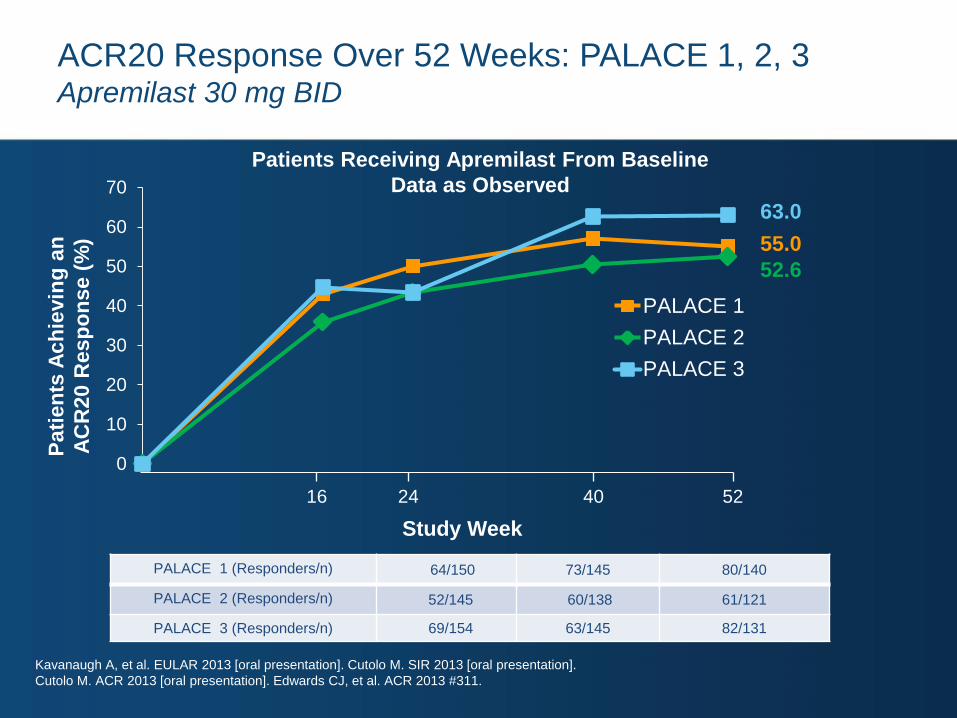
ACR20 Response Over 52 Weeks: PALACE 1, 2, 3 Apremilast 30 mg BID
0
10
20
30
40
50
60
70
PALACE 1
PALACE 2
PALACE 3
Study Week
16 24 40 52
55.0
63.0
52.6
Patients Receiving Apremilast From Baseline
Data as Observed
Pa
tie
nts
Ac
hie
vin
g a
n
AC
R20 R
esp
on
se (
%)
PALACE 1 (Responders/n) 64/150 73/145 80/140
PALACE 2 (Responders/n) 52/145 60/138 61/121
PALACE 3 (Responders/n) 69/154 63/145 82/131
Kavanaugh A, et al. EULAR 2013 [oral presentation]. Cutolo M. SIR 2013 [oral presentation].
Cutolo M. ACR 2013 [oral presentation]. Edwards CJ, et al. ACR 2013 #311.
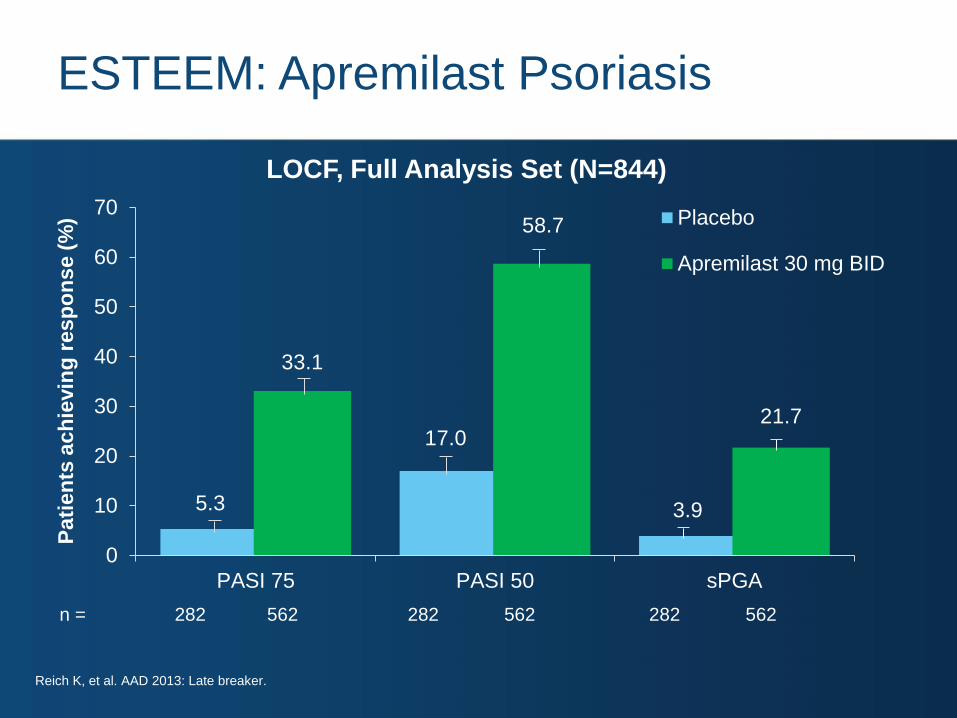
5.3
17.0
3.9
33.1
58.7
21.7
0
10
20
30
40
50
60
70
PASI 75 PASI 50 sPGA
Pa
tie
nts
ac
hie
vin
g r
es
po
ns
e (
%) Placebo
Apremilast 30 mg BID
LOCF, Full Analysis Set (N=844)
282 562 n = 282 562 282 562
ESTEEM: Apremilast Psoriasis
Reich K, et al. AAD 2013: Late breaker.
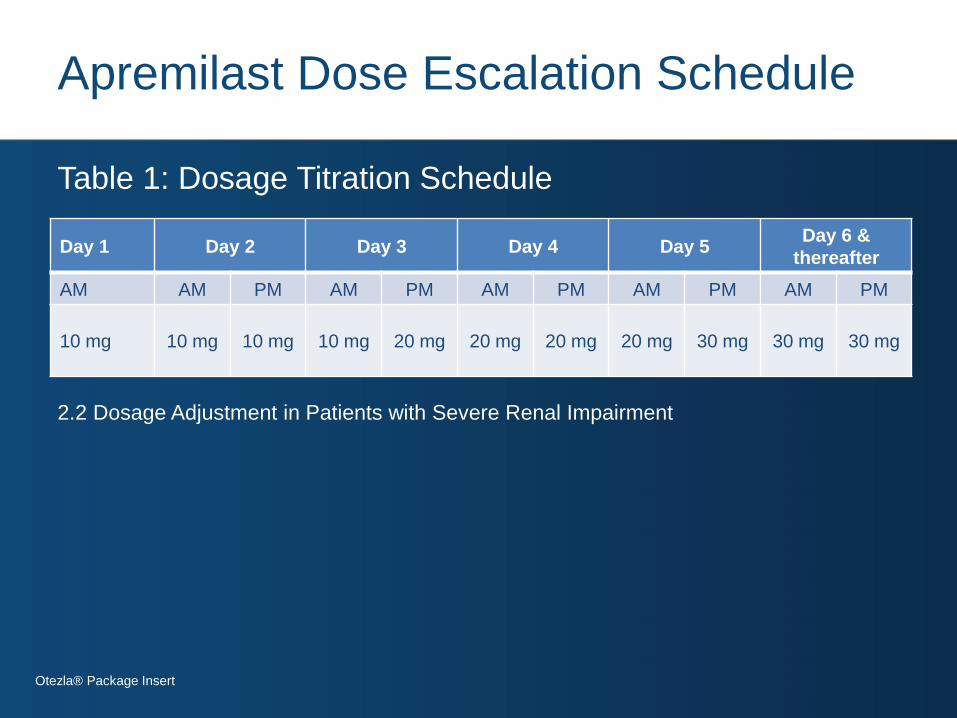
Apremilast Dose Escalation Schedule
Table 1: Dosage Titration Schedule
Otezla® Package Insert
Day 1 Day 2 Day 3 Day 4 Day 5 Day 6 &
thereafter
AM AM PM AM PM AM PM AM PM AM PM
10 mg 10 mg 10 mg 10 mg 20 mg 20 mg 20 mg 20 mg 30 mg 30 mg 30 mg
2.2 Dosage Adjustment in Patients with Severe Renal Impairment

T Cell Differentiation and Role of IL-17
Koenders M I et al. Ann Rheum Dis 2006;65:iii29-iii33
IL-23/STAT3
Th 1 IL-23
Th 17
Th 2
IFNγ
IL-4, IL-10
IL-17
TNFα
IL-6
IL-17F Th 0
IL-17
Fibroblast
Macrophage
Chondrocyte
Osteoblast
Inflammation
Cartilage damage
Bone erosion
Cytokines/chemokines
-IL-1,-6,-8
-TNFα
-LIF, GRO, MIP-1α
-GM-CSF
Destruction mediators
-MMPs
-Nitric oxide
-COX2
RANK
Osteoclastogenesis
IL-23
IL-15
Th 17
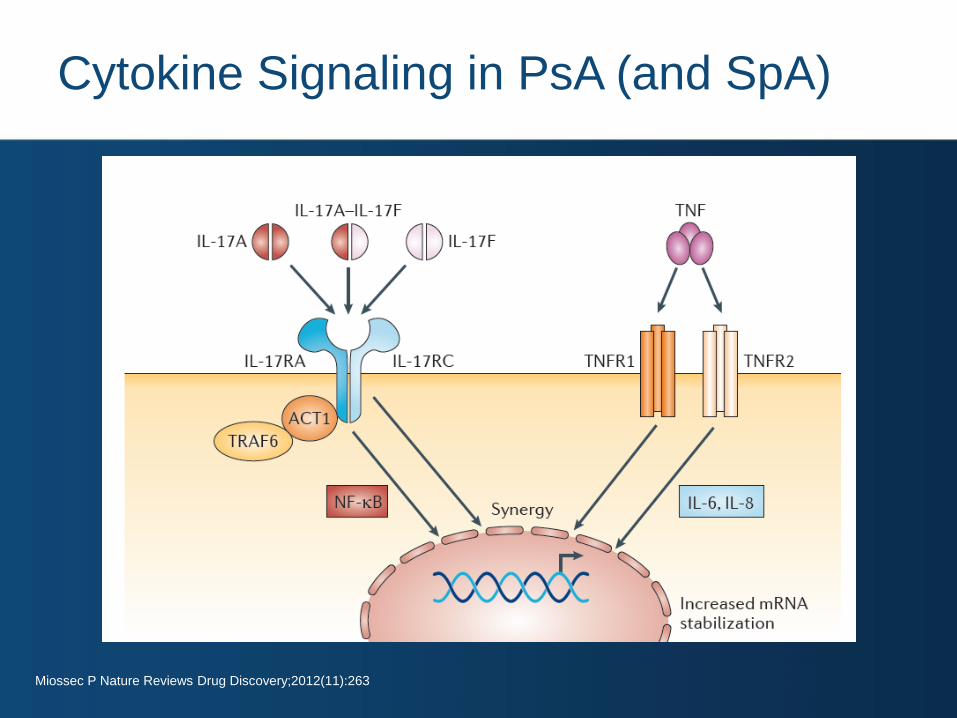
Cytokine Signaling in PsA (and SpA)
Miossec P Nature Reviews Drug Discovery;2012(11):263
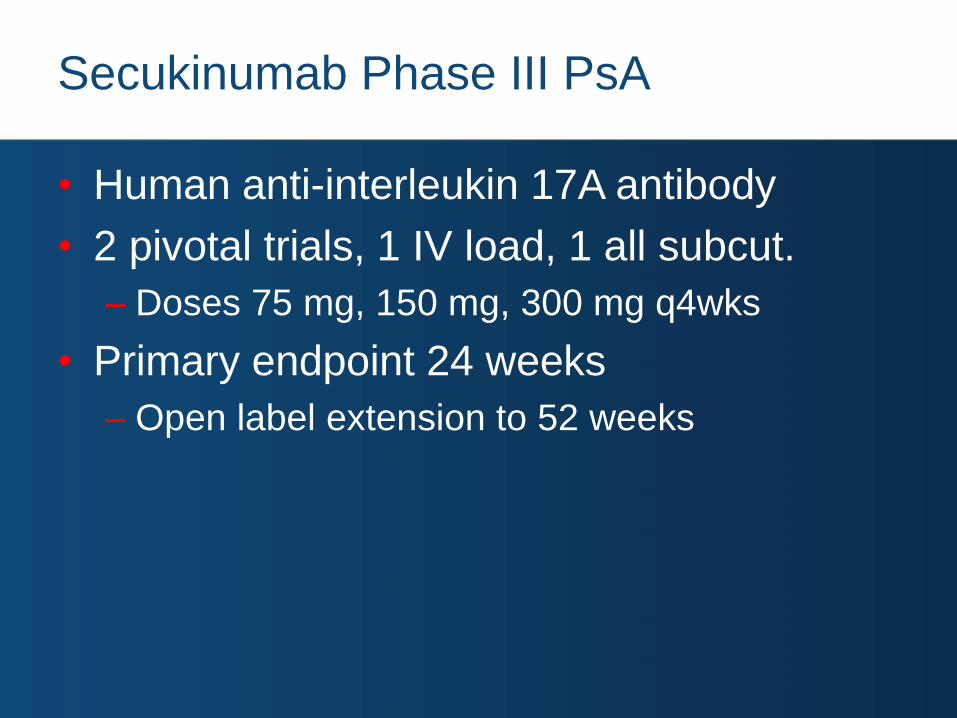
Secukinumab Phase III PsA
• Human anti-interleukin 17A antibody
• 2 pivotal trials, 1 IV load, 1 all subcut.
– Doses 75 mg, 150 mg, 300 mg q4wks
• Primary endpoint 24 weeks
– Open label extension to 52 weeks
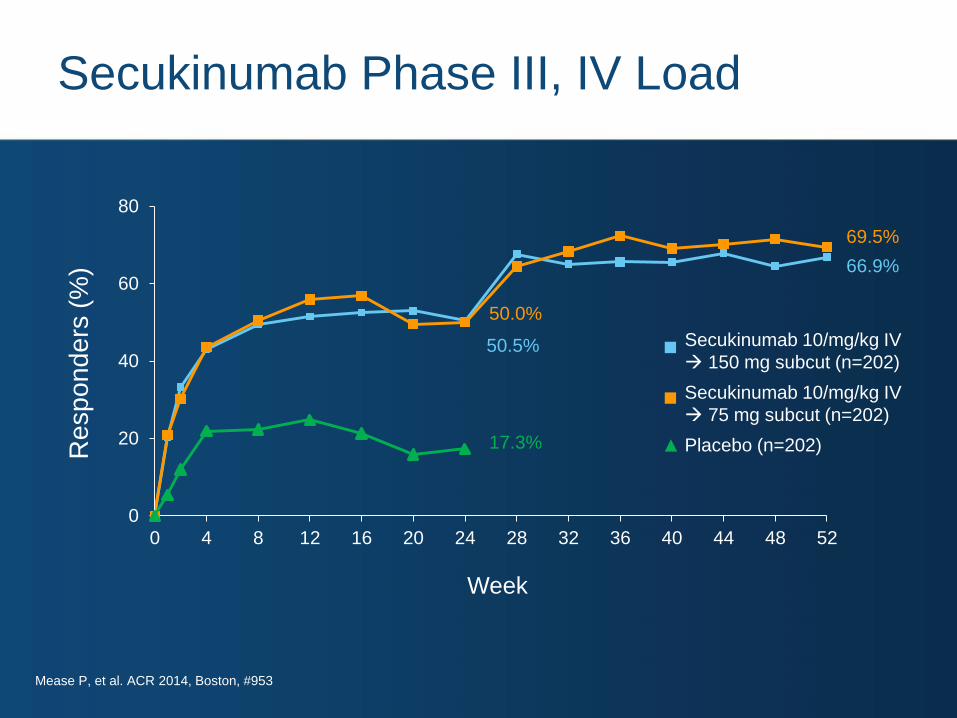
Secukinumab Phase III, IV Load
0
20
40
60
80
0 4 8 12 16 20 24 28 32 36 40 44 48 52
Re
sp
on
de
rs (
%)
50.0%
17.3%
69.5%
66.9%
50.5% Secukinumab 10/mg/kg IV
150 mg subcut (n=202)
Secukinumab 10/mg/kg IV
75 mg subcut (n=202)
Placebo (n=202)
Week
Mease P, et al. ACR 2014, Boston, #953
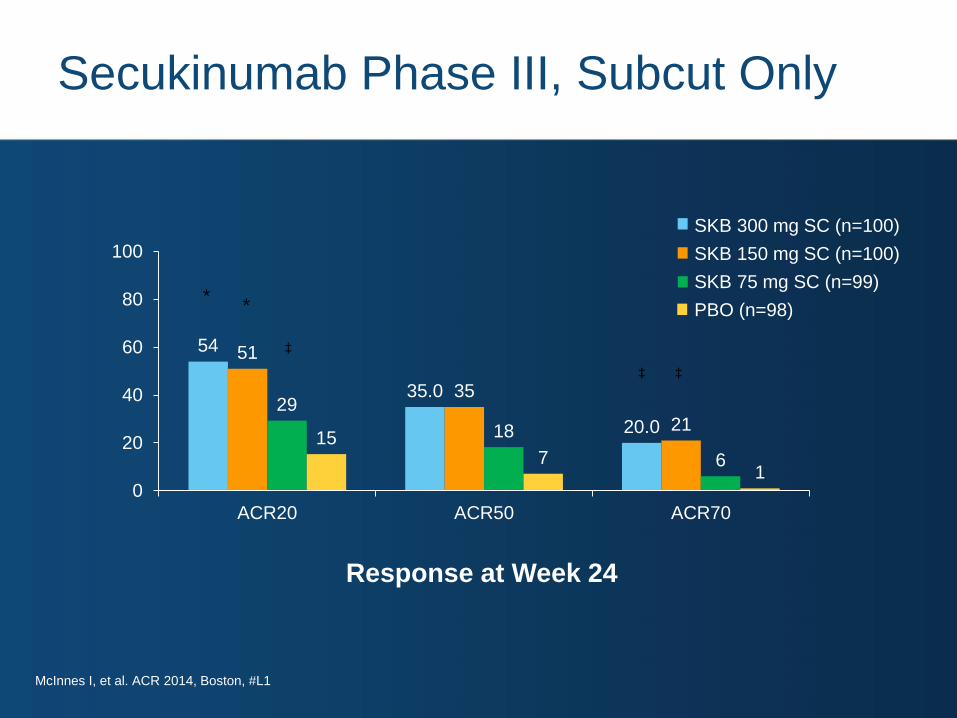
Secukinumab Phase III, Subcut Only
54
35.0
20.0
51
35
21 29
18
6
15 7
1 0
20
40
60
80
100
ACR20 ACR50 ACR70
‡
‡
*
‡
*
SKB 300 mg SC (n=100)
SKB 150 mg SC (n=100)
SKB 75 mg SC (n=99)
PBO (n=98)
Response at Week 24
McInnes I, et al. ACR 2014, Boston, #L1
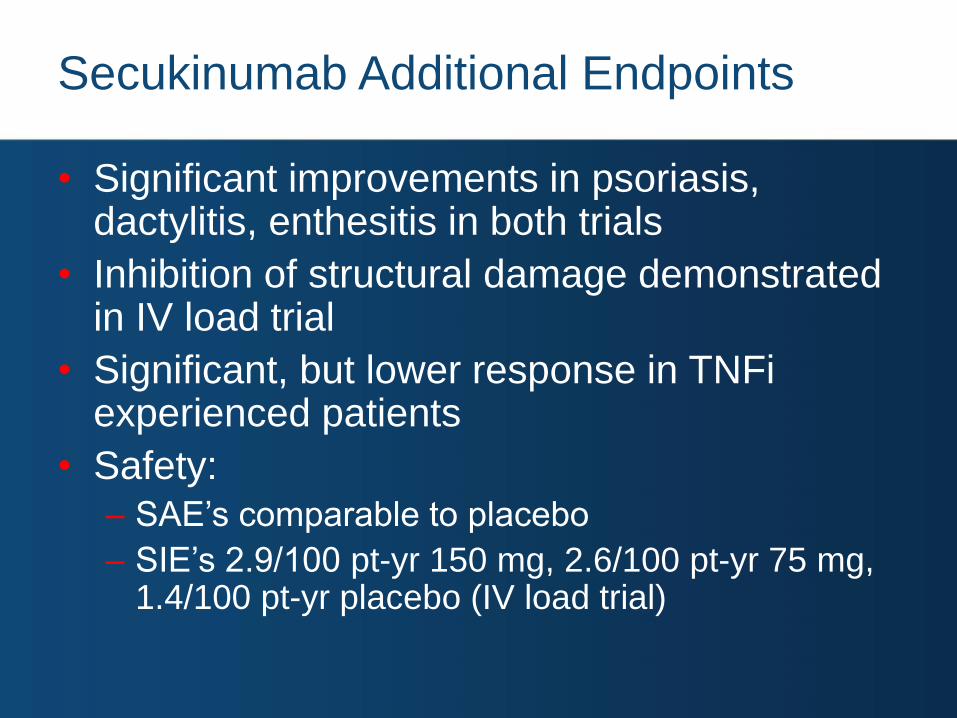
Secukinumab Additional Endpoints
• Significant improvements in psoriasis, dactylitis, enthesitis in both trials
• Inhibition of structural damage demonstrated in IV load trial
• Significant, but lower response in TNFi experienced patients
• Safety:
– SAE’s comparable to placebo
– SIE’s 2.9/100 pt-yr 150 mg, 2.6/100 pt-yr 75 mg, 1.4/100 pt-yr placebo (IV load trial)
Ankylosing Spondylitis
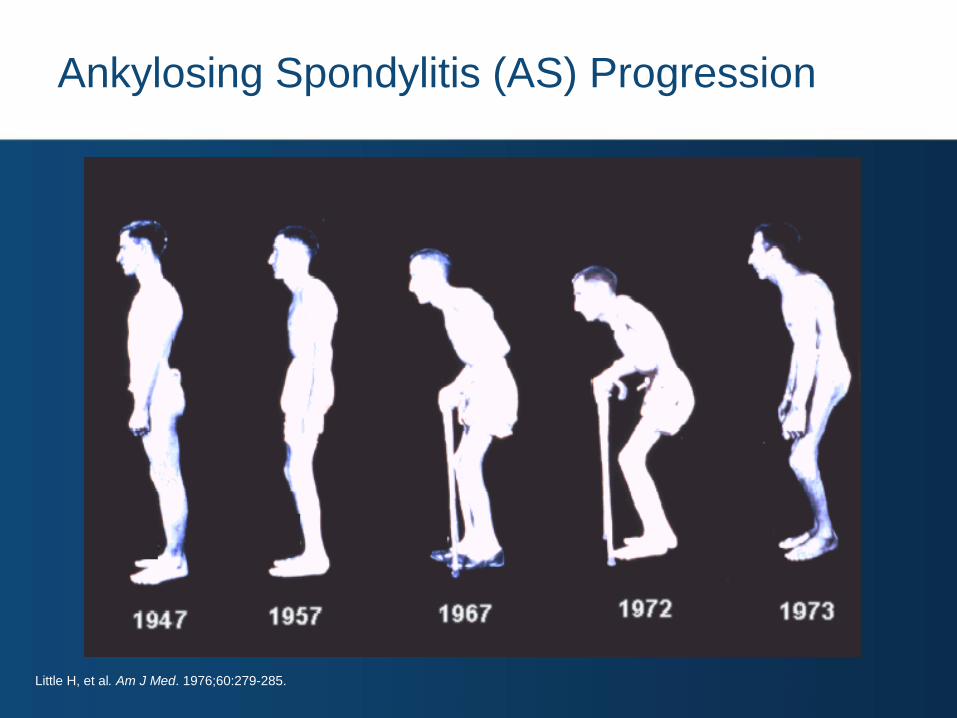
Ankylosing Spondylitis (AS) Progression
Little H, et al. Am J Med. 1976;60:279-285.
AS: Prevalence in Adults
Khan MA. Ann Intern Med. 2002;136:896-907; Akkoc N and Khan, MA. Arthritis Rheum 2005 Dec;52(12):4048-9
Ethnic Group
or Region Prevalence in General Population (%)
Eskimos (Alaska) 0.4
Sami (Finland) 1.8
Northern Norway 1.4
Mordovia 0.5
The Netherlands 0.2
Germany (Berlin) 0.55
Background: AS
• Common clinical features:
– Axial arthritis (eg, spondylitis, sacrolitis)
– Arthritis of “girdle joints” (shoulders, hips)
– Morning stiffness
– Fatigue
– Fever
– Weight loss
• Disease in many pts is progressive, may lead to disability
• Severe AS may be associated with CV disease, pulmonary fibrosis, or neurologic sequelae
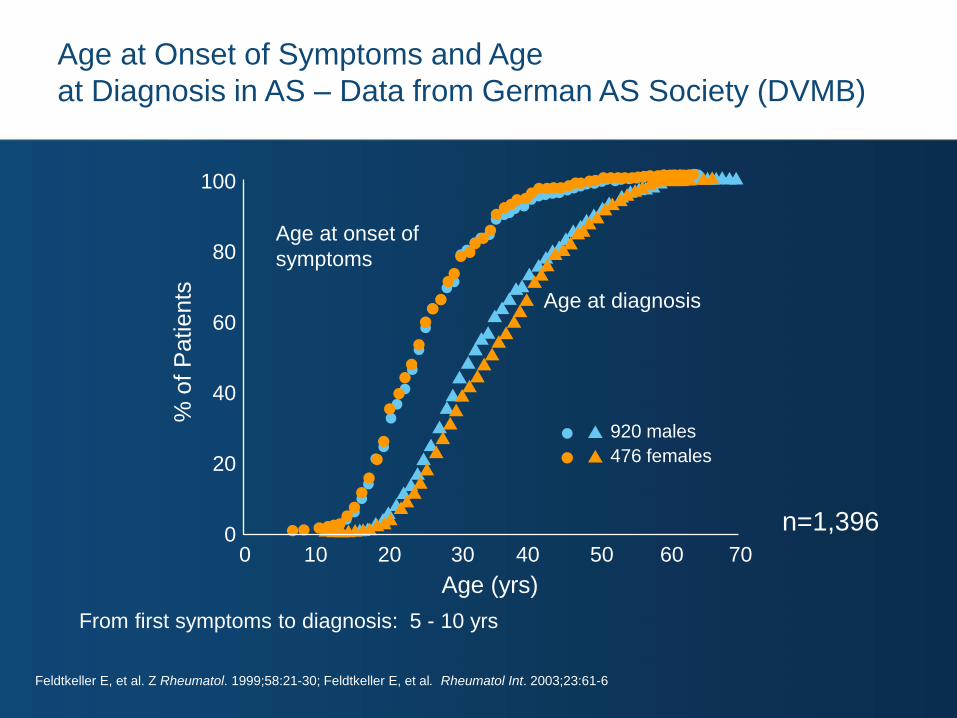
Age at onset of
symptoms
Age at diagnosis
Age (yrs)
% o
f P
atients
n=1,396
From first symptoms to diagnosis: 5 - 10 yrs
0
20
40
60
80
100
0 10 20 30 40 50 60 70
920 males
476 females
Feldtkeller E, et al. Z Rheumatol. 1999;58:21-30; Feldtkeller E, et al. Rheumatol Int. 2003;23:61-6
Age at Onset of Symptoms and Age
at Diagnosis in AS – Data from German AS Society (DVMB)
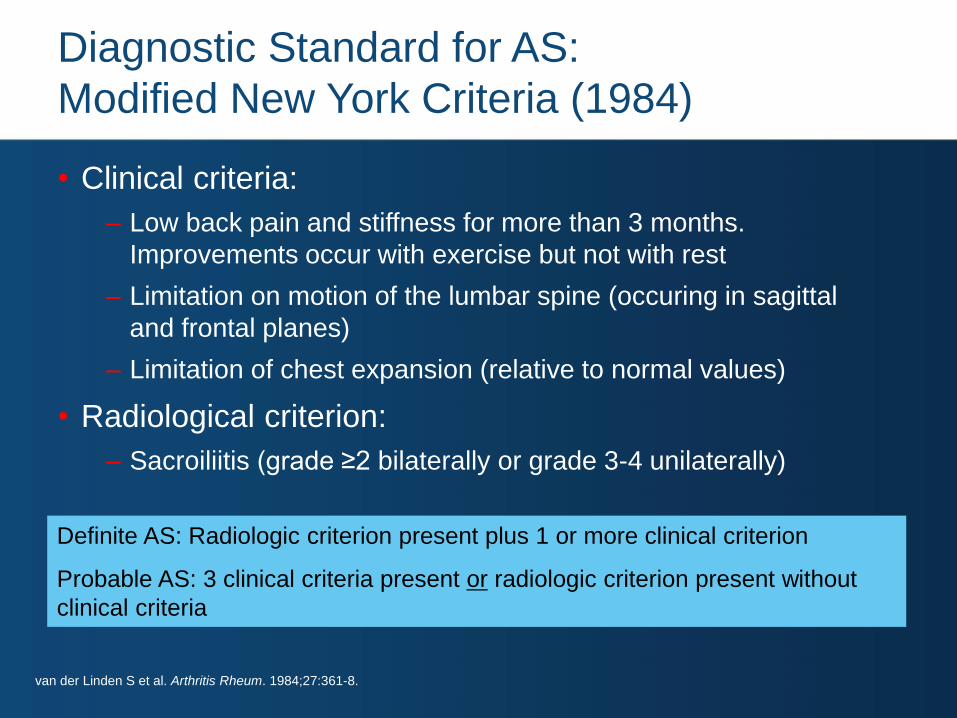
Diagnostic Standard for AS:
Modified New York Criteria (1984)
• Clinical criteria:
– Low back pain and stiffness for more than 3 months.
Improvements occur with exercise but not with rest
– Limitation on motion of the lumbar spine (occuring in sagittal
and frontal planes)
– Limitation of chest expansion (relative to normal values)
• Radiological criterion:
– Sacroiliitis (grade ≥2 bilaterally or grade 3-4 unilaterally)
Definite AS: Radiologic criterion present plus 1 or more clinical criterion
Probable AS: 3 clinical criteria present or radiologic criterion present without
clinical criteria
van der Linden S et al. Arthritis Rheum. 1984;27:361-8.
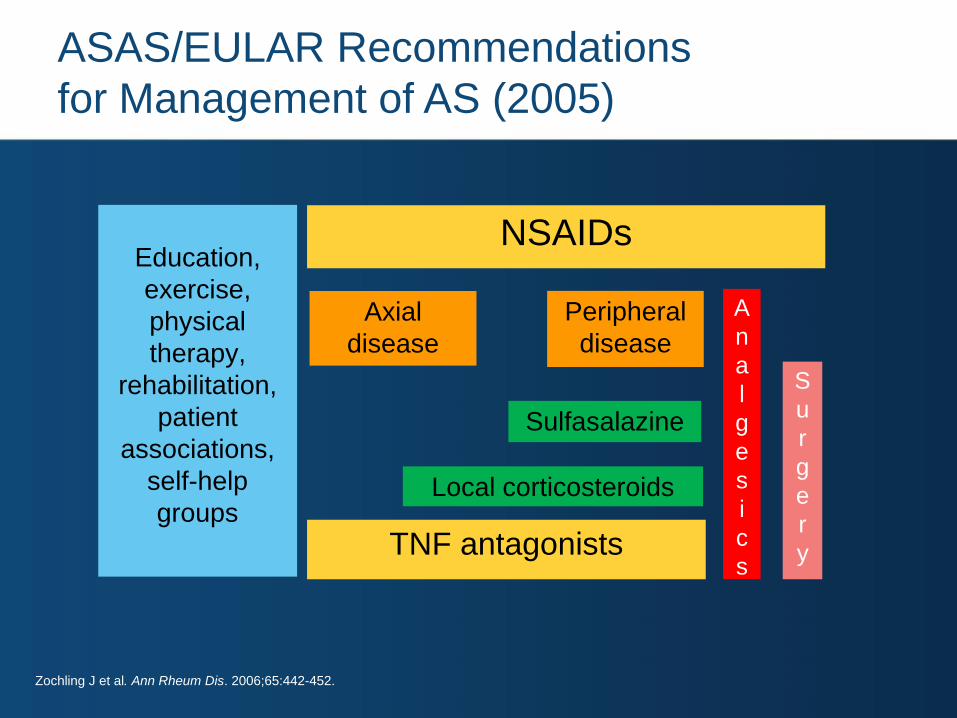
ASAS/EULAR Recommendations
for Management of AS (2005)
Education,
exercise,
physical
therapy,
rehabilitation,
patient
associations,
self-help
groups
NSAIDs
Peripheral
disease
Axial
disease
Sulfasalazine
TNF antagonists
A
n
a
l
g
e
s
i
c
s
Local corticosteroids
S
u
r
g
e
r
y
Zochling J et al. Ann Rheum Dis. 2006;65:442-452.
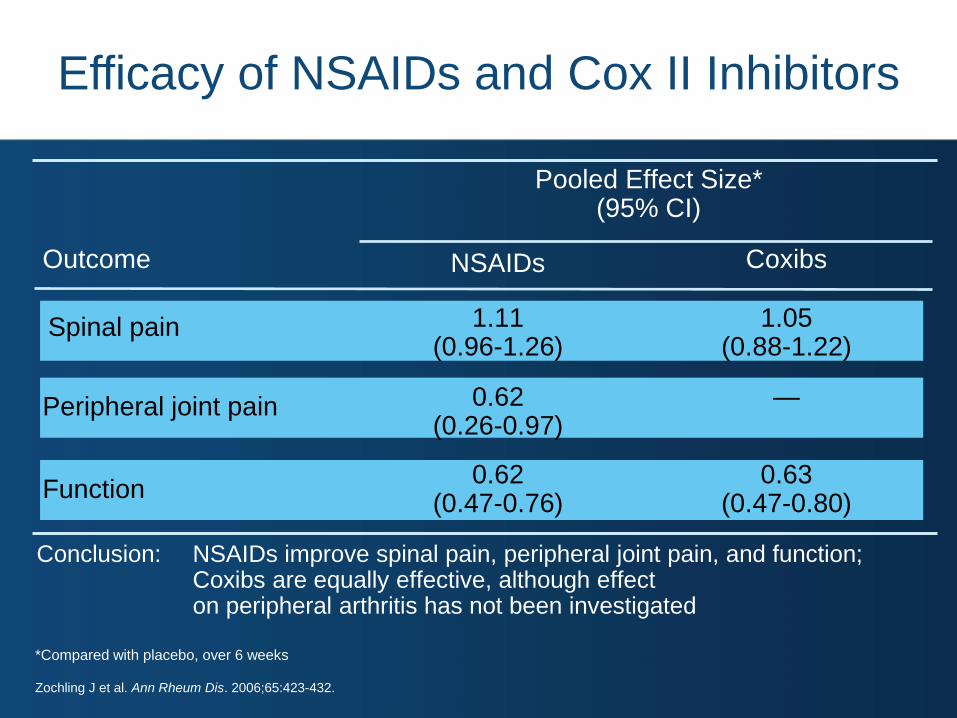
Efficacy of NSAIDs and Cox II Inhibitors
Pooled Effect Size* (95% CI)
Outcome NSAIDs Coxibs
Spinal pain 1.11 (0.96-1.26)
1.05 (0.88-1.22)
Peripheral joint pain 0.62 (0.26-0.97)
—
Function 0.62
(0.47-0.76) 0.63
(0.47-0.80)
Conclusion: NSAIDs improve spinal pain, peripheral joint pain, and function; Coxibs are equally effective, although effect on peripheral arthritis has not been investigated
*Compared with placebo, over 6 weeks
Zochling J et al. Ann Rheum Dis. 2006;65:423-432.
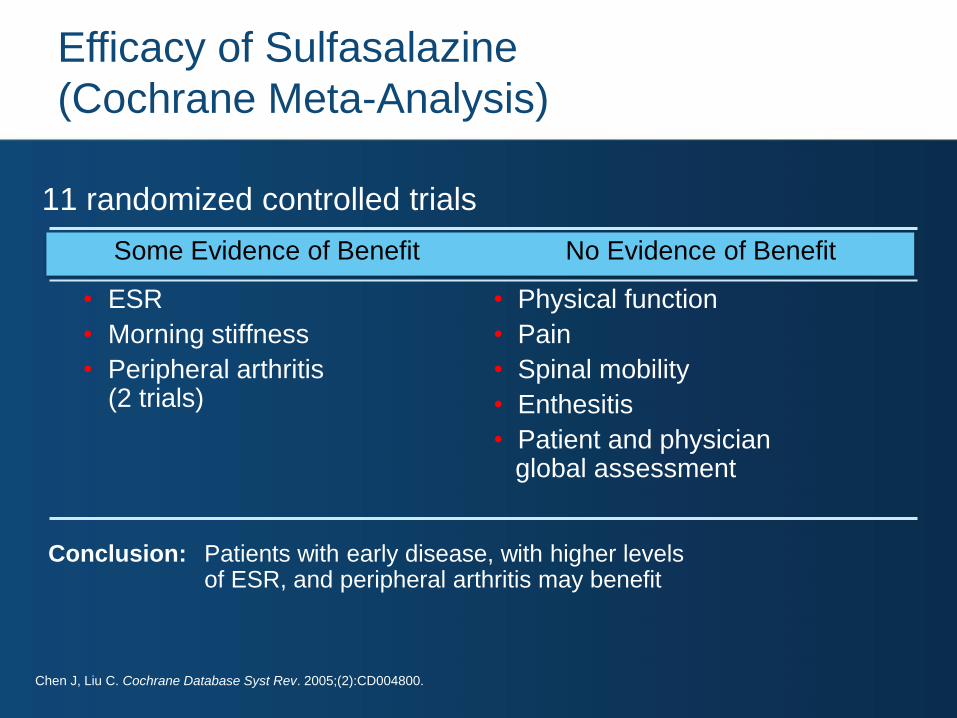
Efficacy of Sulfasalazine
(Cochrane Meta-Analysis)
Some Evidence of Benefit No Evidence of Benefit
• ESR
• Morning stiffness
• Peripheral arthritis (2 trials)
• Physical function
• Pain
• Spinal mobility
• Enthesitis
• Patient and physician global assessment
Conclusion: Patients with early disease, with higher levels of ESR, and peripheral arthritis may benefit
11 randomized controlled trials
Chen J, Liu C. Cochrane Database Syst Rev. 2005;(2):CD004800.

Response after 24 Weeks of TNF-alpha
Blocker Treatment in Ankylosing Spondylitis
0
10
20
30
40
50
60
Infliximab Placebo Etanercept Placebo Adalimumab Placebo
*Different studies, no head to head comparison
ASAS 40 ASAS 50 ASAS 40
%
van der Heijde et al, Arthritis Rheum 2005, 52: 582-91; Davis J et al, Arthritis Rheum. 2003, 48:3230-6;
van der Heijde et al, Arthritis Rheum 2006, 54:2136-46
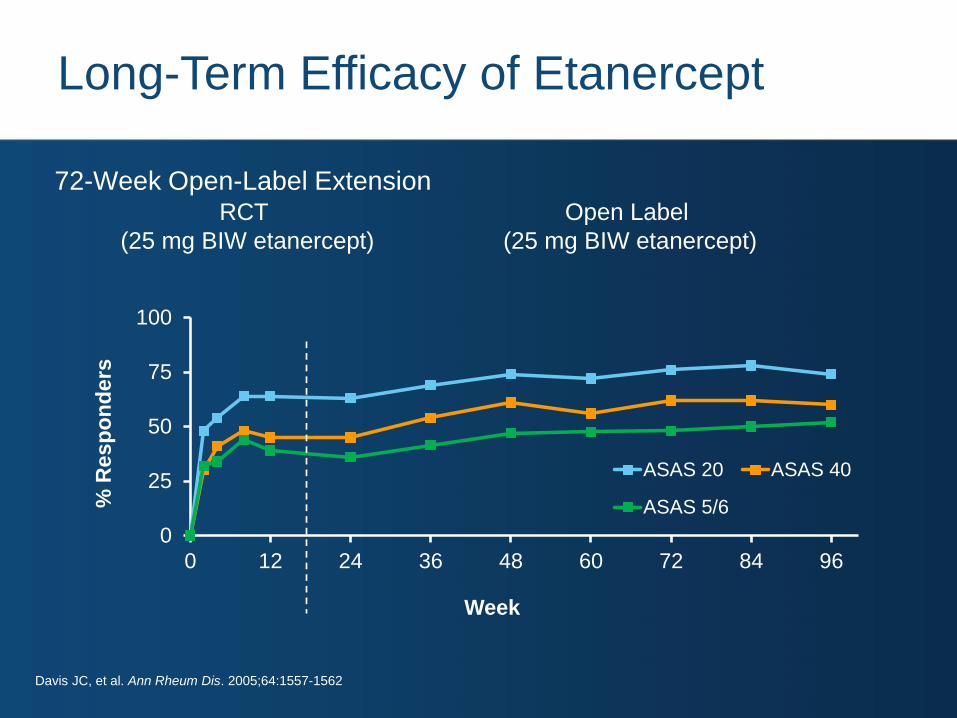
Long-Term Efficacy of Etanercept
0
25
50
75
100
0 12 24 36 48 60 72 84 96
% R
es
po
nd
ers
Week
ASAS 20 ASAS 40
ASAS 5/6
RCT
(25 mg BIW etanercept)
Open Label
(25 mg BIW etanercept)
72-Week Open-Label Extension
Davis JC, et al. Ann Rheum Dis. 2005;64:1557-1562

Golimumab in AS: Week 104
• Purpose
– To assess GLM efficacy and safety at week 104
• Methods
– 356 pts randomized to GLM 50 mg, GLM 100 mg, PBO (1.8:1.8:1)
– Primary end point at week 14 with early escape possible at week 16
– Placebo pts crossed to GLM 50 mg at week 24
– Patients receiving GLM 50 mg could be dose-escalated to 100 mg during f/u
• Results (Week 104)
• Conclusion
– Clinical improvements noted at week 24 persisted to week 104
– No new safety signals
– Patients who early-escaped from GLM 50 mg to GLM 100 mg at week 14 had a diminished
response on all parameters, identifying a subset of patients who are TNF unresponsive?
Braun J et al. ACR 2009, Philadelphia #1259
GLM 50 GLM 100
n 90 118
ASAS 20 (%) 77 (86) 91 (77)
ASAS 40 (%) 74 (82) 71 (60)
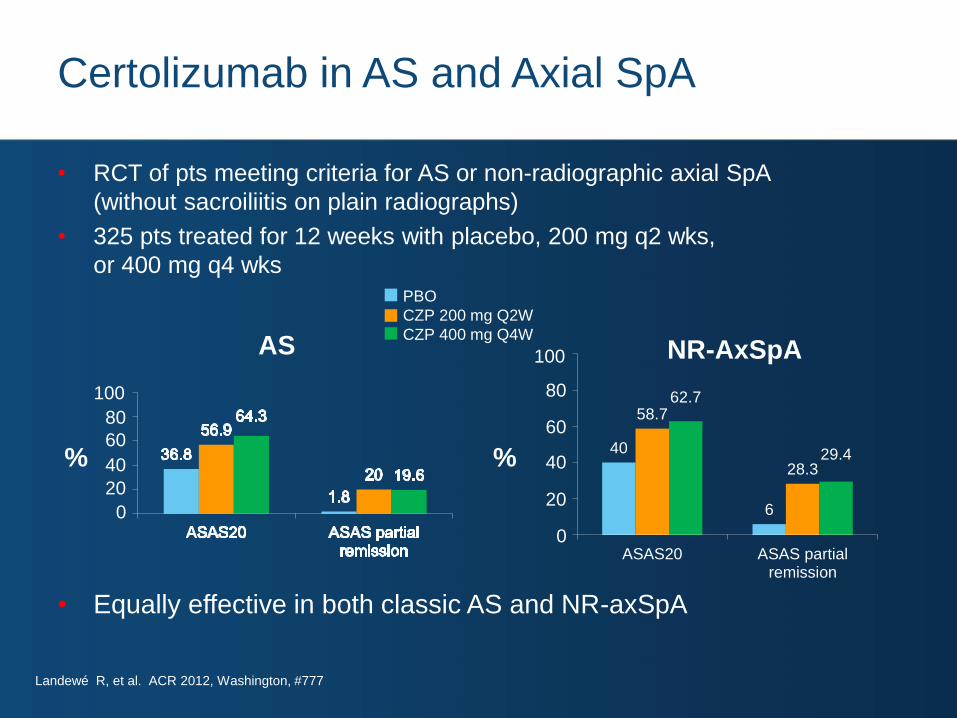
Certolizumab in AS and Axial SpA
• RCT of pts meeting criteria for AS or non-radiographic axial SpA
(without sacroiliitis on plain radiographs)
• 325 pts treated for 12 weeks with placebo, 200 mg q2 wks,
or 400 mg q4 wks
• Equally effective in both classic AS and NR-axSpA
40
6
58.7
28.3
62.7
29.4
ASAS20 ASAS partialremission
PBO
CZP 200 mg Q2W
CZP 400 mg Q4W AS NR-AxSpA
% %
Landewé R, et al. ACR 2012, Washington, #777
20
40
60
80
100
0 20
40
60
80
100
0
Adalimumab in Axial SpA
• RCT of 195 pts meeting criteria for axial SpA
• Treatment with placebo vs. adalimumab 40 mg eow
0
10
20
3031 31
37
Placebo (N=94)
Adalimumab (N=91)
35
13
1915
6
ASAS20
% P
atie
nts
ASAS5/6 ASDASCII ASDAS MI BASDAI50
3
52
A
40
50
60
70
80
Sieper J, et al. Ann Rheum Dis 2012, online ahead of print.

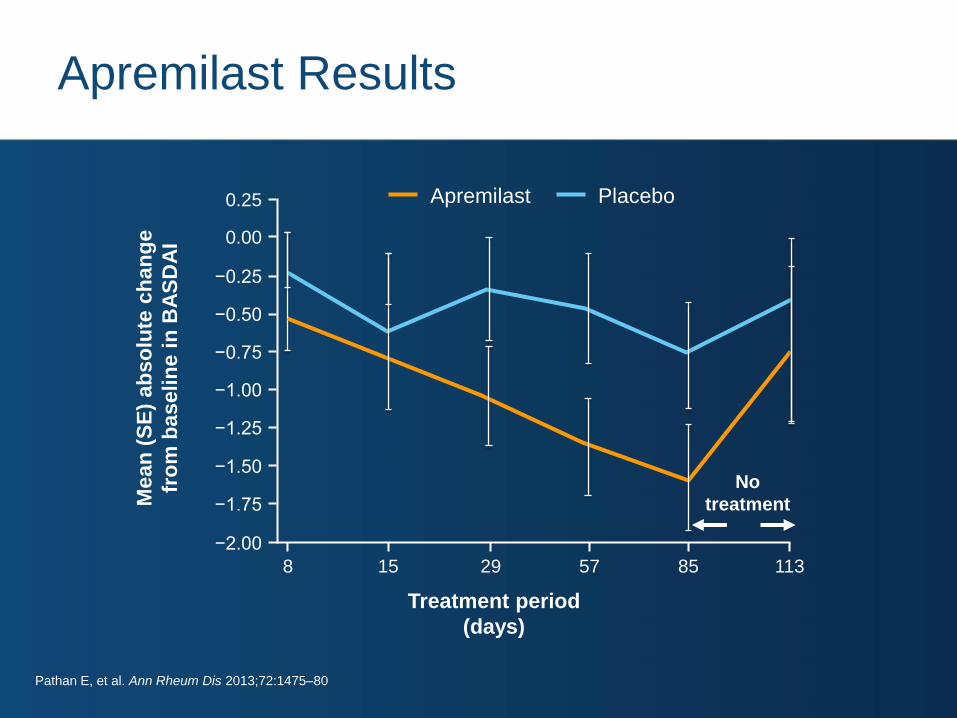
Apremilast pilot in AS
Pathan E, et al. Ann Rheum Dis 2013;72:1475–80
START Study Design Pilot Study Investigating Co-primary Clinical and MRI Endpoints (N=38)
Placebo tablets BID
Follow-up
Apremilast tablets 10 mg BID, days 1-2
Apremilast tablets 20 mg BID, days 3-4
Apremilast tablets 30 mg BID, days 5-end
Active AS
patients
Random
ise
Screening 2 weeks Dose 12 weeks 4 weeks
85 57 29 15 8 1 113
Clinical assessments
Days
Imaging assessments
Treatment period
(days)
Mean
(S
E)
ab
so
lute
ch
an
ge
fro
m b
aselin
e i
n B
AS
DA
I
Apremilast Placebo
0.00
No
treatment
8 15 29 57 85 113
0.25
−0.25
−0.50
−0.75
−1.00
−1.25
−1.50
−1.75
−2.00
Apremilast Results
Pathan E, et al. Ann Rheum Dis 2013;72:1475–80
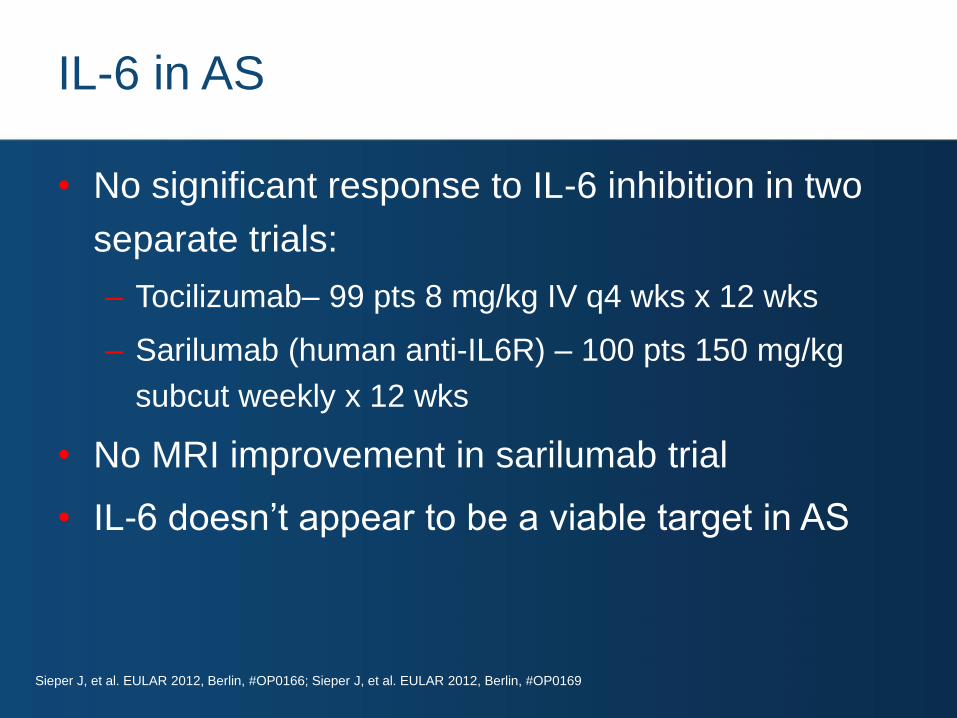
IL-6 in AS
Sieper J, et al. EULAR 2012, Berlin, #OP0166; Sieper J, et al. EULAR 2012, Berlin, #OP0169
• No significant response to IL-6 inhibition in two
separate trials:
– Tocilizumab– 99 pts 8 mg/kg IV q4 wks x 12 wks
– Sarilumab (human anti-IL6R) – 100 pts 150 mg/kg
subcut weekly x 12 wks
• No MRI improvement in sarilumab trial
• IL-6 doesn’t appear to be a viable target in AS
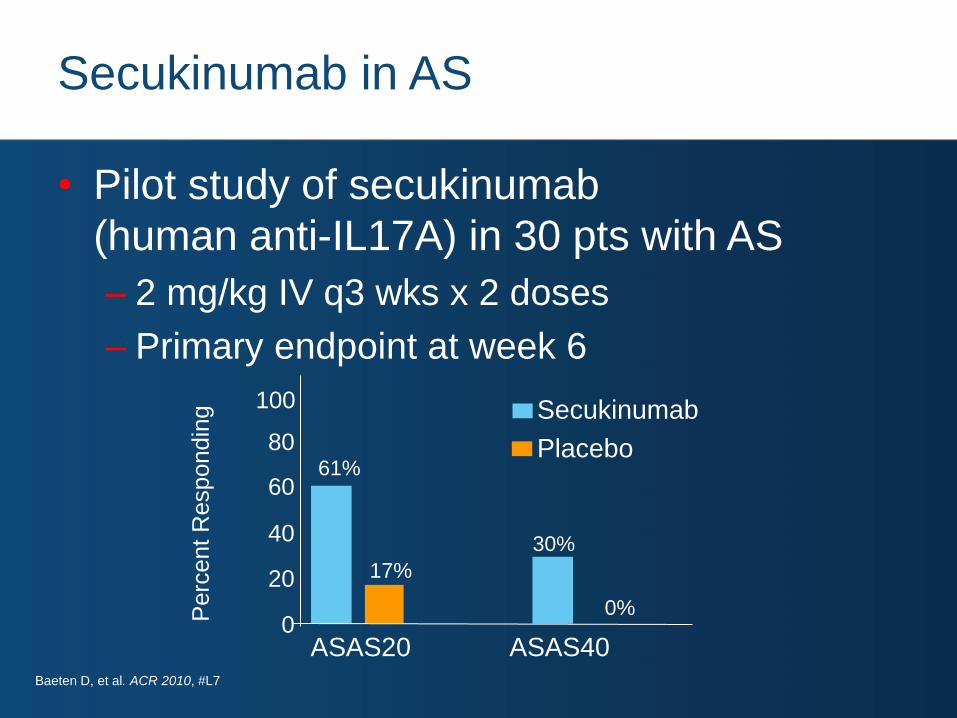
Secukinumab in AS
• Pilot study of secukinumab
(human anti-IL17A) in 30 pts with AS
– 2 mg/kg IV q3 wks x 2 doses
– Primary endpoint at week 6
Placebo
Secukinumab
80
60
40
20
0 ASAS20 ASAS40
Perc
ent
Respondin
g
61%
17%
30%
0%
100
Baeten D, et al. ACR 2010, #L7
Secukinumab Phase III AS
• Human anti-interleukin 17A antibody
• 2 pivotal trials, 1 IV load, 1 all subcut
– Doses 75 mg, 150 mg, q4wks
• Primary endpoint 16 weeks
– Open label extension to 52 weeks
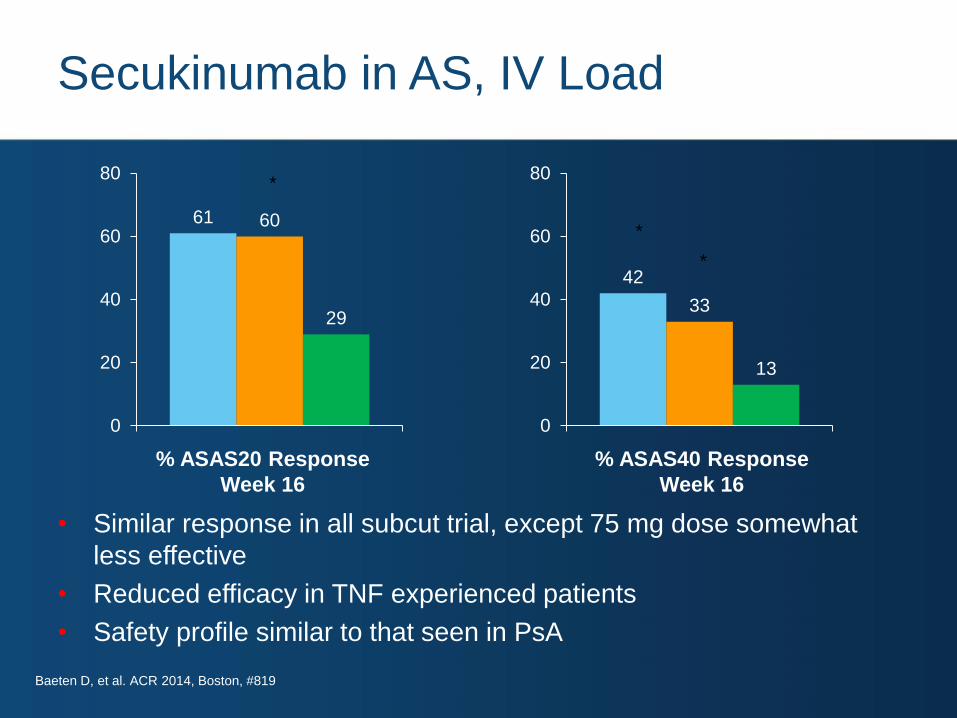
Secukinumab in AS, IV Load
• Similar response in all subcut trial, except 75 mg dose somewhat
less effective
• Reduced efficacy in TNF experienced patients
• Safety profile similar to that seen in PsA
61 60
29
0
20
40
60
80*
42
33
13
0
20
40
60
80
*
*
% ASAS20 Response
Week 16
% ASAS40 Response
Week 16
Baeten D, et al. ACR 2014, Boston, #819

Are TNFi ‘Disease Modifying’ in AS?
• TNFi do not prevent
‘osteoproliferation’ in
established AS
• “Damage” in AS is both,
‘catabolic + anabolic’ (erosions
+ new bone formation)
• Could starting TNFi early
(in ‘nr axial SpA’ stage)
prevent osteoproliferation?
• Do they reduce rate of erosion
progression?
SPARTAN-GRAPPA Educational Symposium
0.9 0.9
0.8
1
0
0.2
0.4
0.6
0.8
1
1.2
Eta
nerc
ept
Inflixim
ab
Ada
limum
ab
OASIS
mSASSS Over 2 years Change in
Three separate trials, not head-to-head Van der Heijde et. Al. Arthritis Rheum. 2008 May;58(5):1324-31.
Van der Heijde et.al. Arthritis Rheum. 2008 Oct;58(10):3063-70.
Van der Heijde et al. Arthritis Res Ther. 2009;11(4):R127. Epub 2009 Aug 24
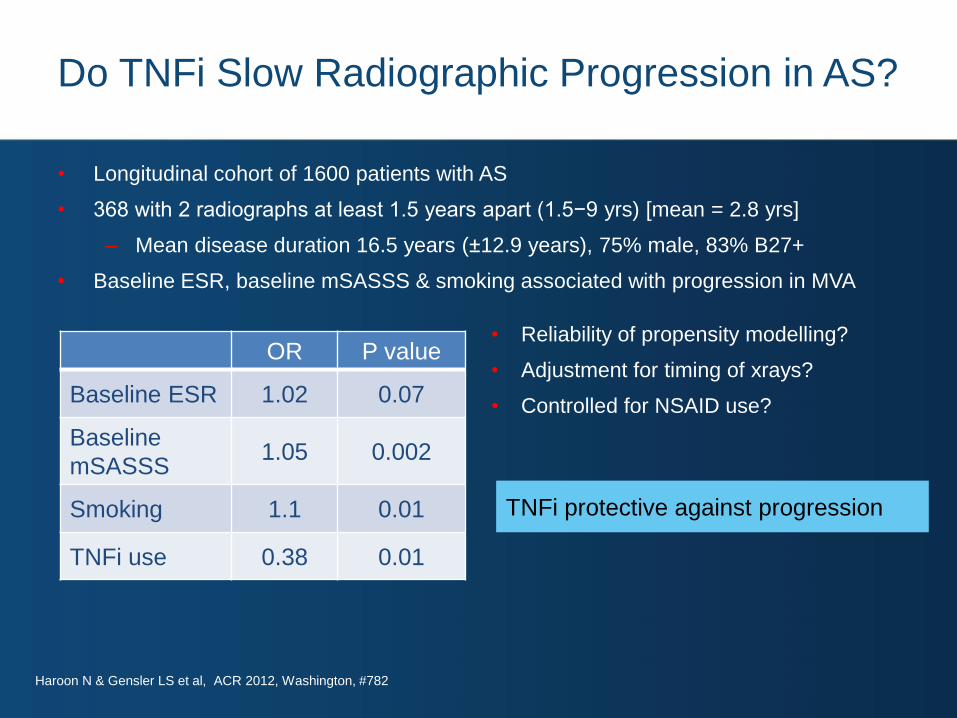
Do TNFi Slow Radiographic Progression in AS?
• Longitudinal cohort of 1600 patients with AS
• 368 with 2 radiographs at least 1.5 years apart (1.5−9 yrs) [mean = 2.8 yrs]
– Mean disease duration 16.5 years (±12.9 years), 75% male, 83% B27+
• Baseline ESR, baseline mSASSS & smoking associated with progression in MVA
TNFi protective against progression
• Reliability of propensity modelling?
• Adjustment for timing of xrays?
• Controlled for NSAID use?
Haroon N & Gensler LS et al, ACR 2012, Washington, #782
OR P value
Baseline ESR 1.02 0.07
Baseline
mSASSS 1.05 0.002
Smoking 1.1 0.01
TNFi use 0.38 0.01
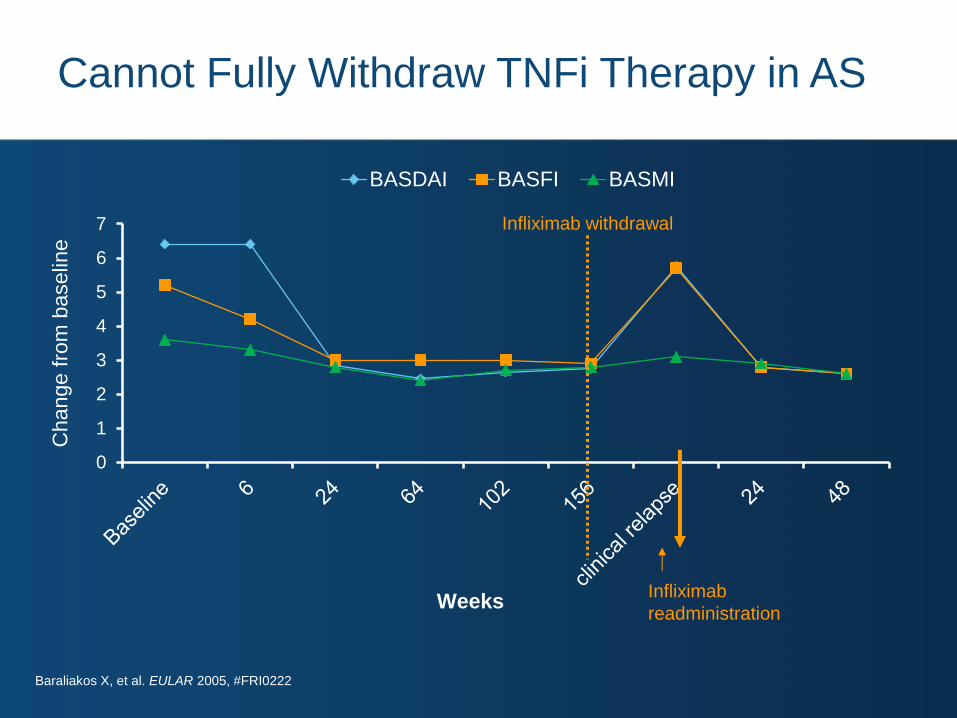
Cannot Fully Withdraw TNFi Therapy in AS
0
1
2
3
4
5
6
7
Change f
rom
baselin
e
BASDAI BASFI BASMI
Infliximab withdrawal
Infliximab
readministration Weeks
Baraliakos X, et al. EULAR 2005, #FRI0222
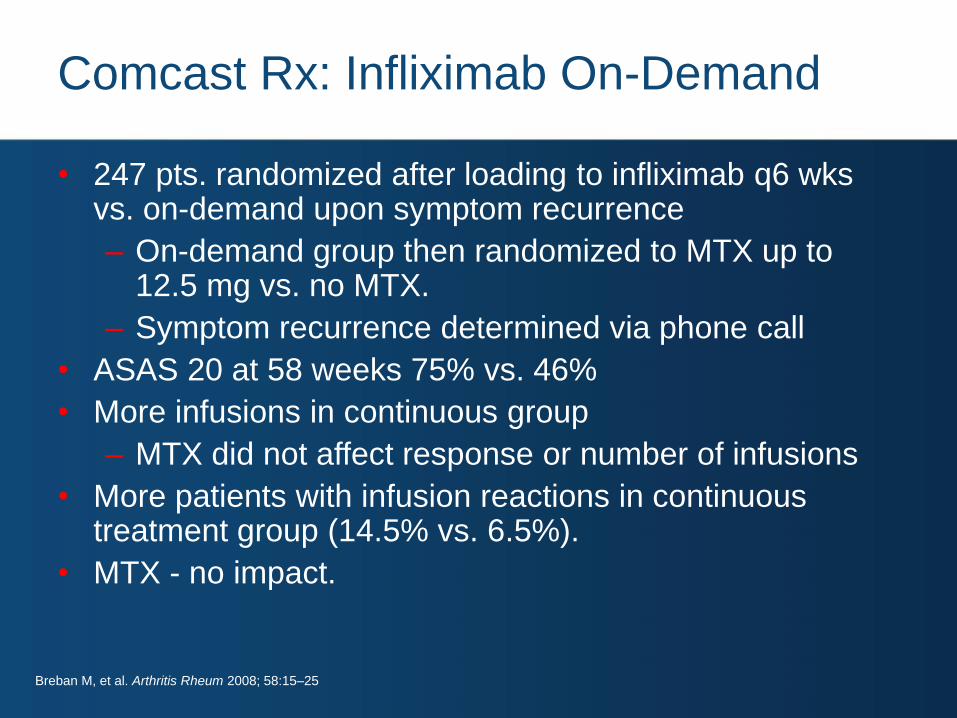
Comcast Rx: Infliximab On-Demand
• 247 pts. randomized after loading to infliximab q6 wks vs. on-demand upon symptom recurrence
– On-demand group then randomized to MTX up to 12.5 mg vs. no MTX.
– Symptom recurrence determined via phone call
• ASAS 20 at 58 weeks 75% vs. 46%
• More infusions in continuous group
– MTX did not affect response or number of infusions
• More patients with infusion reactions in continuous treatment group (14.5% vs. 6.5%).
• MTX - no impact.
Breban M, et al. Arthritis Rheum 2008; 58:15–25
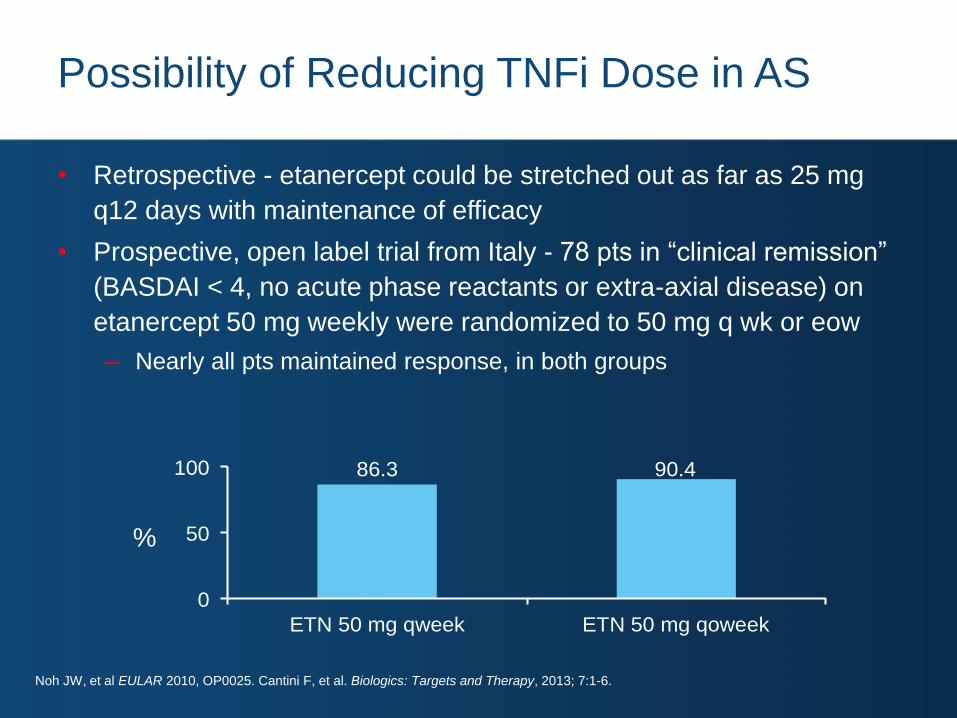
Possibility of Reducing TNFi Dose in AS
86.3 90.4
0
50
100
ETN 50 mg qweek ETN 50 mg qoweek
%
Noh JW, et al EULAR 2010, OP0025. Cantini F, et al. Biologics: Targets and Therapy, 2013; 7:1-6.
• Retrospective - etanercept could be stretched out as far as 25 mg
q12 days with maintenance of efficacy
• Prospective, open label trial from Italy - 78 pts in “clinical remission”
(BASDAI < 4, no acute phase reactants or extra-axial disease) on
etanercept 50 mg weekly were randomized to 50 mg q wk or eow
– Nearly all pts maintained response, in both groups
Conclusions
• PsA, AS and other spondyloarthropathies are
joint, enthesial, and skin inflammatory diseases
with distinctive clinical presentations and
extra-articular manifestations
• Traditional DMARDs may be effective for
peripheral disease, but no apparent effectiveness
in axial disease
• Current biologics may not slow progression,
but there is interest in targets that may
Conclusions (cont.)
• Anti-TNF agents have demonstrated efficacy for
treating multiple clinical domains of PsA, AS,
axial, and peripheral SpA
• Ongoing research is examining additional
targets, such as IL-17, for treating incomplete
responders to anti-TNF inhibitors
• The new axial and peripheral SpA criteria expand
the patient base for whom emerging therapies
will be assessed