Annual Review 2015 - Nissin Kogyo ar 2015.pdf · Annual Review 2015 For the year ended March 31 ......
16
NISSIN KOGYO CO., LTD. Annual Review 2015 For the year ended March 31, 2015
Transcript of Annual Review 2015 - Nissin Kogyo ar 2015.pdf · Annual Review 2015 For the year ended March 31 ......

NISSIN KOGYO CO., LTD.
Annual Review 2015For the year ended March 31, 2015

14 1511 12 130
60,000
120,000
180,000
240,000
0
6,000
12,000
18,000
24,000
14 1511 12 130
5,000
10,000
15,000
14 1511 12 130
100,000
50,000
150,000
200,000
Financial HighlightsNissin Kogyo Co., Ltd. and Consolidated Subsidiaries Years ended March 31, 2014 and 2015
Contents
00 Financial Highlights
01 Message from the President
02 New Adoptions of Our Products
04 Corporate Governance
05 Environmental Policies
06 Financial Review
08 Consolidated Balance Sheets (Unaudited)
Consolidated Statements of Changes in Net Assets (Unaudited)
10 Consolidated Statements of Income (Unaudited)
Consolidated Statements of Comprehensive Income (Unaudited)
11 Consolidated Statements of Cash Flows (Unaudited)
12 Network
13 Corporate Data
Net Sales/Operating Income(¥ millions)
Total Assets/Net Assets(¥ millions)
Net Income(¥ millions)
Total Assets Net Assets
Net Sales (left scale) Operating Income (right scale)
Millions of yenThousands of
U.S. dollars
2014 2015 2015
For the year:
Net sales ¥220,868 ¥227,836 $1,895,947
Operating income 19,417 17,584 146,326
Income before income taxes and minority interests 21,845 19,995 166,389
Net income 12,200 10,446 86,927
At year-end:
Total assets ¥177,540 ¥199,171 $1,657,410
Net assets 129,591 148,844 1,238,612
Per share (yen and U.S. dollars):
Net income—primary ¥ 188.14 ¥ 160.93 $ 1.34
Cash dividends paid 40.00 40.00 0.33
Note: U.S. dollar amounts have been translated from yen for convenience only, at the rate of ¥120.17=U.S.$1, the approximate Tokyo foreign exchange market rate as of March 31, 2015.
Annual Review 2015 1
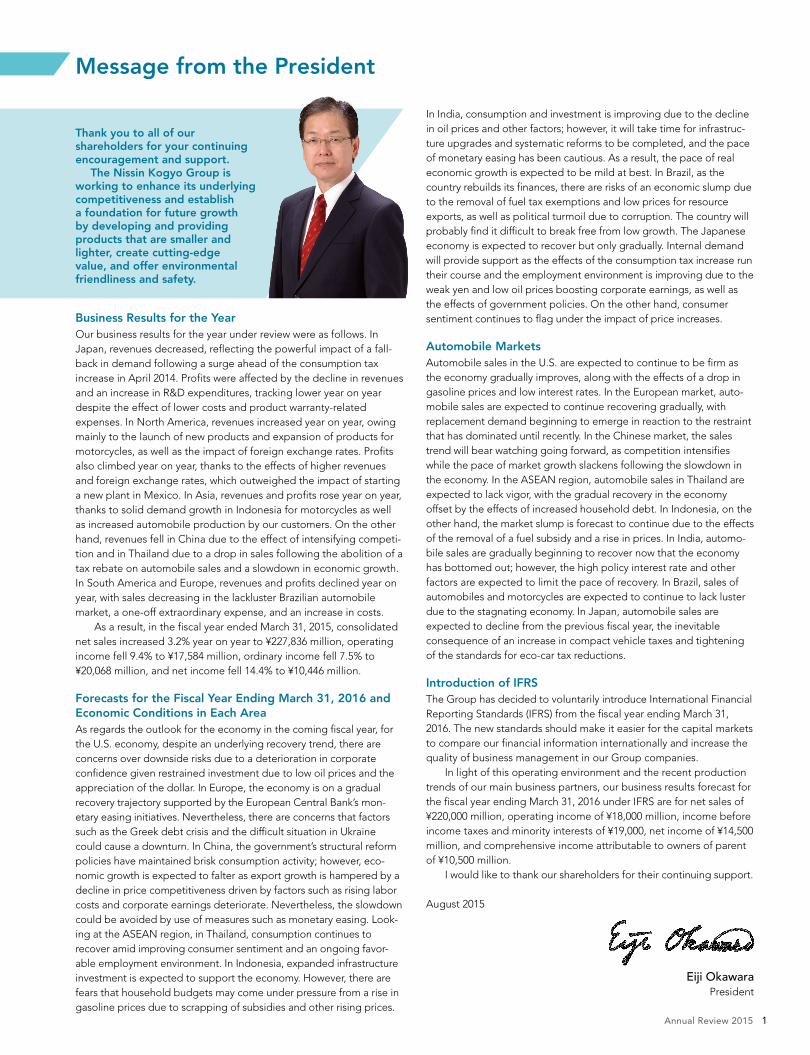
Message from the President
Thank you to all of our shareholders for your continuing encouragement and support.
The Nissin Kogyo Group is working to enhance its underlying competitiveness and establish a foundation for future growth by developing and providing products that are smaller and lighter, create cutting-edge value, and offer environmental friendliness and safety.
Business Results for the YearOur business results for the year under review were as follows. In Japan, revenues decreased, reflecting the powerful impact of a fall-back in demand following a surge ahead of the consumption tax increase in April 2014. Profits were affected by the decline in revenues and an increase in R&D expenditures, tracking lower year on year despite the effect of lower costs and product warranty-related expenses. In North America, revenues increased year on year, owing mainly to the launch of new products and expansion of products for motorcycles, as well as the impact of foreign exchange rates. Profits also climbed year on year, thanks to the effects of higher revenues and foreign exchange rates, which outweighed the impact of starting a new plant in Mexico. In Asia, revenues and profits rose year on year, thanks to solid demand growth in Indonesia for motorcycles as well as increased auto mobile production by our customers. On the other hand, revenues fell in China due to the effect of intensifying competi-tion and in Thailand due to a drop in sales following the abolition of a tax rebate on automobile sales and a slowdown in economic growth. In South America and Europe, revenues and profits declined year on year, with sales decreasing in the lackluster Brazilian automobile market, a one-off extraordinary expense, and an increase in costs.
As a result, in the fiscal year ended March 31, 2015, consolidated net sales increased 3.2% year on year to ¥227,836 million, operating income fell 9.4% to ¥17,584 million, ordinary income fell 7.5% to ¥20,068 million, and net income fell 14.4% to ¥10,446 million.
Forecasts for the Fiscal Year Ending March 31, 2016 and Economic Conditions in Each AreaAs regards the outlook for the economy in the coming fiscal year, for the U.S. economy, despite an underlying recovery trend, there are concerns over downside risks due to a deterioration in corporate confidence given restrained investment due to low oil prices and the appreciation of the dollar. In Europe, the economy is on a gradual recovery trajectory supported by the European Central Bank’s mon-etary easing initiatives. Nevertheless, there are concerns that factors such as the Greek debt crisis and the difficult situation in Ukraine could cause a downturn. In China, the government’s structural reform policies have maintained brisk consumption activity; however, eco-nomic growth is expected to falter as export growth is hampered by a decline in price competitiveness driven by factors such as rising labor costs and corporate earnings deteriorate. Nevertheless, the slowdown could be avoided by use of measures such as monetary easing. Look-ing at the ASEAN region, in Thailand, consumption continues to recover amid improving consumer sentiment and an ongoing favor-able employment environment. In Indonesia, expanded infrastructure investment is expected to support the economy. However, there are fears that household budgets may come under pressure from a rise in gasoline prices due to scrapping of subsidies and other rising prices.
In India, consumption and investment is improving due to the decline in oil prices and other factors; however, it will take time for infrastruc-ture upgrades and systematic reforms to be completed, and the pace of monetary easing has been cautious. As a result, the pace of real economic growth is expected to be mild at best. In Brazil, as the country rebuilds its finances, there are risks of an economic slump due to the removal of fuel tax exemptions and low prices for resource exports, as well as political turmoil due to corruption. The country will probably find it difficult to break free from low growth. The Japanese economy is expected to recover but only gradually. Internal demand will provide support as the effects of the consumption tax increase run their course and the employment environment is improving due to the weak yen and low oil prices boosting corporate earnings, as well as the effects of government policies. On the other hand, consumer sentiment continues to flag under the impact of price increases.
Automobile MarketsAutomobile sales in the U.S. are expected to continue to be firm as the economy gradually improves, along with the effects of a drop in gasoline prices and low interest rates. In the European market, auto-mobile sales are expected to continue recovering gradually, with replacement demand beginning to emerge in reaction to the restraint that has dominated until recently. In the Chinese market, the sales trend will bear watching going forward, as competition intensifies while the pace of market growth slackens following the slowdown in the economy. In the ASEAN region, automobile sales in Thailand are expected to lack vigor, with the gradual recovery in the economy offset by the effects of increased household debt. In Indonesia, on the other hand, the market slump is forecast to continue due to the effects of the removal of a fuel subsidy and a rise in prices. In India, automo-bile sales are gradually beginning to recover now that the economy has bottomed out; however, the high policy interest rate and other factors are expected to limit the pace of recovery. In Brazil, sales of automobiles and motorcycles are expected to continue to lack luster due to the stagnating economy. In Japan, automobile sales are expected to decline from the previous fiscal year, the inevitable consequence of an increase in compact vehicle taxes and tightening of the standards for eco-car tax reductions.
Introduction of IFRSThe Group has decided to voluntarily introduce International Financial Reporting Standards (IFRS) from the fiscal year ending March 31, 2016. The new standards should make it easier for the capital markets to compare our financial information internationally and increase the quality of business management in our Group companies.
In light of this operating environment and the recent production trends of our main business partners, our business results forecast for the fiscal year ending March 31, 2016 under IFRS are for net sales of ¥220,000 million, operating income of ¥18,000 million, income before income taxes and minority interests of ¥19,000, net income of ¥14,500 million, and comprehensive income attributable to owners of parent of ¥10,500 million.
I would like to thank our shareholders for their continuing support.
August 2015
Eiji OkawaraPresident

2 Nissin Kogyo Co., Ltd.
Honda’s Grace and Jade models employ our regenerative cooperative
brake systems, which improve cars’ fuel economy.
The Nissin Kogyo Group constantly strives to keep one step ahead of changes in the world by conducting research and development activities in order to create new product families that can contribute to safety and envi-ronmental performance, while meeting the needs of customers and society. In Japan, Group efforts are centered on basic brake and mechatronics auto-mated control systems and aluminum products, primarily for motorcycles and automobiles. In these areas, we aim to
reduce weight, improve fuel efficiency, and develop products that contribute to better safety and comfort, as well as develop materials and manufacturing processes, all from a global perspec-tive. We are also responding to needs related to achieving a low-carbon soci-ety by developing products, materials and manufacturing processes that can help to reduce CO2 emissions.
We are enhancing our research and development platform to advance these activities more quickly.
Research and Development Activities
Automobile Business
Regenerative cooperative brake: TMOC
Regenerative cooperative brake: BOS
Grace
Jade
New Adoptions of Our ProductsThrough its aluminum-weight-reduction and braking system technologies, Nissin Kogyo makes significant contributions to motorized society in terms of both environmental performance and safety.

Annual Review 2015 3
Aluminum casting products from Nissin Brake
Vietnam Co., Ltd. have been incorporated in
the Honda Tact.
R&D Expenditures/ Ratio to Net Sales(¥ millions/%)
R&D Expenditures (left scale)Ratio to Net Sales (right scale)
Specifically, as a form of computerized assessment, we are working on development initiatives utilizing CAE analysis (strength, action confirmation, casting defects, brake screeching, etc.) and simulation technology (ABS using HILS and ESC program diagnostics).
In North America, we are develop-ing basic brake systems, mechatronics automated control systems and alumi-num products tailored to the needs of regional customers and society. In tandem, we are conducting market
surveys to identify needs and trends in this region.
Nissin Kogyo’s Development Division is the key driver of the Group’s research and development. R&D expenditures in the year under review were ¥8,605 million; by geographic segment, Japan accounted for ¥8,021 million and North America for ¥584 million.
Motorcycle Business
1511 12 13 140
3,000
6,000
9,000
0
3.0
6.0
9.0
Front panel brake assembly
LeverRear brake shoe set
Holder
Bracket assembly for interlocking brake
Cylinder head cover
Aluminum casting products
Tact

The Corporate Governance Structure(As of June 15, 2015)
Board of Directors
Compliance Committee Corporate Ethics Improvement Proposal OfficeBoard of Auditors
Management Committee
Business Management Division
Production and Purchasing Division
Development Division
Quality Assurance Department
Marketing Division
Internal Auditing Office
LocalBases
4 Nissin Kogyo Co., Ltd.
Overview of Nissin Kogyo’s Organization and Development of Internal Control Systems
Nissin Kogyo’s Board of Directors comprises 10 directors, and its role is to deliberate upon legal matters and major
management issues. The Management Committee comprises 9 directors, and its role is to conduct prior deliberation
on matters to be brought up for discussion in the Board of Directors meetings, as well as to sufficiently deliberate upon
important matters of management, share management issues and decide upon measures to solve those issues.
Nissin Kogyo has a Board of Auditors in accordance with the Companies Act. The Board of Auditors comprises four
corporate auditors, two of whom are outside auditors. Corporate auditors attend meetings of the Board of Directors
and the Management Committee, and it is their job to audit the status of management’s execution of duties.
The Internal Auditing Office appoints five full-time corporate auditors and concurrent corporate auditors elected
from the accounting field to form an Independent Operation Auditing Department. The job of this department is to
provide support in the execution of internal auditing and to respond to requests from corporate auditors. In internal
auditing, the Internal Auditing Office conducts audits of all domestic divisions on a twice-yearly basis, along with
conducting regular audits of overseas bases.
The system for execution of operations is modeled on a high standard of effectiveness and efficiency and utilizes
the cooperation of the four headquarters and overseas bases.
Basic PhilosophyThe Group implements corporate governance based on its guidelines and rules of conduct, including its basic principle,
“Rich in spirit. A company that contributes,” and its mission statement, “Always stay ahead of changes in the world and
provide superior products, technologies and ideas to meet the needs of customers and society.”
ClassificationTotal compensation paid
(Millions of yen)
Total compensation paid by type (Millions of yen) Number of recipients (Persons)Basic compensation Bonus
Directors 321 266 55 11
Corporate auditors (Excluding outside corporate auditors)
47 37 10 2
Outside director and corporate auditors 6 6 — 3
Details of Director and Corporate Auditor Remuneration
Corporate Governance
Annual Review 2015 5
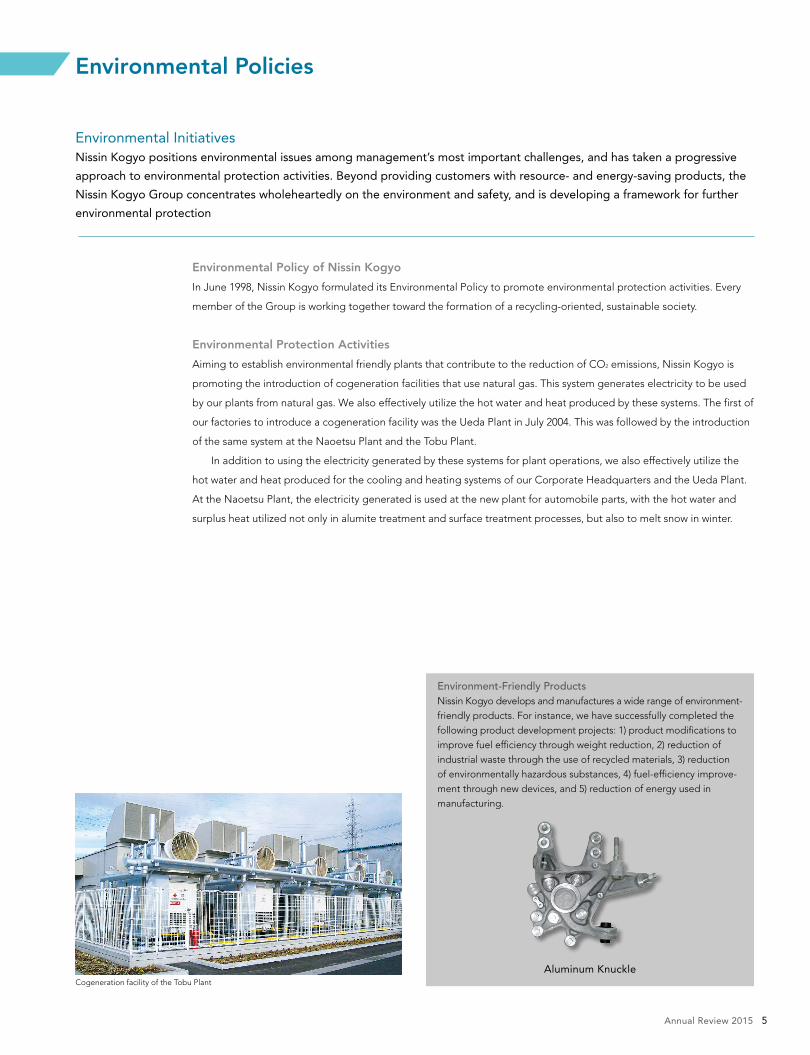
Environmental Policy of Nissin Kogyo
In June 1998, Nissin Kogyo formulated its Environmental Policy to promote environmental protection activities. Every
member of the Group is working together toward the formation of a recycling-oriented, sustainable society.
Environmental Protection Activities
Aiming to establish environmental friendly plants that contribute to the reduction of CO2 emissions, Nissin Kogyo is
promoting the introduction of cogeneration facilities that use natural gas. This system generates electricity to be used
by our plants from natural gas. We also effectively utilize the hot water and heat produced by these systems. The first of
our factories to introduce a cogeneration facility was the Ueda Plant in July 2004. This was followed by the introduction
of the same system at the Naoetsu Plant and the Tobu Plant.
In addition to using the electricity generated by these systems for plant operations, we also effectively utilize the
hot water and heat produced for the cooling and heating systems of our Corporate Headquarters and the Ueda Plant.
At the Naoetsu Plant, the electricity generated is used at the new plant for automobile parts, with the hot water and
surplus heat utilized not only in alumite treatment and surface treatment processes, but also to melt snow in winter.
Environmental InitiativesNissin Kogyo positions environmental issues among management’s most important challenges, and has taken a progressive
approach to environmental protection activities. Beyond providing customers with resource- and energy-saving products, the
Nissin Kogyo Group concentrates wholeheartedly on the environment and safety, and is developing a framework for further
environmental protection
Cogeneration facility of the Tobu Plant
Environment-Friendly ProductsNissin Kogyo develops and manufactures a wide range of environment-friendly products. For instance, we have successfully completed the following product development projects: 1) product modifications to improve fuel efficiency through weight reduction, 2) reduction of industrial waste through the use of recycled materials, 3) reduction of environmentally hazardous substances, 4) fuel-efficiency improve-ment through new devices, and 5) reduction of energy used in manufacturing.
Aluminum Knuckle
Environmental Policies
1511 12 13 140
50
100
150
200
1511 12 13 140
50,000
100,000
150,000
200,000
250,000
1511 12 13 140
3,000
6,000
9,000
12,000
15,000
0
10,000
5,000
15,000
20,000
25,000
6 Nissin Kogyo Co., Ltd.
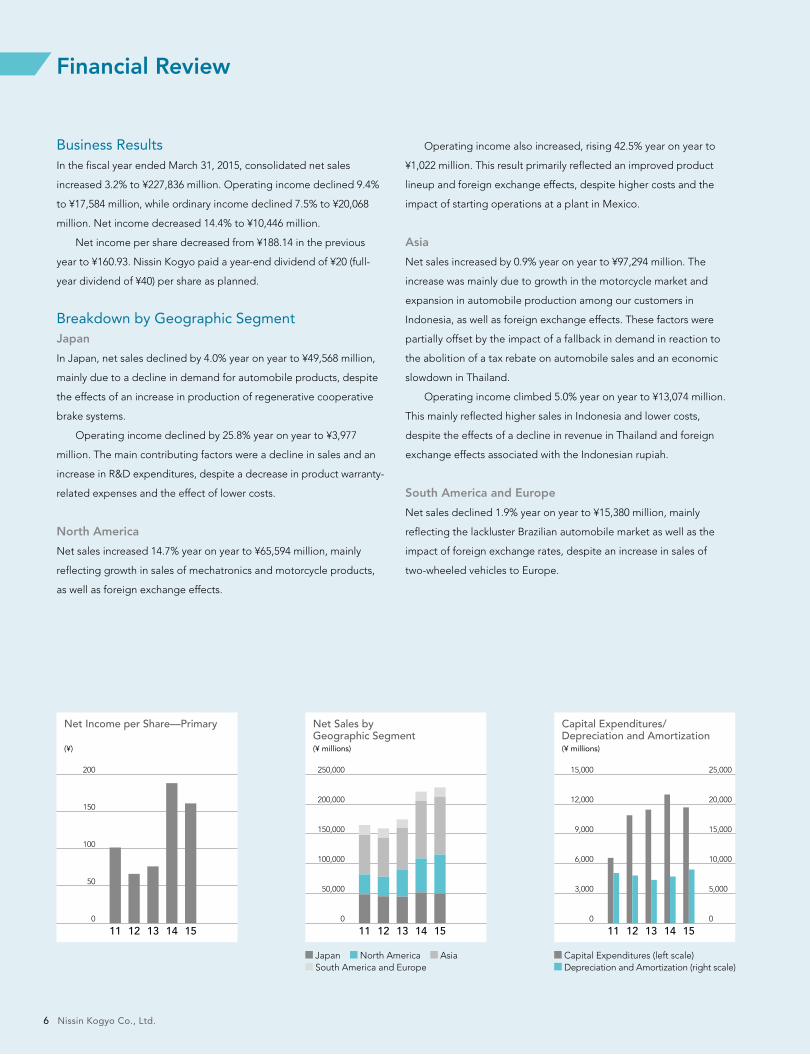
Business ResultsIn the fiscal year ended March 31, 2015, consolidated net sales
increased 3.2% to ¥227,836 million. Operating income declined 9.4%
to ¥17,584 million, while ordinary income declined 7.5% to ¥20,068
million. Net income decreased 14.4% to ¥10,446 million.
Net income per share decreased from ¥188.14 in the previous
year to ¥160.93. Nissin Kogyo paid a year-end dividend of ¥20 (full-
year dividend of ¥40) per share as planned.
Breakdown by Geographic SegmentJapan
In Japan, net sales declined by 4.0% year on year to ¥49,568 million,
mainly due to a decline in demand for automobile products, despite
the effects of an increase in production of regenerative cooperative
brake systems.
Operating income declined by 25.8% year on year to ¥3,977
million. The main contributing factors were a decline in sales and an
increase in R&D expenditures, despite a decrease in product warranty-
related expenses and the effect of lower costs.
North America
Net sales increased 14.7% year on year to ¥65,594 million, mainly
reflecting growth in sales of mechatronics and motorcycle products,
as well as foreign exchange effects.
Operating income also increased, rising 42.5% year on year to
¥1,022 million. This result primarily reflected an improved product
lineup and foreign exchange effects, despite higher costs and the
impact of starting operations at a plant in Mexico.
Asia
Net sales increased by 0.9% year on year to ¥97,294 million. The
increase was mainly due to growth in the motorcycle market and
expansion in automobile production among our customers in
Indonesia, as well as foreign exchange effects. These factors were
partially offset by the impact of a fallback in demand in reaction to
the abolition of a tax rebate on automobile sales and an economic
slowdown in Thailand.
Operating income climbed 5.0% year on year to ¥13,074 million.
This mainly reflected higher sales in Indonesia and lower costs,
despite the effects of a decline in revenue in Thailand and foreign
exchange effects associated with the Indonesian rupiah.
South America and Europe
Net sales declined 1.9% year on year to ¥15,380 million, mainly
reflecting the lackluster Brazilian automobile market as well as the
impact of foreign exchange rates, despite an increase in sales of
two-wheeled vehicles to Europe.
Net Income per Share—Primary (¥)
Net Sales by Geographic Segment(¥ millions)
Capital Expenditures/Depreciation and Amortization(¥ millions)
Japan North America Asia South America and Europe
Capital Expenditures (left scale) Depreciation and Amortization (right scale)
Financial Review

1511 12 13 140
40
20
60
80
100
1511 12 13 140
5
10
15
1511 12 13 14–20,000
–10,000
0
10,000
20,000
30,000
Annual Review 2015 7
Operating loss was ¥336 million, a decline of ¥933 million from
operating income recorded in the previous fiscal year. The main
factors were a one-off extraordinary expense and an increase in costs.
Capital ExpendituresThe Nissin Kogyo Group makes investments primarily to augment
production capacity, reform business structure, conduct R&D, and
launch new products in business segments where longer-term growth
is anticipated. Capital expenditures in the year under review were
¥11,658 million. During the fiscal year under review, the Company sold
a factory site in Tomi City, Nagano Prefecture for ¥1,326 million.
Financial PositionCurrent assets as of March 31, 2015 were up ¥14,593 million from the
previous fiscal year-end to ¥114,744 million, primarily due to an
increase in cash and bank deposits. Non-current assets were up
¥7,038 million from the previous fiscal year-end to ¥84,427 million,
mainly due to an increase in property, plant and equipment. As a
result, total assets at the fiscal year-end came to ¥199,171 million, up
¥21,631 million from the previous fiscal year-end.
Current liabilities were up ¥161 million from the previous fiscal
year-end to ¥40,159 million. Long-term liabilities were up ¥2,217
million to ¥10,169 million from the previous fiscal year-end, mainly due
to an increase in reserve for retirement benefits. As a result, total liabili-
ties were ¥50,327 million, an increase of ¥2,379 million from the previ-
ous fiscal year-end.
Net assets were up ¥19,252 million from the previous fiscal year-
end to ¥148,844 million, principally due to increases in foreign
currency translation adjustments and retained earnings.
Cash FlowsCash and cash equivalents (“cash”) as of March 31, 2015 stood at
¥35,440 million, up ¥5,190 million from the previous fiscal year-end. The
increase reflects an increase in income before income taxes and minor-
ity interests, as well as a decline in cash due to capital expenditures.
Net cash provided by operating activities was ¥18,325 million.
Principle items included income before income taxes and minority
interests and depreciation and amortization.
Net cash used in investing activities was ¥12,202 million. The
principal item was capital investment.
Net cash used in financing activities was ¥3,809 million. This was
mainly due to dividends paid.
The Company will allocate internal reserves to capital needs for
product development essential for future growth and business expansion.
Shareholders’ Equity Ratio
(%)
Return on Equity
(%)
Cash Flows
(¥ millions)
Cash Flows from Operating Activities Cash Flows from Investing Activities Cash Flows from Financing Activities

8 Nissin Kogyo Co., Ltd.
Millions of yenThousands of
U.S. dollars
ASSETS 2014 2015 2015
Current assets:Cash and bank deposits ¥ 31,129 ¥ 37,698 $ 313,706Notes and accounts receivable 32,322 35,631 296,505Marketable securities 6,000 6,213 51,702Inventories 24,117 28,561 237,672Deferred income taxes 1,996 1,472 12,249Prepaid expenses and other current assets 4,601 5,174 43,056Allowance for doubtful accounts (15) (6) (50)
Total current assets 100,151 114,744 954,847
Property, plant and equipment:Land 6,423 6,353 52,867Buildings and structures 24,790 29,149 242,565Machinery and equipment 102,370 118,371 985,030Vehicles and fixtures 23,115 26,196 217,991Lease assets 237 141 1,173Construction in progress 5,421 5,097 42,415
162,356 185,307 1,542,040Accumulated depreciation (105,735) (120,439) (1,002,238)
Property, plant and equipment, net 56,620 64,868 539,802
Investments and other assets:Investment securities 17,100 16,188 134,709Deferred income taxes 231 238 1,981Other assets 1,734 1,006 8,371Allowance for doubtful accounts (0) — —
Total investments and other assets 19,066 17,432 145,061Total assets ¥ 177,540 ¥ 199,171 $ 1,657,410
Note: U.S. dollar amounts have been translated from yen for convenience only, at the rate of ¥120.17=U.S.$1, the approximate Tokyo foreign exchange market rate as of March 31, 2015.
Millions of yen
Shareholders’ equity Valuation, translation adjustments and others
Common stock
Capital surplus
Retained earnings
Treasury stock
Total shareholders’
equity
Net unrealized
holding gain on
investment securities
Deferred gains or
losses on hedges
Foreign currency
translation adjustments
Remeasure-ments of defined
benefit plans
Total valuation,
translation adjustments and others
Minority interests
Total net assets
Balance as of March 31, 2014 ¥3,694 ¥3,451 ¥ 98,381 ¥(786) ¥104,740 ¥7,496 ¥ 11 ¥(3,511) ¥421 ¥ 4,417 ¥20,434 ¥129,591Cumulative effects of changes in accounting policies (1,883) (1,883) (1,883)
Restated balance 3,694 3,451 96,498 (786) 102,857 7,496 11 (3,511) 421 4,417 20,434 127,709Changes in the period:
Dividends (2,596) (2,596) (2,596)Net income 10,446 10,446 10,446Purchase of treasury stock (0) (0) (0)Cancellation of treasury stock 25 93 118 118Increase (decrease) in treasury stock due to changes in equity among associates accounted for by the equity method (132) (132) (132)
Net changes of items other than shareholders’ equity 1,354 (11) 6,521 88 7,951 5,348 13,299
Total changes in the period — 25 7,718 93 7,836 1,354 (11) 6,521 88 7,951 5,348 21,135Balance as of March 31, 2015 ¥3,694 ¥3,476 ¥104,216 ¥(693) ¥110,693 ¥8,850 — ¥ 3,010 ¥509 ¥12,369 ¥25,782 ¥148,844
Consolidated Balance Sheets (Unaudited)
Consolidated Statements of Changes in Net Assets (Unaudited)
Nissin Kogyo Co., Ltd. and Consolidated Subsidiaries March 31, 2014 and 2015
Nissin Kogyo Co., Ltd. and Consolidated Subsidiaries Year ended March 31, 2015

Annual Review 2015 9
Millions of yenThousands of
U.S. dollars
LIABILITIES AND NET ASSETS 2014 2015 2015
Current liabilities:Notes and accounts payable ¥ 28,749 ¥ 28,388 $ 236,232Short-term borrowings 4,826 6,215 51,718Accrued expenses 1,718 735 6,116Accrued income taxes 1,354 991 8,247Other current liabilities 3,351 3.830 31,872
Total current liabilities 39,997 40,159 334,185
Long-term liabilities:Deferred income taxes 5,560 5,206 43,322Retirement benefits for directors and corporate auditors 142 170 1,415Net defined benefit liability 800 3,048 25,364Other long-term liabilities 1,449 1,744 14,513
Total long-term liabilities 7,951 10,169 84,622
Net assets:Shareholders’ equity:
Common stock:Authorized: 150,000,000 sharesIssued: 65,452,143 shares in 2014Issued: 65,452,143 shares in 2015 3,694 3,694 30,740
Capital surplus 3,451 3,476 28,926Retained earnings 98,381 104,216 867,238Treasury stock, at cost: 466,900 shares in 2014 and 466,900 shares in 2015 (786) (693) (5,767)
Total shareholders’ equity 104,740 110,693 921,137Valuation, translation adjustments and others:
Net unrealized holding gain on investment securities 7,496 8,850 73,646Deferred gains or losses on hedges 11 — —Foreign currency translation adjustments (3,511) 3,010 25,048Remeasurements of defined benefit plans 421 509 4,236
Total valuation, translation adjustments and others 4,417 12,369 102,929Minority interests 20,434 25,782 214,546Total net assets 129,591 148,844 1,238,612Total liabilities and net assets ¥177,540 ¥199,171 $1,657,410
Thousands of U.S. dollars
Shareholders’ equity Valuation, translation adjustments and others
Common stock
Capital surplus
Retained earnings
Treasury stock
Total shareholders’
equity
Net unrealized
holding gain on
investment securities
Deferred gains or
losses on hedges
Foreign currency
translation adjustments
Remeasure-ments of defined
benefit plans
Total valuation,
translation adjustments and others
Minority interests
Total net assets
Balance as of March 31, 2014 $30,740 $28,718 $818,682 $(6,541) $871,599 $62,378 $ 92 $(29,217) $3,503 $ 36,756 $170,042 $1,078,397Cumulative effects of changes in accounting policies (15,669) (15,669) (15,669)
Restated balance 30,740 28,718 803,012 (6,541) 855,929 62,378 92 (29,217) 3,503 36,756 170,042 1,062,736Changes in the period:
Dividends (21,603) (21,603) (21,603)Net income 86,927 86,927 86,927Purchase of treasury stock (0) (0) (0)Cancellation of treasury stock 208 774 982 982Increase (decrease) in treasury stock due to changes in equity among associates accounted for by the equity method (1,098) (1,098) (1,098)
Net changes of items other than shareholders’ equity 11,267 (92) 54,265 732 66,165 44,504 110,668
Total changes in the period — 208 64,226 774 65,208 11,267 (92) 54,265 732 66,165 44,504 175,876Balance as of March 31, 2015 $30,740 $28,926 $867,238 $(5,767) $921,137 $73,646 — $ 25,048 $4,236 $102,929 $214,546 $1,238,612
Note: U.S. dollar amounts have been translated from yen for convenience only, at the rate of ¥120.17=U.S.$1, the approximate Tokyo foreign exchange market rate as of March 31, 2015.

Consolidated Statements of Income (Unaudited)
Consolidated Statements of Comprehensive Income (Unaudited)
Nissin Kogyo Co., Ltd. and Consolidated Subsidiaries Years ended March 31, 2014 and 2015
Nissin Kogyo Co., Ltd. and Consolidated Subsidiaries Years ended March 31, 2014 and 2015
10 Nissin Kogyo Co., Ltd.
Millions of yenThousands of
U.S. dollars
2014 2015 2015
Net sales ¥220,868 ¥227,836 $1,895,947Cost of sales 187,998 197,334 1,642,124
Gross profit 32,871 30,502 253,824Selling, general and administrative expenses 13,454 12,918 107,498
Operating income 19,417 17,584 146,326
Other income (expenses):Interest and dividend income 931 1,300 10,818Interest expense (55) (71) (591)Foreign exchange gain (loss), net 1,012 1,113 9,262Gain on sale of securities 610 — —Loss on disposal of fixed assets (130) (174) (1,448)Equity in earnings of affiliates (106) (59) (491)Other, net 167 302 2,513
Other income, net 2,428 2,410 20,055Income before income taxes and minority interests 21,845 19,995 166,389
Income taxes:Current 4,173 4,200 34,950Deferred 1,311 804 6,691
Income before minority interests 16,360 14,991 124,748Minority interests 4,160 4,545 37,821
Net income ¥ 12,200 ¥ 10,446 $ 86,927
Note: U.S. dollar amounts have been translated from yen for convenience only, at the rate of ¥120.17=U.S.$1, the approximate Tokyo foreign exchange market rate as of March 31, 2015.
Millions of yenThousands of
U.S. dollars
2014 2015 2015
Income before minority interests ¥16,360 ¥14,991 $124,748Other comprehensive income:
Net unrealized holding gain on investment securities 324 1,354 11,267Deferred gains or losses on hedges 11 (11) (92)Foreign currency translation adjustments 5,685 9,616 80,020Remeasurements of defined benefit plans, net tax — 1 8
Share of other comprehensive income of associates accounted for by the equity method 53 21 175
Total other comprehensive income 6,073 10,980 91,371
Comprehensive income ¥22,434 ¥25,971 $216,119
(Comprehensive income attributable to)Comprehensive income attributable to owners of the parent ¥17,876 ¥18,397 $153,091
Comprehensive income attributable to minority interests 4,558 7,573 63,019
Note: U.S. dollar amounts have been translated from yen for convenience only, at the rate of ¥120.17=U.S.$1, the approximate Tokyo foreign exchange market rate as of March 31, 2015.

Consolidated Statements of Cash Flows (Unaudited)Nissin Kogyo Co., Ltd. and Consolidated Subsidiaries Years ended March 31, 2014 and 2015
Annual Review 2015 11
Millions of yenThousands of
U.S. dollars
2014 2015 2015
Cash flows from operating activities:Income before income taxes and minority interests ¥ 21,845 ¥ 19,995 $ 166,389Depreciation and amortization 8,032 9,474 78,838Amortization of negative goodwill (1) — —Decrease in allowance for doubtful accounts 11 (11) (92)Increase (decrease) in allowance for directors’ bonuses 37 22 183Increase in allowance for product warranties (1,129) (1,003) (8,347)Increase in accrued retirement benefits (1,287) — —Increase in retirement benefits for directors and corporate auditors 8 6 50Decrease (increase) in retirement benefit assets (418) 418 3,478Increase (decrease) in retirement benefit liabilities 1,574 (728) (6,058)Interest and dividend income (931) (1,300) (10,818)Interest expense 55 71 591Foreign exchange gain, net (131) (20) (166)Equity in earnings of affiliates 106 59 491Loss on sales of property, plant and equipment (39) (101) (840)Loss on disposal of property, plant and equipment 130 174 1,448Impairment loss 376 — —Loss (gain) on valuation of short-term and long-term investment securities (610) — —Increase in notes and accounts receivable—trade (3,912) (235) (1,956)Increase in inventories (752) (1,464) (12,183)Increase in notes and accounts payable—trade 1,269 (3,039) (25,289)Increase in accounts payable 1,002 (900) (7,489)Other, net 407 464 3,861
Subtotal 25,642 21,883 182,100Interest and dividends received 932 1,301 10,826Interest paid (55) (71) (591)Income taxes paid (4,118) (4,788) (39,844)
Net cash provided by operating activities 22,401 18,325 152,492Cash flows from investing activities:
Decrease in time deposits (58) (1,161) (9,661)Decrease in marketable securities (2,000) 0 0Purchases of property and equipment (13,172) (11,663) (97,054)Proceeds from sale of property and equipment 197 1,394 11,600Purchases of intangible assets (299) (835) (6,948)Purchases of investment securities (1,085) (71) (591)Proceeds from the sale of investment securities 715 — —Payments of loans receivable (1,133) — —Other, net (103) 134 1,115
Net cash used in investing activities (16,940) (12,202) (101,539)Cash flows from financing activities:
Decrease in short-term borrowings 1,819 468 3,894Repayments of finance lease obligations (221) (25) (208)Dividends paid (2,464) (2,596) (21,603)Dividends paid to minority shareholders (1,853) (2,225) (18,515)Other, net 494 568 4,727
Net cash used in financing activities (2,225) (3,809) (31,697)Effect of exchange rate changes on cash and cash equivalents 684 1,743 14,504Net increase in cash and cash equivalents 3,920 4,057 33,761Cash and cash equivalents at beginning of year 26,331 30,251 251,735Cash and cash equivalents from newly consolidated subsidiaries — 1,133 9,428Cash and cash equivalents at end of year ¥ 30,251 ¥ 35,440 $ 294,916
Note: U.S. dollar amounts have been translated from yen for convenience only, at the rate of ¥120.17=U.S.$1, the approximate Tokyo foreign exchange market rate as of March 31, 2015.
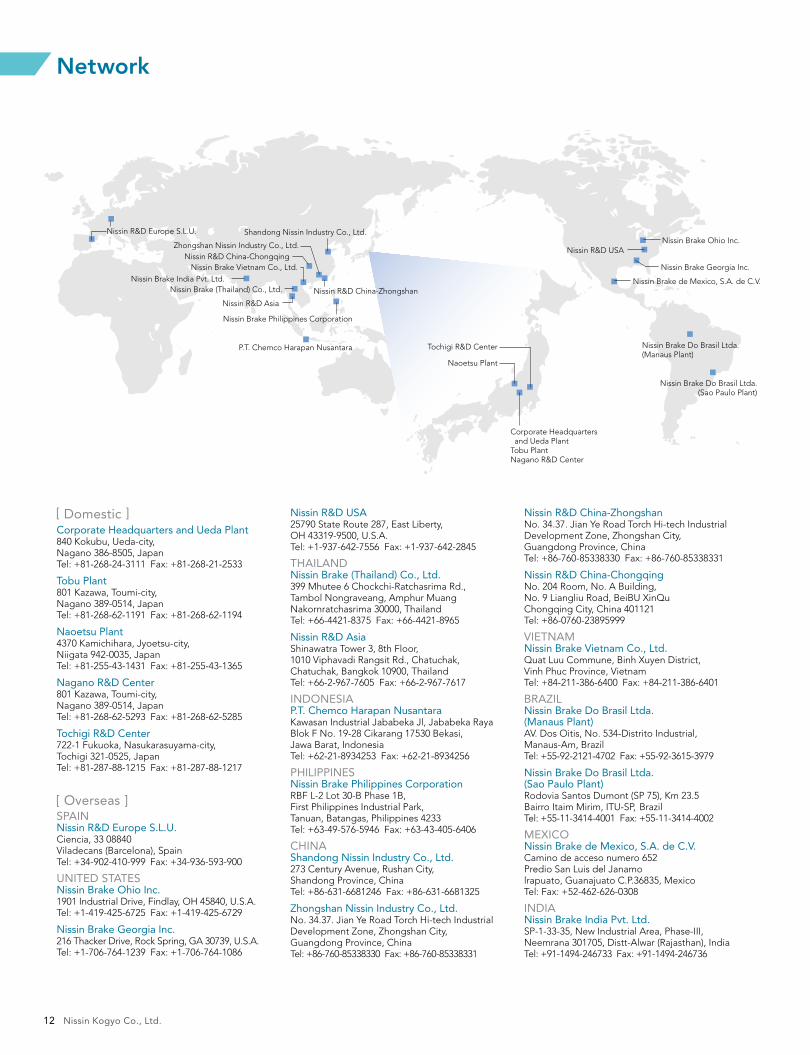
Network
12 Nissin Kogyo Co., Ltd.
Naoetsu Plant
Corporate Headquarters and Ueda PlantTobu PlantNagano R&D Center
Tochigi R&D Center
Nissin R&D Europe S.L.U.
Nissin Brake (Thailand) Co., Ltd.
Nissin Brake Vietnam Co., Ltd.
Nissin R&D Asia
Zhongshan Nissin Industry Co., Ltd.Nissin R&D China‐Chongqing
Nissin R&D China‐Zhongshan
Shandong Nissin Industry Co., Ltd.
Nissin Brake Philippines Corporation
P.T. Chemco Harapan Nusantara
Nissin Brake Ohio Inc.
Nissin Brake de Mexico, S.A. de C.V.
Nissin R&D USA
Nissin Brake Georgia Inc.
Nissin Brake Do Brasil Ltda.(Manaus Plant)
[ Domestic ]Corporate Headquarters and Ueda Plant840 Kokubu, Ueda-city, Nagano 386-8505, Japan Tel: +81-268-24-3111 Fax: +81-268-21-2533
Tobu Plant801 Kazawa, Toumi-city, Nagano 389-0514, Japan Tel: +81-268-62-1191 Fax: +81-268-62-1194
Naoetsu Plant4370 Kamichihara, Jyoetsu-city, Niigata 942-0035, Japan Tel: +81-255-43-1431 Fax: +81-255-43-1365
Nagano R&D Center801 Kazawa, Toumi-city, Nagano 389-0514, Japan Tel: +81-268-62-5293 Fax: +81-268-62-5285
Tochigi R&D Center722-1 Fukuoka, Nasukarasuyama-city, Tochigi 321-0525, Japan Tel: +81-287-88-1215 Fax: +81-287-88-1217
[ Overseas ]SPAINNissin R&D Europe S.L.U.Ciencia, 33 08840 Viladecans (Barcelona), Spain Tel: +34-902-410-999 Fax: +34-936-593-900
UNITED STATESNissin Brake Ohio Inc.1901 Industrial Drive, Findlay, OH 45840, U.S.A. Tel: +1-419-425-6725 Fax: +1-419-425-6729
Nissin Brake Georgia Inc.216 Thacker Drive, Rock Spring, GA 30739, U.S.A. Tel: +1-706-764-1239 Fax: +1-706-764-1086
Nissin R&D USA25790 State Route 287, East Liberty, OH 43319-9500, U.S.A. Tel: +1-937-642-7556 Fax: +1-937-642-2845
THAILANDNissin Brake (Thailand) Co., Ltd.399 Mhutee 6 Chockchi-Ratchasrima Rd., Tambol Nongraveang, Amphur Muang Nakornratchasrima 30000, Thailand Tel: +66-4421-8375 Fax: +66-4421-8965
Nissin R&D AsiaShinawatra Tower 3, 8th Floor, 1010 Viphavadi Rangsit Rd., Chatuchak, Chatuchak, Bangkok 10900, Thailand Tel: +66-2-967-7605 Fax: +66-2-967-7617
INDONESIAP.T. Chemco Harapan NusantaraKawasan Industrial Jababeka Jl, Jababeka Raya Blok F No. 19-28 Cikarang 17530 Bekasi, Jawa Barat, Indonesia Tel: +62-21-8934253 Fax: +62-21-8934256
PHILIPPINESNissin Brake Philippines CorporationRBF L-2 Lot 30-B Phase 1B, First Philippines Industrial Park, Tanuan, Batangas, Philippines 4233 Tel: +63-49-576-5946 Fax: +63-43-405-6406
CHINAShandong Nissin Industry Co., Ltd.273 Century Avenue, Rushan City, Shandong Province, China Tel: +86-631-6681246 Fax: +86-631-6681325
Zhongshan Nissin Industry Co., Ltd.No. 34.37. Jian Ye Road Torch Hi-tech Industrial Development Zone, Zhongshan City, Guangdong Province, China Tel: +86-760-85338330 Fax: +86-760-85338331
Nissin R&D China‐ZhongshanNo. 34.37. Jian Ye Road Torch Hi-tech Industrial Development Zone, Zhongshan City, Guangdong Province, China Tel: +86-760-85338330 Fax: +86-760-85338331
Nissin R&D China‐ChongqingNo. 204 Room, No. A Building, No. 9 Liangliu Road, BeiBU XinQu Chongqing City, China 401121 Tel: +86-0760‐23895999
VIETNAMNissin Brake Vietnam Co., Ltd.Quat Luu Commune, Binh Xuyen District, Vinh Phuc Province, Vietnam Tel: +84-211-386-6400 Fax: +84-211-386-6401
BRAZILNissin Brake Do Brasil Ltda.(Manaus Plant)AV. Dos Oitis, No. 534-Distrito Industrial, Manaus-Am, Brazil Tel: +55-92-2121-4702 Fax: +55-92-3615-3979
Nissin Brake Do Brasil Ltda. (Sao Paulo Plant)Rodovia Santos Dumont (SP 75), Km 23.5 Bairro Itaim Mirim, ITU-SP, Brazil Tel: +55-11-3414-4001 Fax: +55-11-3414-4002
MEXICONissin Brake de Mexico, S.A. de C.V.Camino de acceso numero 652 Predio San Luis del Janamo lrapuato, Guanajuato C.P.36835, Mexico Tel: Fax: +52-462-626-0308
INDIANissin Brake India Pvt. Ltd.SP-1-33-35, New Industrial Area, Phase-III, Neemrana 301705, Distt-Alwar (Rajasthan), India Tel: +91-1494-246733 Fax: +91-1494-246736
Nissin Brake Do Brasil Ltda. (Sao Paulo Plant)
Nissin Brake India Pvt. Ltd.
Corporate Data(As of March 31, 2015)
Annual Review 2015 13
Name: Nissin Kogyo Co., Ltd.
Established: October 1953
Paid-In Capital: ¥3,694 million
Employees: 10,592
Directors and Corporate Auditors:(As of June 13, 2015)
PresidentEiji Okawara
Vice PresidentHideaki Yanagisawa
Senior Managing DirectorNaotoshi Tamai
Executive Managing DirectorJyunya Takei
DirectorsKenji TeradaKenji ShimizuKazuya SatoYuichi IchikawaTakayoshi ShinoharaJiro Miyashita
Statutory Corporate AuditorsKiyoshi SakashitaMakoto Horiuchi
Corporate AuditorsNorimasa OguchiHiroyuki Negishi
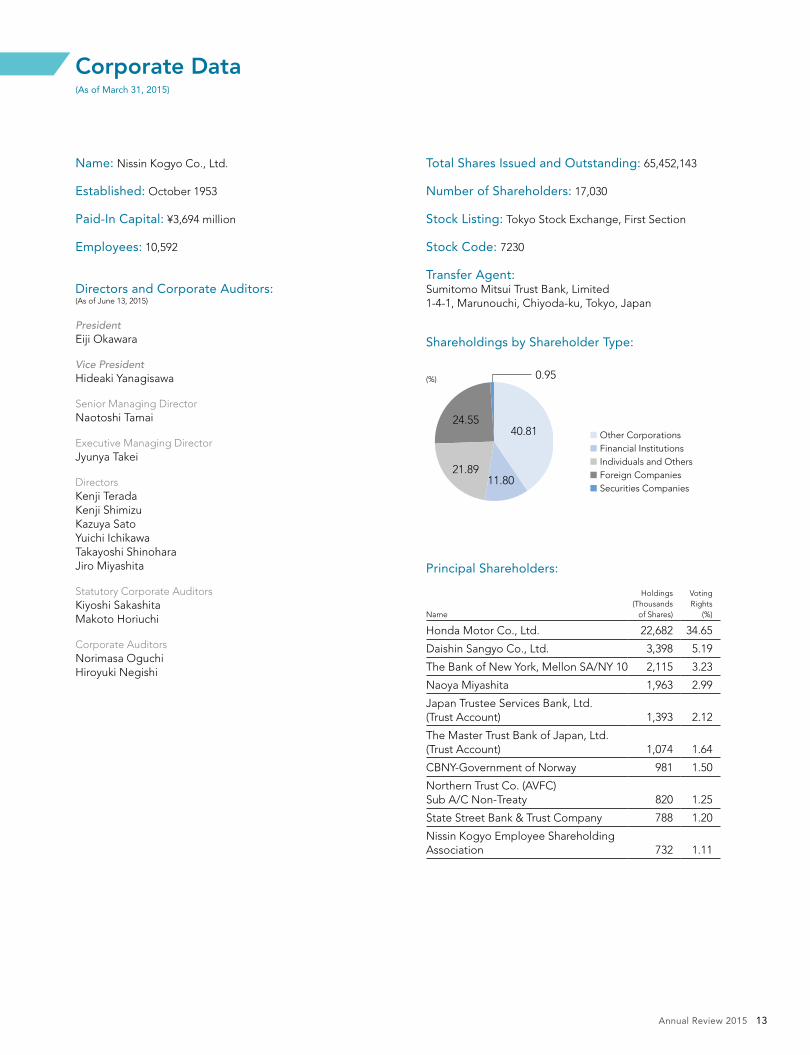
Shareholdings by Shareholder Type:
◼ Other Corporations◼ Financial Institutions◼ Individuals and Others◼ Foreign Companies◼ Securities Companies
Total Shares Issued and Outstanding: 65,452,143
Number of Shareholders: 17,030
Stock Listing: Tokyo Stock Exchange, First Section
Stock Code: 7230
Transfer Agent:Sumitomo Mitsui Trust Bank, Limited1-4-1, Marunouchi, Chiyoda-ku, Tokyo, Japan
40.81
11.8021.89
24.55
0.95
Principal Shareholders:
Name
Holdings (Thousands
of Shares)
Voting Rights
(%)
Honda Motor Co., Ltd. 22,682 34.65
Daishin Sangyo Co., Ltd. 3,398 5.19
The Bank of New York, Mellon SA/NY 10 2,115 3.23
Naoya Miyashita 1,963 2.99
Japan Trustee Services Bank, Ltd. (Trust Account) 1,393 2.12
The Master Trust Bank of Japan, Ltd. (Trust Account) 1,074 1.64
CBNY-Government of Norway 981 1.50
Northern Trust Co. (AVFC) Sub A/C Non-Treaty 820 1.25
State Street Bank & Trust Company 788 1.20
Nissin Kogyo Employee Shareholding Association 732 1.11
(%)

NISSIN KOGYO CO., LTD.840 Kokubu, Ueda-city, Nagano 386-8505, JapanTel: +81-268-24-3111 Fax: +81-268-21-2533http://www.nissinkogyo.co.jp