Annual Results Presentation Period Ended 30 June 2005 · 6/30/2005 · Annual Results Presentation...
47
Annual Results Presentation Period Ended 30 June 2005 Kirby Adams, Managing Director and Chief Executive Officer Brian Kruger, President Australian Manufacturing Markets (formerly Chief Financial Officer) 23 August, 2005 ASX Code: BSL
Transcript of Annual Results Presentation Period Ended 30 June 2005 · 6/30/2005 · Annual Results Presentation...

Annual Results Presentation Period Ended 30 June 2005Kirby Adams, Managing Director and Chief Executive OfficerBrian Kruger, President Australian Manufacturing Markets (formerly Chief Financial Officer)23 August, 2005
ASX Code: BSL

Page 2
Important Notice
THIS PRESENTATION IS NOT AND DOES NOT FORM PART OF ANY OFFER, INVITATION OR RECOMMENDATION IN RESPECT OF SECURITIES. ANY DECISION TO BUY OR SELL BLUESCOPE STEEL LIMITED SECURITIES OR OTHER PRODUCTS SHOULD BE MADE ONLY AFTER SEEKING APPROPRIATE FINANCIAL ADVICE. RELIANCE SHOULD NOT BE PLACED ON INFORMATION OR OPINIONS CONTAINED IN THIS PRESENTATION AND, SUBJECT ONLY TO ANY LEGAL OBLIGATION TO DO SO, BLUESCOPE STEEL DOES NOT ACCEPT ANY OBLIGATION TO CORRECT OR UPDATE THEM. THIS PRESENTATION DOES NOT TAKE INTO CONSIDERATION THE INVESTMENT OBJECTIVES, FINANCIAL SITUATION OR PARTICULAR NEEDS OF ANY PARTICULAR INVESTOR.
TO THE FULLEST EXTENT PERMITTED BY LAW, BLUESCOPE STEEL AND ITS AFFILIATES AND THEIR RESPECTIVE OFFICERS, DIRECTORS, EMPLOYEES AND AGENTS, ACCEPT NO RESPONSIBILITY FOR ANY INFORMATION PROVIDED IN THIS PRESENTATION, INCLUDING ANY FORWARD LOOKING INFORMATION, AND DISCLAIM ANY LIABILITY WHATSOEVER (INCLUDING FOR NEGLIGENCE) FOR ANY LOSS HOWSOEVER ARISING FROM ANY USE OF THIS PRESENTATION OR RELIANCE ON ANYTHING CONTAINED IN OR OMITTED FROM IT OR OTHERWISE ARISING IN CONNECTION WITH THIS.

Page 3
Rewarding Shareholders Rewarding Shareholders As We GrowAs We Grow
Delivering on our Delivering on our StrategyStrategy

Page 4
Capital management – Rewarding shareholders as we grow
• Share Buybacks – Public Listing to 30 June 2005- Purchased and cancelled 102m shares
* on market – 76m shares* off market – 26m shares
• Dividends - All Fully Franked
9 13 1218 18
247
10
20
0
510
15
2025
30
35
4045
50
FY2003-1H FY2003-2H FY2004-1H FY2004-2H FY2005-1H FY2005-2H
¢
¢¢
Cent
s Per
Sha
re
Total return to shareholders since BSL’spublic listing (July 2002):
• Share buybacks $ 612m• Dividends paid $ 656m• Final & special dividend
(to be paid Oct 05) $ 312m$1,580m
$2.09 share or 77% payout ratio
¢
29¢40¢
¢
¢
¢
SpecialOrdinary:- Interim- Final
62¢
¢
¢

Page 5
Safety –”Taking Care” as we grow - Our goal remains Zero Harm
17,500 Employees, 84 manufacturing sites, 17 countries
35
29
1614
84.8
3.4 4.1 3.4 2.8 1.8 1.9 0.8 0.61.40
5
10
15
20
25
30
35
40
1993 1994 1995 1996 1997 1998 1999 2000 2001 2002 2003 2004 2005FY
52.247.1
29.122.4 21.9
12.2 9.3 9.2
1711.3
60
68
80
4.46.8
0
10
20
30
40
50
60
70
80
90
1993 1994 1995 1996 1997 1998 1999 2000 2001 2002 2003 2004 2005FY
* Includes contractors from 1996
Injur
ies re
sultin
g in l
ost ti
me pe
r milli
on m
an-h
ours
worke
d
Medic
ally t
reate
d inju
ries p
er m
illion
man
-hou
rs wo
rked
* Includes contractors from 2004
Medically Treated Injury Frequency RateLost Time Injury Frequency Rate
Includes Butler performance from July 2003Excludes Butler performance
Includes Butler performance from July 2003Excludes Butler performance
Minerals Council of Australia (2004) – 7.0IISI (2003) – 9.4

Page 6
Group headlines FY2005 – diversified portfolio delivers another outstanding result
• Revenue A$7,982 million Up 38% to record
• External despatches 7.2 million metric tonnes Up 4% to record
• EBITDA A$1,694 million Up 53% to record
• EBIT A$1,388 million Up 70% to record
• NPAT A$1,007 million Up 72% to record
• EPS 137.4¢ Up 77% to record
• After tax Return on Invested Capital 25.4% Up 37% to record
• Return on Equity 30.0% Up 53% to record
• Net operating Cashflow A$1,225 million 50/50 to shareholders / CAPEX
• Final Ordinary Dividend 24¢ per share Up 33%(fully franked)
• Special dividend (fully franked) 20¢ per share Doubled
• Gearing (net debt) 18.4% - vs. 12.9% (30 June 2004)- net debt up A$318 million since June 04

Page 7
Our strategy – unchanged and continuing to deliver
Hot Rolled Coil,Plate
Cold Rolled
Painted
Roll-forming
Metallic Coated
PEB /Solutions
• Cost competitive steelmaker – PKSW, NZ Steel and North Star BlueScope.
• Maximise asset life at optimum capacity.
• Strategic conversion alliances in Asia and USA.
• Reassess raw materials appoach.
Downstream
Midstream
Upstream
Steelmaking, Slab
WaterChina
Thailand
India
VietnamChina
ChinaThailand
Vietnam
Australia
NZAustralia
NZAustralia
• Strengthening the world’s largest construction steel roll former, eg. India, China, USA.
• Growing the world’s largest PEB manufacturer, eg. Thailand, India, China.
• Water – solutions for a global issue.
• Grow metal coated and painted capabilities, principally in the world’s growth corridor – Asia and Far East.
• Maintain focus on branded products and new product / market offers.
• Research and Development focus to meet future customer needs.

Page 8
Implementing our strategy – more than 20 major projects in 8 countries
• Bringing balance to our product portfolio FY2006 FY2007
Downstream
Midstream
Upstream
USA- New Vistawall extrusion plant- New Buildings speciality plantAustralia- Water, Lysaght, WA Service CentreThailand- First Pre-Engineered Building (PEB)China- New Panels, residential plants, new beam facility
India- New PEB and Lysaght plants
China- New PEB and Lysaght plants open
New Zealand- Brownfields (increased metal coating & paint capacities)Australia- Brownfields (increased metal coating and paint capacities)Vietnam- New 125kt Metal Coating Line and 50kt Paint LineThailand- 200kt Metal Coating expansionIndia- Potential JV in Coating / Painting
Australia- Colorbond® plant opensChina- 250kt Metal Coating Line and 150kt Paint Line commissions
New Zealand Steel- Front end studyUSA- North Star BlueScope Steel – new bag house- CastripInformation Systems- SAP
Australia- 400kt HSM Expansion- BF No. 5 Reline
“Brownfields” – ongoing work to generate small capacity increases at all existing operations at minimal / no capital cost

Page 9
Our strategy includes Business Excellence
Continue the focus on:
- Manufacturing excellence > reduce costs> capital efficient capacity increments> improve yields
- Improving our market offer > technical support> improved delivery & lead times
- New and colourful products> research and development> product development> global alliances> acquisitions
Page 10
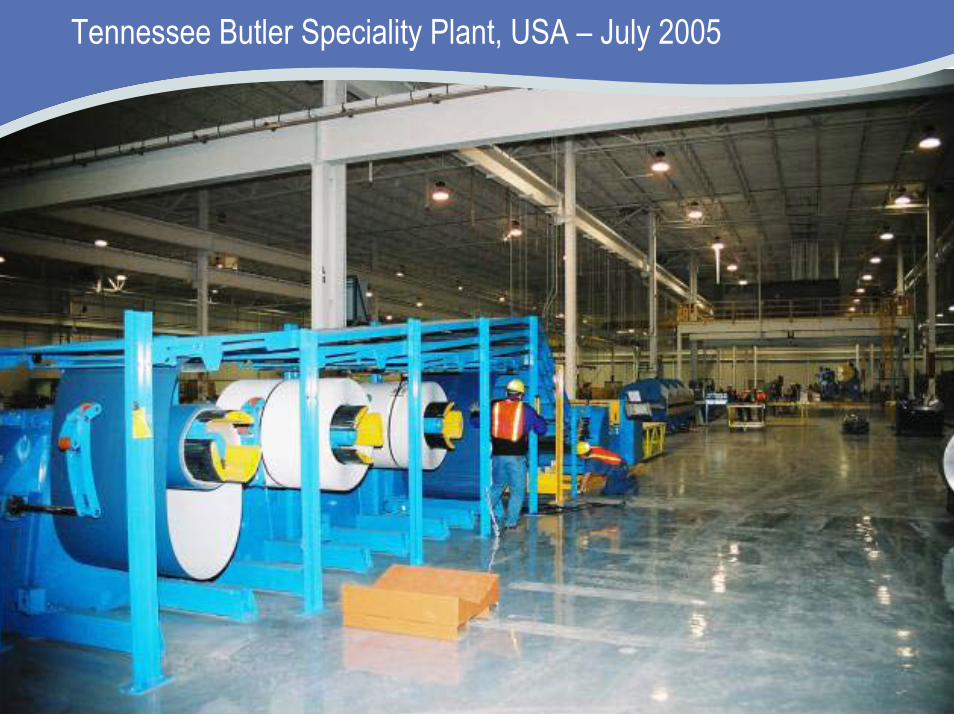
Tennessee Butler Speciality Plant, USA – July 2005
Page 11
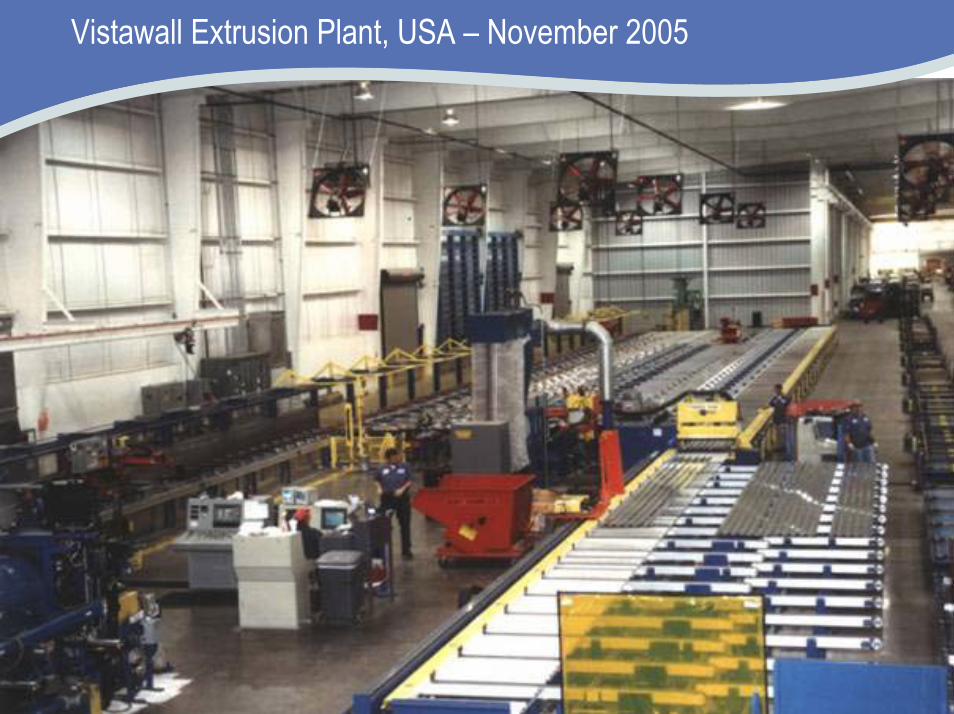
Vistawall Extrusion Plant, USA – November 2005

Page 12
Metal Coating Line Upgrade - Induction Furnace, New Zealand – FY2005

Page 13
West Sydney Colorbond® plant site, Australia – H1 CY2007

Page 14
Logistics and Service Centre, Western Australia – August 2005

Page 15
Sheds and Pre-Engineered Buildings – Australia
• Ranbuild acquired FY2005

Page 16
BlueScope Water developing capabilities – Australia and export
• Pioneer Water Tanks – acquired FY2005

Page 17
Hot Strip Mill Expansion, Port Kembla Steelworks – Q1 FY2007

Page 18
New 125,000t Metallic Coating & Painting, Vietnam – early CY2006
Page 19
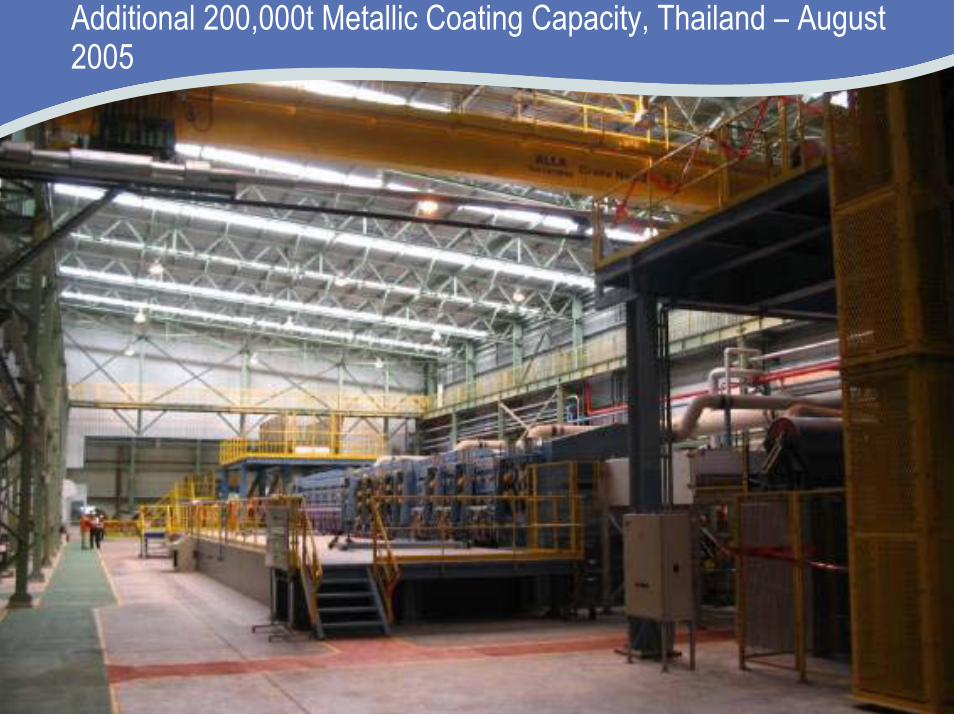
Additional 200,000t Metallic Coating Capacity, Thailand – August 2005

Page 20
BlueScope Buildings PEB for Lysaght at Cibitung, Indonesia - FY2005

Page 21
Asia – Suzhou MCLNew 250,000t Metallic Coating & Painting complex at Suzhou, China – mid CY2006

Page 22
New Welded Beam Plant at BlueScope Building‘s PEB and Beam Facility, Tianjin, China - FY2006
Page 23
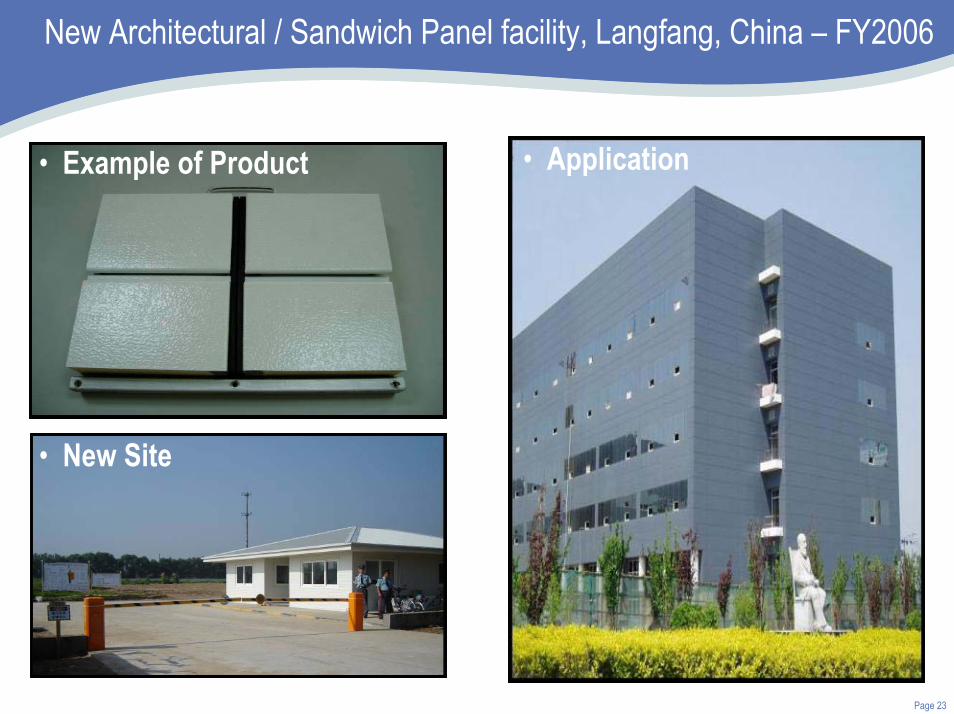
New Architectural / Sandwich Panel facility, Langfang, China – FY2006
• New Site
• Example of Product • Application

Page 24
Butler PEB and Design Centre at Pune, India – 2H CY2006
• SITE
• RENDERING

Page 25
Building the BlueScope Footprint
China
USA
Mexico
Australia New Zealand
ThailandMalaysia
Indonesia
Vietnam
SingaporeBrunei
Taiwan
Sri Lanka Fiji
New Caledonia
VanuatuIndia(under
development)
China
USA
Mexico
Australia New Zealand
ThailandMalaysia
Indonesia
Vietnam
SingaporeBrunei
Taiwan
Sri Lanka Fiji
New Caledonia
VanuatuIndia(under
development)

Page 26
Steelmaking drives strong regional performance in FY2005
104 82 62174
62
183
659
1024
0
150
300
450
600
750
900
1050
Asia Americas New Zealand Australia
FY04 FY05
EBIT
A$ M
illion
s
• Port Kembla• Coated & Building Products Australia
• NZS & Pacific Steel Products
• Coated & Building Products Asia
• North Star BlueScope (50%)• Coated and Building Products
North America
Based on source of production
Sales Revenue +50% +180% +28% +18%($m): 699 / 1,051 678 / 1,897 590 / 756 4,328 / 5,126

Page 27
Coated and Building Products Asia – continues to be the growth engine
Fastest Growing Steel Market in the World
• FY2005 return on net assets annualised (pre-tax) 11%
Market> Twelve months BlueScope Butler PEB> Strong demand in Thailand and Indonesia> Malaysia – softer construction market> China – volatile building market
Performance> EBIT reduced by capex pre-operating costs
and business development costs of A$27m> Higher coating metal costs (zn, al)> FX, stronger A$> Sales price increases offset higher feed costs> 16 million hours LTI free
104
4537
82
0
20
40
60
80
100
120
FY04 FY05-1H FY05-2H FY05
EBIT
A$ M
illion
s
BlueScope Butler
88
16
• Sales revenue up 50% = A$1,051m, including A$254m from BlueScope Butler China
3

Page 28
Coated and Building Products North America – re-establishing BlueScope’s presence
• Sales revenue = A$1,134m up 19%
Markets> Buildings – volumes down in 2nd half
- softer overall industrial market- market share stable
> Vistawall – improved sales and market share
Performance> Overall improvement on prior year – but not to target> Buildings (negative contribution but transformation well
underway)- integration and regionalisation complete- high cost Galesburg plant closed- new speciality plant, Tennessee, started on time
but subsequent delay and cost over-run (cost $15m)- remedial action taken
- High feed costs, although steel supply stabilised> Vistawall (stable and growing)
- Another strong performance- Overcame higher feed costs- Aluminium product despatches up 12% YOY
> Worldwide: EBIT breakeven
-28
0
-20 -20-30
-20
-10
0
10
20
30
FY04 FY05-1H FY05-2H FY05
EBIT
A$ M
illion
s
(1)
(2)
(1) Normalised(2) Equates to (A$15m) normalised, principally
excluding integration costs.
Page 29
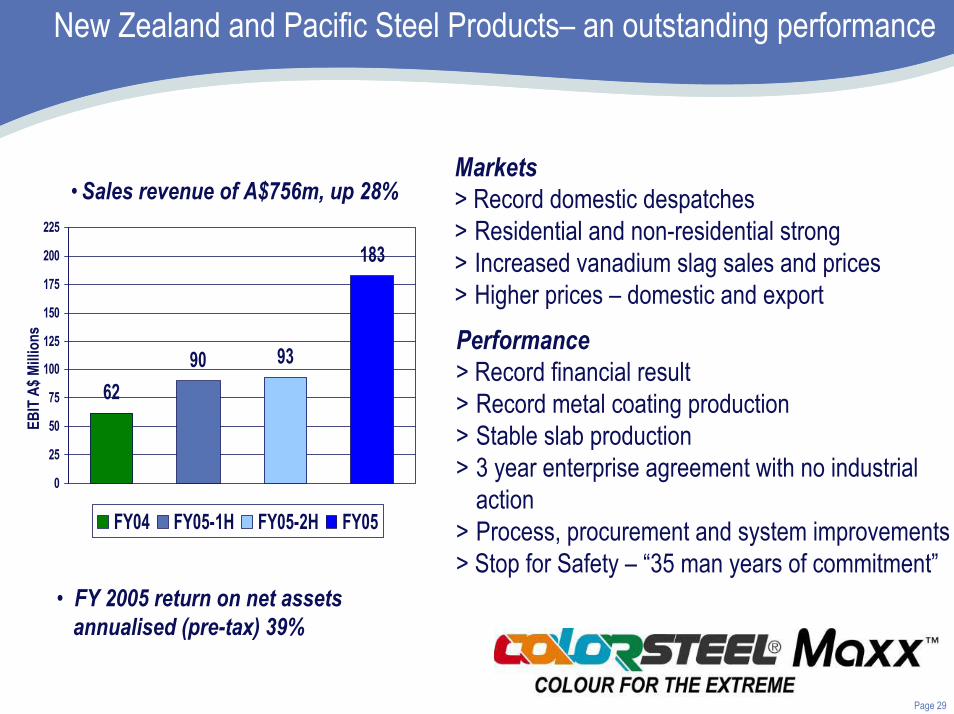
New Zealand and Pacific Steel Products– an outstanding performance
Performance> Record financial result> Record metal coating production> Stable slab production> 3 year enterprise agreement with no industrial
action> Process, procurement and system improvements> Stop for Safety – “35 man years of commitment”
6290 93
183
0
25
50
75
100
125
150
175
200
225
FY04 FY05-1H FY05-2H FY05
EBIT
A$ M
illion
s
• Sales revenue of A$756m, up 28%Markets> Record domestic despatches> Residential and non-residential strong> Increased vanadium slag sales and prices> Higher prices – domestic and export
• FY 2005 return on net assets annualised (pre-tax) 39%

Page 30
Coated & Building Products Australia – recovery underway
Markets> Record domestic despatches> Higher domestic and export prices> Residential softening> Non-dwelling and auto / manufacturing holding193
-91
-25
-116-150
-100
-50
0
50
100
150
200
250
FY04 FY05-1H FY05-2H FY05
EBIT
A$ M
illion
s
• Sales revenue of A$3,190m, up 11%
Performance> Higher steel feed and coating metal costs> Packaging Products
- honoured customer contracts- FY05 results ($109m), incl. ($25m) H2 restructure- withdrawing from export / continue domestic- improved pricing and profitability
> Annual production records achieved> Industrial disruption / strikes
- Western Port, Service Centres & Lysaght- cost to BlueScope Steel approximately $40m - also cost customers and employees
> West Sydney Colorbond® Centre underway> Service Centres and Lysaght stronger
• FY2005 return on net assets annualised (pre-tax) (9)%

Page 31
Hot Rolled Products – “steeling the show”
564692 646
1338
0
200
400
600
800
1000
1200
1400
FY04 FY05-1H FY05-2H FY05
Performance> Maintained record slab production> Record HRC production> Best plate production since FY1997> Partly offset by:
- higher iron ore, coal and scrap costs- planned repair and maintenance spending
> PKSW Hot Strip Mill expansion on schedule> Additional iron ore purchase Q4> 18 month coal arrangement> North Star BlueScope Steel
- production record- paid off debt and first dividend- Jacobsen Award No. 1 again
• FY2005 return on net assets annualised (pre-tax) 66%
EBIT
A$ M
illion
s
71104
North Star BlueScope Steel
Port Kembla Steelworks
90
194
• Sales revenue (excluding NSBSL) = A$3,940m, up 39%
• NSBS revenue US$573m (50%), up 65%
Markets> Strong global demand> Record prices and margins

Page 32
FinancialsFinancials
Page 33
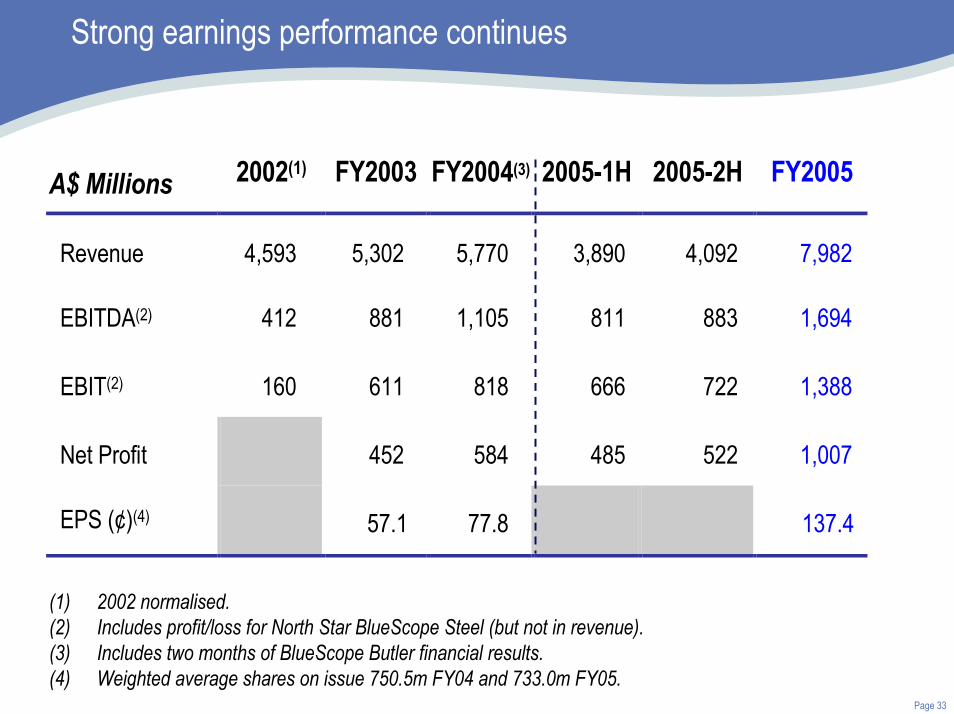
Strong earnings performance continues
A$ Millions 2002(1) FY2003 FY2004(3) 2005-1H 2005-2H FY2005
Revenue 4,593 5,302 5,770 3,890 4,092 7,982
EBITDA(2) 412 881 1,105 811 883 1,694
EBIT(2) 160 611 818 666 722 1,388
Net Profit 452 584 485 522 1,007
EPS (¢)(4) 57.1 77.8 137.4
(1) 2002 normalised.(2) Includes profit/loss for North Star BlueScope Steel (but not in revenue).(3) Includes two months of BlueScope Butler financial results.(4) Weighted average shares on issue 750.5m FY04 and 733.0m FY05.
Page 34
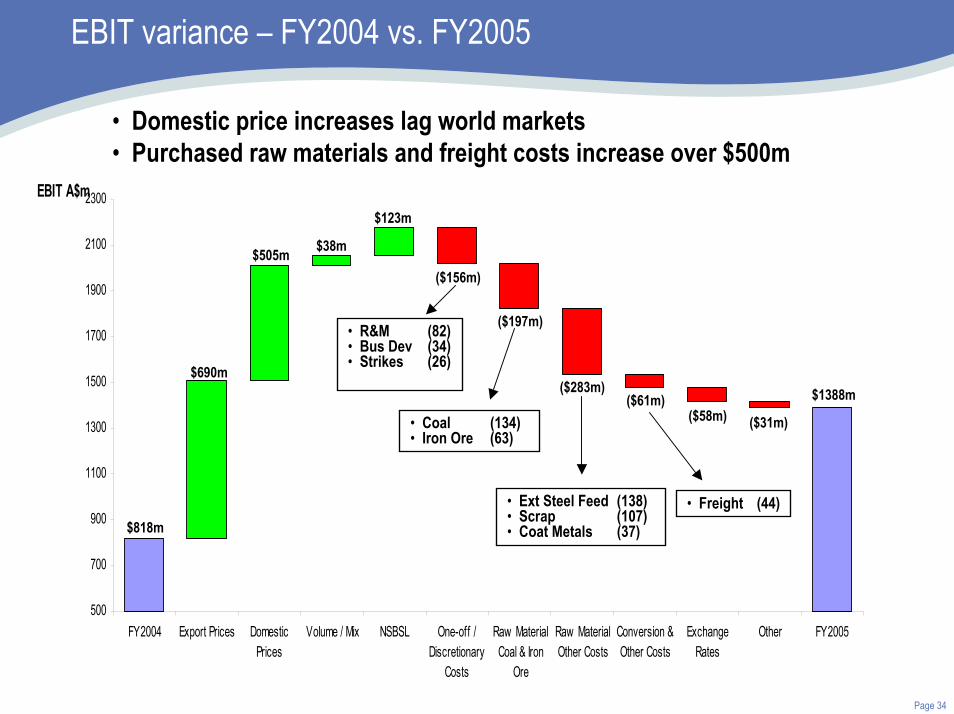
EBIT variance – FY2004 vs. FY2005
500
700
900
1100
1300
1500
1700
1900
2100
2300
FY2004 Export Prices DomesticPrices
Volume / Mix NSBSL One-off /Discretionary
Costs
Raw MaterialCoal & Iron
Ore
Raw MaterialOther Costs
Conversion &Other Costs
ExchangeRates
Other FY2005
EBIT A$m
$818m
$690m$1388m($283m)
$38m
($31m)
($156m)
($58m)
$123m
$505m
($61m)
($197m)• R&M (82)• Bus Dev (34) • Strikes (26)
• Freight (44)
• Coal (134)• Iron Ore (63)
• Ext Steel Feed (138)• Scrap (107)• Coat Metals (37)
• Domestic price increases lag world markets• Purchased raw materials and freight costs increase over $500m

Page 35
Balance Sheet – growing and maintaining flexibility
A s A t A $ M i l l io n s 3 0 J u n e 2 0 0 4 3 0 J u n e 2 0 0 5
A s s e t s C a s h 1 1 9 8 5 R e c e iv a b le s 9 9 6 1 ,0 6 0 In v e n to r y 9 6 3 1 ,2 1 1 O th e r A s s e ts 4 1 5 4 7 9 N e t F ix e d A s s e ts 3 ,2 8 9 3 ,6 2 9
T o t a l A s s e t s 5 ,7 8 2 6 ,4 6 4
L ia b i l i t ie s C r e d ito r s 7 2 8 8 2 4 In te r e s t B e a r in g L ia b i l i t ie s 5 9 3 8 7 6 P r o v is io n s 1 ,2 6 7 1 ,2 6 3 T o t a l L ia b i l i t ie s 2 ,5 8 8 2 ,9 6 3
N e t A s s e ts 3 ,1 9 4 3 ,5 0 1
• Net Debt / (Net Debt + Equity) 12.9% 18.4%(excluding off balance sheet items)

Page 36
Investing for the future – major project capital spending profile
1,170
100300(3)
120
90
28040
80
160
-274122India – Butler / Lysaght facilities(1)
--
45-
8034
1556
China(1)
- Coating and Painting Facility- Guangzhou Butler / Lysaght
Upstream Projects
--44116Vietnam – Coating / Painting(1)
316
-226(3)
18
-
FY2007
-
-
FY2008
401453Total spending on these projects
4070(3)
604(3)
Port Kembla:- HSM expansion- Blast Furnace No. 5 Reline(3)
9012West Sydney Colorbond®
278Thailand(1)
- Metallic Coating Facility
Mid and Downstream Projects
FY2006Actual to 30/06/05(2)
Total Est. Capex/Cost
All in A$million
(1) Estimated capital costs based on forecast exchange rate assumptions at time of project approval.(2) Capital spent from approval to 30/06/05.(3) Indicative, based on project study. Final cost and phasing confirmed later in FY2006.
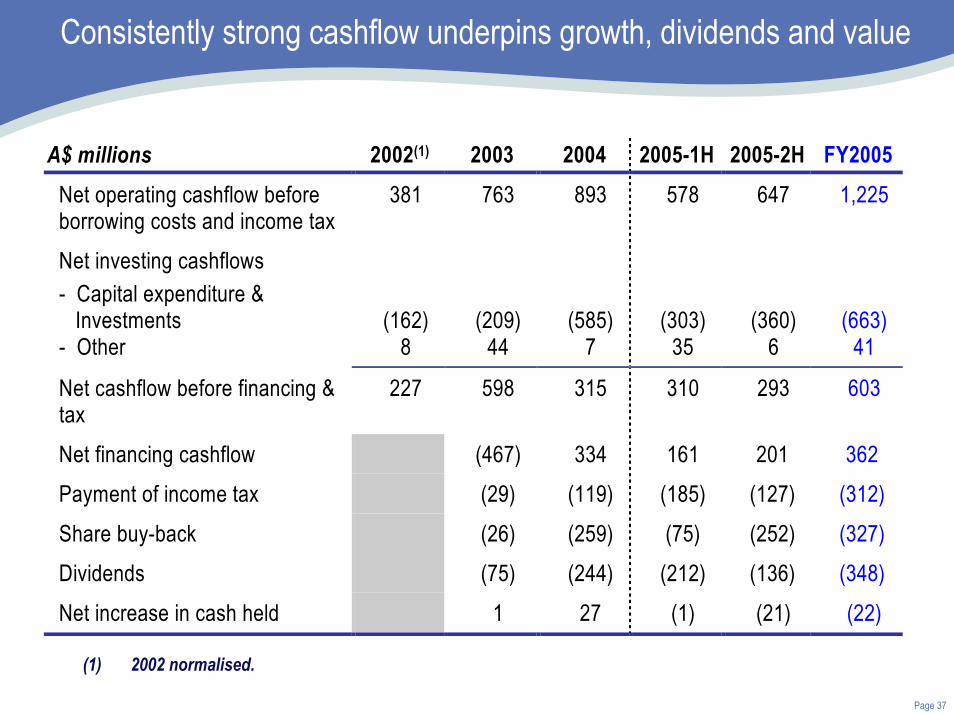
Page 37
Consistently strong cashflow underpins growth, dividends and value
A$ millions 2002(1) 2003 2004 2005-1H 2005-2H FY2005 Net operating cashflow before borrowing costs and income tax
381 763 893 578 647 1,225
Net investing cashflows - Capital expenditure & Investments - Other
(162) 8
(209) 44
(585) 7
(303) 35
(360) 6
(663) 41
Net cashflow before financing & tax
227 598 315 310 293 603
Net financing cashflow (467) 334 161 201 362 Payment of income tax (29) (119) (185) (127) (312) Share buy-back (26) (259) (75) (252) (327) Dividends (75) (244) (212) (136) (348) Net increase in cash held 1 27 (1) (21) (22)
(1) 2002 normalised.

Page 38
Australian International Financial Reporting Standards
(77)2022(3)13
982
Estimated adjustments:(1) Impairment of assets(2) Defined Benefit Superannuation(3) Foreign currency translation(4) Other(5) Tax (expense) / benefit on above itemsEstimated AIFRS Net Profit After Tax
1,007Reported AGAAP Net Profit After TaxNPAT (A$m)FY2005 Earnings
(1) Impairment write-down of Packaging Products assets. The operational assets are fully written down at 30 June 2005 under AIFRS.
(2) Lower superannuation expense as the unfunded liability is now fully recognised on the balance sheet.
(3) Exchange gains and losses on loans that do not qualify as a hedge of a net foreign investment under AIFRS. Note: The company has taken steps to mitigate this exposure from 1 July 2005.

Page 39
Australian International Financial Reporting Standards
(131)(72)812
3,073(3.8%)
(193)(126)
86(8)
3,260(6.9%)
Estimated adjustments to total equity (net of tax)(1) Defined Benefit Superannuation(2) Impairment of assets(3) Income tax methology(4) OtherEstimated total equity under AIFRSEstimated change (%)
3,501
30 June 2005(A$m)
3,193Total equity under AGAAP
1 July 2004(A$m)
Equity
(1) Recognition of unfunded defined benefit superannuation liability, discounted at corporate bond rate (or equivalent) and grossed-up for contributions tax.
(2) Treatment of Packaging Products as a separate Cash Generating Unit in the opening balance sheet (1 July 2004) and a further impairment at 30 June 2005 associated with domestic margin compression and the withdrawal from export tinplate.
(3) Recognition of additional tax assets due to change in recognition test from “virtually certain” to “probable”. Likely result inrecognition of New Zealand tax expense in 2H of FY2006.
Note: In addition, the Group’s sale of receivables program will not meet derecognition requirements under AIFRS ($140m at 30 June 2005). This together with the lower equity balance will increase reported gearing (net debt / net debt + equity) by approximately 4%.

Page 40
Results remain sensitive to raw material costs and realised hot rolled coil prices
Estimated impact on forecast EBIT (A$mil ) for FY06
Assumption+/– US$25 / tonne movement in BlueScope’s average realised export
HRC price (1) (73)66
7+/ 1¢ movement in Australian dollar / US dollar exchange rate(2) (18)+/– US$10 / tonne movement in NSBSS scrap to HRC price spread 12 (12)+/– 2% movement in slab production in Australia, New Zealand and U.S.A. 20 (46)+/– US$10 / tonne movement in coal costs 50 (50)+/– US$10 / tonne movement in iron ore costs 100 (100)(1) The change in export HRC price assumes proportional effect on export slab, and flow on to domestic pipe and tube market and to other
export products. (2) The movement in the Australian dollar/US dollar exchange rate includes the restatement of US dollar denominated receivables and
payables and the impact of translating the earnings of offshore operations to A$.

Page 41
Looking forward
Global steel industry – dynamic and different
Outlook – FY06

Page 42
Slab and HRC Prices (Index July 2002 = 100)
0
50
100
150
200
250
Jul-02 Oct-02 Jan-03 Apr-03 Jul-03 Oct-03 Jan-04 Apr-04 Jul-04 Oct-04 Jan-05 Apr-05 Jul-05
USA Midwest HRC1 Latin America Export Slab2
China growth continues
Extraordinary year in the global steel industry
Volatile Prices
FY03 FY04 FY05
15
20
25
30
35
40
45
50
55
87 88 89 90 91 92 93 94 95 96 97 98 99 00 01 02 03 04 05US$ / DMT. Lump trend indicative of all iron ore types.
JSM Benchmark Prices, Lump Iron Ore
Raw material costs skyrocket
Extreme Deviation
Cyclical HighsLT Average
Unprecedented shipping costs
BDI Index
May-9
5
May-0
0
May-0
1
May-0
2
May-0
3
May-0
4
May-0
5
May-9
9
May-9
8
May-9
7
May-9
6
7000
6000
5000
4000
3000
2000
1000
0

Page 43
Global steel industry - dynamic and different
Current industry issues:- Excess inventory - China’s capacity growth- Soaring raw materials costs- Buyer uncertainty- Energy costs
Likely industry outcomes:- Inventory drawn down- Industry matching
production with demand- China introducing structural
reform- Further raw material investment- More stable pricing environment
Six Pillars of a stronger steel industry
1. Restructure / consolidate
2. Reduce price volatility
3. Address raw materials situation
4. Stand against steel subsidies
5. Spend on innovation and reward our investors
6. Become safer and reaffirm our licence to operate

Page 44
Financial outlook FY2006
Hot Rolled Coil,Plate
Cold Rolled
Painted
Roll-forming
Metallic Coated
PEB /Solutions Downstream
Midstream
Upstream
Steelmaking, Slab
WaterChina
Thailand
India
VietnamChina
ChinaThailand
Vietnam
Australia
NZAustralia
NZAustralia
• Significantly higher raw material costs• Global slab / HRC prices flat• Stable production• Costs / efficiency
• Australia- higher prices- lower feed costs- higher production
• Asia- stronger volumes- market growth- new projects commissioning
• Lower feed costs• Improved sales and grow• Restructured / efficiency• New ventures
EBITRevenueVolume

Page 45
A balanced approach for all our stakeholders
• SHAREHOLDERS • CUSTOMERS
• COMMUNITIES • EMPLOYEES

Page 46
Questions and Answers
Dynamic Global Steel
Market
Dynamic Global Steel
Market
Profitable Through the
Cycle
Profitable Through the
Cycle
Geographic and Product
Diversity
Geographic and Product
Diversity
Strong and Flexible Capital
Structure
Strong and Flexible Capital
Structure
Consistently Strong Cash
Flows
Consistently Strong Cash
Flows
Strong Board & Management
Team
Strong Board & Management
Team
Value Added Branded Products
Value Added Branded Products
Growth Opportunities in
Asia
Growth Opportunities in
Asia
Low Cost Producer
Low Cost Producer
Strong Operating
Track Record
Strong Operating
Track Record
A VERY DIFFERENT KIND OF STEEL
COMPANY

Annual Results Presentation Period Ended 30 June 2005Kirby Adams, Managing Director and Chief Executive OfficerBrian Kruger, President Australian Manufacturing Markets (formerly Chief Financial Officer)23 August, 2005
ASX Code: BSL