Annual Results 2014 - cosl.com.cn · Self-developed ELIS logging units and high end logging units...
27
2015.3 Annual Results 2014
Transcript of Annual Results 2014 - cosl.com.cn · Self-developed ELIS logging units and high end logging units...

2015.3
Annual Results 2014
Disclaimer
The information contained in this presentation is intended solely for your own
reference only. In addition, information contained in this presentation includes
projections and forward-looking statements that reflect the Company’s current
views with respect to future events and financial performance. These views are
based on assumptions subject to various risks. No assurance can be given that
future events will occur, that projections will be achieved, or that the Company’s
assumptions are correct. Actual results may differ materially from those projected.
Past track record cannot be used as guidance for future performances.
2

2. Segments Review
3. Company Prospects
1. Results Overview
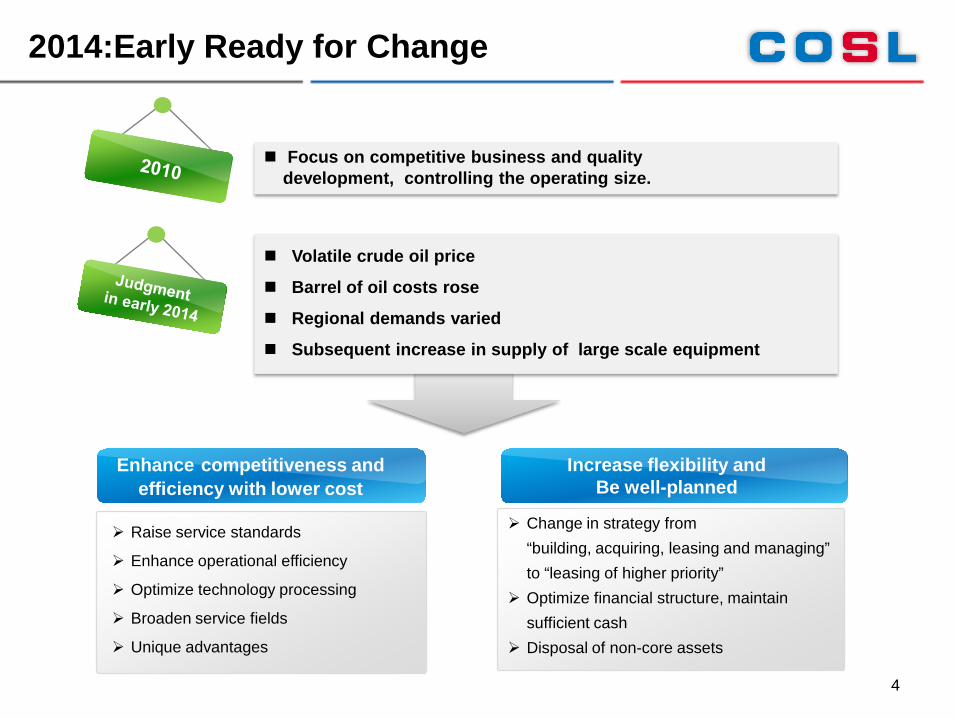
Volatile crude oil price
Barrel of oil costs rose
Regional demands varied
Subsequent increase in supply of large scale equipment
2014:Early Ready for Change
Increase flexibility and Be well-planned
Change in strategy from “building, acquiring, leasing and managing” to “leasing of higher priority”
Optimize financial structure, maintain sufficient cash
Disposal of non-core assets
Enhance competitiveness and efficiency with lower cost
Raise service standards
Enhance operational efficiency
Optimize technology processing
Broaden service fields
Unique advantages
Focus on competitive business and quality development, controlling the operating size.
4
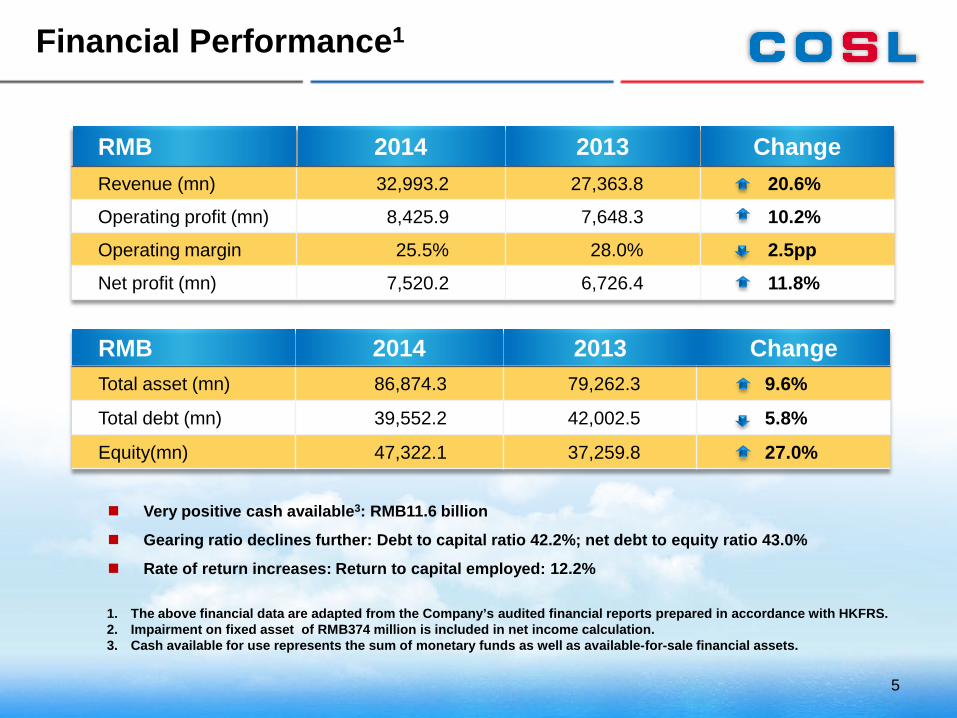
Financial Performance1
RMB 2014 2013 ChangeRevenue (mn) 32,993.2 27,363.8 20.6%
Operating profit (mn) 8,425.9 7,648.3 10.2%
Operating margin 25.5% 28.0% 2.5pp
Net profit (mn) 7,520.2 6,726.4 11.8%
1. The above financial data are adapted from the Company’s audited financial reports prepared in accordance with HKFRS. 2. Impairment on fixed asset of RMB374 million is included in net income calculation.3. Cash available for use represents the sum of monetary funds as well as available-for-sale financial assets.
Very positive cash available3: RMB11.6 billion
Gearing ratio declines further: Debt to capital ratio 42.2%; net debt to equity ratio 43.0%
Rate of return increases: Return to capital employed: 12.2%
5
RMB 2014 2013 ChangeTotal asset (mn) 86,874.3 79,262.3 9.6%
Total debt (mn) 39,552.2 42,002.5 5.8%
Equity(mn) 47,322.1 37,259.8 27.0%

2014 Operating Results
6
2
3
1
Technology Outperformed Equipment
Revenue
9.8
2.7
6.954 7,062
20,889
23,460
2013 2014
47%
12%
Operating Profit
2%
9.8
694 1,364
9,533
2013
97%
20142013 2014 2013
6,475
20142013 2014
4044
Patents Increased
2012 2013 2014
Semi-subJack-up
27
8
30
10
33
11
Expand High-end
463
621
763
69%
31%
Domestic International2013 2014
24%
18,466
22,901
Domestic Revenue International Revenue
2013 2014
13%
8,89810,092
(in RMB million) (in RMB million)
(No. of drilling rigs)
(Equ
ipm
ent s
ecto
r)
(Tec
hnol
ogy
sect
or)
(in RMB million)
(Cum
ulat
ive
no. o
f pat
ents
)

2014 Operating Results
7
Numbers of rigs: received recognitions from
clients, including “Rig of the Month”
HYSY981: completed the deepwater operation in
South China sea 33 days ahead of schedule
Excellent equipment management: Downtime at
1.28 hours/rig/month, equipment integrity rate:
99.41%
Drilling:completed operations in advance with
high efficiency, saved 839 operation days for
clients
Marine support:total voyage increased by
13,000 sea miles which increased job difficulties.
Fuel consumption down by 4600 tons
(4.26%) y-o-y through a variety of optimizations
Well services:new technologies saved 5600
operation hours for clients
Efficiency & competitiveness further increased
Enhance efficiency with lower costs, offer value-added services

Further improve the four regional international businesses, built logistic bases in Singapore and Mexico;
Named the worldwide recognized supplier by Total S.A and Shell;
Steady growth in the Mexican market: New added COSLHunter and COSL7 commenced operation, received
recognition from customers because of excellent services.
Int’l Development
Regional and clients diversification
Regional distribution
美洲12%
41%Europe
18%
Middle East 19%S.E. Asia
14%The Americas
8%Others
Singapore base
8
R&DManufacturing
HRTraining
LogisticsSupply

0%
10%
20%
30%
0
2
4
6
8
10
12
2013 2014
Deepwater Capability
First time of joint operation in the South
Sea between HYSY720 and Shell
12-streamer Geophysical Service Fleet
HYSY721 was delivered and launched
GeophysicalSurveying
Deepwater AHTS vessels operated
steadily
Purchased 3 deepwater PSV and
commenced operation
Marine SupportDrilling
High efficient operated 3 Semis in the North Sea HYSY981 operated in Lingshui 17-
2, efficiency reached 98% Achieved breakthrough: IPM operations
in the South Sea
Well Services
Self-developed ELIS logging units
and high end logging units
equipment, deepwater drilling fluids
and cement slurries in terms of deep
water fields
9
Deepwater Revenue up 35%
Contribution up to 20%
18%
20%
RevenueRMB Billion
Proportion(%)
Note: Deepwater businesses above included: drilling rigs operating at water depths over 500 meters, 12-streamer survey vessels and deepwater surveying vessels, deepwater AHTS vessels and PSV, and deep water well services business.
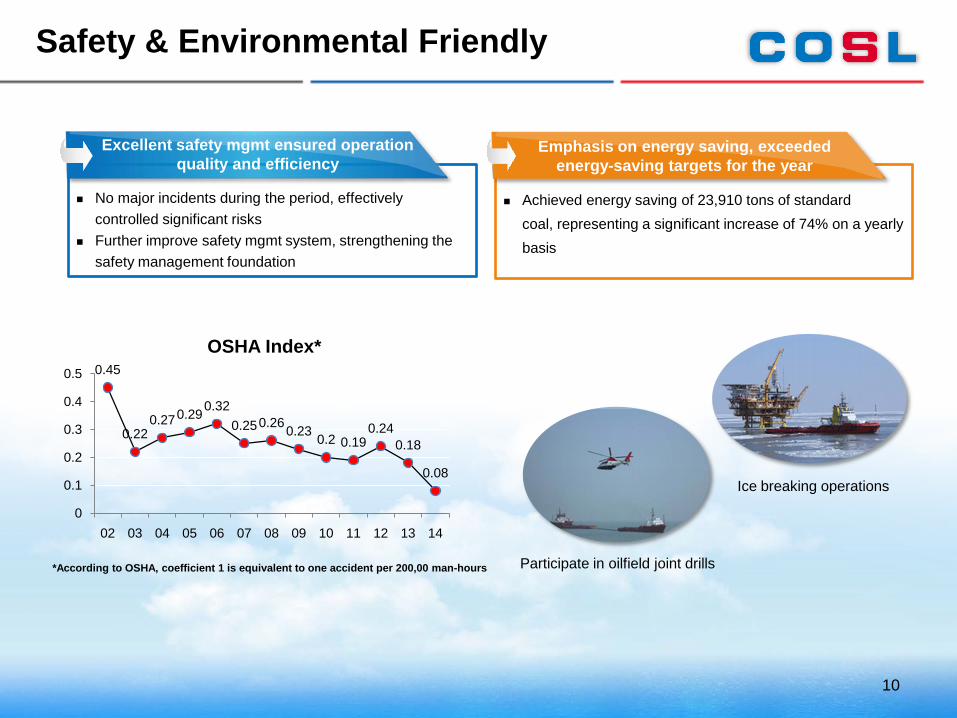
Safety & Environmental Friendly
Excellent safety mgmt ensured operation quality and efficiency
No major incidents during the period, effectively controlled significant risks
Further improve safety mgmt system, strengthening the safety management foundation
Emphasis on energy saving, exceededenergy-saving targets for the year
Achieved energy saving of 23,910 tons of standard coal, representing a significant increase of 74% on a yearly basis
Ice breaking operations
Participate in oilfield joint drills
10
0.45
0.220.270.290.32
0.250.260.23 0.2 0.190.24
0.18
0.08
0
0.1
0.2
0.3
0.4
0.5
02 03 04 05 06 07 08 09 10 11 12 13 14
OSHA Index*
*According to OSHA, coefficient 1 is equivalent to one accident per 200,00 man-hours

First company in China and the
fourth in the world with these
two technologies
Completed land drills, sea drills
and the offshore joint
operations for the first time
ELIS® image logging unit
Completed in tackling key technical problems such as 3D sound waves, 2D nuclear magnetic resonance, laterlogarray and oil-base mud drilling imaging
Overall standard up to international advanced level
Research & Development
11
Application of the R&D results above demonstrated COSL has the ability to meet customer demands for high value-added technologies and provide know-how solutions.
Deepwater drilling fluids and cementing technology
Breakthroughs in on-site
application with operational
experience depth to 1,500m
Able to offer 2,500m depth of
deepwater drilling fluids and
cementing technology
Welleader ® and Drilog ®
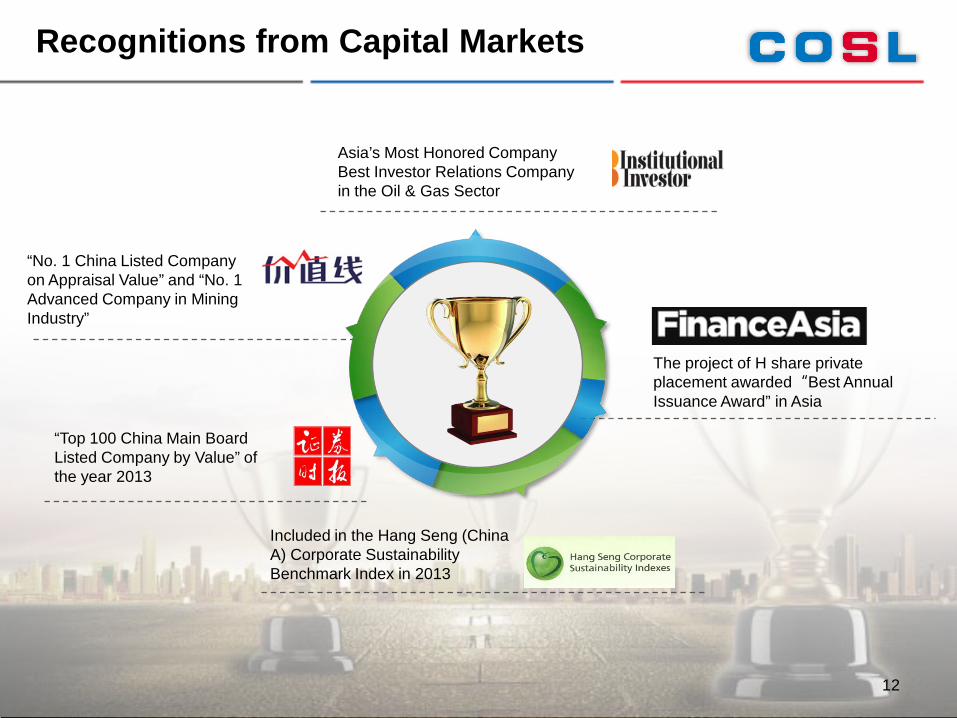
Recognitions from Capital Markets
The project of H share private placement awarded“Best Annual Issuance Award” in Asia
“Top 100 China Main Board Listed Company by Value” of the year 2013
“No. 1 China Listed Company on Appraisal Value” and “No. 1 Advanced Company in Mining Industry”
Asia’s Most Honored CompanyBest Investor Relations Company in the Oil & Gas Sector
12
Included in the Hang Seng (China A) Corporate Sustainability Benchmark Index in 2013

2. Segments Review
3. Company Prospects
1. Results Overview
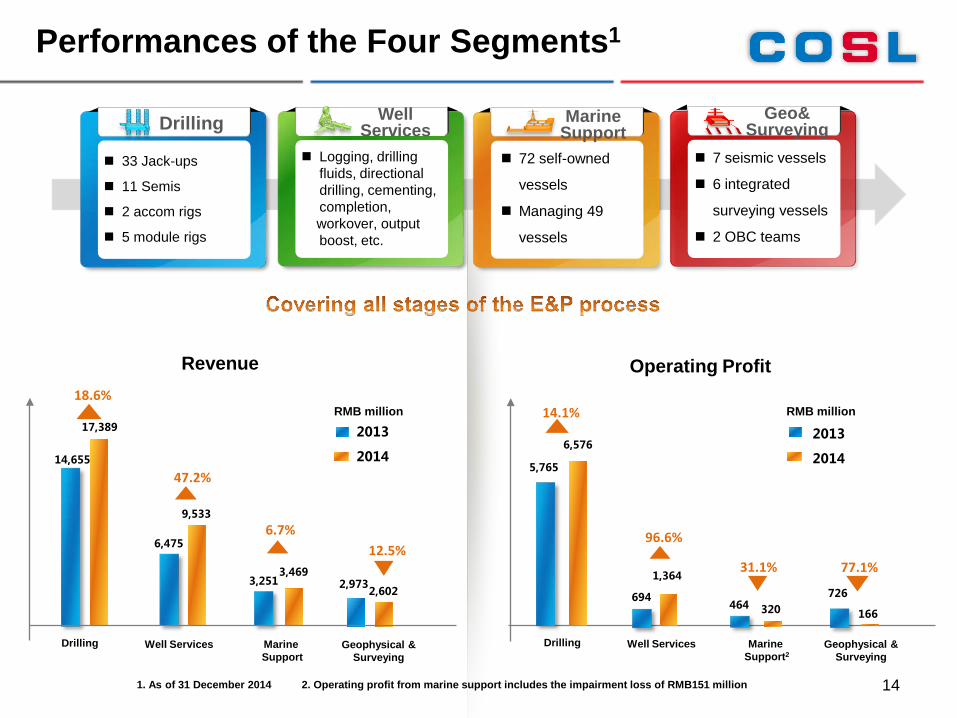
Performances of the Four Segments1
5,765
6,576
694
1,364
464 320726
166
14.1%
96.6%
31.1% 77.1%
2013
201414,655
17,389
6,475
9,533
3,2513,469
2,9732,602
18.6%
47.2%
6.7%12.5%
2013
2014
14
Geo& Surveying
7 seismic vessels
6 integrated
surveying vessels
2 OBC teams
Drilling
33 Jack-ups
11 Semis
2 accom rigs
5 module rigs
Marine Support
72 self-owned
vessels
Managing 49
vessels
Well Services
Logging, drilling fluids, directional drilling, cementing, completion, workover, output boost, etc.
1. As of 31 December 2014 2. Operating profit from marine support includes the impairment loss of RMB151 million
Revenue Operating Profit
RMB million RMB million
Drilling Well Services Marine Support
Geophysical &Surveying
Drilling Well Services Marine Support2
Geophysical &Surveying

2013 2014
17.018.0
91.8%
95.6%
2013
92.1%
3Q14 2014
Drilling & Well Services
Expanded fleet; More high-spec rigs; Higher daily income; More days spent on repairing and oil price drop lead to decreased utilization rate
NH9 and COSLPromoter made full year contribution in 2014
COSLGift and COSLHunter, the high-end jack-ups, were purchased in 2013 and launched in January and April respectively
Efficient leased HYSY932, Gulf Driller I and Kaixuanyihao commenced operation in April, May and July respectively
in USD ’0000/day
Calendar-day Utilization Rate
Average Daily Income
Driven by the drilling synergistic effects Various rigs such as NH9, HYSY932, Gulf Driller I and Kaixuanyihao newly operated in
domestic offshore, driving operation growth of logging, directional drilling, cementing and drilling fluids.
Enhanced technology competitiveness, highly difficult wells, complicated wells and deep-water wells increased
Overall breakthroughs were made with self-developed ELIS logging units and high end logging units equipment, applications of new materials and technologies including deep-water drilling fluids and cement slurries in terms of deep water fields
Oilfield technology equipment and staff operated at full capacity
15

Marine Support & Geo Surveying
Purchased 3 vessels; 2 vessels commenced operations in 2H13 Calendar-day utilization rate maintained stable at 93.6% Chartered vessels achieved 17,183 operating days, up 2,887 days y-o-y with revenue
aggregated RMB1.36 billion Disposal chemical carriers (non-core) business
Reasonable allocation of resources, enhance competitiveness and leading position
16
2D
2014
2013
1H Workload 2H Workload
14,854
12,215
11,122
8,976
Oil price drops led to a decrease in workload and price, sector performance was directly affected. Tried to improve efficiency and reduce production costs
Safety and quality service, stable market demand
2013 14,011 9,645
12,9334,0342014
Data Collection (km) Data Processing (km)
3D
2014
2013 12,899
17,085
11,776
7,121
2013 16,965
6,4712014 11,305
7,432
Data Collection (km2) Data Processing (km2)
1H Workload 2H Workload

2. Segments Review
3. Company Prospects
1. Results Overview

Current Industry Circumstances
Stepping into 2015, international oil price volatiles at USD50/barrel, investment and demand of oil companies significantly reduced.
Further intensified competition in global oilfield service market, prices and utilization rates of various kinds of services have dropped in different extents.
1
2
3
5
18
COSL also faces challenges of the industry; Relying on good fundamentals, COSL will actively seize the industry integration
opportunity and strive to obtain new development.
Global utilization rate of jack-ups fell to 80%, semis fell to 84% 1;
Global utilization rate of seismic vessels was low;
Price cuts, layoffs, discontinuation of business units occurred in the industry.
1. Source: IHS Petrodata, as of February 2015
In medium to long term, oil and gas remains an important component in overall energy consumption structure.
3
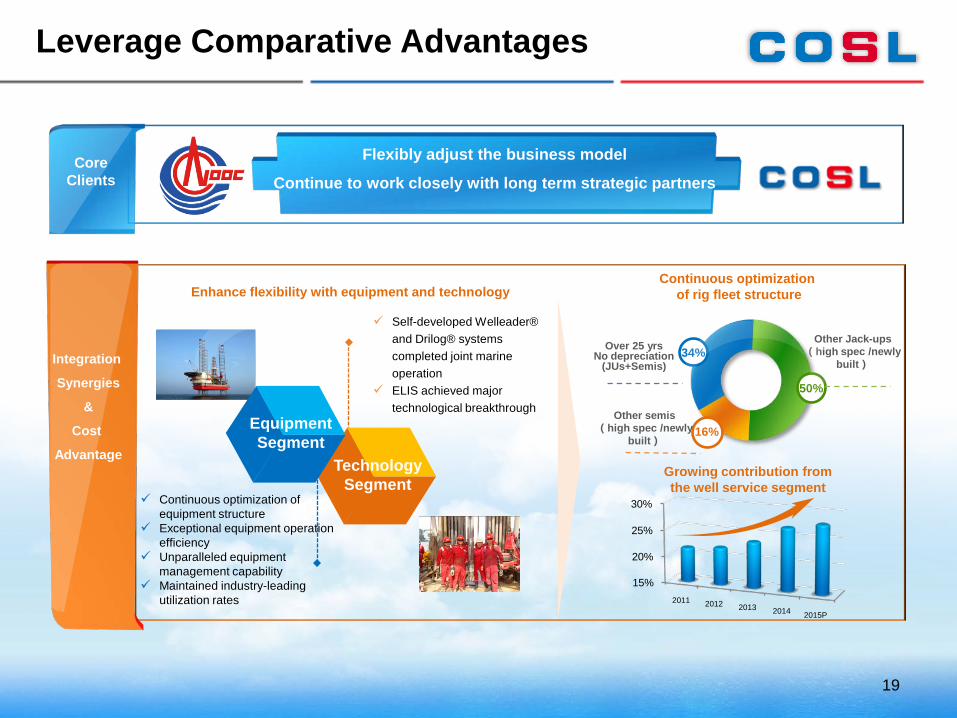
Leverage Comparative Advantages
19
Flexibly adjust the business model
Continue to work closely with long term strategic partners
15%
20%
25%
30%
2011 2012 2013 2014 2015P
Continuous optimization of rig fleet structure
Growing contribution fromthe well service segment
34%
50%
16%
Over 25 yrsNo depreciation
(JUs+Semis)
Other semis(high spec /newly
built)
Other Jack-ups(high spec /newly
built)
Enhance flexibility with equipment and technology
EquipmentSegment
TechnologySegment
Continuous optimization ofequipment structure
Exceptional equipment operationefficiency
Unparalleled equipmentmanagement capability
Maintained industry-leading utilization rates
Self-developed Welleader®and Drilog® systems completed joint marine operation
ELIS achieved major technological breakthrough
CoreClients
Integration
Synergies
&
Cost
Advantage

Healthy financial structure provides higher flexibility
COSL's liquidity is very strong… The company also has abundant undrawn credit facilities from domestic and overseas banks and good access tothe debt and equity capital markets.
20
“……low cash cost and and goodliquidity help Asian oil companies tomanage themselves against low oilprices ……”
1. Cash available for use represents the sum of money market funds as well as available-for-sale financial assets. Financial data as of end of 2014
Leverage Comparative Advantages
Very positive cash available for use1:RMB11.6 billion
Further improved gearing: debt-to-assets ratio: 42.2%
Net debt-to-equity ratio: 43.0%
Debt cost: 2.1%, much lower than industry average
Source: Bloomberg, as of 23 Mar 2015
Moody’s S&P Fitch
Schlumberger Aa3 (stable) AA- (stable) -
Halliburton A2 (stable) A (under negativewatch list) -
Baker Hughes A2 (stable) A (under negativewatch list) -
COSL A3 (stable) A- (stable) A (stable)
Diamond A3 (stable) A- (neg) -
Ensco Baa1 (stable) BBB+ (stable) -
Oceaneering Intl Baa2 (stable) BBB (stable)
Noble - BBB (stable) Not rated
Weatherford Baa3 (stable) - -
Rowan Rating withdrawn BBB- (stable)
Atwood Oceanics Ba2 (stable) BB (stable)
CGG SA Rating withdrawn B (neg)
Hercules Offshore Caa2 (neg) CCC (neg)

Rig Operation Status in 2015
Location Drilling Rig2015
Jan Feb Mar Apr May Jun Jul Aug Sep Oct Nov Dec
Domestic
20 Jack-ups1
(contract terms until end-2015)2 Semi-submersibles
(contract terms until end-2015)
COSLProspector*
HYSY941*
COSLGift*
NH8*/NH9*
NH5*
NH7*
International
6 Jack-ups2
(contract terms until end-2015)3 Semi-submersibles3
(contract terms until end-2015)COSLPower
HYSY937 卡塔尔
COSLSeeker
COSLSuperior*/COSLBoss*
NH6*
21
Note: Data above as of 30 March 2015 and may subject to change; rigs under maintenance are not shown;Jack-ups are marked in blue and semis are marked in green. * Changes of rig contracts occurred during the period of early February till now.1.It is planned to surrender the rental of KT2 after the completion of the short-term operations contract.2.COSLHunter is serving a contract while a subsequent contract is pending confirmation.3.COSLPioneer has suspended its operation and it is expected to resume operation in August.
Australia Under Maintenancein China
Maintenance.
IND
IND
New Delivered
Qatar/S.E. Asia
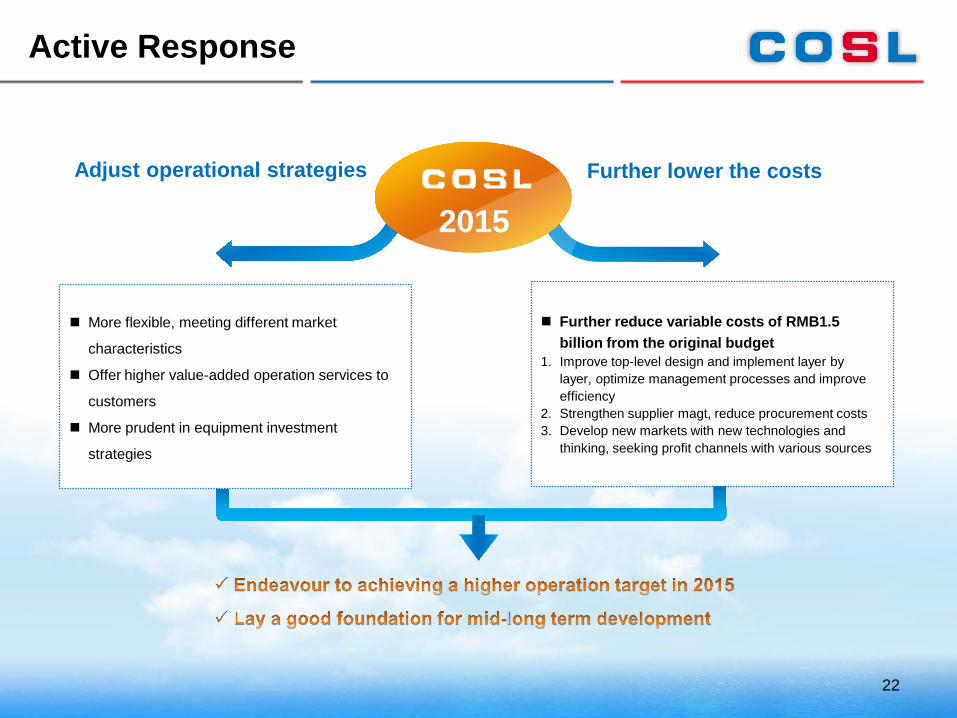
Active Response
2015Adjust operational strategies
More flexible, meeting different market
characteristics
Offer higher value-added operation services to
customers
More prudent in equipment investment
strategies
Further reduce variable costs of RMB1.5 billion from the original budget
1. Improve top-level design and implement layer by layer, optimize management processes and improve efficiency
2. Strengthen supplier magt, reduce procurement costs3. Develop new markets with new technologies and
thinking, seeking profit channels with various sources
Further lower the costs
22

Market Expansion Strategies
Domesticmarket
Active expansion of new
service model, help clients
lower cost while enhancing
efficiency;
Secure leading market
position and market shares in
offshore China.
International market
Explore new business
operation model, offer
suitable solutions closely in
line with clients needs;
Consolidate and expand
overseas market, promote
integrated services.
New projects and opportunities
Mexico market
Middle East market
Canada market
23

CAPEX Plan
24
Drilling(~45%) Well service(~15%)
Marine support(~20%) Geophysical(~20%)
Prudent Capex principle; Continue to implement the projects under construction, selectively upgrade or retire equipment; Increase investment in self-developed high-end technology to enhance competitiveness; Lay a good foundation for mid-long term development.
2015 total6.5-7.5 bn

Proposed Dividend Allocation
Adhere to payout principle of consistency
Payout ratio is 31% Total dividend payment is RMB 2.29 billion The proposed dividend payment to be approved by the upcoming AGM.
Proposed final ordinary share dividends in 2014:RMB0.48/share (tax included)
25
Take both Company development and
shareholder returns into account
Balance short term and mid-long term development
demand

Development Drivers
Strategic partner in China offshore core market provides fundamental guarantee for COSL’s operating performance.
Unique operating efficiency and rising international reputation offer COSL more market opportunities.
Leading cost advantage supports COSL with strong competitiveness during the industry trough.
Excellent financial advantage enables COSL to develop in more flexible business models.
26