hunters hill radioactive waste - 25 11-2011 - nsw parliament

Sydney Ports CorporationAnnual Report 2004
Contents
1 2003–04 Highlights
4 Chairman’s and
Chief Executive Officer’s report
10 Fostering the State’s trade
18 Facilitating trade
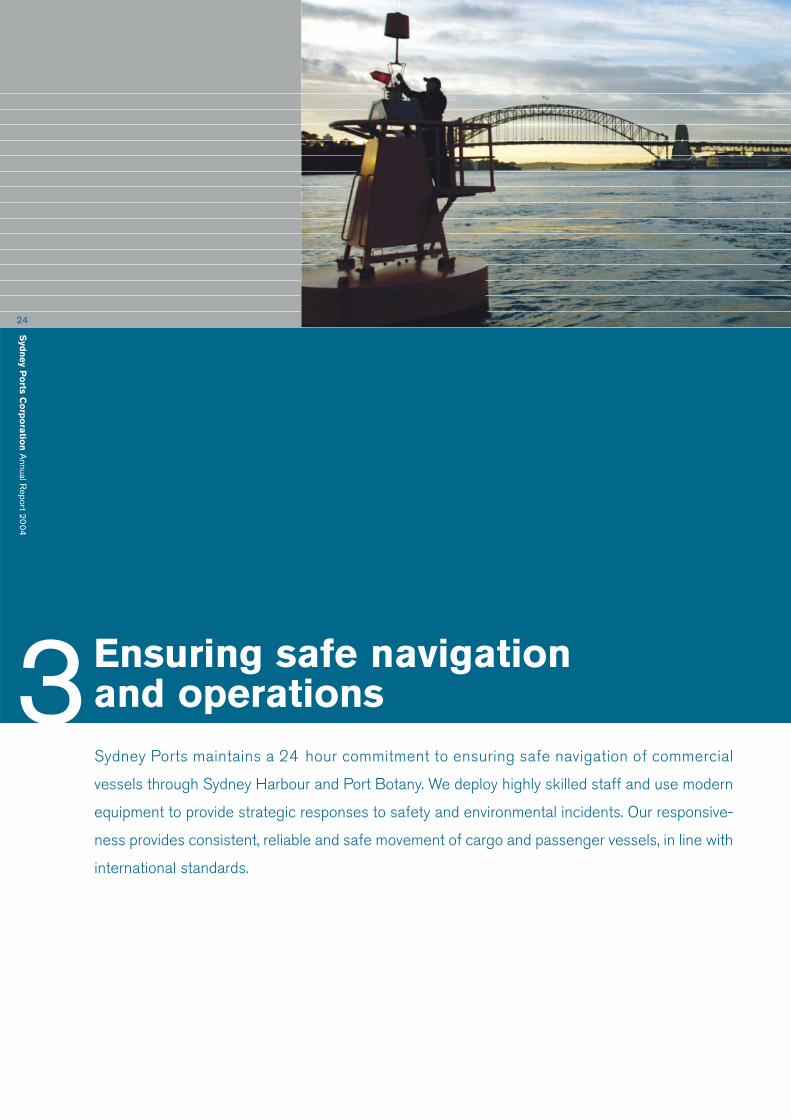
24 Ensuring safe navigation
and operations
28 Stepping up security
30 Protecting the environment
32 Working with industry,
government and the community
36 Investing in our people
38 Board of Directors
40 Management structure
Maps
42 Sydney Harbour port facilities
43 Port Botany port facilities
44 NSW road and rail links
45 Metropolitan road and rail links
46 Port Botany
47 Port Botany proposed expansion
Key roles, objectives and results
49 Key roles, objectives and results
50 Key performance indicators
51 Environment indicators
53 Port users and stakeholders
54 Safety and navigation
55 Environment and community
55 Finance
56 People
57 Business operations
Financial Statements
58 Sydney Ports Corporation
Financial Statements
90 Sydney Pilot Service
Financial Statements
111 Statutory disclosures
119 Appendices
122 Glossary
Syd
ney P
orts C
orp
ora
tion
Annual R
eport 2004

Syd
ney P
orts C
orp
ora
tion
Annual R
eport 2004
1
2003–04 2002–03 % change
Financial (million)
Revenue from port operations 124.5 113.9 9
Pre-tax profit 51.8 41.2 26
Income tax payable 16.7 15.1 11
Capital expenditure 12.0 23.2 48
Dividend payable 17.6 13.2 33
Shareholder value added 12.8 11.5 11
Trade
Total cargo (mass tonnes) 25.1 23.6 6
Total container trade (TEU’s) 1,270,216 1,160, 747 9
Volume of containers moved by rail (to and from Port Botany) 250,000 255,000 2
Shipping
Total commercial vessel visits 2,408 2,331 3
Gross Tonnage (GT – million) 64.1 60.0 7
TEU = Twenty Foot Equivalent Unit% change reporting year against 2002–03, nearest %
2003–04 Highlights– Successful PSOL audit with no non-conformances,
maintaining our international safety standards
– NSW Ports Growth Plan announced in October 2003
– New and unprecedented security arrangements introduced
– Record container trade of 1.27 million TEUs
– A new record set for motor vehicle imports of 220,775
– Growth in bulk and break bulk trade
– All financial targets were achieved and increasedshareholder value
– Environmental Impact Statement for proposed Port Botany expansion lodged
– Spirit of Tasmania III service launched

SYDNEY PORTS CORPORATION ABN 95 784 452 933
Level 8, 207 Kent Street Sydney NSW Australia 2000
PO Box 25 Millers PointSydney NSW Australia 2000
Telephone +61 2 9296 4999
Facsimile + 61 2 9296 4742
www.sydneyports.com.au31 October 2004
The Hon MR Egan, MLC The Hon JJ Della Bosca, MP
Treasurer Special Minister of State
Minister for State Development, and Minister for Commerce
Vice President of the Executive Council Minister for Industrial Relations
Governor Macquarie Tower Assistant Treasurer and
Level 33, 1 Farrer Place Minister for the Central Coast
Sydney NSW 2000 Governor Macquarie Tower
Level 33, 1 Farrer Place
Sydney NSW 2000
Dear Messrs Egan and Della Bosca
This annual report covers Sydney Ports Corporation’s operations and statement of accounts for the year ended 30 June
2004, in accordance with the provisions of the Annual Report (Statutory Bodies) Act 1984 and the applicable provisions
of the Public Finance and Audit Act 1983 and the State Owned Corporations Act 1989, and is submitted for presentation
to Parliament.
Yours faithfully
Mr David LP Field Mr Greg J Martin
Chairman Chief Executive Officer
4
Syd
ney P
orts C
orp
ora
tion
Annual R
eport 200
4
4
The 2003 –04 financial year was a defining period for Sydney Ports Corporation. The NSW
Government announced medium and long-term policies. These provided direction for future
operational, planning, investment and environmental activity in Sydney Harbour and Port Botany.
During the year, trade through the port continued to grow,
reaching new records.
New and unprecedented security arrangements were
implemented during the year, bringing the ports up to national
and international standards.
These developments took place in parallel with significant
operational changes in Sydney Harbour and continuing prepar-
ation for berth and terminal expansion at Botany.
The Corporation continued its mission of evolving into a multi-
faceted and strategic trade facilitator, balancing economic,
social and environmental responsibilities to ensure efficiency
along the logistics chain.
Our efforts in devising and delivering innovative trade
solutions, by working closely with industry, government and
community stakeholders, produced positive results.
The Corporation passed a significant milestone: in May 2004
the Sydney Ports Board held its 100th meeting since corp-
oratisation in 1995.
A defining year: strong tradeand a firm sense of direction
Chairman’s and Chief Executive Officer’s report
Syd
ney P
orts C
orp
ora
tion
Annual R
eport 2004
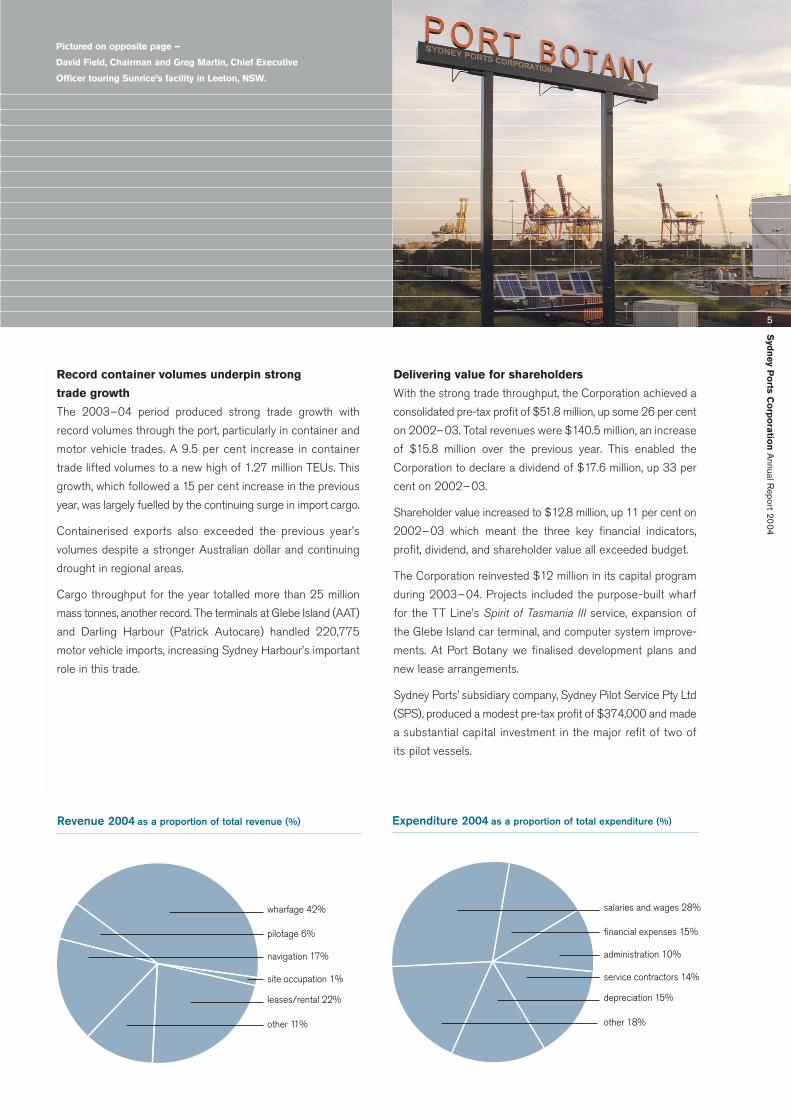
Record container volumes underpin strong
trade growth
The 2003–04 period produced strong trade growth with
record volumes through the port, particularly in container and
motor vehicle trades. A 9.5 per cent increase in container
trade lifted volumes to a new high of 1.27 million TEUs. This
growth, which followed a 15 per cent increase in the previous
year, was largely fuelled by the continuing surge in import cargo.
Containerised exports also exceeded the previous year’s
volumes despite a stronger Australian dollar and continuing
drought in regional areas.
Cargo throughput for the year totalled more than 25 million
mass tonnes, another record. The terminals at Glebe Island (AAT)
and Darling Harbour (Patrick Autocare) handled 220,775
motor vehicle imports, increasing Sydney Harbour’s important
role in this trade.
Delivering value for shareholders
With the strong trade throughput, the Corporation achieved a
consolidated pre-tax profit of $51.8 million, up some 26 per cent
on 2002–03. Total revenues were $140.5 million, an increase
of $15.8 million over the previous year. This enabled the
Corporation to declare a dividend of $17.6 million, up 33 per
cent on 2002–03.
Shareholder value increased to $12.8 million, up 11 per cent on
2002–03 which meant the three key financial indicators,
profit, dividend, and shareholder value all exceeded budget.
The Corporation reinvested $12 million in its capital program
during 2003–04. Projects included the purpose-built wharf
for the TT Line’s Spirit of Tasmania III service, expansion of
the Glebe Island car terminal, and computer system improve-
ments. At Port Botany we finalised development plans and
new lease arrangements.
Sydney Ports’ subsidiary company, Sydney Pilot Service Pty Ltd
(SPS), produced a modest pre-tax profit of $374,000 and made
a substantial capital investment in the major refit of two of
its pilot vessels.
Revenue 2004 as a proportion of total revenue (%) Expenditure 2004 as a proportion of total expenditure (%)
salaries and wages 28%
depreciation 15%
other 18%
service contractors 14%
financial expenses 15%
administration 10%
wharfage 42%
leases/rental 22%
other 11%
site occupation 1%
pilotage 6%
navigation 17%
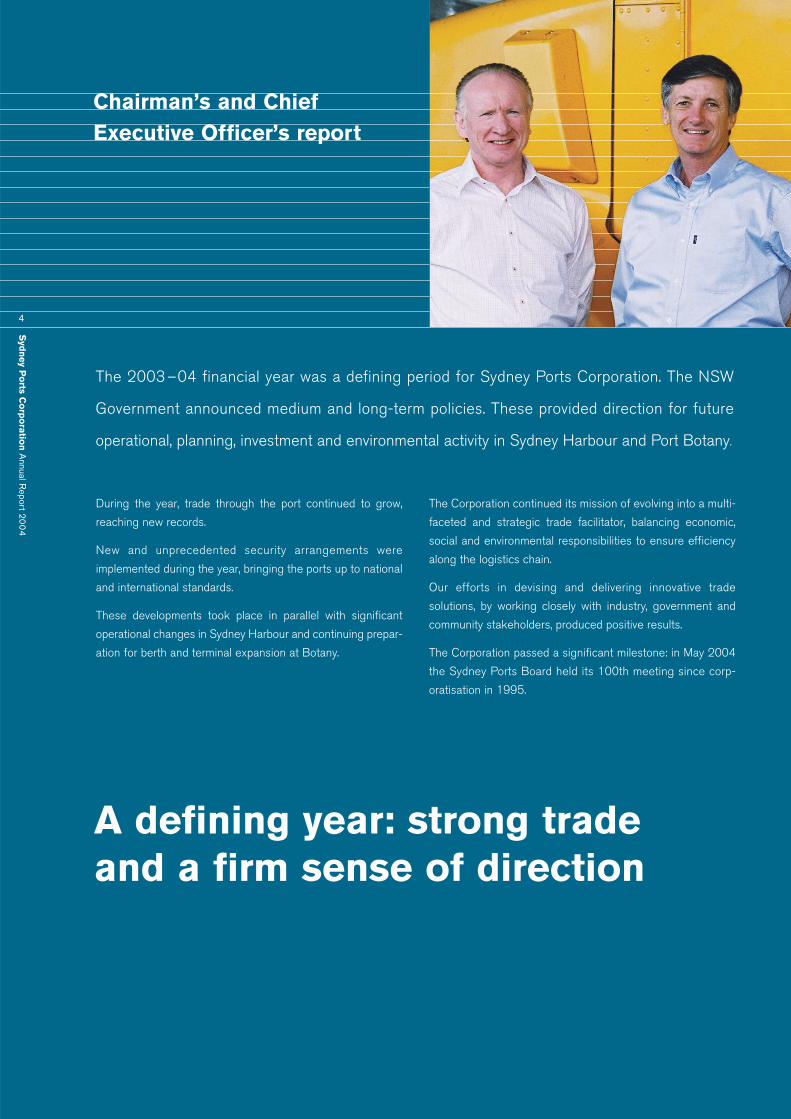
Pictured on opposite page –
David Field, Chairman and Greg Martin, Chief Executive
Officer touring Sunrice’s facility in Leeton, NSW.
5

Syd
ney P
orts C
orp
ora
tion
Annual R
eport 2004
6
The NSW Ports Growth Plan
During the year, the NSW Government made a major policy
announcement which provided a clear long term strategy for
future port development in the State.
The NSW Ports Growth Plan, unveiled in October 2003 by
Premier Bob Carr, provides port operators and the maritime in-
dustry with a framework for future development and investment.
The Ports Growth Plan establishes a framework for the future
of Sydney’s two ports including:
– Port Botany is to remain the State’s major container port
until it reaches capacity. The Government decided that the
Corporation’s proposed 60 hectare terminal expansion should
be referred for review to an independent Commission of
Inquiry (COI), established in January 2004. The COI will make
recommendations to the Minister for Infrastructure, Planning
and Natural Resources.
– The examination of how to increase the proportion of containers
moved by rail to and from the ports to intermodal terminals in
both the Sydney metropolitan area and regional NSW.
– The Plan allows for a phasing-out of containers and general
cargo trade in Port Jackson after stevedoring leases expire
in 2006.
Sydney Harbour will remain a working port. Passenger ships
and other port cargoes such as dry bulk, oil, bulk liquid and
motor vehicle imports will continue to move through the port
until current leases, with options to 2017 or in some cases
2020, expire. Cruise shipping would continue to be a major
user of the Harbour over the long term.
The Corporation has been working closely with shipping lines
affected by these changes, to assist them in the transition to
other facilities.
An important objective of the Ports Growth Plan is to move
more containers onto rail to improve freight transport efficiency
and ease the environmental and social impacts of road
transport. To achieve the Corporation’s goal of moving 40 per
cent of containers by rail by 2010, Sydney Ports still sees a
need to consider development options for intermodal facilities
across Sydney, including the Enfield site.
A Parliamentary Inquiry into Port Infrastructure in NSW by the
Legislative Council Standing Committee on State Development
was established in October 2003. Sydney Ports Corporation
appeared before this Inquiry in April 2004.
The Corporation looks forward to presenting to the COI during
October 2004, following the adjournment in May 2004, to pursue
approval to expand Port Botany.
Container trade is expected to grow to around 3.5 million TEUs
by 2025, with existing facilities anticipated to reach capacity
by around 2010. It is therefore crucial for the Corporation to
obtain planning approval so that construction can commence
during 2005 – 06.
Trade by total cargo (mass tonnes – millions)
0
30
Mass tonnes (m)
24
12
18
6
2000 2001 2002 2003 2004

Syd
ney P
orts C
orp
ora
tion
Annual R
eport 2004
The obligation for the Corporation to be prepared for increasing
trade has never been greater. This was underlined during the
year by MSC, one of the world’s largest container shipping
companies, which expressed strong interest in upgrading
services to Sydney and vying for space at Port Botany if
expansion is approved.
Other important Federal and State policy decisions during the
year will provide medium-term benefits to Port Botany.
One is the agreement between the Commonwealth and
the NSW Government to lease the interstate rail network
(managed by the Australian Rail Track Corporation(ARTC)).
This will enable vital work to commence on the important
Sefton Park to Macarthur Southern Sydney Freight Line. The
line will facilitate the movement of cargo from south-western
Sydney and the Riverina region to Port Botany, avoiding
passenger rail curfews.
The Federal Government’s AusLink road and rail improve-
ment initiative, announced in June 2004, was an encouraging
step towards improving cargo movement across Sydney and
other parts of the State.
The NSW Government announced a preferred option for the
extension of the M4 to the City West Link. This development
would ease freight movements from the west. It will benefit
transport operators, as will the construction of the $1.5 billion
Western Sydney Orbital (M7), which commenced early in 2004.
Security measures a high priority
The threat of a terrorist attack on port facilities and other
significant infrastructure has become an inescapable reality.
The onus is on the owners of all essential infrastructure to
provide an appropriate level of security.
The Corporation, to meet its security obligations, is complying
with the Australian Maritime Transport Security Act 2003, which
came into effect on 1 July 2004. The Act fulfils the require-
ments of the International Maritime Organisation’s International
Ship and Port Facility Security (ISPS) Code. The code is
intended to create security parity between ports worldwide.
Complying with the new measures involved a phase of
intense preparation and planning. Sydney Ports prepared a
series of risk assessments and security plans that required
Commonwealth approval. Significantly, we achieved the required
outcomes by June 2004, just six months after Australia’s new
Maritime Transport Security Act 2003 received assent in
December 2003.
The Corporation is committed to working with the Common-
wealth and all interested bodies to ensure that the plans
work in practice. The financial impost of complying with the
new security arrangements will be significant, in the initial
capital expenditure required and in annual operating costs.
The Federal Government has made it clear – security is a
cost of doing business. Therefore Sydney Ports will need to
levy port users to recover costs in a revenue neutral manner.
7
Pictured right – P&O’s Pacific Princess approaching
Wharf 8 Cruise Terminal in Darling Harbour

Syd
ney P
orts C
orp
ora
tion
Annual R
eport 2004
8
Safe navigation through the ports
Another important achievement during the year was the
successful audit certification of our Port Safety Operating
Licence for the ninth consecutive time. The Corporation has
consistently and professionally met all safety benchmark
requirements under the licence since corporatisation in 1995.
Vessel visits during the year to Sydney’s ports reached 2,408,
a three per cent increase on the previous year.
The largest container ship to ever visit Sydney, the MSC
Fabienne, which has a 5,050 TEU capacity, sailed into Port
Botany in April to collect a cargo of empty containers.
The Corporation warmly welcomed the start of the new
regular ferry service between Sydney and Devonport, with the
Spirit of Tasmania III embarking on her maiden voyage in
January 2004. The service added a new dimension to ship-
ping in Sydney Harbour.
Cruise shipping activity was strong, with 81 vessel visits
throughout the year.
A second tug service, Australian Maritime Services (AMS),
commenced operations in Port Botany in October 2003 and
stimulated towage competition. It also laid the foundations for
a second lines service operator, Ausport Marine, to com-
mence operations in Port Botany from July 2004.
Promoting the ports through co-operation with users
The Board and the Corporation’s staff upheld our key objective
of maintaining close working relationships with port users,
other interest groups and trade organisations. In October
2003 the Board and senior trade staff strengthened relations
with rural stakeholders by holding meetings in Bathurst,
Orange and Manildra.
In March 2004 Sydney Ports Corporation signed an important
agreement with the Port of Los Angeles, an arrangement that
provides a mutually valuable liaison between the Corporation
and one of the world’s largest ports.
Our dedicated staff
To celebrate the important contributions of Sydney Ports’
staff members, the Corporation launched a new program in
May 2004 – the ‘Bravo!’ awards, which recognise the most
significant contributions by staff members each quarter.
As well, we introduced a valuable new program to foster leader-
ship qualities among executive staff and senior managers.
This program will continue into 2004–05.
Enterprise bargaining negotiations, commenced in early 2004
for the 2004–07 Sydney Ports Enterprise Agreement. The
parties had reached agreement with the formalities of
the agreement to be concluded soon after the end of the
reporting period.
Sydney’s Pilots are negotiating a new three-year enterprise
agreement with their employer, Sydney Pilot Service Pty Ltd
(SPS), a subsidiary company of Sydney Ports Corporation. At
the time of reporting, negotiations were nearing a successful
conclusion. Negotiations were underway at the time of reporting
for a new Launch Crew Agreement.
Pictured right – David Solomons, Senior Project Engineer,
Sydney Ports’ inaugural ‘Bravo!’ winner.

Syd
ney P
orts C
orp
ora
tion
Annual R
eport 2004
Planning and working for future service and safety
The year ahead will be a critical period building on the policies
and strategies of 2003 –04. Being prepared to build on the
strong growth of 2003 –04 will be our key challenge. We will
need to maintain our high level of commitment and dedication
to service and safety to ensure that we meet the expectations
of our customers and all other interested parties.
In planning the successful future of Port Botany, we will
continue to co-operate fully with the COI, in the interests of
ensuring that all of the important aspects of proposed
development at the port are discussed fairly, thoroughly
and transparently.
Future uses of Darling Harbour – where stevedoring leases
expire in 2006 – will be subject to a master plan, which is
expected to maintain the long-term interests of cruise shipping
in Sydney Harbour.
Maintaining the efficiency of the transport chain will be
essential. Pivotal to this will be the development of the NSW
Metropolitan Intermodal Freight Strategy, expected to be
released by the Department of Infrastructure Planning and
Natural Resources (DIPNR) during 2004–05. The strategy
will aim to follow the direction provided by the Ports Growth
Plan. As mentioned above, Sydney Ports proposes that
Enfield should be considered as a part of the planned
solution, to facilitate the movement of more containers by rail.
The proposed purchase of the Cooks River rail yards would
help us to manage the surplus of empty containers in Sydney.
Another of our key priorities will be improving regional trade
development by working with exporters and service providers,
and by improving transport links to the Riverina and to the
State’s central west and north-west.
To accommodate continued growth in the bulk liquid trade,
we are investigating the future capacity of the existing
bulk liquids facility. The Corporation will consider the need to
construct a second bulk liquids berth at Port Botany.
We will continue to pay close attention to security matters,
fulfilling our obligation to ensure that we comply with the
Maritime Transport Security Act 2003 and the new ISPS
code. This will involve close interaction with all interested
parties to implement and maintain whole-of-port security
arrangements, including the introduction of maritime
security identification cards.
An issue that demands close attention is the age profile of
our port pilots and the need for appropriate succession
planning. SPS will continue to work closely with the pilots to
devise and implement succession and training plans to
ensure efficient ongoing pilotage services.
AcknowledgementsIt is important to record our thanks to the portfolio Minister,The Hon. Michael Costa, MLC, who, despite his othersignificant commitments in the Transport portfolio, quicklycame to grips with the need to resolve future strategies forthe State’s ports, leading to the preparation of the NSW PortsGrowth Plan.
We are also grateful for the assistance and support of
our shareholding Ministers – The Hon. Michael Egan, MLC,
Treasurer and Minister for State Development, and The Hon.
John Della Bosca, MLC, Special Minister of State, Minister for
Industrial Relations and Assistant Treasurer.
As Chairman and CEO, we would especially like to acknow-
ledge our fellow Board members for collectively steering the
Corporation through this important and eventful year with
foresight, expertise and professionalism.
We greatly appreciate the dedication and commitment of the
Corporation’s staff in achieving the successes of 2003– 04.
The capability and dedication they have shown across all
areas of the organisation has been of a particularly
high standard.
We also wish to record the Corporation’s thanks to all our
stakeholders including our customers, industry, government
and community leaders who work closely with us to help us
provide timely and practical solutions and to maximise
opportunities to improve port operations.
Mr David LP Field Mr Greg J Martin
Chairman Chief Executive Officer
9

Fostering the State’s trade1S
ydn
ey P
orts C
orp
ora
tion
Annual R
eport 2004
10
In a year of continuing growth and strong consumer demand, Sydney Ports played a leadership role in
overseeing the efficient delivery of goods and commodities used in households and industries across
New South Wales. Trade activity was strong overall, breaking many records during the year.
Pictured right –
Patrick Corporation’s container
handling facility at Port Botany

Syd
ney P
orts C
orp
ora
tion
Annual R
eport 2004
Breaking total trade records
Trade statistics reveal the record volumes of freight that
flowed through the ports. During the year:
– Total cargo was 25.1 million mass tonnes, an increase
of 6.4%.
– Total imports rose by 6.0%.
– Total exports increased by 7.5%.
– Non-containerised cargo was 14.2 million mass tonnes, a
rise of 6.2%.
Handling the growth in container trade
In 2003 – 04 container trade rose to 1, 270, 216 TEUs,
a 9.5 per cent increase on 2002– 03. Over the past two
financial years container trade expanded by 25 per cent. Full
container imports during 2003–04 were 643,016 TEUs –
9.7 per cent higher than in the previous year. Full container
exports this year were 303,539 TEUs, a 3.3 per cent increase
on the previous year.
The trade boost was fuelled by imports from North-East Asia
(up 13.8 per cent), New Zealand (increased by 18.2 per cent)
and the United States (15 per cent higher).
Exports of containerised cereal products such as wheat, flour
and rice rose by 59.4 per cent. Iron and steel exports
increased by 15.9 per cent.
110
120
Jul Aug
60
100
80
20
2002–03 2003–04
TEUsSep Oct Nov Dec Jan Feb Mar Apr May Jun
40
Container trade per month (TEUs) (‘000) 12 months ending June 2004 compared with 2003
Container trade per month (TEUs) 12 months ending June 2004 compared with previous five years
Jul Aug Sep Oct Nov Dec Jan Feb Mar Apr May Jun Total
Exports 47,079 51,331 46,549 52,866 53,798 55,828 49,146 48,017 51,406 49,172 52,356 57,871 615,419
Imports 50,375 53,282 57,179 58,049 58,802 55,264 54,988 45,909 55,071 57,804 52,359 55,715 654,797
Total 2003 – 04 97,454 104,613 103,728 110,915 112,600 111,092 104,134 93,926 106,477 106,976 104,715 113,586 1,270,216
Total 2002 – 03 93,675 96,529 98,237 103,123 100,026 104,857 103,769 81,736 99,031 92,845 94,880 92,039 1,160,747
Total 2001 – 02 82,526 86,925 89,128 88,783 90,991 83,960 77,533 75,602 85,298 82,510 87,553 78,533 1,009,342
Total 2000 – 01 92,491 93,413 83,032 90,888 89,963 86,503 78,066 72,321 79,831 70,700 77,327 76,119 990,654
Total 1999 – 00 80,934 84,168 80,952 95,035 95,358 90,249 84,241 79,787 81,886 79,011 82,477 82,303 1,016,401

Syd
ney P
orts C
orp
ora
tion
Annual R
eport 2004
Non-containerised trade expands strongly
Increasing consumer demand produced strong motor vehicle
imports, with 220,775 motor vehicles delivered to Sydney
during the year. The trade grew to 347,143 tonnes, a 12.1 per
cent increase. The results maintained Sydney’s 33 per cent
market share of Australia’s motor vehicle imports.
In the dry bulk sector, overall tonnage rose by 6.7 per cent
to 1.57 million mass tonnes. Strong residential, commercial
and industrial building activity increased cement imports by
11.9 per cent and aggregates by 19.1 per cent. In the break
bulk sector, iron and steel imports rose by 32.9 per cent and
machinery imports by 22.8 per cent.
Refined-oil import shipments increased by 79.9 per cent to
2.4 million mass tonnes, spurred by supermarket chains
entering the petrol market. Bulk chemical and gas shipments
grew by 33.1 per cent, partly in response to gas supply dis-
ruptions caused by South Australia’s Moomba facility fire in
December 2003.
Keeping Sydney’s ports at the forefront
During the year, 2408 vessels visited Sydney – 1,269 berthing
in Port Botany and 1,139 in Sydney Harbour. This was a three
per cent increase over 2002 –03.
Over 40 international shipping services call into Sydney’s ports
year-round, with about 200 sailings per month to and from
300 overseas ports.
Visiting vessels totalled 64.1 million gross tonnes (GT), an
increase of seven per cent. Port Botany recorded 36.1 million
GT (up eight per cent) and Sydney Harbour reached 28.0 million
GT (up five per cent).
At the close of the reporting period five new weekly container
services were being progressively introduced between North
and East Asia and Australia, consolidating the reputation of
Sydney as an essential trade destination. The new services
are likely to add 35 per cent to container capacity between the
two regions.
Large vessels with capacity at and above 4,100 TEUs regularly
visited Sydney during the year. Port Botany is able to serve
large vessels and will be able to handle ships of 6,000 to
8,000 TEU capacity.
Sydney – a global cruise destination
Affirming Sydney’s status as a reliable and world-class cruise
destination, the Port hosted 81 passenger ships during 2003 –
04. The 54 domestic and 27 international vessels carried more
than 140,000 passengers.
Sydney’s international cruise season began with the arrival of
P&O’s Star Princess, the largest cruise vessel to visit Sydney –
109,000 tonnes and 290 metres long. The liner made her
first visit to Sydney in November and returned three times
over the season.
Other inaugural visits included Radisson’s Seven Seas Voyager,
P&O’s Adonia and Fred Olsen Lines’ Black Watch. In February,
21 cruise ships visited, 15 of them overseas liners. For all but
six days of the month, cruise vessels were berthed at one
or both of Sydney’s dedicated passenger terminals, Darling
Harbour and Circular Quay.
12 0
1,500,000
1994–95 1995–96 1996–97 1997–98 1998–99 1999–00 2000–01 2001–02 2002–03
750,000
1,250,000
1,000,000
500,000
2003–04 TEUs
250,000
Annual container trade (TEUs) 1994–95 to 2003–04

Syd
ney P
orts C
orp
ora
tion
Annual R
eport 2004
13
During the year the Corporation spent $148,000 on
improving Sydney’s four passenger gangways at Circular
Quay and Darling Harbour, following the $1.4 million spent on
the terminals in 2002 –03. Those investments, with better
maintenance and training practices, lifted gangway availability
to 100 per cent.
Further trade related information can be viewed in
our Commerce and Logistics Review 2003–04, at
www.sydneyports.com.au/Trade and Logistics.
Launching the Spirit of Tasmania III service
The commencement of tri-weekly Spirit of Tasmania III ferry
services between Sydney and Devonport on 13 January 2004
added another exciting dimension to Sydney Harbour. To
support the new service, consistent with the working harbour
philosophy, Sydney Ports invested $2.5 million in a purpose-
built berthing facility at Darling Harbour, next to the Wharf 8
Cruise Terminal. The facility, completed on budget and ahead
of schedule, caters for the transfer of up to 600 passengers,
240 motor vehicles and multiple freight vehicles per berthing.
The Corporation also assisted with the development of a
dedicated passenger lounge and administration service area
for the ferry.
Keeping port pricing viable and competitive
A review of pricing in 2003 confirmed that Sydney Ports’
wharfage charges had not increased in real terms for more
than a decade. Indeed, during that period real prices fell
by almost 50 per cent. To keep pace with costs and to fund
new investments, Sydney Ports plans to increase wharfage
fees. The Corporation will seek approval in 2005 from the
NSW Government to increase charges whilst continuing to
remain competitive.
A pricing change during the reporting year was halving the
motor vehicle coastal trade charge to one dollar per revenue
tonne, to stimulate domestic vehicle sea trade and improve
manufacturers’ access to Sydney. This initiative, with the
development of the AAT car terminal at Glebe Island,
demonstrates Sydney Ports’ commitment to promoting coastal
trade around Australia and securing Sydney’s status as a
reliable hub for car imports.
Recovering the costs of security
On 1 July 2004, Sydney Ports, as required by Commonwealth
legislation, introduced new security plans for designated areas
within Sydney Harbour and Botany Bay to comply with the
Maritime Transport Security Act 2003. The measures include
increased signage, electronic surveillance, patrols, and enforce-
ment of restriction zones around berthed vessels.
The costs of implementing the security measures will be
significant. The Corporation has carefully considered ways to
recover the costs that fall under our jurisdiction. Following
consultation with industry participants and with the NSW
Government, we have nominated small cargo and vessel-
based levies as a transparent and effective means to recover
security costs. At the time of reporting we were considering
the introduction of such levies by 1 January 2005.
Pictured above – Spirit of Tasmania III, maiden voyage to Sydney,
led by Sydney Ports’ fire tug.

Investing in and redeveloping the ports
Extending Port Botany
Development of specific sites at Port Botany has been
extensive over the year. At Molineux Point, P&O Trans
Australia completed and opened its 10 hectare facility, which
includes a covered warehouse. MT Movements opened a 2.5
hectare park for empty containers. At the former Bunnerong
Power Station site, the Corporation signed long-term leases
with Warehouse Solutions International for a three hectare
container freight facility and warehouse.
Sydney Ports signed an agreement with Randwick City Council
that will allow the Council to move its waste-recycling facility
from Yarra Bay to an unused precinct at the Bunnerong site
in early 2005. The Yarra Bay site will be turned into park-land.
In late 2003 Patrick obtained development approval from
the NSW Department of Infrastructure, Planning and Natural
Resources (DIPNR) to redevelop its container terminal on 2.5
hectares of land released by Sydney Ports. This enabled site
layout improvements and supported the transfer of con-
tainers onto rail. Both stevedores, Patrick and P&O Ports, have
proposals to provide two additional post-panamax ship-to-
shore cranes.
Improving the Bulk Liquids Berth and planning for
future needs
As bulk liquid and gas imports rise in volume, Sydney Ports
has completed a preliminary capacity assessment of the Bulk
Liquids Berth (BLB) at Port Botany to determine whether and
when a second berth will be needed. We will consider this
further during 2004–05. The Corporation will proceed with
BLB refurbishment works during 2004 –05.
Dealing with the empty containers
Because imports dominate Sydney’s trade, almost half of
the containers arriving with cargo leave the ports empty.
Given this imbalance, Sydney Ports is continually reviewing
strategies to ensure better management of empty containers
along the supply chain. This includes increasing the space
for storing empty containers away from the immediate port
area. The move will optimise the use of waterfront land and
maximise transport flexibility.
Significantly, the State Rail Authority (SRA) proposes to divest
17 hectares of land known as the Cooks River Rail Yards, next
to the dedicated freight rail line, linking Port Botany to
Enfield/Chullora. The site, now used as a rail serviced depot
for full and empty containers, could become a hub for storage
and transfer of empty containers.
The Corporation is negotiating with the SRA and expects to
conclude the purchase of this site in 2004–05.
Expanding Port Botany
The proposed 60 hectare Port Botany expansion would com-
prise five new shipping berths capable of handling an extra
1.6 million TEUs per year. This would meet Sydney’s require-
ments for container port capacity until 2025. By then, the
expanded facility would be injecting an additional $1. 3 billion
dollars into the New South Wales economy each year and
would be supporting some 9,000 jobs.
Sydney Ports completed a comprehensive Environmental
Impact Statement (EIS) in late 2003. The process involved
thorough consultation with all interested parties, including
industry, residents, community and environment groups.
Our efforts to factor environmental considerations into the
expansion have been exhaustive. The EIS includes more than
30 environmental and social impact studies which show that
the effects of the development will be minimal. Indeed, as
part of the proposal, $20 million would be invested to sig-
nificantly improve the Penrhyn Estuary and Foreshore Beach.
Syd
ney P
orts C
orp
ora
tion
Annual R
eport 2004
14
Syd
ney P
orts C
orp
ora
tion
Annual R
eport 2004
15
The justification for expanding Port Botany is strong. The
development would be economically, environmentally and
socially sustainable.
The EIS was lodged with DIPNR in November 2003. The
Minister directed that a Commission of Inquiry (COI) be
established. The COI, however, was adjourned on 31 May
2004 after the Minister ordered further investigation of layout
options at Port Botany.
At the time of reporting, Sydney Ports was finalising its
response to the additional term of reference and expected to
return to the COI in October 2004.
Maintaining Sydney’s working harbourTo maintain Sydney Harbour’s status as a working harbour,
Sydney Ports continued development, service and activity at
several key sites. The Corporation has now invested some
$24 million in redeveloping Glebe Island.
Developing Glebe Island
Sydney Ports, in a move that secured Sydney’s reputation as
an international car importing centre, leased 12 hectares of
Glebe Island to Australian Amalgamated Terminals (AAT) –
the Patrick & P&O joint venture. The Corporation invested
$2.5 million in upgrading the AAT site, which was formally
opened by the Transport Services Minister, The Hon. Michael
Costa, MLC.
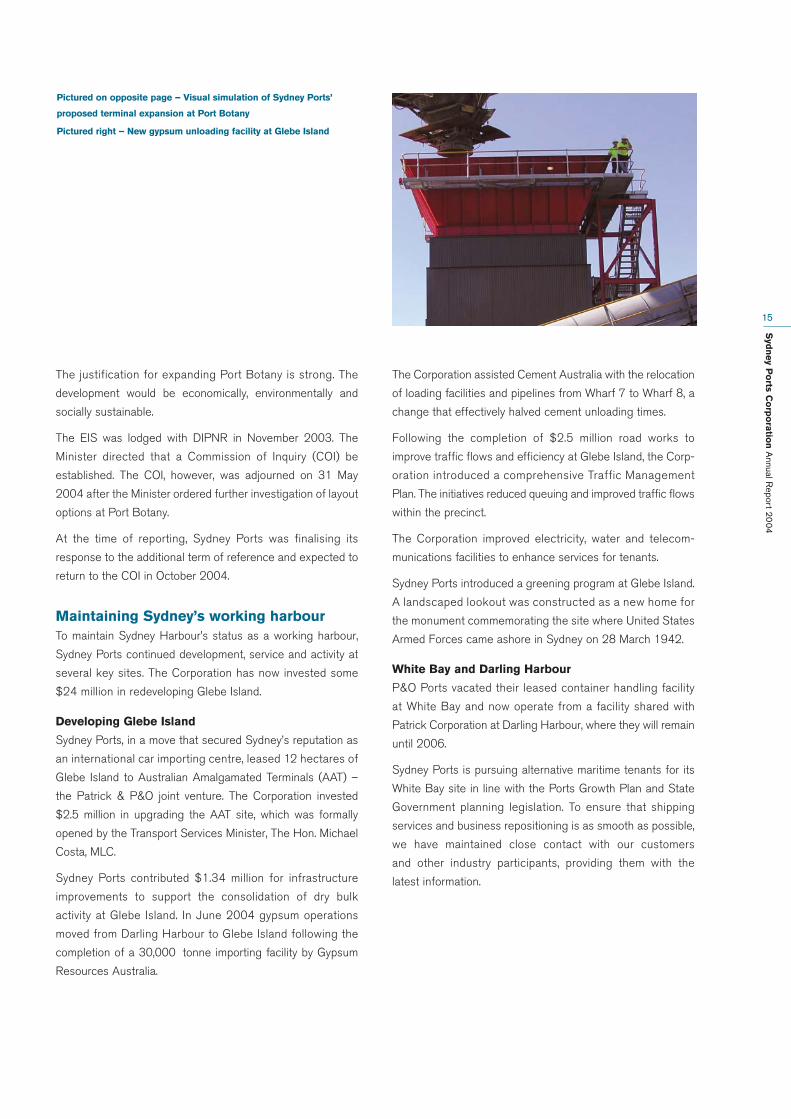
Sydney Ports contributed $1.34 million for infrastructure
improvements to support the consolidation of dry bulk
activity at Glebe Island. In June 2004 gypsum operations
moved from Darling Harbour to Glebe Island following the
completion of a 30,000 tonne importing facility by Gypsum
Resources Australia.
The Corporation assisted Cement Australia with the relocation
of loading facilities and pipelines from Wharf 7 to Wharf 8, a
change that effectively halved cement unloading times.
Following the completion of $2.5 million road works to
improve traffic flows and efficiency at Glebe Island, the Corp-
oration introduced a comprehensive Traffic Management
Plan. The initiatives reduced queuing and improved traffic flows
within the precinct.
The Corporation improved electricity, water and telecom-
munications facilities to enhance services for tenants.
Sydney Ports introduced a greening program at Glebe Island.
A landscaped lookout was constructed as a new home for
the monument commemorating the site where United States
Armed Forces came ashore in Sydney on 28 March 1942.
White Bay and Darling Harbour
P&O Ports vacated their leased container handling facility
at White Bay and now operate from a facility shared with
Patrick Corporation at Darling Harbour, where they will remain
until 2006.
Sydney Ports is pursuing alternative maritime tenants for its
White Bay site in line with the Ports Growth Plan and State
Government planning legislation. To ensure that shipping
services and business repositioning is as smooth as possible,
we have maintained close contact with our customers
and other industry participants, providing them with the
latest information.
Pictured on opposite page – Visual simulation of Sydney Ports’
proposed terminal expansion at Port Botany
Pictured right – New gypsum unloading facility at Glebe Island

Non-ferrous metals 535,130
Chemicals 437,101
Iron and steel 365,112
Paper products 316, 355
Meat 194,705
Cotton 191,957
Animal foods 217,476
Cereals 318,594
Food preparations 130,402
Manufactures 191,423
Beverages and tobacco 130,537
Others 1,137,153
Total 4,165,945 S
ydn
ey P
orts C
orp
ora
tion
Annual R
eport 2004
16
0
15
12
3
9
Mass tonnes (m)
6
1999–00 2000–01 2001–02 2002–03 2003–04
Total bulk liquids trade (mass tonnes – millions)
Import commodities in containers 2003–04 (mass tonnes)
Export commodities in containers
2003–04 (mass tonnes)
Pictured left – Vessel berthed at the Bulk Liquids Berth in Port Botany
Chemicals 999,361
Manufactures 857,211
Machinery 722,921
Paper products 717,010
Non-metallic minerals 355,632
Food preparations 250,689
Iron and steel 210,990
Beverages and tobacco 195,423
Textiles 174,969
Timber 145,540
Others 1,414,020
Total 6,043,767
0
750,000
Dry bulk
600,000
300,000
1999–00 2000–01 2001–02 2002–03 2003–04
450,000
150,000
Total dry bulk (mass tonnes – ‘000)
Syd
ney P
orts C
orp
ora
tion
Annual R
eport 2004
17
0
15
Break bulk (m)
12
6
9
3
1999–00 2000–01 2001–02 2002–03 2003–04
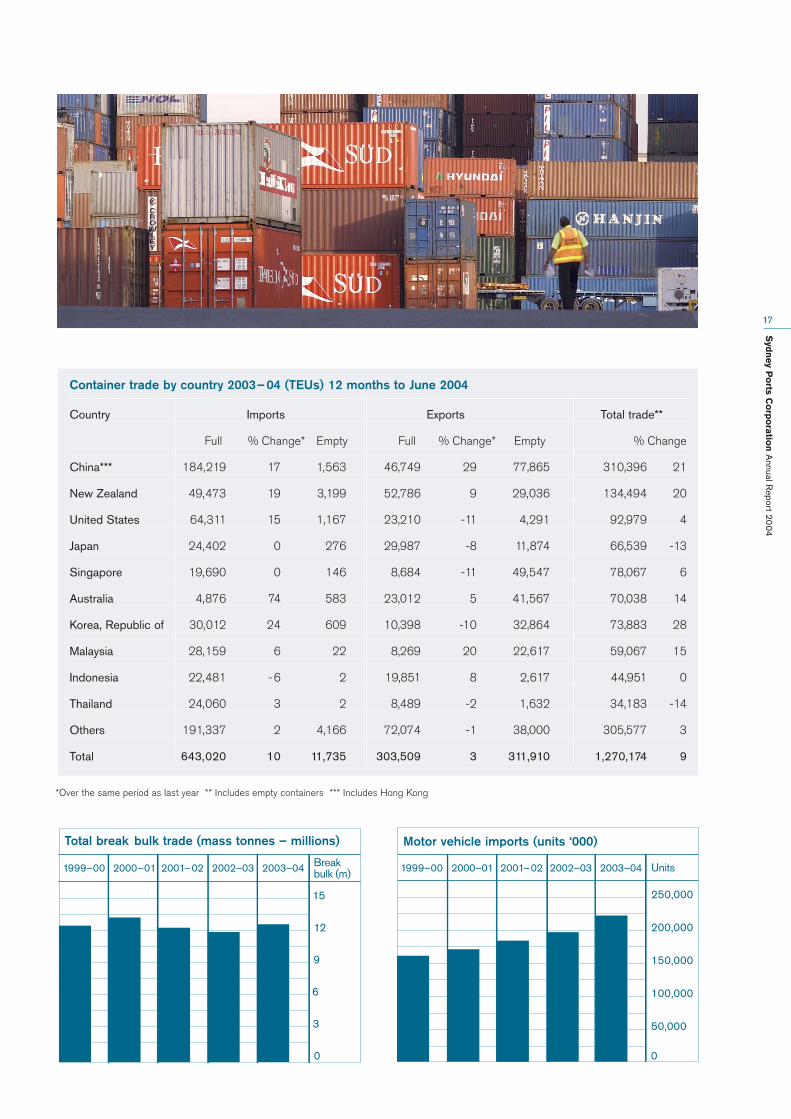
Total break bulk trade (mass tonnes – millions)
Container trade by country 2003– 04 (TEUs) 12 months to June 2004
0
250,000
Units
200,000
150,000
100,000
50,000
1999–00 2000–01 2001–02 2002–03 2003–04
Motor vehicle imports (units ‘000)
*Over the same period as last year ** Includes empty containers *** Includes Hong Kong
Country Imports Exports Total trade**
Full % Change* Empty Full % Change* Empty % Change
China*** 184,219 17 1,563 46,749 29 77,865 310,396 21
New Zealand 49,473 19 3,199 52,786 9 29,036 134,494 20
United States 64,311 15 1,167 23,210 -11 4,291 92,979 4
Japan 24,402 0 276 29,987 -8 11,874 66,539 -13
Singapore 19,690 0 146 8,684 -11 49,547 78,067 6
Australia 4,876 74 583 23,012 5 41,567 70,038 14
Korea, Republic of 30,012 24 609 10,398 -10 32,864 73,883 28
Malaysia 28,159 6 22 8,269 20 22,617 59,067 15
Indonesia 22,481 -6 2 19,851 8 2,617 44,951 0
Thailand 24,060 3 2 8,489 -2 1,632 34,183 -14
Others 191,337 2 4,166 72,074 -1 38,000 305,577 3
Total 643,020 10 11,735 303,509 3 311,910 1,270,174 9

Syd
ney P
orts C
orp
ora
tion
Annual R
eport 2004
18
Facilitating trade2Sydney Ports adopts a commercial approach to its operations. We focus on meeting the expectations of
our customers, shareholders and stakeholders. Our role in supporting the supply chain, which includes
promoting co-operation between all port users, is crucial.

Syd
ney P
orts C
orp
ora
tion
Annual R
eport 2004
Increasing port efficiency
Sydney’s quay crane performance was solid during a year of
record activity. Crane lifts per hour averaged 28.0* in the
September 2003 quarter, the highest average to that date,
settling to 27.5* in the June 2004 quarter. The results place
Sydney ahead of the Federal Government’s benchmark of 25
lifts per hour and on par with the national five-port-average.
Net ship lift-rates – the number of lifts from ships with one or
more cranes operating – peaked at an average of 51.8* per
hour during the September 2003 quarter, this was above the
quarterly five-port-average of 48.3 per hour. Lift-rates settled
to 47.7* per hour by the June 2004 quarter.
The median time that vessels spent in port from July to
December 2003 decreased by four hours to 32* hours com-
pared with July to December 2002. The port turn-around time
remained the same for January to June 2004.
* Source: Australian Government Department of Transport and RegionalServices, Bureau of Transport and Regional Economics, Waterline, March 2004.
See www.btre.gov.au/wline.htm
19
Pictured on opposite page – Dedicated freight rail line to Port Botany
Pictured right – P&O Ports’ container handling facility at Port Botany
0
30
25
20
15
10
5
20042003200220012000
Average crane rates for Sydney and Port Botany*(container lifts per hour)

Syd
ney P
orts C
orp
ora
tion
Annual R
eport 2004
20
Improving transport to meet demandIn early 2003 Sydney Ports met senior freight transport
industry representatives to examine ways of better managing
increasing trade activity, particularly during the peak season.
We agreed on several initiatives. At Port Botany, for example,
a daily operations rail plan was introduced, allowing the Rail
Infrastructure Corporation and RailCorp to test a new system
of managing freight train movements. Early indications show
significant improvements in running times. The work of the
forum continues.
At the time of reporting, planning was well under way for an
operational level transport workshop, scheduled for July 2004.
The goal of the workshop was to allow port cargo represent-
atives to share ideas and, in particular, to plan smoother
freight movement through 24 hour supply-chain operations.
Servicing our ports by Rail
Container movements through Port Botany by rail during the
year were steady at 250,000 TEUs compared with the
previous reporting year’s 255,000. This year, 150,000 TEUs
moved by rail within metropolitan Sydney – 60 per cent of
total rail volumes.
The increased rail freight movements in metropolitan Sydney
offset some of the decline in volumes from regional areas
which had been brought about by continuing drought and the
cessation of Riverina freight rail services in September 2003.
At the time of reporting Sydney Ports expected rail volumes
to increase as rural exports recover and Riverina services
recommence.
At the end of the reporting period, Pacific National announced
that it would withdraw its container rail services from Port
Botany to redeploy locomotives to coal and grain-handling in
other parts of the State. Other rail operators, including Patrick
Portlink and Silverton Rail, showed interest in replacing the ser-
vices. Sydney Ports is confident of a smooth transition, with
no disruptions to freight movement.
With the continuing rail network and operational improve-
ments, the Corporation’s goal of achieving 40 per cent modal
share remains firmly in sight.
DIPNR’s Metropolitan Intermodal Freight Strategy (MIFS), a
framework that will provide a more efficient network of
intermodal rail freight, is expected to be released during
2004–05. Sydney Ports remains committed to using Enfield
as a key operational site within an integrated network. The
Corporation is working closely with DIPNR, with the Ministry
of Transport and with Treasury to advance the case for
developing Enfield.

Syd
ney P
orts C
orp
ora
tion
Annual R
eport 2004
The Botany Rail Steering Group (BRSG), which comprises
representatives from the stevedores, rail operators, inter-
modal facilities, RailCorp, the NSW Ministry of Transport and
Sydney Ports, met in November 2003 and considered a
range of important issues. These included the impact of the
NSW Ports Growth Plan, progress on the ARTC lease of
the NSW interstate network, Sydney Ports’ plans for Cooks
River and Enfield, and rail windows for the Port Botany
container terminals.
In April 2004 rail stakeholders agreed on new train time-
tabling and scheduling at Botany. The realignment of rail
windows supports the competitive new environment in which
seven rail organisations operate, and has produced valuable
improvements in operational efficiency.
Servicing our ports by road
Despite record trade, truck turn-around times at Port Botany
remained steady at 50 – 55 minutes on average, gate-to-
gate. To assist with movement efficiency, Patrick and P&O
Ports introduced 24 hour truck receival and delivery, and
Saturday operations. This is a positive move, which the
Corporation hopes the transport industry will support.
Sydney Ports, to maintain its commitment to monitoring traffic
in the area, engaged a consultant to prepare a traffic
management plan for the southern Port Botany precinct.
This area accommodates P&O Ports’ container terminal,
various container parks and the bulk liquid facilities. We are
working closely with tenants and other stakeholders to form-
ulate a plan that will minimise impacts within the port precinct
and on the local road system.
Improving transport through investment
On 7 June 2004, the Deputy Prime Minister and Minister for
Transport and Regional Services, John Anderson, announced
AusLink, an initiative to upgrade Australia’s road and rail
systems. Importantly, AusLink will contribute funds to improve
freight rail links in the Sydney metropolitan area, including the
Port Botany and Chullora /Enfield connections.
In May 2004 the NSW Government signed an agreement
with the Commonwealth, covering the lease of the NSW
interstate and Hunter Valley rail network for 60 years. The
agreement includes an $872 million rail investment
program, including $180 million to construct the Southern
Sydney Freight Line from Macarthur to Chullora.
These developments are highly significant for the management
of increasing trade and for promoting the movement of freight
by rail. The initiatives will enable Sydney Ports to further
facilitate freight movement. They will also help us to link
Sydney’s key south-western industrial areas to Port Botany.
We will continue to work closely with ARTC to ensure that
protocols for rail access to Port Botany meet our perform-
ance objectives.
21
Pictured on opposite page – Warehousing operations at Port Botany
0
300,000
250,000
200,000
150,000
100,000
20042003200220012000
50,000
TEUs
Port Botany rail volume (TEUs ‘000)
Implementing improved IT solutionsSydney Ports continues to use technology to streamline
operations. Consistent with this principle, the Corporation has
worked to increase the rate of electronic lodgement of
manifests by shipping companies. The rate has risen to 87
per cent – a two per cent increase on the previous financial
year and a seven per cent increase on the 2001–02 period.
ShIPS – Sydney’s Integrated Port System that facilitates
management, on-line booking and the capture of vital trade
statistics – remains the benchmark in providing advanced
e-commerce solutions for the port community and transport
chain. We established a framework supporting the commercial-
isation of the product during the year and commenced
discussions with parties interested in purchasing the technology.
Improved tracking and handling for dangerous goods
On 8 September 2003 we introduced new arrangements for
the electronic lodgment with Sydney Ports of Dangerous Goods
(DGs) information. Approximately four per cent of containers
carry DGs. The onus is on container terminal facilities operators
and on shippers to manage these goods in accordance with
regulations. All DG information is now being handled by
electronic delivery of information (EDI) through our ShIPS
system. This ensures easy access by relevant authorities such
as Customs, AQIS and AMSA and allows the information to
be captured and processed more quickly – streamlining the
safety process and enabling better incident response.
The Department of Transport and Regional Services is pursuing
an industry framework for the safe and secure management
of DGs. Sydney Ports is contributing to ensure beneficial results
for the port transport chain.
The Corporation, as the regulator of DGs through our ports,
conducts random audits to ensure that all port users conform
to the highest levels of safety.
Syd
ney P
orts C
orp
ora
tion
Annual R
eport 2004
22
Operations and shipping personnel utilise IT systems to ensure safety
and efficiency at our ports

Syd
ney P
orts C
orp
ora
tion
Annual R
eport 2004
Investing in our IT system
Sydney Ports upgraded its in-house computer systems and
applications to improve customer service. The investment
included the cyclical replacement of critical servers, desktops
and related hardware. This improved information storage and
handling has enabled us to accommodate critical applications
and information more readily.
The Corporation strengthened protection of its IT network to
minimise security breaches. For example, we improved web
and email filtering and installed a new firewall to limit the spread
of any virus damage and prevent unauthorised systems access.
The new applications we implemented in 2003 – 04 included
RODIS – the Corporation’s wind, wave and tide monitoring
system – and a new records management system. We also
made progress on developing new HR and business in-
telligence systems, using data warehousing, reporting and
analytical tools. These systems will improve our com-
munication with customers and provide more timely access to
trade data.
23
Syd
ney P
orts C
orp
ora
tion
Annual R
eport 2004
24
Ensuring safe navigation and operations3Sydney Ports maintains a 24 hour commitment to ensuring safe navigation of commercial
vessels through Sydney Harbour and Port Botany. We deploy highly skilled staff and use modern
equipment to provide strategic responses to safety and environmental incidents. Our responsive-
ness provides consistent, reliable and safe movement of cargo and passenger vessels, in line with
international standards.

Fulfilling licence requirements and protecting
our waters
Sydney Ports upheld all requirements of its Port Safety
Operating Licence (PSOL) – the NSW Government licence
that maintains maritime safety standards. An external audit
of our activities, carried out in June 2004 resulted in no
non-conformances.
To further minimise the chances of serious incidents, the Corp-
oration increased random safety audits during the year, up-
holding our responsibilities under Dangerous Goods legislation.
We carried out 3,331 audits on vessels transferring bulk
oil, gas and chemicals, ensuring that we upheld State,
national and international standards and codes. We inspected
1, 228 refuelling operations and conducted 586 container
terminal audits.
Sydney Ports has issued many more dangerous goods penalty
infringements – 169 in 2003 –04 – following the introduction
of the Penalty Infringement Notice system in early 2002.
We responded to 216 reported incidents of marine pollution,
98 per cent of them caused by recreational vessels, land debris
and urban run-off. We issued two Penalty Infringement
Notices under the Protection of the Environment Operations
Act 1997. At the end of the reporting period we had com-
pleted three oil spill prosecutions under the Marine Pollution
Act 1987 and another 11 were in progress.
During the year our emergency response team assisted
28 ships experiencing difficulty in bad weather, and seven
recreational vessels with fires on board. We invested $11 million
in emergency preparedness, equipment and training.
The Corporation spent $400,000 on refurbishing two of Sydney
Harbour’s navigation lighthouses. The work will ensure that
the lighthouses function as part of the modern network of
Harbour navigational aids.
Syd
ney P
orts C
orp
ora
tion
Annual R
eport 2004
25
1994–95 1995–96 1996–97 1997–98 1998–99 1999–00 2000–01 2001–02 2002–03 2003–04 Vessels
0
1,000
500
1,500
2,000
2,500
Total vessel visits to Sydney’s ports 1994–95 to 2003–04
Sydney Ports maintains a network of navigation aids and provides
emergency response services in Sydney Harbour and Port Botany
24 hours a day

Securing the oil tanker Eurydice
The oil tanker Eurydice was scheduled to unload 85,000
tonnes of light crude oil at the Shell Terminal at Gore Bay on
14 February 2004, but reported oil seepage as it approached
Sydney. We instructed the vessel to remain outside the Harbour
and co-ordinated a response to the incident.
We worked closely with the ship’s representatives, the Depart-
ment of Environment and Conservation, the Australian Maritime
Safety Authority and Shell. We deployed divers to inspect the
vessel’s hull and carefully considered all repair options and
assessed the risks of each. We ensured that the small crack
in Eurydice’s hull was repaired before allowing the tanker to
enter the Harbour on 19 February. The tanker safely discharged
its cargo and departed Sydney on 23 February.
Facilitating a new Port Botany tug service
Sydney Ports oversaw the introduction by Australian Maritime
Services (AMS) tug operations in Port Botany in October
2003. AMS’s two new tugs, Peng Chau and Shek-O, are
based at Brotherson Dock’s Berth1. Their presence has already
contributed to a more competitive environment.
Ausport Marine, a second lines service was preparing to
commence operations at Port Botany at the time of reporting.
Developing a world-class pilot service
Sydney Pilot Service (SPS) is a subsidiary company of Sydney
Ports Corporation. Since forming in October 2002, SPS has
continually reviewed its operations to ensure that it provides
a cost-effective, sustainable and world-class pilotage service.
During the year SPS spent $1.5 million on refurbishing two
pilot vessels. In November 2003 SPS raised the pilotage service
fee by $150, the first such increase by SPS or its predeces-
sors in 17 years. The increased revenue will support the long-
term viability of the service and contribute to further capital
investment.
During the second half of the year pilots entered extensive
remuneration negotiations with SPS management. The
Australian Industrial Relations Commission facilitated
conciliation between the parties and, at the time of
reporting, negotiations were nearing a successful
conclusion.
SPS, as with other Australian port operators, must deal with
the ageing of its pilots as they near retirement. The challenge
is how to best replace these skilled professionals with suitably
qualified and trained pilots. Sydney Ports supports an Associa-
tion of Australian Port and Marine Authorities (AAPMA)
approach that encourages collaborative solutions between
industry, educational institutions and government agencies.
These will help establish new, shorter and more flexible train-
ing arrangements for pilots. SPS will devise the most practical
ways to implement the new approach.
Advanced pilot training continued throughout the year. Five
pilots participated in competency audit courses at the Star
Cruises’ Port Klang facility in Malaysia; another completed
a manned-model training course at Port Revell in France.
Numerous training activities were undertaken locally.
Syd
ney P
orts C
orp
ora
tion
Annual R
eport 2004
26
Pictured right – Pilot vessel in Sydney Harbour
Pictured on opposite page – Sydney Ports’ Overseas Passenger
Terminal at Circular Quay

Syd
ney P
orts C
orp
ora
tion
Annual R
eport 2004
27
0
120
Jul 2003
Aug2003
60
100
80
40
Botany Sydney
VesselsSep
2003Oct
2003Nov
2003Dec
2003Jan
2004Feb
2004Mar
2004Apr
2004May
2004Jun
2004
20
Vessel visits to the two ports for the 12 months ending June 2004
Cruise vessel visits to Sydney Harbour (5 years)
Year Calls Number of vessels Sydney based International Passengers
2003–04 81 23 3 20 140,000
2002–03 88 24 3 21 115,000
2001–02 59 18 1 17 71,000
2000–01 73 26 3 23 83,000
1999–00 83 18 2 16 100,000

Syd
ney P
orts C
orp
ora
tion
Annual R
eport 2004
28
Stepping up security 4Throughout 2003– 04 Sydney Ports successfully complied with the most significant program of
port security improvements in Australian maritime history.

Syd
ney P
orts C
orp
ora
tion
Annual R
eport 2004
As part of a concerted international response to the threat of
terrorism, the Corporation developed a comprehensive set of
security plans to comply with Australia’s Maritime Transport
Security Act 2003 and to be consistent with the International
Maritime Organisation’s International Ship and Port Facility
Security (ISPS) code.
The Corporation developed the plans in consultation and
co-operation with port and industry stakeholders. The Common-
wealth Government approved the plans ahead of the 1 July
2004 implementation deadline.
Under an implementation program scheduled for completion
by the end of 2005, Sydney Ports’ security plans focus on:
– Port of Sydney Harbour
– Port Botany (including the Bulk Liquids Berth)
– Passenger terminals (Overseas Passenger Terminal, Circular
Quay and Wharf 8, Darling Harbour)
– Glebe Island/ White Bay bulk materials facilities and common-
user berths, and
– Sydney Pilot Service.
Central to the plans are tightened restrictions on access to
facilities by people and vessels, including a 100 metre clear-
ance zone from tanker berths and a 30 metre clearance from
berthed cruise vessels.
Improved patrols, fencing, signage, lighting, CCTV coverage
and intelligence sharing between port users are all funda-
mental to the plans. Sydney Ports’ staff will do more waterside
patrols. Support responses by the NSW Water Police will form
an integral part of the new measures.
Each port facility and service provider has individual security
plans. Nevertheless, industry participants must work collabor-
atively with us to ensure that together we achieve and sustain
a fully integrated approach to port security. The Corporation’s
Port Security Committee will continue to meet regularly to
achieve this co-ordinated approach.
Importantly, the Corporation will play a leading role to
minimise the effect of the new security arrangements on
business operations.
The security measures will include a program of review
and audit as well as regular security threat exercises. These
measures will escalate if the level of threat increases.
In adopting and implementing the new security regime,
Sydney Ports will recover the continuing costs incurred, as
outlined earlier in this report.
29
Pictured right – Sydney Ports’ marine operations unit located at
Moore’s Wharf provide waterside security patrols

Syd
ney P
orts C
orp
ora
tion
Annual R
eport 2004
30
Protecting the environment 5Sydney Ports, in contributing to the State’s economic health, recognises its extensive respon-
sibilities for the well-being of the environment. Sustainable development and trade through
Sydney Harbour and Botany Bay are closely tied to the protection of these natural assets. This is
recognised in our Ports Vision, in which we state our intention to be an internationally respected
environmental manager of port facilities.
Pictured right – Monitoring by Sydney Ports’
Survey team

Syd
ney P
orts C
orp
ora
tion
Annual R
eport 2004
Managing environmental risk
To track and improve environmental performance, the Corp-
oration undertook an environmental audit of its operations
and facilities in 2003, as part of its overall environment
management plan. The audit concluded that Sydney Ports
had achieved an overall high standard of environmental
performance. It also identified the management of hazardous
materials and industrial wastes as key risk areas. In response,
the Corporation scheduled future environmental assessments
to be undertaken in line with regular workplace inspections,
an approach that will further minimise the risk of environ-
mental incidents.
We reviewed key activities undertaken by our customers at
port facilities according to their level of environmental risk. We
developed measures to address those risks where possible
through, for example, regulatory enforcement procedures, lease
and hire arrangements, and emergency response preparations.
The Corporation will continue to work closely with port
customers to review and improve these arrangements. At the
time of reporting, we were planning a further environmental
audit for 2004 – 05. This will review the success of the
measures we developed and implemented during 2003–04.
Exercises that prepare us for emergencies
During the year Sydney Ports participated in a number of marine
response exercises and operations. These included a tug
refuelling spill exercise in Sydney Harbour in November 2003
and the enactment of an oil spill in Botany Bay in April 2004.
In December 2003 we worked closely with the Navy and neigh-
bouring port operators to consider refuge options in the event
of a tanker leaking oil off Jervis Bay. We made substantial
preparations for Exercise James Cook, scheduled for
September 2004, bringing together industry stakeholders
and more than a dozen agencies from around Australia in
response to a staged incident on Botany Bay.
Our Survey Services protect coastal waters
Sydney Ports’ Survey Services team continued to monitor the
impacts of port operations and development along the coastal
zone during the year. The team expanded its charter to
include environmental programs within Botany Bay, where it
now focuses on dry and wet weather water sampling, ground
water level monitoring and beach photography. We use all
data collected by the team to identify potential environmental
impacts and to determine appropriate remediation or mitigation
works – such as the Lady Robinsons Beach restoration project.
As part of our continuing commitment to safe navigation, we
upgraded our Real-time Oceanographic Data Information
System (RODIS). The improved version now provides real-
time wave, wind and tide information to internal clients and
the public through a dedicated page on the Sydney Ports
web site.
See www.sydneyports.com.au/Wave, Wind and Tide
The Corporation also provided Sydney University’s Centre for
the Ecological Impact on Coastal Cities with $10,000 to aid
marine environment research and protection in Sydney Harbour.
Managing the restoration of Lady Robinsons Beach
We are managing a major operation to stabilise and restore
the northern section of Lady Robinsons Beach at Ramsgate.
The project commenced in March 2004, following extensive
negotiations with the funding agents and relevant govern-
ment agencies. DIPNR, Sydney Airport Corporation, NSW
Maritime Authority and Rockdale City Council are funding the
$8.4 million project.
The project will complement successful restoration work
at the southern end of the beach, completed in 1997. It
involves pumping 310,000 cubic metres of sand from Taylor
Bar, off Dolls Point, to build up the northern beach
zone. The construction of five 100 metre rock groynes, the
transplanting of 6000 square metres of seagrass and a
landscaping program will further protect and restore the area.
The work is scheduled for completion in February 2005.
Recognition given to our environmental programs
As a positive example of recycling, the NSW Department of
Environment and Conservation selected Sydney Ports
Corporation’s project for the removal of the Sommerville Road
ramp at Glebe Island. The project, which recycled more than
37,000 tonnes of sandstone and concrete, was to be featured
in the Department’s next Waste Reduction and Purchasing
Policy Report (WRAPP).
The Corporation received a City of Botany Bay Business
Excellence Award, following a submission based on a
dynamic marine protection and emergency response plan
devised for Botany Bay. The plan includes substantial
investment by the Corporation in marine pollution control
and prevention.
See www.sydneyports.com.au/Environment
31

Syd
ney P
orts C
orp
ora
tion
Annual R
eport 2004
32
Working with industry,government and the community6
Sydney Ports, to achieve its corporate objectives efficiently and co-operatively, takes into account
the views of all interested parties through forums, meetings and regular interaction.

Syd
ney P
orts C
orp
ora
tion
Annual R
eport 2004
Applying strategies to develop the State’s trade
Sydney Ports applies clear strategies to develop trade in metro-
politan and regional areas. We maintain a customer alliance
program, work with participants in each trade sector, identify
business opportunities and reduce trade impediments.
In April 2004, Corporation executives visited Europe, meeting
senior managers of P&O Ports and most of the shipping lines
headquartered in Europe. The key issues discussed were the
Ports Growth Plan, security, and operational matters such as
pilots and tugs. We strengthened relationships and planned
for continuing information exchange.
In September 2003 a Sydney Ports delegation visited container
lines, car carriers and port operators in Hong Kong, Singa-
pore, Shanghai and Japan, building productive links.
Our sister-port partnership with the Port of Los Angeles,
established in March 2004, should prove beneficial. The Port
of Los Angeles is of course much bigger than Sydney’s ports,
but we have similar roles within the different scale of our
markets. The Corporation also has sister-port agreements
with Georgia Ports and Yokkaichi Port Authority. Sydney
Ports’ executives visited Yokkaichi Port in October 2003.
In October 2003, the Board and senior representatives from
the Corporation met manufacturers, exporters, importers and
transport operators in Bathurst, Orange and Manildra. The
visit was part of Sydney Ports’ Customer Strategic Alliance
Program, providing an opportunity for us to brief rural clients
on local and international shipping developments.
Because half of Sydney’s exports are sourced from regional
and rural areas of the State, the Corporation’s Commerce and
Logistics team will continue to visit key regional areas on a
regular basis.
33
Pictured on opposite page – Sydney Ports has worked closely with
the community and government to progress the restoration of
Lady Robinsons Beach
Pictured right – Rice is being loaded into a container at Sunrice’s
Leeton facility

The value of consulting with port users
The Sydney Ports Users Consultative Group (SPUCG), a repre-
sentative body of the Sydney ports industry community, meets
regularly to discuss strategic and operational matters. During
the year SPUCG examined:
– port infrastructure development
– pilotage, towage and lines services
– stevedoring performance
– road transport issues
– rail and intermodal terminal operations and infrastructure
– customs and quarantine topics, and
– increased security planning.
SPUCG made a submission and presentation to the NSW
Legislative Council Inquiry into Port Infrastructure in NSW in
favour of retaining Glebe Island’s automotive facility in the
long term. SPUCG called for the early release of the Metro-
politan Intermodal Freight Strategy (MIFS).
The Sydney Ports Cargo Facilitation Committee, a sub-commit-
tee of SPUCG, continued to meet monthly to discuss and
manage day-to-day operations matters.
One of the main issues the sub-committee addressed in
2003–04 was the surplus of empty containers occupying
valuable storage space in Sydney, a situation caused by the
imbalance of import containers over exports.
In response to the high demand for empty containers in Asia,
several vessels visited Sydney to collect empty containers.
The Cargo Facilitation Committee encouraged shipping lines
to make regular retrievals. Overall, 312,000 empty containers
were collected during the year, with timely retrievals during
late 2003 and early 2004.
Syd
ney P
orts C
orp
ora
tion
Annual R
eport 2004
34

Syd
ney P
orts C
orp
ora
tion
Annual R
eport 2004
How the Corporation supports the community
Sydney Ports maintained its social, educational, environmental,
heritage and sponsorship activities during the year.
In late 2003 the Corporation sponsored the Australian National
Maritime Museum’s Sydney Working Harbour Exhibition, the
popular Festival of Kurnell (now in its eighth year), and three
sailing teams from Air Services Australia Fire Fighting Unit in
the NSW Police Games Yacht Racing Event on Sydney Harbour
in February.
In March 2004 thousands of Sydney siders enjoyed the Harbour
Week we sponsor, with more than 40 events staged. We
continue to sponsor Australia Day activities, with audiences this
year appreciating the Sydney Ports Jazz on the Water concert.
Following the success of the Play for Playgrounds trivia night
at Balmain Town Hall in August 2003 (which raised $40,000
for Balmain and Rozelle primary schools) we planned to support
a similar event in August 2004.
The Corporation spent more than $400,000 on community
and industry sponsorship. The funds were channelled to organ-
isations and events that support local communities and high-
light the important role shipping trade plays in serving New
South Wales.
Since the Corporation’s Community Care Program entered a
partnership with United Way on 1 January 2003, our staff have
given their time and donated more than $16,000 to a range
of causes for disadvantaged communities.
Sydney Ports continued to support local organisations. These
included the Shell Gore Bay Community Consultative Committee,
the Botany and Eastern Region Environment Protection Assoc-
iation, the White Bay/Glebe Island Noise Reference Committee,
the Port Botany Neighbourhood Consultative Committee, the
Botany Bay Business Enterprise Centre and Coastal Manage-
ment Committees. As well, we continue to support Randwick
City Council’s Business Excellence Awards.
In July 2003, the Corporation joined the Australian Red Cross
Corporate Donor Program. We encourage our staff to make
regular blood donations.
35
Pictured on oppposite page – The Marit Maersk was specifically
deployed to Sydney to pick up empty containers bound for Asia
Pictured right – Sydney Ports’ Jazz on the Water concert celebrating
Australia Day 2004

Syd
ney P
orts C
orp
ora
tion
Annual R
eport 2004
36
Investing in our people 7Sydney Ports is a multi-disciplinary organisation. The Corporation’s 199 permanent staff provide
diverse professional, technical and operational skills. These include all engineering disciplines; marine
operations expertise to ensure safe vessel navigation and provide emergency response services;
and broad management skills.

Syd
ney P
orts C
orp
ora
tion
Annual R
eport 2004
Programs to recognise and reward staff achievement
Because our staff contribute to Sydney Ports’ success, the
Corporation has introduced initiatives to maintain and boost
employee recognition, development and morale.
The Corporation, acting on results from an Employee Climate
Survey we conducted in 2002–03, launched the quarterly
‘Bravo!’ reward and recognition program in May 2004. The first
‘Bravo!’ winner was Senior Project Manager David Solomons,
nominated for outstanding work in developing the $2.5 million
bow ramp for Spirit of Tasmania III at Darling Harbour. He
managed the completion of the project on budget and weeks
ahead of schedule.
The ‘Bravo!’ winner for the April –June 2004 period was Mike
Gartenfeld from the Marine Operations Unit, nominated for
developing and implementing a training program for the safe
and effective operation of the Bulk Liquids Berth at Port
Botany – another outstanding achievement.
During the year we congratulated a marine operations
administration officer who has served the Corporation and its
predecessors for 40 years and other employees recorded
30 years of service.
Developing our leadership qualities
Sydney Ports worked with external consultants in early 2004
to provide executives and senior managers with a leadership
program. More of our managers and supervisors will part-
icipate in similar programs during 2004–05.
The Corporation is initiating ways to improve its mentoring
culture by encouraging staff to share information, experience
and advice.
We substantially increased spending on learning and develop-
ment initiatives during the year. We surpassed the Corporation’s
benchmark average investment per employee in 2003 – 04.
Measures to ensure a safe working environment
During the financial year five lost-time injuries were recorded –
two more than in the previous year. Employees of our sub-
sidiary company, Sydney Pilots Service, also recorded five
such incidents during the year. The incidents were thoroughly
investigated and we acted immediately to minimise the risk
of recurrences.
Unannounced blood-alcohol-level testing continued as an
active measure to maintain and improve workplace safety
standards. We conducted 241 tests among Sydney Ports’
operations staff, recording only one positive result (a reading
over 0.02). The unannounced tests on pilots produced no
positive results.
The Corporation’s commitment to safety was recognised
and rewarded under the NSW Government’s voluntary OH&S
Premium Discount Scheme, which provides insurance dis-
counts for organisations demonstrating outstanding OH&S
practices and results. During 2003 – 04, Sydney Ports and
Sydney Pilots Service together saved almost $100,000 in
workers compensation premiums because of our solid
commitment to OH&S principles. We are on track to receive
further discounts in 2004 –05.
Sydney Ports continues to address the needs of its
employees and encourage the highest level of service and
safety, as targeted in our statement of corporate values.
Working towards a new Enterprise Agreement
In early 2004, Sydney Ports commenced negotiations with
staff and unions over the 2004–07 Enterprise Agreement.
The main issues being resolved include:
– flexible leave packages
– roster reviews
– commitment to introducing drug-testing
– workplace fitness
– team performance, and
– superannuation contributions.
At the close of the reporting period, negotiations were on
track for a successful conclusion.
Diligent management of risk in the ports
Sydney Ports has in place a corporate Risk Management
System, tailored to the unique responsibilities of managing the
two ports of Sydney Harbour and Port Botany.
The system, which is consistent with AS/NZS 4360:1999,
is audited internally and externally. Every nine months it is
reviewed by the external certification auditors Bureau Veritas
Quality International.
The 2003–04 internal and external assessments were
satisfactory and confirmed that our risk strategies are
relevant and appropriate to our objectives for the successful
management of the ports.
37
Pictured on opposite page – Facility Officer at the Bulk Liquids Berth

Syd
ney P
orts C
orp
ora
tion
Annual R
eport 2004
David Field FAICD
Chairman
Mr. Field has extensive Board Chairmanship, Non Executive
Director (NED) and Chief Executive experience gained from
a 30 year career within the International Trade/Shipping
Industry. He has had wide commercial experience at both
International and National level.
Mr. Field was appointed by the NSW Government as Chair-
man of the Board of the Sydney Ports Corporation in 1998 and
was reappointed in December 2001. He is Chairman of the
Corporation’s Remuneration Committee and a member of the
Audit and Risk Management Committee. He is also a Non
Executive Director of Sydney Pilot Service Pty Ltd.
Other Board appointments include Non Executive Director,
Safe Effect Technologies Limited, The Merchant Navy War
Memorial Fund Limited, the Royal Exchange of Sydney and a
Trustee of the Sydney Bethel Union.
He is a Group Chairman within the CEO Circle and the CIO
Circle that brings together Chief Executives and Heads of
Divisions of large organisations for mutual advice and to
share experience.
Mr. Field is also Executive Director of the Australian and Asia
Pacific Search and Selection Company Carmichael Fisher and
specialises in Executive Search, Interim Executive and Board
of Director Appointments.
From June 2001 to mid 2003 David was Australian Head of the
Interim Executive Practice of another International Executive
Search firm. He also joined the Board of Director Practice in
late 2002. From Nov 2002 to Jan 2003 he was simultaneously
Managing Partner of that firm’s two Korean offices during a
period of structural change.
In his former corporate career he was with the UK owned
Swire Group for 20 years based in Australia and the Far East.
He left Swire’s to join Blue Star Line (Aust) Pty Ltd, a sub-
sidiary of The Vestey Group, UK. In 1996 he was appointed
Managing Director/CEO of Blue Star Line (Aust) Pty Limited
and Chairman of Blue Star Line (Asia) Pty Limited. Respon-
sibilities covered: Australia, Far East, South East Asia, Sub-
Continent, and the Middle East and shared responsibility for
the company’s substantial East and West Coast North American
shipping interests.
He is a Fellow (FAICD) of the Australian Institute of Company
Directors and is a member or closely associated with a range
of business organisations including State Chamber of
Commerce, NSW Technology Showcase, Australian Human
Resources Institute (AHRI), Australian National Maritime
Museum and Shipping Australia Limited. He has recently
been invited by The Conference Board based in New York to
take up an offer of Management Associate.
Greg Martin BE (Civil), BCom, ASIA, FAICD
Chief Executive Officer and Managing Director
Mr Martin was appointed Chief Executive Officer of Sydney
Ports Corporation and took office on 15 April 1996. From
1990 to 1996 he was Chief Executive Officer of the Port of
Brisbane Corporation and is President of the Association of
Australian Ports and Marine Authorities Inc. He is a Director
of the International Association of Ports and Harbours and
United Way Sydney. He is Chairman of the Sydney Pilot Service
Pty Ltd and is a mem-ber of the Audit and Risk Management
Committee of Sydney Ports Corporation.
38
Board of Directors

Syd
ney P
orts C
orp
ora
tion
Annual R
eport 2004
39
Sibylle Krieger LLB (Hons), LLM (Columbia University,
New York), GAICD
Director
Ms Krieger is a commercial lawyer with over twenty years
experience. During that time she has undertaken corporate
advisory and dispute resolution work and has also spent
several years involved with professional staff selection,
induction and evaluation in two large commercial law firms. In
more recent years Ms Krieger has been involved with regulated
industries, government agencies and government-owned
corporations as an outside adviser. Ms Krieger was appointed
to the Sydney Ports Corporation Board in late 2002 and is a
member of the Remuneration Committee of the Board.
Ken Murray
Director
Mr Murray was the Executive Director of Casino World Austral-
asia, the Australian licensee company of US based computer
technology provider Casino World Holdings Ltd. He is Man-
aging Director of property and investment company Yarrum.
K Holdings, Director of BM Computer Solutions, President of
a major registered licensed club and a Member of the Rand-
wick Racecourse Trust Board. Mr Murray is Deputy Chairman
of the Sydney Pilot Service Pty Ltd and has 34 years ex-
perience in the stevedoring industry.
Vic Smith MAICD
Director
Mr Smith is a government relations consultant and a former
Mayor of South Sydney City Council. He is a Director of Cricket
NSW and a former Director of NRMA. He is the former Vice-
Chairman of South Sydney Development Corporation and a
former Director of the Southern Sydney Waste Board. He is
a Paul Harris Fellow of Rotary International, given for services
to the community and is a member of the Australian Institute
of Company Directors. He is a member of the Audit and Risk
Management Committee of Sydney Ports Corporation and a
member of the Remuneration Committee of the Board.
Michael Sullivan AAICD
Staff Director
Mr Sullivan was elected to the position of Staff Director by
the staff of the Corporation in July 2002. He joined the Maritime
Services Board in 1977 where he was initially employed in the
statistical section. He has held a variety of positions since
then within the office environment. He transferred to marine
operations in 1991 as a port officer and has held this role since
then. Mr Sullivan is also president of The Ports Golf Club.
Arlene Tansey FAICD
Director
Ms Tansey joined ANZ Banking Group in July 1999 as Sector
Head, Telco, Media and Entertainment, and Executive Director,
Corporate Finance. She is now a Director, Corporate Portfolio
Management, and handles some of the largest restructuring
opportunities for ANZ. She spent over four years at Macquarie
Bank working in the Project and Structured Finance Division.
She holds a Doctor of Jurisprudence in law from the University
of Southern California Law Center, a Masters in Business
Administration from New York University, with a major in finance
and international business, and a Bachelors degree in Business
and is also a Director of Snowy Hydro Limited. Ms Tansey
was appointed to the Sydney Ports Corporation Board in late
2002. She is the Chair of the Audit and Risk Management
Committee of Sydney Ports Corporation.
Michael Sullivan, Arlene Tansey, David Field, Greg Martin, Sibylle Krieger, Vic Smith and Ken Murray – Board visit to the Riverina region
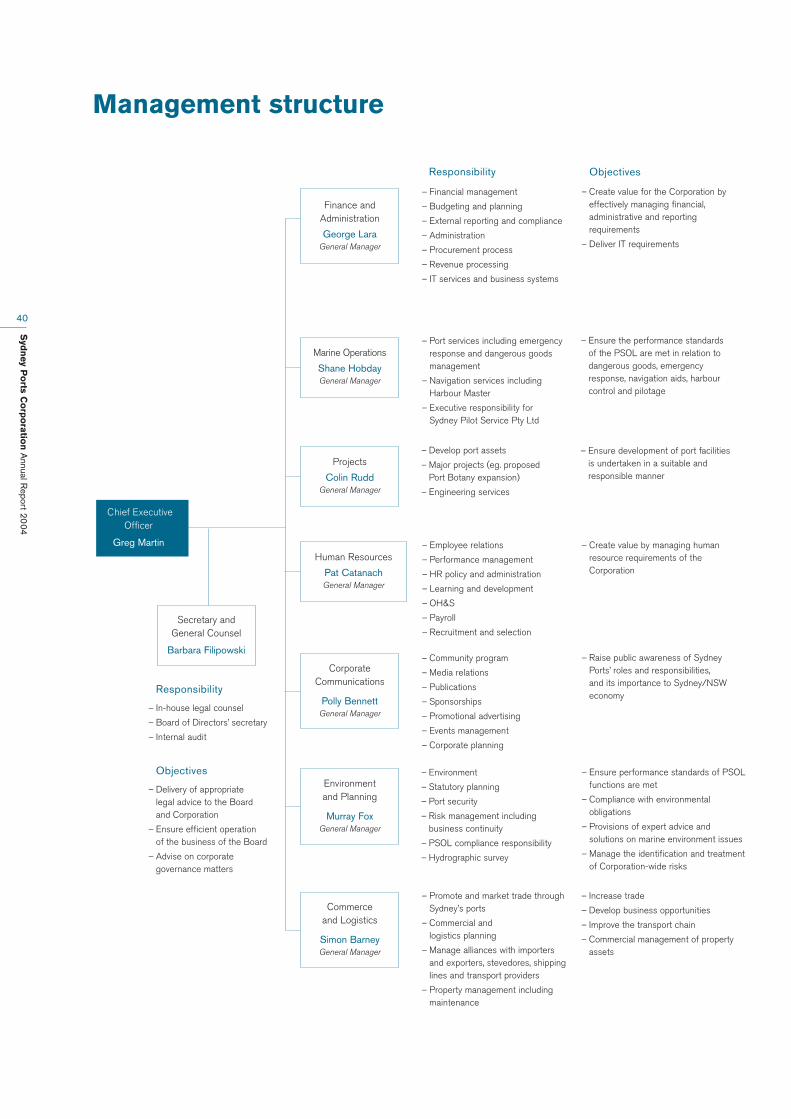
Syd
ney P
orts C
orp
ora
tion
Annual R
eport 2004
40
Management structure
Finance andAdministration
George LaraGeneral Manager
Secretary and General Counsel
Barbara Filipowski
Marine Operations
Shane HobdayGeneral Manager
Responsibility
– In-house legal counsel
– Board of Directors’ secretary
– Internal audit
Objectives
– Delivery of appropriate legal advice to the Board and Corporation
– Ensure efficient operation of the business of the Board
– Advise on corporategovernance matters
Human Resources
Pat CatanachGeneral Manager
– Financial management
– Budgeting and planning
– External reporting and compliance
– Administration
– Procurement process
– Revenue processing
– IT services and business systems
Objectives
Commerce and Logistics
Simon BarneyGeneral Manager
– Port services including emergencyresponse and dangerous goodsmanagement
– Navigation services including Harbour Master
– Executive responsibility for Sydney Pilot Service Pty Ltd
– Develop port assets
– Major projects (eg. proposed Port Botany expansion)
– Engineering services
Responsibility
– Employee relations
– Performance management
– HR policy and administration
– Learning and development
– OH&S
– Payroll
– Recruitment and selection
– Community program
– Media relations
– Publications
– Sponsorships
– Promotional advertising
– Events management
– Corporate planning
– Environment
– Statutory planning
– Port security
– Risk management includingbusiness continuity
– PSOL compliance responsibility
– Hydrographic survey
– Promote and market trade throughSydney’s ports
– Commercial and logistics planning
– Manage alliances with importersand exporters, stevedores, shippinglines and transport providers
– Property management includingmaintenance
– Create value for the Corporation byeffectively managing financial,administrative and reportingrequirements
– Deliver IT requirements
– Ensure the performance standards of the PSOL are met in relation todangerous goods, emergencyresponse, navigation aids, harbourcontrol and pilotage
– Ensure development of port facilitiesis undertaken in a suitable andresponsible manner
– Create value by managing human resource requirements of theCorporation
– Raise public awareness of SydneyPorts’ roles and responsibilities, and its importance to Sydney/NSWeconomy
– Ensure performance standards of PSOLfunctions are met
– Compliance with environmentalobligations
– Provisions of expert advice andsolutions on marine environment issues
– Manage the identification and treatmentof Corporation-wide risks
– Increase trade
– Develop business opportunities
– Improve the transport chain
– Commercial management of propertyassets
Chief ExecutiveOfficer
Greg Martin
Projects
Colin RuddGeneral Manager
CorporateCommunications
Polly BennettGeneral Manager
Environment and Planning
Murray FoxGeneral Manager
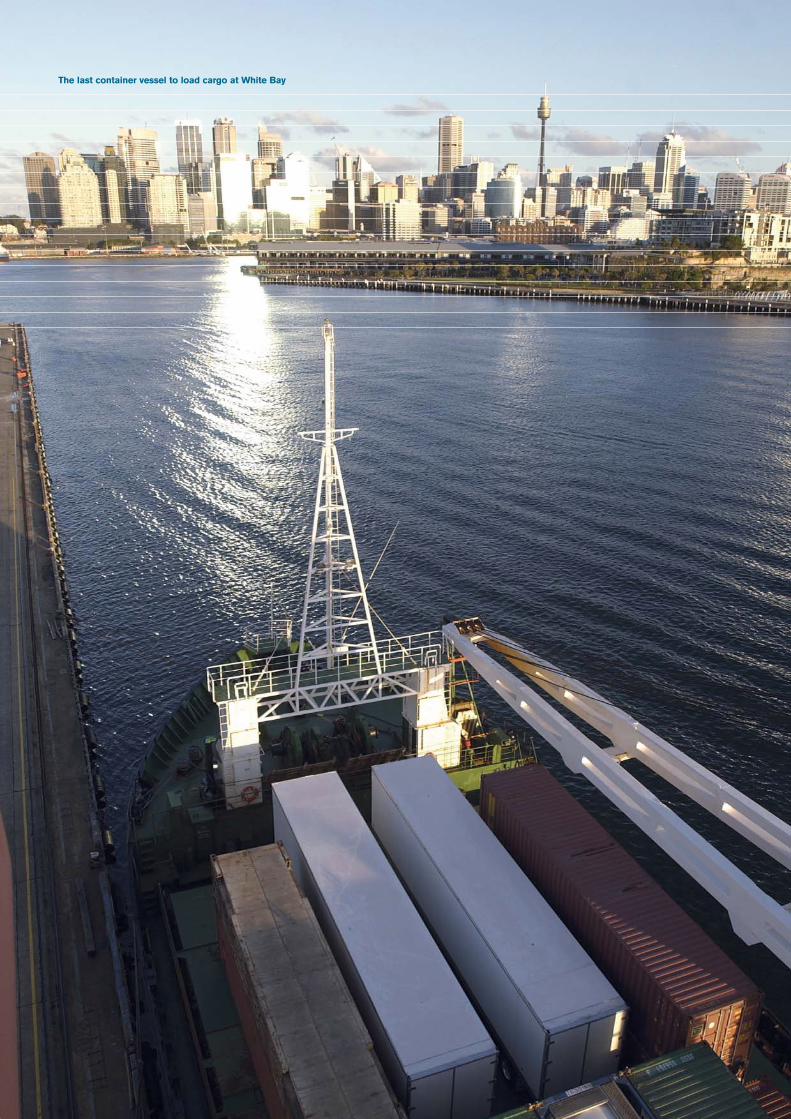
The last container vessel to load cargo at White Bay

Syd
ney P
orts C
orp
ora
tion
Annual R
eport 2004
42
KEY
A Overseas Passenger Terminal
B Patrick Corporation
C Wharf 8 Passenger Terminal
D White Bay
E Penrice Soda Products
F Australian Amalgamated Terminals
G Cement Australia
H Sugar Australia
I Gypsum Resources Australia
Berth Numbers
Sydney Ports’ Property
1
Sydney Harbour port facilities
CockatooIsland
Balls Head
Birchgrove
BallastPoint
Balmain
White Bay
Glebe Island Bridge
RozelleBay
DarlingHarbour
BlackwattleBay
McMahons Point
Walsh Bay
Sydney Cove
Berrys Bay
Goat Island
PyrmontGlebe Island
Sydney HarbourBridge
G
F
HE
D
C
A
I
B
D65
4
32
1
8
72
1
8
7
5
4
3
August 2004

Syd
ney P
orts C
orp
ora
tion
Annual R
eport 2004
43
KEY
A P&O Trans Aust. Holdings Ltd
B Vopak Terminals
C Orica Australia Pty Ltd
D Elgas
E Terminals Pty Ltd
F Origin Energy LPG Limited
G Patrick Port Services
J P&O Ports
K Patrick Corporation
L Caltex Petroleum Pty Ltd
M Australian Customs Services
N Warehouse Solutions International Pty Ltd
O Randwick City Council
Berth Numbers
Sydney Ports’ Property
Port Botany port facilities
1
G
Foreshore Road
Bulk Liquids Berth
Brotherson Dock
FrenchmansBay
BumborahPoint
Molineux Point
Airport Runway
Airport Runway
Silver Beach Groynes
Yarra Bay
Quibray Bay
Kurnell
Caltex Refineries P/L
BF
F
M
O
N
ED
C
E
A
G
K
L
B
1
Banksmeadow
J
2
3
4
5
6
August 2004
A
A
G

Syd
ney P
orts C
orp
ora
tion
Annual R
eport 2004
44
Main roads
Rail lines
Regional Intermodal Terminals
NSW road and rail links
Nyngan
Dubbo
CANBERRA
SYDNEY
0 50 100 150 200 250 300 350 400
Kilometres
CobarWilcannia
Bourke
HebelGoondiwindi
Armidale
Tamworth
MuswellbrookGulgong
Warren
Mudgee
Bathurst
LithgowBlayney
ParkesOrange
Forbes
CowraWest Wyalong
Narrandera
Hay
Tumut
Booligal
Griffith
GoulburnYoung
WaggaWagga
Katoomba
TenterfieldCasino
GraftonInverell Glen
Innes
CoffsHarbour
Moree
NarrabriWee Waa
PortMacquarie
Gunnedah
Coonabarabran
MELBOURNE
BRISBANE
Walgett
Tibooburra
Broken Hill
Menindee
Ivanhoe
Swan Hill
Echuca
Jindabyne
WodongaAlbury
Nowra
Wollongong
Port Kembla
Gosford
Newcastle
Cooma
Queanbeyan
Tocumwal
Mildura
200 k
m
400 k
m
600 k
m
800 km
1,000
km
TasmanSea
N
Cootamundra
PRIN
CESS
HIGHW
AY
BARRIER HIGHWAY
HUME HIGHWAY
STURT HIGHWAY
SILV
ERCI
TYH
IGHW
AY
PACIFI
C HIGHWAY
MITCHELL
HIGHWAY
MID
W
ESTERN HIGHWAY
COBBHIGH
WAY
SNO
WY
MOUNTAINSHWY
NEW
ENG
LAN
D
HIGHWAY
NEWELL
HIG
HW
AY
26 August 2004

Syd
ney P
orts C
orp
ora
tion
Annual R
eport 2004
45
Motorways
Main roads
Rail lines
Dedicated rail freight line
Intermodal Terminals
Industrial zones
Port facilities
Enfield site
Proposed Port Botany development area
Western Sydney Orbital (under construction)
Metropolitan road and rail links
20 km
30 km
40 km
50 k
m
10 km
Kurnell
TempeCooksRiver
Kingsgrove
Seven Hills
Kings Park
Doonside
Rooty HillArndell Park
Riverstone
SouthWindsor
Sydney Harbour
Botany Bay
Bate Bay
Paddington
Randwick
Maroubra
La Perouse
TarenPoint
Rockdale
Botany
Hurstville
Sutherland
LaneCove
Mosman
Bondi
Ryde
Liverpool
Bankstown
Ingleburn
Lane CoveWest
Moorebank
WarwickFarm
Emu Plains
Villawood
Broken Bay
Leichhardt
Marrickville
Merrylands
Yennora
GuildfordProspect
CastleHill
ManlyBrookvale
Mona Vale
Palm Beach
St Marys
Castlreagh
Campbelltown
Fairfield
Strathfield
Blacktown
Chatswood
Parramatta
Windsor
HornsbyRichmond
Penrith
Camden
Minto
WetherillPark
Normanhurst
Asquith
MountKu-ring-gai
Alexandria
Smeaton Grange
Dural
Glenorie
BerowraWaters
TerreyHills
FrenchsForest
Cowan
Box Hill
Glenwood
Chullora Enfield
Erskine Park
Clyde
Camellia
Epping
Georges River
Parramatta River
Hawkesb ury River
Middle Harbour
Peakhurst
WhiteBay
GlebeIsland
SydneyAirport
PortBotany
DarlingHarbour
SydneyCBD
0 2 4 6 8 10
Kilometres
SYDNEY
N
M 5
PRIN
CES
HIG
HWAY
M4GREAT WESTERN HIGHWAY
M2
HUME HIGH WAY
PENN
AN
TH
ILLS
ROAD
CU
MB
ERLA
ND
HIGH
W
AY
PACIFIC HIGHWAY
SYDN
EY–
NEW
CAS
TLE
FREE
WA
Y
G NRL
HOLM
EDR
EAST
ERN
DIS
TRIB
UTO
R
STHERN
CROSS DR
GOREHILL FREEWA
Y
PARRAMATTA ROAD
26 August 2004

Syd
ney P
orts C
orp
ora
tion
Annual R
eport 2004
46
Port Botany

Port Botany proposed expansion
Syd
ney P
orts C
orp
ora
tion
Annual R
eport 2004
47
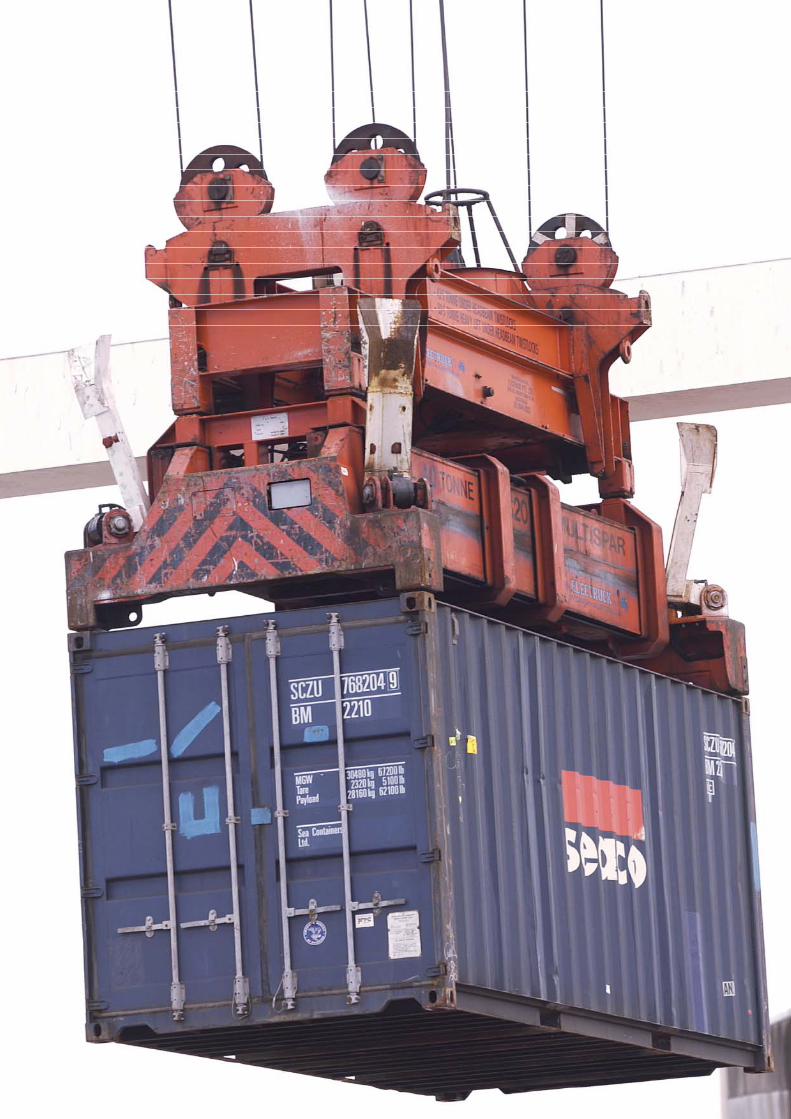

Syd
ney P
orts C
orp
ora
tion
Annual R
eport 2004
49
Sydney Ports Corporation in brief
Sydney Ports Corporation was established in 1995, under the
Ports Corporatisation and Waterways Management Act
1995, to give a greater focus to commercial port operations
and enhance competition in the provision of services to the
shipping and cargo industries.
In doing so, we aim to be a successful business and serve the
needs of our customers while providing an appropriate return
to our shareholders, the two Ministers who represent the
NSW Government.
Our objective is to facilitate trade growth and ensure that port
development is economically sustainable and environmentally
responsible, in keeping with standards of safety and
environmental protection acceptable to the local community
and international standards.
Stating our vision
Sydney Ports’ vision is to be an internationally respected
commercial port manager in all operational and environmental
aspects, and to provide facilities to promote and support trade
growth for the benefit of the New South Wales economy.
Implementing our values
Sydney Ports is committed to:
– Service to our customers through reliable, professional and
courteous attention
– Excellence by being progressive and encouraging alternative
solutions to complex issues
– Respect for the individual worth and honest contribution of
all employees
– Vigilance in promoting a safe environment for personnel and
the community
– Integrity through nurturing the highest standards of conduct
and ethics
– Challenge barriers and impediments to progress, and
– Exceed expectation.
The key roles we play
Sydney Ports’ main functions are to:
– Manage and develop port facilities and services to cater for
existing and future trade needs
– Facilitate trade by providing competitive advantage to
importers, exporters and the port-related supply chain
– Manage the navigational and operational safety needs of
commercial shipping*
– Protect the environment and have regard to the interests of
the community, and
– Deliver profitable business growth.
* The Corporation holds a Port Safety Operating Licence with responsibilities forchannel depths, dangerous goods, emergency response, navigation aids,pilotage and port communications.
Key roles, objectives and results

Syd
ney P
orts C
orp
ora
tion
Annual R
eport 2004
50
Sydney Ports Corporation’s Board of Directors and voting shareholders negotiate an annual agreement, titled the Statement ofCorporate Intent, which lists the Corporation’s key financial performance targets for the coming financial year. Comparison ofperformance in 2003–04 against the targets for the year and the results for 2002–03 reveals:
2003–04 2003–04 2002–03actual target actual
$M $M $M
Financial indicators
Shareholder Value Added (SVA) +12.8 +6.7 +11.5
Debt level 170.3 191.7 169.4
Operating profit before income tax equivalent 51.8 41.1 41.2
Tax equivalent expense 16.6 14.3 14.9
Operating profit after income tax equivalent 35.2 26.8 26.3
Income tax equivalent payable 16.7 15.5 15.1
Dividend payable 17.6 13.4 13.2
Operational indicators
Throughput (million mass tonnes) 25.1 24.1 23.6
Per cent of trade growth 6.4% n/a -3%
TEUs (‘000) 1,270 1,235 1,161
Per cent of TEU growth 9.4% n/a 15.1%
Ship visits 2,408 2,230 2,331
Total gross tonnage (millions) 64.1 58.9 60.0
Customer perception ranking n/a1 n/a1 7.6
Staff numbers3 199 199 199
Average sick leave per employee 2.34 2.5 2.402
Staff training ($’000) 406 387 368
Number of lost time work accidents 5 3 3
1. (no survey during period)2. (excluding long-term illness)3. (excluding SPS)
Sydney Ports CorporationKey performance indicators

Syd
ney P
orts C
orp
ora
tion
Annual R
eport 2004
51
Sydney Ports CorporationEnvironment indicators
Number of pollution incidentsgenerated from Sydney Ports’ ownactivities
Nil Nil During 2003–04 Sydney Ports developed aprocess for conducting workplace inspections,to identify and prevent the occurrence of safetyand environmental incidents. This inspectionprogram will be implemented during 2004–05.
Number of port-related pollutionincidents per 100 vessel visits in:
– Sydney Harbour:
– Botany Bay:
Incidents/100 visits:
5.4
3.9
0
0
The occurrence of pollution incidents fromcommercial vessels – although outside thecontrol of Sydney Ports – is an importantindicator of the sustainability of port operations.These incidents could include marine pollution,air emissions, littering or other occurrences.
Total annual number of pollutionincidents attended by Sydney Ports,in Sydney Harbour and Botany Bay
216 No target to beset3
Sydney Ports has an important role in cleaningup marine pollution events, regardless ofwhether the pollution is sourced from theabove port-related pollution incidents, orpollution arising from land run-off, commercialor recreational vessels. During 2003–04Sydney Ports invested some $11 million inemergency response preparedness andequipment to prevent pollution and protect themarine environment.
Port-related pollution incidents, as apercentage of total annual marinepollution reports2
2% 0 Five of the above incidents were thought torelate to port-generated marine pollution, whichwere primarily sourced from minor maintenanceon berthed vessels.
Number of annual emergencyresponse exercises
2 2 These exercises ensure emergency response,environmental protection and safety measuresare maintained at the highest level. They areundertaken in conjunction with port tenants, theNSW Police Service, NSW Fire Brigade andother emergency service organisations.
Number of EPA penalty actionstaken against Sydney’s portcustomers
Nil Nil A number of port users hold environmentprotection licenses from the EPA for cargohandling and storage activities. These licensesimpose a range of monitoring requirements and performance standards which are regularlyreviewed.
Regulatory complianceNumber of regulatory notices/actionstaken against Sydney Ports
Nil Nil During 2004–05, Sydney Ports will be seekingto obtain further environment protection licensesfrom the EPA, to allow the handling of bulkcargoes through White Bay port facilities.
Incident management andresponseNoise complaints per 100 vesselvisits at:
– Darling Harbour:
– Glebe Island/White Bay:
– Botany Bay:
Complaints/100 visits:
2
28
1
Baseline year1 Noise complaints are distributed for responseand investigation as required, and trends aremonitored by Sydney Ports. This will continueduring 2004–05, in which noise complaintsfrom White Bay are expected to decrease dueto the relocation of container vessel activity.
The environmental performance of Sydney Ports during 2003–04 is shown in the following table. These environmentalperformance measures reflect Sydney Ports’ regulatory risk management performance. During 2004–05, further measures willbe introduced which will address Sydney Ports’ management of its priority environmental impacts.
Indicator Achieved 2003–04 Target Comments

Syd
ney P
orts C
orp
ora
tion
Annual R
eport 2004
52
Sydney Ports CorporationSydney Ports CorporationEnvironment indicators continued
1. 2003–04 was the first year that this indicator was established and hence no performance target has been set.
2. Reports of marine pollution within Sydney Harbour and Botany Bay, received by Sydney Ports as part of our incident and marine pollution response role.
3. As Sydney Ports is obliged to respond to all incidents of marine pollution – whether sourced from land, commercial or recreational vessels – it is not appropriateto establish a target to limit our response.
Dangerous Goods audits conductedby Sydney Ports at containerterminals
586 auditsundertaken at
terminal facilities
Terminals auditedas standardprocedure
Approximately 4 per cent of all containers carry dangerous goods. Sydney Ports auditscontainer terminal facilities to ensure that thesegoods are managed in accordance withregulations. During 2003–04, Sydney Portsissued 169 penalty notices for infringements of dangerous goods requirements.
Inspections undertaken by SydneyPorts for all refuelling activities
1,228 inspectionscompleted
All refuellinginspected as
standardprocedure
The inspections aim to ensure standardprocedures are implemented to prevent water pollution from the refuelling ofcommercial vessels.
Percentage successful prosecutions,per annual cases determined
100% 100% During 2003–04, Sydney Ports launched nonew prosecutions under the Marine PollutionAct; and two penalty infringement notices wereissued for marine pollution incidents. All casesin judgement was received during 2003/041
were determined in Sydney Ports’ favour. As at1 July 2004, 11 prosecutions previouslylaunched by Sydney Ports remained pending.
Monitoring and regulatoryenforcementSafety audits conducted by SydneyPorts on all bulk oil, gas andchemical vessels
3,331 auditsundertaken (all
relevant vessels)
All vesselsaudited asstandard
procedure
These audits are conducted to prevent safetyand water pollution incidents by ensuring State,national and international Standards and codesare implemented.
Indicator Achieved 2003–04 Target Comments

Syd
ney P
orts C
orp
ora
tion
Annual R
eport 2004
53
Sydney Ports CorporationTo support the achievement of the business goals, prominence is given to creating an outcome-based culture focused onfulfiling the organisations key roles and goals as identified in the 2003–2006 Corporate Plan.
Port users and stakeholdersKey Role No.1 – Manage and develop port facilities to cater for existing and future trade needs
Goal Strategy Key performance indicators Results
Delivery of major projects
Port Botany expansion Lodgement of EIS Lodge with DIPNR by end of November 2003 Implementedto meet trade growth
Manage approval process Effectively manage Commission of Inquiry In progress, COI (COI) process recommences
October 2004
GI/WB upgrade to meet Completion of capital works Capital works program to be completed by Implementedchanging trade requirements agreed time on budget and to meet tenant
requirements
Complete remainder of site works in accordance Under review, pending with agreed timeframe requirements
New tenants identified to meet trade New tenancy leases finalised which In progressrequirements and maximise facility meet financial and trade goalsreturns
Enfield intermodal terminal Revitalise project Recommendations to Government Under review, pending NSWdeveloped to improve the to commence EIS process Metropolitan Freightport/land interface (also Strategy announcementcontributes to Key Role No.2) 2004–2005
Update strategic land use plan for Land use plan developed and submitted Pending MFS outcomesthe site for approval so EIS can proceed
Prepare and lodge Enfield EIS Manage preparation of Enfield EIS in Pending MFS outcomesaccordance with agreed C&L timeframeand budget
To undertake strategic land To identify potential land for acquisition Due diligence is completed and properties In progress, negotiations, acquisitions/disposals/ eg Cooks River terminal, Alcatel acquired if relevant criteria are satisfied due diligence progressingdevelopments which enhance (Port Botany) 2004–05the value of the port
To identify potential land for Development proposals assessed against No activitydevelopment and prepare appropriate performance measures and developed wherecase for financial expenditure all relevant criteria are satisfied
Effective management of SPC Continue to build strong relations Stakeholder survey To be completed leaseswhich acknowledge the with tenants 2004–05requirements of trade, tenants, environment and financial
Proactive management of lease issues Introduction of PAMS by 12 December 2003 Implemented
Clear objectives for the outcome of Completion of lease review by Implementedlease negotiations Ernst & Young 8 August 2003

Syd
ney P
orts C
orp
ora
tion
Annual R
eport 2004
54
Sydney Ports CorporationPort users and stakeholders continued
Key Role No. 2 – Facilitate trade by providing competitive advantage to importers,exporters and the port related supply chain
Goal Strategy Key performance indicators Results
Effective relationship Provide information that is responsive Undertake a stakeholder survey by June 2004 To be completed with industry to the business needs of lessees and 2004–05
shipping companies in a timely manner
Prioritise and target visitation program Visitation program completed Implemented
Implement recommendations from the Recommendations implemented according ImplementedTrade Development Performance and to scheduleEvaluation review
Improve efficiencies of the Work closely with rail operators road Complete empty container management Implementedtransport chain transport providers, stevedores, depot strategy by August 2003
operators, shipping lines to overcome inefficiencies in transport chain
Pilot study for rail operation performance Implementedis implemented by September 2003
Follow up the actions arising from the ImplementedTransport Forum by December 2003
Trade market share retained Implemented
Commercial pricing that takes Complete pricing review Pricing review completed by August 2003 Implementedinto account trade forecasts, financial targets and competitive Submitted to Govt for approval Implementedissues. Price changes implemented with Under Review
appropriate notification 2004–05
Communication strategy implemented Under Review 2004–05
Safety and navigationKey Role No. 3 – Manage the navigational and operational safety needs of commercial shipping
Goal Strategy Key performance indicators Results
Provide a high quality Effective pilot service No delays to shipping through pilotage One four hour stop worksustainable pilotage service meeting causing shipping delays
Upgrade vessels PV4, PV11 and PV3 upgraded by July 2003, Achieved, PV3 scheduledFebruary 2004, June 2004 respectively for 2004–05
Develop succession planning strategies Review finalised Ongoing preparation of strategies 2004–05
Compliance with PSOL Satisfactory PSOL performance Meet the performance measures in the licence Achievedrequirements and the requirements of relevant legislation
Maintain quality system to support the No major non conformances from audit Achievedabove strategy
Provide effective & interactive Implement replacement RODIS system System operates in a secure and Implementedsystems to support navigation reliable fashion by end of September 2003and shipping responsibilities
Develop ShIPS system to meet SPC System available in accordance with Implementedand port user requirements Service level agreement
Delivery of module enhancements in Achieved and accordance with publicised dates enhancements ongoingeg. Dangerous Goods EDI
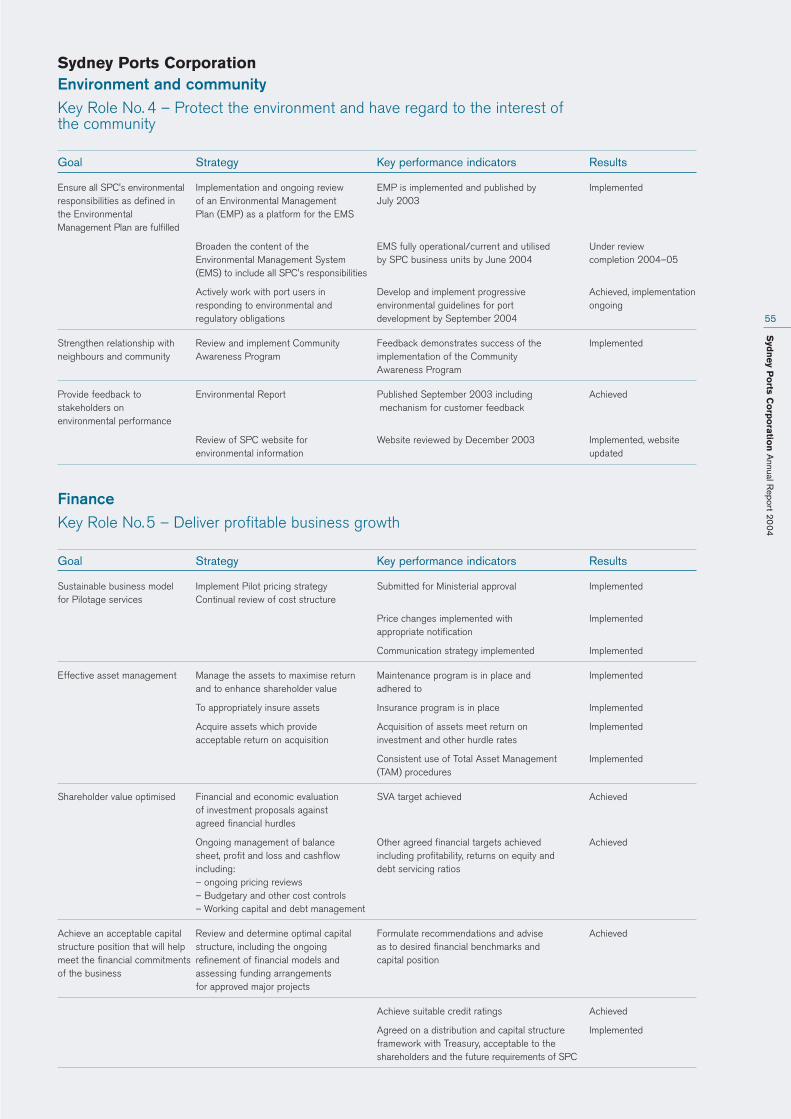
Syd
ney P
orts C
orp
ora
tion
Annual R
eport 2004
55
Sydney Ports CorporationEnvironment and communityKey Role No. 4 – Protect the environment and have regard to the interest ofthe community
Goal Strategy Key performance indicators Results
Ensure all SPC's environmental Implementation and ongoing review EMP is implemented and published by Implementedresponsibilities as defined in of an Environmental Management July 2003the Environmental Plan (EMP) as a platform for the EMSManagement Plan are fulfilled
Broaden the content of the EMS fully operational/current and utilised Under reviewEnvironmental Management System by SPC business units by June 2004 completion 2004–05(EMS) to include all SPC's responsibilities
Actively work with port users in Develop and implement progressive Achieved, implementationresponding to environmental and environmental guidelines for port ongoingregulatory obligations development by September 2004
Strengthen relationship with Review and implement Community Feedback demonstrates success of the Implementedneighbours and community Awareness Program implementation of the Community
Awareness Program
Provide feedback to Environmental Report Published September 2003 including Achievedstakeholders on mechanism for customer feedbackenvironmental performance
Review of SPC website for Website reviewed by December 2003 Implemented, websiteenvironmental information updated
FinanceKey Role No.5 – Deliver profitable business growth
Goal Strategy Key performance indicators Results
Sustainable business model Implement Pilot pricing strategy Submitted for Ministerial approval Implementedfor Pilotage services Continual review of cost structure
Price changes implemented with Implementedappropriate notification
Communication strategy implemented Implemented
Effective asset management Manage the assets to maximise return Maintenance program is in place and Implementedand to enhance shareholder value adhered to
To appropriately insure assets Insurance program is in place Implemented
Acquire assets which provide Acquisition of assets meet return on Implementedacceptable return on acquisition investment and other hurdle rates
Consistent use of Total Asset Management Implemented(TAM) procedures
Shareholder value optimised Financial and economic evaluation SVA target achieved Achievedof investment proposals against agreed financial hurdles
Ongoing management of balance Other agreed financial targets achieved Achievedsheet, profit and loss and cashflow including profitability, returns on equity and including: debt servicing ratios– ongoing pricing reviews– Budgetary and other cost controls– Working capital and debt management
Achieve an acceptable capital Review and determine optimal capital Formulate recommendations and advise Achievedstructure position that will help structure, including the ongoing as to desired financial benchmarks and meet the financial commitments refinement of financial models and capital positionof the business assessing funding arrangements
for approved major projects
Achieve suitable credit ratings Achieved
Agreed on a distribution and capital structure Implementedframework with Treasury, acceptable to the shareholders and the future requirements of SPC

Syd
ney P
orts C
orp
ora
tion
Annual R
eport 2004
56
Sydney Ports CorporationPeopleKey Role No. 6 – Learning and growth – our people
Goal Strategy Key performance indicators Results
Satisfied and committed staff To be recognised as an employer Positive staff feedback In progressto deliver business results of choice
Growing professional skills Project management disciplines utilised Under review 2004–05eg. project management in all business projects
Objectives established with Bi annual performance review feedback Implementedemployees – link to Business and sessions in placeCorporate Plan
Individual training plans in place Payment of At Risk Performance Pay Implemented
Average $ spent per person Implemented
Average hrs per person for Operational Unit Implemented
Career Development Policy Developed Increased awareness by employees Implemented and Published of opportunities
Improved internal Review and implement internal Positive staff survey feedback To be completedcommunications communications program 2004–05
Implement Document Information is easily available and used by staff To be implemented Management system in 2004–05
Enterprise Agreement Develop Strategy – align to Executive, Board and Staff endorsement Negotiations completed,2004–2007 business requirements pending vote and
certification
Establish Negotiation Team Negotiated outcomes are within financial budgetand budget
Provides flexibility to meet changing business needs

Syd
ney P
orts C
orp
ora
tion
Annual R
eport 2004
57
Sydney Ports CorporationBusiness operationsKey Role No.7– Business operations
Goal Strategy Key performance indicators Results
Good corporate governance Compliance with all applicable legal Risk Management strategy in place and Implementedrequirements (eg. SOC Act, PCWM Act, periodically auditedPF&A Act) and government policies in respect of SOC's supported by Crisis management plan in place Implementedappropriate plans and policies. and periodically tested.
Internal audit program in place Implemented
No breaches of the applicable laws of ImplementedGovernment policies identified
No material adverse findings in respect of Implementedcorporate governance made by the external auditor
Provide IT services that add Business system and information Implement document management and Ongoing to bevalue to and meet business needs identified, prioritised and portal solution implemented needs delivered as agreed, in order to facilitate 2004–05
processes and provide/build the information assets
Implement records management system Implemented
Implement new property management and Implementedmaintenance system
Deliver/expand data warehousing and/ Ongoing, to beor reporting capabilities implemented 2004–05
Upgrade or deliver new HR and Ongoing to beFinancial systems implemented 2004–05
Provide infrastructure that supports Implement/maintain infrastructure platforms Implementedagreed business applications suitable for the delivery of agreed business solutions
Provide acceptable support and Upgrade of DRP Implementedmaintenance for both infrastructure and applications Roll-out help desk processes and procedures Implemented
Provisions of support services to agreed Implementedlevels of standard Implemented
Explore opportunities for the provision Recommend e-commerce solutions and Ongoing 2004–05of e-commerce services to industry services that may provide further business stakeholders and customers opportunities
Pursue opportunities for selling ShIPS system Under review
Port Security Establish Port Facilities Security Plans In place by July 2004 consistent with Implementedat SPC Facilities IMO requirements
Facilitate completion of security plans In place by July 2004 consistent with Achieved, ongoingand upgrading measures at leases IMO requirements implementation ofPort facilities security measures
in 2004–05
Compliance with OH&S Develop Risk Assessment Framework AchievedAct 2000 and Regulations 2001
Develop Contractor Management
Framework
Workplace Inspections conducted regularly
Hazards and Ladder Registrars in place OH&S Policy and Management Plan developed Satisfactory external OH&S Audit. Entry to PDS scheme
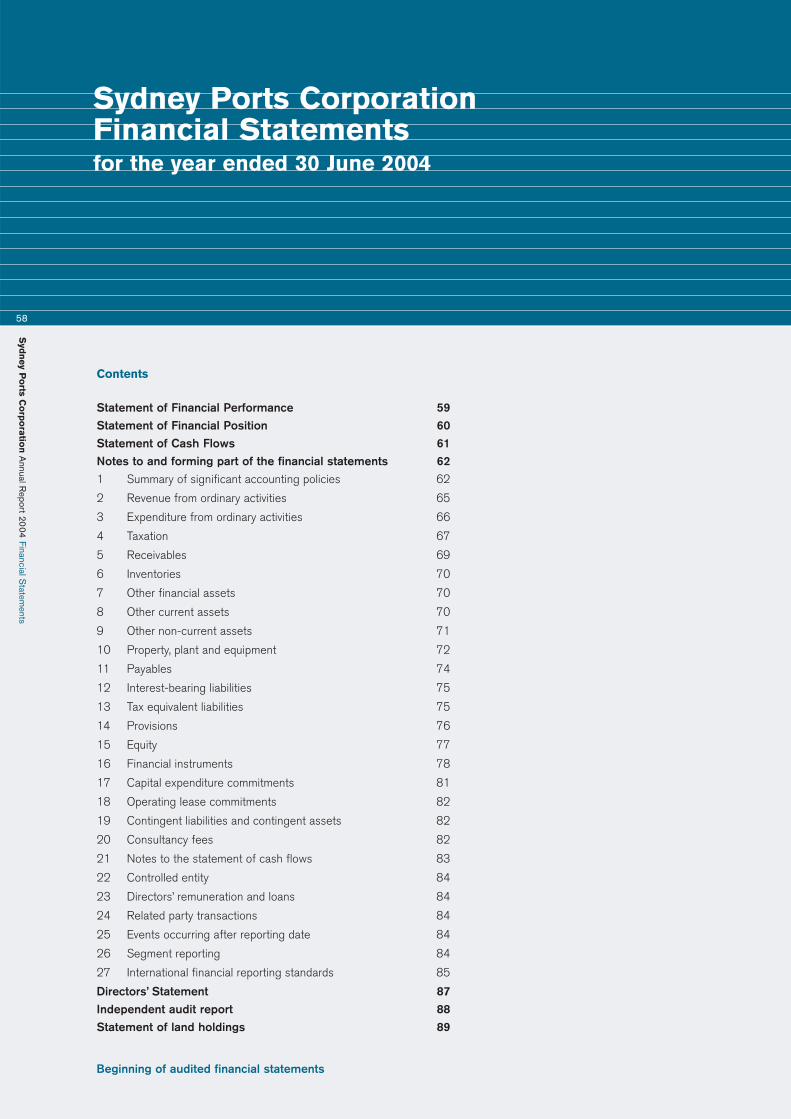
Sydney Ports CorporationFinancial Statementsfor the year ended 30 June 2004
Syd
ney P
orts C
orp
ora
tion
Annual R
eport 2004
Financial Statem
ents
58
Contents
Statement of Financial Performance 59
Statement of Financial Position 60
Statement of Cash Flows 61
Notes to and forming part of the financial statements 62
1 Summary of significant accounting policies 62
2 Revenue from ordinary activities 65
3 Expenditure from ordinary activities 66
4 Taxation 67
5 Receivables 69
6 Inventories 70
7 Other financial assets 70
8 Other current assets 70
9 Other non-current assets 71
10 Property, plant and equipment 72
11 Payables 74
12 Interest-bearing liabilities 75
13 Tax equivalent liabilities 75
14 Provisions 76
15 Equity 77
16 Financial instruments 78
17 Capital expenditure commitments 81
18 Operating lease commitments 82
19 Contingent liabilities and contingent assets 82
20 Consultancy fees 82
21 Notes to the statement of cash flows 83
22 Controlled entity 84
23 Directors’ remuneration and loans 84
24 Related party transactions 84
25 Events occurring after reporting date 84
26 Segment reporting 84
27 International financial reporting standards 85
Directors’ Statement 87
Independent audit report 88
Statement of land holdings 89
58
Beginning of audited financial statements

Syd
ney P
orts C
orp
ora
tion
Annual R
eport 2004
Financial Statem
ents
59
Sydney Ports CorporationStatement of Financial Performance for the year ended 30 June 2004
Consolidated Consolidated Corporation CorporationNote 2004 2003 2004 2003
$000 $000 $000 $000
Revenue from ordinary activities 2 140,489 124,664 132,374 119,723
Borrowing costs expense 3 13,423 13,716 13,423 13,716
Other expenses from ordinary activities 3 75,277 69,718 67,536 64,896
Total expenditure from ordinary activities 88,700 83,434 80,959 78,612
Profit from ordinary activities before income tax equivalent expense 51,789 41,230 51,415 41,111
Income tax equivalent expense relating to ordinary activities 4 (a) 16,610 14,915 16,498 14,866
Net profit attributable to members of Sydney Ports Corporation 35,179 26,315 34,917 26,245
Net increase in asset revaluation reserve 15 — 162,501 — 162,501
Total revenues, expenses and valuation adjustments attributable to members of the parent entity and recognised directly in equity — — — —
Total changes in equity other than those resulting from transactions with owners as owners 15 35,179 188,816 34,917 188,746
Note: The wholly owned subsidiary, Sydney Pilot Service Pty Ltd (SPS), commenced operations on 26 October 2002.
SPS Revenue from Ordinary Activities for the year was $9.096 million ($5.643 million in 2002–03) which represented 6.5% (4.5% in 2002–03) of ConsolidatedRevenue from Ordinary Activities. SPS net profit after income tax equivalent expense was $0.262 million ($0.070 million in 2002 –03).
The accompanying notes form an integral part of these financial statementsThe accompanying notes form an integral part of these financial statements

Syd
ney P
orts C
orp
ora
tion
Annual R
eport 2004
Financial Statem
ents
60
Sydney Ports CorporationStatement of Financial Position as at 30 June 2004
Consolidated Consolidated Corporation CorporationNote 2004 2003 2004 2003
$000 $000 $000 $000
Current assets
Cash assets 21 (a) 1,658 2,245 1,554 1,677
Receivables 5 13,849 15,205 13,298 14,613
Inventories 6 29 62 — —
Other financial assets 7 56,434 30,356 56,236 30,168
Other 8 1,045 1,361 717 1,269
Total current assets 73,015 49,229 71,805 47,727
Non-current assets
Receivables 5 274 412 289 412
Property, plant and equipment 10 728,719 730,613 726,505 729,332
Deferred tax equivalent assets 4 (c) 5,488 5,340 5,488 5,131
Other 9 8,400 6,169 10,070 7,289
Total non-current assets 742,881 742,534 742,352 742,164
Total assets 815,896 791,763 814,157 789,891
Current liabilities
Payables 11 23,787 21,790 22,821 20,728
Interest-bearing liabilities 12 — 31,694 — 31,694
Current tax equivalent liabilities 4 (b) & 13 4,009 5,152 4,009 4,990
Provisions 14 21,160 16,663 20,962 16,475
Total current liabilities 48,956 75,299 47,792 73,887
Non-current liabilities
Payables 11 — — 260 —
Interest-bearing liabilities 12 170,255 137,714 170,255 137,714
Deferred tax equivalent liabilities 4 (d) & 13 4,219 4,371 4,219 4,364
Provisions 14 6,330 5,797 5,827 5,414
Total non-current liabilities 180,804 147,882 180,561 147,492
Total liabilities 229,760 223,181 228,353 221,379
Net assets 586,136 568,582 585,804 568,512
Equity
Contributed equity 15 125,542 125,542 125,542 125,542
Reserves 15 342,721 342,721 342,721 342,721
Retained profits 15 117,873 100,319 117,541 100,249
Total equity 15 586,136 568,582 585,804 568,512
Note: The wholly owned subsidiary, Sydney Pilot Service Pty Ltd, commenced operations on 26 October 2002.
The accompanying notes form an integral part of these financial statements

Syd
ney P
orts C
orp
ora
tion
Annual R
eport 2004
Financial Statem
ents
61
Sydney Ports CorporationStatement of Cash Flows for the year ended 30 June 2004
Consolidated Consolidated Corporation CorporationNote 2004 2003 2004 2003
$000 $000 $000 $000inflow/ inflow/ inflow/ inflow/
(outflow) (outflow) (outflow) (outflow)
Cash flows from operating activities
Cash receipts in the course of operations 156,252 137,914 147,345 132,536
Cash payments in the course of operations (75,007) (68,725) (66,739) (63,904)
Interest received 1,938 1,090 1,930 1,070
Borrowing costs (12,232) (12,325) (12,232) (12,325)
Income tax equivalent paid 13 (18,053) (14,394) (17,821) (14,394)
Net cash provided by operating activities 21 (b) 52,898 43,560 52,483 42,983
Cash flows from investing activities
Payments for property, plant and equipment (14,842) (19,910) (13,423) (18,969)
Proceeds from sale of property, plant and equipment 592 824 592 824
Investment in subsidiary — — — (1,120)
Loan to subsidiary — — (550) —
Net cash used in investing activities (14,250) (19,086) (13,381) (19,265)
Cash flows from financing activities
Proceeds from borrowings — — — —
Repayment of borrowings — (100) — (100)
Dividends paid 14 (13,157) (8,540) (13,157) (8,540)
Net cash used in financing activities (13,157) (8,640) (13,157) (8,640)
Net increase / (decrease) in cash held 25,491 15,834 25,945 15,078
Cash at the beginning of the financial year 32,601 16,767 31,845 16,767
Cash at the end of the financial year 21 (a) 58,092 32,601 57,790 31,845
Note: The wholly owned subsidiary, Sydney Pilot Service Pty Ltd, commenced operations on 26 October 2002.
The accompanying notes form an integral part of these financial statements
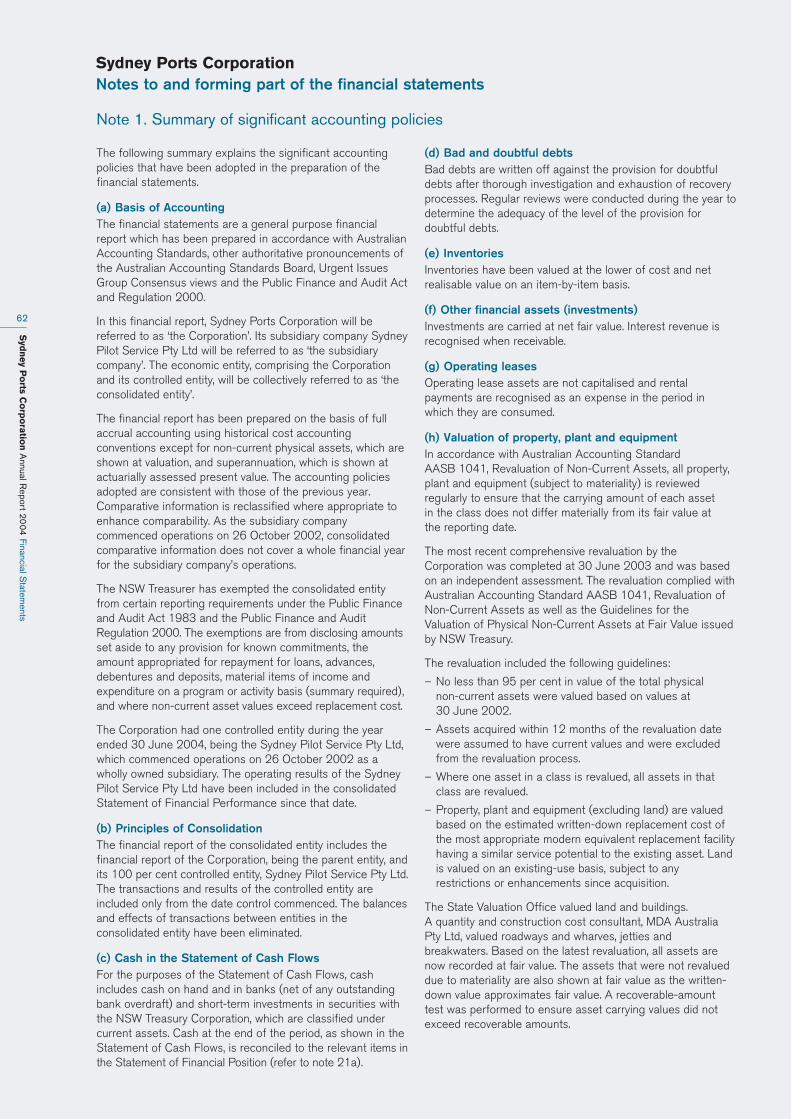
Syd
ney P
orts C
orp
ora
tion
Annual R
eport 2004
Financial Statem
ents
62
The following summary explains the significant accountingpolicies that have been adopted in the preparation of thefinancial statements.
(a) Basis of AccountingThe financial statements are a general purpose financialreport which has been prepared in accordance with AustralianAccounting Standards, other authoritative pronouncements ofthe Australian Accounting Standards Board, Urgent IssuesGroup Consensus views and the Public Finance and Audit Actand Regulation 2000.
In this financial report, Sydney Ports Corporation will bereferred to as ‘the Corporation’. Its subsidiary company SydneyPilot Service Pty Ltd will be referred to as ‘the subsidiarycompany’. The economic entity, comprising the Corporationand its controlled entity, will be collectively referred to as ‘theconsolidated entity’.
The financial report has been prepared on the basis of fullaccrual accounting using historical cost accountingconventions except for non-current physical assets, which areshown at valuation, and superannuation, which is shown atactuarially assessed present value. The accounting policiesadopted are consistent with those of the previous year.Comparative information is reclassified where appropriate toenhance comparability. As the subsidiary companycommenced operations on 26 October 2002, consolidatedcomparative information does not cover a whole financial yearfor the subsidiary company’s operations.
The NSW Treasurer has exempted the consolidated entityfrom certain reporting requirements under the Public Financeand Audit Act 1983 and the Public Finance and AuditRegulation 2000. The exemptions are from disclosing amountsset aside to any provision for known commitments, theamount appropriated for repayment for loans, advances,debentures and deposits, material items of income andexpenditure on a program or activity basis (summary required),and where non-current asset values exceed replacement cost.
The Corporation had one controlled entity during the yearended 30 June 2004, being the Sydney Pilot Service Pty Ltd,which commenced operations on 26 October 2002 as awholly owned subsidiary. The operating results of the SydneyPilot Service Pty Ltd have been included in the consolidatedStatement of Financial Performance since that date.
(b) Principles of ConsolidationThe financial report of the consolidated entity includes thefinancial report of the Corporation, being the parent entity, andits 100 per cent controlled entity, Sydney Pilot Service Pty Ltd.The transactions and results of the controlled entity areincluded only from the date control commenced. The balancesand effects of transactions between entities in theconsolidated entity have been eliminated.
(c) Cash in the Statement of Cash FlowsFor the purposes of the Statement of Cash Flows, cashincludes cash on hand and in banks (net of any outstandingbank overdraft) and short-term investments in securities withthe NSW Treasury Corporation, which are classified undercurrent assets. Cash at the end of the period, as shown in theStatement of Cash Flows, is reconciled to the relevant items inthe Statement of Financial Position (refer to note 21a).
(d) Bad and doubtful debtsBad debts are written off against the provision for doubtfuldebts after thorough investigation and exhaustion of recoveryprocesses. Regular reviews were conducted during the year todetermine the adequacy of the level of the provision fordoubtful debts.
(e) InventoriesInventories have been valued at the lower of cost and netrealisable value on an item-by-item basis.
(f) Other financial assets (investments)Investments are carried at net fair value. Interest revenue isrecognised when receivable.
(g) Operating leasesOperating lease assets are not capitalised and rentalpayments are recognised as an expense in the period inwhich they are consumed.
(h) Valuation of property, plant and equipmentIn accordance with Australian Accounting Standard AASB 1041, Revaluation of Non-Current Assets, all property,plant and equipment (subject to materiality) is reviewedregularly to ensure that the carrying amount of each asset in the class does not differ materially from its fair value at the reporting date.
The most recent comprehensive revaluation by theCorporation was completed at 30 June 2003 and was basedon an independent assessment. The revaluation complied withAustralian Accounting Standard AASB 1041, Revaluation ofNon-Current Assets as well as the Guidelines for theValuation of Physical Non-Current Assets at Fair Value issuedby NSW Treasury.
The revaluation included the following guidelines:
– No less than 95 per cent in value of the total physical non-current assets were valued based on values at 30 June 2002.
– Assets acquired within 12 months of the revaluation datewere assumed to have current values and were excludedfrom the revaluation process.
– Where one asset in a class is revalued, all assets in thatclass are revalued.
– Property, plant and equipment (excluding land) are valuedbased on the estimated written-down replacement cost ofthe most appropriate modern equivalent replacement facilityhaving a similar service potential to the existing asset. Landis valued on an existing-use basis, subject to anyrestrictions or enhancements since acquisition.
The State Valuation Office valued land and buildings. A quantity and construction cost consultant, MDA AustraliaPty Ltd, valued roadways and wharves, jetties andbreakwaters. Based on the latest revaluation, all assets arenow recorded at fair value. The assets that were not revalueddue to materiality are also shown at fair value as the written-down value approximates fair value. A recoverable-amounttest was performed to ensure asset carrying values did notexceed recoverable amounts.
Sydney Ports CorporationNotes to and forming part of the financial statements
Note 1. Summary of significant accounting policies

Syd
ney P
orts C
orp
ora
tion
Annual R
eport 2004
Financial Statem
ents
63
(i) Capitalisation of property, plant and equipmentProperty, Plant and Equipment in excess of $1000 iscapitalised where it is expected to provide future economicbenefits for more than one reporting period. Only those assetscompleted and ready for service are taken to the property,plant and equipment accounts. The remaining capitalexpenditures are carried forward as construction in progressand are included in property, plant and equipment in the Statement of Financial Position.
(j) Depreciation of property, plant and equipmentDepreciation has been calculated on depreciable assets,using rates estimated to write off the assets over theirremaining useful lives on a straight-line basis in accordancewith Australian Accounting Standard AAS4, Depreciation of Non-Current Assets. Land assets have been treated as non-depreciable. The remaining useful lives of assets werereassessed during the year with no changes required. The expected design lives of new depreciable assets at 30 June 2004 are:
– Buildings 10 to 50 years
– Roadways 5 to 20 years
– Wharves, jetties and breakwaters 10 to 100 years
– Plant 2 to 40 years
(k) Retirement benefits (superannuation)The consolidated entity contributes to employee superannuationfunds in addition to contributions made by employees. Suchcontributions are paid to Pillar Administration and otheremployee-nominated funds. The Corporation contributes todefined-benefit schemes and accumulation schemes. Thesubsidiary company contributes to accumulation schemesonly. Payments are applied towards the accruing liability foremployee superannuation and are charged against revenue.
(l) Interest-bearing liabilitiesInterest-bearing liabilities are carried at their face value afterdeducting any unamortised discount or adding anyunamortised premium. Any discount or premium is deferredand amortised over the term of the loan.
(m) Employee benefitsBenefits for annual leave have been provided at the amountexpected to be paid when the liabilities are settled.Appropriate on-costs are included. Benefits for long-serviceleave have been measured using the present value ofexpected future payments to be made for services providedby employees up to the reporting date. Consideration is givento expected future wage and salary levels, experience ofemployee departures and periods of service. Expected futurepayments are discounted using market yields at the reportingdate on national government bonds and terms to maturity thatmatch, as closely as possible, the estimated future cashoutflows. Appropriate on-costs are included. The portionexpected to be settled within 12 months of the reporting dateis recognised as the current provision; the portion expected tobe settled more than 12 months from the reporting date isrecognised as the non-current provision. The average sickleave taken by employees based on past experience is lessthan the entitlement accruing each period. It is consideredimprobable that existing accumulated sick leave entitlementswill be used, and therefore no liability has been recognised.
(n) Revenue recognitionRevenue is recognised to the extent that it is probable thatthe economic benefits will flow to the entity and the revenuecan be reliably measured. The following specific recognitioncriteria must also be met before revenue is recognised:
– Revenue from the rendering of a service is recognised onthe delivery of the service to the customer.
– Interest revenue is recognised when receivable.
– The Corporation’s superannuation liabilities are currently inan over-funded position (refer note 9). Any increase in over-funding during a year is recognised as revenue in theStatement of Financial Performance.
– Proceeds from the sale of assets are recognised upon thedelivery of the assets to the purchaser.
– Government capital grant revenue is recognised whenreceived.
– Assets received at no cost are recorded at their fair valuewhen received, and this amount is included in revenue.
– Goods or services exchanged that are of a different natureand value are recognised at fair value when the followingcriteria have been met:
– the entity has passed control of the goods or otherassets to the consolidated entity
– it is probable that the economic benefits comprising theconsideration will flow to the consolidated entity, and
– the amount of revenue can be measured reliably.
(o) Income Tax EquivalentIncome tax equivalent is required to be paid to the NSWGovernment in accordance with section 20T of the StateOwned Corporations Act 1989. The payments are equivalentto the amounts that would be payable under normal incometax law of the Commonwealth. The National Tax EquivalentRegime was established on 1 July 2001, with the AustralianTaxation Office administering the tax equivalent schemeacross Australia.
The financial statements apply the principles of tax-effectaccounting. The income tax equivalent expense in theStatement of Financial Performance represents the taxequivalent on the pre-tax accounting profit adjusted forincome and expenses never to be assessed or allowed fortaxation equivalent purposes. The deferred tax equivalentassets and liabilities include the tax equivalent effect ofdifferences between income and expense items recognised indifferent accounting periods for book and tax equivalentpurposes. These are calculated at the tax equivalent ratesexpected to apply when the differences reverse. Thecomponents of the deferred tax equivalent assets andliabilities are shown in note 4.
The Corporation and its wholly owned Australian controlledentity have decided to implement the tax consolidationlegislation from 1 July 2003. The Australian Taxation Officehas not been notified of this decision but will be advised whenthe consolidated tax return is lodged in December 2004. As aconsequence, the Corporation, as the head entity in theconsolidated group, recognises current and deferred taxamounts relating to transactions, events and balances of the wholly owned Australian controlled entity in this groupas if those transactions, events and balances were its own, in addition to the current and deferred tax amounts arising in relation to its own transactions, events and balances.
Sydney Ports CorporationNotes to and forming part of the financial statements
Note 1. Summary of significant accounting policies continued

Syd
ney P
orts C
orp
ora
tion
Annual R
eport 2004
Financial Statem
ents
64
(o) Income Tax Equivalent continued
Amounts receivable or payable, under an accounting sharing agreement between the tax consolidated entities, are recognised separately as tax-related amounts receivableor payable. Expenses and revenues arising under the tax-sharing agreement are recognised as a component of income tax expense.
(p) DividendThe consolidated entity reviews its financial performance forthe accounting period and recommends to its shareholders anappropriate dividend payment in light of the current financialposition and longer-term financial commitments. Under NSWTreasury’s Financial Distribution Policy for GovernmentBusinesses, the Corporation prepares a Statement ofCorporate Intent (SCI) which is an agreement between therelevant Minister and the Board. This agreement includesdividend targets for the year ahead and is signed before theend of the financial year to which it relates. This creates avalid expectation that a dividend will be paid. Consequently, inaccordance with Australian Accounting Standard AASB1044Provisions, Contingent Liabilities and Contingent Assets, andNSW Treasury’s Financial Distribution Policy for GovernmentBusinesses, the dividend for the financial year is set aside asa provision in the Statement of Financial Position.
(q) Financial instrumentsFinancial instruments give rise to positions that are financialassets of either the consolidated entity or its counterparty andfinancial liabilities (or equity instruments) of the other party.These include cash, receivables, investments, creditors,interest-bearing liabilities and derivative financial instruments(futures contracts). In accordance with AAS33, Presentationand Disclosure of Financial Instruments, information isdisclosed in note 16 for the credit risk and interest rate risk offinancial instruments. All such amounts are carried in theaccounts at net fair value unless otherwise stated. Thespecific accounting policy for each class of such financialinstrument is stated as follows:
Classes of instruments recorded at cost comprise:
– cash
– receivables
– payables, and
– interest-bearing liabilities.
Classes of instruments recorded at market or net fair valuecomprise:
– investments, and
– derivative financial instruments.
All financial instruments, including revenue, expenses or othercash flows arising from instruments, are recognised on anaccrual basis.
(r) Goods and services taxRevenues, expenses and assets are recognised net of theamount of Goods and Services Tax (GST), except where theamount of GST incurred is not recoverable from theAustralian Taxation Office (ATO). In these circumstances theGST is recognised as part of the cost of acquisition of theasset or as part of an expense item. Receivables andpayables are stated with the amount of GST included. Accrualitems are also shown in the Statement of Financial Positioninclusive of GST where applicable.
The net amount of GST owing to the ATO, or refundable fromthe ATO, is shown as a Payable or Receivable in theStatement of Financial Position. Cash flows are included inthe statement of cash flows on a gross basis. The GSTcomponent of cash flows arising from investing and financingactivities that is recoverable from or payable to the ATO isclassified as operating cash flows.
(s) Rounding amounts to the nearest thousand dollars
In the financial statements, all amounts are recorded inAustralian Dollars and have been rounded to the nearestthousand dollars (shown as $000).
Sydney Ports CorporationNotes to and forming part of the financial statements
Note 1. Summary of significant accounting policies continued
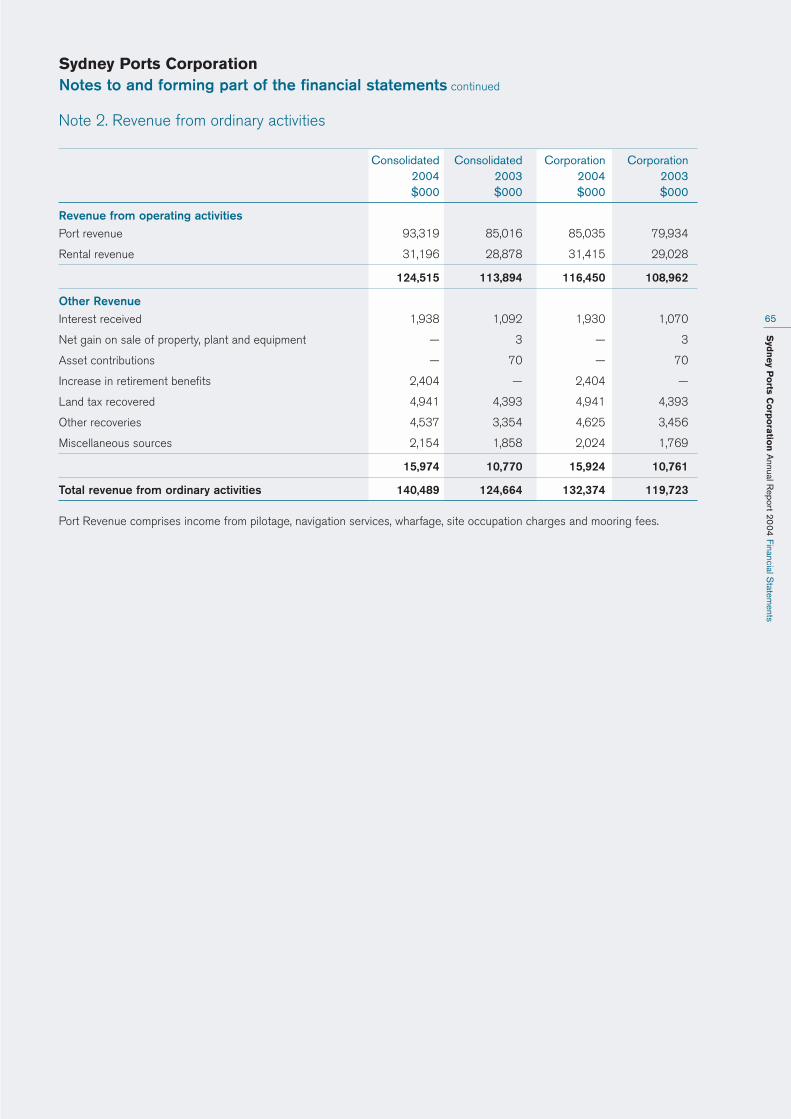
Syd
ney P
orts C
orp
ora
tion
Annual R
eport 2004
Financial Statem
ents
65
Note 2. Revenue from ordinary activities
Consolidated Consolidated Corporation Corporation2004 2003 2004 2003$000 $000 $000 $000
Revenue from operating activities
Port revenue 93,319 85,016 85,035 79,934
Rental revenue 31,196 28,878 31,415 29,028
124,515 113,894 116,450 108,962
Other Revenue
Interest received 1,938 1,092 1,930 1,070
Net gain on sale of property, plant and equipment — 3 — 3
Asset contributions — 70 — 70
Increase in retirement benefits 2,404 — 2,404 —
Land tax recovered 4,941 4,393 4,941 4,393
Other recoveries 4,537 3,354 4,625 3,456
Miscellaneous sources 2,154 1,858 2,024 1,769
15,974 10,770 15,924 10,761
Total revenue from ordinary activities 140,489 124,664 132,374 119,723
Port Revenue comprises income from pilotage, navigation services, wharfage, site occupation charges and mooring fees.
Sydney Ports CorporationNotes to and forming part of the financial statements continued

Syd
ney P
orts C
orp
ora
tion
Annual R
eport 2004
Financial Statem
ents
66
Note 3. Expenditure from ordinary activities
Consolidated Consolidated Corporation CorporationNote 2004 2003 2004 2003
$000 $000 $000 $000
Salaries and wages 21,019 18,216 16,205 15,170
Employee benefits expense:
Annual leave 14 2,044 1,907 1,486 1,569
Long-service leave 14 1,053 1,327 912 1,220
Retirement benefits (superannuation) – defined benefit 9 173 3,340 173 3,340
Retirement benefits (superannuation)– accumulation 636 527 416 387
Other expenses from ordinary activities:
Service contractors 11,978 8,729 11,576 8,464
Utilities and communications 2,204 1,585 2,182 1,571
Indirect taxes 8,920 7,629 8,477 7,438
Depreciation 10 13,270 12,326 13,157 12,286
Doubtful debts 5 (b) & (c) (9) (24) (10) (36)
Auditors’ remuneration from review ofthe financial reports 127 122 110 107
Directors’ remuneration 23 314 255 295 237
Consultants’ fees — 93 — 93
Rental on operating leases 1,852 1,882 1,742 1,809
Net loss on sale of property, plant and equipment 29 — 29 —
Insurance 2,321 2,059 1,980 1,888
Materials 1,232 1,427 923 1,179
Other operations and services 8,114 8,318 7,883 8,174
Other expenses from ordinary activities 75,277 69,718 67,536 64,896
Borrowing costs expense 13,423 13,716 13,423 13,716
Total expenditure from ordinary activities 88,700 83,434 80,959 78,612
Sydney Ports CorporationNotes to and forming part of the financial statements continued

Syd
ney P
orts C
orp
ora
tion
Annual R
eport 2004
Financial Statem
ents
67
Note 4. Taxation
Consolidated Consolidated Corporation Corporation2004 2003 2004 2003$000 $000 $000 $000
(a) Income tax equivalent expense
The difference between income tax equivalent expense provided in the financial statements and the prima facie income tax equivalent expense is reconciled as follows:
Profit on ordinary activities before income tax equivalent 51,789 41,230 51,415 41,111
Prima facie tax thereon at 30% 15,537 12,369 15,425 12,333
Add/(less) tax effect of permanent and other differences:
Entertainment expenses 28 49 28 49
Depreciation not deductible 1,461 1,535 1,461 1,535
Superannuation not deductible (669) 1,002 (669) 1,002
Other 253 (40) 253 (53)
Total income tax equivalent attributable to operating profit 16,610 14,915 16,498 14,866
Total income tax equivalent comprises movements in:
Current tax equivalent liabilities 16,910 15,097 16,910 14,935
Deferred tax equivalent liabilities (152) 451 (152) 444
Deferred tax equivalent assets (148) (722) (148) (513)
Deferred tax equivalent assets generated on acquisition — 89 — —
Tax equivalent related to subsidiary — — (112) —
16,610 14,915 16,498 14,866
Sydney Ports CorporationNotes to and forming part of the financial statements continued
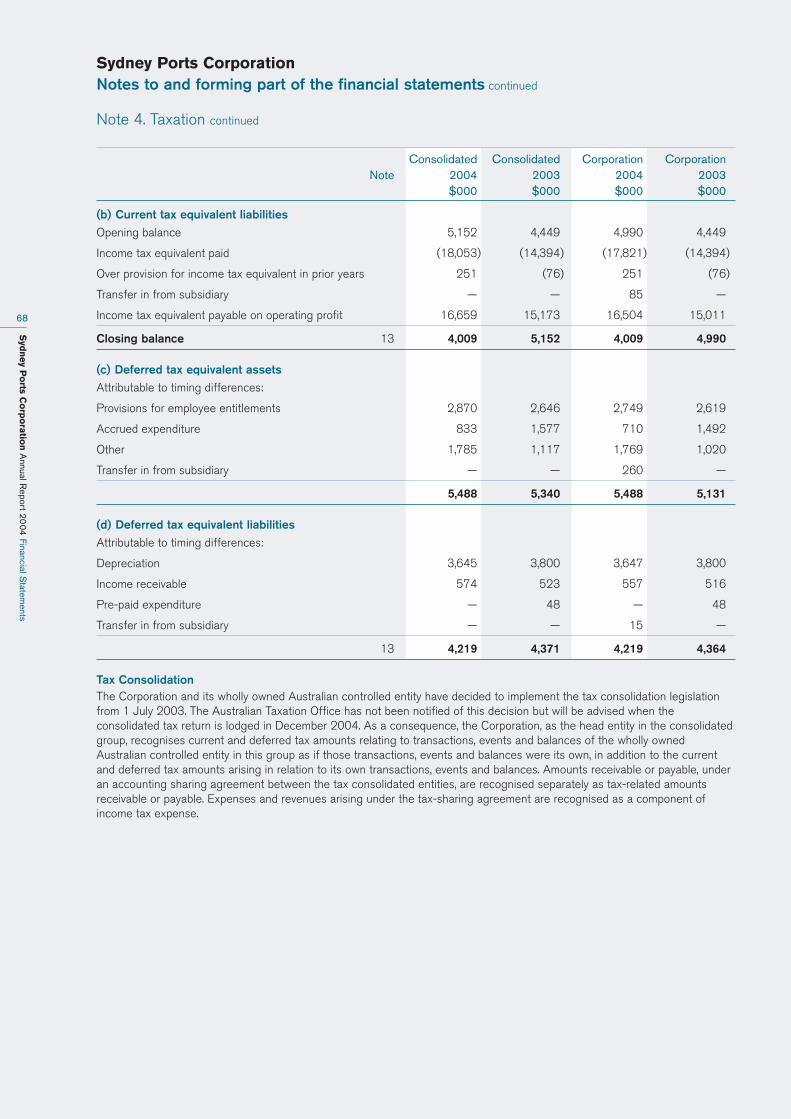
Syd
ney P
orts C
orp
ora
tion
Annual R
eport 2004
Financial Statem
ents
68
Note 4. Taxation continued
Consolidated Consolidated Corporation CorporationNote 2004 2003 2004 2003
$000 $000 $000 $000
(b) Current tax equivalent liabilities
Opening balance 5,152 4,449 4,990 4,449
Income tax equivalent paid (18,053) (14,394) (17,821) (14,394)
Over provision for income tax equivalent in prior years 251 (76) 251 (76)
Transfer in from subsidiary — — 85 —
Income tax equivalent payable on operating profit 16,659 15,173 16,504 15,011
Closing balance 13 4,009 5,152 4,009 4,990
(c) Deferred tax equivalent assets
Attributable to timing differences:
Provisions for employee entitlements 2,870 2,646 2,749 2,619
Accrued expenditure 833 1,577 710 1,492
Other 1,785 1,117 1,769 1,020
Transfer in from subsidiary — — 260 —
5,488 5,340 5,488 5,131
(d) Deferred tax equivalent liabilities
Attributable to timing differences:
Depreciation 3,645 3,800 3,647 3,800
Income receivable 574 523 557 516
Pre-paid expenditure — 48 — 48
Transfer in from subsidiary — — 15 —
13 4,219 4,371 4,219 4,364
Tax ConsolidationThe Corporation and its wholly owned Australian controlled entity have decided to implement the tax consolidation legislationfrom 1 July 2003. The Australian Taxation Office has not been notified of this decision but will be advised when theconsolidated tax return is lodged in December 2004. As a consequence, the Corporation, as the head entity in the consolidatedgroup, recognises current and deferred tax amounts relating to transactions, events and balances of the wholly ownedAustralian controlled entity in this group as if those transactions, events and balances were its own, in addition to the currentand deferred tax amounts arising in relation to its own transactions, events and balances. Amounts receivable or payable, underan accounting sharing agreement between the tax consolidated entities, are recognised separately as tax-related amountsreceivable or payable. Expenses and revenues arising under the tax-sharing agreement are recognised as a component ofincome tax expense.
Sydney Ports CorporationNotes to and forming part of the financial statements continued

Syd
ney P
orts C
orp
ora
tion
Annual R
eport 2004
Financial Statem
ents
69
Note 5. Receivables
Consolidated Consolidated Corporation Corporation2004 2003 2004 2003$000 $000 $000 $000
Current
Trade debtors 7,274 6,575 6,638 5,987
Other debtors 4,189 4,444 4,349 4,476
Accrued income (a) 2,576 4,392 2,488 4,344
14,039 15,411 13,475 14,807
Less: Provision for doubtful debts (b) (190) (206) (177) (194)
13,849 15,205 13,298 14,613
Non-Current
Trade debtors 280 420 280 420
Other debtors — — 15 —
280 420 295 420
Less: Provision for doubtful debts (c) (6) (8) (6) (8)
274 412 289 412
Based on a review of debtors, an appropriate provision is carried for doubtful debts.
(a) Accrued income comprises:
Operating income 2,575 4,390 2,488 4,344
Bank interest 1 2 — —
Total accrued income 2,576 4,392 2,488 4,344
(b) Provision for doubtful debts – Current
Opening balance 206 241 194 241
Add: Current year’s charge (7) (21) (8) (33)
199 220 186 208
Less: Bad debts written off (9) (14) (9) (14)
Closing balance 190 206 177 194
(c) Provision for doubtful debts – Non-current
Opening balance 8 11 8 11
Add: Current year’s charge (2) (3) (2) (3)
6 8 6 8
Less: Bad debts written off — — — —
Closing balance 6 8 6 8
Sydney Ports CorporationNotes to and forming part of the financial statements continued

Syd
ney P
orts C
orp
ora
tion
Annual R
eport 2004
Financial Statem
ents
70
Note 6. Inventories
Consolidated Consolidated Corporation Corporation2004 2003 2004 2003$000 $000 $000 $000
Stores and materials:
– at cost 29 62 — —
29 62 — —
Inventory is classified as current as all items are expected to be consumed in the next financial year.
Note 7. Other financial assets
Consolidated Consolidated Corporation Corporation2004 2003 2004 2003
Net Fair Net Fair Net Fair Net FairValue Value Value Value$000 $000 $000 $000
The investments are:
Cash Facility Trust 56,434 22,518 56,236 22,330
Cash Plus Facility Trust — 7,838 — 7,838
56,434 30,356 56,236 30,168
The consolidated entity has investments in NSW Treasury Corporation’s (TCorp) Hour-Glass Cash Facility Trust. Investments are represented by a number of units in the managed facility. TCorp appoints and monitors fund managers and establishes andmonitors the application of appropriate investment guidelines. These investments are generally able to be redeemed with up to24 hours prior notice. The value of the investments held can increase or decrease depending on market conditions. The valuethat best represents the maximum credit risk exposure is the net fair value. The value of the above investments represents theshare of the value of the underlying assets of the facility and is stated at net fair value.
Note 8. Other current assets
Consolidated Consolidated Corporation Corporation2004 2003 2004 2003$000 $000 $000 $000
Prepayments
Operating expenditure prepayments 1,045 1,361 717 1,269
1,045 1,361 717 1,269
Sydney Ports CorporationNotes to and forming part of the financial statements continued
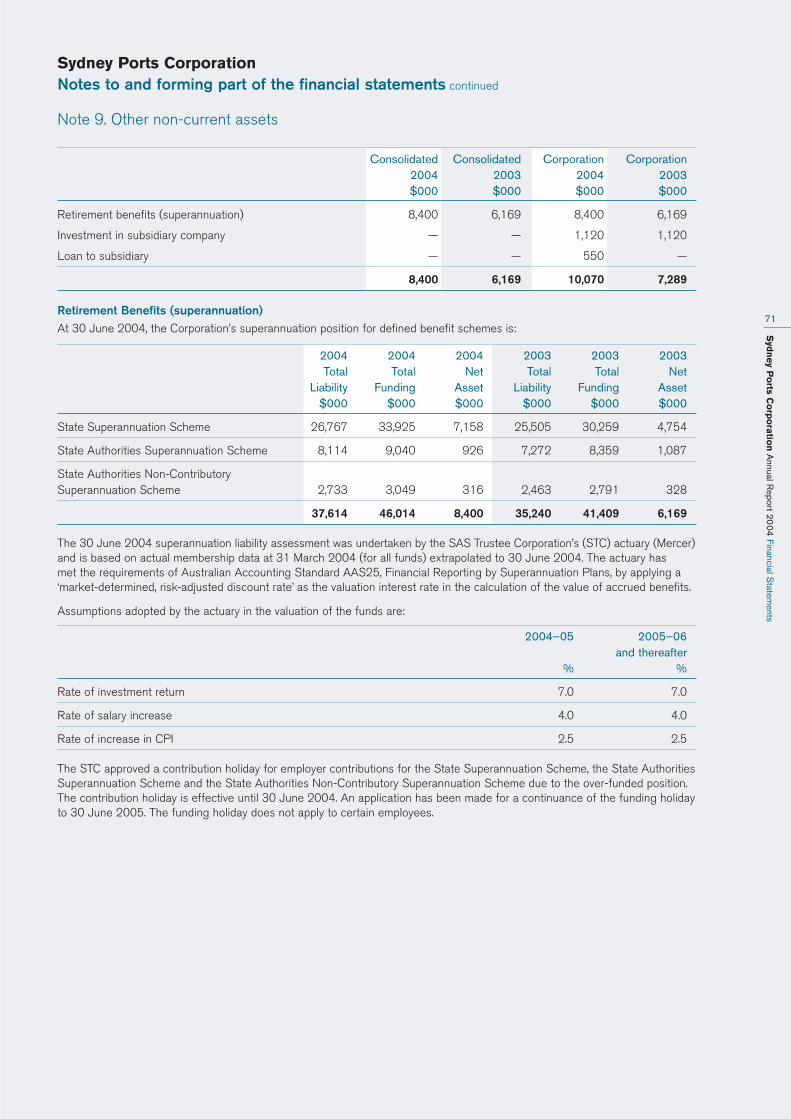
Syd
ney P
orts C
orp
ora
tion
Annual R
eport 2004
Financial Statem
ents
71
Note 9. Other non-current assets
Consolidated Consolidated Corporation Corporation2004 2003 2004 2003$000 $000 $000 $000
Retirement benefits (superannuation) 8,400 6,169 8,400 6,169
Investment in subsidiary company — — 1,120 1,120
Loan to subsidiary — — 550 —
8,400 6,169 10,070 7,289
Retirement Benefits (superannuation)
At 30 June 2004, the Corporation’s superannuation position for defined benefit schemes is:
2004 2004 2004 2003 2003 2003Total Total Net Total Total Net
Liability Funding Asset Liability Funding Asset$000 $000 $000 $000 $000 $000
State Superannuation Scheme 26,767 33,925 7,158 25,505 30,259 4,754
State Authorities Superannuation Scheme 8,114 9,040 926 7,272 8,359 1,087
State Authorities Non-Contributory Superannuation Scheme 2,733 3,049 316 2,463 2,791 328
37,614 46,014 8,400 35,240 41,409 6,169
The 30 June 2004 superannuation liability assessment was undertaken by the SAS Trustee Corporation’s (STC) actuary (Mercer)and is based on actual membership data at 31 March 2004 (for all funds) extrapolated to 30 June 2004. The actuary has met the requirements of Australian Accounting Standard AAS25, Financial Reporting by Superannuation Plans, by applying a‘market-determined, risk-adjusted discount rate’ as the valuation interest rate in the calculation of the value of accrued benefits.
Assumptions adopted by the actuary in the valuation of the funds are:
2004–05 2005–06and thereafter
% %
Rate of investment return 7.0 7.0
Rate of salary increase 4.0 4.0
Rate of increase in CPI 2.5 2.5
The STC approved a contribution holiday for employer contributions for the State Superannuation Scheme, the State AuthoritiesSuperannuation Scheme and the State Authorities Non-Contributory Superannuation Scheme due to the over-funded position.The contribution holiday is effective until 30 June 2004. An application has been made for a continuance of the funding holidayto 30 June 2005. The funding holiday does not apply to certain employees.
Sydney Ports CorporationNotes to and forming part of the financial statements continued
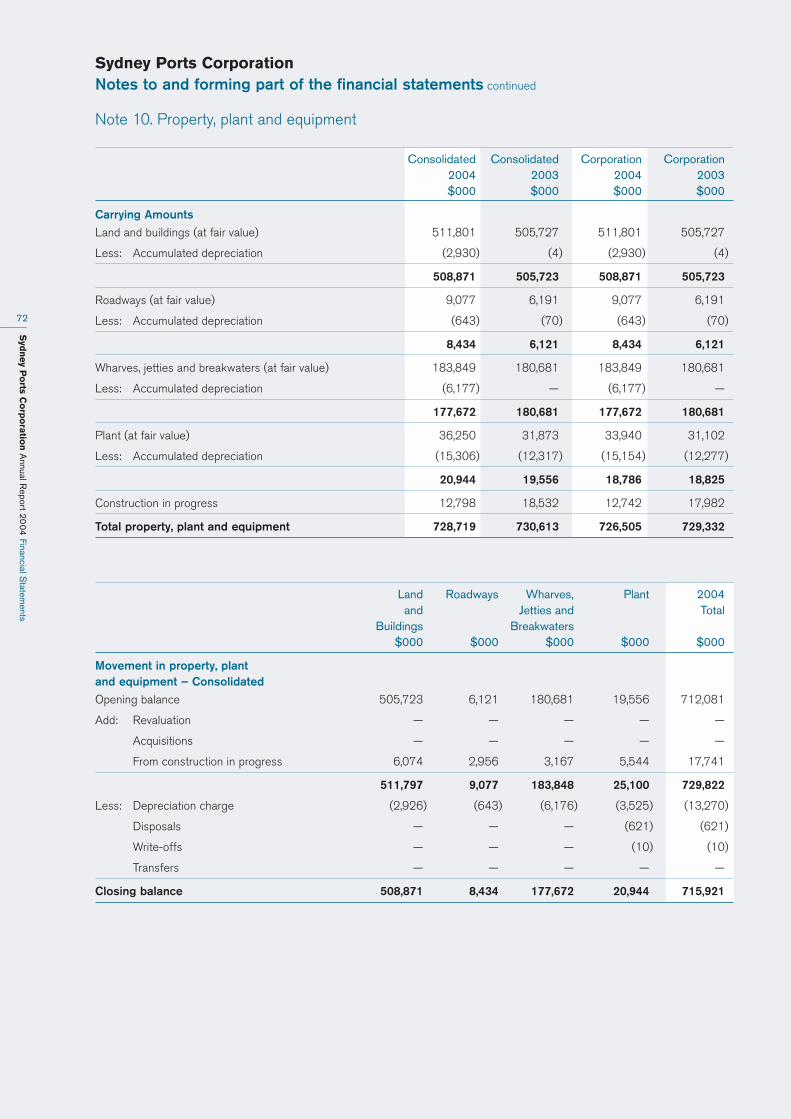
Syd
ney P
orts C
orp
ora
tion
Annual R
eport 2004
Financial Statem
ents
72
Note 10. Property, plant and equipment
Consolidated Consolidated Corporation Corporation2004 2003 2004 2003$000 $000 $000 $000
Carrying Amounts
Land and buildings (at fair value) 511,801 505,727 511,801 505,727
Less: Accumulated depreciation (2,930) (4) (2,930) (4)
508,871 505,723 508,871 505,723
Roadways (at fair value) 9,077 6,191 9,077 6,191
Less: Accumulated depreciation (643) (70) (643) (70)
8,434 6,121 8,434 6,121
Wharves, jetties and breakwaters (at fair value) 183,849 180,681 183,849 180,681
Less: Accumulated depreciation (6,177) — (6,177) —
177,672 180,681 177,672 180,681
Plant (at fair value) 36,250 31,873 33,940 31,102
Less: Accumulated depreciation (15,306) (12,317) (15,154) (12,277)
20,944 19,556 18,786 18,825
Construction in progress 12,798 18,532 12,742 17,982
Total property, plant and equipment 728,719 730,613 726,505 729,332
Land Roadways Wharves, Plant 2004and Jetties and Total
Buildings Breakwaters$000 $000 $000 $000 $000
Movement in property, plant and equipment – Consolidated
Opening balance 505,723 6,121 180,681 19,556 712,081
Add: Revaluation — — — — —
Acquisitions — — — — —
From construction in progress 6,074 2,956 3,167 5,544 17,741
511,797 9,077 183,848 25,100 729,822
Less: Depreciation charge (2,926) (643) (6,176) (3,525) (13,270)
Disposals — — — (621) (621)
Write-offs — — — (10) (10)
Transfers — — — — —
Closing balance 508,871 8,434 177,672 20,944 715,921
Sydney Ports CorporationNotes to and forming part of the financial statements continued

Syd
ney P
orts C
orp
ora
tion
Annual R
eport 2004
Financial Statem
ents
73
Note 10. Property, plant and equipment continued
Land Roadways Wharves, Plant 2004and Jetties and Total
Buildings Breakwaters$000 $000 $000 $000 $000
Movement in property, plant and equipment – Corporation
Opening balance 505,723 6,121 180,681 18,825 711,350
Add: Revaluation — — — — —
Acquisitions — — — — —
From construction in progress 6,074 2,956 3,167 4,001 16,198
511,797 9,077 183,848 22,826 727,548
Less: Depreciation charge (2,926) (643) (6,176) (3,412) (13,157)
Disposals — — — (621) (621)
Write-offs — — — (7) (7)
Transfers — — — — —
Closing balance 508,871 8,434 177,672 18,786 713,763
Consolidated Corporation2004 2004$000 $000
Movement in construction in progress
Opening balance 18,532 17,982
Add: Acquisitions 12,007 10,958
30,539 28,940
Less: To property, plant and equipment (17,741) (16,198)
Closing balance 12,798 12,742
Consolidated Consolidated Corporation Corporation2004 2003 2004 2003$000 $000 $000 $000
Sale of property, plant and equipment:
Property, plant and equipment 961 1,025 961 1,025
Less: Accumulated depreciation (340) (204) (340) (204)
621 821 621 821
Less: Proceeds from sale (592) (824) (592) (824)
Net loss/(profit) on sale 29 (3) 29 (3)
Sydney Ports CorporationNotes to and forming part of the financial statements continued

Syd
ney P
orts C
orp
ora
tion
Annual R
eport 2004
Financial Statem
ents
74
Note 10. Property, plant and equipment continued
Consolidated Consolidated Corporation Corporation2004 2003 2004 2003$000 $000 $000 $000
Assets leased to external parties under operating leases:
Land and buildings 286,946 322,021 286,946 322,021
Less: Accumulated depreciation (1,032) — (1,032) —
Wharves, jetties and breakwaters 58,833 69,246 58,833 69,246
Less: Accumulated depreciation (3,014) — (3,014) —
Plant 668 772 668 772
Less: Accumulated depreciation (325) (350) (325) (350)
Total carrying value of leased assets 342,076 391,689 342,076 391,689
Note 11. Payables
Consolidated Consolidated Corporation Corporation2004 2003 2004 2003$000 $000 $000 $000
Current
Trade creditors 1,171 169 1,117 154
Other creditors 14,586 16,490 13,674 15,443
Income received in advance 8,030 5,131 8,030 5,131
23,787 21,790 22,821 20,728
Non-current
Creditors — — 260 —
— — 260 —
Sydney Ports CorporationNotes to and forming part of the financial statements continued
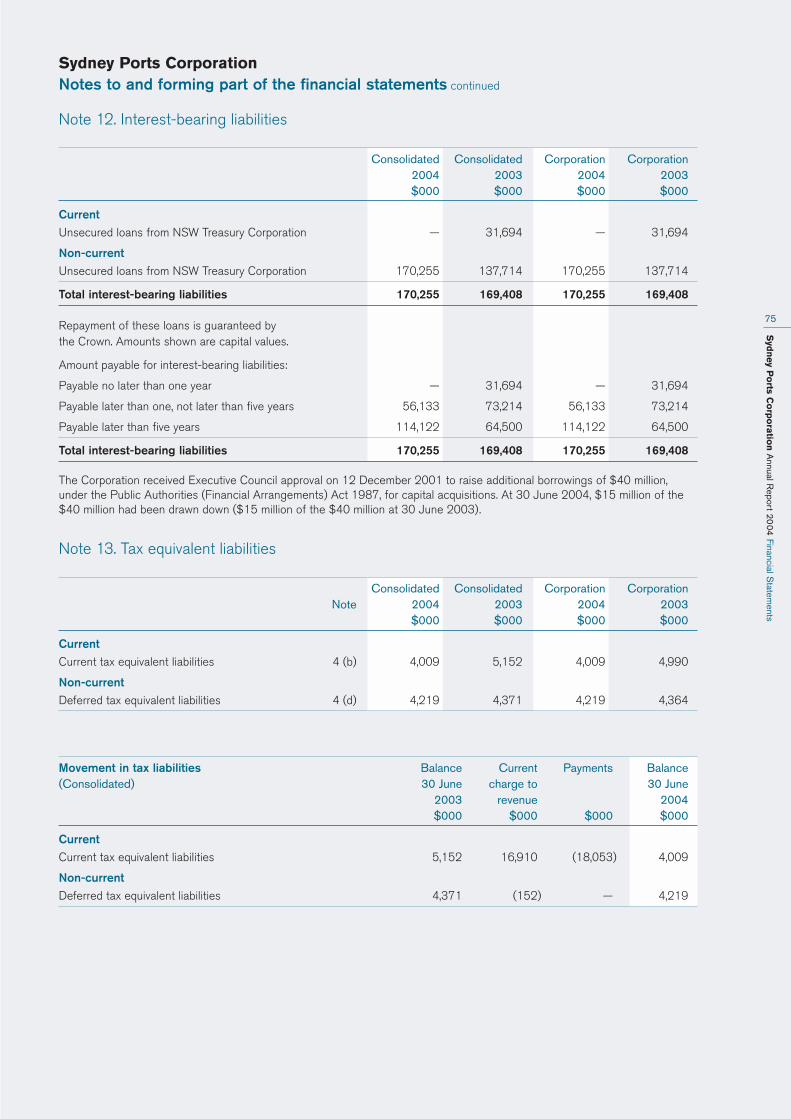
Syd
ney P
orts C
orp
ora
tion
Annual R
eport 2004
Financial Statem
ents
75
Note 12. Interest-bearing liabilities
Consolidated Consolidated Corporation Corporation2004 2003 2004 2003$000 $000 $000 $000
Current
Unsecured loans from NSW Treasury Corporation — 31,694 — 31,694
Non-current
Unsecured loans from NSW Treasury Corporation 170,255 137,714 170,255 137,714
Total interest-bearing liabilities 170,255 169,408 170,255 169,408
Repayment of these loans is guaranteed by the Crown. Amounts shown are capital values.
Amount payable for interest-bearing liabilities:
Payable no later than one year — 31,694 — 31,694
Payable later than one, not later than five years 56,133 73,214 56,133 73,214
Payable later than five years 114,122 64,500 114,122 64,500
Total interest-bearing liabilities 170,255 169,408 170,255 169,408
The Corporation received Executive Council approval on 12 December 2001 to raise additional borrowings of $40 million,under the Public Authorities (Financial Arrangements) Act 1987, for capital acquisitions. At 30 June 2004, $15 million of the$40 million had been drawn down ($15 million of the $40 million at 30 June 2003).
Note 13. Tax equivalent liabilities
Consolidated Consolidated Corporation CorporationNote 2004 2003 2004 2003
$000 $000 $000 $000
Current
Current tax equivalent liabilities 4 (b) 4,009 5,152 4,009 4,990
Non-current
Deferred tax equivalent liabilities 4 (d) 4,219 4,371 4,219 4,364
Movement in tax liabilities Balance Current Payments Balance(Consolidated) 30 June charge to 30 June
2003 revenue 2004$000 $000 $000 $000
Current
Current tax equivalent liabilities 5,152 16,910 (18,053) 4,009
Non-current
Deferred tax equivalent liabilities 4,371 (152) — 4,219
Sydney Ports CorporationNotes to and forming part of the financial statements continued

Syd
ney P
orts C
orp
ora
tion
Annual R
eport 2004
Financial Statem
ents
76
Note 14. Provisions
Consolidated Consolidated Corporation CorporationNote 2004 2003 2004 2003
$000 $000 $000 $000
Current
Dividend 15 17,625 13,157 17,625 13,157
Employee benefits, including on-costs 3,535 3,506 3,337 3,318
21,160 16,663 20,962 16,475
Non-current
Employee benefits, including on-costs 6,330 5,797 5,827 5,414
6,330 5,797 5,827 5,414
Movement in provisions Balance Current Payments Other Balance(Consolidated) 30 June charge to transfers 30 June
2003 revenue 2004$000 $000 $000 $000 $000
Current
Dividend 13,157 17,625 (13,157) — 17,625
Employee benefits, including on-costs:
Annual leave 2,594 2,044 (2,118) 114 2,634
Long-service leave 650 527 (474) — 703
Voluntary separations 261 10 (73) — 198
16,662 20,206 (15,822) 114 21,160
Non-current
Employee benefits, including on-costs:
Long-service leave 5,797 526 — 7 6,330
5,797 526 — 7 6,330
Sydney Ports CorporationNotes to and forming part of the financial statements continued
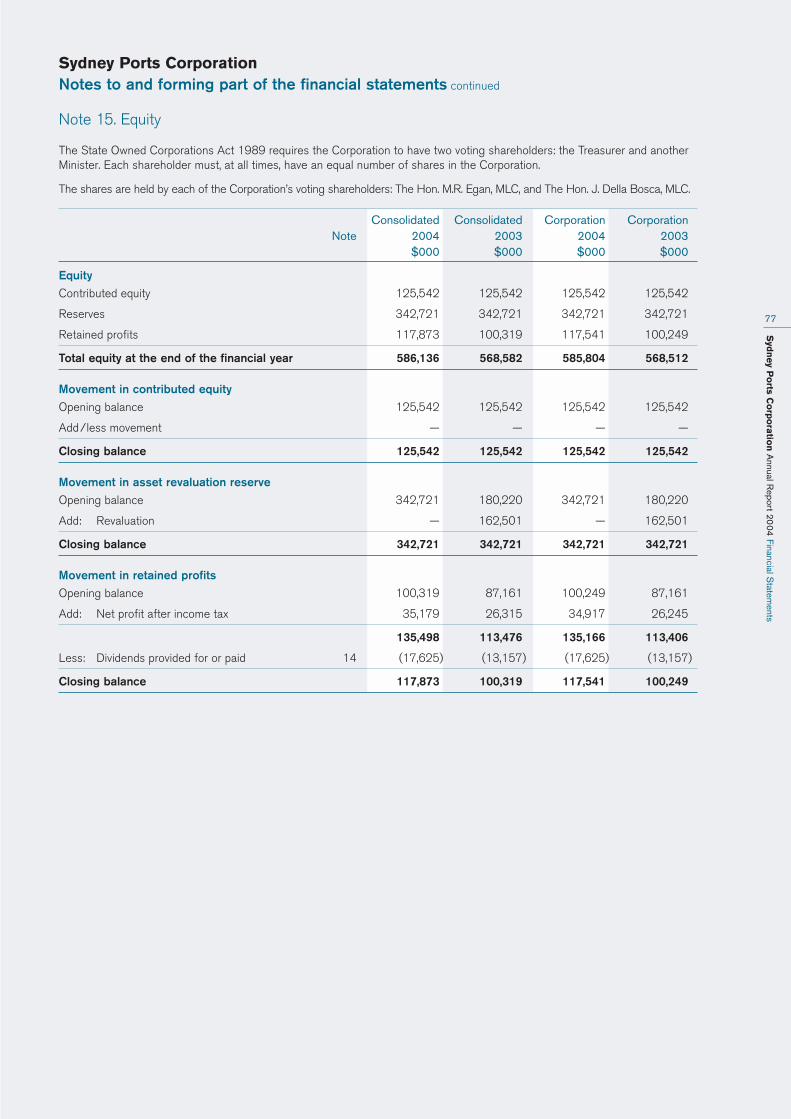
Syd
ney P
orts C
orp
ora
tion
Annual R
eport 2004
Financial Statem
ents
77
Note 15. Equity
The State Owned Corporations Act 1989 requires the Corporation to have two voting shareholders: the Treasurer and anotherMinister. Each shareholder must, at all times, have an equal number of shares in the Corporation.
The shares are held by each of the Corporation’s voting shareholders: The Hon. M.R. Egan, MLC, and The Hon. J. Della Bosca, MLC.
Consolidated Consolidated Corporation CorporationNote 2004 2003 2004 2003
$000 $000 $000 $000
Equity
Contributed equity 125,542 125,542 125,542 125,542
Reserves 342,721 342,721 342,721 342,721
Retained profits 117,873 100,319 117,541 100,249
Total equity at the end of the financial year 586,136 568,582 585,804 568,512
Movement in contributed equity
Opening balance 125,542 125,542 125,542 125,542
Add/less movement — — — —
Closing balance 125,542 125,542 125,542 125,542
Movement in asset revaluation reserve
Opening balance 342,721 180,220 342,721 180,220
Add: Revaluation — 162,501 — 162,501
Closing balance 342,721 342,721 342,721 342,721
Movement in retained profits
Opening balance 100,319 87,161 100,249 87,161
Add: Net profit after income tax 35,179 26,315 34,917 26,245
135,498 113,476 135,166 113,406
Less: Dividends provided for or paid 14 (17,625) (13,157) (17,625) (13,157)
Closing balance 117,873 100,319 117,541 100,249
Sydney Ports CorporationNotes to and forming part of the financial statements continued

Syd
ney P
orts C
orp
ora
tion
Annual R
eport 2004
Financial Statem
ents
78
Note 16. Financial instruments
a) Interest rate riskInterest rate risk is the risk that the value of the financial instrument will fluctuate due to changes in market interest rates. The consolidated entity’s exposure to interest rate risk and the effective interest rates of financial assets and liabilities, bothrecognised and unrecognised at the reporting date, are as follows:
2004 Fixed Interest rate maturing in:
Financial instruments Floating 1 year Over More Non- Total Weightedinterest or less 1 to than interest carrying average
rate 5 years 5 years bearing amount effectiveas per the intereststatement rate*
of financialposition
$000 $000 $000 $000 $000 $000 %
Financial assets
Cash 1,656 — — — 2 1,658 4.54%
Receivables 1,337 — — — 11,957 13,294 2.81%
Investments 56,434 — — — — 56,434 5.23%
Total financial assets 59,427 — — — 11,959 71,386
Financial liabilities
Payables — — — — 14,268 14,268 n/a
Interest-bearing liabilities — — 56,133 114,122 — 170,255 7.27%
Total financial liabilities — — 56,133 114,122 14,268 184,523
Off-balance-sheet financial instruments
Derivative financial instruments ** — — — — — —
Interest rate swaps nominal value — — 2,100 — — —
* Weighted average effective interest rate was computed on a monthly basis.** Notional principal amounts for futures contracts.
Sydney Ports CorporationNotes to and forming part of the financial statements continued

Syd
ney P
orts C
orp
ora
tion
Annual R
eport 2004
Financial Statem
ents
79
Note 16. Financial instruments continued
2003 Fixed Interest rate maturing in:
Financial instruments Floating 1 year Over More Non- Total Weightedinterest or less 1 to than interest carrying average
rate 5 years 5 years bearing amount effectiveas per the intereststatement rate*
of financialposition
$000 $000 $000 $000 $000 $000 %
Financial assets
Cash 2,243 — — — 2 2,245 4.20%
Receivables 1,312 — — — 12,994 14,306 3.51%
Investments 30,356 — — — — 30,356 4.85%
Total financial assets 33,911 — — — 12,996 46,907
Financial liabilities
Payables — — — — 14,622 14,622 n/a
Interest-bearing liabilities 2,744 28,950 73,214 64,500 — 169,408 7.48%
Total financial liabilities 2,744 28,950 73,214 64,500 14,622 184,030
Off-balance-sheet financial instruments
Derivative financial instruments – receivable ** — — (400) (1,200) — —
Interest rate swaps
nominal value — 2,100 — — — —
* Weighted average effective interest rate was computed on a monthly basis.** Notional principal amounts for futures contracts
Sydney Ports CorporationNotes to and forming part of the financial statements continued
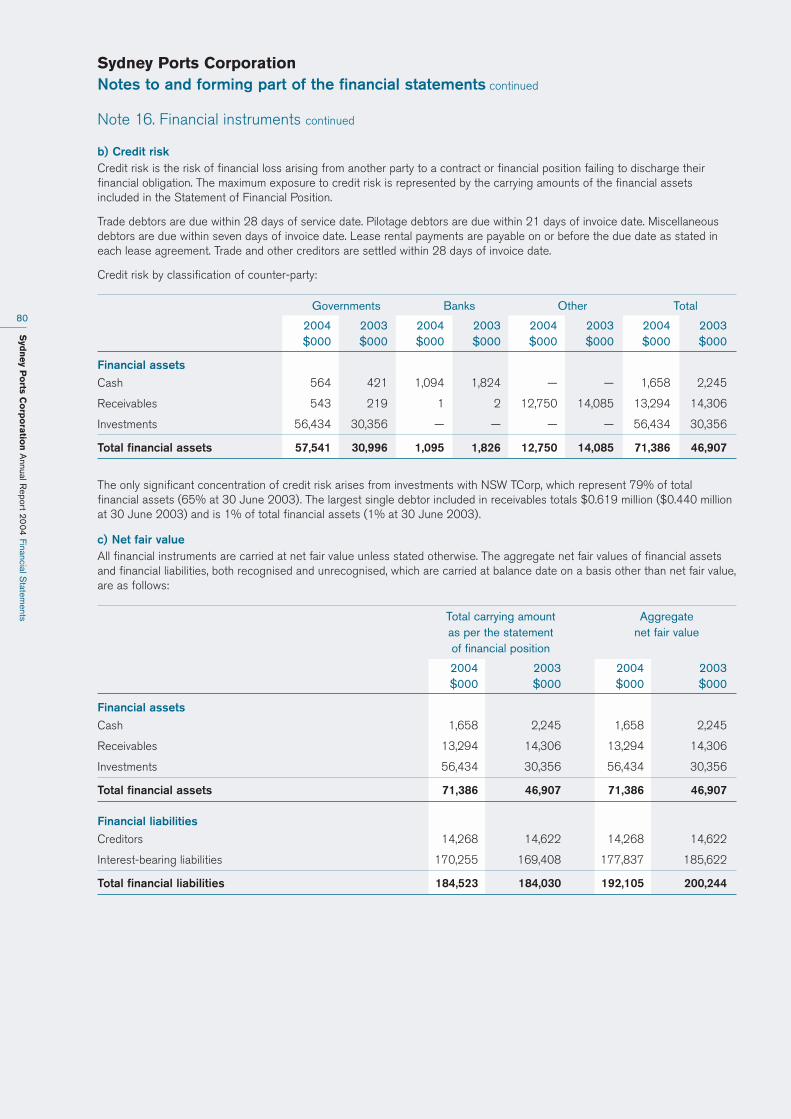
Syd
ney P
orts C
orp
ora
tion
Annual R
eport 2004
Financial Statem
ents
80
Note 16. Financial instruments continued
b) Credit riskCredit risk is the risk of financial loss arising from another party to a contract or financial position failing to discharge theirfinancial obligation. The maximum exposure to credit risk is represented by the carrying amounts of the financial assetsincluded in the Statement of Financial Position.
Trade debtors are due within 28 days of service date. Pilotage debtors are due within 21 days of invoice date. Miscellaneousdebtors are due within seven days of invoice date. Lease rental payments are payable on or before the due date as stated ineach lease agreement. Trade and other creditors are settled within 28 days of invoice date.
Credit risk by classification of counter-party:
Governments Banks Other Total
2004 2003 2004 2003 2004 2003 2004 2003$000 $000 $000 $000 $000 $000 $000 $000
Financial assets
Cash 564 421 1,094 1,824 — — 1,658 2,245
Receivables 543 219 1 2 12,750 14,085 13,294 14,306
Investments 56,434 30,356 — — — — 56,434 30,356
Total financial assets 57,541 30,996 1,095 1,826 12,750 14,085 71,386 46,907
The only significant concentration of credit risk arises from investments with NSW TCorp, which represent 79% of totalfinancial assets (65% at 30 June 2003). The largest single debtor included in receivables totals $0.619 million ($0.440 millionat 30 June 2003) and is 1% of total financial assets (1% at 30 June 2003).
c) Net fair valueAll financial instruments are carried at net fair value unless stated otherwise. The aggregate net fair values of financial assetsand financial liabilities, both recognised and unrecognised, which are carried at balance date on a basis other than net fair value,are as follows:
Total carrying amount Aggregateas per the statement net fair valueof financial position
2004 2003 2004 2003$000 $000 $000 $000
Financial assets
Cash 1,658 2,245 1,658 2,245
Receivables 13,294 14,306 13,294 14,306
Investments 56,434 30,356 56,434 30,356
Total financial assets 71,386 46,907 71,386 46,907
Financial liabilities
Creditors 14,268 14,622 14,268 14,622
Interest-bearing liabilities 170,255 169,408 177,837 185,622
Total financial liabilities 184,523 184,030 192,105 200,244
Sydney Ports CorporationNotes to and forming part of the financial statements continued

Syd
ney P
orts C
orp
ora
tion
Annual R
eport 2004
Financial Statem
ents
81
Note 16. Financial instruments continued
d) Derivative financial instrumentsThe nature of the consolidated entity’s business gives rise to gaps in maturity of its cash flows and to exposures arising frompossible changes in the re-pricing of financial positions on their maturity.
The identifiable risks that arise from such gaps, exposures and policies have been established to prudentially monitor and limitthose risks. In managing such risks, derivative financial instruments have been used. These instruments are managed by NSWTreasury Corporation.
A derivative financial instrument is a contract or agreement whose value is derived from the value of the underlying instrument,reference rate or index. Derivative financial instruments (futures contracts) are used to alter and modify the natural risksinherent in the statement of financial position.
Futures contracts are used to hedge financial exposures arising from interest-bearing liabilities, thereby limiting the risk thatchanges in interest rates will adversely affect profit. These are managed and executed by NSW Treasury Corporation.
Net exposureThe market values of transactions in derivative financial instruments outstanding at year-end are as follows:
Consolidated Consolidated Corporation Corporation2004 2003 2004 2003$000 $000 $000 $000
Derivative financial instruments(payable)/receivable
Exchange traded futures (mark to market) — 59 — 59
Note 17. Capital expenditure commitments
Forward obligations under major contracts committed at 30 June 2004 but not otherwise brought to account have beenassessed at $0.049 million including GST ($0.781 million including GST at 30 June 2003). The $0.049 million includes inputtax credits of $0.004 million ($0.071 million at 30 June 2003) that are expected to be recoverable from the AustralianTaxation Office. They are payable as follows:
Not later than Later than Later thanone year one and not five years
later than five years
$000 $000 $000
Land and buildings 49 — —
Roadways — — —
Wharves, jetties and breakwaters — — —
Plant — — —
Total including GST 49 — —
Sydney Ports CorporationNotes to and forming part of the financial statements continued

Syd
ney P
orts C
orp
ora
tion
Annual R
eport 2004
Financial Statem
ents
82
Note 18. Operating lease commitments
Consolidated Consolidated Corporation Corporation2004 2003 2004 2003$000 $000 $000 $000
Payable
Operating lease expenditure commitments contracted for at balance date, but not recognised in the financial statements,are payable as follows:
Not later than one year 1,594 1,473 1,591 1,470
Later than one and not later than five years 4,599 5,288 4,594 5,281
Later than five years — 407 — 407
Total including GST 6,193 7,168 6,185 7,158
The above total includes input tax credits of $0.563 million ($0.632 million at 30 June 2003) that are expected to berecoverable from the Australian Taxation Office. The expenditure commitments relate to rent, computers and office equipment.
Consolidated Consolidated Corporation Corporation2004 2003 2004 2003$000 $000 $000 $000
Receivable
Operating lease minimum income commitments for non-cancellable leases not recognised in the financial statements are receivable as follows:
Not later than one year 24,363 25,219 24,363 25,219
Later than one and not later than five years 78,054 74,025 78,054 74,025
Later than five years 161,882 155,598 161,882 155,598
Total including GST 264,299 254,842 264,299 254,842
The above includes GST output tax of $24.027 million ($23.167 million at 30 June 2003) that is expected to be paid to theAustralian Taxation Office. The income commitments relate to rent leases.
Leasing arrangementsAll receivable leases are entered into at commercial rates and terms. Regular market valuations and tendering processes arecarried out to ensure commercial arrangements are maintained.
Note 19. Contingent liabilities and contingent assets
The estimated value of liability claims against the consolidated entity at 30 June 2004 is $0.310 million ($0.430 million at 30 June 2003). The estimated recovery of these claims (contingent assets) is $0.060 million ($0.430 million as at 30 June 2003).It is anticipated that negotiated solutions will be possible for these claims.
Note 20. Consultancy fees
Total fees paid and payable to consultants engaged in capital and operating projects during the year was nil ($0.093 million in 2002–03).
Sydney Ports CorporationNotes to and forming part of the financial statements continued

Syd
ney P
orts C
orp
ora
tion
Annual R
eport 2004
Financial Statem
ents
83
Note 21. Notes to the statement of cash flows
(a) Reconciliation of cashFor the purpose of the Statement of Cash Flows, cash includes cash on hand and in banks (net of any outstanding bank overdraft)and short-term investments in money market instruments which are classified as current assets. Cash at 30 June 2004, asshown in the Statement of Cash Flows, is reconciled to the related items in the Statement of Financial Position as follows:
Consolidated Consolidated Corporation Corporation2004 2003 2004 2003$000 $000 $000 $000
Cash assets 1,658 2,245 1,554 1,677
Other financial assets (current investments) 56,434 30,356 56,236 30,168
Cash at the end of the financial year 58,092 32,601 57,790 31,845
(b) Reconciliation of profit on ordinary activities after income tax equivalent to net cash provided by operating activities
Profit on ordinary activities after income tax equivalent 35,179 26,315 34,917 26,245
Depreciation 13,270 12,326 13,157 12,286
Amortisation of discount on interest-bearing liabilities 505 874 505 874
Net loss/(profit) on sale of interest-bearing liabilities 342 25 342 25
Net loss/(profit) on sale of non-current assets 29 (3) 29 (3)
Assets written off 10 1,372 7 1,372
49,335 40,909 48,957 40,799
Net movement in assets and liabilities applicable to operating activities
(Increase)/decrease in receivables 1,012 (497) 1,000 41
(Increase)/decrease in inventories 33 (62) — —
(Increase)/decrease in other assets (2,071) 1,612 (2,036) 1,913
(Decrease)/increase in payables 5,314 (1,109) 5,256 (1,737)
(Decrease)/increase in provisions (725) 2,707 (694) 1,967
Net cash provided by operating activities 52,898 43,560 52,483 42,983
The Corporation had the following credit facilities in place at 30 June 2004:
– A guarantee facility for $100,000 with the Commonwealth Bank of Australia.
– A credit card facility for $60,000 with the Commonwealth Bank of Australia.
Sydney Ports CorporationNotes to and forming part of the financial statements continued
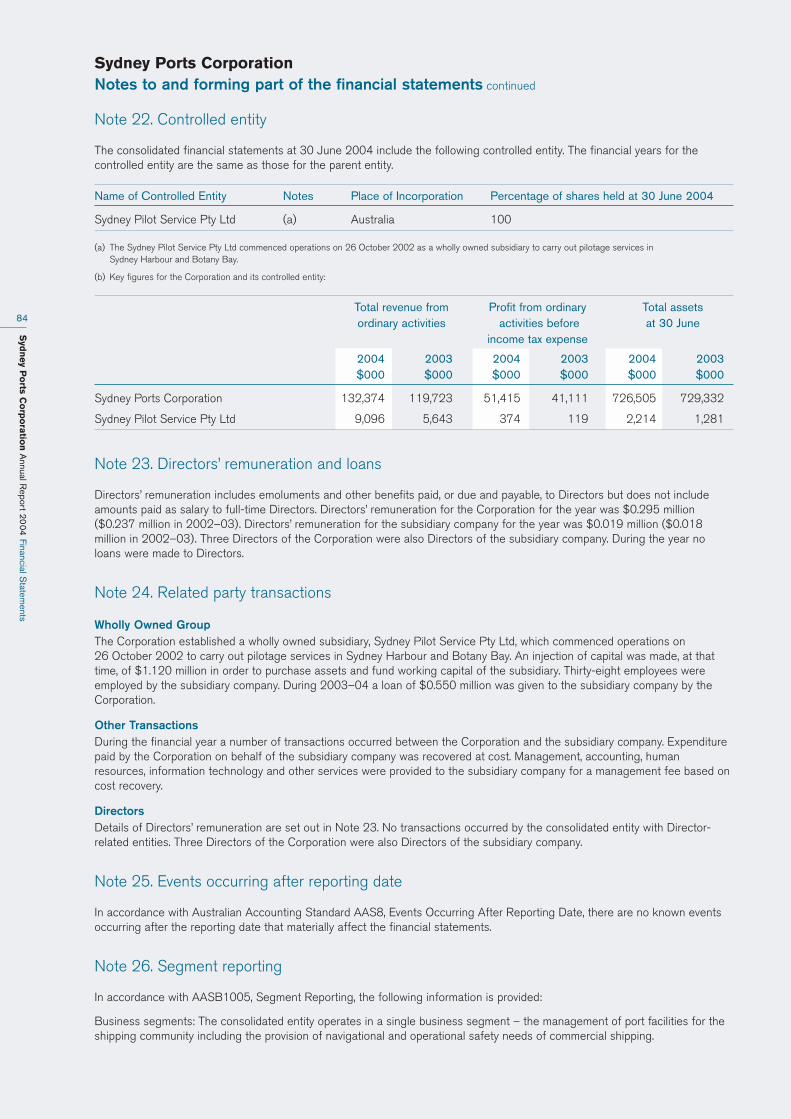
Syd
ney P
orts C
orp
ora
tion
Annual R
eport 2004
Financial Statem
ents
84
Note 22. Controlled entity
The consolidated financial statements at 30 June 2004 include the following controlled entity. The financial years for thecontrolled entity are the same as those for the parent entity.
Name of Controlled Entity Notes Place of Incorporation Percentage of shares held at 30 June 2004
Sydney Pilot Service Pty Ltd (a) Australia 100
(a) The Sydney Pilot Service Pty Ltd commenced operations on 26 October 2002 as a wholly owned subsidiary to carry out pilotage services in Sydney Harbour and Botany Bay.
(b) Key figures for the Corporation and its controlled entity:
Total revenue from Profit from ordinary Total assetsordinary activities activities before at 30 June
income tax expense
2004 2003 2004 2003 2004 2003$000 $000 $000 $000 $000 $000
Sydney Ports Corporation 132,374 119,723 51,415 41,111 726,505 729,332
Sydney Pilot Service Pty Ltd 9,096 5,643 374 119 2,214 1,281
Note 23. Directors’ remuneration and loans
Directors’ remuneration includes emoluments and other benefits paid, or due and payable, to Directors but does not includeamounts paid as salary to full-time Directors. Directors’ remuneration for the Corporation for the year was $0.295 million($0.237 million in 2002–03). Directors’ remuneration for the subsidiary company for the year was $0.019 million ($0.018million in 2002–03). Three Directors of the Corporation were also Directors of the subsidiary company. During the year noloans were made to Directors.
Note 24. Related party transactions
Wholly Owned GroupThe Corporation established a wholly owned subsidiary, Sydney Pilot Service Pty Ltd, which commenced operations on 26 October 2002 to carry out pilotage services in Sydney Harbour and Botany Bay. An injection of capital was made, at thattime, of $1.120 million in order to purchase assets and fund working capital of the subsidiary. Thirty-eight employees wereemployed by the subsidiary company. During 2003–04 a loan of $0.550 million was given to the subsidiary company by theCorporation.
Other TransactionsDuring the financial year a number of transactions occurred between the Corporation and the subsidiary company. Expenditurepaid by the Corporation on behalf of the subsidiary company was recovered at cost. Management, accounting, humanresources, information technology and other services were provided to the subsidiary company for a management fee based oncost recovery.
DirectorsDetails of Directors’ remuneration are set out in Note 23. No transactions occurred by the consolidated entity with Director-related entities. Three Directors of the Corporation were also Directors of the subsidiary company.
Note 25. Events occurring after reporting date
In accordance with Australian Accounting Standard AAS8, Events Occurring After Reporting Date, there are no known eventsoccurring after the reporting date that materially affect the financial statements.
Note 26. Segment reporting
In accordance with AASB1005, Segment Reporting, the following information is provided:
Business segments: The consolidated entity operates in a single business segment – the management of port facilities for theshipping community including the provision of navigational and operational safety needs of commercial shipping.
Sydney Ports CorporationNotes to and forming part of the financial statements continued
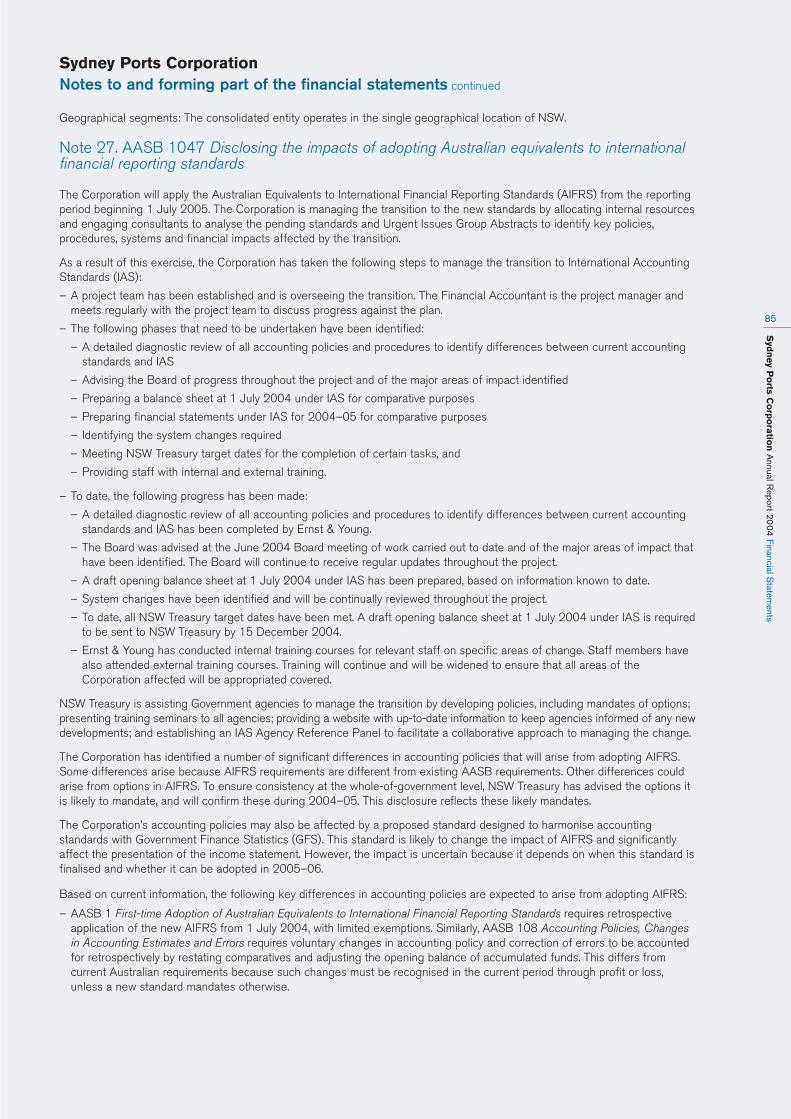
Syd
ney P
orts C
orp
ora
tion
Annual R
eport 2004
Financial Statem
ents
85
Geographical segments: The consolidated entity operates in the single geographical location of NSW.
Note 27. AASB 1047 Disclosing the impacts of adopting Australian equivalents to internationalfinancial reporting standards
The Corporation will apply the Australian Equivalents to International Financial Reporting Standards (AIFRS) from the reportingperiod beginning 1 July 2005. The Corporation is managing the transition to the new standards by allocating internal resourcesand engaging consultants to analyse the pending standards and Urgent Issues Group Abstracts to identify key policies,procedures, systems and financial impacts affected by the transition.
As a result of this exercise, the Corporation has taken the following steps to manage the transition to International AccountingStandards (IAS):
– A project team has been established and is overseeing the transition. The Financial Accountant is the project manager andmeets regularly with the project team to discuss progress against the plan.
– The following phases that need to be undertaken have been identified:
– A detailed diagnostic review of all accounting policies and procedures to identify differences between current accountingstandards and IAS
– Advising the Board of progress throughout the project and of the major areas of impact identified
– Preparing a balance sheet at 1 July 2004 under IAS for comparative purposes
– Preparing financial statements under IAS for 2004–05 for comparative purposes
– Identifying the system changes required
– Meeting NSW Treasury target dates for the completion of certain tasks, and
– Providing staff with internal and external training.
– To date, the following progress has been made:
– A detailed diagnostic review of all accounting policies and procedures to identify differences between current accountingstandards and IAS has been completed by Ernst & Young.
– The Board was advised at the June 2004 Board meeting of work carried out to date and of the major areas of impact thathave been identified. The Board will continue to receive regular updates throughout the project.
– A draft opening balance sheet at 1 July 2004 under IAS has been prepared, based on information known to date.
– System changes have been identified and will be continually reviewed throughout the project.
– To date, all NSW Treasury target dates have been met. A draft opening balance sheet at 1 July 2004 under IAS is requiredto be sent to NSW Treasury by 15 December 2004.
– Ernst & Young has conducted internal training courses for relevant staff on specific areas of change. Staff members havealso attended external training courses. Training will continue and will be widened to ensure that all areas of theCorporation affected will be appropriated covered.
NSW Treasury is assisting Government agencies to manage the transition by developing policies, including mandates of options;presenting training seminars to all agencies; providing a website with up-to-date information to keep agencies informed of any newdevelopments; and establishing an IAS Agency Reference Panel to facilitate a collaborative approach to managing the change.
The Corporation has identified a number of significant differences in accounting policies that will arise from adopting AIFRS.Some differences arise because AIFRS requirements are different from existing AASB requirements. Other differences couldarise from options in AIFRS. To ensure consistency at the whole-of-government level, NSW Treasury has advised the options itis likely to mandate, and will confirm these during 2004–05. This disclosure reflects these likely mandates.
The Corporation’s accounting policies may also be affected by a proposed standard designed to harmonise accountingstandards with Government Finance Statistics (GFS). This standard is likely to change the impact of AIFRS and significantlyaffect the presentation of the income statement. However, the impact is uncertain because it depends on when this standard isfinalised and whether it can be adopted in 2005–06.
Based on current information, the following key differences in accounting policies are expected to arise from adopting AIFRS:
– AASB 1 First-time Adoption of Australian Equivalents to International Financial Reporting Standards requires retrospectiveapplication of the new AIFRS from 1 July 2004, with limited exemptions. Similarly, AASB 108 Accounting Policies, Changesin Accounting Estimates and Errors requires voluntary changes in accounting policy and correction of errors to be accountedfor retrospectively by restating comparatives and adjusting the opening balance of accumulated funds. This differs fromcurrent Australian requirements because such changes must be recognised in the current period through profit or loss,unless a new standard mandates otherwise.
Sydney Ports CorporationNotes to and forming part of the financial statements continued

Syd
ney P
orts C
orp
ora
tion
Annual R
eport 2004
Financial Statem
ents
86
Note 27. AASB 1047 Disclosing the impacts of adopting Australian equivalents to internationalfinancial reporting standards continued
– AASB 110 Events after the balance sheet date states that only dividends ‘declared’ or appropriately ‘authorised’ before thereporting date can be recognised. This is more restrictive than the current approach which is based on ‘valid expectations’.However, this change is not expected to impact on dividend recognition as the signing of the Statement of Corporate Intentbefore the reporting date to which it relates ‘authorises’ the dividend, and any change in the amount of the dividend after thereporting date constitutes an ‘adjusting event after the reporting date’.
However, the amount of the dividend may be affected by other AIFRS, such as AASB 139 Financial Instrument Recognitionand Measurement and AASB 119 Employee Benefits (refer below) as these standards may impact on retained earnings (onfirst adoption) and the amount and volatility of profit/loss.
– AASB 112 Income Taxes requires a balance sheet approach where the entity must identify differences between theaccounting and tax value of assets and liabilities. The previous approach was to account for tax by adjusting accounting profit for temporary and permanent differences to derive taxable income. The AASB 112 approach might alter the quantumof tax assets and liabilities recognised.
In addition, the income tax expense and deferred tax assets and liabilities might be affected by other AIFRS to the extent that they impact on the balance sheet and profit or loss.
– AASB 116 Property, Plant and Equipment requires the cost and fair value of property, plant and equipment to be increased toinclude restoration costs, where restoration provisions are recognised under AASB 137 Provisions, Contingent Liabilities andContingent Assets.
The Corporation must account for asset revaluation increments and decrements on an individual asset basis, rather than on a class basis. This change may decrease accumulated funds.
– AASB 119 Employee Benefits requires the defined benefit obligation to be discounted using the government bond rate ateach reporting date, rather than the long-term expected rate of return on plan assets. This will increase the amount and thefuture volatility of the unfunded superannuation liability and the volatility of the employee benefit expense.
– AASB 132 Financial Instrument Disclosure and Presentation prohibits in-substance defeasance. The Corporation can nolonger offset financial assets and financial liabilities when financial assets are set aside in trust by a debtor for the purposesof discharging an obligation, without assets having been accepted by the creditor in settlement of the obligation. This willhave the effect of increasing assets and liabilities but will have no net impact on equity.
– AASB 136 Impairment of Assets requires an entity to assess at each reporting date whether there is any indication that an asset (or cash-generating unit) is impaired and if such indication exists, requires the entity to estimate the recoverableamount. However, the effect of this Standard should be minimal because all of the substantive principles in AASB 136 arealready incorporated in Treasury’s policy Valuation of Physical Non-Current Assets at Fair Value.
– AASB 139 Financial Instrument Recognition and Measurement results in the recognition of financial instruments that werepreviously off balance sheet, including derivatives. The standard adopts a mixed measurement model and requires financialinstruments held for trading and available for sale to be measured at fair value, and requires valuation changes to berecognised in profit or loss or equity, respectively. Previously they were recognised at cost. This may increase the volatility ofthe operating result and balance sheet. The standard also includes stricter rules for the adoption of hedge accounting, andwhere these are not satisfied, movements in fair value will impact the income statement.
To achieve full harmonisation with GFS, entities would need to designate all financial instruments at fair value through profitor loss. However, at this stage it is unclear whether this option will be available under the standard and, if available, whetherTreasury will mandate this option for all agencies.
– AASB 140 Investment Property requires investment property to be measured at cost or fair value. NSW Treasury is likely to mandate the adoption of fair value. In contrast to the current treatment as an asset classified within property, plant andequipment, investment property recognised at fair value is not depreciated and changes in fair value are recognised in theincome statement.
End of audited financial statements
Sydney Ports CorporationNotes to and forming part of the financial statements continued

Syd
ney P
orts C
orp
ora
tion
Annual R
eport 2004
Financial Statem
ents
87
In the opinion of the Directors of Sydney Ports Corporation:
1 The Financial Statements and Notes:
a Exhibit a true and fair view of the financial position of the Corporation and the consolidated entity at 30 June 2004 and of their performance, as represented by the results of their operations and their cash flows for the year ended on that date
b Comply with applicable Accounting Standards, Urgent Issues Group Consensus Views and other mandatory andstatutory reporting requirements including Part 3 of the Public Finance and Audit Act 1983 and the associatedrequirements of the Public Finance and Audit Regulation 2000
2 There are reasonable grounds to believe that the Corporation will be able to pay its debts as and when they become due and payable, and
3 We are not aware of any circumstances at the date of this declaration that would render any particulars included in theFinancial Statements to be misleading or inaccurate.
Signed in accordance with a resolution of the Directors.
D.L.P. Field G.J. MartinChairman Chief Executive Officer
Date: 14 October 2004 Date: 14 October 2004
Sydney Ports CorporationDirectors’ Statement

Syd
ney P
orts C
orp
ora
tion
Annual R
eport 2004
Financial Statem
ents
88

Syd
ney P
orts C
orp
ora
tion
Annual R
eport 2004
Financial Statem
ents
89
Land is disclosed in the financial statements under the asset grouping ‘Land and buildings’ within property, plant andequipment. In the following summary, land has been separated from buildings and other non-current assets to show land value and usage in terms of the statement of financial position valuations.
Consolidated Corporation2004 2004$000 $000
Land and buildings
Land 447,730 447,730
Buildings 70,208 70,208
Total 517,938 517,938
Other property, plant and equipment
Roadways 9,041 9,041
Wharves, jetties and breakwaters 178,019 178,019
Plant 23,721 21,507
Total property, plant and equipment (as per statement of financial position) 728,719 726,505
Sydney Ports CorporationStatement of land holdings at 30 June 2004

Sydney Pilot Service Pty LtdFinancial Statementsfor the year ended 30 June 2004
Syd
ney P
ilot S
ervice
Pty Ltd
Financial Statem
ents
90
Contents
Statement of Financial Performance 91
Statement of Financial Position 92
Statement of Cash Flows 93
Notes to and forming part of the financial statements 94
1 Summary of significant accounting policies 94
2 Revenue from ordinary activities 96
3 Expenditure from ordinary activities 96
4 Taxation 97
5 Receivables 98
6 Inventories 99
7 Other financial assets 99
8 Other current assets 99
9 Property, plant and equipment 100
10 Payables 100
11 Interest-bearing liabilities 101
12 Tax equivalent liabilities 101
13 Provisions 102
14 Equity 102
15 Financial instruments 103
16 Capital expenditure commitments 105
17 Operating lease commitments 105
18 Contingent liabilities and contingent assets 105
19 Consultancy fees 106
20 Notes to the statement of cash flows 106
21 Directors’ remuneration and loans 106
22 Related party transactions 107
23 Events occurring after reporting date 107
24 Segment reporting 107
25 International financial reporting standards 107
Directors’ Statement 109
Independent audit report 110
Beginning of audited financial statements

Syd
ney P
ilot S
ervice
Pty Ltd
Financial Statem
ents
91
Note 2004 2003$000 $000
Revenue from ordinary activities 2 9,096 5,643
Borrowing costs expense 3 20 0
Other expenses from ordinary activities 3 8,702 5,524
Total expenditure from ordinary activities 8,722 5,524
Profit from ordinary activities before income tax equivalent expense 374 119
Income tax equivalent expense relating to ordinary activities 4 (a) 112 49
Net profit attributable to members of Sydney Pilot Service Pty Ltd 262 70
Total changes in equity other than those resulting from transactions with owners as owners 14 262 70
Note: Sydney Pilot Service Pty Ltd commenced operations on 26 October 2002.
Sydney Pilot Service Pty LtdStatement of Financial Performance for the year ended 30 June 2004
The accompanying notes form an integral part of these financial statements
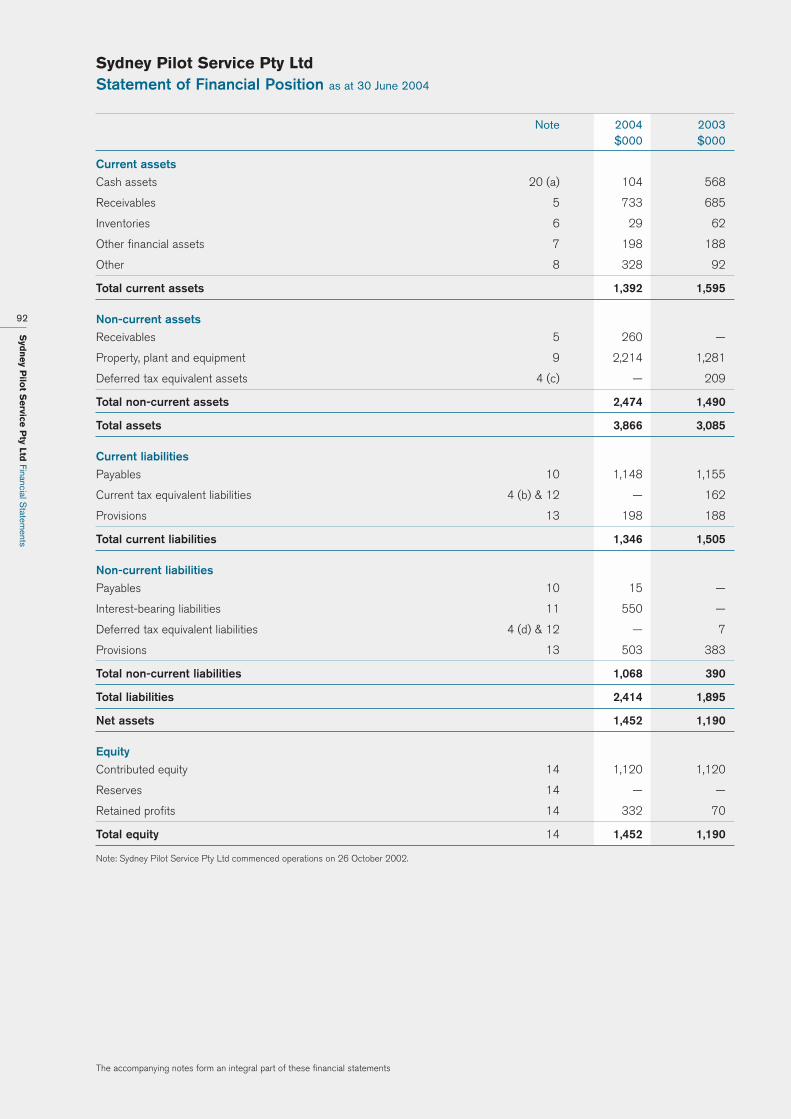
Syd
ney P
ilot S
ervice
Pty Ltd
Financial Statem
ents
92
Note 2004 2003$000 $000
Current assets
Cash assets 20 (a) 104 568
Receivables 5 733 685
Inventories 6 29 62
Other financial assets 7 198 188
Other 8 328 92
Total current assets 1,392 1,595
Non-current assets
Receivables 5 260 —
Property, plant and equipment 9 2,214 1,281
Deferred tax equivalent assets 4 (c) — 209
Total non-current assets 2,474 1,490
Total assets 3,866 3,085
Current liabilities
Payables 10 1,148 1,155
Current tax equivalent liabilities 4 (b) & 12 — 162
Provisions 13 198 188
Total current liabilities 1,346 1,505
Non-current liabilities
Payables 10 15 —
Interest-bearing liabilities 11 550 —
Deferred tax equivalent liabilities 4 (d) & 12 — 7
Provisions 13 503 383
Total non-current liabilities 1,068 390
Total liabilities 2,414 1,895
Net assets 1,452 1,190
Equity
Contributed equity 14 1,120 1,120
Reserves 14 — —
Retained profits 14 332 70
Total equity 14 1,452 1,190
Note: Sydney Pilot Service Pty Ltd commenced operations on 26 October 2002.
Sydney Pilot Service Pty LtdStatement of Financial Position as at 30 June 2004
The accompanying notes form an integral part of these financial statements

Syd
ney P
ilot S
ervice
Pty Ltd
Financial Statem
ents
93
Note 2004 2003$000 $000
Inflow/ Inflow/(Outflow) (Outflow)
Cash flows from operating activities
Cash receipts in the course of operations 9,864 5,987
Cash payments in the course of operations (9,225) (5,430)
Interest received 28 20
Borrowing costs (20) —
Income tax equivalent paid 12 (232) —
Net cash provided by operating activities 20 (b) 415 577
Cash flows from investing activities
Payments for property, plant and equipment (1,419) (941)
Proceeds from sale of property, plant and equipment — —
Proceeds from parent entity — 1,120
Net cash used in investing activities (1,419) 179
Cash flows from financing activities
Loan from parent entity 550 —
Repayment of borrowings — —
Dividends paid — —
Net cash used in financing activities 550 —
Net increase /(decrease) in cash held (454) 756
Cash at the beginning of the financial year 756 —
Cash at the end of the financial year 20 (a) 302 756
Note: Sydney Pilot Service Pty Ltd commenced operations on 26 October 2002.
Sydney Pilot Service Pty LtdStatement of Cash Flows for the year ended 30 June 2004
The accompanying notes form an integral part of these financial statements

Syd
ney P
ilot S
ervice
Pty Ltd
Financial Statem
ents
94
The following summary explains the significant accountingpolicies that have been adopted in the preparation of thefinancial statements.
(a) Basis of accountingThe financial statements are a general-purpose financial reportwhich has been prepared in accordance with AustralianAccounting Standards, other authoritative pronouncements of the Australian Accounting Standards Board, Urgent IssuesGroup Consensus views and the Public Finance and Audit Actand Regulation 2000.
Sydney Pilot Service Pty Ltd commenced operations on 26 October 2002 as a wholly owned subsidiary of SydneyPorts Corporation. In this financial report, Sydney Pilot ServicePty Ltd will be referred to as ‘SPS’; Sydney Ports Corporationas ‘the Corporation’. The economic entity comprising SPS andthe Corporation will be collectively referred to as ‘theconsolidated entity’.
The financial report has been prepared on the basis of full accrual accounting using historical cost accountingconventions. The accounting policies adopted are consistentwith those of the previous period. Because SPS onlycommenced operations on 26 October 2002, comparativeinformation does not cover a whole financial year.
SPS, because of the scale of its operations, is a smallproprietary company under the Corporations Act 2001 and is not required under this Act to prepare a general-purposefinancial report. SPS is controlled by a State OwnedCorporation (SOC), so the company must comply with SOC Acts and the Public Finance and Audit Act 1983.Accordingly, the Public Finance and Audit Act 1983 requiresSPS to prepare a general-purpose financial report.
(b) Cash in the Statement of Cash FlowsFor the purposes of the Statement of Cash Flows, cashincludes cash on hand and in banks (net of any outstandingbank overdraft) and short-term investments in securities withthe NSW Treasury Corporation, which are classified undercurrent assets. Cash at the end of the period, as shown in theStatement of Cash Flows, is reconciled to the relevant itemsin the Statement of Financial Position (refer to note 20a).
(c) Bad and doubtful debtsBad debts are written off against the provision for doubtfuldebts after thorough investigation and exhaustion of recoveryprocesses. Regular reviews were conducted during the yearto determine the adequacy of the level of the provision fordoubtful debts.
(d) InventoriesInventories have been valued at the lower of cost and netrealisable value on an item-by-item basis.
(e) Other financial assets (investments)Investments are carried at net fair value. Interest revenue isrecognised when receivable.
(f) Operating leasesOperating lease assets are not capitalised and rentalpayments are recognised as an expense in the period inwhich they are consumed.
(g) Valuation of property, plant and equipmentAll property, plant and equipment have been acquired atmarket value since the commencement of operations (26October 2002). All property assets and items of plant andequipment are recorded at fair value because the written-down value approximates fair value.
(h) Capitalisation of property, plant and equipmentProperty, plant and equipment in excess of $1000 arecapitalised where they are expected to provide futureeconomic benefits for more than one reporting period. Onlythose assets completed and ready for service are taken intothe property, plant and equipment accounts. The remainingcapital expenditures are carried forward as construction-in-progress and are included in property, plant and equipment inthe Statement of Financial Position.
(i) Depreciation of property, plant and equipmentDepreciation has been calculated on depreciable assets,using rates estimated to write off the assets over theirremaining useful lives on a straight-line basis in accordancewith Australian Accounting Standard AAS4, Depreciation of Non-Current Assets. The remaining useful lives of assetswere reassessed during the year with no changes required.The expected design life of new depreciable assets as at 30 June 2004 is:
– Plant 2 to 40 years
(j) Retirement benefits (superannuation)SPS contributes to employee superannuation funds inaddition to contributions made by employees. Allsuperannuation funds are accumulation schemes. Paymentsare applied towards the accruing liability for employeesuperannuation and are charged against revenue.
(k) Interest-bearing liabilitiesInterest-bearing liabilities consist of a loan from the parententity. The loan has no maturity date and interest is chargedat the official cash rate.
(l) Employee benefitsBenefits for annual leave have been provided at the amountexpected to be paid when the liabilities are settled.Appropriate on-costs are included. Benefits for long-serviceleave have been measured using the present value ofexpected future payments to be made for services providedby employees up to the reporting date. Consideration is givento expected future wage and salary levels, experience ofemployee departures and periods of service. Expected futurepayments are discounted using market yields at the reportingdate on national government bonds and terms to maturity thatmatch, as closely as possible, the estimated future cashoutflows. Appropriate on-costs are included. The portionexpected to be settled within 12 months of the reporting dateis recognised as the current provision; the portion expected tobe settled more than 12 months from the reporting date isrecognised as the non-current provision. The average sickleave taken by employees based on past experience is lessthan the entitlement accruing each period. It is consideredimprobable that existing accumulated sick leave entitlementswill be used and therefore no liability has been recognised.
Sydney Pilot Service Pty LtdNotes to and forming part of the financial statements
Note 1. Summary of significant accounting policies

Syd
ney P
ilot S
ervice
Pty Ltd
Financial Statem
ents
95
(m) Revenue recognitionRevenue is recognised to the extent that it is probable thatthe economic benefits will flow to the entity and the revenuecan be reliably measured. The following specific recognitioncriteria must also be met before revenue is recognised:
– Revenue from the rendering of a service is recognised uponthe delivery of the service to the customer.
– Interest revenue is recognised when receivable.
– Proceeds from the sale of assets are recognised upon thedelivery of the assets to the purchaser.
– Assets received at no cost are recorded at their fair valuewhen received, and this amount is included in revenue.
– Goods or services exchanged that are of a different natureand value, are recognised at fair value when the followingcriteria have been met:
– the entity has passed control of the goods or otherassets to SPS
– it is probable that the economic benefits comprising theconsideration will flow to SPS, and
– the amount of revenue can be measured reliably.
(n) Income Tax EquivalentSPS and its Australian parent, the Corporation, have decidedto implement the tax consolidation legislation from 1 July2003. The Australian Taxation Office has not been notified ofthis decision but will be advised when the consolidated taxreturn is lodged in December 2004. As a consequence, theCorporation, as the head entity in the consolidated group,recognises current and deferred tax amounts relating totransactions, events and balances of SPS as if thosetransactions, events and balances were its own, in addition tothe current and deferred tax amounts arising in relation to itsown transactions, events and balances. Amounts receivable orpayable, under an accounting sharing agreement between thetax consolidated entities, are recognised separately as tax-related amounts receivable or payable. Expenses andrevenues arising under the tax-sharing agreement arerecognised as a component of income tax expense.
(o) DividendSPS reviews its financial performance for the accountingperiod and recommends to its shareholder, if applicable, anappropriate dividend payment in light of the current financialposition and longer-term financial commitments.
(p) Financial instrumentsFinancial instruments give rise to positions that are financialassets of either SPS or its counterparty and financial liabilities(or equity instruments) of the other party. These include cash,receivables, investments, creditors, interest-bearing liabilitiesand derivative financial instruments (futures contracts). Inaccordance with AAS33, Presentation and Disclosure ofFinancial Instruments, information is disclosed in note 15about credit risk and interest rate risk of financial instruments.All such amounts are carried in the accounts at net fair valueunless otherwise stated. The specific accounting policy foreach class of such financial instruments is stated as follows:
Classes of instruments recorded at cost comprise:
– cash
– receivables, and
– payables.
Classes of instruments recorded at market or net fair value comprise:
– investments, and
– derivative financial instruments.
All financial instruments, including revenue, expenses or othercash flows arising from instruments, are recognised on anaccrual basis.
(q) Goods and Services TaxRevenues, expenses and assets are recognised net of theamount of Goods and Services Tax (GST), except where theamount of GST incurred is not recoverable from the AustralianTaxation Office (ATO). In these circumstances the GST isrecognised as part of the cost of acquisition of the asset or aspart of an expense item. Receivables and payables are statedwith the amount of GST included. Accrual items are alsoshown in the Statement of Financial Position inclusive of GST where applicable.
The net amount of GST owing to the ATO, or refundable from the ATO, is shown as a Payable or Receivable in theStatement of Financial Position. Cash flows are included inthe statement of cash flows on a gross basis. The GSTcomponent of cash flows arising from investing and financingactivities which is recoverable from or payable to the ATO isclassified as operating cash flow.
(r) Rounding amounts to the nearest thousand dollarsIn the financial statements, all amounts are recorded inAustralian Dollars and have been rounded to the nearestthousand dollars (shown as $000).
Sydney Pilot Service Pty LtdNotes to and forming part of the financial statements continued
Note 1. Summary of significant accounting policies continued

Syd
ney P
ilot S
ervice
Pty Ltd
Financial Statem
ents
96
Note 2. Revenue from ordinary activities
2004 2003$000 $000
Revenue from operating activities
Pilotage revenue 8,871 5,524
8,871 5,524
Other revenue
Interest received 28 22
Miscellaneous sources 197 97
225 119
Total revenue from ordinary activities 9,096 5,643
Note 3. Expenditure from ordinary activities
Note 2004 2003$000 $000
Salaries and wages 4,814 3,046
Employee benefits expense:
Annual leave 558 338
Long-service leave 13 141 107
Retirement benefits (superannuation) – accumulation 220 140
Other expenses from ordinary activities:
Service contractors 402 265
Utilities and communications 22 14
Indirect taxes 443 191
Depreciation 9 113 40
Doubtful debts 5 (b) 1 12
Auditors’ remuneration from review of the financial reports 17 15
Directors’ remuneration 21 19 18
Consultants’ fees — —
Rental on operating leases 330 223
Insurance 341 171
Materials 464 358
Other operations and services 817 586
Other expenses from ordinary activities 8,702 5,524
Borrowing costs expense 20 —
Total expenditure from ordinary activities 8,722 5,524
Sydney Pilot Service Pty LtdNotes to and forming part of the financial statements continued
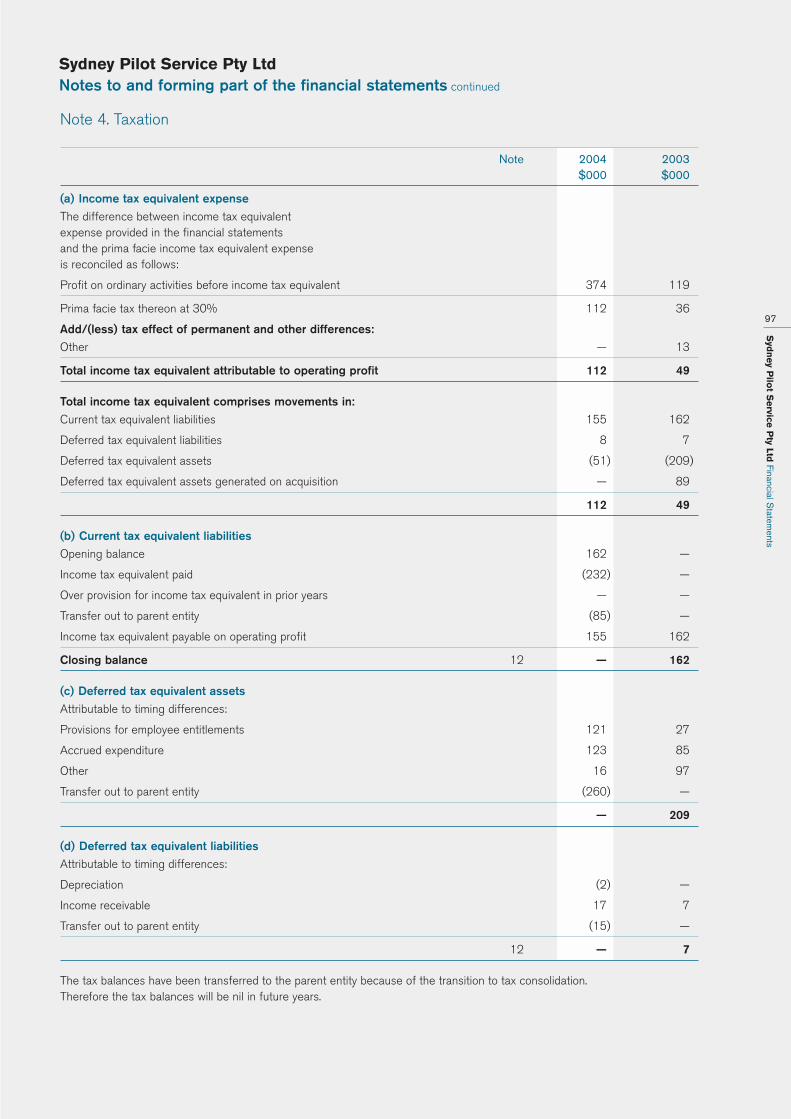
Syd
ney P
ilot S
ervice
Pty Ltd
Financial Statem
ents
97
Note 4. Taxation
Note 2004 2003$000 $000
(a) Income tax equivalent expense
The difference between income tax equivalent expense provided in the financial statements and the prima facie income tax equivalent expense is reconciled as follows:
Profit on ordinary activities before income tax equivalent 374 119
Prima facie tax thereon at 30% 112 36
Add/(less) tax effect of permanent and other differences:
Other — 13
Total income tax equivalent attributable to operating profit 112 49
Total income tax equivalent comprises movements in:
Current tax equivalent liabilities 155 162
Deferred tax equivalent liabilities 8 7
Deferred tax equivalent assets (51) (209)
Deferred tax equivalent assets generated on acquisition — 89
112 49
(b) Current tax equivalent liabilities
Opening balance 162 —
Income tax equivalent paid (232) —
Over provision for income tax equivalent in prior years — —
Transfer out to parent entity (85) —
Income tax equivalent payable on operating profit 155 162
Closing balance 12 — 162
(c) Deferred tax equivalent assets
Attributable to timing differences:
Provisions for employee entitlements 121 27
Accrued expenditure 123 85
Other 16 97
Transfer out to parent entity (260) —
— 209
(d) Deferred tax equivalent liabilities
Attributable to timing differences:
Depreciation (2) —
Income receivable 17 7
Transfer out to parent entity (15) —
12 — 7
The tax balances have been transferred to the parent entity because of the transition to tax consolidation. Therefore the tax balances will be nil in future years.
Sydney Pilot Service Pty LtdNotes to and forming part of the financial statements continued

Syd
ney P
ilot S
ervice
Pty Ltd
Financial Statem
ents
98
Note 4. Taxation continued
Tax consolidation
SPS and its Australian parent, the Corporation, have decided to implement the tax consolidation legislation from 1 July 2003.The Australian Taxation Office has not been notified of this decision but will be advised when the consolidated tax return islodged in December 2004. As a consequence, the Corporation, as the head entity in the consolidated group, recognises currentand deferred tax amounts relating to transactions, events and balances of SPS as if those transactions, events and balanceswere its own, in addition to the current and deferred tax amounts arising in relation to its own transactions, events and balances.Amounts receivable or payable, under an accounting sharing agreement between the tax consolidated entities, are recognisedseparately as tax-related amounts receivable or payable. Expenses and revenues arising under the tax-sharing agreement arerecognised as a component of income tax expense.
Note 5. Receivables
2004 2003$000 $000
Current
Trade debtors 636 588
Other debtors 10 54
Accrued income (a) 100 55
746 697
Less: Provision for doubtful debts (b) (13) (12)
733 685
Non-current
Debtors 260 —
260 —
(a) Accrued income comprises:
Operating income 99 53
Bank interest 1 2
Total accrued income 100 55
(b) Provision for doubtful debts – current
Opening balance 12 —
Add: Current year’s charge 1 12
13 12
Less: Bad debts written off — —
Closing balance 13 12
Based on a review of debtors, an appropriate provision is carried for doubtful debts.
Sydney Pilot Service Pty LtdNotes to and forming part of the financial statements continued

Syd
ney P
ilot S
ervice
Pty Ltd
Financial Statem
ents
99
Note 6. Inventories
2004 2003$000 $000
Stores and materials:
– at cost 29 62
29 62
Inventory is classified as current as all items are expected to be consumed in the next financial year.
Note 7. Other financial assets
2004 2003Net Fair Net Fair
Value Value$000 $000
The investment is:
Cash Facility Trust 198 188
198 188
SPS has investments in NSW Treasury Corporation’s (TCorp) Hour-Glass Cash Facility Trust. Investments are represented by a number of units in the managed facility. TCorp appoints and monitors fund managers and establishes and monitors theapplication of appropriate investment guidelines. These investments are generally able to be redeemed with up to 24 hoursprior notice. The value of the investments held can increase or decrease depending on market conditions. The value that bestrepresents the maximum credit risk exposure is the net fair value. The value of the above investments represents the share ofthe value of the underlying assets of the facility and is stated at net fair value.
Note 8. Other current assets
2004 2003$000 $000
Prepayments
Operating expenditure prepayments 212 86
Annual leave (paid in advance) 116 6
328 92
Sydney Pilot Service Pty LtdNotes to and forming part of the financial statements continued

Syd
ney P
ilot S
ervice
Pty Ltd
Financial Statem
ents
100
Note 9. Property, plant and equipment
2004 2003$000 $000
Carrying Amounts
Plant (at fair value) 2,310 771
Less: Accumulated depreciation (152) (40)
2,158 731
Add: Construction in progress 56 550
Total property, plant and equipment 2,214 1,281
Movement in property, plant and equipment:
Plant
Opening balance 731 —
Add: From construction in progress 1,543 771
2,274 771
Less: Depreciation charge (113) (40)
Disposals — —
Write-offs (3) —
Closing balance 2,158 731
Movement in construction in progress:
Opening balance 550 —
Add: Acquisitions 1,049 1,321
1,599 1,321
Less: To property, plant and equipment (1,543) (771)
Closing balance 56 550
Note 10. Payables
2004 2003$000 $000
Current
Trade creditors 54 15
Other creditors 1,094 1,140
1,148 1,155
Non-current
Creditors 15 —
15 —
Sydney Pilot Service Pty LtdNotes to and forming part of the financial statements continued

Syd
ney P
ilot S
ervice
Pty Ltd
Financial Statem
ents
101
Note 11. Interest-bearing liabilities
2004 2003$000 $000
Non-current
Loan from parent entity 550 —
550 —
During the year SPS received a $550,000 loan from the parent entity. There is no maturity date for this loan.
Note 12. Tax equivalent liabilities
2004 2003$000 $000
Current
Current tax equivalent liabilities — 162
Non-current
Deferred tax equivalent liabilities — 7
Movement in tax liabilities Balance Current Payments Transfers* Balance30 June charge to 30 June
2003 revenue 2004$000 $000 $000 $000 $000
Current
Current tax equivalent liabilities 162 155 (232) (85) —
Non-current
Deferred tax equivalent liabilities 7 8 — (15) —
* The tax balances have been transferred to the parent entity following the implementation of the tax consolidation legislation from 1 July 2003.
Sydney Pilot Service Pty LtdNotes to and forming part of the financial statements continued

Syd
ney P
ilot S
ervice
Pty Ltd
Financial Statem
ents
102
Note 13. Provisions
2004 2003$000 $000
CurrentEmployee benefits, including on-costs 198 188
198 188
Non-currentEmployee benefits, including on-costs 503 383
503 383
Movement in provisions Balance Current Payments Other Balance30 June charge to transfers 30 June
2003 revenue 2004$000 $000 $000 $000 $000
CurrentEmployee benefits, including on-costs:
Long-service leave — 21 (21) — —
Voluntary separations 188 10 — — 198
188 31 (21) — 198
Non-currentEmployee benefits, including on-costs:
Long-service leave 383 120 — — 503
383 120 — — 503
Annual leave – refer note 8 for prepayment.
Note 14. Equity
SPS was established as a wholly owned subsidiary of the Corporation on 30 July 2002, commenced operations on 26 October 2002 and has one shareholder; Sydney Ports Corporation.
2004 2003$000 $000
EquityContributed equity 1,120 1,120
Reserves — —
Retained profits 332 70
Total equity at the end of the financial year 1,452 1,190
Movement in contributed equityOpening balance 1,120 —
Add /less movement — 1,120
Closing balance 1,120 1,120
Movement in retained profitsOpening balance 70 —
Add net profit after income tax 262 70
Closing balance 332 70
Sydney Pilot Service Pty LtdNotes to and forming part of the financial statements continued

Syd
ney P
ilot S
ervice
Pty Ltd
Financial Statem
ents
103
Note 15. Financial instruments
a) Interest rate risk
Interest rate risk is the risk that the value of the financial instrument will fluctuate because of changes in market interest rates.SPS’s exposure to interest rate risk and the effective interest rates of financial assets and liabilities, both recognised andunrecognised at the reporting date, are as follows:
2004 Fixed Interest rate maturing in:
Financial instruments Floating 1 year Over More Non- Total Weightedinterest or less 1 to than interest carrying average
rate 5 years 5 years bearing amount effectiveas per the intereststatement rate*
of financialposition
$000 $000 $000 $000 $000 $000 %
Financial assets
Cash 103 — — — 1 104 4.39%
Receivables — — — — 724 724 n/a
Investments 198 — — — — 198 5.23%
Total financial assets 301 — — — 725 1,026
Financial liabilities
Payables — — — — 810 810 n/a
Interest-bearing liabilities 550 — — — — 550 5.11%
Total financial liabilities 550 — — — 810 1,360
Off-balance-sheet financial instruments
Derivative financial instruments ** — — — — — —
Interest rate swap nominal value — — — — — —
* Weighted average effective interest rate was computed on a monthly basis.** Notional principal amounts for futures contracts.
Sydney Pilot Service Pty LtdNotes to and forming part of the financial statements continued

Syd
ney P
ilot S
ervice
Pty Ltd
Financial Statem
ents
104
Note 15. Financial instruments continued
2003 Fixed Interest rate maturing in:
Financial instruments Floating 1 year Over More Non- Total Weightedinterest or less 1 to than interest carrying average
rate 5 years 5 years bearing amount effectiveas per the intereststatement rate*
of financialposition
$000 $000 $000 $000 $000 $000 %
Financial assets
Cash 568 — — — — 568 4.15%
Receivables — — — — 631 631 n/a
Investments 188 — — — — 188 4.85%
Total financial assets 756 — — — 631 1,387
Financial liabilities
Payables — — — — 1,079 1,079 n/a
Interest-bearing liabilities — — — — — — n/a
Total financial liabilities — — — — 1,079 1,079
Off-balance-sheet financial instruments
Derivative financial instruments ** — — — — — —
Interest rate swap nominal value — — — — — —
* Weighted average effective interest rate was computed on a monthly basis.** Notional principal amounts for futures contracts
b) Credit riskCredit risk is the risk of financial loss arising from another party to a contract or financial position failing to discharge theirfinancial obligation. The maximum exposure to credit risk is represented by the carrying amounts of the financial assetsincluded in the Statement of Financial Position.
Trade debtors are due within 21 days of invoice date. Miscellaneous debtors are due within seven days of invoice date. Tradeand other creditors are settled within 28 days of invoice date.
Credit risk by classification of counter-party:
Governments Banks Other Total
2004 2003 2004 2003 2004 2003 2004 2003$000 $000 $000 $000 $000 $000 $000 $000
Financial assets
Cash 1 — 103 568 — — 104 568
Receivables 68 27 1 2 655 602 724 631
Investments 198 188 — — — — 198 188
Total financial assets 267 215 104 570 655 602 1,026 1,387
The only significant concentration of credit risk arises from cash held with NSW Treasury Corporation, which is 19% of totalfinancial assets (41% with Commonwealth Bank at 30 June 2003). The largest single debtor included in receivables totals$0.075 million ($0.060 million at 30 June 2003) and is 7% of total financial assets (4% at 30 June 2003).
Sydney Pilot Service Pty LtdNotes to and forming part of the financial statements continued
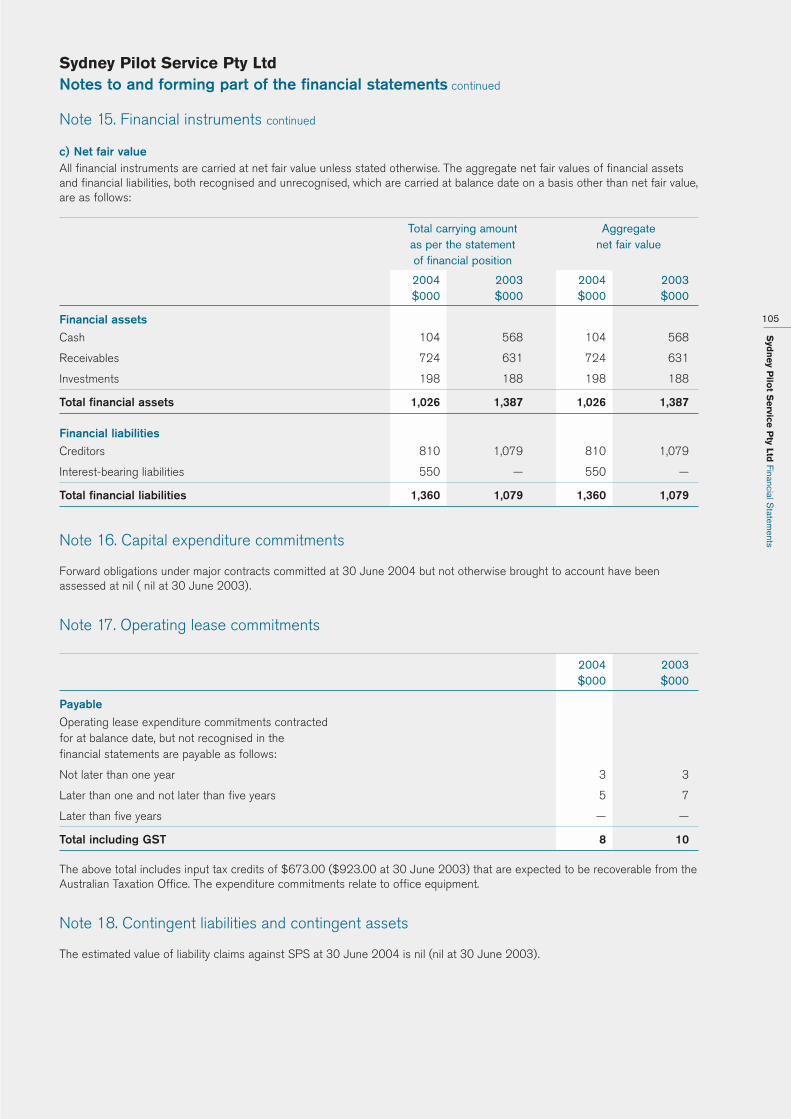
Syd
ney P
ilot S
ervice
Pty Ltd
Financial Statem
ents
105
Note 15. Financial instruments continued
c) Net fair valueAll financial instruments are carried at net fair value unless stated otherwise. The aggregate net fair values of financial assetsand financial liabilities, both recognised and unrecognised, which are carried at balance date on a basis other than net fair value,are as follows:
Total carrying amount Aggregateas per the statement net fair valueof financial position
2004 2003 2004 2003$000 $000 $000 $000
Financial assets
Cash 104 568 104 568
Receivables 724 631 724 631
Investments 198 188 198 188
Total financial assets 1,026 1,387 1,026 1,387
Financial liabilities
Creditors 810 1,079 810 1,079
Interest-bearing liabilities 550 — 550 —
Total financial liabilities 1,360 1,079 1,360 1,079
Note 16. Capital expenditure commitments
Forward obligations under major contracts committed at 30 June 2004 but not otherwise brought to account have beenassessed at nil ( nil at 30 June 2003).
Note 17. Operating lease commitments
2004 2003$000 $000
Payable
Operating lease expenditure commitments contracted for at balance date, but not recognised in the financial statements are payable as follows:
Not later than one year 3 3
Later than one and not later than five years 5 7
Later than five years — —
Total including GST 8 10
The above total includes input tax credits of $673.00 ($923.00 at 30 June 2003) that are expected to be recoverable from theAustralian Taxation Office. The expenditure commitments relate to office equipment.
Note 18. Contingent liabilities and contingent assets
The estimated value of liability claims against SPS at 30 June 2004 is nil (nil at 30 June 2003).
Sydney Pilot Service Pty LtdNotes to and forming part of the financial statements continued

Syd
ney P
ilot S
ervice
Pty Ltd
Financial Statem
ents
106
Note 19. Consultancy fees
No fees were paid or payable to consultants during the year (nil in 2002–03).
Note 20. Notes to the statement of cash flows
(a) Reconciliation of cashFor the purpose of the Statement of Cash Flows, cash includes cash on hand and in banks (net of any outstanding bankoverdraft) and short-term investments in money market instruments which are classified as current assets. Cash at 30 June 2004as shown in the Statement of Cash Flows is reconciled to the related items in the Statement of Financial Position as follows:
2004 2003$000 $000
Cash assets 104 568
Other financial assets (current investments) 198 188
Cash at the end of the financial year 302 756
(b) Reconciliation of profit on ordinary activities after income tax equivalent to net cash provided by operating activities
Profit on ordinary activities after income tax equivalent 262 70
Depreciation 113 40
Amortisation of discount on interest-bearing liabilities — —
Net loss/(profit) on sale of interest-bearing liabilities — —
Net loss/(profit) on sale of non-current assets — —
Assets written off 3 —
378 110
Net movement in assets and liabilities applicable to operating activities
(Increase)/decrease in receivables (352) (631)
(Increase)/decrease in inventories 33 (62)
(Increase)/decrease in other assets (27) (301)
(Decrease)/increase in payables 422 721
(Decrease)/increase in provisions (39) 740
Net cash provided by operating activities 415 577
Note 21. Directors’ remuneration and loans
Directors’ remuneration includes emoluments and other benefits paid or due and payable to Directors but does not includeamounts paid as salary to full-time Directors. Directors’ remuneration for the year was $0.019 million ($0.018 million in 2002–03). Three Directors of SPS were also directors of the Corporation. During the year no loans were made to Directors.
Sydney Pilot Service Pty LtdNotes to and forming part of the financial statements continued

Syd
ney P
ilot S
ervice
Pty Ltd
Financial Statem
ents
107
Note 22. Related party transactions
Wholly owned groupSydney Ports Corporation established a wholly owned subsidiary, Sydney Pilot Service Pty Ltd, on 30 July 2002 to carry out pilotageservices in Sydney Harbour and Botany Bay. SPS commenced operations on 26 October 2002. An injection of capital was made of$1.120 million in order to purchase assets and fund working capital of the subsidiary. Thirty-eight employees were employed by thesubsidiary company. During 2003–04 a loan from the Corporation (the parent entity) was received for $0.550 million.
Other transactionsDuring the financial year a number of transactions occurred between SPS and the Corporation. Expenditure paid by theCorporation on behalf of SPS was recovered at cost. Management, accounting, human resources, information technology andother services were provided to SPS through a management fee based on cost recovery. This amount is included within ‘OtherOperations and Services’ in Note 3.
DirectorsDetails of Directors’ remuneration are set out in Note 21. No transactions occurred between SPS and Director related entities.Three Directors of SPS were also Directors of the Corporation.
Note 23. Events occurring after reporting date
In accordance with Australian Accounting Standard AAS8, Events Occurring After Reporting Date, there are no known eventsoccurring after the reporting date that materially affect the financial statements.
Note 24. Segment reporting
In accordance with AASB1005, Segment Reporting, the following information is provided:
Business segments: SPS provides some of the services under the business segment of the consolidated entity. This segment isthe management of port facilities for the shipping community including the provision of navigational and operational safetyneeds of commercial shipping.
Geographical segments: SPS operates in the single geographical location of NSW.
Note 25. AASB 1047, Disclosing the impacts of adopting Australian equivalents to internationalfinancial reporting standards
SPS will apply the Australian Equivalents to International Financial Reporting Standards (AIFRS) from the reporting periodbeginning 1 July 2005. SPS is managing the transition to the new standards by allocating internal resources and engagingconsultants to analyse the pending standards and Urgent Issues Group Abstracts to identify key areas of policies, procedures,systems and financial impacts that are affected by the transition.
As a result of this exercise, SPS has taken the following steps to manage the transition to International Accounting Standards (IAS):
– A project team has been established and is overseeing the transition. The Financial Accountant is the project manager andmeets regularly with the project team to discuss progress against the plan.
– The following phases that need to be undertaken have been identified:
– A detailed diagnostic review of all accounting policies and procedures to identify differences between current accountingstandards and IAS
– Advising the Board of progress throughout the project and of the major areas of impact identified
– Preparing a balance sheet as at 1 July 2004 under IAS for comparative purposes
– Preparing financial statements under IAS for 2004–05 for comparative purposes
– Identifying the system changes required
– Meeting NSW Treasury target dates for the completion of certain tasks, and
– Providing staff with internal and external training.
Sydney Pilot Service Pty LtdNotes to and forming part of the financial statements continued
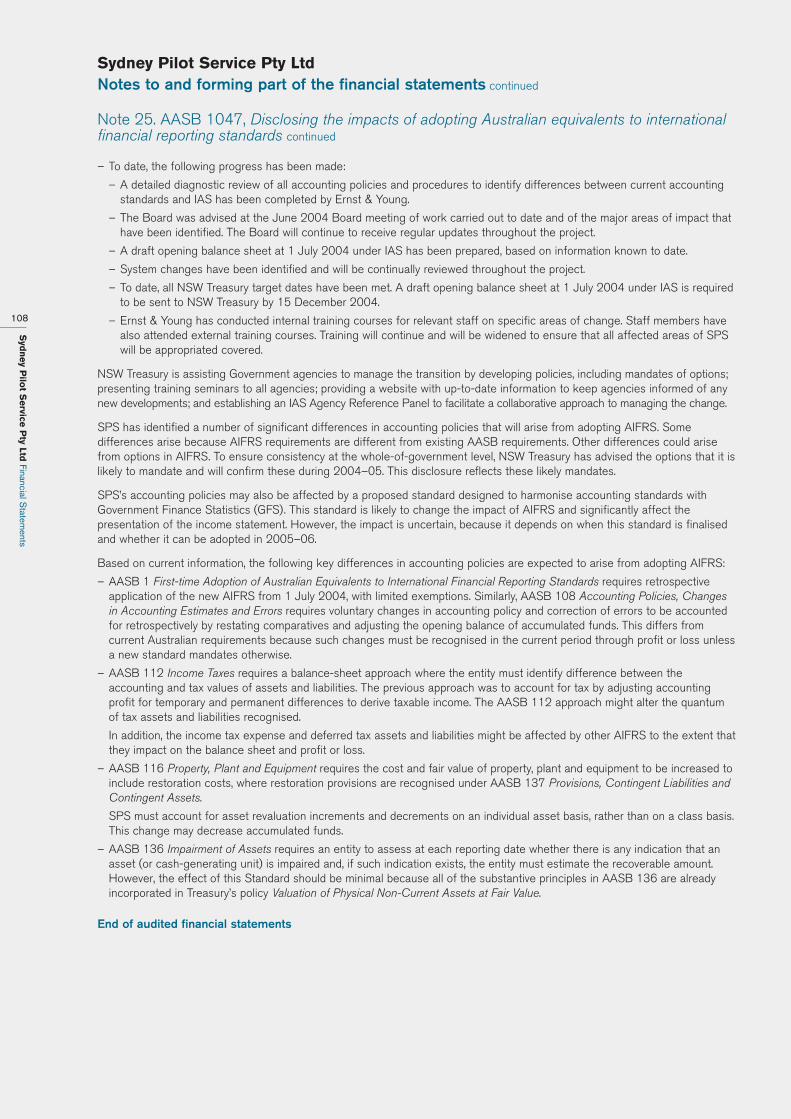
Syd
ney P
ilot S
ervice
Pty Ltd
Financial Statem
ents
108
Note 25. AASB 1047, Disclosing the impacts of adopting Australian equivalents to internationalfinancial reporting standards continued
– To date, the following progress has been made:
– A detailed diagnostic review of all accounting policies and procedures to identify differences between current accountingstandards and IAS has been completed by Ernst & Young.
– The Board was advised at the June 2004 Board meeting of work carried out to date and of the major areas of impact thathave been identified. The Board will continue to receive regular updates throughout the project.
– A draft opening balance sheet at 1 July 2004 under IAS has been prepared, based on information known to date.
– System changes have been identified and will be continually reviewed throughout the project.
– To date, all NSW Treasury target dates have been met. A draft opening balance sheet at 1 July 2004 under IAS is requiredto be sent to NSW Treasury by 15 December 2004.
– Ernst & Young has conducted internal training courses for relevant staff on specific areas of change. Staff members havealso attended external training courses. Training will continue and will be widened to ensure that all affected areas of SPSwill be appropriated covered.
NSW Treasury is assisting Government agencies to manage the transition by developing policies, including mandates of options;presenting training seminars to all agencies; providing a website with up-to-date information to keep agencies informed of anynew developments; and establishing an IAS Agency Reference Panel to facilitate a collaborative approach to managing the change.
SPS has identified a number of significant differences in accounting policies that will arise from adopting AIFRS. Somedifferences arise because AIFRS requirements are different from existing AASB requirements. Other differences could arisefrom options in AIFRS. To ensure consistency at the whole-of-government level, NSW Treasury has advised the options that it islikely to mandate and will confirm these during 2004–05. This disclosure reflects these likely mandates.
SPS’s accounting policies may also be affected by a proposed standard designed to harmonise accounting standards withGovernment Finance Statistics (GFS). This standard is likely to change the impact of AIFRS and significantly affect thepresentation of the income statement. However, the impact is uncertain, because it depends on when this standard is finalisedand whether it can be adopted in 2005–06.
Based on current information, the following key differences in accounting policies are expected to arise from adopting AIFRS:
– AASB 1 First-time Adoption of Australian Equivalents to International Financial Reporting Standards requires retrospectiveapplication of the new AIFRS from 1 July 2004, with limited exemptions. Similarly, AASB 108 Accounting Policies, Changesin Accounting Estimates and Errors requires voluntary changes in accounting policy and correction of errors to be accountedfor retrospectively by restating comparatives and adjusting the opening balance of accumulated funds. This differs fromcurrent Australian requirements because such changes must be recognised in the current period through profit or loss unlessa new standard mandates otherwise.
– AASB 112 Income Taxes requires a balance-sheet approach where the entity must identify difference between theaccounting and tax values of assets and liabilities. The previous approach was to account for tax by adjusting accountingprofit for temporary and permanent differences to derive taxable income. The AASB 112 approach might alter the quantumof tax assets and liabilities recognised.
In addition, the income tax expense and deferred tax assets and liabilities might be affected by other AIFRS to the extent thatthey impact on the balance sheet and profit or loss.
– AASB 116 Property, Plant and Equipment requires the cost and fair value of property, plant and equipment to be increased toinclude restoration costs, where restoration provisions are recognised under AASB 137 Provisions, Contingent Liabilities andContingent Assets.
SPS must account for asset revaluation increments and decrements on an individual asset basis, rather than on a class basis.This change may decrease accumulated funds.
– AASB 136 Impairment of Assets requires an entity to assess at each reporting date whether there is any indication that anasset (or cash-generating unit) is impaired and, if such indication exists, the entity must estimate the recoverable amount.However, the effect of this Standard should be minimal because all of the substantive principles in AASB 136 are alreadyincorporated in Treasury’s policy Valuation of Physical Non-Current Assets at Fair Value.
End of audited financial statements
Sydney Pilot Service Pty LtdNotes to and forming part of the financial statements continued
Syd
ney P
ilot S
ervice
Pty Ltd
Financial Statem
ents
109
In the opinion of the Directors of Sydney Pilot Service Pty Ltd:
1. The Financial Statements and Notes:
a) Exhibit a true and fair view of the financial position of Sydney Pilot Service Pty Ltd at 30 June 2004 and of itsperformance, as represented by the results of its operations and its cash flows for the year ended on that date.
b) Comply with applicable Accounting Standards, Urgent Issues Group Consensus Views and other mandatory andstatutory reporting requirements including Part 3 of the Public Finance and Audit Act 1983 and the associatedrequirements of the Public Finance and Audit Regulation 2000.
2. There are reasonable grounds to believe that Sydney Pilot Service Pty Ltd will be able to pay its debts as and when theybecome due and payable, and
3. We are not aware of any circumstances at the date of this declaration that would render any particulars included in theFinancial Statements to be misleading or inaccurate.
Signed in accordance with a resolution of the Directors.
G.J. Martin S.D. HobdayChairman Director
Date: 15 October 2004 Date: 15 October 2004
Sydney Pilot Service Pty LtdDirectors’ Statement
Syd
ney P
ilot S
ervice
Pty Ltd
Financial Statem
ents
110

Syd
ney P
orts C
orp
ora
tion
Annual R
eport 200
4 S
tatutory Disclosures
111
Sydney Ports CorporationStatutory disclosures 2004
Funds granted to non-government community organisations
The following payments were made to non-government community organisations in 2003–04:
$
La Perouse Precinct Committee 500.00
Malcolm Sargent Cancer Fund for Children 1,000.00
The Cancer Council of NSW 725.00
St Vincents & Mater Health Sydney (Cancer Research) 1,000.00
Mission to Seafarers 2,710.00
Australian Red Cross 404.00
MSB RSL Sub Branch 500.00
United Way Sydney 200.00
2004 Annual Report
The total external cost incurred in the production of 2,000 copies of the Sydney Ports Corporation 2004 Annual Reportincluding incorporation of the Sydney Pilot Service’s (SPS) financial statements was $60,000.
The report is available in non-printed formats via website www.sydneyports.com.au
Exemptions for the reporting period provisions
Section 41B(1)(c)(va) of the Public Finance and Audit Act 1983 and clause 19 of the Annual Reports (Statutory Bodies)Regulation 2000 require a statutory body to include in its annual report statements of all exemptions, omissions, modificationsand variations from reporting provisions which have been granted by the Treasurer under section 41BA of that Act andRegulation and which apply to the statutory body and a summary of the reasons for them.
As a statutory body in competition, the following exemptions, omissions, modifications and variations apply to SydneyPorts Corporation.
Requirements Legislative source Exemption and conditionsof requirements
Financial reporting
Format of financial statements Public Finance and Audit Act 1983(PF&AA)
Financial statements Section 41B(c) PF&AA Exempt from preparing manufacturing,trading and profit and loss statements
Required to prepare a summarisedoperating statement (ie. summarising majorcategories of revenues and expenses)
Notes: Income and expenditure Public Finance & Audit Regulation2000 (PF&AR): Schedule 1, Part 1
Amount charged or set aside for renewalor replacement of fixed assets
Clause 2
Amount set aside to any provision forknown commitments
Clause 4
Amount appropriated for repayment ofloans/advances/debentures/deposits
Clause 6
Material items of income and expenditureon a program or activity basis
Clause 13 Required to summarise the material itemsof revenues and expenses on a program oractivity basis
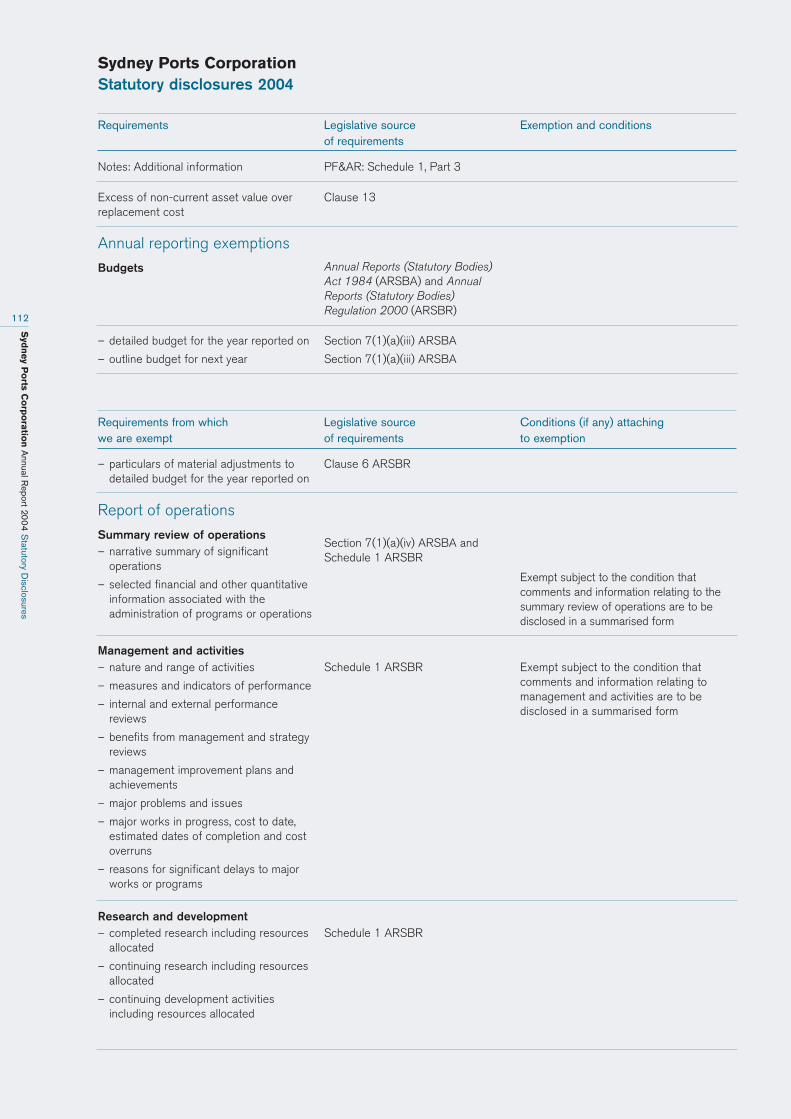
Syd
ney P
orts C
orp
ora
tion
Annual R
eport 200
4 S
tatutory Disclosures
112
Sydney Ports CorporationStatutory disclosures 2004
Research and development – completed research including resources
allocated
– continuing research including resourcesallocated
– continuing development activitiesincluding resources allocated
Schedule 1 ARSBR
Management and activities– nature and range of activities
– measures and indicators of performance
– internal and external performancereviews
– benefits from management and strategyreviews
– management improvement plans andachievements
– major problems and issues
– major works in progress, cost to date,estimated dates of completion and costoverruns
– reasons for significant delays to majorworks or programs
Schedule 1 ARSBR Exempt subject to the condition thatcomments and information relating tomanagement and activities are to bedisclosed in a summarised form
Exempt subject to the condition thatcomments and information relating to thesummary review of operations are to bedisclosed in a summarised form
Excess of non-current asset value overreplacement cost
Clause 13
Notes: Additional information PF&AR: Schedule 1, Part 3
Annual reporting exemptions
Budgets Annual Reports (Statutory Bodies)Act 1984 (ARSBA) and AnnualReports (Statutory Bodies)Regulation 2000 (ARSBR)
– detailed budget for the year reported on
– outline budget for next year
Section 7(1)(a)(iii) ARSBA
Section 7(1)(a)(iii) ARSBA
– particulars of material adjustments todetailed budget for the year reported on
Clause 6 ARSBR
Report of operations
Summary review of operations– narrative summary of significant
operations
– selected financial and other quantitativeinformation associated with theadministration of programs or operations
Section 7(1)(a)(iv) ARSBA andSchedule 1 ARSBR
Requirements Legislative source Exemption and conditionsof requirements
Requirements from which Legislative source Conditions (if any) attaching we are exempt of requirements to exemption

Syd
ney P
orts C
orp
ora
tion
Annual R
eport 200
4 S
tatutory Disclosures
113
Sydney Ports CorporationStatutory disclosures 2004
Requirements Legislative source Exemption and conditionsof requirements
Human resources– number of employees by category and
comparison to prior three years
– exceptional movements in employeewages, salaries or allowances
– personnel policies and practices
– industrial relations policies and practices
Schedule 1 ARSBR Exempt subject to the condition thatoverseas visits with the main purposeshighlighted are required to be disclosed
Consumer response– extent and main features of complaints
– services improved/changed in responseto complaints/suggestions
Schedule 1 ARSBR Exempt subject to the condition thatcomments and information relating toconsumer response are to be disclosed ina summarised form
Land disposalProperties disposed of during the year:
– total number
– total value
If value greater than $5,000,000 and notby public auction or tender:
– list of properties
– for each case, name of person whoacquired the property and proceeds from disposal
– details of family or business connectionsbetween the purchaser and the personresponsible for approving the disposal
– purposes for which proceeds were used
– statement indicating that access to thedocuments relating to the disposal canbe obtained under the Freedom ofInformation Act 1989
Schedule 1 ARSBR
ConsultantsFor each engagement costing greater than $30,000:
– name of consultant
– title of project
– actual cost
For each engagement costing less than $30,000:
– total number of engagements
– total cost
If applicable, a statement that noconsultants were engaged
Schedule 1 ARSBR Exempt subject to the condition that thetotal amount spent on consultants is to bedisclosed along with a summary of themain purposes of the engagements
Payment of accounts– performance in paying accounts,
including action to improve paymentperformance
Schedule 1 ARSBR

Syd
ney P
orts C
orp
ora
tion
Annual R
eport 200
4 S
tatutory Disclosures
114
Sydney Ports CorporationStatutory disclosures 2004
These exemptions, omissions, modifications and variations arise from a review of the External Reporting Framework forStatutory State Owned Corporations and Particular Statutory Bodies by the NSW Treasury and are based on among otherthings commercial sensitivities. A number of exemptions relate to financial reporting requirements that are redundant or notconsidered essential for performance assessment and accountability purposes.
Response to significant issues raised by the Auditor General
There were no significant issues raised by the Auditor General in his 2003–04 report.
2003–04 Performance relative to the Statement of Corporate Intent
The material deviations from targets in the 2003–04 Statement of Corporate Intent are:
Increased Shareholder Value Added (SVA) as a result of Net Operating Profit After Tax (NOPAT) increasing due to growth in trade volumes.
Freedom of Information
Sydney Ports Corporation is required to report annually on its administration of the applications it receives under the Freedom ofInformation Act 1989 (NSW). The following tables detail statistics required to be reported under the Act for the period 1 July to 30 June for the financial years 2002–03 and 2003–04.
During the reporting period, no requests were transferred to another organisation or agency. No requests were carried forwardto the reporting period 2003–04.
No reviews were requested either internally, to the Ombudsman or to the District Court during the reporting period.
Requirements Legislative source Exemption and conditionsof requirements
Time for payment of accounts– reasons for late payments
– interest paid due to late payments
Schedule 1 ARSBR
Clause 18 [PFAR]
Report on risk management andinsurance activities
Schedule 1 ARSBR Exempt subject to the condition that thecomments and information are to bedisclosed in a summarised form
Disclosure of controlled entities– details of objectives, operations,
activities of controlled entities andmeasures of performance
Schedule 1 ARSBR Exempt subject to the condition that thenames of the controlled entities are to bedisclosed along with a summariseddisclosure of the controlled entities’objectives, operations, activities andmeasures of performance
Investment performance Clause 12 ARSBR
Liability management performance Clause 13 ARSBR
Financial statements ofcontrolled entities
Section 7(1)(a)(ia) ARSBA Exempt from preparing manufacturing andtrading statements
Required to prepare a summarisedoperating statement (summarising majorcategories of revenues and expenses)

Syd
ney P
orts C
orp
ora
tion
Annual R
eport 200
4 S
tatutory Disclosures
115
FOI applications and applications determined
Personal Other Total2003 2004 2003 2004 2003 2004
New 0 0 1 1 1 1
Completed 0 0 1 1 1 1
Granted in full 0 0 1 0 1 0
Refused (Exempt) 0 0 0 0 0 0
Information sought not held/information previously provided to applicant (application fees refunded) 0 0 0 1 0 1
Total processed 0 0 1 1 1 1
Days to process FOI applications
Time elapsed Personal Other2003 2004 2003 2004
0 –21 days 0 0 0 0
22–35 days 0 0 0 0
Over 35 days 0 0 1 1
Processing time
Processing hours Personal Other2003 2004 2003 2004
0 –10 hours 0 0 0 1
11–20 hours 0 0 0 0
Greater than 20 hours 0 0 1 0
During the period no Ministerial Certificates were issued, no formal consultations requested, no amendments or notations torecords made.
The Corporation’s compliance with the Act did not raise any major issues in the reporting period, nor did compliance with theAct have any significant impact on Sydney Ports Corporation’s activities.
Code of ConductThe Corporation has a Code of Conduct which is observed by all staff and prescribes standards of behaviour and moralrequirements expected of employees. There were no changes to the Code of Conduct during the year.
Legal changes and subordinate legislationThere have been no material legal changes or changes to subordinate legislation or significant judicial decisions that have hadany significant effect on the operations of Sydney Ports Corporation.
Factors affecting achievement of operational objectives There were no unanticipated factors which have not already been mentioned during the year that led to any material affect onthe achievement of Sydney Ports Corporation’s operational objectives.
Sydney Ports CorporationStatutory disclosures 2004
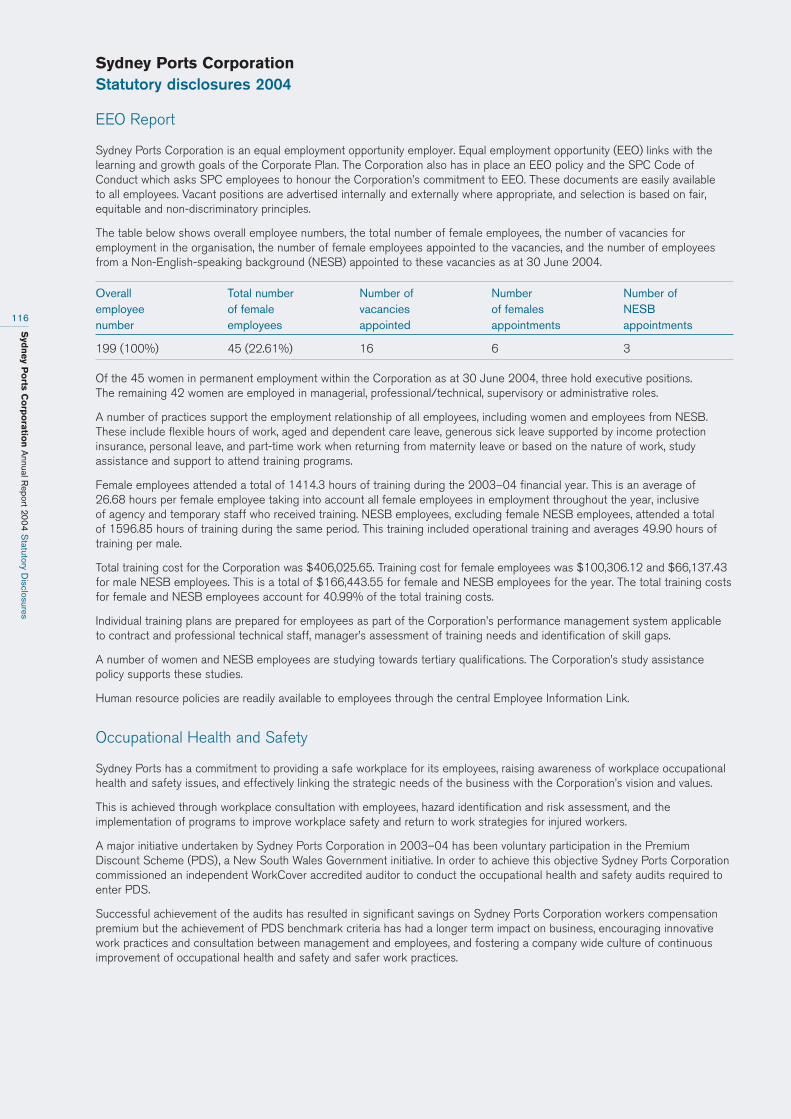
Syd
ney P
orts C
orp
ora
tion
Annual R
eport 200
4 S
tatutory Disclosures
116
EEO Report
Sydney Ports Corporation is an equal employment opportunity employer. Equal employment opportunity (EEO) links with thelearning and growth goals of the Corporate Plan. The Corporation also has in place an EEO policy and the SPC Code ofConduct which asks SPC employees to honour the Corporation’s commitment to EEO. These documents are easily available to all employees. Vacant positions are advertised internally and externally where appropriate, and selection is based on fair,equitable and non-discriminatory principles.
The table below shows overall employee numbers, the total number of female employees, the number of vacancies foremployment in the organisation, the number of female employees appointed to the vacancies, and the number of employeesfrom a Non-English-speaking background (NESB) appointed to these vacancies as at 30 June 2004.
Overall Total number Number of Number Number of employee of female vacancies of females NESB number employees appointed appointments appointments
199 (100%) 45 (22.61%) 16 6 3
Of the 45 women in permanent employment within the Corporation as at 30 June 2004, three hold executive positions. The remaining 42 women are employed in managerial, professional/technical, supervisory or administrative roles.
A number of practices support the employment relationship of all employees, including women and employees from NESB.These include flexible hours of work, aged and dependent care leave, generous sick leave supported by income protectioninsurance, personal leave, and part-time work when returning from maternity leave or based on the nature of work, studyassistance and support to attend training programs.
Female employees attended a total of 1414.3 hours of training during the 2003–04 financial year. This is an average of 26.68 hours per female employee taking into account all female employees in employment throughout the year, inclusive of agency and temporary staff who received training. NESB employees, excluding female NESB employees, attended a total of 1596.85 hours of training during the same period. This training included operational training and averages 49.90 hours oftraining per male.
Total training cost for the Corporation was $406,025.65. Training cost for female employees was $100,306.12 and $66,137.43for male NESB employees. This is a total of $166,443.55 for female and NESB employees for the year. The total training costsfor female and NESB employees account for 40.99% of the total training costs.
Individual training plans are prepared for employees as part of the Corporation’s performance management system applicableto contract and professional technical staff, manager’s assessment of training needs and identification of skill gaps.
A number of women and NESB employees are studying towards tertiary qualifications. The Corporation’s study assistancepolicy supports these studies.
Human resource policies are readily available to employees through the central Employee Information Link.
Occupational Health and Safety
Sydney Ports has a commitment to providing a safe workplace for its employees, raising awareness of workplace occupationalhealth and safety issues, and effectively linking the strategic needs of the business with the Corporation’s vision and values.
This is achieved through workplace consultation with employees, hazard identification and risk assessment, and theimplementation of programs to improve workplace safety and return to work strategies for injured workers.
A major initiative undertaken by Sydney Ports Corporation in 2003–04 has been voluntary participation in the PremiumDiscount Scheme (PDS), a New South Wales Government initiative. In order to achieve this objective Sydney Ports Corporationcommissioned an independent WorkCover accredited auditor to conduct the occupational health and safety audits required toenter PDS.
Successful achievement of the audits has resulted in significant savings on Sydney Ports Corporation workers compensationpremium but the achievement of PDS benchmark criteria has had a longer term impact on business, encouraging innovativework practices and consultation between management and employees, and fostering a company wide culture of continuousimprovement of occupational health and safety and safer work practices.
Sydney Ports CorporationStatutory disclosures 2004

Syd
ney P
orts C
orp
ora
tion
Annual R
eport 200
4 S
tatutory Disclosures
117
Five lost time injuries were sustained during the 2003–04 reporting period.
Reporting period 2001–02 2002–03 2003–04
Number of lost time injuries 3 3 5
There has been an increase in the number of lost time injuries during the reporting period. This has meant that Sydney PortsCorporation did not achieve one of the organisational performance measures, namely no more than 3 lost time injuries.However, Sydney Ports Corporation actively follows through in its commitment to the health and safety of employees and ineach instance there has been an investigation and risk to employees has been addressed. There were no work related illnessesduring the reporting period
There has been one prosecution, which is being defended, under the Occupational Health and Safety Act during the year,relating to an accident that occurred in 2001.
The Occupational Health and Safety Consultative Committee continued its meetings on a regular basis, to monitor the overallperformance of occupational health and safety initiatives, policies, procedures, processes and training, and to identifyopportunities for the promotion and improvement of safe work practices.
Status Report on Ethnic Affairs Priority Statement
The Corporation’s Ethnic Affairs Policy supports The NSW Charter of Principles for a Culturally Diverse Society. In 2003–04, the Corporation:
– Continued to pay a number of its staff, Community Language Classification Allowance to use, read and interpret anotherlanguage.
– Engaged in merit based recruitment practices.
– Provided Employee Assistance program for the use of its staff.
– Provided for operational activities that include cultural and religious differences through the provision of religious and cultural holidays.
The Corporation will continue to support cultural diversity throughout 2004–05. In addition, and where required, translationservices will be available to Assist in communicating with the community.
Waste Reduction and Purchasing Policy (WRAPP)
Sydney Ports is a State-owned corporation and as such is required to comply with the Government’s Waste Reduction andPurchasing Policy (WRAPP) where it is cost effective and in line with sound business practices.
The Corporation has developed a WRAPP plan in accordance with Premier’s Memoranda 99–9 and 97–30.
The plan details strategies for:
(a) reducing the generation of waste (waste avoidance and minimisation)
(b) resource recovery (waste reuse and recycling)
(c) use of recycled materials (purchase of recycled content material) and
(d) establishing a benchmark quantifying waste generated and recycled.
(a) Reducing the generation of waste (waste avoidance and minimisation)– Sydney Ports has a number of strategies in place to reduce the generation of pre-printed forms such as purchase orders
and some invoices.
– Installation of document centres thereby reducing the number of individual desk printers and associated consumables suchas toner cartridges.
(b) Resource recovery (waste re-use and recycling)– Sydney Ports is actively involved in recycling activities undertaken by the building managers whereby waste produced by
employees on a daily basis is separated into paper and other (food etc) and recycled.
– Other paper waste generated is collected and recycled by a private contractor.
– 85% of toner cartridges are recycled.
In the area of construction and related activities, contractors engaged by the Corporation are required to ensure that allactivities on site minimise the generation of waste by encouraging the recycling of all potential waste material.
Sydney Ports CorporationStatutory disclosures 2004

Syd
ney P
orts C
orp
ora
tion
Annual R
eport 200
4 S
tatutory Disclosures
118
(c) The use of recycled material (purchase of recycled – content materials)Sydney Ports Corporation purchases low-waste products and products with recycled content where it is consistent with soundcommercial practice and such products meet technical and operating standards.
Envelopes and folders with recycled contents purchased by the Corporation during the year represent 100% of envelopes and folders purchased. Other materials with recycled content purchased during the year include ink cartridges, toners andsuspension files. These purchases represent 12% to 42% of total purchases of these materials.
Paper purchased with recycled content accounted for 1% of the total plain paper purchased during 2003–04. The lowpercentage of recycled content paper purchased is due to a price differential of 15.62% per Ream for 60% recycled content to 45.20% for 80% recycled content between recycled content paper and virgin paper.
(d) Establishing a benchmark for quantifying waste generated and recycledSydney Ports undertook a Waste Audit during August 2003 to establish a benchmark for future measurement of wastegenerated and recycled. The Waste Audit Report was submitted to Resources NSW as part of the 2001–2003 WRAPP Report.
PublicationsDuring the year, in addition to the Annual Report 2004, Sydney Ports Corporation printed and distributed the followingpublications:
– Port Focus (a newsletter outlining Corporation and customer activities distributed three times per year)
– Current (a quarterly electronic newsletter outlining Corporation and customer activities)
– Corporate Plan 2004–2008
– Environment Report (a report on the Corporations environmental responsibilities and activities)
– The Economic Contribution of Sydney’s Ports (a report on the economic contribution of port activity to New South Wales)
The Sydney Ports Corporation website www.sydneyports.com.au was upgraded to include more information for customersand the general public.
Consultancy feesTotal fees paid and payable to consultants engaged in capital and operating projects by Sydney Ports Corporation during2003–04 amounted to nil ($0.093 million in 2002–2003).
Relevant legislationSydney Ports Corporation is a statutory State-owned corporation established under the State Owned Corporations Act 1989and Ports Corporatisation and Waterways Management Act 1995, and operates in accordance with those Acts.
Other significant legislation affecting the Corporation includes:
– Dangerous Goods (General) Regulation 1999;
– Marine Pollution Act 1987 and associated regulation;
– Management of Waters and Waterside Lands Regulations – NSW;
– Marine Pilotage Licensing Regulations;
– Maritime Services Act 1935;
– Navigation Act 1901;
– Protection of the Environment Operations Act 1997; and
– Maritime Transport Security Act 2003.
Sydney Ports CorporationStatutory disclosures 2004
Syd
ney P
orts C
orp
ora
tion
Annual R
eport 200
4 A
ppendices
119
Sydney Ports CorporationAppendices 2004
Corporate Governance
Good corporate governance creates and sustains an ethical and legal environment which recognises the interests of all thestakeholders in a corporation.
The Role of the BoardThe Board oversees the business and commercial affairs of the Corporation, approves the business and financial objectives andstrategies proposed by and subsequently implemented by management and monitors performance and policy.
Apart from participating in regular Board and committee meetings, the Directors from time to time visit the Corporation’soperations and informally meet port users and staff.
The composition and procedures of the Board The Board generally consists of seven Directors – five non-executive Directors (one of whom is the Chairman), the ChiefExecutive Officer and Staff Director who are selected in accordance with the procedures set out in the Ports Corporatisationand Waterways Management Act 1995. The Directors are appointed by the Governor on the recommendation of the votingshareholders. The proceedings and certain procedures of the Board are governed by the State Owned Corporations Act 1989and the Articles of Association of the Corporation.
Board remuneration Non-executive Directors and the Staff Director are remunerated by fees determined by the voting shareholders from time totime. These fees are comparable with those paid to directors of similarly constituted and similarly sized corporations.
Board committeesSeveral committees support the Board –
– The Audit and Risk Management Committee considers internal accounting controls and procedures, the activities of theinternal and external auditors, the relationship between management and the external auditors, the financial statements ofthe Corporation and risk management.
– The Remuneration Committee considers remuneration policies and practices, the remuneration of the executive managementgroup and merit recognition arrangements.
The majority of the Corporation’s staff are remunerated on the basis of an Enterprise Agreement, which was registered on 26 November 2001. This agreement is in force until 30 June 2004.
In line with developments in the employment market, executive and senior management are remunerated by base salariescoupled with at-risk performance incentives.
Attendance at Board meetings
Regular Board meetings Term of appointmentA B
D.L.P. Field 11 11 4 December 2001 – 3 December 2004
S. Kreiger 11 11 16 October 2002 – 15 October 2005
G.J. Martin 11 11 15 April 2001 – 15 April 2004 & 12 May 2004 – 15 April 2007
K.A.J. Murray 11 11 9 March 2002 – 8 March 2004 & 9 March 2004 – 8 March 2006
V.J. Smith 9 9 4 December 2001 – 3 December 2003 &24 February 2004 – 31 December 2005
M. Sullivan 11 11 1 October 2002 – 30 September 2005
A.Tansey 11 11 16 October 2002 – 15 October 2005
A = Number of meetings eligible to attend during term or since appointment announced
B = Number of meetings attended

Syd
ney P
orts C
orp
ora
tion
Annual R
eport 200
4 A
ppendices
120
Sydney Ports CorporationAppendices 2004
Salary Reporting
In reporting salaries for SES level 5 and above, the following information is provided for the year ended 30 June 2004.
Band Total positions Fixed salary At-risk salary incentive rangeat 30 June 2004 package range subject to performance
against set objectives
1 1 $289,430 – $339,900 $60,000 – $85,000
2 1 $212,180 – $289,430 $40,000 – $60,000
3 6 $154,500 – $212,180 $25,000 – $40,000
4 4 $128,750 – $154,500 $15,000 – $25,000
5 12 $115,875 – $128,750 $10,000 – $15,000
Overseas travel July 2003 – June 2004
Name Date Destination Purpose
Simon Barney 8-19.09.03 Singapore, China, Japan Trade Development Visit
Phil Rosser 8-19.09.03 Hong Kong, Singapore, China, Japan Trade Development Visit
David Field 21-25.10.03 Japan Yokkaichi Sister Port Seminar
Murray Fox 21-25.10.03 Japan Yokkaichi Sister Port Seminar
Simon Barney 17-29.04.04 Europe Trade Development Visit
Greg Martin 17.04-01.05.04 Europe, USA Trade Development Visit (Europe)IAPH Conference (USA)
Bart Pacheco 22-29.05.04 Germany 4th Congress of the InternationalHarbour Masters Association
AAPMA and sub-committeesGreg Martin President from October 2002
Australia Day CouncilBart Pacheco Operations AdvisorJenny Jones Operations Co-ordinator
Botany and Eastern Regional Environment ProtectionAssociationLisa Smith
Botany Bay Business Enterprise Centre Shane Hobday Director
Botany Bay Coastal Management CommitteeColin RuddBruce Royds
Botany Rail Steering Group Simon Barney ChairmanMorgan Noon
Bulk Liquids Industry AssociationMurray Fox
Caltex Australia Limited/Sydney Ports Co-ordination CommitteeRoy GarthBart Pacheco
Commercial Vessels Users GroupBart Pacheco
Cruise Down Under Phil Rosser Deputy Chairman
Interagency Transport Planning Committee Colin Rudd
Internal committeesExecutive Committee Occupational Health and Safety CommitteeSydney Ports Corporation Consultative CommitteeGangway Steering Committee
International Association of Ports and Harbours Greg Martin DirectorTony Navaratne Ports and Planning Construction Committee
International Harbour Masters AssociationBart Pacheco
Major Hazard Inter-Agency CommitteeRoy Garth
Maritime Industry GroupBart Pacheco
Navigators and Navigation Pilotage CommitteeBart Pacheco
Staff who are Members of External Committees

Sydney Ports CorporationAppendices 2004
Syd
ney P
orts C
orp
ora
tion
Annual R
eport 200
4 A
ppendices
121
New Year’s Eve CommitteeBart Pacheco Jenny Jones
NSW Chamber of Commerce – International TradeCommittee Phil Rosser Chair
Orica Groundwater Community Liaison CommitteeLisa SmithChrista Sams
Permanent Committee on Tides and Mean Sea LevelGary Batman
PIANC Congress Organising CommitteeBruce Hudson
Port Botany Emergency Plan Committee and sub-committeesShane Hobday ChairmanJim Pullin
Port Botany Neighbourhood Consultative GroupMurray FoxPolly BennettColin RuddLisa Smith
Sea Freight CouncilSimon Barney
Shell Gore Bay Community Consultative CommitteeMurray Fox
Standards Australia Committee on Maritime StructuresTony Navaratne
Standards Australia Committee ME 018 – The handlingand transport of dangerous cargoes in port areasRoy Garth
State Committee of the National Plan to CombatPollution of the Sea by OilBart Pacheco
Sydney Cruise Industry Forum Phil Rosser ChairmanJenny Jones
Sydney Harbour Executive Murray FoxMarika Calfas
Sydney Harbour Planning Control GroupGreg Martin
Sydney-to-Hobart Yacht Race CommitteeBart Pacheco
Sydney Ports Cargo Facilitation CommitteeMorgan NoonJenny Jones
Sydney Ports Security CommitteeMurray FoxShane HobdaySarah HartsonKim BaileyJim PullinJenny JonesBart Pacheco
Sydney Ports Users Consultative GroupGreg MartinSimon BarneyPhil Rosser
The Export Centre Management Committee Gerry McCormack
The Missions to Seafarers Greg Martin DirectorShane Hobday Director
White Bay/Glebe Island Noise Reference CommitteeLisa Smith ChairmanPolly BennettChrista Sams
Staff who are Members of External Committees continued

Syd
ney P
orts C
orp
ora
tion
Annual R
eport 2004
122
AAPMA Association of Australian Port and Marine Authorities
AAT Australian Amalgamated Terminals Pty Ltd
AMS Australian Maritime Services
AMOU Australian Maritime Officer’s Union
APESMA Association of Professional Engineers, Scientists and Managers Australia
ARTC Australian Rail Track Corporation
AQIS Australian Quarantine Inspection Service
BLB Bulk Liquids Berth
BRSG Botany Rail Steering Group
CEO Chief Executive Officer
COI Commission of Inquiry
CPI Consumer Price Index
DG’s Dangerous Goods
DIPNR Department of Infrastructure, Planning and Natural Resources
EDI Electronic Data Interchange
EIS Environmental Impact Statement
GT Gross Tonne
ha hectares
IAPH International Association of Ports and Harbors
ISPS International Ship and Port Facility Security Code
IT Information Technology
M million/millions
MUA Maritime Union of Australia
MIFS/MFS Metropolitan Intermodal Freight Strategy
NSW New South Wales (Eastern State of Australia)
NOPAT Net Operating Profit After Tax
OH&S Occupational Health and Safety
PIANC Permanent International Association of Navigation Congresses (International Navigation Association)
PSOL Port Safety Operating Licence
RTA Roads and Traffic Authority
RIC Rail Infrastructure Corporation
SCI Statement of Corporate Intent
ShIPS Sydney’s Integrated Port System
SPS Sydney Pilot Service Pty Ltd
SPUCG Sydney Ports Users Consultative Committee
SVA Shareholder Value Added
Sydney Harbour The commercial port areas of Glebe Island and White Bay, Darling Harbour, and the overseas passenger Terminal at Circular Quay (formally know as Port Jackson)
TCC Transport Co-ordination Committee
TEU/TEUs Twenty-foot equivalent unit
Glossary

Copyright © 2004 Sydney Ports Corporation. All rights reserved.
Disclaimer The information contained in this publication is produced in good faith and according to the knowledge available to Sydney Ports Corporation at the time of publication. No warranty is given or representation made as to its accuracy.
Principal office and address Level 8, 207 Kent Street Sydney NSW 2000 Australia
Postal addressPO Box 25, Millers PointNSW 2000 Australia
Telephone 612 9296 4999Facsimile 61 2 9296 [email protected]
ABN 95 784 452 933


![Legislation Review Committee · Parliament. Legislative Assembly. Legislation Review Committee Legislation Review Digest, Legislation Review Committee, Parliament NSW [Sydney, NSW]:](https://static.fdocuments.us/doc/165x107/5f9c6bc6de302b4245453c3b/legislation-review-committee-parliament-legislative-assembly-legislation-review.jpg)