ANNUAL REPORT - Zeta...
36
2017 ANNUAL REPORT
-
Upload
truongdung -
Category
Documents
-
view
214 -
download
1
Transcript of ANNUAL REPORT - Zeta...
2017 ANNUAL REPORT
1
CONTENTS
OVERVIEW AND PERFORMANCE
4 Group Performance Summary5 Chairman’s Statement
STRATEGIC REPORT AND INVESTMENTS
6 Investment Manager’s Report15 MacroTrendsAffectingResources16 Sector Summaries21 ICM Investment Philosophy22 Investment Manager and Team23 Geographical and Sector Split of Investments24 Five Largest Holdings25 Review of the Five Largest Holdings
GOVERNANCE
28 Directors29 Report of the Directors35 Corporate Governance Statement
FINANCIAL STATEMENTS
36 Independent Auditor’s Report39 Auditor’s Independence Declaration40 Financial Statements44 Notes to the Financial Statements
OTHER
64 Additional ASX Information66 Company Information
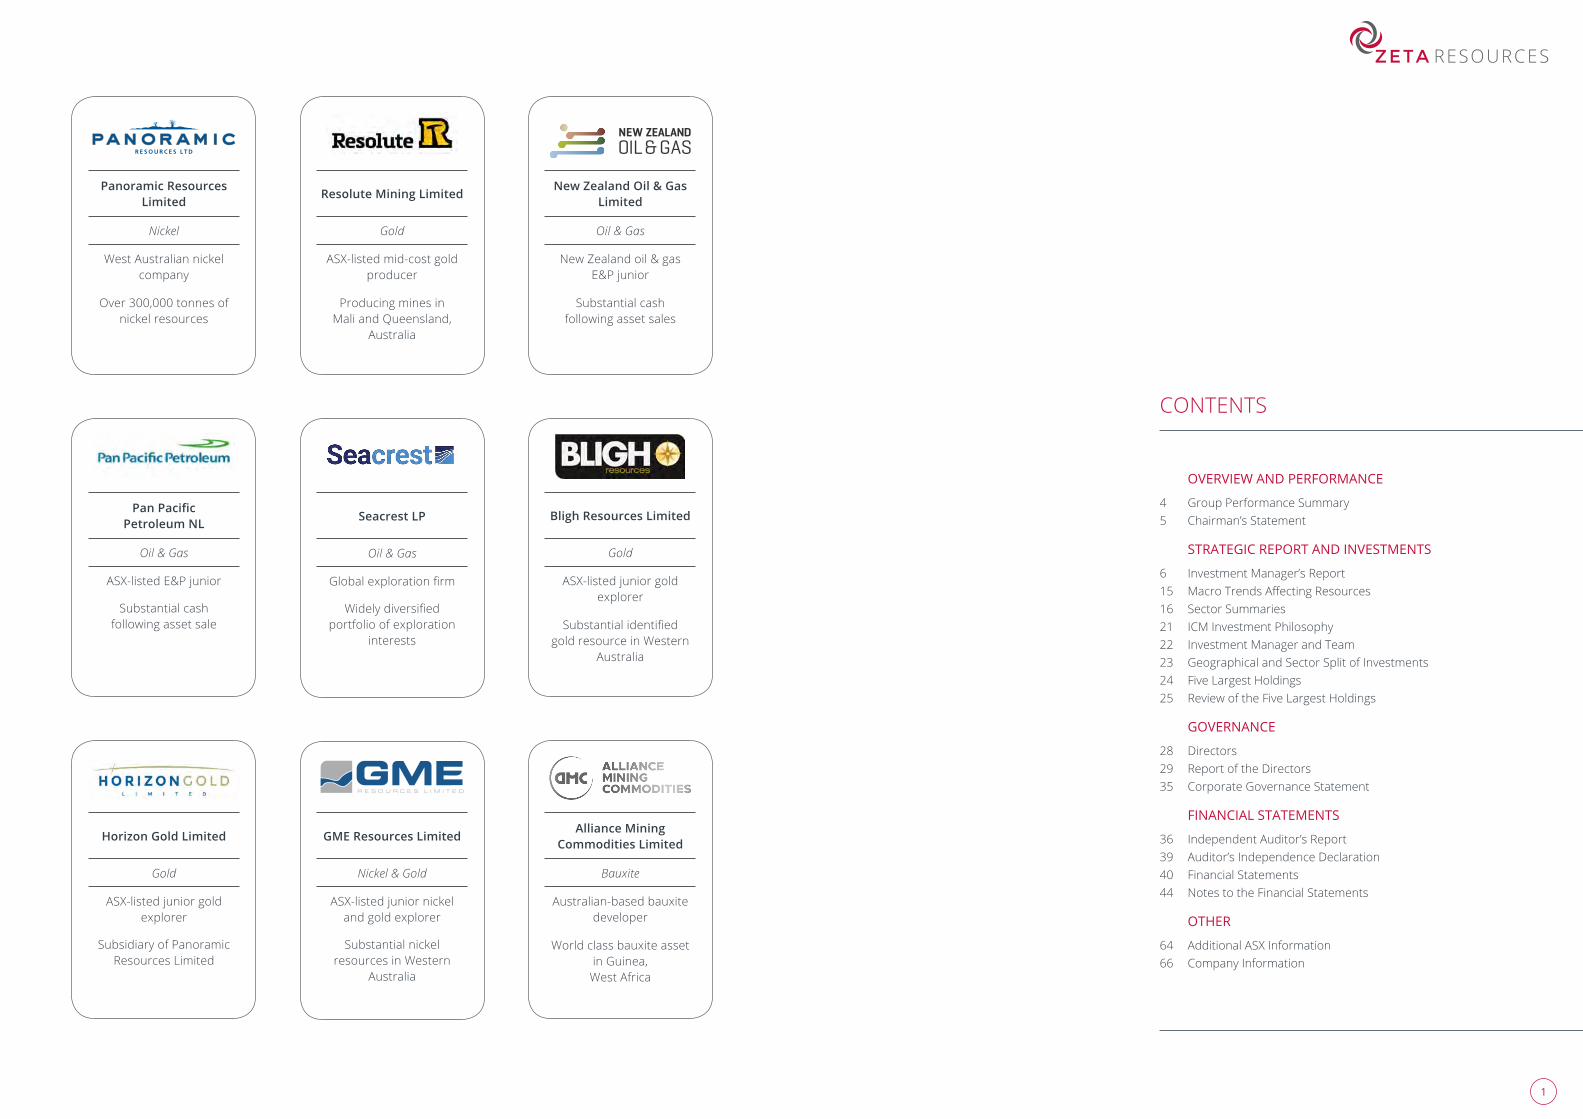
Pan Pacific Petroleum NL
Oil & Gas
ASX-listed E&P junior
Substantial cash following asset sale
Seacrest LP
Oil & Gas
Globalexplorationfirm
Widelydiversifiedportfolio of exploration
interests
Resolute Mining Limited
Gold
ASX-listed mid-cost gold producer
Producing mines in Mali and Queensland,
Australia
New Zealand Oil & Gas Limited
Oil & Gas
New Zealand oil & gas E&P junior
Substantial cash following asset sales
Panoramic Resources Limited
Nickel
West Australian nickel company
Over 300,000 tonnes of nickel resources
Bligh Resources Limited
Gold
ASX-listed junior gold explorer
Substantialidentifiedgold resource in Western
Australia
Horizon Gold Limited
Gold
ASX-listed junior gold explorer
Subsidiary of Panoramic Resources Limited
GME Resources Limited
Nickel & Gold
ASX-listed junior nickel and gold explorer
Substantial nickel resources in Western
Australia
Alliance Mining Commodities Limited
Bauxite
Australian-based bauxite developer
World class bauxite asset in Guinea,
West Africa
32
NATURE OF THE COMPANY
Zeta Resources Limited (“Zeta”) is a closed-end investment company, whose ordinary shares are listed on the Australian Stock Exchange (“ASX”). The business of the company consists of investing the pooled funds of its shareholders in accordance with its investment objective and policy, with the aim of generating a return for shareholders with an acceptable level of risk. The company has borrowings (“gearing”), the proceeds from which can also be invested with the aim of enhancing returns to shareholders. This gearing increases the potential risk to shareholders should the value of the investments fall.
The company has contracted with an external investment manager, ICM Limited (the “Investment Manager” or “ICM”), to manage its investments and undertake the company secretarial function. The company’s general administration is undertaken by ICM Corporate Services (Pty) Ltd. The company has a board of non-executive directors who oversee and monitor the activities of the Investment Manager and the other service providers and ensure that the investment policy is adhered to.
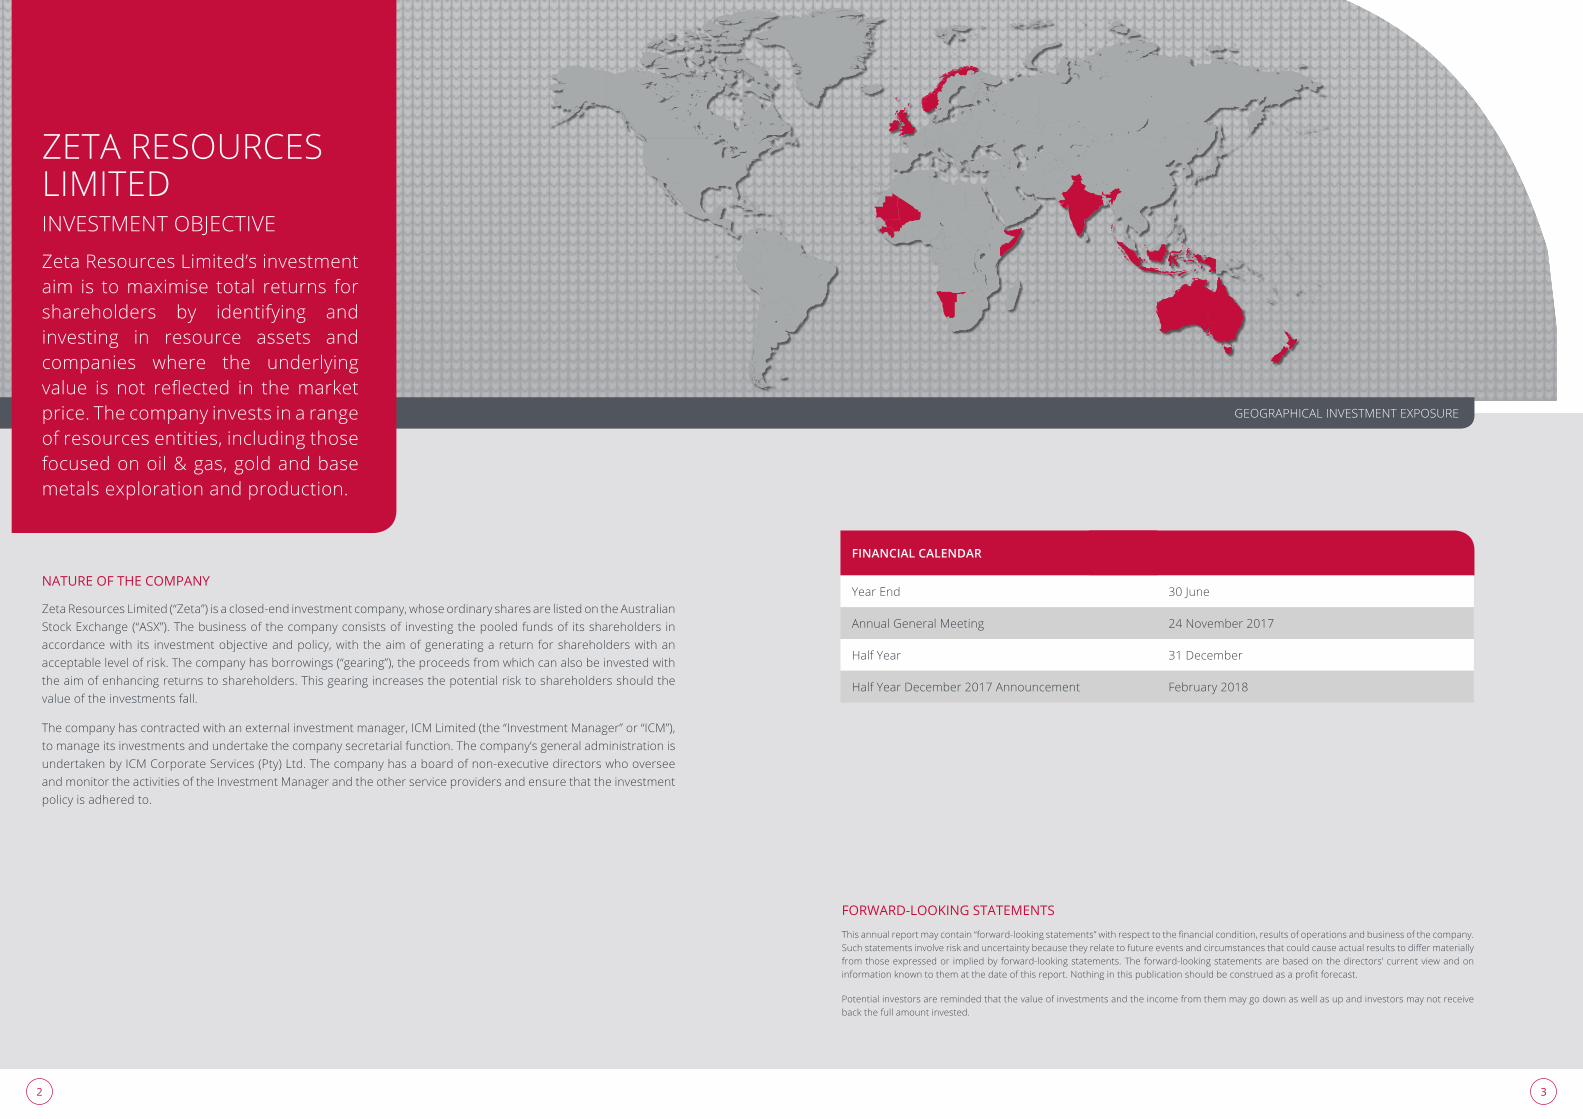
ZETA RESOURCES LIMITEDINVESTMENT OBJECTIVE
Zeta Resources Limited’s investment aim is to maximise total returns for shareholders by identifying and investing in resource assets and companies where the underlying value is not reflected in themarketprice. The company invests in a range of resources entities, including those focused on oil & gas, gold and base metals exploration and production.
GEOGRAPHICAL INVESTMENT EXPOSURE
FORWARD-LOOKING STATEMENTS
Thisannualreportmaycontain“forward-lookingstatements”withrespecttothefinancialcondition,resultsofoperationsandbusinessofthecompany.Suchstatementsinvolveriskanduncertaintybecausetheyrelatetofutureeventsandcircumstancesthatcouldcauseactualresultstodiffermateriallyfrom those expressed or implied by forward-looking statements. The forward-looking statements are based on the directors’ current view and on informationknowntothematthedateofthisreport.Nothinginthispublicationshouldbeconstruedasaprofitforecast.
Potential investors are reminded that the value of investments and the income from them may go down as well as up and investors may not receive back the full amount invested.
FINANCIAL CALENDAR
Year End 30 June
Annual General Meeting 24 November 2017
Half Year 31 December
Half Year December 2017 Announcement February 2018
54
Zeta Resources LimitedAnnual Report for the year to 30 June 2017
Zeta Resources LimitedAnnual Report for the year to 30 June 2017
CHAIRMAN’S STATEMENTGROUP PERFORMANCE SUMMARY
I’m pleased to report that commodity prices have performed much better to date in 2017. ZetahasbenefitedfromthisupturnwithastrongreportedprofitofUS$10.3m,validatingitslongtermapproachtoresourceinvestment.Whilewecannotcontrolshorttermfluctuationsin prices, we believe that long term demand for commodities will remain intact.
With a largely stable platform of investments in oil & gas, gold, nickel, and a growing presence in copper, Zeta has worked hard during the year to add value to its existing investments as well as initiate new positions.
In April, Zeta launched a takeover offer for Bligh Resources Limited (“Bligh”). The strategicrationale was to gain control of a quality gold asset, in close geographical proximity to existing processing infrastructure. While a competitive process, the takeover was successful, delivering Zeta a 86% stake in Bligh.
InJune,PanPacificPetroleumNL(“PPP”)andZetaannouncedthattheyhadenteredintoascheme of arrangement, under which Zeta will acquire all of the issued share capital of PPP that it does not already own. With PPP having sold its oil & gas assets and becoming essentially a cash box, the rationale for the scheme is to consolidate PPP into Zeta, thus reducing costs, and enabling the cash in PPP to be put to more productive use within Zeta. Under the scheme, PPP shareholders will be able to elect to receive either cash or Zeta shares in exchange for their shares in PPP, and it’s my hope that many will choose to join us as shareholders in Zeta.
After thebalancedate, inAugust,Zetamadeapartial takeoverofferpursuant to theNewZealand Takeovers Code, to acquire 50.01% of the shares in New Zealand Oil & Gas Limited (“NZOG”).Ifsuccessful,theofferwillresultinZetaholdingacontrollingstakeinNZOG.LikePPP,NZOGhassoldthemajorityofitsoil&gasassets.Zeta’saimistosignificantlyreducecostsatNZOG, and seek to better use of the cash sitting idle in NZOG, including returning a substantial portion of it to shareholders.
In addition to the above, Zeta supported the spin-out by Panoramic Resources Limited (“Panoramic”) of its gold subsidiary in the form of an IPO of Horizon Gold Limited. Zeta invested in the IPO,andretainsbothPanoramicasa top-fiveholding,andHorizonGoldasasmallerinvestment.
The increased focus on lithium-ion batteries has driven a speculative rush in battery related metals. I would note that while Zeta does not have any exposure to lithium, it does have significantinvestmentsinnickelandcobalt,bothimportantcomponentsofthemostpopulartypes of lithium-ion batteries, and recently it made a modest investment in a graphite company. We will continue to monitor developments in this sector closely.
OurmajorshareholderUILLimitedhasbeenasignificantfactorinourgrowthtodate.DuringtheyearwetookadvantageofcashinflowstoreduceourlevelofdebttoUIL,althoughwewillbe relying on further support as we complete a number of the new initiatives mentioned above.
With the above developments, Zeta’s portfolio, while still relatively concentrated, has broadened. We intend forZeta to remaina concentrated rather thanadiversified investor in thebeliefthatitisbettertohaveathoroughunderstandingofandinfluentialinvolvementwithinvesteecompanies, rather than a commitment to simple risk dissipation through diversity of holdings.
Peter Sullivan Chairman 12 September 2017
Zeta has worked hard during the year to add value to its existing investments as well as initiate new positions
30 JUNE 2017
30 JUNE 2016
CHANGE % 2017/16
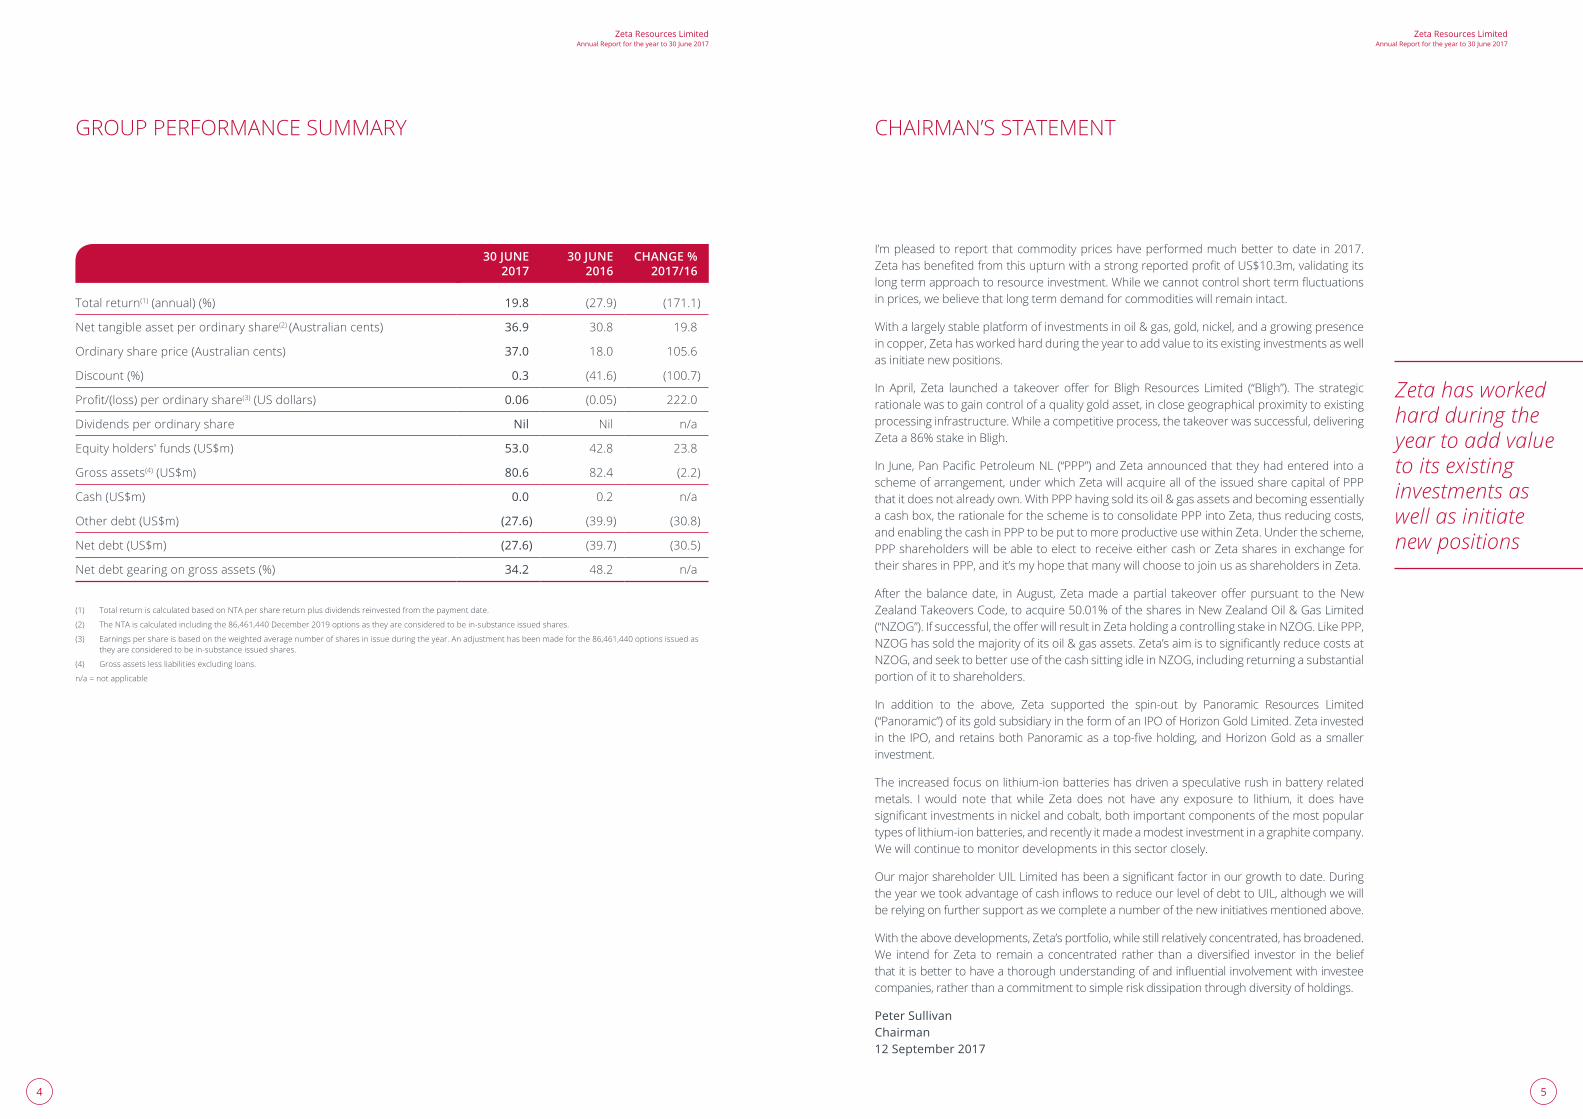
Total return(1) (annual) (%) 19.8 (27.9) (171.1)
Net tangible asset per ordinary share(2) (Australian cents) 36.9 30.8 19.8
Ordinary share price (Australian cents) 37.0 18.0 105.6
Discount (%) 0.3 (41.6) (100.7)
Profit/(loss)perordinaryshare(3) (US dollars) 0.06 (0.05) 222.0
Dividends per ordinary share Nil Nil n/a
Equityholders'funds(US$m) 53.0 42.8 23.8
Gross assets(4)(US$m) 80.6 82.4 (2.2)
Cash(US$m) 0.0 0.2 n/a
Otherdebt(US$m) (27.6) (39.9) (30.8)
Netdebt(US$m) (27.6) (39.7) (30.5)
Net debt gearing on gross assets (%) 34.2 48.2 n/a
(1) Total return is calculated based on NTA per share return plus dividends reinvested from the payment date.
(2) The NTA is calculated including the 86,461,440 December 2019 options as they are considered to be in-substance issued shares.
(3) Earnings per share is based on the weighted average number of shares in issue during the year. An adjustment has been made for the 86,461,440 options issued as they are considered to be in-substance issued shares.
(4) Gross assets less liabilities excluding loans.
n/a=notapplicable
76
Zeta Resources LimitedAnnual Report for the year to 30 June 2017
Zeta Resources LimitedAnnual Report for the year to 30 June 2017
INVESTMENT MANAGER’S REPORT
Thetwelvemonthsunderreviewhaveshownageneralsimilaritytothepreviousyear.Asidefromgold,thefirstsixmonths to the end of December 2016 was characterised by a general decline in commodity prices. The subsequent six months has seen a general recovery, most latterly helped by weakness in the US dollar. Overall, the twelve months has ended up with prices somewhat lower than the start of the period. Zeta’s fortunes have largely mirrored that of the commodity markets, albeit with greater relative changes given the company’s leveraged balance sheet.
ThefirsthalfofthefinancialyearunderreviewwasnotableforcontinuingthedeclineinthepriceofAustraliandollarsagainstUS dollars that occurred in the previous year, thus boosting the profitability of Australianminerswhoseexport prices were denominated in US dollars. In the second half of the year under review, the Australian dollar strengthened against the US dollar, thus reversing some of these earlier gains.
Whereas commodity prices generally ended the twelve months to 30 June 2017 close to where they started, Zeta’s investments were overall higher than at the start. During the year under review, Zeta’s net assets per share rose fromA$0.308toA$0.369,ariseof19.8%.Forcomparison,theS&P/ASX200Energyindexrose6.0%overthesameperiod,andtheS&P/ASX300Metals&Miningindex,whichincludesgoldminingstocks,rose24.1%.Zeta’ssharepricedoubled,rising105.6%toA$0.37.Atthestartoftheperiodthesharepricewasata41.6%discounttonetassets,atthe end of the period the share price was at a modest 0.3% premium to net assets.
TOTAL RETURN COMPARATIVE PERFORMANCE*since inception on 12 June 2013 to 30 June 2017
180.0
160.0
140.0
120.0
100.0
80.0
60.0
40.0
20.0Jun 13 Dec 13 Jun 14 Dec 14 Jun 15 Dec 15 Jun 16 Dec 16 Jun 17 Dec 17
Zeta Share Price S&P/ASX 200 Energy S&P/ASX 300 Metals & Mining
*AUD, rebased to 100 as at 12 June 2013. Zeta NTA adjusted for February 2014 entitlement issue.
Source: ICM and S&P Dow Jones Indices
COMMODITY MARKETS
As noted, the year under review saw modest declines in the prices of oil, nickel and gold. The price of copper, however,finishedtheyearhigherthanwhereitstarted.
Oil & Gas
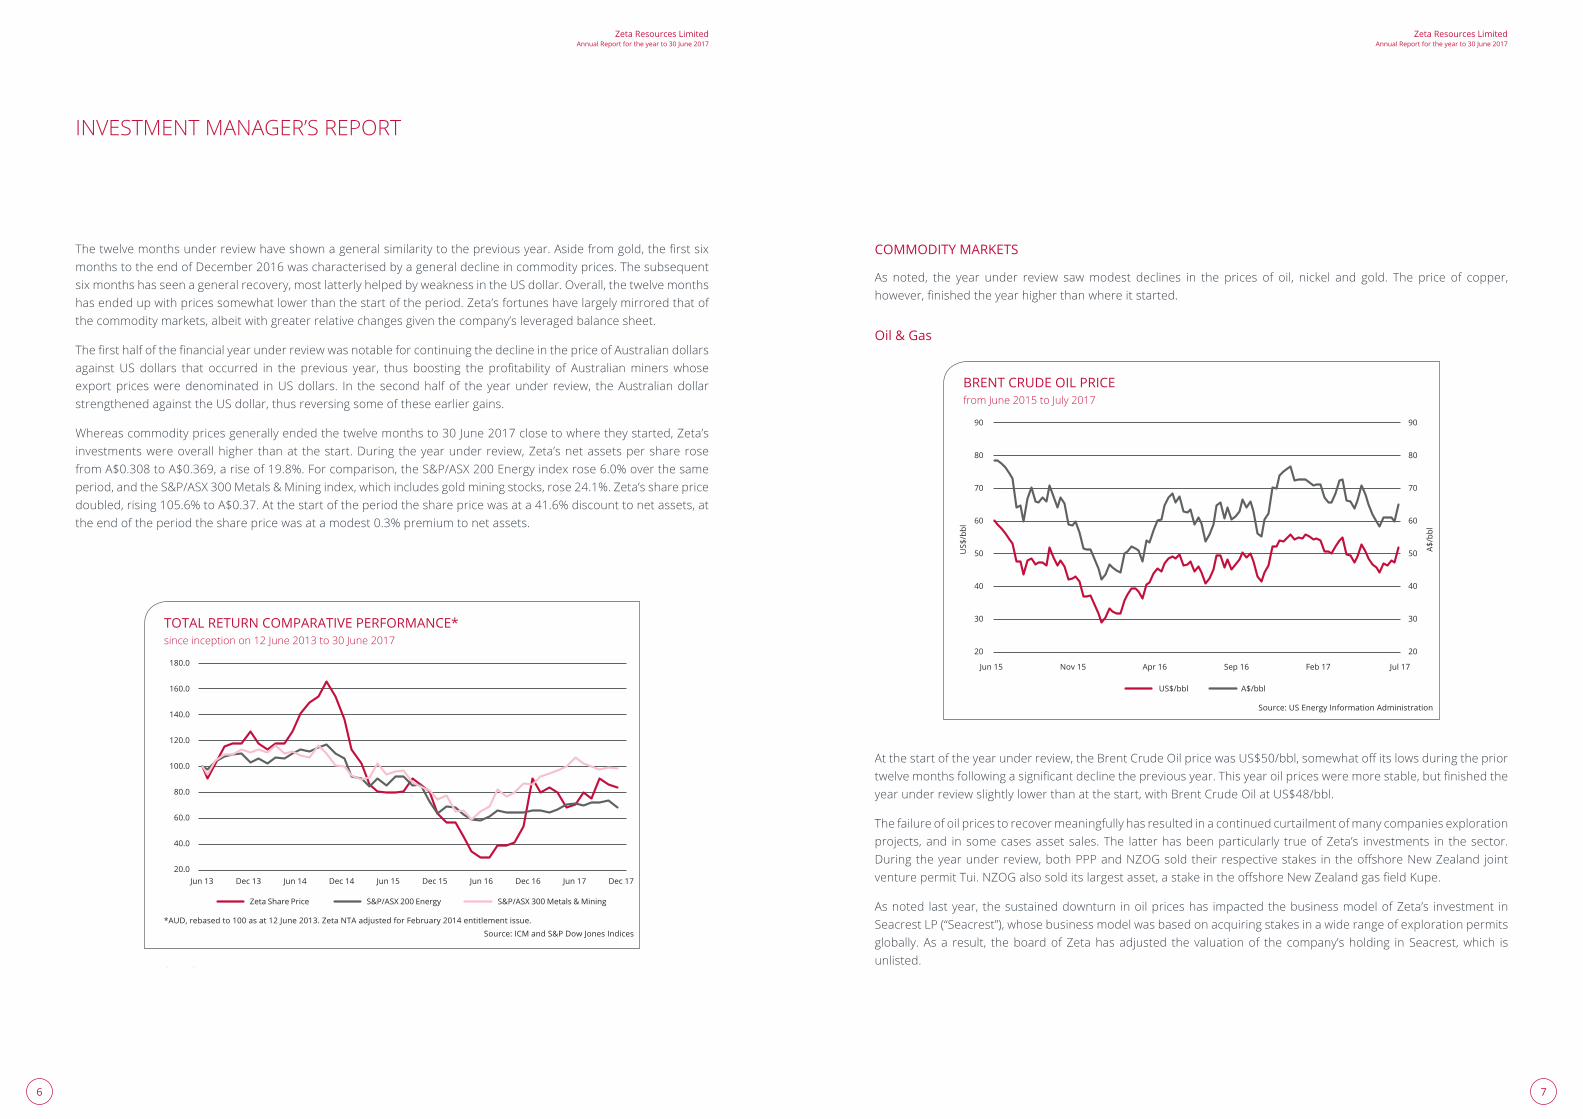
Atthestartoftheyearunderreview,theBrentCrudeOilpricewasUS$50/bbl,somewhatoffitslowsduringthepriortwelvemonthsfollowingasignificantdeclinethepreviousyear.Thisyearoilpricesweremorestable,butfinishedtheyearunderreviewslightlylowerthanatthestart,withBrentCrudeOilatUS$48/bbl.
The failure of oil prices to recover meaningfully has resulted in a continued curtailment of many companies exploration projects, and in some cases asset sales. The latter has been particularly true of Zeta’s investments in the sector. Duringtheyearunderreview,bothPPPandNZOGsoldtheirrespectivestakes intheoffshoreNewZealand jointventurepermitTui.NZOGalsosolditslargestasset,astakeintheoffshoreNewZealandgasfieldKupe.
As noted last year, the sustained downturn in oil prices has impacted the business model of Zeta’s investment in Seacrest LP (“Seacrest”), whose business model was based on acquiring stakes in a wide range of exploration permits globally. As a result, the board of Zeta has adjusted the valuation of the company’s holding in Seacrest, which is unlisted.
BRENT CRUDE OIL PRICEfrom June 2015 to July 2017
Jun 15 Nov 15 Apr 16 Sep 16 Feb 17 Jul 17
US$/bbl A$/bbl
Source: US Energy Information Administration
90
80
70
60
50
40
30
20
90
80
70
60
50
40
30
20
US$
/bbl
A$/b
bl
98
Zeta Resources LimitedAnnual Report for the year to 30 June 2017
Zeta Resources LimitedAnnual Report for the year to 30 June 2017
Nickel
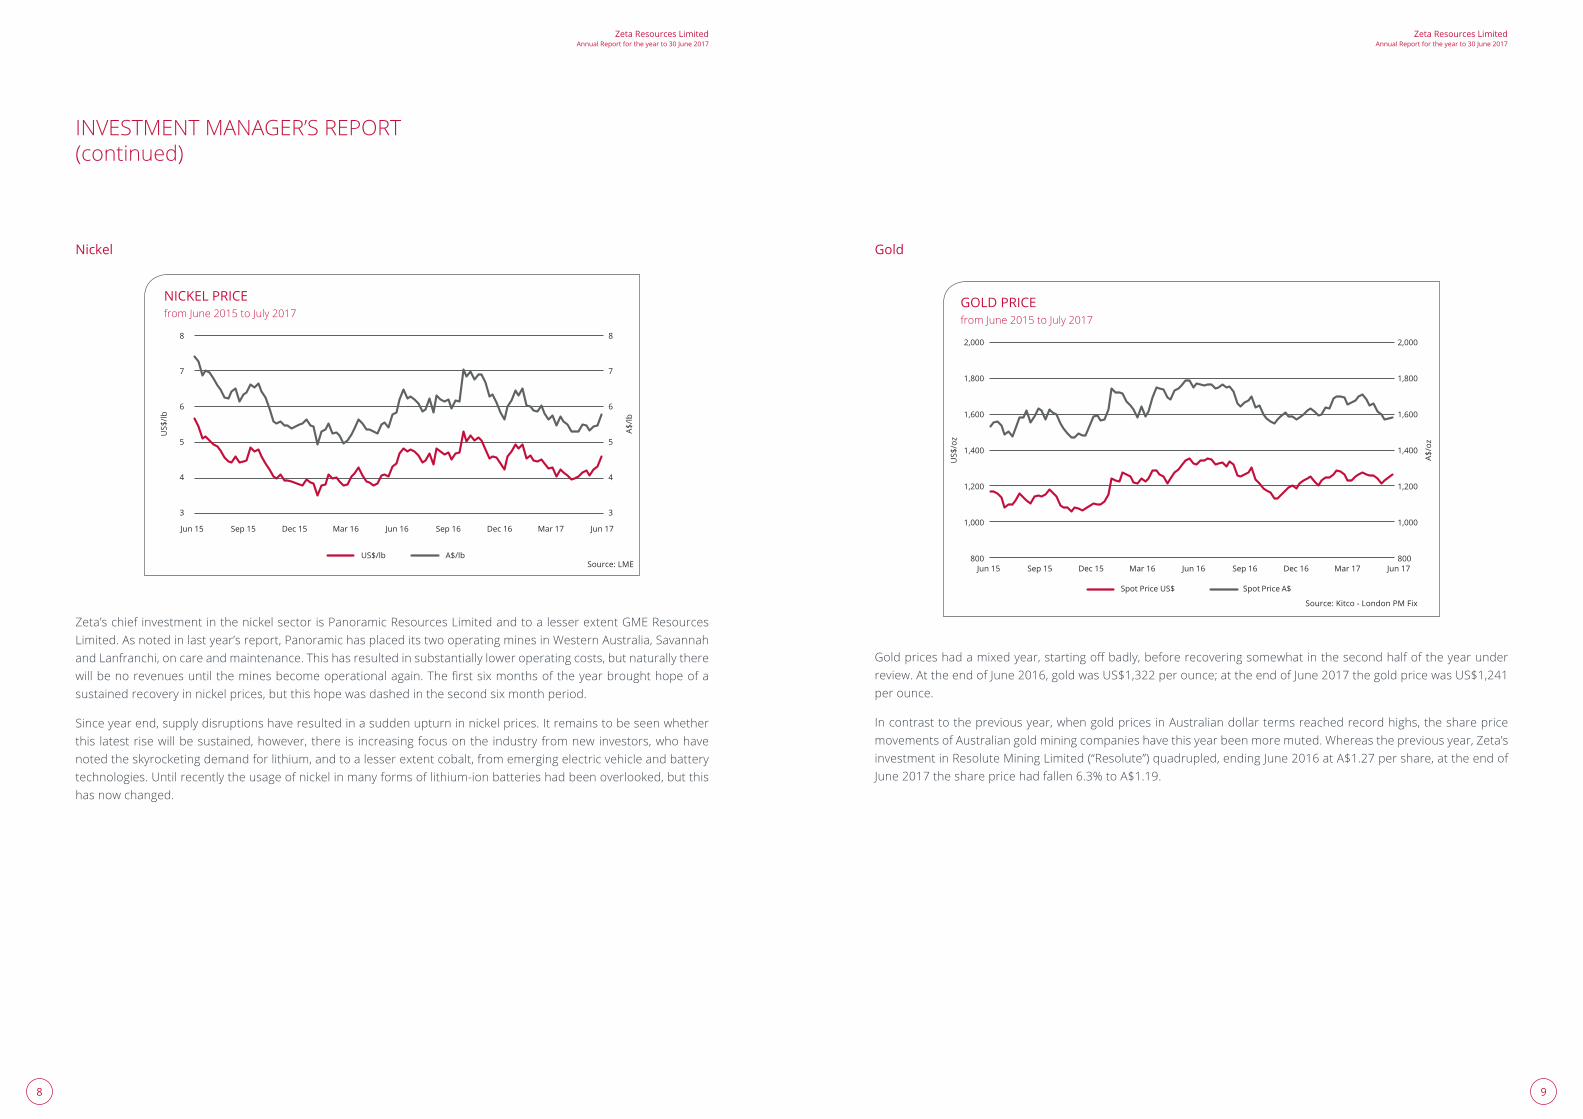
Zeta’s chief investment in the nickel sector is Panoramic Resources Limited and to a lesser extent GME Resources Limited. As noted in last year’s report, Panoramic has placed its two operating mines in Western Australia, Savannah and Lanfranchi, on care and maintenance. This has resulted in substantially lower operating costs, but naturally there willbenorevenuesuntiltheminesbecomeoperationalagain.Thefirstsixmonthsoftheyearbroughthopeofasustained recovery in nickel prices, but this hope was dashed in the second six month period.
Since year end, supply disruptions have resulted in a sudden upturn in nickel prices. It remains to be seen whether this latest rise will be sustained, however, there is increasing focus on the industry from new investors, who have noted the skyrocketing demand for lithium, and to a lesser extent cobalt, from emerging electric vehicle and battery technologies. Until recently the usage of nickel in many forms of lithium-ion batteries had been overlooked, but this has now changed.
NICKEL PRICEfrom June 2015 to July 2017
US$/lb A$/lbSource: LME
Jun 15 Sep 15 Mar 16 Jun 16 Dec 16 Jun 17Mar 17Sep 16Dec 15
8
7
6
5
4
3
US$
/lb
A$/lb
8
7
6
5
4
3
Gold
Goldpriceshadamixedyear,startingoffbadly,beforerecoveringsomewhatinthesecondhalfoftheyearunderreview.AttheendofJune2016,goldwasUS$1,322perounce;attheendofJune2017thegoldpricewasUS$1,241per ounce.
In contrast to the previous year, when gold prices in Australian dollar terms reached record highs, the share price movements of Australian gold mining companies have this year been more muted. Whereas the previous year, Zeta’s investmentinResoluteMiningLimited(“Resolute”)quadrupled,endingJune2016atA$1.27pershare,attheendofJune2017thesharepricehadfallen6.3%toA$1.19.
GOLD PRICEfrom June 2015 to July 2017
Spot Price US$ Spot Price A$
Source: Kitco - London PM Fix
Jun 15 Sep 15 Mar 16 Jun 16 Dec 16 Jun 17Mar 17Sep 16Dec 15
2,000
1,800
1,600
1,400
1,200
1,000
800
US$
/oz
A$/o
z
2,000
1,800
1,600
1,400
1,200
1,000
800
INVESTMENT MANAGER’S REPORT(continued)

1110
Zeta Resources LimitedAnnual Report for the year to 30 June 2017
Zeta Resources LimitedAnnual Report for the year to 30 June 2017
Copper
Thesix-yearbearmarketforcoppercametoanendintheyearunderreview.HavingfinishedJune2016atUS$2.19perpound,thepriceofcopperjumpedinOctober,andendedJune2017atUS$2.68perpound.Sincethenthepriceof copper has risen further, partly due to weakness in the US dollar, to increased industrial demand, and to increased scrutiny of the likely impact on demand that the emergence of electric vehicles will have on copper respectively. A report issued by UBS in May 2017 noted that a typical electric vehicle is likely to use 91kg of copper in its battery and wiring, vs. 50kg in a comparable traditional internal combustion engine car. During the year under review, Zeta has slowly increased its portfolio investment in copper.
COPPER LME PRICEfrom June 2015 to July 2017
US$/lb A$/lb
Source: Kitco - LME
4.00
3.50
3.00
2.50
2.00
1.50
US$
/lb
A$/lb
4.00
3.50
3.00
2.50
2.00
1.50
Jun 15 Dec 15 Dec 16 Jun 17Jun 16 Mar 17Sep 16Mar 16Sep 15
CAPITAL STRUCTURE
Zeta is a closed-end investment company, listed on the ASX, and was incorporated in Bermuda.
During the year Zeta has had working capital support from its parent company, UIL Limited (“UIL”). As of 30 June 2017, ZetahadaloanfromUILtotallingUS$22.3million,drawninAustraliandollars.
Asat30 June2017,ZetahadgrossassetsofUS$80.9million (2016:US$83.0million).Ofthisfigure,$30.4million(2016:$39.6million)wasinvestedintheoil&gassector;$24.1million(2016:$10.4million)wasinvestedinthenickelandcoppersectors;and$26.4million(2016:$32.7million)wasinvestedinthegoldsector.
1.20
1.00
0.80
0.60
0.40
0.20
0.00
Shar
e pr
ice
(A$)
NTA PER SHARE VERSUS SHARE PRICEsince inception on 12 June 2013 to June 2017
Source: ICM
1.20
1.00
0.80
0.60
0.40
0.20
0.00
NTA
per
sha
re (A
$)
Jun 13 Dec 13 Dec 14 Jun 15 Jun 16 Jun 17Dec 16Dec 15Jun 14
Listed Unlisted Kumarina Closing Share Price
INVESTMENT MANAGER’S REPORT(continued)

1312
Zeta Resources LimitedAnnual Report for the year to 30 June 2017
Zeta Resources LimitedAnnual Report for the year to 30 June 2017
FINANCIAL RESULTS
ThenetprofitaftertaxfortheyearwasUS$10,277,906againstalossofUS$6,974,491intheyearendedJune2016.Themajorityoftheconsolidatednetprofitwascomprisedofrealisedgainsfromsalesordistributionsfromlistedinvestments.
SIGNIFICANT INVESTMENTS
Oil & GasNew Zealand Oil & Gas
TheyearunderreviewwasoneofsignificantchangeforNZOG.Thecompanysolditstwooperationalassets:itsjointventurestakesinthegasfieldKupeandtheoilfieldTui.TheKupestakewassoldfirst,afterthecompanyreceivedanunsolicitedofferataprice inexcessofNZOG’s thencurrentmarketcapitalisationand thecompany’s internalvaluation. The Tui stakewas sold later,with themain benefit toNZOGnot being the sales price, but rather theremovaloftherisktothecompanyaroundtheneartermcostoffieldabandonment,giventhatTuiisnearingtheendofitsproductionlife.Asnotedabove,ZetalaunchedapartialtakeoverforNZOGinAugust2017.Shouldtheofferbesuccessful, it will result in Zeta’s ownership of NZOG rising from 17% to 50%.
Pan Pacific Petroleum
PPPalsohadsignificantchangeduringtheyearunderreview.LikeNZOG,PPPsolditsstakeintheTuioilfieldjointventure to the same purchaser that bought the NZOG stake. Later in the year, PPP sold its assets in Vietnam to one of its joint venture partners. Aside from an outstanding dispute, and thus potential liability, the company does not have any current exposure to oil & gas. In June 2017, PPP and Zeta announced that they had executed a scheme implementation agreement, with the aim of merging the two companies via a court approved scheme of arrangement. ZetahasofferedPPPshareholdersachoiceofcashorZetasharesinexchangefortheirPPPshares.
Seacrest
Seacrestisaspecialistoil&gasoffshoreseismicexplorationcompany.Seacrestmovedquicklytoamassasignificantnumberofgeographicallydiversifiedinterestsinjointventurelicensesforoffshoreoilexploration,buthassufferedalossinvalueinthewakeofthesignificantandsustainedfallinthepriceofoilandanumberofdisappointingdrillingresults. Seacrest’s operational interests are now at varying stages, but some are moving forward with drilling.
NickelPanoramic
Panoramic is a Western Australian mining company that owns two 100%-owned underground nickel sulphide mines, theSavannahProjectintheEastKimberleyandtheLanfranchiProjectnearKambalda,WesternAustralia.Bothminesremainedoncareandmaintenancethroughouttheyearunderreview.PanoramichasworkedtorefineitsfeasibilitystudyfortheresumptionofoperationsatSavannah, includingmodestfielddrilling.Earlier intheyear,PanoramicsuccessfullyspunoffitsgoldassetsintheIPOofHorizonGold.ZetaparticipatedinthecapitalraisingforHorizonGold, and remains a shareholder of both companies.
GoldResolute
ASX-listed Resolute is a mid-cost gold producer with two mines in production, the Syama mine in Mali, and the Ravenswood mine in northern Queensland, Australia, with a third development asset at Bibiani in Ghana.
Production in the year to 30 June 2017 of c. 330,000/oz of gold was up on the previous year’s production of c.315,000/oz.GoldouncesproducedatSyamaincreasedby13.5%to237,830ozinpartduetotheoperationofarefurbished roaster at the end of the previous year that had previously been a bottleneck in the mine’s production. Cashcostsfortheyearroseby8.0%toA$896/oz.AtRavenswoodgoldouncesproducedfellby12.8%to92,004oz;production is expected to gradually decrease as the Mt Wright underground mine reaches the end of its life, and until the Ravenswood expansion project is completed. Cash costs per ounce at Ravenswood increased by 21.2% to A$1,252/oz,inpartduetothelowervolumes.
At30June2017ResolutehadcashandbulliononhandofA$283millionandtotalborrowingsofA$35million.
During the year, Resolute continued development work on the underground mine at Syama. Sublevel cave ore production is expected to commence in December 2018. The Ravenswood expansion project is at the regulatory approvals stage.
Resolutehasprovidedguidanceforgoldproductionof300,000ozatanAll-In-Sustaining-CostofA$1,280/oz(US$960/oz) for the year to 30 June 2017.
Bligh
Bligh Resources is a small Australian gold explorer, which owns the Bundarra Gold Project, which lies within the Norseman-Wiluna greenstone belt of the Archean Yilgarn Craton, approximately 60km north of Leonora in the Eastern GoldfieldsregionofWesternAustralia.ThecompanyalsohasprospectinglicensesforgoldinWesternAustraliaandmanganese in the Northern Territory.
Duringtheyear,ZetalaunchedatakeoverofferforBligh,whichwasultimatelysuccessful,withZetaowningan86%stake in Bligh.
Subsequenttoyearend,BlighannouncedanentitlementoffertoraiseA$1.2m.Blighintendstousetheproceedsfrom theoffer to fundexplorationanddevelopmentat theBundarraGoldProject, reducedebt,and forworkingcapital purposes.
INVESTMENT MANAGER’S REPORT(continued)
1514
Zeta Resources LimitedAnnual Report for the year to 30 June 2017
Zeta Resources LimitedAnnual Report for the year to 30 June 2017
CopperKumarina
KumarinaResourcesPtyLimited(“Kumarina”)isa100%-ownedsubsidiaryofZeta.Thecompanyisfocusedontwoprospective projects in Western Australia, being the Ilgarari copper project and the Murrin Murrin copper-gold project. The Ilgarari project contains a secondary copper oxide resource (JORC 2004) estimated to be 1,100,000 tonnes averaging 1.9% copper located around and below historical mine workings. The Murrin Murrin project is prospective for gold and base metals in the form VMS style copper zinc mineralisation. During the year under review, KumarinaenteredajointventurewithasubsidiaryofGMEResourcestoexploreandpotentiallydeveloptheMurrinMurrinproject.However,GMEgavenoticethatitwaswithdrawingfromthejointventureinJune2017.Kumarina’smain focus is now the Ilgarari copper.
JDF Morrison ICM Limited Investment Manager 12 September 2017
MACRO TRENDS AFFECTING RESOURCES
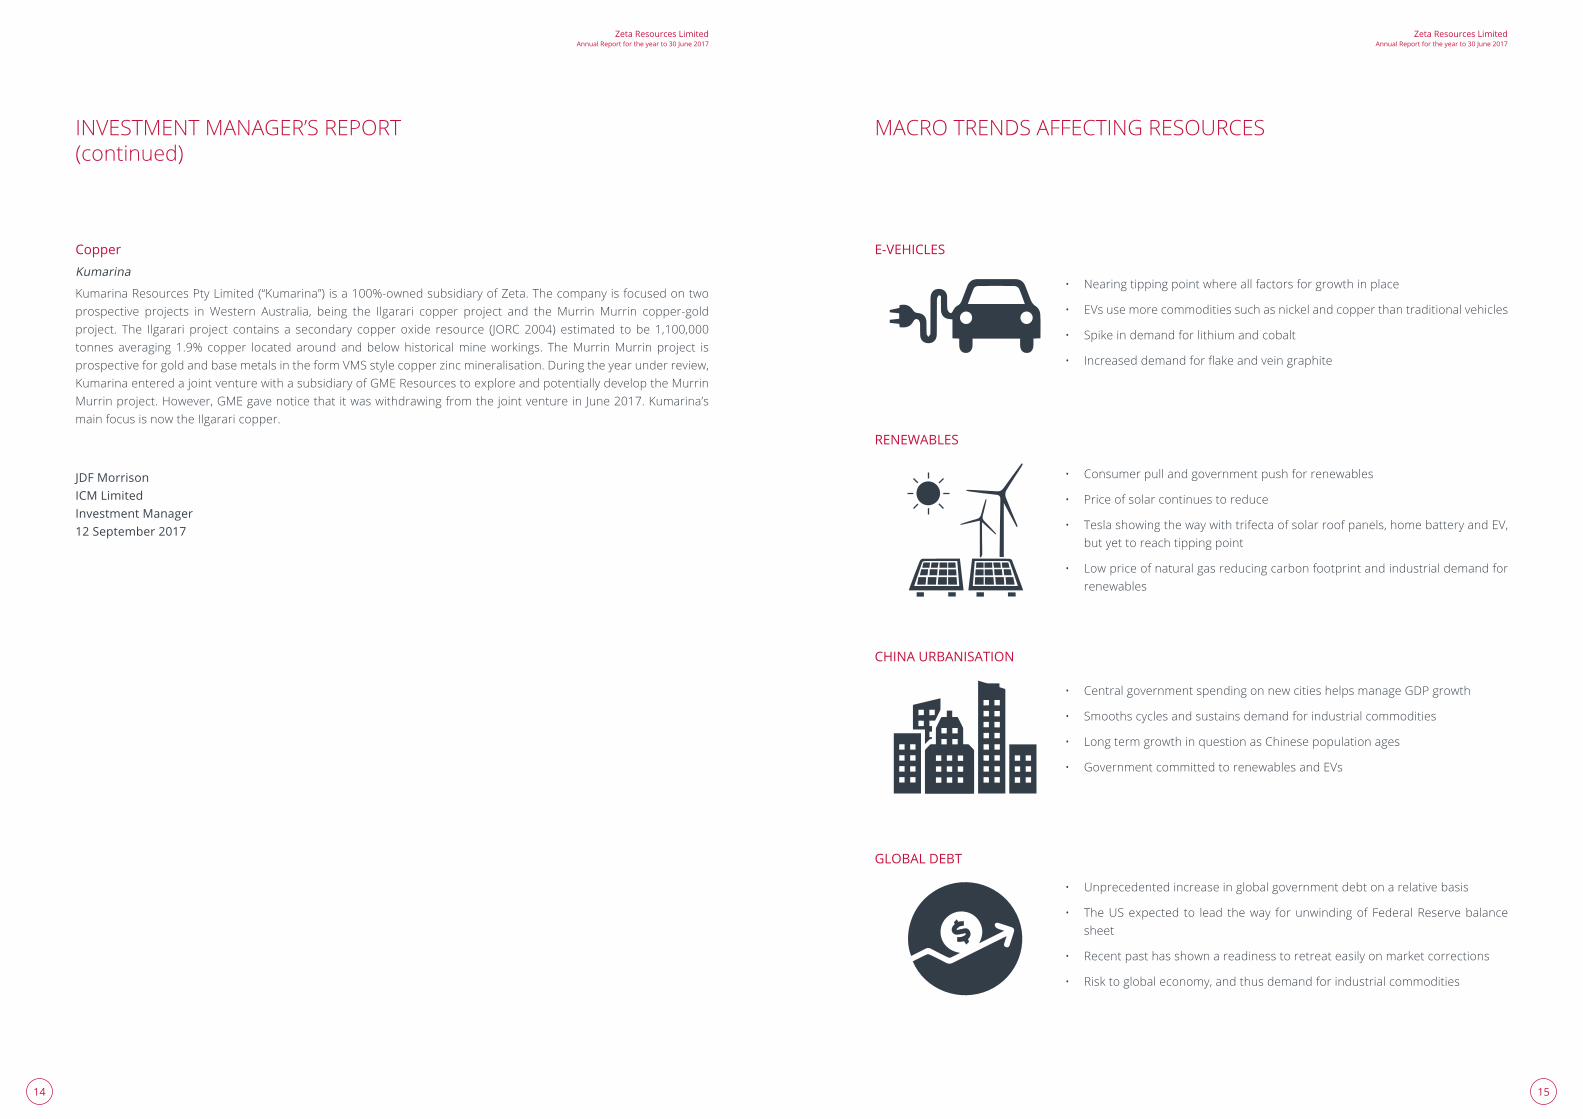
• Unprecedented increase in global government debt on a relative basis
• The US expected to lead the way for unwinding of Federal Reserve balance sheet
• Recent past has shown a readiness to retreat easily on market corrections
• Risk to global economy, and thus demand for industrial commodities
GLOBAL DEBT
• Nearing tipping point where all factors for growth in place
• EVs use more commodities such as nickel and copper than traditional vehicles
• Spike in demand for lithium and cobalt
• Increaseddemandforflakeandveingraphite
E-VEHICLES
• Consumer pull and government push for renewables
• Price of solar continues to reduce
• Tesla showing the way with trifecta of solar roof panels, home battery and EV, but yet to reach tipping point
• Low price of natural gas reducing carbon footprint and industrial demand for renewables
RENEWABLES
• Central government spending on new cities helps manage GDP growth
• Smooths cycles and sustains demand for industrial commodities
• Long term growth in question as Chinese population ages
• Government committed to renewables and EVs
CHINA URBANISATION
INVESTMENT MANAGER’S REPORT(continued)
1716
Zeta Resources LimitedAnnual Report for the year to 30 June 2017
Zeta Resources LimitedAnnual Report for the year to 30 June 2017
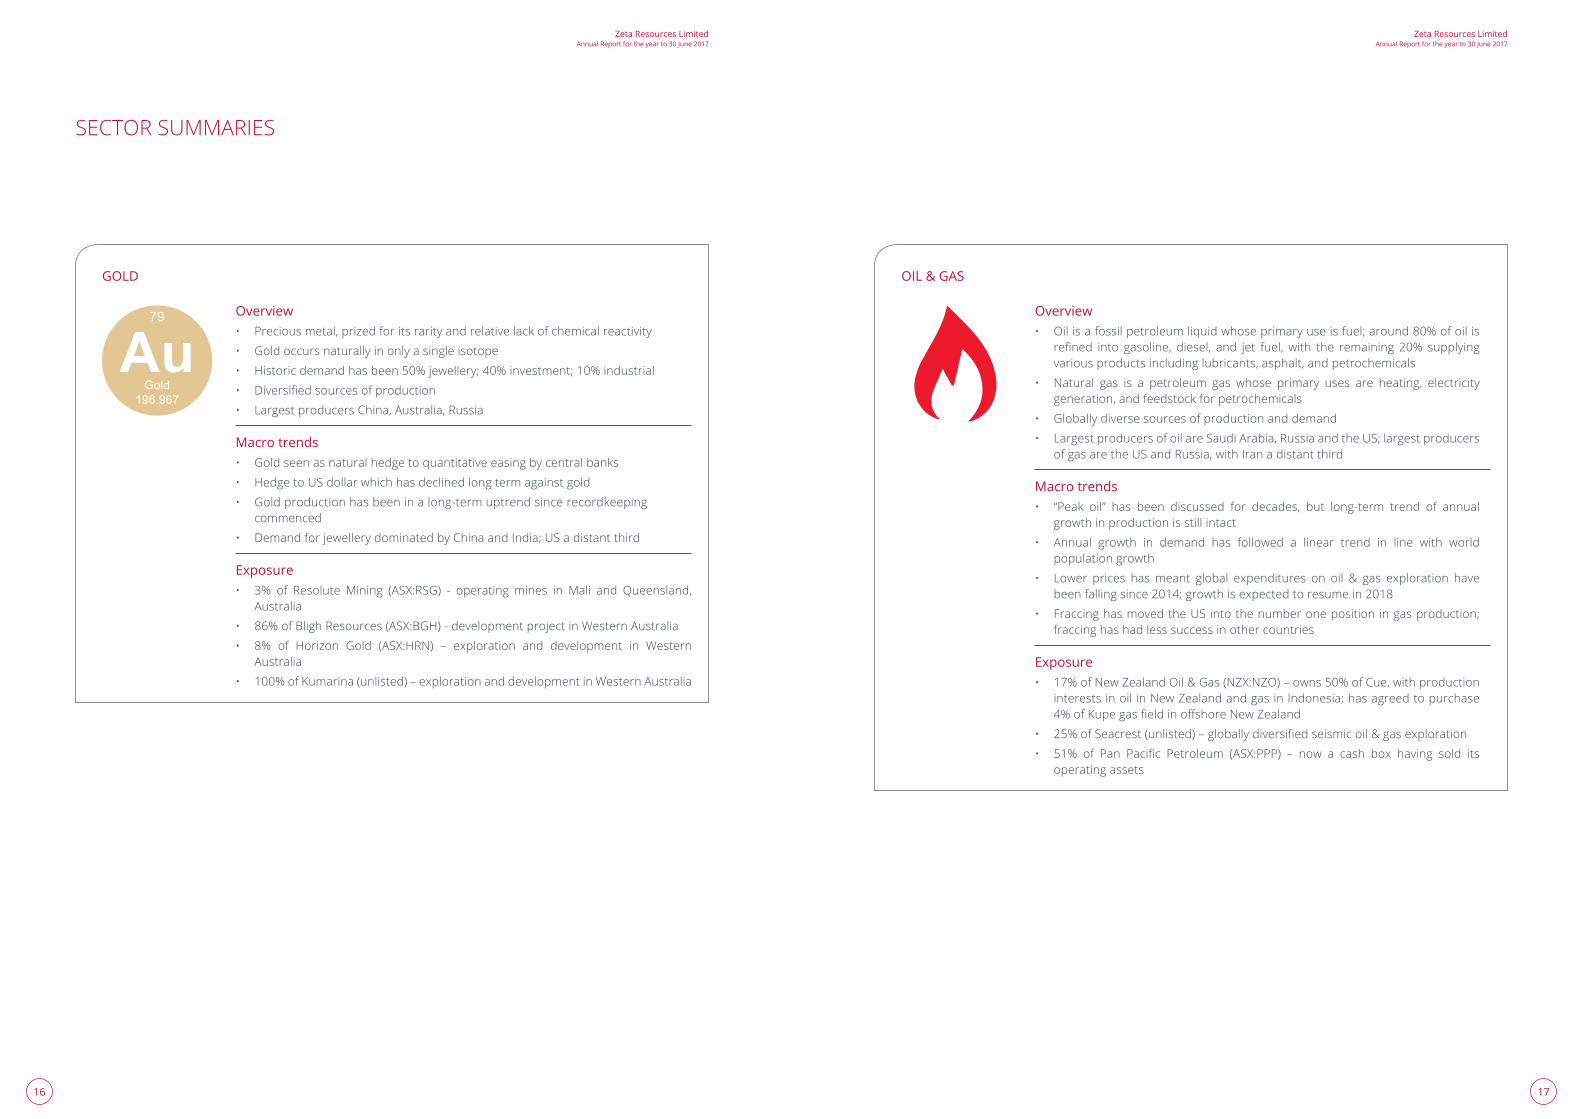
SECTOR SUMMARIES
Overview• Precious metal, prized for its rarity and relative lack of chemical reactivity
• Gold occurs naturally in only a single isotope
• Historicdemandhasbeen50%jewellery;40%investment;10%industrial
• Diversifiedsourcesofproduction
• Largest producers China, Australia, Russia
Macro trends• Gold seen as natural hedge to quantitative easing by central banks
• Hedge to US dollar which has declined long term against gold
• Gold production has been in a long-term uptrend since recordkeeping commenced
• DemandforjewellerydominatedbyChinaandIndia;USadistantthird
Exposure• 3% of Resolute Mining (ASX:RSG) - operating mines in Mali and Queensland,
Australia
• 86%ofBlighResources(ASX:BGH)-developmentprojectinWesternAustralia
• 8% of Horizon Gold (ASX:HRN) – exploration and development in WesternAustralia
• 100%ofKumarina(unlisted)–explorationanddevelopmentinWesternAustralia
GOLD
AuGold
196.967
79 Overview• Oilisafossilpetroleumliquidwhoseprimaryuseisfuel;around80%ofoilis
refined into gasoline, diesel, and jet fuel,with the remaining 20% supplyingvarious products including lubricants, asphalt, and petrochemicals
• Natural gas is a petroleum gas whose primary uses are heating, electricity generation, and feedstock for petrochemicals
• Globally diverse sources of production and demand
• LargestproducersofoilareSaudiArabia,RussiaandtheUS;largestproducersof gas are the US and Russia, with Iran a distant third
Macro trends• “Peak oil” has been discussed for decades, but long-term trend of annual
growth in production is still intact
• Annual growth in demand has followed a linear trend in line with world population growth
• Lower prices has meant global expenditures on oil & gas exploration have beenfallingsince2014;growthisexpectedtoresumein2018
• FraccinghasmovedtheUSintothenumberonepositioningasproduction;fraccing has had less success in other countries
Exposure• 17%ofNewZealandOil&Gas(NZX:NZO)–owns50%ofCue,withproduction
interestsinoilinNewZealandandgasinIndonesia;hasagreedtopurchase4%ofKupegasfieldinoffshoreNewZealand
• 25%ofSeacrest(unlisted)–globallydiversifiedseismicoil&gasexploration
• 51% of Pan Pacific Petroleum (ASX:PPP) – now a cash box having sold itsoperating assets
OIL & GAS
1918
Zeta Resources LimitedAnnual Report for the year to 30 June 2017
Zeta Resources LimitedAnnual Report for the year to 30 June 2017
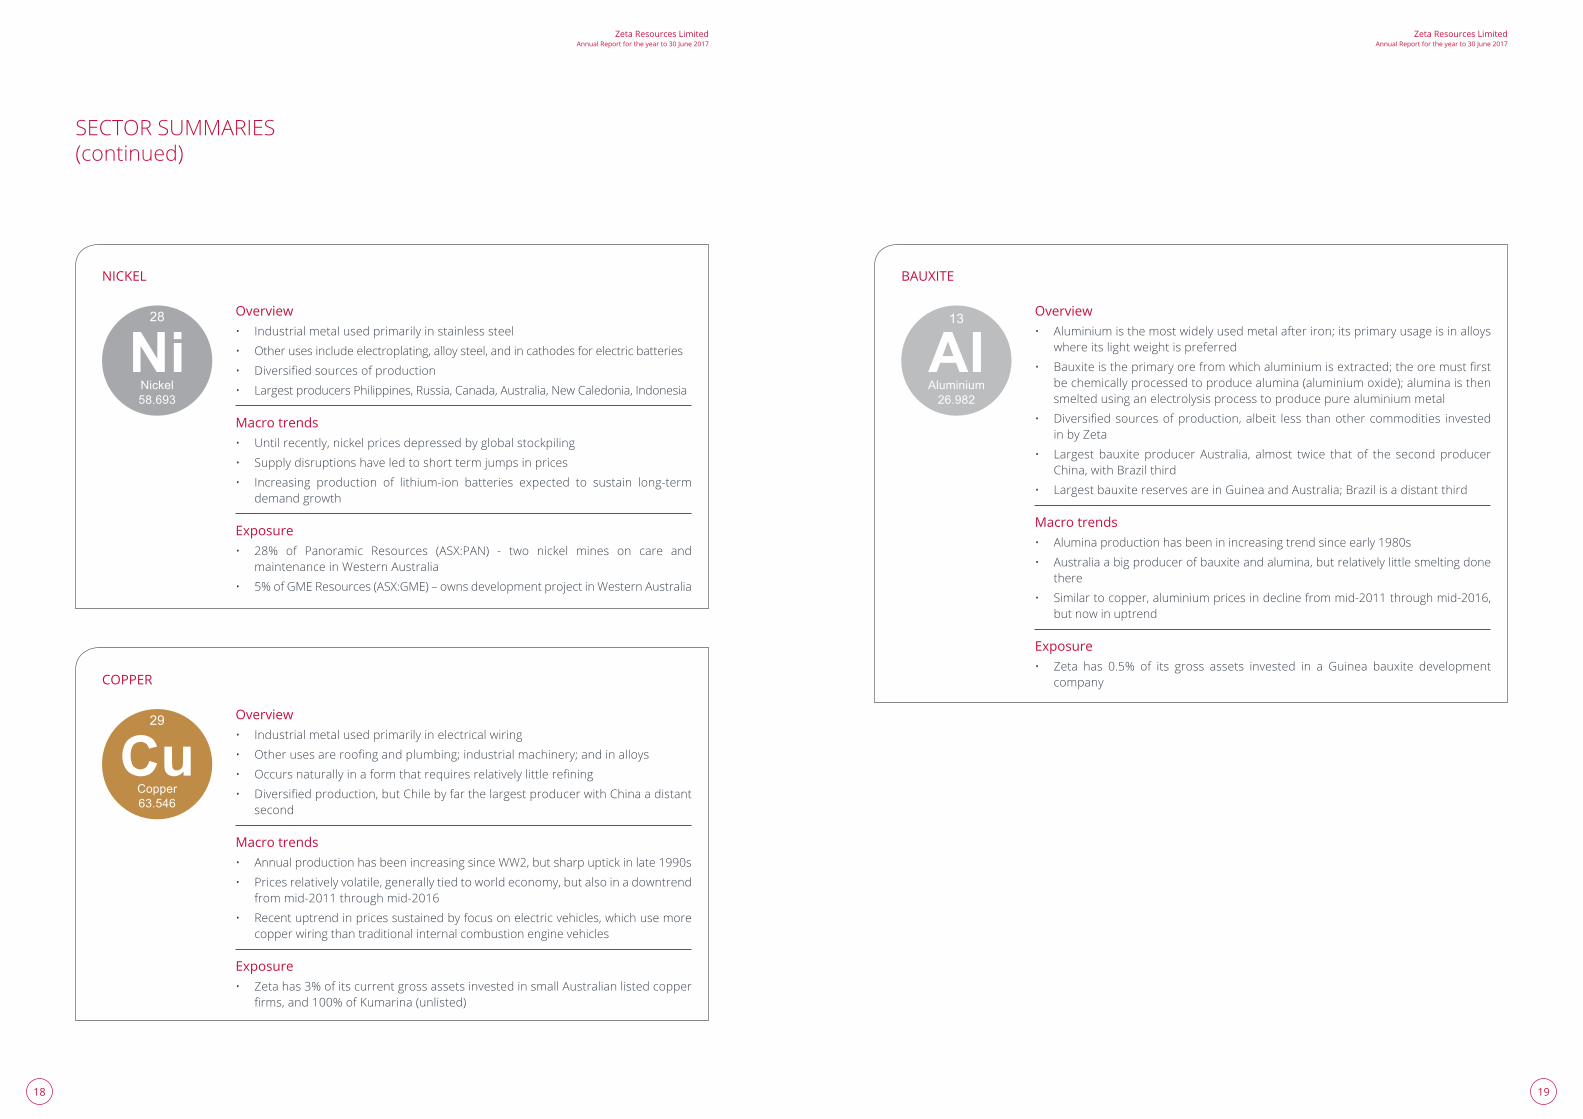
Overview• Industrial metal used primarily in stainless steel
• Other uses include electroplating, alloy steel, and in cathodes for electric batteries
• Diversifiedsourcesofproduction
• Largest producers Philippines, Russia, Canada, Australia, New Caledonia, Indonesia
Macro trends• Until recently, nickel prices depressed by global stockpiling
• Supply disruptions have led to short term jumps in prices
• Increasing production of lithium-ion batteries expected to sustain long-term demand growth
Exposure• 28% of Panoramic Resources (ASX:PAN) - two nickel mines on care and
maintenance in Western Australia
• 5%ofGMEResources(ASX:GME)–ownsdevelopmentprojectinWesternAustralia
NICKEL
Overview• Industrial metal used primarily in electrical wiring
• Otherusesareroofingandplumbing;industrialmachinery;andinalloys
• Occursnaturallyinaformthatrequiresrelativelylittlerefining
• Diversifiedproduction,butChilebyfarthelargestproducerwithChinaadistantsecond
Macro trends• Annual production has been increasing since WW2, but sharp uptick in late 1990s
• Prices relatively volatile, generally tied to world economy, but also in a downtrend from mid-2011 through mid-2016
• Recent uptrend in prices sustained by focus on electric vehicles, which use more copper wiring than traditional internal combustion engine vehicles
Exposure• Zeta has 3% of its current gross assets invested in small Australian listed copper
firms,and100%ofKumarina(unlisted)
COPPER
NiNickel 58.693
28
CuCopper 63.546
29
Overview• Aluminiumisthemostwidelyusedmetalafteriron;itsprimaryusageisinalloys
where its light weight is preferred
• Bauxiteistheprimaryorefromwhichaluminiumisextracted;theoremustfirstbechemicallyprocessedtoproducealumina(aluminiumoxide);aluminaisthensmelted using an electrolysis process to produce pure aluminium metal
• Diversifiedsourcesofproduction,albeit less thanothercommodities investedin by Zeta
• Largest bauxite producer Australia, almost twice that of the second producer China, with Brazil third
• LargestbauxitereservesareinGuineaandAustralia;Brazilisadistantthird
Macro trends• Alumina production has been in increasing trend since early 1980s
• Australia a big producer of bauxite and alumina, but relatively little smelting done there
• Similar to copper, aluminium prices in decline from mid-2011 through mid-2016, but now in uptrend
Exposure• Zeta has 0.5% of its gross assets invested in a Guinea bauxite development
company
BAUXITE
AIAluminium
26.982
13
SECTOR SUMMARIES(continued)
2120
Zeta Resources LimitedAnnual Report for the year to 30 June 2017
Zeta Resources LimitedAnnual Report for the year to 30 June 2017
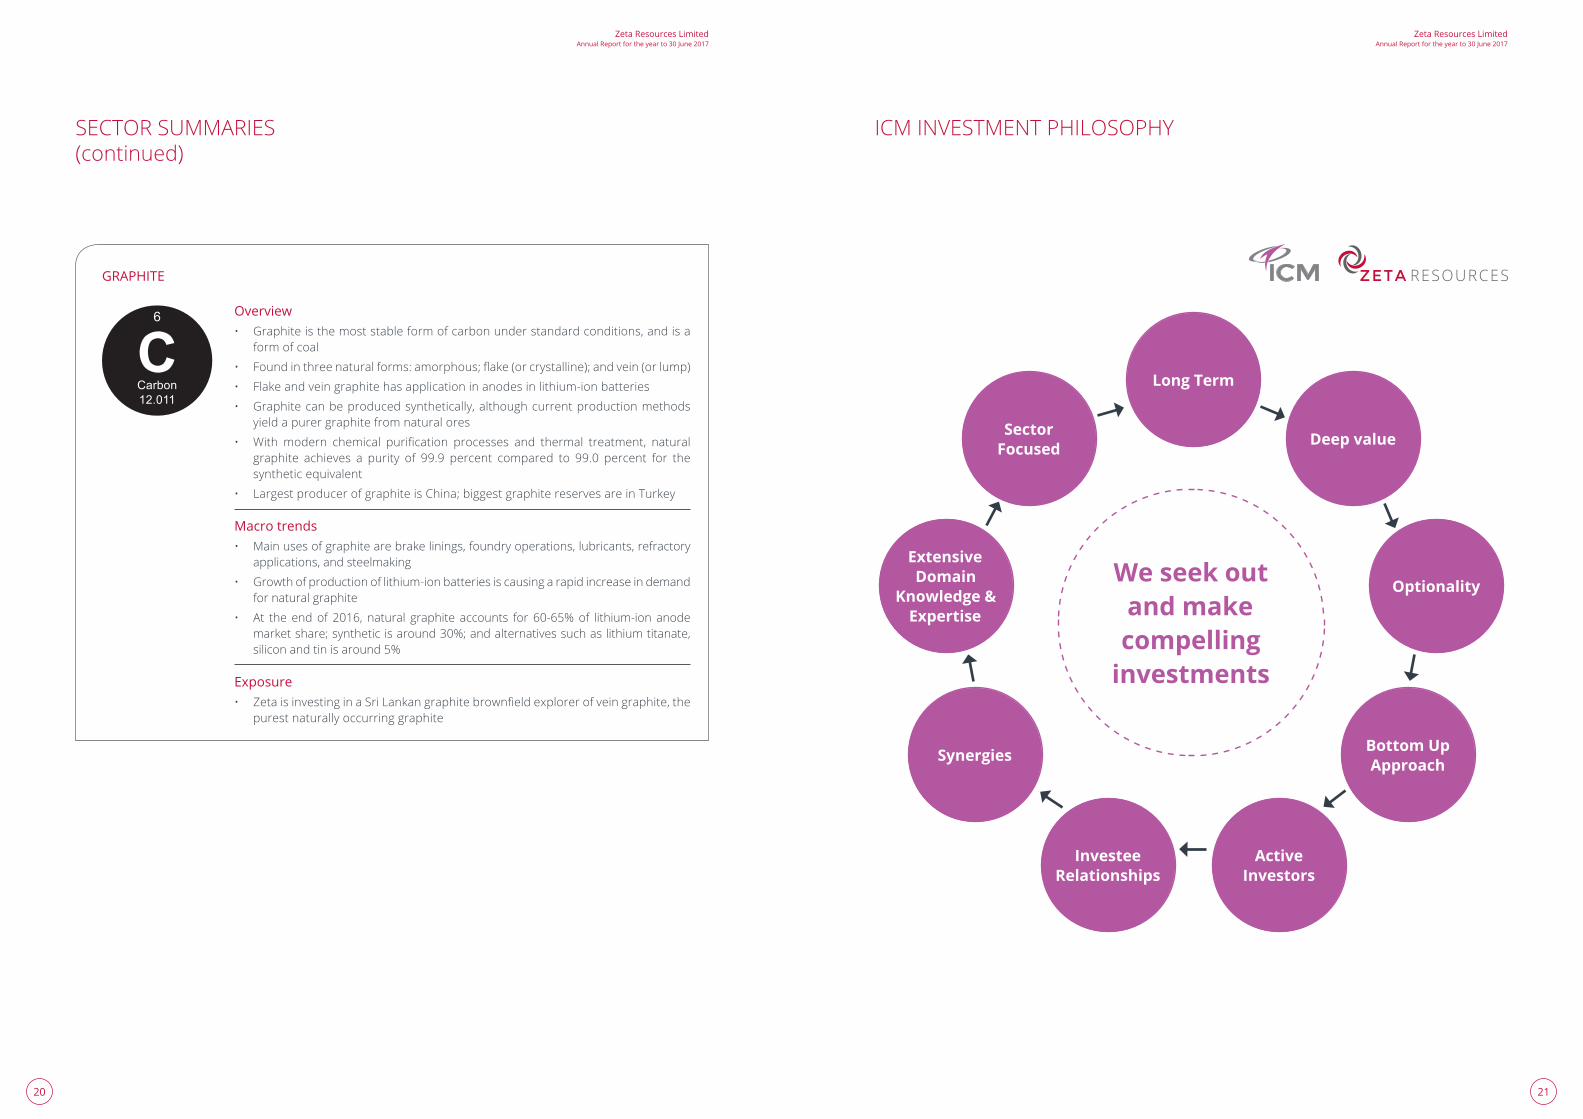
Overview• Graphite is the most stable form of carbon under standard conditions, and is a
form of coal
• Foundinthreenaturalforms:amorphous;flake(orcrystalline);andvein(orlump)
• Flake and vein graphite has application in anodes in lithium-ion batteries
• Graphite can be produced synthetically, although current production methods yield a purer graphite from natural ores
• Withmodern chemical purification processes and thermal treatment, naturalgraphite achieves a purity of 99.9 percent compared to 99.0 percent for the synthetic equivalent
• LargestproducerofgraphiteisChina;biggestgraphitereservesareinTurkey
Macro trends• Main uses of graphite are brake linings, foundry operations, lubricants, refractory
applications, and steelmaking
• Growth of production of lithium-ion batteries is causing a rapid increase in demand for natural graphite
• At the end of 2016, natural graphite accounts for 60-65% of lithium-ion anode marketshare;syntheticisaround30%;andalternativessuchaslithiumtitanate,silicon and tin is around 5%
Exposure• ZetaisinvestinginaSriLankangraphitebrownfieldexplorerofveingraphite,the
purest naturally occurring graphite
GRAPHITE
CCarbon 12.011
6
ICM INVESTMENT PHILOSOPHYSECTOR SUMMARIES(continued)
2322
Zeta Resources LimitedAnnual Report for the year to 30 June 2017
Zeta Resources LimitedAnnual Report for the year to 30 June 2017
INVESTMENT MANAGER AND TEAM
ICMistheInvestmentManagerofZeta.ICMisaBermudabasedglobalfundmanagerfocusedonfindinginvestmentsatvaluationsthatdonotreflecttheirtruelongtermvalue.Ourinvestmentapproachistohaveadeepunderstandingof the business fundamentals of each investment and its environment versus its intrinsic value. We are long term, patient investors and see markets as a place to exchange assets.
ICMhassomeUS$21.1billionundermanagementdirectlyandindirectlyinarangeofmandates.ICMhasover40staffbasedinofficesinBermuda,CapeTown,Dublin,HongKong,London,Singapore,SydneyandWellington.
ICMstaffresponsibleforZeta’sinvestmentsinclude:
Dugald Morrison, based in Wellington, New Zealand, is the General Manager for ICM NZ Limited. He has extensive investment analysis experience, having worked in stockbroking, investment banking and investment management firmsinNewZealand,theUnitedKingdom,andtheUnitedStatessince1987.MrMorrisonisadirectorofanumberof unlisted companies. He is a member of the New Zealand Institute of Directors.
Duncan Saville, a director of ICM, is a chartered accountant with experience in corporate finance and assetmanagement. He is currently a director of a number of listed companies including New Zealand Oil & Gas Limited and is an experienced company director. He is a Fellow of the Institute of Chartered Accountants Australia and New Zealand, Australian Institute of Directors and the Financial Service Institute of Australia and is a member of the Singapore Institute of Directors.
Alasdair Younie, a director of ICM. Based in Bermuda, he is a chartered accountant with experience in corporate finance and corporate investment.Mr Younie qualified as a chartered accountantwith PricewaterhouseCoopersandsubsequentlyworkedforsixyearswithinthecorporatefinancedepartmentofArbuthnotSecuritiesLimitedinLondon. Mr Younie is a director of the Ascendant Group Limited, Bermuda Commercial Bank Limited and Somers Limited and is a member of the Institute of Chartered Accountants in England and Wales.
Eduardo Greca, joined ICM in 2010 as an Equity Analyst and he is based in Brazil. He has over eight years of experienceasaneconomist,andpriortojoiningtheinvestmentteamheworkedinthecommoditiesteamatKraftFoods in Brazil. Eduardo supports Zeta on Latam investments. Eduardo obtained an economics degree at the Federal University of Parana in 2009 and is a CFA Charterholder.
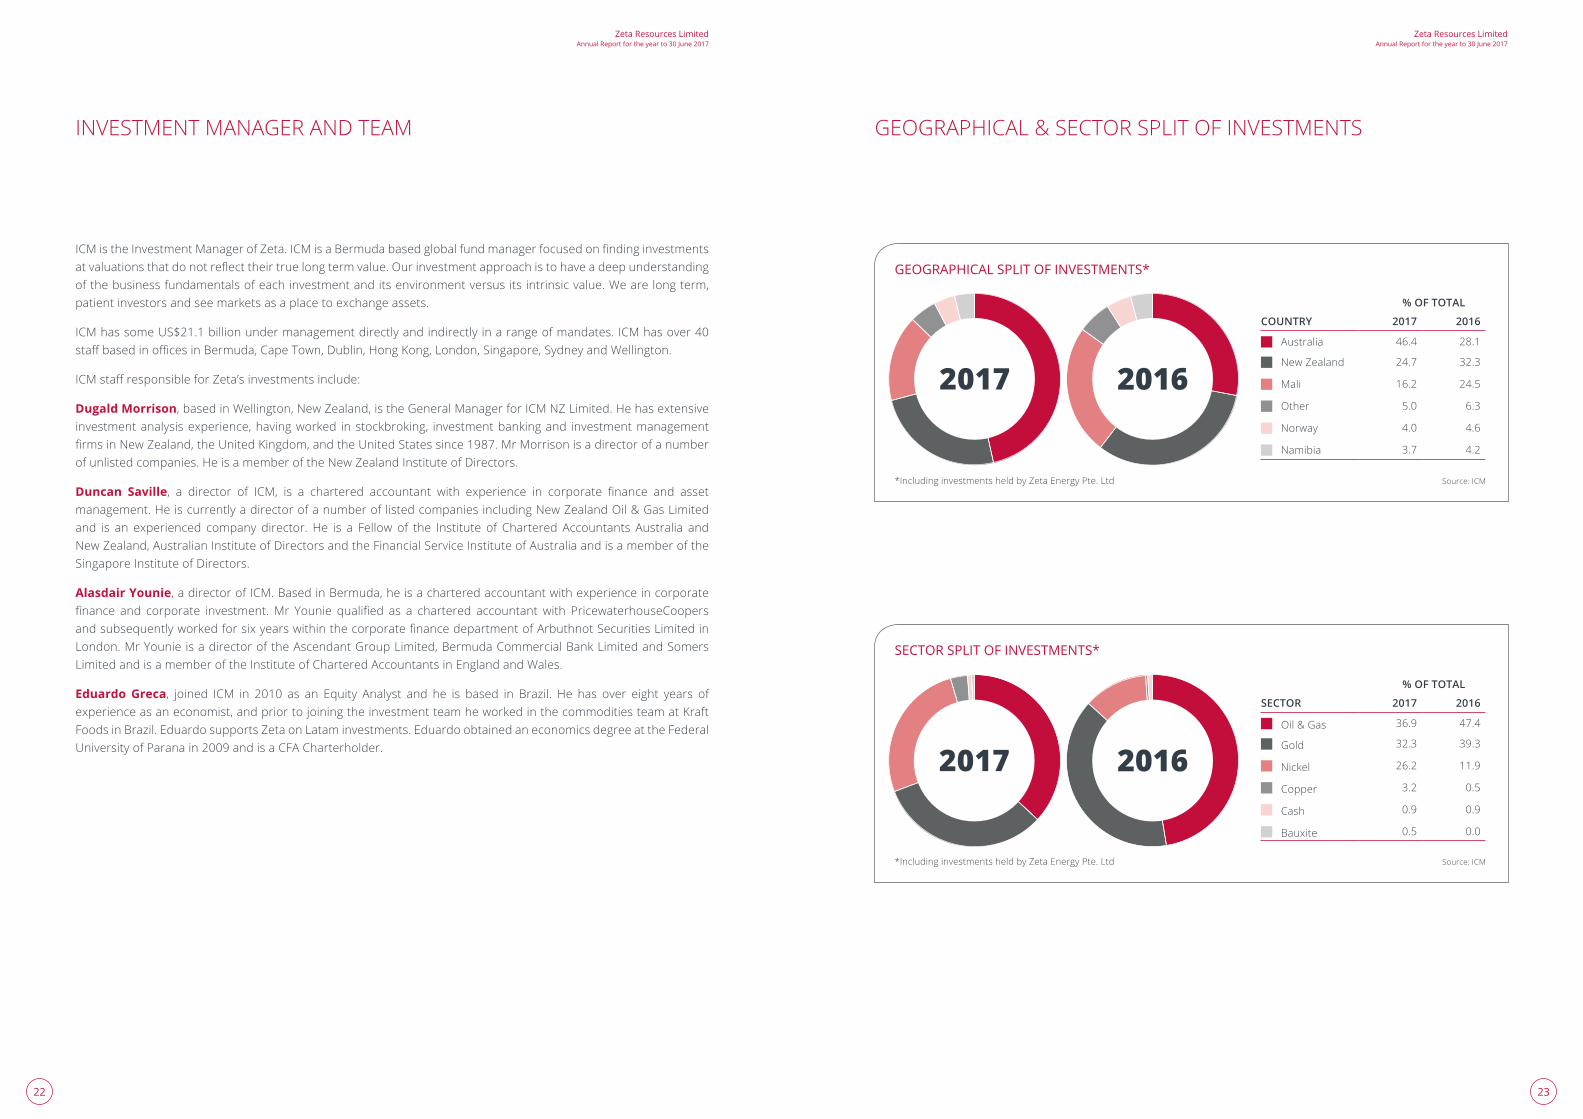
GEOGRAPHICAL & SECTOR SPLIT OF INVESTMENTS
% OF TOTAL
SECTOR 2017 2016
Oil & Gas 36.9 47.4
Gold 32.3 39.3
Nickel 26.2 11.9
Copper 3.2 0.5
Cash 0.9 0.9
Bauxite 0.5 0.0
SECTOR SPLIT OF INVESTMENTS*
Source:ICM*Including investments held by Zeta Energy Pte. Ltd
% OF TOTAL
COUNTRY 2017 2016
Australia 46.4 28.1
New Zealand 24.7 32.3
Mali 16.2 24.5
Other 5.0 6.3
Norway 4.0 4.6
Namibia 3.7 4.2
GEOGRAPHICAL SPLIT OF INVESTMENTS*
Source:ICM*Including investments held by Zeta Energy Pte. Ltd
2524
Zeta Resources LimitedAnnual Report for the year to 30 June 2017
Zeta Resources LimitedAnnual Report for the year to 30 June 2017
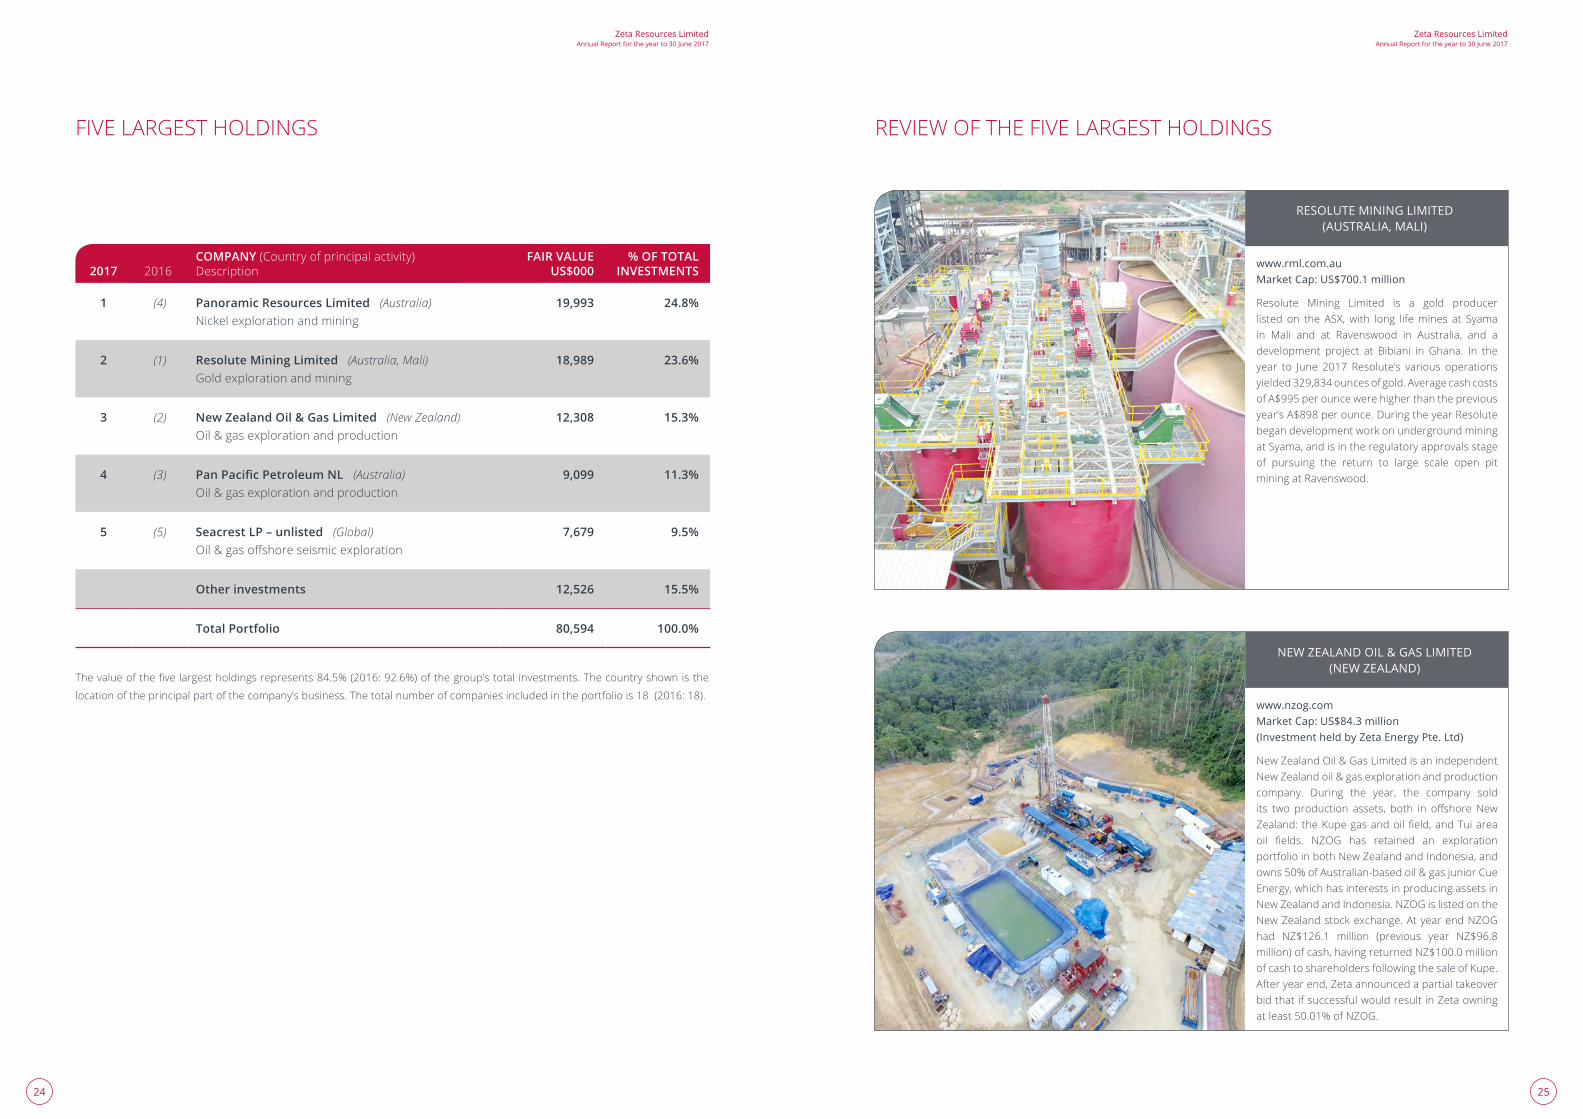
FIVE LARGEST HOLDINGS
2017 2016COMPANY (Country of principal activity) Description
FAIR VALUE US$000
% OF TOTAL INVESTMENTS
1 (4) Panoramic Resources Limited (Australia) Nickel exploration and mining
19,993 24.8%
2 (1) Resolute Mining Limited (Australia, Mali) Gold exploration and mining
18,989 23.6%
3 (2) New Zealand Oil & Gas Limited (New Zealand) Oil & gas exploration and production
12,308 15.3%
4 (3) Pan Pacific Petroleum NL (Australia) Oil & gas exploration and production
9,099 11.3%
5 (5) Seacrest LP – unlisted (Global) Oil&gasoffshoreseismicexploration
7,679 9.5%
Other investments 12,526 15.5%
Total Portfolio 80,594 100.0%
Thevalueofthefivelargestholdingsrepresents84.5%(2016:92.6%)ofthegroup’stotalinvestments.Thecountryshownisthe
locationoftheprincipalpartofthecompany’sbusiness.Thetotalnumberofcompaniesincludedintheportfoliois18(2016:18).
REVIEW OF THE FIVE LARGEST HOLDINGS
www.nzog.com Market Cap: US$84.3 million (Investment held by Zeta Energy Pte. Ltd)
New Zealand Oil & Gas Limited is an independent New Zealand oil & gas exploration and production company. During the year, the company sold its two production assets, both in offshoreNewZealand: theKupegasandoilfield,andTuiareaoil fields. NZOG has retained an explorationportfolio in both New Zealand and Indonesia, and owns 50% of Australian-based oil & gas junior Cue Energy, which has interests in producing assets in New Zealand and Indonesia. NZOG is listed on the New Zealand stock exchange. At year end NZOG had NZ$126.1 million (previous year NZ$96.8million)ofcash,havingreturnedNZ$100.0millionofcashtoshareholdersfollowingthesaleofKupe.After year end, Zeta announced a partial takeover bid that if successful would result in Zeta owning at least 50.01% of NZOG.
NEW ZEALAND OIL & GAS LIMITED (NEW ZEALAND)
www.rml.com.au Market Cap: US$700.1 million
Resolute Mining Limited is a gold producer listed on the ASX, with long life mines at Syama in Mali and at Ravenswood in Australia, and a development project at Bibiani in Ghana. In the year to June 2017 Resolute’s various operations yielded 329,834 ounces of gold. Average cash costs ofA$995perouncewerehigherthanthepreviousyear’sA$898perounce.DuringtheyearResolutebegan development work on underground mining at Syama, and is in the regulatory approvals stage of pursuing the return to large scale open pit mining at Ravenswood.
RESOLUTE MINING LIMITED (AUSTRALIA, MALI)
2726
Zeta Resources LimitedAnnual Report for the year to 30 June 2017
Zeta Resources LimitedAnnual Report for the year to 30 June 2017
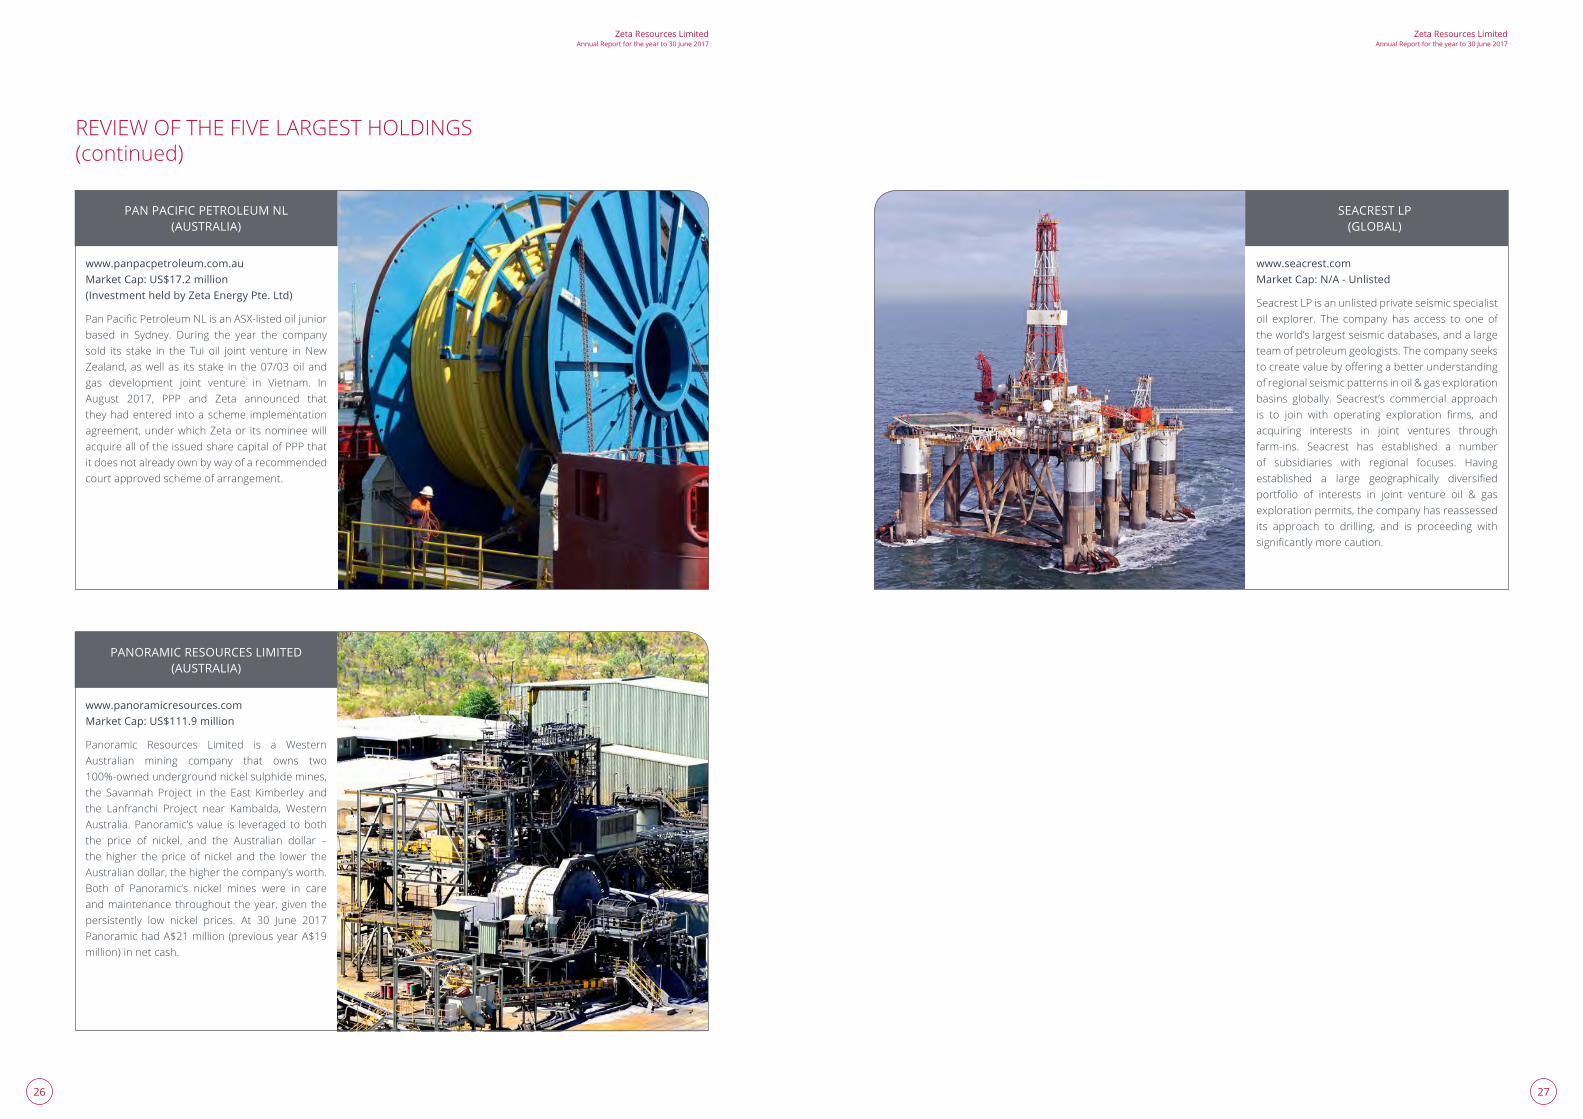
www.panoramicresources.com Market Cap: US$111.9 million
Panoramic Resources Limited is a Western Australian mining company that owns two 100%-owned underground nickel sulphide mines, the Savannah Project in the East Kimberley andthe Lanfranchi Project near Kambalda, WesternAustralia. Panoramic’s value is leveraged to both the price of nickel, and the Australian dollar –the higher the price of nickel and the lower the Australian dollar, the higher the company’s worth. Both of Panoramic’s nickel mines were in care and maintenance throughout the year, given the persistently low nickel prices. At 30 June 2017 PanoramichadA$21million(previousyearA$19million) in net cash.
PANORAMIC RESOURCES LIMITED (AUSTRALIA)
www.panpacpetroleum.com.au Market Cap: US$17.2 million (Investment held by Zeta Energy Pte. Ltd)
PanPacificPetroleumNLisanASX-listedoiljuniorbased in Sydney. During the year the company sold its stake in the Tui oil joint venture in New Zealand,aswellas itsstake in the07/03oilandgas development joint venture in Vietnam. In August 2017, PPP and Zeta announced that they had entered into a scheme implementation agreement, under which Zeta or its nominee will acquire all of the issued share capital of PPP that it does not already own by way of a recommended court approved scheme of arrangement.
PAN PACIFIC PETROLEUM NL (AUSTRALIA)
REVIEW OF THE FIVE LARGEST HOLDINGS(continued)
www.seacrest.com Market Cap: N/A - Unlisted
Seacrest LP is an unlisted private seismic specialist oil explorer. The company has access to one of the world’s largest seismic databases, and a large team of petroleum geologists. The company seeks tocreatevaluebyofferingabetterunderstandingof regional seismic patterns in oil & gas exploration basins globally. Seacrest’s commercial approach is to join with operating exploration firms, andacquiring interests in joint ventures through farm-ins. Seacrest has established a number of subsidiaries with regional focuses. Having established a large geographically diversifiedportfolio of interests in joint venture oil & gas exploration permits, the company has reassessed its approach to drilling, and is proceeding with significantlymorecaution.
SEACREST LP (GLOBAL)
2928
Zeta Resources LimitedAnnual Report for the year to 30 June 2017
Zeta Resources LimitedAnnual Report for the year to 30 June 2017
DIRECTORS
Peter Ross Sullivan (Chairman and Non-Executive Director), appointed 7 June 2013. Mr Sullivan is an engineer and has been involved in the management and strategic development of resource companies and projects for more than 20 years, including project engineering, corporate finance, investment banking, corporate and operationalmanagementandpubliccompanydirectorships.Hehasspecialised inprovidingstrategiccorporate,financialandinvestment advice to companies principally in the resource sector. He has served as a Director for numerous listed and unlisted companies and been closely involved with their development. Mr Sullivan holds a Bachelor of Engineering and a Master of Business Administration.
Directorships of other listed companies in the last 3 yearsMrSullivanisChairmanofPanPacificPetroleumNL(ASX:PPP),GMEResourcesLimited(ASX:GME)andBlighResourcesLimited (ASX:BGH) and non-executive director of Resolute Mining Limited (ASX:RSG) and Panoramic ResourcesLimited(ASX:PAN).
Marthinus (Martin) Botha (Non-Executive Director), appointed 7 June 2013. Mr Botha has over 30 years’ experience in banking, with the last 26 years spent in leadership roles building Standard Bank Plc’s (part of The Standard Bank of South Africa Limited group of companies) international operations. Mr Botha’s primary responsibilities at Standard Bank included establishing and leading the development of the core global natural resources trading andfinancingfranchises,aswellasvariousgeographicstrategies,includingthoseintheRussianCommonwealthofIndependentStates,TurkeyandtheMiddleEast.MrBothaiscurrentlynon-executivechairmanofSberbankCIB(UK)Ltd,asecuritiesbrokerregulatedbytheUKFinancialServicesAuthority.MrBothaholdsaBachelorofEngineeringdegree in Survey.
Directorships of other listed companies in the last 3 years MrBothaisnon-executivedirectorofResoluteMiningLimited(ASX:RSG).
Xi Xi (Non-Executive Director), appointed 7 June 2013. Ms Xi is a financial analyst withmore than 15 years’experience in the mining, energy and natural resource industry, ranging from managing companies focused on international exploration and development of mining projects to restructuring and overseeing a portfolio of private and public companies. Ms Xi holds dual Bachelor of Science degrees in Chemical Engineering and Economics from the Colorado School of Mines and a Master of Arts in International Relations and China Studies from Johns Hopkins School of Advanced International Studies.
Directorships of other listed companies in the last 3 yearsMsXiXiiscurrentlynon-executivedirectorofMineralResourcesLimited(ASX:MIN),andpreviouslyGalaxyResourcesLimited(ASX:GXY).
REPORT OF THE DIRECTORS
Yourdirectorspresenttheirreport forZetaResourcesLimited, including itssubsidiaries,KumarinaResourcesPtyLimited, Zeta Energy Pte. Ltd and Zeta Investments Limited, for the year ended 30 June 2017.
DIRECTORSThenamesofdirectorsinofficeatanytimeduringorsincetheendoftheyearare:
Peter Ross SullivanMarthinus (Martin) BothaXi Xi
Directorshavebeeninofficesincethestartoftheyeartothedateofthisreport.
PRINCIPAL ACTIVITIESThe principal activities of the company are investing in listed and unlisted resource focused investments.
Nosignificantchangeinthenatureoftheseactivitiesoccurredduringtheyear.
OPERATING AND FINANCIAL REVIEW
Operating resultsThenetprofitattributabletothecompanyfortheyearto30June2017amountedtoUS$10,277,906.
Overview of operating activityThe company listed on the ASX on 12 June 2013.
During the year the company has continued to build its portfolio of resource investments by investing a further US$10,515,751.AnincreaseinthefairvalueoftheportfolioresultedinanunrealisedprofitrecognisedinprofitorlossatyearendofUS$5,504,003.
Theactivitiesof thecompany’ssubsidiary,Kumarina, related to furtherexplorationandevaluationof theexistingAustralianminingtenements(theMurrinMurrinandIlgarariprojects)andatotalofA$117,518wasinvestedduringthe twelve months to 30 June 2017 in further drilling and analysis work.
Financial positionAttheendoftheyear,thecompanyhadUS$15,828incashandcashequivalents.InvestmentsatfairvaluetotalledUS$47,685,376,loanstosubsidiarieswerevaluedatUS$30,027,206andtheinvestmentinsubsidiarieswasvaluedatUS$3,181,102.
ThecompanyhasaloanowingtoUILof$22,257,029atyearend.
DIVIDENDSNo dividends have been paid or declared since the start of the year. No recommendation is made as to dividends.
3130
Zeta Resources LimitedAnnual Report for the year to 30 June 2017
Zeta Resources LimitedAnnual Report for the year to 30 June 2017
AFTER BALANCE DATE EVENTSZeta Resources Limited has entered into a Scheme Implementation Agreement under which Zeta (or its nominee) will acquire all of the issued share capital of PPP that it does not already own by way of a recommended court approved schemeof arrangement.Under the scheme,PPP shareholders canelect to receiveeitherA$0.038 cashperPPPshare, or one Zeta share for every ten PPP shares. Zeta already has a relevant interest in approximately 50.91% of PPP shares via its wholly owned subsidiary Zeta Energy Pte. Ltd (“Zeta Energy”).
Zeta has entered into a subscription agreement to subscribe for 15 million shares in Margosa, to be issued in 5 tranchesovera12-monthperiod,foracostofA$3million.Thefirsttrancheofthesubscriptionwascompletedon 21July2017whereZetareceived5,000,000sharesforA$1million.Tranche2to5becomedue3months,6months,9 months and 12 months following the initial subscription. After the last tranche has been issued, Zeta will own approximately 33% of Margosa.
Following the announcement of a takeover bid to acquire all Bligh shares not already owned by Zeta, on 13 July 2017 Zetaacquiredafurther109,736,891sharesinBlighatacostofA$0.038ashare.Zetanowcurrentlyowns85.75%of Bligh.
On10August2017ZetagavenoticeofitsintentiontomakeapartialtakeoverofferundertheNewZealandTakeoversCode to acquire an additional 41.955% of each class of the shares in NZOG not currently held or controlled by Zeta EnergyatanofferpriceofNZ$0.72pershare.Ifsuccessful,theofferwouldresultinZetaEnergyholdingorcontrollingno less than 50.01% of the voting rights in NZOG.
There have been no other facts nor circumstances of a material nature that have occurred between the reporting dateandthedateofthisreportthathaveamaterialimpactonthefinancialpositionofthecompanyat30June2017.
LIKELY DEVELOPMENTSThe company intends to continue to seek to maximise total returns for shareholders by identifying and investing in assetsandcompanieswheretheunderlyingvalueisnotreflectedinthemarketprice.
INFORMATION ON COMPANY SECRETARYOn 12 September 2017 ICM Limited was appointed Company Secretary.
REMUNERATION REPORT Theremunerationreportissetoutinthefollowingmanner:
• Policies used to determine the nature and amount of remuneration
• Details of remuneration
• Share based compensation
• Directors and executives interests
REPORT OF THE DIRECTORS(continued)
Remuneration policyThe board of directors is responsible for remuneration policies and the packages applicable to the directors of the company. Thebroad remuneration policy is to ensure that packages offeredproperly reflect a person’s duties andresponsibilities and that remuneration is competitive and attracts, retains, and motivates people of the highest quality.
The directors are remunerated for the services they render to the company and such services are carried out under normal commercial terms and conditions. Engagement and payment for such services are approved by the other directors who have no interest in the engagement of services.
At the date of this report the company had not entered into any packages with directors or senior executives which include performance based components.
Details of remuneration for DirectorsThecompanypaidatotalof$150,000todirectorsfortheyearended30June2017.
The company had no employees as at 30 June 2017.
Share based compensationThere is currently no provision in the policies of the company for the provision of share-based compensation to directors. The interest of directors and executives in shares and options is set out elsewhere in this report.
Directors and Executives’ interestsThe relevant interests of directors and executives either directly or through entities controlled by the directors and executivesinthesharecapitalofthecompanyandrelatedbodycorporatesasatthedateofthisreportare:
DIRECTORORDINARY SHARES OPENING BALANCE NET CHANGE
ORDINARY SHARES CLOSING BALANCE
Peter R Sullivan 5,670,632 – 5,670,632
Martin Botha – 279,565 279,565
Xi Xi – – –
3332
Zeta Resources LimitedAnnual Report for the year to 30 June 2017
Zeta Resources LimitedAnnual Report for the year to 30 June 2017
MEETINGS OF DIRECTORSThe board held six meetings during the year which were attended by all directors. The meetings were held on 4 July, 2 September, 29 November 2016 and 8 February, 23 May and 12 June 2017.
In addition, throughout the course of the year there were a number of resolutions of directors which were made by unanimous written resolution.
There were no meetings of committees of directors that were required to be held during the year.
LOANS TO DIRECTORS AND EXECUTIVESThere were no loans entered into with directors or executives during the year under review.
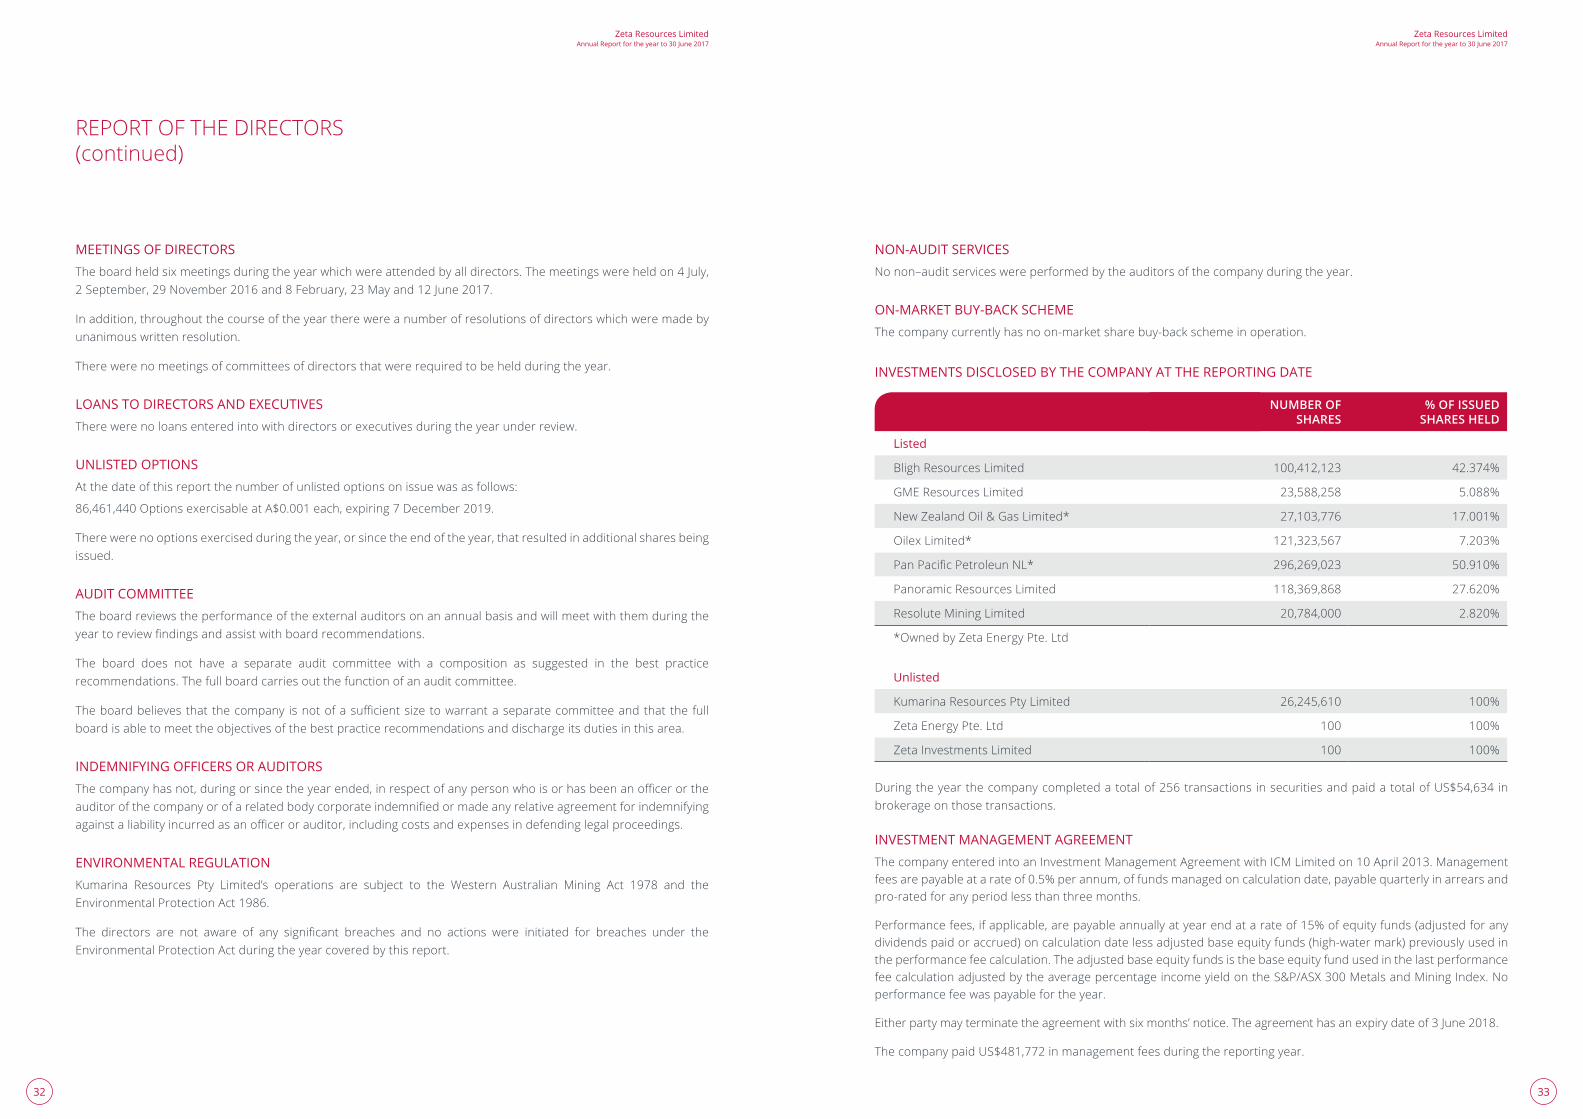
UNLISTED OPTIONSAtthedateofthisreportthenumberofunlistedoptionsonissuewasasfollows:
86,461,440OptionsexercisableatA$0.001each,expiring7December2019.
There were no options exercised during the year, or since the end of the year, that resulted in additional shares being issued.
AUDIT COMMITTEEThe board reviews the performance of the external auditors on an annual basis and will meet with them during the yeartoreviewfindingsandassistwithboardrecommendations.
The board does not have a separate audit committee with a composition as suggested in the best practice recommendations. The full board carries out the function of an audit committee.
Theboardbelievesthat thecompany isnotofasufficientsizetowarrantaseparatecommitteeandthat the fullboard is able to meet the objectives of the best practice recommendations and discharge its duties in this area.
INDEMNIFYING OFFICERS OR AUDITORSThecompanyhasnot,duringorsincetheyearended,inrespectofanypersonwhoisorhasbeenanofficerortheauditorofthecompanyorofarelatedbodycorporateindemnifiedormadeanyrelativeagreementforindemnifyingagainstaliabilityincurredasanofficerorauditor,includingcostsandexpensesindefendinglegalproceedings.
ENVIRONMENTAL REGULATIONKumarina Resources Pty Limited’s operations are subject to the Western Australian Mining Act 1978 and theEnvironmental Protection Act 1986.
The directors are not aware of any significant breaches and no actions were initiated for breaches under theEnvironmental Protection Act during the year covered by this report.
NON-AUDIT SERVICESNonon–auditserviceswereperformedbytheauditorsofthecompanyduringtheyear.
ON-MARKET BUY-BACK SCHEMEThe company currently has no on-market share buy-back scheme in operation.
INVESTMENTS DISCLOSED BY THE COMPANY AT THE REPORTING DATE
NUMBER OF SHARES
% OF ISSUED SHARES HELD
Listed
Bligh Resources Limited 100,412,123 42.374%
GME Resources Limited 23,588,258 5.088%
New Zealand Oil & Gas Limited* 27,103,776 17.001%
Oilex Limited* 121,323,567 7.203%
PanPacificPetroleunNL* 296,269,023 50.910%
Panoramic Resources Limited 118,369,868 27.620%
Resolute Mining Limited 20,784,000 2.820%
*Owned by Zeta Energy Pte. Ltd
Unlisted
KumarinaResourcesPtyLimited 26,245,610 100%
Zeta Energy Pte. Ltd 100 100%
Zeta Investments Limited 100 100%
Duringtheyearthecompanycompletedatotalof256transactionsinsecuritiesandpaidatotalofUS$54,634inbrokerage on those transactions.
INVESTMENT MANAGEMENT AGREEMENTThe company entered into an Investment Management Agreement with ICM Limited on 10 April 2013. Management fees are payable at a rate of 0.5% per annum, of funds managed on calculation date, payable quarterly in arrears and pro-rated for any period less than three months.
Performance fees, if applicable, are payable annually at year end at a rate of 15% of equity funds (adjusted for any dividends paid or accrued) on calculation date less adjusted base equity funds (high-water mark) previously used in the performance fee calculation. The adjusted base equity funds is the base equity fund used in the last performance feecalculationadjustedbytheaveragepercentageincomeyieldontheS&P/ASX300MetalsandMiningIndex.Noperformance fee was payable for the year.
Either party may terminate the agreement with six months’ notice. The agreement has an expiry date of 3 June 2018.
ThecompanypaidUS$481,772inmanagementfeesduringthereportingyear.
REPORT OF THE DIRECTORS(continued)
3534
Zeta Resources LimitedAnnual Report for the year to 30 June 2017
Zeta Resources LimitedAnnual Report for the year to 30 June 2017
AUDITOR’S INDEPENDENCE DECLARATIONA copy of the auditor’s independence declaration is included in the Independent Auditor’s Report.
This report is signed in accordance with a resolution of directors.
Peter R Sullivan Chairman Perth, Western Australia 12 September 2017
CORPORATE GOVERNANCE STATEMENT
The company’s directors and management are committed to conducting the group’s business in an ethical manner and in accordance with the highest standards of corporate governance. The company has adopted and substantially complies with the ASX Corporate Governance Principles and Recommendations (Third Edition) (Recommendations) to the extent appropriate to the size and nature of the group’s operations. The company has prepared a statement (“Corporate Governance Statement”) which sets out the corporate governance practices that were in operation throughout the financialyearforthecompany,identifiesanyRecommendationsthathavenotbeenfollowed,andprovidesreasonsfornot following such Recommendations. In accordance with ASX Listing Rules 4.10.3 and 4.7.4, the Corporate Governance Statement will be available for review on the company’s website (www.zetaresources.limited), and will be lodged together with an Appendix 4G to the ASX at the same time that the Annual Report is lodged with ASX.
The Appendix 4G will particularise each Recommendation that needs to be reported against by the company and will provide shareholders with information as to where relevant governance disclosures can be found. The company’s corporate governance policies and charters are all available on its website (www.zetaresources.limited).
REPORT OF THE DIRECTORS(continued)
3736
Zeta Resources LimitedAnnual Report for the year to 30 June 2017
Zeta Resources LimitedAnnual Report for the year to 30 June 2017
INDEPENDENT AUDITOR’S REPORT
3938
Zeta Resources LimitedAnnual Report for the year to 30 June 2017
Zeta Resources LimitedAnnual Report for the year to 30 June 2017
AUDITOR’S INDEPENDENCE DECLARATION
Independent Auditor’s Declaration to the directors of Zeta Resources Limited
In relation to our audit of the financial report of Zeta Resources Limited for the financial year ended 30 June 2017, to the best of my knowledge and belief, there have been no contraventions of the auditor independence requirements of the International Standards on Auditing or any applicable code of professional conduct.
KPMG Inc.
Per P Farrand Chartered Accountant (SA) Registered Auditor Director 12 September 2017
KPMG Inc. KPMG Crescent 85 Empire Road, Parktown, 2193, Private Bag 9, Parkview, 2122, South Africa
+27 (0)11 647 7111 +27 (0)11 647 8000 472 Johannesburg kpmg.co.za
Telephone Fax Docex Internet
KPMG Inc. is a company incorporated under the South African Companies Act and a member firm of the KPMG network of independent member firms affiliated with KPMG International Cooperative (“KPMG International”), a Swiss entity.
KPMG Inc. is a Registered Auditor, in public practice, in terms of the Auditing Profession Act, 26 of 2005.
Registration number 1999/021543/21
Chief Executive: N Dlomu
Directors: Full list on website
The company’s principal place of business is at KPMG Crescent, 85 Empire Road, Parktown, where a list of the directors’ names is available for inspection.
INDEPENDENT AUDITOR’S REPORT(continued)
4140
Zeta Resources LimitedAnnual Report for the year to 30 June 2017
Zeta Resources LimitedAnnual Report for the year to 30 June 2017
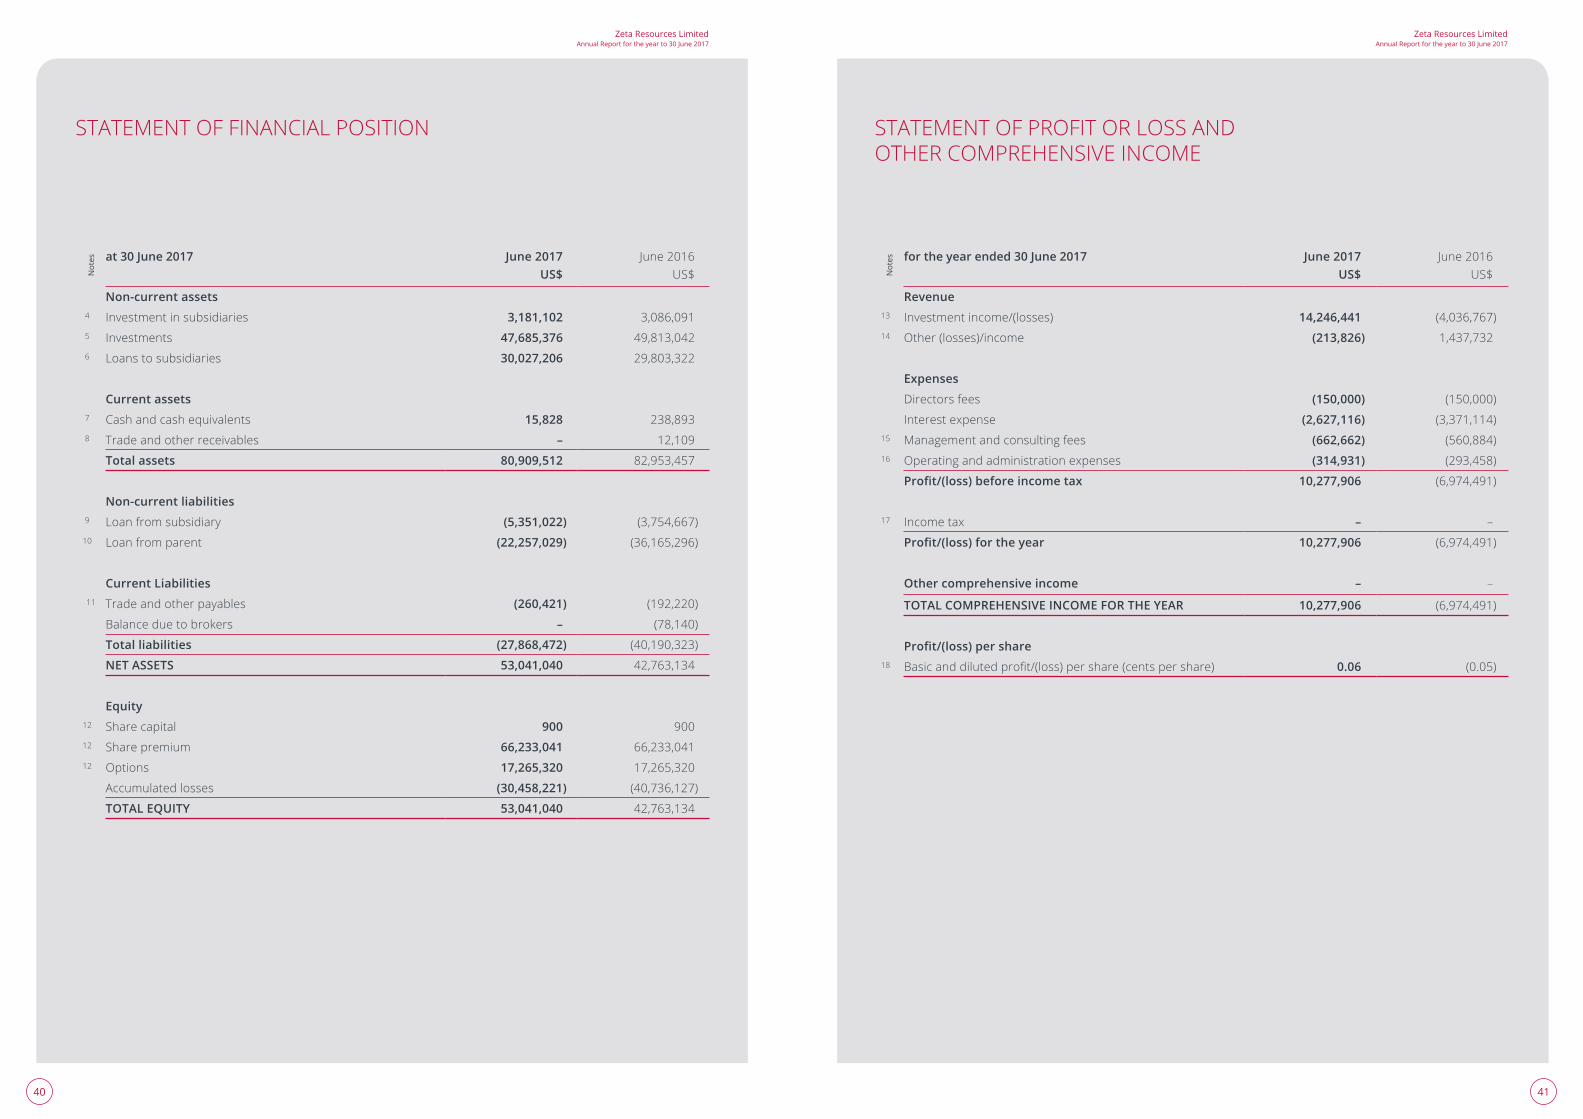
STATEMENT OF FINANCIAL POSITION
Not
es at 30 June 2017 June 2017 US$
June 2016 US$
Non-current assets4 Investment in subsidiaries 3,181,102 3,086,0915 Investments 47,685,376 49,813,0426 Loans to subsidiaries 30,027,206 29,803,322
Current assets7 Cash and cash equivalents 15,828 238,8938 Trade and other receivables – 12,109
Total assets 80,909,512 82,953,457
Non-current liabilities9 Loan from subsidiary (5,351,022) (3,754,667)
10 Loan from parent (22,257,029) (36,165,296)
Current Liabilities11 Trade and other payables (260,421) (192,220)
Balance due to brokers – (78,140)
Total liabilities (27,868,472) (40,190,323)
NET ASSETS 53,041,040 42,763,134
Equity12 Share capital 900 90012 Share premium 66,233,041 66,233,04112 Options 17,265,320 17,265,320
Accumulated losses (30,458,221) (40,736,127)
TOTAL EQUITY 53,041,040 42,763,134
STATEMENT OF PROFIT OR LOSS AND OTHER COMPREHENSIVE INCOME
Not
es for the year ended 30 June 2017 June 2017 US$
June 2016 US$
Revenue13 Investmentincome/(losses) 14,246,441 (4,036,767)14 Other(losses)/income (213,826) 1,437,732
Expenses
Directors fees (150,000) (150,000)
Interest expense (2,627,116) (3,371,114)15 Management and consulting fees (662,662) (560,884)16 Operating and administration expenses (314,931) (293,458)
Profit/(loss) before income tax 10,277,906 (6,974,491)
17 Income tax – –
Profit/(loss) for the year 10,277,906 (6,974,491)
Other comprehensive income – –
TOTAL COMPREHENSIVE INCOME FOR THE YEAR 10,277,906 (6,974,491)
Profit/(loss) per share18 Basicanddilutedprofit/(loss)pershare(centspershare) 0.06 (0.05)
4342
Zeta Resources LimitedAnnual Report for the year to 30 June 2017
Zeta Resources LimitedAnnual Report for the year to 30 June 2017
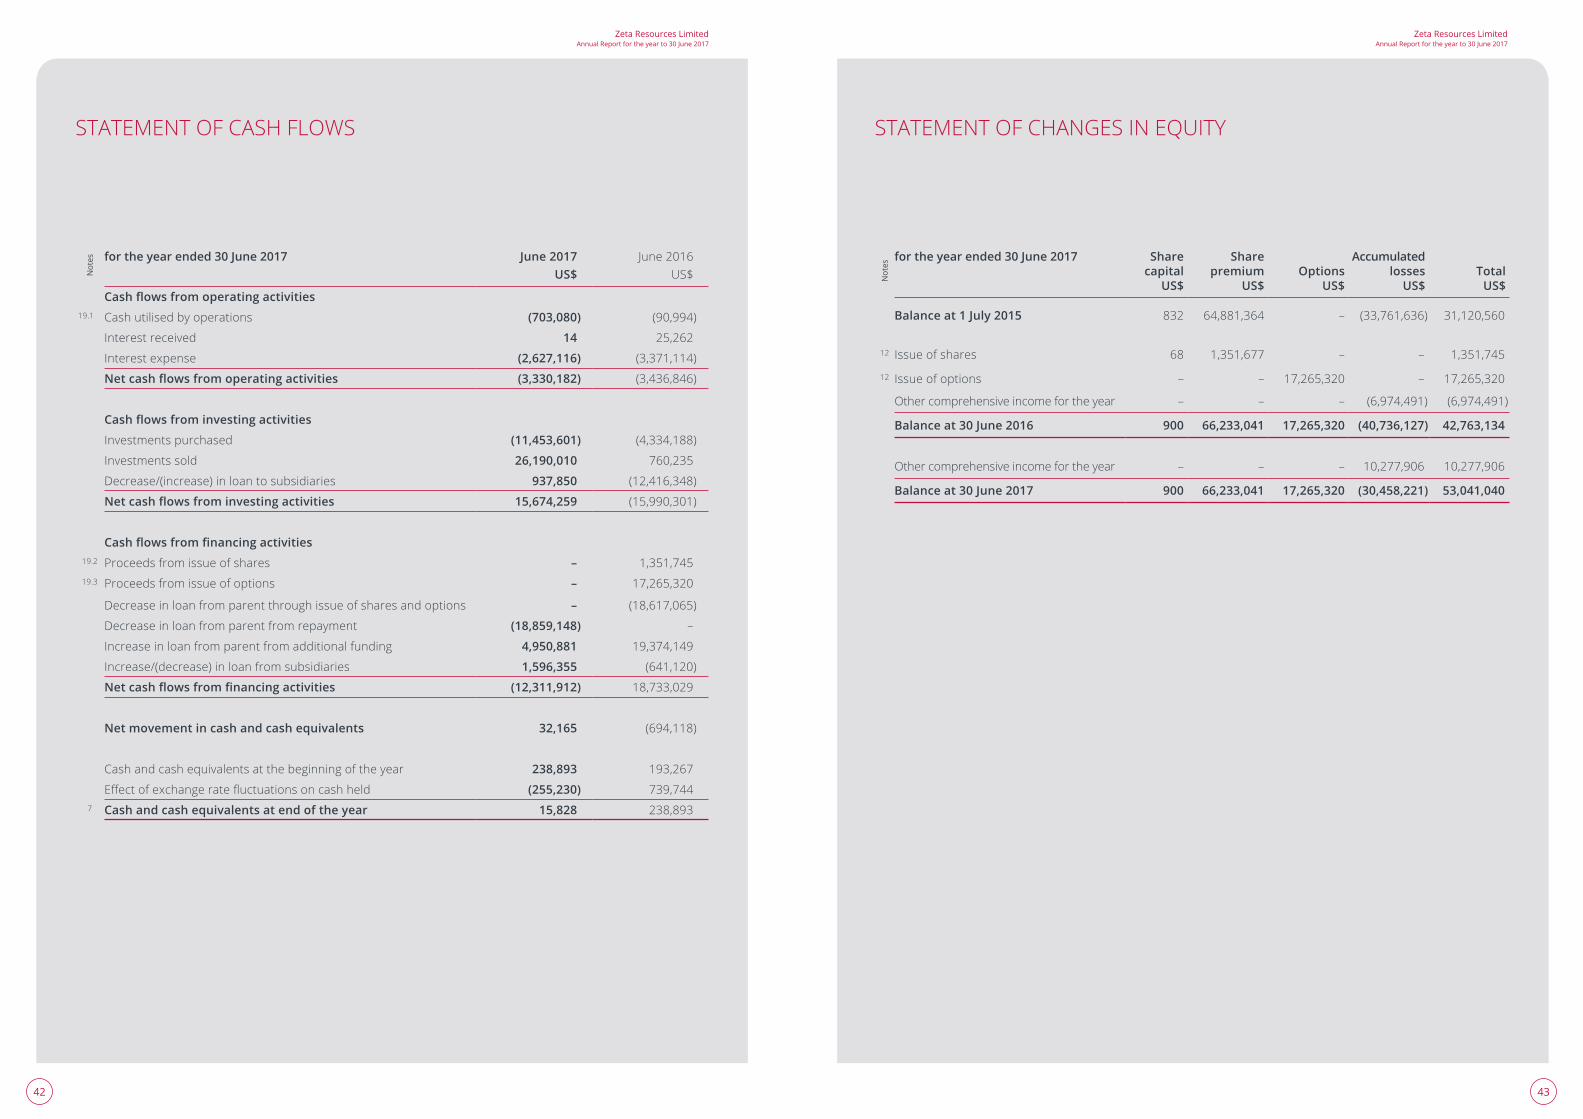
STATEMENT OF CASH FLOWS
Not
es for the year ended 30 June 2017 June 2017 US$
June 2016 US$
Cash flows from operating activities19.1 Cash utilised by operations (703,080) (90,994)
Interest received 14 25,262
Interest expense (2,627,116) (3,371,114)
Net cash flows from operating activities (3,330,182) (3,436,846)
Cash flows from investing activities
Investments purchased (11,453,601) (4,334,188)
Investments sold 26,190,010 760,235
Decrease/(increase)inloantosubsidiaries 937,850 (12,416,348)
Net cash flows from investing activities 15,674,259 (15,990,301)
Cash flows from financing activities19.2 Proceeds from issue of shares – 1,351,74519.3 Proceeds from issue of options – 17,265,320
Decrease in loan from parent through issue of shares and options – (18,617,065)
Decrease in loan from parent from repayment (18,859,148) –
Increase in loan from parent from additional funding 4,950,881 19,374,149
Increase/(decrease)inloanfromsubsidiaries 1,596,355 (641,120)
Net cash flows from financing activities (12,311,912) 18,733,029
Net movement in cash and cash equivalents 32,165 (694,118)
Cash and cash equivalents at the beginning of the year 238,893 193,267
Effectofexchangeratefluctuationsoncashheld (255,230) 739,7447 Cash and cash equivalents at end of the year 15,828 238,893
STATEMENT OF CHANGES IN EQUITY
Not
es
for the year ended 30 June 2017 Share capital
US$
Share premium
US$Options
US$
Accumulated losses
US$Total
US$
Balance at 1 July 2015 832 64,881,364 – (33,761,636) 31,120,560
12 Issue of shares 68 1,351,677 – – 1,351,745
12 Issue of options – – 17,265,320 – 17,265,320
Other comprehensive income for the year – – – (6,974,491) (6,974,491)
Balance at 30 June 2016 900 66,233,041 17,265,320 (40,736,127) 42,763,134
Other comprehensive income for the year – – – 10,277,906 10,277,906
Balance at 30 June 2017 900 66,233,041 17,265,320 (30,458,221) 53,041,040
4544
Zeta Resources LimitedAnnual Report for the year to 30 June 2017
Zeta Resources LimitedAnnual Report for the year to 30 June 2017
NOTES TO THE FINANCIAL STATEMENTS
1. BASIS OF PREPARATION
1.1 Corporate information
Zeta Resources Limited (“the company”) is an investment company incorporated on 13 August 2012, listed on the Australian StockExchangeanddomiciledinBermuda.Thefinancialstatementsofthecompanyasatandfortheyearended30June2017comprise the company only.
1.2 Basis of preparation
Thefinancialstatementsfortheperiodended30June2017havebeenpreparedinaccordancewithInternationalFinancialReportingStandards (IFRSs). The following accounting policies have, in all material respects, been applied consistently. The company carries on the business of an investment holding company. The purpose of the company is to earn returns through capital appreciation or investment income. The company is accordingly applying the consolidation exemption for investments in subsidiaries.
Thefinancialstatementswereauthorisedforissuebytheboardofdirectorson12September2017.
1.3 Basis of measurement
The financial statements provide information about the financial position, results of operations and changes in financialpositionof thecompany.Theyhavebeenpreparedonthehistoriccostbasisexcept forfinancial instrumentsat fairvaluethroughprofitorloss,whicharemeasuredatfairvalue.
1.4 Functional and presentation currency
The company’s functional and presentational currency is United States Dollars.
1.5 Use of estimates and judgements
Thepreparationoffinancialstatements inconformitywith IFRSrequiresmanagementtomake judgements,estimatesandassumptions that affect theapplicationof accountingpolicies and the reportedamountsof assets, liabilities, incomeandexpense.Actualresultsmaydifferfromtheseestimates.
The estimates and underlying assumptions are reviewed on an on-going basis. Revisions are recognised in the period in which theestimateisrevisedandinanyfutureperiodsaffected.
Informationaboutassumptionsandestimationuncertaintiesthathaveasignificantriskofresultinginamaterialadjustmentwithinthenextfinancialyear,aswellascriticaljudgementsinapplyingaccountingpoliciesthathavethemostsignificanteffectontheamountsrecognisedinthefinancialstatementsareincludedinnote21.
2. ADOPTION OF NEW AND REVISED STANDARDSFuture amendments not early adopted in the 2017 year ended financial statements
Atthedateofthesefinancialstatementsthefollowingstandards,amendmentstostandards,andinterpretations,whicharerelevantto the company, have been issued by the International Accounting Standards Board, but have not yet been adopted by the company.
IFRS9FinancialInstruments(effectiveforyearscommencingonorafter1January2018)-thisstandardaddressestheinitialmeasurementandclassificationoffinancialassetsaseithermeasuredatamortisedcostoratfairvalue.Financialassetsaremeasuredatamortisedcostwhenthebusinessmodelistoholdassetsinordertocollectcontractualcashflows.Allotherfinancialassetsaremeasuredatfairvaluewithchangesrecognisedinprofitorloss.Foraninvestmentinanequityinstrumentthat is not held for trading, an entity may on initial recognition elect to present all fair value changes from the investment in other comprehensive income.
IFRS9retainstheclassificationandmeasurementrequirementsinIAS39forfinancialliabilities.Thestandardhoweverrequiresforfinancialliabilitiesdesignatedunderthefairvalueoption(otherthanloancommitmentsandfinancialguaranteecontracts),thatthe amount of change in fair value attributable to changes in the credit risk of the liability be presented in other comprehensive income(OCI).Theremainingamountofthetotalgainorlossisincludedinprofitorloss.However,ifthisrequirementcreatesorenlargesanaccountingmismatchinprofitorloss,thenthewholefairvaluechangeispresentedinprofitorloss.
IFRS9willbeadoptedforthefirsttimefortheyearending30June2019,subjecttocertaintransitionalprovisions.Theimpactonthefinancialstatementshasnotyetbeenestimated.
IFRS 16 Leases - as Zeta Resources is an investment entity, its main operations are to invest in securities. All other business operations are outsourced and therefore no leases are held by Zeta Resources. This indicates that IFRS 16 will have no impact onZetaResources.IFRS15Revenue–ZetaResources’revenueconsistsonlyofdividendincomeandrealisedandunrealisedgains and losses. These income streams are not impacted by IFRS 15.
3. SIGNIFICANT ACCOUNTING POLICIESThe accounting policies detailed below have been consistently applied by the company.
3.1 Revenue
Dividends receivable are recognised as income on the ex-dividend date.
Gains or losses on the sale of investments are recorded on the trade date.
Investmentincomealsocomprisesgainsonchangesinthefairvalueoffinancialassetsatfairvaluethroughprofitorloss.
Interest income is accrued on a time basis by reference to the principal outstanding and at the interest rate applicable.
3.2 Borrowing costs
Borrowing costs are recognised as an expense when incurred.
3.3 Income tax
Current tax assets and liabilities for the current and prior periods are measured at the amount expected to be recovered from or paid to the taxation authorities. The tax rates and tax laws used to compute the amount are those that are enacted or substantively enacted by the balance sheet date.
3.4 Foreign currency
Foreign currency transactions and balances
Transactions in foreign currencies are translated into the respective functional currencies of the company at exchange rates at the dates of the transaction. Monetary assets and liabilities denominated in foreign currencies at the reporting date are retranslated to the functional currency at the exchange rate at that date. The foreign currency gain or loss on monetary items is thedifferencebetweenamortised cost in the functional currency at thebeginningof theperiod, adjusted for effectiveinterest and payments during the period, and the amortised cost in foreign currency translated at the exchange rate at the endoftheperiod.Theforeigncurrencygainsorlossesarerecognisedinprofitorloss.
Foreigncurrencydifferencesarisingonretranslationarerecognisedinothercomprehensiveincome.
3.5 Earnings per share ("EPS")
Basic EPS is calculated as net result attributable to members, adjusted to exclude costs of servicing equity (other than dividends) and preference share dividends, divided by the weighted average number of ordinary shares, adjusted for any bonus element.
DilutedEPSiscalculatedasnetresultattributabletomembers,adjustedfor:
• costsofservicingequity(otherthandividends)andpreferencesharedividends;
• theaftertaxeffectofdividendsandinterestassociatedwithpotentialdilutiveordinarysharesthathavebeenrecognisedasexpenses;and
• other non-discretionary changes in revenues or expenses during the period that would result from the dilution of potential ordinary shares divided by the weighted average number of ordinary shares and potential dilutive ordinary shares, adjusted for any bonus element.
3.6 Financial instruments
Non-derivative financial instruments
Non-derivativefinancialinstrumentscompriseinvestmentsinlistedandunlistedsecurities,investmentloans,tradeandotherreceivables,cashandcashequivalents,tradeandotherpayablesandamountsdueto/frombrokers.
Non-derivativefinancialinstrumentsarerecognisedinitiallyatfairvalueplus,forinstrumentsnotatfairvaluethroughprofitorloss,anydirectlyattributabletransactioncosts.Subsequenttoinitialrecognitionnon-derivativefinancialinstrumentsaremeasured as described below.
Recognition and derecognition of financial instrumentsFinancial instruments are recognised when, and only when, the company becomes a party to the contractual provisions of the particularinstrument.Thecompanyderecognisesafinancialassetwhenthecontractualrightstothecashflowsarisingfromthefinancialassethaveexpiredorwhenittransferstherightstoreceivethecontractualcashflowsonthefinancialassetinatransactioninwhichsubstantiallyalltherisksandrewardsofownershipofthefinancialassetaretransferred.
4746
Zeta Resources LimitedAnnual Report for the year to 30 June 2017
Zeta Resources LimitedAnnual Report for the year to 30 June 2017
3. SIGNIFICANT ACCOUNTING POLICIES (continued)
3.6 Financial instruments (continued)
Non-derivative financial instruments (continued)
Afinancialliabilityisderecognisedwhentheliabilityisextinguished,thatbeing,whentheobligationspecifiedinthecontractisdischarged,cancelledorhasexpired.Thedifferencebetweenthecarryingamountofafinancialliabilityassumed(orpartthereof) extinguished or transferred to another party and the consideration paid, including any non-cash assets transferred orliabilitiesassumed,isrecognisedinprofitorloss.
Financial assets at fair value through profit or lossInvestment purchases and sales are accounted for on the trade date, exclusive of transaction costs. Investments used for efficientportfoliomanagementareclassifiedasbeingatfairvaluethroughprofitorloss.Asthecompany’sbusinessisinvestinginfinancialassetswithaviewtoprofitingfromtheirtotalreturnintheformofdividends,interestorincreasesinfairvalue,itsinvestmentsaredesignatedasbeingatfairvaluethroughprofitorlossoninitialrecognition.
Gains and losses on investments are analysed within the statement of comprehensive income as capital return. Quoted investments are shown at fair value using market bid prices. The fair value of unquoted investments is determined by the board. In exercising its judgement over the value of these investments, the board uses valuation techniques which take into account, where appropriate, latest dealing prices, valuations from reliable sources, asset values, earnings and other relevant factors.
Cash and cash equivalentsCash and cash equivalents are measured at amortised cost at the reporting date. Cash and cash equivalents comprise operating cash balances, call deposits and short-term deposits with a maturity of three months or less.
Non-derivative financial liabilitiesThecompanyhasthefollowingnon-derivativefinancialliabilities:loansandborrowings,tradeandotherreceivables,tradeandotherpayablesandamountsdueto/frombrokers.
Allotherfinancialliabilities(includingliabilitiesdesignatedatfairvaluethroughprofitorloss)arerecognisedinitiallyonthetrade date at which the company becomes a party to the contractual provisions of the instrument. The company derecognises afinancialliabilitywhenitscontractualobligationsaredischargedorcancelledorexpire.Thedifferencebetweenthecarryingamountofafinancialliabilityassumed(orpartthereof),extinguishedortransferredtoanotherpartyandconsiderationpaid,includinganynon-cashassetstransferredorliabilitiesassumed,isrecognisedinprofitorloss.
Trade and other payablesTrade and other payables are initially recognised at original invoice amount and are subsequently stated at amortised cost by applying theeffective interestmethod. Trade andotherpayables arenotdiscountedwhere theeffectsof discountingis considered immaterial. Trade and other payables are settled within 30 to 90 days and are interest free. Any gains on derecognitionarerecognisedinprofitorloss.
3.7 Impairment of assets
Financial assets
Afinancialassetisassessedateachreportingdatetodeterminewhetherthereisanyobjectiveevidencethatitisimpaired.Afinancialassetisconsideredtobeimpairedifobjectiveevidenceindicatesthatoneormoreeventshavehadanegativeeffectontheestimatedfuturecashflowsofthatasset.
Animpairmentlossinrespectofafinancialassetiscalculatedasthedifferencebetweenitscarryingamount,andthepresentvalueoftheestimatedfuturecashflowsdiscountedattheoriginaleffectiveinterestrate.Animpairmentlossinrespectofanavailable-for-salefinancialassetiscalculatedbyreferencetoitsfairvalue.
Significant financial assets are tested for impairment on an individual basis. The remaining financial assets are assessedcollectivelyingroupsthatsharesimilarcreditriskcharacteristics.Allimpairmentlossesarerecognisedinprofitorloss.Anycumulativelossinrespectofanavailablefor-salefinancialassetrecognisedpreviouslyinequityistransferredtoprofitorloss.
Financial assets related to subsidiaries are measured at fair value under IAS 39, in line with the requirements for investment entities under IFRS 10.
Non-financial assets
The carrying amountsof thenon-financial assets, other thandeferred tax assets, are reviewedat each reportingdate todetermine whether there is any indication of impairment. If any such indication exists, then the asset's recoverable amount is estimated. An impairment loss is recognised if the carrying amount of an asset exceeds its estimated recoverable amount. Impairmentlossesarerecognisedinprofitorloss.
NOTES TO THE FINANCIAL STATEMENTS(continued)
3. SIGNIFICANT ACCOUNTING POLICIES (continued)
3.7 Impairment of assets (continued)
Non-financial assets (continued)
The recoverable amount of an asset is the greater of its value in use and its fair value less cost to sell. The fair value less cost to sell is the amount obtainable from the sale of an asset in an arm's length transaction less the cost of disposal. While assessing valueinuse,theestimatedfuturecashflowsarediscountedtotheirpresentvalueusingapre-taxdiscountratethatreflectsthecurrentmarketassessmentsofthetimevalueofmoneyandtherisksspecifictotheasset.
In respect of other assets, impairment losses recognised in prior periods are assessed at each reporting date for any indications that the loss has decreased or no longer exists. An impairment loss is reversed if there has been a change in the estimates used to determine the recoverable amount. An impairment loss is reversed only to the extent that the asset's carrying amount does not exceed the carrying amount that would have been determined, net of depreciation or amortisation, if no impairment loss had been recognised.
3.8 Share capital
Ordinary shares are classified as equity. Incremental costsdirectly attributable to the issueof ordinary shares and shareoptions are recognised as a deduction from equity.
3.9 Provisions and accruals
Provisions are recognised when the company has a present legal or constructive obligation as a result of past events, for whichitisprobablethatanoutflowofeconomicbenefitswilloccur,andwhereareliableestimatecanbemadeoftheamountof the obligation. The expense relating to any provision is presented in the statement of comprehensive income net of any reimbursement. If theeffectofdiscounting ismaterial,provisionsarediscounted.Thediscountrateused isapre-taxratethatreflectscurrentmarketassessmentsofthetimevalueofmoneyand,whereappropriate,therisksspecifictotheliability.
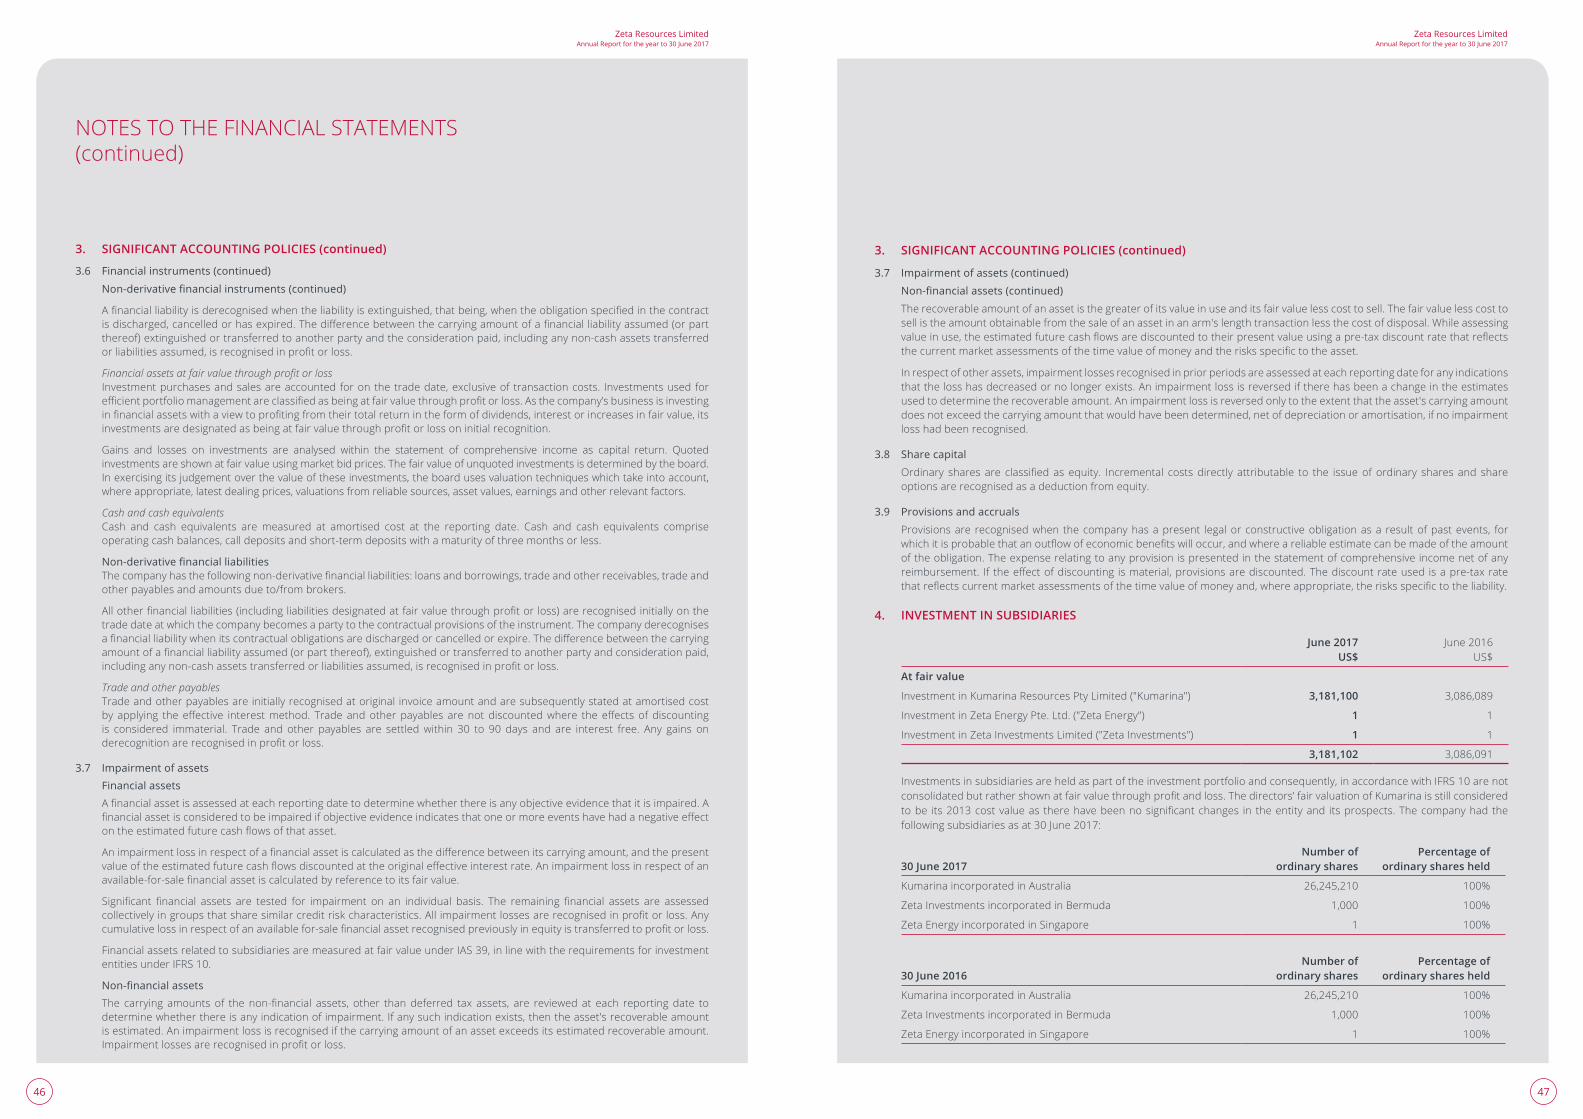
4. INVESTMENT IN SUBSIDIARIES
June 2017 US$
June 2016 US$
At fair value
InvestmentinKumarinaResourcesPtyLimited("Kumarina") 3,181,100 3,086,089
InvestmentinZetaEnergyPte.Ltd.("ZetaEnergy") 1 1
InvestmentinZetaInvestmentsLimited("ZetaInvestments") 1 1
3,181,102 3,086,091
Investments in subsidiaries are held as part of the investment portfolio and consequently, in accordance with IFRS 10 are not consolidatedbutrathershownatfairvaluethroughprofitandloss.Thedirectors’fairvaluationofKumarinaisstillconsideredtobe its2013costvalueas therehavebeennosignificantchanges in theentityand itsprospects.Thecompanyhadthefollowingsubsidiariesasat30June2017:
30 June 2017Number of
ordinary sharesPercentage of
ordinary shares held
KumarinaincorporatedinAustralia 26,245,210 100%
Zeta Investments incorporated in Bermuda 1,000 100%
Zeta Energy incorporated in Singapore 1 100%
30 June 2016Number of
ordinary sharesPercentage of
ordinary shares held
KumarinaincorporatedinAustralia 26,245,210 100%
Zeta Investments incorporated in Bermuda 1,000 100%
Zeta Energy incorporated in Singapore 1 100%
4948
Zeta Resources LimitedAnnual Report for the year to 30 June 2017
Zeta Resources LimitedAnnual Report for the year to 30 June 2017
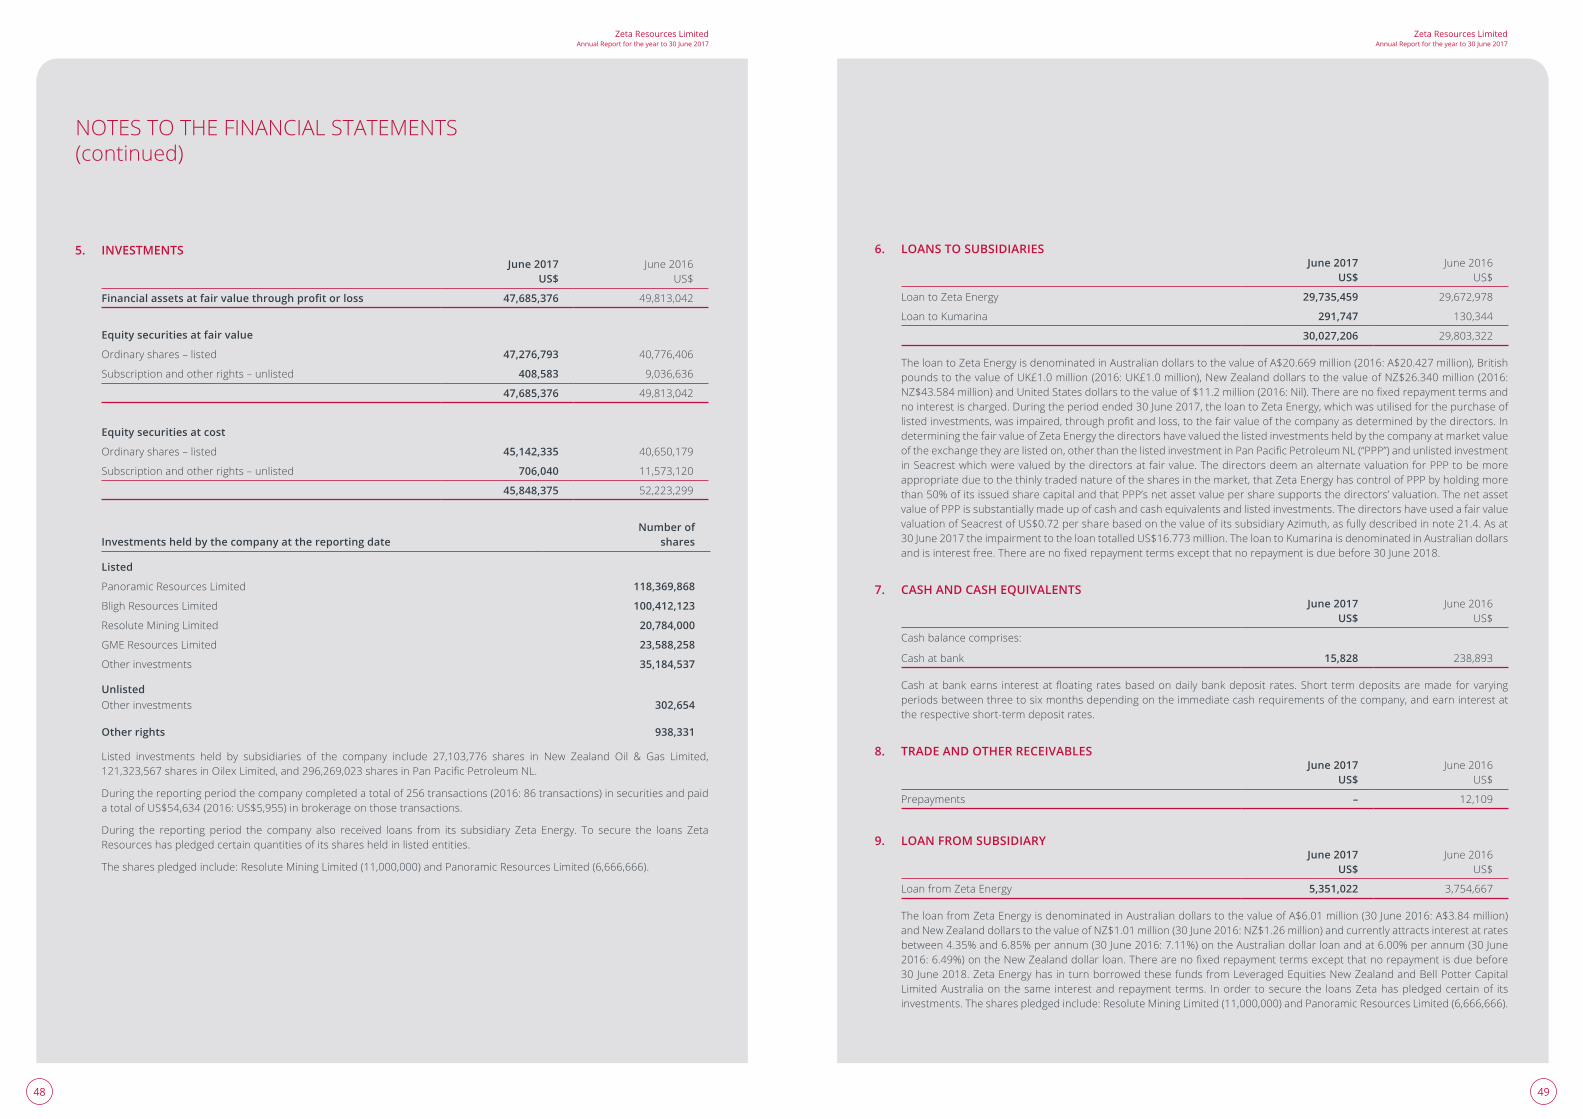
5. INVESTMENTSJune 2017
US$June 2016
US$
Financial assets at fair value through profit or loss 47,685,376 49,813,042
Equity securities at fair value
Ordinaryshares–listed 47,276,793 40,776,406
Subscriptionandotherrights–unlisted 408,583 9,036,636
47,685,376 49,813,042
Equity securities at cost
Ordinaryshares–listed 45,142,335 40,650,179
Subscriptionandotherrights–unlisted 706,040 11,573,120
45,848,375 52,223,299
Investments held by the company at the reporting dateNumber of
shares
Listed
Panoramic Resources Limited 118,369,868
Bligh Resources Limited 100,412,123
Resolute Mining Limited 20,784,000
GME Resources Limited 23,588,258
Other investments 35,184,537
UnlistedOther investments 302,654
Other rights 938,331
Listed investments held by subsidiaries of the company include 27,103,776 shares in New Zealand Oil & Gas Limited, 121,323,567sharesinOilexLimited,and296,269,023sharesinPanPacificPetroleumNL.
Duringthereportingperiodthecompanycompletedatotalof256transactions(2016:86transactions)insecuritiesandpaidatotalofUS$54,634(2016:US$5,955)inbrokerageonthosetransactions.
During the reporting period the company also received loans from its subsidiary Zeta Energy. To secure the loans Zeta Resources has pledged certain quantities of its shares held in listed entities.
Thesharespledgedinclude:ResoluteMiningLimited(11,000,000)andPanoramicResourcesLimited(6,666,666).
NOTES TO THE FINANCIAL STATEMENTS(continued)
6. LOANS TO SUBSIDIARIESJune 2017
US$June 2016
US$
Loan to Zeta Energy 29,735,459 29,672,978
LoantoKumarina 291,747 130,344
30,027,206 29,803,322
TheloantoZetaEnergyisdenominatedinAustraliandollarstothevalueofA$20.669million(2016:A$20.427million),BritishpoundstothevalueofUK£1.0million(2016:UK£1.0million),NewZealanddollarstothevalueofNZ$26.340million(2016:NZ$43.584million)andUnitedStatesdollarstothevalueof$11.2million(2016:Nil).Therearenofixedrepaymenttermsandno interest is charged. During the period ended 30 June 2017, the loan to Zeta Energy, which was utilised for the purchase of listedinvestments,wasimpaired,throughprofitandloss,tothefairvalueofthecompanyasdeterminedbythedirectors.Indetermining the fair value of Zeta Energy the directors have valued the listed investments held by the company at market value oftheexchangetheyarelistedon,otherthanthelistedinvestmentinPanPacificPetroleumNL(“PPP”)andunlistedinvestmentin Seacrest which were valued by the directors at fair value. The directors deem an alternate valuation for PPP to be more appropriate due to the thinly traded nature of the shares in the market, that Zeta Energy has control of PPP by holding more than 50% of its issued share capital and that PPP’s net asset value per share supports the directors’ valuation. The net asset value of PPP is substantially made up of cash and cash equivalents and listed investments. The directors have used a fair value valuationofSeacrestofUS$0.72persharebasedonthevalueofitssubsidiaryAzimuth,asfullydescribedinnote21.4.Asat30June2017theimpairmenttotheloantotalledUS$16.773million.TheloantoKumarinaisdenominatedinAustraliandollarsandisinterestfree.Therearenofixedrepaymenttermsexceptthatnorepaymentisduebefore30June2018.
7. CASH AND CASH EQUIVALENTSJune 2017
US$June 2016
US$
Cashbalancecomprises:
Cash at bank 15,828 238,893
Cashatbankearns interestatfloatingratesbasedondailybankdeposit rates.Short termdepositsaremade forvaryingperiods between three to six months depending on the immediate cash requirements of the company, and earn interest at the respective short-term deposit rates.
8. TRADE AND OTHER RECEIVABLESJune 2017
US$June 2016
US$
Prepayments – 12,109
9. LOAN FROM SUBSIDIARYJune 2017
US$June 2016
US$
Loan from Zeta Energy 5,351,022 3,754,667
TheloanfromZetaEnergyisdenominatedinAustraliandollarstothevalueofA$6.01million(30June2016:A$3.84million)andNewZealanddollarstothevalueofNZ$1.01million(30June2016:NZ$1.26million)andcurrentlyattractsinterestatratesbetween4.35%and6.85%perannum(30June2016:7.11%)ontheAustraliandollarloanandat6.00%perannum(30June2016:6.49%)ontheNewZealanddollarloan.Therearenofixedrepaymenttermsexceptthatnorepaymentisduebefore 30 June 2018. Zeta Energy has in turn borrowed these funds from Leveraged Equities New Zealand and Bell Potter Capital Limited Australia on the same interest and repayment terms. In order to secure the loans Zeta has pledged certain of its investments.Thesharespledgedinclude:ResoluteMiningLimited(11,000,000)andPanoramicResourcesLimited(6,666,666).

5150
Zeta Resources LimitedAnnual Report for the year to 30 June 2017
Zeta Resources LimitedAnnual Report for the year to 30 June 2017
10. LOAN FROM PARENTJune 2017
US$June 2016
US$
Loan from UIL Limited (“UIL”) 22,257,029 36,165,296
TheloanisdenominatedinAustraliandollarstothevalueofA$28.99million(30June2016:A$45.4million),carriesinterestat7.5%perannum(30June2016:10%)andnorepaymentisduebefore30June2018.DuringtheyearthecompanyconvertedA$15.86millionofloansintoNZ$17millionofwhichNZ$15.05millionwasrepaidinMay2017.FollowingtherepaymentthebalanceoftheNZ$loanwasconvertedbackintoA$.DuringtheyearthecompanyreceivedA$2.6millionoffundingforthepurchaseofinvestments,capitalisedinterestofA$5.93millionandmadefurtherrepaymentsofA$10.70million.
11. TRADE AND OTHER PAYABLESJune 2017
US$June 2016
US$
Accruals 260,421 192,220
The accruals are for audit, management, directors and administration fees payable.
12. SHARE CAPITAL AND SHARE PREMIUMAuthorised
5,000,000,000ordinarysharesofparvalueUS$0.00001
IssuedNumber of
sharesShare
capitalShare
premium
Ordinary shares
Balance as at incorporation – –
IssuedatincorporationasUS$1parshares 100 – –
Sharessplitinto10,000,000sharesofUS$0.00001each 9,999,900 – –
Issued in consideration for purchase of investments from UIL 22,835,042 228 32,221,936
Issuedinconsiderationforpurchaseof100%ofKumarina Resources Limited
17,775,514 178 13,406,337
Issuedunderinitialpublicoffering 4,000 – 3,795
Issued under public rights issue dated 10 February 2014 42,616,164 426 19,249,296
Following shareholder approval, issued under ASX listing rule 10.11 dated 7 December 2015
6,769,280 68 1,351,677
Balance as at 30 June 2016 100,000,000 900 66,233,041
Balance as at 30 June 2017 100,000,000 900 66,233,041
For further details related to the share issue transactions please see note 19.2.
OptionsJune 2017
US$June 2016
US$
Options
Balance at the beginning of the year (Note (a)) 86,461,440 17,265,320 –
Following shareholder approval, issued under ASX listing rule 10.11 dated 7 December 2015
– – 17,265,320
Balance at the end of the year 86,461,440 17,265,320 17,265,320
Note(a)TheoptionswereexercisableatanexercisepriceofA$1.00intooneordinaryshareuntil7December2019.
NOTES TO THE FINANCIAL STATEMENTS(continued)
13. INVESTMENT INCOME/(LOSSES)June 2017
US$June 2016
US$
Interest income 14 25,262
Dividend income 380,939 –
Realised gains 8,361,485 17,756
Unrealisedfairvaluegains/(losses):
Financialassetsatfairvaluethroughprofitorloss 4,342,269 2,427,511
Impairmentofloantosubsidiaryatfairvaluethroughprofitorloss 1,161,734 (6,507,296)
14,246,441 (4,036,767)
14. OTHER (LOSSES)/INCOMEJune 2017
US$June 2016
US$
Foreignexchange(losses)/gains (255,230) 739,744
Other income 41,404 697,988
(213,826) 1,437,732
15. MANAGEMENT AND CONSULTING FEESJune 2017
US$June 2016
US$
Management and consulting fees 662,662 560,884
The company entered into an investment management agreement with ICM Limited (Bermuda registered) on 10 April 2013. Management fees are payable at a rate of 0.5% per annum, of funds managed on calculation date, payable quarterly in arrears and pro-rated for any period less than three months.
Performancefeesarepayableannuallyatyearendonthedifferencebetweenadjustedequityfunds(adjustedforanydividendspaid or accrued) on calculation date less adjusted base equity funds (high-water mark) previously used in the performance fee calculation multiplied by 15%. The adjusted base equity funds is the base equity fund used in the last performance fee calculationadjustedbytheaveragepercentageincomeyieldontheS&P/ASX300MetalsandMiningIndex.Noperformancefeewaspayableinthecurrentperiod(2016:US$Nil).
Either party may terminate the agreement with six months’ notice. The agreement has an expiry date of 3 June 2018.
16. OPERATING AND ADMINISTRATION EXPENSESJune 2017
US$June 2016
US$
Operatingandadministrationexpensesconsistof:
Accounting fees 115,645 82,833
Audit fees 20,838 14,463
Australian Stock Exchange listing fees and regulation costs 55,620 47,694
Insurance costs 14,153 14,042
Other expenses 108,675 134,426
314,931 293,458
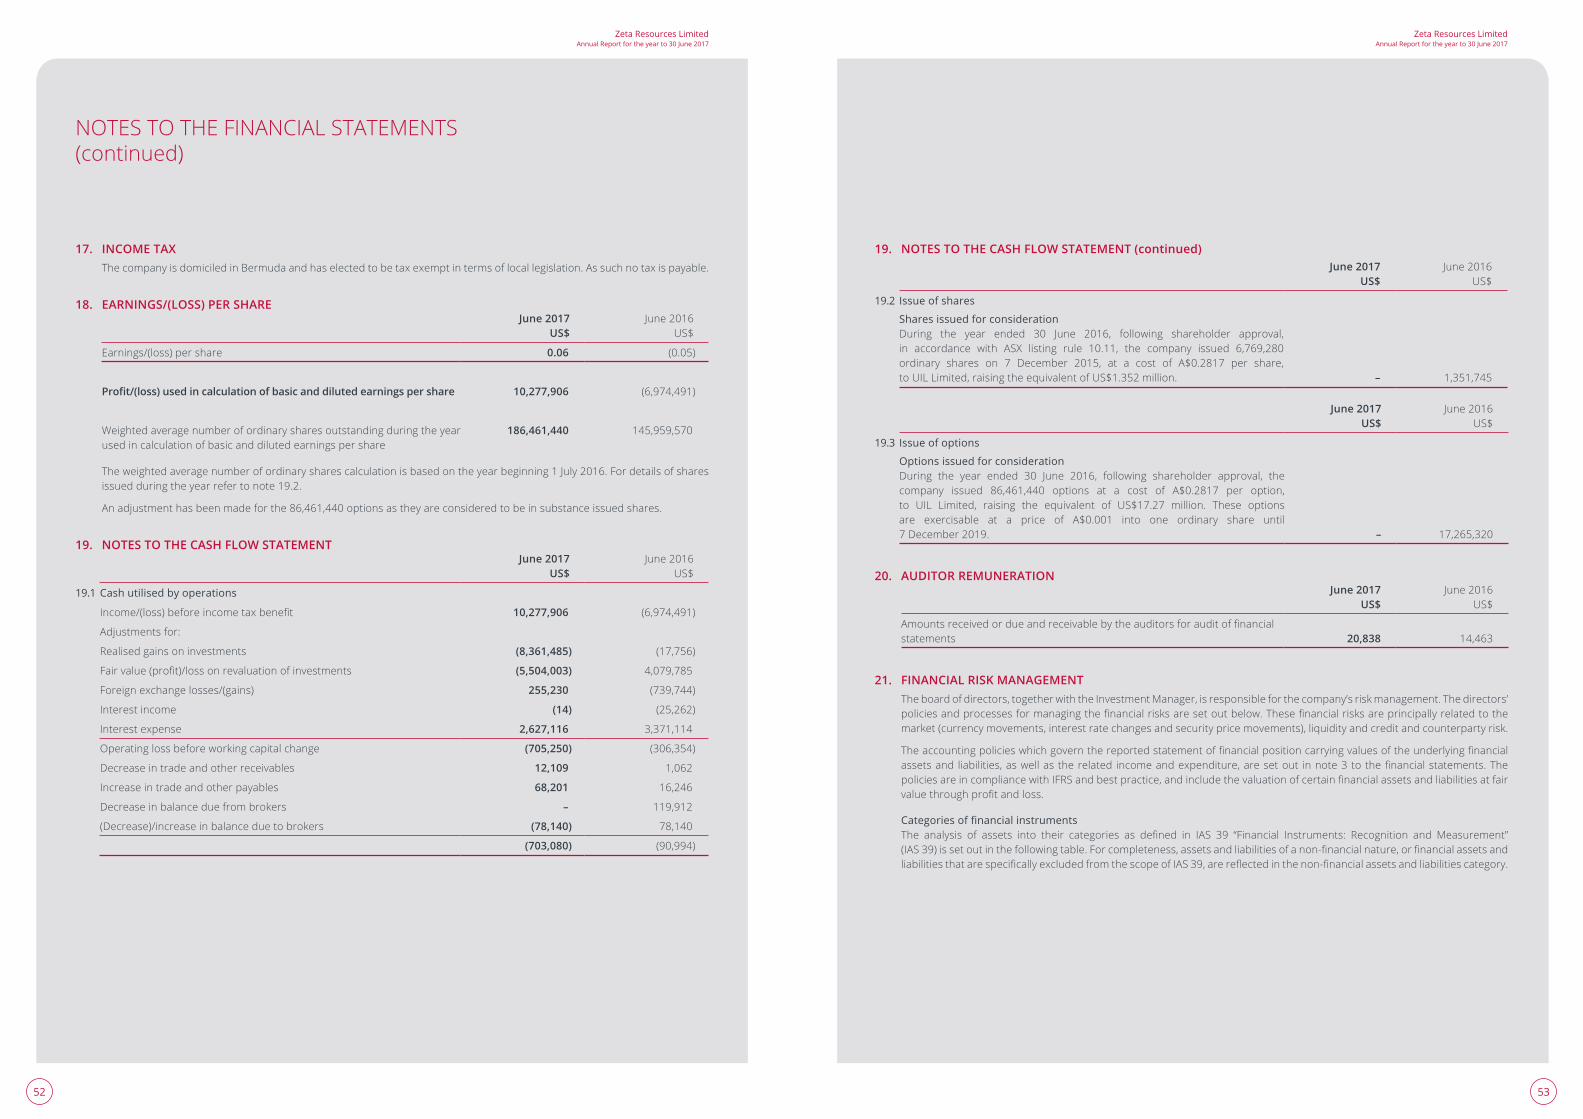
5352
Zeta Resources LimitedAnnual Report for the year to 30 June 2017
Zeta Resources LimitedAnnual Report for the year to 30 June 2017
17. INCOME TAXThe company is domiciled in Bermuda and has elected to be tax exempt in terms of local legislation. As such no tax is payable.
18. EARNINGS/(LOSS) PER SHAREJune 2017
US$June 2016
US$
Earnings/(loss)pershare 0.06 (0.05)
Profit/(loss) used in calculation of basic and diluted earnings per share 10,277,906 (6,974,491)
Weighted average number of ordinary shares outstanding during the year used in calculation of basic and diluted earnings per share
186,461,440 145,959,570
The weighted average number of ordinary shares calculation is based on the year beginning 1 July 2016. For details of shares issued during the year refer to note 19.2.
An adjustment has been made for the 86,461,440 options as they are considered to be in substance issued shares.
19. NOTES TO THE CASH FLOW STATEMENTJune 2017
US$June 2016
US$
19.1 Cash utilised by operations
Income/(loss)beforeincometaxbenefit 10,277,906 (6,974,491)
Adjustmentsfor:
Realised gains on investments (8,361,485) (17,756)
Fairvalue(profit)/lossonrevaluationofinvestments (5,504,003) 4,079,785
Foreignexchangelosses/(gains) 255,230 (739,744)
Interest income (14) (25,262)
Interest expense 2,627,116 3,371,114
Operating loss before working capital change (705,250) (306,354)
Decrease in trade and other receivables 12,109 1,062
Increase in trade and other payables 68,201 16,246
Decrease in balance due from brokers – 119,912
(Decrease)/increaseinbalanceduetobrokers (78,140) 78,140
(703,080) (90,994)
NOTES TO THE FINANCIAL STATEMENTS(continued)
19. NOTES TO THE CASH FLOW STATEMENT (continued) June 2017
US$June 2016
US$
19.2 Issue of shares
Shares issued for considerationDuring the year ended 30 June 2016, following shareholder approval, in accordance with ASX listing rule 10.11, the company issued 6,769,280 ordinary shares on 7 December 2015, at a cost of A$0.2817 per share, toUILLimited,raisingtheequivalentofUS$1.352million. – 1,351,745
June 2017 US$
June 2016 US$
19.3 Issue of options
Options issued for considerationDuring the year ended 30 June 2016, following shareholder approval, the company issued 86,461,440 options at a cost of A$0.2817 per option,to UIL Limited, raising the equivalent of US$17.27 million. These optionsare exercisable at a price of A$0.001 into one ordinary share until 7 December 2019. – 17,265,320
20. AUDITOR REMUNERATIONJune 2017
US$June 2016
US$
Amountsreceivedordueandreceivablebytheauditorsforauditoffinancialstatements 20,838 14,463
21. FINANCIAL RISK MANAGEMENTThe board of directors, together with the Investment Manager, is responsible for the company’s risk management. The directors’ policiesandprocessesformanagingthefinancialrisksaresetoutbelow.Thesefinancialrisksareprincipallyrelatedtothemarket (currency movements, interest rate changes and security price movements), liquidity and credit and counterparty risk.
Theaccountingpolicieswhichgovernthereportedstatementoffinancialpositioncarryingvaluesoftheunderlyingfinancialassetsand liabilities,aswellastherelated incomeandexpenditure,aresetout innote3tothefinancialstatements.ThepoliciesareincompliancewithIFRSandbestpractice,andincludethevaluationofcertainfinancialassetsandliabilitiesatfairvaluethroughprofitandloss.
Categories of financial instrumentsThe analysis of assets into their categories as defined in IAS 39 “Financial Instruments: Recognition and Measurement” (IAS39)issetoutinthefollowingtable.Forcompleteness,assetsandliabilitiesofanon-financialnature,orfinancialassetsandliabilitiesthatarespecificallyexcludedfromthescopeofIAS39,arereflectedinthenon-financialassetsandliabilitiescategory.
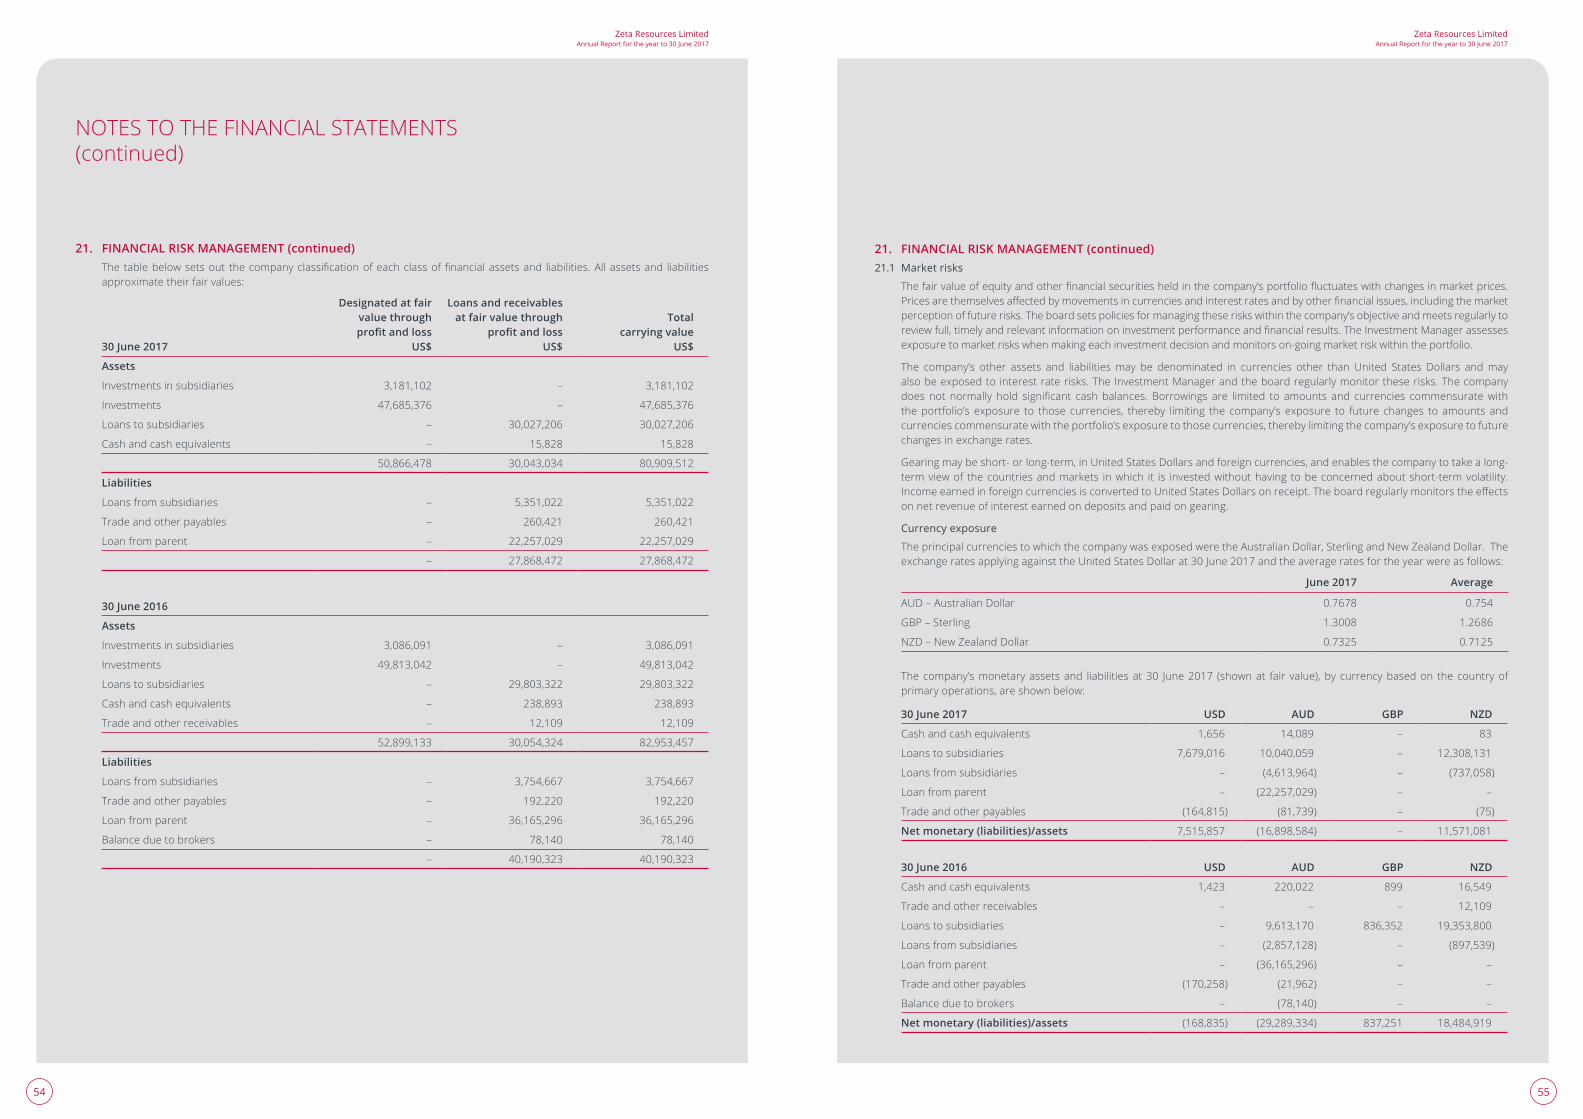
5554
Zeta Resources LimitedAnnual Report for the year to 30 June 2017
Zeta Resources LimitedAnnual Report for the year to 30 June 2017
21. FINANCIAL RISK MANAGEMENT (continued)Thetablebelowsetsout thecompanyclassificationofeachclassoffinancialassetsand liabilities.Allassetsand liabilitiesapproximatetheirfairvalues:
30 June 2017
Designated at fair value through profit and loss
US$
Loans and receivables at fair value through
profit and loss US$
Total carrying value
US$
Assets
Investments in subsidiaries 3,181,102 – 3,181,102
Investments 47,685,376 – 47,685,376
Loans to subsidiaries – 30,027,206 30,027,206
Cash and cash equivalents – 15,828 15,828
50,866,478 30,043,034 80,909,512
Liabilities
Loans from subsidiaries – 5,351,022 5,351,022
Trade and other payables – 260,421 260,421
Loan from parent – 22,257,029 22,257,029
– 27,868,472 27,868,472
30 June 2016
Assets
Investments in subsidiaries 3,086,091 – 3,086,091
Investments 49,813,042 – 49,813,042
Loans to subsidiaries – 29,803,322 29,803,322
Cash and cash equivalents – 238,893 238,893
Trade and other receivables – 12,109 12,109
52,899,133 30,054,324 82,953,457
Liabilities
Loans from subsidiaries – 3,754,667 3,754,667
Trade and other payables – 192,220 192,220
Loan from parent – 36,165,296 36,165,296
Balance due to brokers – 78,140 78,140
– 40,190,323 40,190,323
NOTES TO THE FINANCIAL STATEMENTS(continued)
21. FINANCIAL RISK MANAGEMENT (continued)21.1 Market risks
Thefairvalueofequityandotherfinancialsecuritiesheldinthecompany’sportfoliofluctuateswithchangesinmarketprices.Pricesarethemselvesaffectedbymovementsincurrenciesandinterestratesandbyotherfinancialissues,includingthemarketperception of future risks. The board sets policies for managing these risks within the company’s objective and meets regularly to reviewfull,timelyandrelevantinformationoninvestmentperformanceandfinancialresults.TheInvestmentManagerassessesexposure to market risks when making each investment decision and monitors on-going market risk within the portfolio.
The company’s other assets and liabilities may be denominated in currencies other than United States Dollars and may also be exposed to interest rate risks. The Investment Manager and the board regularly monitor these risks. The company doesnot normally hold significant cashbalances. Borrowings are limited to amounts and currencies commensuratewiththe portfolio’s exposure to those currencies, thereby limiting the company’s exposure to future changes to amounts and currencies commensurate with the portfolio’s exposure to those currencies, thereby limiting the company’s exposure to future changes in exchange rates.
Gearing may be short- or long-term, in United States Dollars and foreign currencies, and enables the company to take a long-term view of the countries and markets in which it is invested without having to be concerned about short-term volatility. IncomeearnedinforeigncurrenciesisconvertedtoUnitedStatesDollarsonreceipt.Theboardregularlymonitorstheeffectson net revenue of interest earned on deposits and paid on gearing.
Currency exposure
The principal currencies to which the company was exposed were the Australian Dollar, Sterling and New Zealand Dollar. The exchangeratesapplyingagainsttheUnitedStatesDollarat30June2017andtheaverageratesfortheyearwereasfollows:
June 2017 Average
AUD–AustralianDollar 0.7678 0.754
GBP–Sterling 1.3008 1.2686
NZD–NewZealandDollar 0.7325 0.7125
The company’s monetary assets and liabilities at 30 June 2017 (shown at fair value), by currency based on the country of primaryoperations,areshownbelow:
30 June 2017 USD AUD GBP NZD
Cash and cash equivalents 1,656 14,089 – 83
Loans to subsidiaries 7,679,016 10,040,059 – 12,308,131
Loans from subsidiaries – (4,613,964) – (737,058)
Loan from parent – (22,257,029) – –
Trade and other payables (164,815) (81,739) – (75)
Net monetary (liabilities)/assets 7,515,857 (16,898,584) – 11,571,081
30 June 2016 USD AUD GBP NZD
Cash and cash equivalents 1,423 220,022 899 16,549
Trade and other receivables – – – 12,109
Loans to subsidiaries – 9,613,170 836,352 19,353,800
Loans from subsidiaries – (2,857,128) – (897,539)
Loan from parent – (36,165,296) – –
Trade and other payables (170,258) (21,962) – –
Balance due to brokers – (78,140) – –
Net monetary (liabilities)/assets (168,835) (29,289,334) 837,251 18,484,919
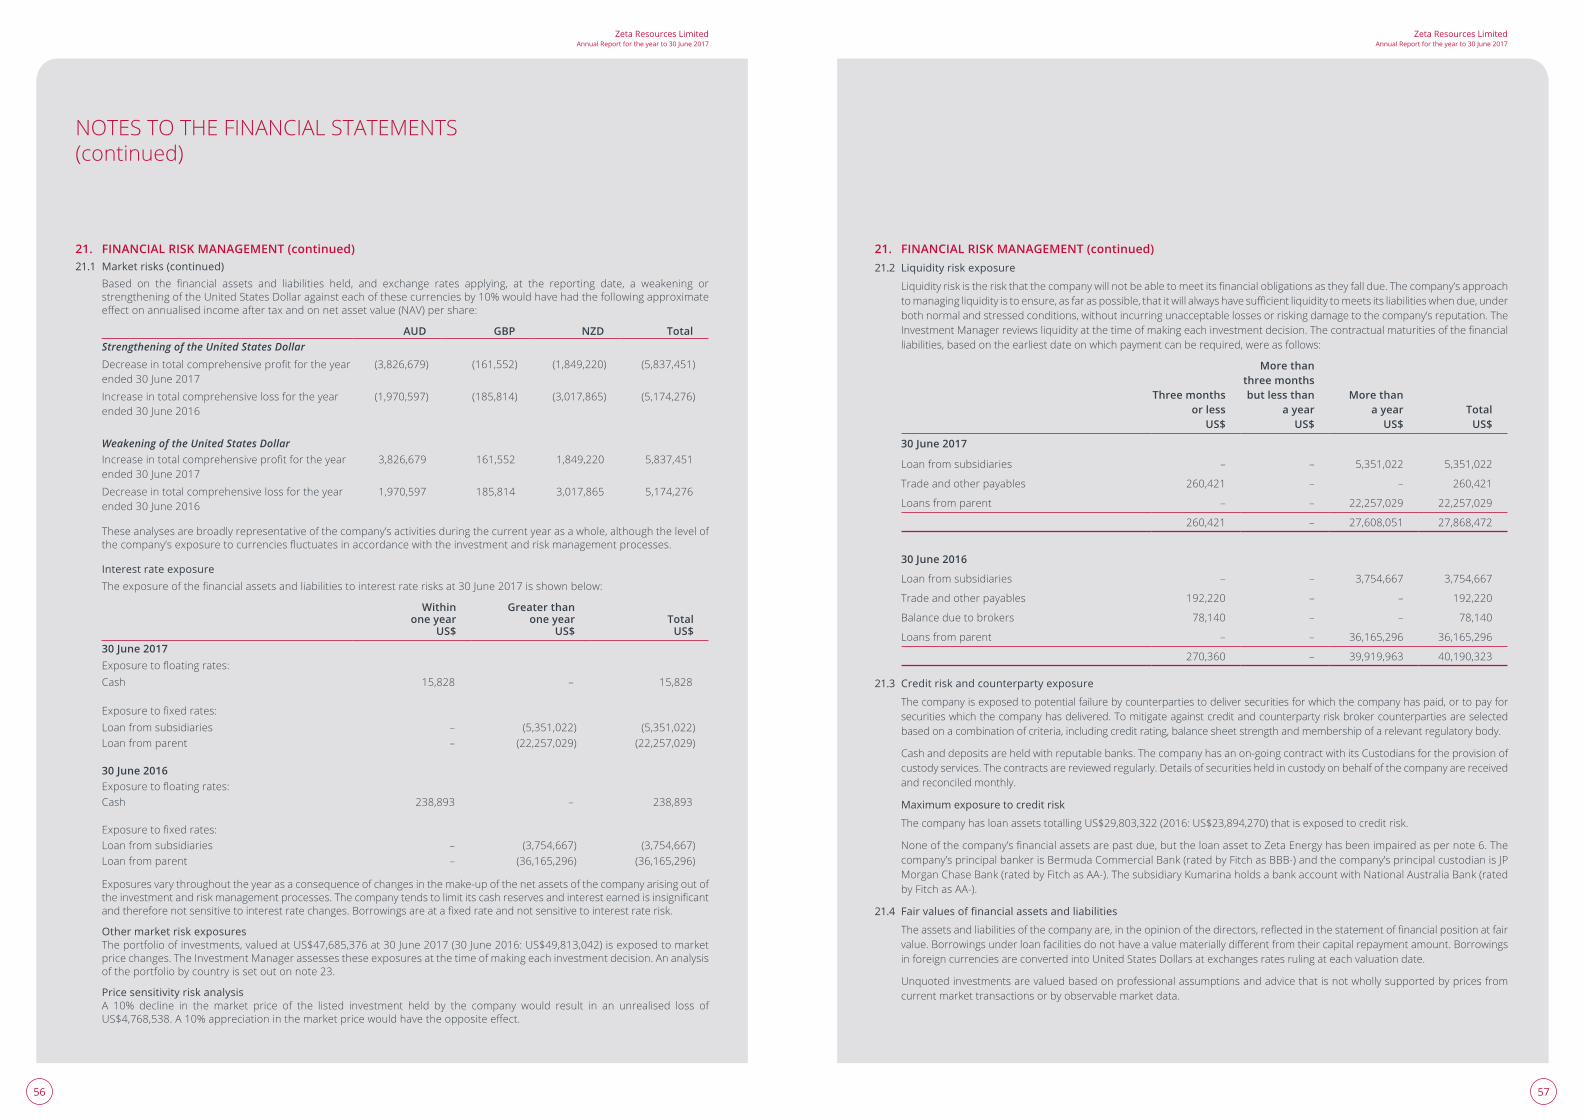
5756
Zeta Resources LimitedAnnual Report for the year to 30 June 2017
Zeta Resources LimitedAnnual Report for the year to 30 June 2017
21. FINANCIAL RISK MANAGEMENT (continued)21.1 Market risks (continued)
Based on the financial assets and liabilities held, and exchange rates applying, at the reporting date, a weakening orstrengthening of the United States Dollar against each of these currencies by 10% would have had the following approximate effectonannualisedincomeaftertaxandonnetassetvalue(NAV)pershare:
AUD GBP NZD TotalStrengthening of the United States DollarDecreaseintotalcomprehensiveprofitfortheyearended 30 June 2017
(3,826,679) (161,552) (1,849,220) (5,837,451)
Increase in total comprehensive loss for the year ended 30 June 2016
(1,970,597) (185,814) (3,017,865) (5,174,276)
Weakening of the United States DollarIncreaseintotalcomprehensiveprofitfortheyearended 30 June 2017
3,826,679 161,552 1,849,220 5,837,451
Decrease in total comprehensive loss for the year ended 30 June 2016
1,970,597 185,814 3,017,865 5,174,276
These analyses are broadly representative of the company’s activities during the current year as a whole, although the level of thecompany’sexposuretocurrenciesfluctuatesinaccordancewiththeinvestmentandriskmanagementprocesses.
Interest rate exposure Theexposureofthefinancialassetsandliabilitiestointerestraterisksat30June2017isshownbelow:
Within one year
US$
Greater than one year
US$Total
US$30 June 2017Exposuretofloatingrates:Cash 15,828 – 15,828
Exposuretofixedrates:Loan from subsidiaries – (5,351,022) (5,351,022)Loan from parent – (22,257,029) (22,257,029)
30 June 2016Exposuretofloatingrates:Cash 238,893 – 238,893
Exposuretofixedrates:Loan from subsidiaries – (3,754,667) (3,754,667)Loan from parent – (36,165,296) (36,165,296)
Exposures vary throughout the year as a consequence of changes in the make-up of the net assets of the company arising out of theinvestmentandriskmanagementprocesses.Thecompanytendstolimititscashreservesandinterestearnedisinsignificantandthereforenotsensitivetointerestratechanges.Borrowingsareatafixedrateandnotsensitivetointerestraterisk.
Other market risk exposures Theportfolioofinvestments,valuedatUS$47,685,376at30June2017(30June2016:US$49,813,042)isexposedtomarketprice changes. The Investment Manager assesses these exposures at the time of making each investment decision. An analysis of the portfolio by country is set out on note 23.
Price sensitivity risk analysis A 10% decline in the market price of the listed investment held by the company would result in an unrealised loss of US$4,768,538.A10%appreciationinthemarketpricewouldhavetheoppositeeffect.
NOTES TO THE FINANCIAL STATEMENTS(continued)
21. FINANCIAL RISK MANAGEMENT (continued)21.2 Liquidity risk exposure
Liquidityriskistheriskthatthecompanywillnotbeabletomeetitsfinancialobligationsastheyfalldue.Thecompany’sapproachtomanagingliquidityistoensure,asfaraspossible,thatitwillalwayshavesufficientliquiditytomeetsitsliabilitieswhendue,underboth normal and stressed conditions, without incurring unacceptable losses or risking damage to the company’s reputation. The InvestmentManagerreviewsliquidityatthetimeofmakingeachinvestmentdecision.Thecontractualmaturitiesofthefinancialliabilities,basedontheearliestdateonwhichpaymentcanberequired,wereasfollows:
Three months or less
US$
More than three months but less than
a year US$
More than a year
US$Total
US$
30 June 2017
Loan from subsidiaries – – 5,351,022 5,351,022
Trade and other payables 260,421 – – 260,421
Loans from parent – – 22,257,029 22,257,029
260,421 – 27,608,051 27,868,472
30 June 2016
Loan from subsidiaries – – 3,754,667 3,754,667
Trade and other payables 192,220 – – 192,220
Balance due to brokers 78,140 – – 78,140
Loans from parent – – 36,165,296 36,165,296
270,360 – 39,919,963 40,190,323
21.3 Credit risk and counterparty exposure
The company is exposed to potential failure by counterparties to deliver securities for which the company has paid, or to pay for securities which the company has delivered. To mitigate against credit and counterparty risk broker counterparties are selected based on a combination of criteria, including credit rating, balance sheet strength and membership of a relevant regulatory body.
Cash and deposits are held with reputable banks. The company has an on-going contract with its Custodians for the provision of custody services. The contracts are reviewed regularly. Details of securities held in custody on behalf of the company are received and reconciled monthly.
Maximum exposure to credit risk
ThecompanyhasloanassetstotallingUS$29,803,322(2016:US$23,894,270)thatisexposedtocreditrisk.
Noneofthecompany’sfinancialassetsarepastdue,buttheloanassettoZetaEnergyhasbeenimpairedaspernote6.Thecompany’s principal banker is Bermuda Commercial Bank (rated by Fitch as BBB-) and the company’s principal custodian is JP MorganChaseBank(ratedbyFitchasAA-).ThesubsidiaryKumarinaholdsabankaccountwithNationalAustraliaBank(ratedby Fitch as AA-).
21.4 Fair values of financial assets and liabilities
Theassetsandliabilitiesofthecompanyare,intheopinionofthedirectors,reflectedinthestatementoffinancialpositionatfairvalue.Borrowingsunderloanfacilitiesdonothaveavaluemateriallydifferentfromtheircapitalrepaymentamount.Borrowingsin foreign currencies are converted into United States Dollars at exchanges rates ruling at each valuation date.
Unquoted investments are valued based on professional assumptions and advice that is not wholly supported by prices from current market transactions or by observable market data.

5958
Zeta Resources LimitedAnnual Report for the year to 30 June 2017
Zeta Resources LimitedAnnual Report for the year to 30 June 2017
21. FINANCIAL RISK MANAGEMENT (continued)21.4 Fair values of financial assets and liabilities (continued)
Valuation of financial instruments
Thetablebelowanalysesfinancialassetsmeasuredatfairvalueattheendoftheyearbythelevelinthefairvaluehierarchyintowhichthefairvaluemeasurementiscategorised:
Level 1 The fair values are measured using quoted prices in active markets.
Level 2 The fair values are measured using inputs, other than quoted prices, that are included within level 1, that are observable for the asset.
Level 3 The fair values are measured using inputs for the asset or liability that are not based on observable market data. The directors make use of recognised valuation techniques and may take account of recent arms’ length transactions in the same or similar investments.
The Directors regularly review the principles applied by the Investment Manager to those valuations to ensure they comply with the company’s accounting policies and with fair value principles.
Level 3 financial instruments
Valuation methodologyThedirectorshavesatisfiedthemselvesastothemethodologyused,thediscountratesandkeyassumptionsapplied,andthevaluation. The level 3 assets have each been assessed based on its industry, location and business cycle. Where sensible, the directors have taken into account observable data and events to underpin the valuations.
The level 3 investments are split between (a) unlisted companies and (b) investments and loans in subsidiaries.
(a) Unlisted companies
Seacrest LP (“Seacrest”) - Bermuda incorporatedValuationinputs:TheunlistedinvestmentcomprisesanequityinterestinSeacrest.Thecompany’ssoleassetisitsholdingin Azimuth, a joint venture between Seacrest and PGS (the listed Norwegian seismic data service company). Azimuth owns a number of operating subsidiaries.
The valuation of Azimuth is based on fair value GAAP accounting. Using the General Partner’s valuation of the Seacrest portfolio a discount is applied to each Azimuth subsidiary. The extent of the discount depends on whether the assets are in a mature or frontier basin. In addition, following the fall in the oil price a further discount was applied thereby calculating a fairvalue forAzimuth.On thisbasisAzimuthwasvaluedasat30 June2017atUS$63.62m.Thedirector’sdeemthisvaluation method to be appropriate.
Valuationmethodology:ZetahasusedafairvaluevaluationofSeacrestofUS$0.72persharebasedonthevalueofAzimuth,described above.
Sensitivities:Given Azimuth is an exploration company its risks are significant in both directions. Should commerciallyrecoverable oil not be discovered then the value will fall to nil. Should substantial commercially recoverable oil be discovered thevaluationupliftsaresignificant.
(b) Investments and loans in subsidiaries
Zeta Energy - Singapore incorporatedValuationinputs:ThekeyassetistheinvestmentloantoZetaEnergywhichwasutilisedforthepurchaseoflistedinvestments,andwhichwasimpaired,throughprofitandloss,tothefairvalueofthecompanyasdeterminedbythedirectorsbasedonthe valuation of the investments held by Zeta Energy as at 30 June 2017.
Valuationmethodology:ZetahasusedafairvaluevaluationoflossesincurredbyZetaEnergyonitsinvestmentsbywhichto impair the loan value in the accounts as at 30 June 2017.
Sensitivities:GivenZetaEnergy’sassetscompriselistedinvestmentsitsrisksaresignificantinbothdirections.Increasesinshare prices will increase the value of the loan and decreases in share prices will further decrease the value of the loan.
Other investments and loans to subsidiaries Zetahasfurtherinvestmentsandloanstosubsidiariesvaluedatbookandrealisablevalue,withatotalvalueofUS$3.2m(2016:US$3.1m).
NOTES TO THE FINANCIAL STATEMENTS(continued)
21. FINANCIAL RISK MANAGEMENT (continued)21.4 Fair values of financial assets and liabilities (continued)
30 June 2016Level 1
US$Level 2
US$Level 3
US$
Financial assets
Investments 47,276,793 – 408,583
Investment in subsidiaries – – 3,181,102
Loan to subsidiary – – 30,027,206
There have been no movements between the level 1 and level 3 categories.
The following table shows a reconciliation from opening balances to closing balances for fair value measurements in level 3 investmentsofthefairvaluehierarchy:
Level 3 investments
US$
Level 3 investments in subsidiary
US$
Level 3 loan to
subsidiary US$
Balance at 1 July 2016 9,036,636 3,086,091 29,803,322
Acquisitions at cost 332,920 – 11,200,000
Disposals during the year (11,200,000) – (12,137,850)
Totalgainsrecognisedin:Fairvaluethroughprofitorloss 2,239,027 95,011 1,161,734
Balance at 30 June 2017 408,583 3,181,102 30,027,206
30 June 2016Level 1
US$Level 2
US$Level 3
US$
Financial assets
Investments 40,776,406 – 9,036,636
Investment in subsidiaries – – 3,086,091
Loan to subsidiary – – 29,803,322
Balance at 30 June 2016 40,776,406 – 9,036,636
The following table shows a reconciliation from opening balances to closing balances for fair value measurements in level 3 investmentsofthefairvaluehierarchy:
Level 3 investments
US$
Level 3 investments in subsidiary
US$
Level 3 loan to
subsidiary US$
Balance at 1 July 2015 13,424,975 3,193,721 23,894,270
Acquisitions at cost – – 12,416,347
Disposals during the year – – –
Totallossesrecognisedin:Fairvaluethroughprofitorloss (4,388,339) (107,630) (6,507,295)
Balance at 30 June 2016 9,036,636 3,086,091 29,803,322

6160
Zeta Resources LimitedAnnual Report for the year to 30 June 2017
Zeta Resources LimitedAnnual Report for the year to 30 June 2017
21. FINANCIAL RISK MANAGEMENT (continued)21.5 Capital risk management
The objective of the company is stated as being to maximise shareholder returns by identifying and investing in investments wheretheunderlyingvalueisnotreflectedinthemarketprice.Inpursuingthislongtermobjective,theboardhasaresponsibilityfor ensuring the company’s ability to continue as a going concern. It must therefore maintain an optimal capital structure through varying market conditions. This involves the ability to issue and buy back share capital within limits set by the shareholders in generalmeeting;borrowmoniesintheshortandlongterm;andpaydividendstoshareholdersoutofcurrentyearearningsaswell as out of brought forward reserves.
22. RELATED PARTIES
22.1 Material related parties Holding company The company’s holding company is UIL which held 85.5% of the company’s issued share capital on 30 June 2017. UIL is in turn held 62.09% by General Provincial Life Pension Fund Limited.
Subsidiary companiesThecompany’ssubsidiariesareKumarina,ZetaEnergyandZetaInvestments,all100%heldsubsidiaries.
Key management personnelKeymanagementpersonnelandtheirclosefamilymembersandentitieswhichtheycontrol,jointlyoroverwhichtheyexercisesignificantinfluenceareconsideredrelatedpartiesofthecompany.Thecompany’sdirectors,aslistedintheDirector’sreportare considered to be key management personnel of the company.
Investment Manager ICM Limited is an Investment Manager of both the company, its subsidiaries and UIL.
22.2 Material related parties transactionsJune 2017
US$June 2016
US$
Nature of transactionsInvestmentsinrelatedparties:Kumarina 3,181,100 3,086,089Zeta Investments 1 1Zeta Energy 1 1
Loanstorelatedparties:Kumarina 291,747 130,344Zeta Energy 29,735,459 29,672,978
Loansfromrelatedparties:Utilico 22,257,029 36,165,296Zeta Energy 5,351,022 3,754,667
Tradeandotherpayables:ICM Limited 162,057 103,829Directors 37,500 37,500
Interest charged by the subsidiaries 380,552 318,776Interest charged by the parent company 2,246,555 3,051,091Interest charged by the Investment Manager – 1,225Fees paid to the Investment Manager 481,772 344,464Fees paid to the directors 150,000 150,000
During the year ended 30 June 2017 the company held a loan from its subsidiary Zeta Energy. To secure the loan Zeta Resources has pledged certain quantities of its shares held in listed entities.
Thesharespledgedinclude:ResoluteMiningLimited(11,000,000)andPanoramicResourcesLimited(6,666,666).
NOTES TO THE FINANCIAL STATEMENTS(continued)
23. SEGMENTAL REPORTING
The company has four reportable segments, as described below, which are considered to be the company’s strategic investment areas.Foreachinvestmentarea,thecompany’schiefoperatingdecisionmaker(“CODM”)(ICMLimited–investmentmanager)reviews internal management reports on at least a monthly basis. The following summary describes each of the company’s reportablesegments:
Gold:investmentsincompanieswhichminegold
Oil & Gas:investmentsincompanieswhichextractorprospectforoilorgas
Mineral Exploration:investmentsincompanieswhichexploreorminefornickel,copperandotherminerals
Other segments:activitieswhichdonotfitintooneoftheabovesegments
Information regarding the results of each reportable segment is included below. Performance is measured based on segment profit before tax, as included in the internal management reports that are reviewed by the company’s CODM. Segmentprofitisusedtomeasureperformanceasmanagementbelievesthatsuchinformationisthemostrelevantinevaluatingtheperformance of certain segments relative to other entities that operate within these industries.
Information about reportable segments
30 June 2017Gold US$
Oil & gas US$
Mineral exploration
US$
Other segments
US$Total
US$
External revenues 3,354,866 3,560,753 7,337,443 (6,621) 14,246,441
Reportable segment revenue 3,354,866 3,560,753 7,337,443 (6,621) 14,246,441
Interest revenue – – – 14 14
Interest expense – – – (2,627,116) (2,627,116)
Reportablesegmentprofit/(loss)before tax
3,396,270 3,560,753 7,337,443 (4,016,560) 10,277,906
Reportable segment assets 26,371,713 30,392,342 24,129,627 15,830 80,909,512
Reportable segment liabilities – – – (27,868,472) (27,868,472)
30 June 2016Gold US$
Oil & gas US$
Mineral exploration
US$
Other segments
US$Total
US$
External revenues 22,471,287 (11,016,091) (15,375,751) (116,212) (4,036,767)
Reportable segment revenue 22,471,287 (11,016,091) (15,375,751) (116,212) (4,036,767)
Interest revenue – – – 25,262 25,262
Interest expense – – – (3,371,114) (3,371,114)
Reportable segment loss before tax 22,471,287 (10,543,292) (15,150,562) (3,751,924) (6,974,491)
Reportable segment assets 32,747,455 39,573,255 10,375,105 257,642 82,953,457
Reportable segment liabilities – – (78,140) (40,112,183) (40,190,323)
During the year there were no transactions between segments which resulted in income or expenditure.
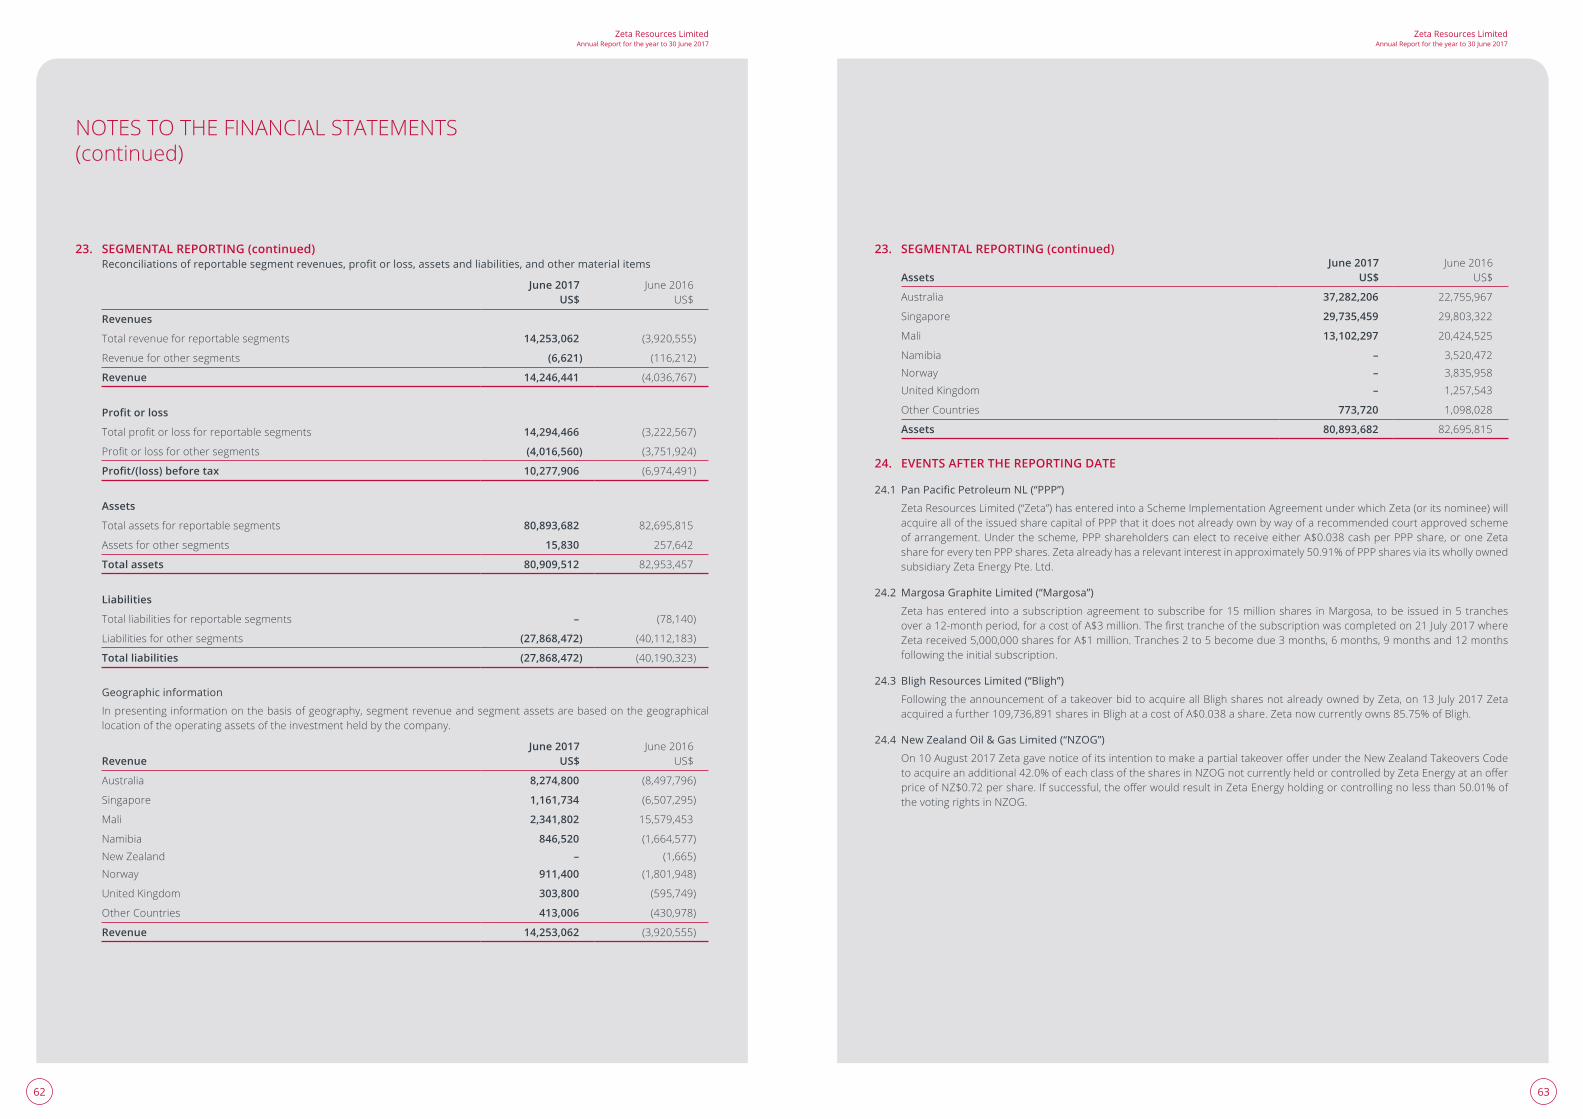
6362
Zeta Resources LimitedAnnual Report for the year to 30 June 2017
Zeta Resources LimitedAnnual Report for the year to 30 June 2017
23. SEGMENTAL REPORTING (continued)Reconciliations of reportable segment revenues, profit or loss, assets and liabilities, and other material items
June 2017 US$
June 2016 US$
Revenues
Total revenue for reportable segments 14,253,062 (3,920,555)
Revenue for other segments (6,621) (116,212)
Revenue 14,246,441 (4,036,767)
Profit or loss
Totalprofitorlossforreportablesegments 14,294,466 (3,222,567)
Profitorlossforothersegments (4,016,560) (3,751,924)
Profit/(loss) before tax 10,277,906 (6,974,491)
Assets
Total assets for reportable segments 80,893,682 82,695,815
Assets for other segments 15,830 257,642
Total assets 80,909,512 82,953,457
Liabilities
Total liabilities for reportable segments – (78,140)
Liabilities for other segments (27,868,472) (40,112,183)
Total liabilities (27,868,472) (40,190,323)
Geographic information
In presenting information on the basis of geography, segment revenue and segment assets are based on the geographical location of the operating assets of the investment held by the company.
RevenueJune 2017
US$June 2016
US$
Australia 8,274,800 (8,497,796)
Singapore 1,161,734 (6,507,295)
Mali 2,341,802 15,579,453
Namibia 846,520 (1,664,577)
New Zealand – (1,665)
Norway 911,400 (1,801,948)
UnitedKingdom 303,800 (595,749)
Other Countries 413,006 (430,978)
Revenue 14,253,062 (3,920,555)
NOTES TO THE FINANCIAL STATEMENTS(continued)
23. SEGMENTAL REPORTING (continued)
AssetsJune 2017
US$June 2016
US$
Australia 37,282,206 22,755,967
Singapore 29,735,459 29,803,322
Mali 13,102,297 20,424,525
Namibia – 3,520,472
Norway – 3,835,958
UnitedKingdom – 1,257,543
Other Countries 773,720 1,098,028
Assets 80,893,682 82,695,815
24. EVENTS AFTER THE REPORTING DATE
24.1 Pan Pacific Petroleum NL (“PPP”)
Zeta Resources Limited (“Zeta”) has entered into a Scheme Implementation Agreement under which Zeta (or its nominee) will acquire all of the issued share capital of PPP that it does not already own by way of a recommended court approved scheme ofarrangement.Underthescheme,PPPshareholderscanelecttoreceiveeitherA$0.038cashperPPPshare,oroneZetashare for every ten PPP shares. Zeta already has a relevant interest in approximately 50.91% of PPP shares via its wholly owned subsidiary Zeta Energy Pte. Ltd.
24.2 Margosa Graphite Limited (“Margosa”)
Zeta has entered into a subscription agreement to subscribe for 15 million shares in Margosa, to be issued in 5 tranches overa12-monthperiod,foracostofA$3million.Thefirsttrancheofthesubscriptionwascompletedon21July2017whereZetareceived5,000,000sharesforA$1million.Tranches2to5becomedue3months,6months,9monthsand12monthsfollowing the initial subscription.
24.3 Bligh Resources Limited (“Bligh”)
Following the announcement of a takeover bid to acquire all Bligh shares not already owned by Zeta, on 13 July 2017 Zeta acquiredafurther109,736,891sharesinBlighatacostofA$0.038ashare.Zetanowcurrentlyowns85.75%ofBligh.
24.4 New Zealand Oil & Gas Limited (“NZOG”)
On10August2017ZetagavenoticeofitsintentiontomakeapartialtakeoverofferundertheNewZealandTakeoversCodetoacquireanadditional42.0%ofeachclassofthesharesinNZOGnotcurrentlyheldorcontrolledbyZetaEnergyatanofferpriceofNZ$0.72pershare.Ifsuccessful,theofferwouldresultinZetaEnergyholdingorcontrollingnolessthan50.01%ofthe voting rights in NZOG.
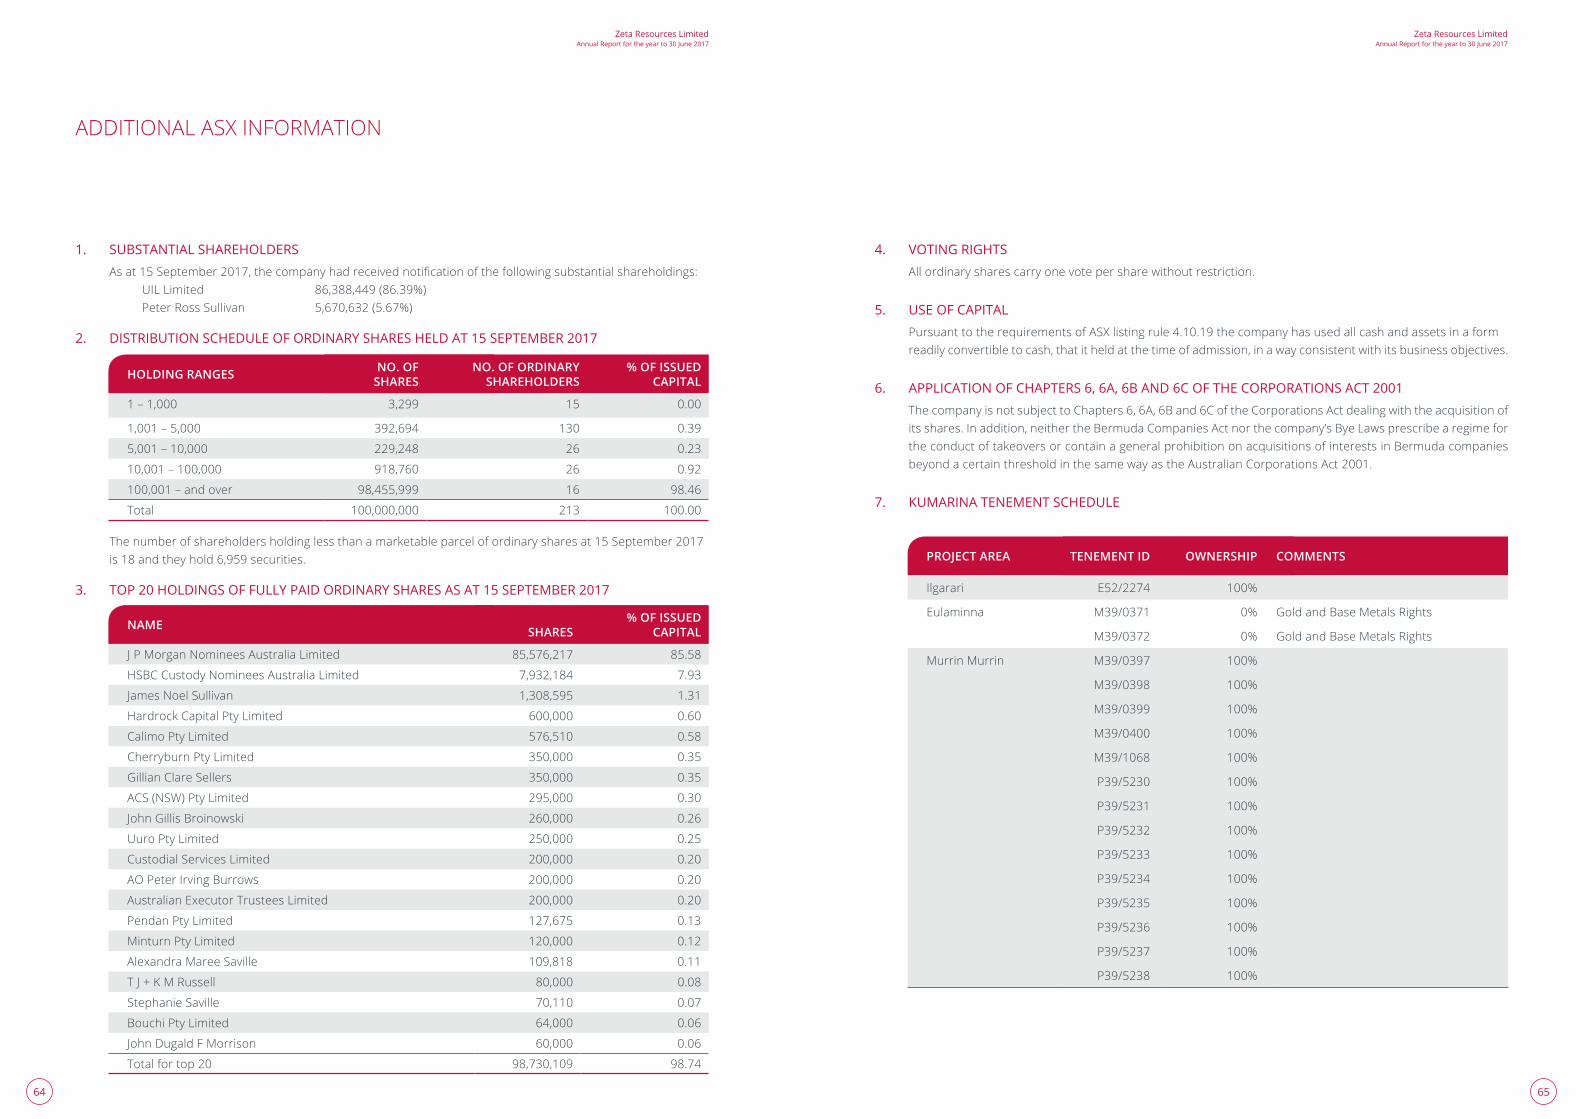
6564
Zeta Resources LimitedAnnual Report for the year to 30 June 2017
Zeta Resources LimitedAnnual Report for the year to 30 June 2017
ADDITIONAL ASX INFORMATION
1. SUBSTANTIAL SHAREHOLDERS Asat15September2017,thecompanyhadreceivednotificationofthefollowingsubstantialshareholdings: UIL Limited 86,388,449 (86.39%) Peter Ross Sullivan 5,670,632 (5.67%)
2. DISTRIBUTION SCHEDULE OF ORDINARY SHARES HELD AT 15 SEPTEMBER 2017
HOLDING RANGES NO. OF SHARES
NO. OF ORDINARY SHAREHOLDERS
% OF ISSUED CAPITAL
1–1,000 3,299 15 0.00
1,001–5,000 392,694 130 0.39
5,001–10,000 229,248 26 0.23
10,001–100,000 918,760 26 0.92
100,001–andover 98,455,999 16 98.46
Total 100,000,000 213 100.00
The number of shareholders holding less than a marketable parcel of ordinary shares at 15 September 2017 is 18 and they hold 6,959 securities.
3. TOP 20 HOLDINGS OF FULLY PAID ORDINARY SHARES AS AT 15 SEPTEMBER 2017
NAME SHARES% OF ISSUED
CAPITAL
J P Morgan Nominees Australia Limited 85,576,217 85.58
HSBC Custody Nominees Australia Limited 7,932,184 7.93
James Noel Sullivan 1,308,595 1.31
Hardrock Capital Pty Limited 600,000 0.60
Calimo Pty Limited 576,510 0.58
Cherryburn Pty Limited 350,000 0.35
Gillian Clare Sellers 350,000 0.35
ACS (NSW) Pty Limited 295,000 0.30
John Gillis Broinowski 260,000 0.26
Uuro Pty Limited 250,000 0.25
Custodial Services Limited 200,000 0.20
AO Peter Irving Burrows 200,000 0.20
Australian Executor Trustees Limited 200,000 0.20
Pendan Pty Limited 127,675 0.13
Minturn Pty Limited 120,000 0.12
Alexandra Maree Saville 109,818 0.11
TJ+KMRussell 80,000 0.08
Stephanie Saville 70,110 0.07
Bouchi Pty Limited 64,000 0.06
John Dugald F Morrison 60,000 0.06
Total for top 20 98,730,109 98.74
4. VOTING RIGHTSAll ordinary shares carry one vote per share without restriction.
5. USE OF CAPITALPursuant to the requirements of ASX listing rule 4.10.19 the company has used all cash and assets in a form readily convertible to cash, that it held at the time of admission, in a way consistent with its business objectives.
6. APPLICATION OF CHAPTERS 6, 6A, 6B AND 6C OF THE CORPORATIONS ACT 2001The company is not subject to Chapters 6, 6A, 6B and 6C of the Corporations Act dealing with the acquisition of its shares. In addition, neither the Bermuda Companies Act nor the company’s Bye Laws prescribe a regime for the conduct of takeovers or contain a general prohibition on acquisitions of interests in Bermuda companies beyond a certain threshold in the same way as the Australian Corporations Act 2001.
7. KUMARINA TENEMENT SCHEDULE
PROJECT AREA TENEMENT ID OWNERSHIP COMMENTS
Ilgarari E52/2274 100%
Eulaminna M39/0371 0% Gold and Base Metals Rights
M39/0372 0% Gold and Base Metals Rights
Murrin Murrin M39/0397 100%
M39/0398 100%
M39/0399 100%
M39/0400 100%
M39/1068 100%
P39/5230 100%
P39/5231 100%
P39/5232 100%
P39/5233 100%
P39/5234 100%
P39/5235 100%
P39/5236 100%
P39/5237 100%
P39/5238 100%
66
Zeta Resources LimitedAnnual Report for the year to 30 June 2017
COMPANY INFORMATION
Zeta Resources LimitedCompany ARBN: 162 902 481www.zetaresources.limited
DIRECTORS (NON-EXECUTIVE)Peter Sullivan (Chairman)Marthinus (Martin) BothaXi Xi
REGISTERED OFFICE34 Bermudiana RoadHamilton HM 11BermudaCompanyRegistrationNumber:46795
AUSTRALIAN REGISTERED OFFICELevel 945 Clarence StreetSydney NSW 2000AustraliaTelephone:+61292480304
NEW ZEALAND OFFICEICM NZ LimitedPO Box 25437Featherston StreetWellington 6146Telephone:+6449017600Email:[email protected]
INVESTMENT MANAGERICM Limited34 Bermudiana RoadHamilton HM 11BermudaTelephone:+14412992894
SECRETARYICM Limited34 Bermudiana RoadPO Box HM 1748Hamilton HM GXBermuda
GENERAL ADMINISTRATIONICM Corporate Services (Pty) Ltd1KnutsfordRoadWynberg 7800Cape TownSouth Africa
AUDITORKPMGIncMSC House1 Mediterranean Street, Foreshore 8001, Cape TownSouth Africa
DEPOSITORYJP Morgan Chase Bank NALondon Branch25 Bank StreetCanary WharfLondon E14 5JPUnitedKingdom
REGISTRARSecurity Transfer Australia Pty Ltd 770 Canning Highway Applecross WA 6153AustraliaTelephone:+61893152333
STOCK EXCHANGE LISTINGThecompany’ssharesarequotedontheOfficialListoftheAustralianSecuritiesExchange.Tickercode:ZER

www.zetaresources.limited ZETA
/AN
N-1
7