Annual Report ValueInvest LUX 2014
32
Annual report including audited financial statements as at 31st December 2014 ValueInvest LUX Société d'Investissement à Capital Variable incorporated in Luxembourg R.C.S. Luxembourg B 83 606
-
Upload
valueinvest-asset-management-sa -
Category
Documents
-
view
215 -
download
2
description
Â
Transcript of Annual Report ValueInvest LUX 2014

Annual report including audited financial statements as at 31st December 2014
ValueInvest LUX Société d'Investissement à Capital Variable incorporated in Luxembourg
R.C.S. Luxembourg B 83 606

No subscription can be received on the basis of this financial report. Subscriptions are only valid if made on the basis of the current Prospectus, the KIID supplemented by the latest annual report and the most recent semi-annual report, if published thereafter.

ValueInvest LUX
Contents
1
Organisation ..................................................................................................................................................... 2
General information ......................................................................................................................................... 4
Additional information for the investors in Germany, in Switzerland and in Austria ............................... 5
Report on activities of the Board of Directors............................................................................................... 8
Report of the réviseur d'entreprises agréé .................................................................................................. 11
Combined statement of net assets ............................................................................................................... 13
Combined statement of operations and other changes in net assets ...................................................... 14
ValueInvest LUX - Global ............................................................................................................................... 15 Statement of net assets ................................................................................................................................ 15 Statement of operations and other changes in net assets ........................................................................... 16 Statistical information .................................................................................................................................... 17 Statement of investments and other net assets ........................................................................................... 19 Industrial and geographical classification of investments ............................................................................. 19
ValueInvest LUX - Japan ................................................................................................................................ 21 Statement of net assets ................................................................................................................................ 21 Statement of operations and other changes in net assets ........................................................................... 22 Statistical information .................................................................................................................................... 23 Statement of investments and other net assets ........................................................................................... 25 Industrial and geographical classification of investments ............................................................................. 26
Notes to the financial statements ................................................................................................................. 27

ValueInvest LUX
2
Organisation
Registered Office 11, rue Aldringen L-1118 LUXEMBOURG Board of Directors Chairman Michael ANDERSEN Group Executive Vice President, Asset Management
SYDBANK A/S Peberlyk 4 DK-6200 AABENRAA
Directors Jan GERHARDT Director
SPARNORD BANK Skelagervej 15 Postboks 162 DK-9100 AALBORG SV
Per MUNCK Managing Director
SKJERN BANK Banktorvet 3 DK-6900 SKJERN
Stéphane RIES Head of Business Development Investment Funds & Global Custody Services
KBL EUROPEAN PRIVATE BANKERS S.A. 43, boulevard Royal L-2955 LUXEMBOURG
Delegates of the Board of Directors Angela SCHROEDER Head of Administration, CFO
VALUEINVEST ASSET MANAGEMENT S.A. Jacob VENDELBO Director, Client Relations
VALUEINVEST ASSET MANAGEMENT S.A. Investment Manager VALUEINVEST ASSET MANAGEMENT S.A. 36, rue Marie-Adelaïde L-2128 LUXEMBOURG Custodian and Main Paying Agent KBL EUROPEAN PRIVATE BANKERS S.A. 43, boulevard Royal L-2955 LUXEMBOURG

ValueInvest LUX
Organisation (continued)
3
Domiciliary, Registrar, Transfer and Administrative Agent KREDIETRUST LUXEMBOURG S.A. 11, rue Aldringen L-2960 LUXEMBOURG Cabinet de révision agréé DELOITTE Audit Société à responsabilité limitée 560, rue de Neudorf L-2220 LUXEMBOURG Paying and Information Agent in Germany MERCK FINCK & CO Neuer Wall 77 D-20354 HAMBURG Representative in Switzerland CARNEGIE FUND SERVICES S.A. 11, rue du Général-Dufour CH-1204 GENEVA Paying Agent in Switzerland BANQUE CANTONALE DE GENEVE 17, quai de l’Ile CH-1204 GENEVA Representative Agent in Austria ERSTE BANK DER ÖSTERREICHISCHEN SPARKASSEN AG Graben 21 A-1010 VIENNA Distributor (among others) VALUEINVEST ASSET MANAGEMENT S.A. 36, rue Marie-Adelaïde L-2128 LUXEMBOURG

ValueInvest LUX
4
General information
ValueInvest LUX (the "SICAV") is an open-ended investment fund registered on the official list of collective investment undertakings on transferable securities (UCITS) under the Council Directive 2009/65/EC as amended and pursuant to Part I of the amended Law of 17 December 2010 relating to undertakings for collective investment (the “2010 Law”). The SICAV was incorporated on 12 September 2001 and qualifies as a Self-Managed Company in accordance with article 27 of the 2010 Law. The investment objective of the SICAV is to manage the assets of each Sub-Fund for the benefit of its Shareholders and to achieve a long-term capital growth by investing in a broad range of transferable securities. The SICAV is a "Société Anonyme" incorporated in Luxembourg under the laws of Luxembourg as a "Société d'Investissement à Capital Variable" ("SICAV") with multiple Sub-Funds. The "umbrella" structure offers investors not only the advantage to choose between different Sub-Funds but also to switch between these Sub-Funds; furthermore, within each Sub-Fund, each investor can choose between capitalisation of the Sub-Fund's earnings or prospective distribution thereof in the form of dividends, by selecting either capitalisation shares or distribution shares. Each individual Sub-Fund consists of share classes dedicated to Retail investors (A Shares and B shares) and Institutional investors (I Shares and X Shares). At the date of the report, two Sub-Funds are activated: - ValueInvest LUX - Global expressed in EUR - ValueInvest LUX - Japan expressed in EUR The annual general meeting of Shareholders of the SICAV is held at the registered office of the SICAV or at such other place in Luxembourg on the second Wednesday of the month of May in each year at 11.30 a.m., or if any such day is not a bank Business Day in Luxembourg, on the next following bank Business Day in Luxembourg. Audited annual reports are published within 4 months following the end of the accounting year and unaudited semi-annual reports are published within 2 months following the period to which they refer. The Articles of Incorporation, the prospectus, the KIID, the most recent audited annual and unaudited semi-annual reports are made available at the registered office of the SICAV during normal business hours, at the office of the paying and information agent in Germany, at the office of the representative and paying agent in Switzerland and at the office of the representative agent in Austria. The SICAV's accounting year ends on 31 December each year. The accounts of the SICAV are presented in EUR. The Net Asset Value per share of each Sub-Fund is determined for each class on a daily basis.

ValueInvest LUX
5
Additional information for the investors in Germany, in Switzerland and in Austria
Additional information for the investors in Germany: The umbrella SICAV ValueInvest LUX has been authorised for distribution in Germany as from 16 May 2007. The Paying and Information Agent in the Federal Republic of Germany is MERCK FINCK & CO, Neuer Wall 77, D-20354 HAMBURG ("MERCK FINCK"). Subscriptions and redemptions of shares will be accepted by the Transfer Agent or the Paying Agent in Germany in the currencies stated in the Prospectus of the SICAV under "1.4. Share prices". Subscription, redemption and conversion orders for shares may be submitted to the Transfer Agent directly or to the German Paying Agent and must arrive to the Transfer Agent no later than 9.15 a.m. Luxembourg time on a Valuation Day to be dealt with on Valuation Day. The Prospectus, the KIID, the Articles of Incorporation of the SICAV, the semi-annual and audited annual reports, as well as the subscription, conversion and redemption prices may be obtained by Shareholders free of charge at MERCK FINCK. In addition, the Custodian and Paying Agent Agreements with KBL EUROPEAN PRIVATE BANKERS S.A., Luxembourg, the Domiciliary Agreement, the Administrative Agent Agreement, the Registrar & Transfer Agent Agreement with KREDIETRUST LUXEMBOURG S.A. and the Investment Management Agreement with VALUEINVEST ASSET MANAGEMENT S.A. may be inspected there. All payments by the SICAV to Shareholders in the Federal Republic of Germany (proceeds of redemptions, any distributions and other payments) may be transferred via the Paying Agent MERCK FINCK. Publication in the Federal Republic of Germany of subscription and redemption prices and any other important information to Shareholders is available on www.fundinfo.com and on www.valueinvestlux.com. ValueInvest LUX intends to fulfil its obligations to provide information which are included in the requirements for taxation of Shareholders subject to taxation in the Federal Republic of Germany pursuant to Section 5 of the German Investment Tax Act (InvStG) but assumes no liability for doing so. The Prospectus does not provide any information on the German taxation of Shareholders in respect of shares in ValueInvest LUX. It should, however, be noted that distributions by the SICAV, income allocated for tax purposes but not distributed (including profits) in the SICAV, and the proceeds from the sale, conversion or redemption of shares and from the assignment of claims arising from the shares and equivalent cases are subject in the Federal Republic of Germany to taxation at the legally prescribed rates and may also be subject to a deduction of tax (investment income tax plus solidarity surcharge). Moreover, any other (German or non-German) taxation must be observed. Investors are recommended to contact their tax advisor in respect of taxation details relating to shares in ValueInvest LUX.

ValueInvest LUX
Additional information for the investors in Germany, in Switzerland and in Austria (continued)
6
Additional information for the investors in Switzerland: The umbrella SICAV ValueInvest LUX has been authorised for distribution in Switzerland as from 15 February 2008. The authorised Representative in Switzerland is Carnegie Funds Services S.A., 11 rue du Général-Dufour, CH-1204 GENEVA, Switzerland and the authorised Paying Agent in Switzerland is Banque Cantonale de Genève, 17 quai de l’Ile, CH-1204 GENEVA, Switzerland. This authorisation includes the right to offer and distribute the SICAV's shares in or from Switzerland, in conformity with Article 120 of the Federal Act on Collective Investment Schemes of 23 June 2006. The prospectus, the Articles of Incorporation, the annual and semi-annual reports, the statement of changes in investments of the SICAV as well as the KIID of each Sub-Fund may be obtained, free of charge, at the office of Carnegie Funds Services S.A., 11 rue du Général-Dufour, CH-1204 GENEVA. The SICAV’s publications in Switzerland are made in the "Feuille Officielle Suisse du Commerce" and on the electronic platform www.fundinfo.com and on www.valueinvestlux.com The issue and redemption prices of Shares, respectively the net asset value with a note “commission not included”, are published on a daily basis on the electronic platform www.fundinfo.com and on www.valueinvestlux.com. Only the prospectus signed and submitted in its German version, the Swiss version of the KIID in German, prevail in the legal relationship between the SICAV and the investors in Switzerland. The place of execution and jurisdiction in respect of all shares of the SICAV offered or distributed in or from Switzerland is the registered office of the Representative of the SICAV.

ValueInvest LUX
Additional information for the investors in Germany, in Switzerland and in Austria (continued)
7
Additional information for the investors in Austria: Place where the shareholders ("investors") may obtain the prescribed information in reference to §§ 141 and 142 InvFG 2011: ERSTE BANK DER ÖSTERREICHISCHEN SPARKASSEN AG, Graben 21, A-1010 VIENNA Phone 0043 (0) 50100 12139 Fax 0043 (0) 50100 9 12139. Publication The respective net asset values of the Sub-Funds and any other information to investors are published on the electronic platform of ValueInvest LUX www.valueinvestlux.com and of www.fundinfo.com. The Net Asset Value per share of each Sub-Fund is determined for each class on a daily basis.

ValueInvest LUX
8
Report on activities of the Board of Directors
Yet another strong year for the stock market - and ValueInvest LUX After a somewhat slow start to 2014, where economic key figures seemed weak, the stock market got off to a better start in the second half of 2014. Even though 2014 was characterised by concern, this did not seem to influence the stock market - on the contrary. With the so-called risk free return being close to none-existing, the investors seemed to believe that the stock market was “the place to be” in 2014. With the central banks buying bonds at a large-scale, everyone looking to secure their assets against inflation had to look further up the risk curve. Assisted by the lack of attractiveness of the bond market, the global stock market increased by 19.2% and the Japanese market by 9.0% measured by MSCI World and MSCI Japan. With returns of 17.4% the investors in the Global sub-fund took part in the feast on the stock market, however with portfolios still largely consisting of earning stable companies. Investors in the Japan sub-fund noted a 10.8% return - slightly above the market, also achieved by a portfolio construction that is significantly more conservative than the market in general, measured by earnings stability. Sectors The sector increasing the most over 2014 was Health Care, followed by Information Technology and Utilities. Based on Price to Fair Value, as calculated by the investment manager, the Health Care sector has over time become one of the most expensive sectors. The investors were able to gain from this development as the fund throughout a long-running period has had a somewhat high exposure towards Health Care shares. With the high price of the sector, the fund thinned out in the health care stocks and was able to book some of the profits. 10% of the investments in the Global sub-fund, however, are still placed within Health Care. Within the Information Technology sector, the second most successful sector of the year, two of the companies held by the Global sub-fund did just as well as the sector in general, whereas Microsoft did outstandingly well and was one of the single best performing stocks of the year. At the beginning of the year, only two companies within the Energy sector, the weakest sector of 2014, were part of the Global sub- fund. The Austrian company OMV was sold in the spring, before the price of oil really started to drop. The Materials sector was the second-weakest sector of the year and, until the autumn of 2014, no Materials stocks had been part of the Global sub-fund since the spring of 2010. After buying French Air Liquide the Global sub-fund was again exposed towards Materials, specifically Industrial Gases, that is considered to be a highly earnings stable industry. Continued majority in earnings stable sectors - spread across products and markets The largest exposure (more than 55%) is still towards the most earnings stable sector, Consumer Staples. In this sector, companies from Packaged Foods and Meats, Food Retail, Brewers, Household Products, as well as Distillers & Vintners are found. In Packaged Foods and Meats, the Global sub-fund holds eight companies that are among the world’s largest manufacturers of products from all conceivable categories and brands ranging from Nestlé’s KitKat to Irish Kerry Group’s hi-tech ingredients production. Holdings in Food Retail consist of five companies - three European and two Japanese - and business is conducted in Europe, USA, Latin America, Japan, and Asia. The exposure towards Consumer Staples is spread across 20 companies, resulting in good risk diversification. The remaining exposure in the Global sub-fund is spread across eight sectors, with Health Care being the only sector with a double-digit weighting. Consumer Discretionary follows with three companies, among others the German company adidas. 2014 was poor for adidas in terms of stock price development, partially due to challenges relating to currency exposure and a declining golf segment. Our belief in adidas is however strong, and the weighting in the stock was increased in the fall of 2014. The stock price of French advertising agency Publicis Groupe also went through a rough patch after the planned merger with Omnicom was called off in spring. Following a 30% slump, the holdings here were also increased. In both cases the weightings were very small before the fall in prices - combined, below 2% at the beginning of the year. Japan

ValueInvest LUX
Report on activities of the Board of Directors (continued)
9
All ten main sectors in the World index brought about positive return, but the situation was a bit more varied in Japan. Financial, Telecommunication Services, and Energy were the three weakest sectors with negative returns of 6.0%, 5.8%, and 5.2% respectively. Like in the Global sub-fund, no Financial stocks were part of the Japan sub-fund either and within the two other weakest sectors, only two companies were part of the sub-fund. Inpex (Energy) increased contrary to the sector and KDDI (Telecommunication Services) increased with more than 20% and provided a significant contribution to the yearly return. In the positive end, we find the sectors Information Technology, Materials, and Health Care with returns between 15.3% and 16.3%. Portfolio composition Historically, the funds have been composed of companies where the majority is characterised by earnings stability. In a carefully structured process, all sub-sectors of the stock market (128, excl. Finance) are divided into different degrees of earnings stability. Following this, through a profound analysis, we try to identify the best companies (typically within the most earnings stable sub-sectors) to end up with a composition of companies with a high likelihood of meeting earnings expectations. We believe that this composition is a key factor in delivering what is considered to be the cornerstone of the strategy: capital protection. The great emphasis on earnings stability is an active elective that determines how the portfolios will do in different market settings. This means, among others, that the returns typically will fluctuate less than the market return in the longer term. Compared to the general market in a relative perspective this means, that the portfolios typically will return slightly less than the market in times of prosperity, however in times of recession they are expected to drop somewhat lesser than the market. Expectations The economic development in ValueInvest LUX’s investment markets are expected to be dissimilar. The IMF expects the US and the UK, with growth rates of 3%, to lead in the economic growth of the mature economies, whereas continental Europe will experience a low and dissimilar growth. Italy and France are expected to be the losers in the fight for growth. The two countries have not been able to use the time the central banks bought them and did not implement structural reforms that could have kick-started growth. Spain on the other hand seems to have found its way and will experience higher growth rates. In Japan, the IMF is expecting a growth rate just below 1% - a little lower than Europe. For the combined Emerging Markets a 5% growth is expected, approx. double in value to the mature economies. The ValueInvest LUX Fund has no direct investments in Emerging Markets, but most companies in the Global sub-fund are global and as a group their exposure to Emerging Markets accounts for approx. 20% based on revenue. The central banks in Europe and Japan appear to have taken over where the FED left off when it comes to quantitative easing. The interest rates in Europe and Japan are expected to stay low for quite some time, whereas the US is expected to raise interest rates in 2015. The risk-free alternative to stocks hence does not appear to become an essential competitor to the stock market in the nearest future - except in the US where ripples appear to be forming. This is one of the prerequisites for the stock market keeping its optimism, but certainly not a guarantee.

ValueInvest LUX
Report on activities of the Board of Directors (continued)
10
As always, the portfolios are composed from a bottom-up strategy, where each company is expected to deliver value to the consolidated group account of the fund. The composition is neither inspired by benchmarks nor macroeconomic visions. In order to revitalise the potential for return and create downside protection, it is essential that the market creates some undervalued companies that can be bought at a reasonable discount. Using stock market screenings, possibilities to acquire interesting companies at a considerable discount compared to their real value, still exist. Luxembourg, 3rd March 2015 The Board of Directors Note: The information in this report represents historical data and is not an indication of future results.

Société à responsabilité limitée au capital de 35.000 EUR RCS Luxembourg B 67.895
11
Deloitte Audit Société à responsabilité limitée 560, rue de Neudorf L-2220 Luxembourg B.P. 1173 L-1011 Luxembourg Tel: +352 451 451 Fax: +352 451 452 992 www.deloitte.lu
Report of the réviseur d'entreprises agréé
To the Shareholders of ValueInvest LUX Following our appointment by the general meeting of the shareholders, we have audited the accompanying financial statements of ValueInvest LUX and of each of its Sub-Funds, which comprise the statement of net assets and the statement of investments and other net assets as at 31 December 2014 and the statement of operations and other changes in net assets for the year then ended, and a summary of significant accounting policies and other explanatory notes to the financial statements. Responsibility of the Board of Directors of the SICAV for the financial statements The Board of Directors of the SICAV is responsible for the preparation and fair presentation of these financial statements in accordance with Luxembourg legal and regulatory requirements relating to the preparation of the financial statements and for such internal control as the Board of Directors of the SICAV determines is necessary to enable the preparation of financial statements that are free from material misstatement, whether due to fraud or error. Responsibility of the réviseur d’entreprises agréé Our responsibility is to express an opinion on these financial statements based on our audit. We conducted our audit in accordance with International Standards on Auditing as adopted for Luxembourg by the Commission de Surveillance du Secteur Financier. Those standards require that we comply with ethical requirements and plan and perform the audit to obtain reasonable assurance whether the financial statements are free from material misstatement. An audit involves performing procedures to obtain audit evidence about the amounts and disclosures in the financial statements. The procedures selected depend on the réviseur d’entreprises agréé’s judgement, including the assessment of the risks of material misstatement of the financial statements, whether due to fraud or error. In making those risk assessments, the réviseur d’entreprises agréé considers internal control relevant to the entity’s preparation and fair presentation of the financial statements in order to design audit procedures that are appropriate in the circumstances, but not for the purpose of expressing an opinion on the effectiveness of the entity’s internal control.

Deloitte.
Report of the reviseur d'entreprises agree (continued)
An audit also includes evaluating the appropriateness of accounting policies used and the reasonableness of accounting estimates made by the Board of Directors of the SICAV, as well as evaluating the overall presentation of the financial statements. We believe that the audit evidence we have obtained is sufficient and appropriate to provide a basis for our audit opinion.
Opinion
In our opinion, the financial statements give a true and fair view of the financial position of Valuelnvest LUX and of each of its Sub-Funds as of 31 December 2014, and of the results of their operations and changes in their net assets for the year then ended in accordance with the Luxembourg legal and regulatory requirements relating to the preparation of the financial statements.
Other matter
Supplementary information included in the annual report has been reviewed in the context of our mandate but has not been subject to specific audit procedures carried out in accordance with the standards described above. Consequently, we express no opinion on such information. However, we have no observation to make concerning such information in the context of the financial statements taken as a whole.
27th March 2015 560, rue de Neudorf L-2220 LUXEMBOURG
12

ValueInvest LUX
Combined statement of net assets (in EUR) as at 31 December 2014
The accompanying notes are an integral part of these financial statements.
13
Assets Securities portfolio at market value 600,733,760.18 Cash at banks 10,566,702.58 Receivable on issues of shares 331,981.95 Income receivable on portfolio 772,200.30 Prepaid expenses 800.00
Total assets 612,405,445.01
Liabilities Payable on redemptions of shares 233,134.00 Expenses payable 645,721.05 Other liabilities 1,879.88
Total liabilities 880,734.93
Net assets at the end of the year 611,524,710.08
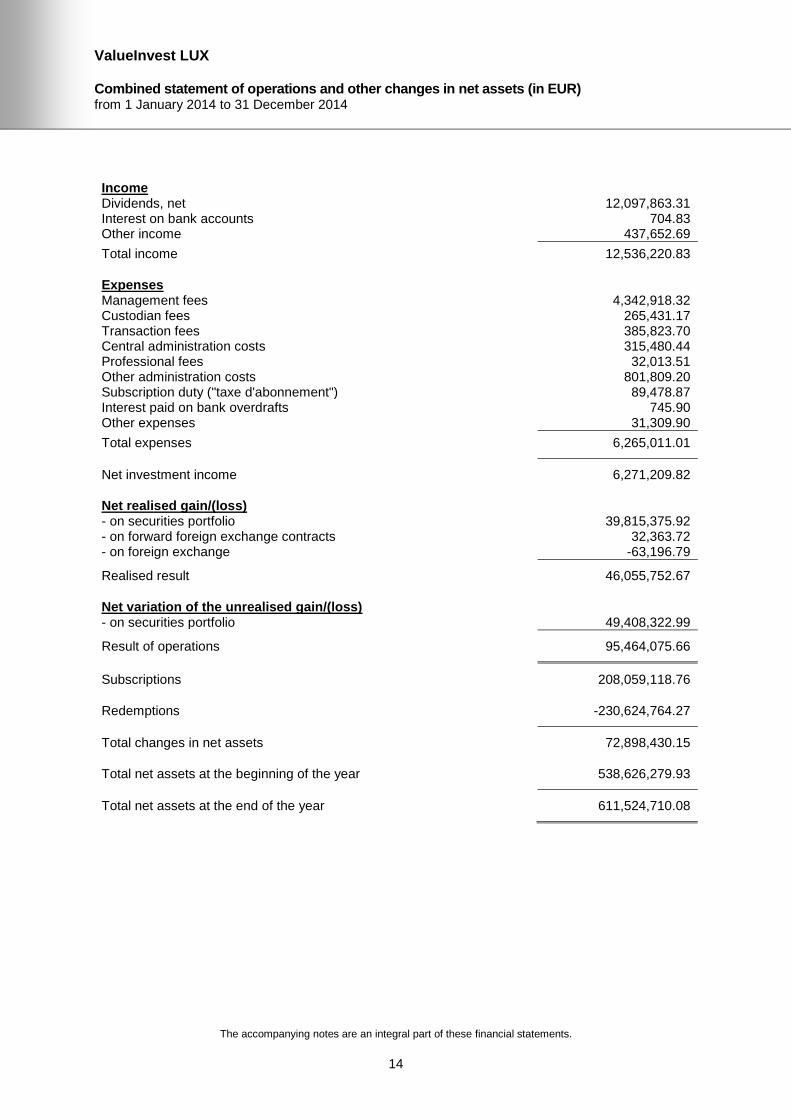
ValueInvest LUX
Combined statement of operations and other changes in net assets (in EUR) from 1 January 2014 to 31 December 2014
The accompanying notes are an integral part of these financial statements.
14
Income Dividends, net 12,097,863.31 Interest on bank accounts 704.83 Other income 437,652.69
Total income 12,536,220.83
Expenses Management fees 4,342,918.32 Custodian fees 265,431.17 Transaction fees 385,823.70 Central administration costs 315,480.44 Professional fees 32,013.51 Other administration costs 801,809.20 Subscription duty ("taxe d'abonnement") 89,478.87 Interest paid on bank overdrafts 745.90 Other expenses 31,309.90
Total expenses 6,265,011.01
Net investment income 6,271,209.82
Net realised gain/(loss) - on securities portfolio 39,815,375.92 - on forward foreign exchange contracts 32,363.72 - on foreign exchange -63,196.79
Realised result 46,055,752.67
Net variation of the unrealised gain/(loss) - on securities portfolio 49,408,322.99
Result of operations 95,464,075.66
Subscriptions 208,059,118.76
Redemptions -230,624,764.27
Total changes in net assets 72,898,430.15
Total net assets at the beginning of the year 538,626,279.93
Total net assets at the end of the year 611,524,710.08

ValueInvest LUX - Global
Statement of net assets (in EUR) as at 31 December 2014
The accompanying notes are an integral part of these financial statements.
15
Assets Securities portfolio at market value 526,439,514.95 Cash at banks 8,584,564.31 Receivable on issues of shares 315,122.25 Income receivable on portfolio 692,257.75 Prepaid expenses 600.00
Total assets 536,032,059.26
Liabilities Payable on redemptions of shares 223,865.25 Expenses payable 562,324.36 Other liabilities 1,879.88
Total liabilities 788,069.49
Net assets at the end of the year 535,243,989.77
Capitalisation A Shares outstanding 223,253.855 Net asset value per capitalisation A Share 221.36
Capitalisation B Shares outstanding 2,709.350 Net asset value per capitalisation B Share 221.42
Capitalisation I Shares outstanding 1,959,371.463 Net asset value per capitalisation I Share 241.90
Distribution A Shares outstanding 50,800.943 Net asset value per distribution A Share 221.36

ValueInvest LUX - Global
Statement of operations and other changes in net assets (in EUR) from 1 January 2014 to 31 December 2014
The accompanying notes are an integral part of these financial statements.
16
Income Dividends, net 10,817,320.88 Interest on bank accounts 699.38 Other income 431,592.32
Total income 11,249,612.58
Expenses Management fees 3,796,117.37 Custodian fees 231,931.78 Transaction fees 338,588.54 Central administration costs 275,194.38 Professional fees 27,961.35 Other administration costs 696,708.72 Subscription duty ("taxe d'abonnement") 78,014.78 Interest paid on bank overdrafts 745.90 Other expenses 15,654.95
Total expenses 5,460,917.77
Net investment income 5,788,694.81
Net realised gain/(loss) - on securities portfolio 37,478,292.85 - on forward foreign exchange contracts 34,150.06 - on foreign exchange -60,951.03
Realised result 43,240,186.69
Net variation of the unrealised gain/(loss) - on securities portfolio 44,275,741.67
Result of operations 87,515,928.36
Subscriptions 203,542,237.44
Redemptions -225,460,676.78
Total changes in net assets 65,597,489.02
Total net assets at the beginning of the year 469,646,500.75
Total net assets at the end of the year 535,243,989.77

ValueInvest LUX - Global
Statistical information (in EUR) as at 31 December 2014
Annual returns were calculated for the last 3 full consecutive financial years. For sub-funds / share types launched or liquidated during the financial year, the corresponding annual return has not been calculated. The historical performance is not an indication of current or future results. The performance data do not take account of the commissions and costs incurred on the issue and redemption of shares of the SICAV.
The accompanying notes are an integral part of these financial statements.
17
Total net assets
- as at 31.12.2014 535,243,989.77 - as at 31.12.2013 469,646,500.75 - as at 31.12.2012 457,756,036.32
Portfolio Turnover Rate (in %)
(subscriptions and redemptions of shares are netted by NAV calculation)
- as at 31.12.2014 6.50
Number of capitalisation A Shares
- outstanding at the beginning of the year 338,963.693 - issued 56,895.333 - redeemed -172,605.171
- outstanding at the end of the year 223,253.855
Net asset value per capitalisation A Share
- as at 31.12.2014 221.36 - as at 31.12.2013 188.49 - as at 31.12.2012 154.70
Performance of capitalisation A Shares (in %)
- as at 31.12.2014 17.44 - as at 31.12.2013 21.84 - as at 31.12.2012 6.51
TER per capitalisation A Share (in %)
- as at 31.12.2014 1.87
Number of capitalisation B Shares
- outstanding at the beginning of the year 0.000 - issued 2,709.350 - redeemed 0.000
- outstanding at the end of the year 2,709.350
Net asset value per capitalisation B Share
- as at 31.12.2014 221.42 - as at 31.12.2013 - - as at 31.12.2012 -
TER per capitalisation B Share (in %)
- as at 31.12.2014 * 1.16 * annualised
Number of capitalisation I Shares
- outstanding at the beginning of the year 1,948,192.533 - issued 874,883.012 - redeemed -863,704.082
- outstanding at the end of the year 1,959,371.463
Net asset value per capitalisation I Share
- as at 31.12.2014 241.90 - as at 31.12.2013 204.07 - as at 31.12.2012 165.85

ValueInvest LUX - Global
Statistical information (in EUR) (continued) as at 31 December 2014
Annual returns were calculated for the last 3 full consecutive financial years. For sub-funds / share types launched or liquidated during the financial year, the corresponding annual return has not been calculated. The historical performance is not an indication of current or future results. The performance data do not take account of the commissions and costs incurred on the issue and redemption of shares of the SICAV.
The accompanying notes are an integral part of these financial statements.
18
Performance of capitalisation I Shares (in %)
- as at 31.12.2014 18.54 - as at 31.12.2013 23.04 - as at 31.12.2012 ** 7.60
TER per capitalisation I Share (in %)
- as at 31.12.2014 0.88
Number of distribution A Shares
- outstanding at the beginning of the year 43,471.469 - issued 17,037.418 - redeemed -9,707.944
- outstanding at the end of the year 50,800.943
Net asset value per distribution A Share
- as at 31.12.2014 221.36 - as at 31.12.2013 188.49 - as at 31.12.2012 154.70
Performance of distribution A Shares (in %)
- as at 31.12.2014 17.44 - as at 31.12.2013 21.84 - as at 31.12.2012 6.51
TER per distribution A Share (in %)
- as at 31.12.2014 1.87
** The performance had been adjusted.

ValueInvest LUX - Global
Industrial and geographical classification of investments as at 31 December 2014
19
Currency Number / nominal value
Description Cost Market value % of total net assets
Investments in securities
Transferable securities admitted to an official stock exchange listing
Shares
AUD 1,042,061 AGL Energy Ltd 10,685,350.69 9,421,026.87 1.76 CHF 391,841 Nestlé SA Reg 17,025,268.44 23,766,147.92 4.44 CHF 86,882 Roche Holding AG B de jouis Pref 14,346,530.39 19,496,484.90 3.64
31,371,798.83 43,262,632.82 8.08
EUR 217,571 Adidas AG Reg 13,611,261.09 12,536,441.02 2.34 EUR 94,383 Air Liquide SA 9,039,995.58 9,707,291.55 1.81 EUR 295,189 Casino Guichard Perrachon 21,520,468.84 22,570,150.94 4.22 EUR 350,716 Danone 19,218,698.67 19,096,486.20 3.57 EUR 1,622,339 Davide Campari SpA 9,101,772.65 8,371,269.24 1.56 EUR 296,119 Delhaize Groupe 14,833,864.73 17,894,471.17 3.34 EUR 90,839 Kerry Group Plc A 2,972,271.09 5,184,181.73 0.97 EUR 1,547,302 Koninklijke Ahold NV 16,778,354.08 22,830,441.01 4.27 EUR 1,131,938 Orange 13,599,573.51 16,016,922.70 2.99 EUR 189,052 Publicis Groupe SA 9,503,240.47 11,275,061.28 2.11
130,179,500.71 145,482,716.84 27.18
GBP 429,712 GlaxoSmithKline Plc 7,085,881.18 7,615,616.98 1.42 HKD 8,662,000 Chaoda Modern Agri (Hgs) * 4,427,512.39 200,360.00 0.04 JPY 417,200 Asahi Group Holdings Ltd 6,835,720.37 10,769,265.46 2.01 JPY 307,800 Familymart Co Ltd 10,387,526.28 9,649,305.53 1.80 JPY 1,299,100 INPEX Corp 12,906,619.84 12,043,211.97 2.25 JPY 178,800 Kao Corp 4,485,451.12 5,860,257.66 1.10 JPY 109,300 KDDI Corp 3,121,280.72 5,751,206.99 1.07 JPY 574,900 Kirin Holdings Co Ltd 5,840,436.90 5,929,664.95 1.11 JPY 914,000 Konica Minolta Inc 5,897,154.31 8,344,073.47 1.56 JPY 121,400 Lawson Inc 6,562,321.44 6,097,646.74 1.14 JPY 90,500 Makita Corp 2,571,585.27 3,417,001.61 0.64 JPY 441,400 Mitsubishi Tanabe Pharma Corp 4,784,001.72 5,382,966.05 1.01 JPY 2,887,000 Osaka Gas Co Ltd 8,448,136.81 8,970,969.32 1.68 JPY 113,400 Secom Co Ltd 4,031,860.21 5,426,269.38 1.01
75,872,094.99 87,641,839.13 16.38
SEK 1,622,986 Securitas AB B 11,388,746.19 16,180,630.82 3.02 USD 222,800 Clorox Co 14,771,559.72 19,180,494.01 3.58 USD 117,900 Computer Sciences Corp 4,563,074.03 6,140,929.37 1.15 USD 881,950 ConAgra Foods Inc 18,833,789.16 26,432,999.59 4.94 USD 678,000 General Mills Inc 20,964,521.62 29,870,086.74 5.58 USD 456,200 Hormel Foods Corp 14,880,923.88 19,634,878.15 3.67 USD 285,500 Kimberly-Clark Corp 17,350,635.13 27,250,450.23 5.09 USD 225,899 Kraft Foods Group Inc 8,232,338.45 11,693,375.75 2.19 USD 155,430 Merck Co Inc 5,110,002.15 7,291,920.45 1.36 USD 447,300 Microsoft Corp 10,506,870.96 17,164,052.04 3.21 USD 188,400 Mondelez Intl Inc 3,812,093.75 5,653,556.38 1.06 USD 530,500 Pfizer Inc 9,366,718.41 13,651,445.68 2.55 USD 1,774,700 Staples Inc 16,667,662.85 26,565,521.69 4.96 USD 144,000 Waste Management Inc 3,669,027.97 6,104,981.41 1.14
148,729,218.08 216,634,691.49 40.48
Total investments in securities 419,740,103.06 526,439,514.95 98.36
Cash at banks 8,584,564.31 1.60
Other net assets/(liabilities) 219,910.51 0.04
Total 535,243,989.77 100.00
* See note to the financial statements 1(b).

ValueInvest LUX - Global
Industrial and geographical classification of investments (continued) as at 31st December 2014
20
Industrial classification
(in percentage of net assets)
Food, beverage and tobacco 31.14 %
Food retailing, drugstores and pharmacies 11.83 %
Pharmaceuticals and biotechnology 9.98 %
Household and personal products 9.77 %
Retailing 7.90 %
Commercial services and supplies 5.17 %
Consumer durables and apparel 4.54 %
Software and services 4.36 %
Telecommunication services 4.06 %
Utilities 3.44 %
Energy 2.25 %
Media 2.11 %
Materials 1.81 %
Total 98.36 %
Geographical classification
(by domicile of the issuer) (in percentage of net assets)
United States of America 40.48 %
Japan 16.38 %
France 14.70 %
Switzerland 8.08 %
The Netherlands 4.27 %
Belgium 3.34 %
Sweden 3.02 %
Germany 2.34 %
Australia 1.76 %
Italy 1.56 %
United Kingdom 1.42 %
Ireland 0.97 %
Cayman Islands 0.04 %
Total 98.36 %

ValueInvest LUX - Japan
Statement of net assets (in EUR) as at 31 December 2014
The accompanying notes are an integral part of these financial statements.
21
Assets Securities portfolio at market value 74,294,245.23 Cash at banks 1,982,138.27 Receivable on issues of shares 16,859.70 Income receivable on portfolio 79,942.55 Prepaid expenses 200.00
Total assets 76,373,385.75
Liabilities Payable on redemptions of shares 9,268.75 Expenses payable 83,396.69
Total liabilities 92,665.44
Net assets at the end of the year 76,280,720.31
Capitalisation A Shares outstanding 58,061.758 Net asset value per capitalisation A Share 170.35
Capitalisation B Shares outstanding 3,622.351 Net asset value per capitalisation B Share 170.39
Capitalisation I Shares outstanding 371,623.000 Net asset value per capitalisation I Share 176.75
Distribution A Shares outstanding 508.885 Net asset value per distribution A Share 170.35

ValueInvest LUX - Japan
Statement of operations and other changes in net assets (in EUR) from 1 January 2014 to 31 December 2014
The accompanying notes are an integral part of these financial statements.
22
Income Dividends, net 1,280,542.43 Interest on bank accounts 5.45 Other income 6,060.37
Total income 1,286,608.25
Expenses Management fees 546,800.95 Custodian fees 33,499.39 Transaction fees 47,235.16 Central administration costs 40,286.06 Professional fees 4,052.16 Other administration costs 105,100.48 Subscription duty ("taxe d'abonnement") 11,464.09 Other expenses 15,654.95
Total expenses 804,093.24
Net investment income 482,515.01
Net realised gain/(loss) - on securities portfolio 2,337,083.07 - on forward foreign exchange contracts -1,786.34 - on foreign exchange -2,245.76
Realised result 2,815,565.98
Net variation of the unrealised gain/(loss) - on securities portfolio 5,132,581.32
Result of operations 7,948,147.30
Subscriptions 4,516,881.32
Redemptions -5,164,087.49
Total changes in net assets 7,300,941.13
Total net assets at the beginning of the year 68,979,779.18
Total net assets at the end of the year 76,280,720.31

ValueInvest LUX - Japan
Statistical information (in EUR) as at 31 December 2014
Annual returns were calculated for the last 3 full consecutive financial years. For sub-funds / share types launched or liquidated during the financial year, the corresponding annual return has not been calculated. The historical performance is not an indication of current or future results. The performance data do not take account of the commissions and costs incurred on the issue and redemption of shares of the SICAV.
The accompanying notes are an integral part of these financial statements.
23
Total net assets
- as at 31.12.2014 76,280,720.31 - as at 31.12.2013 68,979,779.18 - as at 31.12.2012 18,609,832.50
Portfolio Turnover Rate (in %)
(subscriptions and redemptions of shares are netted by NAV calculation)
- as at 31.12.2014 19.70
Number of capitalisation A Shares
- outstanding at the beginning of the year 65,878.451 - issued 23,439.504 - redeemed -31,256.197
- outstanding at the end of the year 58,061.758
Net asset value per capitalisation A Share
- as at 31.12.2014 170.35 - as at 31.12.2013 153.79 - as at 31.12.2012 134.88
Performance of capitalisation A Shares (in %)
- as at 31.12.2014 10.77 - as at 31.12.2013 14.02 - as at 31.12.2012 -1.48
TER per capitalisation A Share (in %)
- as at 31.12.2014 1.86
Number of capitalisation B Shares
- outstanding at the beginning of the year 0.000 - issued 3,622.351 - redeemed 0.000
- outstanding at the end of the year 3,622.351
Net asset value per capitalisation B Share
- as at 31.12.2014 170.39 - as at 31.12.2013 - - as at 31.12.2012 -
TER per capitalisation B Share (in %)
- as at 31.12.2014 * 1.65 * annualised
Number of capitalisation I Shares
- outstanding at the beginning of the year 371,623.000 - issued 0.000 - redeemed 0.000
- outstanding at the end of the year 371,623.000
Net asset value per capitalisation I Share
- as at 31.12.2014 176.75 - as at 31.12.2013 158.14 - as at 31.12.2012 137.60

ValueInvest LUX - Japan
Statistical information (in EUR) (continued) as at 31 December 2014
Annual returns were calculated for the last 3 full consecutive financial years. For sub-funds / share types launched or liquidated during the financial year, the corresponding annual return has not been calculated. The historical performance is not an indication of current or future results. The performance data do not take account of the commissions and costs incurred on the issue and redemption of shares of the SICAV.
The accompanying notes are an integral part of these financial statements.
24
Performance of capitalisation I Shares (in %)
- as at 31.12.2014 11.77 - as at 31.12.2013 14.93 - as at 31.12.2012 ** -0.52
TER per capitalisation I Share (in %)
- as at 31.12.2014 0.90
Number of distribution A Shares
- outstanding at the beginning of the year 512.699 - issued 168.373 - redeemed -172.187
- outstanding at the end of the year 508.885
Net asset value per distribution A Share
- as at 31.12.2014 170.35 - as at 31.12.2013 153.79 - as at 31.12.2012 134.88
Performance of distribution A Shares (in %)
- as at 31.12.2014 10.77 - as at 31.12.2013 14.02 - as at 31.12.2012 -1.48
TER per distribution A Share (in %)
- as at 31.12.2014 1.86
** The performance had been adjusted.

ValueInvest LUX - Japan
Statement of investments and other net assets (in EUR) as at 31 December 2014
The accompanying notes are an integral part of these financial statements.
25
Currency Number / nominal value
Description Cost Market value % of total net assets
Investments in securities
Transferable securities admitted to an official stock exchange listing
Shares
JPY 336,000 Air Water Inc 3,508,162.37 4,435,584.20 5.82 JPY 158,500 Asahi Group Holdings Ltd 2,644,408.92 4,091,391.60 5.36 JPY 103,700 Astellas Pharma Inc 733,809.96 1,204,983.63 1.58 JPY 135,900 Benesse Holdings Inc 4,175,319.35 3,356,793.78 4.40 JPY 255,500 Daiichi Sankyo Co Ltd 3,215,701.72 2,971,525.03 3.90 JPY 24,600 Eisai Co Ltd 731,537.47 791,870.18 1.04 JPY 123,800 Familymart Co Ltd 3,675,383.59 3,881,039.71 5.09 JPY 251,000 House Foods Group Inc 2,908,202.54 3,604,022.40 4.72 JPY 216,500 INPEX Corp 2,197,146.53 2,007,047.49 2.63 JPY 251,600 IT Holdings Corp 2,241,852.68 3,153,257.09 4.13 JPY 84,800 Itochu Techno-Solut Corp CTC 2,592,217.93 2,494,823.19 3.27 JPY 104,100 Kao Corp 2,274,609.90 3,411,928.54 4.47 JPY 65,800 KDDI Corp 1,840,066.71 3,462,300.27 4.54 JPY 351,300 Kirin Holdings Co Ltd 3,467,040.83 3,623,397.63 4.75 JPY 304,400 Konica Minolta Inc 1,793,657.58 2,778,923.38 3.64 JPY 70,600 Lawson Inc 3,633,470.83 3,546,077.92 4.65 JPY 50,800 Makita Corp 1,616,675.85 1,918,051.73 2.51 JPY 257,400 Mitsubishi Tanabe Pharma Corp 2,628,978.89 3,139,047.26 4.12 JPY 939,000 Nippon Flour Mills Co Ltd 3,282,162.60 3,461,269.53 4.54 JPY 1,212,000 Osaka Gas Co Ltd 3,714,766.69 3,766,129.13 4.94 JPY 65,400 Secom Co Ltd 2,352,604.77 3,129,435.78 4.10 JPY 112,440 Seven & I Holdings Co Ltd 2,477,966.65 3,376,555.81 4.43 JPY 44,200 Takeda Pharmaceutical Co Ltd 1,590,346.44 1,521,612.99 2.00 JPY 149,800 Terumo Corp 2,522,706.80 2,845,539.54 3.73 JPY 86,400 Toyo Suisan Kaisha Ltd 2,242,070.78 2,321,637.42 3.04
Total investments in securities 64,060,868.38 74,294,245.23 97.40
Cash at banks 1,982,138.27 2.60
Other net assets/(liabilities) 4,336.81 0.00
Total 76,280,720.31 100.00

ValueInvest LUX - Japan
Industrial and geographical classification of investments as at 31 December 2014
26
Industrial classification
(in percentage of net assets)
Food, beverage and tobacco 22.41 %
Pharmaceuticals and biotechnology 15.33 %
Retailing 14.17 %
Commercial services and supplies 8.50 %
Software and services 7.40 %
Consumer durables and apparel 6.15 %
Materials 5.82 %
Utilities 4.94 %
Telecommunication services 4.54 %
Household and personal products 4.47 %
Energy 2.63 %
Health care equipment and services 1.04 %
Total 97.40 %
Geographical classification
(by domicile of the issuer) (in percentage of net assets)
Japan 97.40 %
Total 97.40 %

ValueInvest LUX
Notes to the financial statements as at 31 December 2014
27
Note 1 - Significant accounting policies a) Presentation of the financial statements The financial statements of the SICAV are established in accordance with the Luxembourg legal and regulatory requirements concerning undertakings for collective investment. b) Valuation of assets The basic accounting principles for determining the Net Asset Value of the Sub-Funds are set forth in the Articles of Incorporation, the material provisions of which provide as follows:
(1) the value of any cash on hand or on deposit, bills and demand notes and accounts
receivable, prepaid expenses, cash dividends and interest declared or accrued as aforesaid and not yet received are deemed to be the full amount thereof, unless in any case the same is unlikely to be paid or received in full, in which case the value thereof is arrived at after making such discount as the Directors may consider appropriate in such case to reflect the true value thereof;
(2) the value of securities, which are quoted or dealt in on any stock exchange is in respect of
each security, the last known price, and where appropriate, the middle market price on the stock exchange which is normally the principal market for such security;
(3) securities dealt in on another regulated market are valued in a manner as near as possible
to that described in the preceding paragraph; (4) in the event that any of the securities held in any portfolio on the relevant Valuation Day are
not quoted or dealt in on a stock exchange or another regulated market or, for any of the securities, no price quotation is available, or if the price as determined pursuant to sub-paragraphs (2) and/or (3) is not in the opinion of the Directors representative of the fair market value of the relevant securities, the value of such securities is determined based on the reasonably foreseeable sales price determined prudently and in good faith;
(5) all other assets are valued at their respective fair values as determined in good faith by the
Directors in accordance with generally accepted valuation principles and procedures.
(6) By circular Resolution with effect as from 4 January 2013, the Board of Directors has resolved:
the security Chaoda Modern Agri (HGS) is suspended for official trading in Hong Kong since 27 June 2011, pending the release of price sensitive information on the Company. The Board authorizes the Central Administration of the SICAV instead of this stale suspended price to take a daily OTC quotation when available.
As at 31 December 2014, this Resolution is still in application. c) Acquisition cost of securities in the portfolio The acquisition cost of the securities held by each Sub-Fund that are denominated in currencies other than the reference currency of the Sub-Fund is converted into this currency at the exchange rate prevailing on the date of purchase. d) Net realised gain (loss) on sales of securities The realised gains and losses on sales of securities are calculated on the basis of the average acquisition cost.

ValueInvest LUX
Notes to the financial statements (continued) as at 31 December 2014
28
e) Investment income Dividend income is recorded at the ex-date, net of any withholding tax. f) Formation expenses
Formation expenses were amortised on a straight line basis over a period of 5 years.
g) Conversion of foreign currencies Cash at banks, other net assets and liabilities and the market value of the securities in portfolio expressed in currencies other than the currency of the Sub-Fund are converted into this currency at the exchange rate prevailing on the date of the report. Income and expenses expressed in currencies other than the currency of the Sub-Fund are converted into this currency at the exchange rate prevailing on the date of the transaction. Exchange gains or losses are recorded in the statement of operations and other changes in net assets. h) Combined financial statements The combined financial statements of the SICAV are expressed in EUR and are equal to the sum of the corresponding items in the financial statements of each Sub-Fund. i) Transaction fees Transaction costs disclosed under the item "Transaction fees" in the expenses of the statement of operations and other changes in net assets are mainly composed of transaction costs incurred by the SICAV relating to purchases or sales of securities, of fees relating to liquidation of transaction paid to the custodian bank. Note 2 - Management fee As remuneration for its services, the Investment Manager receives from the SICAV an effective monthly fee of 0.75% p.a. calculated on the average net asset value of each Sub-Fund, payable within the first ten Business Days after the last day of each month. Note 3 - Central administration costs
The item “Central administration costs” disclosed in the statement of operations and other changes in net assets is mainly composed of administrative agent and transfer agent commissions. Note 4 - Distribution fees The distributors receive a quarterly fee on the retail share classes applicable on the average net assets of their contribution in each Sub-Fund of the SICAV at the maximum annual rate of 1%. As at 31 December 2014, the accrued distribution fees amounted to:
EUR
ValueInvest LUX - Global 660,494.37
ValueInvest LUX - Japan 96,581.04

ValueInvest LUX
Notes to the financial statements (continued) as at 31 December 2014
29
These fees are recorded in the statement of operations and other changes in net assets under the item "Other administration costs". Note 5 - Subscription duty ("Taxe d’abonnement") The SICAV is governed by Luxembourg law. Pursuant to the legislation and regulations in force, the SICAV is subject to an annual "taxe d’abonnement" of 0.05% which is payable quarterly and calculated on the basis of the net assets of each class on the last day of each quarter. Institutional Share Classes benefit from the reduced "taxe d’abonnement" of 0.01%. Note 6 - Total Expense Ratio ("TER") and Portfolio Turnover Rate ("PTR") The TER and the PTR disclosed under "Statistical Information" of this report are calculated in accordance with the "Guidelines on the calculation and disclosure of the TER and PTR of collective investment schemes" issued by the Swiss Funds & Assets Management Association SFAMA on 16 May 2008. The TER and the PTR are calculated for the last 12 months preceding the date of this report. Transaction fees are not taken into account in the calculation of the TER. The PTR has been calculated according to the following formula (Total 1 - Total 2)/M*100 with Total 1 = Total securities transactions = X + Y
X = Securities purchases Y = Securities sales
Total 2 = Total subscriptions and redemptions = S + T S = subscriptions T = redemptions S+T: subscriptions and redemptions are netted per NAV calculation day. M = average net assets
Note 7 - Risk management As required by Circular CSSF 11/512, the Board of Directors needs to determine the global risk exposure of the SICAV either by applying the commitment approach or the VaR approach. In terms of risk management, the Board of Directors of the SICAV decided to adopt the commitment approach as a method of determining the global exposure for each Sub-Fund. Note 8 - Changes in investments The statement of changes in investments for the period in reference to the report is available free of charge at the registered office of the SICAV, at the office of the paying and information agent in Germany, at the office of the representative and paying agent in Switzerland and at the office of the representative agent in Austria.

ValueInvest LUX
Notes to the financial statements (continued) as at 31 December 2014
30
Note 9 - Significant event By circular resolution dated 31st March 2014, the Board of Directors has accepted a contribution in kind in the Sub-Fund ValueInvest LUX - Global. This contribution in kind was valued on 1st April 2014 based on the closing prices as of 31st March 2014, for listed securities and on the last available prices, for the other assets. The total value of the contribution in kind was fixed at EUR 127,417,759.05. The shareholders subscribing through the contribution in kind have received 611,380.256 Class I shares of the Sub-Fund. Note 10 - Subsequent event The suspension for official trading in Hong Kong of the security Chaoda Modern Agri (HGS) since 27 June 2011, was removed on 2nd February 2015. As at 3rd and 4th February 2015, the SICAV sold its shares of the security Chaoda Modern Agri (HGS).