Annual Report - Tata Capital · 2020-03-06 · About Tata Capital A subsidiary of Tata Sons...
202
Annual Report 2014 - 2015
Transcript of Annual Report - Tata Capital · 2020-03-06 · About Tata Capital A subsidiary of Tata Sons...

Annual Report2014 - 2015
AboutTata CapitalA subsidiary of Tata Sons Limited, Tata Capital Limited is registered with the Reserve Bank of India
as a Systemically Important Non-Deposit Accepting Core Investment Company. A trusted,
customer-centric, one-stop financial solutions partner, it caters to the diverse needs of retail,
corporate and institutional customers through a range of offerings, directly or through its
subsidiaries. Predominantly catering to the domestic market, it also has subsidiaries in Singapore
and London.


The most admired financial solutions partner.
Our Vision

Our Culture
Our Mission
KnowKnowledge. It is what empowers us to make a difference in the lives of our customers. It is the fuel that
will power the engine of innovation. It is what will enhance our ability to predict change and adapt
quickly and effectively. So, let us begin each day with a strong desire to know more, for only when we
seek to know more, will we strengthen our pursuit towards excellence.
Care Care. It is at the core of our relationships. It is what forges bonds that endure the test of time.
It is about demonstrating humility and understanding towards all. Care is an appreciation of the truth,
that in unity and in keeping 'we' before 'me', we will truly progress.
DoDo. It is what separates aspirations from reality. It calls for a heightened sense of responsibility and
passion to give our best at all times. And to 'Do Right' is a higher calling. It calls for integrity - a constant
practice of honesty, transparency and fairness. It calls for courage. So, let's do right, for it is what gives
us our unique identity, our unique strength.
We will only do what's right - for all our stakeholders, including our employees, customers and
society at large.
CorporateInformation
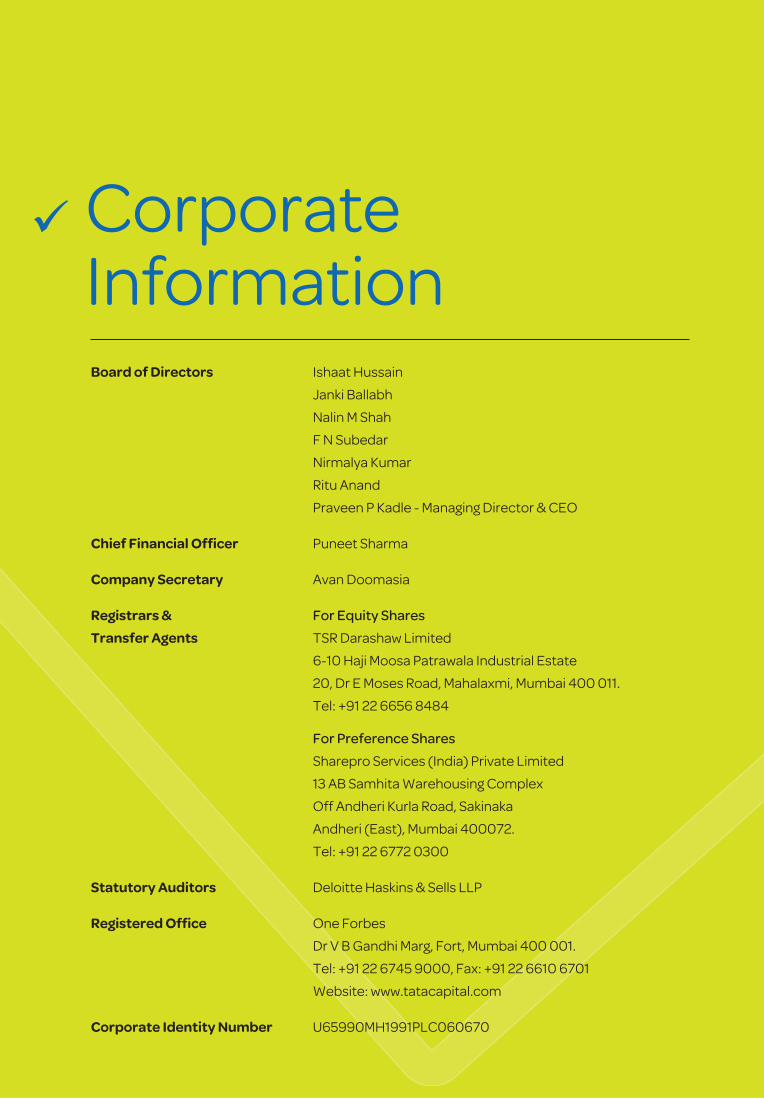
Board of Directors Ishaat Hussain
Janki Ballabh
Nalin M Shah
F N Subedar
Nirmalya Kumar
Ritu Anand
Praveen P Kadle - Managing Director & CEO
Chief Financial Officer Puneet Sharma
Company Secretary Avan Doomasia
Registrars & For Equity Shares
Transfer Agents TSR Darashaw Limited
6-10 Haji Moosa Patrawala Industrial Estate
20, Dr E Moses Road, Mahalaxmi, Mumbai 400 011.
Tel: +91 22 6656 8484
For Preference Shares
Sharepro Services (India) Private Limited
13 AB Samhita Warehousing Complex
Off Andheri Kurla Road, Sakinaka
Andheri (East), Mumbai 400072.
Tel: +91 22 6772 0300
Statutory Auditors Deloitte Haskins & Sells LLP
Registered Office One Forbes
Dr V B Gandhi Marg, Fort, Mumbai 400 001.
Tel: +91 22 6745 9000, Fax: +91 22 6610 6701
Website: www.tatacapital.com
Corporate Identity Number U65990MH1991PLC060670

ContentsMessage from the Managing Director & CEO 16
Directors’ Report 19
Consolidated Financial Statements
Salient Features of Financial Statements of
Subsidiaries / Associates / Joint Venture
Standalone Financial Statements

We only do what’s rightfor you The essence of the Tata Capital brand is encapsulated in its promise –
‘We only do what’s right for you’. The proposition reflects our strong resolve to deliver financial
solutions that are ‘right’ for our customers and the society at large. We seek to build strong
relationships with customers via deep understanding of their needs, strong financial expertise
and the delivery of superior and consistent customer experience across all touch-points.


The Tata Capital brand promise, ‘We only do what’s right for you’, reflects its strong resolve to
deliver solutions that are ‘right’ for customers, stakeholders and the society at large. To propagate
this philosophy of ‘Do Right’, Tata Capital launched the ‘Do Right’ initiative – an initiative that aims
to spread the spirit of ‘doing right’, both by inspiring people to do right and providing platforms to
do right.
The Do Right initiative uses the power of story telling to help highlight various challenges facing the
country, using the digital medium. As the initiative travels across the country, thousands of digital
‘do righters’ ride pillion and help discover real stories of courage and perseverance. Stories that
highlight a challenge and call upon people at large to come forward and ‘do right’ by helping solve
the challenge.
Do Right Website - www.doright.in
Facebook - https://www.facebook.com/tatacapital
Youtube - http://www.youtube.com/TataCapitalLtd
Twitter - https://twitter.com/tatacapital
Instagram - http://instagram.com/tatacapital
Do RightPhilosophy


The Do Right initiative is an extension of Tata Capital’s brand promise ‘We only do what’s right for
you’, and aims to spread and nurture the spirit of doing what’s right. The renowned musical trio -
Shankar, Ehsaan & Loy and classical music maestros - Pandit Shivkumar Sharma, Pandit Hariprasad
Chaurasia, Ustad Zakir Hussain and Ustad Amjad Ali Khan joined the initiative and demonstrated
their support through beautiful musical renditions of the ‘Do Right’ philosophy - imbibed in the
Tata Capital signature song.
Do RightSignature Song

Message from the maestros
The ‘Do Right’ initiative has linked us to Tata Capital. There is a
message, that we are communicating in the ‘Karein wahi jo ho sahi’
song - ‘Doing Right’ manifests itself in many ways, from things we do
everyday to things that can change the nation.
- Shankar, Ehsaan and Loy
The ‘Do Right’ message is for everyone, considering himself
to be an Indian. The composition is very beautiful and we are very
happy to work on the sarod rendition of this composition. It is a
great honour and pleasure to be associated with this initiative.
- Ustad Amjad Ali Khan, Amaan Ali Khan and Ayaan Ali Khan
Today, everyone wants to achieve great things in life, but it is
important that you achieve them by the right means. The thought
of ‘Do Right’ is very inspiring. To inspire children to do right, we must
set ourselves as examples.
- Pandit Shivkumar Sharma and Rahul Sharma
The ‘Do Right’ message deserves deep thought and if we follow it,
many good things can be discovered and we will get peace of
mind. There is a lot of learning for children in this message that
studies may not teach. Children can find a new path with this
message.
- Pandit Hariprasad Chaurasia and Rakesh Chaurasia
Children are our future and it is our responsibility to give them a
chance. It is important to do right for them. The ‘Do Right’ initiative
is about making people realise that it’s time we thought about the
next generation. I hope these films will inspire people to do the
right thing.
- Ustad Zakir Hussain


CorporateSustainabilityIn keeping with the spirit of ‘Doing Right’, Tata Capital is committed to being a dedicated, socially
responsible corporate citizen. Its efforts in the space of Corporate Sustainability fall under two
major areas – Financial Independence and Climate Change, each being driven through initiatives
that are people-centric and have active community participation.
Tata Capital is associated with leading NGOs in the space of financial literacy, education and
training. Its efforts to engage with the community for environmental conservation covers unique
initiatives like the Surya Aranya – a solar-powered lighting solution and a recent partnership with
WWF India to conserve three critical, indigenous endangered species.

Our Range ofOfferingsTata Capital’s range of offerings caters to the diverse financial requirements of its retail, corporate and institutional customers. A one-stop financial solutions partner, Tata Capital’s suite of products and services offers a wide choice of options to the customer.
*Consumer Finance | Home Loans | Loan Against Property | Home Equity | Business Loan | Investment Advisory Services | Wealth Products Distribution | Commercial Finance | Construction Equipment Finance | Infrastructure Finance | Leasing Solutions | Cleantech Finance | Equity Broking | Private Equity | Investment Banking | Rural Finance | Travel & Forex | Tata Cards
*Consumer Finance, Loan Against Property, Commercial Finance, Infrastructure Finance, Rural Finance, Wealth Management Services, Leasing Solutions are originated and serviced by Tata Capital Financial Services Limited (TCFSL). |Investment Advisory Services are brought to you by Tata Capital Limited.| Home Loans are originated and serviced by Tata Capital Housing Finance Limited. | Equity Broking and Investment Banking are brought to you by Tata SecuritiesLimited. Regd Office : One Forbes, Dr V B Gandhi Marg, Fort, Mumbai – 400 001. Tel No. +91 22 67459000. Member of BSE Limited. SEBI Regn Nos. INB010664150 & INF011207954. Member of NSE. SEBI Regn Nos. INB/F/E 231288730. DP ofCDSL. SEBI Regn No. IN-DP-CDSL-450-2008. DP of NSDL. SEBI Regn No. IN-DP-NSDL-298-2008.Merchant Banker SEBI Regn No INM0000111302 , PMS SEBI Regn No. INP000003872. ARN 0021 - Distributors of IPO and MFs. | PrivateEquity Funds are registered with SEBI as Domestic Venture Capital Funds. | Travel & Forex – Travel services are brought to you by TC Travels & Services Limited & Forex services are brought to you by Tata Capital Forex Limited. | Tata TravelCard is a white label card issued, established and operated by Axis Bank. It is marketed and distributed by Tata Capital Forex Limited. | Tata Credit Card is a white label card issued, established and operated by SBI Cards and PaymentServices Pvt. Ltd. It is marketed and distributed by TCFSL. | Cleantech Finance is brought to you by Tata Capital Cleantech Limited | Terms and Conditions apply. All loans and products are at the sole discretion of the respective entities.

Messagefrom theManagingDirector
Dear Shareholder,
In a span of seven years, Tata Capital has achieved many milestones and I wish to thank each one of you for your continued support and patronage.
Tata Capital’s Vision is to be the ‘Most Admired Financial Solutions Partner’ and you will be pleased to know that recognition in this area has already started coming in with Fortune India’s annual ranking of ‘India’s Most Admired Companies’, placing Tata Capital as the 3rd Most Admired Non Banking Financial Company (NBFC).
For Tata Capital, the year 2014-15 was characterized by renewed optimism and strong effective steps taken to garner opportunities and mitigate challenges. Despite a challenging environment, our portfolio saw a 21% growth, closing the year at 34,462 crore. We achieved a consolidated
total Income of 4,203 crore and Profit After Tax of 306 crore, recording very impressive growth rates of 17% and 43%, respectively. All this, has enabled us to maintain our place amongst the top 10 NBFCs, by asset size, in the private sector.
The Corporate Finance Division of Tata Capital Financial Services Limited (“TCFSL”), which includes Commercial Finance, Infrastructure Finance and Leasing, closed on a consolidated basis, with a portfolio of
15,438 crore. While the Infrastructure
Finance business faced a few challenges, the Commercial Finance business saw high growth and the building of a healthy portfolio. Leasing and Cleantech Finance – two relatively new lines of business in our corporate suite, performed very well, each closing the year with a profit.
The Consumer Finance business witnessed significant growth and closed at a total portfolio, of 7,340 crore, a 20% growth over the previous year.
The Rural Finance vertical performed very well amidst very tough conditions. In an industry that witnessed a decline, the business saw an increase of 57% in portfolio to 1,194 crore. The Rural Finance vertical is a key vertical for Tata Capital and the year saw the charting of a clear roadmap outlining the launch of multiple new rural finance products.
Tata Cards – our credit card offering, in alliance with SBI Cards, crossed the 100 crore monthly spends mark and
received the Mastercard Innovation Award this year.
Tata Capital Housing Finance Limited has been consistently reporting strong growth, in both, its asset size and profitability. This year too, it has closed with a portfolio size of 9,283 crore and Profit After Tax of 68 crore, with a Net NPA level of 0.4%.

This year also saw a turnaround of our subsidiary, Tata Securities Limited, engaged in the business of securities broking, depository services, distribution of mutual funds and third party products and investment banking. With a focused strategy and strong leadership team, the business is all set to grow rapidly.
Our Private Equity investments performed extremely well in the year and the consolidated NAV of our family of funds has grown to over 124% of the total paid up capital. The coming financial year should also see some highly profitable marquee exits.
Overall strategically, the year saw us re-orient ourselves with a focus on building ourselves into a pure-play NBFC. With a conscious move towards superior business portfolio, renewed understanding of our identified customer segments, re-alignment of processes and systems and strong focus on product innovation and digital, Tata Capital is geared to move ahead strongly. The Company has launched the ‘Office of Strategic Management’ – an ancillary office which works with the various businesses and functional units to focus on effective and efficient execution of the strategy and to oversee cross-functional themes and creation of long term value.
Our commitment to excellence is a key component of our strategy and goals, and will play a very important role in the achievement of our Vision. We have adopted the Tata Business Excellence Model (“TBEM”) - an internal Business Excellence framework - as the guiding framework in our journey of excellence.
The Tata Capital brand has grown consistently since inception, and today enjoys awareness and consideration scores much higher than many peers in the financial services industry. It is very heartening to note that, as a young brand in financial services, we have already achieved an overall brand awareness of 83% and a positive consideration of 72% as reported in our latest Brand Track survey. Over the next few years, the Tata Capital brand will focus on innovating and launching multiple new products and services. This year, in particular, saw the launch of the Tata Capital Flexi EMI Loans campaign, a truly customer centric offering which provides customers the flexibility to customize their EMI plans across all our key loan products, namely Home Loans, Personal Loans, Business Loans and Auto Loans.
The year also saw Tata Capital go more ‘digital’ with the launch of multiple unique digital assets and more strategic alliances in the digital space. Some of the key digital launches were an Online
Home Search Portal, an Online Car Search Portal covering both new and used cars, and the Tata Capital Mart – a portal which allows our customers to rent, buy and sell construction equipment. Looking ahead, Tata Capital will continue on its digital journey and develop more cost-effective, innovative and customer-centric digital solutions.
All the achievements in the year would not have been possible without determination and talent of the Tata Capital team, which has taken challenges head-on and overcome the obstacles. The year saw us get the Gallup® Great Workplace Award, acknowledging the work done by us toward creating a highly engaged workforce and the CII HR Excellence Award for ‘Significant Achievement in Human Resources’. We have also achieved a level 3 certification for our people processes through the People Capability Maturity Model (PCMM®), making us the only NBFC globally to do so. We aim to take this to a level 5 certification by 2017.
One of the key attributes that we wish to be known for as we traverse our journey towards being the most admired financial solutions partner, is ‘Doing Right’ by our customers, stakeholders and society at large. Our internationally recognized and award winning ‘Do Right’ initiative entered its second season this year, and has placed itself on a larger platform, calling attention to India’s major challenges through the stories it discovers and conveys.
Continuing on our path of ‘Doing Right’, we have strengthened our resolve through our Corporate Social Responsibility (‘CSR’) initiatives by developing lasting partnerships with various NGOs and taking long-term positions in the areas of education, health, development of livelihood and the environment. Tata Capital has contributed an aggregate amount of about
9 crore towards the CSR initiatives and additionally garnered generous donations and support from our network of Do Righter’s . We strongly believe that a society truly develops only if all its members move forward together. Taking this belief ahead, we have also expanded our efforts in the Affirmative Action space.
As we look ahead, we are confident and well prepared for scaling new heights. I, once again, thank you for placing your faith in us and in our potential. I am sure that we, together, have a very exciting and rewarding journey ahead of us.
Thank you.
Praveen P KadleManaging Director & CEOTata Capital Limited


19
DIRECTORS’ REPORT
TO THE MEMBERS OF TATA CAPITAL LIMITED
The Directors have pleasure in presenting the Twenty-Fourth Annual Report and the Audited Financial Statements for the Financial Year (“FY”) ended March 31, 2015.
1. BACKGROUND Tata Capital Limited (“Company” or “TCL”), the flagship financial services company of the Tata
Group, is a subsidiary of Tata Sons Limited and is registered with the Reserve Bank of India (“RBI”) as a Systemically Important Non-Deposit Accepting Core Investment Company (“CIC”). As a CIC, TCL is primarily a holding company, holding investments in its subsidiaries and other group companies and carries out only such activities, as are permitted under the Directions issued by RBI for CICs. TCL and its subsidiaries (collectively referred to as “Tata Capital”) are engaged in a wide arrayofservices/productsinthefinancialservicessector.
A detailed discussion on TCL’s business and that of its subsidiaries is set out in Para 6 of this Report.
2. INDUSTRY AND ECONOMIC SCENARIO The Central and State elections were a mixed bag. India has a single party majority at the
Centre after a long time, resulting in high policy intent, but, moderate action due to constraints. The Government’s recent usage of the ordinance route to pass reforms in key issues such as land acquisition, coal auctions,mining andFDI in Insurance, reflects its conviction behind reformsand willingness to act outside of conventional avenues. The Government’s flagship initiative ‘Make in India’ aims to promote manufacturing, which currently constitutes approximately 18% of GDP versus a targeted 25%. India’s unique combination of democracy, demography and demand would also help make it a suitable manufacturing destination.
The Finance Minister presented the Budget, which addresses some pending concerns, such as (i) laying out a transformative tax regime in terms of GST, GAAR, phased reduction in corporate taxes, abolition of wealth tax (ii) higher public investments to kick start growth (iii) direct benefittransfers/Jan Dhan to streamline/plug leakages in subsidies delivery and (iv) institutionalization of inflation targeting monetary policy framework. However, it has extended the fiscal consolidationroadmapwithfiscaldeficittargetof3.9%inFY2016;3.5%inFY2017and3%inFY2018.Overall,theBudget isafinebalancingactbetweenfiscalconsolidationandcreatingenablingconditions forgrowth and job creation.
India’s growth story got a boost with the rebasing of GDP data. Based on the new series, the real GDP growth stands at 7.4% in FY 2014-15 and 6.9% in FY 2013-14 i.e. approximately 180 bps higher than earlier estimates. While the data shows that growth recovery has been swift and substantial, several on-ground indicators like growth in industrial output, credit and net tax revenues, suggest that activity is still sub-par. Even within the revised GDP data, fixed capitalformationhasbeenweakat4%YOYinFY2015.
RBI commenced its easing cycle with an inter-meeting cut in January 2015. RBI kept rates unchanged in the February 2015 policy and reiterated its guidance ‘further easing will be dependent on data that confirm continuing disinflationary pressures and sustained high qualityfiscal consolidation’. The Government and RBI entered into an agreement on a framework formonetary policy. India imports 80% of its crude oil requirements and crude oil imports constitute 30% of India’s total import bill. After factoring in petro product exports, a US$1/bbl decline in oil prices reduced the tradedeficit byUS$900million,annually.Given thechanges in thecrudepriceassumption of ‘net’ oil import bill to come in at US$57 billion in FY 2016, which represents anapproximatelyUS$45billion decline over the last two fiscal years, it is likely to help keep inflationundercontrol.However,theinternationalcrudepricesarefirmingup.If thetrendcontinues, itcoulddealablowtothelowinflationscenario.

20
Annual Report 2014-15
Closer home, the Non-Banking Financial Companies (“NBFCs”) in India, have evolved over the last fiftyyears toemergeasnotablealternatesourcesofcredit intermediation,especially for the lastmilecredit delivery. Regulation of the NBFC sector over the last decade and a half has been incremental. As and when risks have been detected, they were sought to be addressed. RBI has taken major steps inFY2014-15 toalignasset classificationnormswith thatofBanks (90daysnormphased inover3years).HigherStandardAssetprovisioninghasbeenput inplace (0.40%against theexisting0.25%, phased in over 3 years). The sector will report higher NPAs in the initial period, however, the sector as a whole will emerge stronger after the implementation of these initiatives.
The year ahead will be challenging on the credit quality front. However, if the Government andprivate spending revive, partially assisted by interest rate cuts, FY 2015-16 could witness an improvement in asset quality and growth.
3. FINANCIAL RESULTS (` in crore)
ParticularsConsolidated Standalone
FY 2014-15 FY 2013-14 FY 2014-15 FY 2013-14Gross Income 4,203 3,579 244 167Less:ExpensesFinance Costs 2,481 2,148 41 16EmployeeBenefitsExpenses 353 309 33 31OtherOperatingExpenses 835 702 33 24Depreciation 105 68 8 7Amortization of Expenses 17 11 4 3Profit Before Tax 412 341 125 87Less: Tax Expense 111 143 10 9Profit After Tax 301 198 115 78Share of Associates and Minority Interest 5 16 – –
Balance carried to Reserves 306 214 115 78
Consolidated Results: Tata Capital’s book size increased from `28,435croreasatMarch31,2014 to`34,462croreas
at March 31, 2015, on a consolidated basis. This increase of about ` 6,027crorewasmainlydueto the growth in the loan book of two major subsidiaries viz. Tata Capital Financial Services Limited (“TCFSL”): `2,570croreandTataCapitalHousingFinanceLimited(“TCHFL”):` 2,918 crore.
DuringFY2014-15,TataCapital recordedaconsolidatedTotal Incomeof`4,203croreasagainst`3,579croreinFY2013-14,anincreaseofabout17.4%.TheTotalIncomecomprisedincomefromfinancingactivitiesof`3,714crore (FY2013-14:` 3,258 crore), Investment Income of `134crore(FY2013-14:`60crore)andOtherIncomeof`354crore(FY2013-14:` 262 crore). The growth in incomefromfinancingactivitieswasinlinewiththegrowthinadvances.
During theyear,TataCapital’sProfitAfterTax (“PAT”)onaconsolidatedbasis, increasedbyabout42.6%to`306crore(FY2013-14:`214crore).
During FY 2014-15, Tata Capital’s consolidated interest expense was ` 2,481 crore (FY 2013-14: ` 2,148 crore).This increasewas on account of higher borrowings of ` 5,396 crore (FY2013-14:` 3,418 crore), in linewith the growth in the loan portfolio.Notwithstanding the tightliquidity conditions in the market, Tata Capital was able to ensure a comfortable liquidity position to support its business requirements.

21
As stated above, during FY 2014-15, the Operating Expenses, which include credit costs andprovisions for diminution in value of investments, increased by 18.9% and stood at ` 835 crore, as against ` 702 crore in FY 2013-14. The Operating Expenses, excluding credit costs andprovisions for diminution in value of investments, increased by 12%. Employee costs increased from ` 309crore inFY2013-14 to` 353crore inFY2014-15,owing to increase inmanpowerstrengthto support new businesses and growth in existing businesses and on account of salary increments, which were broadly in line with industry.
Due to a tough economic environment, the consolidated Gross NPA increased from 3.5% in FY 2013-14 to 4.2% in FY 2014-15. The Net NPA in FY 2014-15 was 2.8% as against 2.9%in FY 2013-14. A provision of ` 21 crore (FY 2013-14: ` 15 crore) was made for Standard Assets on incremental Standard Assets for FY 2014-15. Further, a provision of ` 4 crore (FY 2013-14: ` 28 crore) was made on restructured advances pursuant to a new requirement introducedbyRBI duringFY2013-14.The consolidatedReturn onAssets (“RoA”) forFY2014-15was0.7%(FY2013-14:0.6%)whiletheReturnonEquity(“RoE”)was5.4%(FY2013-14:3.8%).
Standalone Results: During FY 2014-15,TCL recorded aGross Income of ` 244 crore (FY 2013-14: ` 167 crore) and
PAT of ` 115 crore (FY 2013-14: ` 78 crore). The increase in PAT was mainly on account ofincrease in Dividends from Investments.
4. SHARE CAPITAL The paid-up Equity Share Capital of the Company was ` 2,826 crore as on March 31, 2015. This
was held by Tata Sons Limited (90.28%), Tata Investment Corporation Limited (2.73%) and TCLEmployeeWelfareTrust (through itsTrustees)(1.97%).Thebalance5.02%washeldbyotherTatacompanies, trusts, other corporates, individuals and employees of Tata Capital.
During FY 2014-15, the Company successfully raised funds by way of an issuance of 8.33%Cumulative Redeemable Preference Shares (“CRPS”) of ` 1,000 each aggregating ` 210.07crore,on a private placement basis. Consequent to the above issue, the paid up Preference Share Capital of the Company was `896.45crore,asonMarch31,2015.
The Company had, on March 31, 2015, issued and offered 25,00,000 8.33% CRPS of the Face Value of ` 1,000/- each, at par, aggregating ` 250 crore, on a private placement basis, with an option to retain oversubscription of not more than 25,00,000 CRPS aggregating ` 250 crore. Consequently,theCompanyallotted46,48,5008.33%CRPSoftheFaceValueof` 1,000/- each at par, aggregating ` 464.85crore,onApril22,2015.
Under theTataCapitalLimitedEmployeeStockPurchase /OptionScheme (“ESOPScheme”), theCompany had allotted 7,02,34,526EquityShares of` 10 each of the Company to TCL Employee WelfareTrust (through itsTrustees).TheTrustwassetup toadministerand implement theESOPScheme. As on March 31, 2015, the number of Equity Shares held by the employees under the ESOPSchemeaggregated1,44,54,295.
5. DIVIDEND The Directors recommend for the approval of the Members, payment of dividend on CRPS for
FY2014-15,asunder:i) On20,71,066CRPSatthecouponrateof12.50%p.a. : ` 25.89 croreii) On68,93,401CRPSatthecouponrateof8.33%p.a. : `50.87crore
(on a pro-rata basis from the allotment date)iii) Total Dividend Distribution Tax : Niliv) TotalOutgo : ` 76.76crore
In order to conserve the resources of the Company and to build up reserves and considering the business plans of the Company, the Directors do not recommend payment of dividend on Equity Shares for the Financial Year ended March 31, 2015.

22
Annual Report 2014-15
6. OVERVIEW OF THE COMPANY, ITS SUBSIDIARIES, ASSOCIATES AND JOINT VENTURE
6.1 Structure of Business Operations at Tata Capital TCL is primarily a holding company, holding investments in its subsidiaries and other group
companies and carries out only such activities, including management of private equity funds as are permitted under the Directions issued by the RBI for CICs. All the other operating businesses are carried on by the subsidiaries of TCL. The Company has completed seven full years of operations and over this period, has emerged as one of the leading players in the NBFC space in India.
The financial services sector in India, as also globally, is highly regulated. TCL and itssubsidiaries are subject to regulations by authorities such as RBI, the Securities and ExchangeBoardofIndia(“SEBI”), theNationalHousingBank(“NHB”), theMonetaryAuthorityof Singapore and the Financial Conduct Authority, UK.
As a one stop financial services provider, Tata Capital caters to the diverse financialrequirements of its retail, corporate and institutional customers with a wide suite of products and service offerings. In the corporate segment, the Company’s wholly owned subsidiary, Tata Capital Financial Services Limited (“TCFSL”) offers commercial finance, infrastructurefinance and leasing solutions to corporate customers. In the consumer segment, TCFSLprovides asset finance and rural finance to its retail customers. TCFSL is also engaged inthe business of distribution of investment products such as Mutual Funds under its Wealth Products Distribution business and is engaged in the distribution of White Label Credit Cards, inassociationwith itsbankpartners.TataCapitalalsooperates in thehousingfinancespace through another wholly-owned subsidiary viz. Tata Capital Housing Finance Limitedwhich offers Housing Loans and Loans against Property, mainly in the retail segment. Tata Cleantech Capital Limited, also a subsidiary of the Company, provides financeand advisory services to corporate customers for renewable energy, energy efficiencyand water management projects. Tata Capital provides investment banking and broking services to retail and institutional clients in India through its wholly owned subsidiary, Tata Securities Limited. In the private equity space, TCL has sponsored Private Equity Funds in India, to which it acts as an Investment Manager. The Company’s step-down wholly-owned subsidiary in Singapore, Tata Capital Advisors Pte. Limited (“TCAPL”), also acts as an Investment Manager to the Private Equity Funds set up in Singapore, to which, TCL acts as an Advisor. Tata Capital offers travel and forex related services to the retail and corporate customers, through two wholly owned subsidiaries viz. TC Travel and Services Limited and Tata Capital Forex Limited, respectively. Tata Capital Pte. Limited (“TCPL”), a wholly-owned subsidiary of TCL, has been established in Singapore as the International Headquarters ofTataCapital and is responsible forTataCapital’s international presence andactivities.
6.2 Private Equity The Company has set up four Private Equity Funds in India viz. Tata Capital Growth
Fund I,TataCapitalHealthcareFund I,TataCapital InnovationsFundandTataCapitalSpecialSituations Fund (collectively referred to as “Funds”). These Funds have been registered with SEBI as Venture Capital Funds. The Company has sponsored these Funds and acts as their Investment Manager and has also invested in the Funds by subscribing to units of these Funds. In addition to the above, the Company’s wholly-owned subsidiary in Singapore, TCAPL, is the Investment Manager for Tata Capital Growth Fund Limited Partnership, Tata Capital HBMHealthcareFundILimitedPartnershipandTataOpportunitiesFundLimitedPartnership.
The performance of the above Funds is reviewed below:
i) Tata Capital Growth Fund I (“TCGF”) TCGF targets private equity growth capital investments in companies that have
a significant portion of their operations in India. TCGF aims to provide growth capitalfunding of around ` 50 crore to mid-market companies with an average holding period

23
of three to five years. TCGF’s investment focus themes are Urbanization, DiscreteManufacturing, Strategic Services and Growth Opportunities. TCGF declared its finalclose in February 2011 with commitments of ` 339 crore, of which, ` 198 crore has been invested (“NAV”) as at March 31, 2015, in portfolio companies. At March 31, 2015, the Net Asset Value per unit was ` 1.02 as compared to the paid up value of `0.67.
ii) Tata Capital Healthcare Fund I (“TCHF”) TCHF focuses on private equity growth capital investments in companies in the
pharmaceutical, contract research/manufacturing, healthcare services, medical devices, diagnosticandotherhealthcaresectors.TCHFseeksinvestmentsinhealthcarecompanieswith high growth potential and a favourable risk-reward balance. TCHF declared its finalclose in April 2012 with commitments of ` 320 crore, of which, ` 117 crore has beeninvested as at March 31, 2015, in portfolio companies. At March 31, 2015, the NAV per unit was ` 0.61 as compared to the paid up value of ` 0.49.
iii) Tata Capital Innovations Fund (“TCIF”) TCIF focuses predominantly on technology led innovations which represent
breakthrough, fundamental or incremental changes in technology or process. TCIF is a sector agnostic fund and invests across all stages of an enterprise, provided the proof of concept is established. TCIF declared its final close inApril 2012 with commitmentsof ` 287 crore, ofwhich,` 89 crore, as at March 31, 2015, has been drawn down and investmentsmade infiveportfoliocompanies.AtMarch31,2015, theNAVperunitwas `517ascomparedtothepaidupvalueof`492.
iv) Tata Capital Special Situations Fund (“TCSSF”) TCSSF focuses on investing in turnaround opportunities. TCSSF declared a final
close with commitments of ` 360 crore, essentially from Public Sector Banks in India. However, due to regulatory restrictions, the aggregate utilizable commitmentis only ` 267 crore. Of this, TCSSF has invested ` 213 crore in four portfolio companies which have shown good performance and consequently, the NAV has improved by 21% in the past one year. During the year, TCSSF partially exited from its investment in one of its portfolio companies at a profit of ` 10 crore, yielding a 20% IRR. At March 31, 2015, the NAV per unit was ` 1,37,592 as compared to the paid up value of ` 1,00,000.
v) Overseas Funds The Overseas Funds viz. Tata Capital Growth Fund Limited Partnership (“TCGFLP”),
Tata Capital HBM Healthcare Fund I Limited Partnership (“TCHHFLP”) and TataOpportunities Fund Limited Partnership (“TOF”) are based in Singapore and have beenset up by TCPL. These funds accept commitments only from overseas investors. TOFdeclared its final close in March 2013, with commitments of US$ 545 million, of which, US$ 231 million has been invested in portfolio companies (excluding follow-on commitments), as at March 31, 2015. TCL has a co-investment arrangement with TOF, whereby TCL has agreed to co-invest the Rupee equivalent of an amount of upto US$50millionalongsideTOF,subject toregulatoryrestrictions.TCGFLPdeclared itsfinalclose in November 2011with commitments of US$ 167million, of which, US$ 74millionhas been invested as at March 31, 2015, in portfolio companies. During the year, the Fund partiallyexitedfromitsinvestmentinoneof itsportfoliocompaniesataprofitof` 8 crore. TCHHFLPdeclareditsfirstcloseinMarch2014andhascommitmentsofUS$8millionasatMarch31,2015.TCHHFLPisexpectedtodeclareitsfinalcloseinFY2015-16.

24
Annual Report 2014-15
6.3 Review of Subsidiaries, Associates and Joint Venture 6.3.1 Subsidiaries:
As on March 31, 2015, the Company had the following subsidiaries, brief details of whose performance are given below:
i) Tata Capital Financial Services Limited (“TCFSL”) TCFSL is a wholly-owned subsidiary of the Company, registered with RBI as a
Systemically Important Non Deposit Accepting Non-Banking Finance Company. Pursuant to the conversion of TCL into a CIC in May 2012, all the fund based and fee based activities (except private equity and investment advisory) hitherto carried on by TCL were transferred to TCFSL. TCFSL has three main areas of business viz. Corporate Finance, Consumer Finance & Advisory and Rural Finance.
TCFSL’s average book size increased by ` 1,743 crore from ` 19,734 crore in FY 2013-14 to ` 21,477 crore in FY 2014-15. During FY 2014-15, the Gross Incomemarginally increased by 10% and stood at ` 3,065 crore (FY 2013-14: ` 2,783 crore).PAT for FY 2014-15 was ` 187 crore (FY 2013-14: ` 172 crore). The Gross and NetNPAs increased and stood at 5.7% and 3.8% in FY 2014-15, compared to 4.5% and3.7%, respectively, inFY2013-14.TheCost to Incomeratio inFY2014-15was48%ascomparedto48.5%inFY2013-14.
(a) Corporate Finance The Corporate Finance Division of TCFSL has three broad business segments
viz. Commercial Finance, Infrastructure Finance and Leasing.
Commercial Finance The Commercial Finance segment specializes in product offerings ranging from vanilla
term loans, working capital term loans, channel finance, bill discounting, equipmentfinancing, lease rental discounting and promoter finance through structured products.This segment serves over 1,600 customers through its verticals viz. large corporates, mid-size corporates, supply chain & trade finance and equipment finance and has setup a Government Business vertical in FY 2014-15 which works towards meeting thefinancial needs of Government enterprises and Public Sector Undertakings across the country. All the verticals are supported by the Competence Centre which focuses on debt syndications, down selling and new product development.
Despite low credit growth due to the very challenging business environment, Commercial FinanceendedFY2014-15withabookof`10,645croreascompared to` 8,978croreat the end of FY 2013-14. This segment has disbursed loans of ` 35,150 crore during FY 2014-15 through its diverse and customer centric product offerings. This segmentearned a total Net Interest Income and fee income of ` 361 crore.
The five verticals of Commercial Finance viz. supply chain & trade finance, largecorporates, mid market corporates, equipment finance and government business caterto all customer segments and had a book size of ` 5,236 crore, ` 2,804crore,` 1,986 crore, ` 330 crore and ` 289 crore, respectively, as at March 31, 2015.
TheCommercial FinanceBusiness is committed to being a complete financial solutionspartner to its corporate clients, through high quality service levels and innovative products which provide value to its customers. Keeping the customer at the core of its strategy, this segment is planning to grow its portfolio while improving asset quality.
Infrastructure Finance The Infrastructure Finance segment has three main verticals viz. Construction Equipment
Finance, Project Finance and Equipment Rental. In view of the subdued macroeconomic environment, companies operating in the
Infrastructurespacefacedadifficultoperatingenvironment inFY2014-15.Thecountry’s
25
Infrastructure sector was also adversely affected by regulatory issues and delayed payments from Government bodies. These challenges also had an impact on TCFSL, resulting in reduced disbursement levels as compared to FY 2013-14 and increasedstress on the portfolio quality. Considering the challenges, the Infrastructure Finance segment was cautious in extending new credit so as to maintain asset quality.
During FY 2014-15, Construction Equipment Finance continued to be amongst the topfive players in the industry. While Project Finance worked with caution on account ofthe slowdown in the economy, the Equipment Rental business stabilized during the year. This segment disbursed fresh loans of ` 1,892 crore in FY 2014-15 (FY 2013-14: ` 2,425 crore) and closed the year with a decrease in the book size by 24% at `4,370crore(FY2013-14:` 5,717crore).
A decision was taken that TCFSL would not undertake any new loan proposal related to Project Finance in the next financial year. During FY 2014-15, TCFSL transferred,at commercial terms, a loan portfolio aggregating ` 350 crore related to renewable/ non-conventional energy, water management, energy efficiency, etc. to Tata CleantechCapital Limited (“TCCL”), its fellow subsidiary. TCCL will be undertaking the project financebusinessgoingforward.
A Remedial Group was established on April 1, 2015, with the primary responsibility of identifying, quantifying and minimizing the loss that could be incurred on impaired assets. This Group will focus on the reduction in impaired asset portfolio through proactive asset management, disposals, practical solutions, debt restructuring and portfolio monitoring, on an ongoing basis.
Leasing In its second year of operations, the LeasingBusiness has built a varied and profitable
asset portfolio. As on March 31, 2015, the outstanding book was about `423crore,withexposure to diverse asset classes ranging from Capital Goods, Information Technology, Auto andOffice Equipments. The Leasing Business has built a client roster comprisingreputed customers from diverse industries. Operating leases constituted a significantcomponent of its total sanctions of nearly `600croreduringFY2014-15.
In FY 2015-16, the Leasing Business will focus on vendor programs with OriginalEquipment Manufacturers, large ticket deals and structured products to offer innovative assetfinancingsolutionstothecorporatesector.
(b) Consumer Finance TCFSL offers through its Consumer Finance and Advisory Division (“CFAB”), a wide
range of consumer loans such as Auto Loans (Car and Two Wheeler), Commercial Vehicle Loans, Business Loans, Personal Loans, Consumer Durables Loans, Loans against Property and Loans against Securities.
Disbursements in FY 2014-15 aggregated ` 4,917 crore as compared to ` 3,655 crore in FY 2013-14, representing an increase of about 35%. Auto Loanscontinued to constitute the major share of disbursements at `1,944crore inFY2014-15(FY2013-14:`1,842crore).
Going forward, CFAB plans to grow its business through ramping up high Net Interest Margin focus products, balancing its product mix, growing fee based income, optimizing operatingcostsandimprovingcollectionefficiencyforenhancingitsprofitability.
(c) Rural Finance FY2014-15wasa toughyear for the ruraleconomydue tonatural factors likeuntimely
monsoonandseveredroughtconditions.However,despite thesubduedmacroeconomicenvironment, the Rural Finance Business ended the year with a book of `1,194croreascompared to ` 760 crore last year, registering a growth of about 57%.Disbursals grewfrom ` 559 crore to `743crore.

26
Annual Report 2014-15
Currently, the business operates out of 33 branches and 220 locations. Going forward, it plans to have a deeper penetration into the rural markets by tapping opportunities for lending in Agri Allied value chains and by entering new geographical locations.
(d) Others Tata Card is a white label credit card, launched in partnership with SBI Cards and
Payments Services Limited. Tata Card is committed to developing long-term relationships with its customers by providing high-quality services and products through regular customer engagement in an easy and convenient manner. Tata Card offers Tata Platinum Card to corporates for their Travel and Entertainment expenses, by providing safety, convenience and security in using the card.
On the retail side, Tata Platinum and Tata Titanium Card are offered with unmatchedrewardsandbenefitstothecustomer.
During the year, ‘LandmarkLimited’wasaddedasa partner to “Empower”, the flagshiployalty program of Tata Cards, providing myriad opportunities for the customer to earn rewards. “Empower” is designed to reward customers for every transaction and offers them convenient and hassle free redemption across partners – Croma, Titan, Westside, etc.
AsofMarch31,2015,TataCardshasabaseof1.47lakhcustomers,upfrom1.40lakhcustomersasofMarch31,2014.TotalannualspendforFY2014-15was`1,074crore,up from ` 818 crore in FY 2013-14, resulting in a growth of 31% in spend, while thisindustrygrewby24%.The targetedapproachof thebusiness to seize thee-commercewavehasresultedingrowthofonlinespendby127%overthepreviousyear.Theonlinespend aggregated ` 275 crore inFY2014–15.Contribution frome-commercewas29%inFY2014-15ascomparedto17%inFY2013-14.
ii) Tata Capital Housing Finance Limited (“TCHFL”) TCHFL is a wholly-owned subsidiary of the Company and is registered with NHB
to carry on housing finance activities. TCHFL offers Housing Loans and Loansagainst Property to various segments of society and has been focusing on business opportunitiesavailablewithin theTataecosystem.Apart fromHousingLoansandLoansagainst Property to the retail segment, TCHFL also provides Project Finance Loans todevelopers. TCHFL has significantly grown its presence in providing Project Financeto eligible projects across the country and has also ramped up its rural and affordable housingfinancebusiness.
Despite an increase in residential property prices during FY 2014-15, the demand forindividual home loans remained buoyant, with strong growth coming from Tier-II and Tier-III cities. Other factors that promoted strong demand for individual home loansinclude increase indisposable incomes, interest ratesubventionandfiscal incentivesonhousing loans.
During the year under review, TCHFL disbursed Mortgage Loans amounting to ` 4,563 crore (FY 2013-14: ` 3,159 crore), representing an increase of over 44%.This included Housing Loans of ` 3,255 crore (FY 2013-14: ` 2,269 crore). TCHFL’sloan portfolio increased by 46% and stood at ` 9,283 crore on March 31, 2015 (March31,2014:` 6,366 crore).
In FY 2014-15, TCHFL recorded Gross Income of ` 910 crore and PAT of ` 68 crore as compared to Gross Income of ` 643 crore and PAT of ` 58 crore in FY2013-14.
In FY 2014-15, TCHFL availed refinance of ` 751 crore from NHB under variousrefinanceassistanceschemes.
27
As a strategy, TCHFLwill continue tomaintain a balanced housing loan book betweenthe salaried and self-employed segment and grow its disbursements significantly tobecomeoneof themajor playersamong theHousingFinanceCompanies in Indiaoverthe next few years.
iii) Tata Cleantech Capital Limited (“TCCL”) TCCL is a Systemically Important Non Deposit Accepting Non-Banking Finance Company
registeredwith theRBI and engaged in the business of providing finance and advisoryservices for projects in renewable energy, energy efficiency, waste management andwater management. TCCL is a joint venture between TCL and International Finance Corporation (“IFC”), Washington D.C., USA, in the ratio of 80.50:19.50.
During FY 2014-15, TCCL focused on consolidating its strengths in origination andevaluation of projects in its mandated areas of businesses, expanded its sphere of relationships with leading Independent Power Producers, Technology providers, Erection Procurement and Construction players and other leading Financial Institutions and participated in direct as well as consortium lending projects. TCCL sanctioned loans for projects being set-up in new emerging renewable energy destination states such as Madhya Pradesh and continued to strengthen and leverage its relationship with leaders in various stages of the value chain. TCCL has entered into a Memorandum of Understanding with Energy Efficiency Services India Limited, a Joint Venture of NTPCLimited, Powergrid Corporation of India Limited, Power Finance Corporation and Rural ElectrificationCorporation,tofacilitateimplementationofenergyefficientprojects.
During FY 2014-15, TCCL purchased a loan portfolio aggregating ` 350 crore, related to renewable/non-conventional energy, water management, energy efficiency, etc. fromTCFSL, its fellow subsidiary.
AttheendofFY2014-15,TCCLhadaloanbookof` 671crore,across28transactions.TCCL’sGrossIncomeforFY2014-15stoodat` 28 crore and the PAT at ` 6 crore. The loan portfolio consisted of projects in the areas of Wind Energy, Solar Energy, Small Hydro Energy, Off-grid Solar, Waste Management, Water Management and EnergyEfficiency.
iv) Tata Securities Limited (“Tata Securities”) Tata Securities is a wholly-owned subsidiary of the Company, engaged in the business
of securities broking, investment banking services, depository participant services and distribution of mutual fund units and third party products. It is a member of the National Stock Exchange of India Limited in the cash, derivatives, currency derivatives and wholesale debt market segments and of BSE Limited in the cash and derivative segments. Tata Securities is also a Depository Participant of the National Securities Depository Limited and the Central Depository Services (India) Limited and holds a Merchant Banking License issued by SEBI.
During the year under review, Tata Securities reported Gross Income of ` 36 crore (FY 2013-14: ` 24 crore) and PAT of ` 4 crore (FY 2013-14: Loss After Tax of ` 12 crore).
Investor sentiment looks positive and seems to be building up in the wake of the improving political/economic environment. The Indian securities market is poised to grow significantly and the increase in market participation by the retail and the institutionalclients will enhance the future outlook of the broking company. India has emerged as one of the strongest economies in the emerging markets. Brokerage Houses are optimisticaboutdomestic inflows intoequities inFY2015-16.The robust sentiment inanticipationofeconomicreformscouldseeadditionalFIIinflowsinFY2015-16.
Efforts are being undertaken to improve the performance of Tata Securities and achieve profitability in all its business segments. There have been concerted efforts to work
28
Annual Report 2014-15
together with teams from TCFSL, TCPL, Singapore and its subsidiary companies, to offer seamless service to clients for all their investment banking requirements, subject to compliance with local regulations and at an arm’s length basis.
v) TC Travel and Services Limited (“TCTSL”) TCTSL is a wholly-owned subsidiary of the Company, primarily engaged in travel
and travel related services. With a view to arrest its losses, TCTSL had put in certain measures for cost optimization and revenue growth. For the year ended March 31, 2015, TCTSL achieved a growth in turnover of 6.7% from ` 178 crore in FY 2013-14 to ` 189 crore. In order to yield higher revenue, TCTSL also laid stress on Meetings, Incentives, Conferences, Exhibitions (MICE) and leisure segments. Revenue in FY 2014-15 grew by 47% to ` 12 crore as against ` 8 crore, recorded in FY2013-14.Asa result of the revenuegrowthandcostoptimizationsachieved,TCTSLachievedasignificant improvement in itsfinancialperformance,with loss for theyearof` 0.5 crore, a swing of ` 6.1 crore over the previous year’s loss of ` 6.6 crore.
vi) Tata Capital Forex Limited (“TCFL”) TCFL(formerlyknownasTTHoldings&ServicesLimited),awholly-ownedsubsidiaryof
the Company, holds a Full-Fledged Money Changer License from RBI and is engaged in the money-changing business through foreign currency Traveller Cheques and pre-paid Travel Cards. Stress on revenue growth was primarily due to TCFL not having won the bid for retention of the airport counters at Bengaluru and the loss of business for nearly 7months fromamajor customer.However,TCFL’s shift in product focus to saleof travel cards, which yields better back-end incentives, helped in its revenue generation during the year. Consequently, during FY 2014-15, TCFL’s revenue remained flat at ` 15.6 crore (FY2013-14:` 15.7 crore) and the loss for the yearwas` 3 crore, which was better by about ` 3 crore over the previous year’s loss of ` 6 crore.
vii) India Collections Management Limited (“ICML”) ICML was set up as a joint venture between TCL and IFC, Washington D.C., USA, in
the ratio of 81:19, to provide receivables and collections management services in the banking, financial and other industrial sectors and consultancy, advisory services inrelation thereto. During the year, the entire Equity Shares held by IFC were acquired by TCL and thereby, ICML became a wholly-owned subsidiary of the Company. ICML is yet to commence business.
viii) Tata Infrastructure Capital Limited (“TICL”) TICL was incorporated as a wholly-owned subsidiary of the Company, to operate as an
Infrastructure Finance company, but, has yet to commence business activity.
ix) Tata Capital Pte. Ltd., (“TCPL”) Singapore and its subsidiaries viz. Tata Capital Advisors Pte. Ltd. (“TCAPL”), Singapore, Tata Capital Markets Pte. Ltd. (“TCMPL”), Singapore and Tata Capital Plc. (“TCPLC”), U.K.
TCPL, a wholly-owned subsidiary of TCL incorporated in Singapore in 2008, has been establishedastheInternationalHeadquartersofTataCapital.TCPL,eitheron itsownorthrough itssubsidiaries, isengaged in fundmanagement,advisingoncorporatefinance,dealing in securities and investments in debt papers.
TCAPL, a wholly-owned subsidiary of TCPL, holds a Capital Markets Services (“CMS”) licence under the Securities and Futures Act of Singapore, issued by the Monetary Authority of Singapore (“MAS”) for conducting regulated Fund Management activities. TCAPL acts as an Investment Manager to the offshore Private Equity Funds set up by TCPL. The total commitment from investors in the offshore Private Equity Funds managedbyTCAPLstandsatUS$720million,asonMarch31,2015.
29
TCMPL, a wholly-owned subsidiary of TCPL, holds since FY 2013-14, a CMS licencefromMASforconducting regulatedactivities (excluding IPOs)suchascorporatefinanceand dealing in securities. During FY 2014-15, TCMPL completed seven CorporateFinanceAdvisory deals and also completed its first securities dealings transaction withthe successful placement of equity shares for a client listed on the Singapore Stock Exchange.
TCPLC, a wholly owned subsidiary of TCPL, incorporated in the UK, is authorised by the Financial Conduct Authority to provide regulated services, with a focus on cross border mergers and acquisitions. TCPLC also acts as an intermediary providing fund marketing services to TCAPL.
During the year under review, TCPL recorded consolidated Gross Income of US$ 18.7 million i.e. ` 114.7 crore (FY 2013-14: US$ 18.0 million i.e. ` 108.7 crore),Profit Before Tax of US$ 7.6 million i.e. ` 46.5 crore (FY 2013-14: US$ 6.2 million i.e. ` 37.3 crore) and PAT of US$ 7.6 million i.e. ` 46.5 crore (FY 2013-14: US$ 6.2 million i.e. `37.4crore);(US$amounttranslatedat` 61.25, the annual average exchangerateforFY2014-15.
x) Other Subsidiaries In addition to the above subsidiaries, the following entities are also treated as
subsidiaries of the Company, as per the applicable Accounting Standards:i. Tata Capital General Partners Limited Liability Partnership (“LLP”), a partnership
formed in Singapore to act as a General Partner and manage the Tata Capital Growth Fund Limited Partnership.
ii. Tata Capital Healthcare General Partners LLP, a partnership formed in Singaporeto act as aGeneralPartner andmanage theTataCapitalHBMHealthcareFund ILimited Partnership.
iii. TataOpportunitiesGeneralPartnersLLP,apartnership formed inSingapore toactasaGeneralPartnerandmanagetheTataOpportunitiesFundLimitedPartnership.
6.3.2 Associates/Joint Venture:i) e-Nxt Financials Limited (“e-Nxt”)
e-Nxt, a subsidiary of Tata Sons Limited, is engaged in developing and providing Collections and Business Process Management solutions, focused primarily on the Banking and Financial Services Industry and catering largely to the domestic market.
The entire equity capital of e-Nxt is held equally by Tata Sons Limited and TCL. During FY 2014-15, the Board of e-Nxt approved its amalgamation with Tata BusinessSupportServices Limited (“TBSS”), subject to the approvals of theHon’bleHighCourtsof Hyderabad and Bombay. TBSS is engaged in the business of providing voice and non-voice based business process services to its clients. It focuses on front officeservices like Customer Acquisition, Customer Management and Loyalty Management across four focus verticals viz. Telecom & Media, Retail, e-Commerce and Banking Financial Services and Insurance. The Appointed Date of the amalgamation is April 1, 2014.Theapproval from theHon’bleHighCourtofHyderabadhasbeen receivedwhilethe approval from theHon’bleHighCourt of Bombay, is awaited.Upon approval of theSchemeoftheaforesaidamalgamation,theCompanywouldreceive37EquitySharesof` 10 each of TBSS for every 100 Equity Shares held in e-Nxt.
ii) Tata Autocomp Systems Limited (“TACO”) TACO,aTatagroupcompany,providesproductsandservices intheautomotive industry
toIndianandglobalcustomers.TCLacquireda24%equitystakeinTACOinJune2008,which involved an investment of ` 185 crore.
30
Annual Report 2014-15
iii) International Asset Reconstruction Company Private Limited (“IARC”) IARC is registered under Section 3 of the SARFAESI Act, 2002, as a Securitisation and
Reconstruction Company with RBI. IARC was promoted in 2002 by professionals from the banking and financial services sector, for reconstruction of financial assets. TCFSLholds a 25.37% equity stake in IARC which involved an investment of ` 33.1 crore. InFY2014-15,IARCrecordedaTotalIncomeof`33.5crore(FY2013-14:` 21.5 crore) and PAT of ` 4.4 crore (FY2013-14:` 3.1 crore). IARC’s paid up Equity Share Capital and Networth as on March 31, 2015 were ` 55 crore and ` 120 crore, respectively.
iv) Hemisphere Properties India Limited (“Hemisphere”) HemisphereceasedtobeanAssociateoftheCompany,witheffectfromMarch26,2015.
v) Nectar Loyalty Management Limited (“Nectar”) TCLholds49%inthejointventureand51%isheldbyAIMIA (formerly known as Groupe
Aeroplan Inc.). The joint venture was expected to launch a multi-party coalition loyalty program in India. The Board of Nectar has taken a decision to hold its operations in abeyance. TCL made a provision of ` 13 crore for its entire investment in Equity and CompulsorilyConvertibleDebenturesofNectarduringFY2014-15.
6.3.3 Other Investments: As at March 31, 2015, the Company had, as per its Consolidated Financial Statements,
total investments of ` 2,102 crore (FY 2013-14: ` 1,407 crore). Of this, ` 502 crore (FY 2013-14: ` 470 crore) were investments in associate companies and balance ` 1,600 crore (FY 2013-14: ` 937 crore) were in shares of other companies and in debtinstruments such as debentures, pass through certificates, commercial paper, governmentsecurities, etc. The Company’s investment in its subsidiaries stood at ` 4,223 crore asat March 31, 2015 (FY 2013-14: ` 3,640 crore), representing 79% of its total Assets (FY 2013-14: 83%),which amount is eliminated in theConsolidated Financial Statements, inaccordance with the prevailing Accounting Standards.
6.3.4 Provision for Investments: As on March 31, 2015, an aggregate provision on a consolidated basis, of ` 194 crore
(FY2013-14:` 259 crore) has been made for diminution, other than temporary, in the value of investments.
7. ALLIANCES Tata Capital’s alliances and partnerships are based on and are an extension of its core objects and
values. These include alliances with:– Mizuho Securities Company Limited, to foster business co-operation in private equity,
investment banking (including cross border mergers and acquisitions), securities business (including broking and distribution), structured finance and other business areas, such aswealth management.
– Mizuho Bank Limited, to foster business co-operation, enhance cross-market value creation capabilities and strengthen competitive advantages in addition to aiding each other in gaining a deeper understanding of the Indian and Japanese markets.
– Mitsubishi UFJ Securities Company Limited, to establish a basis for co-operation in a wide range of strategic business areas that include cross-border investment banking, global offering of Indian equities and working towards development of a local bond market.
– International Finance Corporation, Washington D.C., USA (a member of the World Bank Group), to foray into the area of Climate change with the formation of TCCL.
– Century Tokyo Leasing Corporation, to co-operate with and assist each other in connection with the operation of the Leasing Business of TCFSL and all other aspects related to the purchase of assets for leasing/hire purchase to corporate customers in India, sale of leased assets to any person and to establish at a future date, a joint venture company for carrying on leasing business in India.

31
– AIMIA (formerly known as Groupe Aeroplan Inc.), the Canadian Loyalty Management giant, to launch a multi-party coalition loyalty program in India modeled on the lines of Nectar, which is Group Aeroplan’s highly acclaimed coalition loyalty program in the UK and Italy.
8. CONSOLIDATED FINANCIAL STATEMENTS Pursuant to the provisions of Section 129(3) of the Companies Act, 2013 (“Act”), the Consolidated
Financial Statements of the Company and a separate statement containing the salient features of the Financial Statements of its subsidiaries, associates and joint venture, in the prescribed Form No. AOC-1, is included in the Annual Report at Page No. 151. The Financial Statements of the subsidiary companies are kept for inspection by the Members at the Registered Office of the Company. The Company shall provide free of cost, a copy of the Financial Statements of the subsidiary companies to the Members upon their request. The said Financial Statements are also available on the website of the Company, www.tatacapital.com.
9. FINANCE During FY 2014-15, the Company met its funding requirements through borrowings and the issue
of CRPS. During the year, the Company allotted CRPS aggregating ` 210.1 crore with a tenure of 7 years and with Put and Call options at the end of four years. The Company also borrowed ` 1,604.5 crore, by way of short term instruments, such as Commercial Paper. The Company’s aggregate debt outstanding as at March 31, 2015 was ` 929.5 crore, all of which is payable within one year.
The Debt Equity ratio of the Company as at March 31, 2015 was 0.54 times.
The Company has been regular in repayment of its borrowings and payment of interest thereon.
10. CREDIT RATING During the year under review, the Company had its Short Term instruments rated and re-affirmed by
CRISIL Limited, as “CRISIL A1+”. Further, the CRPS issued by the Company were rated as “CRISIL AA+/Stable” by CRISIL Limited.
11. RISK MANAGEMENT A Risk Management Policy for the Company has been adopted by the Board. The Company
manages risk through a detailed Risk Management Policy framework which lays down guidelines in identifying, assessing and managing risks that the businesses are exposed to. Risk is managed by the Board/Risk Management Committee of the Board through appropriate structures that are in place at TCL, including suitable reporting mechanisms.
12. INTERNAL CONTROL SYSTEMS TCL’s internal control system is designed to ensure operational efficiency, protection and
conservation of resources, accuracy and promptness in financial reporting and compliance with laws and regulations. The internal control system is supported by an internal audit process for reviewing the adequacy and efficacy of the internal controls, including its systems and processes and compliance with regulations and procedures. Internal Audit Reports are discussed with the Management and are reviewed by the Audit Committee of the Board, which also reviews the adequacy and effectiveness of the internal controls. TCL’s internal control system is commensurate with its size, nature and operations.
13. INTERNAL FINANCIAL CONTROLS During the course of FY 2014-15, the Management appointed an external consultant and
formed a Cross Functional Team (“CFT”) comprising Operating Managers, Internal Audit, Risk and Statutory Auditors to document and evaluate the effectiveness of the internal financial controls of the Company, broadly in accordance with the criteria established under the Internal Control - Integrated Framework (2013) issued by the Committee of Sponsoring Organizations of the Treadway Commission. The documentation of process maps, key controls and risk registers has
32
Annual Report 2014-15
been completed for key businesses and functions under the supervision of the CFT. Management testing was conducted on a sample basis and remedial action has been taken or agreed upon where control weaknesses were identified. The Management will put in place a more detailedtesting plan for FY 2015-16. Based on the aforementioned, the Management believes adequate internalfinancialcontrolsexistinrelationtoitsFinancialStatements.
14. INFORMATION TECHNOLOGY SUPPORT Information Technology (“IT”) at Tata Capital is on the verge of moving to the next level with
a slew of key strategic projects that have been initiated and has achieved stability in its core systems, close to total automation of all its business processes. Tata Capital has entered into the digital space with several new products and its customer portal is being constantly enhanced and currently offers the customers, a view of their entire relationship with Tata Capital. Customers can also apply for loans and complete the end to end process online and also download statements. The emphasis is on continual improvement and upgradation of systems and the underlying processes. Tata Capital launched a mobile application viz. ‘Soham’ for its corporate customers offering multiple features as also several applications for its retail customers and a suite of features on its ever evolving customer portal, from a sourcing, servicing and an improved customer experience perspective.
The assessment of IT capability maturity of the Company has been completed with a high score. There is a constant endeavour to move up the IT maturity curve (including benchmarking against internationally accepted IT Capability Maturity Framework) and to deliver value to businesses and customers. Several IT projects for FY 2015-16 that would give Tata Capital a clear advantage and wouldbenefit thestakeholdershavebeen identified.TataCapital isalsoona ‘digitalisation’ journeywherein it will deploy latest technology, covering the internet and cloud, analytics, social media and mobility areas.
Tata Capital is also in the process of changing its IT outsourcing model to rationalize and optimize the overall IT costs and is now moving into the leadership stage in its technology journey. The projects on the IT road map and the digital strategy initiative will enable Tata Capital to take the leadership position with the support of its IT partners and the business units representing a collaborative framework.
15. DIGITAL PLATFORM In February 2014, Tata Capital launched its Digital Platform with an aim to build rich digital
interface(s) and superior datamining and analytical tools to efficiently and effectivelymanage theentire customer life cycle viz. customer acquisition, service and retention.
The year saw Tata Capital go more digital with dedicated efforts towards building a holistic digital roadmapandefficient implementationof thesame.TataCapitalaimstoenhancedigitalacquisition,servicing and engagement, by effectively using various web platforms, social media and mobility.
The focus is on four key digital properties viz. consumer durable loan e-card, online store for home searchandflexihomeloans,onlinecarstorefornewandusedcarsandcustomizedcar loansanda Tata Capital Mart which allows customers to rent and auction construction equipment. Mobility is another area of focus and Tata Capital has begun developmental work on key customer-relevant mobile applications. Tata Capital’s Facebook page crossed 1 million subscribers and Twitter channel saw greater engagement, clocking higher likes/followers and greater participation.
Looking ahead, Tata Capital will continue to embark on digital as a way of life and look for innovative and customer-centric digital solutions.
16. HUMAN RESOURCES The Company recognizes people as its most valuable asset and it has built an open, transparent
and meritocratic culture to nurture this asset.
Talent Management (Apex) is a key people planning tool that provides an integrated means of identifying, selecting, developing and retaining top talent within the organization. Focus on Behavioural and Leadership traits through Learning & Development interventions, job rotation is planned for the employees who constitute the Talent Pool.
33
Tata Capital has embarked on the journey of creating a High Performance Culture and has laid the foundation towards this. The exercise of building this culture began by the Senior Leadership Group (“SLG”) working together, in a structured exercise, to identify Tata Capital’s ten unique cultural attributes. Tata Capital’s first Cultural Survey, based on the ten identified attributes and conducted by the Gallup Organisation, has given it a very healthy and positive score of 4.15 on a scale of 5.
Tata Capital was again recognized, in October 2014, by the CII for its Human Resources practices, this time in the higher band of “Significant Achievement in HR Excellence”. The CII Human Resource Excellence awards were established to promote awareness of HR Excellence as an increasingly important element of organizational performance management. The model used for assessment is based on the European Foundation for Quality Management (EFQM) Model, similar to the Tata Business Excellence Model (“TBEM”).
The Company’s focus on Employee Engagement has resulted in its overall Employee Engagement Scores (Q12), climbing steadily from 3.52 in 2009 to 4.15 in 2014, in surveys conducted by the Gallup Organisation. Tata Capital won the Gallup Great Workplace Award for the year 2015, an award which recognizes exceptional performance in Employee Engagement at a global level.
As part of the journey to becoming a benchmark organization as far as HR practices are concerned, Tata Capital has also embarked on the journey of getting the People Capability Maturity Model (“P-CMM”) assessment and certification by the Carnegie Mellon University. Today, Tata Capital is the first and only NBFC in India to be P-CMM assessed at Level 3.
Tata Capital’s Learning & Development initiatives are focused on enhancing functional skills and competencies of its employees and its other Learning & Development interventions include Executive Development Programs, e-learning and various class room based training programmes.
Tata Capital is committed to strive towards full engagement of all its employees, partners, contractors, suppliers and clients to ensure safe working conditions and safe behavior as well as take care of their health. Tata Capital has an Occupational Health and Safety Policy in place and has adopted OHSAS 18001:2007 for its Head Office, Regional Offices and select branches. The basis for implementing the Occupational Health and Safety Management System at Tata Capital is to support and promote good health and safety practices for balancing with socio economic needs. The Occupational Health & Safety Management System at Tata Capital meets the requirements of the international standard OHSAS 18001:2007. BS OHSAS 18001:2007 demonstrates Tata Capital’s commitment in implementing a strong Occupational Health and Safety Management System and represents, for Tata Capital, both a successful achievement and a strong commitment for the future to ensure compliance to international best practices/standards and continuous improvement in the way Health Safety and Environment aspects are managed in every company’s activity.
17. TATA BUSINESS EXCELLENCE MODEL Tata Capital continues to enhance its capabilities and processes in keeping with market and
regulatory changes, using the framework of TBEM (based on Baldridge Criteria, USA), which covers aspects of Leadership and Governance, Strategic Planning, Customer Focus, Measurement, Analysis and Knowledge Management, Workforce Focus and Operations Focus. Tata Capital participated in its second TBEM external assessment conducted by Tata Quality Management Services (a division of Tata Sons Limited) in September 2014 and was placed in the 450-500 score band which indicates “good performance”. While the score band is the same as that in FY 2013-14, there is an improvement in the absolute score.
The assessment provided Tata Capital with important feedback in terms of its current strengths and opportunities for improvements to work towards in the coming year. Key Strengths indicated in this report were the organization’s alignment with its Vision and the building capability and structure for achieving the Vision, focus on building quality book, Internal Audit mechanism and Governance mechanisms.
Tata Capital also successfully underwent ISO 9001:2008 surveillance audit, without any major non conformity. Currently, only the operations of the assets business is under the scope of ISO

34
Annual Report 2014-15
9001:2008. It isplannedto increasethescope inaphasedmannerduringthecomingre-certificationaudits. Tata Capital is also beginning to implement Lean Six Sigma as a tool for improving its operationalfocusinordertoenhancecustomersatisfactionandimproveinternalefficiencies.
In July2014,anew initiativewasstartedby formingan `OfficeofStrategyManagement’ (“OSM”),with the intent to drive strategy execution within Tata Capital, in Businesses and Functions. This will ensure that Tata Capital’s objectives are well executed. Currently, there are twelve Strategic InitiativeswhicharebeingdriventhroughtheOSM.
18. THE TATA CAPITAL BRAND The Tata Capital Brand has grown consistently over the last few years and today holds a strong
position. The Total Awareness and Consideration scores enjoyed by the young Brand are higher thanthoseofmanynon-bankingfinancialservicesprovidersandbanks.
The year saw two key brand initiatives. The first was the launch of the next season of the ‘Do Right’ initiative – a branded initiative focused on living the promise of the Tata Capital brand and building a platform to ‘do right’. The second was the launch of Tata Capital Flexi EMI Loans–a trulycustomercentricofferingwhichprovidescustomers theflexibility tocustomize their EMI plans on the basis of their individual financial needs and circumstances. Offering of variousoptionssuchasStepUp,StepDown,BulletandBallooning,flexibleEMIsareapplicableacrossallTataCapital’s key loan products namelyHome Loans, Personal Loans, Business Loans andAutoLoans. Launched extensively across print, outdoors and radio, the campaign covers Tata Capital’s range of loan products and establishes it as a holistic loan provider.
In the years to come, Tata Capital will continue to invest in building the Tata Capital Brand with concertedeffortsacrossitsidentifiedpillarsof–expertise,empathyandethicalconduct.
19. BUSINESS DEVELOPMENT During the year, the Business Development Group (“BDG”) initiated opportunities and harnessed its
extensive relationship networkwithin and outside theTata group, to the benefit of somebusinessesof Tata Capital. The BDG connected the Investment Banking business with some Tata companies for potential transactions, initiated a relationship for the Corporate Finance Division of TCFSL with an overseas banking group, initiated and nurtured affluent-investor relationships for the WealthProducts Distribution team and organized and participated in meetings with various Tata companies in connection with a proposed Real Estate Fund. For the securities broking business, BDG was involved in the organization and execution of two Institutional Investor Conferences in Singapore and Mumbai.
Additionally, the BDG continued its regular interactions and deepened relationships with trade bodies of Canada, UK and Australia, amongst others, to further Tata Capital’s potential business interests in and from these geographies. The BDG also sustained its interactions with domestic industry and trade bodies and with other entities, with a view to promoting the Tata Capital Brand and laying the groundwork for future business.
20. CORPORATE SUSTAINABILITY AND CORPORATE SOCIAL RESPONSIBILITY The Tata group has always epitomized philanthropy, ethical practices and an untiring quest for
nationalbetterment.Throughitsinitiatives,TataCapitalhasmanylongtermassociationswithNGOsthat make a positive and measurable difference in each of the focus areas.
Tata Capital believes in social equity and the principle of equal opportunity, irrespective of gender, religion,casteorcreed.TheAffirmativeActionprogrammeatTataCapitalseekstopromoteaccessto quality education and technical skills and competencies for members of the Scheduled Caste and Scheduled Tribe communities, thus creating economic independence and sustainable livelihoods. The Vatsalya Ashramshala in Vikramgad, Maharashtra, is a residential school for tribal children, supported by Tata Capital. This initiative has seen very positive results.
In the annual assessment of Tata Capital’sAffirmativeAction Strategy andAgenda conducted byTata Quality Management Services, Tata Capital moved up a band and was placed in the score bandof426-450.

35
As per the provisions of Section 135 of the Act, the Company has constituted the Corporate Social Responsibility (“CSR”) Committee comprising Mr. F. N. Subedar (Chairman), Mr. Janki Ballabh, Dr. Ritu Anand and Mr. Praveen P. Kadle, as Members. The average net profit of the Company computed as per the Act and the applicable Rules, was negative and hence, the Company was not required to spend on CSR activities in FY 2014-15 and consequently has not spent any amount on the CSR activities. However, the subsidiaries of the Company viz. TCFSL and TCHFL have spent an aggregate amount of ` 8.96 crore on CSR activities, in projects and programs covered under Schedule VII of the Act. The CSR Policy outling four thrust areas of development viz. Livelihood & Employability, Health, Education and Environment was adopted by the Board and the same has been put up on the Company’s website. The Annual Report on CSR activities is annexed herewith as Annexure ‘A’.
21. COMPLIANCE The Company is registered with RBI as a CIC. The Company has complied with and continues to
comply with all applicable Laws, Rules, Circulars, Regulations, etc. including Directions of RBI for a CIC and it does not carry on any activities other than those specifically permitted by RBI for CICs.
The Company has deployed “ComplianceCheck” (“Application”), an online platform to report and monitor compliances. The Application has features such as generation of compliance task alerts to Performer, escalation mechanism to Reviewer and Business/Functional Heads and Compliance Officer, generation of compliance reports and updating the compliance tasks based on regulatory developments. The Compliance status reports are submitted, on a regular basis, to the Managing Director & CEO and are placed before the Board on a half yearly basis, by the Company Secretary.
22. REGULATORY ACTION There are no significant and material orders passed by the regulators or courts or tribunals
impacting the going concern status and operations of the Company in future.
23. DEPOSITS The Company did not hold any public deposits at the beginning of the year nor has it accepted any
public deposits during the year under review.
24. PARTICULARS OF LOANS, GUARANTEES OR INVESTMENTS The provisions of Section 186 of the Act pertaining to investment and lending activities is not
applicable to the Company since the Company is an NBFC whose principal business is acquisition of securities.
Details of guarantees and/or security in connection with loans to other bodies corporates or persons as covered under the provisions of Section 186 of the Act, are given in Note No. 26 to the Standalone Financial Statements.
25. DIRECTORS Mr. F. K. Kavarana stepped down as a Director from the Board of the Company, with effect from June
9, 2014, on his attaining the age of 70 years which was in accordance with the provisions of the Guidelines on Composition of the Board of Directors and Committees of the Board and Retirement Age of Directors (“Guidelines”), circulated by Tata Sons Limited and adopted by the Board.
Further, Mr. H. N. Sinor, who retired by rotation at the Annual General Meeting (“AGM”) of the Company held on June 30, 2014, did not seek re-appointment at the AGM, in order to meet with the requirements under the Act relating to the number of directorships that an individual can hold. Accordingly, he ceased to be a Director from the close of business hours on June 30, 2014.
The Directors place on record their appreciation for the valuable contribution made by Mr. Kavarana and Mr. Sinor during their tenure as Directors of the Company.
The appointment of Mr. Janki Ballabh, Independent Director, was formalized by the Board of Directors at its meeting held on May 8, 2014 and the Members appointed him as an Independent Director at the AGM, with effect from June 30, 2014. Mr. Ballabh’s term as Independent Director would be upto October 23, 2017 i.e. upon his attaining the age of 75 years, as per the Guidelines.

36
Annual Report 2014-15
The Board of Directors had appointed Mr. Nalin M. Shah and Dr. Nirmalya Kumar as Additional Directors of the Company, with effect from October 28, 2014 and Dr. Ritu Anand as Additional Director of the Company, with effect from March 30, 2015. Dr. Kumar and Dr. Anand holds office upto the date of the ensuing AGM and is eligible for re-appointment. Mr. Shah had submitted a declaration that he would meet the criteria for independence and could be treated as Independent Director, with effect from April 1, 2015. At the Extraordinary General Meeting of the Company held on March 30, 2015, the Members of the Company approved the appointment of Mr. Shah as an Independent Director of the Company under the provisions of the Act, with effect from April 1, 2015, for an initial period of three years, in line with the Governance Guidelines on Board Effectiveness circulated by Tata Sons Limited and adopted by the Board.
The Company has received declarations from the Independent Directors viz. Mr. Janki Ballabh and Mr. Nalin M. Shah, stating that they meet the criteria of independence as provided in Section 149(6) of the Act.
In accordance with the provisions of the Act and the Articles of Association of the Company, Mr. Ishaat Hussain, Director, is liable to retire by rotation at the ensuing AGM of the Company and is eligible for re-appointment.
The Company has received Notices as per the provisions of Section 160 of the Act, from a Member proposing the appointments of Dr. Kumar and Dr. Anand as Directors of the Company.
The Members of the Company may wish to refer to the accompanying Notice of the AGM of the Company, for brief Resumes of Mr. Hussain, Dr. Kumar and Dr. Anand.
26. EVALUATION OF THE BOARD, ITS COMMITTEES AND INDIVIDUAL DIRECTORS Pursuant to the provisions of the Act, the Board has carried out an annual evaluation of its own
performance, the individual Directors (including the Chairman) as well as an evaluation of the working of all Board Committees. The Board of Directors was assisted by the Nomination and Remuneration Committee (“NRC”). The performance evaluation was carried out by seeking inputs from all the Directors / Members of the Committees, as the case may be and discussions with the Directors by the Chairman of the NRC and the Chairman of the Board. The criteria for evaluating the performance of the Board as a whole covered various aspects of the Board’s functioning such as fulfillment of key responsibilities, structure of the Board and its composition, establishment and delineation of responsibilities of the Board Committees, effectiveness of Board processes, information and functioning, Board culture and dynamics, etc. The criteria for evaluation of individual Directors covered parameters such as attendance and contribution at meetings, guidance to Management, etc. The criteria for evaluation of the Board Committees covered areas related to degree of fulfillment of key responsibilities, adequacy of Board Committee composition, effectiveness of meetings, Committee dynamics, quality of relationship of the Committee with the Board and the Management, etc.
The feedback of the Independent Directors on their review of the performance of Non-Independent Directors and the Board as a whole, the performance of the Chairman of the Company and assessment of the quality, quantity and timeliness of flow of information between the Company Management and the Board, was taken into consideration by the Board in carrying out the performance evaluation.
27. POLICY ON APPOINTMENT OF DIRECTORS AND REMUNERATION POLICY OF THE COMPANY
The Nomination and Remuneration Committee of the Company comprises Mr. Janki Ballabh (Chairman), Mr. Ishaat Hussain, Mr. Nalin M. Shah and Dr. Ritu Anand. The NRC develops the competency requirements of the Board based on the industry and strategy of the Company, conducts a gap analysis and recommends the reconstitution of the Board, as and when required. It also recommends to the Board, the appointment of Directors having good personal and professional reputation and conducts reference checks and due diligence of all Directors before recommending them to the Board. Besides the above, the NRC ensures that the new Directors are familiarized with the operations of the Company and endeavours to provide relevant training to the Directors.
37
Inaccordancewith theprovisionsofSection178of theAct, theBoardofDirectorshaveadoptedaPolicy on Board Diversity and Director Attributes and the Remuneration Policy. The Policy on Board Diversity and Director Attributes has been framed to encourage diversity of thought, experience, knowledge, perspective, age and gender in the Board. The Remuneration Policy for Directors, Key Managerial Personnel and all other employees is aligned to the philosophy on the commitment of fostering a culture of leadership with trust. The Remuneration Policy aims to ensure that the level and composition of the remuneration of the Directors, Key Managerial Personnel and all other employees is reasonableandsufficient toattract, retainandmotivate them to successfully run theCompany. The Policy on Board Diversity and Director Attributes as also the Remuneration Policy of the Company are attached as Annexure ‘B’ and Annexure ‘C’, respectively.
28. KEY MANAGERIAL PERSONNEL The appointments of Mr. Praveen P Kadle, Managing Director & CEO and Ms. Sarita Kamath,
Company Secretary, were formalized as the Key Managerial Personnel (“KMP”) of the Company, witheffectfromMay8,2014.
Mr. Puneet Sharma was appointed as the Chief Financial Officer of the Company and a KMP, witheffectfromMay9,2014.
Ms. Kamath stepped down as the Company Secretary, with effect from the end of day on January 1, 2015 and Ms. Avan Doomasia was appointed as the Company Secretary and a KMP, with effect from January 2, 2015.
At present, the KMPs of TCL are also the KMPs of TCFSL.
29. DIRECTORS’ RESPONSIBILITY STATEMENT Pursuant to Section 134(5) of theAct, the Board of Directors, to the best of their knowledge and
ability,confirmthat:
a) in the preparation of the annual accounts, the applicable accounting standards had been followedandthattherearenomaterialdeparturesthereof;
b) they had selected such accounting policies and applied them consistently and made judgments and estimates that are reasonable and prudent so as to give a true and fair view of thestateofaffairsof theCompanyat theendof thefinancialyearandof theprofitandcashflowsoftheCompanyfortheyear;
c) theyhadtakenproperandsufficientcareforthemaintenanceofadequateaccountingrecordsin accordance with the provisions of this Act for safeguarding the assets of the Company and forpreventinganddetectingfraudandotherirregularities;
d) theyhadpreparedtheannualaccountsonagoingconcernbasis;and
e) they had devised proper systems to ensure compliance with the provisions of all applicable laws and that such systems were adequate and operating effectively.
30. CORPORATE GOVERNANCE A summary of the corporate governance measures adopted by the Company is, given below:
i) The Company recognizes its role as a corporate citizen and endeavours to adopt the best practices and the highest standards of corporate governance through transparency in business ethics, accountability to its customers, Government and others. The Company’s activities are carried out in accordance with good corporate practices and the Company is constantly striving to better them by adopting the best practices.
The Company believes that good Corporate Governance practices enable the Management to direct and control the affairs of the Company in an efficient manner and to achieve theCompany’s goal of maximizing value for all its stakeholders. The Company will continue to focus its resources, strengths and strategies to achieve its vision of becoming a leading financialservicescompany in India,withaglobal footprint,whileupholding thecorevaluesof
38
Annual Report 2014-15
transparency, integrity, honesty and accountability, which are fundamental to Tata companies. As a part of the Tata group, Tata Capital has a strong legacy of fair, transparent and ethical
governance practices. The Corporate Governance philosophy has been further strengthened with the adherence to the TBEM as a means to drive excellence, the Balanced Scorecard methodology for tracking progress on long term strategic objectives and the Tata Code of Conduct (“TCOC”) which articulates the values, ethics and business principles and servesas a guide to the Company, its directors and employees, supplemented with an appropriate mechanism to reportanyconcernpertaining tonon-adherence to thesaidTCOC. Inaddition,the Company has adopted Governance Guidelines on Board Effectiveness, a Code of Conduct for Prevention of Insider Trading, a Code of Corporate Disclosure Practices, Vigil Mechanism, a Fair Practices Code, an Affirmative Action Policy, a Policy against Sexual Harassment inthe Workplace, a Policy on Board Diversity and Director Attributes, a Code of Conduct for Non-Executive Directors, Internal Guidelines on Corporate Governance and an OccupationalHealth&SafetyManagementSystem.
ii) The Board of Directors along with its Committees provides leadership and guidance to the Company’s Management and directs, supervises and controls the activities of the Company.
iii) The size of the Board is commensurate with the size and business of the Company. At present, the Board comprises seven Directors viz. Mr. Ishaat Hussain, Mr. Janki Ballabh, Mr. Nalin M. Shah, Mr. F. N. Subedar, Dr. Nirmalya Kumar, Dr. Ritu Anand andMr. PraveenP. Kadle.Mr. Kadle is theManagingDirector &CEO (“MD&CEO”) of theCompany. Mr. Janki Ballabh and Mr. Nalin M. Shah are the Independent Directors (“ID”) of the Company and the other four Directors are Non-Executive Directors (“NED”). Board Meetings of theCompanyheldduringtheFY2014-15weregenerallychairedbyMr.IshaatHussain,NED.
iv) Mr. Kadle was re-appointed as the MD & CEO of the Company as also of TCFSL, for afurther period of 5 years commencing September 18, 2012. As at March 31, 2015, Mr. Kadle held14,58,580EquitySharesof`10each,10,000 -8.33%CRPSand7,000 -12.5%CRPSof ` 1,000 each. At the NRC Meeting held on May 5, 2015 and at the Board Meeting held on May 8, 2015, an Incentive Remuneration of ` 2.20 crore was approved as payable to Mr. Kadle for FY 2014-15.With this, the total remuneration of Mr. Kadle for FY 2014-15, is `4.15crore.
v) The Board has constituted Committees with specific terms of reference to focus on specificissues and ensure expedient resolution of diverse matters. These include the Audit Committee, NRC (with the ESOPCommittee being combined into theNRC), Finance andAsset LiabilitySupervisory Committee, Risk Management Committee, Stakeholders Relationship Committee (“SRC”) and CSR Committee. During the year, the Investment Credit Committee, the Committee for Review of Policies and the Executive Committee of the Board were dissolved, as they were not functional. Several meetings of the Committees were held during the year.
Currently, the Audit Committee of TCL comprises two Independent Directors viz. Mr. Nalin M. Shah (Chairman) and Mr. Janki Ballabh and one Non-Executive Director, Mr. F. N. Subedar. The Board has adopted an Audit Committee Charter which lays down the role, responsibilities and powers of the Audit Committee.
The scope of the Audit Committee, inter alia, includes the following: – Recommend the appointment and removal of the Auditors and their remuneration, nature
and scope of audit
– Ensure adequacy of internal controls and compliances and recommend remedial measures
– Review adequacy of the Internal Audit function– Review and monitor the auditors’ independence and performance and effectiveness of
the audit process– Overseefinancialreportingprocessanddisclosureoffinancialinformation– Examinethefinancialstatementsandtheauditors’reportthereon

39
– Evaluateinternalfinancialcontrolsandtheriskmanagementsystems– Act as a link between the Statutory Auditors, the Internal Auditors and the Board of
Directors– Review accounting policies– MonitorcompliancewithTCOC– Approve any transactions of the Company with related parties or any subsequent
modificationsthereof– Scrutinise inter-corporate loans and investments– Evaluate the valuation of undertakings or assets of the Company, if necessary– Monitor the end use of funds raised through public offers and related matters– Reviewfindingsofinternalinvestigations/frauds/irregularities,etc.– Carry out additional functions as per the regulatory requirements applicable to the
Company or in the terms of reference of the Audit Committee– Carry out the responsibilities under the Code of Conduct for Prevention of Insider Trading
and Code of Corporate Disclosure Practices. The Board has accepted all the recommendations made by the Audit Committee during the year. Besides the Members of the Committee, meetings of the Audit Committee are attended by
the Managing Director & CEO, Chief Financial Officer, Company Secretary, StatutoryAuditorsand Internal Auditor. The Internal Audit function is headed by the Chief Internal Auditor of the Company who reports to the Chairman of the Audit Committee to ensure independence of operations.
vi) During FY 2014-15, seven meetings of the Board of Directors and seven meetings of theAuditCommittee were held. The details of attendance at Board Meetings, Audit Committee Meetings and the previous Annual General Meeting of the Company are, given below:
Name of DirectorBoard Meetings Audit Committee
MeetingsWhether present
at previous AGM held on June 30, 2014Held Attended Held Attended
Mr. F. K. Kavarana* 7 1 7 Not a Member No
Mr.H.N.Sinor* 7 1 7 1 No
Mr.IshaatHussain 7 6 7 Not a Member Yes
Mr. Janki Ballabh 7 7 7 7 Yes
Mr. Nalin M. Shah* 7 4 7 3 No
Mr. F. N. Subedar 7 7 7 7 Yes
Dr. Nirmalya Kumar* 7 5 7 Not a Member No
Dr. Ritu Anand* 7 1 7 Not a Member No
Mr. Praveen P. Kadle* 7 7 7 2 Yes
*Notes:(a) Mr. F. K. Kavarana stepped down as Director w.e.f. June 9, 2014.(b) Mr. H. N. Sinor stepped down as Director w.e.f. June 30, 2014.(c) Mr. Nalin M. Shah and Dr. Nirmalya Kumar were appointed as Additional Directors w.e.f. October 28, 2014.(d) Dr. Ritu Anand was appointed as Additional Director w.e.f. March 30, 2015.(e) Mr. Praveen P. Kadle was a Member of the Audit Committee between July 17, 2014 and October 28, 2014.
The Chairman of the Audit Committee and the NRC had attended the last AGM of the Company. The Chairman of the SRC had authorized Mr. Janki Ballabh, a Member of the SRC, to attend the last AGM on his behalf.

40
Annual Report 2014-15
vii) The Company paid Sitting Fees for attending meetings of the Board and the Committees of the Board within the maximum prescribed limits, to the Non-Executive Directors and Independent Directors, as per details given below:
(` in lakh)
Name of DirectorSitting Fees paid for attending
Board and Committee Meetings during FY 2014-15
Mr. F. K. Kavarana* 0.70Mr.H.N.Sinor* 0.90Mr.IshaatHussain 3.40Mr. Janki Ballabh 6.45Mr. Nalin M. Shah* 1.80Mr. F. N. Subedar 4.25Dr. Nirmalya Kumar* 1.50Dr. Ritu Anand* 0.60
* Please refer to the Notes in (vi) above
viii) None of the NEDs and IDs had any pecuniary relationships or transactions with the Company during the year under review.
ix) NoCommissionisproposedtobepaidtotheNEDsoftheCompanyforFY2014-15.x) Minutes of meetings of all Committees of the Board are placed before the Board for
discussion/noting. A summary of the minutes of the meetings of the Boards of the Company’s subsidiaries is also placed before the Board for noting, on a quarterly basis.
xi) The Company Secretary is the Secretary of all the aforementioned Committees.xii) The Company has signed the Tata Brand Equity and Business Promotion (“BEBP”) Agreement
with Tata Sons Limited for subscribing to the TATA BEBP Scheme. The Company abides by TCOCandthenormsforusingtheTataBrandidentity.
xiii) Ms.SaritaKamathistheComplianceOfficeroftheCompany.
31. VIGIL MECHANISM The Company has established a Vigil Mechanism for its Directors and employees to report their
genuine concerns or grievances. The said mechanism encompasses the Whistle Blower Policy, the Fraud RiskManagement Process, the Ethicsmechanism under TCOC, etc., and provides foradequate safeguards against victimization of persons who use such mechanism. It also provides direct access to the Chairman of the Audit Committee and the Chief Ethics Counsellor. The Vigil Mechanism,WhistleBlowerPolicyandTCOChavebeenputupontheCompany’swebsite.
32. DISCLOSURE AS PER THE SEXUAL HARASSMENT OF WOMEN AT WORKPLACE (PREVENTION, PROHIBITION AND REDRESSAL) ACT, 2013
The Company is committed to providing and promoting a safe and healthy work environment for all its employees.
The Company has zero tolerance towards sexual harassment at the workplace and has adopted a ‘Prevention of Sexual Harassment’ (“POSH”) policy that is in line with the provisions of theSexual Harassment of Women at Workplace (Prevention, Prohibition and Redressal) Act, 2013and the Rules framed thereunder for prevention and redressal of complaints of sexual harassment at workplace, along with a structured reporting and redressal mechanism. The Company has also constituted an Internal Complaints Committee, known as the POSH Committee, to inquireinto complaints of sexual harassment and recommend appropriate action. The POSH Policy isdisplayed on the Company’s Intranet and is also communicated to employees through e-mails and

41
communicationcampaigns.PostersonthePOSHPolicy,givingcontactdetailsofPOSHCommitteeMembersaredisplayedinofficesoftheCompany.
TheCompanyhasnotreceivedanycomplaintonsexualharassmentduringFY2014-15.
33. STATUTORY AUDITORS Deloitte Haskins & Sells LLP (formerly known asM/s Deloitte Haskins & Sells) (“DHS”), who are
theStatutoryAuditorsof theCompany,holdofficeuntil theconclusionof theensuingAGMandareeligible for re-appointment.
DHSwere appointed as theStatutoryAuditors of theCompany at theAGMof theCompany heldon July 17, 2007 for FY 2007-08 and have been re-appointed thereafter, at every AGM of theCompany. DHS have furnished a certificate, confirming that if re-appointed, their re-appointmentwouldbeinaccordancewithSection139readwithSection141oftheAct.Attheconclusionof theensuingAGMof theCompany,DHSwillcompleteaperiodofeightyearsas theStatutoryAuditorsof the Company. As per the provisions of the Act read with the Companies (Audit and Auditors) Rules, 2014, it is proposed to re-appointDHSas theAuditors of theCompany to hold office fromthe conclusion of this Meeting until the conclusion of the next AGM of the Company.
34. ACCOUNTING STANDARDS FOLLOWED BY THE COMPANY The Financial Statements of the Company have been prepared in accordance with the Generally
Accepted Accounting Principles in India (Indian GAAP) to comply with the Accounting Standards specifiedunderSection133of theActreadwithRule7of theCompanies(Accounts)Rules,2014and the relevant provisions of the Act and the Guidelines prescribed by RBI, as applicable.
35. EXPLANATION ON STATUTORY AUDITORS’ REPORT There are no qualifications, reservations or adverse remarks or disclaimersmade byDHS in their
ReportdatedMay8,2015ontheFinancialStatementsoftheCompanyforFY2014-15.
36. SECRETARIAL AUDITOR AND SECRETARIAL AUDIT REPORT Pursuant to the provisions of Section 204 of the Act and the Companies (Appointment and
Remuneration of Managerial Personnel) Rules, 2014, the Board of Directors had appointed M/s. Parikh&Associates, a firm ofCompanySecretaries in Practice, to undertake theSecretarialAudit of the Company for the Financial Year ended March 31, 2015. The Secretarial Audit Report, in the prescribed Form No. MR-3, is annexed as Annexure ‘D’.
M/s.Parikh&Associates in theirAuditReportdatedMay8,2015 forFY2014-15havestated thatthe Company was not in compliance with the requirement of Section 149 of the Act, in respectof Independent Directors and related compliances. The Directors are of the view that whilst Mr. Janki Ballabh’s appointment as an Independent Director was formalised at the last AGM held onJune30,2014,Mr.NalinM.Shah,whowasappointedasaNEDonOctober28,2014,couldbeconsideredasan IndependentDirectorwitheffect fromApril1,2015,onhis fulfilling thecriteriaofindependence as prescribed under the Act.
Apart from the above, there are no qualifications, reservations or adverse remarks or disclaimersmade by M/s. Parikh & Associates in their Audit Report.
37. INFORMATION ON MATERIAL CHANGES AND COMMITMENTS There are no material changes or commitments affecting the financial position of the Company
which have occurred between March 31, 2015 and May 8, 2015, being the date of this Report.
38. RELATED PARTY TRANSACTIONS The Company has adopted a Framework on Related Party Transactions for the purpose of
identificationandmonitoringofsuchtransactions.
Details of material contracts or arrangements or transactions with Related Parties on an arm’s length basis with respect to transactions covered under Section 188 (1) of the Act in the prescribed

42
Annual Report 2014-15
Form No. AOC-2, is attached as Annexure ‘E’. Further, details of Related Party Transactions asrequired to be disclosed by Accounting Standard – 18 on “Related Party Disclosures” specifiedunderSection133oftheAct,readwithRule7oftheCompanies(Accounts)Rules,2014,aregivenin the Notes to the Financial Statements.
During the year, the Company has not entered into any transactions with Related Parties which are not in its ordinary course of business or not on an arm’s length basis and which require disclosure in this Report in terms of the provisions of Section 188(1) of the Act.
39. ENERGY CONSERVATION, TECHNOLOGY ABSORPTION AND FOREIGN EXCHANGE EARNINGS & OUTGO(A) Conservation of energy:
i. Steps taken / impact on conservation of energy: The operations of the Company, being financial services related, require normal
consumption of electricity. The Company is taking every necessary step to reduce the consumption of energy.
ii. Steps taken by the Company for utilising alternate sources of energy: Tata Capital has installed a solar panel at its Thane office which self illuminates and
provides power to the garden and security lights on the campus from dusk to dawn producingcloseto750wattsofenergy.Thegardenlightsat theThaneofficehavebeenretrofitted with LED bulbs that consume less electricity as compared to conventionalincandescent or CFL bulbs.
iii. Capital investment on energy conservation equipments: In view of the nature of activities carried on by the Company, there is no capital
investment on energy conservation equipments.
(B) Technology absorption:i. Theeffortsmadetowardstechnologyabsorption;ii. The benefits derived like product improvement, cost reduction, product development or
importsubstitution;iii. In case of imported technology (imported during the last 3 years reckoned from the
beginningofthefinancialyear):(a) Thedetailsoftechnologyimported;(b) Theyearofimport;(c) Whetherthetechnologybeenfullyabsorbed;(d) If not fully absorbed, areas where absorption has not taken place, and the reasons
thereof;andiv. The expenditure incurred on Research and Development.
Given the nature of the activities of the Company, the above would not be applicable to the Company.
(C) Foreign Exchange Earnings and Outgo: The Foreign Exchange earned in terms of actual inflows during the year under review was
` 28.57 crore and the Foreign Exchange Outgo during the year under review in terms ofactualoutflowswas`0.64crore.
40. EXTRACT OF ANNUAL RETURN An extract of the Annual Return as prescribed under Section 92 (3) of the Act and the Companies
(ManagementandAdministration)Rules,2014, in theprescribedFormNo.MGT.9, isattachedasAnnexure ‘F’.

43
41. TATA CAPITAL LIMITED EMPLOYEE STOCK PURCHASE / OPTION SCHEME In order to develop and implement a long term incentive program to effectively attract, motivate and
retain the best talent from the industry in a competitive environment, the Company has implemented theTataCapitalLimitedEmployeeStockPurchase /OptionScheme(“Scheme”).TheSchemehasalsobeenadoptedbythesubsidiariesof theCompanyviz.TCFSL,TCHFL,TCCL,TataSecurities,TCTSL and TCFL.
For implementation of the Scheme, TCL Employee Welfare Trust (“Trust”) was set up and 7,02,34,526 Equity Shares of the Company aggregating 2.49% of its total paid up Equity ShareCapitalhavebeenallottedtotheTrust.TheTrusthadentrustedtheESOPCommitteeof theBoard(which has now been combined with the NRC of the Board), with powers to effectively administer the Scheme. The NRC, inter alia, determines the employees to whom an offer is to be made, based on certain performance criteria, the price at which the options can be exercised, the quantum of offer to be made and the terms and conditions for vesting and exercise of offer. For the purpose of the Scheme, a valuation of the Equity Shares of the Company is conducted by an independent Chartered Accountant or a Category-I Merchant Banker, on a half-yearly basis.
As on March 31, 2015, out of 7,02,34,526 Equity Shares of the Company allotted to the Trust,1,44,54,295 Equity Shares of the Company aggregating 0.51% of its total paid up Equity ShareCapital were transferred to the Employees under the Schemes.
The following disclosures are being made as required under Rule 12 of the Companies (Share CapitalandDebentures)Rules,2014:
Sr. No.
Particulars (upto March 31, 2015) ESOP 2011 ESOP 2013
1 OptionsGranted 34,73,331 29,75,414
2 OptionsVested 34,73,331 9,91,847
3 OptionsExercised 8,54,222 42,737
4 Total number of shares arising out of exercise of Options 8,54,222 42,737
5 OptionsLapsed NIL NIL
6 Exercise Price 17.77 25
7 Money realized by exercise of Options `1,51,79,525 ` 10,68,425
8 Variation of terms of Options N.A. N.A.
9 Total number of Options in force 26,19,109 29,32,677
Employee wise details of options granted to:
(i) Key Managerial Personnel:
Sr. No.
Name of Key Managerial Personnel
ESOP 2011 ESOP 2013
Offered Exercised Offered Exercised
1 Mr. Praveen P. Kadle 2,40,000 2,40,000 Nil Nil
2 Mr. Puneet Sharma 80,000 Nil Nil Nil
3 Ms. Avan Doomasia 60,000 Nil Nil Nil
4 Ms. Sarita Kamath Nil Nil 30,000 Nil

44
Annual Report 2014-15
(ii) Any other employee who receives a grant of Options in any one year of Option amounting to fivepercentormoreofOptions granted during that year: None.
(iii) Identified employees who were granted Option, during any one year, equal to or exceeding one percent of the issued capital (excluding outstanding warrants and Conversions) of the Company at the time of grant: None.
42. GREEN INITIATIVE Section 136 of the Act and the Rules framed there under allows the Company to send its Financial
Statements by electronic mode to such Members whose shareholding is in dematerialized format and whose email addresses are registered with the Depositories for communication purposes. As a responsible corporate citizen, the Company proposes to effect electronic delivery of the Annual Report of the Company in lieu of the paper form to the Members who have registered their email IDs with the Depositories. A physical copy of the Annual Report will be sent to those Members who have not registered their email addresses with the Depositories for receiving electronic communication. A physical copy of this Annual Report can also be obtained free of cost by any MemberfromtheRegisteredOfficeoftheCompanyonanyworkingdayduringbusinesshours.
A copy of this Annual Report along with the Annual Report of each of the Company’s subsidiaries forFY2014-15isalsoavailableonthewebsiteoftheCompany,www.tatacapital.com.
43. ACKNOWLEDGEMENTS The Directors would like to place on record their gratitude for the valuable guidance and support
received from the Reserve Bank of India, the Securities and Exchange Board of India, the National Housing Bank, Monetary Authority of Singapore, Financial Conduct Authority, UK and othergovernment and regulatory agencies and to convey their appreciation to Tata Sons Limited (the holding company), the Members, customers, bankers, lenders, vendors and all other business associates for the continuous support given by them to Tata Capital. The Directors also place on record their appreciation of all the employees of Tata Capital for their commitment, commendable efforts, team work and professionalism.
For and on behalf of the Board of Directors
Mumbai, Ishaat Hussain Praveen P Kadle May8,2015 Director ManagingDirector&CEO

45
Annexure AANNUAL REPORT ON CORPORATE SOCIAL RESPONSIBILITY
(“CSR”) ACTIVITIES
1. Brief outline of the Company’s CSR policy, including overview of projects or programs proposed to be undertaken and reference to the web-link to the CSR policy and projects or programs:
Vision: To ensure sustainability by doing what is right, through the adoption of sustainable business practices, employee policies and technologies.
Purpose: To protect the interests of all the stakeholders of the Company and contribute to society at large, by making a measurable and positive difference through the four causes the Company supports viz. Livelihood & Employability, Health, Education and Environment.
Sectors and Issues: In sectors and issues pertaining to the purpose mentioned above.
For details of the CSR Policy along with projects and programs, kindly refer to http://tatacapital.com/Financialresult.htm
2. The composition of the CSR Committee: The Board of Directors have constituted a CSR Committee in accordance with the requirements of
Section 135(1) of the Companies Act, 2013 (“Act”), which currently comprises:a) Mr. F.N. Subedar, Non-Executive Director (Chairman)b) Mr. Janki Ballabh, Independent Directorc) Dr. Ritu Anand, Non-Executive Directord) Mr.PraveenP.Kadle,ManagingDirector&CEO
3. Average Net Profit of the Company as per Section 198 of the Act for last three Financial Years:
(` in crore)
Financial Year Net Profit (net of dividend)
FY 2011-12 (33.47)
FY 2012-13 (22.44)
FY2013-14 10.05
AverageNetProfit (15.29)
Note: The above net profit (net of dividend) has been calculated in accordance with the provisions of Section 198 of the Act read with the Companies (Corporate Social Responsibility Policy) Rules, 2014.
4. CSR expenditure (2% of Average Net Profit as indicated in Point No. 3): Since theaveragenetprofitsof theCompany for thepast threefinancial yearswerenegative, the
CompanywasnotrequiredtospendanyamountonCSRactivitiesinFY2014-15.
5. Details of CSR spend during FY 2014-15: a. Total amount to be spent : Not Applicableb. Amount unspent, if any : Not Applicable

46
Annual Report 2014-15
c. MannerinwhichtheamountwasspentduringFY2014-15isdetailedbelow:
Sr. No.
CSR Projects
or Activity Identified
Sector in which the project is covered
Projects or Programs1) Local area or other,
2) Specify the state and District where the projects or programs
was undertaken
Amount outlay
(Budget) project or Program
wise
Amount spent on the projects or Programs Sub heads: Cumulative
expenditure upto the reporting
period
Amount spent Direct or through
implementing agency
Direct Expenditure
on projects or Programs
Overheads
Not Applicable
6. IncasetheCompanyhasfailedtospendthe2%oftheAverageNetProfitofthelastthreefinancialyears or any part thereof, reasons for not spending the amount:
Not Applicable
Weherebyconfirmthattheimplementation,whereapplicable,andthemonitoringoftheCSRPolicy,hasbeen in compliance with the CSR objectives and CSR Policy adopted by the Company.
Sd/-
F.N. SubedarChairman, CSR Committee
(Non-Executive Director)
Sd/-
Janki BallabhMember, CSR Committee
(Independent Director)
Sd/-
Ritu AnandMember, CSR Committee(Non-Executive Director)
Sd/-
Praveen P KadleMember, CSR Committee(ManagingDirector&CEO)
47
Annexure BBOARD DIVERSITY POLICY AND DIRECTOR ATTRIBUTES
1. PURPOSE In terms of Section 178 of the Companies Act, 2013 (“Act”) and the Governance Guidelines on
Board Effectiveness issued by Tata Sons Limited and adopted by the Board of Directors, the Nomination and Remuneration Committee (“NRC”) of the Board is, inter alia, required to formulate a PolicyonBoardDiversityand laydown thecriteria fordeterminingqualifications,positiveattributesand independence of a director.
Diversity in the composition of the Board of Directors has become essential in view of the expansion of business, greater social responsibility, increasing emphasis on Corporate Governance, need for addressing concerns of diverse stakeholders and the necessity for managing risks in the business effectively.ABoard composed of appropriately qualified and skilled people,with a broadrange of experience relevant to the business, is important for effective corporate governance and sustained commercial success of a company.
In view of the above, Tata Capital Limited (“TCL” or “Company”) has framed this Policy on Board Diversity and Director Attributes (“Policy”) that encourages diversity of thought, experience, knowledge, perspective, age and gender in the Board. The Policy sets out the approach to diversity in the Board of Directors of the Company so as to ensure that the Board has an appropriate blend of functional and industry expertise.
This Policy has been adopted by the Board of Directors of the Company, based on the recommendations of the NRC.
2. OBJECTIVES OF THE POLICY TheObjectivesofthePolicyinclude:
i. Boardtodrivediversityandhaveanappropriateblendoffunctionalandindustryexpertise;
ii. While recommending the appointment of a director to, inter alia, consider the manner in which the function and domain expertise of the individual contributes to the overall skill domain mix oftheBoard;
iii. To help the Company build a better Board that can draw upon a wide range of perspectives, expertise,knowledgeandexperience;
iv. ToachieveanoptimumandbalancedBoard,withawiderangeofattributes;
v. To encourage healthy and open discussion and promote independence of judgement in Board andCommitteedeliberations;and
vi. To have an optimum mix of Executive, Non-Executive and Independent Directors, including Women Directors.
3. POLICY STATEMENT
TomeettheaboveObjectives:
i. The Board of TCL will ensure that a transparent Board nomination process is in place that encourages diversity of thought, experience, skills, knowledge, perspective, age, nationality, gender,culturalandeducationalbackground;
ii. It will be ensured that the Board has an appropriate blend of functional and industry expertise andskills;
iii. The consideration and selection of candidates for appointment to the Board will be based on merit which shall include a review of any candidate’s integrity, experience, educational background,industryorrelatedexperienceandmoregeneralexperience;

48
Annual Report 2014-15
iv. Candidates that bring a diversity of background and opinion from amongst those candidates with the appropriate background and industry or related expertise and experience and having the ability to devote sufficient time to the affairs of the Company, should be considered forappointmenttotheBoard;and
v. While recommending the appointment of a Director, the NRC will consider the criteria as laid down under the Act and applicable Regulations/Guidelines issued by Statutory and Regulatory authorities, as also those issued by Tata Sons Limited, from time to time, and the manner in which the function and domain expertise of the individual will contribute to the overall skill-domain mix of the Board.
4. MEASURABLE OBJECTIVES The NRC will largely rely on the regulatory provisions of the Act, the Regulations/Guidelines issued
by the RBI (as applicable to a Core Investment Company) as also the Guidelines circulated by Tata Sons Limited and review the measurable objectives for achieving diversity against these provisions and recommend the same to the Board for adoption. At any given point of time, the Board may seek to improve one or more aspects of its diversity and measure progress accordingly.
5. MONITORING AND REPORTING The NRC will review the Policy periodically, which will include an assessment of the effectiveness of
the Policy. The NRC will discuss any revision that may be required and recommend the same to the Board for approval.
49
Annexure CREMUNERATION POLICY
1. COMPENSATION PHILOSOPHY Tata Capital Limited (“Company”) has a defined formal compensation philosophy for itself and its
subsidiary companies. In order to build a high performance culture, aligned to the Company’s Vision and Goals, the Compensation Philosophy aims at providing a significant differential to superiorperformers and also segregating increments and performance payouts, based on the actual performance of various business verticals.
TheaforementionedCompensationphilosophyhelpstheCompanytomanage longtermfixedcost,keep up with market compensation and attract the right talent to help drive its growth plans.
The performance of the Company and its Business Units / Functions is measured against annual budgets / targets, set as per the Balanced Score Card (BSC). Performance of individuals is measured against Key Result Areas (KRAs) set at the beginning of year and after considering any revision of target during the year. The Annual Performance Rating would be considered for calculating the Performance Pay. Rating would be on a 5 point scale.
Consistent with the principle of differential influence that an employee may have on the overallperformance of the Company, different weights are assigned for the Company’s performance, the performance of Business Units/Functions and the performance of individuals. Thus, employees in entry level / junior management have greater weightage for individual performance while employees in senior leadership roles have maximum weightage for Company and Business Unit Performance.
2. REMUNERATION POLICY FOR DIRECTORS, KEY MANAGERIAL PERSONNEL AND OTHER EMPLOYEES
The philosophy for remuneration of Directors, Senior Leadership Team, Key Managerial Personnel (“KMP”) and all other employees of the Company is based on the commitment to fostering a culture of leadership with trust. The Remuneration Policy is aligned to this philosophy.
This Remuneration Policy has been prepared pursuant to the provisions of Section 178(3) ofthe Companies Act, 2013 (“Act”). In case of any inconsistency between the provisions of law and this Remuneration Policy, the provisions of law shall prevail and the Company shall abide by the applicable law. In case there are any changes in the law, the Company shall comply with the applicable amended provisions. While formulating this Remuneration Policy, the Nomination and Remuneration Committee (“NRC”) has considered the factors laid downunderSection178(4)ofthe Act which are, as under:
“(a) the level and composition of remuneration is reasonable and sufficient to attract, retain and motivate directors of the quality required to run the company successfully;
(b) relationship of remuneration to performance is clear and meets appropriate performance benchmarks; and
(c) remuneration to directors, key managerial personnel and senior management involves a balance between fixed and incentive pay reflecting short and long-term performance objectives appropriate to the working of the company and its goals.”
The key principles governing this Remuneration Policy are, as follows:
2.1 Remuneration for Independent Directors and Non-Independent Non- Executive Directors(i) Independent Directors (“ID”) and Non-Independent Non-Executive Directors (“NED”)
may be paid Sitting Fees (for attending the meetings of the Board and of Committees of the Board of which they may be Members) and Commission within regulatory limits.

50
Annual Report 2014-15
(ii) Within the parameters prescribed by law, the payment of Sitting Fees and Commission will be recommended by the NRC for approval of the Board.
(iii) Overall remuneration (Sitting Fees and Commission) should be reasonable and sufficient to attract, retain and motivate directors aligned to the requirements of the Company (taking into consideration, the challenges faced by the Company and its future growth imperatives).
(iv) Overall remuneration should be reflective of the size of the Company, complexity of the sector/ industry/ Company’s operations and the Company’s capacity to pay the remuneration.
(v)Overall remunerationpracticesshould be consistentwith recognizedbest practices.
(vi) Quantum of Sitting Fees may be subject to review on a periodic basis, as required.
(vii) The aggregate Commission payable to all the NEDs and IDs will be recommended by the NRC to the Board based on Company performance, profits, return to investors,shareholder value creation and any other significant qualitative parameters, asmay bedecided by the Board.
(viii) The NRC will recommend to the Board, the quantum of Commission for each director based upon the outcome of the evaluation process which is driven by various factors including attendance and time spent at Board and Committee meetings, individual contribution at the meetings and contributions made by directors, other than at Board and Committee meetings.
(ix) In addition to the Sitting Fees and Commission, the Company may pay to any director such fair and reasonable expenditure, as may have been incurred by the director while performing his / her role as a Director of the Company. This could include reasonable expenditure incurred by the director for attending Board / Board Committee meetings, General Meetings, court convened meetings, meetings with Shareholders / Creditors / Management, site visits, induction and training (arranged by the Company for directors) and in obtaining professional advice from independent advisors in the furtherance of his / her duties as a director.
2.2 Remuneration for Managing Director (“MD”)/Executive Directors (“ED”)/ KMP/ rest of the employees (Note 1)
(i) The extent of overall remuneration to the MD/ED/KMPs/ rest of the employees should be sufficienttoattractandretain talentedandqualifiedindividualssuitablefortheirroles.
Hence, remuneration should be:Ø marketcompetitive (‘market’ foreveryrole isdefinedascompanies from which the
company attracts talent or companies to which the company loses talent)
Ø drivenbytheroleplayedbytheindividual;
Ø reflective of the size of the company, complexity of the sector / industry / Company’soperationsandtheCompany’scapacitytopay;
Ø consistentwithrecognizedbestpractices;and
Ø aligned to any regulatory requirements.
(ii) In terms of remuneration mix or composition,Ø the remuneration mix for the MD/ EDs should be as per the contract approved
by the Shareholders. In case of any change which is beyond the remuneration approved by the Shareholders, the same would require the approval of the Shareholders.
51
Ø basic / fixed salary is provided to all employees to ensure that there is a steadyincome in line with their skills and experience.
Ø inaddition to thebasic/fixedsalary, theCompanyprovidesemployeeswithcertainperquisites, allowances and benefits to enable a certain level of lifestyle and tooffer scope for savings and tax optimization, where possible. The Company also provides all employees with a social security net (subject to limits) by covering medical expenses and hospitalization through re-imbursements or insurance cover and accidental death and dismemberment through personal accident insurance.
Ø theCompanyprovidesretirementbenefits,asapplicable.
Ø in addition to the basic/ fixed salary, benefits, perquisites and allowances asprovided above, the Company may provide MD/EDs such remuneration by way of Commission, calculated with reference to the Net Profits of the Company in aparticularfinancialyear,asmaybedeterminedby theBoard,subject to theoverallceilings stipulated in Section 197 of the Act. The specific amount payable to theMD/ EDs would be based on the performance of the MD/EDs as evaluated by the Board or the NRC and approved by the Board.
OR
Ø In addition to the basic/fixed salary, benefits, perquisites and allowances asprovided above, the Company may provide to its MD/ED, such remuneration by way of an annual incentive remuneration/performance linked bonus subject to the achievement of certain performance criteria and such other parameters as may be considered appropriate from time to time by the Board. An indicative list of factors that may be considered for determination of the extent of this component are:– Company’s performance on certain defined qualitative and quantitative
parameters, as may be decided by the Board from time to time,– Industry benchmarks of remuneration,– Performance of the individual.
Ø The Company will provide the rest of the employees, a performance linked incentive pay. The performance linked pay would be driven by the outcome of the performance appraisal process and the performance of the Company.
2.3 Remuneration payable to Director for services rendered in other capacity No remuneration will be payable to the Directors for services rendered by such Director in any
other capacity unless:a) Theservicesrenderedareofaprofessionalnature;b) The NRC is of the opinion that the director possesses requisite qualification for the
practiceoftheprofession;andc) Approval of the Central Government has been received, if required, for paying the same.
2.4 Policy implementation The NRC is responsible for recommending the Remuneration Policy to the Board. The
Board is responsible for approving and overseeing implementation of the Remuneration Policy.
Note 1 Excludes employees covered by any long term settlements or specific term contracts. The remuneration for these employees would be driven by the respective long term settlements or contracts.
52
Annual Report 2014-15
Annexure DFORM No. MR-3
SECRETARIAL AUDIT REPORT FOR THE FINANCIAL YEAR ENDED 31st MARCH, 2015
(PursuanttoSection204(1)oftheCompaniesAct,2013andRule No. 9 of the Companies (Appointment andRemunerationofManagerialPersonnel)Rules,2014)
To,The MembersTata Capital Limited
We have conducted the Secretarial Audit of the compliance of applicable statutory provisions and the adherence to good corporate practices by Tata Capital Limited (hereinafter called the “Company”). Secretarial Audit was conducted in a manner that provided us a reasonable basis for evaluating the corporate conducts/statutory compliances and expressing our opinion thereon.
Based on our verification of the Tata Capital Limited’s books, papers, minute books, forms andreturns filed and other records maintained by the Company and also the information provided by the Company, its officers, agents and authorised representatives during the conduct of Secretarial Auditand the representations made by the Company, we hereby report that in our opinion, the Company has, during the audit period covering the financial year ended on 31stMarch, 2015 generally compliedwith the statutory provisions listed hereunder and also that the Company has proper Board processes and compliance mechanism in place to the extent, in the manner and subject to the reporting made hereinafter:
We have examined the books, papers, minute books, forms and returns filed and other recordsmadeavailable tousandmaintainedbyTataCapitalLimited for thefinancialyearendedon31stMarch,2015according to the provisions of:
(i) TheCompaniesAct,2013(“theAct”)andtheRulesmadethereunder;
(ii) TheDepositoriesAct,1996andtheRegulationsandBye-lawsframedthereunder;
(iii) Other laws, including the lawsrelating toNonBankingFinancialCompanies to theextentapplicableto the Company as per the representations made by the Company.
We have also examined compliance with the applicable clause of the Secretarial Standards issued by The Institute of Company Secretaries of India with respect to Board and General Meetings, which are not in force as on the date of this Report.
During the period under review, the Company has generally complied with the provisions of the Act, Rules, Regulations, Guidelines, etc. mentioned above except that the Company was not in compliance with the requirement of Section 149 of the Act in respect of Independent Directors and relatedcompliances.
We further report that:(i) The Board of Directors of the Company as on 31st March, 2015 is duly constituted with proper
balance of Executive Directors, Non-Executive Directors except one Independent Director. The changes in the composition of the Board of Directors that took place during the period under review were carried out in compliance with the provisions of the Act.
(ii) Adequate notice for the Board/Committee Meetings was given at least seven days in advance to all the Directors for holding the Board Meetings. Agenda and detailed notes on Agenda were sent in advance,anda systemexists for seekingandobtaining further informationandclarificationson theagenda items before the meeting and for meaningful participation at the meeting.
(iii) Decisions at the Board Meetings, as represented by the Management, were taken unanimously.
53
We further report that as represented by the Company and relied upon by us, there are adequate systems and processes in the Company commensurate with the size and operations of the Company to monitor and ensure compliance with applicable laws, rules, regulations and guidelines.
We further report that during the audit period, the Company had the following events which had a bearing on the Company’s affairs in pursuance of the above referred laws, rules, regulations, guidelines, etc:
a. The Companyhadallotted21,00,791CumulativeRedeemablePreferenceSharesof` 1,000/- each (“CRPS”) aggregating `210.07crore,onaprivateplacementbasis.
b. The Company had offered 25,00,000 CRPS of the Face Value of ` 1,000/- each, at par, aggregating ` 250 crore, on a private placement basis, with an option to retain oversubscription of not more than 25,00,000 CRPS, amounting to Rs. 250 crore.
c. The Company has an Employee Stock Purchase / Option Scheme (“ESOP Scheme”) which isimplemented through the TCL Employee Welfare Trust (“Trust”) to whom the Company had allotted Equity Shares in the past. During the year, the Trust had issued 4,18,020 equity shares to theemployees of the Company and its subsidiary companies and had bought back 6,52,673 equitysharesintermsoftheESOPScheme.
d. The Members had passed a Special Resolution under Section 180(1)(c) of the Act, for borrowing monies, which may exceed the aggregate of the paid up capital of the Company and free reserves, such that the total outstanding amount so borrowed should not exceed ` 20,000 crore at any point of time.
e. The Members had passed a Special Resolution under Section 180(1)(a) of the Act, for creation of charge, mortgage and hypothecation on the assets of the Company for an outstanding aggregate value not exceeding ` 20,000 crore.
For Parikh & Associates
Jigyasa Ved Mumbai, (Partner) May8,2015. FCSNo:6488CPNo:6018
This Report is to be read with our letter of even date which is annexed as Annexure I and forms an integral part of this report.

54
Annual Report 2014-15
Annexure I
To,The MembersTata Capital Limited
Ourreportofevendateistobereadalongwiththisletter.
1. Maintenance of Secretarial record is the responsibility of the Management of the Company. Ourresponsibility is to express an opinion on these Secretarial records based on our audit.
2. We have followed the audit practices and process as were appropriate to obtain reasonable assuranceaboutthecorrectnessofthecontentsoftheSecretarialrecords.Theverificationwasdoneon test basis to ensure that correct facts are reflected in Secretarial records. We believe that theprocess and practices, we followed provide a reasonable basis for our opinion.
3. WehavenotverifiedthecorrectnessandappropriatenessoffinancialrecordsandBooksofAccountsof the Company.
4. Whereverrequired,wehaveobtainedtheManagementrepresentationaboutthecomplianceof laws,rules and regulations and happening of events, etc.
5. The compliance of the provisions of Corporate and other applicable laws, rules, regulations, standards is the responsibility of Management. Our examination was limited to the verification ofprocedure on test basis.
6. The Secretarial Audit report is neither an assurance as to the future viability of the Company nor of theefficacyoreffectivenesswithwhichtheManagementhasconductedtheaffairsoftheCompany.
For Parikh & Associates
Jigyasa Ved Mumbai, (Partner) May8,2015. FCSNo:6488CPNo:6018
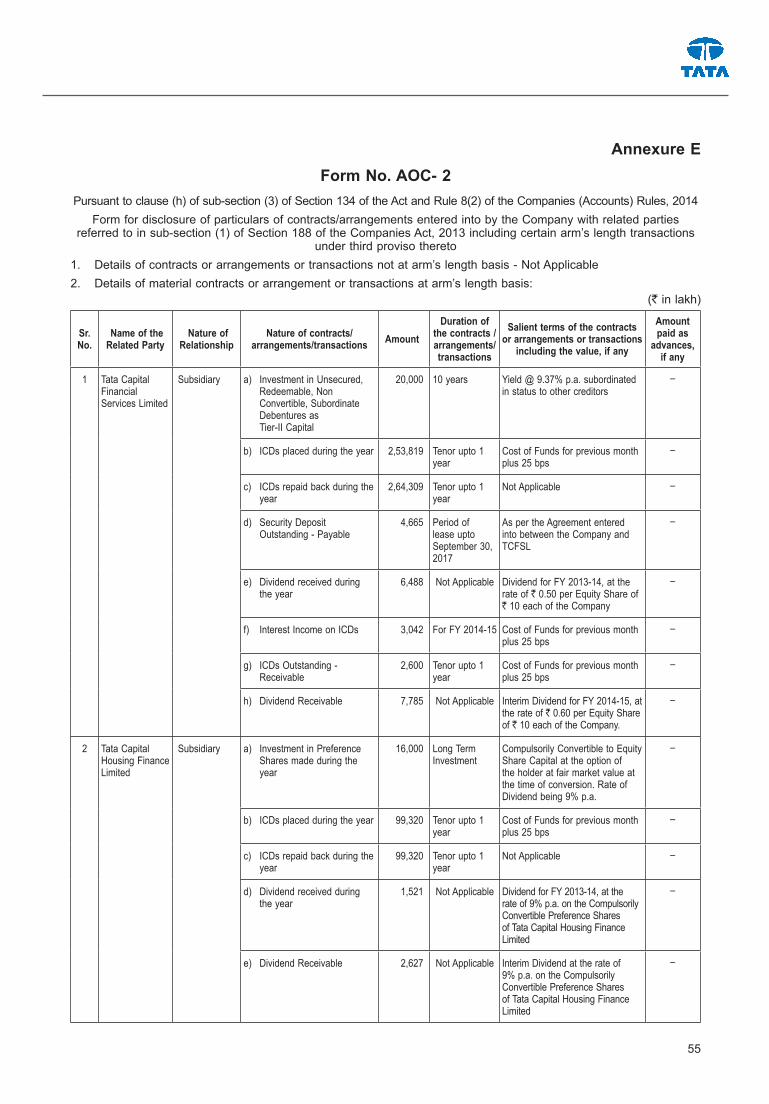
55
Annexure EForm No. AOC- 2
Pursuanttoclause(h)ofsub-section(3)ofSection134oftheActandRule8(2)oftheCompanies(Accounts)Rules,2014Form for disclosure of particulars of contracts/arrangements entered into by the Company with related parties
referred to in sub-section (1) of Section 188 of the Companies Act, 2013 including certain arm’s length transactions under third proviso thereto
1. Details of contracts or arrangements or transactions not at arm’s length basis - Not Applicable2. Details of material contracts or arrangement or transactions at arm’s length basis:
(` in lakh)
Sr. No.
Name of the Related Party
Nature of Relationship
Nature of contracts/arrangements/transactions Amount
Duration of the contracts / arrangements/transactions
Salient terms of the contracts or arrangements or transactions
including the value, if any
Amount paid as
advances, if any
1 Tata Capital Financial Services Limited
Subsidiary a) Investment in Unsecured, Redeemable, Non Convertible, Subordinate Debentures as Tier-II Capital
20,000 10 years [email protected]%p.a.subordinatedin status to other creditors
–
b) ICDs placed during the year 2,53,819 Tenor upto 1 year
Cost of Funds for previous month plus 25 bps
–
c) ICDs repaid back during the year
2,64,309 Tenor upto 1 year
Not Applicable –
d) Security Deposit Outstanding - Payable
4,665 Period of lease upto September 30, 2017
As per the Agreement entered into between the Company and TCFSL
–
e) Dividend received during the year
6,488 Not Applicable DividendforFY2013-14,attherate of ` 0.50 per Equity Share of ` 10 each of the Company
–
f) Interest Income on ICDs 3,042 ForFY2014-15 Cost of Funds for previous month plus 25 bps
–
g) ICDsOutstanding-Receivable
2,600 Tenor upto 1 year
Cost of Funds for previous month plus 25 bps
–
h) Dividend Receivable 7,785 Not Applicable InterimDividendforFY2014-15,atthe rate of ` 0.60 per Equity Share of ` 10 each of the Company.
–
2 Tata Capital HousingFinanceLimited
Subsidiary a) Investment in Preference Shares made during the year
16,000 Long Term Investment
Compulsorily Convertible to Equity Share Capital at the option of the holder at fair market value at the time of conversion. Rate of Dividend being 9% p.a.
–
b) ICDs placed during the year 99,320 Tenor upto 1 year
Cost of Funds for previous month plus 25 bps
–
c) ICDs repaid back during the year
99,320 Tenor upto 1 year
Not Applicable –
d) Dividend received during the year
1,521 Not Applicable DividendforFY2013-14,attherate of 9% p.a. on the Compulsorily Convertible Preference Shares ofTataCapitalHousingFinanceLimited
–
e) Dividend Receivable 2,627 Not Applicable Interim Dividend at the rate of 9% p.a. on the Compulsorily Convertible Preference Shares ofTataCapitalHousingFinanceLimited
–

56
Annual Report 2014-15
Sr. No.
Name of the Related Party
Nature of Relationship
Nature of contracts/arrangements/transactions Amount
Duration of the contracts / arrangements/transactions
Salient terms of the contracts or arrangements or transactions
including the value, if any
Amount paid as
advances, if any
3 Tata Cleantech Capital Limited
Subsidiary a) Investment in Equity Shares made during the year
18,515 Long Term Investment
Total 16,83,18,182 shares of ` 10 each, at a premium of ` 1 per share.
–
b) ICDs placed during the year 57,245 Tenor upto 1 year
Cost of Funds for previous month plus 25 bps
–
c) ICDs repaid back during the year
30,568 Tenor upto 1 year
Not Applicable –
d) ICDsOutstanding-Receivable
31,560 Tenor upto 1 year
Cost of Funds for previous month plus 25 bps
–
4 TC Travel and Services Limited
Subsidiary a) ICDs placed during the year 1,675 Tenor upto 1 year
Cost of Funds for previous month plus 25 to 100 bps
–
b) ICDs repaid back during the year
2,680 Tenor upto 1 year
Not Applicable –
5 Tata Capital Forex Limited
Subsidiary a) ICDs placed during the year 3,500 Tenor upto 1 year
Cost of Funds for previous month plus 25 to 100 bps
–
b) ICDs repaid back during the year
1,200 Tenor upto 1 year
Not Applicable –
c) ICDsOutstanding-Receivable
2,300 Tenor upto 1 year
Cost of Funds for previous month plus 25 to 100 bps
–
6 Tata Capital Advisors Pte Limited (“TCAPL”)
Subsidiary Income – Advisory Fees 2,857 Ongoing,subject to termination
Non-binding advice by the Company. Monthly invoices raised as per terms of agreement with currency risk is to the account of TCAPL.
–
7 Tata Capital Growth Fund
Subsidiary Investment in Units of Fund made during the year
3,604 Long Term Investment
Investment made during the year on the basis of capital call from Fund. Total commitment at ` 250 crore to the Fund
–
8 Tata Capital Special Situations Fund
Associate Investment in Units of Fund made during the year
2,207 Long Term Investment
Investment made during the year on the basis of capital call from Fund. Total commitment at `75croretotheFund
–
9 e-Nxt Financials Limited
Associate a) ICDs placed during the year 1,050 Tenor upto 1 year
Cost of Funds for previous month plus 25 bps
–
b) ICDs repaid back during the year
1,050 Tenor upto 1 year
Not Applicable –
10 Tata AutoComp Systems Limited
Associate a) Dividend received during the year
966 Not Applicable DividendforFY2013-14,attherate of ` 2 per equity share of ` 10 each of the Company
–
11 Tata Capital Innovation Fund
Associate a) Investment in Units of Fund made during the year
870 Long Term Investment
Investment made during the year on the basis of capital call from Fund. Total commitment at ` 78crores to the Fund.
–
12 Tata Sky Limited Fellow Subsidiary
Investment in Equity Shares made during the year
3,105 Long Term Investment
Investmentin53,24,533sharesat` 10 each, at par
–
Note: Appropriate approvals have been taken for Related Party Transactions.
For and on behalf of the Board of Directors
Mumbai Ishaat Hussain Praveen P Kadle May 08, 2015 Director Managing Director & CEO
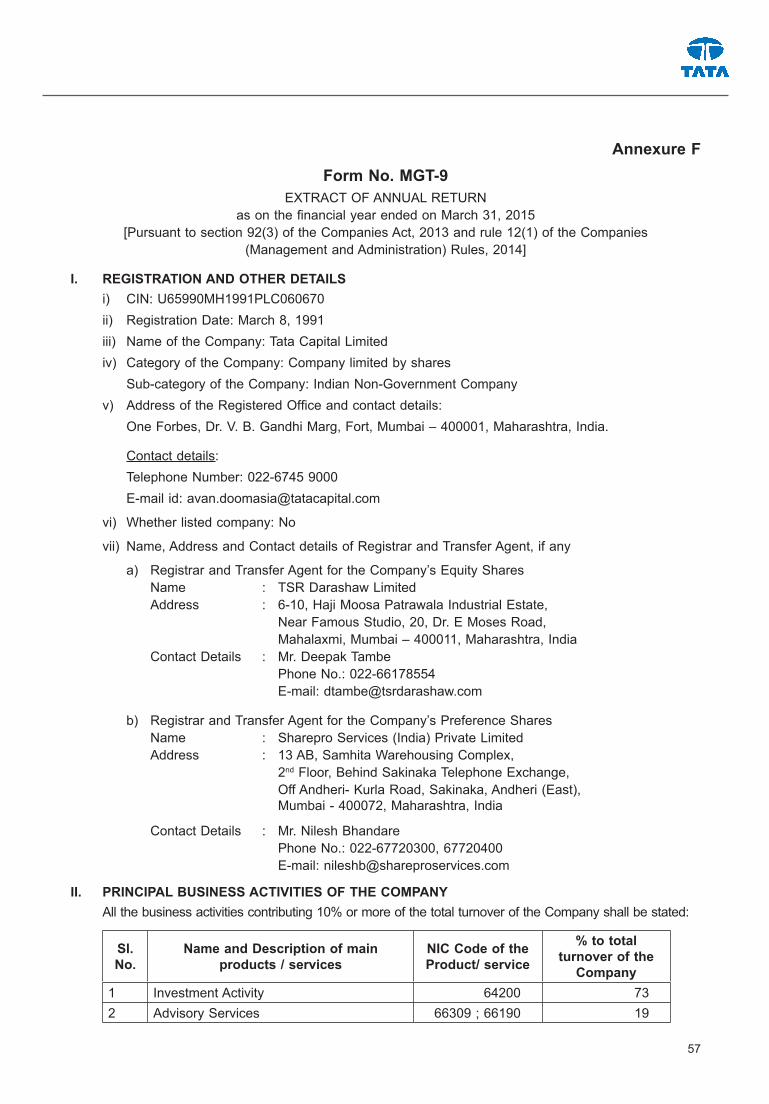
57
Annexure FForm No. MGT-9
EXTRACTOFANNUALRETURNasonthefinancialyearendedonMarch31,2015
[Pursuant to section 92(3) of the Companies Act, 2013 and rule 12(1) of the Companies(ManagementandAdministration)Rules,2014]
I. REGISTRATION AND OTHER DETAILS i) CIN:U65990MH1991PLC060670 ii) Registration Date: March 8, 1991 iii) Name of the Company: Tata Capital Limited iv) Category of the Company: Company limited by shares Sub-category of the Company: Indian Non-Government Company v) AddressoftheRegisteredOfficeandcontactdetails: OneForbes,Dr.V.B.GandhiMarg,Fort,Mumbai–400001,Maharashtra,India.
Contact details: TelephoneNumber:022-67459000 E-mail id: [email protected]
vi) Whether listed company: No
vii) Name, Address and Contact details of Registrar and Transfer Agent, if any
a) Registrar and Transfer Agent for the Company’s Equity Shares Name : TSR Darashaw Limited Address : 6-10,HajiMoosaPatrawalaIndustrialEstate, Near Famous Studio, 20, Dr. E Moses Road, Mahalaxmi,Mumbai–400011,Maharashtra,India Contact Details : Mr. Deepak Tambe PhoneNo.:022-66178554 E-mail: [email protected]
b) Registrar and Transfer Agent for the Company’s Preference Shares Name : Sharepro Services (India) Private Limited Address : 13 AB, Samhita Warehousing Complex, 2nd Floor, Behind Sakinaka Telephone Exchange, OffAndheri-KurlaRoad,Sakinaka,Andheri(East), Mumbai-400072,Maharashtra,India
Contact Details : Mr. Nilesh Bhandare PhoneNo.:022-67720300,67720400 E-mail: [email protected]
II. PRINCIPAL BUSINESS ACTIVITIES OF THE COMPANY All the business activities contributing 10% or more of the total turnover of the Company shall be stated:
Sl. No.
Name and Description of main products / services
NIC Code of the Product/ service
% to total turnover of the
Company 1 Investment Activity 64200 732 Advisory Services 66309;66190 19

58
Annual Report 2014-15
III. PARTICULARS OF HOLDING, SUBSIDIARY AND ASSOCIATE COMPANIES
Sl. No
Name And Address of The Company CIN/GLN
Holding/ Subsidiary/ Associate
% of shares
held Applicable
Section
1 Tata Sons LimitedBombayHouse,24HomiModyStreet,Mumbai-400001
U99999MH1917PLC000478 Holding 90.28 Section 2(46)
2 Tata Capital Financial Services LimitedOneForbes,DrVBGandhiMarg,Fort,Mumbai-400001
U67100MH2010PLC210201 Subsidiary 100 Section 2(87)
3 TataCapitalHousingFinanceLimitedOneForbes,DrVBGandhiMarg,Fort,Mumbai-400001
U67190MH2008PLC187552 Subsidiary 100 Section 2(87)
4 Tata Securities LimitedOneForbes,DrVBGandhiMarg,Fort,Mumbai-400001
U67120MH1994PLC080918 Subsidiary 100 Section 2(87)
5 Tata Cleantech Capital LimitedOneForbes,DrVBGandhiMarg, Fort,Mumbai-400001
U65923MH2011PLC222430 Subsidiary 80.50 Section 2(87)
6 TC Travel And Services LimitedOneForbes,DrVBGandhiMarg,Fort,Mumbai-400001
U63040MH2008PLC187559 Subsidiary 100 Section 2(87)
7 Tata Infrastructure Capital LimitedMTRajen’sProperties,#40Buzullah Road,TNagar,Chennai-600017
U67190TN2010PLC076545 Subsidiary 100 Section 2(87)
8 Tata Capital Pte. Limited8 Shenton Way, #19-01, AXA Tower, Singapore 068811
N.A. Subsidiary 100 Section 2(87)
9 Tata Capital Forex LimitedOneForbes,DrVBGandhiMarg,Fort,Mumbai-400001
U65921MH2006PLC238745 Subsidiary 100 Section 2(87)
10 India Collections Management LimitedOneForbes,DrVBGandhiMarg,Fort,Mumbai-400001
U74120MH2010PLC207484 Subsidiary 100 Section 2(87)
11 Tata Capital Markets Pte. Limited.8 Shenton Way, #19-01, AXA Tower, Singapore 068811
N.A. Subsidiary 100 Section 2(87)
12 Tata Capital Advisors Pte. Limited8 Shenton Way, #19-01, AXA Tower, Singapore 068811
N.A. Subsidiary 100 Section 2(87)
13 Tata Capital Plc30 Millbank, London, SW1P 4WY,England,UnitedKingdom
N.A. Subsidiary 100 Section 2(87)
14 Tata Capital General Partners LLP8 Shenton Way, #19-01, AXA Tower, Singapore 068811
N.A. Subsidiary 80 Section 2(87)

59
Sl. No
Name And Address of The Company CIN/GLN
Holding/ Subsidiary/ Associate
% of shares
held Applicable
Section
15 TataCapitalHealthcareGeneral Partners LLP8 Shenton Way, #19-01, AXA Tower, Singapore 068811
N.A. Subsidiary 100 Section 2(87)
16 TataOpportunitiesGeneralPartners LLP8 Shenton Way, #19-01, AXA Tower, Singapore 068811
N.A. Subsidiary 90 Section 2(87)
17 e-Nxt Financials LimitedOneForbes,DrVBGandhiMarg, Fort,Mumbai–400001
U74999MH2002PLC135640 Associate 50 Section 2(6)
18 Tata Autocomp Systems LimitedBombayHouse,24HomiModyStreet,Mumbai–400001
U34100MH1995PLC093733 Associate 24 Section 2(6)
19 International Asset Reconstruction Company Private Limited709,7thFloor,AnsalBhawan,16, Kasturba Gandhi Marg, New Delhi – 110001
U74999DL2002PTC117357 Associate 25.37 Section 2(6)
20 Nectar Loyalty Management India LimitedRamnordHouse,GroundFloor,77Dr.AnnieBesantRoad,Worli,Mumbai-400018
U74120MH2011PLC221894 Joint Venture
49 Section 2(6)
IV. A) SHARE HOLDING PATTERN (Equity Share Capital Breakup as percentage of Total Equity)
i) Category-wise Share Holding
Category of Shareholders No. of Shares held at the beginning of the year No. of Shares held at the end of the year
% Change during the year Demat Physical Total % of Total
Shares Demat Physical Total % of Total Shares
A. Promoters
(1) Indian
a) Individual/HUF – – – – – – – – –
b) Central Govt – – – – – – – – –
c) State Govt (s) – – – – – – – – –
d) Bodies Corp. 2,55,14,33,946 - 2,55,14,33,946 90.28 2,55,14,33,946 – 2,55,14,33,946 90.28 –
e) Banks / FI – – – – – – – – –
f) AnyOther…. – – – – – – – – –
Sub-total (A) (1):- 2,55,14,33,946 – 2,55,14,33,946 90.28 2,55,14,33,946 – 2,55,14,33,946 90.28 –
(2) Foreign
a) NRIs - Individuals – – – – – – – – –
b) Other–Individuals – – – – – – – – –
c) Bodies Corp. – – – – – – – – –
d) Banks / FI – – – – – – – – –
e) AnyOther – – – – – – – – –
Sub-total (A) (2):- – – – – – – – – –
Total shareholding of Promoter (A) = (A)(1)+(A)(2) 2,55,14,33,946 – 2,55,14,33,946 90.28 2,55,14,33,946 – 2,55,14,33,946 90.28 –
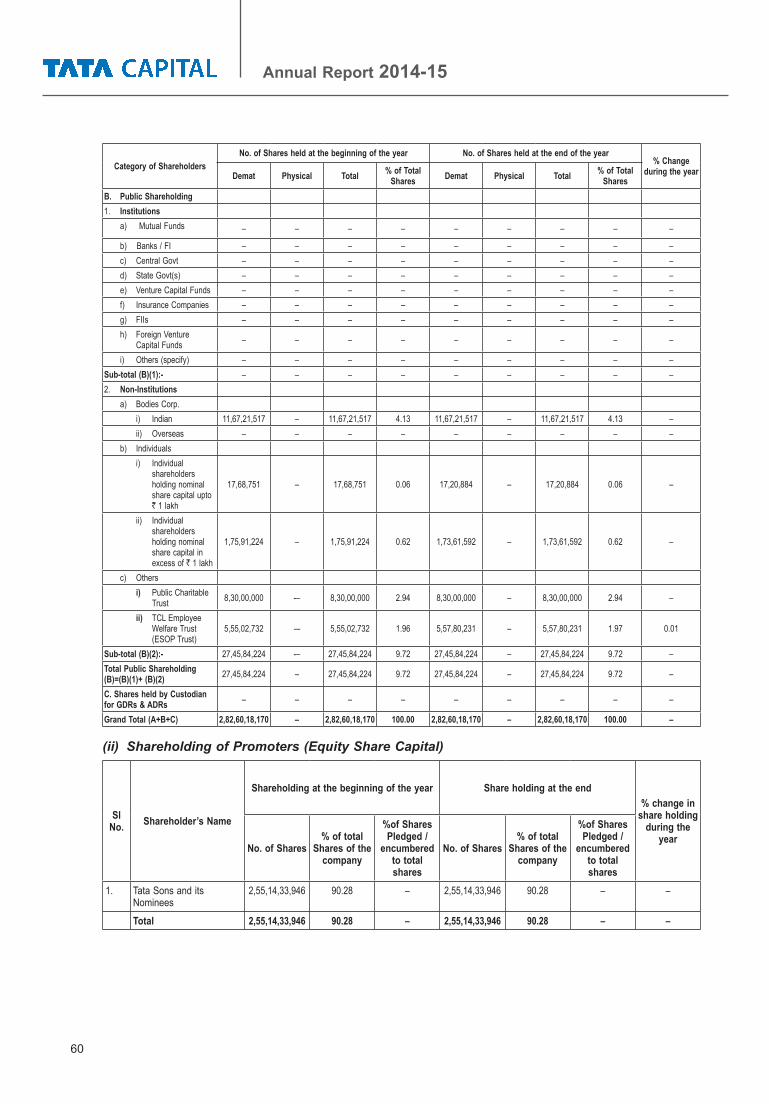
60
Annual Report 2014-15
Category of Shareholders No. of Shares held at the beginning of the year No. of Shares held at the end of the year
% Change during the year Demat Physical Total % of Total
Shares Demat Physical Total % of Total Shares
B. Public Shareholding 1. Institutions a) Mutual Funds – – – – – – – – –
b) Banks / FI – – – – – – – – – c) Central Govt – – – – – – – – – d) State Govt(s) – – – – – – – – – e) Venture Capital Funds – – – – – – – – – f) Insurance Companies – – – – – – – – – g) FIIs – – – – – – – – – h) Foreign Venture Capital Funds – – – – – – – – –
i) Others(specify) – – – – – – – – –Sub-total (B)(1):- – – – – – – – – –2. Non-Institutions a) Bodies Corp. i) Indian 11,67,21,517 – 11,67,21,517 4.13 11,67,21,517 – 11,67,21,517 4.13 – ii) Overseas – – – – – – – – – b) Individuals i) Individual shareholders holding nominal share capital upto ` 1 lakh
17,68,751 – 17,68,751 0.06 17,20,884 – 17,20,884 0.06 –
ii) Individual shareholders holding nominal share capital in excess of ` 1 lakh
1,75,91,224 – 1,75,91,224 0.62 1,73,61,592 – 1,73,61,592 0.62 –
c) Others i) Public Charitable Trust 8,30,00,000 -– 8,30,00,000 2.94 8,30,00,000 – 8,30,00,000 2.94 –
ii) TCL Employee Welfare Trust (ESOPTrust)
5,55,02,732 -– 5,55,02,732 1.96 5,57,80,231 – 5,57,80,231 1.97 0.01
Sub-total (B)(2):- 27,45,84,224 -– 27,45,84,224 9.72 27,45,84,224 – 27,45,84,224 9.72 –Total Public Shareholding (B)=(B)(1)+ (B)(2) 27,45,84,224 – 27,45,84,224 9.72 27,45,84,224 – 27,45,84,224 9.72 –
C. Shares held by Custodian for GDRs & ADRs – – – – – – – – –
Grand Total (A+B+C) 2,82,60,18,170 – 2,82,60,18,170 100.00 2,82,60,18,170 – 2,82,60,18,170 100.00 –
(ii) Shareholding of Promoters (Equity Share Capital)
Sl No. Shareholder’s Name
Shareholding at the beginning of the year Share holding at the end % change in
share holding during the
yearNo. of Shares
% of total Shares of the
company
%of Shares Pledged /
encumbered to total shares
No. of Shares % of total
Shares of the company
%of Shares Pledged /
encumbered to total shares
1. Tata Sons and its Nominees
2,55,14,33,946 90.28 – 2,55,14,33,946 90.28 – –
Total 2,55,14,33,946 90.28 – 2,55,14,33,946 90.28 – –
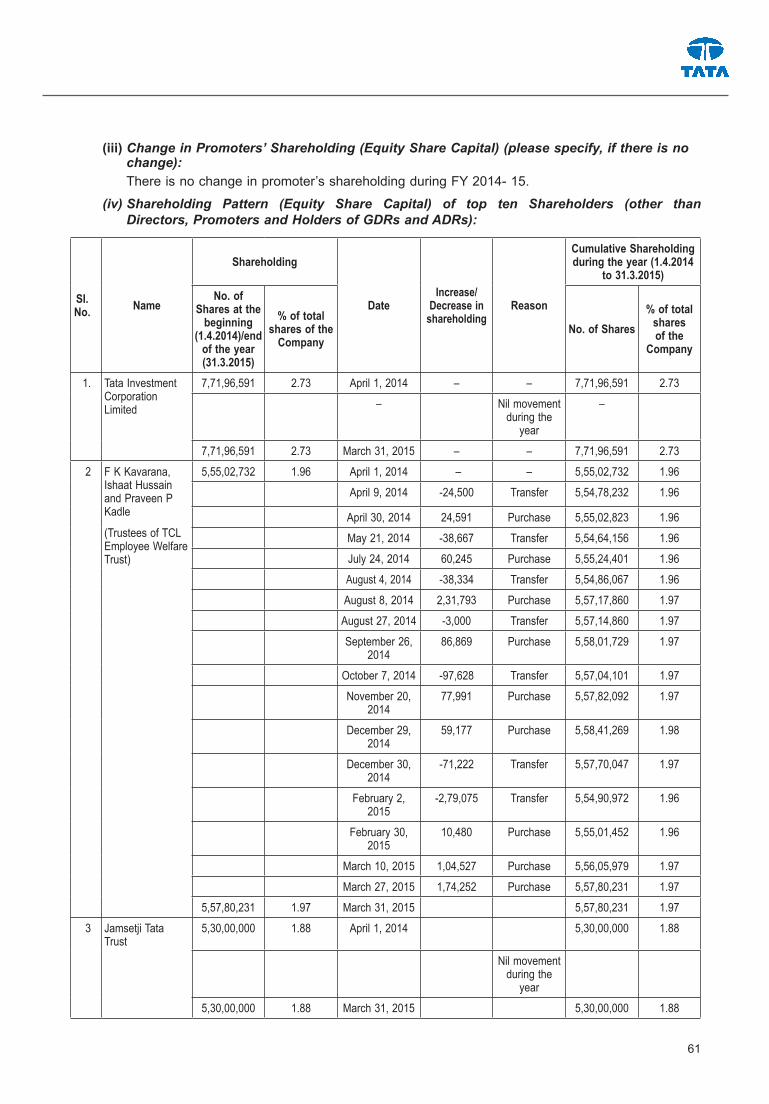
61
(iii) Change in Promoters’ Shareholding (Equity Share Capital) (please specify, if there is no change):
Thereisnochangeinpromoter’sshareholdingduringFY2014-15.
(iv) Shareholding Pattern (Equity Share Capital) of top ten Shareholders (other than Directors, Promoters and Holders of GDRs and ADRs):
SI. No. Name
Shareholding
DateIncrease/
Decrease in shareholding
Reason
Cumulative Shareholding during the year (1.4.2014
to 31.3.2015)No. of
Shares at the beginning
(1.4.2014)/end of the year (31.3.2015)
% of total shares of the
CompanyNo. of Shares
% of total shares of the
Company
1. Tata Investment Corporation Limited
7,71,96,591 2.73 April1,2014 – – 7,71,96,591 2.73
– Nil movement during the
year
–
7,71,96,591 2.73 March 31, 2015 – – 7,71,96,591 2.73
2 F K Kavarana, IshaatHussainand Praveen P Kadle
(Trustees of TCL Employee Welfare Trust)
5,55,02,732 1.96 April1,2014 – – 5,55,02,732 1.96
April9,2014 -24,500 Transfer 5,54,78,232 1.96
April30,2014 24,591 Purchase 5,55,02,823 1.96
May21,2014 -38,667 Transfer 5,54,64,156 1.96
July24,2014 60,245 Purchase 5,55,24,401 1.96
August4,2014 -38,334 Transfer 5,54,86,067 1.96
August8,2014 2,31,793 Purchase 5,57,17,860 1.97
August27,2014 -3,000 Transfer 5,57,14,860 1.97
September 26, 2014
86,869 Purchase 5,58,01,729 1.97
October7,2014 -97,628 Transfer 5,57,04,101 1.97
November 20, 2014
77,991 Purchase 5,57,82,092 1.97
December 29, 2014
59,177 Purchase 5,58,41,269 1.98
December 30, 2014
-71,222 Transfer 5,57,70,047 1.97
February 2, 2015
-2,79,075 Transfer 5,54,90,972 1.96
February 30, 2015
10,480 Purchase 5,55,01,452 1.96
March 10, 2015 1,04,527 Purchase 5,56,05,979 1.97
March27,2015 1,74,252 Purchase 5,57,80,231 1.97
5,57,80,231 1.97 March 31, 2015 5,57,80,231 1.97
3 Jamsetji Tata Trust
5,30,00,000 1.88 April1,2014 5,30,00,000 1.88
Nil movement during the
year
5,30,00,000 1.88 March 31, 2015 5,30,00,000 1.88
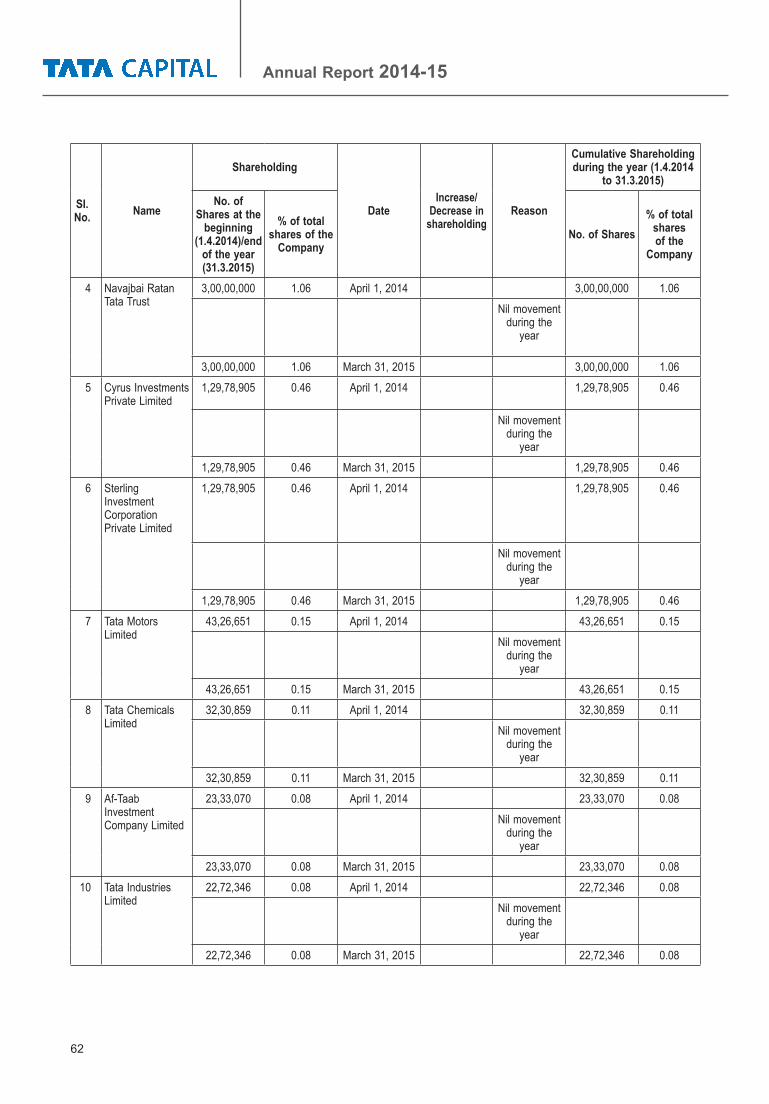
62
Annual Report 2014-15
SI. No. Name
Shareholding
DateIncrease/
Decrease in shareholding
Reason
Cumulative Shareholding during the year (1.4.2014
to 31.3.2015)No. of
Shares at the beginning
(1.4.2014)/end of the year (31.3.2015)
% of total shares of the
CompanyNo. of Shares
% of total shares of the
Company
4 Navajbai Ratan Tata Trust
3,00,00,000 1.06 April1,2014 3,00,00,000 1.06
Nil movement during the
year
3,00,00,000 1.06 March 31, 2015 3,00,00,000 1.06
5 Cyrus Investments Private Limited
1,29,78,905 0.46 April1,2014 1,29,78,905 0.46
Nil movement during the
year
1,29,78,905 0.46 March 31, 2015 1,29,78,905 0.46
6 Sterling Investment Corporation Private Limited
1,29,78,905 0.46 April1,2014 1,29,78,905 0.46
Nil movement during the
year
1,29,78,905 0.46 March 31, 2015 1,29,78,905 0.46
7 Tata Motors Limited
43,26,651 0.15 April1,2014 43,26,651 0.15
Nil movement during the
year
43,26,651 0.15 March 31, 2015 43,26,651 0.15
8 Tata Chemicals Limited
32,30,859 0.11 April1,2014 32,30,859 0.11
Nil movement during the
year
32,30,859 0.11 March 31, 2015 32,30,859 0.11
9 Af-Taab Investment Company Limited
23,33,070 0.08 April1,2014 23,33,070 0.08
Nil movement during the
year
23,33,070 0.08 March 31, 2015 23,33,070 0.08
10 Tata Industries Limited
22,72,346 0.08 April1,2014 22,72,346 0.08
Nil movement during the
year
22,72,346 0.08 March 31, 2015 22,72,346 0.08

63
(v) Shareholding (Equity Share) of Directors and Key Managerial Personnel:
SI. No. Name
Shareholding
DateIncrease/
Decrease in shareholding
Reason
Cumulative Shareholding during the year (1.4.2014 to
31.3.2015)
No. of Shares at the
beginning (1.4.2014)/end
of the year (31.3.2015)
% of total shares of the
CompanyNo. of Shares
% of total shares of the
Company
1 Mr. Ishaat Hussain (Director)
2,20,000 0.01 April1,2014 2,20,000 0.01
Nil movement during the year
2,20,000 0.01 March 31, 2015
2,20,000 0.01
2 Mr. Janki Ballabh (Director)
2,30,780 0.01 April1,2014 2,30,780 0.01
Nil movement during the year
2,30,780 0.01 March 31, 2015
2,30,780 0.01
3 Mr. F. K. Kavarana (Director)
Please see Note No.1
2,43,716 0.01 April1,2014 2,43,716 0.01
Nil movement during the year
2,43,716 0.01 March 31, 2015
2,43,716 0.01
4 Mr. H. N. Sinor (Director)
Please see Note No.2
2,20,000 0.01 April1,2014 2,20,000 0.01
Nil movement during the year
2,20,000 0.01 March 31, 2015
2,20,000 0.01
5 Mr. F. N. Subedar (Director)
2,43,716 0.01 April1,2014 2,43,716 0.01
Nil movement during the year
2,43,716 0.01 March 31, 2015
2,43,716 0.01
6 Mr. Praveen P Kadle (Managing Director &CEO)
13,78,580 0.05 April1,2014 13,78,580 0.05
February 2, 2015
80,000 ESOPAllotment
14,58,580 0.05
14,58,580 0.05 March 31, 2015
14,58,580 0.05
7 Mr. Puneet Sharma (CFO)
1,46,050 0.01 April1,2014 1,46,050 0.01
Nil movement during the year
1,46,050 0.01 March 31, 2015
1,46,050 0.01
8 Ms. Sarita Kamath (Company Secretary)
Please see Note No.3
3,323 0 April1,2014 3,323 0
Nil movement during the year
3,323 0 March 31, 2015
3,323 0

64
Annual Report 2014-15
SI. No. Name
Shareholding
DateIncrease/
Decrease in shareholding
Reason
Cumulative Shareholding during the year (1.4.2014 to
31.3.2015)
No. of Shares at the
beginning (1.4.2014)/end
of the year (31.3.2015)
% of total shares of the
CompanyNo. of Shares
% of total shares of the
Company
9 Ms. Avan Doomasia (Company Secretary)
Please see Note No.4
89,305 0 April1,2014 89,305 0
Nil movement during the year
89,305 0 March 31, 2015
89,305 0
Notes:1. Mr. F. K. Kavarana ceased to be Director w.e.f. June 9, 20142. Mr. H. N. Sinor ceased to be Director w.e.f. June 30, 20143. Ms. Sarita Kamath ceased to be Company Secretary w.e.f. end of day on January 1, 20154. Ms. Avan Doomasia was appointed as the Company Secretary w.e.f. January 2, 2015
IV. B) SHARE HOLDING PATTERN (Preference Share Capital Breakup as percentage of Total Preference Capital)
i) Category-wise Share Holding
Category of Shareholders
No. of Shares held at the beginning of the year No. of Shares held at the end of the year % Change
during the year Demat Physical Total % of Total
Shares Demat Physical Total % of Total Shares
A. Promoters
(1) Indian
a) Individual/HUF – – – – – – – – –
b) Central Govt – – – – – – – – –
c) State Govt (s) – – – – – – – – –
d) Bodies Corp. – – – – – – – – –
e) Banks / FI – – – – – – – – –
f) AnyOther…. – – – – – – – – –
Sub-total (A) (1):- – – – – – – – – –
(2) Foreign
a) NRIs - Individuals – – – – – – – – –
b) Other–Individuals – – – – – – – – –
c) Bodies Corp. – – – – – – – – –
d) Banks / FI – – – – – – – – –
e) AnyOther…. – – – – – – – – –
Sub-total (A) (2):- – – – – – – – – –
Total shareholding of Promoter (A) = (A)(1)+(A)(2) – – – – – – – – –

65
Category of Shareholders
No. of Shares held at the beginning of the year No. of Shares held at the end of the year % Change
during the year Demat Physical Total % of Total
Shares Demat Physical Total % of Total Shares
B. Public Shareholding
1. Institutions
a) Mutual Funds – – – – – – – – –
b) Banks / FI – – – – – – – – –
c) Central Govt – – – – – – – – –
d) State Govt(s) – – – – – – – – –
e) Venture Capital Funds – – – – – – – – –
f) Insurance Companies – – – – – – – – –
g) FIIs – – – – – – – – –
h) Foreign Venture Capital Funds – – – – – – – – –
i) Others(specify) – – – – – – – – –
Sub-total (B)(1):- – – – – – – – – –
2. Non-Institutions
a) Bodies Corp.
i) Indian 14,84,023 – 14,84,023 21.62 27,29,423 – 27,29,423 30.45 83.92
ii) Overseas – – – – – – – – –
b) Individuals
i) Individual shareholders holding nominal share capital upto ` 1 lakh
3,610 – 3,610 0.05 3,780 – 3,780 0.04 4.71
ii) Individual shareholders holding nominal share capital in excess of ` 1 lakh
51,72,643 – 51,72,643 75.36 60,27,864 – 60,27,864 67.24 16.53
c) Others
Trust 2,00,000 – 2,00,000 2.91 2,00,000 – 2,00,000 2.23 –
Others 3,400 – 3,400 0.05 3,400 – 3,400 0.04 –
Sub-total (B)(2):- 68,63,676 – 68,63,676 100 89,64,467 – 89,64,467 100 30.61
Total Public Shareholding (B)=(B)(1)+ (B)(2) 68,63,676 – 68,63,676 100 89,64,467 – 89,64,467 100 30.61
C. Shares held by Custodian for GDRs & ADRs – – – – – – – – –
Grand Total (A+B+C) 68,63,676 – 68,63,676 100.00 89,64,467 – 89,64,467 100.00 30.61
(ii) Shareholding (Preference Shares) of Promoters – Nil
(iii) Change in Promoters’ Shareholding (Preference Shares) (please specify, if there is no change) - Not Applicable
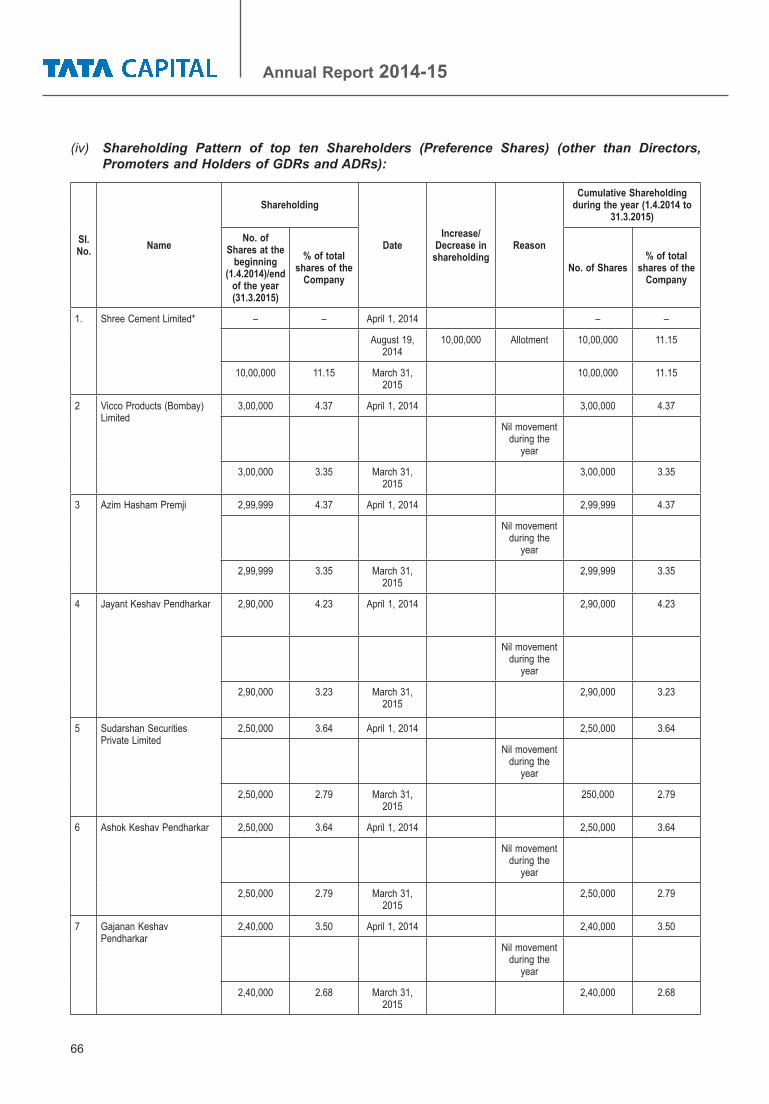
66
Annual Report 2014-15
(iv) Shareholding Pattern of top ten Shareholders (Preference Shares) (other than Directors, Promoters and Holders of GDRs and ADRs):
SI. No. Name
Shareholding
DateIncrease/
Decrease in shareholding
Reason
Cumulative Shareholding during the year (1.4.2014 to
31.3.2015)
No. of Shares at the
beginning (1.4.2014)/end
of the year (31.3.2015)
% of total shares of the
CompanyNo. of Shares
% of total shares of the
Company
1. Shree Cement Limited* – – April1,2014 – –
August 19, 2014
10,00,000 Allotment 10,00,000 11.15
10,00,000 11.15 March 31, 2015
10,00,000 11.15
2 Vicco Products (Bombay) Limited
3,00,000 4.37 April1,2014 3,00,000 4.37
Nil movement during the
year
3,00,000 3.35 March 31, 2015
3,00,000 3.35
3 AzimHashamPremji 2,99,999 4.37 April1,2014 2,99,999 4.37
Nil movement during the
year
2,99,999 3.35 March 31, 2015
2,99,999 3.35
4 Jayant Keshav Pendharkar 2,90,000 4.23 April1,2014 2,90,000 4.23
Nil movement during the
year
2,90,000 3.23 March 31, 2015
2,90,000 3.23
5 Sudarshan Securities Private Limited
2,50,000 3.64 April1,2014 2,50,000 3.64
Nil movement during the
year
2,50,000 2.79 March 31, 2015
250,000 2.79
6 Ashok Keshav Pendharkar 2,50,000 3.64 April1,2014 2,50,000 3.64
Nil movement during the
year
2,50,000 2.79 March 31, 2015
2,50,000 2.79
7 Gajanan Keshav Pendharkar
2,40,000 3.50 April1,2014 2,40,000 3.50
Nil movement during the
year
2,40,000 2.68 March 31, 2015
2,40,000 2.68

67
SI. No. Name
Shareholding
DateIncrease/
Decrease in shareholding
Reason
Cumulative Shareholding during the year (1.4.2014 to
31.3.2015)
No. of Shares at the
beginning (1.4.2014)/end
of the year (31.3.2015)
% of total shares of the
CompanyNo. of Shares
% of total shares of the
Company
8 Sumant Keshav Pendharkar 2,15,000 3.13 April1,2014 2,15,000 3.13
Nil movement during the
year
2,15,000 2.40 March 31, 2015
2,15,000 2.40
9 Yeshwant Keshav Pendharkar
2,10,000 3.06 April1,2014 2,10,000 3.06
Nil movement during the
year
210,000 2.34 March 31, 2015
2,10,000 2.34
10 Azim Premji Trust 2,00,000 2.91 April1,2014 2,00,000 2.91
Nil movement during the
year
2,00,000 2.23 March 31, 2015
2,00,000 2.23
11 International Tractors Limited#
1,33,700 1.95 April1,2014 1,33,700 1.95
Nil movement during the
year
1,33,700 1.50 March 31, 2015
1,33,700 1.50
*Not in the list of Top 10 shareholders as on 01-04-2014. The same has been reflected above since the shareholder was one of the Top 10 shareholders as on 31-03-2015.#Ceased to be in the list of Top 10 shareholders as on 31-03-2015. The same is reflected above since the shareholder was one of the Top 10 shareholders as on 01-04-2014.
(v) Shareholding (Preference Shares ) of Directors and Key Managerial Personnel:
SI. No. Name
Shareholding
DateIncrease/
Decrease in shareholding
Reason
Cumulative Shareholding during the year (1.4.2014 to
31.3.2015)No. of
Shares at the beginning (1.4.2014)/
end of the year
(31.3.2015)
% of total shares of the
CompanyNo. of Shares
% of total shares of the
Company
1 Mr.IshaatHussain (Director)
7,000 0.10 April1,2014 7,000 0.10August 19,
201410,000 Allotment 17,000 0.19
17,000 0.19 March 31, 2015
17,000 0.19
2 Mr. Nalin M. Shah (Director)
3,000 0.04 April1,2014 3,000 0.04Nil movement
during the year
3,000 0.03 March 31, 2015
3,000 0.03
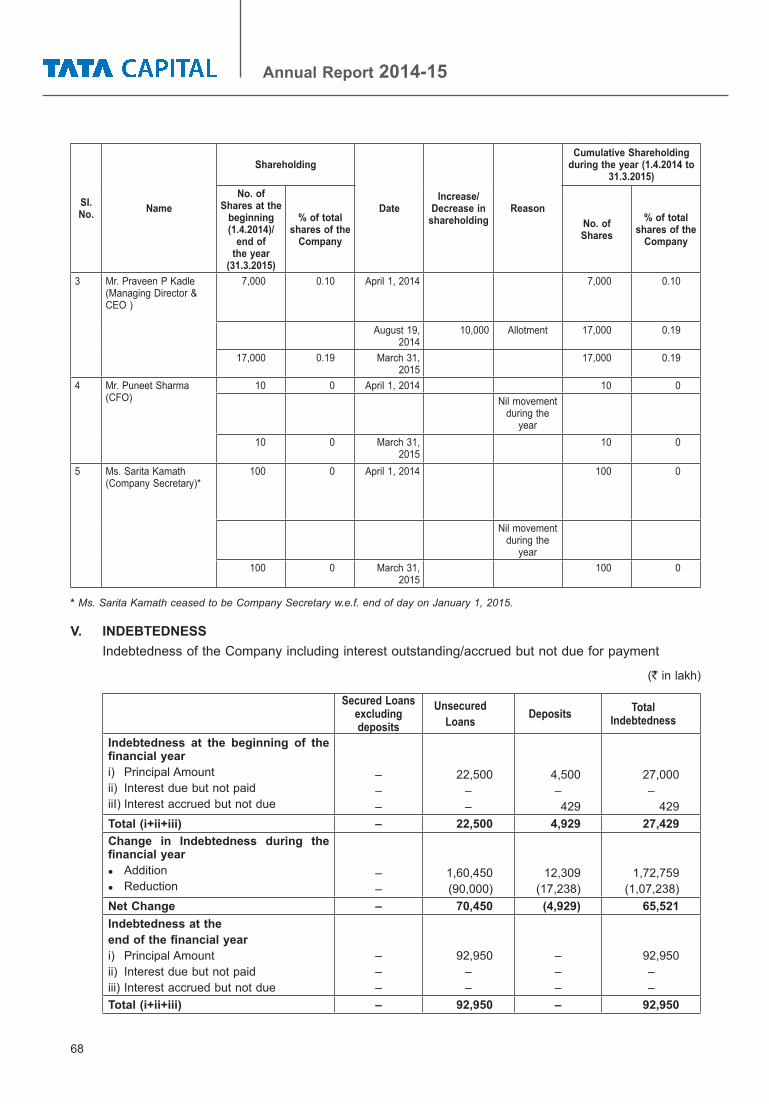
68
Annual Report 2014-15
SI. No. Name
Shareholding
DateIncrease/
Decrease in shareholding
Reason
Cumulative Shareholding during the year (1.4.2014 to
31.3.2015)No. of
Shares at the beginning (1.4.2014)/
end of the year
(31.3.2015)
% of total shares of the
CompanyNo. of Shares
% of total shares of the
Company
3 Mr. Praveen P Kadle (Managing Director & CEO)
7,000 0.10 April1,2014 7,000 0.10
August 19, 2014
10,000 Allotment 17,000 0.19
17,000 0.19 March 31, 2015
17,000 0.19
4 Mr. Puneet Sharma (CFO)
10 0 April1,2014 10 0Nil movement
during the year
10 0 March 31, 2015
10 0
5 Ms. Sarita Kamath (Company Secretary)*
100 0 April1,2014 100 0
Nil movement during the
year100 0 March 31,
2015100 0
* Ms. Sarita Kamath ceased to be Company Secretary w.e.f. end of day on January 1, 2015.
V. INDEBTEDNESS Indebtedness of the Company including interest outstanding/accrued but not due for payment
(` in lakh)
Secured Loans excluding deposits
UnsecuredLoans Deposits Total
Indebtedness
Indebtedness at the beginning of the financial yeari) Principal Amountii) Interest due but not paidiiI) Interest accrued but not due
–––
22,500––
4,500–429
27,000–429
Total (i+ii+iii) – 22,500 4,929 27,429Change in Indebtedness during the financial yearl Additionl Reduction
––
1,60,450(90,000)
12,309(17,238)
1,72,759(1,07,238)
Net Change – 70,450 (4,929) 65,521Indebtedness at theend of the financial yeari) Principal Amountii) Interest due but not paidiii) Interest accrued but not due
–––
92,950––
–––
92,950––
Total (i+ii+iii) – 92,950 – 92,950
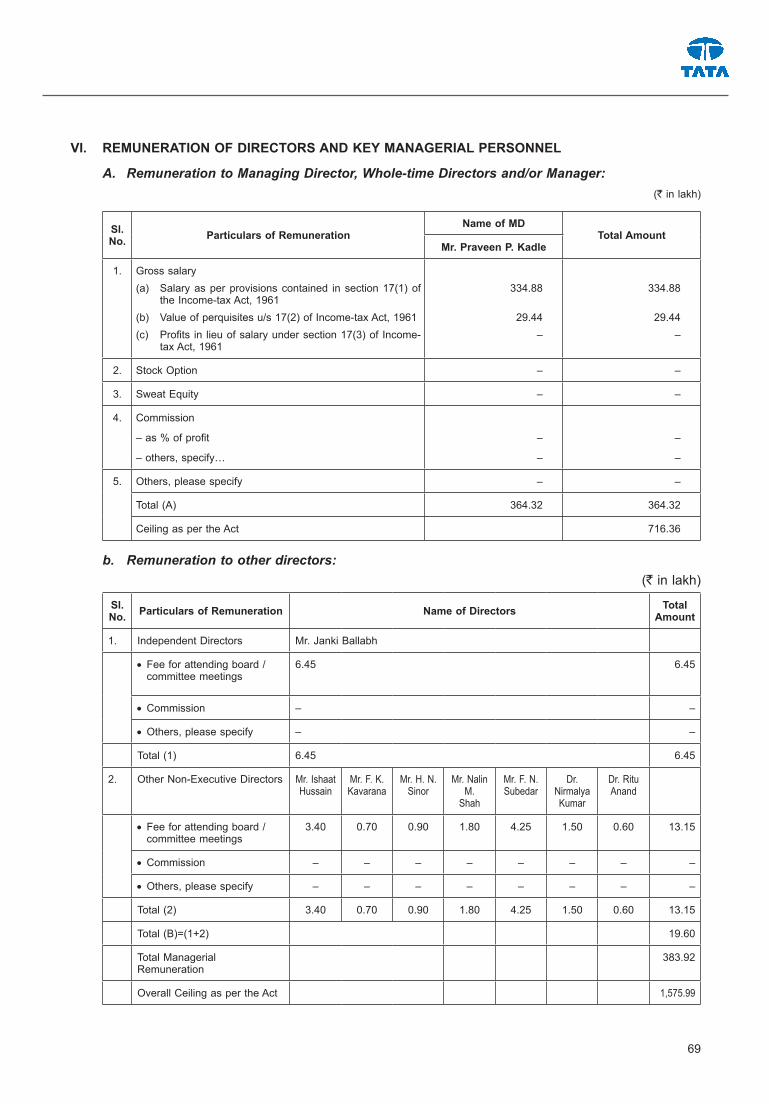
69
VI. REMUNERATION OF DIRECTORS AND KEY MANAGERIAL PERSONNEL
A. Remuneration to Managing Director, Whole-time Directors and/or Manager:(` in lakh)
Sl. No. Particulars of Remuneration
Name of MDTotal Amount
Mr. Praveen P. Kadle
1. Gross salary(a) Salaryasperprovisionscontained insection17(1)of
the Income-tax Act, 1961(b) Valueofperquisitesu/s17(2)ofIncome-taxAct,1961(c) Profits in lieuofsalaryundersection17(3)of Income-
tax Act, 1961
334.88
29.44–
334.88
29.44–
2. StockOption – –
3. Sweat Equity – –
4. Commission
–as%ofprofit
–others,specify…
–
–
–
–
5. Others,pleasespecify – –
Total (A) 364.32 364.32
Ceiling as per the Act 716.36
b. Remuneration to other directors: (` in lakh)
Sl. No. Particulars of Remuneration Name of Directors Total
Amount
1. Independent Directors Mr. Janki Ballabh
•Fee for attending board / committee meetings
6.45 6.45
•Commission – –
•Others,pleasespecify – –
Total (1) 6.45 6.45
2. OtherNon-ExecutiveDirectors Mr. Ishaat Hussain
Mr. F. K. Kavarana
Mr.H.N.Sinor
Mr. Nalin M.
Shah
Mr. F. N. Subedar
Dr. Nirmalya Kumar
Dr. Ritu Anand
•Fee for attending board / committee meetings
3.40 0.70 0.90 1.80 4.25 1.50 0.60 13.15
•Commission – – – – – – – –
•Others,pleasespecify – – – – – – – –
Total (2) 3.40 0.70 0.90 1.80 4.25 1.50 0.60 13.15
Total (B)=(1+2) 19.60
Total Managerial Remuneration
383.92
OverallCeilingaspertheAct 1,575.99

70
Annual Report 2014-15
C. REMUNERATION TO KEY MANAGERIAL PERSONNEL OTHER THAN MD/MANAGER/WTD(` in lakh)
Sl. No. Particulars of Remuneration
Key Managerial Personnel
Mr. Puneet Sharma, CFO
Ms. Avan Doomasia, Company Secretary#
Ms. Sarita Kamath,
Company Secretary*
Total
1. Gross salary
(a) Salary as per provisions containedinsection17(1)ofthe Income-tax Act, 1961
(b) Valueofperquisitesu/s17(2)of Income-tax Act, 1961
(c) Profitsinlieuofsalaryundersection17(3)ofIncome-taxAct, 1961
127.20
6.59
–
15.05
0.64
–
24.15
0.90
–
166.40
8.13
–
2. StockOption(Number) 80,000 60,000 30,000 1,70,000
3. Sweat Equity – – – –
4. Commission
-as%ofprofit
-others,specify…
– - – –
5. Others,please
specify
– – – –
Total 133.79 15.69 25.05 174.53#Ms. Avan Doomasia was appointed as the Company Secretary w.e.f. January 2, 2015.*Ms. Sarita Kamath ceased to be Company Secretary w.e.f. end on day of January 1, 2015.
VII. PENALTIES/ PUNISHMENT/ COMPOUNDING OF OFFENCES:
Type Section of the Companies Act
Brief Description
Details of Penalty /
Punishment/ Compounding fees imposed
Authority [RD / NCLT
/ COURT]
Appeal made, if any (give
Details)
A. COMPANY
Penalty – – – – –
Punishment – – – – –
Compounding – – – – –
B. DIRECTORS
Penalty – – – – –
Punishment – – – – –
Compounding – – – – –
C. OTHER OFFICERS IN DEFAULT
Penalty – – – – –
Punishment – – – – –
Compounding – – – – –

71
ConsolidatedFinancial
Statements

72
Annual Report 2014-15
INDEPENDENT AUDITORS’ REPORT
TO THE MEMBERS OF TATA CAPITAL LIMITED
Report on the Consolidated Financial StatementsWe have audited the accompanying consolidated financial statements of Tata Capital Limited (hereinafter referred to as the “Holding Company”), its subsidiaries (the Holding Company and its subsidiaries together referred to as the “Group”) and its associates, which comprise the Consolidated Balance Sheet as at 31st March, 2015, the Consolidated Statement of Profit and Loss, the Consolidated Cash Flow Statement for the year then ended, and a summary of the significant accounting policies and other explanatory information.
Management’s Responsibility for the Consolidated Financial Statements
The Holding Company’s Board of Directors is responsible for the preparation of these consolidated financial statements in terms of the requirements of the Companies Act, 2013 (hereinafter referred to as the “Act”) that give a true and fair view of the consolidated financial position, consolidated financial performance and consolidated cash flows of the Group in accordance with the accounting principles generally accepted in India, including the Accounting Standards specified under Section 133 of the Act, read with Rule 7 of the Companies (Accounts) Rules, 2014. This responsibility also includes maintenance of adequate accounting records in accordance with the provisions of the Act for safeguarding the assets of the Group and for preventing and detecting frauds and other irregularities; the selection and application of appropriate accounting policies; making judgments and estimates that are reasonable and prudent; and the design, implementation and maintenance of adequate internal financial controls, that were operating effectively for ensuring the accuracy and completeness of the accounting records, relevant to the preparation and presentation of the consolidated financial statements that give a true and fair view and are free from material misstatement, whether due to fraud or error.
Auditor’s ResponsibilityOur responsibility is to express an opinion on these consolidated financial statements based on our audit. We have taken into account the provisions of the Act, the accounting and auditing standards and matters which are required to be included in the audit report under the provisions of the Act and the Rules made thereunder.
We conducted our audit in accordance with the Standards on Auditing specified under Section 143(10) of the Act. Those Standards require that we comply with ethical requirements and plan and perform the audit to obtain reasonable assurance about whether the consolidated financial statements are free from material misstatement.
An audit involves performing procedures to obtain audit evidence about the amounts and the disclosures in the consolidated financial statements. The procedures selected depend on the auditor’s judgment, including the assessment of the risks of material misstatement of the consolidated financial statements, whether due to fraud or error. In making those risk assessments, the auditor considers internal financial control relevant to the Holding Company’s preparation of the consolidated financial statements that give a true and fair view in order to design audit procedures that are appropriate in the circumstances but not for the purpose of expressing an opinion on whether the Holding Company has an adequate internal financial controls system over financial reporting in place and the operating effectiveness of such controls. An audit also includes evaluating the appropriateness of the accounting policies used and the reasonableness of the accounting estimates made by the Holding Company’s Board of Directors, as well as evaluating the overall presentation of the consolidated financial statements.
We believe that the audit evidence obtained by us and the audit evidence obtained by the other auditors in terms of their reports referred to in sub-paragraph (a) of the Other Matters paragraph below, is sufficient and appropriate to provide a basis for our audit opinion on the consolidated financial statements.

73
OpinionIn our opinion and to the best of our information and according to the explanations given to us, the aforesaid consolidated financial statements give the information required by the Act in the manner so required and give a true and fair view in conformity with the accounting principles generally accepted in India, of the consolidated state of affairs of the Group as at 31st March, 2015, and their consolidated profit and their consolidated cash flows for the year ended on that date.
Other Matters(a) We did not audit the financial statements of a subsidiary, whose financial statements reflect total
assets of ` 53,987 lakh as at 31st March, 2015, total revenues of ` 11,449 lakh, total profit after tax (net) of ` 4,642 lakh and net cash flows amounting to ` 950 lakh for the year ended on that date, as considered in the consolidated financial statements. The consolidated financial statements also include the Group’s share of net profit of ` 112 lakh for the year ended 31st March, 2015, as considered in the consolidated financial statements, in respect of an associate, whose financial statements have not been audited by us. These financial statements have been audited by other auditors whose reports have been furnished to us by the Management and our opinion on the consolidated financial statements, in so far as it relates to the amounts and disclosures included in respect of this subsidiary and associate, and our report in terms of sub-sections (3) and (11) of Section 143 of the Act, in so far as it relates to the aforesaid subsidiary and associate, is based solely on the reports of the other auditors.
(b) We did not audit the financial statements of a joint venture, whose financial statements did not reflect any asset as at 31st March, 2015, any revenue, any profit or loss after tax (net) and any net cash flows for the year ended on that date, as considered in the consolidated financial statements. The consolidated financial statements also include the Group’s share of profit of ` 593 lakh for the year ended 31st March, 2015, as considered in the consolidated financial statements, in respect of an associate, whose financial statement have not been audited by us. These financial statements are unaudited and have been furnished to us by the Management and our opinion on the consolidated financial statements, in so far as it relates to the amounts and disclosures included in respect of this joint venture and associate, and our report in terms of sub-sections (3) and (11) of Section 143 of the Act in so far as it relates to the joint venture and associate, is based solely on such unaudited financial statements. In our opinion and according to the information and explanations given to us by the Management, these financial statements are not material to the Group.
Our opinion on the consolidated financial statements, and our report on Other Legal and Regulatory Requirements below, is not modified in respect of the above matters with respect to our reliance on the work done and the reports of the other auditors and the financial statements certified by the Management.
Report on Other Legal and Regulatory Requirements1. As required by the Companies (Auditor’s Report) Order, 2015 (the “Order”), issued by the Central
Government of India in terms of sub-section (11) of Section 143 of the Act, we give in the Annexure a statement on the matters specified in paragraphs 3 and 4 of the Order, to the extent applicable.
2. As required by Section 143(3) of the Act, we report, to the extent applicable, that: (a) We have sought and obtained all the information and explanations which to the best of
our knowledge and belief were necessary for the purposes of our audit of the aforesaid consolidated financial statements.
(b) In our opinion, proper books of account as required by law relating to preparation of the aforesaid consolidated financial statements have been kept so far as it appears from our examination of those books and the reports of the other auditors.
(c) The Consolidated Balance Sheet, the Consolidated Statement of Profit and Loss, and the Consolidated Cash Flow Statement dealt with by this Report are in agreement with the relevant books of account.

74
Annual Report 2014-15
(d) In our opinion, the aforesaid consolidated financial statements comply with the Accounting Standards specified under Section 133 of the Act, read with Rule 7 of the Companies (Accounts) Rules, 2014.
(e) On the basis of the written representations received from the directors of the Holding Company as on 31st March, 2015 taken on record by the Board of Directors of the Holding Company and the reports of the statutory auditors of its subsidiary companies incorporated in India, none of the directors of the Group’s companies incorporated in India is disqualified as on 31st March, 2015 from being appointed as a director in terms of Section 164 (2) of the Act.
(f) With respect to the other matters to be included in the Auditor’s Report in accordance with Rule 11 of the Companies (Audit and Auditor’s) Rules, 2014, in our opinion and to the best of our information and according to the explanations given to us:
i. The consolidated financial statements disclose the impact of pending litigations on the consolidated financial position of the Group – Refer Note 31 to the consolidated financial statements.
ii. The Group has made provisions, as required under the applicable law or accounting standards, for material foreseeable losses on long term contracts. The Group does not have any outstanding derivative contracts as at the year end
iii. As at the year end, there were no amounts that were required to be transferred, to the Investor Education and Protection Fund by the Holding Company, and its subsidiaries incorporated in India.
For DELOITTE HASKINS & SELLS LLP Chartered Accountants
(Firm’s Registration No. 117366W/W-100018)
Sanjiv V. Pilgaonkar Mumbai, Partner May 8, 2015 (Membership No. 39826)

75
ANNEXURE TO THE INDEPENDENT AUDITOR’S REPORT ON THE CONSOLIDATED FINANCIAL STATEMENTS
(Referred to in paragraph 1 under ‘Report on Other Legal and Regulatory Requirements’ section of our report of even date)
1. Our reporting on the Order includes an associate company incorporated in India, to which the Order is applicable, which has been audited by other auditors and our report in respect of these entities is based solely on the report of the other auditors, to the extent considered applicable for reporting under the Order in the case of the consolidated financial statements.
In respect of a jointly controlled company and an associate company incorporated in India, which have been included in the consolidated financial statements based on unaudited financial statements / financial information of such entities provided to us by the Management, whilst in our opinion, and according to the information and explanations given to us, reporting under the Order is applicable in respect of these entities, since these entities are unaudited, the possible effects of the same on our reporting under the Order in the case of these consolidated financial statements has not been considered.
The Holding Company and subsidiary companies audited by us and the associate company audited by other auditors whose report, to the extent considered applicable for reporting under the Order, has been furnished to us have hereinafter been refered to as the “Audited Components”.
2. In respect of the fixed assets of the Audited Components:
a. The respective entities have maintained proper records showing full particulars, including quantitative details and situation of fixed assets.
b. The Audited Components have a program of verification of fixed assets to cover all the items in a phased manner over a period of three year which, in our opinion and the opinion of the other auditors, is reasonable having regard to the size of the respective entities and the nature of their assets. Pursuant to the program, certain fixed assets were physically verified by the Management of the respective entities during the year. According to the information and explanations given to us and the other auditors, no material discrepancies were noticed on such verification.
3. In our opinion and in the opinion of the other auditors and according to the information and explanations given to us and the other auditors, the nature of the Audited Components’ business is such that it is not required to hold any inventories. Therefore, the provisions of paragraph 3(ii) of the Order are not applicable to the Audited Components.
4. The Audited Components have not granted any loans, secured or unsecured, to companies, firms or other parties covered in the Register maintained under Section 189 of the Companies Act, 2013 by the respective entities.
5. In our opinion and in the opinion of the other auditors and according to the information and explanations given to us and the other auditors, there is an adequate internal control system in the Audited Components, commensurate with the size of the respective entities and the nature of their business for the purchase of fixed assets and for the sale of services. The nature of the Audited Components’ business is such that it does not involve purchase of inventories and sale of goods. During the course of our and the other auditors audit, no major weakness in such internal control system has been observed.
6. According to the information and explanations given to us and the other auditors, the Audited Components have not accepted any deposit during the year and there were no unclaimed deposits as at March 31, 2015.

76
Annual Report 2014-15
7. According to the information and explanations given to us and the other auditors, in our opinion and in the opinion of the other auditors, the provisions of clause (3)(vi) of the Order are not applicable to the Audited Components as the Audited Components are not engaged in the production of goods or in providing services covered by the Companies (Cost Records and Audit) Rules, 2014.
8. According to the information and explanations given to us and the other auditors, in respect of statutory dues of the Audited Components:
(a) The respective entities have generally been regular in depositing undisputed statutory dues, including Provident Fund, Employees’ State Insurance, Income-tax, Sales Tax, Wealth Tax, Service Tax, Customs Duty, Excise Duty, Value Added Tax, Cess and other material statutory dues applicable to the respective entities with the appropriate authorities.
(b) There were no undisputed amounts payable by the respective entities in respect of Provident Fund, Employees’ State Insurance, Income-tax, Sales Tax, Wealth Tax, Service Tax, Customs Duty, Excise Duty, Value Added Tax, Cess and other material statutory dues in arrears as at March 31, 2015 for a period of more than six months from the date they became payable.
(c) Details of dues of income tax and value added taxes which have not been deposited as at March 31, 2015 on account of disputes by the aforesaid entities are given below:
Particulars Period to which the amount relates
Forum where the dispute is pending
Amount
(` lakh)
Value added tax Financial years 2008-09 and 2011-12.
Deputy Commissioner31
Financial years 2009-10, 2010-11 and 2011-12
Tribunal42
Financial year 2010-11 Joint Commissioner 31
Financial year 2013-14 Joint Commissioner 1
Financial year 2012-13 Deputy Commissioner 4
Financial year 2014-15 Commercial Tax officer 218
Income tax Assessment year 2008-09 Income Tax Appellate Tribunal 23
There were no dues of sales tax, wealth tax, service tax, duty of customs, duty of excise and cess which have not been deposited as on March 31, 2015 on account of disputes.
(d) There are no amounts that are due to be transferred by the aforesaid entities to the Investor Education and Protection Fund in accordance with the relevant provisions of the Companies Act, 1956 (1 of 1956) and Rules made thereunder.
9. The Group and its associates do not have consolidated accumulated losses at the end of the financial year and have not incurred cash losses on a consolidated basis during the financial year covered by our audit and in the immediately preceding financial year.
10. In our opinion and in the opinion of the other auditors and according to the information and explanations given to us and the other auditors, the Audited Components have not defaulted in the repayment of dues to financial institutions, banks and debenture holders.

77
11. According to the information and explanations given to us and the other auditors, the Group has not given any guarantee in respect loans taken by others from banks and financial institutions.
12. In our opinion and in the opinion of the other auditors and according to the information and explanations given to us and the other auditors, the term loans have been applied by the Audited Components during the year for the purposes for which they were obtained.
13. To the best of our knowledge and according to the information and explanations given to us and the other auditors, no fraud by the Audited Components and no material fraud on the Audited Components has been noticed or reported during the year.
For DELOITTE HASKINS & SELLS LLP Chartered Accountants
(Firm’s Registration No. 117366W/W-100018)
Sanjiv V. Pilgaonkar Mumbai, Partner May 8, 2015 (Membership No. 39826)

78
Annual Report 2014-15
CONSOLIDATED BALANCE SHEET AS AT MARCH 31, 2015(` in lakh)
Particulars Note No.
As at March 31, 2015
As at March 31, 2014
I EQUITY AND LIABILITIES 1. Shareholders' Funds (a) Share Capital 2 366,507 345,480 (b) Reserves and Surplus 3 136,179 115,311
502,686 460,791 2. Share application money pending allotment 41 5,000 604 3. Minority Interest 10,474 4,714 4. Non-current liabilities (a) Long-term borrowings 4 1,517,336 1,160,109 (b) Deferred tax liabilities (net) 5 133 22 (c) Other long-term liabilities 6 24,098 19,464 (d) Long-term provisions 7 7,567 5,835
1,549,134 1,185,430 5. Current liabilities (a) Short-term borrowings 8 962,898 771,417 (b) Trade payables 9 35,864 31,449 (c) Other current liabilities 10 640,186 652,004 (d) Short-term provisions 11 16,182 12,606
1,655,130 1,467,476 Total 3,722,424 3,119,015II ASSETS 1. Non-current assets (a) Fixed assets 12 (i) Tangible assets 63,779 50,455 (ii) Intangible assets 9,628 8,948 (iii) Capital work-in-progress 670 122
74,077 59,525 (b) Goodwill on consolidation 5,515 5,515 (c) Non-current investments 13 209,166 104,214 (d) Deferred tax assets (net) 14 17,415 9,416 (e) Long-term Loans and advances - financing activity 15 1,962,564 1,572,658 (f) Long-term Loans and advances - others 16 14,274 8,371 (g) Other non-current assets 17 7,979 6,169
2,290,990 1,765,868 2. Current assets (a) Current investments 13 1,053 36,442 (b) Trade receivables 18 8,648 9,588 (c) Cash and bank balances 19 28,283 36,174 (d) Short-term Loans and advances - financing activity 15 1,368,427 1,240,503 (e) Short-term Loans and advances - others 20 12,362 9,082 (f) Other current assets 21 12,661 21,358
1,431,434 1,353,147 Total 3,722,424 3,119,015See accompanying notes forming part of the financial statements 1-48
In terms of our report attached For and on behalf of the Board of Directors
For Deloitte Haskins & Sells LLP Ishaat Hussain Janki Ballabh Nalin M. Shah F.N. Subedar Chartered Accountants (Director) (Director) (Director) (Director)
Sanjiv V. Pilgaonkar Nirmalya Kumar Ritu Anand Praveen P. Kadle Partner (Director) (Director) (Managing Director & CEO)Mumbai Puneet Sharma Avan Doomasia Date: May 8, 2015 (Chief Financial Officer) (Company Secretary)

79
CONSOLIDATED STATEMENT OF PROFIT AND LOSS FOR THE YEAR ENDED MARCH 31, 2015(` in lakh)
Particulars Note No.
For the Year Ended
March 31, 2015
For the Year Ended
March 31, 2014I Revenue from operations 22 371,445 325,775
II Investment income 23 13,430 5,970
III Other income 24 35,443 26,152
IV Total Revenue (I + II + III) 420,318 357,897V Expenses: Finance costs 25 248,143 214,814
Employee benefit expenses 26 35,272 30,885
Other operating expenses 27 83,545 70,240
Depreciation and amortisation 12 10,502 6,748
Amortisation of expenses 1,659 1,053
Total expenses 379,121 323,740VI Profit before tax (IV - V) 41,197 34,157VII Tax expense: (1) Current tax 19,998 17,426
(2) Deferred tax (8,841) (3,051)
(3) MAT Credit Entitlement (12) (10)
Total Tax expense 11,145 14,365VIII Profit after tax before share of associates & minority interest (VI-VII)
30,052 19,792
IX Share of profit of associates 611 1,326
X Profit after tax before share of (profit)/loss attributable to minority interest (VIII + IX)
30,663 21,118
XI Share of (profit)/loss of minority interest (110) 307
XII Profit for the year attributable to the shareholders of the Company (X + XI)
30,553 21,425
XIII Earnings per equity shares: (1) Basic (in Rupees) 0.83 0.57 (2) Diluted (in Rupees) 0.81 0.55 Face Value per share (Amount in `) 10.00 10.00See accompanying notes forming part of the financial statements
1-48
In terms of our report attached For and on behalf of the Board of Directors
For Deloitte Haskins & Sells LLP Ishaat Hussain Janki Ballabh Nalin M. Shah F.N. Subedar Chartered Accountants (Director) (Director) (Director) (Director)
Sanjiv V. Pilgaonkar Nirmalya Kumar Ritu Anand Praveen P. Kadle Partner (Director) (Director) (Managing Director & CEO)Mumbai Puneet Sharma Avan Doomasia Date: May 8, 2015 (Chief Financial Officer) (Company Secretary)

80
Annual Report 2014-15
CONSOLIDATED CASH FLOW STATEMENT FOR THE YEAR ENDED MARCH 31, 2015(` in lakh)
Particulars Note No.
For the Year Ended
March 31, 2015
For the Year Ended
March 31, 20141 CASH FLOW USED IN OPERATING ACTIVITIES Profit before tax 41,197 34,157 Adjustments for : Amortisation of share/debenture issue expenses 1,659 1,053 Depreciation and amortisation 10,502 6,748 Loss on sale of fixed assets 2 203 Interest expenses 188,430 169,710 Discounting charges on commercial paper 57,015 41,524 Discounting charges on debentures 950 3,123 Discounting charges on Collateralised Borrowings and Lending
Obligations (CBLO)1,748 457
Interest income (348,976) (307,953) Income from investments (13,430) (5,970) Interest income on fixed deposits (317) (1,313) Loss on sale of investments 1,073 – Unrealised exchange gain (3) – Provision for leave encashment 277 73 (Reversal)/Provision for diminution in value of investments (6,440) 9,649 Contingent provision against standard assets 2,061 1,471 Contingent provision against restructured advances (net) 406 2,769 Provision against assets held for sale 89 – Provision for doubtful loans (net) 40,533 14,575 Operating Profit before working capital changes and
adjustments for interest paid, interest received, dividend received and dividend received from Associates
(23,224) (29,724)
Adjustments for :
(Increase)/Decrease in trade receivables 863 (3,350)
(Increase)/Decrease in loans and advances - financing activity (572,584) (364,267)
(Increase)/Decrease in loans and advances - others 13,346 87,120
Increase/(Decrease) in other liabilities and provisions (5,586) (84,296) Bank balance in client account (207) (1,376) Fixed Deposits with Banks placed under lien with stock
exchanges for trading margins
(125)
140 Cash used in operations before adjustments for interest
paid, interest received, dividend received and dividend received from Associates
(587,517) (395,753)
Interest paid (238,338) (212,080) Interest received 346,806 307,426 Dividend received 1,469 2,366 Dividend received from Associates 966 966 Taxes paid (20,152) (20,529) NET CASH USED IN OPERATING ACTIVITIES (496,766) (317,604)

81
Particulars Note No.
For the Year Ended
March 31, 2015
For the Year Ended
March 31, 20142 CASH FLOW USED IN INVESTING ACTIVITIES Purchase of fixed assets (including capital advances) (34,915) (23,880) Proceeds from sale of fixed assets 2,173 1,044 Purchase of long-term investments (97,538) (48,921) Purchase of current investments – (14,741) Purchase of mutual fund units (4,140,300) (5,653,400) Proceeds from sale of mutual fund units 4,141,413 5,653,949 Proceeds from current investments 14,479 – Proceeds from sale of long-term investments 41,245 15,940 Fixed deposits with banks having maturity over 3 months (622) 9,963
NET CASH USED IN INVESTING ACTIVITIES (74,065) (60,046)3 CASH FLOW FROM FINANCING ACTIVITIES Issue of preference share capital (including securities premium) 20,499 47,926 Share application money (refunded) / received (95) 604 Infusion of capital by minority shareholders 5,777 – Dividend paid (including dividend distribution tax) (5,783) – Interest expense on share application money (33) – Collection of loan given to employees for ESOP 23 110 Purchase of minority interest (127) – Share issue expenses (474) (114) Debenture issue/loan processing expenses (656) (1,487) Net proceeds from short-term borrowings 165,492 60,173 Proceeds from long-term borrowings 1,154,719 901,273 Repayment of long-term borrowings (782,357) (617,616) NET CASH FROM FINANCING ACTIVITIES 556,985 390,869 NET INCREASE/(DECREASE) IN CASH AND CASH EQUIVALENTS (13,845) 13,218 CASH AND CASH EQUIVALENTS AS AT THE BEGINNING OF
THE YEAR31,349 18,131
CASH AND CASH EQUIVALENTS AS AT THE END OF THE YEAR 17,504 31,349 ADD : RESTRICTED CASH (Refer Note No. 19) 5,001 1
CASH AND CASH EQUIVALENTS AS AT THE END OF THE YEAR 22,505 31,350 Reconciliation of cash and cash equivalents as above with
cash and bank balances Cash and Cash equivalents at the end of the year as per above 22,505 31,350 Add: Deposits with banks and stock exchanges under lien 1,688 1,563 Add: Bank balance in client account 1,801 1,594 Add: Fixed deposits with original maturity over 3 months 2,289 1,667 CASH AND CASH EQUIVALENTS AS AT THE END OF THE YEAR 19 28,283 36,174See accompanying notes forming part of the financial statements 1-48
In terms of our report attached For and on behalf of the Board of Directors
For Deloitte Haskins & Sells LLP Ishaat Hussain Janki Ballabh Nalin M. Shah F.N. Subedar Chartered Accountants (Director) (Director) (Director) (Director)
Sanjiv V. Pilgaonkar Nirmalya Kumar Ritu Anand Praveen P. Kadle Partner (Director) (Director) (Managing Director & CEO)Mumbai Puneet Sharma Avan Doomasia Date: May 8, 2015 (Chief Financial Officer) (Company Secretary)
CONSOLIDATED CASH FLOW STATEMENT FOR THE YEAR ENDED MARCH 31, 2015CASH FLOW (contd.......) (` in lakh)

82
Annual Report 2014-15
SIGNIFICANT ACCOUNTING POLICIES AND NOTES TO ACCOUNTS
1 SIGNIFICANT ACCOUNTING POLICIES
i Basis of accounting and preparation of the consolidated financial statements The consolidated financial statements of Tata Capital Limited (the Company) and its
subsidiaries and jointly controlled entities (together the ‘Group’) have been prepared in accordance with the Generally Accepted Accounting Principles in India (Indian GAAP) to comply with the Accounting Standards specified under Section 133 of the Companies Act, 2013 read with Rule 7 of the Companies (Accounts) Rules, 2014 and the relevant provisions of the Companies Act, 2013 (“the Act”), as applicable. The consolidated financial statements have been prepared on accrual basis under the historical cost convention. The accounting policies adopted in the preparation of the consolidated financial statements are consistent with those followed in the previous year.
Current assets do not include elements which are not expected to be realised within one year and current liabilities do not include items which are due after one year.
ii Principles of Consolidation The consolidated financial statements relate to Tata Capital Limited (the ‘Company’), its
subsidiary companies, jointly controlled entities and the Group’s share of profit / loss in its associates. The consolidated financial statements have been prepared on the following basis:
a) The financial statements of the subsidiary companies, jointly controlled entities and associates used in the consolidation are drawn upto the same reporting date as that of the Company i.e., March 31, 2015, except for certain jointly controlled entities/ associates for which financial statements as on the reporting date are not available. These have been consolidated based on their latest available financial statements. Necessary adjustments have been made for the effects of significant transactions and other events between the reporting dates of such financial statements and the consolidated financial statements.
b) The financial statements of the Company and its subsidiary companies have been combined on a line-by-line basis by adding together like items of assets, liabilities, income and expenses, after eliminating intra-group balances, intra-group transactions and resulting unrealised profits or losses, unless cost cannot be recovered.
c) The consolidated financial statements include the share of profit/ (loss) of associate companies, which have been accounted for using the equity method as per AS 23 (Accounting for Investments in Associates in Consolidated Financial Statements). Accordingly, the share of profit/ (loss) of the associate companies (the loss being restricted to the cost of the investment) have been added/deducted to the costs of investments.
d) Share of profit / loss, assets and liabilities in the jointly controlled entities, which are not subsidiaries, have been consolidated on a line-by-line basis by adding together the book values of like items of assets, liabilities, incomes and expenses on a proportionate basis to the extent of the Group’s equity interest in such entity as per AS 27 (Financial Reporting of Interests in Joint Ventures). The intra-group balances, intra-group transactions and unrealised profits or losses have been eliminated to the extent of the Group’s share in the entity. Jointly controlled entities that are considered subsidiaries under AS 21 (Consolidated Financial Statements) are consolidated similar to the manner of consolidating subsidiaries (Refer (b) above) and the share of interest of the other venturers in such entities is included as part of minority interest.
e) The excess of cost to the Group of its investments in the subsidiary companies / jointly controlled entities over its share of equity of the subsidiary companies / jointly controlled entities, at the dates on which the investments in the subsidiary companies / jointly

83
controlled entities were made, is recognised as “Goodwill on Consolidation” and is tested for impairment on annual basis. On the other hand, where the share of equity in the subsidiary companies / jointly controlled entities as on the date of investment is in excess of cost of investments of the Group, it is recognised as ‘Capital Reserve’ and shown under the head ‘Reserves & Surplus’ in the consolidated financial statements.
f) In case of a foreign subsidiary, being a non-integral operation, revenue items are consolidated at the average rate prevailing during the year. All assets and liabilities are converted at the rates prevailing at the end of the year. Any exchange difference arising on consolidation is recognised in the “Foreign Currency Translation Reserve”.
g) The difference between the cost of investment in the associate and the share of net assets at the time of acquisition of shares in the associate is identified in the consolidated financial statements as Goodwill or Capital Reserve as the case may be and adjusted against the carrying amount of investment in the associate.
h) Minority Interest in the net assets of the subsidiaries consist of the amount of equity attributable to the minority shareholders at the date on which investments in the subsidiary companies were made and further movements in their share in the equity, subsequent to the dates of investments. Net profit / loss for the year of the subsidiaries attributable to minority interest is identified and adjusted against the profit after tax of the Group in order to arrive at the profit attributable to shareholders of the Company.
iii. Use of Estimates The preparation of the consolidated financial statements in confirmity with Indian GAAP
requires the Management of the Group to make estimates and assumptions that affect the reported balances of assets and liabilities, revenues and expenses and disclosures relating to contingent liabilities. The Management believes that the estimates used in preparation of the financials statements are prudent and reasonable. Future results could differ from these estimates. Any revision to accounting estimates is recognised prospectively in the current and future periods. Estimates include provisions for doubtful debts and advances, employee benefit plans, provision for income taxes and provision for diminution in the value of investments.
iv Revenue recognition
a) Income on Loan transactions Income on loan transactions is accounted for by using the internal rate of return method.
Consequently, a constant rate of return on net outstanding amount is accrued over the period of the contract, except that no income is recognised on non-performing assets as per the prudential norms for income recognition issued by the RBI/NHB for NBFCs/HFC’s and Accounting Standard 9 (Revenue Recognition). Interest income on such assets is recognised on receipt basis.
In respect of non-performing assets acquired from other NBFCs / Companies, aggregate collections in excess of the consideration paid on acquisition of the portfolio of assets is treated as income.
Upfront / processing fees collected from the customer for processing loans are primarily towards documentation charges. These are accounted as income when the amounts become due provided recovery thereof is not uncertain.
Dealer subvention income and service charges are collected at the time of inception of the contract. These are accounted over the tenure of the loans in the proportion of interest earned to total interest receivable during the tenure of loans.
Income from sale/assignment of loan assets is recognised at the time of sale.
Repayment of housing loans is generally by way of Equated Monthly Instalments (EMIs) comprising principal and interest. EMIs commences once the entire loan is disbursed.

84
Annual Report 2014-15
Pending commencement of EMIs, pre-EMI interest is payable every month. Interest on loans is computed on a monthly rest basis.
b) Income from Current and Long-term Investments Income from dividend on shares of corporate bodies and units of mutual funds is
accounted when the Group’s right to receive dividend is established. Interest income on bonds and debentures is recognised on time proportion basis taking into account the amount outstanding and the rate applicable.
Premium / Discount on investments, which is the difference between the acquisition cost and face value of debt instrument is recognised as interest income over the tenor of the instruments.
Redemption premium on investments (except on preference shares ) is recognised as income over the tenor of the investment.
c) Income from Services Fees for financial advisory services are accounted based on stage of completion of
assignments, when there is reasonable certainty of its ultimate realisation.
Income from property management is recognised on a straight line basis to the extent that rental income is deemed collectible.
Revenue from underwriting commission is recognised on fulfillment of obligation under underwriting arrangements.
d) Income from distribution of financial products Revenue from brokerage is recognised when the service is performed. Trail brokerage is
recognised at the end of the measurement period when the pre-defined thresholds are met. Revenue is net of taxes and sub-brokerage.
Sourcing income is recognised on an accrual basis when there is a reasonable certainty of its ultimate realisation.
e) Income from Travel related services Income from services is net of service tax. Revenue is recognised upon rendering the
service, the price being determined and collection of the receivable is reasonably certain.
v. Provisions for Standard/Non Performing Assets and Doubtful Debts The Group provides an allowance for loan receivables and debentures/bonds in the nature
of advance based on the prudential norms issued by the Reserve Bank of India (“RBI”) relating to income recognition, asset classification and provisioning for non-performing assets except for construction equipment, auto and personal loan portfolio where in addition to the provisioning as per the RBI norms, the Group also provides for the entire receivables, where any of the instalments is overdue for a period exceeding 11 months. Provision is calculated after considering the net realisable value of repossessed stock.
In case of housing loans, the Group provides an allowance for loan receivables based on prudential norms issued by the National Housing Bank (“NHB”) relating to income recognition, asset classification and provisioning for non-performing assets. The provision on Standard and Non-Performing Loans is made as per the prudential norms prescribed in the Housing Finance Companies (NHB) Directions, 2010 as amended. Additional provisions (over and above the prudential norms), if required, is made as per the Guidelines approved by the Board of Directors from time to time.
In addition, the Group provides for Restructured Assets (including Standard Assets) as required by the directions issued by the RBI.

85
vi. Investments Investments are classified into long-term investments and current investments.
a. Long-term investments Long-term investments are stated at cost. Provision for diminution is made to recognise a
diminution, other than temporary, in the carrying value of such investments.
b. Current investments Current investments are stated at the lower of cost and market value, determined on an
individual investment basis.
vii. Fixed Assets
a. Tangible: Fixed assets are stated at cost of acquisition including any cost attributable for bringing
asset to its working condition, which comprises of purchase consideration and other directly attributable costs of bringing the assets to their working condition for their intended use less accumulated depreciation.
Foreign exchange differences arising on reporting of long-term foreign currency monetary items at rates different from those at which they were initially recorded during the period, or reported in previous financial statements, in so far as they relate to the acquisition of a depreciable capital asset, have been added to or deducted from the cost of the asset and are depreciated over the balance life of the asset.
The Group has adopted the provisions of para 46 / 46A of AS 11 (The Effects of Changes in Foreign Exchange Rates), accordingly, exchange differences arising on restatement / settlement of long-term foreign currency borrowings relating to acquisition of depreciable fixed assets are adjusted to the cost of the respective assets and depreciated over the remaining useful life of such assets.
b. Intangible: Acquired intangible assets other than goodwill are measured at cost less amortisation.
Goodwill is stated at cost. Goodwill comprises the portion of a purchase price for an acquisition that exceeds the market value of the identifiable assets, with deductions for liabilities, calculated on the date of acquisition.
Expenses on software support and maintenance are charged to the Statement of Profit and Loss during the year in which such costs are incurred.
c. Capital work -in- progress : Projects under which tangible fixed assets are not yet ready for their intended use are
carried at cost, comprising direct costs, related incidental expenses and attributable interest.
viii. Depreciation and Amortisation Depreciable amount for assets is the cost of an asset, or other amount substituted for cost,
less its estimated residual value.
Depreciation on tangible fixed assets has been provided on the straight-line method as per the useful life prescribed in Schedule II to the Companies Act, 2013 except in respect of Building, Computer Equipment and Vehicles, in whose case the life of the assets has been assessed based on the nature of the asset, the estimated usage of the asset, the operating conditions of the asset, past history of replacement, etc.
Purchased software licenses and capitalised implementation costs are amortised over the period the benefits are expected to accrue, while Goodwill is tested for impairment at each
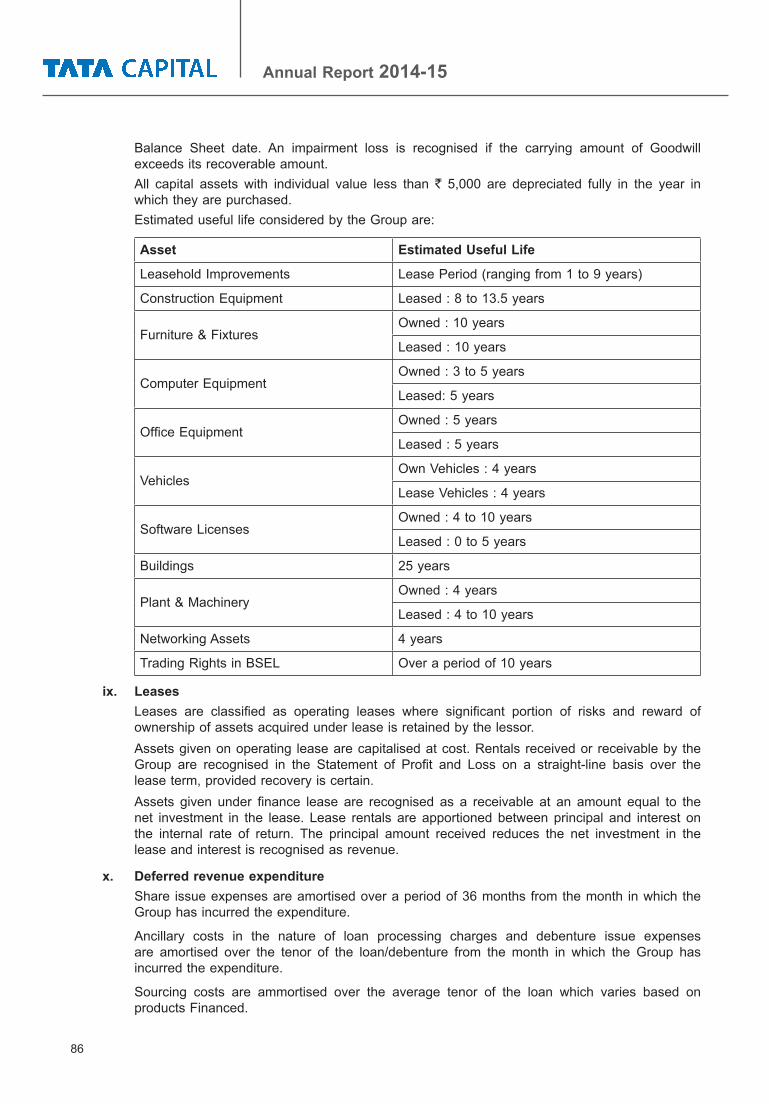
86
Annual Report 2014-15
Balance Sheet date. An impairment loss is recognised if the carrying amount of Goodwill exceeds its recoverable amount.
All capital assets with individual value less than ` 5,000 are depreciated fully in the year in which they are purchased.
Estimated useful life considered by the Group are:
Asset Estimated Useful Life
Leasehold Improvements Lease Period (ranging from 1 to 9 years)
Construction Equipment Leased : 8 to 13.5 years
Furniture & FixturesOwned : 10 years
Leased : 10 years
Computer EquipmentOwned : 3 to 5 years
Leased: 5 years
Office EquipmentOwned : 5 years
Leased : 5 years
VehiclesOwn Vehicles : 4 years
Lease Vehicles : 4 years
Software LicensesOwned : 4 to 10 years
Leased : 0 to 5 years
Buildings 25 years
Plant & MachineryOwned : 4 years
Leased : 4 to 10 years
Networking Assets 4 years
Trading Rights in BSEL Over a period of 10 years
ix. Leases Leases are classified as operating leases where significant portion of risks and reward of
ownership of assets acquired under lease is retained by the lessor. Assets given on operating lease are capitalised at cost. Rentals received or receivable by the
Group are recognised in the Statement of Profit and Loss on a straight-line basis over the lease term, provided recovery is certain.
Assets given under finance lease are recognised as a receivable at an amount equal to the net investment in the lease. Lease rentals are apportioned between principal and interest on the internal rate of return. The principal amount received reduces the net investment in the lease and interest is recognised as revenue.
x. Deferred revenue expenditure Share issue expenses are amortised over a period of 36 months from the month in which the
Group has incurred the expenditure.
Ancillary costs in the nature of loan processing charges and debenture issue expenses are amortised over the tenor of the loan/debenture from the month in which the Group has incurred the expenditure.
Sourcing costs are ammortised over the average tenor of the loan which varies based on products Financed.

87
xi. Employee Benefits Employee benefits include provident fund, superannuation fund, employee state insurance
scheme, gratuity fund, compensated absences and long term service awards.
(a) Defined contribution plans The eligible employees of the Group are entitled to receive benefits under the provident
fund, a defined contribution plan, in which both employees and the Group make monthly contributions at a specified percentage of the covered employees’ salary (currently 12% of employees’ salary), which is recognised as an expense in the Statement of Profit and Loss during the year. The contributions as specified under the law are paid to the provident fund set up as irrevocable trust by the Group. The Group is generally liable for annual contributions and any shortfall in the fund assets based on the government specified minimum rates of return and recognises such contributions and shortfall, if any, as an expense in the year incurred.
The Group’s contribution to superannuation fund is considered as defined contribution plans and are charged as an expense based on the amount of contribution required to be made as and when services are rendered by the employees.
(b) Defined benefit plans For defined benefit plans in the form of gratuity fund the cost of providing benefits is
determined using the Projected Unit Credit method, with actuarial valuations being carried out at each Balance Sheet date. Actuarial gains and losses are recognised in the Statement of Profit and Loss in the year in which they occur. Past service cost is recognised immediately to the extent that the benefits are already vested and otherwise is amortised on a straight-line basis over the average period until the benefits become vested. The retirement benefit obligation recognised in the Balance Sheet represents the present value of the defined benefit obligation as adjusted for unrecognised past service cost, as reduced by the fair value of scheme assets. Any asset resulting from this calculation is limited to past service cost, plus the present value of available refunds and reductions in future contributions to the schemes.
(c) Short-term employee benefits The undiscounted amount of short-term employee benefits expected to be paid in
exchange for the services rendered by employees is recognised during the year when the employees render the service. These benefits include performance incentive and compensated absences which are expected to occur within twelve months after the end of the year in which the employees render the related service.
The cost of short-term compensated absences is accounted as under :(a) in case of accumulated compensated absences, when employees render the
services that increase their entitlement of future compensated absences; and(b) in case of non-accumulating compensated absences, when the absences occur.
(d) Long-term employee benefits Compensated absences which are not expected to occur within twelve months after the
end of the year in which the employees render the related service are recognised as a liability at the present value of the defined benefit obligation as at the Balance Sheet date less the fair value of the plan assets out of which the obligations are expected to be settled. Long-term service awards are recognised as a liability at the present value of the defined benefit obligation as at the Balance Sheet date.
xii. Employees Share Purchase / Option Scheme As per the Guidance Note on Accounting for Employee Share-based Payments issued by
The Institute of Chartered Accountants of India, the Company has adopted the intrinsic value method in accounting of the Employee Stock Purchase Scheme offered by the Company.
88
Annual Report 2014-15
xiii Share Based Payment Transactions The grant date intrinsic value of share based payment options under the Employees’ Share
Purchase Scheme (“ESPS”) granted to employees, determined as the fair value of underlying shares, less the amount which the employee is required to pay at the time of exercise of the option (the exercise price), is recognised as an employee cost with a corresponding increase in equity in the period of the grant as the options granted under Company’s ESPS plan vest immediately and it is presumed that consideration for the options have been received.
As the Group has adopted the intrinsic value for accounting the share based payments, there are no adjustments made to the amounts recognised as an expense for differences between the expected and actual outcomes.
On exercise of the stock option, the amount standing to the credit of the relevant equity account is treated as part of the consideration for the shares issued. Where stock options expires unexercised the balance to the credit of the relevant equity account is transferred to the general ledger.
xiv. Provisions, Contingent Liabilities and Contingent Assets A provision is recognised when the Group has a present obligation as a result of past event
and it is probable that an outflow of resources will be required to settle the obligation, in respect of which reliable estimate can be made. Provisions (excluding retirement benefits) are not discounted to their present value and are determined based on best estimate required to settle the obligation at the Balance Sheet date. These are reviewed at each Balance Sheet date and adjusted to reflect the current best estimates. Contingent liabilities are not recognised but disclosed in the financial statements. A contingent asset is neither recognised nor disclosed in the financial statements.
xv. Impairment of Assets At each Balance Sheet date, the Group reviews the carrying amount of its assets to
determine, whether there is any indication of impairment of those assets. If any such condition exists, the recoverable amount of the asset is estimated in order to determine the extent of impairment loss (if any).
Recoverable amount of the asset is the higher of an asset’s net selling price and value in use. In assessing the value in use, the estimated future cash flow expected from continuing use of the asset and from its disposal is discounted to their present value using a pre-tax discount rate that reflects the current market assessments of time value of money and the risk specific to the asset.
If the recoverable amount of an asset is estimated to be less than the carrying amount, the carrying amount of the asset is reduced to its recoverable amount. An impairment loss is recognised immediately in the Statement of Profit and Loss.
After impairment, depreciation is provided on the revised carrying amount of the assets over their remaining useful life. A previously recognised impairment loss is increased or reversed depending on changes in circumstances. However, the carrying value after reversal is not increased above the lower of recoverable amount and the carrying value that would have prevailed by charging usual depreciation if there was no impairment.
xvi. Foreign currency transactions and translations
Accounting of forward contracts: Premium / discount on forward exchange contracts, which are not intended for trading or
speculation purposes, are amortised over the period of the contracts if such contracts relate to monetary items as at the Balance Sheet date.
89
Initial recognition Transactions in foreign currencies entered into by the Group are accounted at the exchange
rates prevailing on the date of the transaction or at rates that closely approximate the rate on the date of the transaction.
Measurement at the Balance Sheet date(a) Foreign currency monetary items (other than derivative contracts) of the Group,
outstanding as at the Balance Sheet date are restated at the year-end rates. Non-monetary items of the Group are carried at historical cost.
(b) Foreign currency monetary assets and liabilities other than net investments in non-integral foreign operations are translated at the exchange rate prevailing on the Balance Sheet date and the exchange gains or losses are recognised in the Statement of Profit and Loss. Exchange difference arising on a monetary item that, in substance, forms part of an enterprise’s net investments in a non-integral foreign operation are accumulated in a foreign currency translation reserve.
(c) The exchange differences arising on settlement / restatement of long-term foreign currency monetary items are capitalised as part of the depreciable fixed assets to which the monetary item relates and depreciated over the remaining useful life of such asset.
(d) For the purpose of consolidation, income and expenses are translated at average rates and the assets and liabilities are stated at closing rate. The net impact of such change is accumulated in ‘Foreign Currency Translation Reserve Account’.
xvii. Derivative Contracts The Group enters into derivative contracts in the nature of forward contracts with an intention
to hedge its existing assets and liabilities. Derivative contracts which are closely linked to the existing assets and liabilities are accounted as per the policy stated for foreign currency transactions and translations. All other derivative contracts are mark-to-market and losses are recognised in the Statement of Profit and Loss. Gains arising on the same are not recognised, until realised, on grounds of prudence.
xviii. Taxation Current tax is the amount of tax payable on the taxable income for the year as determined in
accordance with the applicable tax rates and the provision of the Income Tax Act, 1961 and the other applicable tax laws.
Deferred tax corresponds to the net effect of tax on all timing differences,which occur as a result of items being allowed for income tax purposes during a year different from when they were recognised in the financial statements.
Deferred tax is recognised on the timing differences, being the differences between the taxable income and the accounting income that originate in one period and are capable of reversal in one or more subsequent periods. Deferred tax is measured using the tax rates and the tax laws enacted or substantively enacted as at the reporting date. Deferred tax liabilities are recognised for all timing differences. Deferred tax assets are recognised for timing differences of items other than unabsorbed depreciation and carry forward losses only to the extent that reasonable certainty exists that sufficient future taxable income will be available against which these can be realised. However, if there are unabsorbed depreciation and carry forward losses and items relating to capital losses, deferred tax assets are recognised only if there is virtual certainty supported by convincing evidence that there will be sufficient future taxable income available to realise assets. Deferred tax assets and liabilities are offset if such items relate to taxes on income levied by the same governing tax laws and the company has a legally enforceable right for such set off. Deferred tax assets are reviewed at each Balance Sheet date for their realisability.
Current and deferred tax relating to items directly recognised in reserves are recognised in

90
Annual Report 2014-15
reserves and not in the Statement of Profit & Loss.
xix. Business segment The Group’s reportable segments consist of Financing, Investments and Others. Financing
consists of asset financing, housing finance, term loans (corporate and retail), channel financing and bill discounting. Investments consist of corporate investments and treasury activities. Others primarily include advisory services, wealth management, travel and tourist related services, broking services and distribution of financial products.
Revenue and expense directly attributable to segments are reported under each reportable segment. Expenses not directly identifiable to each of the segments have been allocated to each segment on the basis of associated revenues of each segment. All other expenses which are not attributable or allocable to segments have been disclosed as unallocable expenses.
Assets and liabilities that are directly attributable to segments are disclosed under each reportable segment. All other assets and liabilities are disclosed as unallocable.
xx. Cash Flow Statement Cash flows are reported using the indirect method, whereby profit before extraordinary items
and tax is adjusted for the effects of transactions of non-cash nature and any deferrals or accruals of past or future cash receipts or payments. The cash flows from operating, investing and financing activities of the Group are segregated based on the available information.
xxi. Earnings Per Share Basic earnings per share is computed by dividing the profit / (loss) after tax (including the post
tax effect of extraordinary items, if any) by the weighted average number of equity shares outstanding during the year. Diluted earnings per share is computed by dividing the profit/ (loss) after tax (including the post tax effect of extraordinary items, if any) as adjusted for dividend, interest and other charges to expense or income (net of any attributable taxes) relating to the dilutive potential equity shares, by the weighted average number of equity shares considered for deriving basic earnings per share and the weighted average number of equity shares which could have been issued on the conversion of all dilutive potential equity shares. Potential equity shares are deemed to be dilutive only if their conversion to equity shares would decrease the net profit per share from continuing ordinary operations. Potential dilutive equity shares are deemed to be converted as at the beginning of the year, unless they have been issued at a later date. The dilutive potential equity shares are adjusted for the proceeds receivable had the shares been actually issued at fair value (i.e. average market value of the outstanding shares). Dilutive potential equity shares are determined independently for each period presented. The number of equity shares and potentially dilutive equity shares are adjusted for share splits / reverse share splits and bonus shares, as appropriate.

91
NOTE “2” (` in lakh)
SHARE CAPITALAs at
March 31, 2015
As at March 31,
2014
AUTHORISED
4,750,000,000 (as at March 31, 2014: 4,750,000,000 shares) Equity shares of ` 10 each
475,000 475,000
32,500,000 (as at March 31, 2014: 32,500,000 shares) Preference shares of ` 1,000 each
325,000 325,000
ISSUED
2,826,092,570 (as at March 31, 2014: 2,826,092,570 shares) Equity shares of ` 10 each
282,609 282,609
12,121,215 (as at March 31, 2014: 7,570,424 shares) Preference shares of ` 1,000 each
121,212 75,704
SUBSCRIBED
2,826,018,170 (as at March 31, 2014: 2,826,018,170 shares) Equity shares of ` 10 each
282,602 282,602
8,964,467 (as at March 31, 2014: 6,863,676 shares) Preference shares of ` 1,000 each
89,645 68,637
PAID UP
2,826,018,170 (as at March 31, 2014: 2,826,018,170 shares) Equity shares of ` 10 each fully paid up
282,602 282,602
Less: Loan given to TCL Employees Welfare Trust (5,695) (5,695)
Less: Loans to Employees (45) (64)
8,964,467 (as at March 31, 2014: 6,863,676 shares) Preference shares of ` 1,000 each fully paid up
89,645 68,637
Total 366,507 345,480
NOTES TO AND FORMING PART OF THE CONSOLIDATED BALANCE SHEET AS AT MARCH 31, 2015

92
Annual Report 2014-15
NOTE “2” (contd.......)
2 (a) Reconciliation of number of shares outstanding No. of shares ` in Lakh
Opening Share Capital as on April 1, 2013
Equity Shares Face Value ` 10 fully paid up 2,826,018,170 282,602
Cumulative Redeemable Preference Shares Face Value ` 1000 fully paid up
2,071,066 20,711
Additions during the year
Equity Share Capital – –
Preference Capital
- Privately placed 4,792,610 47,926
Closing Share Capital as on March 31, 2014
Equity Shares Face Value ` 10 fully paid up 2,826,018,170 282,602
Cumulative Redeemable Preference Shares Face Value ` 1000 fully paid up
6,863,676 68,637
Additions during the year
Equity Share Capital – –
Preference Capital
- Privately placed 2,100,791 21,008
Closing Share Capital as on March 31, 2015
Equity Shares Face Value ` 10 fully paid up 2,826,018,170 282,602
Cumulative Redeemable Preference Shares Face Value ` 1000 fully paid up
8,964,467 89,645
2 (b) Rights, preferences and restrictions attached to Equity Shares The Company has one class of equity shares having a par value of ` 10 per share. Each
shareholder is eligible for one vote per share held. The dividend proposed by the Board of Directors is subject to the approval of the shareholders at the ensuing Annual General Meeting, except in case of interim dividend. In the event of liquidation, the equity shareholders are eligible to receive the remaining assets of the Company after distribution of all preferential amounts, in proportion to their shareholding.
NOTES TO AND FORMING PART OF THE CONSOLIDATED BALANCE SHEET AS AT MARCH 31, 2015
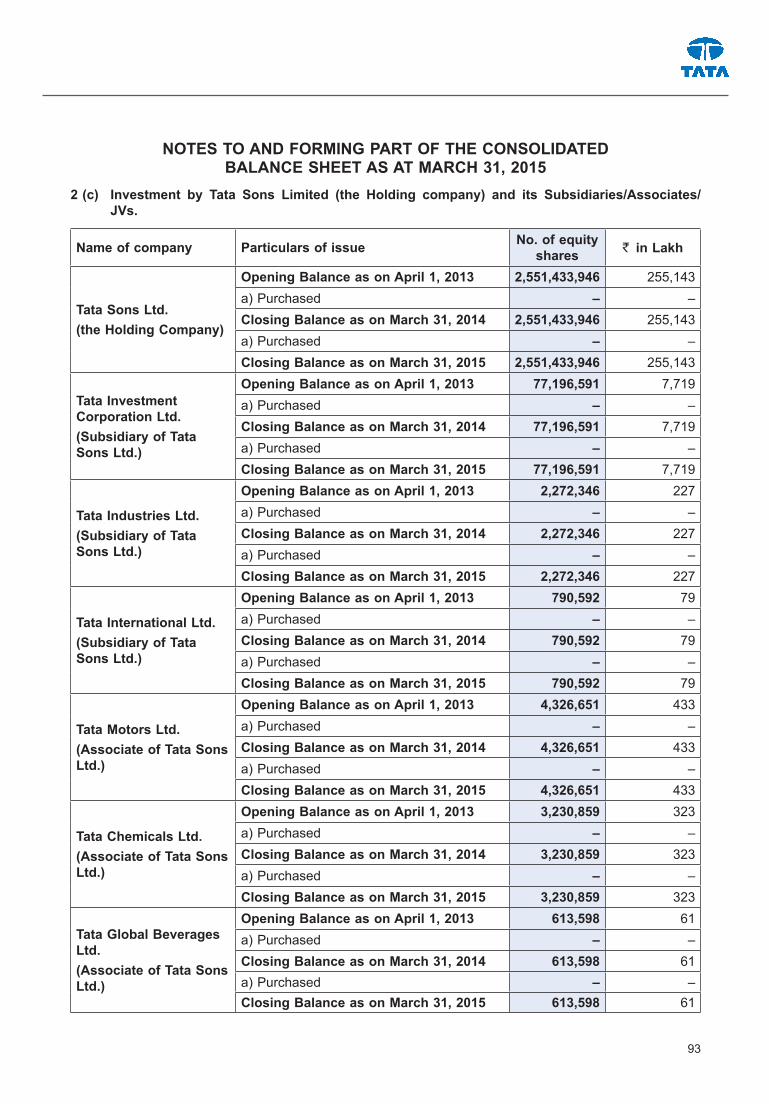
93
NOTES TO AND FORMING PART OF THE CONSOLIDATED BALANCE SHEET AS AT MARCH 31, 2015
2 (c) Investment by Tata Sons Limited (the Holding company) and its Subsidiaries/Associates/JVs.
Name of company Particulars of issue No. of equity shares ` in Lakh
Tata Sons Ltd.(the Holding Company)
Opening Balance as on April 1, 2013 2,551,433,946 255,143a) Purchased – –Closing Balance as on March 31, 2014 2,551,433,946 255,143a) Purchased – –Closing Balance as on March 31, 2015 2,551,433,946 255,143
Tata Investment Corporation Ltd. (Subsidiary of Tata Sons Ltd.)
Opening Balance as on April 1, 2013 77,196,591 7,719a) Purchased – –Closing Balance as on March 31, 2014 77,196,591 7,719a) Purchased – –Closing Balance as on March 31, 2015 77,196,591 7,719
Tata Industries Ltd.(Subsidiary of Tata Sons Ltd.)
Opening Balance as on April 1, 2013 2,272,346 227a) Purchased – –Closing Balance as on March 31, 2014 2,272,346 227a) Purchased – –Closing Balance as on March 31, 2015 2,272,346 227
Tata International Ltd. (Subsidiary of Tata Sons Ltd.)
Opening Balance as on April 1, 2013 790,592 79a) Purchased – –Closing Balance as on March 31, 2014 790,592 79a) Purchased – –Closing Balance as on March 31, 2015 790,592 79
Tata Motors Ltd. (Associate of Tata Sons Ltd.)
Opening Balance as on April 1, 2013 4,326,651 433a) Purchased – –Closing Balance as on March 31, 2014 4,326,651 433a) Purchased – –Closing Balance as on March 31, 2015 4,326,651 433
Tata Chemicals Ltd.(Associate of Tata Sons Ltd.)
Opening Balance as on April 1, 2013 3,230,859 323a) Purchased – –Closing Balance as on March 31, 2014 3,230,859 323a) Purchased – –Closing Balance as on March 31, 2015 3,230,859 323
Tata Global Beverages Ltd. (Associate of Tata Sons Ltd.)
Opening Balance as on April 1, 2013 613,598 61a) Purchased – –Closing Balance as on March 31, 2014 613,598 61a) Purchased – –Closing Balance as on March 31, 2015 613,598 61
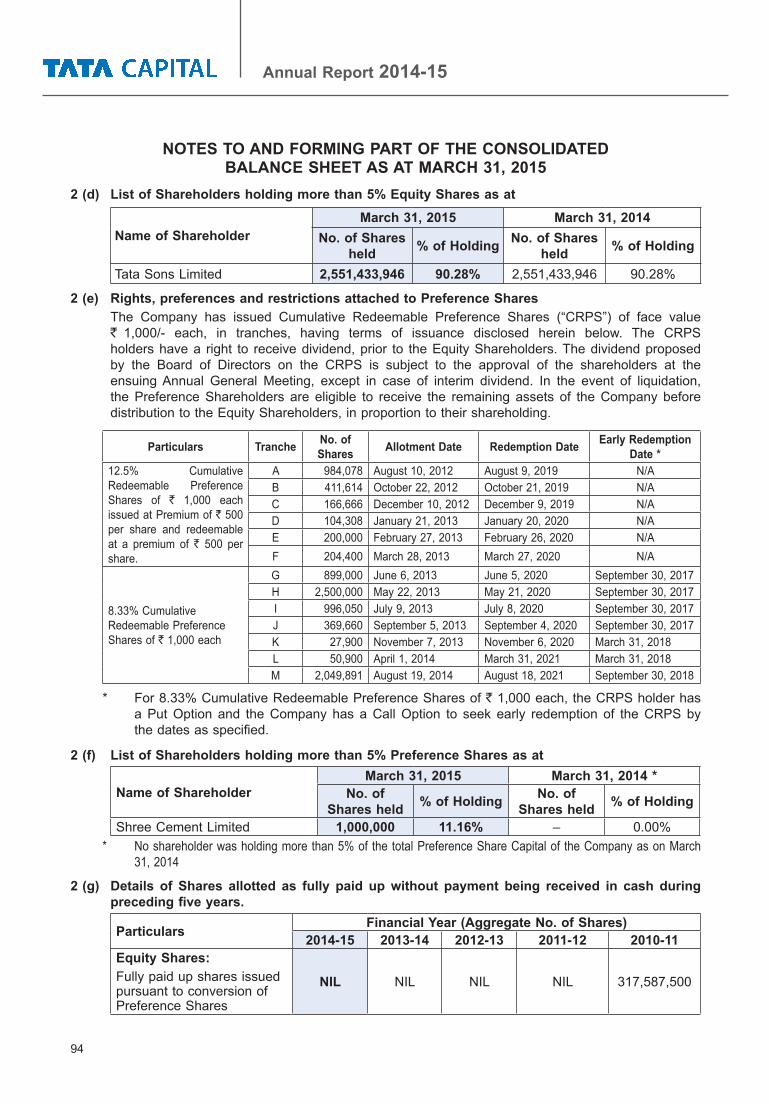
94
Annual Report 2014-15
NOTES TO AND FORMING PART OF THE CONSOLIDATED BALANCE SHEET AS AT MARCH 31, 2015
2 (d) List of Shareholders holding more than 5% Equity Shares as at
Name of ShareholderMarch 31, 2015 March 31, 2014
No. of Shares held % of Holding No. of Shares
held % of Holding
Tata Sons Limited 2,551,433,946 90.28% 2,551,433,946 90.28%
2 (e) Rights, preferences and restrictions attached to Preference Shares The Company has issued Cumulative Redeemable Preference Shares (“CRPS”) of face value
` 1,000/- each, in tranches, having terms of issuance disclosed herein below. The CRPS holders have a right to receive dividend, prior to the Equity Shareholders. The dividend proposed by the Board of Directors on the CRPS is subject to the approval of the shareholders at the ensuing Annual General Meeting, except in case of interim dividend. In the event of liquidation, the Preference Shareholders are eligible to receive the remaining assets of the Company before distribution to the Equity Shareholders, in proportion to their shareholding.
Particulars Tranche No. of Shares Allotment Date Redemption Date Early Redemption
Date *12.5% Cumulative Redeemable Preference Shares of ` 1,000 each issued at Premium of ` 500 per share and redeemable at a premium of ` 500 per share.
A 984,078 August 10, 2012 August 9, 2019 N/AB 411,614 October 22, 2012 October 21, 2019 N/AC 166,666 December 10, 2012 December 9, 2019 N/AD 104,308 January 21, 2013 January 20, 2020 N/AE 200,000 February 27, 2013 February 26, 2020 N/AF 204,400 March 28, 2013 March 27, 2020 N/A
8.33% Cumulative Redeemable Preference Shares of ` 1,000 each
G 899,000 June 6, 2013 June 5, 2020 September 30, 2017H 2,500,000 May 22, 2013 May 21, 2020 September 30, 2017I 996,050 July 9, 2013 July 8, 2020 September 30, 2017J 369,660 September 5, 2013 September 4, 2020 September 30, 2017K 27,900 November 7, 2013 November 6, 2020 March 31, 2018L 50,900 April 1, 2014 March 31, 2021 March 31, 2018M 2,049,891 August 19, 2014 August 18, 2021 September 30, 2018
* For 8.33% Cumulative Redeemable Preference Shares of ` 1,000 each, the CRPS holder has a Put Option and the Company has a Call Option to seek early redemption of the CRPS by the dates as specified.
2 (f) List of Shareholders holding more than 5% Preference Shares as at
Name of ShareholderMarch 31, 2015 March 31, 2014 *
No. of Shares held % of Holding No. of
Shares held % of Holding
Shree Cement Limited 1,000,000 11.16% – 0.00%* No shareholder was holding more than 5% of the total Preference Share Capital of the Company as on March
31, 2014
2 (g) Details of Shares allotted as fully paid up without payment being received in cash during preceding five years.
Particulars Financial Year (Aggregate No. of Shares)2014-15 2013-14 2012-13 2011-12 2010-11
Equity Shares:Fully paid up shares issued pursuant to conversion of Preference Shares
NIL NIL NIL NIL 317,587,500
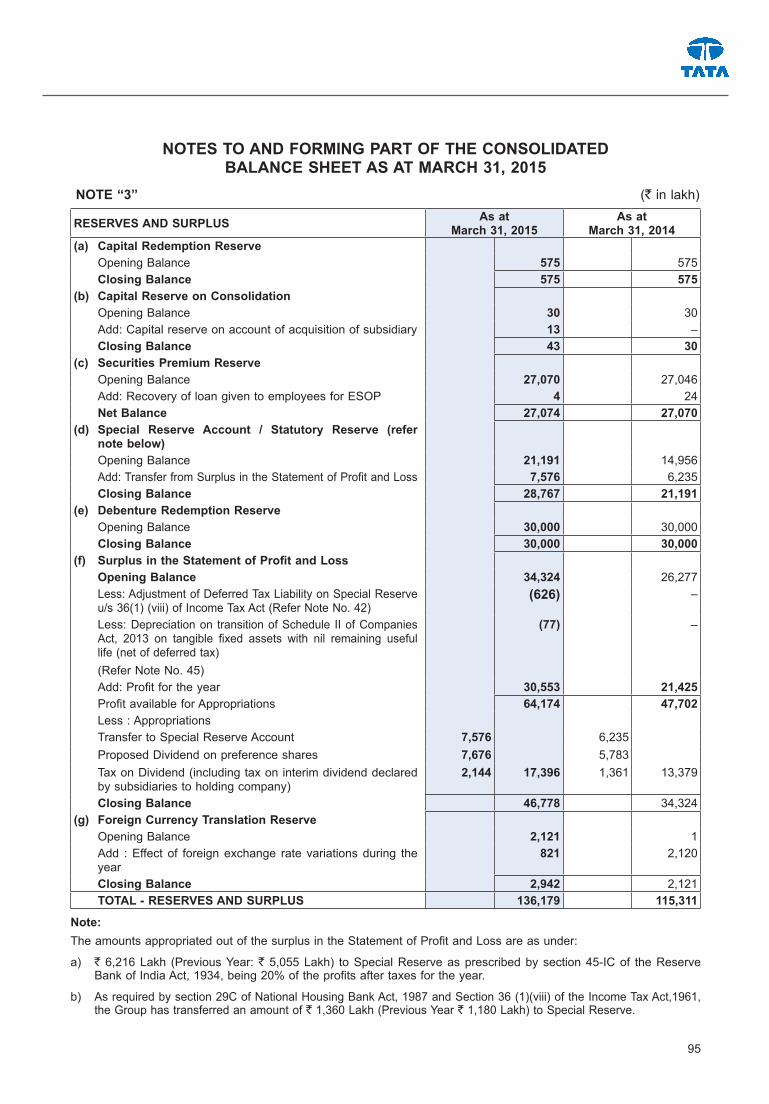
95
NOTES TO AND FORMING PART OF THE CONSOLIDATED BALANCE SHEET AS AT MARCH 31, 2015
NOTE “3” (` in lakh)
RESERVES AND SURPLUS As at March 31, 2015
As at March 31, 2014
(a) Capital Redemption Reserve Opening Balance 575 575 Closing Balance 575 575(b) Capital Reserve on Consolidation Opening Balance 30 30 Add: Capital reserve on account of acquisition of subsidiary 13 – Closing Balance 43 30(c) Securities Premium Reserve Opening Balance 27,070 27,046 Add: Recovery of loan given to employees for ESOP 4 24 Net Balance 27,074 27,070(d) Special Reserve Account / Statutory Reserve (refer
note below) Opening Balance 21,191 14,956 Add: Transfer from Surplus in the Statement of Profit and Loss 7,576 6,235 Closing Balance 28,767 21,191(e) Debenture Redemption Reserve Opening Balance 30,000 30,000 Closing Balance 30,000 30,000(f) Surplus in the Statement of Profit and Loss Opening Balance 34,324 26,277 Less: Adjustment of Deferred Tax Liability on Special Reserve
u/s 36(1) (viii) of Income Tax Act (Refer Note No. 42) (626) –
Less: Depreciation on transition of Schedule II of Companies Act, 2013 on tangible fixed assets with nil remaining useful life (net of deferred tax)
(Refer Note No. 45)
(77) –
Add: Profit for the year 30,553 21,425 Profit available for Appropriations 64,174 47,702 Less : Appropriations Transfer to Special Reserve Account 7,576 6,235 Proposed Dividend on preference shares 7,676 5,783 Tax on Dividend (including tax on interim dividend declared
by subsidiaries to holding company) 2,144 17,396 1,361 13,379
Closing Balance 46,778 34,324(g) Foreign Currency Translation Reserve Opening Balance 2,121 1 Add : Effect of foreign exchange rate variations during the
year821 2,120
Closing Balance 2,942 2,121 TOTAL - RESERVES AND SURPLUS 136,179 115,311
Note:The amounts appropriated out of the surplus in the Statement of Profit and Loss are as under:
a) ` 6,216 Lakh (Previous Year: ` 5,055 Lakh) to Special Reserve as prescribed by section 45-IC of the Reserve Bank of India Act, 1934, being 20% of the profits after taxes for the year.
b) As required by section 29C of National Housing Bank Act, 1987 and Section 36 (1)(viii) of the Income Tax Act,1961, the Group has transferred an amount of ` 1,360 Lakh (Previous Year ` 1,180 Lakh) to Special Reserve.

96
Annual Report 2014-15
NOTE “4” (` in lakh)
LONG-TERM BORROWINGSAs at
March 31, 2015
As at March 31,
2014(a) Bonds/Debentures Secured Privately Placed Non-Convertible Debentures (Refer Notes 4 (a)
and 4 (f) below)772,949 510,799
[Net of unamortised discount of ` Nil (as at March 31, 2014: ` 1 Lakh)]
Public issue of Non-Convertible Debentures (Refer Notes 4 (b) & 4 (g) below)
28,818 28,818
Unsecured Non-Convertible Subordinated Debentures (Refer Note 4 (h) below) 131,039 104,909 [Net of unamortised discount of ` 2,076 Lakh (as at March 31,
2014 : ` 2,406 Lakh)] Non-Convertible Perpetual Debentures (Refer Note 4 (i) below) 10,000 10,000
(b) Term loans Secured (i) From Banks (Refer Notes No. 4 (c) & 4 (d) below) 392,549 373,333 (ii) From National Housing Bank (Refer Note No. 4 (e) below) 91,266 31,535 Unsecured (i) From Banks (Refer Note No. 4 (d) below) 90,000 100,000
(c) Deposits Unsecured 715 715
Total 1,517,336 1,160,109
Notes(a) Privately Placed Non-Convertible Debentures are secured by a pari passu charge on the specific
immovable property, specified receivables arising out of loan, lease, hire purchase transactions and to the extent of shortfall in asset cover by a pari passu charge on certain current assets of the Group.
(b) Public issue of Non-Convertible Debentures are secured by a pari passu charge on the specific immovable property, receivables against unsecured loans, bills discounted and trade advances and other current assets of the Group.
(c) Loans and advances from banks are secured by a pari passu charge on the certain current assets of the Group.
Terms of repayment of term loans and rate of interest:(d) As per the terms of agreements loan from banks classified under long-term borrowings, short-term
borrowings and current liabilities aggregating ` 638,902 Lakh (Previous Year: ` 726,198 Lakh) are repayable at maturity ranging between 23 and 60 months from the date of respective loan. Rate of Interest payable on term loan varies between 9.40 % to 10.50%.
(e) Term Loan from National Housing Bank is secured by way of hypothecation of book debt and is repayable in quarterly instalments ranging from 28 to 60 quarters. Rate of Interest payable on Term loan varies between 7.10% to 10.00%.
NOTES TO AND FORMING PART OF THE CONSOLIDATED BALANCE SHEET AS AT MARCH 31, 2015

97
(f) Particulars of Privately Placed Secured Non-Convertible Debentures (“NCDs”) issued by Tata Capital Financial Services Limited (“TCFSL”) and Tata Capital Housing Finance Limited (“TCHFL”) outstanding as on March 31, 2015
Description of NCDs Issue Date Redemption Date
As on March 31, 2015* As on March 31, 2014*Number of
NCDs ` in Lakh Number of NCDs ` in Lakh
TCFSL NCD ‘S’ FY 2014-15 - Option IV 9-Oct-14 6-Dec-24 40 400 – –TCFSL NCD ‘S’ FY 2014-15 - Option II 9-Oct-14 20-Nov-24 103 1,030 – –TCFSL NCD ‘AH’ FY 2012-13 5-Sep-12 5-Sep-22 500 5,000 500 3,400TCFSL NCD ‘B’ FY 2014-15 20-Jun-14 9-Jul-19 250 2,500 – –TCL NCD ‘AA’ FY 2011-12 21-Oct-11 21-Oct-18 150 1,500 150 1,500TCL NCD ‘R’ FY 2011-12 23-Sep-11 23-Sep-18 100 1,000 100 1,000TCFSL NCD ‘O’ FY 2013-14 20-Aug-13 20-Aug-18 430 4,300 430 4,300TCL NCD ‘M’ FY 2011-12 17-Aug-11 17-Aug-18 40 400 40 400TCFSL NCD ‘J’ FY 2013-14 28-May-13 28-May-18 250 2,500 250 2,500TCFSL NCD ‘G’ FY 2013-14 22-May-13 22-May-18 2,000 20,000 2,000 20,000TCFSL NCD ‘H’ FY 2013-14 22-May-13 22-May-18 250 2,500 250 2,500TCFSL NCD ‘E’ FY 2013-14 7-May-13 7-May-18 500 5,000 500 5,000TCFSL NCD ‘D’ FY 2013-14 7-May-13 7-May-18 200 2,000 200 2,000TCFSL NCD ‘A’ FY 2013-14 23-Apr-13 23-Apr-18 850 8,500 850 8,500TCFSL NCD ‘U’ FY 2014-15 21-Oct-14 5-Apr-18 100 1,000 – –TCFSL NCD ‘AB’ FY 2014-15 - Option III 21-Nov-14 3-Apr-18 150 1,500 – –TCFSL NCD ‘BF’ FY 2012-13 26-Mar-13 26-Mar-18 50 500 50 500TCFSL NCD ‘AC’ FY 2014-15 25-Nov-14 23-Mar-18 2,000 20,000 – –TCFSL NCD ‘AB’ FY 2014-15 - Option I 21-Nov-14 9-Mar-18 380 3,800 – –TCFSL NCD ‘Z’ FY 2014-15 19-Nov-14 2-Mar-18 740 7,400 – –TCFSL NCD ‘X’ FY 2014-15 - Option I 14-Nov-14 12-Feb-18 1,700 17,000 – –TCFSL NCD ‘W’ FY 2014-15 - Option I 12-Nov-14 2-Feb-18 1,400 14,000 – –TCFSL NCD ‘V’ FY 2014-15 - Option I 27-Oct-14 29-Jan-18 145 1,450 – –TCFSL NCD ‘V’ FY 2014-15 - Option II 27-Oct-14 24-Jan-18 500 5,000 – –TCFSL NCD ‘AZ’ FY 2012-13 22-Jan-13 22-Jan-18 3,000 30,000 3,000 30,000TCFSL NCD ‘AY’ FY 2012-13 22-Jan-13 22-Jan-18 2,000 20,000 2,000 20,000TCFSL NCD ‘BA’ FY 2012-13 22-Jan-13 22-Jan-18 250 2,500 250 2,500TCFSL NCD ‘AX’ FY 2012-13 16-Jan-13 16-Jan-18 650 6,500 650 6,500TCFSL NCD ‘T’ FY 2014-15 - Option IV 13-Oct-14 15-Jan-18 150 1,500 – –TCFSL NCD ‘T’ FY 2014-15 - Option V 13-Oct-14 10-Jan-18 250 2,500 – –TCFSL NCD ‘T’ FY 2014-15 - Option III 13-Oct-14 4-Jan-18 100 1,000 – –TCFSL NCD ‘S’ FY 2014-15 - Option V 9-Oct-14 8-Dec-17 22 220 – –TCFSL NCD ‘AS’ FY 2012-13 5-Dec-12 5-Dec-17 250 2,500 250 2,500TCFSL NCD ‘S’ FY 2014-15 - Option I 9-Oct-14 29-Nov-17 50 500 – –TCFSL NCD ‘R’ FY 2014-15 - Option III 30-Sep-14 27-Nov-17 50 500 – –TCFSL NCD ‘P’ FY 2014-15 19-Sep-14 24-Nov-17 100 1,000 – –TCFSL NCD ‘Q’ FY 2014-15 24-Sep-14 20-Nov-17 100 1,000 – –TCFSL NCD ‘R’ FY 2014-15 - Option II 30-Sep-14 20-Nov-17 100 1,000 – –TCFSL NCD ‘R’ FY 2014-15 - Option I 30-Sep-14 15-Nov-17 2,000 20,000 – –TCFSL NCD ‘AQ’ FY 2012-13 12-Nov-12 10-Nov-17 300 3,000 300 3,000TCFSL NCD ‘AJ’ FY 2012-13 9-Nov-12 9-Nov-17 5,000 50,000 5,000 50,000
NOTES TO AND FORMING PART OF THE CONSOLIDATED BALANCE SHEET AS AT MARCH 31, 2015

98
Annual Report 2014-15
Description of NCDs Issue Date Redemption Date
As on March 31, 2015* As on March 31, 2014*Number of
NCDs ` in Lakh Number of NCDs ` in Lakh
TCFSL NCD ‘K’ FY 2014-15 - Option III 7-Aug-14 20-Oct-17 70 700 – –TCFSL NCD ‘N’ FY 2014-15 10-Sep-14 18-Oct-17 85 850 – –TCFSL NCD ‘K’ FY 2014-15 - Option II 7-Aug-14 9-Oct-17 210 2,100 – –TCFSL NCD ‘K’ FY 2014-15 - Option I 7-Aug-14 29-Sep-17 100 1,000 – –TCFSL NCD ‘J’ FY 2014-15 6-Aug-14 28-Sep-17 100 1,000 – –TCFSL NCD ‘AK’ FY 2014-15 Option III 15-Jan-15 27-Sep-17 880 8,800 – –TCFSL NCD ‘0’ FY 2014-15 12-Sep-14 26-Sep-17 320 3,200 – –TCFSL NCD ‘L’ FY 2014-15 - Option II 1-Sep-14 20-Sep-17 85 850 – –TCFSL NCD ‘AG’ FY 2012-13 10-Sep-12 8-Sep-17 100 1,000 100 1,000TCFSL NCD ‘I’ FY 2014-15 - Option II 4-Aug-14 4-Sep-17 250 2,500 – –TCFSL NCD ‘G’ FY 2014-15 16-Jul-14 1-Sep-17 144 1,440 – –TCFSL NCD ‘R’ FY 2013-14 26-Aug-13 25-Aug-17 300 3,000 300 3,000TCL NCD ‘M’ FY 2011-12 17-Aug-11 17-Aug-17 30 300 30 300TCFSL NCD ‘AE’ FY 2012-13 9-Aug-12 9-Aug-17 200 2,000 200 2,000TCFSL NCD ‘D’ FY 2014-15 10-Jul-14 14-Jul-17 2,500 25,000 – –TCFSL NCD ‘A’ FY 2014-15 - Option II 26-May-14 10-Jul-17 800 8,000 – –TCFSL NCD ‘AX’ FY 2014-15 Option I 20-Mar-15 2-May-17 187 1,870 – –TCFSL NCD ‘AV’ FY 2014-15 Option II 10-Mar-15 10-Apr-17 500 5,000 – –TCFSL NCD ‘T’ FY 2014-15 - Option II 13-Oct-14 24-Mar-17 1,600 16,000 – –TCFSL NCD ‘AD’ FY 2014-15 2-Dec-14 24-Mar-17 1,000 10,000 – –TCFSL NCD ‘AY’ FY 2014-15 Option II 24-Mar-15 17-Mar-17 250 2,500 – –TCFSL NCD ‘AB’ FY 2014-15 - Option II 21-Nov-14 16-Mar-17 200 2,000 – –TCFSL NCD ‘AA’ FY 2014-15 20-Nov-14 10-Mar-17 950 9,500 – –TCFSL NCD ‘X’ FY 2013-14 16-Sep-13 6-Mar-17 220 2,200 220 2,200TCFSL NCD ‘AW’ FY 2014-15 18-Mar-15 2-Mar-17 3,000 30,000 – –TCFSL NCD ‘AU’ FY 2014-15 Option IV 5-Mar-15 27-Feb-17 500 5,000 – –TCFSL NCD ‘AV’ FY 2014-15 Option I 10-Mar-15 27-Feb-17 5,550 55,500 – –TCFSL NCD ‘Y’ FY 2014-15 18-Nov-14 24-Feb-17 100 1,000 – –TCFSL NCD ‘AU’ FY 2014-15 Option III 5-Mar-15 23-Feb-17 110 1,100 – –TCFSL NCD ‘AU’ FY 2014-15 Option II 5-Mar-15 16-Feb-17 126 1,260 – –TCFSL NCD ‘P’ FY 2013-14 22-Aug-13 15-Feb-17 500 5,000 500 5,000TCFSL NCD ‘W’ FY 2014-15 - Option II 12-Nov-14 3-Feb-17 100 1,000 – –TCFSL NCD ‘X’ FY 2014-15 - Option II 14-Nov-14 2-Feb-17 150 1,500 – –TCFSL NCD ‘AS’ FY 2014-15 27-Feb-15 19-Jan-17 100 1,000 – –TCFSL NCD ‘AT’ FY 2014-15 Option I 2-Mar-15 12-Jan-17 650 6,500 – –TCFSL NCD ‘AR’ FY 2014-15 Option II 26-Feb-15 15-Dec-16 100 1,000 – –TCFSL NCD ‘T’ FY 2014-15 - Option I 13-Oct-14 9-Dec-16 1,500 15,000 – –TCFSL NCD ‘AR’ FY 2014-15 Option III 26-Feb-15 8-Dec-16 250 2,500 – –TCFSL NCD ‘AR’ FY 2014-15 Option I 26-Feb-15 6-Dec-16 325 3,250 – –TCFSL NCD ‘AJ’ FY 2013-14 13-Dec-13 5-Dec-16 45 450 45 450TCFSL NCD ‘S’ FY 2014-15 - Option III 9-Oct-14 2-Dec-16 100 1,000 – –TCFSL NCD ‘AQ’ FY 2014-15 20-Feb-15 30-Nov-16 60 600 – –TCFSL NCD ‘AP’ FY 2014-15 Option III 6-Feb-15 29-Nov-16 1,000 10,000 – –
NOTES TO AND FORMING PART OF THE CONSOLIDATED BALANCE SHEET AS AT MARCH 31, 2015

99
Description of NCDs Issue Date Redemption Date
As on March 31, 2015* As on March 31, 2014*Number of
NCDs ` in Lakh Number of NCDs ` in Lakh
TCFSL NCD ‘AN’ FY 2014-15 29-Jan-15 11-Nov-16 3,000 30,000 – –TCFSL NCD ‘AC’ FY 2013-14 8-Nov-13 11-Nov-16 55 550 55 550TCL NCD ‘AM’ FY 2011-12 10-Nov-11 10-Nov-16 100 1,000 100 1,000TCFSL NCD ‘AF’ FY 2013-14 2-Dec-13 7-Nov-16 50 500 50 500TCFSL NCD ‘L’ FY 2014-15 - Option I 1-Sep-14 27-Oct-16 4,000 40,000 – –TCFSL NCD ‘H’ FY 2014-15 24-Jul-14 26-Oct-16 750 7,500 – –TCFSL NCD ‘AL’ FY 2014-15 20-Jan-15 20-Oct-16 210 2,100 – –TCFSL NCD ‘AX’ FY 2014-15 Option II 20-Mar-15 18-Oct-16 80 800 – –TCFSL NCD ‘AK’ FY 2014-15 Option II 15-Jan-15 17-Oct-16 59 590 – –TCFSL NCD ‘AH’ FY 2014-15 - Option I 16-Dec-14 5-Oct-16 151 1,510 – –TCFSL NCD ‘F’ FY 2014-15 Option II 14-Jul-14 29-Sep-16 100 1,000 – –TCFSL NCD ‘AK’ FY 2014-15 Option I 15-Jan-15 26-Sep-16 97 970 – –TCFSL NCD ‘AI’ FY 2014-15 13-Jan-15 23-Sep-16 110 1,100 – –TCFSL NCD ‘AJ’ FY 2014-15 14-Jan-15 21-Sep-16 162 1,620 – –TCFSL NCD ‘AH’ FY 2014-15 - Option II 16-Dec-14 14-Sep-16 40 400 – –TCFSL NCD ‘AH’ FY 2014-15 - Option III 16-Dec-14 13-Sep-16 90 900 – –TCFSL NCD ‘Y’ FY 2013-14 24-Sep-13 8-Sep-16 400 4,000 400 4,000TCFSL NCD ‘V’ FY 2013-14 5-Sep-13 5-Sep-16 50 500 50 500TCFSL NCD ‘U’ FY 2013-14 3-Sep-13 2-Sep-16 250 2,500 250 2,500TCFSL NCD ‘W’ FY 2013-14 13-Sep-13 2-Sep-16 30 300 30 300TCFSL NCD ‘T’ FY 2013-14 3-Sep-13 30-Aug-16 62 620 62 620TCFSL NCD ‘S’ FY 2013-14 30-Aug-13 22-Aug-16 99 990 99 990TCL NCD ‘M’ FY 2011-12 17-Aug-11 17-Aug-16 30 300 30 300TCFSL NCD ‘Q’ FY 2013-14 23-Aug-13 8-Aug-16 40 400 40 400TCFSL NCD ‘E’ FY 2014-15 Option II 11-Jul-14 4-Aug-16 750 7,500 – –TCFSL NCD ‘AG’ FY 2014-15 - Option I 10-Dec-14 4-Aug-16 50 500 – –TCFSL NCD ‘E’ FY 2014-15 Option I 11-Jul-14 2-Aug-16 1,500 15,000 – –TCFSL NCD ‘AF’ FY 2014-15 - Option II 8-Dec-14 2-Aug-16 170 1,700 – –TCFSL NCD ‘AG’ FY 2014-15 - Option II 10-Dec-14 1-Aug-16 250 2,500 – –TCFSL NCD ‘AF’ FY 2014-15 - Option I 8-Dec-14 27-Jul-16 750 7,500 – –TCFSL NCD ‘C’ FY 2014-15 Option II 9-Jul-14 11-Jul-16 350 3,500 – –TCFSL NCD ‘AE’ FY 2014-15 - Option III 4-Dec-14 8-Jul-16 130 1,300 – –TCFSL NCD ‘A’ FY 2014-15 - Option I 26-May-14 21-Jun-16 800 8,000 – –TCFSL NCD ‘AE’ FY 2014-15 - Option I 4-Dec-14 26-May-16 1,500 15,000 – –TCFSL NCD ‘BE’ FY 2012-13 12-Mar-13 10-May-16 30 300 30 300TCFSL NCD ‘AU’ FY 2014-15 Option I 5-Mar-15 6-May-16 115 1,150 – –TCL NCD ‘A’ FY 2011-12 27-Apr-11 27-Apr-16 370 3,700 370 3,700TCFSL NCD ‘AT’ FY 2014-15 Option II 2-Mar-15 22-Apr-16 170 1,700 – –TCFSL NCD ‘AP’ FY 2014-15 Option II 4-Feb-15 15-Apr-16 100 1,000 – –TCFSL NCD ‘I’ FY 2014-15 - Option I 4-Aug-14 25-Mar-16 650 6,500 – –TCFSL NCD ‘M’ FY 2014-15 4-Sep-14 25-Mar-16 500 5,000 – –TCFSL NCD ‘AY’ FY 2014-15 Option I 24-Mar-15 11-Mar-16 150 1,500 – –TCFSL NCD ‘AM’ FY 2014-15 23-Jan-15 1-Mar-16 250 2,500 – –
NOTES TO AND FORMING PART OF THE CONSOLIDATED BALANCE SHEET AS AT MARCH 31, 2015

100
Annual Report 2014-15
Description of NCDs Issue Date Redemption Date
As on March 31, 2015* As on March 31, 2014*Number of
NCDs ` in Lakh Number of NCDs ` in Lakh
TCFSL NCD ‘AF’ FY 2014-15 - Option III 8-Dec-14 19-Jan-16 50 500 – –TCL NCD ‘W’ FY 2010-11 19-Jan-11 19-Jan-16 440 4,400 440 4,400TCFSL NCD ‘AP’ FY 2014-15 Option I 4-Feb-15 24-Dec-15 500 5,000 – –TCFSL NCD ‘C’ FY 2014-15 Option I 9-Jul-14 15-Dec-15 250 2,500 – –TCFSL NCD ‘AO’ FY 2014-15 2-Feb-15 14-Dec-15 500 5,000 – –TCL NCD ‘T’ FY 2010-11 2-Dec-10 2-Dec-15 50 500 50 500TCFSL NCD ‘AE’ FY 2014-15 - Option II 4-Dec-14 26-Nov-15 164 1,640 – –TCL NCD ‘S’ FY 2010-11 19-Nov-10 19-Nov-15 100 1,000 100 1,000TCFSL NCD ‘AA’ FY 2012-13 16-Jul-12 1-Oct-15 40 400 40 400TCFSL NCD ‘E’ FY 2012-13 4-May-12 4-Aug-15 50 500 50 500TCFSL NCD ‘AD’ FY 2012-13 31-Jul-12 31-Jul-15 500 5,000 500 5,000TCFSL NCD ‘Z’ FY 2012-13 13-Jul-12 13-Jul-15 50 500 50 500TCFSL NCD ‘AM’ FY 2013-14 10-Jan-14 30-Jun-15 200 2,000 200 2,000TCFSL NCD ‘B’ FY 2012-13 30-Apr-12 30-Jun-15 200 2,000 200 2,000TCFSL NCD ‘AW’ FY 2013-14 28-Jan-14 30-Jun-15 100 1,000 100 1,000TCFSL NCD ‘AI’ FY 2013-14 13-Dec-13 29-Jun-15 50 500 50 500TCFSL NCD ‘Y’ FY 2012-13 19-Jun-12 19-Jun-15 50 500 50 500TCFSL NCD ‘AA’ FY 2013-14 17-Oct-13 15-Jun-15 100 1,000 100 1,000TCFSL NCD ‘V’ FY 2012-13 4-Jun-12 4-Jun-15 100 1,000 100 1,000TCL NCD ‘CE’ FY 2011-12 24-Feb-12 1-Jun-15 180 1,800 180 1,800TCFSL NCD ‘U’ FY 2012-13 28-May-12 27-May-15 400 4,000 400 4,000TCFSL NCD ‘T’ FY 2012-13 25-May-12 25-May-15 140 1,400 140 1,400TCFSL NCD ‘I’ FY 2013-14 21-May-13 21-May-15 1,000 10,000 2,000 20,000TCFSL NCD ‘BI’ FY 2013-14 20-Feb-14 20-May-15 250 2,500 250 2,500TCFSL NCD ‘AE’ FY 2013-14 21-Nov-13 19-May-15 400 4,000 400 4,000TCFSL NCD ‘AT’ FY 2013-14 28-Jan-14 18-May-15 255 2,550 255 2,550TCFSL NCD ‘AQ’ FY 2013-14 15-Jan-14 14-May-15 210 2,100 210 2,100TCL NCD ‘G’ FY 2010-11 12-May-10 12-May-15 250 2,500 250 2,500TCFSL NCD ‘AR’ FY 2013-14 16-Jan-14 12-May-15 150 1,500 150 1,500TCFSL NCD ‘AL’ FY 2013-14 9-Jan-14 12-May-15 60 600 60 600TCFSL NCD ‘AO’ FY 2013-14 13-Jan-14 11-May-15 100 1,000 100 1,000TCFSL NCD ‘AP’ FY 2013-14 15-Jan-14 11-May-15 80 800 80 800TCFSL NCD ‘AH’ FY 2013-14 12-Dec-13 8-May-15 240 2,400 240 2,400TCFSL NCD ‘C’ FY 2013-14 7-May-13 7-May-15 250 2,500 250 2,500TCFSL NCD ‘AN’ FY 2013-14 13-Jan-14 7-May-15 120 1,200 120 1,200TCFSL NCD ‘S’ FY 2012-13 22-May-12 6-May-15 225 2,250 225 2,250TCFSL NCD ‘G’ FY 2012-13 9-May-12 6-May-15 200 2,000 200 2,000TCFSL NCD ‘D’ FY 2012-13 3-May-12 4-May-15 620 6,200 620 6,200TCFSL NCD ‘BO’ FY 2013-14 28-Feb-14 4-May-15 510 5,100 510 5,100TCFSL NCD ‘BF’ FY 2013-14 17-Feb-14 4-May-15 473 4,730 473 4,730TCFSL NCD ‘BK’ FY 2013-14 21-Feb-14 4-May-15 430 4,300 430 4,300TCFSL NCD ‘BB’ FY 2013-14 7-Feb-14 4-May-15 300 3,000 300 3,000TCFSL NCD ‘AZ’ FY 2013-14 6-Feb-14 4-May-15 180 1,800 180 1,800
NOTES TO AND FORMING PART OF THE CONSOLIDATED BALANCE SHEET AS AT MARCH 31, 2015

101
Description of NCDs Issue Date Redemption Date
As on March 31, 2015* As on March 31, 2014*Number of
NCDs ` in Lakh Number of NCDs ` in Lakh
TCFSL NCD ‘AG’ FY 2013-14 11-Dec-13 4-May-15 50 500 50 500TCFSL NCD ‘C’ FY 2012-13 2-May-12 30-Apr-15 500 5,000 500 5,000TCFSL NCD ‘AK’ FY 2013-14 3-Jan-14 30-Apr-15 380 3,800 380 3,800TCFSL NCD ‘A’ FY 2013-14 23-Apr-13 23-Apr-15 300 3,000 300 3,000TCFSL NCD ‘AV’ FY 2013-14 28-Jan-14 23-Apr-15 220 2,200 220 2,200TCFSL NCD ‘BQ’ FY 2013-14 3-Mar-14 20-Apr-15 250 2,500 250 2,500TCFSL NCD ‘BN’ FY 2013-14 28-Feb-14 20-Apr-15 120 1,200 120 1,200TCFSL NCD ‘BY’ FY 2013-14 18-Mar-14 16-Apr-15 900 9,000 900 9,000TCFSL NCD ‘BE’ FY 2013-14 14-Feb-14 16-Apr-15 80 800 80 800TCFSL NCD ‘BR’ FY 2013-14 10-Mar-14 15-Apr-15 621 6,210 621 6,210TCFSL NCD ‘AS’ FY 2013-14 17-Jan-14 15-Apr-15 300 3,000 300 3,000TCFSL NCD ‘AB’ FY 2013-14 17-Oct-13 15-Apr-15 250 2,500 250 2,500TCFSL NCD ‘AX’ FY 2013-14 6-Feb-14 15-Apr-15 190 1,900 190 1,900TCFSL NCD ‘AU’ FY 2013-14 28-Jan-14 15-Apr-15 50 500 50 500TCFSL NCD ‘BU’ FY 2013-14 14-Mar-14 14-Apr-15 744 7,440 744 7,440TCFSL NCD ‘BS’ FY 2013-14 13-Mar-14 13-Apr-15 585 5,850 585 5,850TCFSL NCD ‘BG’ FY 2013-14 18-Feb-14 13-Apr-15 100 1,000 100 1,000TCFSL NCD ‘A’ FY 2012-13 25-Apr-12 10-Apr-15 200 2,000 200 2,000TCFSL NCD ‘CA’ FY 2013-14 24-Mar-14 8-Apr-15 400 4,000 400 4,000TCFSL NCD ‘BL’ FY 2013-14 24-Feb-14 7-Apr-15 765 7,650 765 7,650TCFSL NCD ‘BZ’ FY 2013-14 18-Mar-14 7-Apr-15 561 5,610 561 5,610TCFSL NCD ‘BM’ FY 2013-14 24-Feb-14 7-Apr-15 380 3,800 380 3,800TCFSL NCD ‘BJ’ FY 2013-14 21-Feb-14 7-Apr-15 340 3,400 340 3,400TCFSL NCD ‘BC’ FY 2013-14 12-Feb-14 7-Apr-15 290 2,900 290 2,900TCFSL NCD ‘BD’ FY 2013-14 13-Feb-14 7-Apr-15 210 2,100 210 2,100TCFSL NCD ‘Z’ FY 2013-14 10-Oct-13 7-Apr-15 100 1,000 100 1,000TCFSL NCD ‘BV’ FY 2013-14 14-Mar-14 7-Apr-15 100 1,000 100 1,000TCFSL NCD ‘BT’ FY 2013-14 14-Mar-14 6-Apr-15 900 9,000 900 9,000TCFSL NCD ‘BX’ FY 2013-14 18-Mar-14 6-Apr-15 170 1,700 170 1,700TCFSL NCD ‘BA’ FY 2013-14 7-Feb-14 6-Apr-15 160 1,600 160 1,600TCL NCD ‘CK’ FY 2011-12 16-Mar-12 6-Apr-15 120 1,198 120 1,101TCFSL NCD ‘BP’ FY 2013-14 28-Feb-14 6-Apr-15 100 1,000 100 1,000TCFSL NCD ‘BW’ FY 2013-14 14-Mar-14 31-Mar-15 – – 200 2,000TCFSL NCD ‘BH’ FY 2013-14 18-Feb-14 31-Mar-15 – – 570 5,700TCFSL NCD ‘AY’ FY 2013-14 6-Feb-14 31-Mar-15 – – 278 2,780TCFSL NCD ‘AD’ FY 2013-14 8-Nov-13 25-Mar-15 – – 300 3,000TCL NCD ‘CL’ FY 2011-12 20-Mar-12 13-Mar-15 – – 250 2,500TCFSL NCD ‘H’ FY 2012-13 10-May-12 9-Mar-15 – – 100 1,000TCL NCD ‘CI’ FY 2011-12 7-Mar-12 6-Mar-15 – – 100 1,000TCL NCD ‘CD’ FY 2011-12 23-Feb-12 9-Feb-15 – – 300 3,000TCL NCD ‘BY’ FY 2011-12 1-Feb-12 3-Feb-15 – – 50 500TCL NCD ‘BW’ FY 2011-12 24-Jan-12 27-Jan-15 – – 350 3,263TCL NCD ‘BX’ FY 2011-12 25-Jan-12 23-Jan-15 – – 50 500
NOTES TO AND FORMING PART OF THE CONSOLIDATED BALANCE SHEET AS AT MARCH 31, 2015
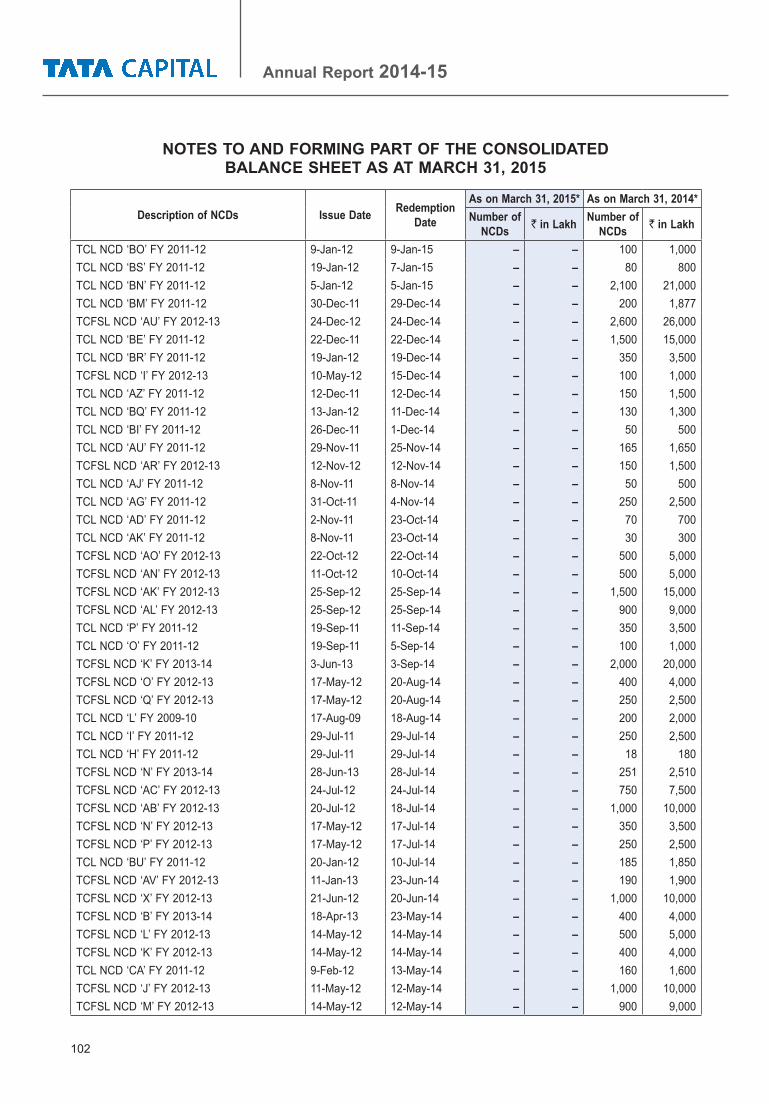
102
Annual Report 2014-15
Description of NCDs Issue Date Redemption Date
As on March 31, 2015* As on March 31, 2014*Number of
NCDs ` in Lakh Number of NCDs ` in Lakh
TCL NCD ‘BO’ FY 2011-12 9-Jan-12 9-Jan-15 – – 100 1,000TCL NCD ‘BS’ FY 2011-12 19-Jan-12 7-Jan-15 – – 80 800TCL NCD ‘BN’ FY 2011-12 5-Jan-12 5-Jan-15 – – 2,100 21,000TCL NCD ‘BM’ FY 2011-12 30-Dec-11 29-Dec-14 – – 200 1,877TCFSL NCD ‘AU’ FY 2012-13 24-Dec-12 24-Dec-14 – – 2,600 26,000TCL NCD ‘BE’ FY 2011-12 22-Dec-11 22-Dec-14 – – 1,500 15,000TCL NCD ‘BR’ FY 2011-12 19-Jan-12 19-Dec-14 – – 350 3,500TCFSL NCD ‘I’ FY 2012-13 10-May-12 15-Dec-14 – – 100 1,000TCL NCD ‘AZ’ FY 2011-12 12-Dec-11 12-Dec-14 – – 150 1,500TCL NCD ‘BQ’ FY 2011-12 13-Jan-12 11-Dec-14 – – 130 1,300TCL NCD ‘BI’ FY 2011-12 26-Dec-11 1-Dec-14 – – 50 500TCL NCD ‘AU’ FY 2011-12 29-Nov-11 25-Nov-14 – – 165 1,650TCFSL NCD ‘AR’ FY 2012-13 12-Nov-12 12-Nov-14 – – 150 1,500TCL NCD ‘AJ’ FY 2011-12 8-Nov-11 8-Nov-14 – – 50 500TCL NCD ‘AG’ FY 2011-12 31-Oct-11 4-Nov-14 – – 250 2,500TCL NCD ‘AD’ FY 2011-12 2-Nov-11 23-Oct-14 – – 70 700TCL NCD ‘AK’ FY 2011-12 8-Nov-11 23-Oct-14 – – 30 300TCFSL NCD ‘AO’ FY 2012-13 22-Oct-12 22-Oct-14 – – 500 5,000TCFSL NCD ‘AN’ FY 2012-13 11-Oct-12 10-Oct-14 – – 500 5,000TCFSL NCD ‘AK’ FY 2012-13 25-Sep-12 25-Sep-14 – – 1,500 15,000TCFSL NCD ‘AL’ FY 2012-13 25-Sep-12 25-Sep-14 – – 900 9,000TCL NCD ‘P’ FY 2011-12 19-Sep-11 11-Sep-14 – – 350 3,500TCL NCD ‘O’ FY 2011-12 19-Sep-11 5-Sep-14 – – 100 1,000TCFSL NCD ‘K’ FY 2013-14 3-Jun-13 3-Sep-14 – – 2,000 20,000TCFSL NCD ‘O’ FY 2012-13 17-May-12 20-Aug-14 – – 400 4,000TCFSL NCD ‘Q’ FY 2012-13 17-May-12 20-Aug-14 – – 250 2,500TCL NCD ‘L’ FY 2009-10 17-Aug-09 18-Aug-14 – – 200 2,000TCL NCD ‘I’ FY 2011-12 29-Jul-11 29-Jul-14 – – 250 2,500TCL NCD ‘H’ FY 2011-12 29-Jul-11 29-Jul-14 – – 18 180TCFSL NCD ‘N’ FY 2013-14 28-Jun-13 28-Jul-14 – – 251 2,510TCFSL NCD ‘AC’ FY 2012-13 24-Jul-12 24-Jul-14 – – 750 7,500TCFSL NCD ‘AB’ FY 2012-13 20-Jul-12 18-Jul-14 – – 1,000 10,000TCFSL NCD ‘N’ FY 2012-13 17-May-12 17-Jul-14 – – 350 3,500TCFSL NCD ‘P’ FY 2012-13 17-May-12 17-Jul-14 – – 250 2,500TCL NCD ‘BU’ FY 2011-12 20-Jan-12 10-Jul-14 – – 185 1,850TCFSL NCD ‘AV’ FY 2012-13 11-Jan-13 23-Jun-14 – – 190 1,900TCFSL NCD ‘X’ FY 2012-13 21-Jun-12 20-Jun-14 – – 1,000 10,000TCFSL NCD ‘B’ FY 2013-14 18-Apr-13 23-May-14 – – 400 4,000TCFSL NCD ‘L’ FY 2012-13 14-May-12 14-May-14 – – 500 5,000TCFSL NCD ‘K’ FY 2012-13 14-May-12 14-May-14 – – 400 4,000TCL NCD ‘CA’ FY 2011-12 9-Feb-12 13-May-14 – – 160 1,600TCFSL NCD ‘J’ FY 2012-13 11-May-12 12-May-14 – – 1,000 10,000TCFSL NCD ‘M’ FY 2012-13 14-May-12 12-May-14 – – 900 9,000
NOTES TO AND FORMING PART OF THE CONSOLIDATED BALANCE SHEET AS AT MARCH 31, 2015

103
Description of NCDs Issue Date Redemption Date
As on March 31, 2015* As on March 31, 2014*Number of
NCDs ` in Lakh Number of NCDs ` in Lakh
TCFSL NCD ‘R’ FY 2012-13 18-May-12 8-May-14 – – 330 3,300TCFSL NCD ‘F’ FY 2012-13 9-May-12 5-May-14 – – 200 2,000TCFSL NCD ‘BB’ FY 2012-13 23-Jan-13 30-Apr-14 – – 125 1,250TCL NCD ‘CM’ FY 2011-12 19-Mar-12 29-Apr-14 – – 110 1,100TCFSL NCD ‘BG’ FY 2012-13 26-Mar-13 25-Apr-14 – – 569 5,690TCFSL NCD ‘AP’ FY 2012-13 22-Oct-12 22-Apr-14 – – 500 5,000TCFSL NCD ‘AW’ FY 2012-13 11-Jan-13 16-Apr-14 – – 160 1,600TCFSL NCD ‘BD’ FY 2012-13 18-Feb-13 8-Apr-14 – – 50 500TCFSL NCD ‘W’ FY 2012-13 7-Jun-12 4-Apr-14 – – 140 1,400TCFSL NCD ‘BH’ FY 2012-13 28-Mar-13 3-Apr-14 – – 100 1,000TCFSL NCD ‘BC’ FY 2012-13 13-Feb-13 2-Apr-14 – – 1,000 10,000TCHFL - Series U - FY 2014-15 20-Jan-15 24-Jan-28 190 1,900 – –TCHFL - Series M - FY 2014-15 - Option II 14-Nov-14 24-Nov-27 150 1,500 – –TCHFL - Series V - FY 2014-15 23-Jan-15 23-Jan-25 1,500 15,000 – –TCHFL - Series R - FY 2014-15 9-Dec-14 9-Dec-24 2,000 20,000 – –TCHFL - Series U - FY 2012-13 12-Mar-13 10-Mar-23 100 1,000 100 1,000TCHFL - Series R - FY 2012-13 18-Jan-13 18-Jan-23 150 1,500 150 1,500TCHFL - Series Q - FY 2012-13 24-Dec-12 28-Dec-22 100 1,000 100 1,000TCHFL - Series G - FY 2012-13 15-May-12 18-May-22 100 1,000 100 1,000TCHFL - Series Z - FY 2014-15 12-Feb-15 12-Feb-20 100 1,000 – –TCHFL - Series G - FY 2014-15 22-Oct-14 22-Oct-19 550 5,500 – –TCHFL - Series K - FY 2012-13 3-Oct-12 3-Oct-19 100 1,000 100 1,000TCHFL - Series D - FY 2014-15 - Option II 22-Aug-14 22-Aug-19 100 1,000 – –TCHFL - Series B - FY 2014-15 - Option II 22-Jul-14 21-Jul-19 100 1,000 – –TCHFL - Series A - FY 2014-15 - Option II 13-Jun-14 13-Jun-19 100 1,000 – –TCHFL - Series N - FY 2013-14 20-Jan-14 18-Jan-19 50 500 50 500TCHFL - Series G - FY 2011-12 18-Nov-11 18-Nov-18 100 1,000 100 1,000TCHFL - Series C - FY 2013-14 23-Apr-13 23-Apr-18 100 1,000 100 1,000TCHFL - Series AE - FY 2014-15 26-Mar-15 10-Apr-18 340 3,400 – –TCHFL - Series AD - FY 2014-15 - Option II 16-Mar-15 12-Mar-18 50 500 – –TCHFL - Series AC - FY 2014-15 - Option II 10-Mar-15 9-Mar-18 600 6,000 – –TCHFL - Series W - FY 2014-15 - Option I 28-Jan-15 14-Feb-18 80 800 – –TCHFL - Series AA - FY 2014-15 - Option I 16-Feb-15 12-Feb-18 75 750 – –TCHFL - Series Y - FY 2014-15 4-Feb-15 2-Feb-18 150 1,500 – –TCHFL - Series T - FY 2014-15 13-Jan-15 10-Jan-18 162 1,620 – –TCHFL - Series O - FY 2014-15 21-Nov-14 22-Nov-17 180 1,800 – –TCHFL - Series N - FY 2014-15 18-Nov-14 21-Nov-17 70 700 – –TCHFL - Series J - FY 2014-15 - Option II 7-Nov-14 13-Nov-17 120 1,200 – –TCHFL - Series K - FY 2014-15 11-Nov-14 1-Nov-17 100 1,000 – –TCHFL - Series D - FY 2014-15 - Option I 22-Aug-14 22-Aug-17 600 6,000 – –TCHFL - Series C - FY 2014-15 - Option II 7-Aug-14 1-Aug-17 200 2,000 – –TCHFL - Series B - FY 2014-15 - Option I 22-Jul-14 21-Jul-17 100 1,000 – –TCHFL - Series A - FY 2014-15 - Option III 13-Jun-14 13-Jun-17 250 2,500 – –
NOTES TO AND FORMING PART OF THE CONSOLIDATED BALANCE SHEET AS AT MARCH 31, 2015

104
Annual Report 2014-15
Description of NCDs Issue Date Redemption Date
As on March 31, 2015* As on March 31, 2014*Number of
NCDs ` in Lakh Number of NCDs ` in Lakh
TCHFL - Series A - FY 2014-15 - Option I 13-Jun-14 2-May-17 600 6,000 – –TCHFL - Series AD - FY 2014-15 - Option I 16-Mar-15 17-Apr-17 90 900 – –TCHFL - Series AB - FY 2014-15 5-Mar-15 10-Apr-17 100 1,000 – –TCHFL - Series AC - FY 2014-15 - Option I 10-Mar-15 10-Mar-17 1,850 18,500 – –TCHFL - Series AA - FY 2014-15 - Option II 16-Feb-15 27-Feb-17 40 400 – –TCHFL - Series W - FY 2014-15 - Option II 27-Jan-15 24-Jan-17 44 440 – –TCHFL - Series L - FY 2013-14 10-Jan-14 10-Jan-17 250 2,500 250 2,500TCHFL - Series E - FY 2014-15 23-Sep-14 23-Dec-16 400 4,000 – –TCHFL - Series S - FY 2014-15 - Option I 16-Dec-14 15-Dec-16 118 1,180 – –TCHFL - Series S - FY 2014-15 - Option II 16-Dec-14 6-Dec-16 101 1,010 – –TCHFL - Series K - FY 2013-14 2-Dec-13 2-Dec-16 200 2,000 200 2,000TCHFL - Series Q - FY 2014-15 - Option I 4-Dec-14 2-Dec-16 139 1,390 – –TCHFL - Series Q - FY 2014-15 - Option II 4-Dec-14 29-Nov-16 274 2,740 – –TCHFL - Series J - FY 2013-14 7-Nov-13 7-Nov-16 50 500 50 500TCHFL - Series J - FY 2014-15 - Option I 7-Nov-14 7-Nov-16 60 600 – –TCHFL - Series I - FY 2014-15 - Option II 3-Nov-14 3-Nov-16 70 700 – –TCHFL - Series H - FY 2014-15 31-Oct-14 31-Oct-16 182 1,820 – –TCHFL - Series F - FY 2014-15 - Option II 20-Oct-14 10-Oct-16 188 1,880 – –TCHFL - Series H - FY 2013-14 10-Sep-13 9-Sep-16 300 3,000 300 3,000TCHFL - Series C - FY 2014-15 - Option III 7-Aug-14 2-Aug-16 200 2,000 – –TCHFL - Series C - FY 2014-15 - Option IV 7-Aug-14 1-Aug-16 70 700 – –TCHFL - Series C - FY 2014-15 - Option I 7-Aug-14 1-Aug-16 1,000 10,000 – –TCHFL - Series I - FY 2013-14 25-Oct-13 28-Jun-16 180 1,800 180 1,800TCHFL - Series E - FY 2013-14 16-May-13 16-May-16 100 1,000 100 1,000TCHFL - Series A - FY 2013-14 9-Apr-13 10-May-16 30 300 30 300TCHFL - Series T - FY 2012-13 12-Mar-13 10-May-16 20 200 20 200TCHFL - Series S - FY 2012-13 5-Feb-13 28-Apr-16 626 6,260 626 6,260TCHFL - Series P - FY 2014-15 2-Dec-14 15-Apr-16 1,000 10,000 – –TCHFL - Series F - FY 2014-15 - Option I 20-Oct-14 25-Mar-16 1,000 10,000 – –TCHFL - Series X - FY 2014-15 2-Feb-15 3-Mar-16 250 2,500 – –TCHFL - Series L - FY 2014-15 12-Nov-14 1-Mar-16 250 2,500 – –TCHFL - Series M - FY 2014-15 - Option I 14-Nov-14 14-Dec-15 1,700 17,000 – –TCHFL - Series I - FY 2014-15 - Option I 3-Nov-14 23-Nov-15 1,000 10,000 – –TCHFL - Series O - FY 2012-13 30-Oct-12 30-Oct-15 100 1,000 100 1,000TCHFL - Series N - FY 2012-13 29-Oct-12 29-Oct-15 500 5,000 500 5,000TCHFL - Series L - FY 2012-13 12-Oct-12 12-Oct-15 200 2,000 200 2,000TCHFL - Series P - FY 2013-14 28-Jan-14 30-Jun-15 100 1,000 100 1,000TCHFL - Series E - FY 2012-13 29-May-12 29-May-15 51 510 51 510TCHFL - Series F - FY 2013-14 21-May-13 21-May-15 – – 2,000 20,000TCHFL - Series U - FY 2013-14 20-Feb-14 20-May-15 250 2,500 250 2,500TCHFL - Series M - FY 2013-14 9-Jan-14 12-May-15 60 600 60 600TCHFL - Series T - FY 2013-14 14-Feb-14 8-May-15 210 2,100 210 2,100TCHFL - Series S - FY 2013-14 10-Feb-14 4-May-15 210 2,100 210 2,100TCHFL - Series V - FY 2013-14 21-Feb-14 4-May-15 350 3,500 350 3,500
NOTES TO AND FORMING PART OF THE CONSOLIDATED BALANCE SHEET AS AT MARCH 31, 2015

105
Description of NCDs Issue Date Redemption Date
As on March 31, 2015* As on March 31, 2014*Number of
NCDs ` in Lakh Number of NCDs ` in Lakh
TCHFL - Series Z - FY 2013-14 13-Mar-14 27-Apr-15 50 500 50 500TCHFL - Series O - FY 2013-14 28-Jan-14 23-Apr-15 100 1,000 100 1,000TCHFL - Series X - FY 2013-14 3-Mar-14 20-Apr-15 250 2,500 250 2,500TCHFL - Series B - FY 2012-13 17-Apr-12 17-Apr-15 17 170 17 170TCHFL - Series Q - FY 2013-14 6-Feb-14 15-Apr-15 190 1,900 190 1,900TCHFL - Series AB - FY 2013-14 13-Mar-14 13-Apr-15 292 2,920 292 2,920TCHFL - Series AA - FY 2013-14 13-Mar-14 10-Apr-15 35 350 35 350TCHFL - Series AC - FY 2013-14 14-Mar-14 6-Apr-15 350 3,500 350 3,500TCHFL - Series AD - FY 2013-14 14-Mar-14 6-Apr-15 50 500 50 500TCHFL - Series AE - FY 2013-14 18-Mar-14 6-Apr-15 170 1,700 170 1,700TCHFL - Series R - FY 2013-14 7-Feb-14 6-Apr-15 160 1,600 160 1,600TCHFL - Series Y - FY 2013-14 6-Mar-14 6-Apr-15 31 310 31 310TCHFL - Series AF - FY 2013-14 19-Mar-14 31-Mar-15 – – 750 7,500TCHFL - Series W - FY 2013-14 3-Mar-14 31-Mar-15 – – 420 4,200TCHFL - Series P - FY 2012-13 26-Dec-12 26-Dec-14 – – 2,500 25,000TCHFL - Series C - FY 2011-12 24-Oct-11 23-Oct-14 – – 70 700TCHFL - Series D - FY 2011-12 2-Nov-11 23-Oct-14 – – 30 300TCHFL - Series B - FY 2013-14 18-Apr-13 23-May-14 – – 403 4,030TCHFL - Series H - FY 2012-13 16-Jul-12 1-Oct-15 40 400 40 400TCHFL - Series C - FY 2012-13 4-May-12 4-Aug-15 50 500 50 500TCHFL - Series BC - FY 2011-12 23-Feb-12 1-Jun-15 180 1,800 180 1,800TCHFL - Series A - FY 2012-13 10-Apr-12 2-Apr-15 – – 250 2,500TCHFL - Series BF - FY 2011-12 7-Mar-12 6-Mar-15 – – 100 1,000TCHFL - Series BB- FY 2011-12 17-Feb-12 9-Feb-15 – – 100 1,000TCHFL - Series W- FY 2011-12 1-Feb-12 3-Feb-15 – – 50 500TCHFL - Series T- FY 2011-12 25-Jan-12 23-Jan-15 – – 50 500TCHFL - Series H - FY 2011-12 23-Nov-11 10-Nov-14 – – 600 6,000TCHFL - Series I - FY 2012-13 24-Jul-12 24-Jul-14 – – 200 2,000TCHFL - Series Q - FY 2011-12 16-Jan-12 10-Jul-14 – – 300 3,000TCHFL - Series Y- FY 2011-12 9-Feb-12 13-May-14 – – 160 1,600TCHFL - Series F - FY 2012-13 15-May-12 8-May-14 – – 330 3,300TCHFL - Series P - FY 2011-12 16-Jan-12 25-Apr-14 – – 350 3,500TCHFL - Series V - FY 2012-13 15-Mar-13 11-Apr-14 – – 200 2,000TCHFL - Series W - FY 2012-13 15-Mar-13 10-Apr-14 – – 250 2,500TCHFL - Series BH - FY 2011-12 20-Mar-12 8-Apr-14 – – 220 2,200TCHFL - Series O - FY 2011-12 13-Jan-12 13-Jan-15 – – 250 2,337TOTAL 1,172,447 843,438Of which current maturities classified under “Current liabilities” in note No. 10 (399,498) (332,639)TOTAL 772,949 510,799
* Net of unamortised discount of ` 2 Lakh (Previous Year : ` 622 Lakh).
* Note : Coupon rate of “NCDs” outstanding as on March 31, 2015 varies from 8.35% to 11.25% (Previous Year : Varies from 8.35% to 11.25%)
NOTES TO AND FORMING PART OF THE CONSOLIDATED BALANCE SHEET AS AT MARCH 31, 2015

106
Annual Report 2014-15
(g) Particulars of Public issue of Secured Non-Convertible Debentures outstanding as on March 31, 2015
Description of NCD Issue Date Redemption Date Number of NCDs ` in Lakh
TCL NCD Option I (2009) March 6, 2009 March 5, 2019 310 310TCL NCD Option II (2009) March 6, 2009 March 5, 2019 177,875 1,779TCL NCD Option IIII (2009) March 6, 2009 March 5, 2019 1,497,029 14,970TCL NCD Option IV (2009) March 6, 2009 March 5, 2019 1,175,939 11,759Total 28,818
Note : Coupon rate of above outstanding as on March 31, 2015 varies from 9.75% to 10.50%Particulars of Public issue of Secured Non-Convertible Debentures outstanding as on March 31, 2014
Description of NCD Issue Date Redemption Date Number of NCDs ` in Lakh
TCL NCD Option I (2009) March 6, 2009 March 5, 2019 310 310TCL NCD Option II (2009) March 6, 2009 March 5, 2019 177,875 1,779TCL NCD Option IIII (2009) March 6, 2009 March 5, 2019 1,497,029 14,970TCL NCD Option IV (2009) March 6, 2009 March 5, 2019 1,175,939 11,759Total 28,818
Note : Coupon rate of above outstanding as on March 31, 2014 varies from 9.75% to 10.50%(h) Particulars of unsecured redeemable non convertible subordinated debentures (Tier II Bonds)
outstanding as on March 31, 2015
Description of NCD Issue Date Redemption Date Number of NCDs ` in Lakh*
TCL Tier II Bond ‘C’ FY 2014-15 30-Jan-15 30-Jan-25 750 7,500TCL Tier II Bond ‘B’ FY 2014-15 7-Jan-15 7-Jan-25 350 3,500TCL Tier II Bond ‘A’ FY 2014-15 26-Sep-14 25-Sep-24 1,000 10,000TCL Tier II Bond ‘H’ FY 2009-10 24-Dec-09 24-Dec-19 1,000 5,000TCL Tier II Bond ‘G’ FY 2009-10 18-Dec-09 18-Dec-19 3,000 15,000TCL Tier II Bond ‘E’ FY 2009-10 15-Dec-09 15-Dec-19 5,725 28,625TCL Tier II Bond ‘F’ FY 2009-10 30-Nov-09 30-Nov-19 1,135 3,599TCL Tier II Bond ‘C’ FY 2009-10 28-Oct-09 28-Oct-19 1,479 7,395TCL Tier II Bond ‘D’ FY 2009-10 28-Oct-09 28-Oct-19 1,580 7,900TCL Tier II Bond ‘B’ FY 2009-10 9-Sep-09 9-Sep-19 1,704 17,040TCL Tier II Bond ‘A’ FY 2009-10 4-Aug-09 4-Aug-19 391 3,910TCHFL Tier II Bonds ‘A’ FY 2014-15 26-Sep-14 26-Sep-24 480 4,800TCHFL Tier II Bonds ‘E’ FY-2013-14 18-Mar-14 18-Mar-24 4 40TCHFL Tier II Bonds ‘D’ FY-2013-14 10-Jan-14 10-Jan-24 77 770TCHFL Tier II Bonds ‘C’ FY-2013-14 20-May-13 19-May-23 10 100TCHFL Tier II Bonds ‘B’ FY-2013-14 23-Apr-13 23-Apr-23 21 210TCHFL Tier II Bonds ‘A’ FY-2013-14 15-Apr-13 15-Apr-23 250 2,500TCHFL Tier II Bonds ‘E’ FY-2012-13 28-Mar-13 28-Mar-23 150 1,500TCHFL Tier II Bonds ‘C’ FY-2012-13 30-May-12 30-May-22 300 3,000TCHFL Tier II Bonds ‘B’ FY-2012-13 30-May-12 30-May-22 3 30TCHFL Tier II Bonds ‘A’ FY-2012-13 10-May-12 10-May-22 10 100TCHFL Tier II Bonds ‘F’ FY-2011-12 12-Mar-12 12-Mar-22 102 1,020
NOTES TO AND FORMING PART OF THE CONSOLIDATED BALANCE SHEET AS AT MARCH 31, 2015

107
Description of NCD Issue Date Redemption Date Number of NCDs ` in Lakh*
TCHFL Tier II Bonds ‘E’ FY-2011-12 25-Jan-12 25-Jan-22 135 1,350TCHFL Tier II Bonds ‘D’ FY-2011-12 4-Nov-11 4-Nov-21 101 1,010TCHFL Tier II Bonds ‘C’ FY-2011-12 28-Oct-11 28-Oct-21 11 110TCHFL Tier II Bonds ‘B’ FY-2011-12 29-Sep-11 29-Sep-21 253 2,530TCHFL Tier II Bonds ‘A’ FY-2011-12 29-Jul-11 29-Jul-21 250 2,500Total 131,039
*Net of unamortised discount of ` 2,076 LakhNote : Coupon rate of above outstanding as on March 31, 2015 varies from 8.72% to 10.70%.
Particulars of unsecured redeemable non convertible subordinated debentures (Tier II Bonds) outstanding as on March 31, 2014
Description of NCD Issue Date Redemption Date Number of NCDs ` in Lakh*
TCL Tier II Bond ‘H’ FY 2009-10 24-Dec-09 24-Dec-19 1,000 5,000TCL Tier II Bond ‘G’ FY 2009-10 18-Dec-09 18-Dec-19 3,000 15,000TCL Tier II Bond ‘E’ FY 2009-10 15-Dec-09 15-Dec-19 5,725 28,625TCL Tier II Bond ‘F’ FY 2009-10 30-Nov-09 30-Nov-19 1,135 3,269TCL Tier II Bond ‘C’ FY 2009-10 28-Oct-09 28-Oct-19 1,479 7,395TCL Tier II Bond ‘D’ FY 2009-10 28-Oct-09 28-Oct-19 1,580 7,900TCL Tier II Bond ‘B’ FY 2009-10 9-Sep-09 9-Sep-19 1,704 17,040TCL Tier II Bond ‘A’ FY 2009-10 4-Aug-09 4-Aug-19 391 3,910TCHFL Tier II Bonds ‘E’ FY-2013-14 18-Mar-14 18-Mar-24 4 40TCHFL Tier II Bonds ‘D’ FY-2013-14 10-Jan-14 10-Jan-24 77 770TCHFL Tier II Bonds ‘C’ FY-2013-14 20-May-13 19-May-23 10 100TCHFL Tier II Bonds ‘B’ FY-2013-14 23-Apr-13 23-Apr-23 21 210TCHFL Tier II Bonds ‘A’ FY-2013-14 15-Apr-13 15-Apr-23 250 2,500TCHFL Tier II Bonds ‘E’ FY-2012-13 28-Mar-13 28-Mar-23 150 1,500TCHFL Tier II Bonds ‘C’ FY-2012-13 30-May-12 30-May-22 300 3,000TCHFL Tier II Bonds ‘B’ FY-2012-13 30-May-12 30-May-22 3 30TCHFL Tier II Bonds ‘A’ FY-2012-13 10-May-12 10-May-22 10 100TCHFL Tier II Bonds ‘F’ FY-2011-12 12-Mar-12 12-Mar-22 102 1,020TCHFL Tier II Bonds ‘E’ FY-2011-12 25-Jan-12 25-Jan-22 135 1,350TCHFL Tier II Bonds ‘D’ FY-2011-12 4-Nov-11 4-Nov-21 101 1,010TCHFL Tier II Bonds ‘C’ FY-2011-12 28-Oct-11 28-Oct-21 11 110TCHFL Tier II Bonds ‘B’ FY-2011-12 29-Sep-11 29-Sep-21 253 2,530TCHFL Tier II Bonds ‘A’ FY-2011-12 29-Jul-11 29-Jul-21 250 2,500Total 104,909
* Net of unamortised discount of ` 2,406 Lakh
Note : Coupon rate of above outstanding as on March 31, 2014 varies from 8.72% to 10.70%.
NOTES TO AND FORMING PART OF THE CONSOLIDATED BALANCE SHEET AS AT MARCH 31, 2015
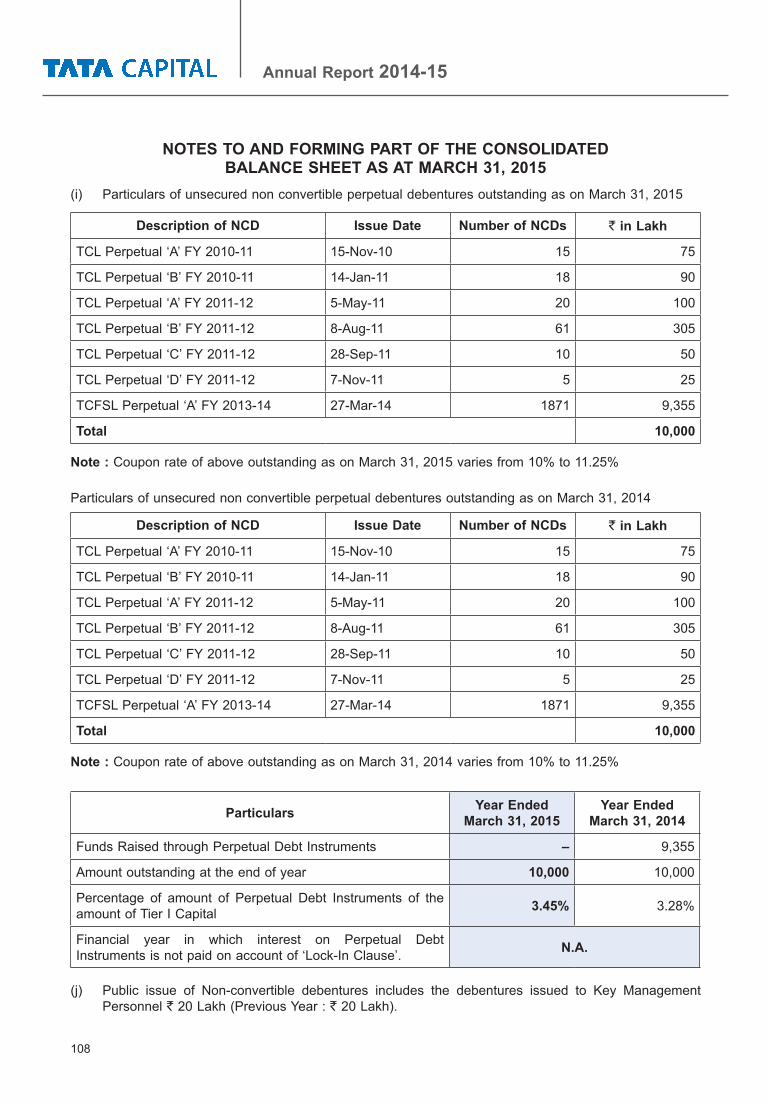
108
Annual Report 2014-15
(i) Particulars of unsecured non convertible perpetual debentures outstanding as on March 31, 2015
Description of NCD Issue Date Number of NCDs ` in Lakh
TCL Perpetual ‘A’ FY 2010-11 15-Nov-10 15 75
TCL Perpetual ‘B’ FY 2010-11 14-Jan-11 18 90
TCL Perpetual ‘A’ FY 2011-12 5-May-11 20 100
TCL Perpetual ‘B’ FY 2011-12 8-Aug-11 61 305
TCL Perpetual ‘C’ FY 2011-12 28-Sep-11 10 50
TCL Perpetual ‘D’ FY 2011-12 7-Nov-11 5 25
TCFSL Perpetual ‘A’ FY 2013-14 27-Mar-14 1871 9,355
Total 10,000
Note : Coupon rate of above outstanding as on March 31, 2015 varies from 10% to 11.25%
Particulars of unsecured non convertible perpetual debentures outstanding as on March 31, 2014
Description of NCD Issue Date Number of NCDs ` in Lakh
TCL Perpetual ‘A’ FY 2010-11 15-Nov-10 15 75
TCL Perpetual ‘B’ FY 2010-11 14-Jan-11 18 90
TCL Perpetual ‘A’ FY 2011-12 5-May-11 20 100
TCL Perpetual ‘B’ FY 2011-12 8-Aug-11 61 305
TCL Perpetual ‘C’ FY 2011-12 28-Sep-11 10 50
TCL Perpetual ‘D’ FY 2011-12 7-Nov-11 5 25
TCFSL Perpetual ‘A’ FY 2013-14 27-Mar-14 1871 9,355
Total 10,000
Note : Coupon rate of above outstanding as on March 31, 2014 varies from 10% to 11.25%
Particulars Year Ended March 31, 2015
Year Ended March 31, 2014
Funds Raised through Perpetual Debt Instruments – 9,355
Amount outstanding at the end of year 10,000 10,000
Percentage of amount of Perpetual Debt Instruments of the amount of Tier I Capital 3.45% 3.28%
Financial year in which interest on Perpetual Debt Instruments is not paid on account of ‘Lock-In Clause’. N.A.
(j) Public issue of Non-convertible debentures includes the debentures issued to Key Management Personnel ` 20 Lakh (Previous Year : ` 20 Lakh).
NOTES TO AND FORMING PART OF THE CONSOLIDATED BALANCE SHEET AS AT MARCH 31, 2015

109
NOTE “5” (` in lakh)
DEFERRED TAX LIABILITIES As at March 31, 2015
As at March 31, 2014
Deferred Tax Liabilities (net) 133 22
Total 133 22
5(a) The major components of deferred tax assets and deferred tax liabilities arising out of timing differences are as under:
Particulars As at March 31, 2015
As at March 31, 2014
Deferred Tax Liabilities(a) On account of loan sourcing cost 206 35
(b) Debenture issue expenses 3 –
Deferred Tax Assets(a) Contingent Provision for Standard Assets (58) (11)
(b) Provision for restructured assets (13) –
(c) Timing difference in respect of depreciation on fixed assets (1) –
(d) Others (4) (2)
Net Deferred Tax Liabilities 133 22
NOTE “6” (` in lakh)
OTHER LONG-TERM LIABILITIES As at March 31, 2015
As at March 31, 2014
(a) Premium on redemption payable to preference shareholders
10,355 10,355
(b) Others (i) Interest accrued but not due on borrowings 9,659 8,876 (ii) Income received in advance 349 233 (iii) Sundry liabilities account (interest capitalisation) 3,735 –Total 24,098 19,464
NOTE “7” (` in lakh)
LONG-TERM PROVISIONS As at March 31, 2015
As at March 31, 2014
(a) Provision for employee benefits 258 187(b) Contingent Provision against Standard Assets (Refer Note No. 31)
7,309 5,648
Total 7,567 5,835
NOTES TO AND FORMING PART OF THE CONSOLIDATED BALANCE SHEET AS AT MARCH 31, 2015

110
Annual Report 2014-15
NOTES TO AND FORMING PART OF THE CONSOLIDATED BALANCE SHEET AS AT MARCH 31, 2015
NOTE “8” (` in lakh)
SHORT-TERM BORROWINGSAs at
March 31, 2015
As at March 31,
2014(a) Loans repayable on demand Secured (i) From Banks (1) Working capital demand loan (Refer Note No. 4 (c) above) 49,858 68,520 (2) Bank Overdraft (Refer Note No. 4 (c) above) 310,555 266,772 Unsecured (i) From Banks (1) Working capital demand loan 29,405 17,970 (2) Bank Overdraft – 245(b) Collateralised Borrowings and Lending Obligations (CBLO) (Secured) (Refer Notes No. 8.2 and 8.3 below)
[Net of unamortised discount of ` 64 Lakh (as at March 31, 2014: ` Nil)]
46,936 –
(c) Deposits Unsecured Inter Corporate Deposits 4,500 28,000(d) Other loans and advances Unsecured (i) Term Loans from Banks (Refer Note No. 4 (d) above) 15,569 32,863 (ii) Commercial Papers (Refer Note No. 8.1 below) 506,075 357,047
[(Net of unamortised discount of ` 10,475 Lakh) (as at March 31, 2014 ` 8,888 Lakh)]
Total 962,898 771,417Notes8.1. Discount on Commercial Papers varies between 8.26% to 9.80% (Previous Year: 8.85% to 11%).8.2. Discount on Collateralised Borrowings and Lending Obligations (CBLO) varies between 7.09% to 10%
(Previous Year: 6.25% to 10.23%)8.3. Collateralised Borrowings and Lending Obligations (CBLO) are secured by the Company’s
investment in Government Securities and are repayable in 7 days.
NOTE “9” (` in lakh)
TRADE PAYABLESAs at
March 31, 2015
As at March 31,
2014(a) Accrued employee benefit expenses 4,399 4,699(b) Accrued expenses 1,3460 10,795(c) Others 18,005 15,955Total 35,864 31,449
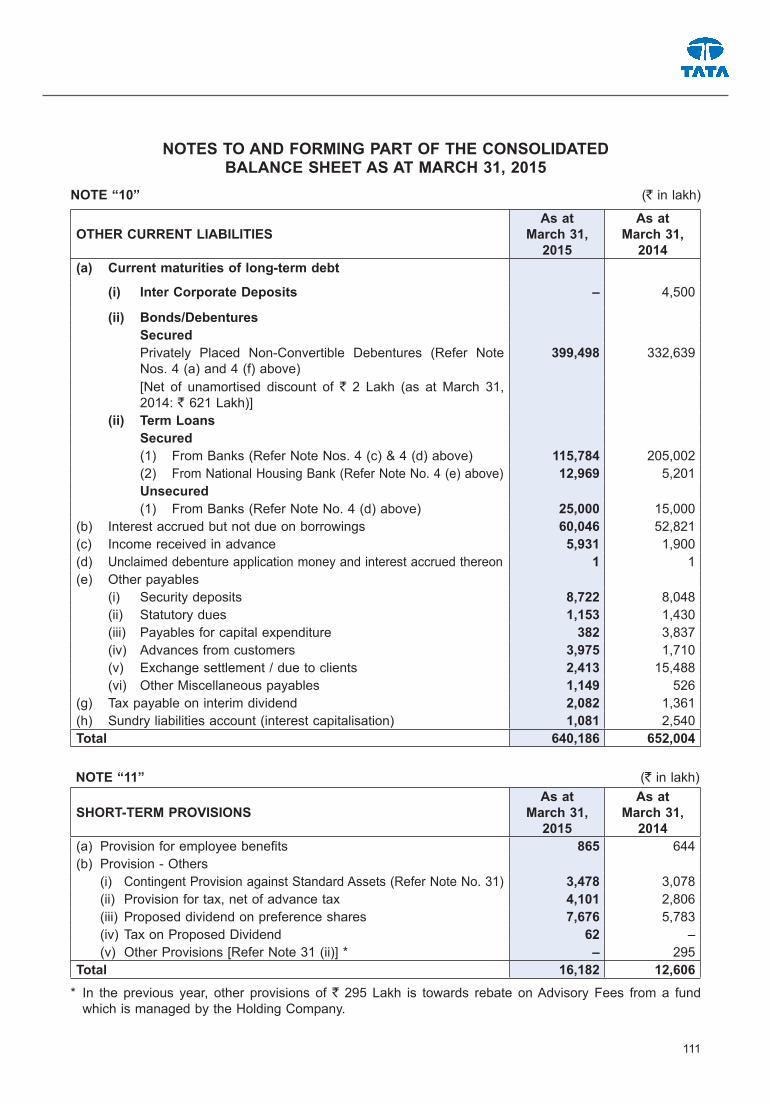
111
NOTES TO AND FORMING PART OF THE CONSOLIDATED BALANCE SHEET AS AT MARCH 31, 2015
NOTE “10” (` in lakh)
OTHER CURRENT LIABILITIESAs at
March 31, 2015
As at March 31,
2014(a) Current maturities of long-term debt
(i) Inter Corporate Deposits – 4,500
(ii) Bonds/Debentures Secured
Privately Placed Non-Convertible Debentures (Refer Note Nos. 4 (a) and 4 (f) above)
399,498 332,639
[Net of unamortised discount of ` 2 Lakh (as at March 31, 2014: ` 621 Lakh)]
(ii) Term Loans Secured
(1) From Banks (Refer Note Nos. 4 (c) & 4 (d) above) 115,784 205,002 (2) From National Housing Bank (Refer Note No. 4 (e) above) 12,969 5,201
Unsecured (1) From Banks (Refer Note No. 4 (d) above) 25,000 15,000(b) Interest accrued but not due on borrowings 60,046 52,821(c) Income received in advance 5,931 1,900(d) Unclaimed debenture application money and interest accrued thereon 1 1(e) Other payables (i) Security deposits 8,722 8,048 (ii) Statutory dues 1,153 1,430 (iii) Payables for capital expenditure 382 3,837 (iv) Advances from customers 3,975 1,710 (v) Exchange settlement / due to clients 2,413 15,488 (vi) Other Miscellaneous payables 1,149 526(g) Tax payable on interim dividend 2,082 1,361(h) Sundry liabilities account (interest capitalisation) 1,081 2,540Total 640,186 652,004
NOTE “11” (` in lakh)
SHORT-TERM PROVISIONSAs at
March 31, 2015
As at March 31,
2014(a) Provision for employee benefits 865 644(b) Provision - Others (i) Contingent Provision against Standard Assets (Refer Note No. 31) 3,478 3,078 (ii) Provision for tax, net of advance tax 4,101 2,806 (iii) Proposed dividend on preference shares 7,676 5,783 (iv) Tax on Proposed Dividend 62 – (v) Other Provisions [Refer Note 31 (ii)] * – 295Total 16,182 12,606
* In the previous year, other provisions of ` 295 Lakh is towards rebate on Advisory Fees from a fund which is managed by the Holding Company.
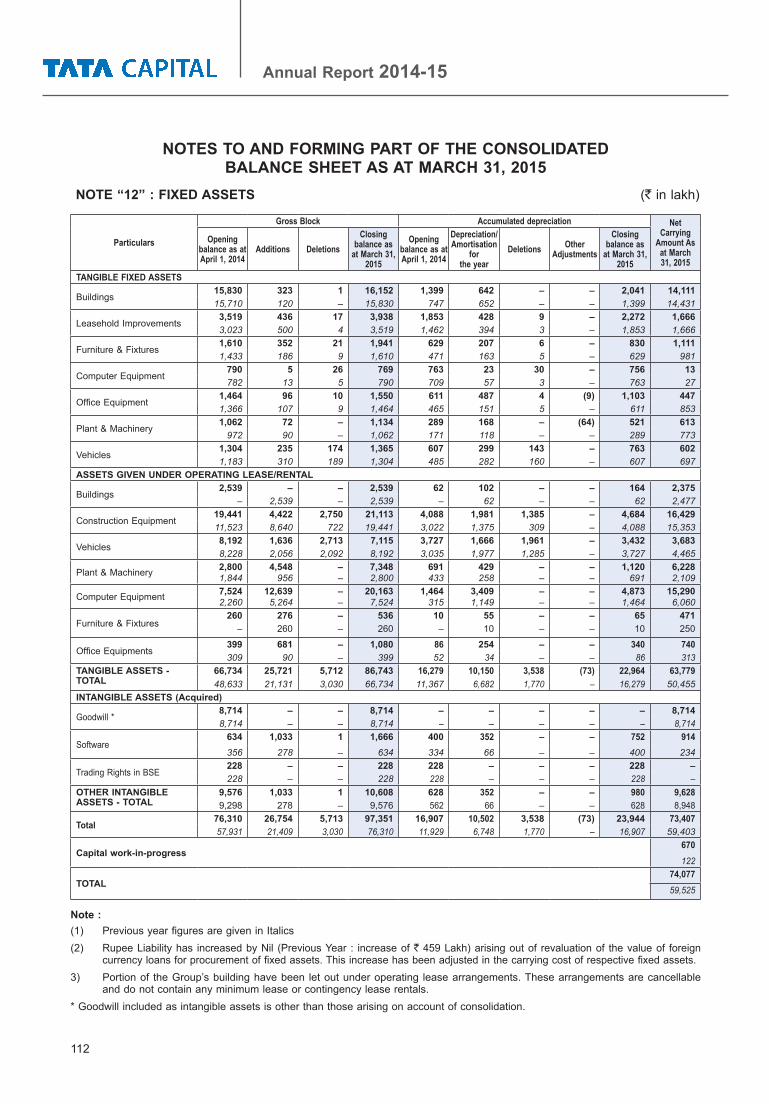
112
Annual Report 2014-15
NOTES TO AND FORMING PART OF THE CONSOLIDATED BALANCE SHEET AS AT MARCH 31, 2015
NOTE “12” : FIXED ASSETS (` in lakh)
Particulars
Gross Block Accumulated depreciation Net Carrying
Amount As at March 31, 2015
Opening balance as at April 1, 2014
Additions DeletionsClosing
balance as at March 31,
2015
Opening balance as at April 1, 2014
Depreciation/ Amortisation
for the year
Deletions Other Adjustments
Closing balance as
at March 31, 2015
TANGIBLE FIXED ASSETS
Buildings15,830 323 1 16,152 1,399 642 – – 2,041 14,11115,710 120 – 15,830 747 652 – – 1,399 14,431
Leasehold Improvements3,519 436 17 3,938 1,853 428 9 – 2,272 1,6663,023 500 4 3,519 1,462 394 3 – 1,853 1,666
Furniture & Fixtures1,610 352 21 1,941 629 207 6 – 830 1,1111,433 186 9 1,610 471 163 5 – 629 981
Computer Equipment790 5 26 769 763 23 30 – 756 13782 13 5 790 709 57 3 – 763 27
Office Equipment1,464 96 10 1,550 611 487 4 (9) 1,103 4471,366 107 9 1,464 465 151 5 – 611 853
Plant & Machinery1,062 72 – 1,134 289 168 – (64) 521 613
972 90 – 1,062 171 118 – – 289 773
Vehicles1,304 235 174 1,365 607 299 143 – 763 6021,183 310 189 1,304 485 282 160 – 607 697
ASSETS GIVEN UNDER OPERATING LEASE/RENTAL
Buildings2,539 – – 2,539 62 102 – – 164 2,375
– 2,539 – 2,539 – 62 – – 62 2,477
Construction Equipment19,441 4,422 2,750 21,113 4,088 1,981 1,385 – 4,684 16,42911,523 8,640 722 19,441 3,022 1,375 309 – 4,088 15,353
Vehicles8,192 1,636 2,713 7,115 3,727 1,666 1,961 – 3,432 3,6838,228 2,056 2,092 8,192 3,035 1,977 1,285 – 3,727 4,465
Plant & Machinery 2,800 4,548 – 7,348 691 429 – – 1,120 6,2281,844 956 – 2,800 433 258 – – 691 2,109
Computer Equipment 7,524 12,639 – 20,163 1,464 3,409 – – 4,873 15,2902,260 5,264 – 7,524 315 1,149 – – 1,464 6,060
Furniture & Fixtures260 276 – 536 10 55 – – 65 471
– 260 – 260 – 10 – – 10 250
Office Equipments399 681 – 1,080 86 254 – – 340 740309 90 – 399 52 34 – – 86 313
TANGIBLE ASSETS - TOTAL
66,734 25,721 5,712 86,743 16,279 10,150 3,538 (73) 22,964 63,77948,633 21,131 3,030 66,734 11,367 6,682 1,770 – 16,279 50,455
INTANGIBLE ASSETS (Acquired)
Goodwill *8,714 – – 8,714 – – – – – 8,7148,714 – – 8,714 – – – – – 8,714
Software634 1,033 1 1,666 400 352 – – 752 914356 278 – 634 334 66 – – 400 234
Trading Rights in BSE228 – – 228 228 – – – 228 –228 – – 228 228 – – – 228 –
OTHER INTANGIBLE ASSETS - TOTAL
9,576 1,033 1 10,608 628 352 – – 980 9,6289,298 278 – 9,576 562 66 – – 628 8,948
Total76,310 26,754 5,713 97,351 16,907 10,502 3,538 (73) 23,944 73,40757,931 21,409 3,030 76,310 11,929 6,748 1,770 – 16,907 59,403
Capital work-in-progress670122
TOTAL74,07759,525
Note :(1) Previous year figures are given in Italics(2) Rupee Liability has increased by Nil (Previous Year : increase of ` 459 Lakh) arising out of revaluation of the value of foreign
currency loans for procurement of fixed assets. This increase has been adjusted in the carrying cost of respective fixed assets.3) Portion of the Group’s building have been let out under operating lease arrangements. These arrangements are cancellable
and do not contain any minimum lease or contingency lease rentals.* Goodwill included as intangible assets is other than those arising on account of consolidation.

113
NOTES TO AND FORMING PART OF THE CONSOLIDATED BALANCE SHEET AS AT MARCH 31, 2015
NOTE “13” INVESTMENTS (` in lakh)
INVESTMENTS
As at March 31, 2015 As at March 31, 2014
Non-Current Investments
Current portion of
Non-Current Investments
Non-Current Investments
Current portion of
Non-Current Investments
Long-Term InvestmentsInvestments in AssociatesUnquoted :
Carrying amount of investments in associates (Refer Note 29)
50,228 – 47,039 –
Investment in Security Receipts 882 – 777 –
Investments in OthersQuoted
Investment in Equity Shares 29,483 – 30,608 19,405Investment in Debentures 47,504 – 15,301 –Investment in Government Securities 48,457 500 8,026 1,481
UnquotedInvestment in Equity Shares 35,289 – 14,130 –Investment in Preference shares 14,971 389 13,339 1,022Investment in Venture Capital Fund 1,779 – 926 –
Less: Provision for diminution in value of investments
(19,427) (3) (25,931) –
Total Long-Term Investments 209,166 886 104,214 21,908
(` in lakh)
INVESTMENTS As at March 31, 2015
As at March 31, 2014
CURRENT INVESTMENTSQuoted :
Investment in Equity Shares 112 –Quoted
Investment in Debentures – 14,479Investment in Units of Mutual Funds 55 55
Total Current Investments 167 14,534
Total Investments 209,166 1,053 104,214 36,442
(` in lakh)As at March 31, 2015 As at March 31, 2014
Particulars Non-Current Investments
Current Investments
Non-Current Investments
Current Investments
Book value of Quoted investments 110,219 662 32,957 35,420Market value of Quoted investments 115,956 661 35,186 40,481Book value of Unquoted investments 98,947 391 71,257 1,022
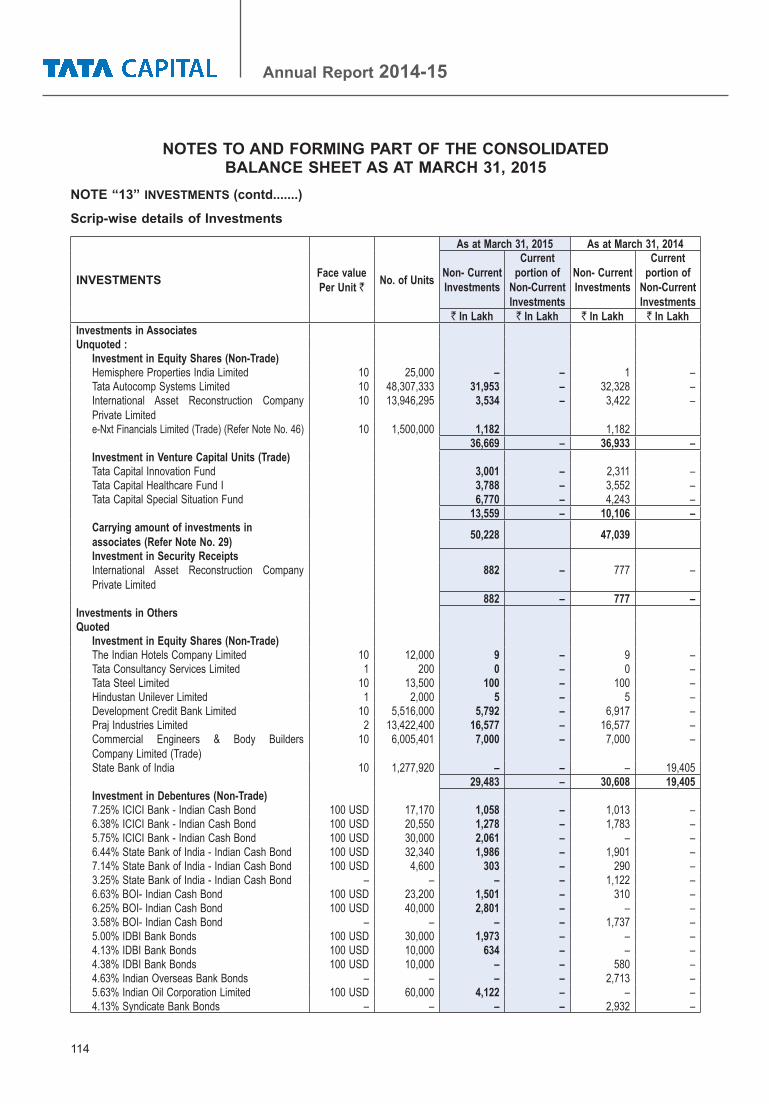
114
Annual Report 2014-15
NOTES TO AND FORMING PART OF THE CONSOLIDATED BALANCE SHEET AS AT MARCH 31, 2015
NOTE “13” INVESTMENTS (contd.......)
Scrip-wise details of Investments
INVESTMENTS Face value Per Unit ` No. of Units
As at March 31, 2015 As at March 31, 2014
Non- Current Investments
Current portion of
Non-Current Investments
Non- Current Investments
Current portion of
Non-Current Investments
` In Lakh ` In Lakh ` In Lakh ` In LakhInvestments in AssociatesUnquoted :
Investment in Equity Shares (Non-Trade)Hemisphere Properties India Limited 10 25,000 – – 1 –Tata Autocomp Systems Limited 10 48,307,333 31,953 – 32,328 –International Asset Reconstruction Company Private Limited
10 13,946,295 3,534 – 3,422 –
e-Nxt Financials Limited (Trade) (Refer Note No. 46) 10 1,500,000 1,182 1,18236,669 – 36,933 –
Investment in Venture Capital Units (Trade)Tata Capital Innovation Fund 3,001 – 2,311 –Tata Capital Healthcare Fund I 3,788 – 3,552 –Tata Capital Special Situation Fund 6,770 – 4,243 –
13,559 – 10,106 –Carrying amount of investments in associates (Refer Note No. 29) 50,228 47,039
Investment in Security ReceiptsInternational Asset Reconstruction Company Private Limited
882 – 777 –
882 – 777 –Investments in OthersQuoted
Investment in Equity Shares (Non-Trade)The Indian Hotels Company Limited 10 12,000 9 – 9 –Tata Consultancy Services Limited 1 200 0 – 0 –Tata Steel Limited 10 13,500 100 – 100 –Hindustan Unilever Limited 1 2,000 5 – 5 –Development Credit Bank Limited 10 5,516,000 5,792 – 6,917 –Praj Industries Limited 2 13,422,400 16,577 – 16,577 –Commercial Engineers & Body Builders Company Limited (Trade)
10 6,005,401 7,000 – 7,000 –
State Bank of India 10 1,277,920 – – – 19,40529,483 – 30,608 19,405
Investment in Debentures (Non-Trade)7.25% ICICI Bank - Indian Cash Bond 100 USD 17,170 1,058 – 1,013 –6.38% ICICI Bank - Indian Cash Bond 100 USD 20,550 1,278 – 1,783 –5.75% ICICI Bank - Indian Cash Bond 100 USD 30,000 2,061 – – –6.44% State Bank of India - Indian Cash Bond 100 USD 32,340 1,986 – 1,901 –7.14% State Bank of India - Indian Cash Bond 100 USD 4,600 303 – 290 –3.25% State Bank of India - Indian Cash Bond – – – – 1,122 –6.63% BOI- Indian Cash Bond 100 USD 23,200 1,501 – 310 –6.25% BOI- Indian Cash Bond 100 USD 40,000 2,801 – – –3.58% BOI- Indian Cash Bond – – – – 1,737 –5.00% IDBI Bank Bonds 100 USD 30,000 1,973 – – –4.13% IDBI Bank Bonds 100 USD 10,000 634 – – –4.38% IDBI Bank Bonds 100 USD 10,000 – – 580 –4.63% Indian Overseas Bank Bonds – – – – 2,713 –5.63% Indian Oil Corporation Limited 100 USD 60,000 4,122 – – –4.13% Syndicate Bank Bonds – – – – 2,932 –

115
NOTES TO AND FORMING PART OF THE CONSOLIDATED BALANCE SHEET AS AT MARCH 31, 2015
NOTE “13” INVESTMENTS (contd.......)
Scrip-wise details of Investments
INVESTMENTS Face value Per Unit ` No. of Units
As at March 31, 2015 As at March 31, 2014
Non- Current Investments
Current portion of
Non-Current Investments
Non- Current Investments
Current portion of
Non-Current Investments
` In Lakh ` In Lakh ` In Lakh ` In Lakh6.37% Canara Bank 100 USD 15,000 958 – – –4.63% Union Bank Bond – – – – 920 –4.55% Union Bank Bond 100 USD 36,000 2,330 – – –7.25% Axis Bank Bond 100 USD 10,000 670 – – –6.63% Bank of Baroda Bond 100 USD 8,400 550 – – –5.63% NTPC Bond 100 USD 20,000 1,375 – – –6.65% Tata International Bond 100 SGD 300,000 13,623 – – –4.85% ABJA Bonds 100 USD 65,000 4,227 – – –4.63% Tata Motors Limited Bond 100 USD 10,000 637 – – –5.75% Tata Motors Limited Bond 100 USD 10,000 656 – – –4.25% Tata Motors Limited Bond 100 USD 105,000 4,760 – – –The Indian Hotels Company Limited 55 2,700 1 – – –
47,504 – 15,301 –Investment in Government Securities (Non-Trade)6.07% GOI 2014 – – – – – 1,4816.49% GOI 2015 100 500,000 – 500 499 –6.90% GOI 2019 100 1,500,000 1,502 – 1,504 –8.07% GOI 2017 100 2,000,000 1,994 – 1,989 –7.16% GOI 2023 100 7,500,000 6,935 – – –7.80% GOI 2020 100 6,500,000 6,347 – – –8.12% GOI 2020 100 8,000,000 7,937 – – –8.35% GOI 2022 100 10,000,000 9,995 – – –8.83% GOI 2023 100 8,000,000 8,231 – – –8.40% GOI 2024 100 1,500,000 1,502 – – –8.07% GOI 2017 100 2,500,000 2,466 – 2,444 –7.94% GOI 2021 100 1,500,000 1,548 – 1,590 –
48,457 500 8,026 1,481Unquoted :Investment in Equity Shares (Non-Trade)QuikJet Cargo Airlines Private Limited 10 3,259,008 – – 339 –Lands End Properties Limited 10 1,990,000 199 – 199 –Adithya Automotives Private Limited 10 1,396,500 140 – 140 –Roots Corporation Limited 90 2,089,269 1,880 – 1,880 –Tata Sky Limited 10 10,072,871 5,242 – 2,137 –Tata Technologies Limited (Trade) 10 1,873,253 4,707 – 4,707 –Star Health & Allied Insurance Company Limited (Trade)
10 15,723,270 5,000 – 4,000 –
SKS Ispat & Power Limited 10,000 3,202,905 1,029 – 728 –Shriram Properties Private Limited 10 1,913,465 2,773 – – –Tata Tele Services Limited (Refer Note No. 42) 10 62,250,000 14,318 – – –Aricent Technologies Holdings Limited 10 8 – – – –Standard Greases and Specialities Pvt Limited (Trade) 10 200 1 – – –
35,289 – 14,130 –Investment in Preference Shares (Non-Trade)12% KCP Limited Cumulative Redeemable Preference Shares
10 15,000,000 – – – 800

116
Annual Report 2014-15
NOTES TO AND FORMING PART OF THE CONSOLIDATED BALANCE SHEET AS AT MARCH 31, 2015
NOTE “13” INVESTMENTS (contd.......)
Scrip-wise details of Investments
INVESTMENTS Face value Per Unit ` No. of Units
As at March 31, 2015 As at March 31, 2014
Non- Current Investments
Current portion of
Non-Current Investments
Non- Current Investments
Current portion of
Non-Current Investments
` In Lakh ` In Lakh ` In Lakh ` In Lakh0.001% QuikJet Cargo Airlines Private Limited Cumulative Convertible Preference Shares
10 4,688,519 – – 587 –
0.001% Spandana Spoorthy Financial Limited Optionally Convertible Cumulative Redeemable Preference Shares
10 20,400,000 1,428 357 1,734 204
0.001% Share Microfin Limited Optionally Convertible Cumulative Redeemable Preference Shares
10 1,800,000 126 32 153 18
11.35% Coromondal Engineering Private Limited – – 840 –Vanu Inc 6,272 – 6,004 –Varroc Engineering Pvt Limited Series A CCPS 100 2,521,007 2,521 – 2,521 –Standard Greases and Specialities Pvt Limited (Trade)
10 555,998 3,124 – – –
8% e-Nxt Financials Limited Cumulative Redeemable Preference Shares (Trade)
10 15,000,000 1,500 – 1,500 –
14,971 389 13,339 1,022Investment in Venture Capital FundPitango Venture Capital Fund VI L.P. 1,779 – 926 –
1,779 – 926 –Less: Provision for diminution in value of investments
(19,427) (3) (25,931) –
Total Long-Term Investments 209,166 886 104,214 21,908
(` in lakh)
INVESTMENTS Face value Per Unit ` No. of Units As at
March 31, 2015As at
March 31, 2014CURRENT INVESTMENTSQuoted :
Investment in Equity SharesIVRCL Limited 2 706,149 112 –
112 –Investment in Debentures4.5% Tata Steel Bonds – 11,9371.75% Tata Power Bonds – 2,543
– 14,479Investment in Units of Mutual FundsHDFC Debt Fund For Cancer Cure 10 500,000 50 50Kotak Flexi Debt Institutional Fund 10 50,000 5 5
55 55Total Current Investments 167 14,534
(` in lakh)
ParticularsAs at March 31, 2015 As at March 31, 2014
Non-Current Investments
Current Investments
Non-Current Investments
Current Investments
Total Investments 209,166 1,053 104,214 36,442Book value of Quoted investments 110,219 662 32,957 35,420Market value of Quoted investments 115,956 661 35,186 40,481Book value of Unquoted investments 98,947 391 71,257 1,022

117
NOTES TO AND FORMING PART OF THE CONSOLIDATED BALANCE SHEET AS AT MARCH 31, 2015
NOTE “14” (` in lakh)
DEFERRED TAX ASSETS As at March 31, 2015
As at March 31, 2014
Deferred Tax Assets
(a) On account of provisions for non-performing assets 17,328 7,438
(b) Provision for restructured advances 1,086 –
(c) Contingent Provision for Standard Assets 3,675 2,956
(d) Employee benefits 268 256
(e) Timing difference in respect of depreciation on fixed assets 377 53
(f) Others 470 1,279
Deferred Tax Liabilities (a) Timing difference in respect of depreciation on fixed
assets(4,402) (2,302)
(b) Debenture issue expenses (302) (264)
(c) Special Reserve u/s 36(1) (viii) (Refer Note No. 42) (1,085) –
Total 17,415 9,416
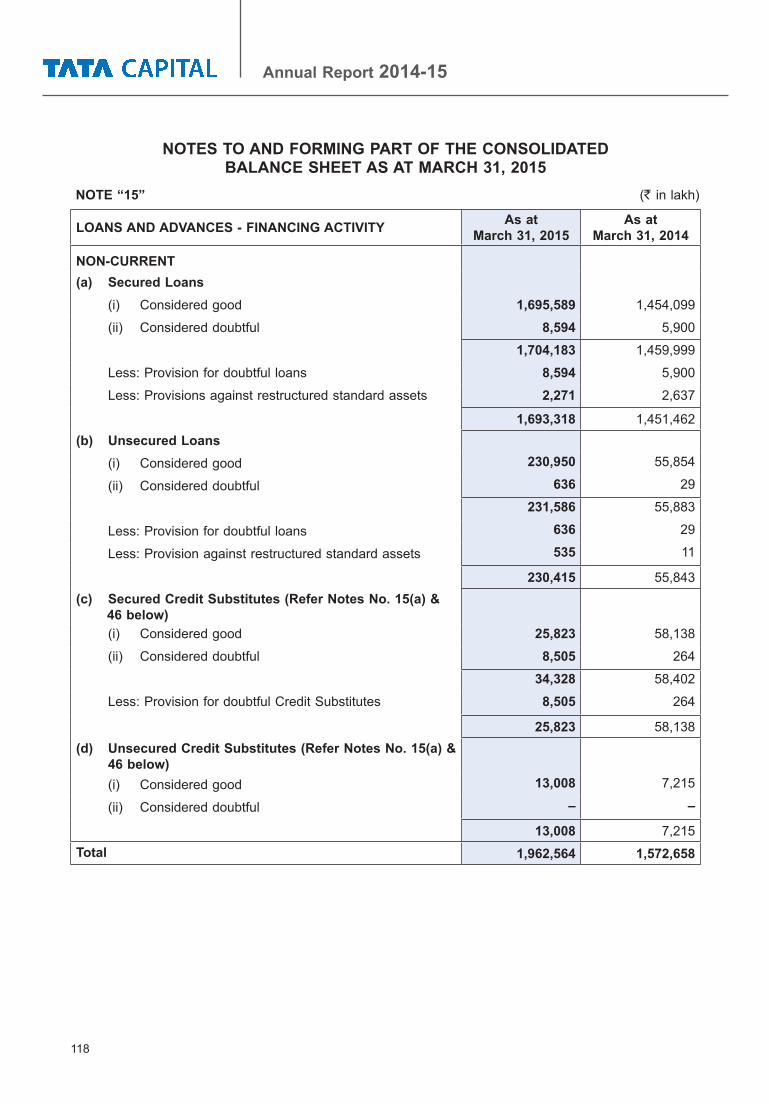
118
Annual Report 2014-15
NOTES TO AND FORMING PART OF THE CONSOLIDATED BALANCE SHEET AS AT MARCH 31, 2015
NOTE “15” (` in lakh)
LOANS AND ADVANCES - FINANCING ACTIVITY As at March 31, 2015
As at March 31, 2014
NON-CURRENT(a) Secured Loans (i) Considered good 1,695,589 1,454,099
(ii) Considered doubtful 8,594 5,900
1,704,183 1,459,999
Less: Provision for doubtful loans 8,594 5,900
Less: Provisions against restructured standard assets 2,271 2,637
1,693,318 1,451,462(b) Unsecured Loans (i) Considered good 230,950 55,854
(ii) Considered doubtful 636 29
231,586 55,883
Less: Provision for doubtful loans 636 29
Less: Provision against restructured standard assets 535 11
230,415 55,843 (c) Secured Credit Substitutes (Refer Notes No. 15(a) & 46 below) (i) Considered good 25,823 58,138
(ii) Considered doubtful 8,505 264
34,328 58,402
Less: Provision for doubtful Credit Substitutes 8,505 264
25,823 58,138(d) Unsecured Credit Substitutes (Refer Notes No. 15(a) & 46 below) (i) Considered good 13,008 7,215
(ii) Considered doubtful – –
13,008 7,215Total 1,962,564 1,572,658
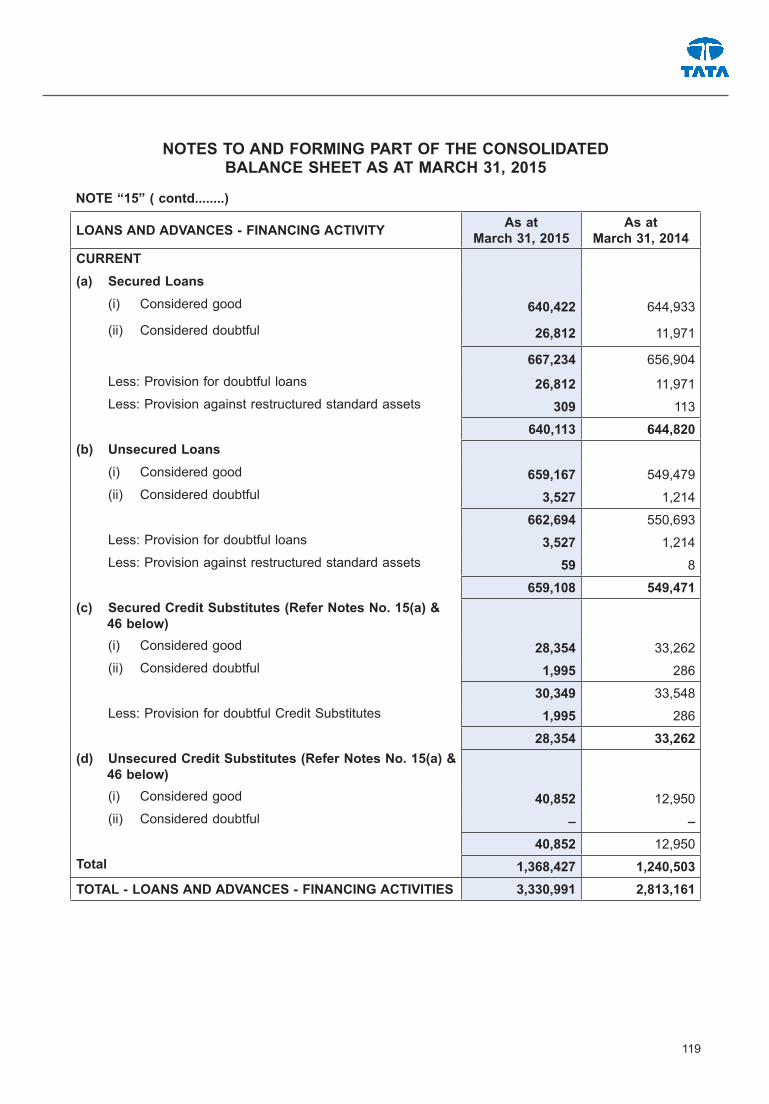
119
LOANS AND ADVANCES - FINANCING ACTIVITY As at March 31, 2015
As at March 31, 2014
CURRENT (a) Secured Loans (i) Considered good 640,422 644,933
(ii) Considered doubtful 26,812 11,971
667,234 656,904 Less: Provision for doubtful loans 26,812 11,971 Less: Provision against restructured standard assets 309 113
640,113 644,820 (b) Unsecured Loans (i) Considered good 659,167 549,479 (ii) Considered doubtful 3,527 1,214
662,694 550,693 Less: Provision for doubtful loans 3,527 1,214 Less: Provision against restructured standard assets 59 8
659,108 549,471(c) Secured Credit Substitutes (Refer Notes No. 15(a) & 46 below) (i) Considered good 28,354 33,262 (ii) Considered doubtful 1,995 286
30,349 33,548 Less: Provision for doubtful Credit Substitutes 1,995 286
28,354 33,262(d) Unsecured Credit Substitutes (Refer Notes No. 15(a) & 46 below) (i) Considered good 40,852 12,950 (ii) Considered doubtful – –
40,852 12,950Total 1,368,427 1,240,503TOTAL - LOANS AND ADVANCES - FINANCING ACTIVITIES 3,330,991 2,813,161
NOTES TO AND FORMING PART OF THE CONSOLIDATED BALANCE SHEET AS AT MARCH 31, 2015
NOTE “15” ( contd........)

120
Annual Report 2014-15
NOTES TO AND FORMING PART OF THE CONSOLIDATED BALANCE SHEET AS AT MARCH 31, 2015
NOTE 15(a). Scrip-wise details of Credit Substitutes. (` in lakh)
PARTICULARSFace value
Per Unit
No. of Units
As at March 31, 2015
As at March 31, 2014
Non- Current Current Non-
Current Current
Quoted :Investment in Debentures (Trade)5% Trent Limited 1,000,000 100 – 1,000 1,000 –10.25% Shriram Transport Finance Company Limited 1,000,000 250 2,500 – 2,500 –
10.40% Meghmani Organics Limited 100,000 2,000 – 2,000 2,000 2,000 11.80% Elder Pharmaceuticals Limited 1,000,000 150 – 375 375 500 12.75% Diamond Power Infra limited 100,000 1,666 510 850 1,360 340 10.75% Kiri Industries Limited 1,000,000 400 – 1,663 2,312 963 12.90% Cholamandalam Investment & Finance Company Limited 500,000 1 – 5 – 6,010
10.50% Tulip Telecom Limited - CDR 1,000,000 1,850 17,344 1,156 18,500 –
12.65% Consolidated Construction Consortium Limited 1,000,000 200 2,000 – 800 1,000
12.25% Kolte Patil Developers Limited 1,000,000 400 4,000 – – – 12.50% Srei Equipment Finance Ltd 65 – – – 12.90% Godawari Power and Ispat Ltd 1,000,000 300 750 2,250 3,000 – 10% Indian Overseas Bank 1,000,000 400 – 4,000 –
27,169 13,299 31,847 10,813 Unquoted : Investment in Preference Shares (Trade)10.75% Kiri Industries Limited – 433 – – 11.50% Mcnally Bharat Engineering Co Ltd Cumulative Non Convertible Redeemable Preference Shares
100 625,000 4,000 – 4,000 –
4,000 433 4,000 – Investment in Debentures (Trade)11.15% JBF Industries Limited 100,000 200 – – – 2009% East Coast Constructions and Industries Ltd 1,000 245,000 – 2,450 1,050 2,450
8% IOT Utkal Energy Services Limited 10 1,000,000 – – 10,000 – 13.65% Metropolitan Infrahousing Private Ltd 10,000,000 75 – – – 7,500 5.64% Mandava Holding Private Ltd 50,000,000 4 – – – 2,218 8% JL Power Ventures Pvt Limited 10,000,000 38 3,800 – 3,800 – 12.40%TRIF Amritsar Projects Pvt. Ltd. Series B 1,000,000 200 – 1,964 1,964 36
12.40%TRIF Amritsar Projects Pvt. Limited - Series C 1,000,000 150 1,369 104 1,473 27
12.40%TRIF Amritsar Projects Pvt. Limited - Series D 1,000,000 150 1,369 104 1,473 27

121
NOTES TO AND FORMING PART OF THE CONSOLIDATED BALANCE SHEET AS AT MARCH 31, 2015
NOTE “16” (` in lakh)
LONG-TERM LOANS AND ADVANCES - OTHERS (UNSECURED - CONSIDERED GOOD)
As at March 31, 2015
As at March 31, 2014
(a) Capital advances 7,879 3,721(b) Security deposits 752 753(c) Loans and advances to related parties 51 – (d) Prepaid expenses 374 417(e) Advances payment of Income tax, net of provision 4,982 3,186(f) MAT credit entitlement 19 27(g) Others
- Deposit 217 268 Total 14,274 8,371NOTE “17” (` in lakh)
OTHER NON-CURRENT ASSETS As at March 31, 2015
As at March 31, 2014
(a) Interest accrued on investments – 8(b) Deferred revenue expenditure [Refer Note No. 21(a)] 1,581 1,463(c) Unamortised loan sourcing costs 6,366 4,657(d) Others 32 41 Total 7,979 6,169
PARTICULARSFace value
Per Unit
No. of Units
As at March 31, 2015
As at March 31, 2014
Non- Current Current Non-
Current Current
10.75% IDBI Bank Ltd. 1,000,000 50 508 – – – 11% Cargo Solar Power Gujarat Limited 10,000 11,250 1,125 – 1,125 – 11% Cargo Solar Power Gujarat Limited 10,000 8,750 875 – 875 – 14.50% Arohi Infrastructure Private Limited 100 5,000,000 – 5,000 – 5,000
9,046 9,622 21,760 17,458 Investment in Debentures (Trade)10.90% Tata Motor Finance Limited 500,000 400 2,000 – 2,000 –
2,000 – 2,000 – Investment in Pass Through Certificates (Trade)Jindal ITF Limited - Series A to E 4,483 2,958 6,435 719 DRL Trust Feb 141 Series A – – – 10,297 DRL Trust Dec 143 Series B – 270 – – HPR Trust Mar 151 Series A – 5,807 – – DRL Trust Feb 151 Series A – 22,726 – – DRL Trust Feb 151 Series B – 6,064 – –
4,483 37,825 6,435 11,016Total 46,698 61,179 66,042 39,287 Less: Provision for doubtful Credit Substitutes 8,505 1,995 264 286Grand Total 38,193 59,184 65,778 39,001
Note : The above scrip-wise details of Credit Substitutes does not include interest accrued on Credit Substitutes and receivable on sale of Credit Substitutes.

122
Annual Report 2014-15
NOTES TO AND FORMING PART OF THE CONSOLIDATED BALANCE SHEET AS AT MARCH 31, 2015
NOTE “18” (` in lakh)
TRADE RECEIVABLES As at March 31, 2015
As at March 31, 2014
(a) Over six months (from the date due for payment)(i) Secured, considered good – –(ii) Unsecured, considered good 488 923(iii) Doubtful 248 168
736 1,092Less: Provision for trade receivables 248 168
488 923(b) Others
(i) Secured, considered good – –(ii) Unsecured, considered good 8,160 8,665(iii) Doubtful – –
8,160 8,665Less: Provision for trade receivables – –
8,160 8,665 Total 8,648 9,588
NOTE “19” (` in lakh)
CASH AND BANK BALANCES As at March 31, 2015
As at March 31, 2014
(a) Cash on Hand 1,035 1,081(b) Cheques on hand 1,770 2,298(c) Balances with bank
(i) In current accounts 13,961 27,971(ii) In client accounts 1,801 1,594(iii) In deposit accounts 4,716 3,230
(d) Other bank balances(i) In earmarked accounts
- Share application money received for allotment of securities (Refer Note 41)
5,000 –
Total 28,283 36,174
Of the above, the balances that meet the definition of Cash and Cash Equivalents as per AS 3 (Cash Flow Statements) is ` 17,504 Lakh ( as at March 31, 2014: ` 31,350 Lakh)
Balance with bank includes deposits amounting to ` 1,095 Lakh (as at March 31, 2014 ` 676 Lakh) which have an original maturity of more than 12 months. Deposits includes deposits with Banks and Stock Exchanges under lien as margin, amounting to ` 1,688 Lakh (As at March 31, 2014 ` 1,563 Lakh)
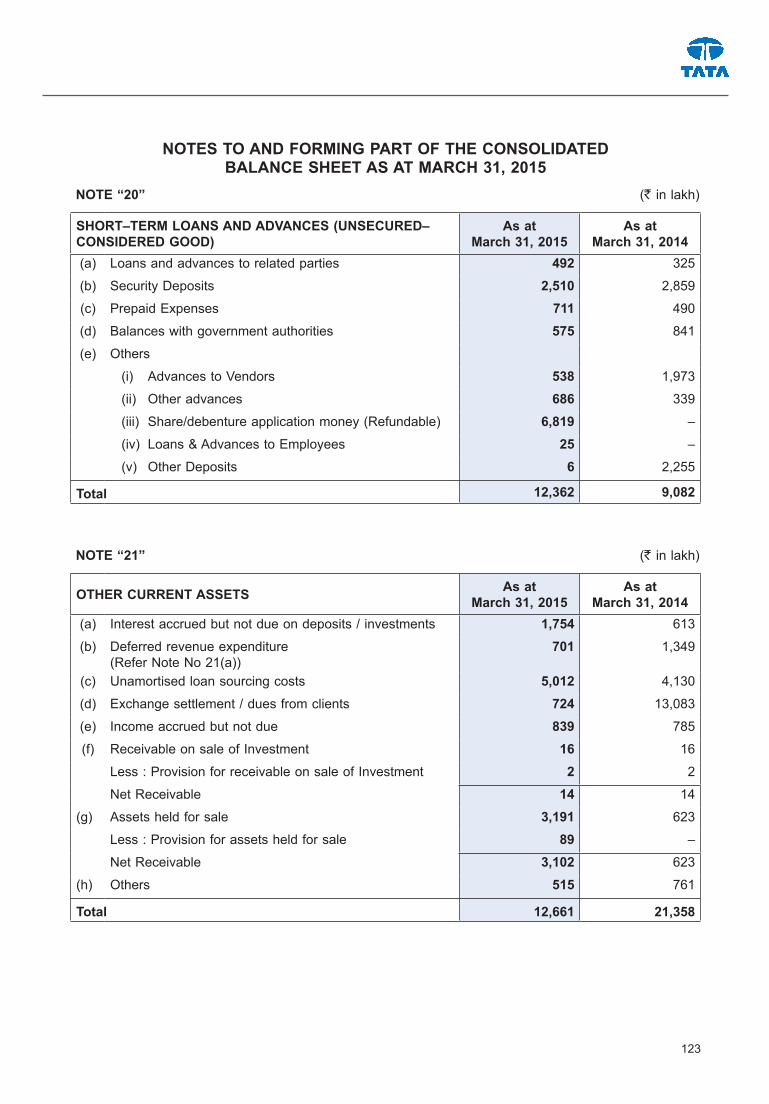
123
NOTES TO AND FORMING PART OF THE CONSOLIDATED BALANCE SHEET AS AT MARCH 31, 2015
NOTE “20” (` in lakh)
SHORT–TERM LOANS AND ADVANCES (UNSECURED–CONSIDERED GOOD)
As at March 31, 2015
As at March 31, 2014
(a) Loans and advances to related parties 492 325
(b) Security Deposits 2,510 2,859
(c) Prepaid Expenses 711 490
(d) Balances with government authorities 575 841
(e) Others
(i) Advances to Vendors 538 1,973
(ii) Other advances 686 339
(iii) Share/debenture application money (Refundable) 6,819 –
(iv) Loans & Advances to Employees 25 –
(v) Other Deposits 6 2,255
Total 12,362 9,082
NOTE “21” (` in lakh)
OTHER CURRENT ASSETS As at March 31, 2015
As at March 31, 2014
(a) Interest accrued but not due on deposits / investments 1,754 613
(b) Deferred revenue expenditure (Refer Note No 21(a))
701 1,349
(c) Unamortised loan sourcing costs 5,012 4,130
(d) Exchange settlement / dues from clients 724 13,083
(e) Income accrued but not due 839 785
(f) Receivable on sale of Investment 16 16
Less : Provision for receivable on sale of Investment 2 2
Net Receivable 14 14
(g) Assets held for sale 3,191 623
Less : Provision for assets held for sale 89 –
Net Receivable 3,102 623
(h) Others 515 761
Total 12,661 21,358

124
Annual Report 2014-15
NOTES TO AND FORMING PART OF THE CONSOLIDATED STATEMENT OF BALANCE SHEET FOR THE YEAR ENDED MARCH 31, 2015
NOTE “21 (a)” (` in lakh)
DEFERRED REVENUE EXPENDITURE (TO THE EXTENT NOT WRITTEN OFF OR ADJUSTED)
As at March 31, 2015
As at March 31, 2014
(a) Unamortised share issue expenses Opening Balance 888 1,605Add: expenses incurred during the period 474 114 Less: written off during the period 849 831 Closing Balance 513 888
(b) Unamortised debenture issue expenses Opening Balance 837 591 Add: expenses incurred during the period 595 333 Less: written off during the period 456 87 Closing Balance 976 837
(c) Unamortised loan processing charges Opening Balance 1,087 70 Add: expenses incurred during the period 61 1,154 Less: written off during the period 355 137 Closing Balance 793 1,087
Total 2,282 2,812
(` in lakh)
PARTICULARS For the Year Ended March 31, 2015
For the Year Ended March 31, 2014
Non- Current Current Non-
Current Current
(a) Unamortised share issue expenses 326 187 63 825 (b) Unamortised debenture issue expenses 759 217 683 154 (c) Unamortised loan processing charges 496 297 430 657
Total 1,581 701 1,176 1,636Grand Total 2,282 2,812

125
NOTES TO AND FORMING PART OF THE CONSOLIDATED STATEMENT OF PROFIT AND LOSS FOR THE YEAR ENDED MARCH 31, 2015
NOTE “22” (` in lakh)
REVENUE FROM OPERATIONS For the Year Ended March 31, 2015
For the Year Ended March 31, 2014
(a) Interest Income
(i) From Secured Loans & Credit Substitutes 267,722 240,923
(ii) From Unsecured Loans & Credit Substitutes 75,561 63,506
(b) Income from Bill Discounting 5,693 3,524
(c) Others 22,469 17,822
Total 371,445 325,775
NOTE “23” (` in lakh)
INVESTMENT INCOME For the Year Ended March 31, 2015
For the Year Ended March 31, 2014
(a) Dividend from Non-Current Investments 1,006 1,255
(b) Dividend from Current Investments 271 1,111
(c) Profit on sale of Non-Current Investments 6,962 1,369
(d) Profit on sale of Current Investments 1,113 549
(e) Interest on Non-Current Investments 4,078 1,666
(f) Interest on Current Investments – 20
Total 13,430 5,970

126
Annual Report 2014-15
NOTES TO AND FORMING PART OF THE CONSOLIDATED STATEMENT OF PROFIT AND LOSS FOR THE YEAR ENDED MARCH 31, 2015
NOTE “24” (` in lakh)
OTHER INCOME For the Year Ended March 31, 2015
For the Year Ended March 31, 2014
(a) Income from advisory services 11,746 11,120
(b) Income from operating leases 14,570 7,703
(c) Interest Income on Fixed Deposits 317 1,313
(d) Income from Ticketing & other travel related services 926 731
(e) Income from Forex services 1,561 1,566
(f) Brokerage Income 2,181 1,943
(g) Exchange gains (net) 3 –
(h) Miscellaneous Income 4,139 1,776
Total 35,443 26,152
NOTE “25” (` in lakh)
FINANCE COSTS For the Year Ended March 31, 2015
For the Year Ended March 31, 2014
(a) Interest expense 188,430 169,710
(b) Discounting charges
(i) On commercial papers 57,015 41,524
(i) On debentures 950 3,123
(i) On Collateralised Borrowings and Lending / Obligations 1,748 457
Total 248,143 214,814
NOTE “26” (` in lakh)
EMPLOYEE BENEFIT EXPENSES For the Year Ended March 31, 2015
For the Year Ended March 31, 2014
(a) Salaries, wages and bonus 31,630 27,977
(b) Contribution to provident and other funds (Refer Note No. 34) 2,027 1,329
(c) Staff welfare expenses 1,615 1,579
Total 35,272 30,885
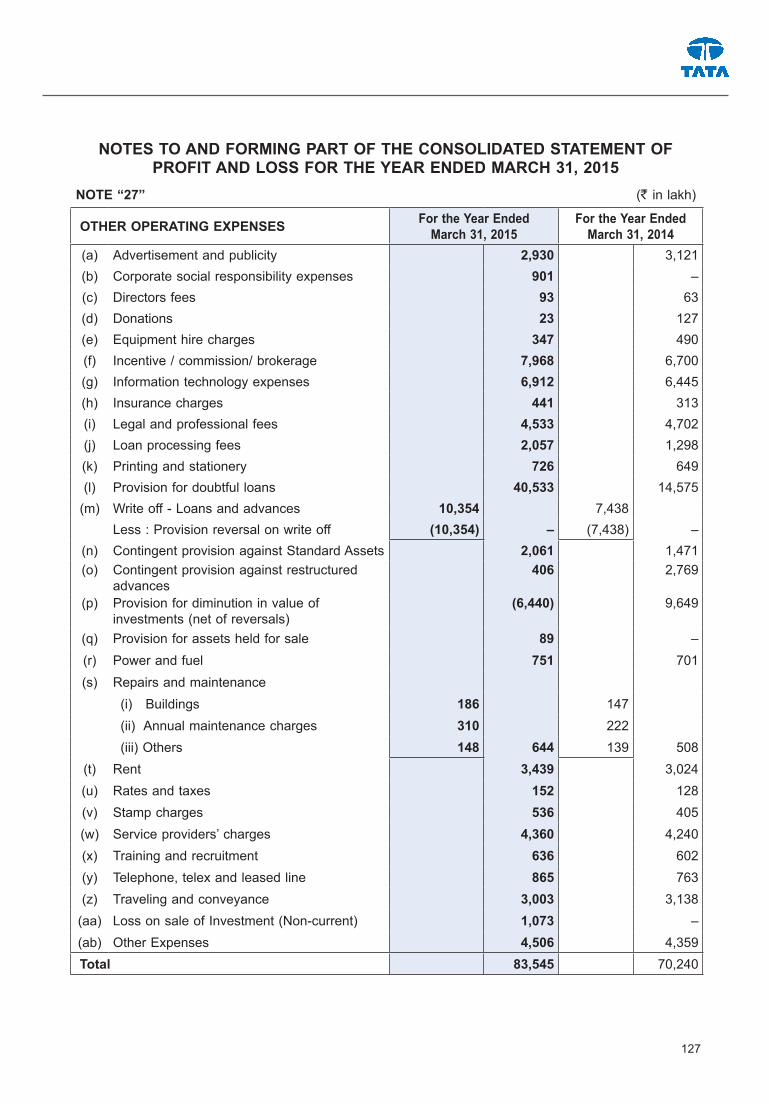
127
NOTES TO AND FORMING PART OF THE CONSOLIDATED STATEMENT OF PROFIT AND LOSS FOR THE YEAR ENDED MARCH 31, 2015
NOTE “27” (` in lakh)
OTHER OPERATING EXPENSES For the Year Ended March 31, 2015
For the Year Ended March 31, 2014
(a) Advertisement and publicity 2,930 3,121 (b) Corporate social responsibility expenses 901 – (c) Directors fees 93 63 (d) Donations 23 127 (e) Equipment hire charges 347 490 (f) Incentive / commission/ brokerage 7,968 6,700 (g) Information technology expenses 6,912 6,445 (h) Insurance charges 441 313 (i) Legal and professional fees 4,533 4,702 (j) Loan processing fees 2,057 1,298 (k) Printing and stationery 726 649 (l) Provision for doubtful loans 40,533 14,575
(m) Write off - Loans and advances 10,354 7,438 Less : Provision reversal on write off (10,354) – (7,438) –
(n) Contingent provision against Standard Assets 2,061 1,471 (o) Contingent provision against restructured
advances 406 2,769
(p) Provision for diminution in value of investments (net of reversals)
(6,440) 9,649
(q) Provision for assets held for sale 89 – (r) Power and fuel 751 701 (s) Repairs and maintenance
(i) Buildings 186 147 (ii) Annual maintenance charges 310 222 (iii) Others 148 644 139 508
(t) Rent 3,439 3,024 (u) Rates and taxes 152 128 (v) Stamp charges 536 405 (w) Service providers’ charges 4,360 4,240 (x) Training and recruitment 636 602 (y) Telephone, telex and leased line 865 763 (z) Traveling and conveyance 3,003 3,138
(aa) Loss on sale of Investment (Non-current) 1,073 –(ab) Other Expenses 4,506 4,359 Total 83,545 70,240

128
Annual Report 2014-15
NOTE “27(a)” (` in lakh)
AUDITORS’ REMUNERATION (excl. Service Tax) For the Year Ended March 31, 2015
For the Year Ended March 31, 2014
(a) Audit Fees 237 222
(b) Tax Audit Fees 14 14
(c) Other Services 13 11
(d) Out of Pocket Expenses 1 1
(Auditors' Remuneration is included in Other expenses)
NOTE “27(b)” (` in lakh)
EXPENDITURE IN FOREIGN CURRENCY For the Year Ended March 31, 2015
For the Year Ended March 31, 2014
(a) Legal and professional fees 30 261
(b) Membership and subscription 12 59
(c) Advertisement and publicity – 25
(d) Travelling and conveyance 19 10
(e) Training and recruitment 24 31
(f) Directors Sitting Fees 1 1
(g) Other expenses 3 3
NOTES TO AND FORMING PART OF THE CONSOLIDATED STATEMENT OF PROFIT AND LOSS FOR THE YEAR ENDED MARCH 31, 2015

129
NOTE “28”The financial statements of the following subsidiaries have been consolidated as per Accounting Standard 21 on ‘Consolidated Financial Statements’:
Name of the Subsidiary Country of % Holding % Holding
Incorporation as at as atMarch 31, 2015 March 31, 2014
Tata Securities Limited India 100 100
Tata Capital Housing Finance Limited India 100 100
TC Travel and Services Limited India 100 100
Tata Capital Forex Limited India 100 100
Tata Infrastructure Capital Limited India 100 100
Tata Capital Financial Services Limited India 100 100
Tata Capital Growth Fund India 73.75 73.75
Tata Cleantech Capital Limited India 80.50 80.50
India Collections Management Limited India 100 81
Tata Capital Pte. Limited Singapore 100 100
Tata Capital Markets Pte. Limited(Subsidiary of Tata Capital Pte. Limited)
Singapore 100 100
Tata Capital Advisors Pte. Limited(Subsidiary of Tata Capital Pte. Limited)
Singapore 100 100
Tata Capital Plc(Subsidiary of Tata Capital Pte. Limited)
United Kingdom 100 100
Tata Capital General Partners LLP(Subsidiary of Tata Capital Pte. Limited)
Singapore 80 80
Tata Capital Healthcare General Partners LLP(Subsidiary of Tata Capital Pte. Limited)
Singapore 100 100
Tata Opportunities General Partners LLP(Subsidiary of Tata Capital Pte. Limited)
Singapore 90 90
NOTES TO AND FORMING PART OF THE CONSOLIDATED STATEMENT OF PROFIT AND LOSS FOR THE YEAR ENDED MARCH 31, 2015

130
Annual Report 2014-15
NOTE “29”The Group has investments in the following associates, which are accounted for on the Equity Method in accordance with the Accounting Standard 23 on ‘Accounting for Investments in Associates in Consolidated Financial Statements’:The Particulars of investments in associates as on March 31, 2015 are as follows :
(` In Lakh)
Sr.No.
Name of Associates Country of Incorporation
Ownership Interest
(%)
Original Cost of
Investment (` in Lakh)
Amount of goodwill/ (Capital
Reserve) in original cost
Share of post acquisition Reserves &
Surplus
Carrying Amount of
Investments
1 Tata Autocomp Systems Limited(Refer footnote 1)
India 24.00% 18,528 12,145 13,425 31,953
24.00% 18,528 12,145 13,800 32,328
2 Hemisphere Properties India Limited(Ceased to be an associate since March 26, 2015) (Refer footnote 1)
India NA – – – –
24.44% 1 – – 1
3 Tata Capital Special Situation Fund
India 28.15% 7,306 – (536) 6,770
20.83% 5,099 – (856) 4,2434 Tata Capital Healthcare
Fund India31.30% 4,931 – (1,143) 3,78831.30% 4,462 – (910) 3,552
5 Tata Capital Innovation Fund India
27.13% 3,941 – (940) 3,00127.13% 3,071 – (760) 2,311
6 International Asset Reconstruction Company Private Limited
India25.37% 3,313 483 221 3,534
25.37% 3,313 483 109 3,422
7 e-Nxt Financials Limited (Refer Note No. 47)
India 50% 1,022 1,221 160 1,182
50% 1,022 1,221 160 1,182
Total39,041 13,849 11,187 50,22835,496 13,849 11,543 47,039
Notes:1) Consolidated based on unaudited financial statements as at/for the year ended March 31, 2015 and
March 31, 20142) Figures in Italics represent previous year.

131
NOTE “30”The financial statements of the following jointly controlled entity has been consolidated as per Accounting Standard 27 (Financial Reporting of Interests in Joint Ventures).
Name of Jointly Controlled Entity% Holding
as atMarch 31, 2015
% Holdingas at
March 31, 2014Nectar Loyalty Management India Limited 49 49
The following amounts are included in the Financial Statements in respect of the jointly controlled entity referred to in Note above, based on the proportionate consolidation method:
(` in Lakh)
PARTICULARS As at March 31, 2015
As at March 31, 2014
Assets:Tangible Fixed Assets 18 18
Intangible Fixed Assets 4 4
Long-term loans and advances 170 170
Cash and bank balances 8 8
Short-term loans and advances 1 1
Total 201 201
LiabilitiesShort-term borrowings 358 358
Other current liabilities 115 115
Total 473 473
Income NIL NIL
Expenses NIL 521
Footnote:-1) As per the latest available audited financial statements as at and for the year ended March 31, 2014.2) Nectar Loyalty Management India Limited (“Nectar”) is a joint venture with AIMIA (formerly known as Groupe Aeroplan Inc.), the Canadian Loyalty Management giant, to launch a multi-party coalition loyalty program in India modeled on the lines of Nectar, which is Group Aeroplan’s highly acclaimed coalition loyalty program in the UK and Italy. Tata Capital holds 49% in the joint venture. The Group has fully provided for its investment in debentures and equity shares in the joint venture during the financial year. Since the investment is fully provided for and the fact that Nectar’s operations are held in abeyance during the year, loss picked up historically is more than invested amount, the financial statements for the entity have not been consolidated.
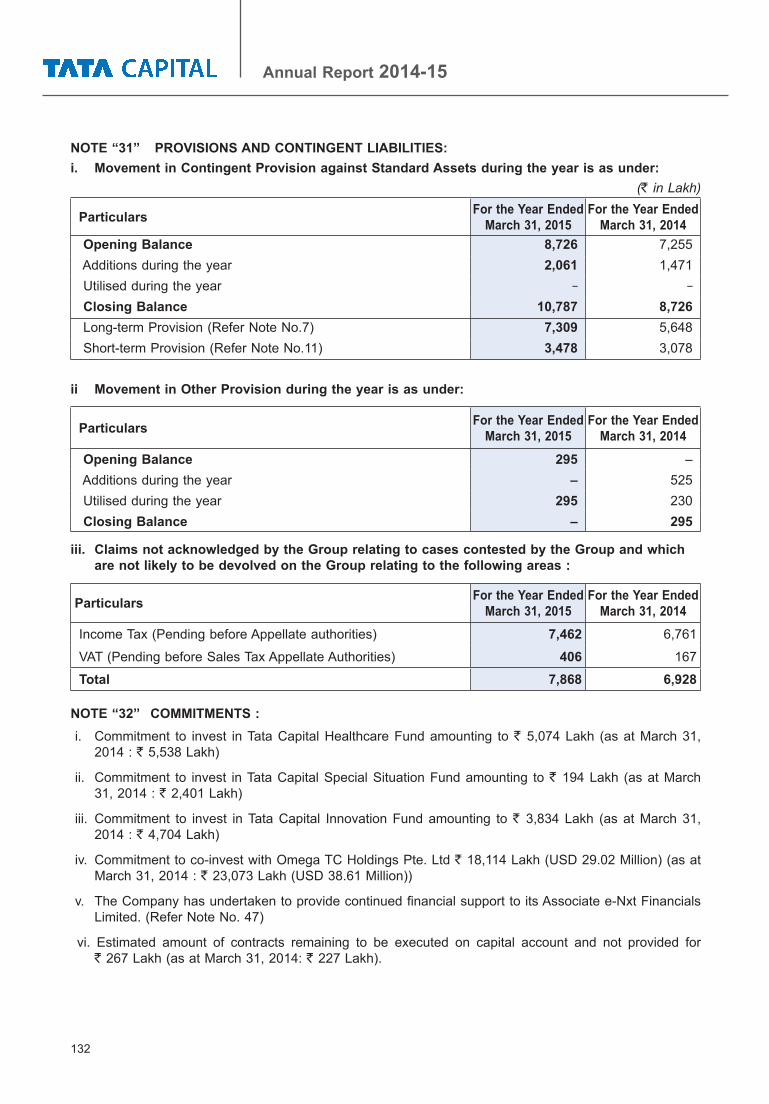
132
Annual Report 2014-15
NOTE “31” PROVISIONS AND CONTINGENT LIABILITIES: i. Movement in Contingent Provision against Standard Assets during the year is as under:
(` in Lakh)
Particulars For the Year Ended March 31, 2015
For the Year Ended March 31, 2014
Opening Balance 8,726 7,255 Additions during the year 2,061 1,471 Utilised during the year – –
Closing Balance 10,787 8,726 Long-term Provision (Refer Note No.7) 7,309 5,648 Short-term Provision (Refer Note No.11) 3,478 3,078
ii Movement in Other Provision during the year is as under:
Particulars For the Year Ended March 31, 2015
For the Year Ended March 31, 2014
Opening Balance 295 – Additions during the year – 525 Utilised during the year 295 230 Closing Balance – 295
iii. Claims not acknowledged by the Group relating to cases contested by the Group and which are not likely to be devolved on the Group relating to the following areas :
Particulars For the Year Ended March 31, 2015
For the Year Ended March 31, 2014
Income Tax (Pending before Appellate authorities) 7,462 6,761
VAT (Pending before Sales Tax Appellate Authorities) 406 167
Total 7,868 6,928
NOTE “32” COMMITMENTS : i. Commitment to invest in Tata Capital Healthcare Fund amounting to ` 5,074 Lakh (as at March 31,
2014 : ` 5,538 Lakh)
ii. Commitment to invest in Tata Capital Special Situation Fund amounting to ` 194 Lakh (as at March 31, 2014 : ` 2,401 Lakh)
iii. Commitment to invest in Tata Capital Innovation Fund amounting to ` 3,834 Lakh (as at March 31, 2014 : ` 4,704 Lakh)
iv. Commitment to co-invest with Omega TC Holdings Pte. Ltd ` 18,114 Lakh (USD 29.02 Million) (as at March 31, 2014 : ` 23,073 Lakh (USD 38.61 Million))
v. The Company has undertaken to provide continued financial support to its Associate e-Nxt Financials Limited. (Refer Note No. 47)
vi. Estimated amount of contracts remaining to be executed on capital account and not provided for ` 267 Lakh (as at March 31, 2014: ` 227 Lakh).
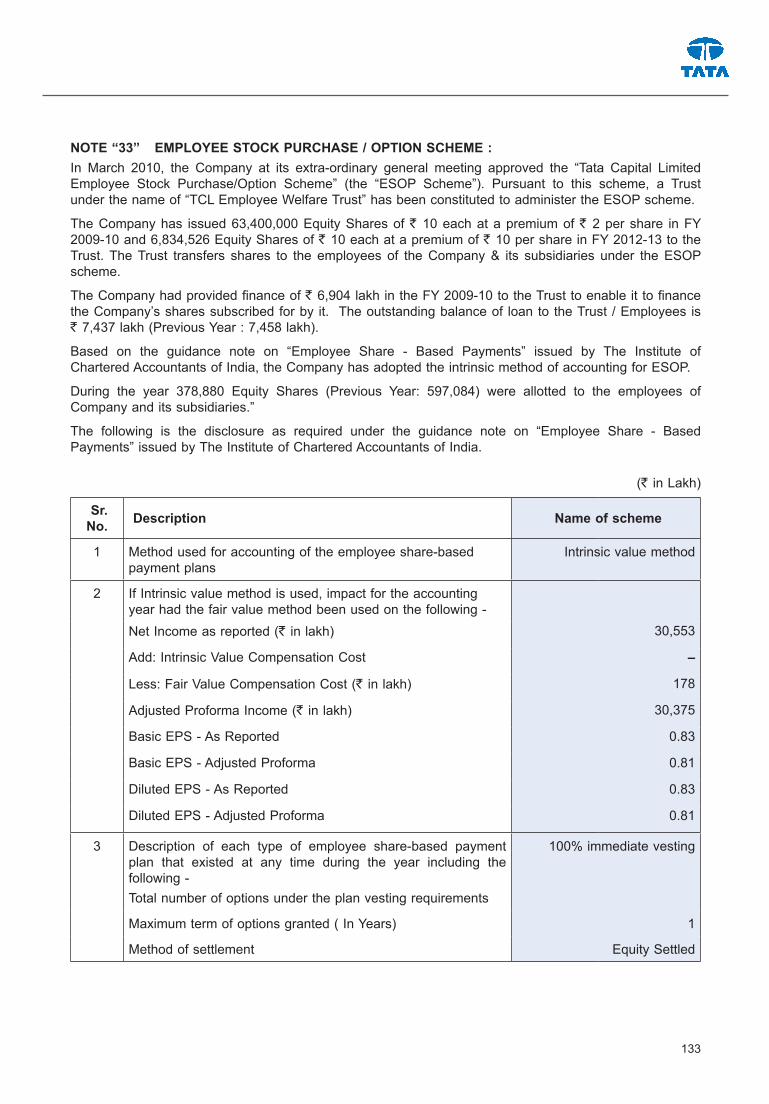
133
NOTE “33” EMPLOYEE STOCK PURCHASE / OPTION SCHEME : In March 2010, the Company at its extra-ordinary general meeting approved the “Tata Capital Limited Employee Stock Purchase/Option Scheme” (the “ESOP Scheme”). Pursuant to this scheme, a Trust under the name of “TCL Employee Welfare Trust” has been constituted to administer the ESOP scheme.
The Company has issued 63,400,000 Equity Shares of ` 10 each at a premium of ` 2 per share in FY 2009-10 and 6,834,526 Equity Shares of ` 10 each at a premium of ` 10 per share in FY 2012-13 to the Trust. The Trust transfers shares to the employees of the Company & its subsidiaries under the ESOP scheme.
The Company had provided finance of ` 6,904 lakh in the FY 2009-10 to the Trust to enable it to finance the Company’s shares subscribed for by it. The outstanding balance of loan to the Trust / Employees is ` 7,437 lakh (Previous Year : 7,458 lakh).
Based on the guidance note on “Employee Share - Based Payments” issued by The Institute of Chartered Accountants of India, the Company has adopted the intrinsic method of accounting for ESOP.
During the year 378,880 Equity Shares (Previous Year: 597,084) were allotted to the employees of Company and its subsidiaries.”
The following is the disclosure as required under the guidance note on “Employee Share - Based Payments” issued by The Institute of Chartered Accountants of India.
(` in Lakh)
Sr. No. Description Name of scheme
1 Method used for accounting of the employee share-based payment plans
Intrinsic value method
2 If Intrinsic value method is used, impact for the accounting year had the fair value method been used on the following - Net Income as reported (` in lakh) 30,553
Add: Intrinsic Value Compensation Cost –
Less: Fair Value Compensation Cost (` in lakh) 178
Adjusted Proforma Income (` in lakh) 30,375
Basic EPS - As Reported 0.83
Basic EPS - Adjusted Proforma 0.81
Diluted EPS - As Reported 0.83
Diluted EPS - Adjusted Proforma 0.81
3 Description of each type of employee share-based payment plan that existed at any time during the year including the following - Total number of options under the plan vesting requirements
100% immediate vesting
Maximum term of options granted ( In Years) 1
Method of settlement Equity Settled

134
Annual Report 2014-15
Sr. No. Description Name of scheme
4 Number and weighted average exercise prices of stock options for each of the following -
Number of options
Weighted Average Exercise Price
(` )- Outstanding at the beginning of the year 7,530,068 22.37
- Granted during the year – –
- Forfeited during the year 2,170,694 24.57
- Exercised during the year 378,880 20.86
- Outstanding at the end of the year 4,980,494 21.52
- Exercisable at the end of the year 3,232,450 19.64
5 Number of options vested –
6 Total number of shares arising as a result of exercise 378,880
7 Money realised by exercise of options ( ` ) 7,904,2838 Employee wise details of options granted to -
- Senior management personnel –
- Employees holding 5% or more of the total number of warrants/options granted during the year
–
- Identified employees who were granted warrant/option, during any one year equal to or exceeding 1% of the issued capital (excluding outstanding warrants / options and conversions) of the Company at the time of grant.
–
9 For stock options exercised during the year the weighted average share price at the date of exercise. If options were exercised on a regular basis throughout the year, the weighted average share price during the year. ( ` )
26.65
10 For stock options outstanding at the end of the year, the range of exercise prices and weighted average remaining contractual life (vesting year + exercise year). If the range of the exercise prices is wide, the outstanding options should be divided into ranges that are meaningful for assessing the number and timing of additional shares that may be issued and cash that may be received upon exercise of those options.
Range of exercise Prices (`)
Weighted Average
Contractual Life (Years)
25.00 1.33
11 For stock options granted during the year, the weighted average fair value of those options at the grant date and information on how the fair value was measured including the following - - Option pricing model used Black Scholes
- Inputs to that model including -
weighted average share price ( ` ) 25
exercise price ( ` ) 25
expected volatility 0.34%
option life (comprising vesting period + exercise period) 1.42 years
expected dividends 0.00%
risk-free interest rate 8.00%

135
Sr. No. Description Name of scheme
Any other inputs to the model including the method used and the assumptions made to incorporate the effects of expected early exercise.
- Determination of expected volatility, including explanation to the extent expected volatility was based on historical volatility.
NA
- Any other features of the option grant were incorporated into the measurement of the fair value, such AS market conditions.
NA
12 For other instruments granted during the year (I.e., other than stock options)
No other instruments were granted during the year
- Number and weighted average fair value of those instruments at the grant date
NA
- Fair Value determination in case -
(a) fair value not measured on the basis of an observable market price
NA
(b) whether and how expected dividends were incorporated NA(c) whether and how any other features were incorporated NA
13 For employee share-based payment plans that were modified during the year
No modifications were made the scheme during the year
- Explanation of those modifications NA
- Incremental fair value granted (as a result of those modifications)
NA
- Information on how Incremental fair value granted was measured, consistently with the requirements set out in points 7 and 8 above.
NA
14 Total expense recognised for the year for employee share-based payment plans
Nil
15 Separate disclosure of that portion of the total expense that arises from transactions accounted for as equity-settled employee share-based payment plans
Nil
16 For liabilities arising from employee share-based payment plans Nil (No cash settled awards given out)
- Total carrying amount at the end of the year NA- Total intrinsic value at the end to the year for which the
right of the employee to cash or other assets had vested by the end of the year.
NA
17 Basic / Diluted earnings per share (EPS) pursuant to issue of shares on exercise of option. 0.81
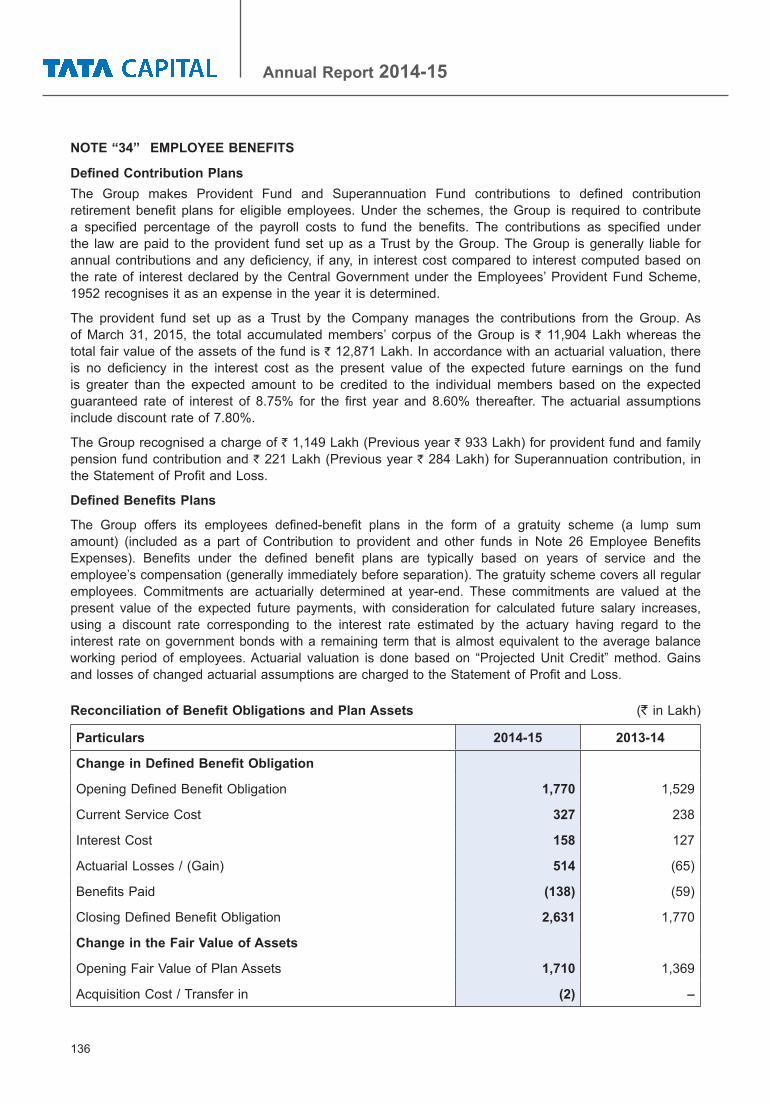
136
Annual Report 2014-15
NOTE “34” EMPLOYEE BENEFITS
Defined Contribution PlansThe Group makes Provident Fund and Superannuation Fund contributions to defined contribution retirement benefit plans for eligible employees. Under the schemes, the Group is required to contribute a specified percentage of the payroll costs to fund the benefits. The contributions as specified under the law are paid to the provident fund set up as a Trust by the Group. The Group is generally liable for annual contributions and any deficiency, if any, in interest cost compared to interest computed based on the rate of interest declared by the Central Government under the Employees’ Provident Fund Scheme, 1952 recognises it as an expense in the year it is determined.
The provident fund set up as a Trust by the Company manages the contributions from the Group. As of March 31, 2015, the total accumulated members’ corpus of the Group is ` 11,904 Lakh whereas the total fair value of the assets of the fund is ` 12,871 Lakh. In accordance with an actuarial valuation, there is no deficiency in the interest cost as the present value of the expected future earnings on the fund is greater than the expected amount to be credited to the individual members based on the expected guaranteed rate of interest of 8.75% for the first year and 8.60% thereafter. The actuarial assumptions include discount rate of 7.80%.
The Group recognised a charge of ` 1,149 Lakh (Previous year ` 933 Lakh) for provident fund and family pension fund contribution and ` 221 Lakh (Previous year ` 284 Lakh) for Superannuation contribution, in the Statement of Profit and Loss.
Defined Benefits Plans
The Group offers its employees defined-benefit plans in the form of a gratuity scheme (a lump sum amount) (included as a part of Contribution to provident and other funds in Note 26 Employee Benefits Expenses). Benefits under the defined benefit plans are typically based on years of service and the employee’s compensation (generally immediately before separation). The gratuity scheme covers all regular employees. Commitments are actuarially determined at year-end. These commitments are valued at the present value of the expected future payments, with consideration for calculated future salary increases, using a discount rate corresponding to the interest rate estimated by the actuary having regard to the interest rate on government bonds with a remaining term that is almost equivalent to the average balance working period of employees. Actuarial valuation is done based on “Projected Unit Credit” method. Gains and losses of changed actuarial assumptions are charged to the Statement of Profit and Loss.
Reconciliation of Benefit Obligations and Plan Assets (` in Lakh)
Particulars 2014-15 2013-14
Change in Defined Benefit Obligation
Opening Defined Benefit Obligation 1,770 1,529
Current Service Cost 327 238
Interest Cost 158 127
Actuarial Losses / (Gain) 514 (65)
Benefits Paid (138) (59)
Closing Defined Benefit Obligation 2,631 1,770
Change in the Fair Value of Assets
Opening Fair Value of Plan Assets 1,710 1,369
Acquisition Cost / Transfer in (2) –

137
Particulars 2014-15 2013-14
Expected Return on Plan Assets 157 117
Contributions by Employer 483 187
Actuarial Gains / (Losses) 192 53
Benefits paid (2) (16)
Closing Fair Value of Plan Assets 2,537 1,710
Composition of Plan Assets
Investment Pattern
Government Bonds 40% 37%
Equity Mutual Funds 8% 9%
Bonds / Debentures 35% 30%
Others 17% 25%
Total 100% 100%
Reconciliation of present Value of the obligation and the Fair value of the plan Assets
Fair Value of plan assets at the end of the year 2,537 1,710
Present value of the defined obligations at the end of the year 2,631 1,770
Funded status [Surplus / (Deficit)] (94) (60)
Net Asset /(Liability) recognised in the Balance Sheet (94) (60)
Net Gratuity cost for the year ended March 31, 2015
Service Cost 327 238
Interest on Defined benefit Obligation 158 127
Expected return on plan assets (157) (117)
Settlement Cost / (Credit) 6 –
Net actuarial (gain) / loss recognised in the year 323 (136)
Net Gratuity Cost (Refer Note No. 26(b)) 657 111
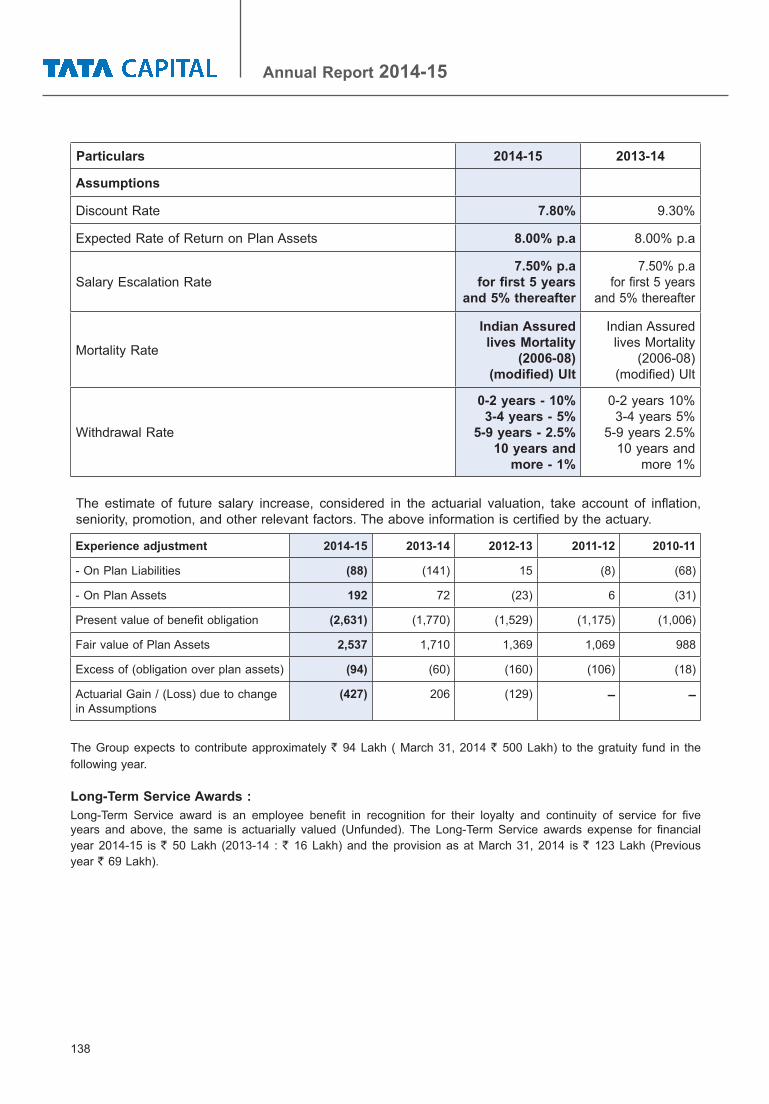
138
Annual Report 2014-15
Particulars 2014-15 2013-14
Assumptions
Discount Rate 7.80% 9.30%
Expected Rate of Return on Plan Assets 8.00% p.a 8.00% p.a
Salary Escalation Rate 7.50% p.a
for first 5 years and 5% thereafter
7.50% p.a for first 5 years
and 5% thereafter
Mortality Rate
Indian Assured lives Mortality
(2006-08) (modified) Ult
Indian Assured lives Mortality
(2006-08) (modified) Ult
Withdrawal Rate
0-2 years - 10% 3-4 years - 5%
5-9 years - 2.5% 10 years and
more - 1%
0-2 years 10% 3-4 years 5%
5-9 years 2.5% 10 years and
more 1%
The estimate of future salary increase, considered in the actuarial valuation, take account of inflation, seniority, promotion, and other relevant factors. The above information is certified by the actuary.
Experience adjustment 2014-15 2013-14 2012-13 2011-12 2010-11
- On Plan Liabilities (88) (141) 15 (8) (68)
- On Plan Assets 192 72 (23) 6 (31)
Present value of benefit obligation (2,631) (1,770) (1,529) (1,175) (1,006)
Fair value of Plan Assets 2,537 1,710 1,369 1,069 988
Excess of (obligation over plan assets) (94) (60) (160) (106) (18)
Actuarial Gain / (Loss) due to change in Assumptions
(427) 206 (129) – –
The Group expects to contribute approximately ` 94 Lakh ( March 31, 2014 ` 500 Lakh) to the gratuity fund in the following year.
Long-Term Service Awards :Long-Term Service award is an employee benefit in recognition for their loyalty and continuity of service for five years and above, the same is actuarially valued (Unfunded). The Long-Term Service awards expense for financial year 2014-15 is ` 50 Lakh (2013-14 : ` 16 Lakh) and the provision as at March 31, 2014 is ` 123 Lakh (Previous year ` 69 Lakh).

139
NOTE “35”Disclosure as required by Accounting Standard 18 (Related Party Disclosures).
i. List of related parties and relationship: (` in Lakh)
Holding Company Tata Sons LimitedAssociates e-Nxt Financials Limited (See note No 47)
Hemisphere Properties India Limited*International Asset Reconstruction Company Private LimitedTata Capital Healthcare FundTata Capital Innovation FundTata Capital Special Situation FundTata AutoComp Systems Limited
Fellow Subsidiaries Tata Sky Limited(with which the Group had transactions) Tata Consultancy Services Limited
Tata AIG General Insurance Company LimitedTata AIA Life Insurance Company LimitedInfiniti Retail LimitedTata Housing Development Company LimitedTata Asset Management LimitedTata Business Support Services LimitedTata Petrodyne LimitedTata Realty & Infrastructure LimitedTata Consulting Engineers LimitedTata Investment Corporation LimitedEwart Investments LimitedNiskalp Infrastructure Services LimitedTata Advanced Materials LimitedTata Advanced Systems LimitedDrive India Enterprise Solutions LimitedTata Industries LimitedIndian Rotocraft LimitedTata International LimitedTata Trustee Company LimitedTRIL Roads Private LimitedTRIL Constructions Private LimitedTaj Air Metrojet Aviation LimitedAutomotive Stampings & Assemblies LimitedTaj Air LimitedTata Sikorsky Aerospace LimitedTata Toyo Radiator LimitedTata Industrial Services LimitedArdent Properties Private LimitedTata Lockheed Martin Aerostructure LimitedTata SIA Airlines LimitedCMC LimitedNova Integrated Systems LimitedPanatone Finvest LimitedTRIF Amritsar Projects Pvt Limited Calsea Footwear Pvt LimitedKriday Realty Private Limited
Key Management Personnel Mr. Praveen P Kadle - Managing Director & CEO
* Ceased to be an Associate with effect from March 26, 2015.

140
Annual Report 2014-15
ii. Transactions with related parties :Sr. No. Party Name Nature of Transaction 2014-15 2013-14
1 Tata Sons Limited a) Expenditure - Brand Equity Contribution 1,049 739 - Other Charges 56 68b) Income - Services rendered 849 720 - Equity Brokerage Income (1) –c) Deposit For premises paid 104 91d) Share of Rent and Expenses 322 484e) Balance Receivable/(Payable) (881) (851)
2 e-Nxt Financials Limited
a) Services rendered 4,597 3,763b) Income - Operating Lease Income 234 25 - Processing Fee Received 2 2 - Syndication Fee Received 15 10 - Rental Income 227 –
- Interest income on ICDs placed 15 –- Reimbursement of Expenses 234 –
c) Expenditure - Service Providers’ charges 917 770 - Administration and Support
Expenses 36 27
- Professional and Legal Fees 15 8d) Loan / Finance Lease facility given
during the year 896 7,062
e) ICDs placed during the year 1,050 –f) Repayment of Loan/ICDs/ Finance Lease
facility1,089 8,558
g) Outstanding balance of Lease facility/loan/ICDs
857 –
h) Balance Receivable 59 4323 International Asset
Reconstruction Company Pvt Ltd
a) Investment in Security Receipts during the year
105 777
4 Tata Capital Healthcare Fund
a) Investment in Units of Fund 469 2,110b) Income - Management Fees & Set-up cost 635 635c) Balance Receivable - Towards Asset Management Fees 119 122 - Towards Reimbursement of Expenses 5 2
5 Tata Capital InnovationFund
a) Investment in Units of Fund 870 725b) Income - Management Fees 573 573c) Advance Income received 188 188
6 Tata Capital Special Situation Fund
a) Investment made during the year 2,207 2,593b) Income - Management Fees 440 433c) Rebate of Asset Management Fees (526) –d) Advance Income received 377 –e) Balance Receivable - Towards Management fees – 164 - Towards Reimbursement of Expenses – 3
(` in Lakh)

141
(` in Lakh)
Sr. No. Party Name Nature of Transaction 2014-15 2013-14
7 Tata Sky Limited a) Investment in Equity Shares 3,105 2,137b) Loan/ Invoice discounting given – 7,301c) Interest received on loan given 85 248d) Repayment of Loan / Invoice discounting – 3,365e) Services rendered 22 –
8 Tata Consultancy Services Limited
a) Expenditure - IT Outsourcing 6,442 7,486 - Interest paid on ICD 1,375 1,624b) Reimbursement of expenses 411 482c) Fixed Assets - Software & other maintenance cost 46 33d) Services rendered 1,621 4,783e) ICD repaid during the year 28,000 –f) ICD outstanding – 28,000g) Balance Receivable/(Payable) (24) 1,291
9 Tata AIG General Insurance Company Limited
a) Expenditure -Insurance Expenses 300 204b) Services rendered 244 207c) Marketing & Advertisement Revenue 122 114d) Balance Receivable 6 43
10 Tata AIA Life Insurance Company Limited
a) Income - Marketing & Advertisement Revenue 194 –b) Services rendered – 2c) Expenditure -Insurance Expenses 12 12d) Shared Expenses 88 52e) Amount paid on behalf of customer 7 –f) Balance Receivable/(Payable) (147) 5
11 Infiniti Retail Limited a) Expenses-Incentive 53 2b) Services rendered 90 135c) Purchase of Fixed Assets 26 434d) Balance Receivable 16 46
12 Tata AutoComp Systems Limited
a) Dividend received during the year 966 966b) Services rendered 93 –c) Balance Receivable 43 –
13 Tata HousingDevelopmentCompany Limited
a) Income - Referral Fees 98 68 - Interest income on Loan 85 –b) Loan given during the year 2,000 –c) Outstanding loan 2,000 –d) Balance Receivable 28 13
14 Tata Asset Management Limited
a) Services rendered 2 8b) Income - Portfolio Management Service 49 45c) Balance Receivable – 5
15 Tata Business Support Services Limited
a) Services rendered 156 26b) Interest Income and Processing Fees 200 272c) Expenses- Call Center & Others 240 113d) Loan repaid during the year 649 –e) Loan Outstanding 1,642 2,291f) Balance Receivable 31 12
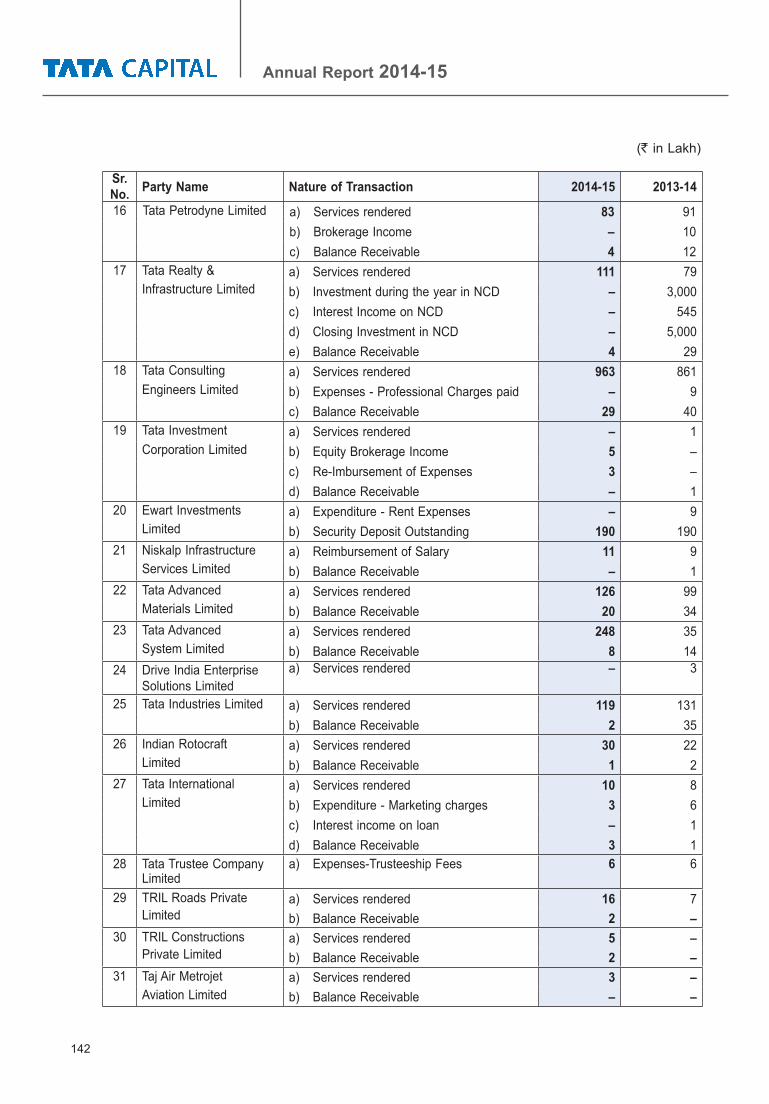
142
Annual Report 2014-15
(` in Lakh)
Sr. No. Party Name Nature of Transaction 2014-15 2013-14
16 Tata Petrodyne Limited a) Services rendered 83 91b) Brokerage Income – 10c) Balance Receivable 4 12
17 Tata Realty & Infrastructure Limited
a) Services rendered 111 79b) Investment during the year in NCD – 3,000c) Interest Income on NCD – 545d) Closing Investment in NCD – 5,000e) Balance Receivable 4 29
18 Tata ConsultingEngineers Limited
a) Services rendered 963 861b) Expenses - Professional Charges paid – 9c) Balance Receivable 29 40
19 Tata InvestmentCorporation Limited
a) Services rendered – 1b) Equity Brokerage Income 5 –c) Re-Imbursement of Expenses 3 –d) Balance Receivable – 1
20 Ewart InvestmentsLimited
a) Expenditure - Rent Expenses – 9b) Security Deposit Outstanding 190 190
21 Niskalp InfrastructureServices Limited
a) Reimbursement of Salary 11 9b) Balance Receivable – 1
22 Tata AdvancedMaterials Limited
a) Services rendered 126 99b) Balance Receivable 20 34
23 Tata AdvancedSystem Limited
a) Services rendered 248 35b) Balance Receivable 8 14
24 Drive India Enterprise Solutions Limited
a) Services rendered – 3
25 Tata Industries Limited a) Services rendered 119 131b) Balance Receivable 2 35
26 Indian RotocraftLimited
a) Services rendered 30 22b) Balance Receivable 1 2
27 Tata InternationalLimited
a) Services rendered 10 8b) Expenditure - Marketing charges 3 6c) Interest income on loan – 1d) Balance Receivable 3 1
28 Tata Trustee Company Limited
a) Expenses-Trusteeship Fees 6 6
29 TRIL Roads PrivateLimited
a) Services rendered 16 7b) Balance Receivable 2 –
30 TRIL ConstructionsPrivate Limited
a) Services rendered 5 –b) Balance Receivable 2 –
31 Taj Air MetrojetAviation Limited
a) Services rendered 3 –b) Balance Receivable – –
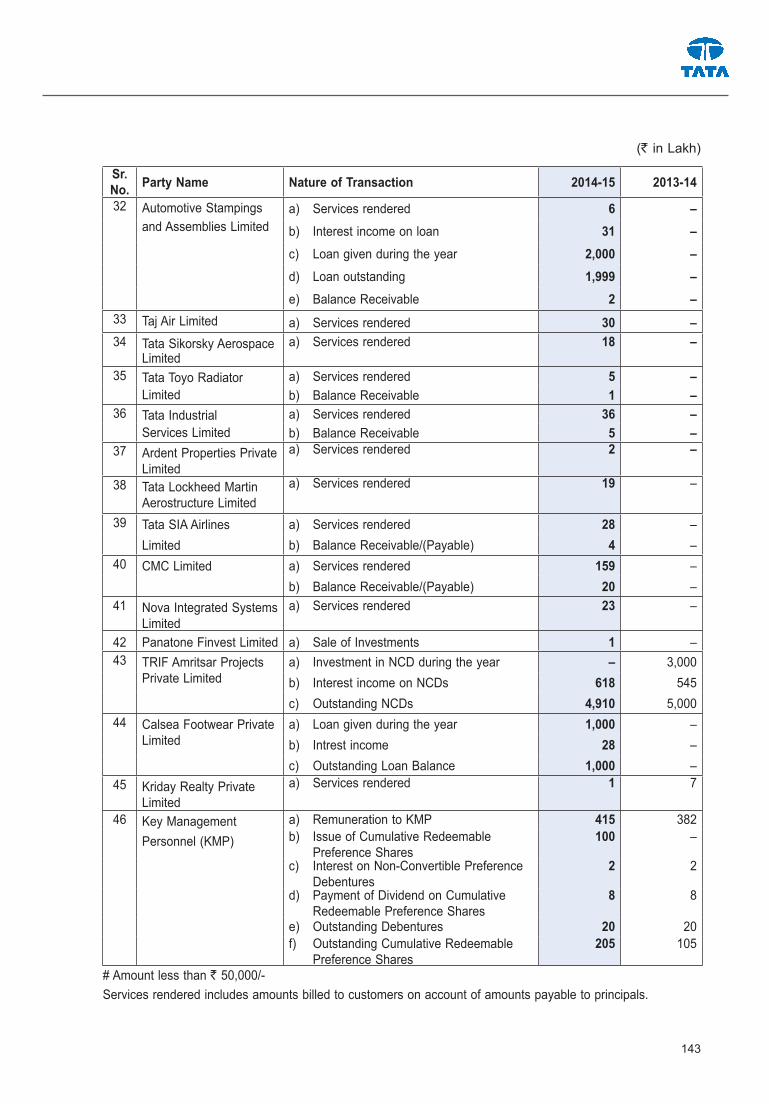
143
(` in Lakh)
Sr. No. Party Name Nature of Transaction 2014-15 2013-14
32 Automotive Stampingsand Assemblies Limited
a) Services rendered 6 –b) Interest income on loan 31 –c) Loan given during the year 2,000 –d) Loan outstanding 1,999 –e) Balance Receivable 2 –
33 Taj Air Limited a) Services rendered 30 –34 Tata Sikorsky Aerospace
Limiteda) Services rendered 18 –
35 Tata Toyo RadiatorLimited
a) Services rendered 5 –b) Balance Receivable 1 –
36 Tata Industrial Services Limited
a) Services rendered 36 –b) Balance Receivable 5 –
37 Ardent Properties Private Limited
a) Services rendered 2 –
38 Tata Lockheed Martin Aerostructure Limited
a) Services rendered 19 –
39 Tata SIA Airlines a) Services rendered 28 –Limited b) Balance Receivable/(Payable) 4 –
40 CMC Limited a) Services rendered 159 –b) Balance Receivable/(Payable) 20 –
41 Nova Integrated Systems Limited
a) Services rendered 23 –
42 Panatone Finvest Limited a) Sale of Investments 1 –43 TRIF Amritsar Projects
Private Limiteda) Investment in NCD during the year – 3,000b) Interest income on NCDs 618 545c) Outstanding NCDs 4,910 5,000
44 Calsea Footwear Private Limited
a) Loan given during the year 1,000 –b) Intrest income 28 –c) Outstanding Loan Balance 1,000 –
45 Kriday Realty Private Limited
a) Services rendered 1 7
46 Key ManagementPersonnel (KMP)
a) Remuneration to KMP 415 382b) Issue of Cumulative Redeemable
Preference Shares100 –
c) Interest on Non-Convertible Preference Debentures
2 2
d) Payment of Dividend on Cumulative Redeemable Preference Shares
8 8
e) Outstanding Debentures 20 20f) Outstanding Cumulative Redeemable
Preference Shares205 105
# Amount less than ` 50,000/-Services rendered includes amounts billed to customers on account of amounts payable to principals.

144
Annual Report 2014-15
NOTE “36”The Group avails from time to time non-cancellable long-term leases for office premises including office furniture. The total of future minimum lease payments that the Group is committed to make is:
(` in lakh)
Lease Payments As at March 31, 2015
As at March 31, 2014
- Within one year 359 458- Later than one year and not later than five years 929 1,243- Later than five years 341 101
The amount charged towards lease rentals (as part of Rent expenditure) is ` 3,439 Lakh (March 31, 2014 : ` 3,024 Lakh).
The Group has given Assets under non-cancellable operating leases. The total of future minimum lease payments that the Group is committed to receive is:
(` in lakh)
Lease Payments As at March 31, 2015
As at March 31, 2014
- Within one year 10,238 6,106- Later than one year and not later than five years 10,138 7,389- Later than five years 388 –
The details of Gross investments, unearned finance income in respect of assets given under finance lease are as under:
(` in lakh)
Particulars 2014-15 2013-14Gross Investments:- Within one year 4,163 6,685- Later than one year and not later than five years 5,598 4,785- Later than five years 381 – Total 10,142 11,470Unearned Finance Income:- Within one year 839 992- Later than one year and not later than five years 4,602 563- Later than five years 337 – Total 5,778 1,555Present Value of Rentals:- Within one year 3,324 5,693- Later than one year and not later than five years 996 4,222- Later than five years 44 – Total 4,364 9,915

145
NOTE “37” Earnings per Share (EPS):
Particulars 2014-15 2013-14
Profit after tax ` in Lakh 30,553 21,425
Less : Dividend on Preference Shares (including dividend distribution tax)
` in Lakh 7,676 5,783
Profit after tax available for equity shareholders ` in Lakh 22,877 15,642
Weighted average number of equity shares used in computing Basic EPS
Nos 2,768,771,879 2,768,317,928
Face value of equity shares Rupees 10 10
Basic EPS Rupees 0.83 0.57Profit after tax available for equity shareholders ` in Lakh 22,877 15,642
Weighted Average Number of equity shares used in computing Basic earnings per share
Nos 2,768,771,879 2,768,317,928
Add: Potential weighted average number of equity shares
Nos 57,246,291 57,700,242
Weighted average number of shares in computing Diluted EPS
Nos 2,826,018,170 2,826,018,170
Face value of equity shares Rupees 10 10
Diluted EPS Rupees 0.81 0.55
Shares under the ESOP Schemes are issued at intrinsic value. [Refer Note 1(xii))]

146
Annual Report 2014-15
NOTE “38”
Additional information as required by Paragraph 2 of the General Instructions for Preparation of Consolidated Financial Statements to Schedule III to the Companies Act, 2013
(` in Lakh)
Name of the Entity
2014-15 2013-14 2014-15 2013-14 Net assets, i.e.,
total assets minus total liabilities
Net Assets, i.e. total assets minus
total liabilities
Share of profit or loss
Share in profit or loss
As % of consoli-
dated net assets
Amount As % of consoli-
dated net assets
Amount As % of consoli-
dated net assets
Amount As % of consoli-
dated net assets
Amount
Parent: Tata Capital Limited 84.09 426,931 86.00 397,717 37.80 11,549 36.20 7,756 Subsidiaries IndianTata Capital Financial Services Limited 64.69 328,423 69.00 319,033 61.31 18,733 80.34 17,213 Tata Capital Housing Finance Limited 15.54 78,893 13.00 60,242 22.23 6,793 27.20 5,828 Tata Cleantech Capital Limited 6.29 31,953 2.00 8,304 2.13 650 1.39 298 Tata Securities Limited 0.49 2,500 – 2,062 1.46 447 (5.55) (1,190) TC Travel & Services Limited 0.38 1,921 – 1,975 (0.17) (53) (3.08 (661) Tata Capital Forex Limited 0.04 198 – 507 (1.00) (304) (2.78) (596) Tata Capital Growth Fund 2.81 14,261 2.00 9,498 (0.40) (123) (6.65) (1,425) India Collections Management Limited 0.14 722 – 668 0.18 54 0.22 48 Tata Infrastructure Capital Limited 0.01 63 – 61 0.01 3 0.01 3 Foreign Tata Capital Pte. Limited 4.48 22,750 4.00 17,377 15.23 4,652 17.45 3,738 Minority Interests in all subsidiaries Indian Tata Capital Growth Fund 0.74 3,745 1.00 2,497 0.11 32 1.75 374 Tata Cleantech Capital Limited 1.23 6,231 – 1,619 (0.41) (127) (0.27) (58) India Collections Management Limited – – – 127 (0.03) (9) (0.04) (9) Foreign Tata Capital Pte. Limited 0.10 499 – 471 (0.02) (7) 0.01 1 Associates (Investment as per theequity method) Indian Tata Capital Healthcare Fund 0.75 3,788 1.00 3,552 (0.76) (233) (0.84) (179) Tata Capital Special Situations Fund 1.33 6,771 1.00 4,243 1.05 320 (0.59) (126) Tata Capital Innovations Fund 0.59 3,001 1.00 2,311 (0.59) (181) (0.62) (132)Tata Autocomp Systems Limited 6.29 31,953 7.00 32,328 1.94 593 3.95 846 International Asset ReconstructionCompany Private Limited 0.70 3,534 1.00 3,422 0.37 112 0.51 109
e-Nxt Financials Limited – – – 1,182 – – 0.74 158 Hemisphere Properties India Limited – – – 1 – – – –Precision Camshafts Limited – – – – – – 3.03 649 Joint Ventures (as per proportionate consolidation) - IndianNectar Loyalty Management India Limited (0.30) (1,519) – (1,519) – – (2.43) (521) Eliminations (90.40) (458,932) (88.00) (406,282) (40.41) (12,348) (49.93) (10,698) Total 100.00 507,686 100.00 461,395 100.00 30,553 100.00 21,425

147
NOTE “39” SEGMENT REPORTINGIn accordance with Accounting Standard 17 (Segment Reporting) the Group has identified three business segments i.e. Financing Activity, Investment Activity, and Others and one Geographical Segment viz. India, as secondary segment.
(` in lakh)
Particulars As at March 31, 2015
As at March 31, 2014
I Segment Revenue
(a) Financing Activity 371,962 326,654
(b) Investment Activity 30,739 18,166
(c) Others 40,670 32,067
Total 443,371 376,887
Less : Inter Segment Revenue 23,053 18,990
Total Income 420,318 357,897
II Segment Results
(a) Financing Activity 29,015 48,097
(b) Investment Activity 16,733 (3,378)
(c) Others 5,627 678
Total 51,375 45,397
Less : Unallocated Corporate Expenses 10,178 11,240
Profit before taxation 41,197 34,157
Less : Provision for taxation 11,145 14,365
Profit after taxation 30,052 19,792
III Segment Assets
(a) Financing Activity 3,373,307 2,831,984
(b) Investment Activity 203,924 148,084
(c) Others 97,236 95,395
(d) Unallocated 47,444 42,664
Total 3,721,911 3,118,127
IV Segment Liabilities
(a) Financing Activity 3,049,369 2,540,713
(b) Investment Activity 29,309 6,259
(c) Others 94,994 83,981
(d) Unallocated 41,066 27,271
Total 3,214,739 2,658,225

148
Annual Report 2014-15
NOTE “39” SEGMENT REPORTING (Contd...) (` in lakh)
Particulars As at March 31, 2015
As at March 31, 2014
V Capital Expenditure (including Capital Work-in-Progress)
(a) Financing Activity – 133
(b) Investment Activity – –
(c) Others 31,815 22,755
(d) Unallocated 3,101 1,008
Total 34,916 23,896
VI Depreciation and Amortisation
(a) Financing Activity 766 449
(b) Investment Activity – –
(c) Others 8,590 5,524
(d) Unallocated 1,146 794
Total 10,502 6,767
VII Significant Non-Cash Expenses Other than Depreciation and Amortisation
(a) Financing Activity 43,089 18,753
(b) Investment Activity (6,440) 9,558
(c) Others – 153
(d) Unallocated – –
Total 36,649 28,464
149
NOTE “40”
DERIVATIVE INSTRUMENTS EXPOSURES: There are no derivative positions open as at March 31, 2015 (Previous Year : Yen 416 million - ` 2,578 Lakh) towards Forward Contracts (payment for Capital Expenditure). These transactions were undertaken to act as economic hedges for the Group’s exposures to various risks in foreign exchange markets and may / may not qualify or be designated as hedging instruments. The accounting for these transactions is stated in note 1 (xvi).
Forward exchange contracts (being derivative instrument), which are not intended for trading or speculation purposes but for hedge purposes to establish the amount of reporting currency required or available at the settlement date at certain payables and receivables.
NOTE “41” As at March 31, 2015, the Company has received an amount of ` 5,000 lakh towards share application money for issue of preference shares of the Company. The share application money was received pursuant to an invitation to offer shares and in terms of such invitation, the Company is required to complete the allotment formalities by April 28, 2015. The Company has sufficient authorised capital to cover the allotment of these shares. As of March 31, 2015, pending allotment of shares, the amount is maintained in a designated bank account and is not available for use by the Company. Subsequently, the Company has allotted the shares on April 22, 2015.
As at March 31, 2014, the Company had received an amount of ` 604 lakh towards share application money for issue of preference shares of the Company which was subsequently allotted on April 01, 2014.
NOTE “42” Vide circular NHB(ND)/DRS/Pol. Circular No. 62/2014 dated May 27, 2014, the National Housing Bank (“NHB”) has directed Housing Finance Companies (HFCs) to provide for a deferred tax liability in respect of the balance in the “Special Reserve” created under section 36(1) (viii) of the Income Tax Act, 1961. NHB has, within the same circular, clarified that the deferred tax liability in respect of the opening balance in the Special Reserve as at April 1, 2014, may be created by adjusting the opening reserves as of that date, but has mandated charging the Statement of Profit and Loss for the period in respect of additional appropriations to Special Reserve out of the net profit after tax Accordingly, the Group has adjusted its opening reserves as at April 1, 2014 with the amount of deferred tax liability in respect of the opening balance in the Special Reserve as of that date and has charged its Statement of Profit and Loss for the quarter ended June 30, 2014, with the deferred tax liability on the additional amount expected to be appropriated towards Special Reserve out of profits after tax. Accordingly an amount of ` 626 Lakh has been against opening balance of Statement of Profit & Loss for the year ended March 31, 2015 with the deferred tax liabilities on the additional amount appropriated towards Special Reserve out of Profits after tax. Accordingly an amount of 626 ` Lakh has been adjusted against opening balance of Statement of Profit & Loss.
Vide circular NHB(ND)/DRS/Policy Circular 65/2014-15 dated August 22, 2014 NHB has given an option to HFCs to create the deferred tax liability on the opening balance of special reserves over a period of 3 years in a ratio of 25:25:50. As stated above the Group has already created the Deferred Tax Liability on the entire amount.
NOTE “43” During year ended March 31, 2015 the Group has acquired 62,250,000 unquoted equity shares of Tata Teleservices Limited, as part of a loan conciliation/settlement agreement (the “Settlement Agreement”) with the borrower. The equity shares have been recorded at a cost of ` 14,318 lakh, being the carrying amount of the loan settled, and classified as a part of the Group’s Long Term Investments. In addition to the above, the Group has entered into a “Shareholders” Agreement with the borrower which includes, provision like seeking approvals for sale from the borrower, right of first refusal to purchase the said shares by the borrower, call option favoring borrower and a put option favoring the Group with a minimum threshold price. Further, the agreement defines the proportion of sharing of surplus arising on
150
Annual Report 2014-15
sale of the said shares. The entire arrangement is time bound with latest expiry being 36 months from date of Shareholder’s Agreement. As at the Balance Sheet date, the Group does not have any liability with regard to its commitments.
NOTE “44” During the year ended March 31, 2015, the Group has sold 1,277,920 equity shares of State Bank of India for a total consideration of ` 25,600 lakh resulting in a gain of ` 6,254 lakh.
NOTE “45” During the year ended March 31, 2015, the Group has reassessed depreciation rate on tangible fixed assets as per the useful life specified in the Companies Act, 2013. Based on current estimates, depreciation of ` 77 Lakh on account of assets whose useful life is already exhausted as on April 01, 2014 has been adjusted against the opening surplus in the Statement of Profit and Loss.
NOTE “46” Investments in bonds, debentures and other financial instruments which, in substance, form a part of the Group’s financing activities (“Credit Substitutes”) have been classified as under Loans and Advances - Financing Activity (note 15). In the past these were classified as a part of Investments (note 13). Management believes that the current period’s classification results in a better presentation of the substance of these receivables and is in alignment with other regulatory filings.
NOTE “47” Pursuant to a Scheme of Arrangement (the “Scheme”) filed with the Honourable High Court of Judicature at Hyderabad and the Honourable High Court of Judicature at Bombay, it is proposed to amalgamate e-Nxt Financials Limited with Tata Business Support Services Limited at the proposed Appointment Date of April 01, 2014. The Scheme has been approved by the Honourable High Court of Hyderabad, post the Balance Sheet date, but is under the consideration of the Honourable High Court of Judicature at Bombay. Post the approval of the Scheme by the Honourable High Court of Judicature at Bombay, e-Nxt Financials Limited shall cease to be an associate of the Company with effect from the Appointment Date i.e. April 01, 2014.
NOTE “48” Previous year’s figures have been regrouped / reclassified wherever necessary to correspond with the current year’s classification / disclosure.
For and on behalf of the Board of Directors
Ishaat Hussain Janki Ballabh Nalin M. Shah F.N. Subedar (Director) (Director) (Director) (Director)
Nirmalya Kumar Ritu Anand Praveen P. Kadle (Director) (Director) (Managing Director & CEO)
Puneet Sharma Avan Doomasia (Chief Financial Officer) (Company Secretary)
Mumbai Date: May 08, 2015

151
Form
AO
C -
1(P
ursu
ant t
o fir
st p
rovi
so to
sub
-sec
tion
(3)
of S
ectio
n 12
9 re
ad w
ith R
ule
5 of
the
Com
pani
es (
Acc
ount
s) R
ules
, 201
4)
Sta
tem
ent c
onta
inin
g sa
lient
feat
ures
of t
he fi
nanc
ial s
tate
men
ts o
f sub
sidi
arie
s/as
soci
ates
/join
t ven
ture
sPa
rt “
A”:
SU
BSI
DIA
RIE
S(`
in la
kh)
Sr.
No.
Nam
e of
Sub
sidi
ary
Repo
rting
cur
renc
y an
d ex
chan
ge ra
te a
s on
the
last
dat
e of
the
rele
vant
Fin
anci
al Y
ear
in th
e ca
se o
f for
eign
su
bsid
iarie
s
Shar
e Ca
pita
l /
Partn
er’s
Capi
tal /
Un
it ho
lder
’s Ca
pita
l
Rese
rves
&
Surp
lus
Tota
l As
sets
Tota
l Li
abili
tites
Inve
st-
men
tsTu
rnov
erPr
ofit/
(Los
s)
Befo
re
Taxa
tion
Prov
isio
n fo
r Ta
xatio
n
Profi
t/ (L
oss)
Af
ter
Taxa
tion
Prop
osed
Di
vide
nd%
of
Shar
e-ho
ldin
g
1Ta
ta C
apita
l Fina
ncial
Ser
vices
Lim
ited
` 1
29,7
55
198
,668
2
,574,4
00
2,24
5,977
8
9,73
5 3
06,5
36
25,
033
6,3
00
18,
733
– 1
00.0
0
2Ta
ta C
apita
l Hou
sing
Fina
nce
Limite
d`
66,
733
12,
160
919
,503
8
40,6
10
– 9
1,01
3 1
0,33
0 3
,537
6
,793
3
02
100
.00
3Ta
ta C
leant
ech
Capit
al Lim
ited
` 2
8,90
9 3
,044
6
9,06
0 3
7,10
7 –
2,8
45
992
3
43
649
–
80.
50
4Ta
ta C
apita
l Pte
. Lim
ited(1
)1
US$
= `
62.4
1 1
3,53
4 8
,174
6
5,37
2 4
3,66
5 5
3,07
2 9
,842
8
,127
1
3 8
,114
– 1
00.0
0
5Ta
ta C
apita
l Mar
kets
Pte.
Lim
ited(1
)1
US$
= `
62.4
1 3
,932
(1
,427
) 2
,663
1
58
– 5
24
(358
) (1
7) (3
41)
– 1
00.0
0
6Ta
ta C
apita
l Adv
isors
Pte
. Lim
ited(1
)1
US$
= `
62.4
1 4
,724
4
,245
9
,939
9
69
10
8,6
28
4,1
56
(3)
4,1
59
– 1
00.0
0
7Ta
ta C
apita
l Gen
eral
Partn
ers
LLP(1
)1
US$
= `
62.4
1 3
,121
(6
32)
2,4
93
4
– 2
,067
2
0 –
20
– 8
0.00
8Ta
ta C
apita
l Hea
lthca
re G
ener
al Pa
rtner
s LL
P(1)
1 US
$ =
` 62
.41
31
(16)
69
54
– 9
8 2
–
2
– 1
00.0
0
9Ta
ta O
ppor
tunit
ies G
ener
al Pa
rtner
s LL
P(1)
1 US
$ =
` 62
.41
7
(1)
10
5
– 6
,370
2
4 –
24
– 9
0.00
10Ta
ta C
apita
l Plc(1
)1
£ =
` 92
.21
922
8
3 1
,073
6
8 –
609
3
1 6
2
5 1
00.0
0
11Ta
ta S
ecur
ities
Limite
d`
1,8
83
617
6,9
71
4,47
0–
3,6
50
447
–
447
–
100
.00
12TC
Tra
vel a
nd S
ervic
es L
imite
d`
2,5
00
(579
) 3
,904
1
,984
5
1
,226
(5
3)–
(53)
– 1
00.0
0
13Ta
ta C
apita
l For
ex L
imite
d`
1,0
43
(845
) 6
,272
6
,074
–
1,5
61
(304
)–
(304
)–
100
.00
14Ta
ta C
apita
l Gro
wth
Fund
- Tr
ust(3
)`
22,
793
(8,5
32)
14,
270
9
13,
465
649
(1
13)
10
(123
)–
73.
75
15In
dia C
ollec
tions
Man
agem
ent L
imite
d(4)
` 7
50
(28)
724
2
–
58
54
– 5
4 –
100
.00
16Ta
ta In
frastr
uctu
re C
apita
l Lim
ited(4
)`
55
8
65
1
– 5
4
1
3
–
100
.00
Not
es -
Part
“A
”(1
) Sh
are
Capit
al, P
artn
er’s
Capit
al, U
nitho
lder’s
Cap
ital,
Rese
rves
& S
urplu
s, To
tal A
sset
s, To
tal L
iabilit
ies a
nd In
vestm
ents
are
trans
lated
at t
he e
xcha
nge
rate
as
on M
arch
31,
201
5 as
: 1 U
S$ =
` 6
2.41
and
1
£ =
` 92
.21
wher
eas
Turn
over
, Pro
fit be
fore
Tax
ation
, Pro
vision
for T
axat
ion a
nd P
rofit
afte
r Tax
ation
are
tran
slate
d at
ann
ual a
vera
ge ra
te o
f 1 U
S$ =
` 6
1.25
and
1 £
= `
98.
43.
(2)
Repo
rting
per
iod fo
r all s
ubsid
iaries
is th
e sa
me
as h
olding
com
pany
.(3
) Th
ough
Tru
sts w
ould
not b
e co
nside
red
as b
ody
corp
orat
e un
der t
he C
ompa
nies A
ct, 2
013,
thes
e ha
ve b
een
disclo
sed
as a
mea
sure
of g
ood
gove
rnan
ce.
(4)
India
Coll
ectio
ns M
anag
emen
t Lim
ited
and
Tata
Infra
struc
ture
Cap
ital L
imite
d, w
holly
own
ed s
ubdia
ries
of th
e Co
mpa
ny, a
re y
et to
com
men
ce o
pera
tions
.

152
Annual Report 2014-15 P
AR
T “B
”: A
SSO
CIA
TES
AN
D J
OIN
T VE
NTU
RES
Sta
tem
ent p
ursu
ant t
o S
ectio
n 12
9(3)
of t
he C
ompa
nies
Act
, 201
3 re
late
d to
Ass
ocia
te C
ompa
nies
and
Joi
nt V
entu
re
(` in
lakh
)
Sr.
NoNa
me
of A
ssoc
iate
/ Jo
int V
entu
re1.
Lat
est
audi
ted
Bala
nce
Shee
t da
te
2. S
hare
s of
Ass
ocia
te/J
oint
Ven
ture
hel
d by
the
Com
pany
on
the
year
end
3. D
escr
iptio
n of
how
ther
e is
sig
nific
ant
influ
ence
4. R
easo
n wh
y th
e as
soci
ate/
join
t ven
ture
ha
s no
t bee
n co
nsol
idat
ed
5. N
etwo
rth a
ttrib
utab
le to
sh
areh
oldi
ng a
s pe
r lat
est
audi
ted
Bala
nce
Shee
t
6. P
rofit
/(Los
s) fo
r the
yea
r
No. o
f Sha
res
Amou
nt o
f in
vest
men
t in
Asso
ciat
e /
Join
t Ven
ture
Exte
nt o
f Ho
ldin
g %
i. Co
nsid
ered
in
Co
nsol
idat
ion
ii. No
t Co
nside
red
in Co
nsoli
datio
n
1Ta
ta C
apita
l Hea
lthca
re F
und
- Tru
st(3)
31.0
3.20
15 N
.A
4,9
31
31.3
0%Si
nce
the
Com
pany
ho
lds
mor
e th
an
20%
of
vo
ting
powe
r, sig
nifica
nt
influe
nce
is as
sum
ed
N.A
3,7
68
(233
) (5
11)
2Ta
ta C
apita
l Spe
cial S
ituat
ions
Fund
-T
rust(3
)31
.03.
2015
N.A
7
,306
28
.15%
N.A
6,6
79
320
8
16
3Ta
ta C
apita
l Inn
ovat
ions
Fund
- Tr
ust(3
)31
.03.
2015
N.A
3
,941
27
.13%
N.A
2,9
14
(181
) (4
86)
4Ta
ta A
utoc
omp
Syste
ms
Limite
d31
.03.
2014
48,
307,
333
18,
528
24.0
0%N.
A 1
9,86
2 5
93
1,8
79
5In
tern
ation
al As
set R
econ
struc
tion
Com
pany
Priv
ate
Limite
d31
.03.
2015
13,
946,
295
3,3
13
25.3
7%N.
A 3
,051
1
12
329
6Ne
ctar L
oyalt
y M
anag
emen
t Ind
ia Lim
ited
31.0
3.20
14 4
90,0
00
49
49.0
0%No
te 1
(1,4
85)
––
7e-
Nxt F
inanc
ials
Limite
d31
.03.
2014
1,5
00,0
00
1,0
22
50.0
0%No
te 2
892
–
–
8He
misp
here
Pro
perti
es In
dia L
imite
d 31
.03.
2014
25,
000
250
,000
24
.44%
Note
4 2
–
–
Not
es -
Part
“B
”(1
) Th
e Co
mpa
ny h
as fu
lly p
rovid
ed fo
r its
inves
tmen
t in
equit
y sh
ares
in th
e joi
nt v
entu
re w
ith N
ecta
r Loy
alty
Man
agem
ent I
ndia
Limite
d (“N
ecta
r”) d
uring
the
finan
cial y
ear.
Sinc
e th
e inv
estm
ent i
s fu
lly p
rovid
ed
for a
nd th
e fa
ct th
at N
ecta
r’s o
pera
tions
are
held
in a
beya
nce
durin
g th
e ye
ar a
nd lo
ss p
icked
up
histo
ricall
y is
mor
e th
an in
veste
d am
ount
, the
inve
stmen
t has
not
bee
n co
nsoli
date
d.(2
) Pu
rsua
nt to
a S
chem
e of
Am
algam
ation
(“Sc
hem
e”) fi
led w
ith th
e Ho
n’ble
High
Cou
rt of
Hyd
erab
ad a
nd th
e Ho
n’ble
High
Cou
rt of
Bom
bay,
it wa
s pr
opos
ed to
am
algam
ate
e-Nx
t Fina
ncial
s Lim
ited
with
Tat
a Bu
sines
s Su
ppor
t Ser
vices
Lim
ited,
with
effe
ct fro
m th
e Ap
point
ed D
ate
of A
pril
1, 2
014.
The
Sch
eme
has
been
app
rove
d by
the
Hon’b
le Hi
gh C
ourt
of H
yder
abad
and
app
rova
l of t
he H
on’bl
e Hi
gh C
ourt
of
Bom
bay,
is aw
aited
. Sinc
e, th
e Ap
point
ed D
ate
is Ap
ril 1,
201
4, th
e Co
mpa
ny h
as n
ot c
onso
lidat
ed th
e fin
ancia
ls of
e-N
xt Fi
nanc
ials
Limite
d.(3
) Th
ough
Tru
sts w
ould
not b
e co
nside
red
as b
ody
corp
orat
e un
der t
he C
ompa
nies A
ct, 2
013,
thes
e ha
ve b
een
disclo
sed
as a
mea
sure
of g
ood
gove
rnan
ce.
(4)
Hem
isphe
re P
rope
rties
India
Lim
ited
ceas
ed to
be
an a
ssoc
iate
since
Mar
ch 2
6, 2
015.
Is
haat
Hus
sain
J
anki
Bal
labh
N
alin
M. S
hah
F.N
. Sub
edar
N
irmal
ya K
umar
R
itu A
nand
Pr
avee
n P.
Kad
le
(
Dire
ctor
)
(D
irect
or)
(D
irect
or)
(Dire
ctor
) (D
irect
or)
(Dire
ctor
) (M
anag
ing
Dire
ctor
& C
EO
)
Pu
neet
Sha
rma
Avan
Doo
mas
ia
(C
hief
Fin
anci
al O
ffice
r)
(Com
pany
Sec
reta
ry)
Mum
bai
Dat
e: M
ay 8
, 201
5

153
StandaloneFinancial
Statements

154
Annual Report 2014-15
INDEPENDENT AUDITORS’ REPORTTO THE BOARD OF DIRECTORS OF TATA CAPITAL LIMITED
Report on the Financial StatementsWe have audited the accompanying financial statements of TATA CAPITAL LIMITED (the “Company”), which comprise the Balance Sheet as at March 31, 2015, the Statement of Profit and Loss and the Cash Flow Statement for the year then ended, and a summary of significant accounting policies and the explanatory information.
Management’s Responsibility for the Financial StatementsThe Company’s Board of Directors is responsible for the matters stated in Section 134(5) of the Companies Act, 2013 (the “Act”) with respect to the preparation of these standalone financial statements that give a true and fair view of the financial position, financial performance and cash flows of the Company in accordance with the accounting principles generally accepted in India, including the Accounting Standards specified under Section 133 of the Act, read with Rule 7 of the Companies (Accounts) Rules, 2014. This responsibility also includes maintenance of adequate accounting records in accordance with the provisions of the Act for safeguarding the assets of the Company and for preventing and detecting frauds and other irregularities; selection and application of appropriate accounting policies; making judgments and estimates that are reasonable and prudent; and design, implementation and maintenance of adequate internal financial controls, that were operating effectively for ensuring the accuracy and completeness of the accounting records, relevant to the preparation and presentation of the financial statements that give a true and fair view and are free from material misstatement, whether due to fraud or error.
Auditors’ ResponsibilityOur responsibility is to express an opinion on these financial statements based on our audit.
We have taken into account the provisions of the Act, the accounting and auditing standards and matters which are required to be included in the audit report under the provisions of the Act and the Rules made thereunder.
We conducted our audit in accordance with the Standards on Auditing specified under Section 143(10) of the Act. Those Standards require that we comply with ethical requirements and plan and perform the audit to obtain reasonable assurance about whether the financial statements are free from material misstatement.
An audit involves performing procedures to obtain audit evidence about the amounts and the disclosures in the condensed financial statements. The procedures selected depend on the auditor’s judgment, including the assessment of the risks of material misstatement of the financial statements, whether due to fraud or error. In making those risk assessments, the auditor considers the internal financial control relevant to the Company’s preparation of the financial statements that give a true and fair view in order to design audit procedures that are appropriate in the circumstances, but not for the purpose of expressing an opinion on whether the Company has in place an adequate internal financial controls system over financial reporting and the operating effectiveness of such controls. An audit also includes evaluating the appropriateness of the accounting policies used and the reasonableness of the accounting estimates made by the Company’s Directors, as well as evaluating the overall presentation of the financial statements.
We believe that the audit evidence we have obtained is sufficient and appropriate to provide a basis for our audit opinion on the financial statements.
OpinionIn our opinion and to the best of our information and according to the explanations given to us, the aforesaid financial statements give the information required by the Act in the manner so required and give a true and fair view in conformity with the accounting principles generally accepted in India, of the

155
state of affairs of the Company as at March 31, 2015, and its profit and its cash flows for the year ended on that date.
Report on Other Legal and Regulatory Requirements
1. As required by the Companies (Auditor’s Report) Order, 2015 (the “Order”) issued by the Central Government in terms of Section 143(11) of the Act, we give in the Annexure a statement on the matters specified in paragraphs 3 and 4 of the Order.
2. As required by Section 143 (3) of the Act, we report that:
(a) We have sought and obtained all the information and explanations which to the best of our knowledge and belief were necessary for the purposes of our audit.
(b) In our opinion, proper books of account as required by law have been kept by the Company so far as it appears from our examination of those books
(c) The Balance Sheet, the Statement of Profit and Loss, and the Cash Flow Statement dealt with by this Report are in agreement with the books of account.
(d) In our opinion, the aforesaid financial statements comply with the Accounting Standards specified under Section 133 of the Act, read with Rule 7 of the Companies (Accounts) Rules, 2014.
(e) On the basis of the written representations received from the directors and taken on record by the Board of Directors, none of the directors is disqualified as on March 31, 2015 from being appointed as a director in terms of Section 164 (2) of the Act.
(f) With respect to the other matters to be included in the Auditor’s Report in accordance with Rule 11 of the Companies (Audit and Auditors) Rules, 2014, in our opinion and to the best of our information and according to the explanations given to us:
i. The Company has disclosed the impact of pending litigations on its financial position in its financial statements - Refer Note 24 to the financial statements.
ii. The Company has made provisions, as required under the applicable law or accounting standards, for material foreseeable losses on long term contracts. The Company does not have any outstanding derivative contracts as at the year end.
iii. As at the year end, there were no amounts that were required to be transferred, to the Investor Education and Protection Fund by the Company.
For DELOITTE HASKINS & SELLS LLP Chartered Accountants
(Firm’s Registration No. 117366W/W-100018)
SANJIV V. PILGAONKAR Mumbai, Partner May 08, 2015 (Membership No. 39826)
156
Annual Report 2014-15
ANNEXURE TO THE INDEPENDENT AUDITORS’ REPORT(Referred to in paragraph 1 under ‘Report on Other Legal and Regulatory Requirements’ section of our report of even date)
1. In respect of the Company’s fixed assets:
(a) The Company has maintained proper records showing full particulars, including quantitative details and situation of fixed assets.
(b) The Company has a program of verification of fixed assets to cover all the items in a phased manner over a period of three years which, in our opinion, is reasonable having regard to the size of the Company and the nature of its assets. Pursuant to the program, certain fixed assets were physically verified by the Management during the year. According to the information and explanations given to us no material discrepancies were noticed on such verification.
2. According to the information and explanations given to us, the Company is engaged in investing activities and therefore does not hold any physical inventories. Accordingly, the provisions of paragraph 3 (ii) of the Order are not applicable to the Company;
3. According to the information and explanations given to us, the Company has granted unsecured loans to a company covered in the Register maintained under Section 189 of the Companies Act, 2013. In respect of such loans:(a) The receipts of principal amounts and interest have been as per stipulations.(b) There are no overdue amounts in excess or ` 1 lakh remaining outstanding as at year-end.
4. In our opinion and according to the information and explanations given to us, there are adequate internal control systems commensurate with the size of the Company and the nature of its business for the purchase of fixed assets and for the sale of services. The nature of the Company’s business is such that it does not involve purchase of inventories and sale of goods. During the course of our audit, we have not observed any major weaknesses in such internal control system.
5. In our opinion and according to the information and explanations given to us, the Company has not accepted deposits. Therefore, the provisions of the clause 3 (v) of the Order are not applicable to the Company.
6. In our opinion, the provisions of clause (3)(vi) of the Order are not applicable to the Company as the Company is not engaged in the production of goods or in providing services covered by the Companies (Cost Records and Audit) Rules, 2014.
7. According to the information and explanations given to us, in respect of statutory dues: (a) The Company has been regular in depositing undisputed dues in respect of Provident Fund,
Income Tax, Profession Tax, Service Tax and other material statutory dues applicable to it with the appropriate authorities.
(b) There were no undisputed amounts payable in respect of provident fund, income tax, sales tax, wealth tax, service tax, duty of customs, duty of excise, value added tax, cess and other material statutory dues in arrears as at March 31, 2015 for a period of more than six months from the date they became payable.
(c) Details of dues of value added tax which have not been deposited as at March 31, 2015 on account of disputes are given below:
Particulars Period to which the amount relates
Forum where the dispute is pending
Amount(` lakh)
Value added tax 2008-09 and 2011-12. Deputy Commissioner 312009-10, 2010-11 and 2011-12 Tribunal 42
2010-11 Joint Commissioner 31
157
There were no dues of income tax, sales tax, wealth tax, service tax, duty of customs, duty of excise and cess which have not been deposited as on March 31, 2015 on account of disputes.
(d) There are no amounts payable in respect of Investor Education and Protection Fund in accordance with the relevant provisions of the Companies Act, 1956 (1 of 1956) and Rules made thereunder.
8. The Company does not have accumulated losses at the end of the financial year and the Company has not incurred cash losses during the financial year covered by our audit and in the immediately preceding financial year.
9. According to the information and explanations given to us, the Company has neither borrowed any sum from banks or financial institutions nor has it issued any debentures.
10. In our opinion and according to the information and explanations given to us, and having regard to the extent of equity ownership in those entities, on whose behalf the guarantees were given the terms and conditions of such guarantees given by the Company for loans taken by others from banks and financial institutions are not, prima facie, prejudicial to the interests of the Company
11. According to the information and explanations given to us, the Company has not taken any term loan during the year. Therefore, the provisions of clause 3(xi) of the Order are not applicable to the Company.
12. To the best of our knowledge and belief and according to the information and explanations given to us, no fraud by the Company and no material fraud on the Company has been noticed or reported during the year.
For DELOITTE HASKINS & SELLS LLP Chartered Accountants
(Firm’s Registration No. 117366W/W-100018)
SANJIV V. PILGAONKAR Mumbai, Partner May 08, 2015 (Membership No. 39826)

158
Annual Report 2014-15
BALANCE SHEET AS AT MARCH 31, 2015(` in lakh)
Particulars Note No.
As at March 31, 2015
As at March 31, 2014
I. EQUITY AND LIABILITIES 1. Shareholders’ Funds (a) Share Capital 3 372,243 351,235 (b) Reserves and Surplus 4 49,687 45,878
421,930 397,113 2. Share application money pending allotment 38 5,000 604 3. Non-current liabilities (a) Other Long term liabilities 5 15,020 15,020 (b) Long-term provisions 6 96 23
15,116 15,043 4. Current liabilities (a) Short-term borrowings 7 91,116 22,140 (b) Trade payables 8 1,865 1,891 (c) Other current liabilities 9 632 5,302 (d) Short-term provisions 10 7,884 6,303
101,497 35,636 Total 543,543 448,396II. ASSETS 1. Non-Current assets (a) Fixed Assets 11 (i) Tangible assets 13,050 13,656 (ii) Capital work-in-progress 1 2
13,051 13,658 (b) Non-current Investments 12 466,726 403,126 (c) Deferred tax assets 13 189 281 (d) Long-term loans and advances 14 1,987 3,301 (e) Other non-current assets 15 175 292
482,128 420,658 2. Current assets (a) Trade receivables 16 679 1,140 (b) Cash and bank balances 17 12,023 121 (c) Short-term loans and advances 18 37,378 19,198 (d) Other current assets 19 11,335 7,279
61,415 27,738 Total 543,543 448,396See accompanying notes forming part of the financial statements 1-40
In terms of our report attached For and on behalf of the Board of Directors
For Deloitte Haskins & Sells LLP Ishaat Hussain Janki Ballabh Nalin M. Shah F.N. Subedar Chartered Accountants (Director) (Director) (Director) (Director)
Sanjiv V. Pilgaonkar Nirmalya Kumar Ritu Anand Praveen P. Kadle Partner (Director) (Director) (Managing Director & CEO)
Puneet Sharma Avan Doomasia (Chief Financial Officer) (Company Secretary)Mumbai Date: May 08, 2015

159
STATEMENT OF PROFIT AND LOSS for the year ended MARCH 31, 2015(` in lakh)
Particulars Note No.
For the year ended
March 31, 2015
For the year ended
March 31, 2014
I Revenue from Operations 20 18,033 13,082
II Other Income 21 6,321 3,636
III Total Revenue (I + II) 24,354 16,718
IV Expenses:
Finance costs 22 4,089 1,596
Employee benefits expense 23 3,267 3,082
Other operating expenses 24 3,347 2,441
Depreciation 769 659
Amortisation of share issue expenses 379 290
Total Expenses 11,851 8,068
V Profitbeforetax(III-IV) 12,503 8,650
VI Tax expense:
(1) Current tax 862 1,084
(2) Deferred tax 92 (190)
Total Tax expense 954 894
VII Profitfortheyear(V-VI) 11,549 7,756
VIII Earnings per equity share :
(1) Basic (in `) 0.14 0.07
(2) Diluted (in `) 0.14 0.07
Face Value per share (Amount in `) 10 10
See accompanying notes forming part of the financial statements 1-40
In terms of our report attached For and on behalf of the Board of Directors
For Deloitte Haskins & Sells LLP Ishaat Hussain Janki Ballabh Nalin M. Shah F.N. Subedar Chartered Accountants (Director) (Director) (Director) (Director)
Sanjiv V. Pilgaonkar Nirmalya Kumar Ritu Anand Praveen P. Kadle Partner (Director) (Director) (Managing Director & CEO)
Puneet Sharma Avan Doomasia (Chief Financial Officer) (Company Secretary)Mumbai Date: May 08, 2015

160
Annual Report 2014-15
CASH FLOW STATEMENT for the year ended MARCH 31, 2015(` in lakh)
Particulars Note No.
For the year ended
March 31, 2015
For the year ended
March 31, 20141. CASH FLOW FROM OPERATING ACTIVITIES Profit before tax 12,503 8,650 Adjustments for :
Dividend Income (12,901) (7,682) Income from Investments 1 – Interest Income (4,409) (1,870) Interest Expenses 360 549 Discounting charges on Commercial Paper 3,730 1,047 Provision for employee benefits 25 (25) Provision for rebate on advisory fees (525) 525 Provision against Standard Assets 93 37 Provision for diminution in value of investments 1,297 – Amortisation of share issue expenses 379 290 Depreciation 769 659 Income accrued on advisory fees 127 (127)
Operating Profit before working capital changes and adjustments forinterest paid, interest received and dividend received
1,449 2,053
Adjustments for : (Increase) / Decrease in Trade receivables 461 (697) Increase in Loans and advances (16,904) (15,094) Decrease in Trade payables (26) (1,025) Increase / (Decrease) in other liabilities and provisions 303 (35)
Cash (used in) operations before adjustments for interest paid, interest received and dividend received
(14,717) (14,798)
Interest paid (3,037) (1,111) Interest received 4,403 1,872 Dividend received 8,976 5,088
Cash (used in) / from operations (4,375) (8,949) Taxes paid (953) (707) CASH FLOW FROM OPERATING ACTIVITIES (5,328) (9,656)2. CASH FLOW FROM INVESTING ACTIVITIES Purchase of fixed assets (including capital advances) (192) (2,576) Proceeds from sale of fixed assets 2 7 Investments in group companies (64,896) (30,704) Proceeds from sale of investments – 2 Net cash used in investing activities (65,086) (33,271)3. CASH FLOW FROM FINANCING ACTIVITIES Collection of loan given to employees for ESOP 0* 13 Issue of preference shares 20,499 47,926 Dividend paid on preference shares including dividend distribution tax (net) (5,783) (1,130) Interest expense on share application money (33) (121) Share application money (refunded) / received (95) 604 Share issue expenses (299) (566) Net proceeds from short-term borrowings 63,027 (3,882) Netcashfromfinancingactivities 77,316 42,844 Net increase / (decrease) in cash and cash equivalents 6,902 (83) CASH AND CASH EQUIVALENTS AS AT THE BEGINNING OF THE YEAR 121 204 CASH AND CASH EQUIVALENTS AS AT THE END OF THE YEAR 17 7,023 121 Reconciliation of cash and cash equivalents as above with cash and bank
balances CASH AND CASH EQUIVALENTS AS AT THE END OF THE YEAR 7,023 121 Add: Restricted Cash (Refer Note 17) 5,000 – CASH AND BANK BALANCE AS AT THE END OF THE YEAR 12,023 121* Amount less than ` 50,000See accompanying notes forming part of the financial statements 1-40
In terms of our report attached For and on behalf of the Board of Directors
For Deloitte Haskins & Sells LLP Ishaat Hussain Janki Ballabh Nalin M. Shah F.N. Subedar Chartered Accountants (Director) (Director) (Director) (Director)Sanjiv V. Pilgaonkar Nirmalya Kumar Ritu Anand Praveen P. Kadle Partner (Director) (Director) (Managing Director & CEO) Puneet Sharma Avan Doomasia (Chief Financial Officer) (Company Secretary)Mumbai Date: May 08, 2015

161
TATA CAPITAL LIMITEDSIGNIFICANT ACCOUNTING POLICIES AND NOTES TO ACCOUNTS1. CORPORATE INFORMATION Tata Capital Limited (the “Company” or “TCL”) is a subsidiary of Tata Sons Limited. In May 2012,
TCL was registered with the Reserve Bank of India (“RBI”) as a Core Investment Company (“CIC”). As a CIC, TCL is primarily a holding company, holding investments in its subsidiaries and other
group companies and carries out only such activities as are permitted under the guidelines issued by the RBI for CICs. The Company’s subsidiaries are engaged in a wide array of businesses in the financial services sector.
2. SIGNIFICANT ACCOUNTING POLICIESi. Basisofaccountingandpreparationofthefinancialstatements The financial statements of the Company have been prepared in accordance with the
Generally Accepted Accounting Principles in India (Indian GAAP) to comply with the Accounting Standards specified under Section 133 of the Companies Act, 2013, read with Rule 7 of the Companies (Accounts) Rules, 2014 and the relevant provisions of the Companies Act, 2013 (“the Act”), as applicable. The financial statements have been prepared on accrual basis under the historical cost convention. The accounting policies adopted in the preparation of the financial statements are consistent with those followed in the previous year.
Current assets do not include elements which are not expected to be realised within one year and current liabilities do not include items which are due after one year.
ii. Operating Cycle Based on the nature of products/activities of the company and the normal time between
acquisition of assets and their realisation in cash or cash equivalents, the company has determined its operating cycle as 12 months for the purpose of classification of its assets and liabilities as current and non current.
iii. Use of Estimates The preparation of the financial statements requires the Management of the Company to
make estimates and assumptions that affect the reported balances of assets and liabilities, and disclosures relating to contingent liabilities as at the date of the financial statements and reported amounts of income and expenses for the reporting period. The Management believes that the estimates used in preparation of the financials statements are prudent and reasonable. Future results could differ from these estimates. Any revision to accounting estimates is recognised prospectively in the current and future periods. Estimates include provisions for doubtful debts and advances, employee benefit plans, provision for income taxes and provision for diminution in the value of investments.
iv. Revenue recognition a. Income from Current and Long-term Investments
Income from dividend on shares of corporate bodies and units of mutual funds is accounted when the Company’s right to receive dividend is established.
Interest income on bonds and debentures is recognised on a time proportion basis taking into account the amount outstanding and the rate applicable.
b. Income from Services Fees for financial advisory services are accounted based on stage of completion of
assignments, when there is reasonable certainty of its ultimate realisation. Income from property management is recognised on a straight line basis to the extent
that rental income is deemed collectible. Income from managerial and marketing services is accounted on cost plus markup basis
as and when the underlying costs are incurred. Reimbursements of expenses incurred for rendering the services are reduced from such expense heads.
c. Income on Inter corporate deposits Interest income on deposits is recognised on a time proportion basis taking into account
the amount outstanding and the rate applicable.
162
Annual Report 2014-15
v. Provisions for standard assets The Company provides an allowance for inter-corporate deposits and debentures based on the
prudential norms issued by the RBI relating to income recognition, asset classification and provisioning.
vi. Investments Investments are classified into long-term investments and current investments.
a. Long-term investments Long-term investments are stated at cost. Provision for diminution is made to recognise a
diminution, other than temporary, in the value of such investments. Investments in Subsidiaries are classified as Trade Investments. Long-term investments
made by the Company in equity shares, preference shares or debentures in its associates or any other entities primarily intended to fulfill its business objective are also classified as Trade Investments. It is intended to hold these to further the long-term interests of the Company and not for the purpose of frequent selling/trading of these investments.
b. Current investments Current Investments are stated at the lower of cost and the market value, determined on
an individual investment basis.
vii. Fixed Assets a. Tangible:
Tangible fixed assets acquired by the Company are reported at acquisition cost, with deductions for accumulated depreciation and impairment losses, if any.
The acquisition value includes the purchase price (excluding refundable taxes) and expenses directly attributable to the asset to bring it to the site and in the working condition for its intended use.”
b. Capital work-in-progress: Projects under which tangible fixed assets are not yet ready for their intended use are
carried at cost, comprising direct cost (excluding refundable taxes), related incidental expenses and attributable interest.
viii. Depreciation Depreciable amount for assets is the cost of an asset, or other amount substituted for cost,
less its estimated residual value.
Depreciation on tangible fixed assets is provided using the straight-line method in accordance with the useful life prescribed in Schedule II to the Companies Act, 2013 except in respect of Buildings and Vehicles, in whose case the life of the assets has been assessed based on the nature of the asset, the estimated usage of the asset, the operating conditions of the asset and past history of replacement. The following table sets out the Estimated useful lives considered by the Company:Asset Estimated useful lifeBuilding 25 yearsComputer Equipment 3 yearsFurniture and Fixtures 10 yearsOffice Equipment 5 yearsVehicles 4 years
All capital assets with individual value less than ` 5,000 are depreciated fully in the month in which they are purchased.
ix. Impairment of Assets At each Balance Sheet date, the Company reviews whether there is any indication of
impairment of assets. If any such condition exists, the recoverable amount of the asset is estimated in order to determine the extent of impairment loss (if any).
Recoverable amount of the asset is the higher of an asset’s net selling price and value in use. In assessing the value in use, the estimated future cash flow expected from continuing use
163
of the asset and from its disposal is discounted to its present value using a pre-tax discount rate that reflects the current market assessments of time value of money and the risk specific to the asset. If the recoverable amount of an asset is estimated to be less than the carrying amount, the carrying amount of the asset is reduced to its recoverable amount. An impairment loss is recognised immediately in the Statement of Profit and Loss. After impairment, depreciation is provided on the revised carrying amount of the assets over its remaining useful life. A previously recognised impairment loss is increased or reversed depending on changes in circumstances. However, the carrying value after reversal is not increased above the lower of recoverable amount and the carrying value that would have prevailed by charging usual depreciation if there was no impairment.
x. Deferred revenue expenditure Share issue expenses are amortised over a period of 36 months from the month in which the
Company has incurred the expenditure. Ancillary costs in the nature of loan processing charges are amortised over the tenor of the
loan from the month in which the Comany has incurred the expenditure.
xi. EmployeeBenefits Employee benefits include provident fund, superannuation fund, gratuity fund, compensated
absences and long service awards.
a. Defined-contributionplans The eligible employees of the Company are entitled to receive benefits under provident
fund, a defined contribution plan, in which both employees and the Company make monthly contributions at a specified percentage of the covered employees’ salary (currently 12% of employees’ salary), which is recognised as an expense in the Statement of Profit and Loss in the year in which they occur. The contributions as specified under the law are paid to the provident fund set up as irrevocable trust by the Company. The Company is generally liable for annual contributions and any shortfall in the fund assets based on the government specified minimum rates of return and recognises such contributions and shortfall, if any, as an expense in the year incurred.
The Company’s contribution to the superannuation fund is considered as a defined contribution plan and is charged as an expense based on the amount of contribution required to be made as and when services are rendered by the employees.
b. Defined-benefitplans For defined benefit plans in the form of gratuity, the cost of providing benefits is
determined using the Projected Unit Credit method, with actuarial valuations being carried out at each Balance Sheet date. Actuarial gains and losses are recognised in the Statement of Profit and Loss in the year in which they occur. Past service cost is recognised immediately to the extent that the benefits are already vested and otherwise is amortised on a straight-line basis over the average period until the benefits become vested. The retirement benefit obligation recognised in the Balance Sheet represents the present value of the defined benefit obligation as adjusted for unrecognised past service cost, as reduced by the fair value of scheme assets. Any asset resulting from this calculation is limited to past service cost, plus the present value of available refunds and reductions in future contributions to the schemes.
c. Short-termemployeebenefits The undiscounted amount of short-term employee benefits expected to be paid in
exchange for the services rendered by employees is recognised during the year when the employees render the service. These benefits include performance incentive and compensated absences which are expected to occur within twelve months after the end of the year in which the employees render the related service.
The cost of short-term compensated absences is accounted as under :
(a) in case of accumulated compensated absences, when employees render the services that increase their entitlement of future compensated absences; and
(b) in case of non-accumulating compensated absences, when the absences occur.

164
Annual Report 2014-15
d. Long-termemployeebenefits Compensated absences which are not expected to occur within twelve months after the
end of the year in which the employees render the related service are recognised as a liability at the present value of the defined benefit obligation as at the balance sheet date less the fair value of the plan assets out of which the obligations are expected to be settled. Long Term Service Awards are recognised as a liability at the present value of the defined benefit obligation as at the Balance Sheet date.
e. Employees Share Purchase / Option Scheme As per the Guidance Note on Accounting for Employee Share-based Payments issued
by the Institute of Chartered Accountants of India, the Company has adopted the intrinsic value method in accounting of the Employee Stock Options offered by the Company.
f. Share Based Payment Transactions The grant date intrinsic value of share based payment options under the Employees’
Share Purchase Scheme (“ESPS”) granted to employees, determined as the fair value of underlying shares, less the amount which the employee is required to pay at the time of exercise of the option (the exercise price), is recognised as an employee cost with a corresponding increase in equity in the period of the grant as the options granted under Company’s ESPS plan vest immediately and it is presumed that consideration for the options have been received.
As the Company has adopted the intrinsic value for accounting the share based payments, there are no adjustments made to the amounts recognised as an expense for differences between the expected and actual outcomes.
On exercise of the stock option, the amount standing to the credit of the relevant equity account is treated as part of the consideration for the shares issued. Where stock options expires unexercised the balance to the credit of the relevant equity account is transferred to the general ledger.
xii. Provisions, Contingent Liabilities and Contingent Assets A provision is recognised when the Company has a present obligation as a result of past
event and it is probable that an outflow of resources will be required to settle the obligation, in respect of which reliable estimate can be made. Provisions (excluding long term employee benefits) are not discounted to their present values and are determined based on best estimate required to settle the obligation at the Balance Sheet date. These are reviewed at each Balance Sheet date and adjusted to reflect the current best estimates. Contingent liabilities are not recognised but disclosed in the financial statements. A contingent asset is neither recognised nor disclosed in the financial statements.
xiii. Accounting for Leases Leases of assets under which substantially all of the risks and rewards of ownership are
effectively retained by the lessor are classified as operating leases. The Company has let out portions of its buildings to its subsidiaries / associates under operating lease arrangements. Income is recognised over the period over which the property is used by the lessee based on the lease terms as the arrangements are cancellable and do not confirm any minimum lease payments or contingent rent payments.
xiv. Foreign currency transactions and translations Initial recognition:-
Transactions in foreign currencies entered into by the Company are accounted at the exchange rates prevailing on the date of the transaction or at rates that closely approximate the rate at the dates of the transactions.
Measurement at the Balance Sheet date:- Foreign currency monetary items (other than derivative contracts), outstanding at the Balance
Sheet date are restated at the closing rates. Non-monetary items are carried at historical cost.

165
xv. Taxation Current tax is the amount of tax payable on the taxable income for the year as determined in
accordance with the applicable tax rates and the provision of the Income Tax Act, 1961 and the other applicable tax laws.
Deferred tax corresponds to the net effect of tax on all timing differences,which occur as a result of items being allowed for income tax purposes during a year different from when they were recognised in the financial statements.
Deferred tax is recognised on the timing differences, being the differences between the taxable income and the accounting income that originate in one period and are capable of reversal in one or more subsequent periods. Deferred tax is measured using the tax rates and the tax laws enacted or substantively enacted as at the reporting date. Deferred tax liablities are recognised for all timing differences. Deferred tax assets are recognised for timing differences of items other than unabsorbed depreciation and carry forward losses only to the extent that reasonable certainty exists that sufficient future taxable income will be available against which these can be realised. However, if there are unabsorbed depreciation and carry forward losses and items relating to capital losses, deferred tax assets are recognised only if there is virtual certainty supported by convincing evidence that there will be sufficient future taxable income available to realise assets. Deferred tax assets and liabilities are offset if such items relate to taxes on income levied by the same governing tax laws and the company has a legally enforcable right for such set off. Deferred tax assets are reviewed at each Balance Sheet date for their realisability.
Current and deferred tax relating to items directly recognised in reserves are recognised in reserves and not in the Statement of Profit & Loss.
xvi. Business segment The Company’s reportable segments consist of Investments, Advisory Services and Others.
Investments consist of corporate investments and treasury activities. Advisory Services consists of Investment management and support services activities and Others include managerial services and property management.
Revenue and expense directly attributable to segments are reported under each reportable segment. All other expenses which are not attributable to the segments have been disclosed as unallocable expenses.
Assets and liabilities that are directly attributable to segments are disclosed under each reportable segment. All other assets and liabilities are disclosed as unallocable.
xvii. Cash Flow Statement Cash flows are reported using the indirect method, whereby profit before tax is adjusted for
the effects of transactions of non-cash nature and any deferrals or accruals of past or future cash receipts or payments. The cash flows from operating, investing and financing activities of the Company are segregated based on the available information.
xviii. Earnings Per Share Basic earnings per share is computed by dividing the profit after tax available for equity
shareholders by the weighted average number of equity shares outstanding during the year. Diluted earnings per share is computed by dividing the profit after tax available for equity shareholders as adjusted for dividend, interest and other charges to expense or income (net of any attributable taxes) relating to the dilutive potential equity shares, by the weighted average number of equity shares considered for deriving basic earnings per share and the weighted average number of equity shares which could have been issued on the conversion of all dilutive potential equity shares. Potential equity shares are deemed to be dilutive only if their conversion to equity shares would decrease the net profit per share from continuing ordinary operations. Potential dilutive equity shares are deemed to be converted as at the beginning of the year, unless they have been issued at a later date. The dilutive potential equity shares are adjusted for the proceeds receivable had the shares been actually issued at fair value (i.e. average market value of the outstanding shares). Dilutive potential equity shares are determined independently for each year presented. The number of equity shares and potentially dilutive equity shares are adjusted for share splits / reverse share splits and bonus shares, as appropriate.

166
Annual Report 2014-15
NOTE “3” (` in lakh)
SHARE CAPITAL As at March 31, 2015
As at March 31, 2014
AUTHORISED
4,750,000,000 (as at March 31, 2014: 4,750,000,000 shares) Equity shares of ` 10 each
475,000 475,000
32,500,000 (as at March 31, 2014: 32,500,000 shares) Preference shares of ` 1,000 each
325,000 325,000
ISSUED
2,826,092,570 (as at March 31, 2014: 2,826,092,570 shares) Equity shares of ` 10 each
282,609 282,609
12,121,215 (as at March 31, 2014: 7,570,424 shares) Preference shares of ` 1,000 each
121,212 75,704
SUBSCRIBED
2,826,018,170 (as at March 31, 2014: 2,826,018,170 shares) Equity shares of ` 10 each
282,602 282,602
8,964,467 (as at March 31, 2014: 6,863,676 shares) Preference shares of ` 1,000 each
89,645 68,637
PAID UP
2,826,018,170 (as at March 31, 2014: 2,826,018,170 shares) Equity shares of ` 10 each fully paid up
282,602 282,602
Less: Loan given to TCL Employees Welfare Trust (3) (3)
Less: Loans to Employees (1) (1)
8,964,467 (as at March 31, 2014: 6,863,676 shares) Preference shares of ` 1,000 each fully paid up
89,645 68,637
Total 372,243 351,235
NOTES TO AND FORMING PART OF THE BALANCE SHEET AS AT MARCH 31, 2015

167
NOTE “3” (Continued)
3 (a) Reconciliation of number of shares outstanding No. of shares ` in Lakh
Opening Share Capital as on April 1, 2013
Equity Shares Face Value ` 10 fully paid up 2,826,018,170 282,602
Cumulative Redeemable Preference Shares Face Value ` 1,000 fully paid up
2,071,066 20,711
Additions during the year
Equity Share Capital – –
Preference Share Capital
– Privately placed 4,792,610 47,926
Closing Share Capital as on March 31, 2014
Equity Shares Face Value ` 10 fully paid up 2,826,018,170 282,602
Preference Shares Face Value ` 1,000 fully paid up 6,863,676 68,637
Additions during the year
Equity Share Capital – –
Preference Share Capital
– Privately placed 2,100,791 21,008
Closing Share Capital as on March 31, 2015
Equity Shares Face Value ` 10 fully paid up 2,826,018,170 282,602
Preference Shares Face Value ` 1,000 fully paid up 8,964,467 89,645
3 (b) Rights, preferences and restrictions attached to Equity Shares The Company has one class of equity shares having a par value of ` 10 per share. Each
shareholder is eligible for one vote per share held. The dividend proposed by the Board of Directors is subject to the approval of the shareholders at the ensuing Annual General Meeting, except in case of interim dividend. In the event of liquidation, the equity shareholders are eligible to receive the remaining assets of the Company after distribution of all preferential amounts, in proportion to their shareholding.
NOTES TO AND FORMING PART OF THE BALANCE SHEET AS AT MARCH 31, 2015

168
Annual Report 2014-15
NOTE “3” (Continued)
3 (c) Investment by Tata Sons Limited (the Holding Company) and its Subsidiaries/Associates/JVs.
Name of company Particulars of issue No. of equity shares ` in Lakh
Tata Sons Limited (the Holding Company)
Opening Balance as on April 1, 2013 2,551,433,946 255,143add: Purchased – –Closing Balance as on March 31, 2014 2,551,433,946 255,143
add: Purchased – –Closing Balance as on March 31, 2015 2,551,433,946 255,143
Tata Investment Corporation Limited (Subsidiary of Tata Sons Limited)
Opening Balance as on April 1, 2013 77,196,591 7,719add: Purchased – –Closing Balance as on March 31, 2014 77,196,591 7,719add: Purchased – –Closing Balance as on March 31, 2015 77,196,591 7,719
Tata Industries Limited (Subsidiary of Tata Sons Limited)
Opening Balance as on April 1, 2013 2,272,346 227add: Purchased – –Closing Balance as on March 31, 2014 2,272,346 227add: Purchased – –Closing Balance as on March 31, 2015 2,272,346 227
Tata International Limited (Subsidiary of Tata Sons Limited)
Opening Balance as on April 1, 2013 790,592 79add: Purchased – –Closing Balance as on March 31, 2014 790,592 79add: Purchased – –Closing Balance as on March 31, 2015 790,592 79
Tata Motors Limited (Associate of Tata Sons Limited)
Opening Balance as on April 1, 2013 4,326,651 433add: Purchased – –Closing Balance as on March 31, 2014 4,326,651 433add: Purchased – –Closing Balance as on March 31, 2015 4,326,651 433
Tata Chemicals Limited (Associate of Tata Sons Limited)
Opening Balance as on April 1, 2013 3,230,859 323add: Purchased – –Closing Balance as on March 31, 2014 3,230,859 323add: Purchased – –Closing Balance as on March 31, 2015 3,230,859 323
Tata Global Beverages Limited (Associate of Tata Sons Limited)
Opening Balance as on April 1, 2013 613,598 61add: Purchased – –Closing Balance as on March 31, 2014 613,598 61add: Purchased – –Closing Balance as on March 31, 2015 613,598 61
NOTES TO AND FORMING PART OF THE BALANCE SHEET AS AT MARCH 31, 2015

169
NOTE “3” (Continued)
3 (d) List of Shareholders holding more than 5% Equity Shares as at
Name of ShareholderMarch 31, 2015 March 31, 2014
No. of Shares held % of Holding No. of Shares held % of HoldingTata Sons Limited 2,551,433,946 90.28% 2,551,433,946 90.28%
3 (e) Rights, preferences and restrictions attached to Preference Shares The Company has issued Cumulative Redeemable Preference Shares (“CRPS”) of face value
` 1,000/- each, in tranches, having terms of issuance disclosed herein below. The CRPS holders have a right to receive dividend, prior to the Equity Shareholders. The dividend proposed by the Board of Directors on the CRPS is subject to the approval of the shareholders at the ensuing Annual General Meeting, except in case of interim dividend. In the event of liquidation, the Preference Shareholders are eligible to receive the remaining assets of the Company before distribution to the Equity Shareholders, in proportion to their shareholding.
Particulars Tranche No. of Shares Allotment Date Redemption Date Early Redemption
Date *12.5% Cumulative Redeemable Preference Shares of ` 1,000 each issued at Premium of ` 500 per share and redeemable at a premium of ` 500 per share.
A 984,078 August 10, 2012 August 9, 2019 N/AB 411,614 October 22, 2012 October 21, 2019 N/AC 166,666 December 10, 2012 December 9, 2019 N/AD 104,308 January 21, 2013 January 20, 2020 N/AE 200,000 February 27, 2013 February 26, 2020 N/AF 204,400 March 28, 2013 March 27, 2020 N/A
8.33% Cumulative Redeemable Preference Shares of ` 1,000 each
G 899,000 June 6, 2013 June 5, 2020 September 30, 2017H 2,500,000 May 22, 2013 May 21, 2020 September 30, 2017I 996,050 July 9, 2013 July 8, 2020 September 30, 2017J 369,660 September 5, 2013 September 4, 2020 September 30, 2017K 27,900 November 7, 2013 November 6, 2020 March 31, 2018L 50,900 April 1, 2014 March 31, 2021 March 31, 2018M 2,049,891 August 19, 2014 August 18, 2021 September 30, 2018
* For 8.33% Cumulative Redeemable Preference Shares of ` 1,000 each, the CRPS holder has a Put Option and the Company has a Call Option to seek early redemption of the CRPS by the dates as specified.
3 (f) List of Shareholders holding more than 5% Preference Shares as at
Name of ShareholderMarch 31, 2015 March 31, 2014 *
No. of Shares held % of Holding No. of Shares
held % of Holding
Shree Cement Limited 1,000,000 11.16% – 0.00%* No shareholder was holding more than 5% of the total Preference Share Capital of the Company as
on March 31, 2014.
3 (g) Details of Shares allotted as fully paid up without payment being received in cash during precedingfiveyears.
Particulars Financial Year (Aggregate No. of Shares)2014-15 2013-14 2012-13 2011-12 2010-11
Equity Shares:Fully paid up shares issued pursuant to conversion of Preference Shares
NIL NIL NIL NIL 317,587,500
NOTES TO AND FORMING PART OF THE BALANCE SHEET AS AT MARCH 31, 2015

170
Annual Report 2014-15
NOTE “4” (` in lakh)
RESERVES AND SURPLUS As at March 31, 2015
As at March 31, 2014
(a) Capital Redemption Reserve Opening Balance 575 575 Closing Balance 575 575 (b) Securities Premium Account Opening Balance 28,767 28,765 Add: Securities Premium on Issue of Equity Shares – 2 Closing Balance 28,767 28,767 (c) Special Reserve Account/Statutory Reserve Opening Balance 6,869 5,318 Add: Transfer from Surplus in the Statement of Profit and Loss 2,310 1,551 Closing Balance 9,179 6,869 (d) SurplusinStatementofProfitandLoss Opening Balance 9,667 9,245 Less: Depreciation on transition of Schedule II of Companies Act, 2013 on tangible fixed assets with nil remaining useful life (Refer Note 37) 64 – Add: Profit for the year 11,549 7,756 ProfitavailableforAppropriations 21,152 17,001 Less : Appropriations Transfer to Special Reserve Account 2,310 1,551 Dividend on preference shares including dividend distribution tax (net)
7,676 9,986 5,783 7,334
Closing Balance 11,166 9,667 TOTAL 49,687 45,878
NOTES TO AND FORMING PART OF THE BALANCE SHEET AS AT MARCH 31, 2015
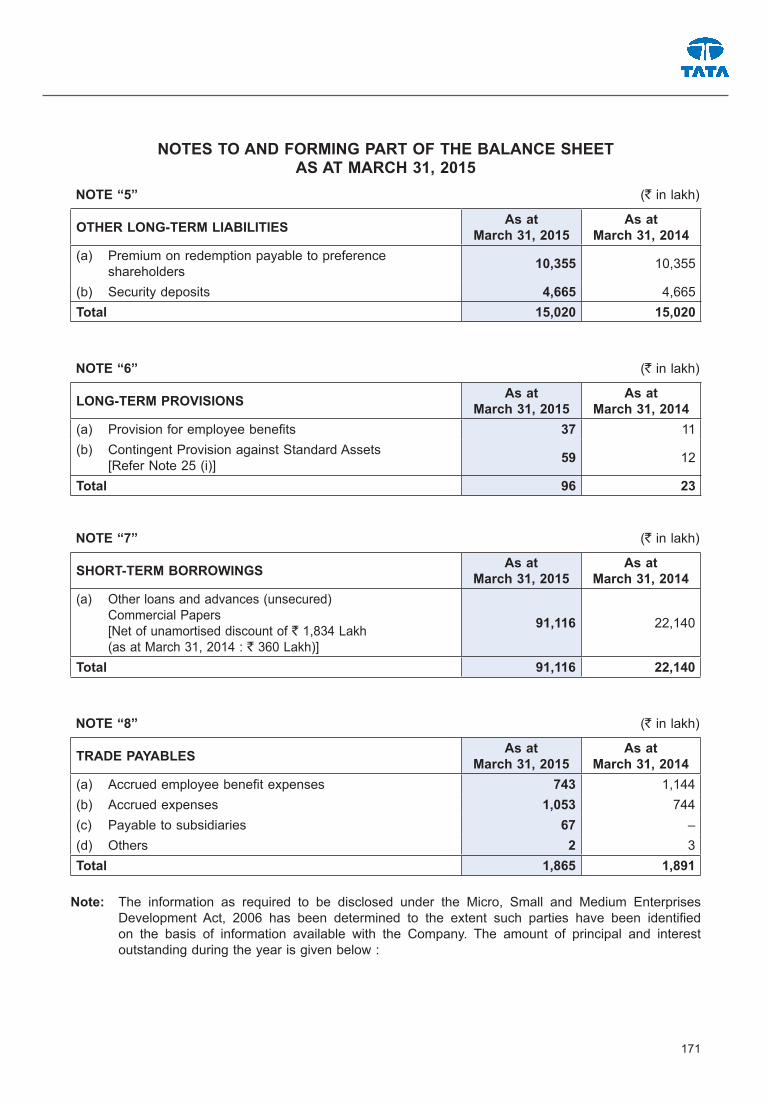
171
NOTE “5” (` in lakh)
OTHER LONG-TERM LIABILITIES As at March 31, 2015
As at March 31, 2014
(a) Premium on redemption payable to preference shareholders 10,355 10,355
(b) Security deposits 4,665 4,665Total 15,020 15,020
NOTE “6” (` in lakh)
LONG-TERM PROVISIONS As at March 31, 2015
As at March 31, 2014
(a) Provision for employee benefits 37 11(b) Contingent Provision against Standard Assets
[Refer Note 25 (i)] 59 12
Total 96 23
NOTE “7” (` in lakh)
SHORT-TERM BORROWINGS As at March 31, 2015
As at March 31, 2014
(a) Other loans and advances (unsecured) Commercial Papers [Net of unamortised discount of ` 1,834 Lakh (as at March 31, 2014 : ` 360 Lakh)]
91,116 22,140
Total 91,116 22,140
NOTE “8” (` in lakh)
TRADE PAYABLES As at March 31, 2015
As at March 31, 2014
(a) Accrued employee benefit expenses 743 1,144(b) Accrued expenses 1,053 744(c) Payable to subsidiaries 67 –(d) Others 2 3Total 1,865 1,891
Note: The information as required to be disclosed under the Micro, Small and Medium Enterprises Development Act, 2006 has been determined to the extent such parties have been identified on the basis of information available with the Company. The amount of principal and interest outstanding during the year is given below :
NOTES TO AND FORMING PART OF THE BALANCE SHEET AS AT MARCH 31, 2015

172
Annual Report 2014-15
NOTES TO AND FORMING PART OF THE BALANCE SHEET AS AT MARCH 31, 2015
(` in lakh)
As at March 31, 2015
As at March 31, 2014
(a) Amounts outstanding but not due as at year end – –(b) Amounts due but unpaid as at year end – –(c) Amounts paid after appointed date during the year – –(d) Amount of interest accrued and unpaid as at year end – –(e) The amount of further interest due and payable even in the succeeding year – –
Total – –
NOTE “9” (` in lakh)
OTHER CURRENT LIABILITIES As at March 31, 2015
As at March 31, 2014
(a) Current maturities of long-term debt (unsecured) – Inter corporate deposit – 4,500
(b) Interest accrued but not due 1 431(c) Income received in advance 582 221(d) Statutory dues 10 112(e) Security deposits 1 –(f) Other payables 38 38Total 632 5,302
NOTE “10” (` in lakh)
SHORT-TERM PROVISIONS As at March 31, 2015
As at March 31, 2014
(a) Provision for employee benefits 115 75(b) Contingent Provisions against Standard Assets [Refer Note 25 (i)] 93 47
(c) Proposed dividend on preference shares 7,676 5,783(d) Other provisions [Refer Note 25 (ii)] * – 398Total 7,884 6,303
* In the previous year, other provisions of ` 398 lakh is towards rebate on Advisory Fees from a fund which is managed by the Company.

173
NOTES TO AND FORMING PART OF THE BALANCE SHEET AS AT MARCH 31, 2015
NOTE “11” : FIXED ASSETS (` in lakh)
Particulars
Gross Block Accumulated depreciation Net Carrying Amount
As at March 31,
2015
Opening balance
as at Additions Deletions
Closing balance
as at
Opening balance
as atDepreci-ation for the year
DeletionsOther
Adjust-ments
Closing balance
as atApril 1,
2014March 31,
2015April 1,
2014March 31,
2015Tangible AssetsBuildings - (Refer Footnote 2)
10,750 – – 10,750 651 430 – – 1,081 9,66910,750 – – 10,750 221 430 – – 651 10,099
Buildings - Given on operating lease
2,539 – – 2,539 62 102 – – 164 2,375– 2,539 – 2,539 – 62 – – 62 2,477
Computer Equipment8 5 – 13 6 3 – – 9 44 4 – 8 4 2 – – 6 2
Furniture & Fixtures657 172 – 829 91 88 – – 179 650617 40 – 657 25 66 – – 91 566
Office Equipment501 16 – 517 84 107 – 64 255 262471 30 – 501 23 61 – – 84 417
Vehicles161 36 (24) 173 66 39 (22) – 83 90127 47 (13) 161 34 38 (6) – 66 95
TANGIBLE FIXED ASSETS - TOTAL
14,616 229 (24) 14,821 960 769 (22) 64 1,771 13,05011,969 2,660 (13) 14,616 307 659 (6) – 960 13,656
Capital work-in-progress12
TOTAL13,05113,658
Footnotes: -1) Previous year figures are given in Italics
2) Portion of the Company’s building have been let out to its subsidiaries / associates, under operating lease arrangements. These arrangements are cancellable and do not contain any minimum lease or contingency lease rentals.
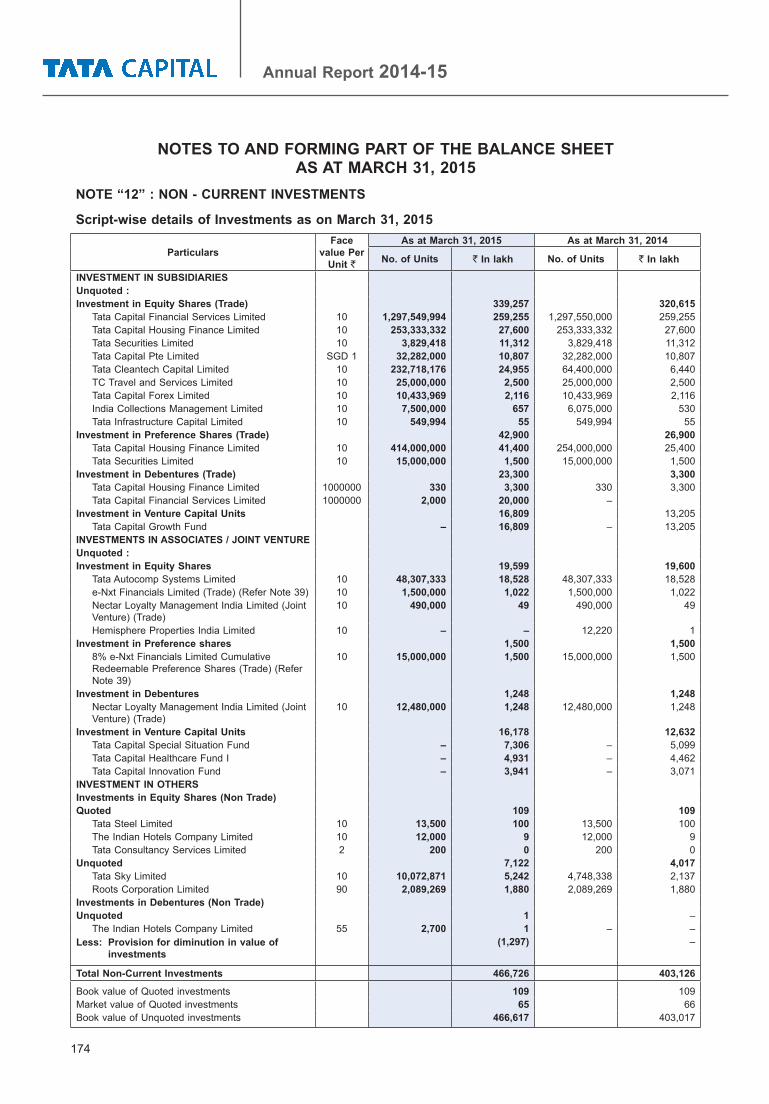
174
Annual Report 2014-15
NOTE “12” : NON - CURRENT INVESTMENTS
Script-wise details of Investments as on March 31, 2015
ParticularsFace
value Per Unit `
As at March 31, 2015 As at March 31, 2014
No. of Units ` In lakh No. of Units ` In lakh
INVESTMENT IN SUBSIDIARIESUnquoted :Investment in Equity Shares (Trade) 339,257 320,615
Tata Capital Financial Services Limited 10 1,297,549,994 259,255 1,297,550,000 259,255Tata Capital Housing Finance Limited 10 253,333,332 27,600 253,333,332 27,600Tata Securities Limited 10 3,829,418 11,312 3,829,418 11,312Tata Capital Pte Limited SGD 1 32,282,000 10,807 32,282,000 10,807Tata Cleantech Capital Limited 10 232,718,176 24,955 64,400,000 6,440TC Travel and Services Limited 10 25,000,000 2,500 25,000,000 2,500Tata Capital Forex Limited 10 10,433,969 2,116 10,433,969 2,116India Collections Management Limited 10 7,500,000 657 6,075,000 530Tata Infrastructure Capital Limited 10 549,994 55 549,994 55
Investment in Preference Shares (Trade) 42,900 26,900Tata Capital Housing Finance Limited 10 414,000,000 41,400 254,000,000 25,400Tata Securities Limited 10 15,000,000 1,500 15,000,000 1,500
Investment in Debentures (Trade) 23,300 3,300Tata Capital Housing Finance Limited 1000000 330 3,300 330 3,300Tata Capital Financial Services Limited 1000000 2,000 20,000 –
Investment in Venture Capital Units 16,809 13,205Tata Capital Growth Fund – 16,809 – 13,205
INVESTMENTS IN ASSOCIATES / JOINT VENTUREUnquoted :Investment in Equity Shares 19,599 19,600
Tata Autocomp Systems Limited 10 48,307,333 18,528 48,307,333 18,528e-Nxt Financials Limited (Trade) (Refer Note 39) 10 1,500,000 1,022 1,500,000 1,022Nectar Loyalty Management India Limited (Joint Venture) (Trade)
10 490,000 49 490,000 49
Hemisphere Properties India Limited 10 – – 12,220 1Investment in Preference shares 1,500 1,500
8% e-Nxt Financials Limited Cumulative Redeemable Preference Shares (Trade) (Refer Note 39)
10 15,000,000 1,500 15,000,000 1,500
Investment in Debentures 1,248 1,248Nectar Loyalty Management India Limited (Joint Venture) (Trade)
10 12,480,000 1,248 12,480,000 1,248
Investment in Venture Capital Units 16,178 12,632Tata Capital Special Situation Fund – 7,306 – 5,099Tata Capital Healthcare Fund I – 4,931 – 4,462Tata Capital Innovation Fund – 3,941 – 3,071
INVESTMENT IN OTHERSInvestments in Equity Shares (Non Trade)Quoted 109 109
Tata Steel Limited 10 13,500 100 13,500 100The Indian Hotels Company Limited 10 12,000 9 12,000 9Tata Consultancy Services Limited 2 200 0 200 0
Unquoted 7,122 4,017Tata Sky Limited 10 10,072,871 5,242 4,748,338 2,137Roots Corporation Limited 90 2,089,269 1,880 2,089,269 1,880
Investments in Debentures (Non Trade)Unquoted 1 –
The Indian Hotels Company Limited 55 2,700 1 – –Less: Provision for diminution in value of
investments(1,297) –
Total Non-Current Investments 466,726 403,126
Book value of Quoted investments 109 109Market value of Quoted investments 65 66Book value of Unquoted investments 466,617 403,017
NOTES TO AND FORMING PART OF THE BALANCE SHEET AS AT MARCH 31, 2015
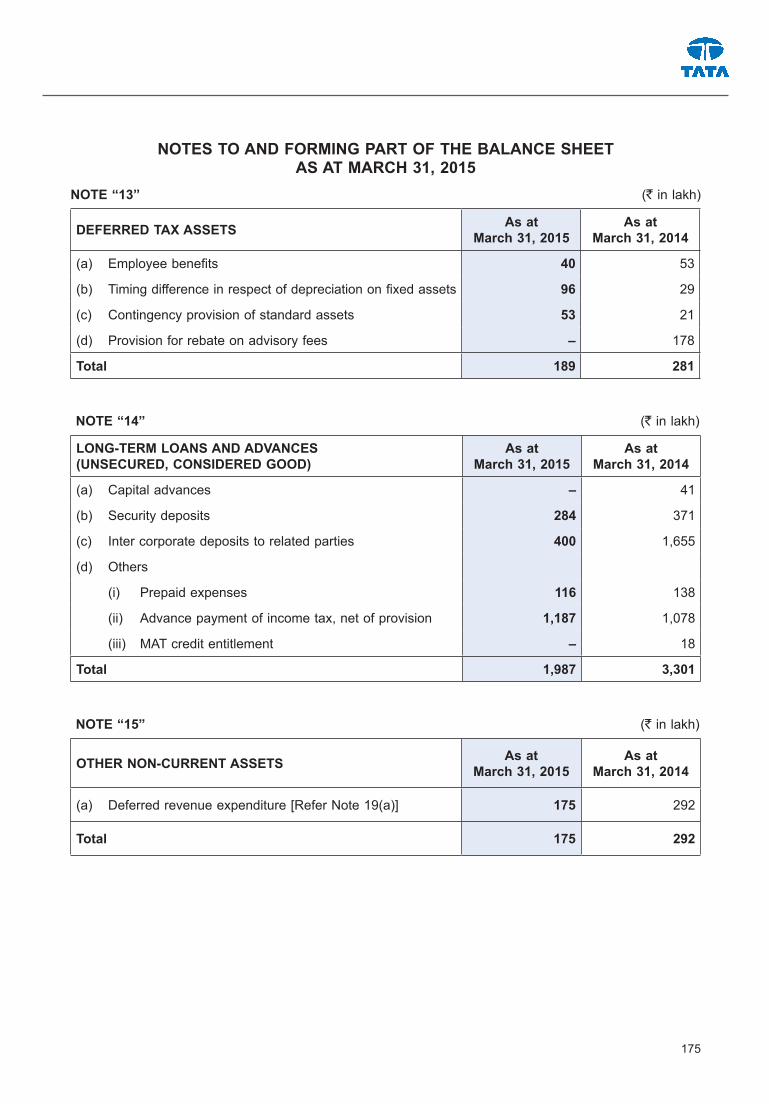
175
NOTE “13” (` in lakh)
DEFERRED TAX ASSETS As at March 31, 2015
As at March 31, 2014
(a) Employee benefits 40 53
(b) Timing difference in respect of depreciation on fixed assets 96 29
(c) Contingency provision of standard assets 53 21
(d) Provision for rebate on advisory fees – 178
Total 189 281
NOTE “14” (` in lakh)
LONG-TERM LOANS AND ADVANCES (UNSECURED, CONSIDERED GOOD)
As at March 31, 2015
As at March 31, 2014
(a) Capital advances – 41
(b) Security deposits 284 371
(c) Inter corporate deposits to related parties 400 1,655
(d) Others
(i) Prepaid expenses 116 138
(ii) Advance payment of income tax, net of provision 1,187 1,078
(iii) MAT credit entitlement – 18
Total 1,987 3,301
NOTE “15” (` in lakh)
OTHER NON-CURRENT ASSETS As at March 31, 2015
As at March 31, 2014
(a) Deferred revenue expenditure [Refer Note 19(a)] 175 292
Total 175 292
NOTES TO AND FORMING PART OF THE BALANCE SHEET AS AT MARCH 31, 2015

176
Annual Report 2014-15
NOTE “16” (` in lakh)
TRADE RECEIVABLES As at March 31, 2015
As at March 31, 2014
(a) Over six months (from the due date for payment) - Unsecured, considered good
200 264
(b) Others - Unsecured, considered good 479 876Total 679 1,140
NOTE “17” (` in lakh)
CASH AND BANK BALANCES As at March 31, 2015
As at March 31, 2014
Cash and cash equivalents(a) Balances with banks in current account 6,901 121(b) Cheques on hand 122 –Other bank balances(a) In earmarked accounts – Share application money received for allotment of securities (Refer Note 38)
5,000 –
Total 12,023 121
Footnote: -Of the above, the balances that meet the definition of Cash and Cash Equivalents as per AS 3 (Cash Flow Statements) is ` 7,023 Lakh (Previous year ` 121 Lakh)
NOTE “18” (` in lakh)
SHORT-TERM LOANS AND ADVANCES (UNSECURED, CONSIDERED GOOD)
As at March 31, 2015
As at March 31, 2014
(a) Loans and advances to related parties 175 238(b) Security deposits 4 –(c) Inter-corporate deposits to related parties 37,110 18,773(d) Others (i) Advances to vendors 19 16 (ii) Other advances 21 16 (iii) Prepaid expenses 46 153 (iv) Balances with government authorities 3 2Total 37,378 19,198
NOTES TO AND FORMING PART OF THE BALANCE SHEET AS AT MARCH 31, 2015

177
NOTE “19” (` in lakh)
OTHER CURRENT ASSETS As at March 31, 2015
As at March 31, 2014
(a) Deferred revenue expenditure [Refer Note 19(a)] 353 316(b) Interest accrued but not due on deposits / investments 211 205(c) Assets held for sale * 223 223(d) Dividend receivable from subsidiaries 10,412 6,488(e) Accrued rental income 136 47Total 11,335 7,279
* The Company has repossessed land and building of ` 223 lakh on behalf of its subsidiary Tata Capital Financial Services Limited in settlement of its loan outstanding, the Company has created a payable for the same.
NOTES TO AND FORMING PART OF THE BALANCE SHEET AS AT MARCH 31, 2015
NOTE “19(a)” DEFERRED REVENUE EXPENDITURE (` in lakh)
Particulars As at March 31, 2015
As at March 31, 2014
(a) Unamortised share issue expenses Opening Balance 608 328 Add: expenses incurred during the year 299 566 Less: written off during the year 379 286 Closing Balance 528 608(b) Unamortised loan processing charges Opening Balance – 4 Add: expenses incurred during the year – – Less: written off during the year – 4 Closing Balance – –Total 528 608
(` in lakh)
ParticularsAs at March 31, 2015 As at March 31, 2014
Non-Current Current Non-Current Current(a) Unamortised share issue expenses 175 353 292 316Total 175 353 292 316Grand Total 528 608

178
Annual Report 2014-15
NOTES TO AND FORMING PART OF THE STATEMENT OF PROFIT AND LOSS For the year ended MARCH 31, 2015
NOTE “20” (` in lakh)
REVENUE FROM OPERATIONS For the year ended March 31, 2015
For the year ended March 31, 2014
(a) Dividend from Non-Current Investments * 12,901 7,682(b) Income from advisory services ** 5,132 5,400Total 18,033 13,082
* Includes dividend income from subsidiaries ` 11,934 lakh (Previous Year ` 6,715 lakh)** Includes income in foreign currency ` 2,857 lakh (Previous Year ` 2,953 lakh)
NOTE “21” (` in lakh)
OTHER INCOME For the year ended March 31, 2015
For the year ended March 31, 2014
(a) Income from managerial services 748 844(b) Interest on Non-Current Investments 343 338(c) Interest on others 4,065 1,532(d) Income from property management 1,162 921(e) Miscellaneous income 3 1Total 6,321 3,636
NOTE “22” (` in lakh)
FINANCE COSTS For the year ended March 31, 2015
For the year ended March 31, 2014
(a) Interest expense on share application money 33 121(b) Interest expense on inter corporate deposit 326 428(c) Discounting charges on commercial paper 3,730 1,047Total 4,089 1,596
NOTE “23” (` in lakh)
EMPLOYEE BENEFITS EXPENSE For the year ended March 31, 2015
For the year ended March 31, 2014
(a) Salaries, wages and bonus 2,918 2,869(b) Contribution to provident and other funds [Refer Note 28]
307 167
(c) Staff welfare expenses 42 46Total 3,267 3,082

179
NOTE “24” (` in lakh)
OTHER OPERATING EXPENSES For the year ended March 31, 2015
For the year ended March 31, 2014
(a) Advertisements and publicity 66 12(b) Directors fees 20 15(c) Incentive, commission and brokerage 2 2(d) Insurance 14 15(e) Legal and professional fees 830 877(f) Membership and subscription 57 113(g) Printing and stationery 22 15(h) Rent 104 236(i) Repairs to Buildings 141 69(j) Telephone, telex and leased line 31 44(k) Travelling and conveyance 439 330(l) Provision for rebate on advisory fees (525) 525(m) Contingent Provisions against Standard Assets 93 37(n) Provision for diminution in value of investments 1,297 –(o) Rebate on advisory fees 526 –(p) Repairs and Maintanance 10 9(q) Others 220 142Total 3,347 2,441
NOTE “24 (a)” (` in lakh)
AUDITOR’S REMUNERATION (excl. Service Tax) For the year ended March 31, 2015
For the year ended March 31, 2014
(a) Audit fees 13 13(b) Tax Audit fees 2 2(c) Other services 1 1
(Auditor’s Remuneration is included in Other expenses)
NOTE “24 (b)” (` in lakh)
EXPENDITURE IN FOREIGN CURRENCY For the year ended March 31, 2015
For the year ended March 31, 2014
(a) Membership and subscription 12 59(b) Legal and professional fees 3 10(c) Advertisements and publicity – 11(d) Travelling and conveyance 49 40(e) Training expenses – 10Total 64 130
NOTES TO AND FORMING PART OF THE STATEMENT OF PROFIT AND LOSS For the year ended MARCH 31, 2015

180
Annual Report 2014-15
NOTE “25” : PROVISIONS AND CONTINGENT LIABILITIES:
i. Movement in Contingent Provisions against Standard Assets during the year is as under:(` in lakh)
Particulars For the year ended March 31, 2015
For the year ended March 31, 2014
Opening Balance 59 22Additions during the year 93 37Utilised during the year – –Closing Balance 152 59
ii. Movement in Other Provisions during the year is as under:(` in lakh)
Particulars For the year ended March 31, 2015
For the year ended March 31, 2014
Opening Balance 398 –Additions during the year – 525Utilised during the year 398 127Closing Balance – 398
iii. Claims not acknowledged by the Company relating to cases contested by the Company and which are not likely to be devolved on the Company relating to the following areas :
(` in lakh)
Particulars As at March 31, 2015
As at March 31, 2014
Income Tax (Pending before Appellate authorities) 6,686 6,690VAT (Pending before Sales Tax Appellate Authorities) 182 167Total 6,868 6,857
NOTE “26” : COMMITMENTS :i. Commitment to invest in Tata Capital Special Situation Fund amounting to ` 194 lakh (as at March
31, 2014 : ` 2,401 lakh)ii. Commitment to invest in Tata Capital Healthcare Fund amounting to ` 5,074 lakh (as at March 31,
2014 : ` 5,543 lakh)iii. Commitment to invest in Tata Capital Growth Fund amounting to ` 8,191 lakh (as at March 31,
2014 : ` 11,795 lakh)iv. Commitment to invest in Tata Capital Innovation Fund amounting to ` 3,834 lakh (as at March 31,
2014 : ` 4,704 lakh)v. Commitment to co-invest with Omega TC Holdings Pte. Ltd ` 18,114 lakh (USD 29.02 Million) (as
at March 31, 2014 : ` 23,073 lakh (USD 38.61 Million)vi. Guarantees issued to National Housing Bank on behalf of Tata Capital Housing Finance Limited
` 120,000 lakh (As at March 31, 2014 ` 50,000 lakh) of which an amount of ` 104,235 lakh has been utilised by Tata Capital Housing Finance Limited to borrow from the National Housing Bank.
vii. The Company has undertaken to provide continued financial support to its Associate e-Nxt Financials Limited (Refer Note 39).
NOTES TO AND FORMING PART OF THE STATEMENT OF PROFIT AND LOSS For the year ended MARCH 31, 2015
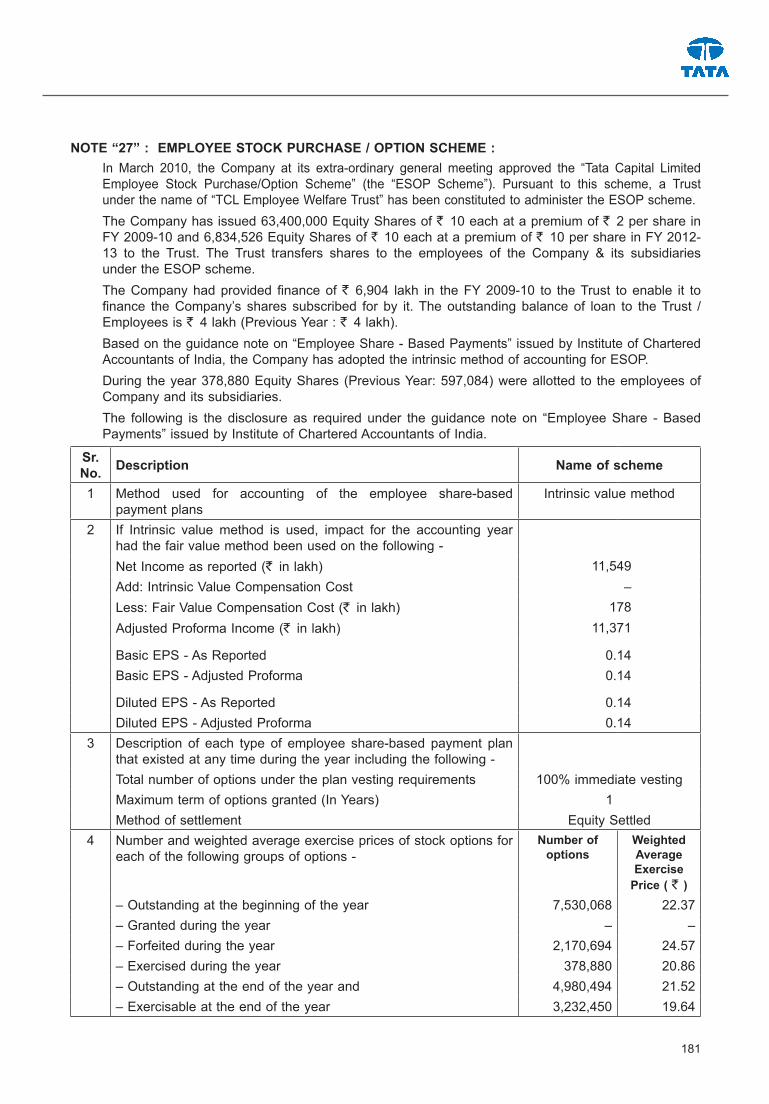
181
NOTE “27” : EMPLOYEE STOCK PURCHASE / OPTION SCHEME : In March 2010, the Company at its extra-ordinary general meeting approved the “Tata Capital Limited
Employee Stock Purchase/Option Scheme” (the “ESOP Scheme”). Pursuant to this scheme, a Trust under the name of “TCL Employee Welfare Trust” has been constituted to administer the ESOP scheme.
The Company has issued 63,400,000 Equity Shares of ` 10 each at a premium of ` 2 per share in FY 2009-10 and 6,834,526 Equity Shares of ` 10 each at a premium of ` 10 per share in FY 2012-13 to the Trust. The Trust transfers shares to the employees of the Company & its subsidiaries under the ESOP scheme.
The Company had provided finance of ` 6,904 lakh in the FY 2009-10 to the Trust to enable it to finance the Company’s shares subscribed for by it. The outstanding balance of loan to the Trust / Employees is ` 4 lakh (Previous Year : ` 4 lakh).
Based on the guidance note on “Employee Share - Based Payments” issued by Institute of Chartered Accountants of India, the Company has adopted the intrinsic method of accounting for ESOP.
During the year 378,880 Equity Shares (Previous Year: 597,084) were allotted to the employees of Company and its subsidiaries.
The following is the disclosure as required under the guidance note on “Employee Share - Based Payments” issued by Institute of Chartered Accountants of India.
Sr. No. Description Name of scheme
1 Method used for accounting of the employee share-based payment plans
Intrinsic value method
2 If Intrinsic value method is used, impact for the accounting year had the fair value method been used on the following -Net Income as reported (` in lakh) 11,549Add: Intrinsic Value Compensation Cost –Less: Fair Value Compensation Cost (` in lakh) 178Adjusted Proforma Income (` in lakh) 11,371
Basic EPS - As Reported 0.14Basic EPS - Adjusted Proforma 0.14
Diluted EPS - As Reported 0.14Diluted EPS - Adjusted Proforma 0.14
3 Description of each type of employee share-based payment plan that existed at any time during the year including the following -Total number of options under the plan vesting requirements 100% immediate vestingMaximum term of options granted (In Years) 1Method of settlement Equity Settled
4 Number and weighted average exercise prices of stock options for each of the following groups of options -
Number of options
Weighted Average Exercise
Price ( ` )– Outstanding at the beginning of the year 7,530,068 22.37– Granted during the year – –– Forfeited during the year 2,170,694 24.57– Exercised during the year 378,880 20.86– Outstanding at the end of the year and 4,980,494 21.52– Exercisable at the end of the year 3,232,450 19.64

182
Annual Report 2014-15
Sr. No. Description Name of scheme
5 Number of options vested –
6 Total number of shares arising as a result of exercise 378,880
7 Money realised by exercise of options ( ` ) 7,904,283
8 Employee wise details of options granted to -
– Senior management personnel –
– Employees holding 5% or more of the total number of warrants/options granted during the year
–
– Identified employees who were granted warrant/option, during any one year equal to or exceeding 1% of the issued capital (excluding outstanding warrants / options and conversions) of the Company at the time of grant.
–
9 For stock options exercised during the year the weighted average share price at the date of exercise. If options were exercised on a regular basis throughout the year, the weighted average share price during the year. ( ` )
` 26.65
10 For stock options outstanding at the end of the year, the range of exercise prices and weighted average remaining contractual life (vesting year + exercise year). If the range of the exercise prices is wide, the outstanding options should be divided into ranges that are meaningful for assessing the number and timing of additional shares that may be issued and cash that may be received upon exercise of those options.
Range of exercise Prices
( ` )
25.00
Weighted Average
Contractual Life (Years)
1.33
11 For stock options granted during the year, the weighted average fair value of those options at the grant date and information on how the fair value was measured including the following -
– Option pricing model used Black Scholes
– Inputs to that model including -
weighted average share price ( ` ) 25
exercise price ( ` ) 25
expected volatility 0.34%
option life (comprising vesting period + exercise period) 1.42 years
expected dividends 0.00%
risk-free interest rate 8.00%
Any other inputs to the model including the method used and the assumptions made to incorporate the effects of expected early exercise.
– Determination of expected volatility, including explanation to the extent expected volatility was based on historical volatility. NA
– Any other features of the option grant were incorporated into the measurement of the fair value, such as market conditions. NA
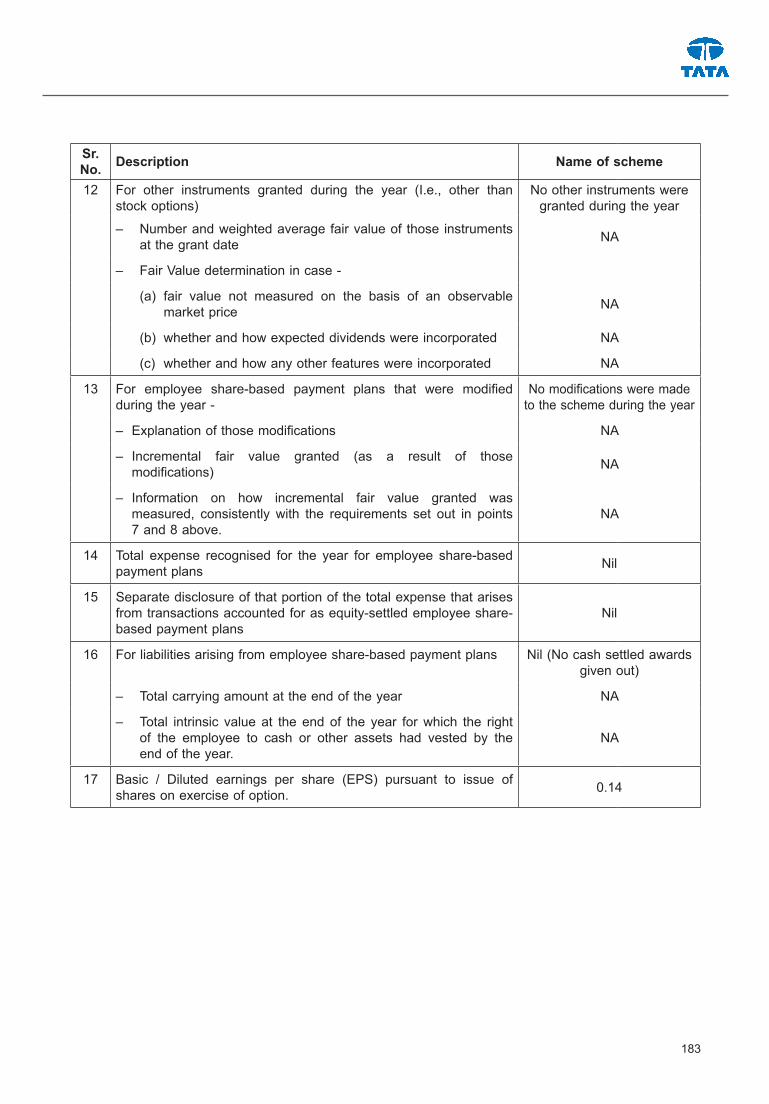
183
Sr. No. Description Name of scheme
12 For other instruments granted during the year (I.e., other than stock options)
No other instruments were granted during the year
– Number and weighted average fair value of those instruments at the grant date NA
– Fair Value determination in case -
(a) fair value not measured on the basis of an observable market price NA
(b) whether and how expected dividends were incorporated NA
(c) whether and how any other features were incorporated NA
13 For employee share-based payment plans that were modified during the year -
No modifications were made to the scheme during the year
– Explanation of those modifications NA
– Incremental fair value granted (as a result of those modifications) NA
– Information on how incremental fair value granted was measured, consistently with the requirements set out in points 7 and 8 above.
NA
14 Total expense recognised for the year for employee share-based payment plans Nil
15 Separate disclosure of that portion of the total expense that arises from transactions accounted for as equity-settled employee share-based payment plans
Nil
16 For liabilities arising from employee share-based payment plans Nil (No cash settled awards given out)
– Total carrying amount at the end of the year NA
– Total intrinsic value at the end of the year for which the right of the employee to cash or other assets had vested by the end of the year.
NA
17 Basic / Diluted earnings per share (EPS) pursuant to issue of shares on exercise of option. 0.14

184
Annual Report 2014-15
NOTE “28” : EMPLOYEE BENEFITS
DefinedContributionPlansThe Company makes Provident Fund and Superannuation Fund contributions to defined contribution retirement benefit plans for eligible employees. Under the schemes, the Company is required to contribute a specified percentage of the payroll costs to fund the benefits. The contributions as specified under the law are paid to the provident fund set up as a Trust by the Company. The Company is generally liable for annual contributions and any deficiency in interest cost compared to interest computed based on the rate of interest declared by the Central Government under the Employees’ Provident Fund Scheme, 1952 and recognises, if any, as an expense in the year it is determined.
The provident fund set up as a Trust by the Company manages the contributions from the Company and other participating subsidiaries. As of March 31, 2015, the accumulated members’ corpus of the Company is ` 2,155 lakh whereas the total fair value of the assets of the fund and the total accumulated members’ corpus is ` 12,871 lakh and ` 11,904 lakh respectively. In accordance with an actuarial valuation, there is no deficiency in the interest cost as the present value of the expected future earnings on the fund is greater than the expected amount to be credited to the individual members based on the expected guaranteed rate of interest of 8.75% for the first year and 8.60% thereafter. The actuarial assumptions include discount rate of 7.80%.
The Company recognised a charge of ` 117 lakh (Previous year ` 107 lakh) for provident fund and family pension fund contribution and ` 50 lakh (Previous year ` 51 lakh) for Superannuation contribution, in Statement the Profit and Loss.
DefinedBenefitsPlans
The Company offers its employees defined-benefit plans in the form of a gratuity scheme (a lump sum amount). Benefits under the defined benefit plans are typically based on years of service and the employee’s compensation (generally immediately before separation). The gratuity scheme covers all regular employees. Commitments are actuarially determined at the year-end. These commitments are valued at the present value of the expected future payments, with consideration for calculated future salary increases, using a discount rate corresponding to the interest rate estimated by the actuary having regard to the interest rate on government bonds with a remaining term that is almost equivalent to the average balance working period of employees. Actuarial valuation is done based on “Projected Unit Credit” method. Gains and losses of changed actuarial assumptions are charged to the Statement of Profit and Loss.
ReconciliationofBenefitObligationsandPlanAssets (` in lakh)
Particulars 2014-15 2013-14
ChangeinDefinedBenefitObligation
Opening Defined Benefit Obligation 288 256
Current Service Cost 44 34
Interest Cost 24 20
Acquisitions Cost / (Credit) 27 (2)
Actuarial Losses / (Gain) 120 (18)
Benefits Paid (57) (2)
Closing Defined Benefit Obligation 446 288

185
Particulars 2014-15 2013-14Change in the Fair Value of AssetsOpening Fair Value of Plan Assets 280 191Transfer in 8 (2)Expected Return on Plan Assets 26 18Contributions by Employer 78 64Actuarial Gains / (Losses) 22 11Benefits paid 0 (2)Closing Fair Value of Plan Assets 414 280Composition of the plan assetsInvestment PatternGovernment bonds 40.33% 39.64%Equity mutual funds 16.80% 9.46%Bonds / Debentures 34.51% 32.11%Others (including assets under Schemes of Insurance) 8.36% 18.79%Total 100.00% 100.00%Reconciliation of present value of the obligation and the Fair value of the plan assetsFair Value of plan assets at the end of the year 414 280Present value of the defined obligations at the end of the year 446 288Funded status [Surplus / (Deficit)] (32) (8)Net Asset / (Liability) recognised in the balance sheet (32) (8)
Net Gratuity cost for the year ended March 31, 2015Service Cost 44 34
Interest on Defined benefit Obligation 24 21
Expected return on plan assets (26) (18)
Net actuarial loss recognised in the year 98 (28)
Net Gratuity Cost as included in Employee Benefit Expenses [Refer Note 23 (b)]
140 9
AssumptionsDiscount Rate 7.80% 9.30%Expected Rate of Return on Plan Assets 8.00% p.a 8.00% p.a
Salary Escalation Rate 7.50% p.a for first5years
and 5% thereafter
7.50% p.a for first 5 years
and 5% thereafter
Mortality Rate Indian assured lives
Mortality (2006-08)(modified)Ult.
Indian assured lives
Mortality (2006-08) (modified) Ult.
Withdrawal Rate 0-2 years 10% 3-4 years 5%
5-9 years 2.5% 10 years & more 1%
0-2 years 10% 3-4 years 5%
5-9 years 2.5% 10 years & more 1%
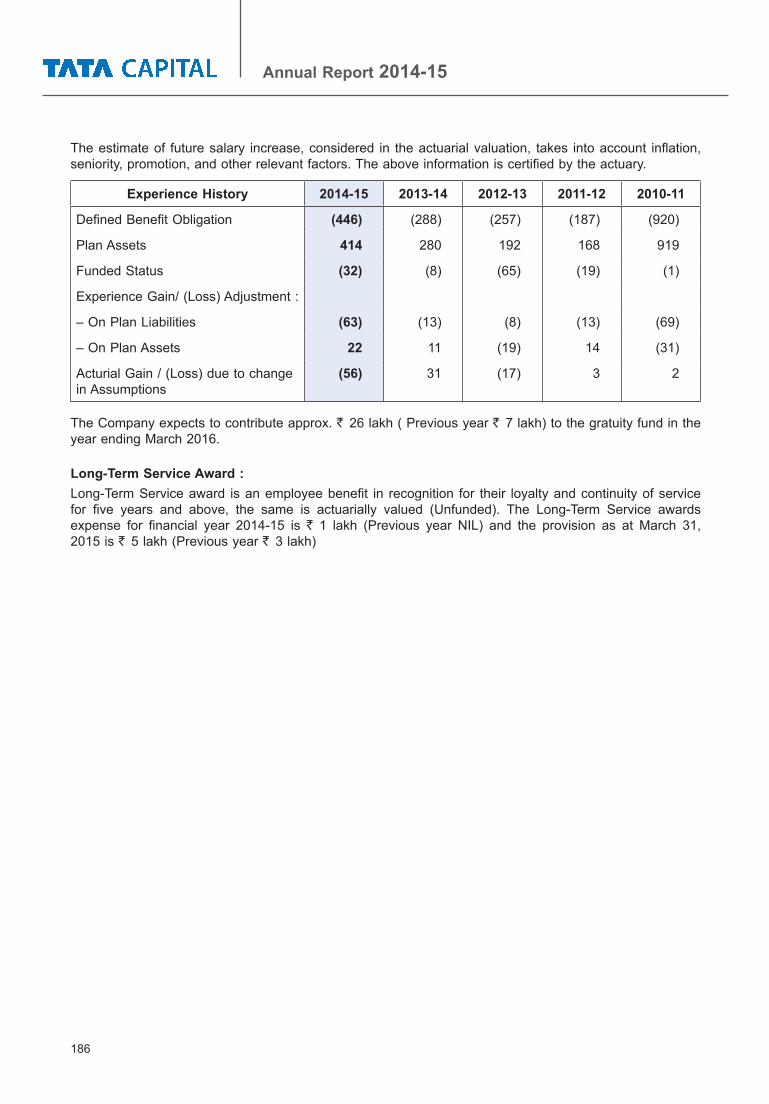
186
Annual Report 2014-15
The estimate of future salary increase, considered in the actuarial valuation, takes into account inflation, seniority, promotion, and other relevant factors. The above information is certified by the actuary.
Experience History 2014-15 2013-14 2012-13 2011-12 2010-11
Defined Benefit Obligation (446) (288) (257) (187) (920)
Plan Assets 414 280 192 168 919
Funded Status (32) (8) (65) (19) (1)
Experience Gain/ (Loss) Adjustment :
– On Plan Liabilities (63) (13) (8) (13) (69)
– On Plan Assets 22 11 (19) 14 (31)
Acturial Gain / (Loss) due to change in Assumptions
(56) 31 (17) 3 2
The Company expects to contribute approx. ` 26 lakh ( Previous year ` 7 lakh) to the gratuity fund in the year ending March 2016.
Long-Term Service Award :Long-Term Service award is an employee benefit in recognition for their loyalty and continuity of service for five years and above, the same is actuarially valued (Unfunded). The Long-Term Service awards expense for financial year 2014-15 is ` 1 lakh (Previous year NIL) and the provision as at March 31, 2015 is ` 5 lakh (Previous year ` 3 lakh)
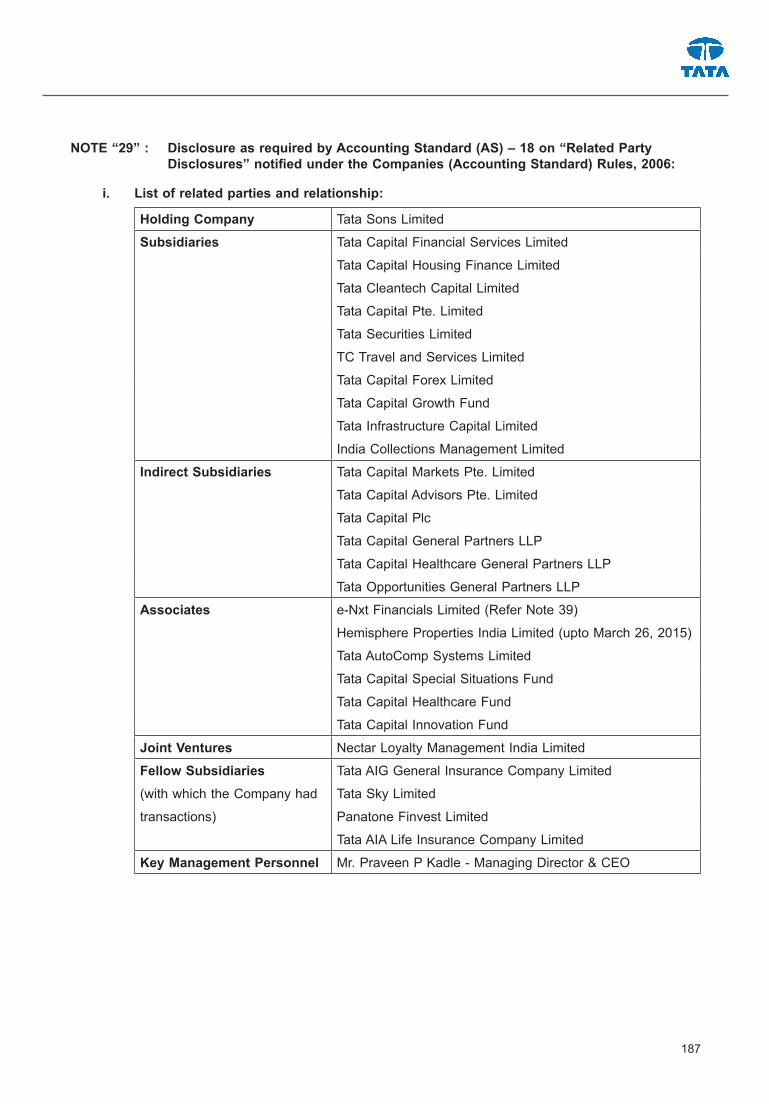
187
NOTE “29” : Disclosure as required by Accounting Standard (AS) – 18 on “Related Party Disclosures”notifiedundertheCompanies(AccountingStandard)Rules,2006:
i. List of related parties and relationship:
Holding Company Tata Sons Limited
Subsidiaries Tata Capital Financial Services Limited
Tata Capital Housing Finance Limited
Tata Cleantech Capital Limited
Tata Capital Pte. Limited
Tata Securities Limited
TC Travel and Services Limited
Tata Capital Forex Limited
Tata Capital Growth Fund
Tata Infrastructure Capital Limited
India Collections Management Limited
Indirect Subsidiaries Tata Capital Markets Pte. Limited
Tata Capital Advisors Pte. Limited
Tata Capital Plc
Tata Capital General Partners LLP
Tata Capital Healthcare General Partners LLP
Tata Opportunities General Partners LLP
Associates e-Nxt Financials Limited (Refer Note 39)
Hemisphere Properties India Limited (upto March 26, 2015)
Tata AutoComp Systems Limited
Tata Capital Special Situations Fund
Tata Capital Healthcare Fund
Tata Capital Innovation Fund
Joint Ventures Nectar Loyalty Management India Limited
Fellow Subsidiaries Tata AIG General Insurance Company Limited
(with which the Company had Tata Sky Limited
transactions) Panatone Finvest Limited
Tata AIA Life Insurance Company Limited
Key Management Personnel Mr. Praveen P Kadle - Managing Director & CEO

188
Annual Report 2014-15
ii. Transactions with related parties : (` in lakh)
Sr. No. Party Name Nature of transaction 2014-15 2013-14
1 Tata Sons Ltd a) Expenditure - Brand Equity Contribution 28 28b) Security Deposit received 1 –c) Balance Receivable 13 18
2 Tata Capital a) Investments in Tier II Bonds 20,000 –Financial b) ICDs placed during the year 253,819 154,972Services Limited c) ICDs repaid back during the year 264,309 142,082
d) Security Deposit outstanding - Payable 4,665 4,665e) Security Deposit outstanding - Receivable 3 –f) Dividend received during the year 6,488 3,893g) Interest Income on - ICDs 3,042 1,202 - Debentures 5 –h) Rental Income 741 748i) Marketing & Managerial Service Fees
Income582 657
j) Expenditure - SLA fees expense 42 37 - Rent expense 11 11 - Guest house charges 6 10k) Reimbursement of Expenses - Insurance Expenses 92 5 - Marketing & Managerial Service 411 417l) Payment towards Arranger Fees 27 378m) ICDs Outstanding - Receivable 2,600 13,090n) Dividend receivable 7,785 6,488o) Balance Receivable 227 149
3 Tata Capital Housing Finance Limited
a) Investments in Preference shares made during the year
16,000 14,900
b) ICDs placed during the year 99,320 57,605c) ICDs repaid back during the year 99,320 61,655d) Security Deposit outstanding - Receivable 1 –e) Interest Income on - ICDs 230 102 - Debentures 338 338f) Marketing & Managerial Service Fees
Income166 188
g) Dividend received during the year 1,521 227h) Reimbursement of Expenses - Insurance Expenses 30 1 - Marketing & Managerial Service 128 130i) Dividend receivable 2,627 –j) Balance Receivable 32 27

189
Sr. No. Party Name Nature of transaction 2014-15 2013-14
4 Tata Securities Limited
a) Investments in Preference Shares made during the year
– 1,500
b) ICDs placed during the year 400 8,970c) ICDs repaid back during the year 800 8,320d) Income - Interest income on ICDs placed 41 53 - Rental Income 105 126e) Reimbursement of Expenses - Electricity 9 8 - Insurance 2 0f) Payment towards Arranger Fees 41 97g) ICDs Outstanding Receivable 400 800h) Balance Receivable 220 220
5 TC Travel and a) ICDs placed during the year 1,675 1,655Services Limited b) ICDs repaid back during the year 2,680 200
c) Interest income on ICDs placed 126 23d) Expenditure - Service provides charges 215 195e) ICDs Outstanding Receivable 650 1,655f) Balance Receivable 24 19
6 Tata Capital Forex a) ICDs placed during the year 3,500 –Limited b) ICDs repaid back during the year 1,200 900
c) Interest income on ICDs placed 70 30d) Expenditure - Service provides charges 74 61e) ICDs Outstanding Receivable 2,300 –f) Balance Receivable – 2
7 Tata Capital Pte. Limited
a) Balance Payable 5 5
8 Tata Capital a) Income – Advisory Fees 2,857 2,953Advisors Pte Ltd b) Balance Receivable 129 470
9 Tata Capital Plc a) Balance Receivable – 310 Tata Capital
Healthcare Funda) Investment in Units of Fund made during
the year469 2,110
b) Income – Asset Management Fees 635 635c) Balance Receivable 124 124
11 Tata Capital Growth Fund
a) Investment in Units of Fund made during the year
3,604 548
b) Income - Asset Management Fees 628 678c) Balance Payable 56 –
12 Tata Capital Innovation Fund
a) Investment in Units of Fund made during the year
870 725
b) Income - Asset Management Fees 573 573c) Advance Income received 188 188

190
Annual Report 2014-15
Sr. No. Party Name Nature of transaction 2014-15 2013-14
13 Tata Capital Special Situations Fund
a) Investment in Units of Fund made during the year
2,207 2,593
b) Income - Asset Management Fees 440 561
c) Rebate of Asset Management Fees 526 –
d) Advance Income received 377 –
e) Balance Receivable – 167
14 Tata Cleantech Capital Limited
a) Investment in Equity Shares made during the year
18,515 6,190
b) ICDs placed during the year 57,245 7,216
c) ICDs repaid back during the year 30,568 2,333
d) Interest income on ICDs placed 542 121
e) Reimbursement of Expenses
- Insurance Expenses 1 –
f) ICDs Outstanding Receivable 31,560 4,883
15 e-Nxt Financials a) ICDs placed during the year 1,050 –Limited b) ICDs repaid back during the year 1,050 –
c) Interest income on ICDs placed 15 –d) Rental Income 227 –e) Expenditure - Service providers’ charges 6 9 - Audit Fees 12 –f) Reimbursement of expenses - Electricity Expenses 136 –g) Balance Receivable – 64
16 Tata AIG General Insurance Company Limited
a) Expenditure - Insurance Premium 7 11
17 Tata Auto Comp Systems Limited a) Dividend received during the year 966 966
18 Tata Sky Limited a) Investment in Equity Shares made during the year
3,105 2,137
19 Tata AIA Life Insurance Company Limited
a) Expenditure - Insurance Premium 11 –b) Insurance claim received 5 –
20 Panatone Finvest Limited a) Sale of Investments 1 –
21 Key Management Personnel (KMP)
a) Remuneration to KMP 415 382b) Issue of Cumulative Redeemable
Preference Shares100 –
(c) Payment of Dividend on Cumulative Redeemable Preference Shares
8 8

191
NOTE “30” : EARNINGS PER SHARE (EPS)
Particulars 2014-15 2013-14
Profit after tax ` in lakh 11,548 7,756
Less: Preference dividend payable to cumulative redeemable preference shareholders
` in lakh 7,676 5,783
Profit after tax available for equity shareholders ` in lakh 3,872 1,973
Weighted average number of Equity shares used in computing Basic EPS
Nos 2,825,982,123 2,825,972,336
Face value of equity shares ` 10 10
Basic EPS ` 0.14 0.07
Profit after tax available for equity shareholders ` in Lakh 3,872 1,973
Weighted Average Number of Equity Shares used in computing Basic EPS
Nos 2,825,982,123 2,825,972,336
Add: Potential weighted average number of Equity shares
Nos 36,047 45,834
Weighted average number of shares in computing Diluted EPS
Nos 2,826,018,170 2,826,018,170
Face value of equity shares ` 10 10
Diluted EPS ` 0.14 0.07
Shares under the ESOP Schemes are issued at intrinsic value. [Refer Note 2(xi)(f)]

192
Annual Report 2014-15
NOTE “31” : SEGMENT REPORTING In accordance with Accounting Standard 17 on Segment Reporting, Company has identified
three business segments i.e. Investment Activity, Advisory services and Others (includes property management and managerial services) and one Geographical Segment viz. India, as secondary segment.
(` in lakh)
Particulars For the year ended March 31, 2015
For the year ended March 31, 2014
I Segment Revenue
(a) Investment Activity 17,309 9,552
(b) Advisory services 5,132 5,400
(c) Others 1,911 1,765
(d) Unallocated 2 1
Total Income 24,354 16,718
II Segment Results
(a) Investment Activity 14,943 9,262
(b) Advisory services (1,897) (530)
(c) Others 380 307
(d) Unallocated (923) (389)
Profitbeforetaxation 12,503 8,650
Less : Provision for taxation 954 894
Profitaftertaxation 11,549 7,756
Particulars As at March 31, 2015
As at March 31, 2014
III Segment Assets
(a) Investment Activity 481,872 404,410
(b) Advisory services 33,304 26,717
(c) Others 11,729 12,083
(d) Unallocated 16,110 4,578
Total 543,015 447,788

193
(` in lakh)
Particulars As at March 31, 2015
As at March 31, 2014
IV Segment Liabilities
(a) Investment Activity 58,284 1,293
(b) Advisory services 34,089 26,904
(c) Others 4,665 4,665
(d) Unallocated 19,574 17,817
Total 116,613 50,679
V Capital Expenditure (including Capital Work-in-Progress)
(a) Investment Activity – –
(b) Advisory services – –
(c) Others – 2,539
(d) Unallocated 192 37
Total 192 2,576
Particulars For the year ended March 31, 2015
For the year ended March 31, 2014
VI Depreciation and Amortisation
(a) Investment Activity – –
(b) Advisory services 39 38
(c) Others 643 536
(d) Unallocated 466 375
Total 1,148 949
VII SignificantNon-CashExpensesOtherthan Depreciation and Amortisation
(a) Investment Activity 1,390 37
(b) Advisory services – 525
(c) Others – –
(d) Unallocated 211 25
Total 1,601 587

194
Annual Report 2014-15
NOTE “32” : Details of the Company’s interest in its Joint Venture, having Joint Control, as per the requirement of Accounting Standard (AS) - 27 on “Financial Reporting of Interests in Joint Venture”
(` in lakh)
Sr. No. Particulars Nectar Loyalty Management India Ltd (Incorporated and Registered in India)
For the year ended March 31, 2015
[Refer Footnote 1]
For the year ended March 31, 2014
% Shares Held 49% 49%
(a) Assets 201 201
(b) Liabilities 605 605
(c) Income – –
(d) Expenses 521 521
(e) Other Matters – Contingent Liability – –
Footnotes:1) As per the latest available audited financial statements as at and For the year ended March 31,
2014.
2) Nectar Loyalty Management India Limited (“Nectar”) is a joint venture with AIMIA (formerly known as Groupe Aeroplan Inc.), the Canadian Loyalty Management giant, to launch a multi-party coalition loyalty program in India modeled on the lines of Nectar, which is Group Aeroplan’s highly acclaimed coalition loyalty program in the UK and Italy. Tata Capital holds 49% in the joint venture. The Company has fully provided for its investment in debentures and equity shares in the joint venture during the financial year since the operations of Nectar are held in abeyance during the year.
NOTE “33” : Core Investment Company (“CIC”) Compliance Ratios
Sr. No. Particulars As at March 31, 2015
As at March 31, 2014
(a) Investments & loans to group companies as a proportion of Net Assets (%)
91% 90%
(b) Investments in equity shares and compulsorily convertible instruments of group companies as a proportion of Net Assets (%)
77% 83%
(c) Capital Adequacy Ratio (%) [ Adjusted Net worth / Risk Weighted Assets ]
52% 73%
(d) Leverage Ratio (Times) [ Outside liabilities / Adjusted Networth ]
0.68 0.16
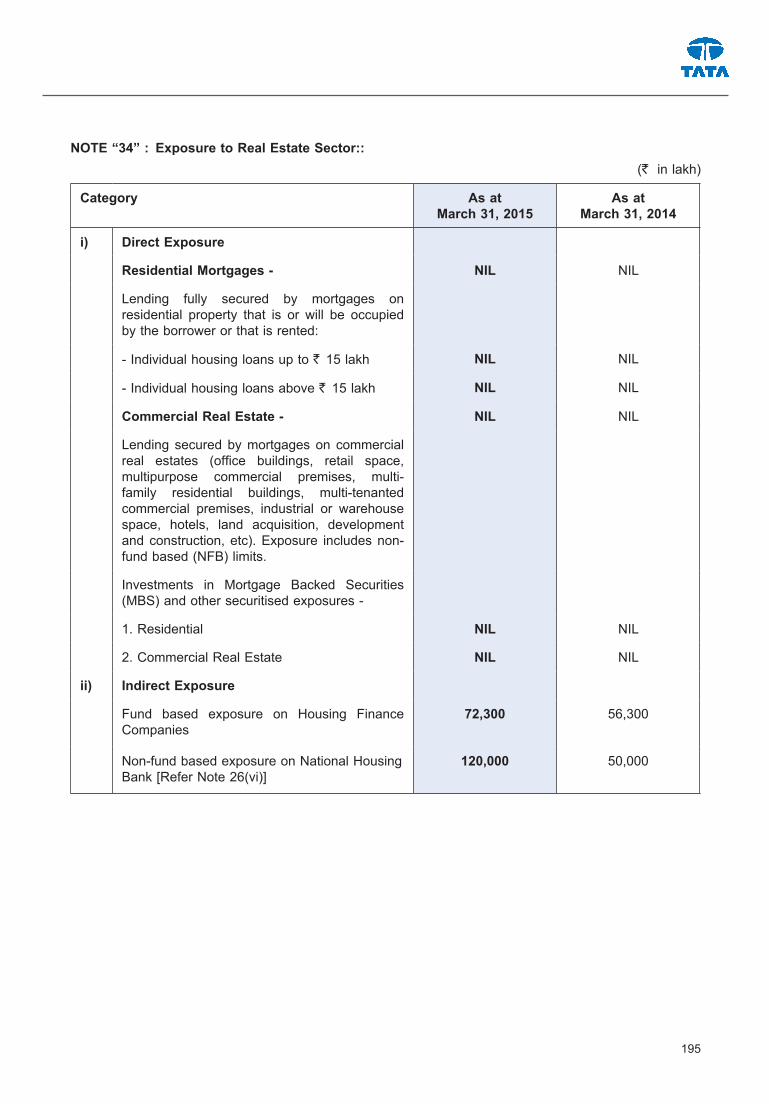
195
NOTE “34” : Exposure to Real Estate Sector::(` in lakh)
Category As at March 31, 2015
As at March 31, 2014
i) Direct Exposure
Residential Mortgages - NIL NIL
Lending fully secured by mortgages on residential property that is or will be occupied by the borrower or that is rented:
- Individual housing loans up to ` 15 lakh NIL NIL
- Individual housing loans above ` 15 lakh NIL NIL
Commercial Real Estate - NIL NIL
Lending secured by mortgages on commercial real estates (office buildings, retail space, multipurpose commercial premises, multi-family residential buildings, multi-tenanted commercial premises, industrial or warehouse space, hotels, land acquisition, development and construction, etc). Exposure includes non-fund based (NFB) limits.
Investments in Mortgage Backed Securities (MBS) and other securitised exposures -
1. Residential NIL NIL
2. Commercial Real Estate NIL NIL
ii) Indirect Exposure
Fund based exposure on Housing Finance Companies
72,300 56,300
Non-fund based exposure on National Housing Bank [Refer Note 26(vi)]
120,000 50,000

196
Annual Report 2014-15
NOTE “35” : Asset Liability Management
Maturity pattern of certain items of Assets and Liabilities (Based on RBI Guidelines)
For the year 2014-15 (` in lakh)
Particulars Liabilities Assets
Borrowings from Banks
Market Borrowings Advances Investments
1 day to 30/31 days (One month) – 19,881 3,000 –
Over 1 month to 2 months – 24,675 – –
Over 2 months to 3 months – 28,492 – –
Over 3 months to 6 months – 12,055 5,410 –
Over 6 months to 1 year – 6,013 29,100 –
Over 1 year to 3 years – – – –
Over 3 years to 5 years – – – 1,500
Over 5 years – – – 465,226
Total – 91,116 37,510 466,726
For the year 2013-14 (` in lakh)
Particulars Liabilities Assets
Borrowings from Banks
Market Borrowings
Advances Investments
1 day to 30/31 days (One month) – – 13,090 –
Over one month to 2 months – 11,887 – –
Over 2 months to 3 months – 9,793 – –
Over 3 months to 6 months – 4,500 – –
Over 6 months to 1 year – 460 7,338 –
Over 1 year to 3 years – – – –
Over 3 years to 5 years – – – 1,500
Over 5 years – – – 401,626
Total – 26,640 20,428 403,126
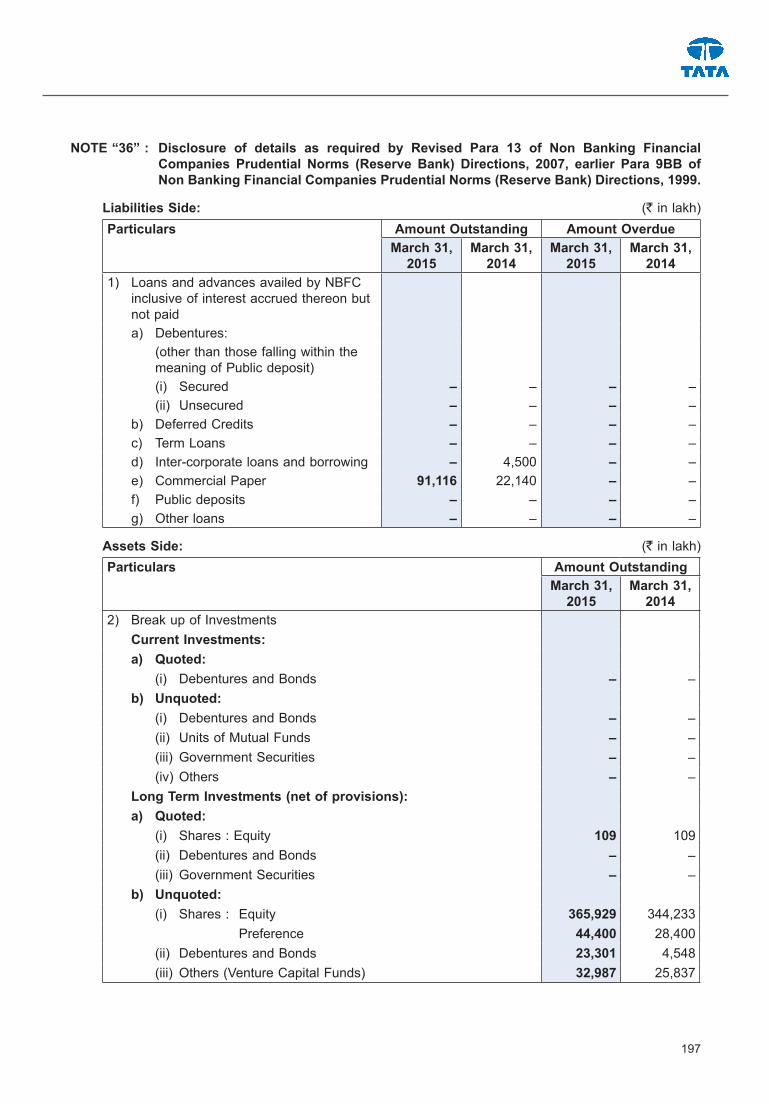
197
NOTE “36” : Disclosure of details as required by Revised Para 13 of Non Banking Financial Companies Prudential Norms (Reserve Bank) Directions, 2007, earlier Para 9BB of Non Banking Financial Companies Prudential Norms (Reserve Bank) Directions, 1999.
Liabilities Side: (` in lakh)Particulars Amount Outstanding Amount Overdue
March 31, 2015
March 31, 2014
March 31, 2015
March 31, 2014
1) Loans and advances availed by NBFC inclusive of interest accrued thereon but not paida) Debentures: (other than those falling within the
meaning of Public deposit)(i) Secured – – – –(ii) Unsecured – – – –
b) Deferred Credits – – – – c) Term Loans – – – – d) Inter-corporate loans and borrowing – 4,500 – – e) Commercial Paper 91,116 22,140 – – f) Public deposits – – – – g) Other loans – – – –
Assets Side: (` in lakh)Particulars Amount Outstanding
March 31, 2015
March 31, 2014
2) Break up of Investments Current Investments: a) Quoted: (i) Debentures and Bonds – – b) Unquoted: (i) Debentures and Bonds – – (ii) Units of Mutual Funds – – (iii) Government Securities – – (iv) Others – – Long Term Investments (net of provisions): a) Quoted: (i) Shares : Equity 109 109 (ii) Debentures and Bonds – – (iii) Government Securities – – b) Unquoted: (i) Shares : Equity 365,929 344,233 Preference 44,400 28,400 (ii) Debentures and Bonds 23,301 4,548 (iii) Others (Venture Capital Funds) 32,987 25,837

198
Annual Report 2014-15
3) Investor group-wise classification of all investments (current and long-term) in shares and securities (both quoted and unquoted)
(` in lakh)
Particulars Market Value/Break up or fair value or NAV
Book Value (Net of Provisions)
2014-15 2013-14 2014-15 2013-14
a) Related Parties
1) Subsidiaries 422,266 364,021 422,266 364,021
2) Companies in the same group 21,050 21,050 21,050 21,050
3) Other related Parties 23,301 17,947 23,301 17,946
b) Other than related parties 65 66 109 109
TOTAL 466,682 403,084 466,726 403,126
Notes:a) Market Value/Break up Value or Fair Value or NAV is taken as same as book value in case of unquoted
shares in absence of market value/break up value or fair value or NAV.
37 During the year the Company has reassessed depreciation rate on tangible fixed assets as per the useful life specified in the Companies Act, 2013 as on September 30, 2014. Based on current estimates, depreciation of ` 64 lakh on account of assets whose useful life is already exhausted as on April 01, 2014 have been adjusted against the opening surplus in the Statement of Profit and Loss. As a result of the change, the charge on account of the depreciation for the year ended March 31, 2015 is higher by ` 23 lakh compared to the charge based on useful lives estimated in earlier period.
38 As at March 31, 2015, the Company has received an amount of ` 5,000 lakh towards share application money for issue of preference shares of the Company. The share application money was received pursuant to an invitation to offer shares and in terms of such invitation, the Company is required to complete the allotment formalities by April 28, 2015. The Company has sufficient authorised capital to cover the allotment of these shares. As of March 31, 2015, pending allotment of shares, the amount is maintained in a designated bank account and is not available for use by the Company. Subsequently, the Company has allotted the shares on April 22, 2015. As at March 31, 2014, the Company had received an amount of ` 604 lakh towards share application money for issue of preference shares of the Company which was subsequently allotted on April 01, 2014.
39 Pursuant to a Scheme of Arrangement (the “Scheme”) filed with the Honourable High Court of Judicature at Hyderabad and the Honourable High Court of Judicature at Bombay, it is proposed to amalgamate e-Nxt Financials Limited with Tata Business Support Services Limited at the proposed Appointment Date of April 01, 2014. The Scheme has been approved by the Honourable High Court of Hyderabad, post the Balance Sheet date, but is under the consideration of the Honourable High Court of Judicature at Bombay. Post the approval of the Scheme by the Honourable High Court of Judicature at Bombay, e-Nxt Financials Limited shall cease to be an associate of the Company with effect from the Appointment Date i.e. April 01, 2014.
40 Previous year’s figures have been regrouped / reclassified wherever necessary to correspond with the current year’s classification / disclosure.
For and on behalf of the Board of Directors
Ishaat Hussain Janki Ballabh Nalin M. Shah F.N. Subedar Nirmalya Kumar (Director) (Director) (Director) (Director) (Director)
Ritu Anand Praveen P. Kadle Puneet Sharma Avan Doomasia (Director) (Managing Director & CEO) (Chief Financial Officer) (Company Secretary)
Mumbai Date: May 08, 2015

Talk to [email protected]
MumbaiTata Capital LimitedOne Forbes, Dr V B Gandhi Marg Fort, Mumbai - 400 001.
SingaporeTata Capital Pte. Limited8 Shenton Way, #19–01 AXA TowerSingapore – 068 811.
LondonTata Capital PLC30 Millbank, LondonSW1P 4WY UK.

Registered O�ce Address:One Forbes, Dr. V.B. Gandhi Marg, Fort, Mumbai 400001, IndiaTelephone No. +91 22 67459000, Facsimile +91 22 6610 6701.