Annual Report Shams 2012 - SHAMS TEXTILE MILLS LIMITED Report 2012.pdf · ANNUAL REPORT 2012...
47
ANNUAL REPORT 2012
Transcript of Annual Report Shams 2012 - SHAMS TEXTILE MILLS LIMITED Report 2012.pdf · ANNUAL REPORT 2012...
ANNUAL REPORT 2012
A N N U A L R E P O R T 2 0 1 2
CONTENTS
Pages
1. Company Information 2
2. Profile 3
3. Mission / Vision Statement 4
4. Statement of Compliance withCode of Corporate Governance 5-6
5. Directors’ Report 7-9
6. Financial Summary 10
7. Notice of Annual General Meeting 11
8. Auditors’ Review Report on statement of Compliance 12
9. Auditors’ Report to the Members 13
10. Balance Sheet 14-15
11. Profit and Loss Account 16
12. Statement of Comprehensive Income 17
13. Cash Flow Statement 18
14. Statement of Changes in Equity 19
15. Notes to the Accounts 20-42
16. Pattern of Share Holding 43
17. Information required as per Code of Corporate Governance 44
18. Form of Proxy 45
A N N U A L R E P O R T 2 0 1 2
Board of DirectorsAdil BashirAmjad MahmoodAsif BashirKhalid Bashir (Chief Executive)Muhammad Anwar (Chairman)Muhammad Asif (Nominee:NIT)Nadeem Maqbool
Chief Financial OfficerFarooq Ahmad
Audit CommitteeMuhammad Anwar (Chairman)Asif Bashir (Member)Adil Bashir (Member)Khaleeque Ahmad (Secretary)
Human Resource & Remuneration CommitteeAmjad Mahmood (Chairman)Khalid Bashir (Member)Adil Bashir (Member)
AuditorsRiaz Ahmad & Company Chartered Accountants
BankersAllied Bank LimitedHabib Bank LimitedMCB Bank LimitedNational Bank of PakistanThe Bank of PunjabKASB Bank Limited
Registered Office7-B-III, Aziz Avenue, Gulberg-V, Lahore
Ph: +92-423-576 0379, 576 0382Fax: +92-423-576 0376Email: [email protected] Web: www.shams.com.pk
Project LocationsKotla Kahloon, District Nankana Sahib, Punjab3-KM, Faisalabad Road, Chiniot, Punjab
COMPANY INFORMATION
02
A N N U A L R E P O R T 2 0 1 203
Shams Textile Mills Limited is a public limited company incorporated on January 10, 1968. The company is primarily engaged in the manufacturing and trading of high quality Yarn.
The Company initially setup up its composite project consisting of spinning, weaving, dyeing and finishing at Chiniot in 1968. The plant today comprises of 24,960 spindles having capacity of producing 400,000 Kg/month (approx.) of yarn. During the initial years of operations the management successfully marketed the cotton yarn, grey and finished fabrics produced from these facilities, generating substantial export business. These operations resulted in the manufacturing of premium quality products leading to higher profitability for the company.
The company successfully built enough reserves over time inducing the management to think about the expansion of its existing facilities. The Management therefore decided to increase its spindle age capacity to 46,320 by installing another spinning unit at Sheikhupura Road near Shahkot. The facility started its commercial production in August 01, 1994 and ever since has contributed positively to the results of the company.
Our 21,360 spindle-spinning unit located at Shahkot has the capacity of producing 425,000 Kg (approx.) of the finest Knitting and weaving yarns monthly. Our strength is our commitment to customer satisfaction. Every product passes stringent quality control tests conducted on highly sophisticated machinery before it is dispatched to a customer.
The Company has grown steadily and has distinction of being associated with several prestigious local and foreign firms. The modern yet conservative policies of the company helped in attracting investment in the form of equity participation and loans. The weaving, dyeing and finishing facilities have been shut down with the passage of time due to lower profitability and the management's decision to primarily focus on the spinning business which has always been the company's strength.
The specialized yarn based new spinning unit of 12,096 spindles has been added to existing facilities of the Company at Shahkot to cater the demand of coarse count Slub, Multi and Lycra yarns. The plant started its commercial production in January 2006.
Shams Textile Mills Limited is managed by people who have had vast experiences in the textile sector. The management is constantly looking to avail opportunities in the field of textiles and to grow on its strengths. It has a low cost and growth driven approach to its businesses and is looking to grow further on the same policies.
PROFILE
A N N U A L R E P O R T 2 0 1 204
Our Business
We are a manufacturing organization operating integrated spinning and weaving facilities in textile industry and our end products are sold to international and national customers.
Vision of Future Business
We are committed to becoming the premier manufacturing organization in the textile industry maintaining market leadership in the present business and diversifying into value added projects with the object of maximizing returns for all the stakeholders.
Our Strengths
We have made pioneering efforts in development of new products, which has enabled us to emerge as a market leader. This together with an innovative and professional management style has helped us to build a strong and financially sound base.
Our Strategy
We are determined to convert our vision into reality by using innovation to create a market niche for our products and by investing in facilities, people, systems and new technology, diversification into value addition and improvements in productivity and service to customers.
We shall aggressively exploit new markets by drawing strength from our corporate image and by promoting a culture that encourages initiatives at all levels of decision-making.
Our Values
§ We take pride in adhering to ethical business practices and in being a good corporate citizen.
§ We respect our people and endeavor to provide them opportunities to realize their full potential.
§ We recognize our responsibility to our stakeholders and society.
MISSION / VISION STATEMENT
A N N U A L R E P O R T 2 0 1 205
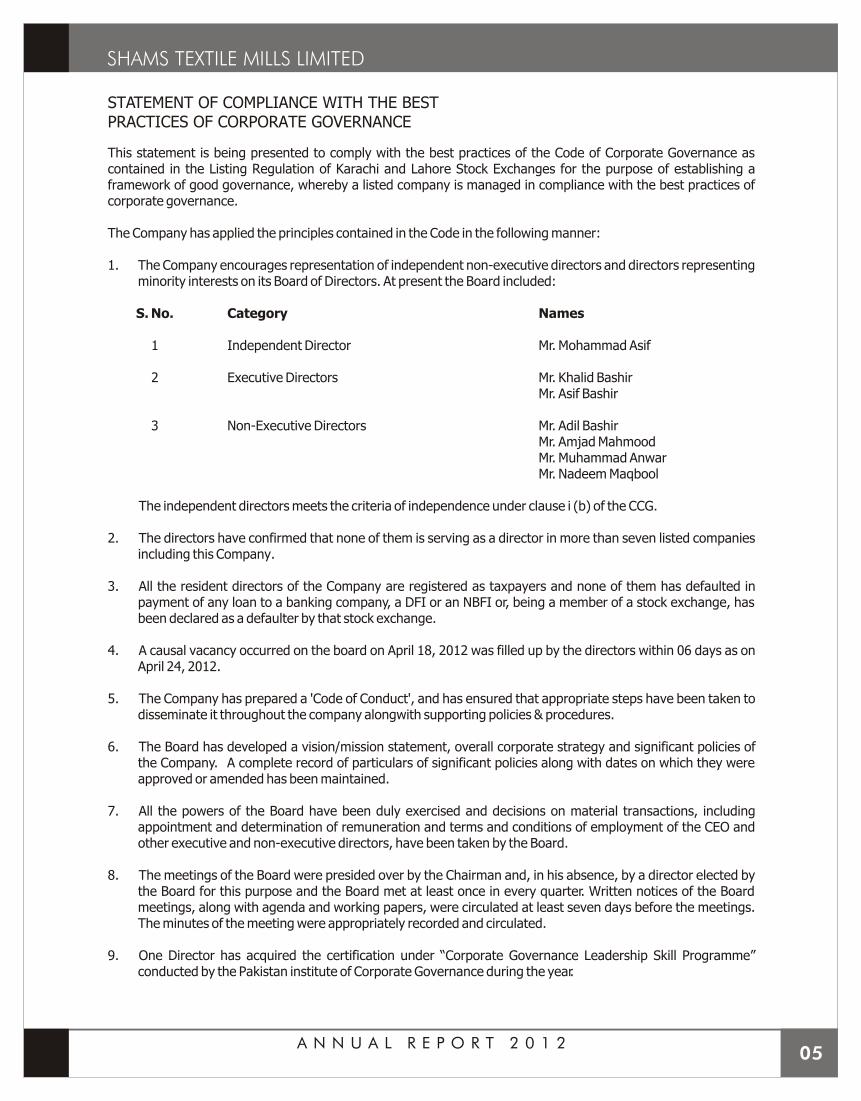
This statement is being presented to comply with the best practices of the Code of Corporate Governance as contained in the Listing Regulation of Karachi and Lahore Stock Exchanges for the purpose of establishing a framework of good governance, whereby a listed company is managed in compliance with the best practices of corporate governance.
The Company has applied the principles contained in the Code in the following manner:
1. The Company encourages representation of independent non-executive directors and directors representing minority interests on its Board of Directors. At present the Board included:
S. No. Category Names
1 Independent Director Mr. Mohammad Asif
2 Executive Directors Mr. Khalid BashirMr. Asif Bashir
3 Non-Executive Directors Mr. Adil BashirMr. Amjad MahmoodMr. Muhammad AnwarMr. Nadeem Maqbool
The independent directors meets the criteria of independence under clause i (b) of the CCG.
2. The directors have confirmed that none of them is serving as a director in more than seven listed companies including this Company.
3. All the resident directors of the Company are registered as taxpayers and none of them has defaulted in payment of any loan to a banking company, a DFI or an NBFI or, being a member of a stock exchange, has been declared as a defaulter by that stock exchange.
4. A causal vacancy occurred on the board on April 18, 2012 was filled up by the directors within 06 days as on April 24, 2012.
5. The Company has prepared a 'Code of Conduct', and has ensured that appropriate steps have been taken to disseminate it throughout the company alongwith supporting policies & procedures.
6. The Board has developed a vision/mission statement, overall corporate strategy and significant policies of the Company. A complete record of particulars of significant policies along with dates on which they were approved or amended has been maintained.
7. All the powers of the Board have been duly exercised and decisions on material transactions, including appointment and determination of remuneration and terms and conditions of employment of the CEO and other executive and non-executive directors, have been taken by the Board.
8. The meetings of the Board were presided over by the Chairman and, in his absence, by a director elected by the Board for this purpose and the Board met at least once in every quarter. Written notices of the Board meetings, along with agenda and working papers, were circulated at least seven days before the meetings. The minutes of the meeting were appropriately recorded and circulated.
9. One Director has acquired the certification under “Corporate Governance Leadership Skill Programme” conducted by the Pakistan institute of Corporate Governance during the year.
STATEMENT OF COMPLIANCE WITH THE BESTPRACTICES OF CORPORATE GOVERNANCE
A N N U A L R E P O R T 2 0 1 206
10. The Board has approved appointment of CFO, Company Secretary and Head of Internal Audit, including their remuneration and terms and conditions of employment.
11. The Directors' report for this year has been prepared in compliance with the requirements of the Code and fully describes the salient matters required to be disclosed.
12. The financial statements of the Company were duly endorsed by CEO and CFO before approval of the Board.
13. The Directors, CEO and executives do not hold any interest in the shares of the Company other than that disclosed in the pattern of shareholding.
14. The Company has complied with all the corporate and financial reporting requirements of the CCG.
15. The Board has formed an audit committee. It comprises of 3 (three) members, two of them are non executive Directors including the Chairman of the Committee.
16. The meetings of the audit committee were held at least once every quarter prior to approval of interim and final results of the Company and as required by the CCG. The terms of reference of the committee have been formed and advised to the committee for compliance.
17. The board has formed and HR and Remuneration Committee. It comprises three members, of whom two are non-executive and the chairman of the committee is a non-executive director.
18. The Board has set-up effective internal audit function by appointing a full-time Head of Internal Audit. The day to day operations of this function are being performed and supervised by the Head of Internal Audit, who is suitably qualified and experienced for the purpose and is conversant with the policies and procedures of the Company.
19. The statutory auditors of the Company have confirmed that they have given a satisfactory rating under the quality control review programme of the Institute of Chartered Accountants of Pakistan, that they or any of the partners of the firm, their spouses and minor children do not hold shares of the Company and that the firm and all its partners are in compliance with International Federation of Accountants (IFAC) guidelines on code of ethics as adopted by Institute of Chartered Accountants of Pakistan.
20. The statutory auditors or the persons associated with them have not been appointed to provide other services except in accordance with the listing regulations and the auditors have confirmed that they have observed IFAC guidelines in this regard.
21. The 'closed period' prior to the announcement of interim / final results, and business decisions, which may materially affect the market price of company's securities, was determined and intimated to directors, employees and stock exchange(s).
22. Material / price sensitive information has been disseminated among all market participants at once through stock exchange(s).
23. We confirm that all other material principles enshrined in the CCG have been complied.
Khalid BashirChief Executive
October 08, 2012
A N N U A L R E P O R T 2 0 1 207
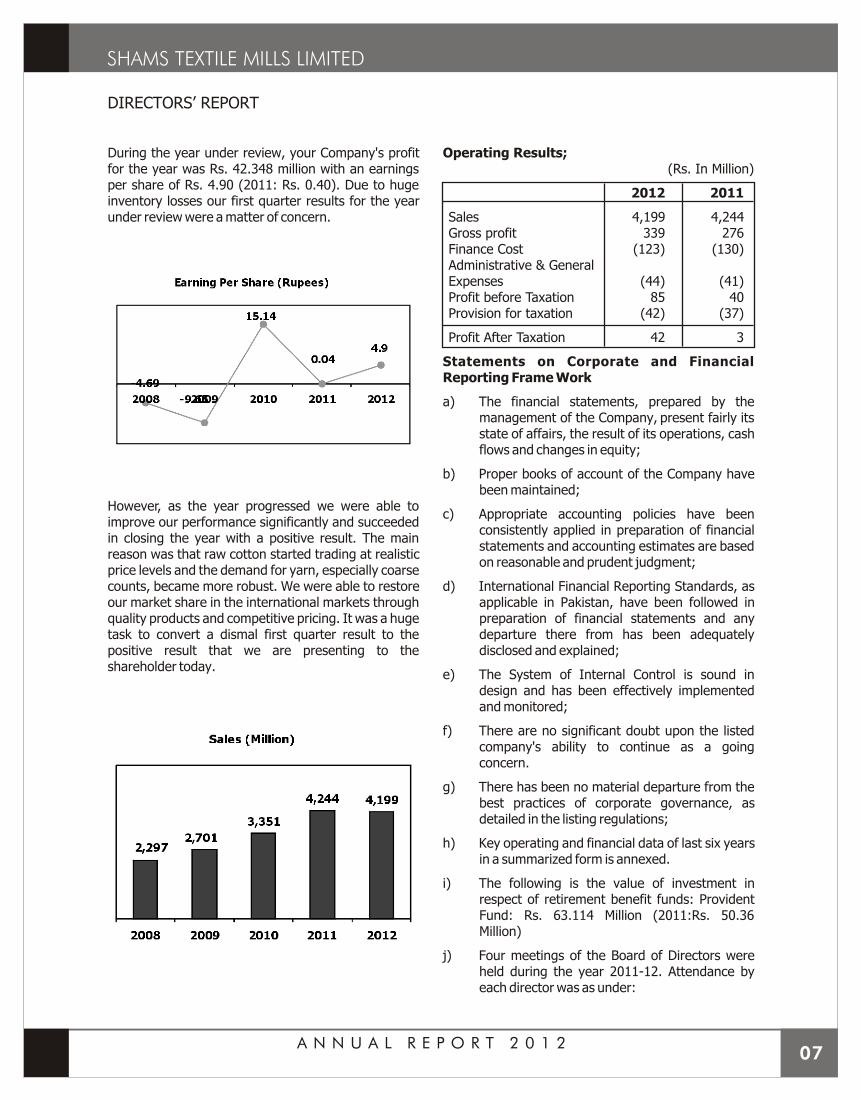
During the year under review, your Company's profit for the year was Rs. 42.348 million with an earnings per share of Rs. 4.90 (2011: Rs. 0.40). Due to huge inventory losses our first quarter results for the year under review were a matter of concern.
However, as the year progressed we were able to improve our performance significantly and succeeded in closing the year with a positive result. The main reason was that raw cotton started trading at realistic price levels and the demand for yarn, especially coarse counts, became more robust. We were able to restore our market share in the international markets through quality products and competitive pricing. It was a huge task to convert a dismal first quarter result to the positive result that we are presenting to the shareholder today.
Operating Results;(Rs. In Million)
2012 2011
Sales 4,199 4,244Gross profit 339 276Finance Cost (123) (130)Administrative & General Expenses (44) (41)Profit before Taxation 85 40Provision for taxation (42) (37)
Profit After Taxation 42 3
Statements on Corporate and Financial Reporting Frame Work
a) The financial statements, prepared by the management of the Company, present fairly its state of affairs, the result of its operations, cash flows and changes in equity;
b) Proper books of account of the Company have been maintained;
c) Appropriate accounting policies have been consistently applied in preparation of financial statements and accounting estimates are based on reasonable and prudent judgment;
d) International Financial Reporting Standards, as applicable in Pakistan, have been followed in preparation of financial statements and any departure there from has been adequately disclosed and explained;
e) The System of Internal Control is sound in design and has been effectively implemented and monitored;
f) There are no significant doubt upon the listed company's ability to continue as a going concern.
g) There has been no material departure from the best practices of corporate governance, as detailed in the listing regulations;
h) Key operating and financial data of last six years in a summarized form is annexed.
i) The following is the value of investment in respect of retirement benefit funds: Provident Fund: Rs. 63.114 Million (2011:Rs. 50.36 Million)
j) Four meetings of the Board of Directors were held during the year 2011-12. Attendance by each director was as under:
DIRECTORS’ REPORT
A N N U A L R E P O R T 2 0 1 208
Sr. No. Name of Director No. Of MeetingsAttended
1 Mr. Adil Bashir 3
2 Mr. Amjad Mahmood 2
3 Mr. Asif Bashir 3
4 Mr. Bashir Ahmad (NIT)(Resigned on 18-04-12) 1
5 Mr. Khalid Bashir 4
6 Mr. Muhammad Anwar 2
7 Mr. Muhammad Asif (NIT)(Appointed on 24-04-2012) 0
8 Mr. Nadeem Maqbool 4
(However, leave of absence was granted to the Directors who could not attend the Board Meetings due to preoccupations)
Audit Committee
The Board of Directors in compliance to the Code of Corporate Governance has established an Audit Committee and the following non-executive directors are its members. Five Audit Committee meetings were held
Sr. No. Name of Members No. OfMeetingsAttended
1 Mr. Muhammad Anwar 03
2 Mr. Asif Bashir 05
3 Mr. Adil Bashir 05
Human Resource & Remuneration Committee
The Board of Directors in compliance to the Code of Corporate Governance has established an Human Resource & Remuneration Committee and the following directors are its members:
1. Mr. Amjad Mahmood Chairman
2. Mr. Khalid Bashir Member
3. Mr. Adil Bashir Member
Directors' Training Programme:
Mr. Nadeem Maqbool, Director completed his Director Certification from the Pakistan Institute of Corporate Governance. Other Directors will also undergo training and certification over the next year.
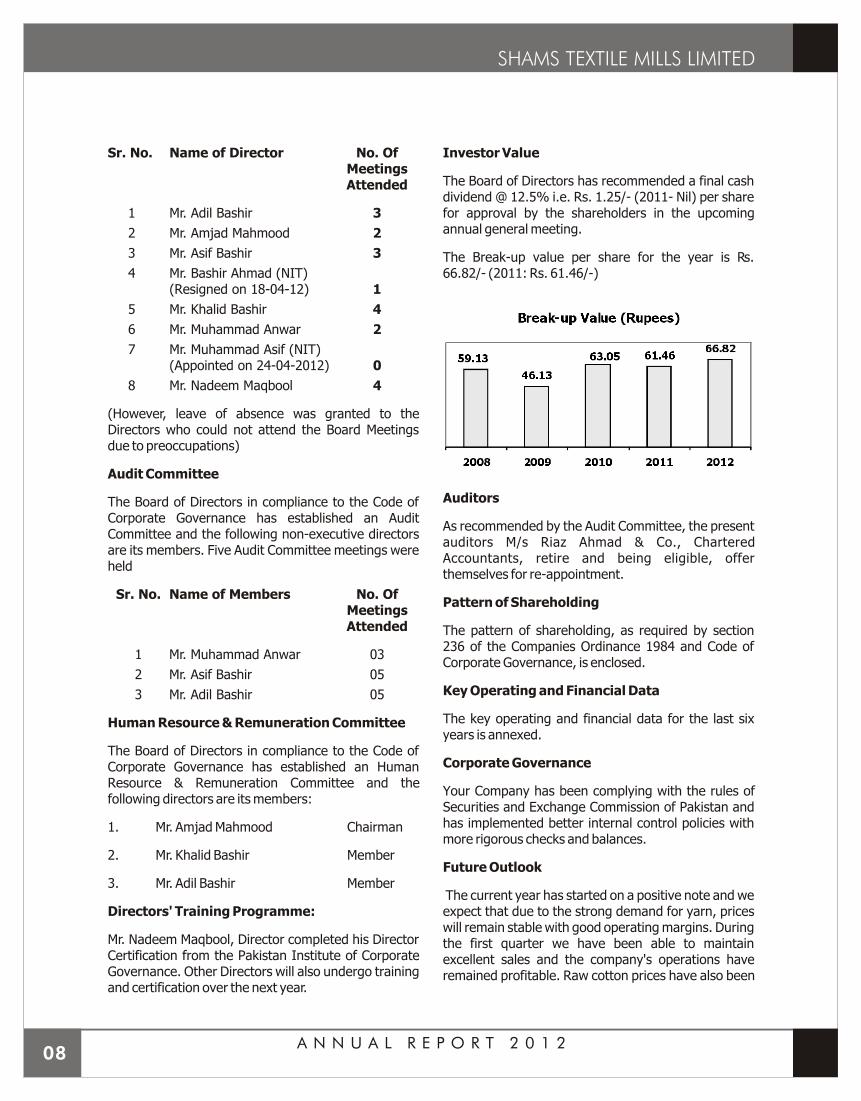
Investor Value
The Board of Directors has recommended a final cash dividend @ 12.5% i.e. Rs. 1.25/- (2011- Nil) per share for approval by the shareholders in the upcoming annual general meeting.
The Break-up value per share for the year is Rs. 66.82/- (2011: Rs. 61.46/-)
Auditors
As recommended by the Audit Committee, the present auditors M/s Riaz Ahmad & Co., Chartered Accountants, retire and being eligible, offer themselves for re-appointment.
Pattern of Shareholding
The pattern of shareholding, as required by section 236 of the Companies Ordinance 1984 and Code of Corporate Governance, is enclosed.
Key Operating and Financial Data
The key operating and financial data for the last six years is annexed.
Corporate Governance
Your Company has been complying with the rules of Securities and Exchange Commission of Pakistan and has implemented better internal control policies with more rigorous checks and balances.
Future Outlook
The current year has started on a positive note and we expect that due to the strong demand for yarn, prices will remain stable with good operating margins. During the first quarter we have been able to maintain excellent sales and the company's operations have remained profitable. Raw cotton prices have also been
A N N U A L R E P O R T 2 0 1 209
maintained at reasonable levels in view of an expected larger output. The weather pattern in the country has been conducive to the cotton crop and the rains have been at normal levels. It is expected that the cotton output will be excellent in terms of quality and quantity barring any unforeseen problems. This bodes well for the textile industry and we view the future with optimism.
The main issue is the shortage of gas and electricity. This will continue to make an adverse impact on the profitability of the company. Since the gas availability is confined to 4 days a week, we are compelled to use alternate energy sources. This issue needs the urgent attention of the government.
The management is continually striving towards better cost controls and efficiencies both in terms of production and financial management. We hope that with our efforts the company will perform even better to maximise returns to our shareholders. We are also planning balancing and modernisation in our older plants in order to remain competitive. Pakistan yarn in terms of quality and price is one of the most acceptable alternatives and this has resulted in increased market share.
Acknowledgements
On behalf of the Board of Directors, I would take this opportunity to than all our partners for their continued support and especially thank the employees who have worked with dedication zeal throughout the year.
For & On behalf of Board of Directors
Khalid BashirChief Executive
October 08, 2012Lahore
A N N U A L R E P O R T 2 0 1 210
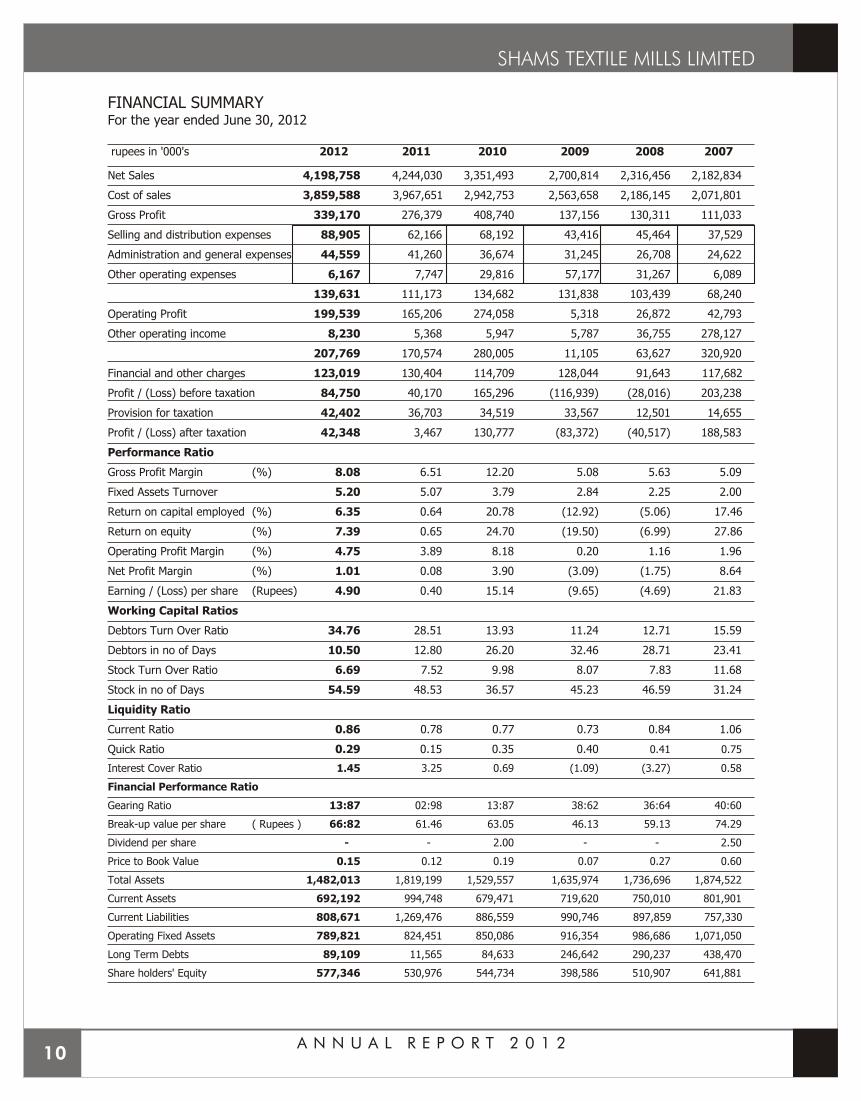
FINANCIAL SUMMARYFor the year ended June 30, 2012
rupees in '000's 2012 2011 2010 2009 2008 2007
Net Sales 4,198,758 4,244,030 3,351,493 2,700,814 2,316,456 2,182,834
Cost of sales 3,859,588 3,967,651 2,942,753 2,563,658 2,186,145 2,071,801
Gross Profit 339,170 276,379 408,740 137,156 130,311 111,033
Selling and distribution expenses 88,905 62,166 68,192 43,416 45,464 37,529
Administration and general expenses 44,559 41,260 36,674 31,245 26,708 24,622
Other operating expenses 6,167 7,747 29,816 57,177 31,267 6,089
139,631 111,173 134,682 131,838 103,439 68,240
Operating Profit 199,539 165,206 274,058 5,318 26,872 42,793
Other operating income 8,230 5,368 5,947 5,787 36,755 278,127
207,769 170,574 280,005 11,105 63,627 320,920
Financial and other charges 123,019 130,404 114,709 128,044 91,643 117,682
Profit / (Loss) before taxation 84,750 40,170 165,296 (116,939) (28,016) 203,238
Provision for taxation 42,402 36,703 34,519 33,567 12,501 14,655
Profit / (Loss) after taxation 42,348 3,467 130,777 (83,372) (40,517) 188,583
Performance Ratio
Gross Profit Margin (%) 8.08 6.51 12.20 5.08 5.63 5.09
Fixed Assets Turnover 5.20 5.07 3.79 2.84 2.25 2.00
Return on capital employed (%) 6.35 0.64 20.78 (12.92) (5.06) 17.46
Return on equity (%) 7.39 0.65 24.70 (19.50) (6.99) 27.86
Operating Profit Margin (%) 4.75 3.89 8.18 0.20 1.16 1.96
Net Profit Margin (%) 1.01 0.08 3.90 (3.09) (1.75) 8.64
Earning / (Loss) per share (Rupees) 4.90 0.40 15.14 (9.65) (4.69) 21.83
Working Capital Ratios
Debtors Turn Over Ratio 34.76 28.51 13.93 11.24 12.71 15.59
Debtors in no of Days 10.50 12.80 26.20 32.46 28.71 23.41
Stock Turn Over Ratio 6.69 7.52 9.98 8.07 7.83 11.68
Stock in no of Days 54.59 48.53 36.57 45.23 46.59 31.24
Liquidity Ratio
Current Ratio 0.86 0.78 0.77 0.73 0.84 1.06
Quick Ratio 0.29 0.15 0.35 0.40 0.41 0.75
Interest Cover Ratio 1.45 3.25 0.69 (1.09) (3.27) 0.58
Financial Performance Ratio
Gearing Ratio 13:87 02:98 13:87 38:62 36:64 40:60
Break-up value per share ( Rupees ) 66:82 61.46 63.05 46.13 59.13 74.29
Dividend per share - - 2.00 - - 2.50
Price to Book Value 0.15 0.12 0.19 0.07 0.27 0.60
Total Assets 1,482,013 1,819,199 1,529,557 1,635,974 1,736,696 1,874,522
Current Assets 692,192 994,748 679,471 719,620 750,010 801,901
Current Liabilities 808,671 1,269,476 886,559 990,746 897,859 757,330
Operating Fixed Assets 789,821 824,451 850,086 916,354 986,686 1,071,050
Long Term Debts 89,109 11,565 84,633 246,642 290,237 438,470
Share holders' Equity 577,346 530,976 544,734 398,586 510,907 641,881

A N N U A L R E P O R T 2 0 1 211
NOTICE OF ANNUAL GENERAL MEETING
iii. The proxy shall produce his/her original valid CNIC or original passport at the time of the meeting.
In case of corporate entity, the Board of Directors' resolution/power of attorney with specimen signature shall be produced (unless it has been provided earlier) at the time of meeting.
5. SECP has directed vide SRO No. 779(1)/2011 dated August 18, 2011 to issue dividend warrant only crossed as “A/c Payee only” and should bear the Computerized National Identity Card (CNIC) of the registered members. Members who have not yet submitted photocopy of their valid CNIC are requested to send the same to the Company's Registrar.
6. As directed by SECP vide Circular NO. 18 of 2012 dated June 5, 2012, we give the shareholders the opportunity to authorize the Commapny to directly credit in your bank account with cash dividend, if any, declared by the Company in future. If you wish that the cash dividend if decleared by the Company be directly, credited into your bank account, instead of issuing a dividend warrants, please provide the following details:
Folio No.
Name
Title of Bank Account
Bank Account Number
Bank's Name
Branch Name & Address
Cell Number of Transferee
Landline Number of Transferee, if any
1) Statement under Section 160(1)(b) of the Companies Ordinance, 1984
This statement set out the material facts concerning the special business to be transacted at the annual general meeting of the Company to be held on October 30, 2012.
The Company is listed on Two Stock Exchanges of Pakistan i.e. Karachi and Lahore.The Board of Directors of the Company is of the view that there is no need to keep the Company listed on Lahore Stock Exchange as it involves unnecessary expenditure (including annual listing fees, printing cost etc) which is not in the interest of the Company and its shareholders. These expenditures would continue to increase in future if the Company is no delisted from Lahore Stock Exchange. It would be sufficient if the Compay is listed on one stock exchange i.e. Karachi Stock Exchange (Guarantee) Limited. The following resolution is proposed to be passed as special resolution:
Resolved that the Company be delisted from the Lahore Stock Exchange Limited (“LSE”) under section 9(5) of the Securities & Exchange Ordinance, 1969 while the Company shall remain listed on the Karachi Stock Exchange (Guarantee) Limited.
Resolved further that the Chief Executive Officer, Chief Financial Officer and / or the Company Secretary, be and are / is hereby authorized to fulfill all requisite legal and procedural formalities for accomplishing the delisting of the Company from LSE and to make application, sign and submit requisite documents as may be reasonably required by LSE so as to effectuate the de-listing of the Company and to take all actions and do necessary acts, deeds and things for implementation of this resolution including filing of appeals before the appropriate forum, if need be.
The Directors have no other personal interest, directly or indirectly, in the proposed special business except in their capacities as shareholders and directors of the Company.
2) Statement under Section 160(1)(b) of the Companies Ordinance, 1984
This statement set out the material facts concerning the special business to be transacted at the annual general meeting of the Company to be held on October 30, 2012.
The Direcrtors in their meeting held on October 08, 2012 have recommended to the shareholders to pass the special resolutions to approve amendments in certain clauses of the Articles of Association of the Company to bring it in line with the changes made by Securities & Exchange Commission of Pakistan and Ministry of Finance & Law, Government of Pakistan , in Companies Ordinance, 1984 from time to time.
thNOTICE IS HEREBY GIVEN THAT the 45 Annual General Meeting of the shareholders of Shams Textile Mills Limited will be held on Tuesday , October 30, 2012 at 09:30 a.m. at the Registered Office, 7-B III, Aziz Avenue, Gulberg V, Lahore to transact the following business:
ORDINARY BUSINESS
1. To receive, consider and adopt the Audited Accounts together with the Directors' and Auditors' reports thereon for the year ended June 30, 2012.
2. To approve as recommended by Directors' the pay off Cash Dividend @ 12.5% Rs. 1.25 per share for the year ended June 30, 2012.
3. To appoint auditors of the Company and fix their remuneration. The present auditor M/s Riaz Ahmad & Company, Chartered Accountants retires and offers themselves for re-appointment.
4. To transact any other business with the permission of the Chair
SPECIAL BUSINESS
1. To consider and approve the delisting of the Company from the Lahore Stock Exchange Limited, while retain the listing of the Company on Karachi Stock Exchange (Guarantee) Limited.
2. To consider and approved the following special resolutions.
Annual General Meeting
Resolved that the article No. 25 of the Articles of Association of the Company thbe and is hereby amended the words “six month” appearing in 4 line be
substituted with the “four months”.
Quorum
Resoved that the article No. 30 of the Articles of Association of the Company rdbe and is hereby amended the words “three member” appearing in 3 line be
substituted with the “ten members”.
By Order of the Board
Lahore
October 09, 2012 Company Secretary
BOOK CLOSURE:
The Members' Register will remain closed from October 24, 2012 to October 30, 2012 (both day inclusive)
NOTES:
1. Transfer received in order at the Registered Office by the close of business hours on Tuesday, October 23, 2012 will be treated in time.
2. A member eligible to attend and vote at this Meeting may appoint another member as his/her proxy to attend and vote instead of him/her.
3. The instrument appointing a proxy and the power of attorney or other authority under which it is signed or a notarially attested copy of the power of attorney must be received by the Company at the Registered Office not later than 48 hours before the time for holding the Meeting.
4. CDC account holders will further have to follow the under mentioned guidelines as laid down in circular no. 1 dated January 26, 2000 of the Securities & Exchange Commission of Pakistan for attending the meeting:
For Attending the Meeting:
i. In case of individuals, the account holder or sub-account holder and whose registration details are uploaded as per the Regulations, shall authenticate his/her identity by showing his/her original National Identity Card (NIC) or passport at the time of attending the meeting.
ii. In case of corporate entity, the Board of Directors' resolution/power of attorney with specimen signature of the nominee shall be produced (unless it has been provided earlier) at the time of meeting.
For Appointing Proxies:
i. In case of individuals, the account holder or sub-account holder and whose registration details are uploaded as per the Regulations, shall submit the proxy form as per above requirement
ii. Attested copies of valid CNICor the passport of beneficial owners and the proxy shall be furnished with the proxy form.
A N N U A L R E P O R T 2 0 1 212
We have reviewed the Statement of Compliance with the best practices contained in the Code of Corporate Governance prepared by the Board of Directors of SHAMS TEXTILE MILLS LIMITED (“the Company”) for the year ended 30 June 2012, to comply with the Listing Regulations of the respective Stock Exchanges, where the Company is listed.
The responsibility for compliance with the Code of Corporate Governance is that of the Board of Directors of the Company. Our responsibility is to review, to the extent where such compliance can be objectively verified, whether the statement of compliance reflects the status of the Company's compliance with the provisions of the Code of Corporate Governance and report if it does not. A review is limited primarily to inquiries of the Company personnel and review of various documents prepared by the Company to comply with the Code.
As part of our audit of financial statements, we are required to obtain an understanding of the accounting and internal control systems sufficient to plan the audit and develop an effective audit approach. We are not required to consider whether the Board's statement on internal control covers all risks and controls, or to form an opinion on the effectiveness of such internal controls, the Company's corporate governance procedures and risks.
Further, Listing Regulations of the Karachi and Lahore Stock Exchanges require the Company to place before the Board of Directors for their consideration and approval related party transactions distinguishing between transactions carried out on terms equivalent to those that prevail in arm's length transactions and transactions which are not executed at arm's length price recording proper justification for using such alternate pricing mechanism. Further, all such transactions are also required to be separately placed before the audit committee. We are only required and have ensured compliance of requirement to the extent of approval of related party transactions by the Board of Directors and placement of such transactions before the audit committee. We have not carried out any procedures to determine whether the related party transactions were undertaken at arm's length price or not.
Based on our review, nothing has come to our attention, which causes us to believe that the Statement of Compliance does not appropriately reflect the Company's compliance, in all material respects, with the best practices contained in the Code of Corporate Governance as applicable to the Company for the year ended 30 June 2012.
RIAZ AHMAD & COMPANYChartered Accountants
Name of engagement partner: Syed Mustafa Ali
DATE: October 08, 2012
LAHORE
REVIEW REPORT TO THE MEMBERS ON STATEMENT OF COMPLIANCEWITH BEST PRACTICES OF CODE OF CORPORATE GOVERNANCE
A N N U A L R E P O R T 2 0 1 213
We have audited the annexed balance sheet of SHAMS TEXTILE MILLS LIMITED as at 30 June 2012 and the related profit and loss account, statement of comprehensive income, cash flow statement and statement of changes in equity together with the notes forming part thereof, for the year then ended and we state that we have obtained all the information and explanations which, to the best of our knowledge and belief, were necessary for the purposes of our audit.
It is the responsibility of the company's management to establish and maintain a system of internal control, and prepare and present the above said statements in conformity with the approved accounting standards and the requirements of the Companies Ordinance, 1984. Our responsibility is to express an opinion on these statements based on our audit.
We conducted our audit in accordance with the auditing standards as applicable in Pakistan. These standards require that we plan and perform the audit to obtain reasonable assurance about whether the above said statements are free of any material misstatement. An audit includes examining, on a test basis, evidence supporting the amounts and disclosures in the above said statements. An audit also includes assessing the accounting policies and significant estimates made by management, as well as, evaluating the overall presentation of the above said statements. We believe that our audit provides a reasonable basis for our opinion and, after due verification, we report that:
(a) in our opinion, proper books of account have been kept by the company as required by the Companies Ordinance, 1984;
(b) in our opinion:
i) the balance sheet and profit and loss account together with the notes thereon have been drawn up in conformity with the Companies Ordinance, 1984, and are in agreement with the books of account and are further in accordance with accounting policies consistently applied;
ii) the expenditure incurred during the year was for the purpose of the company's business; and
iii) the business conducted, investments made and the expenditure incurred during the year were in accordance with the objects of the company;
(c) in our opinion and to the best of our information and according to the explanations given to us, the balance sheet, profit and loss account, statement of comprehensive income, cash flow statement and statement of changes in equity together with the notes forming part thereof conform with approved accounting standards as applicable in Pakistan, and, give the information required by the Companies Ordinance, 1984, in the manner so required and respectively give a true and fair view of the state of the company's affairs as at 30 June 2012 and of the profit, its comprehensive income, its cash flows and changes in equity for the year then ended; and
(d) in our opinion, no Zakat was deductible at source under the Zakat and Ushr Ordinance, 1980 (XVIII of 1980).
RIAZ AHMAD & COMPANYChartered Accountants
Name of engagement partner: Syed Mustafa AliDATE: October, 08 2012LAHORE
AUDITORS’ REPORT TO THE MEMBERS
A N N U A L R E P O R T 2 0 1 214
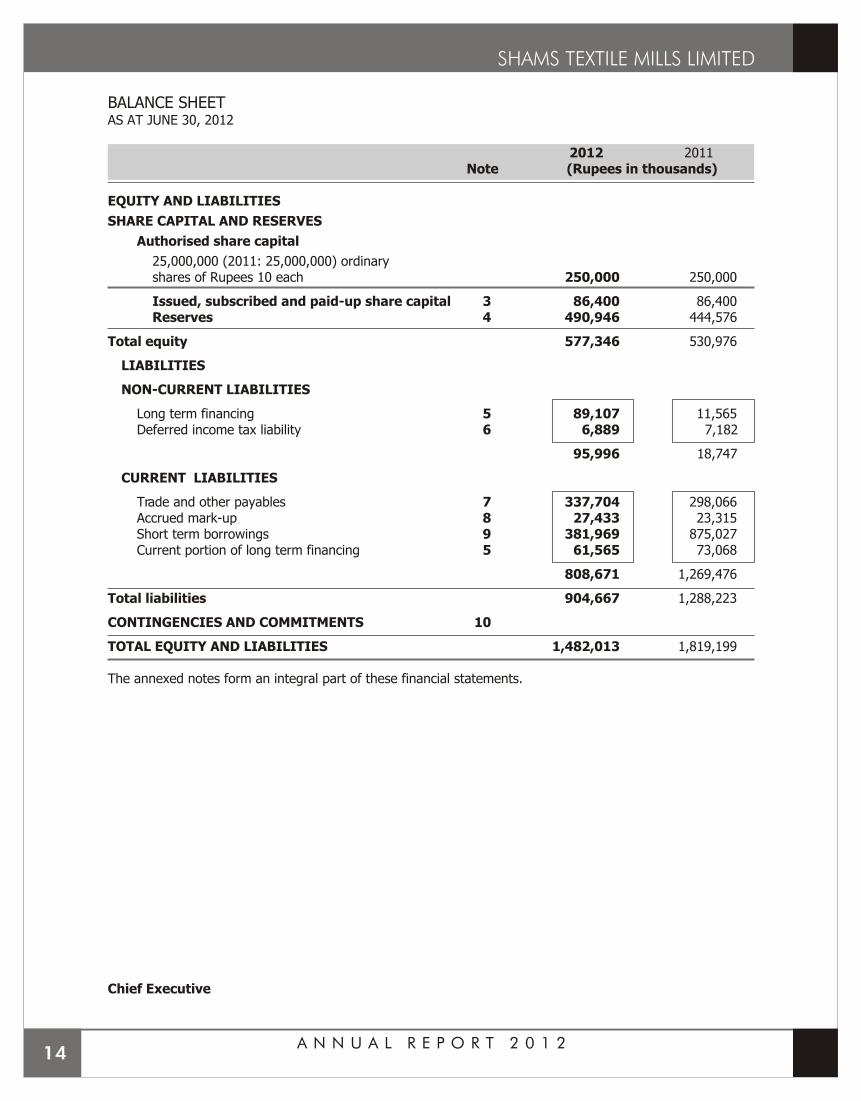
2012 2011Note (Rupees in thousands)
EQUITY AND LIABILITIES
SHARE CAPITAL AND RESERVES
Authorised share capital
25,000,000 (2011: 25,000,000) ordinaryshares of Rupees 10 each 250,000 250,000
Issued, subscribed and paid-up share capital 3 86,400 86,400Reserves 4 490,946 444,576
Total equity 577,346 530,976
LIABILITIES
NON-CURRENT LIABILITIES
Long term financing 5 89,107 11,565Deferred income tax liability 6 6,889 7,182
95,996 18,747
CURRENT LIABILITIES
Trade and other payables 7 337,704 298,066Accrued mark-up 8 27,433 23,315Short term borrowings 9 381,969 875,027Current portion of long term financing 5 61,565 73,068
808,671 1,269,476
Total liabilities 904,667 1,288,223
CONTINGENCIES AND COMMITMENTS 10
TOTAL EQUITY AND LIABILITIES 1,482,013 1,819,199
The annexed notes form an integral part of these financial statements.
Chief Executive
BALANCE SHEETAS AT JUNE 30, 2012
A N N U A L R E P O R T 2 0 1 215
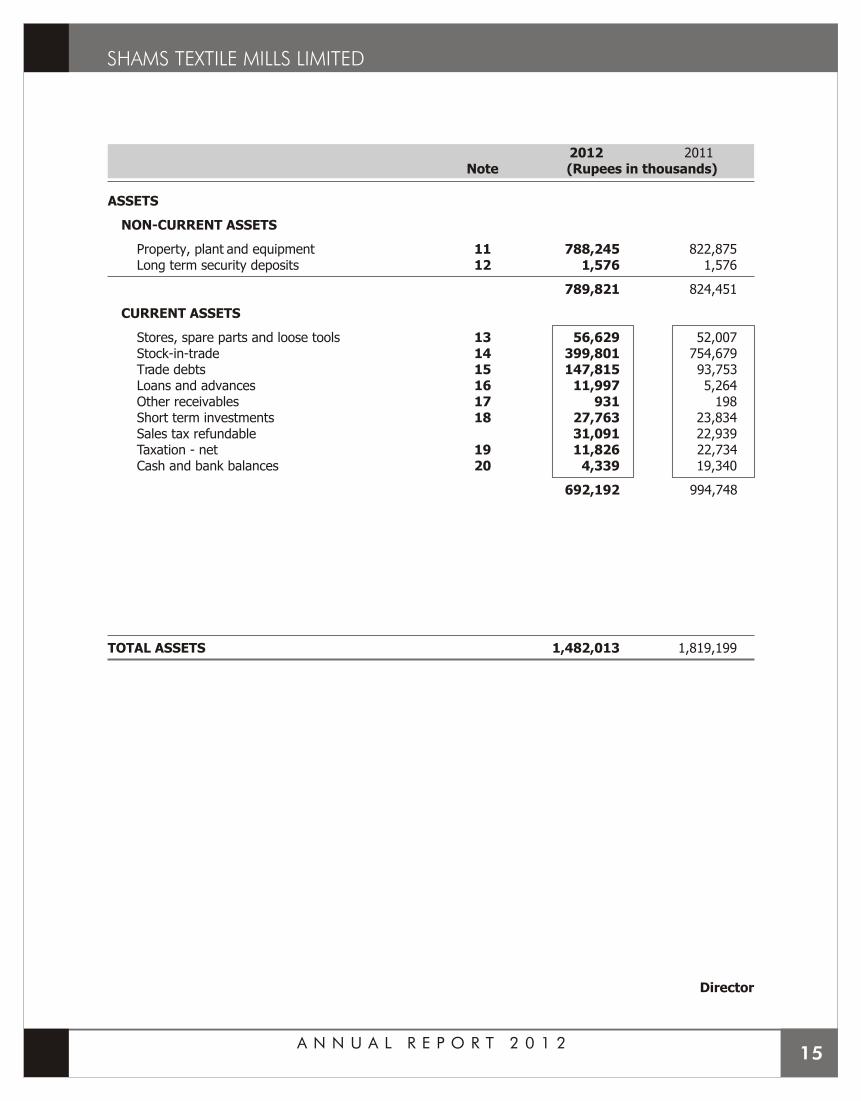
2012 2011Note (Rupees in thousands)
ASSETS
NON-CURRENT ASSETS
Property, plant and equipment 11 788,245 822,875Long term security deposits 12 1,576 1,576
789,821 824,451
CURRENT ASSETS
Stores, spare parts and loose tools 13 56,629 52,007Stock-in-trade 14 399,801 754,679Trade debts 15 147,815 93,753Loans and advances 16 11,997 5,264Other receivables 17 931 198Short term investments 18 27,763 23,834Sales tax refundable 31,091 22,939Taxation - net 19 11,826 22,734Cash and bank balances 20 4,339 19,340
692,192 994,748
TOTAL ASSETS 1,482,013 1,819,199
Director
A N N U A L R E P O R T 2 0 1 216
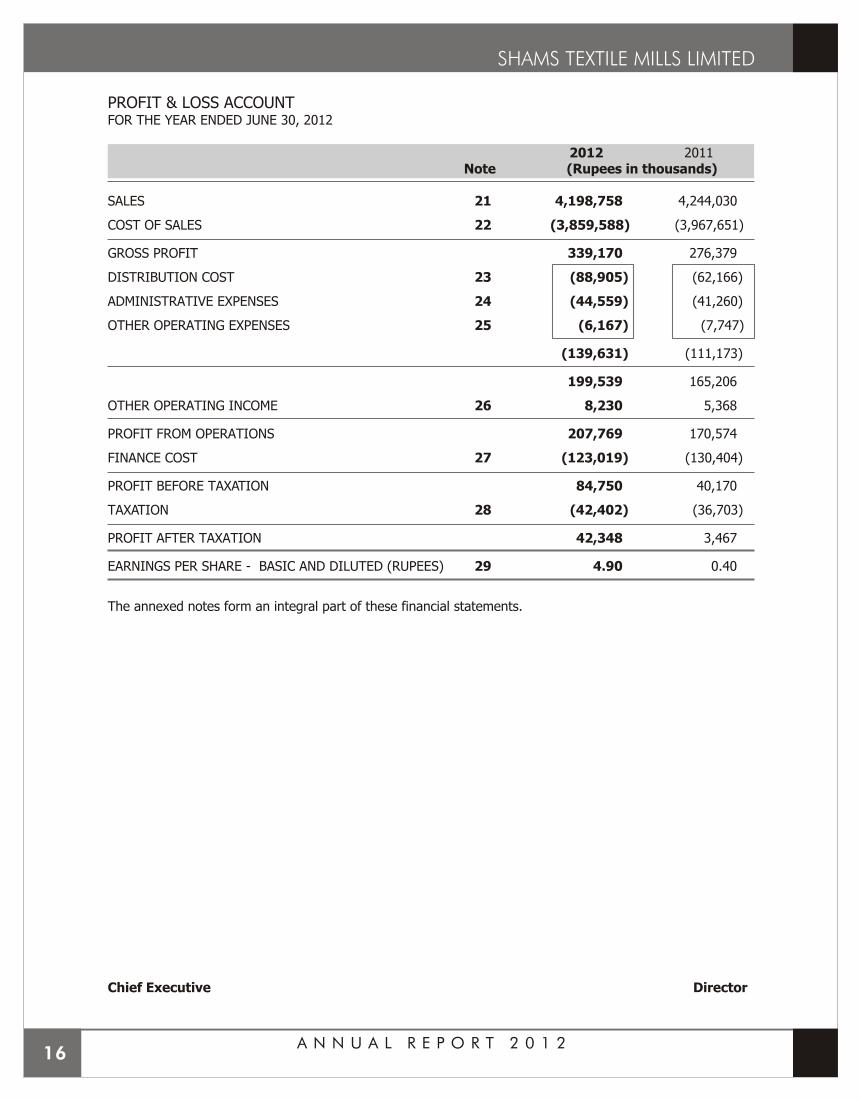
PROFIT & LOSS ACCOUNTFOR THE YEAR ENDED JUNE 30, 2012
2012 2011Note (Rupees in thousands)
SALES 21 4,198,758 4,244,030
COST OF SALES 22 (3,859,588) (3,967,651)
GROSS PROFIT 339,170 276,379
DISTRIBUTION COST 23 (88,905) (62,166)
ADMINISTRATIVE EXPENSES 24 (44,559) (41,260)
OTHER OPERATING EXPENSES 25 (6,167) (7,747)
(139,631) (111,173)
199,539 165,206
OTHER OPERATING INCOME 26 8,230 5,368
PROFIT FROM OPERATIONS 207,769 170,574
FINANCE COST 27 (123,019) (130,404)
PROFIT BEFORE TAXATION 84,750 40,170
TAXATION 28 (42,402) (36,703)
PROFIT AFTER TAXATION 42,348 3,467
EARNINGS PER SHARE - BASIC AND DILUTED (RUPEES) 29 4.90 0.40
The annexed notes form an integral part of these financial statements.
Chief Executive Director

STATEMENT OF COMPREHENSIVE INCOMEFor The Year Ended JUNE 30, 2012
2012 2011(Rupees in thousands)
PROFIT AFTER TAXATION 42,348 3,467
OTHER COMPREHENSIVE INCOME
Surplus arising on remeasurement of available for sale investments 4,022 55
TOTAL COMPREHENSIVE INCOME FOR THE YEAR 46,370 3,522
The annexed notes form an integral part of these financial statements.
Chief Executive Director
A N N U A L R E P O R T 2 0 1 217
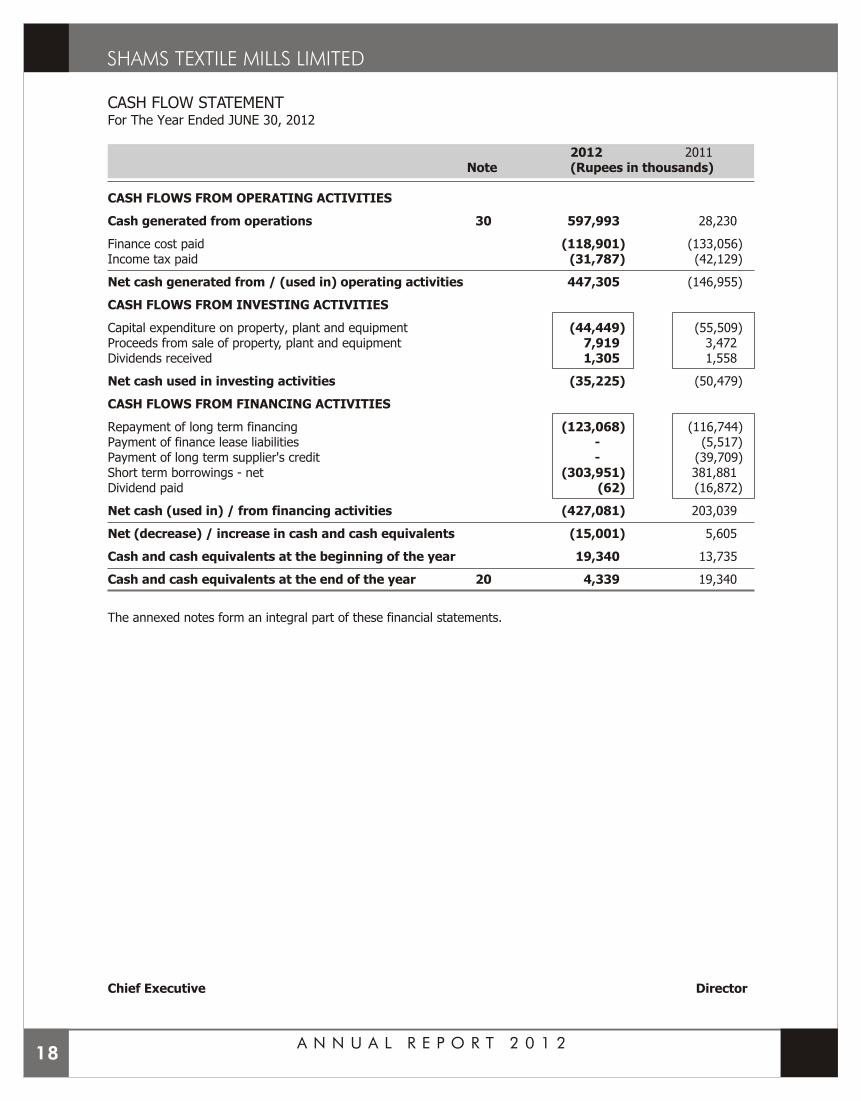
CASH FLOW STATEMENTFor The Year Ended JUNE 30, 2012
2012 2011Note (Rupees in thousands)
CASH FLOWS FROM OPERATING ACTIVITIES
Cash generated from operations 30 597,993 28,230
Finance cost paid (118,901) (133,056)Income tax paid (31,787) (42,129)
Net cash generated from / (used in) operating activities 447,305 (146,955)
CASH FLOWS FROM INVESTING ACTIVITIES
Capital expenditure on property, plant and equipment (44,449) (55,509)Proceeds from sale of property, plant and equipment 7,919 3,472Dividends received 1,305 1,558
Net cash used in investing activities (35,225) (50,479)
CASH FLOWS FROM FINANCING ACTIVITIES
Repayment of long term financing (123,068) (116,744)Payment of finance lease liabilities - (5,517)Payment of long term supplier's credit - (39,709)Short term borrowings - net (303,951) 381,881Dividend paid (62) (16,872)
Net cash (used in) / from financing activities (427,081) 203,039
Net (decrease) / increase in cash and cash equivalents (15,001) 5,605
Cash and cash equivalents at the beginning of the year 19,340 13,735
Cash and cash equivalents at the end of the year 20 4,339 19,340
The annexed notes form an integral part of these financial statements.
Chief Executive Director
A N N U A L R E P O R T 2 0 1 218
A N N U A L R E P O R T 2 0 1 219
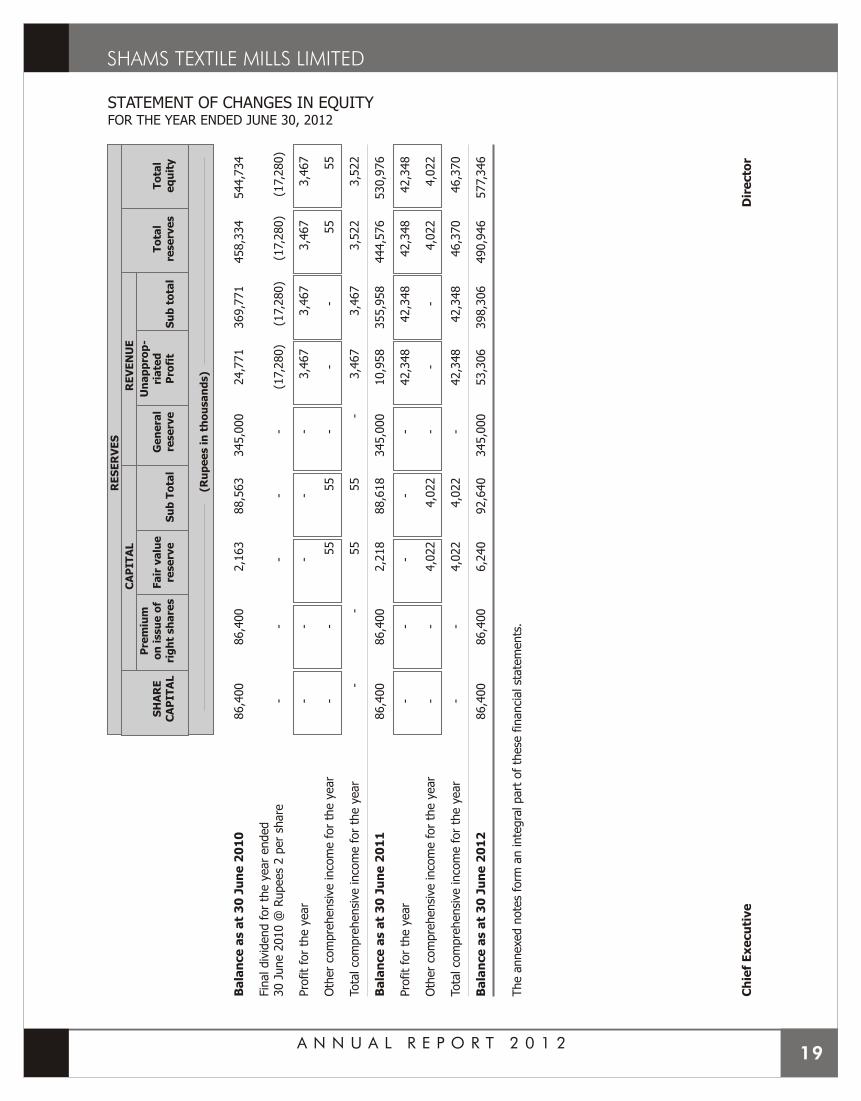
STATEMENT OF CHANGES IN EQUITYFOR THE YEAR ENDED JUNE 30, 2012
RE
SE
RV
ES
CA
PIT
AL
RE
VE
NU
E
Pre
miu
mU
na
pp
rop
-S
HA
RE
on
issu
e o
fFa
ir v
alu
eG
en
era
lri
ate
dT
ota
lT
ota
lC
AP
ITA
Lri
gh
t sh
are
sre
se
rve
Su
b T
ota
lre
se
rve
Pro
fit
Su
b t
ota
lre
se
rve
se
qu
ity
(R
up
ee
s i
n t
ho
usa
nd
s)
Ba
lan
ce
as a
t 3
0 J
un
e 2
01
086,4
00
86,4
00
2,1
63
88,5
63
345,0
00
24,7
71
369,7
71
458,3
34
544,7
34
Fin
al div
idend for
the y
ear
ended
30 J
une 2
010 @
Rupees
2 p
er
share
--
--
-(1
7,280)
(17,
280)
(17,
280)
(17,
280)
Pro
fit
for
the y
ear
--
--
-3,4
67
3,4
67
3,4
67
3,4
67
Oth
er
com
pre
hensi
ve inco
me for
the y
ear
--
55
55
--
-
55
55
Tota
l co
mpre
hensi
ve inco
me for
the y
ear
--
55
55
-3,4
67
3,4
67
3,5
22
3,5
22
Ba
lan
ce
as a
t 3
0 J
un
e 2
01
186,4
00
86,4
00
2,2
18
88,6
18
345,0
00
10,9
58
355,9
58
444,5
76
530,9
76
Pro
fit
for
the y
ear
--
--
-42,3
48
42,3
48
42,3
48
42,3
48
Oth
er
com
pre
hensi
ve inco
me for
the y
ear
--
4,0
22
4,0
22
--
-
4,0
22
4,0
22
Tota
l co
mpre
hensi
ve inco
me for
the y
ear
--
4,0
22
4,0
22
-42,3
48
42,3
48
46,3
70
46,3
70
Ba
lan
ce
as a
t 3
0 J
un
e 2
01
286,4
00
86,4
00
6,2
40
92,6
40
345,0
00
53,3
06
398,3
06
490,9
46
577,
346
The a
nnexe
d n
ote
s fo
rm a
n inte
gra
l part
of
these
fin
anci
al st
ate
ments
.
Ch
ief
Ex
ecu
tive
Dir
ecto
r

1. THE COMPANY AND ITS OPERATIONS
Shams Textile Mills Limited ("the Company") is a public limited Company incorporated in Pakistan under the Companies Act, 1913 (Now Companies Ordinance, 1984) and is listed on Karachi and Lahore Stock Exchanges in Pakistan. Its registered office is situated at 7-B-III, Aziz Avenue, Gulberg V, Lahore. The Company is engaged in the business of manufacturing, sale and trading of yarn and trading of cloth.
2. SUMMARY OF SIGNIFICANT ACCOUNTING POLICIES
The significant accounting policies applied in the preparation of these financial statements are set out below. These policies have been consistently applied to all years presented, unless otherwise stated.
2.1 Basis of preparation
a) Statement of compliance
These financial statements have been prepared in accordance with approved accounting standards as applicable in Pakistan. Approved accounting standards comprise of such International Financial Reporting Standards (IFRS) issued by the International Accounting Standards Board as are notified under the Companies Ordinance, 1984, provisions of and directives issued under the Companies Ordinance, 1984. In case requirements differ, the provisions or directives of the Companies Ordinance, 1984 shall prevail.
b) Accounting convention
These financial statements have been prepared under the historical cost convention except for the certain financial instruments carried at fair value.
c) Critical accounting estimates and judgements
The preparation of financial statements in conformity with the approved accounting standards requires the use of certain critical accounting estimates. It also requires the management to exercise its judgement in the process of applying the Company's accounting policies. Estimates and judgements are continually evaluated and are based on historical experience and other factors, including expectations of future events that are believed to be reasonable under the circumstances. The areas where various assumptions and estimates are significant to the Company's financial statements or where judgements were exercised in application of accounting policies are as follows:
Useful lives, patterns of economic benefits and impairments
Estimates with respect to useful lives and pattern of flow of economic benefits are based on the analysis of the management of the Company. Further, the Company reviews the value of assets for possible impairment on an annual basis. Any change in the estimates in the future might affect the carrying amount of respective item of property, plant and equipment with a corresponding effect on the depreciation charge and impairment.
Inventories
Net realizable value of inventories is determined with reference to currently prevailing selling prices less estimated expenditure to make sales.
Taxation
In making the estimates for income tax currently payable by the Company, the management takes into account the current income tax law and the decisions of appellate authorities on certain issues in the past.
Future estimation of export sales
Deferred income tax calculation has been based on estimate of future ratio of export and local sales.
Provision for doubtful debts
The Company reviews its receivables against any provision required for any doubtful balances on an ongoing basis. The provision is made while taking into consideration expected recoveries, if any.
d) Amendments to published approved standards that are effective in current year and are relevant to the Company
The following amendments to published approved standards are mandatory for the Company's accounting periods beginning on or after 01 July 2011:
IFRS 7 (Amendment), 'Financial Instruments: Disclosures' (effective for annual periods beginning on or after 01 July 2011). The new disclosure requirements apply to transfer of financial assets. An entity transfers a financial asset when it transfers the contractual rights to receive cash flows of the asset to another party. These amendments are part of the International Accounting Standards Board (IASBs) comprehensive review of off balance sheet activities. The amendments will promote transparency in the reporting of transfer transactions and improve users’ understanding of the risk exposures relating to transfers of financial assets and the effect of those risks on an entity’s financial position, particularly those involving securitization of financial asset. However, this amendment has no material impact on these financial statements.
IAS 1 (Amendment), ‘Presentation of Financial Statements’ (effective for annual periods beginning on or after 01 January 2011). It clarifies that an entity will present an analysis of other comprehensive income for each component of equity, either in the statement of changes in equity or in the notes to the financial statements. However, this amendment has no material impact on these financial statements.
e) Interpretations and amendments to published approved standards that are effective in current year but not relevant to the Company
There are other new interpretations and amendments to the published approved standards that are mandatory for accounting periods beginning on or after 01 July 2011 but are considered not to be relevant or do not have any significant impact on the Company's financial statements and are therefore not detailed in these financial statements.
f) Standards and amendments to published approved standards that are not yet effective but relevant to the Company
Following standards and amendments to existing standards have been published and are mandatory for the Company's accounting
NOTES TO THE FINANCIAL STATEMENTSFOR THE YEAR ENDED JUNE 30, 2012
A N N U A L R E P O R T 2 0 1 220
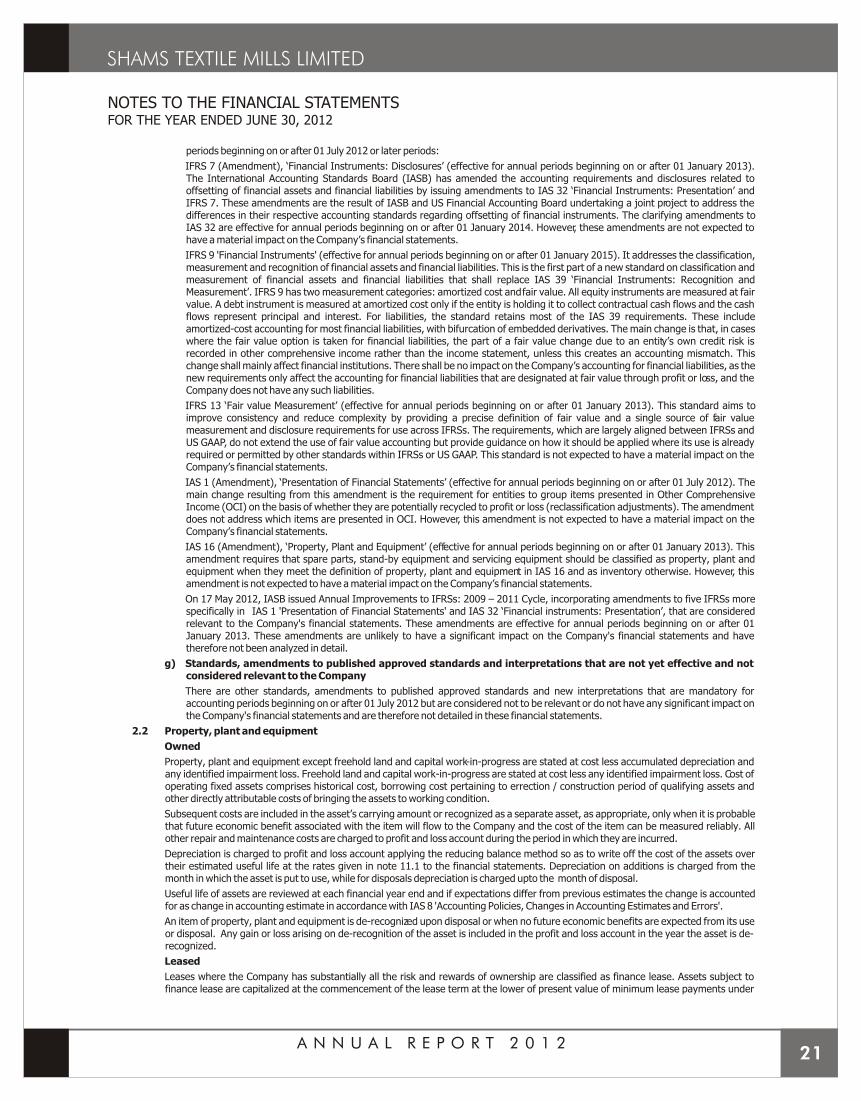
periods beginning on or after 01 July 2012 or later periods:
IFRS 7 (Amendment), ‘Financial Instruments: Disclosures’ (effective for annual periods beginning on or after 01 January 2013). The International Accounting Standards Board (IASB) has amended the accounting requirements and disclosures related to offsetting of financial assets and financial liabilities by issuing amendments to IAS 32 ‘Financial Instruments: Presentation’ and IFRS 7. These amendments are the result of IASB and US Financial Accounting Board undertaking a joint project to address the differences in their respective accounting standards regarding offsetting of financial instruments. The clarifying amendments to IAS 32 are effective for annual periods beginning on or after 01 January 2014. However, these amendments are not expected to have a material impact on the Company’s financial statements.
IFRS 9 'Financial Instruments' (effective for annual periods beginning on or after 01 January 2015). It addresses the classification, measurement and recognition of financial assets and financial liabilities. This is the first part of a new standard on classification and measurement of financial assets and financial liabilities that shall replace IAS 39 ‘Financial Instruments: Recognition and Measurement’. IFRS 9 has two measurement categories: amortized cost and fair value. All equity instruments are measured at fair value. A debt instrument is measured at amortized cost only if the entity is holding it to collect contractual cash flows and the cash flows represent principal and interest. For liabilities, the standard retains most of the IAS 39 requirements. These include amortized-cost accounting for most financial liabilities, with bifurcation of embedded derivatives. The main change is that, in cases where the fair value option is taken for financial liabilities, the part of a fair value change due to an entity’s own credit risk is recorded in other comprehensive income rather than the income statement, unless this creates an accounting mismatch. This change shall mainly affect financial institutions. There shall be no impact on the Company’s accounting for financial liabilities, as the new requirements only affect the accounting for financial liabilities that are designated at fair value through profit or loss, and the Company does not have any such liabilities.
IFRS 13 ‘Fair value Measurement’ (effective for annual periods beginning on or after 01 January 2013). This standard aims to improve consistency and reduce complexity by providing a precise definition of fair value and a single source of fair value measurement and disclosure requirements for use across IFRSs. The requirements, which are largely aligned between IFRSs and US GAAP, do not extend the use of fair value accounting but provide guidance on how it should be applied where its use is already required or permitted by other standards within IFRSs or US GAAP. This standard is not expected to have a material impact on the Company’s financial statements.
IAS 1 (Amendment), ‘Presentation of Financial Statements’ (effective for annual periods beginning on or after 01 July 2012). The main change resulting from this amendment is the requirement for entities to group items presented in Other Comprehensive Income (OCI) on the basis of whether they are potentially recycled to profit or loss (reclassification adjustments). The amendment does not address which items are presented in OCI. However, this amendment is not expected to have a material impact on the Company’s financial statements.
IAS 16 (Amendment), ‘Property, Plant and Equipment’ (effective for annual periods beginning on or after 01 January 2013). This amendment requires that spare parts, stand-by equipment and servicing equipment should be classified as property, plant and equipment when they meet the definition of property, plant and equipment in IAS 16 and as inventory otherwise. However, this amendment is not expected to have a material impact on the Company’s financial statements.
On 17 May 2012, IASB issued Annual Improvements to IFRSs: 2009 – 2011 Cycle, incorporating amendments to five IFRSs more specifically in IAS 1 'Presentation of Financial Statements' and IAS 32 ‘Financial instruments: Presentation’, that are considered relevant to the Company's financial statements. These amendments are effective for annual periods beginning on or after 01 January 2013. These amendments are unlikely to have a significant impact on the Company's financial statements and have therefore not been analyzed in detail.
g) Standards, amendments to published approved standards and interpretations that are not yet effective and not considered relevant to the Company
There are other standards, amendments to published approved standards and new interpretations that are mandatory for accounting periods beginning on or after 01 July 2012 but are considered not to be relevant or do not have any significant impact on the Company's financial statements and are therefore not detailed in these financial statements.
2.2 Property, plant and equipment
Owned
Property, plant and equipment except freehold land and capital work-in-progress are stated at cost less accumulated depreciation and any identified impairment loss. Freehold land and capital work-in-progress are stated at cost less any identified impairment loss. Cost of operating fixed assets comprises historical cost, borrowing cost pertaining to errection / construction period of qualifying assets and other directly attributable costs of bringing the assets to working condition.
Subsequent costs are included in the asset’s carrying amount or recognized as a separate asset, as appropriate, only when it is probable that future economic benefit associated with the item will flow to the Company and the cost of the item can be measured reliably. All other repair and maintenance costs are charged to profit and loss account during the period in which they are incurred.
Depreciation is charged to profit and loss account applying the reducing balance method so as to write off the cost of the assets over their estimated useful life at the rates given in note 11.1 to the financial statements. Depreciation on additions is charged from the month in which the asset is put to use, while for disposals depreciation is charged upto the month of disposal.
Useful life of assets are reviewed at each financial year end and if expectations differ from previous estimates the change is accounted for as change in accounting estimate in accordance with IAS 8 'Accounting Policies, Changes in Accounting Estimates and Errors'.
An item of property, plant and equipment is de-recognized upon disposal or when no future economic benefits are expected from its use or disposal. Any gain or loss arising on de-recognition of the asset is included in the profit and loss account in the year the asset is de-recognized.
Leased
Leases where the Company has substantially all the risk and rewards of ownership are classified as finance lease. Assets subject to finance lease are capitalized at the commencement of the lease term at the lower of present value of minimum lease payments under
NOTES TO THE FINANCIAL STATEMENTSFOR THE YEAR ENDED JUNE 30, 2012
A N N U A L R E P O R T 2 0 1 221
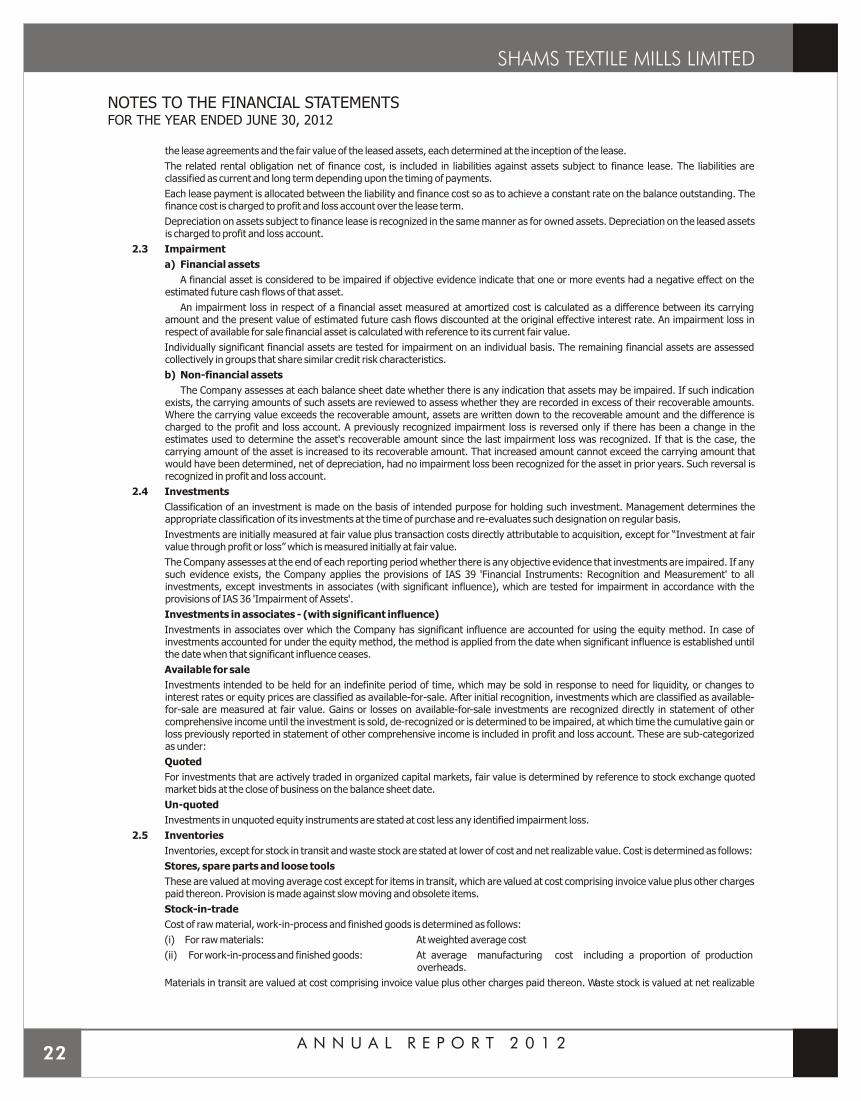
the lease agreements and the fair value of the leased assets, each determined at the inception of the lease.
The related rental obligation net of finance cost, is included in liabilities against assets subject to finance lease. The liabilities are classified as current and long term depending upon the timing of payments.
Each lease payment is allocated between the liability and finance cost so as to achieve a constant rate on the balance outstanding. The finance cost is charged to profit and loss account over the lease term.
Depreciation on assets subject to finance lease is recognized in the same manner as for owned assets. Depreciation on the leased assets is charged to profit and loss account.
2.3 Impairment
a) Financial assets
A financial asset is considered to be impaired if objective evidence indicate that one or more events had a negative effect on the estimated future cash flows of that asset.
An impairment loss in respect of a financial asset measured at amortized cost is calculated as a difference between its carrying amount and the present value of estimated future cash flows discounted at the original effective interest rate. An impairment loss in respect of available for sale financial asset is calculated with reference to its current fair value.
Individually significant financial assets are tested for impairment on an individual basis. The remaining financial assets are assessed collectively in groups that share similar credit risk characteristics.
b) Non-financial assets
The Company assesses at each balance sheet date whether there is any indication that assets may be impaired. If such indication exists, the carrying amounts of such assets are reviewed to assess whether they are recorded in excess of their recoverable amounts. Where the carrying value exceeds the recoverable amount, assets are written down to the recoverable amount and the difference is charged to the profit and loss account. A previously recognized impairment loss is reversed only if there has been a change in the estimates used to determine the asset's recoverable amount since the last impairment loss was recognized. If that is the case, the carrying amount of the asset is increased to its recoverable amount. That increased amount cannot exceed the carrying amount that would have been determined, net of depreciation, had no impairment loss been recognized for the asset in prior years. Such reversal is recognized in profit and loss account.
2.4 Investments
Classification of an investment is made on the basis of intended purpose for holding such investment. Management determines the appropriate classification of its investments at the time of purchase and re-evaluates such designation on regular basis.
Investments are initially measured at fair value plus transaction costs directly attributable to acquisition, except for “Investment at fair value through profit or loss” which is measured initially at fair value.
The Company assesses at the end of each reporting period whether there is any objective evidence that investments are impaired. If any such evidence exists, the Company applies the provisions of IAS 39 'Financial Instruments: Recognition and Measurement' to all investments, except investments in associates (with significant influence), which are tested for impairment in accordance with the provisions of IAS 36 'Impairment of Assets'.
Investments in associates - (with significant influence)
Investments in associates over which the Company has significant influence are accounted for using the equity method. In case of investments accounted for under the equity method, the method is applied from the date when significant influence is established until the date when that significant influence ceases.
Available for sale
Investments intended to be held for an indefinite period of time, which may be sold in response to need for liquidity, or changes to interest rates or equity prices are classified as available-for-sale. After initial recognition, investments which are classified as available-for-sale are measured at fair value. Gains or losses on available-for-sale investments are recognized directly in statement of other comprehensive income until the investment is sold, de-recognized or is determined to be impaired, at which time the cumulative gain or loss previously reported in statement of other comprehensive income is included in profit and loss account. These are sub-categorized as under:
Quoted
For investments that are actively traded in organized capital markets, fair value is determined by reference to stock exchange quoted market bids at the close of business on the balance sheet date.
Un-quoted
Investments in unquoted equity instruments are stated at cost less any identified impairment loss.
2.5 Inventories
Inventories, except for stock in transit and waste stock are stated at lower of cost and net realizable value. Cost is determined as follows:
Stores, spare parts and loose tools
These are valued at moving average cost except for items in transit, which are valued at cost comprising invoice value plus other charges paid thereon. Provision is made against slow moving and obsolete items.
Stock-in-trade
Cost of raw material, work-in-process and finished goods is determined as follows:
(i) For raw materials: At weighted average cost
(ii) For work-in-process and finished goods: At average manufacturing cost including a proportion of production overheads.
Materials in transit are valued at cost comprising invoice value plus other charges paid thereon. Waste stock is valued at net realizable
NOTES TO THE FINANCIAL STATEMENTSFOR THE YEAR ENDED JUNE 30, 2012
A N N U A L R E P O R T 2 0 1 222
value.
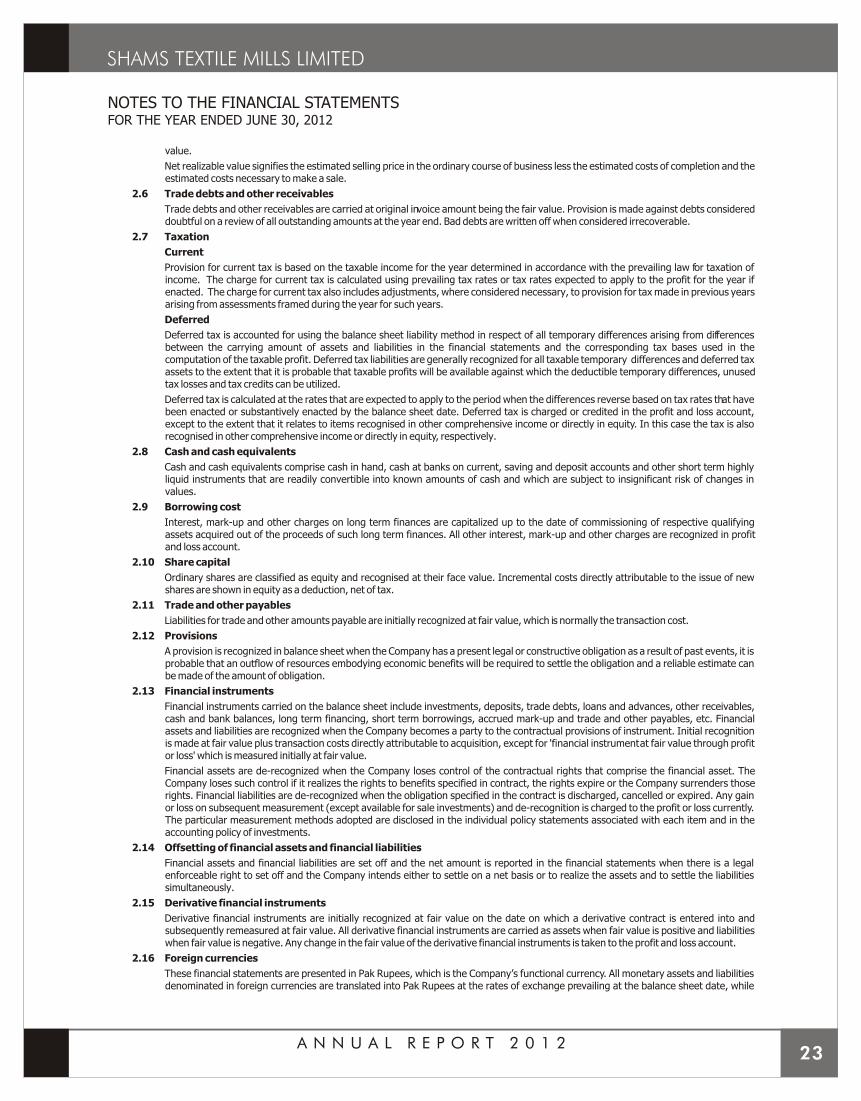
Net realizable value signifies the estimated selling price in the ordinary course of business less the estimated costs of completion and the estimated costs necessary to make a sale.
2.6 Trade debts and other receivables
Trade debts and other receivables are carried at original invoice amount being the fair value. Provision is made against debts considered doubtful on a review of all outstanding amounts at the year end. Bad debts are written off when considered irrecoverable.
2.7 Taxation
Current
Provision for current tax is based on the taxable income for the year determined in accordance with the prevailing law for taxation of income. The charge for current tax is calculated using prevailing tax rates or tax rates expected to apply to the profit for the year if enacted. The charge for current tax also includes adjustments, where considered necessary, to provision for tax made in previous years arising from assessments framed during the year for such years.
Deferred
Deferred tax is accounted for using the balance sheet liability method in respect of all temporary differences arising from differences between the carrying amount of assets and liabilities in the financial statements and the corresponding tax bases used in the computation of the taxable profit. Deferred tax liabilities are generally recognized for all taxable temporary differences and deferred tax assets to the extent that it is probable that taxable profits will be available against which the deductible temporary differences, unused tax losses and tax credits can be utilized.
Deferred tax is calculated at the rates that are expected to apply to the period when the differences reverse based on tax rates that have been enacted or substantively enacted by the balance sheet date. Deferred tax is charged or credited in the profit and loss account, except to the extent that it relates to items recognised in other comprehensive income or directly in equity. In this case the tax is also recognised in other comprehensive income or directly in equity, respectively.
2.8 Cash and cash equivalents
Cash and cash equivalents comprise cash in hand, cash at banks on current, saving and deposit accounts and other short term highly liquid instruments that are readily convertible into known amounts of cash and which are subject to insignificant risk of changes in values.
2.9 Borrowing cost
Interest, mark-up and other charges on long term finances are capitalized up to the date of commissioning of respective qualifying assets acquired out of the proceeds of such long term finances. All other interest, mark-up and other charges are recognized in profit and loss account.
2.10 Share capital
Ordinary shares are classified as equity and recognised at their face value. Incremental costs directly attributable to the issue of new shares are shown in equity as a deduction, net of tax.
2.11 Trade and other payables
Liabilities for trade and other amounts payable are initially recognized at fair value, which is normally the transaction cost.
2.12 Provisions
A provision is recognized in balance sheet when the Company has a present legal or constructive obligation as a result of past events, it is probable that an outflow of resources embodying economic benefits will be required to settle the obligation and a reliable estimate can be made of the amount of obligation.
2.13 Financial instruments
Financial instruments carried on the balance sheet include investments, deposits, trade debts, loans and advances, other receivables, cash and bank balances, long term financing, short term borrowings, accrued mark-up and trade and other payables, etc. Financial assets and liabilities are recognized when the Company becomes a party to the contractual provisions of instrument. Initial recognition is made at fair value plus transaction costs directly attributable to acquisition, except for 'financial instrument at fair value through profit or loss' which is measured initially at fair value.
Financial assets are de-recognized when the Company loses control of the contractual rights that comprise the financial asset. The Company loses such control if it realizes the rights to benefits specified in contract, the rights expire or the Company surrenders those rights. Financial liabilities are de-recognized when the obligation specified in the contract is discharged, cancelled or expired. Any gain or loss on subsequent measurement (except available for sale investments) and de-recognition is charged to the profit or loss currently. The particular measurement methods adopted are disclosed in the individual policy statements associated with each item and in the accounting policy of investments.
2.14 Offsetting of financial assets and financial liabilities
Financial assets and financial liabilities are set off and the net amount is reported in the financial statements when there is a legal enforceable right to set off and the Company intends either to settle on a net basis or to realize the assets and to settle the liabilities simultaneously.
2.15 Derivative financial instruments
Derivative financial instruments are initially recognized at fair value on the date on which a derivative contract is entered into and subsequently remeasured at fair value. All derivative financial instruments are carried as assets when fair value is positive and liabilities when fair value is negative. Any change in the fair value of the derivative financial instruments is taken to the profit and loss account.
2.16 Foreign currencies
These financial statements are presented in Pak Rupees, which is the Company’s functional currency. All monetary assets and liabilities denominated in foreign currencies are translated into Pak Rupees at the rates of exchange prevailing at the balance sheet date, while
NOTES TO THE FINANCIAL STATEMENTSFOR THE YEAR ENDED JUNE 30, 2012
A N N U A L R E P O R T 2 0 1 223
A N N U A L R E P O R T 2 0 1 224
NOTES TO THE FINANCIAL STATEMENTSFOR THE YEAR ENDED JUNE 30, 2012
the transactions in foreign currencies during the year are initially recorded in functional currency at the rates of exchange prevailing at the transaction date. All non-monetary items are translated into Pak Rupees at exchange rates prevailing on the date of transaction or on the date when fair values are determined. Exchange gains and losses are included in the profit and loss account currently.
2.17 Employee benefits
Defined contribution plan
The Company operates a funded employees’ provident fund scheme for its permanent employees. Equal monthly contributions at the rate of six percent of basic pay are made both by the Company and employees to the fund.
Compensated absences
Compensated absences are accounted for in the period in which the absences are earned.
2.18 Borrowings
Borrowings are recognized initially at fair value and are subsequently stated at amortized cost. Any difference between the proceeds and the redemption value is recognized in the profit and loss account over the period of the borrowings using the effective interest method.
2.19 Revenue recognition
Revenue from different sources is recognized as under:
- Revenue from sale of goods is recognized on dispatch of goods to customers.
- Dividend on equity investments is recognized when right to receive dividend is established.
- Profit on deposits with banks is recognized on time proportion basis taking into account the amounts outstanding and rates applicable thereon.
2.20 Dividend and other appropriations
Dividend distribution to the Company's shareholders is recognized as a liability in the Company's financial statements in the period in which the dividends are declared and other appropriations are recognized in the period in which these are approved by the Board of Directors.
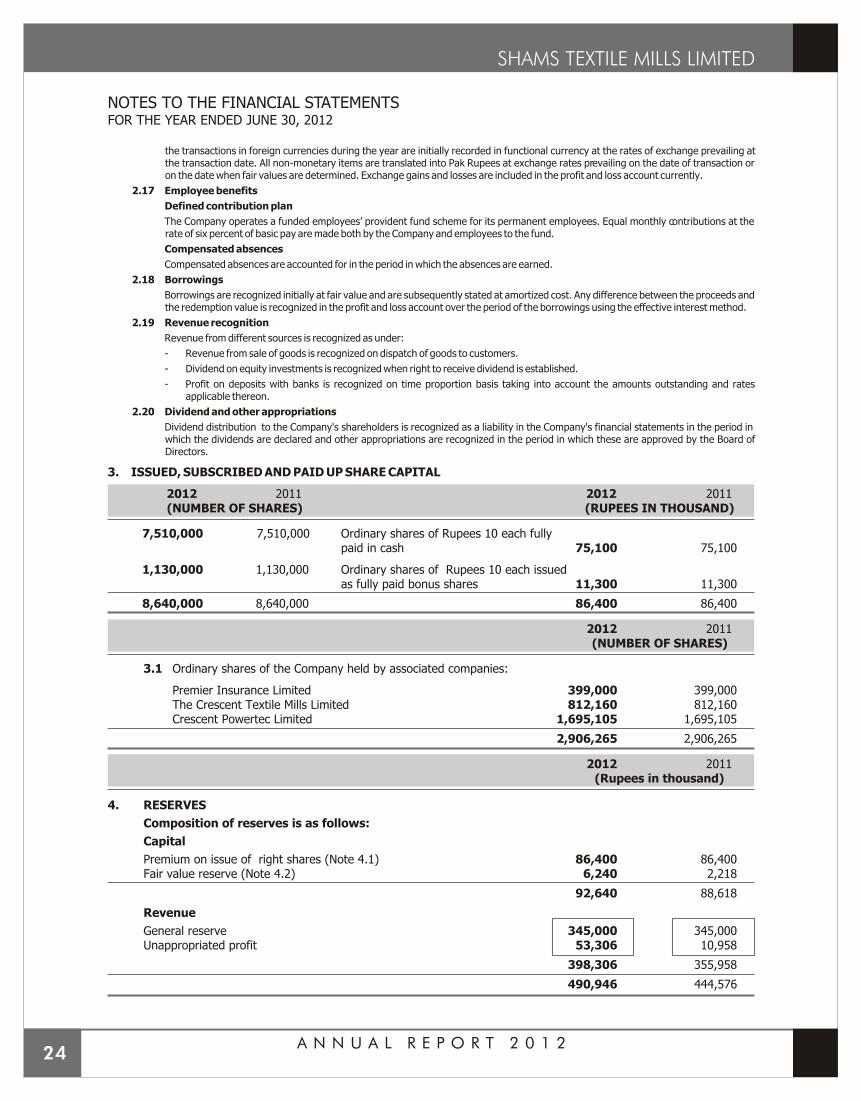
3. ISSUED, SUBSCRIBED AND PAID UP SHARE CAPITAL
2012 2011 2012 2011(NUMBER OF SHARES) (RUPEES IN THOUSAND)
7,510,000 7,510,000 Ordinary shares of Rupees 10 each fully paid in cash 75,100 75,100
1,130,000 1,130,000 Ordinary shares of Rupees 10 each issued as fully paid bonus shares 11,300 11,300
8,640,000 8,640,000 86,400 86,400
2012 2011(NUMBER OF SHARES)
3.1 Ordinary shares of the Company held by associated companies:
Premier Insurance Limited 399,000 399,000The Crescent Textile Mills Limited 812,160 812,160Crescent Powertec Limited 1,695,105 1,695,105
2,906,265 2,906,265
2012 2011(Rupees in thousand)
4. RESERVES
Composition of reserves is as follows:
Capital
Premium on issue of right shares (Note 4.1) 86,400 86,400Fair value reserve (Note 4.2) 6,240 2,218
92,640 88,618
Revenue
General reserve 345,000 345,000Unappropriated profit 53,306 10,958
398,306 355,958
490,946 444,576
NOTES TO THE FINANCIAL STATEMENTSFOR THE YEAR ENDED JUNE 30, 2012
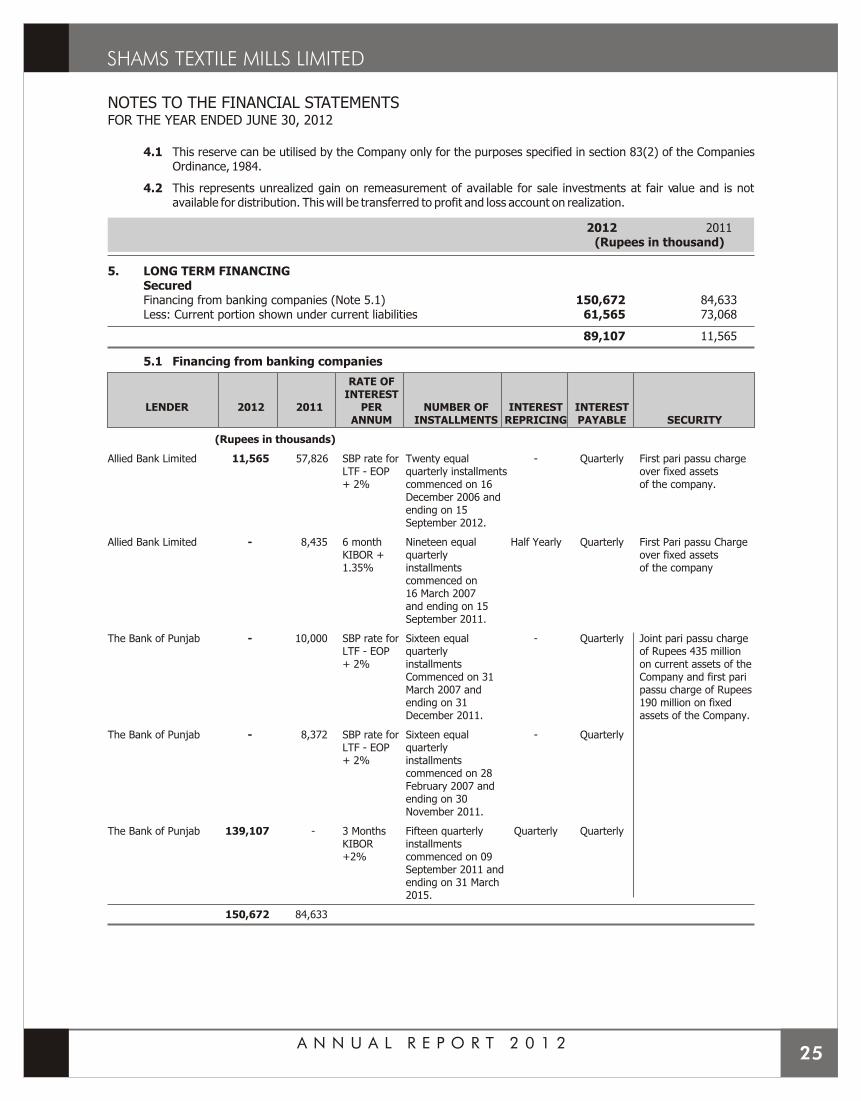
4.1 This reserve can be utilised by the Company only for the purposes specified in section 83(2) of the Companies Ordinance, 1984.
4.2 This represents unrealized gain on remeasurement of available for sale investments at fair value and is not available for distribution. This will be transferred to profit and loss account on realization.
2012 2011(Rupees in thousand)
5. LONG TERM FINANCINGSecuredFinancing from banking companies (Note 5.1) 150,672 84,633Less: Current portion shown under current liabilities 61,565 73,068
89,107 11,565
5.1 Financing from banking companies
RATE OFINTEREST
LENDER 2012 2011 PER NUMBER OF INTEREST INTERESTANNUM INSTALLMENTS REPRICING PAYABLE SECURITY
(Rupees in thousands)
Allied Bank Limited 11,565 57,826 SBP rate for Twenty equal - Quarterly First pari passu chargeLTF - EOP quarterly installments over fixed assets+ 2% commenced on 16 of the company.
December 2006 andending on 15September 2012.
Allied Bank Limited - 8,435 6 month Nineteen equal Half Yearly Quarterly First Pari passu ChargeKIBOR + quarterly over fixed assets1.35% installments of the company
commenced on16 March 2007and ending on 15September 2011.
The Bank of Punjab - 10,000 SBP rate for Sixteen equal - Quarterly Joint pari passu chargeLTF - EOP quarterly of Rupees 435 million+ 2% installments on current assets of the
Commenced on 31 Company and first pariMarch 2007 and passu charge of Rupeesending on 31 190 million on fixedDecember 2011. assets of the Company.
The Bank of Punjab - 8,372 SBP rate for Sixteen equal - QuarterlyLTF - EOP quarterly + 2% installments
commenced on 28February 2007 andending on 30November 2011.
The Bank of Punjab 139,107 - 3 Months Fifteen quarterly Quarterly QuarterlyKIBOR installments +2% commenced on 09
September 2011 and ending on 31 March 2015.
150,672 84,633
A N N U A L R E P O R T 2 0 1 225
A N N U A L R E P O R T 2 0 1 226
NOTES TO THE FINANCIAL STATEMENTSFOR THE YEAR ENDED JUNE 30, 2012
2012 2011(Rupees in thousand)
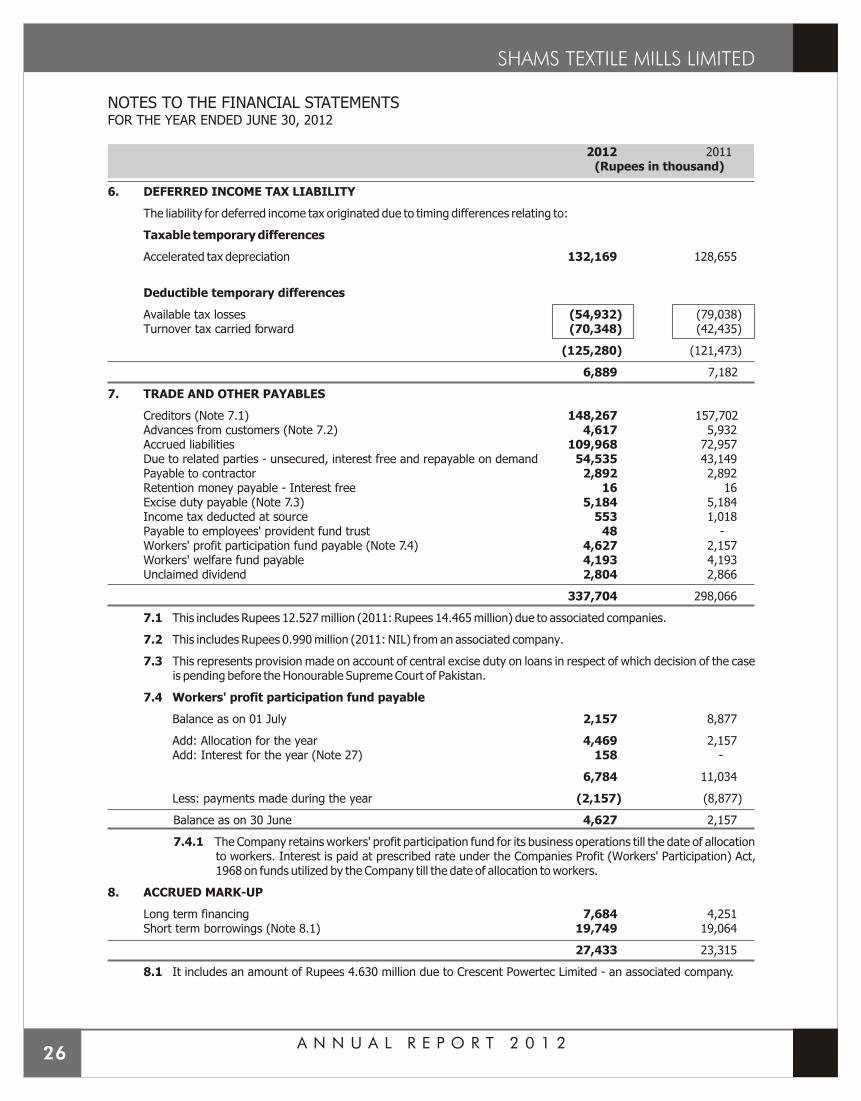
6. DEFERRED INCOME TAX LIABILITY
The liability for deferred income tax originated due to timing differences relating to:
Taxable temporary differences
Accelerated tax depreciation 132,169 128,655
Deductible temporary differences
Available tax losses (54,932) (79,038)Turnover tax carried forward (70,348) (42,435)
(125,280) (121,473)
6,889 7,182
7. TRADE AND OTHER PAYABLES
Creditors (Note 7.1) 148,267 157,702Advances from customers (Note 7.2) 4,617 5,932Accrued liabilities 109,968 72,957Due to related parties - unsecured, interest free and repayable on demand 54,535 43,149Payable to contractor 2,892 2,892Retention money payable - Interest free 16 16Excise duty payable (Note 7.3) 5,184 5,184Income tax deducted at source 553 1,018Payable to employees' provident fund trust 48 -Workers' profit participation fund payable (Note 7.4) 4,627 2,157Workers' welfare fund payable 4,193 4,193Unclaimed dividend 2,804 2,866
337,704 298,066
7.1 This includes Rupees 12.527 million (2011: Rupees 14.465 million) due to associated companies.
7.2 This includes Rupees 0.990 million (2011: NIL) from an associated company.
7.3 This represents provision made on account of central excise duty on loans in respect of which decision of the case is pending before the Honourable Supreme Court of Pakistan.
7.4 Workers' profit participation fund payable
Balance as on 01 July 2,157 8,877
Add: Allocation for the year 4,469 2,157Add: Interest for the year (Note 27) 158 -
6,784 11,034
Less: payments made during the year (2,157) (8,877)
Balance as on 30 June 4,627 2,157
7.4.1 The Company retains workers' profit participation fund for its business operations till the date of allocation to workers. Interest is paid at prescribed rate under the Companies Profit (Workers' Participation) Act, 1968 on funds utilized by the Company till the date of allocation to workers.
8. ACCRUED MARK-UP
Long term financing 7,684 4,251Short term borrowings (Note 8.1) 19,749 19,064
27,433 23,315
8.1 It includes an amount of Rupees 4.630 million due to Crescent Powertec Limited - an associated company.
NOTES TO THE FINANCIAL STATEMENTSFOR THE YEAR ENDED JUNE 30, 2012
2012 2011(Rupees in thousand)
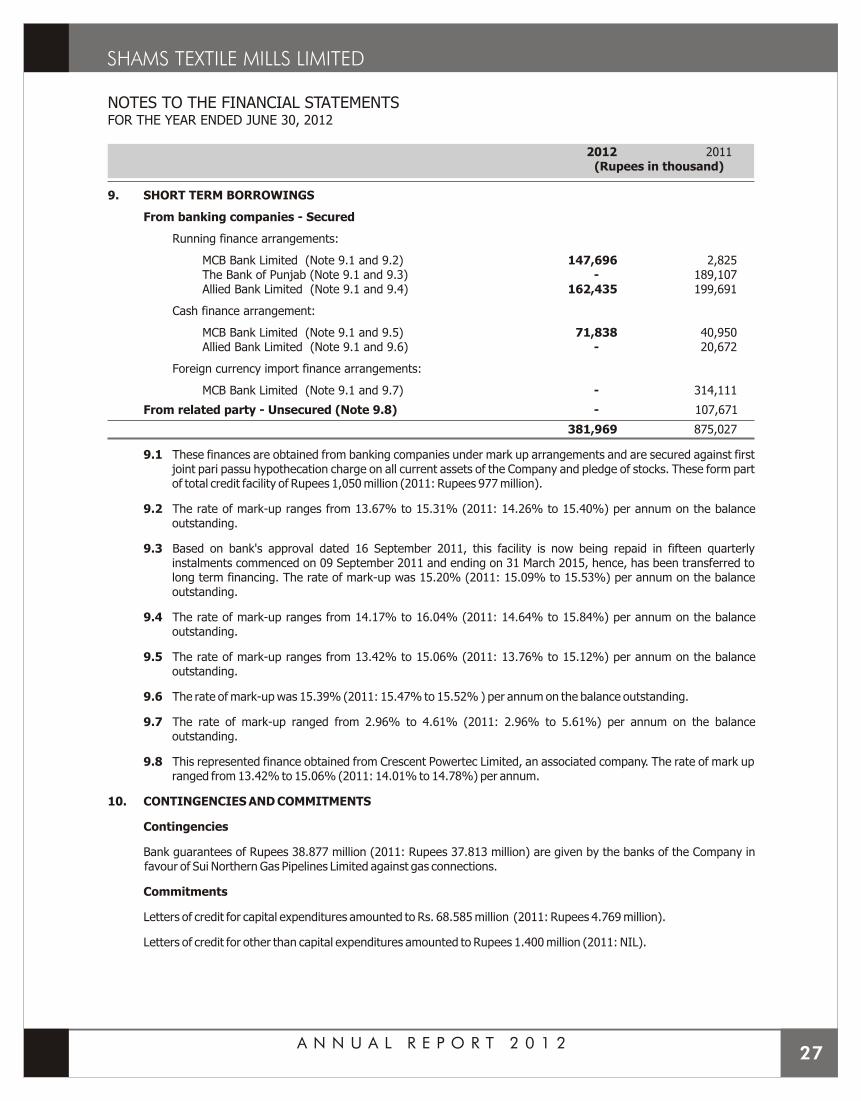
9. SHORT TERM BORROWINGS
From banking companies - Secured
Running finance arrangements:
MCB Bank Limited (Note 9.1 and 9.2) 147,696 2,825The Bank of Punjab (Note 9.1 and 9.3) - 189,107Allied Bank Limited (Note 9.1 and 9.4) 162,435 199,691
Cash finance arrangement:
MCB Bank Limited (Note 9.1 and 9.5) 71,838 40,950Allied Bank Limited (Note 9.1 and 9.6) - 20,672
Foreign currency import finance arrangements:
MCB Bank Limited (Note 9.1 and 9.7) - 314,111
From related party - Unsecured (Note 9.8) - 107,671
381,969 875,027
9.1 These finances are obtained from banking companies under mark up arrangements and are secured against first joint pari passu hypothecation charge on all current assets of the Company and pledge of stocks. These form part of total credit facility of Rupees 1,050 million (2011: Rupees 977 million).
9.2 The rate of mark-up ranges from 13.67% to 15.31% (2011: 14.26% to 15.40%) per annum on the balance outstanding.
9.3 Based on bank's approval dated 16 September 2011, this facility is now being repaid in fifteen quarterly instalments commenced on 09 September 2011 and ending on 31 March 2015, hence, has been transferred to long term financing. The rate of mark-up was 15.20% (2011: 15.09% to 15.53%) per annum on the balance outstanding.
9.4 The rate of mark-up ranges from 14.17% to 16.04% (2011: 14.64% to 15.84%) per annum on the balance outstanding.
9.5 The rate of mark-up ranges from 13.42% to 15.06% (2011: 13.76% to 15.12%) per annum on the balance outstanding.
9.6 The rate of mark-up was 15.39% (2011: 15.47% to 15.52% ) per annum on the balance outstanding.
9.7 The rate of mark-up ranged from 2.96% to 4.61% (2011: 2.96% to 5.61%) per annum on the balance outstanding.
9.8 This represented finance obtained from Crescent Powertec Limited, an associated company. The rate of mark up ranged from 13.42% to 15.06% (2011: 14.01% to 14.78%) per annum.
10. CONTINGENCIES AND COMMITMENTS
Contingencies
Bank guarantees of Rupees 38.877 million (2011: Rupees 37.813 million) are given by the banks of the Company in favour of Sui Northern Gas Pipelines Limited against gas connections.
Commitments
Letters of credit for capital expenditures amounted to Rs. 68.585 million (2011: Rupees 4.769 million).
Letters of credit for other than capital expenditures amounted to Rupees 1.400 million (2011: NIL).
A N N U A L R E P O R T 2 0 1 227
A N N U A L R E P O R T 2 0 1 228
NOTES TO THE FINANCIAL STATEMENTSFOR THE YEAR ENDED JUNE 30, 2012
20
12
2011
(Ru
pe
es i
n t
ho
usa
nd
s)
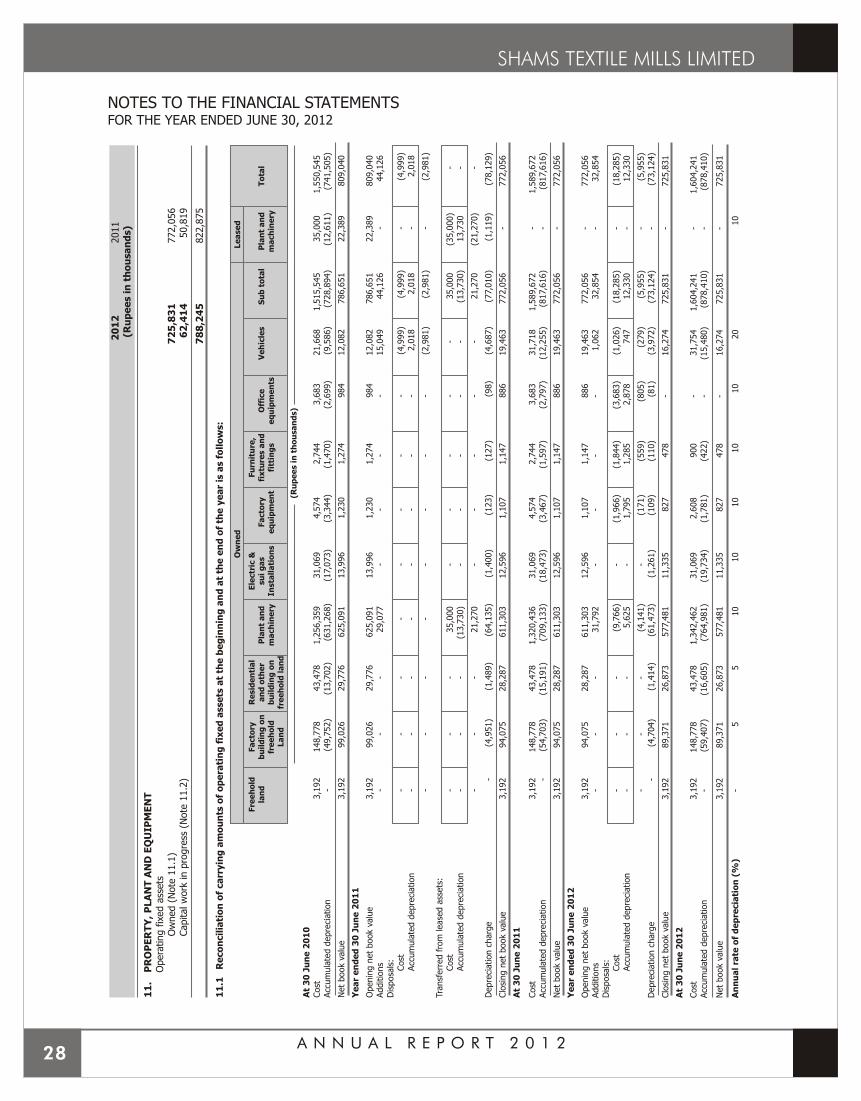
11
.P
RO
PE
RT
Y,
PLA
NT
AN
D E
QU
IPM
EN
TO
pera
ting f
ixed a
ssets
Ow
ned (
Note
11.1
)7
25
,83
1772,0
56
Capital w
ork
in p
rogre
ss (
Note
11.2
)6
2,4
14
50,8
19
78
8,2
45
822,8
75
11
.1
Re
co
ncil
iati
on
of
ca
rryin
g a
mo
un
ts o
f o
pe
rati
ng
fix
ed
asse
ts a
t th
e b
eg
inn
ing
an
d a
t th
e e
nd
of
the
ye
ar
is a
s f
oll
ow
s:
Ow
ne
dLe
ase
d
Fre
eh
old
Fa
cto
ryR
esid
en
tia
lE
lectr
ic &
Fu
rnit
ure
,la
nd
bu
ild
ing
on
an
d o
the
rP
lan
t a
nd
su
i g
as
Fa
cto
ryfi
xtu
res a
nd
Off
ice
Ve
hic
les
Su
b t
ota
lP
lan
t a
nd
To
tal
fre
eh
old
bu
ild
ing
on
ma
ch
ine
ryIn
sta
lla
tio
ns
eq
uip
me
nt
fitt
ing
se
qu
ipm
en
tsm
ach
ine
ryLa
nd
fre
eh
old
la
nd
(Ru
pe
es i
n t
ho
usa
nd
s)
At
30
Ju
ne
20
10
Cost
3,1
92
148,7
78
43,4
78
1,2
56,3
59
31,0
69
4,5
74
2,7
44
3,6
83
21,6
68
1,5
15,5
45
35,0
00
1,5
50,5
45
Acc
um
ula
ted d
epre
ciation
-(4
9,7
52)
(13,7
02)
(631,2
68)
(17,
073)
(3,3
44)
(1,4
70)
(2,6
99)
(9,5
86)
(728,8
94)
(12,6
11)
(741,5
05)
Net
book
valu
e3,1
92
99,0
26
29,7
76
625,0
91
13,9
96
1,2
30
1,2
74
984
12,0
82
786,6
51
22,3
89
809,0
40
Ye
ar
en
de
d 3
0 J
un
e 2
01
1
Openin
g n
et
book
valu
e3,1
92
99,0
26
29,7
76
625,0
91
13,9
96
1,2
30
1,2
74
984
12,0
82
786,6
51
22,3
89
809,0
40
Additio
ns
--
-29,0
77
--
--
15,0
49
44,1
26
-44,1
26
Dis
posa
ls:
Cost
--
--
--
--
(4,9
99)
(4,9
99)
-(4
,999)
Acc
um
ula
ted d
epre
ciation
--
--
--
--
2,0
18
2,0
18
-2,0
18
--
--
--
--
(2,9
81)
(2,9
81)
-(2
,981)
Transf
err
ed f
rom
lease
d a
ssets
:Cost
--
-35,0
00
--
--
-35,0
00
(35,0
00)
-Acc
um
ula
ted d
epre
ciation
--
-(1
3,7
30)
--
--
-(1
3,7
30)
13,7
30
-
--
-21,2
70
--
--
-21,2
70
(21,2
70)
-
Depre
ciation c
harg
e-
(4,9
51)
(1,4
89)
(64,1
35)
(1,4
00)
(123)
(127)
(98)
(4,6
87)
(77,
010)
(1,1
19)
(78,1
29)
Clo
sing n
et
book
valu
e3,1
92
94,0
75
28,2
87
611,3
03
12,5
96
1,1
07
1,1
47
886
19,4
63
772,0
56
-772,0
56
At
30
Ju
ne
20
11
Cost
3,1
92
148,7
78
43,4
78
1,3
20,4
36
31,0
69
4,5
74
2,7
44
3,6
83
31,7
18
1,5
89,6
72
-1,5
89,6
72
Acc
um
ula
ted d
epre
ciation
-(5
4,7
03)
(15,1
91)
(709,1
33)
(18,4
73)
(3,4
67)
(1,5
97)
(2,7
97)
(12,2
55)
(817,
616)
-(8
17,
616)
Net
book
valu
e3,1
92
94,0
75
28,2
87
611,3
03
12,5
96
1,1
07
1,1
47
886
19,4
63
772,0
56
-772,0
56
Ye
ar
en
de
d 3
0 J
un
e 2
01
2
Openin
g n
et
book
valu
e
3,1
92
94,0
75
28,2
87
611,3
03
12,5
96
1,1
07
1,1
47
886
19,4
63
772,0
56
-772,0
56
Additio
ns
--
-31,7
92
--
--
1,0
62
32,8
54
-32,8
54
Dis
posa
ls:
Cost
--
-(9
,766)
-(1
,966)
(1,8
44)
(3,6
83)
(1,0
26)
(18,2
85)
-(1
8,2
85)
Acc
um
ula
ted d
epre
ciation
--
-5,6
25
-1,7
95
1,2
85
2,8
78
747
12,3
30
-12,3
30
--
-(4
,141)
-(1
71)
(559)
(805)
(279)
(5,9
55)
-(5
,955)
Depre
ciation c
harg
e-
(4,7
04)
(1,4
14)
(61,4
73)
(1,2
61)
(109)
(110)
(81)
(3,9
72)
(73,1
24)
-(7
3,1
24)
Clo
sing n
et
book
valu
e3,1
92
89,3
71
26,8
73
577,
481
11,3
35
827
478
-16,2
74
725,8
31
-725,8
31
At
30
Ju
ne
20
12
Cost
3,1
92
148,7
78
43,4
78
1,3
42,4
62
31,0
69
2,6
08
900
-31,7
54
1,6
04,2
41
-1,6
04,2
41
Acc
um
ula
ted d
epre
ciation
-(5
9,4
07)
(16,6
05)
(764,9
81)
(19,7
34)
(1,7
81)
(422)
-(1
5,4
80)
(878,4
10)
-(8
78,4
10)
Net
book
valu
e3,1
92
89,3
71
26,8
73
577,
481
11,3
35
827
478
-16,2
74
725,8
31
-725,8
31
An
nu
al
rate
of
de
pre
cia
tio
n (
%)
-5
510
10
10
10
10
20
10
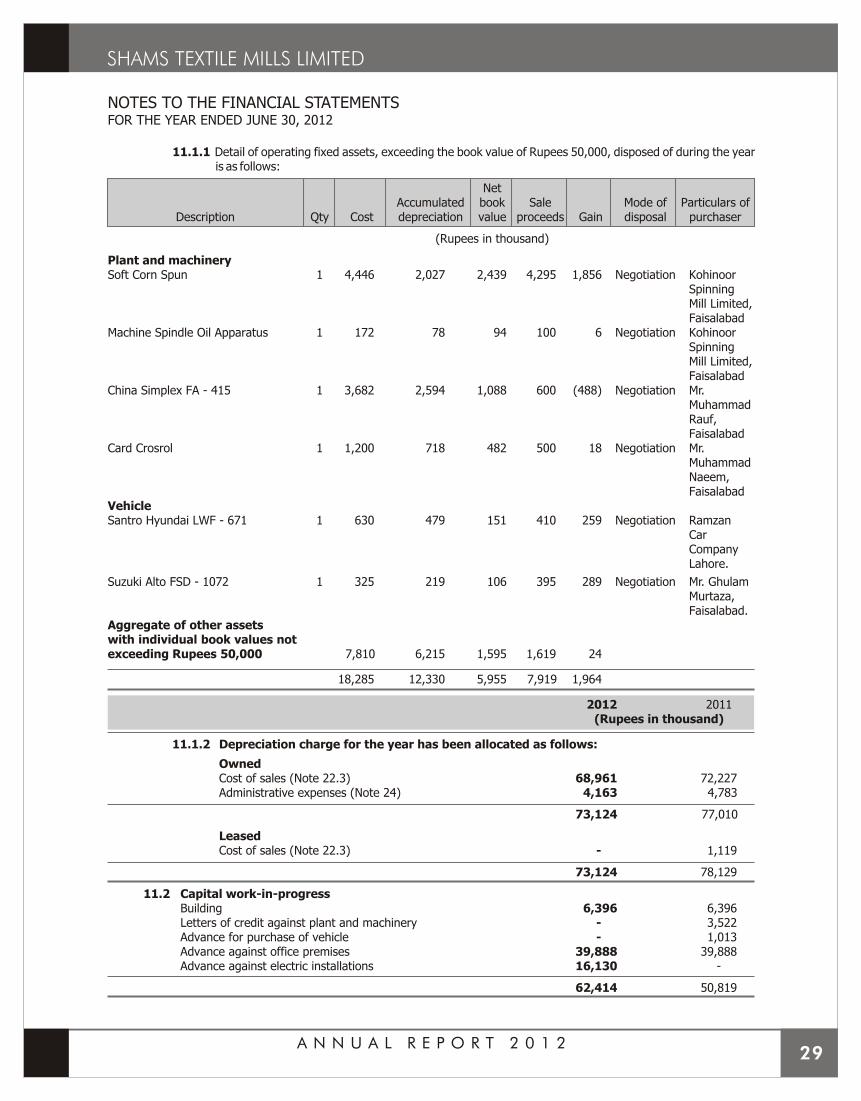
NOTES TO THE FINANCIAL STATEMENTSFOR THE YEAR ENDED JUNE 30, 2012
11.1.1 Detail of operating fixed assets, exceeding the book value of Rupees 50,000, disposed of during the year is as follows:
NetAccumulated book Sale Mode of Particulars of
Description Qty Cost depreciation value proceeds Gain disposal purchaser
(Rupees in thousand)
Plant and machinerySoft Corn Spun 1 4,446 2,027 2,439 4,295 1,856 Negotiation Kohinoor
SpinningMill Limited,Faisalabad
Machine Spindle Oil Apparatus 1 172 78 94 100 6 Negotiation KohinoorSpinningMill Limited,Faisalabad
China Simplex FA - 415 1 3,682 2,594 1,088 600 (488) Negotiation Mr.MuhammadRauf,Faisalabad
Card Crosrol 1 1,200 718 482 500 18 Negotiation Mr.MuhammadNaeem,Faisalabad
VehicleSantro Hyundai LWF - 671 1 630 479 151 410 259 Negotiation Ramzan
CarCompanyLahore.
Suzuki Alto FSD - 1072 1 325 219 106 395 289 Negotiation Mr. GhulamMurtaza,Faisalabad.
Aggregate of other assets with individual book values notexceeding Rupees 50,000 7,810 6,215 1,595 1,619 24
18,285 12,330 5,955 7,919 1,964
2012 2011(Rupees in thousand)
11.1.2 Depreciation charge for the year has been allocated as follows:
OwnedCost of sales (Note 22.3) 68,961 72,227Administrative expenses (Note 24) 4,163 4,783
73,124 77,010
LeasedCost of sales (Note 22.3) - 1,119
73,124 78,129
11.2 Capital work-in-progressBuilding 6,396 6,396Letters of credit against plant and machinery - 3,522Advance for purchase of vehicle - 1,013Advance against office premises 39,888 39,888Advance against electric installations 16,130 -
62,414 50,819
A N N U A L R E P O R T 2 0 1 229

NOTES TO THE FINANCIAL STATEMENTSFOR THE YEAR ENDED JUNE 30, 2012
2012 2011(Rupees in thousand)
12. LONG TERM SECURITY DEPOSITS
12.1 These represents security deposits with utility companies against utility connections.
13. STORES, SPARE PARTS AND LOOSE TOOLS
Stores 12,148 16,579Spare parts 51,664 43,094Loose tools 239 223
64,051 59,896Less: Provision for slow moving and obsolete items (Note 13.1) (7,422) (7,889)
56,629 52,007
13.1 Provision for slow moving and obsolete items
Balance as on 01 July 7,889 7,889Less: Provision reversed during the year 467 -
Balance as on 30 June 7,422 7,889
14. STOCK-IN-TRADE
Raw materials 206,405 117,448Work-in-process 24,089 16,101Finished goods (Note 14.2 and 14.3) 157,608 617,327Waste stock 11,699 3,803
399,801 754,679
14.1 Stock-in-trade of Rupees 41.580 million (2011: Rupees 726.847 million) is being valued at net realizable value.
14.2 Finished goods include stock held with third party of Rupees 0.520 million (2011: Rupees 17.970 million) in the ordinary course of business.
14.3 Finished goods include stock in transit of NIL (2011: Rupees 36.99 million).
14.4 The carrying value of stock in trade pledged with banking companies against short term borrowings is Rupees 89.798 million (2011: Rupees 56 million). Detail of the corresponding borrowings are disclosed in note 9 to the financial statements.
14.5 The aggregate amount of write-down of inventories to net realizable value recognized during the year was Rupees 10.512 million (2011: Rupees 135.276 million)
15. TRADE DEBTS
Considered good:
Secured (against letters of credit) 61,426 -Unsecured 86,389 93,753
147,815 93,753
15.1 As at 30 June 2012, trade debts of Rupees 82.780 million (2011: Rupees 41.976 million) were past due but not impaired. These relate to a number of independent customers from whom there is no recent history of default. The age analysis of these trade debts is as follows:
Upto 1 month 66,302 1,6671 to 6 months 3,486 18,800More than 6 months 12,992 21,509
82,780 41,976
A N N U A L R E P O R T 2 0 1 230
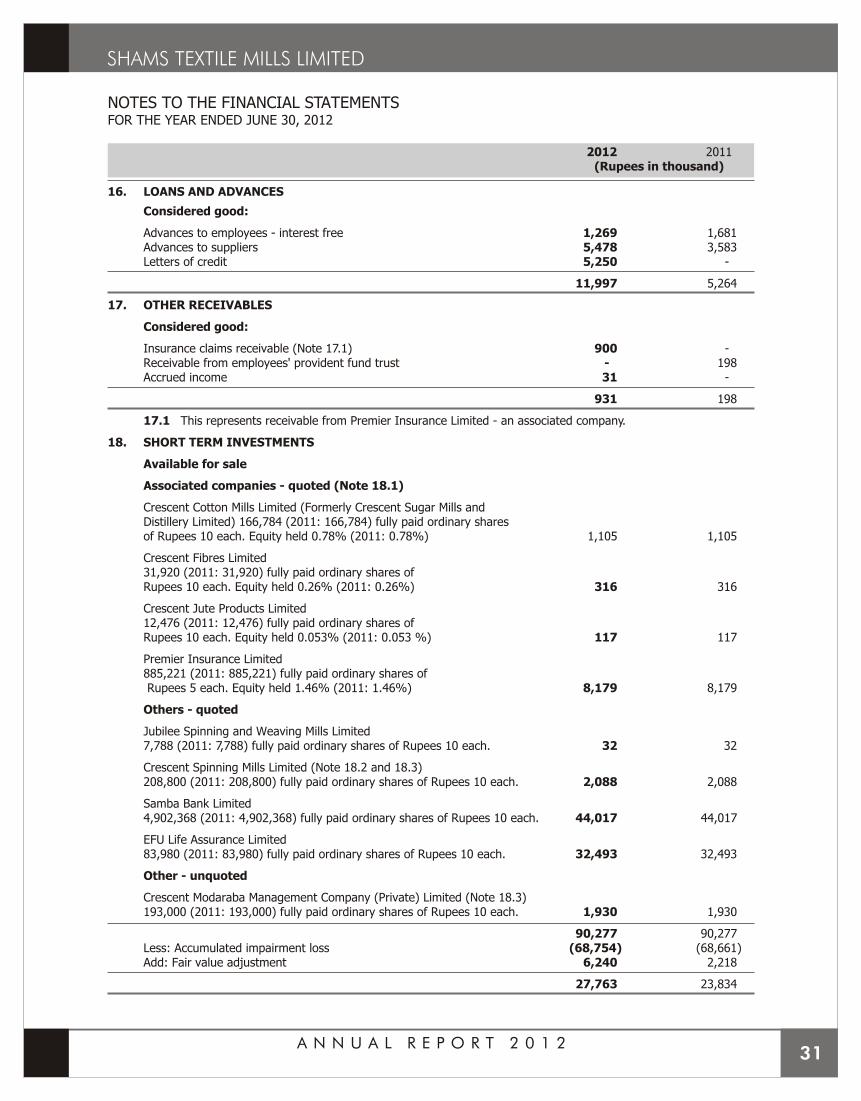
NOTES TO THE FINANCIAL STATEMENTSFOR THE YEAR ENDED JUNE 30, 2012
2012 2011(Rupees in thousand)
16. LOANS AND ADVANCES
Considered good:
Advances to employees - interest free 1,269 1,681Advances to suppliers 5,478 3,583Letters of credit 5,250 -
11,997 5,264
17. OTHER RECEIVABLES
Considered good:
Insurance claims receivable (Note 17.1) 900 -Receivable from employees' provident fund trust - 198Accrued income 31 -
931 198
17.1 This represents receivable from Premier Insurance Limited - an associated company.
18. SHORT TERM INVESTMENTS
Available for sale
Associated companies - quoted (Note 18.1)
Crescent Cotton Mills Limited (Formerly Crescent Sugar Mills and Distillery Limited) 166,784 (2011: 166,784) fully paid ordinary shares of Rupees 10 each. Equity held 0.78% (2011: 0.78%) 1,105 1,105
Crescent Fibres Limited31,920 (2011: 31,920) fully paid ordinary shares ofRupees 10 each. Equity held 0.26% (2011: 0.26%) 316 316
Crescent Jute Products Limited12,476 (2011: 12,476) fully paid ordinary shares ofRupees 10 each. Equity held 0.053% (2011: 0.053 %) 117 117
Premier Insurance Limited885,221 (2011: 885,221) fully paid ordinary shares of Rupees 5 each. Equity held 1.46% (2011: 1.46%) 8,179 8,179
Others - quoted
Jubilee Spinning and Weaving Mills Limited7,788 (2011: 7,788) fully paid ordinary shares of Rupees 10 each. 32 32
Crescent Spinning Mills Limited (Note 18.2 and 18.3)208,800 (2011: 208,800) fully paid ordinary shares of Rupees 10 each. 2,088 2,088
Samba Bank Limited4,902,368 (2011: 4,902,368) fully paid ordinary shares of Rupees 10 each. 44,017 44,017
EFU Life Assurance Limited83,980 (2011: 83,980) fully paid ordinary shares of Rupees 10 each. 32,493 32,493
Other - unquoted
Crescent Modaraba Management Company (Private) Limited (Note 18.3)193,000 (2011: 193,000) fully paid ordinary shares of Rupees 10 each. 1,930 1,930
90,277 90,277Less: Accumulated impairment loss (68,754) (68,661)Add: Fair value adjustment 6,240 2,218
27,763 23,834
A N N U A L R E P O R T 2 0 1 231
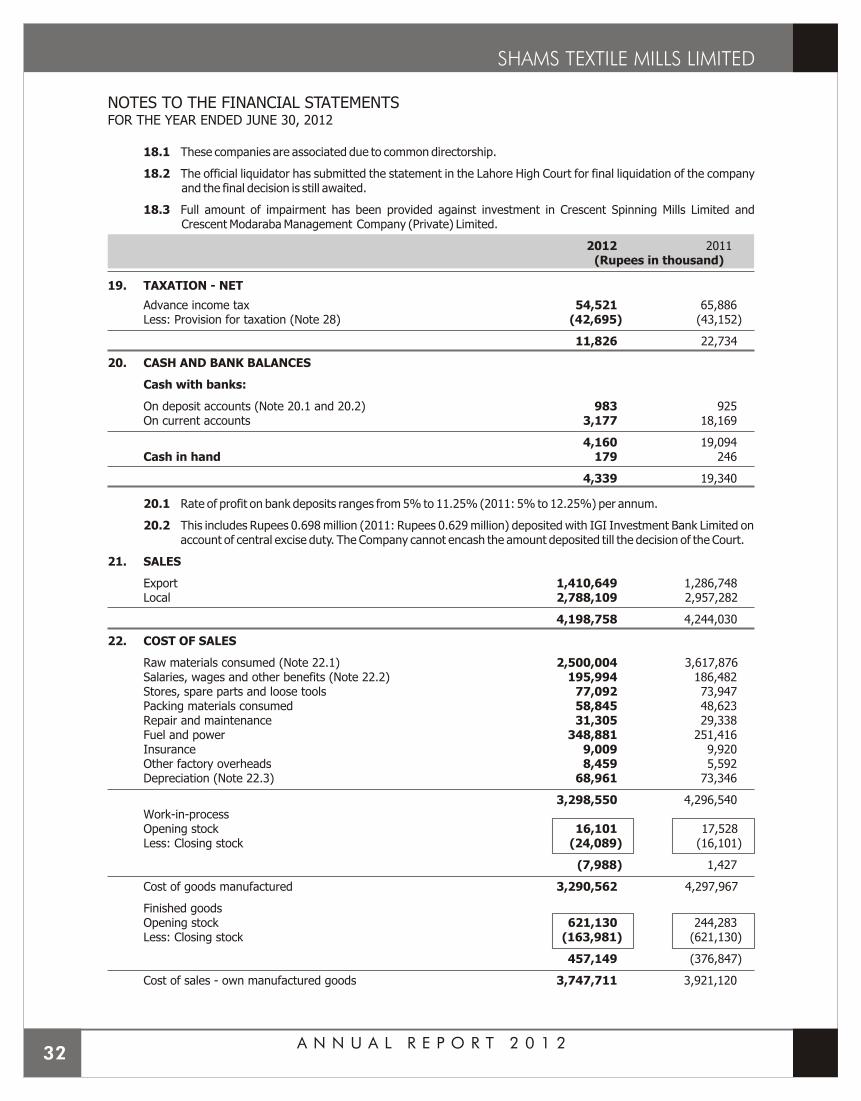
NOTES TO THE FINANCIAL STATEMENTSFOR THE YEAR ENDED JUNE 30, 2012
18.1 These companies are associated due to common directorship.
18.2 The official liquidator has submitted the statement in the Lahore High Court for final liquidation of the company and the final decision is still awaited.
18.3 Full amount of impairment has been provided against investment in Crescent Spinning Mills Limited and Crescent Modaraba Management Company (Private) Limited.
2012 2011(Rupees in thousand)
19. TAXATION - NET
Advance income tax 54,521 65,886Less: Provision for taxation (Note 28) (42,695) (43,152)
11,826 22,734
20. CASH AND BANK BALANCES
Cash with banks:
On deposit accounts (Note 20.1 and 20.2) 983 925On current accounts 3,177 18,169
4,160 19,094Cash in hand 179 246
4,339 19,340
20.1 Rate of profit on bank deposits ranges from 5% to 11.25% (2011: 5% to 12.25%) per annum.
20.2 This includes Rupees 0.698 million (2011: Rupees 0.629 million) deposited with IGI Investment Bank Limited on account of central excise duty. The Company cannot encash the amount deposited till the decision of the Court.
21. SALES
Export 1,410,649 1,286,748Local 2,788,109 2,957,282
4,198,758 4,244,030
22. COST OF SALES
Raw materials consumed (Note 22.1) 2,500,004 3,617,876Salaries, wages and other benefits (Note 22.2) 195,994 186,482Stores, spare parts and loose tools 77,092 73,947Packing materials consumed 58,845 48,623Repair and maintenance 31,305 29,338Fuel and power 348,881 251,416Insurance 9,009 9,920Other factory overheads 8,459 5,592Depreciation (Note 22.3) 68,961 73,346
3,298,550 4,296,540Work-in-processOpening stock 16,101 17,528Less: Closing stock (24,089) (16,101)
(7,988) 1,427
Cost of goods manufactured 3,290,562 4,297,967
Finished goodsOpening stock 621,130 244,283Less: Closing stock (163,981) (621,130)
457,149 (376,847)
Cost of sales - own manufactured goods 3,747,711 3,921,120
A N N U A L R E P O R T 2 0 1 232
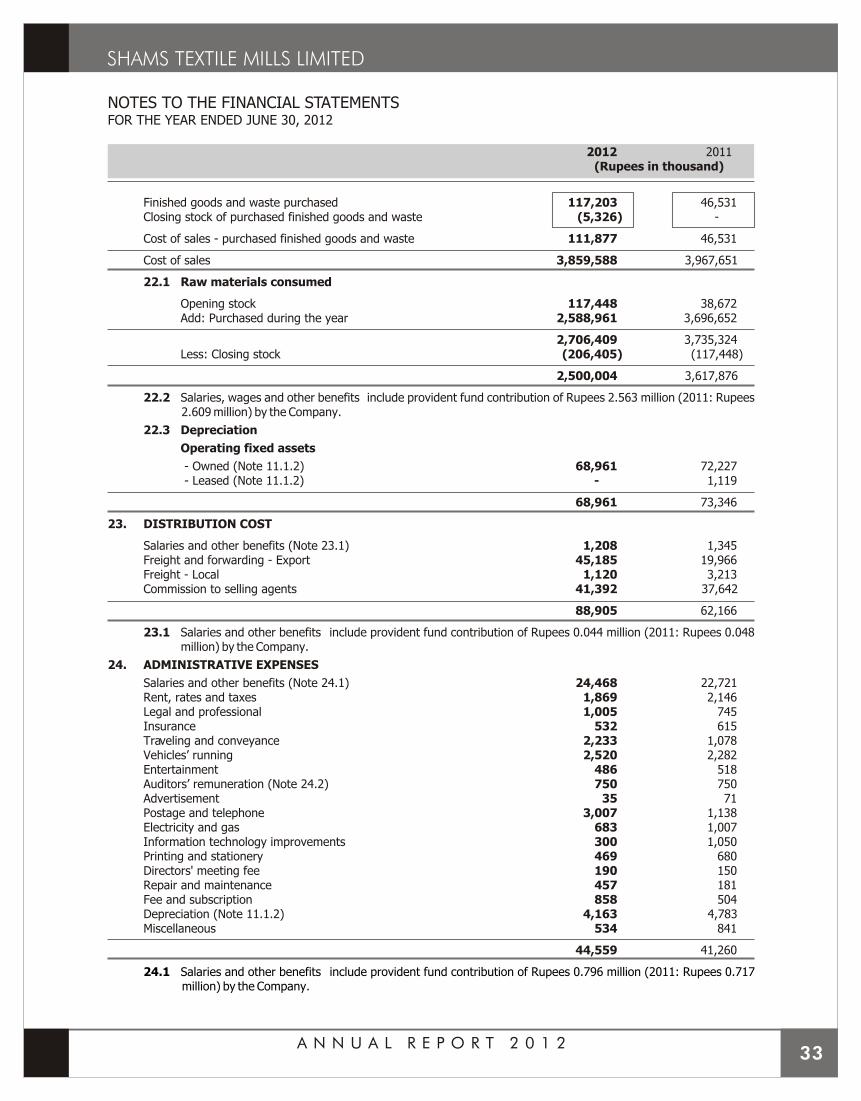
NOTES TO THE FINANCIAL STATEMENTSFOR THE YEAR ENDED JUNE 30, 2012
2012 2011(Rupees in thousand)
Finished goods and waste purchased 117,203 46,531Closing stock of purchased finished goods and waste (5,326) -
Cost of sales - purchased finished goods and waste 111,877 46,531
Cost of sales 3,859,588 3,967,651
22.1 Raw materials consumed
Opening stock 117,448 38,672Add: Purchased during the year 2,588,961 3,696,652
2,706,409 3,735,324Less: Closing stock (206,405) (117,448)
2,500,004 3,617,876
22.2 Salaries, wages and other benefits include provident fund contribution of Rupees 2.563 million (2011: Rupees 2.609 million) by the Company.
22.3 Depreciation
Operating fixed assets
- Owned (Note 11.1.2) 68,961 72,227 - Leased (Note 11.1.2) - 1,119
68,961 73,346
23. DISTRIBUTION COST
Salaries and other benefits (Note 23.1) 1,208 1,345Freight and forwarding - Export 45,185 19,966Freight - Local 1,120 3,213Commission to selling agents 41,392 37,642
88,905 62,166
23.1 Salaries and other benefits include provident fund contribution of Rupees 0.044 million (2011: Rupees 0.048 million) by the Company.
24. ADMINISTRATIVE EXPENSES
Salaries and other benefits (Note 24.1) 24,468 22,721Rent, rates and taxes 1,869 2,146Legal and professional 1,005 745Insurance 532 615Traveling and conveyance 2,233 1,078Vehicles’ running 2,520 2,282Entertainment 486 518Auditors’ remuneration (Note 24.2) 750 750Advertisement 35 71Postage and telephone 3,007 1,138Electricity and gas 683 1,007Information technology improvements 300 1,050Printing and stationery 469 680
Directors' meeting fee 190 150Repair and maintenance 457 181
Fee and subscription 858 504Depreciation (Note 11.1.2) 4,163 4,783Miscellaneous 534 841
44,559 41,260
24.1 Salaries and other benefits include provident fund contribution of Rupees 0.796 million (2011: Rupees 0.717 million) by the Company.
A N N U A L R E P O R T 2 0 1 233
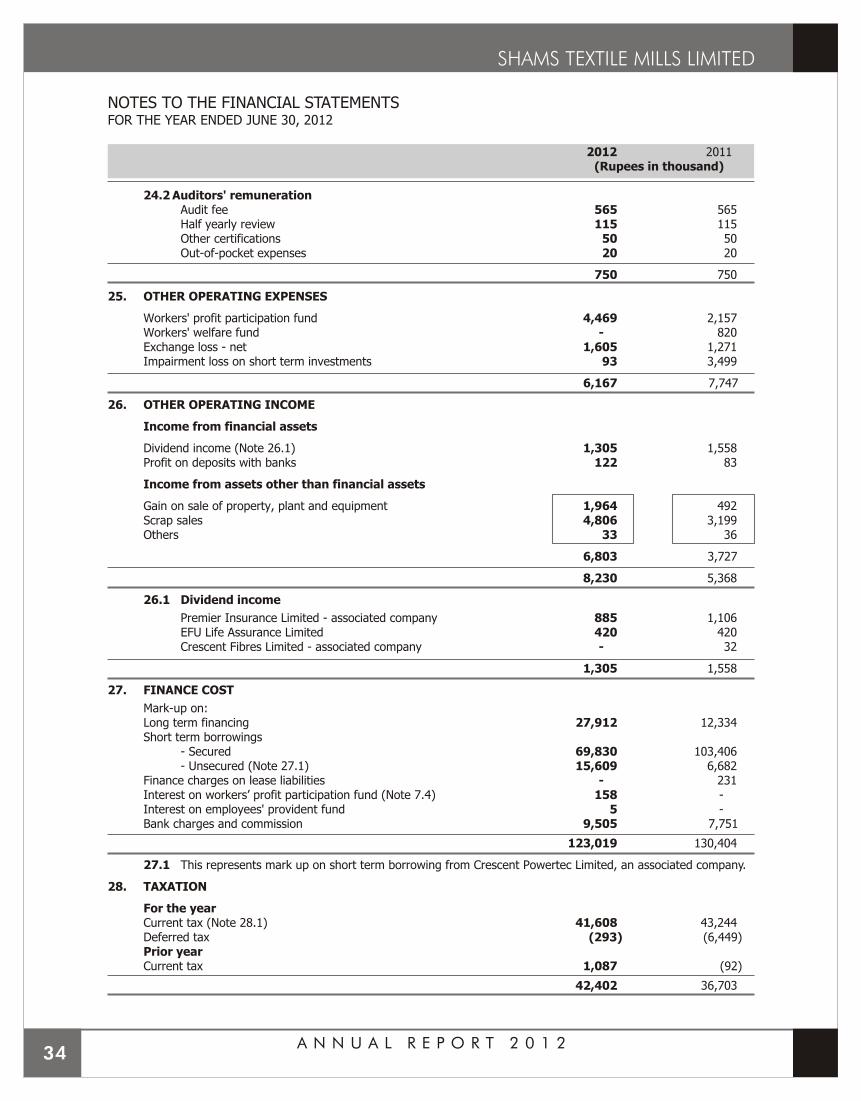
A N N U A L R E P O R T 2 0 1 234
NOTES TO THE FINANCIAL STATEMENTSFOR THE YEAR ENDED JUNE 30, 2012
2012 2011(Rupees in thousand)
24.2 Auditors' remunerationAudit fee 565 565Half yearly review 115 115Other certifications 50 50Out-of-pocket expenses 20 20
750 750
25. OTHER OPERATING EXPENSES
Workers' profit participation fund 4,469 2,157Workers' welfare fund - 820Exchange loss - net 1,605 1,271Impairment loss on short term investments 93 3,499
6,167 7,747
26. OTHER OPERATING INCOME
Income from financial assets
Dividend income (Note 26.1) 1,305 1,558Profit on deposits with banks 122 83
Income from assets other than financial assets
Gain on sale of property, plant and equipment 1,964 492Scrap sales 4,806 3,199Others 33 36
6,803 3,727
8,230 5,368
26.1 Dividend income
Premier Insurance Limited - associated company 885 1,106EFU Life Assurance Limited 420 420Crescent Fibres Limited - associated company - 32
1,305 1,558
27. FINANCE COST
Mark-up on:Long term financing 27,912 12,334Short term borrowings
- Secured 69,830 103,406- Unsecured (Note 27.1) 15,609 6,682
Finance charges on lease liabilities - 231Interest on workers’ profit participation fund (Note 7.4) 158 -Interest on employees' provident fund 5 -Bank charges and commission 9,505 7,751
123,019 130,404
27.1 This represents mark up on short term borrowing from Crescent Powertec Limited, an associated company.
28. TAXATION
For the yearCurrent tax (Note 28.1) 41,608 43,244Deferred tax (293) (6,449)Prior yearCurrent tax 1,087 (92)
42,402 36,703
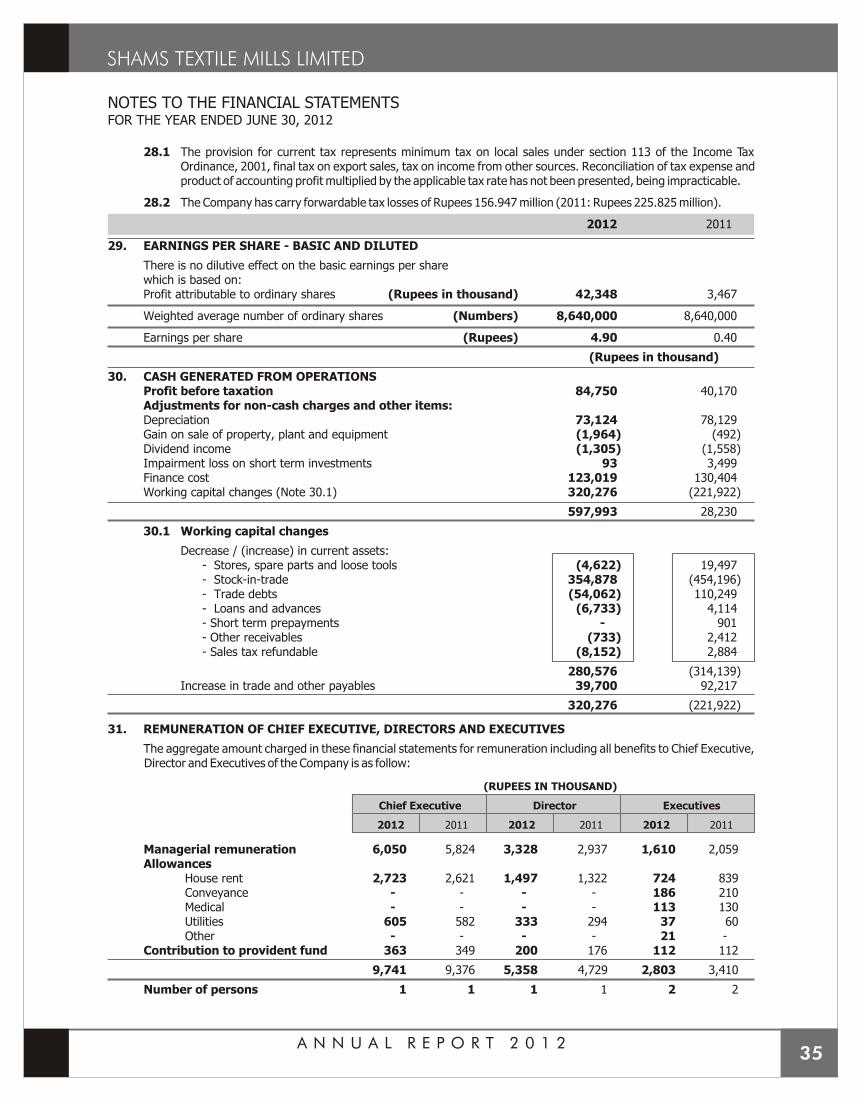
A N N U A L R E P O R T 2 0 1 235
NOTES TO THE FINANCIAL STATEMENTSFOR THE YEAR ENDED JUNE 30, 2012
28.1 The provision for current tax represents minimum tax on local sales under section 113 of the Income Tax Ordinance, 2001, final tax on export sales, tax on income from other sources. Reconciliation of tax expense and product of accounting profit multiplied by the applicable tax rate has not been presented, being impracticable.
28.2 The Company has carry forwardable tax losses of Rupees 156.947 million (2011: Rupees 225.825 million).
2012 2011
29. EARNINGS PER SHARE - BASIC AND DILUTED
There is no dilutive effect on the basic earnings per sharewhich is based on:Profit attributable to ordinary shares (Rupees in thousand) 42,348 3,467
Weighted average number of ordinary shares (Numbers) 8,640,000 8,640,000
Earnings per share (Rupees) 4.90 0.40
(Rupees in thousand)
30. CASH GENERATED FROM OPERATIONSProfit before taxation 84,750 40,170Adjustments for non-cash charges and other items:Depreciation 73,124 78,129Gain on sale of property, plant and equipment (1,964) (492)Dividend income (1,305) (1,558)Impairment loss on short term investments 93 3,499Finance cost 123,019 130,404Working capital changes (Note 30.1) 320,276 (221,922)
597,993 28,230
30.1 Working capital changes
Decrease / (increase) in current assets:- Stores, spare parts and loose tools (4,622) 19,497- Stock-in-trade 354,878 (454,196)- Trade debts (54,062) 110,249- Loans and advances (6,733) 4,114- Short term prepayments - 901- Other receivables (733) 2,412- Sales tax refundable (8,152) 2,884
280,576 (314,139)Increase in trade and other payables 39,700 92,217
320,276 (221,922)
31. REMUNERATION OF CHIEF EXECUTIVE, DIRECTORS AND EXECUTIVES
The aggregate amount charged in these financial statements for remuneration including all benefits to Chief Executive, Director and Executives of the Company is as follow:
(RUPEES IN THOUSAND)
Chief Executive Director Executives
2012 2011 2012 2011 2012 2011
Managerial remuneration 6,050 5,824 3,328 2,937 1,610 2,059Allowances
House rent 2,723 2,621 1,497 1,322 724 839Conveyance - - - - 186 210Medical - - - - 113 130Utilities 605 582 333 294 37 60Other - - - - 21 -
Contribution to provident fund 363 349 200 176 112 112
9,741 9,376 5,358 4,729 2,803 3,410
Number of persons 1 1 1 1 2 2
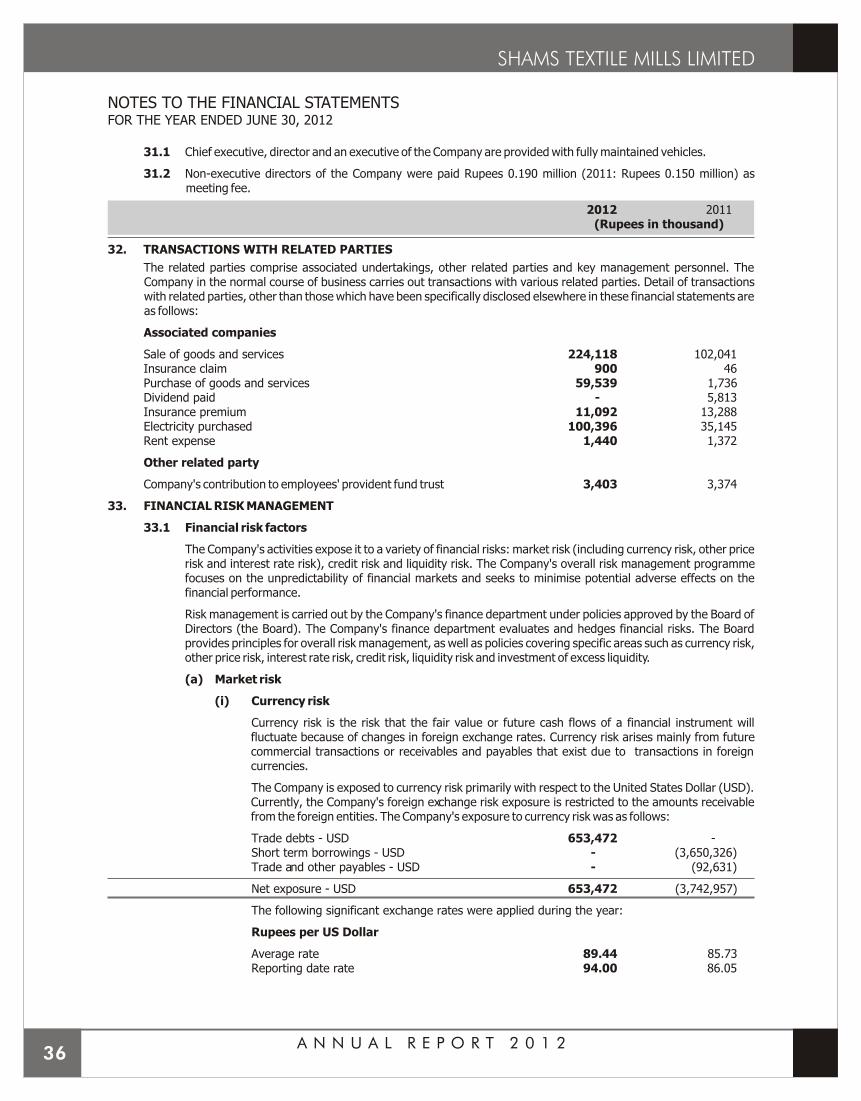
NOTES TO THE FINANCIAL STATEMENTSFOR THE YEAR ENDED JUNE 30, 2012
31.1 Chief executive, director and an executive of the Company are provided with fully maintained vehicles.
31.2 Non-executive directors of the Company were paid Rupees 0.190 million (2011: Rupees 0.150 million) as meeting fee.
2012 2011(Rupees in thousand)
32. TRANSACTIONS WITH RELATED PARTIES
The related parties comprise associated undertakings, other related parties and key management personnel. The Company in the normal course of business carries out transactions with various related parties. Detail of transactions with related parties, other than those which have been specifically disclosed elsewhere in these financial statements are as follows:
Associated companies
Sale of goods and services 224,118 102,041Insurance claim 900 46Purchase of goods and services 59,539 1,736Dividend paid - 5,813Insurance premium 11,092 13,288Electricity purchased 100,396 35,145Rent expense 1,440 1,372
Other related party
Company's contribution to employees' provident fund trust 3,403 3,374
33. FINANCIAL RISK MANAGEMENT
33.1 Financial risk factors
The Company's activities expose it to a variety of financial risks: market risk (including currency risk, other price risk and interest rate risk), credit risk and liquidity risk. The Company's overall risk management programme focuses on the unpredictability of financial markets and seeks to minimise potential adverse effects on the financial performance.
Risk management is carried out by the Company's finance department under policies approved by the Board of Directors (the Board). The Company's finance department evaluates and hedges financial risks. The Board provides principles for overall risk management, as well as policies covering specific areas such as currency risk, other price risk, interest rate risk, credit risk, liquidity risk and investment of excess liquidity.
(a) Market risk
(i) Currency risk
Currency risk is the risk that the fair value or future cash flows of a financial instrument will fluctuate because of changes in foreign exchange rates. Currency risk arises mainly from future commercial transactions or receivables and payables that exist due to transactions in foreign currencies.
The Company is exposed to currency risk primarily with respect to the United States Dollar (USD). Currently, the Company's foreign exchange risk exposure is restricted to the amounts receivable from the foreign entities. The Company's exposure to currency risk was as follows:
Trade debts - USD 653,472 -Short term borrowings - USD - (3,650,326)Trade and other payables - USD - (92,631)
Net exposure - USD 653,472 (3,742,957)
The following significant exchange rates were applied during the year:
Rupees per US Dollar
Average rate 89.44 85.73Reporting date rate 94.00 86.05
A N N U A L R E P O R T 2 0 1 236
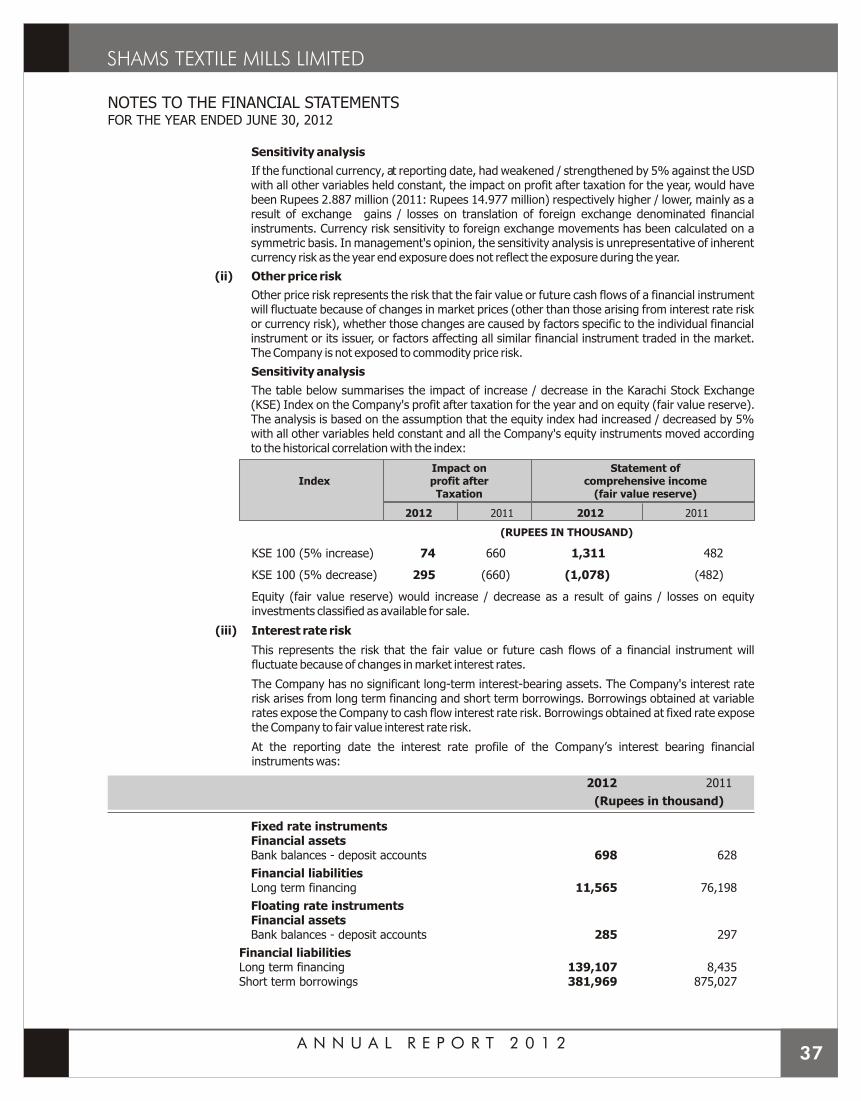
NOTES TO THE FINANCIAL STATEMENTSFOR THE YEAR ENDED JUNE 30, 2012
Sensitivity analysis
If the functional currency, at reporting date, had weakened / strengthened by 5% against the USD with all other variables held constant, the impact on profit after taxation for the year, would have been Rupees 2.887 million (2011: Rupees 14.977 million) respectively higher / lower, mainly as a result of exchange gains / losses on translation of foreign exchange denominated financial instruments. Currency risk sensitivity to foreign exchange movements has been calculated on a symmetric basis. In management's opinion, the sensitivity analysis is unrepresentative of inherent currency risk as the year end exposure does not reflect the exposure during the year.
(ii) Other price risk
Other price risk represents the risk that the fair value or future cash flows of a financial instrument will fluctuate because of changes in market prices (other than those arising from interest rate risk or currency risk), whether those changes are caused by factors specific to the individual financial instrument or its issuer, or factors affecting all similar financial instrument traded in the market. The Company is not exposed to commodity price risk.
Sensitivity analysis
The table below summarises the impact of increase / decrease in the Karachi Stock Exchange (KSE) Index on the Company's profit after taxation for the year and on equity (fair value reserve). The analysis is based on the assumption that the equity index had increased / decreased by 5% with all other variables held constant and all the Company's equity instruments moved according to the historical correlation with the index:
Impact on Statement of Index profit after comprehensive income
Taxation (fair value reserve)
2012 2011 2012 2011
(RUPEES IN THOUSAND)
KSE 100 (5% increase) 74 660 1,311 482
KSE 100 (5% decrease) 295 (660) (1,078) (482)
Equity (fair value reserve) would increase / decrease as a result of gains / losses on equity investments classified as available for sale.
(iii) Interest rate risk
This represents the risk that the fair value or future cash flows of a financial instrument will fluctuate because of changes in market interest rates.
The Company has no significant long-term interest-bearing assets. The Company's interest rate risk arises from long term financing and short term borrowings. Borrowings obtained at variable rates expose the Company to cash flow interest rate risk. Borrowings obtained at fixed rate expose the Company to fair value interest rate risk.
At the reporting date the interest rate profile of the Company’s interest bearing financial instruments was:
2012 2011
(Rupees in thousand)
Fixed rate instrumentsFinancial assetsBank balances - deposit accounts 698 628
Financial liabilitiesLong term financing 11,565 76,198
Floating rate instrumentsFinancial assetsBank balances - deposit accounts 285 297
Financial liabilitiesLong term financing 139,107 8,435Short term borrowings 381,969 875,027
A N N U A L R E P O R T 2 0 1 237
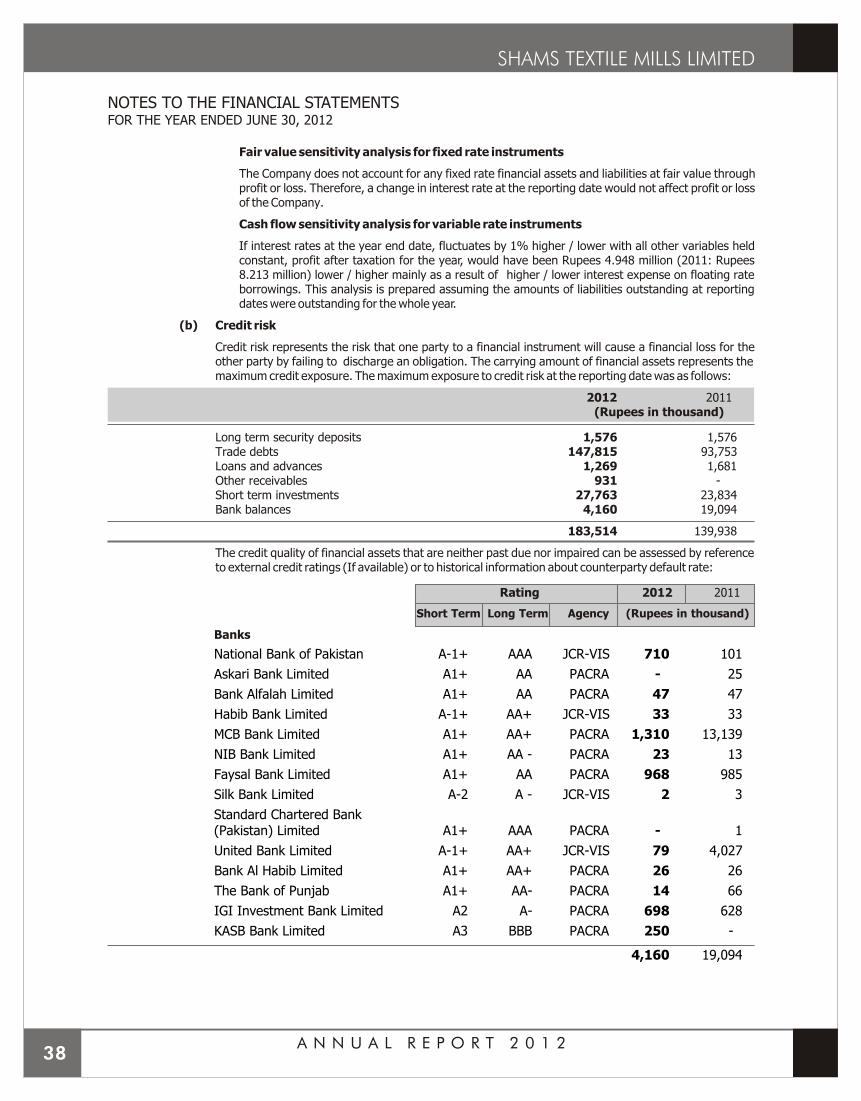
NOTES TO THE FINANCIAL STATEMENTSFOR THE YEAR ENDED JUNE 30, 2012
Fair value sensitivity analysis for fixed rate instruments
The Company does not account for any fixed rate financial assets and liabilities at fair value through profit or loss. Therefore, a change in interest rate at the reporting date would not affect profit or loss of the Company.
Cash flow sensitivity analysis for variable rate instruments
If interest rates at the year end date, fluctuates by 1% higher / lower with all other variables held constant, profit after taxation for the year, would have been Rupees 4.948 million (2011: Rupees 8.213 million) lower / higher mainly as a result of higher / lower interest expense on floating rate borrowings. This analysis is prepared assuming the amounts of liabilities outstanding at reporting dates were outstanding for the whole year.
(b) Credit risk
Credit risk represents the risk that one party to a financial instrument will cause a financial loss for the other party by failing to discharge an obligation. The carrying amount of financial assets represents the maximum credit exposure. The maximum exposure to credit risk at the reporting date was as follows:
2012 2011(Rupees in thousand)
Long term security deposits 1,576 1,576Trade debts 147,815 93,753Loans and advances 1,269 1,681Other receivables 931 -Short term investments 27,763 23,834Bank balances 4,160 19,094
183,514 139,938
The credit quality of financial assets that are neither past due nor impaired can be assessed by reference to external credit ratings (If available) or to historical information about counterparty default rate:
Rating 2012 2011
Short Term Long Term Agency (Rupees in thousand)
Banks
National Bank of Pakistan A-1+ AAA JCR-VIS 710 101
Askari Bank Limited A1+ AA PACRA - 25
Bank Alfalah Limited A1+ AA PACRA 47 47
Habib Bank Limited A-1+ AA+ JCR-VIS 33 33
MCB Bank Limited A1+ AA+ PACRA 1,310 13,139
NIB Bank Limited A1+ AA - PACRA 23 13
Faysal Bank Limited A1+ AA PACRA 968 985
Silk Bank Limited A-2 A - JCR-VIS 2 3
Standard Chartered Bank (Pakistan) Limited A1+ AAA PACRA - 1
United Bank Limited A-1+ AA+ JCR-VIS 79 4,027
Bank Al Habib Limited A1+ AA+ PACRA 26 26
The Bank of Punjab A1+ AA- PACRA 14 66
IGI Investment Bank Limited A2 A- PACRA 698 628
KASB Bank Limited A3 BBB PACRA 250 -
4,160 19,094
A N N U A L R E P O R T 2 0 1 238
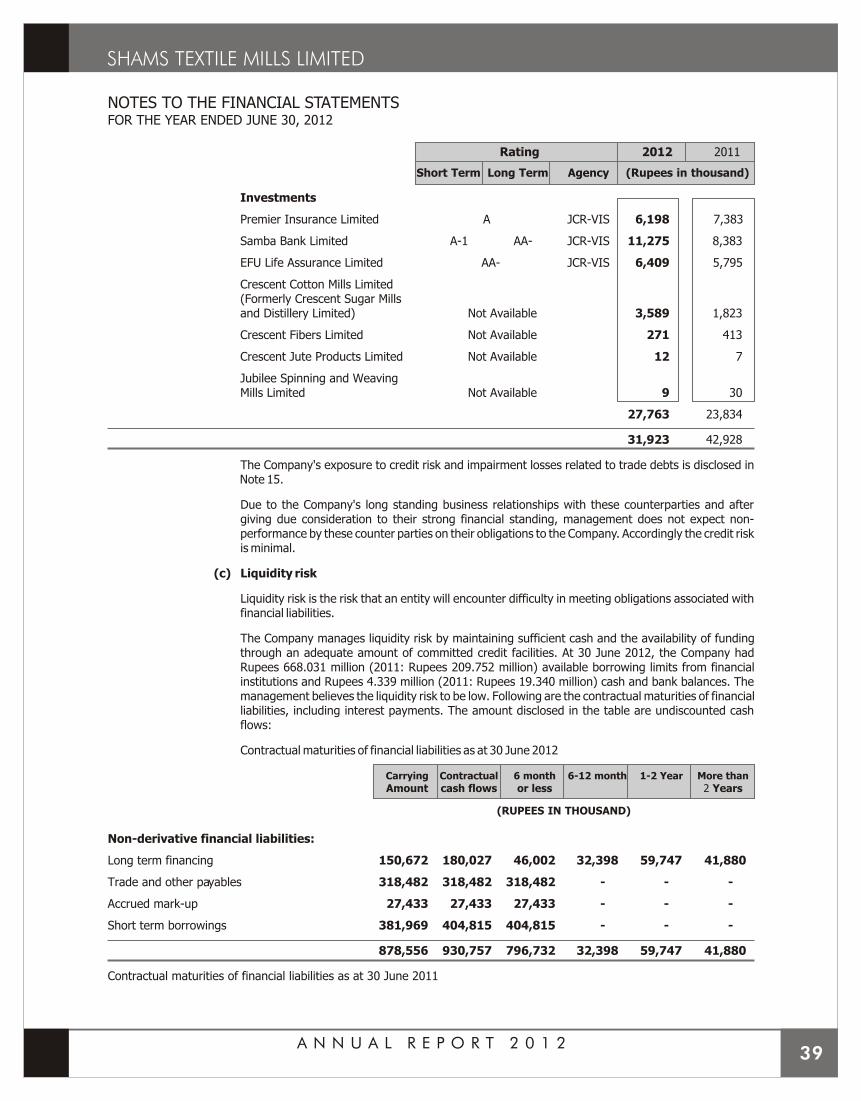
NOTES TO THE FINANCIAL STATEMENTSFOR THE YEAR ENDED JUNE 30, 2012
Rating 2012 2011
Short Term Long Term Agency (Rupees in thousand)
Investments
Premier Insurance Limited A JCR-VIS 6,198 7,383
Samba Bank Limited A-1 AA- JCR-VIS 11,275 8,383
EFU Life Assurance Limited AA- JCR-VIS 6,409 5,795
Crescent Cotton Mills Limited (Formerly Crescent Sugar Millsand Distillery Limited) Not Available 3,589 1,823
Crescent Fibers Limited Not Available 271 413
Crescent Jute Products Limited Not Available 12 7
Jubilee Spinning and WeavingMills Limited Not Available 9 30
27,763 23,834
31,923 42,928
The Company's exposure to credit risk and impairment losses related to trade debts is disclosed in Note 15.
Due to the Company's long standing business relationships with these counterparties and after giving due consideration to their strong financial standing, management does not expect non-performance by these counter parties on their obligations to the Company. Accordingly the credit risk is minimal.
(c) Liquidity risk
Liquidity risk is the risk that an entity will encounter difficulty in meeting obligations associated with financial liabilities.
The Company manages liquidity risk by maintaining sufficient cash and the availability of funding through an adequate amount of committed credit facilities. At 30 June 2012, the Company had Rupees 668.031 million (2011: Rupees 209.752 million) available borrowing limits from financial institutions and Rupees 4.339 million (2011: Rupees 19.340 million) cash and bank balances. The management believes the liquidity risk to be low. Following are the contractual maturities of financial liabilities, including interest payments. The amount disclosed in the table are undiscounted cash flows:
Contractual maturities of financial liabilities as at 30 June 2012
Carrying Contractual 6 month 6-12 month 1-2 Year More than
Amount cash flows or less 2 Years
(RUPEES IN THOUSAND)
Non-derivative financial liabilities:
Long term financing 150,672 180,027 46,002 32,398 59,747 41,880
Trade and other payables 318,482 318,482 318,482 - - -
Accrued mark-up 27,433 27,433 27,433 - - -
Short term borrowings 381,969 404,815 404,815 - - -
878,556 930,757 796,732 32,398 59,747 41,880
Contractual maturities of financial liabilities as at 30 June 2011
A N N U A L R E P O R T 2 0 1 239
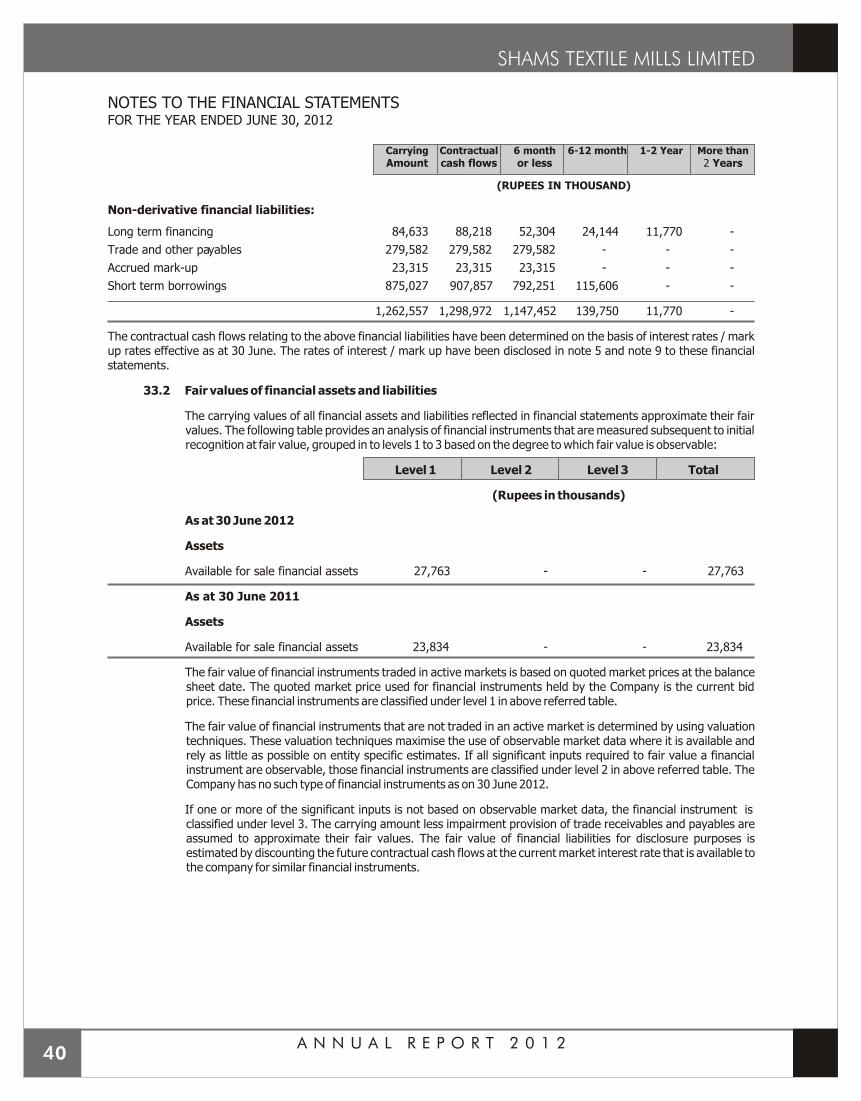
NOTES TO THE FINANCIAL STATEMENTSFOR THE YEAR ENDED JUNE 30, 2012
Carrying Contractual 6 month 6-12 month 1-2 Year More than
Amount cash flows or less 2 Years
(RUPEES IN THOUSAND)
Non-derivative financial liabilities:
Long term financing 84,633 88,218 52,304 24,144 11,770 -
Trade and other payables 279,582 279,582 279,582 - - -
Accrued mark-up 23,315 23,315 23,315 - - -
Short term borrowings 875,027 907,857 792,251 115,606 - -
1,262,557 1,298,972 1,147,452 139,750 11,770 -
The contractual cash flows relating to the above financial liabilities have been determined on the basis of interest rates / mark up rates effective as at 30 June. The rates of interest / mark up have been disclosed in note 5 and note 9 to these financial statements.
33.2 Fair values of financial assets and liabilities
The carrying values of all financial assets and liabilities reflected in financial statements approximate their fair values. The following table provides an analysis of financial instruments that are measured subsequent to initial recognition at fair value, grouped in to levels 1 to 3 based on the degree to which fair value is observable:
Level 1 Level 2 Level 3 Total
(Rupees in thousands)
As at 30 June 2012
Assets
Available for sale financial assets 27,763 - - 27,763
As at 30 June 2011
Assets
Available for sale financial assets 23,834 - - 23,834
The fair value of financial instruments traded in active markets is based on quoted market prices at the balance sheet date. The quoted market price used for financial instruments held by the Company is the current bid price. These financial instruments are classified under level 1 in above referred table.
The fair value of financial instruments that are not traded in an active market is determined by using valuation techniques. These valuation techniques maximise the use of observable market data where it is available and rely as little as possible on entity specific estimates. If all significant inputs required to fair value a financial instrument are observable, those financial instruments are classified under level 2 in above referred table. The Company has no such type of financial instruments as on 30 June 2012.
If one or more of the significant inputs is not based on observable market data, the financial instrument is classified under level 3. The carrying amount less impairment provision of trade receivables and payables are assumed to approximate their fair values. The fair value of financial liabilities for disclosure purposes is estimated by discounting the future contractual cash flows at the current market interest rate that is available to the company for similar financial instruments.
A N N U A L R E P O R T 2 0 1 240
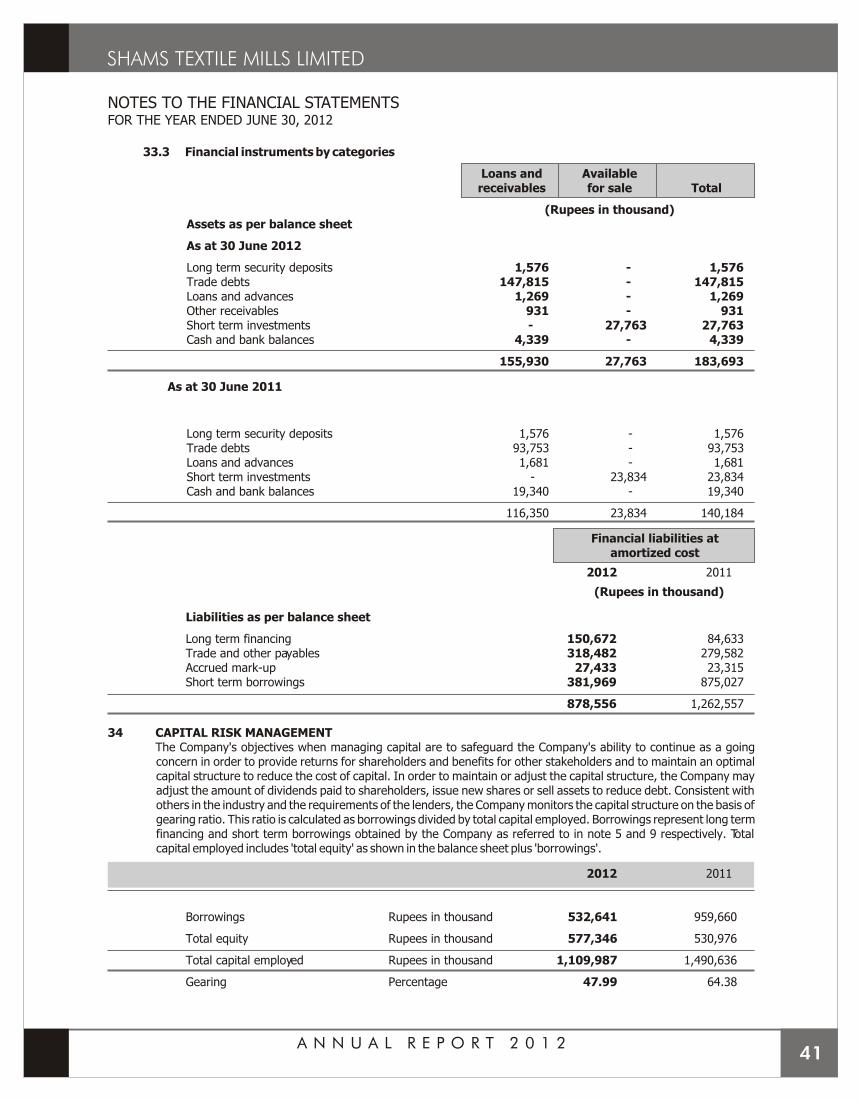
NOTES TO THE FINANCIAL STATEMENTSFOR THE YEAR ENDED JUNE 30, 2012
33.3 Financial instruments by categories
Loans and Availablereceivables for sale Total
(Rupees in thousand)Assets as per balance sheet
As at 30 June 2012
Long term security deposits 1,576 - 1,576Trade debts 147,815 - 147,815Loans and advances 1,269 - 1,269Other receivables 931 - 931Short term investments - 27,763 27,763Cash and bank balances 4,339 - 4,339
155,930 27,763 183,693
As at 30 June 2011
Long term security deposits 1,576 - 1,576Trade debts 93,753 - 93,753Loans and advances 1,681 - 1,681Short term investments - 23,834 23,834Cash and bank balances 19,340 - 19,340
116,350 23,834 140,184
Financial liabilities atamortized cost
2012 2011
(Rupees in thousand)
Liabilities as per balance sheet
Long term financing 150,672 84,633Trade and other payables 318,482 279,582Accrued mark-up 27,433 23,315Short term borrowings 381,969 875,027
878,556 1,262,557
34 CAPITAL RISK MANAGEMENTThe Company's objectives when managing capital are to safeguard the Company's ability to continue as a going concern in order to provide returns for shareholders and benefits for other stakeholders and to maintain an optimal capital structure to reduce the cost of capital. In order to maintain or adjust the capital structure, the Company may adjust the amount of dividends paid to shareholders, issue new shares or sell assets to reduce debt. Consistent with others in the industry and the requirements of the lenders, the Company monitors the capital structure on the basis of gearing ratio. This ratio is calculated as borrowings divided by total capital employed. Borrowings represent long term financing and short term borrowings obtained by the Company as referred to in note 5 and 9 respectively. Total capital employed includes 'total equity' as shown in the balance sheet plus 'borrowings'.
2012 2011
Borrowings Rupees in thousand 532,641 959,660
Total equity Rupees in thousand 577,346 530,976
Total capital employed Rupees in thousand 1,109,987 1,490,636
Gearing Percentage 47.99 64.38
A N N U A L R E P O R T 2 0 1 241
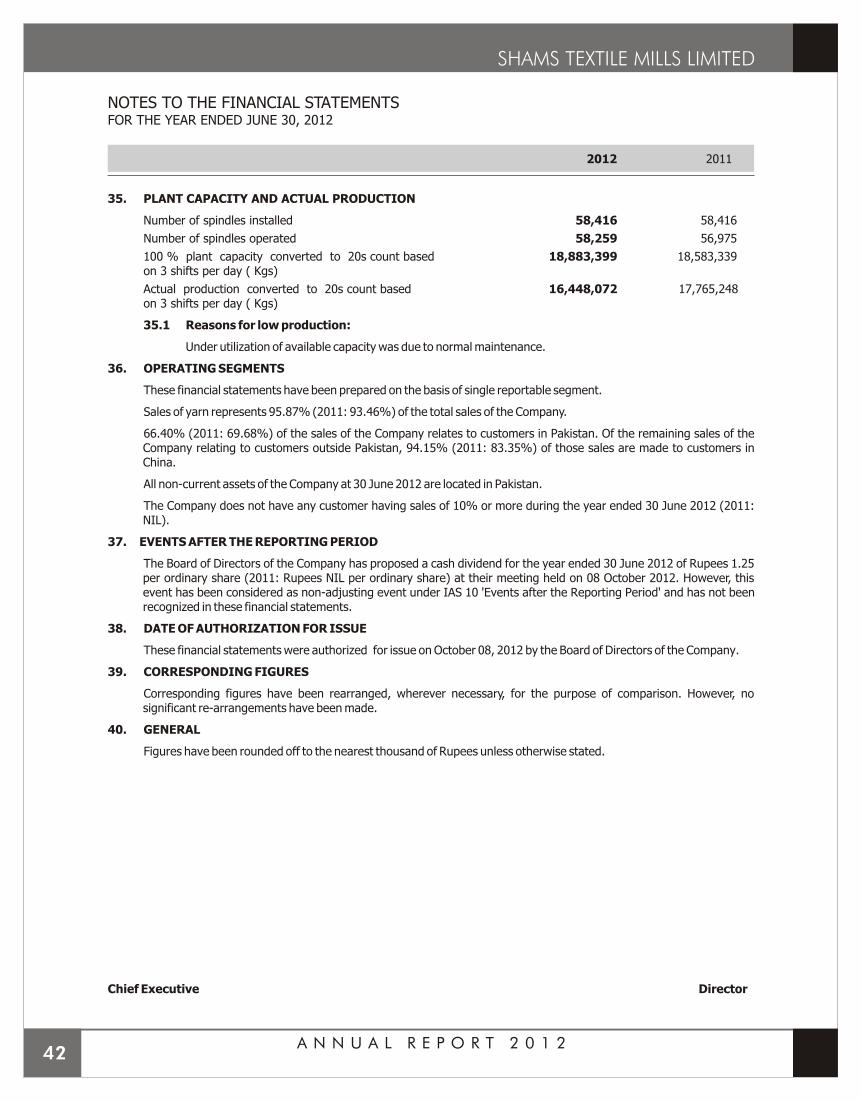
2012 2011
35. PLANT CAPACITY AND ACTUAL PRODUCTION
Number of spindles installed 58,416 58,416
Number of spindles operated 58,259 56,975
100 % plant capacity converted to 20s count based 18,883,399 18,583,339on 3 shifts per day ( Kgs)
Actual production converted to 20s count based 16,448,072 17,765,248on 3 shifts per day ( Kgs)
35.1 Reasons for low production:
Under utilization of available capacity was due to normal maintenance.
36. OPERATING SEGMENTS
These financial statements have been prepared on the basis of single reportable segment.
Sales of yarn represents 95.87% (2011: 93.46%) of the total sales of the Company.
66.40% (2011: 69.68%) of the sales of the Company relates to customers in Pakistan. Of the remaining sales of the Company relating to customers outside Pakistan, 94.15% (2011: 83.35%) of those sales are made to customers in China.
All non-current assets of the Company at 30 June 2012 are located in Pakistan.
The Company does not have any customer having sales of 10% or more during the year ended 30 June 2012 (2011: NIL).
37. EVENTS AFTER THE REPORTING PERIOD
The Board of Directors of the Company has proposed a cash dividend for the year ended 30 June 2012 of Rupees 1.25 per ordinary share (2011: Rupees NIL per ordinary share) at their meeting held on 08 October 2012. However, this event has been considered as non-adjusting event under IAS 10 'Events after the Reporting Period' and has not been recognized in these financial statements.
38. DATE OF AUTHORIZATION FOR ISSUE
These financial statements were authorized for issue on October 08, 2012 by the Board of Directors of the Company.
39. CORRESPONDING FIGURES
Corresponding figures have been rearranged, wherever necessary, for the purpose of comparison. However, no significant re-arrangements have been made.
40. GENERAL
Figures have been rounded off to the nearest thousand of Rupees unless otherwise stated.
Chief Executive Director
NOTES TO THE FINANCIAL STATEMENTSFOR THE YEAR ENDED JUNE 30, 2012
A N N U A L R E P O R T 2 0 1 242
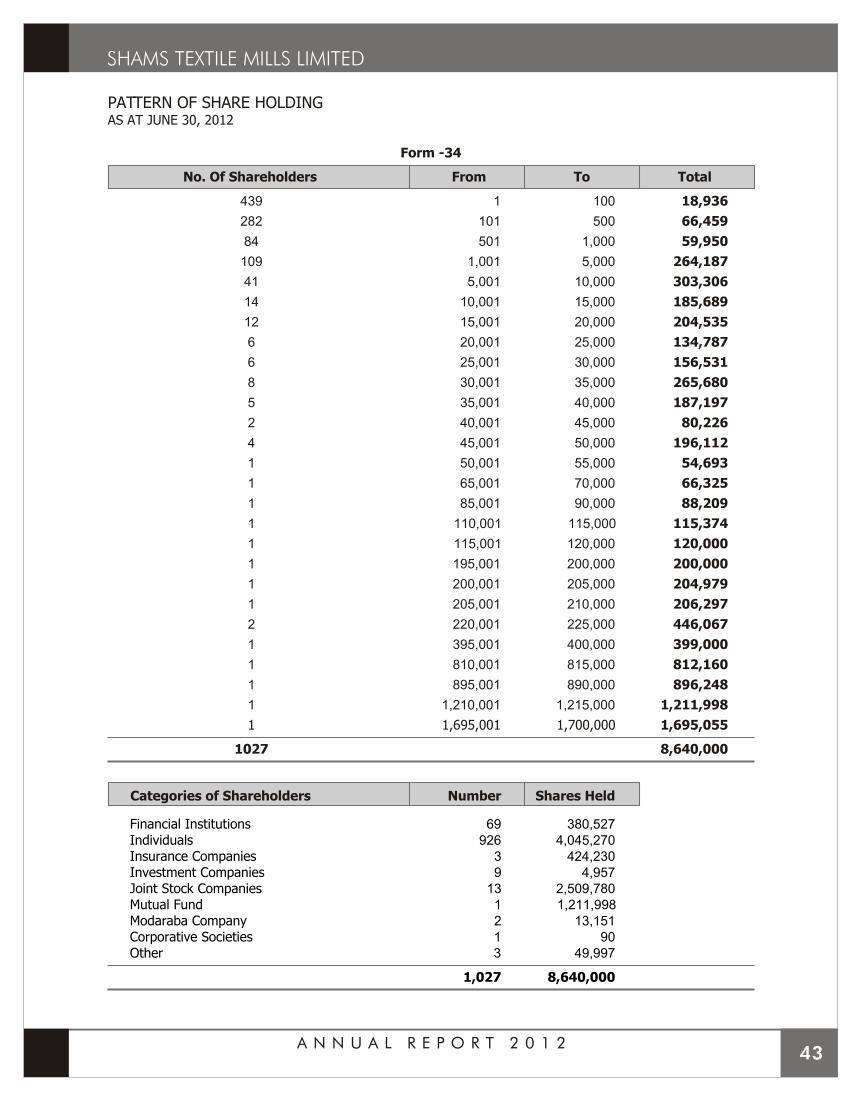
PATTERN OF SHARE HOLDINGAS AT JUNE 30, 2012
Form -34
No. Of Shareholders From To Total
439 1 100 18,936
282 101 500 66,459
84 501 1,000 59,950
109 1,001 5,000 264,187
41 5,001 10,000 303,306
14 10,001 15,000 185,689
12 15,001 20,000 204,535
6 20,001 25,000 134,787
6 25,001 30,000 156,531
8 30,001 35,000 265,680
5 35,001 40,000 187,197
2 40,001 45,000 80,226
4 45,001 50,000 196,112
1 50,001 55,000 54,693
1 65,001 70,000 66,325
1 85,001 90,000 88,209
1 110,001 115,000 115,374
1 115,001 120,000 120,000
1 195,001 200,000 200,000
1 200,001 205,000 204,979
1 205,001 210,000 206,297
2 220,001 225,000 446,067
1 395,001 400,000 399,000
1 810,001 815,000 812,160
1 895,001 890,000 896,248
1 1,210,001 1,215,000 1,211,998
1 1,695,001 1,700,000 1,695,055
1027 8,640,000
Categories of Shareholders Number Shares Held
Financial Institutions 69 380,527Individuals 926 4,045,270Insurance Companies 3 424,230Investment Companies 9 4,957Joint Stock Companies 13 2,509,780Mutual Fund 1 1,211,998Modaraba Company 2 13,151Corporative Societies 1 90Other 3 49,997
1,027 8,640,000
A N N U A L R E P O R T 2 0 1 243
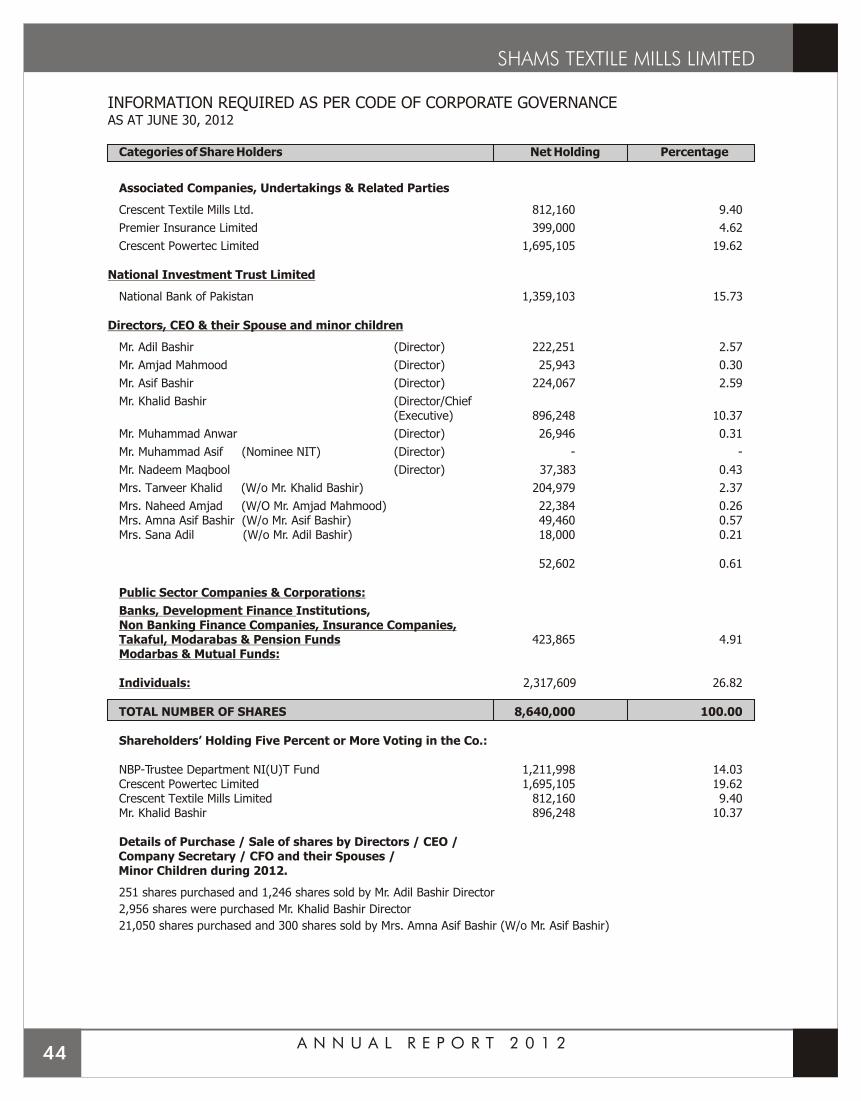
INFORMATION REQUIRED AS PER CODE OF CORPORATE GOVERNANCEAS AT JUNE 30, 2012
Categories of Share Holders Net Holding Percentage
Associated Companies, Undertakings & Related Parties
Crescent Textile Mills Ltd. 812,160 9.40
Premier Insurance Limited 399,000 4.62
Crescent Powertec Limited 1,695,105 19.62
National Investment Trust Limited
National Bank of Pakistan 1,359,103 15.73
Directors, CEO & their Spouse and minor children
Mr. Adil Bashir (Director) 222,251 2.57
Mr. Amjad Mahmood (Director) 25,943 0.30
Mr. Asif Bashir (Director) 224,067 2.59
Mr. Khalid Bashir (Director/Chief(Executive) 896,248 10.37
Mr. Muhammad Anwar (Director) 26,946 0.31
Mr. Muhammad Asif (Nominee NIT) (Director) - -
Mr. Nadeem Maqbool (Director) 37,383 0.43
Mrs. Tanveer Khalid (W/o Mr. Khalid Bashir) 204,979 2.37
Mrs. Naheed Amjad (W/O Mr. Amjad Mahmood) 22,384 0.26Mrs. Amna Asif Bashir (W/o Mr. Asif Bashir) 49,460 0.57Mrs. Sana Adil (W/o Mr. Adil Bashir) 18,000 0.21
52,602 0.61
Public Sector Companies & Corporations:
Banks, Development Finance Institutions,Non Banking Finance Companies, Insurance Companies,Takaful, Modarabas & Pension Funds 423,865 4.91Modarbas & Mutual Funds:
Individuals: 2,317,609 26.82
TOTAL NUMBER OF SHARES 8,640,000 100.00
Shareholders’ Holding Five Percent or More Voting in the Co.:
NBP-Trustee Department NI(U)T Fund 1,211,998 14.03Crescent Powertec Limited 1,695,105 19.62Crescent Textile Mills Limited 812,160 9.40Mr. Khalid Bashir 896,248 10.37
Details of Purchase / Sale of shares by Directors / CEO / Company Secretary / CFO and their Spouses / Minor Children during 2012.
251 shares purchased and 1,246 shares sold by Mr. Adil Bashir Director
2,956 shares were purchased Mr. Khalid Bashir Director
21,050 shares purchased and 300 shares sold by Mrs. Amna Asif Bashir (W/o Mr. Asif Bashir)
A N N U A L R E P O R T 2 0 1 244
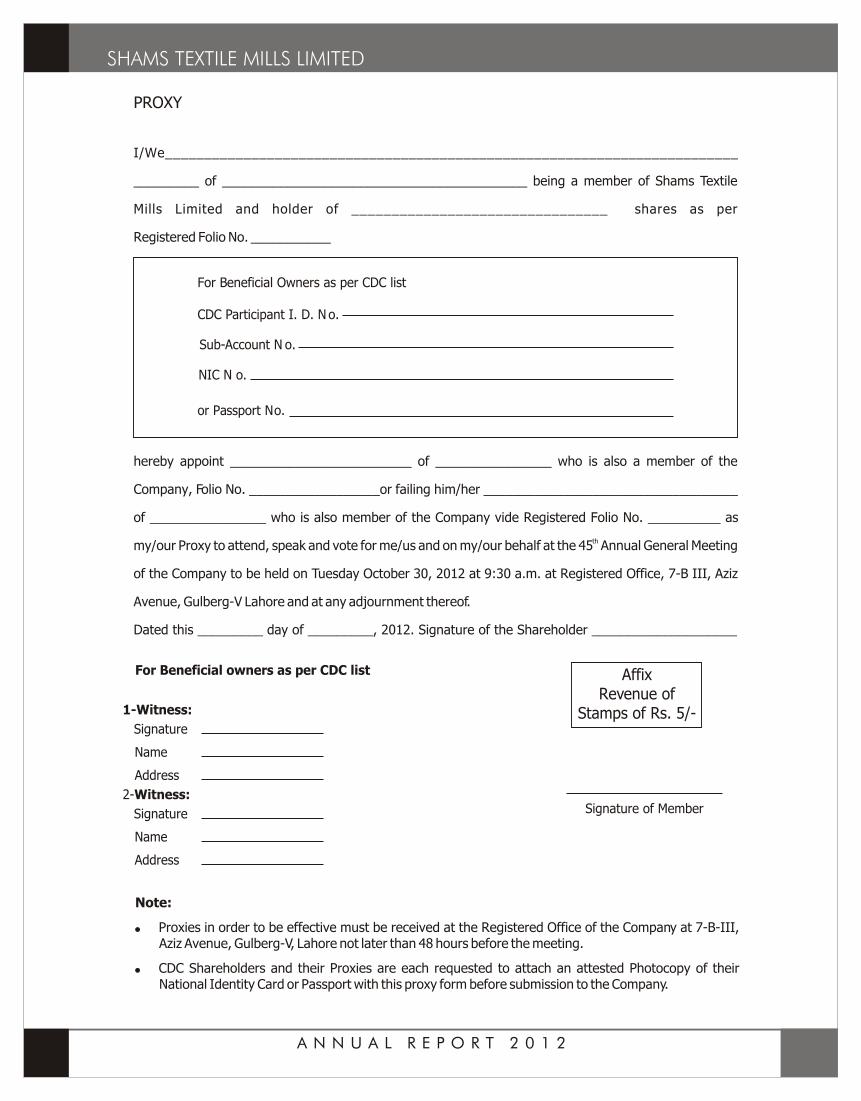
A N N U A L R E P O R T 2 0 1 2
PROXY
I/We_________________________________________________________________________
_________ of __________________________________________ being a member of Shams Textile
Mills Limited and holder of ________________________________ shares as per
Registered Folio No. ___________
hereby appoint _________________________ of ________________ who is also a member of the
Company, Folio No. __________________or failing him/her ___________________________________
of ________________ who is also member of the Company vide Registered Folio No. __________ as
thmy/our Proxy to attend, speak and vote for me/us and on my/our behalf at the 45 Annual General Meeting
of the Company to be held on Tuesday October 30, 2012 at 9:30 a.m. at Registered Office, 7-B III, Aziz
Avenue, Gulberg-V Lahore and at any adjournment thereof.
Dated this _________ day of _________, 2012. Signature of the Shareholder ____________________
AffixRevenue of
Stamps of Rs. 5/-
For Beneficial owners as per CDC list
1-Witness:
Signature
Name
Address
2-Witness:
Signature
Name
Address
For Beneficial Owners as per CDC list
CDC Participant I. D. N o.
Sub-Account N o.
NIC N o.
or Passport N o.
Signature of Member
Note:
! Proxies in order to be effective must be received at the Registered Office of the Company at 7-B-III, Aziz Avenue, Gulberg-V, Lahore not later than 48 hours before the meeting.
! CDC Shareholders and their Proxies are each requested to attach an attested Photocopy of their National Identity Card or Passport with this proxy form before submission to the Company.

Shams Textile Mills Limited
7-B-3, Aziz Avenue, Gulberg 5
Lahore Pakistan
Telephone 92 (42) 3576 0381
Fax: 92 (42) 3576 0376
E-mail: [email protected]
Web: www.shams.com.pk