ANNUAL REPORT - OVS S.p.a. - Corporate Website | Ovs … · 2017-06-22 · to the indirect...
140
ANNUAL REPORT 2016
-
Upload
vuongquynh -
Category
Documents
-
view
216 -
download
0
Transcript of ANNUAL REPORT - OVS S.p.a. - Corporate Website | Ovs … · 2017-06-22 · to the indirect...

ANNUAL REPORT2016


COMPANY INFORMATION
Registered office of the Parent CompanyOVS S.p.A.Via Terraglio n. 17 – 30174Venice - Mestre
Legal details of the Parent Company Authorised share capital €227,000,000.00Subscribed and paid up share capital €227,000,000.00
Venice Companies Register no. 04240010274Tax and VAT code 04240010274Corporate website: www.ovscorporate.it


LETTER TO SHAREHOLDERS
Dear friends and shareholders,
The excellent results achieved by OVS in 2016, despite what remains a challenging market scenario, continue to demonstrate the soundness of our business model. Only the unusual adverse climatic conditions in our major markets of operation – particularly Italy and the rest of Europe – kept us from generating positive like-for-like sales, and thus penalised us at the level of our overall performance.Turnover nonetheless rose by 3.3%, EBITDA by 3.9% and net profit – normalised to reflect certain non-core, non-cash components – by 13.2%.
The development plan for the Italian domestic market moved ahead with determination, resulting in 176 net store openings, including 35 directly operated full-format stores and 141 mainly small franchise stores with a kids format. This allowed us to further increase both our market share, which climbed to 7.4%, and our margins.
In 2016 we also laid solid foundations to continue with our international organic expansion plan, bringing the total number of group brand stores to 176 as a result of 24 net new openings.
In international development, attention should be drawn to the indirect acquisition of a minority interest in Charles Vögele, which with its extensive network of high-quality stores, particularly in Switzerland and Austria, represents an extraordinary opportunity for OVS to expand into attractive nearby markets while taking limited risk.
In addition, the multi-channel approach gained considerable momentum in 2016, through both the additional effort dedicated to our website, which was extended to cover Spain, and the launch of a parallel website dedicated to children, OVS&Kids. Some very promising partnerships were also struck with several marketplaces.
Lastly, a great deal of attention was paid to the sustainability of our actions and to our Company’s most important asset: its people.The Board of Directors approved our first sustainability report, drafted after three years of work and preparatory activities; some salient aspects are discussed below in this document.Our focus on our employees led us to introduce some measures aimed at making company life more comfortable, such as providing all employees with water bottles and installing purified water dispensers, which have already permitted us to cut back on the plastic waste we produce.We adopted a material procurement policy that reduces our impact by preferring more sustainable cotton, whether organically grown or produced through the Better Cotton Initiative. Our participation in this initiative has made us the first Italian brand to make a formal commitment to pursuing a reduced environmental impact through cotton-growing and ensuring better living conditions for cotton farmers. Once fully implemented, LED-based lighting and other energy efficiency initiatives will enable significant energy savings at the more than 400 stores where they have been installed.
An enormous thanks goes out to our customers, for their constant interest in our brands, and to our employees, who see themselves as part of a great tradition of innovation and a drive to improve, of professionalism and competence and, without fail, enthusiasm and team spirit.Our gratitude also goes out to our shareholders for their confidence in our strategies and ability to implement them.
In early 2017 we have continued to consolidate on the Italian market, which is showing some tentative signs of a recovery, through a significant new store opening plan.We will intensify our focus on international growth, through both organic channels, by stepping up new openings, primarily of franchised stores, and inorganic channels. On a related note, it should be mentioned that the summer will see our investee Charles Vögele convert approximately 150 Swiss stores into OVS locations, with a positive impact on our profitability as well as the image of our brand, which is clearly on the road to having a
European presence, in addition to leadership in Italy. Our online presence will continue to grow rapidly, through both our site and penetration of the European market, where we expect to double our total turnover compared to the previous year.
We look to the new year with confidence, due in part to our new commercial and merchandising initiatives. We remain convinced that the soundness of our business model and strategy, and our ability to react and implement, as demonstrated thus far, in response to a constantly changing market, will allow us to achieve further robust and remunerative growth in 2017.
Stefano BeraldoChief Executive Officer


MAIN FIGURES
€ 1,362.6 MLN SALES, + 3.3% GROWTH
€ 186.7 MLN EBITDA, + 3.9% GROWTH
€ 91.8 MLN NET RESULT
1,473 STORES
841,000 SELLING AREA
6,641 EMPLOYEES


CORPORATE OFFICERS
Board of Directors
Nicholas Stathopoulos (2) Chairman
Stefano Beraldo Chief Executive Officer and General Manager
Gabriele Del Torchio (1) (2) Director
Stefano Ferraresi (1) Director
Heinz Jürgen Krogner-Kornalik (1) (2) Director
Jerome Pierre Losson Director
Marvin Teubner (3) Director
Board of Statutory Auditors
Giuseppe Moretti Chairman
Roberto Cortellazzo Wiel Standing Auditor
Lucio Giulio Ricci Standing Auditor
Lorenzo Boer Alternate Auditor
Stefano Lenoci Alternate Auditor
External auditor
PricewaterhouseCoopers S.p.A.
Director responsible for preparing the company’s accounting statements
Nicola Perin
(1) Member of the Control and Risks Committee(2) Member of the Appointments and Remuneration Committee(3) Co-opted by the Board of Directors on 14 April 2016 and confirmed
by the shareholders’ meeting of 25 May 2016

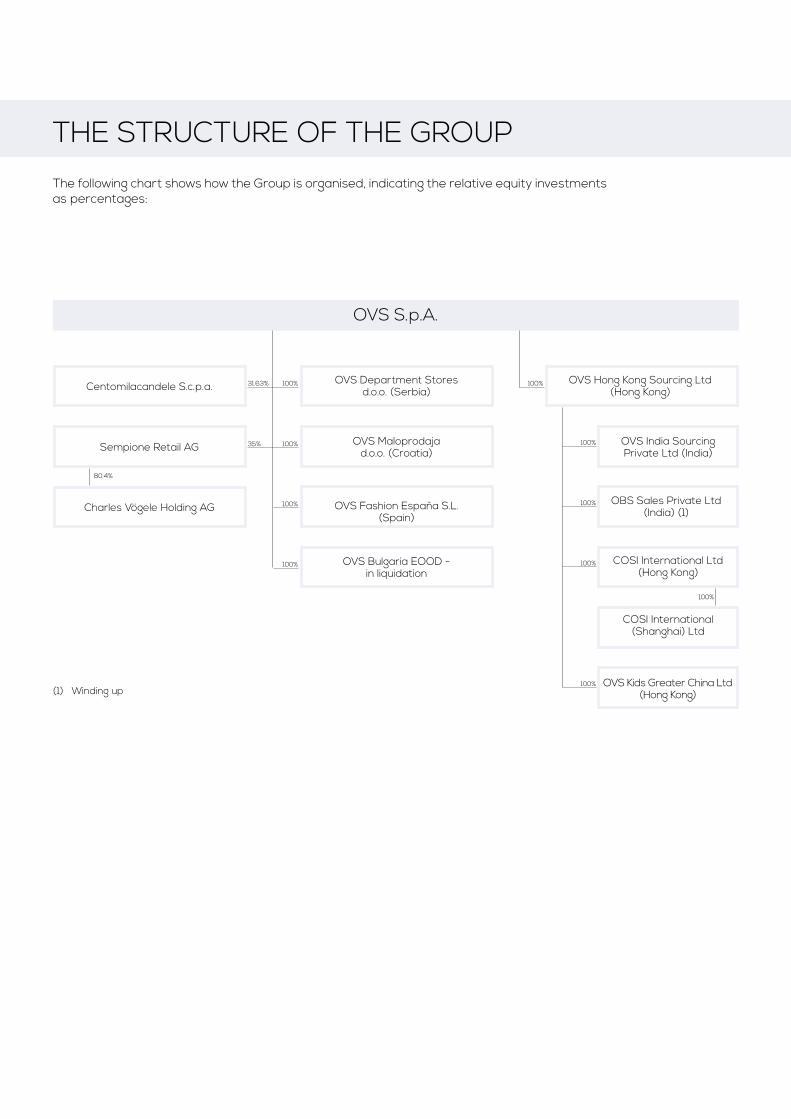
THE STRUCTURE OF THE GROUP
The following chart shows how the Group is organised, indicating the relative equity investments as percentages:
OVS Hong Kong Sourcing Ltd(Hong Kong)
OBS Sales Private Ltd (India) (1)
COSI International Ltd (Hong Kong)
COSI International (Shanghai) Ltd
OVS Kids Greater China Ltd (Hong Kong)
OVS Department Stores d.o.o. (Serbia)
OVS Maloprodaja d.o.o. (Croatia)
OVS Fashion España S.L.(Spain)
OVS Bulgaria EOOD - in liquidation
Centomilacandele S.c.p.a.
Sempione Retail AG
Charles Vögele Holding AG
OVS S.p.A.
OVS India Sourcing Private Ltd (India)
31.63%
35%
100%
100%
100%
100%
100%
100%
100%
100%
100%
100%
(1) Winding up
80.4%


CONTENTS
Report on Operations p.03
Consolidated financial statements at 31 January 2017 p.29
Notes to the consolidated statement of financial position p.63
Notes to the consolidated income statement p.87
Relations with related parties p.97
Appendices to the consolidated financial statements p.107
Independent Auditors’ Report p.115
Separate financial statements of OVS SpA at 31 January 2017 p.119


REPORT ON OPERATIONS

4 OVS SpA
REPORT ON OPERATIONSNote on methodology
To give a clearer representation of the financial performance of the OVS Group, the income statement information shown for 2016 has been adjusted for: i) non-recurring expenses of €2.8 million, mainly related to costs incurred for M&A activities; ii) other normalizing elements relating to the accounting treatment of stock options (“non-cash” expenses of €2.5 million), iii) currency derivatives for which mark-to-market accounting is required (costs of €0.9 million), and iv) amortisation of intangible assets related to PPA (€8.6 million). In the same way, the comparative figures for 2015 do not include: i) non-recurring net income of €9.9 million, mainly deriving from tax entries (€19.7 million relating to the “non-cash” impact of the release of deferred tax liabilities due to the announced reduction in the IRES rate in 2017), partly offset by costs associated with the IPO (€3.6 million) and with the simultaneous refinancing of the company (€6.8 million in financial fees); ii) other normalising elements relating to the accounting treatment of stock options (“non-cash” expenses of €1.4 million) and currency derivatives, for which mark-to-market accounting is required, resulting in high volatility (revenue of €7.2 million) and the relative tax effect (€1.6 million); and iii) amortisation of intangible assets relating to PPA of €8.6 million.
OVS has continued to increase its turnover and share of a market that is generally still weak and in a phase of evolution and change. Growth in EBITDA and net profit.
• Net sales amounted to €1,362.6 million, up 3.3% year-on-year.
• The gross margin (57.7%) grew year-on-year, thanks to close management of commercial leverage and improvements in contractual purchasing conditions.
• EBITDA of €186.7 million and 13.7% as a percentage of net sales, up €7.1 million, or 3.9%, and up by approximately 10 bps as a percentage of sales compared with the previous year
• Net profit of €91.8 million, up €10.7 million (or 13.2%) year-on-year.
• Further network expansion, with the addition of 35 full-format DOS and another 165 stores (mainly Kids Franchising).
• Market share of 7.4% in December 2016 (up 37 bps compared with December 2015), strengthening OVS’s leadership of the Italian market.
• A net financial position of €265.8 million, thanks to an operating cash flow of €75.2 million offset by the following extraordinary cash outflows: i) dividend payment of €34.1 million in June 2016; ii) larger tax cash out, despite the tax rate reduction, due to advance tax payments made in 2016 and not due in the previous year, iii) the disbursement of an investment of €13.8 million to acquire a minority stake in Sempione Retail AG, which now controls Swiss retailer Charles Vögele.
• Proposed total dividend of €34.05 million (€0.15 per share).

5 2016 ANNUAL REPORT
Summary consolidated figures
Information on operations
The Italian economy presented signs of recovery in 2016, with GDP growth of 0.9%. However the political and economic situation remained uncertain. The effects of an initial improvement at macroeconomic level did not translate into an actual recovery in consumption. The Italian clothing market remained difficult, contracting by another 1.6%, with the offline market suffering even more. The many factors characterizing this trend include i) the pressure on margins caused by a continuous search for promotions and discounts; ii) the decline in footfall in stores, iii) the development of on-line channel. On top of this weather conditions were particularly adverse in 2016, affecting almost the entire year, and particularly May (cold and rainy) and September (summer heat), represent key months for seasonal sales.This negative headwinds have been the reason for the negative Like-for-Like performance of the year (-3.2%). OVS once again demonstrated its ability to consolidate its presence in the Italian market, while pursuing its plans for international expansion. During 2016, OVS’ network grew in Italy and abroad by 200 stores (equivalent to +6% of weighted surface), including 35 full-format DOS, while the children’s clothing offering was also expanded through the franchise channel. All new store openings generated positive results, above the Group average. The Group achieved a 7.4% share of the Italian market (up 5% compared with December 2015, in line with the increase in the sales area gained in the same period).
Our e-commerce channel grew strongly, in line with the Group’s strategy: alongside the online website for the Italian market, a new web site entirely dedicated to children’s products was created (www.ovsekids.it). In tandem with the network expansion, we began selling through our e-commerce platform also in Spain. At the same time, we broadened our collaboration with Zalando and LaModa marketplaces, which cover 16 countries in total, including Russia. Overall, sales through the e-commerce channel more than tripled compared with the same period of the previous year, driven by a steady increase in traffic, thanks also to the success of the process undertaken to integrate the retail channel and the e-commerce channel.
The international expansion continued.
On the one hand, the Group pursued its organic growth opening plan to open both children’s clothing stores (OVS Kids and Blukids) and full-format OVS stores; growth was focused on markets where we are already present, like Spain, the Balkan countries and all the Eastern European countries.An even more important non-organic expansion plan also began in 2016, with the investment in a
€mln 31 January 2017 31 January 2016 Chg Chg %Net Sales 1,362.6 1,319.5 43.1 3.3%
EBITDA 186.7 179.6 7.1 3.9%% on net sales 13.7% 13.6%EBIT 136.2 130.0 6.3 4.8%% on net sales 10.0% 9.8%EBT 121.6 114.9 6.7 5.8%% on net sales 8.9% 8.7%Net Profit 91.8 81.1 10.7 13.2%% on net sales 6.7% 6.1%Net Financial Debt 265.8 235.0 30.8 13%Market Share (%) 7.4 7.0 0.4 5.7%

6 OVS SpA
minority stake of Sempione Retail (35%, amounting to CHF 14.1 million), intended to hold 84.8% of Charles Vögele, a Swiss retailer with a network of around 600 stores in various European countries. This project represents a great opportunity for growing and expanding our brands in three rich adjacent markets (Switzerland, Austria and Slovenia). As planned by management, thanks to the continuous diversification of procurement mainly in the Far East, and in particular with the increase in purchase volumes from some Indochina countries, the gross margin could slight improve compared with the previous year, despite the stronger dollar. In terms of the cost dynamic, OVS could perform in confirming its operating leverage levels, with staff costs growing in line with inflation, and savings in rents and utilities, particularly in electricity, thanks to investments in LED technology made in previous years. Activities and related investments to support brand awareness through marketing and advertising campaigns also continued. Our firm commitment to corporate sustainability and corporate social responsibility is also ongoing, and we are publishing this year our first sustainability report.
Looking at the overall results, sales amounted to €1,362.6 million, up 3.3% compared with the same period of last year. The ratio of gross profit to net sales increased by about 50 bps, while EBITDA increased by 3.9% and approximately 10 bps as a percentage of net sales, reaching €186.7 million. Growth in net profit also continued, to €91.8 million or by 13.2% compared with the previous year.
Positive results were recorded for both the Group’s brands despite the adverse market conditions. In particular: i) OVS is consolidating its role as a leader by maintaining a steady pace of network expansion, with a rise in sales of 3%, growth in EBITDA, and EBITDA as a percentage of net sales broadly in line with the previous year and above 14%, while (ii) Upim, thanks to the brand’s repositioning and the focus on the product offering in the family value segment, achieved remarkable results in terms of sales and EBITDA, with respective increases of 4.5% and 27.8%, and EBITDA as a percentage of sales in excess of 10%, demonstrating the success of the strategic direction taken by management. The financial structure of OVS SpA has remained solid and, considering the performance achieved and the future outlook, the company is able to remunerate again this year its shareholders.New fiscal year started very encouragingly. Like-for-like sales trend, performance of newly open and refurbished stores, and new international openings, are performing better that our estimates. Also the activities related to the gradual integration of Charles Vögele business are well on track. A commercial Agreement with Charles Vögele has been signed. The parties agreed to start the progressive conversion of Charles Vögele stores to the OVS (and to a lower extent Upim) format with investments borne by the Swiss company. The plan provides for the conversion of over 300 stores in Switzerland, Austria, Hungary and Slovenia, to the OVS and Upim brands by the end of 2018. The process of disposing a part of the German network is undergoing. Meanwhile, the headquarter downsizing process is well underway: the first redundancy process related to the product development structure has already been accomplished, and the results of the rationalization process are currently in line with forecasts.
OVS will benefit from the payment of royalties equal to 3% of the net sales generated by the stores from the conversion date, as well as from the relevant synergies generated by the increased purchase volumes. The transaction will allow for significant acceleration in the international expansion of OVS, with an extremely limited financial risk. From 16 December 2019, OVS will be able to exercise a call option to purchase another 44.5% stake in Sempione Retail AG at the OVS multiple at the option exercise date, discounted by 25%. In the first months of 2017, pilot stores were opened to test the format and the product offering, in order to gather all the feedback from the various markets, in view of the major conversion phase scheduled to begin in the summer of 2017; the first results and feedbacks are very encouraging. All the most important KPI’s (sales, EBITDA and NFP) are performing better than expected.OVS, with the aim to strengthening its market leadership, will continue to explore opportunities to further consolidate the fragmented Italian apparel market.In view of this, management is looking ahead to the new year with confidence and the conviction for its strategy and believes that its proven ability to execute and react in a constantly changing and increasingly competitive market, will result in sustainable and remunerative growth for our shareholders in 2017.

7 2016 ANNUAL REPORT
Consolidated results
€mln 31 January 2017
31 January 2016 Chg Chg %
Net Sales 1,362.6 1,319.5 43.1 3.3%
Purchases of consumables 576.8 565.0 11.8 2.1%Gross Margin 785.8 754.5 31.3 4.1%GM% 57.7% 57.2%Total operating costs 599.1 574.9 24.2 4.2%EBITDA 186.7 179.6 7.1 3.9%EBITDA% 13.7% 13.6%Depreciation & Amortization 50.4 49.6 0.8 1.6%EBIT 136.2 130.0 6.3 4.8%EBIT % 10.0% 9.8%Net financial (income)/charges 14.6 15.0 (0.4) 0.0%PBT 121.6 114.9 6.7 5.8%Tax 29.8 33.8 (4.1) n.m..Net Profit 91.8 81.1 10.7 13.2%
€mln 31 January 2017 31 January 2016 Chg % Net Sales
OVS 1,150.9 1,116.9 3.0%UPIM 211.7 202.6 4.5% Total Net Sales 1,362.6 1,319.5 3.3%EBITDAOVS 164.3 162.1 1.4%EBITDA margin 14.3% 14.5%UPIM 22.4 17.5 27.8%EBITDA margin 10.6% 8.6% Total EBITDA 186.7 179.6 3.9%EBITDA margin 13.7% 13.6%

8 OVS SpA
Net sales
Total sales increased by €43.1 million, or 3.3%, with a positive contribution from network expansion, while like-for-like sales mainly suffered due to adverse weather conditions and decreased by 3.2%.OVS registered an increase in sales of 3.0% (up €34.0 million), driven by steady development of the direct sales network and accelerated openings of franchised stores. Upim’s trend of growth was further strengthened, with an increase in sales of 4.5% (up €9.1 million), boosted by (i) positive feedback from the public on the brand’s repositioning in terms of format and offering and (ii) the expansion of the network of franchised children’s clothing stores (Blukids).
Gross margin
Although 2016 was a not an easy year in terms of sales, due to a difficult market, it should nevertheless be said that the Group was able to maintain a level of very good profitability and growth compared with the previous year.The growth of approximately 50 bps as a percentage of net sales was, in fact, entirely attributable to growth in the intake margin, only partly offset by a greater use of promotional leverage to counteract the weak sales trend. While considering external factors such as the increase in the price of cotton, the stronger dollar and rising inflation, we again do not expect to see significant changes next year, partly due to the expected incremental volume purchased.
EBITDA
EBITDA came in at €186.7 million (13.7% as a percentage of net sales), representing an increase of €7.1 million (3.9%) on the €179.6 million recorded in 2015 (13.6% as a percentage of net sales). Both brands made positive contributions to this performance, thanks to (i) an improvement in the gross margin as a result of actions taken in the supply chain (displacement of part of procurement to lower-cost countries) and in distribution (improvement in stock quality and consequent reduced impact of mark downs), and (ii) careful control of costs and specific savings initiatives (particularly on rents and energy with the LED project).The EBITDA of the OVS brand increased by €2.2 million (up 1.4% year-on-year), while the EBITDA of the Upim brand grew by €4.9 million (up 27.8%).
EBIT
EBIT came in at €136.2 million, up €6.3 million (or 4.8%) year-on-year.There was a slight increase in amortization related to development activities of the network and investments in operations.
Profit before tax
Profit before tax came in at €121.6 million, up €6.7 million (or 5.8%) year-on-year. This performance was buoyed by the operating result and a slight decrease in financial expenses.Net profit grew by €10.7 million, to €91.8 million.

9 2016 ANNUAL REPORT
Net financial position
At 31 January 2017, the Group’s net financial position was €265.8 million. The ratio of net financial position to EBITDA for the last 12 months was 1.4, and the average interest rate for the year was 2.6%.
Shareholders’ equity
Consolidated shareholders’ equity stood at €871.7 million at 31 January 2017, up year-on-year due to the profit generated in the financial year, net of dividends of €34 million paid out in June 2016.
Summary statement of financial position
€mln 31 January 2017 31 January 2016 Chg Receivables 75.3 71.0 4.2Inventory 340.6 289.7 50.9Payables (367.7) (368.8) 1.2Net Operating Working Capital 48.2 (8.1) 56.3Other short term assets/(liabilities) (79.0) (91.3) 12.3Net Working Capital (30.9) (99.5) 68.6Tangible and Intangible Assets 1,368.9 1,357.2 11.7Net deferred taxes (140.9) (142.7) 1.8Other long term assets/(liabilities) (11.8) (6.1) (5.7)Pension funds and other provisions (47.7) (48.7) 1.1Net Capital Employed 1,137.6 1,060.1 77.5Net Equity 871.7 825.1 46.7Net Financial Debt 265.8 235.0 30.8Total source of financing 1,137.6 1,060.1 77.5

10 OVS SpA
Summary statement of cash flows
Cash flow
Operating cash flow was positive for €75.2 million. The decrease of €42.8 million year-on-year reflects an increase in trade receivables for the expansion of the franchising network and in inventories. The stock increase is due to (i) unfavorable weather conditions in May and September, (ii) the development of the international and domestic store network, and (iii) the higher merchandise volumes required to supply Charles Vögele’s pilot stores. The commercial agreement with the Swiss retailer implies a relevant stock absorption and therefore no critical issue arise with regards to average collection days and stock rotation on turnover. Trade payables are broadly in line with the previous year, notwithstanding the increase in sales, given a higher incidence of purchase volumes from Far East countries (characterized by shorter terms of payments). Lastly, investments continued, slightly lower than in 2015. The increase in net working capital is under control, in line with the activities implemented by management.The decrease in financial expenses year-on-year was more than offset by an increase in tax payments, due to the withdrawal from the tax consolidation scheme, under which payments on account were offset against the Group’s credit. Of the tax payments, €5.5 million related to IRAP and €31.1 million to IRES, including the balance from 2015 tax consolidation (€21.6 million) and the 2016 payment on account (€9.5 million). The dividend distribution of €34.1 million and the investment of €13.8 million in Sempione Retail AG also contributed to the cash absorption recorded for the year.
Dividends
The Board of Directors has resolved to propose to the shareholders’ meeting the payment of dividends for 2016 of €34.05 million, equal to €0.15 per share, with a payout ratio of 37.0% of consolidated net profit. If approved by the shareholders, the dividend will be paid out on 14 June 2017 (ex-coupon date 12 June 2017 and record date 13 June 2017).
€mln 31 January 2017 31 January 2016EBITDA 186.7 179.6
Change in Net Operating Working Capital (56.3) (5.6)Other changes in Working Capital 7.3 12.4Capex (62.5) (68.3)Operating Cash Flow 75.2 118.0Financial charges (15.3) (20.2)Severance indemnity payment (2.1) (2.5)Corporate taxes (36.6) (20.5)IPO costs (excl. bank commissions) 0.0 (3.6)IPO proceeds (net of bank commissions) 0.0 349.1Dividends (34.1)Equity investment on Sempione Retail AG (13.8)Others (3.2) (6.1)Net Cash Flow (excl derivatives MtM and amortised costs) (29.9) 414.1MtM derivatives, amortized cost and exchange rate differences (0.9) (24.7)Net cash flow (30.8) 389.4
11 2016 ANNUAL REPORT
Board of Directors
Following the resignation of Board member Lori Hall-Kimm (already announced to the market on 17 December 2015), the Company’s Board of Directors on 14 April 2016 resolved to appoint, through co-option, Marvin Teubner as a new Company Board member, categorising him as non-executive pursuant to the applicable regulatory provisions.The Director thus appointed was confirmed by shareholders’ meeting on 25 May 2016 and his mandate will expire along with that of all Company Board members.
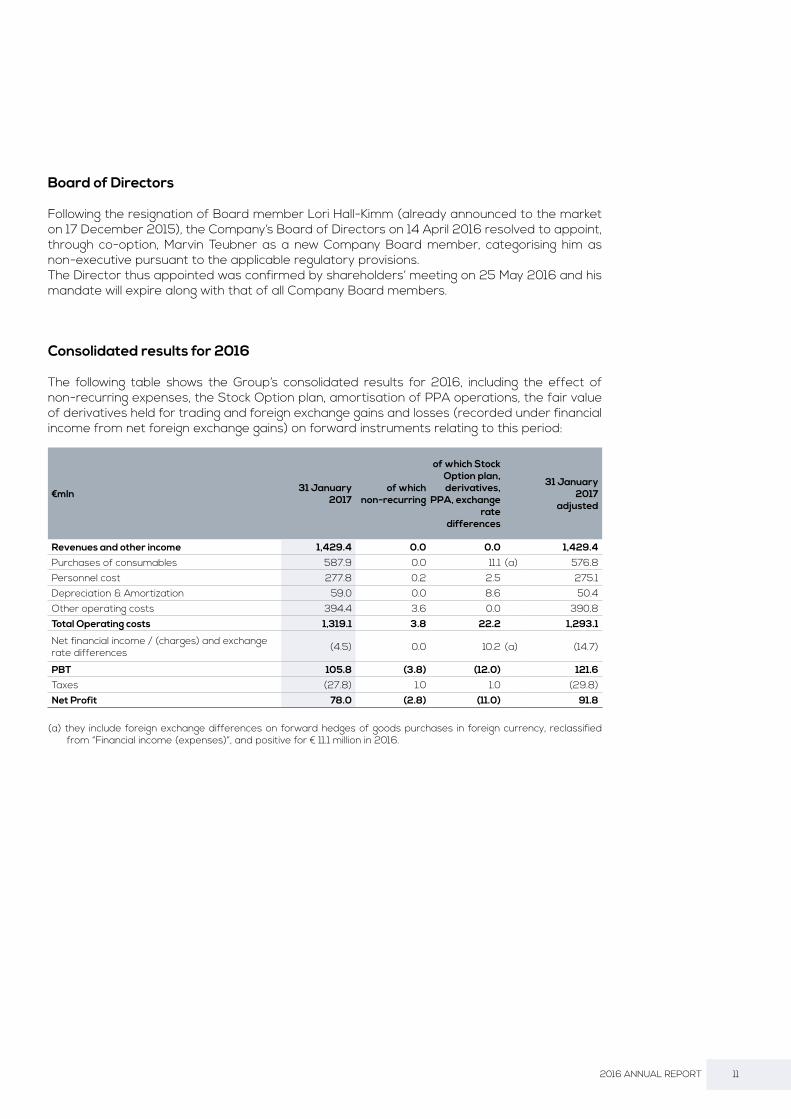
Consolidated results for 2016
The following table shows the Group’s consolidated results for 2016, including the effect of non-recurring expenses, the Stock Option plan, amortisation of PPA operations, the fair value of derivatives held for trading and foreign exchange gains and losses (recorded under financial income from net foreign exchange gains) on forward instruments relating to this period:
(a) they include foreign exchange differences on forward hedges of goods purchases in foreign currency, reclassified from “Financial income (expenses)”, and positive for € 11.1 million in 2016.
€mln 31 January 2017
of which non-recurring
of which Stock Option plan, derivatives,
PPA, exchange rate
differences
31 January 2017
adjusted
Revenues and other income 1,429.4 0.0 0.0 1,429.4
Purchases of consumables 587.9 0.0 11.1 (a) 576.8 Personnel cost 277.8 0.2 2.5 275.1 Depreciation & Amortization 59.0 0.0 8.6 50.4 Other operating costs 394.4 3.6 0.0 390.8 Total Operating costs 1,319.1 3.8 22.2 1,293.1
Net financial income / (charges) and exchange rate differences (4.5) 0.0 10.2 (a) (14.7)
PBT 105.8 (3.8) (12.0) 121.6Taxes (27.8) 1.0 1.0 (29.8)Net Profit 78.0 (2.8) (11.0) 91.8

12 OVS SpA
The Group’s consolidated results for 2015 are reported below, with the same records as the table relating to results for 2016.
(a) they include foreign exchange differences on forward hedges of goods purchases in foreign currency, reclassified from “Financial income (expenses)”, and positive for € 11.1 million in 2015.
• Revenues, which came in at €1,429.4 million, mainly include the retail sales generated by the OVS and Upim brands.
• Given by the difference between revenues and operating costs after depreciation and amortisation, net of non-recurring expenses, the Stock Option Plan, depreciation and amortisation from PPA operations and derivatives held for trading, and adjusted to take account of foreign exchange gains and losses realised on forward instruments stipulated by the Group for hedging purposes, EBITDA came in at €186.7 million, or 13.7% of revenues.
• The net result before tax was positive for €105.8 million, and €121.6 million net of non-recurring expenses and other costs, which are shown in the third column of the prospectus.
• Net taxes amounted to €27.8 million. The previous year benefited from a positive effect of €19.8 million, deriving from the recalculation of deferred tax at the close of 2015, based on the lower IRES rate of 24% (rather than 27.5%) defined in the 2016 Stability Law, which will come into force in 2017.
• The net result was positive for €78.0 million, and positive for €91.8 million net of the above expenses.
€mln 31 January 2016
of which non-recurring
of which Stock Option plan, derivatives,
PPA, exchange rate
differences
31 January 2016
adjusted
Revenues and other income 1,380.2 0.0 0.0 1,380.2
Purchases of consumables 576.1 0.0 11.1 (a) 565.0 Personnel cost 261.9 0.3 1.4 260.2 Depreciation & Amortization 58.2 0.0 8.6 49.6 Other operating costs 382.0 6.6 0.0 375.4 Total Operating costs 1,278.2 6.9 21.1 1,250.2
Net financial income / (charges) and exchange rate differences (3.5) (6.8) 18.3 (a) (15.0)
PBT 98.5 (13.7) (2.8) 114.9Taxes (11.9) 23.5 (1.6) (33.8)Net Profit 86.6 9.9 (4.3) 81.1

13 2016 ANNUAL REPORT
Results of OVS SpA
PROFIT PERFORMANCE
The tables below set out OVS SpA’s results for 2016 and 2015, showing the effect of non-recurring expenses, the Stock Option Plan, depreciation and amortisation from PPA operations and derivatives held for trading for the period under review, and are adjusted to take account of foreign exchange gains and losses realised on forward instruments stipulated by the Company for hedging purposes (€11.1 million in 2016).
€mln 31 January 2016
of which non-recurring
of which Stock Option plan, derivatives,
PPA, exchange rate
differences
31 January 2016 adjusted
Revenues and other income 1,374.3 0.0 0.0 1,374.3
Purchases of consumables 606.1 0.0 11.1 595.0 Personnel cost 254.2 0.3 1.4 252.5 Depreciation & Amortization 57.2 0.0 8.6 48.6 Other opereting costs 375.7 6.6 0.0 369.1 Total Operating costs 1,293.2 6.9 21.1 1,265.2 Income/(charges) from partecipated company 18.1 0.0 0.0 18.1
Net financial income / (charges) and exchange rate differences (6.0) (6.8) 18.3 (17.5)
PBT 93.2 (13.7) (2.8) 109.7Taxes (11.4) 23.5 (1.6) (33.3)Net Profit 81.8 9.9 (4.3) 76.2
€mln 31 January 2017
of which non-recurring
of which Stock Option plan, derivatives,
PPA, exchange rate
differences
31 January 2017 adjusted
Revenues and other income 1,424.0 0.0 0.0 1,424.0
Purchases of consumables 620.4 0.0 11.1 609.3 Personnel cost 268.6 0.2 2.5 265.9 Depreciation & Amortization 58.5 0.0 8.6 49.9 Other opereting costs 387.7 3.6 0.0 384.1 Total Operating costs 1,335.2 3.8 22.2 1,309.2Income/(charges) from partecipated company 19.0 0.0 0.0 19.0
Net financial income / (charges) and exchange rate differences (4.0) 0.0 10.2 (14.2)
PBT 103.8 (3.8) (12.0) 119.6Taxes (27.3) 1.0 1.0 (29.3)Net Profit 76.5 (2.8) (11.0) 90.3

14 OVS SpA
• Revenues, which came in at €1,424.0 million, mainly include the retail sales generated by the OVS and Upim brands.
• Depreciation and amortisation, amounting to €58.5 million, mainly relate to store improvements and refits.
• Other operating expenses, which totaled € 387.7 million, mainly comprise costs for the use of third-party assets (€189.7 million), miscellaneous operating expenses (€23.2 million), sales service costs (€41.8 million), utility costs (€32.0 million), maintenance, cleaning and security costs (€32.8 million), professional services (€21.9 million) and advertising expenses (€24.0 million). Net of non-recurring costs, the amount of “Other operating expenses” would have been €384.1 million; non-recurring expenses mainly relate to services provided in relation to the development process in Switzerland.
• Gains (losses) on equity investments include income for dividends received from subsidiary OVS Hong Kong Sourcing Ltd for €20.5 million and expenses arising from the write-down of the foreign companies for about €1.5 million.
• Net financial expenses came in at €4.0 million, deriving from financial expenses of €15.8 million, financial income of €0.2 million, foreign exchange gains and the fair value of derivatives for €11.6 million.
• Taxes were negative for €27.3 million; without the charges shown in the second and third columns of the income statement, taxes would be negative for €29.3 million.
• The net result was positive for €76.5 million, and would be positive for €90.3 million if the Company had not incurred the costs indicated in the second and third columns of the statement.

15 2016 ANNUAL REPORT
FINANCIAL PERFORMANCE
The financial performance is shown below, and is described in more detail in the notes to the separate financial statements.
(A) The item includes: Trade receivables and payables, current and deferred tax assets, other receivables, inventories, current and deferred tax liabilities, other payables, employee benefits and provisions for risks and charges.
(B) The item includes: Property, plant and machinery, intangible assets, goodwill and equity investments.
FINANCIAL MANAGEMENT
Net debt was €269.4 million at 31 January 2017, compared with €237.1 million at 31 January 2016.
The breakdown is as follows (in millions of euros):
Payables to banks are shown later in this report.
€mln 31 January 2017 31 January 2016
Working capital (A) (252.8) (318.1)Net capital employed (B) 1,377.5 1,365.8 Net Financial position 269.4 237.1Shareholders' equity 855.3 810.6
€mln 31 January 2017 31 January 2016
Cash and net financial assets 86.2 123.3Credits/(Debts) on derivatives 17.4 18.3 Credits/(Debts) to related company 5.5 0.0Credits/(Debts) to banks (375.2) (375.2)Credits/(Debts) to other financial institutions (3.3) (3.5)Net financial position (269.4) (237.1)

16 OVS SpA
Main subsidiaries
OVS HONG KONG SOURCING LTD
OVS Hong Kong Sourcing Ltd, which has its registered office in Hong Kong, operates in the Far East (mainly China, Bangladesh and India), and, more generally, in areas outside Europe, aiming to select suppliers, win orders, manage the entire product development phase up to the point of quality control, support production activities and ensure, by monitoring with its own structures, that product costs and quality comply with Group standards. Specifically, the company focuses on strengthening existing supplier relationships in the Asian region, further boosting its presence in Bangladesh by increasing purchasing volumes. At the same time, purchasing has also increased in the Indian region, and the search has continued for more sources of supply in countries in that area that can meet the quality standards required by the Group in a context of lower costs (e.g. Burma, Cambodia and Vietnam).
The company recorded net profit of €21.7 million in 2016 (compared with €20.9 million in 2015).
OVS MALOPRODAJA D.O.O.
The company operates in the Croatian market, directly managing seven OVS stores. There were no new openings or closures of stores in 2016.OVS will pursue expansion in the region through the franchising formula.The performance of the company has not relevant impact on the consolidated figures.
OVS DEPARTMENT STORES D.O.O.
The company operates in the Serbian market, directly managing six OVS stores. There were no new openings or closures of stores in 2016.OVS will pursue expansion in the region through the franchising formula.The performance of the company has not relevant impact on the consolidated figures.
OVS BULGARIA EOOD
The company, which was placed in liquidation in 2016, did not manage any stores in the year just ended, having closed three outlets in November 2014.OVS will pursue expansion in the region through the franchising formula, managed directly by OVS SpA.The performance of the company has not relevant impact on the consolidated figures.
OVS FASHION ESPAÑA SL
OVS Fashion España SL, which was acquired in 2016, manages the sales network in Spain, with 41 stores under franchise and one directly managed store.The performance of the company has not relevant impact on the consolidated figures.
17 2016 ANNUAL REPORT
Management of financial and operating risks
The Group operates in the commercial sphere, both retail and wholesale, with exposure to market risks relating to changes in interest rates, exchange rates and goods prices. The risk of changes in prices and cash flows is connected to the very nature of the business and can be only slightly mitigated by the use of appropriate risk management policies.
Credit risk
Credit risk represents the Group’s exposure to the risk of potential losses arising from default by a counterparty.At 31 January 2017, there were no significant concentrations of credit risk, as this risk is mitigated by the fact that credit exposure is spread over a large number of customers.To reduce the risk, the Group also obtains guarantees in the form of sureties in respect of loans granted for the supply of goods.Financial assets are recognised net of write-downs calculated on the basis of the risk of counterparty default, determined by using available information on the solvency of the customer and taking historical data into account.
Liquidity risk
Liquidity risk represents the risk that financial resources may be difficult to access.Currently, the Group believes that it can access, through available sources of financing and lines of credit, sufficient funds to meet its foreseeable financial requirements.
Market risk
Market risk includes the effects that changes in the market might have on the group’s commercial activity that is sensitive to consumer spending choices. Positive results can be influenced, inter alia, by the business environment, interest rates, taxation, local economic conditions, uncertainty over the economic outlook and shifts to other goods and services in consumer spending choices. Consumer preferences and economic circumstances may change from time to time in every market in which we operate.The Group has to be able to combat the deflationary price pressure associated with increased competition and changes in consumer choices, which could have adverse effects on the financial situation and results.
RISK OF CHANGE IN PRICES AND CASH FLOWS
The Group’s margins are influenced by changes in the prices of the goods it deals in.Any reduction in the price of items sold, if not accompanied by a corresponding reduction in purchase cost, generally entails a decrease in operating results.The Group’s cash flows are also exposed to the risk of changes in exchange rates and interest rates on the market. More specifically, the exposure to exchange rates arises from the fact that the Group operates in currencies other than the euro. Because of this, a significant part of the marketed products purchased by the Group are denominated in or linked to the US dollar.Interest rate fluctuations affect the market value of the Group’s financial liabilities and its net financial expenses.

18 OVS SpA
OBJECTIVES AND POLICIES FOR MANAGING THE RISK OF CASH FLOW CHANGES The Group has guidelines in place for financial operations that involve the use of derivatives to reduce exchange rate risk against the US dollar ( foreign currency forward contracts ) and the risk of interest rate fluctuations.
DERIVATIVE CONTRACTSNominal value of financial derivative contractsThe nominal value of a financial derivative contract is the amount of each contract in monetary terms. The monetary amounts in foreign currency are converted into euros at the spot exchange rate on the reporting date.
Management of interest rate risk With regard to the new financing structure defined during 2015, as discussed in the appropriate section of the notes to the financial statements in the 2015 Annual Report, on 2 August 2015, interest rate cap agreements were entered into, maturing on 7 September 2017, to partially manage the risk in question.
Foreign exchange risk The Group enters into various types of foreign exchange contracts to manage foreign exchange risk associated with future purchases in foreign currencies.These contracts are mainly used to insure against the risk that the foreign currency (US dollar) will appreciate.
Investment and development
Gross investments of €62.5 million were made in 2016. Most investments were focused on Group growth, and mainly related to (i) the opening of new stores (approximately €27.5 million), including a disposal price of approximately €3.9 million for the acquisition of eight former Coin stores, converted into OVS stores (6) and Upim stores (2), (ii) restructuring of the existing network (approximately €8.0 million), (iii) extraordinary store maintenances (approximately €8.5 million), (iv) development of IT systems (approximately €9.0 million) and (v) the upgrade of the main logistics depot (approximately €1.1 million), to improve distribution efficiency. The net investments made in 2015 amounted to €73.5 million.
At the Group level, the sales network at 31 January 2017 comprised a total of 1,473 stores (including small-format stores), including 691 directly managed stores, 638 affiliated stores (including 162 abroad), 14 directly managed stores abroad and 130 administered stores (including 51 abroad).In 2016 (01 February 2016 - 31 January 2017), the network continued to grow in terms of stores (net of closures) by 200 units, including 33 that are directly managed, 108 that are affiliated and 59 that are administered.At the end of 2015, the network comprised a total of 1,273 stores (including small-format stores), including 659 directly managed stores, 530 affiliated stores (including 139 abroad), 13 directly managed stores abroad and 71 administered stores (including 35 abroad).

19 2016 ANNUAL REPORT
Organisation
In 2016, we worked to develop integrated action plans to ensure that we have the skills and organisational structures needed to support growth programmes in Italy and abroad. With this objective, the main organisational development activities related to:
• the strengthening of structures and skills dedicated to international expansion;
• the strengthening of oversight in e-commerce and, generally, areas dedicated to the management of individual brand marketing, to ensure that customer relationship processes are focused and open to innovation;
• the development of Business Innovation and Change Management programmes, which saw the dedicated function engaged in cross-cutting improvements to processes and systems, particularly in the core activities of planning, quantification and distribution, with the use of mathematical models developed in collaboration with university research centres, to ensure more flexible responses to the varying needs of individual local markets and target customers;
• the introduction of new ways of integrating product development activities in Italy with oversight of international sourcing, through the introduction of new support and control systems, in line with the requirements of speed, flexibility, synergy between suppliers and entry into new supply areas.
Particular attention has been paid to human resources, to promote skills growth and the improvement of engagement pathways. The main plans developed are summarised below:
• the strengthening of recruitment programmes targeting the most prestigious Italian universities, to attract young talent on career paths in the areas of product development, administration and corporate functions;
• the expansion of talent management plans aimed at employees with the potential for growth and an international outlook;
• the insertion of new individuals to build in-house specialist expertise in the areas most involved in the brands’ development plans and in innovation;
• the expansion of programmes in WEshare, the corporate in-house social tool, which gives all employees direct access to services, welfare and training through e-learning, and the chance to make contributions and suggestions.
The training activity relating to the stores is very intense for all the brands, in order to provide employees with tools for information, knowledge and sharing, designed to strengthen customer service and management efficiency, through training, improvement teams and programmes aimed at recognising and rewarding the best results in sales and customer service. The Retail Schools, which are dedicated to the growth of new management for managing the stores, have provided jobs and training for more than 150 store manager students.
All store managers have been involved in activities aimed at enhancing their skills in managing and developing resources and image.Industrial relations activities have been proactive, in order to involve the national trades unions and some regional unions in the management of plans to optimise resources and streamline activities, always reaching agreements consistent with the corporate objectives and with the consent of those involved.
20 OVS SpA
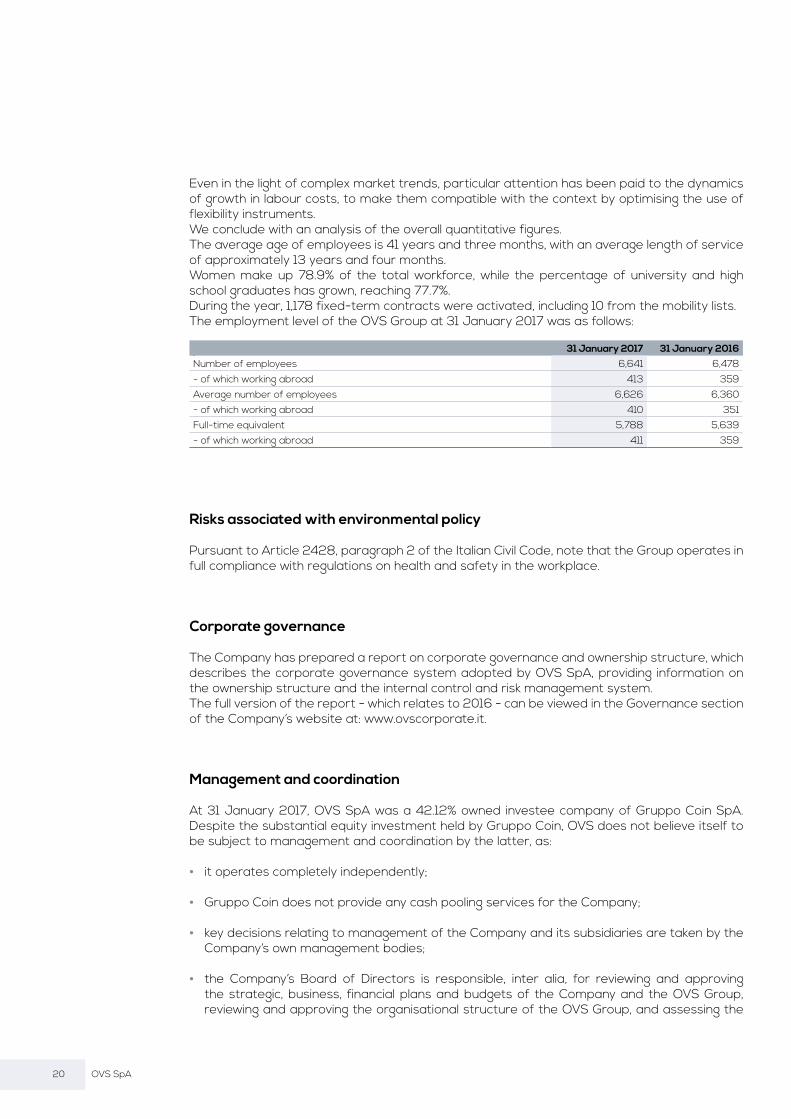
Even in the light of complex market trends, particular attention has been paid to the dynamics of growth in labour costs, to make them compatible with the context by optimising the use of flexibility instruments. We conclude with an analysis of the overall quantitative figures.The average age of employees is 41 years and three months, with an average length of service of approximately 13 years and four months.Women make up 78.9% of the total workforce, while the percentage of university and high school graduates has grown, reaching 77.7%.During the year, 1,178 fixed-term contracts were activated, including 10 from the mobility lists. The employment level of the OVS Group at 31 January 2017 was as follows:
.
Risks associated with environmental policy
Pursuant to Article 2428, paragraph 2 of the Italian Civil Code, note that the Group operates in full compliance with regulations on health and safety in the workplace.
Corporate governance The Company has prepared a report on corporate governance and ownership structure, which describes the corporate governance system adopted by OVS SpA, providing information on the ownership structure and the internal control and risk management system.The full version of the report - which relates to 2016 - can be viewed in the Governance section of the Company’s website at: www.ovscorporate.it.
Management and coordination
At 31 January 2017, OVS SpA was a 42.12% owned investee company of Gruppo Coin SpA. Despite the substantial equity investment held by Gruppo Coin, OVS does not believe itself to be subject to management and coordination by the latter, as:
• it operates completely independently;
• Gruppo Coin does not provide any cash pooling services for the Company;
• key decisions relating to management of the Company and its subsidiaries are taken by the Company’s own management bodies;
• the Company’s Board of Directors is responsible, inter alia, for reviewing and approving the strategic, business, financial plans and budgets of the Company and the OVS Group, reviewing and approving the organisational structure of the OVS Group, and assessing the
31 January 2017 31 January 2016Number of employees 6,641 6,478 - of which working abroad 413 359 Average number of employees 6,626 6,360 - of which working abroad 410 351 Full-time equivalent 5,788 5,639 - of which working abroad 411 359

21 2016 ANNUAL REPORT
adequacy of the organisational, management and accounting structure of the Company and the OVS Group.
Research and development
The Group did not carry out any research and development activities in the year pursuant to the provisions of the accounting standards. However, a number of people are continuously employed in creating and developing collections, to ensure an exclusive offering that is consistent with the positioning of the Group’s various brands. Specifically, the activities carried out by dedicated teams are classified as subject to the “Community framework” Directive 2006/c 323/01, which defines “industrial research” as: “industrial research or planned research or critical investigation aimed at acquiring new knowledge and skills for developing new products, processes or services or bringing about a significant improvement in existing products, processes or services. …“
Treasury shares
At the date of this annual report, the Parent Company, OVS SpA, does not hold (and did not hold at any time in 2016), treasury shares or shares/units of controlling companies, either directly or indirectly.
Related-party transactions
In accordance with the applicable laws and regulations, the Board of Directors of the Parent Company, by resolution of 23 July 2014, effective as of 2 March 2015, approved the “Rules on related-party transactions”, to govern transactions that are significant in terms of strategy, profit and financial performance, including transactions with related parties, to define the competencies and duties that relate to significant transactions and to ensure the substantive and procedural transparency and correctness of these transactions.
Information on, and details of, relations with related entities are provided in the notes to the consolidated financial statements and the separate financial statements, pursuant to IAS 24.
Compliance with the Privacy Code
Pursuant to Appendix B, point 26 of Legislative Decree 196/2003, relating to the Data Protection Code, the management body acknowledges that the Company is in compliance with data protection measures in light of the provisions introduced by Legislative Decree 196/2003, according to the terms and procedures set forth therein.In particular, the Security Planning Document, filed at the registered office and freely available, is updated by the data controller as required by law.

22 OVS SpA
Significant events during the reporting period
EQUITY INVESTMENT IN SEMPIONE RETAIL AG
On the 19th September 2016 Sempione Retail AG launched a public tender offer to acquire the 84.8% of Charles Vögele with the objective to obtain the control of the company, jointly with Aspen Trust Services Limited which holds the remaining 15%.As a result of the public tender offer, supported by the Board of Directors of Charles Vögele, at the end of the period Sempione Retail AG controls the 80.4% of the company and the 96% together with Aspen Trust Services Limited. OVS and Charles Vögele AG consequently implemented the plan, with the conversion of some pilot stores in early 2017. From 16 December 2019, OVS will be able to exercise a call option to purchase another 44.5% stake in Sempione Retail AG at the multiple of OVS at the option exercise date, discounted by 25%. Until then, Charles Vögele will pay royalties equal to 3% of the net sales generated by the stores from the conversion date. The transaction will allow for significant acceleration in the international expansion of the Group, with an extremely limited financial risk.
OVS FASHION ESPAÑA SL
As part of its internationalisation, OVS (which was already operating in the Spanish market with a network of stores, mostly in the children’s clothing format), through a commercial agreement with a local partner, assessed the opportunity to acquire the assets of this company in order to obtain more direct management in the important Spanish retail market. To this end OVS acquired Shopping Day company, which correspond to the present OVS Fashion España SL. The purpose of the company is to strengthen the existing network and give more impetus to a plan to also expand the network by opening directly managed stores, including full-format ones.

23 2016 ANNUAL REPORT
NOTES ON SHARE PERFORMANCE
OVS S.p.A. Stock Price Trend - FY 2016
OVS S.p.A. vs FTSE MIB
The OVS stock was listed on the Milan Stock Exchange on 2 March 2015 at a placement price of €4.10. The stock closed the year at €5.60 on 29 January 2016. One year later, on 31 January 2017, the stock was trading at €5.165 (up 26% compared with the placement price and down 7.8% compared with the closing price for the previous year). Specifically, the OVS stock hit a peak of €6.19 on 30 May 2016 before trending downwards like all of the benchmark stocks. Management believes that this trend is entirely due to sectoral factors. Following a rebound in the FTSE MIB after December, the index registered a modest rise of 0.36%, while in general, Italian mid-caps grew by 3.30% in the same period. The stock returned to a positive trend early in 2017, reaching €5.96 on 23 March 2017 (up 15% at end-2016).At 5 April 2016, of the ten brokers that monitor OVS SpA, two had an “outperform” recommendation on the stock, five had a “buy” recommendation and two had a “neutral” recommendation. The average target price for all coverage at this date was €6.57.
OVS IM Equity
FTSEMIB Index
€ 6.25
€ 6.00
€ 5.75
€ 5.50
€ 5.25
€ 5.00
€ 4.75
€ 4.50
115.00
110.00
105.00
100.00
95.00
90.00
85.00
80.00
feb
-16
feb
-16
mar
-16
mar
-16
apr-
16
apr-
16
may
-16
may
-16
jun-
16
jun-
16
jul-
16
jul-
16
aug-
16
aug-
16
sep
-16
sep
-16
oct-
16
oct-
16
nov-
16
nov-
16
jan-
17
jan-
17
feb
-17
mar
-17
apr-
17
dec
-16
dec
-16
24 OVS SpA
For more information and updates on share performance, and for the latest corporate information, please visit the “Investor Relations” section of the website at www.ovscorporate.it.
STOCK OPTION PLAN
On 26 May 2015, the shareholders’ meeting approved the 2015-2020 Stock Option Plan, which will be implemented through the allocation of free options for subscription to ordinary newly issued shares of OVS SpA. The Plan is reserved for directors who are also employees, managers with strategic responsibilities and/or other employees of OVS SpA and its subsidiaries. The Plan is intended to create value for shareholders by improving long-term corporate performance and attracting personnel that play a key role in the Company’s development.The Plan provides for the issue of up to 5,107,500 options, which will be freely allocated to the Beneficiaries if certain performance targets are met, and confers on each of them the right to subscribe to one ordinary share of the Company for each option assigned.
The same meeting also approved, in extraordinary session, the proposal to confer upon the Board of Directors, for a period of five years from the date of the resolution, the power to increase the share capital, pursuant to Article 2443 of the Italian Civil Code, in tranches, excluding option rights pursuant to Article 2441, paragraph 8 of the Italian Civil Code, for a total maximum nominal amount of €35,000,000, through the issue, in one or more tranches, of up to 5,107,500 ordinary shares with no par value, to be reserved for the Beneficiaries of the “2015-2020 Stock Option Plan”.
On 8 June 2015, the Board of Directors resolved to execute the mandate, and consequently resolved to carry out a capital increase to serve the 2015-2020 Stock Option Plan, approved by the same shareholders’ meeting. In particular, the Board of Directors resolved to carry out a paid share capital increase by the deadline of 8 June 2025, by issuing, in one or more tranches, up to 5,107,500 new ordinary shares with no par value, with the same characteristics as the ordinary shares outstanding on the issue date, with ordinary rights, excluding option rights pursuant to Article 2441, paragraph 8, of the Italian Civil Code, to be reserved for subscription by the Beneficiaries of the aforementioned 2015-2020 Stock Option Plan, with a strike price of €4.88 per share. For all details of the 2015-2020 Stock Option Plan and the capital increase, please see the documents provided pursuant to Article 125-ter of the TUF and Articles 72 and 84-bis of the Consob Issuers’ Regulation, and the notary minutes of 8 June 2015, published in the Governance/Shareholders’ Meeting section of the Company website at www.ovscorporate.it. Please also see the examination of the effects of this plan on the income statement and balance sheet at 31 January 2017 in the notes to the consolidated financial statements.
Furthermore, during next Meeting, the Board of Directors will submit to the attention of Shareholders a new Stock Option Plan “2017-2022 Stock Option Plan”, which provides for the granting of options allowing newly issued ordinary shares of OVS SpA to be purchased.
25 2016 ANNUAL REPORT
Significant events after the reporting date
No significant events took place after the reporting period.
Business outlook
The early months of 2017, which saw better weather conditions than last year, and new commercial initiatives undertaken by management, are bringing positive results in terms of sales.In view of this, management is looking ahead to the new year with confidence and the conviction that the validity of its strategy and its proven ability to implement it, as well as its reaction speed in a continually changing and increasingly competitive market, will result in further sustainable and remunerative growth for our shareholders in 2017.
Art. 36 of Consob Regulation 16191/2007 relating to market governance
Investee companies with registered offices in countries not within the European Union, of which the biggest is OVS Hong Kong Sourcing Ltd, are not significant within the meaning of Article 151 of the Issuers’ Regulation, as their respective assets make up less than 2% of the assets in the Group’s consolidated financial statements at 31 January 2017, and their respective revenues make up less than 5% of the Group’s consolidated revenues at 31 January 2017.


27 2016 ANNUAL REPORT
Dear Shareholders,
We submit the following resolution for your approval:
“The shareholders’ meeting of OVS SpA, in ordinary session,
• having heard and approved the statements of the Board of Directors;
• having examined the data in the separate financial statements of OVS SpA at 31 January 2017 and the Report on Operations of the Board of Directors;
• having acknowledged the reports of the Statutory Auditors and the external auditor;
• having examined the consolidated financial statements at 31 January 2017;
resolves
1. to approve the separate financial statements of OVS SpA at 31 January 2017;2. to approve the allocation of earnings of OVS SpA at 31 January 2017, amounting to
€76,506,926.00, as follows:
- €3,825,346.00 to the legal reserve; - €34,050,000.00 to be paid out as dividends (€0.15 per share); - €38,631,580.00 in retained earnings.”
for the Board of Directors the Chief Executive Officer Stefano Beraldo
Venice – Mestre, 18 April 2017
PROPOSED RESOLUTION ON NET RESULT FOR THE YEAR


CONSOLIDATED FINANCIAL STATEMENTS

30 OVS SpA
Consolidated statement of financial position(amounts in thousands of euros)
ASSETS Note 31.01.2017 of which related parties 31.01.2016 of which related
parties
Current assets
Cash and banks 1 89,713 125,636Trade receivables 2 75,259 6,608 71,025 3,955Inventories 3 340,577 289,675Financial assets 4 18,897 16,308Current tax assets 5 1,120 923Other receivables 6 31,059 33,406Total current assets 556,625 536,973
Non-current assetsProperty, plant and equipment 7 267,359 260,083Intangible assets 8 639,924 644,412Goodwill 9 453,165 452,541Equity investments 10 8,420 136Financial assets 4 5,491 5,491 1,988Other receivables 6 5,220 5,633Total non-current assets 1,379,579 1,364,793
TOTAL ASSETS 1,936,204 1,901,766
LIABILITIES AND SHAREHOLDERS' EQUITY Note 31.01.2017 of which related
parties 31.01.2016 of which related parties
Current liabilities
Financial liabilities 11 6,559 7,355Trade payables 12 367,662 1,245 368,834 1,807Current tax liabilities 13 15,796 11,460 23,771 23,506Other payables 14 95,420 2,018 101,895 2,701Total current liabilities 485,437 501,855
Non-current liabilitiesFinancial liabilities 11 373,363 371,601Employee benefits 15 39,906 40,529Provisions for risks and charges 16 7,785 8,216Deferred tax liabilities 17 140,939 142,733Other payables 14 17,030 11,776Total non-current liabilities 579,023 574,855
TOTAL LIABILITIES 1,064,460 1,076,710
SHAREHOLDERS' EQUITYShare capital 18 227,000 227,000Other reserves 18 566,729 511,429Net result for the year 78,015 86,627
TOTAL SHAREHOLDERS' EQUITY 871,744 825,056
TOTAL LIABILITIES AND SHAREHOLDERS' EQUITY 1,936,204 1,901,766

31 2016 ANNUAL REPORT
Consolidated income statement(amounts in thousands of euros)
Consolidated statement of comprehensive income(amounts in thousands of euros)
Note 31.01.2017 of which non-recurring
of which related parties 31.01.2016 of which
non-recurringof which
related parties
Revenues 19 1,362,624 4,180 1,319,480 4,261Other operating income and revenues 20 66,794 3,872 60,733 49 252Total revenues 1,429,418 0 1,380,213 49
Purchases of raw materials, consumables and goods 21 587,935 2 576,127 (111)
Staff costs 22 277,815 161 5,619 261,930 301 5,751Depreciation, amortisation and write-downs of assets 23 59,050 58,193Other operating expensesService costs 24 176,427 889 17,017 171,560 2,053 14,061Costs for the use of third-party assets 25 192,666 48 (404) 185,248 1,017 (953)Write-downs and provisions 26 1,200 1,800Other operating charges 27 24,086 2,697 14 23,359 3,559 21Result before net financial expenses and taxes 110,239 (3,795) 101,996 (6,881)Financial income 28 200 100 118Financial expenses (15,817) (26,926) (6,774)Exchange rate gains and losses 11,167 23,273Gains (losses) from equity investments 0 47 47Net result for the year before tax 105,789 (3,795) 98,508 (13,655)Taxes 29 (27,774) 1,044 (11,881) 23,512Net result for the year 78,015 (2,751) 86,627 9,857
Net result for the year attributable to the Group 78,015 86,627
Net result for the year attributable to minority interests 0 0
Earnings per share (in euro)- basic 0.34 0.39- diluted 0.34 0.39
Note 31.01.2017 31.01.2016Net result for the year (A) 78,015 86,627
Other gains (losses) that will not be subsequently reclassified in the income statement:
- Actuarial gains (losses) for employee benefits 15-18 (323) 2,240- Tax on items recognised in the reserve for actuarial gains (losses) 17-18 26 (616)
Total other comprehensive gains (losses) that will not be subsequently reclassified in the income statement (297) 1,624
Other gains (losses) that will be subsequently reclassified in the income statement:
- Gains (losses) on cash flow hedging instruments 18 0 (26,558)- Tax on items recognised in the cash flow hedging reserve 18 0 7,303- Change in translation reserve 18 531 (2,441)
Total other comprehensive gains (losses) that will be subsequently reclassified in the income statement 531 (21,696)
Total other items of comprehensive income (B) 234 (20,072)Total comprehensive income for the period (A) + (B) 78,249 66,555Total comprehensive income attributable to the Group 78,249 66,555Total comprehensive income attributable to minority interests - -

32 OVS SpA
Consolidated statement of cash flows(amounts in thousands of euros)
The effects of relations with related parties are described in the section “Relations with related parties” in the notes to these consolidated financial statements.
Note 31.01.2017 31.01.2016Operating activities
Net result for the year 78,015 86,627 Provision for taxes 29 27,774 11,881 Adjusted for: Net depreciation, amortisation and write-downs of fixed assets 23 59,050 58,193 Net capital gains (losses) on fixed assets 35 720 Losses (gains) from equity investments 28 0 (47) Net financial expenses (income) 28 15,611 26,808
Expenses (income) from foreign exchange differences and currency derivatives
28 (12,085) (16,067)
Loss (gain) on derivatives due to change in fair value 28 924 (7,206) Allocations to provisions 15-16 0 0 Utilisation of provisions 15-16 (2,534) (3,728) Cash flows from operating activities before changes in working capital 166,790 157,181
Cash flow generated by change in working capital2-3-5-
6-12-13-14-17
(53,244) 1,784
Taxes paid (36,577) (20,484) Net interest received (paid) (16,190) (27,910)
Realised foreign exchange differences and cash flows from currency derivatives 11,465 15,538
Other changes 3,020 (1,048)Cash flow generated (absorbed) by operating activities 75,264 125,061
Investment activities (Investments) in fixed assets 7-8-9 (61,700) (68,919) Disposals of fixed assets 7-8-9 116 1,368 (Increase) decrease in equity investments 10 (8,284) 0 Dividends received 0 47 Cash out due to business combination during the year (3,931) 0Cash flow generated (absorbed) by investment activities (73,799) (67,504)
Financing activities Net change in financial assets and liabilities 4-11 (3,338) (321,365) Increase in share capital and reserves 0 349,110 Dividend distribution (34,050) 0Cash flow generated (absorbed) by financing activities (37,388) 27,745
Increase (decrease) in cash and cash equivalents (35,923) 85,302
Cash and cash equivalents at beginning of the period 125,636 40,334
Cash and cash equivalents at end of the period 89,713 125,636
33 2016 ANNUAL REPORT
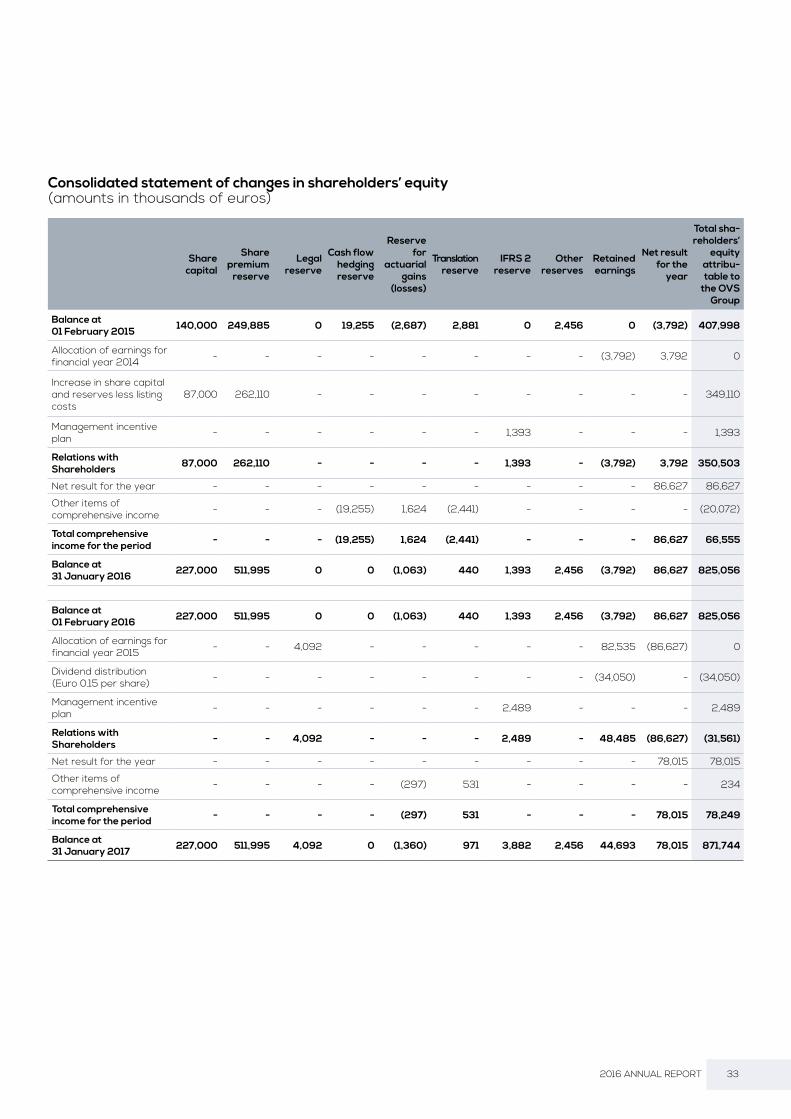
Consolidated statement of changes in shareholders’ equity(amounts in thousands of euros)
Share capital
Share premium
reserve
Legal reserve
Cash flow hedging reserve
Reserve for
actuarial gains
(losses)
Translation reserve
IFRS 2 reserve
Other reserves
Retained earnings
Net result for the
year
Total sha-reholders’
equity attribu-table to
the OVS Group
Balance at 01 February 2015 140,000 249,885 0 19,255 (2,687) 2,881 0 2,456 0 (3,792) 407,998
Allocation of earnings for financial year 2014 - - - - - - - - (3,792) 3,792 0
Increase in share capital and reserves less listing costs
87,000 262,110 - - - - - - - - 349,110
Management incentive plan - - - - - - 1,393 - - - 1,393
Relations with Shareholders 87,000 262,110 - - - - 1,393 - (3,792) 3,792 350,503
Net result for the year - - - - - - - - - 86,627 86,627
Other items of comprehensive income - - - (19,255) 1,624 (2,441) - - - - (20,072)
Total comprehensive income for the period - - - (19,255) 1,624 (2,441) - - - 86,627 66,555
Balance at 31 January 2016 227,000 511,995 0 0 (1,063) 440 1,393 2,456 (3,792) 86,627 825,056
Balance at 01 February 2016 227,000 511,995 0 0 (1,063) 440 1,393 2,456 (3,792) 86,627 825,056
Allocation of earnings for financial year 2015 - - 4,092 - - - - - 82,535 (86,627) 0
Dividend distribution (Euro 0.15 per share) - - - - - - - - (34,050) - (34,050)
Management incentive plan - - - - - - 2,489 - - - 2,489
Relations with Shareholders - - 4,092 - - - 2,489 - 48,485 (86,627) (31,561)
Net result for the year - - - - - - - - - 78,015 78,015
Other items of comprehensive income - - - - (297) 531 - - - - 234
Total comprehensive income for the period - - - - (297) 531 - - - 78,015 78,249
Balance at 31 January 2017 227,000 511,995 4,092 0 (1,360) 971 3,882 2,456 44,693 78,015 871,744

34 OVS SpA
GENERAL INFORMATION
OVS SpA (hereinafter also the “Company” or the “Parent Company”) is a company incorporated on 14 May 2014, domiciled in Italy and organised under the laws of the Italian Republic, with its registered office at 17, via Terraglio, Mestre, Venice, Italy.
Borsa Italiana, with Provision 8006 of 10 February 2015, approved the admission to trading of the Company’s shares on the Mercato Telematico Azionario (MTA), organised and managed by OVS SpA.The start of trading on the MTA was set by Borsa Italiana for Monday, 2 March 2015. The subscription operation entailed a capital increase of €87,000,000, taking the share capital from €140,000,000 to €227,000,000, divided into 227,000,000 ordinary shares with no par value.
STRUCTURE AND CONTENT OF THE FINANCIAL STATEMENTS
The consolidated financial statements of the OVS Group at 31 January 2017 were prepared in accordance with the International Financial Reporting Standards (“IFRS”) issued by the International Accounting Standards Board. “IFRS” is intended to mean all the revised International Accounting Standards (IAS), and all the interpretations of the International Financial Reporting Interpretations Committee (IFRIC), including those previously issued by the Standing Interpretations Committee (SIC). At the reporting date for the consolidated financial statements, these had been approved by the European Union under the procedure set forth in (EC) Regulation 1606/2002 of the European Parliament and the European Council of 19 July 2002.
The consolidated financial statements of the OVS Group, which comprise the consolidated statement of financial position, the consolidated income statement, the consolidated statement of comprehensive income, the consolidated statement of cash flows, the consolidated statement of changes in consolidated shareholders’ equity and the notes to the financial statements, are presented in euros as the current currency of the economies in which the Group chiefly operates, unless otherwise indicated.
These consolidated financial statements were prepared on a going concern basis, as the directors have verified the absence of any financial, operational or other indicators that could signal problems with the Group’s ability to meet its obligations in the foreseeable future, and particularly in the next 12 months.
With regard to procedures for the presentation of the consolidated accounts, in the context of the options provided for by IAS 1, OVS SpA has opted for the following types of accounting schedules:
• Statement of financial position: assets and liabilities are classified with current and non-current items shown separately;
• Income statement: prepared separately from the statement of comprehensive income with operating costs classified by nature;
• Statement of comprehensive income: includes, as well as net profit, changes in shareholders’ equity related to items of an economic nature which, by express provision of the international accounting standards, are recognised as components of shareholders’ equity;
• Statement of cash flows: the statement shows the cash flows from operating, investment and financing activities. The indirect method was used to prepare this statement;
NOTES TO THE FINANCIAL STATEMENTS

35 2016 ANNUAL REPORT
• Statement of changes in shareholders’ equity: shows net profit and each item of income and expense not posted to the income statement but recognised directly in equity pursuant to specific IAS/IFRS.
The schedules used, as specified above, provide the best representation of the OVS Group’s financial position and profit performance.The notes to the financial statements analyse, expand upon and comment on the values shown in the OVS Group’s consolidated financial statements. They are accompanied by additional information deemed necessary to give a true and fair view of the Group’s financial position and results.Changes in the items recognised under assets and liabilities and in the income statement are elaborated upon when they are significant.
The consolidated financial statements were prepared using the conventional historical cost method, altered as required for the valuation of some derivatives.Please see the Report on Operations for detailed information on the nature of the Group’s activity.
The financial statements have been audited by PricewaterhouseCoopers SpA.

36 OVS SpA
SCOPE OF CONSOLIDATION
The consolidated financial statements include, as well as the Parent Company’s financial statements, the financial statements of all the subsidiaries from the date at which control is assumed until the date at which this control ceases.The following is a list of companies included within the scope of consolidation on a line-by-line basis:
List of equity investments measured using the equity method:
On 1 October 2016, OVS SpA acquired 100% of the share capital of OVS Fashion España S.L., which manages the sales network in Spain, with 41 stores under franchise and one directly managed store.
As already indicated in the Report on Operations, on 18 September 2016 a minority stake was acquired in Sempione Retail AG (35%, for CHF 8.9 million), the company that made the friendly takeover offer for bearer shares of Charles Vögele Holding, a Swiss retailer operating in the clothing segment, with which OVS has subsequently entered into specific commercial agreements.
Company Registered office Share capital % investmentItalian company
OVS S.p.A. Venice - Mestre 227,000,000.00 EUR Parent Company
Foreign companiesOVS Department Stores D.O.O. Belgrade - Serbia 745,156,428 RSD 100%OVS Maloprodaja D.O.O. Zagreb - Croatia 20,000 HRK 100%OVS Bulgaria Eood Sofia - Bulgaria 2,870,000 BGN 100%OVS Hong Kong Sourcing Limited Hong Kong 585,000 HKD 100%OVS India Sourcing Private Ltd Delhi - India 15,000,000 INR 100%OBS Sales Private Ltd Delhi - India 15,000,000 INR 100%COSI International Ltd Hong Kong 10,000 HKD 100%COSI International (Shanghai) Ltd Shanghai - China 1,000,000 RMB 100%OVS Kids Greater China Ltd Hong Kong 1 HKD 100%OVS Fashion España S.L. Madrid - Spain 3,100.00 EUR 100%
Company Registered office Share capital % investment
Centomilacandele S.c.p.A. Milan 300,000.00 EUR 31.63%Sempione Retail AG Zurich - Switzerland 25,385,526.00 CHF 35.00%
37 2016 ANNUAL REPORT
ACCOUNTING POLICIES AND CONSOLIDATION CRITERIA
The consolidated financial statements include the financial statements of Parent Company OVS SpA and the companies over which it has the right to exercise control pursuant to IFRS 10. This standard stipulates that an investor controls an entity in which it has invested when it enjoys rights that confer the possibility of directing the entity’s significant activities, has an exposure or a right to receive variable returns from its involvement in the entity and has the real possibility of using its power to influence the amount of its returns from the investment. Equity investments held in companies over which significant influence is exercised (“associates”), which is presumed to exist when the percentage of the equity investment is between 20% and 50%, are measured using the equity method.Application of the equity method involves aligning the carrying amount of the equity investment with shareholders’ equity, adjusted where necessary to reflect the application of the IFRS approved by the European Commission (and includes any goodwill identified at the time of acquisition). The share of gains/losses realised by the associate after the acquisition is recognised in the income statement, while the share of movements in reserves after the acquisition is booked in equity reserves. When the Group’s share of losses in an associate is equal to or more than its minority interest in this associate, taking any unsecured credit into account, the value of the investment is reduced to zero and the Group recognises no further losses other than those pertaining to it, unless and to the extent that the Group is obliged to meet them. Unrealised gains and losses on transactions with associates are eliminated according to the value of the Group’s equity investment in these associates.The “joint arrangements” (agreements under which two or more parties hold common control, within the meaning of IFRS 11) are included, where they exist, according to the equity method, if they qualify as joint ventures, or by recognising their specific shares of assets, liabilities, costs and revenues, if they qualify as joint operations.The financial statements of the subsidiaries are consolidated line-by-line in the consolidated financial statements from the date at which control is assumed until the date at which this control ceases. Where necessary, the financial statements used to prepare the consolidated financial statements have been appropriately restated and adjusted to comply with the Group’s accounting policies.
The following consolidation criteria are used:
• for equity investments consolidated line by line, the carrying amount of the individual consolidated equity investments is eliminated against the relative shareholders’ equity, with the assumption of the assets, liabilities, costs and revenues of the subsidiaries, regardless of the size of the investment held; any share of shareholders’ equity and net profit attributable to minorities are identified separately in shareholders’ equity and in the income statement;
• all inter-company balances and transactions are eliminated, as are profits and losses (the latter only if they do not represent effective impairment of the asset transferred) arising from commercial transactions, including the sale of business units in the Parent Company’s subsidiaries, or financial inter-company transactions not yet realised with third parties;
• all increases/decreases in the shareholders’ equity of the consolidated companies arising from results generated after the date of acquisition of the equity investment are booked to a dedicated equity reserve named “Retained earnings (accumulated losses)” at the time of the elision;
• the dividends distributed to Group companies are eliminated in the income statement at the time of consolidation.

38 OVS SpA
• changes in the percentage of ownership of subsidiaries that do not entail a loss of control, or that represent increases after control has been acquired, are recognised under changes in shareholders’ equity.
Business combinations
The Group recognises business combinations using the acquisition method pursuant to IFRS 3 - Business Combinations.
Under this method, the consideration transferred to a business combination is measured at fair value, calculated as the sum of the fair values of the assets transferred and the liabilities assumed at the acquisition date. The ancillary costs of the transaction are usually recognised in the income statement when they are incurred.
Goodwill is determined as the excess of the sum of the considerations transferred to the business combination, shareholders’ equity attributable to third parties and the fair value of any equity investment previously held in the acquiree, over the fair value of the net assets acquired and liabilities assumed at the acquisition date.
If a business combination takes place in stages with successive purchases of shares, each phase is valued separately, using the cost and information on the fair value of the assets, liabilities and contingent liabilities at the date of each operation to determine the amount of any difference. When a subsequent purchase means that control of a company is obtained, the stake previously held is re-presented based on the fair value of the identifiable assets, liabilities and contingent liabilities determined at the date that control is taken, and the difference is recognised in the income statement.
Financial statements in foreign currencies
The translation into euros of the financial statements of foreign subsidiaries denominated in currencies other than the Euro is carried out by applying the exchange rates in force at the end of the year to assets and liabilities and applying average exchange rates in the period to income statement items, while shareholders’ equity is recognised at historical exchange rates, usually identified as the exchange rates at the end of the first year in which the investee company was included in the scope of consolidation.Exchange rate gains or losses arising from the translation of financial statements presented in foreign currencies using the above methods are cumulatively recognised under other comprehensive income in a specific equity reserve until the equity investments are disposed of.The exchange rates used for translation are shown in the following table:
Final exchange rate at Average exchange rateCurrency Code 31.01.2017 31.01.2016 FY 2016 FY 2015US dollar USD 1.08 1.09 1.10 1.10Hong Kong dollar HKD 8.34 8.51 8.57 8.56Chinese renminbi RMB 7.40 7.18 7.37 6.97Croatian kuna HRK 7.48 7.66 7.52 7.61Serbian dinar RSD 123.99 123.73 123.19 120.68Bulgarian lev BGN 1.96 1.96 1.96 1.96Indian rupee INR 72.80 74.10 74.28 71.27

39 2016 ANNUAL REPORT
ACCOUNTING POLICIES AND VALUATION CRITERIA
The main accounting policies and valuation criteria used by the Group are described below.
Goodwill
Goodwill is recognised at cost, less any accumulated impairment.Goodwill acquired as part of a business combination is determined as the excess of the sum of the considerations transferred to the business combination, shareholders’ equity attributable to third parties and the fair value of any equity investment previously held in the acquiree, over the fair value of the net assets acquired and liabilities assumed at the acquisition date.If the value of the net assets acquired and liabilities assumed exceeds the sum of the considerations transferred, the shareholders’ equity attributable to third parties and the fair value of any equity investment previously held in the acquiree, the excess amount is immediately recognised in the income statement as income.Goodwill is not amortised, but is tested annually, and whenever events or circumstances indicate the possibility of impairment, for recoverability pursuant to IAS 36 - Impairment of Assets.If the recoverable amount is lower than the carrying amount, the asset is written down to the recoverable amount. If goodwill is allocated to a cash-generating unit that is partially transferred/disposed of, the goodwill associated with this unit is used to determine any gain/loss arising from the operation.
Brands
Brands deriving from business combinations are recognised at fair value at the date of the combination, according to the acquisition method. They are not amortised as they have an indefinite useful life, but are tested annually, and whenever events or circumstances indicate the possibility of impairment, for recoverability pursuant to IAS 36 - Impairment of Assets. After initial recognition, the brands are valued at cost less any cumulative impairment.
Intangible assets
Intangible assets consist of non-monetary items, identifiable and without physical substance, which can be controlled by the Group, can generate future economic benefits and whose cost can be reliably determined. These items are recognised at cost, less amortisation, calculated using the straight-line method for a period corresponding to the useful life, and any impairment. Useful life is reviewed annually. Specifically:
Licences – Licences deriving from business combinations are recognised at fair value at the date of the combination, according to the acquisition method. After initial recognition, licences are valued at cost less amortisation and any cumulative impairment. Amortisation is calculated based on the difference between the cost and the residual value at the end of their useful life, on a straight line basis over their useful life (defined as 40 years). Please see note 8 - “Intangible assets” for a description of the criteria used to define useful life and residual value at the end of useful life.

40 OVS SpA
Software – The costs of software licences, including ancillary costs, are capitalised and recognised in the financial statements net of amortisation and any cumulative impairment. The amortisation rate used is 20%.
Other intangible assets – These assets are measured at acquisition cost, less amortisation calculated on a straight-line basis throughout their useful life and cumulative impairment. The value of the franchising network recognised post-business combination is amortised on the basis of a useful life of 20 years.
Property, plant and equipment
Property, plant and equipment is measured at acquisition cost, including ancillary costs booked directly, less depreciation and cumulative impairment. Land is not depreciated even if acquired at the same time as buildings. Depreciation is booked from the month in which the assets enter into operation. Depreciation rates are charged on a monthly basis at constant rates that allow assets to be depreciated until their useful life is ended or, in the case of disposals, until the last month of use.The depreciation rates used are as follows:
Ordinary maintenance costs are charged in full to the income statement in the period in which they are incurred. Leasehold improvements are classified as tangible assets. The amortisation period is the lesser of the remaining useful life of the tangible asset and the remaining term of the lease.Assets assumed through finance leases, through which all the risks and rewards of ownership are substantially transferred to the Group, are recognised under tangible assets at their current value, or, if lower, the present value of the minimum lease payments, with a contra-entry of financial debt to the lessor. This debt is progressively reduced according to the plan for repayment of principal amounts included in the contractually established payments, while the value of the asset recognised under tangible assets is systematically depreciated according to the economic and technical life of the asset.
Buildings 3-6%Light construction 10%Plant and equipment for lifting, loading, unloading and weighing 7.5%Miscellaneous machinery, appliances and equipment 11.1%Special facilities for communications and remote signalling 25%Furnishings 11.1%Alarm systems 11.1%Specific bar, restaurant and canteen facilities 8%Bar, restaurant and canteen furnishings 25%Office furniture and ordinary machinery 12%Electromechanical and electronic office equipment 20%Cash registers 20%Motor vehicles and internal transport 20-25%

41 2016 ANNUAL REPORT
Impairment of tangible and intangible assets
IAS 36 stipulates that impairment of tangible and intangible assets must be measured if there are indicators suggesting that such a problem might exist.Impairment testing takes place at least once a year in the case of goodwill, other intangible assets with an indefinite useful life and assets not available for use.The recoverability of the amounts recognised is assessed by comparing the carrying amount with the higher of fair value (current realisable value) less the costs of disposal and the value in use of the asset. Value in use is defined by discounting the expected cash flows generated by the asset.To determine value in use, expected future cash flows are discounted using a rate that reflects current market valuations of the time value of money, compared with the investment period and the specific risks associated with the activity.For the purposes of assessing impairment, assets are analysed starting from the lowest level for which there are separately identifiable independent cash flows (cash generating units). Within the Group, the individual OVS and Upim stores have been identified as cash generating units. If the recoverable amount of an asset is lower than the carrying amount, the carrying amount is reduced to the recoverable amount. This reduction constitutes impairment and is charged to the income statement.If there is an indicator of reversal of the impairment loss, the recoverable amount of the asset is recalculated and the carrying amount is increased to this new amount. The increase in the carrying amount may not, however, exceed the net carrying amount that the asset would have had if the impairment had not arisen.Goodwill impairment cannot be reversed.
Other equity investments
Other equity investments (i.e. other than in subsidiaries, associates and joint ventures), where these exist, are included among non-current assets, or among current assets if they will remain among the assets of the OVS Group, for a period of, respectively, more than one year and no longer than one year.Other equity investments constituting financial assets available for sale are measured at fair value, if this can be determined, and any gains or losses deriving from changes in the fair value are entered directly under other comprehensive gains/(losses), until they are transferred or undergo impairment, at which time the other comprehensive gains/(losses) previously recognised in equity are recognised in the income statement for the period.Other equity investments for which the fair value is not available are recognised at cost, written down for any impairment.
Financial assets
Financial assets are recognised under current and non-current assets based on maturity and expectations of when they will be converted into monetary assets. Financial assets include equity investments in other companies (other than associates and joint ventures), derivatives, receivables, and cash and cash equivalents.

42 OVS SpA
A) CLASSIFICATIONFor the purposes of measurement, the Group subdivides financial assets into the following categories: financial assets at fair value through profit or loss, loans and receivables, financial assets held to maturity and financial assets available for sale. Classification depends on the purpose for which the financial asset was acquired. Financial assets are classified at the time of initial recognition.
I. Financial assets measured at fair value through profit or lossThis category includes both financial assets held for trading and derivatives that do not meet the criteria for hedge accounting.
II. Loans and receivablesLoans and receivables comprise non-derivative financial assets with fixed or determinable maturities. They are recognised under current assets, except for the portion falling due beyond the 12-month period after the reporting date, which are classified as non-current assets.
III. Financial assets held to maturityFinancial assets held to maturity comprise non-derivative assets with fixed or determinable payments that the Group intends to hold to maturity. Classification to current or non-current assets depends on whether they are expected to be realised within or beyond the 12-month period after the reporting date.
IV. Financial assets available for saleFinancial assets available for sale represent a residual category comprising financial instruments that are not derivative or not attributable to any of the above categories of financial instruments. These assets are included among non-current assets, unless there is an intention to dispose of them within the 12-month period after the reporting date.
B) RECOGNITION AND MEASUREMENTFinancial assets, regardless of how they are classified, are initially recognised at fair value, with possible additions for ancillary acquisition costs.After initial recognition, financial assets at fair value through profit or loss and financial assets available for sale are recognised at fair value. In the first case, changes in fair value are posted to the income statement in the period in which they take place; in the second, they are posted to the statement of comprehensive income. Loans and receivables and financial assets held to maturity are recognised using the amortised cost criterion and the effective interest rate method after initial recognition. Any impairment is recorded in the income statement to offset the value of the asset. The value of assets previously written down for impairment is reversed if the circumstances that led to the write-down no longer exist.Financial assets are eliminated from the financial statements when the rights to receive the cash flows associated with the financial assets expire or have been transferred to third parties and the Group has substantially transferred all the risks and benefits of ownership.For the treatment of derivatives, please see the relevant section below.

43 2016 ANNUAL REPORT
Inventories
Inventories are recognised at the lower of acquisition cost and net realisable value.The purchase cost is determined by configuring the weighted average cost for the reporting period. The cost also includes ancillary costs directly attributable to the purchase of merchandise.Goods relating to the collections are written down according to the presumed possibility of future realisation, by recognising a specific adjustment provision.
Cash and cash equivalents
Cash and cash equivalents includes available cash and credit balances of bank current accounts with no limits or restrictions.Cash in foreign currency is valued according to period-end exchange rates.
Provision for risks and charges
Provisions for risks and charges are allocated for current obligations, legal or constructive, arising from a past event in respect of third parties for which the utilisation of resources, the amount of which can be reliably estimated, is probable.The amount recognised as a provision is the best estimate of the expenditure required to settle the current obligation fully. Risks for which the emergence of a liability is only possible are disclosed in the notes to the financial statements, and no provision is made.
Employee benefits
A) PENSION PLANSPost-employment benefits are defined under either “defined contribution” plans or “defined benefit” plans.Defined benefit plans, such as the provision for employee severance benefits accrued before the entry into force of the 2007 Budget, are plans with guaranteed benefits for employees that are paid out at the end of the employment relationship. The liability relating to defined benefit plans is determined on the basis of actuarial assumptions and booked on an accruals basis in line with the service required to obtain the benefits; the liability is measured annually by independent actuaries.Employee severance benefits and pension provisions, which are determined using an actuarial method, provide for the recognition in the income statement under employment cost of the rights accrued during the year, while the figurative cost is included among net financial income (expenses). Actuarial gains and losses that reflect the effects of changes in the actuarial assumptions used are instead fully recognised in specific equity reserve in the year in which they arise, with immediate recognition in the statement of comprehensive income. From 1 January 2007, the 2007 Budget and the associated implementing decrees introduced significant amendments to the rules on employee severance benefits, including options for employees, to be exercised by 30 June 2007, with regard to the allocation of their accruing severance benefits. Specifically, new flows of severance benefits may be directed by the employee to preselected or company pension schemes (in the latter case, the company will pay severance benefit contributions into a treasury account set up with the INPS (the Italian social security and welfare institution)).As a result of these amendments, the provision for employee severance benefits accrued since the date of the employee option (defined benefit plan) has been recalculated by independent actuaries to exclude the component relating to future pay increases.

44 OVS SpA
The portion of the employee severance benefits that has accrued since the option date (30 June 2007) is regarded as a defined benefit plan, and the accounting treatment is similar to that used for all other contribution payments.Employee benefits also include pension provisions and similar obligations. This provision mainly includes liabilities and rights accrued by the employees of the former Standa, in relation to supplementary pension schemes; the liability associated with such defined-benefit programmes is determined on the basis of actuarial assumptions and the amount recognised in the financial statements represents the present value of the OVS Group’s obligation.
B) COMPENSATION PLANS IN THE FORM OF STOCK OPTIONSThe Group provides additional benefits to certain employees and consultants through stock option plans offering equity-settled stock options. In accordance with IFRS 2 - Share-based Payments, the current value of the stock options determined at the grant date using the “Black & Scholes” method is recognised in the income statement under staff costs on a straight -line basis over the period between the grant date of the stock options and the vesting date, with a direct contra-entry in shareholders’ equity.The effects of granting conditions not related to the market are not taken into account in the evaluation of the fair value of the options granted, but are relevant to the evaluation of the number of options expected to be exercised.At the reporting date the Group reviews its estimates of the number of options that are expected to be exercised. The effect of the review of the original estimates is recognised in the income statement over the vesting period with a contra-entry in shareholders’ equity.When the stock options are exercised, the amounts received from the employee, net of costs directly attributable to the transaction, are credited to the share capital in an amount equal to the nominal value of the issued shares, with the remaining portion credited to the share premium reserve.
Financial liabilities and trade and other payables Payables and other financial and/or trade liabilities are initially recognised at fair value, less any transaction costs incurred in relation to obtaining financing. They are subsequently carried at amortised cost; any difference between the amount received (less transaction costs) and the total repayment amount is recognised in the income statement over the period of the loan, using the effective interest rate method. Borrowings are classified as current liabilities unless the Group has an unconditional right to defer settlement of the liability for 12 months after the reporting date; in this case, only the portion falling due within 12 months of the reporting date is classified as a current liability.
Derivatives
Derivatives are assets and liabilities recognised at fair value.The Group uses derivatives to hedge foreign exchange risk or interest rate risk. Pursuant to IAS 39, derivatives may only be booked using hedge accounting methods when:
• at the beginning of the hedge there is formal designation and documentation of the hedging relationship;
• it is assumed that the hedge is highly effective;
• effectiveness can be reliably measured;

45 2016 ANNUAL REPORT
• the hedge is highly effective throughout the financial reporting periods for which it is designated.
When derivatives meet the criteria for hedge accounting, the following accounting treatments apply:
• if the derivatives hedge the risk of changes in the fair value of the assets or liabilities being hedged (fair value hedge, e.g. hedging of fluctuations in the fair value of fixed-rate assets/liabilities), the derivatives are recognised at fair value through profit or loss; correspondingly, the assets or liabilities being hedged are adjusted to reflect changes in fair value associated with the hedged risk;
• if the derivatives hedge the risk of changes in the cash flows of the assets or liabilities being hedged (cash flow hedge, e.g. hedging of changes in the cash flows of assets/liabilities due to variations in interest rates), changes in the fair value of the derivatives are initially recognised in equity and subsequently in profit or loss in line with the economic effects of the hedged transaction.
If hedge accounting cannot be applied, gains or losses arising from the measurement of the derivative at fair value are immediately recognised in the income statement.
Segment information
The information relating to business segments was provided pursuant to IFRS 8 - Operating segments, which stipulates that information be presented in a way that is consistent with the procedures used by management to make operational decisions. The operating segments and the information presented are therefore identified according to the internal reports used by management to allocate resources to the various segments and to analyse their performance.IFRS 8 defines an operating segment as a component of an entity that: i) engages in business activities from which it may earn revenues and incur expenses (including revenues and expenses relating to transactions with other components of the same entity); ii) whose operating results are reviewed regularly by the entity’s chief operating decision maker to make decisions about resources to be allocated to the segment and assess its performance; and iii) for which discrete financial information is available.The operating segments identified by management, which incorporate all of the services and products provided to customers, are represented by the OVS division, dedicated to the marketing of clothing products for the value fashion market segment, and the Upim division, which provides value segment of the Italian market, as well as products relating to the homeware and fragrance segments.
Revenues and costs
Revenues from the sales of directly operated stores are recognised when the customer makes the payment. Revenues from the sale of goods are recognised in the income statement when the risks and benefits related to the product sold are transferred to the customer, usually coinciding with the delivery or shipment of the goods to the customer; revenues for services are recognised in the period in which the services are rendered, with reference to completion of the service provided and as a proportion of the total services still to be rendered.Revenues are recognised at the fair value of the consideration received. Revenues are recognised net of value added tax, expected returns and any trade discounts, rebates and bonuses granted.

46 OVS SpA
Costs are recognised when they relate to goods and services sold or used during the year, while in the case of multi-year use the costs are systematically spread.
Income and costs deriving from leases
Income and costs deriving from operating leases are recognised on a straight-line basis over the duration of the leases to which they relate.
Income tax
Current income tax for the year is calculated by applying the current tax rates on reasonably estimated taxable income, determined in accordance with the tax regulations in force. The expected payable, net of payments on account and withholding taxes, is recognised in the statement of financial position under “Current tax liabilities”, (or under “Current tax assets” if the payments on account made and the withholdings exceed the expected payable).Deferred tax assets and deferred tax liabilities are determined on the basis of taxable temporary differences between the carrying amount of assets and liabilities and their value for tax purposes, except for goodwill, which is not tax deductible, and are classified under non-current assets and liabilities.Income tax is recognised in the income statement, except in relation to items directly credited to or debited from equity, in which case the tax effect is recognised directly in equity.Deferred tax assets, including those relating to any previous tax losses, are recognised to the extent that it is probable that future taxable income will be available in respect of which they can be recovered.The value of deferred tax assets is reviewed at each reporting date and reduced to the extent that it is no longer probable that sufficient taxable income will be available in the future to use all or part of this receivable.Deferred tax assets and deferred tax liabilities are measured at the tax rates that are expected to apply in the period when the asset is realised or the liability is settled, based on the tax rates in force and tax rates that have been enacted or substantively enacted at the reporting date.During 2016, when Gruppo Coin SpA no longer met the requirements for control over OVS SpA pursuant to tax law, group taxation ended. Consequently, the consolidating company and the consolidated company opted back out of the tax consolidation scheme, with effect from fiscal 2016.
Exchange rate gains and losses
Foreign exchange transactions are recognised at the current exchange rate at the date of completion of the transaction. Monetary assets and liabilities denominated in foreign currencies are translated into euros at the current exchange rate at the reporting date and recognised in the income statement under the “Exchange rate gains and losses” item.
Earnings per share
EARNINGS PER SHARE - BASICBasic earnings per share is calculated by dividing the profit pertaining to the OVS Group by the weighted average of the ordinary shares outstanding during the year, excluding treasury shares.

47 2016 ANNUAL REPORT
EARNINGS PER SHARE - DILUTEDDiluted earnings per share is calculated by dividing the profit pertaining to the OVS Group by the weighted average of the ordinary shares outstanding during the year, excluding treasury shares. To calculate diluted earnings per share, the weighted average number of shares outstanding is adjusted assuming the exercise by all owners of rights with a potentially dilutive effect, while the profit pertaining to the OVS Group is adjusted to take account of any effects, net of tax, arising from the exercise of these rights.
Dividends
Dividends are recognised at the date of approval by the general meeting.
Use of estimates
The preparation of the consolidated financial statements in accordance with the IFRSs requires management to make estimates and assumptions that affect the reported amounts of assets and liabilities and the disclosure of contingent assets and liabilities at the reporting date. The final results may differ from these estimates. Estimates are used to recognise provisions for doubtful accounts, inventory obsolescence, depreciation and amortisation, impairment of assets, employee benefits, restructuring provisions, deferred tax assets, other provisions for risk and valuations of derivatives. Estimates and assumptions are reviewed periodically and the effects of any changes are immediately reflected in the income statement.
IMPAIRMENT OF TANGIBLE AND INTANGIBLE ASSETSGoodwill and the brands are tested annually, and whenever events or circumstances indicate the possibility of impairment, for recoverability pursuant to IAS 36 - Impairment of Assets. If the recoverable amount is less than the carrying amount, the asset is written down to its recoverable amount (defined as the greater of its value in use and its fair value). Verification of the amount requires subjective judgements to be made, based on information available within the OVS Group and from the market, as well as past experience. In addition, if potential impairment is identified, it is determined using evaluation techniques regarded as appropriate. The same verifications of value and the same evaluation techniques are applied to intangible and tangible assets with a definite useful life when there are indicators suggesting that recovery of the relative net carrying amount through use might be difficult. The correct identification of indicators of potential impairment and estimates to determine this depend on factors that may vary over time, with an effect on the valuations and estimates made by the OVS Group.
DEPRECIATION AND AMORTISATIONDepreciation and amortisation reflect the best estimate of the expected useful life of assets with a finite life.This estimate is based on the possibility of using these assets and their capacity to contribute to the OVS Group’s results in future years.
INVENTORY OBSOLESCENCEThe OVS Group develops and sells items of clothing that change according to customer taste and trends in the world fashion. The provision for inventory write-downs therefore reflects estimated expected impairment of the collections in stock, taking account of the OVS Group’s capacity to sell items of clothing through a range of distribution channels.

48 OVS SpA
PROVISIONS FOR DOUBTFUL ACCOUNTSThe provision for doubtful accounts reflects the best estimate of losses relating to the portfolio of trade receivables. This estimate is based on the losses expected by the OVS Group, determined on the basis of past experience with similar receivables, current and previous receivables falling due, the careful monitoring of credit quality and projections of economic and market conditions.
DEFERRED TAX ASSETSDeferred tax assets are booked based on expectations of taxable income in future years for the purpose of recovering them. The evaluation of expected taxable income for the accounting of deferred tax assets depends on factors that may vary over time and have significant effects on the recoverability of the deferred tax assets.
PENSION FUNDS AND OTHER EMPLOYEE BENEFITSThe cost of the defined benefit pension plans is determined using actuarial valuations. The actuarial valuations involve making assumptions about discount rates, expected rates of return on investments, future salary increases, mortality rates and future pension increases. Because of the long-term nature of these plans, such estimates are subject to significant uncertainty. Further details are provided in note 15.The costs recognised in the income statement in relation to incentive plans for managers (please see the explanations in note 22 “Staff costs”) are mainly influenced by the estimated timing of the occurrence of the event that triggers vesting, as well as the actual possibility of the occurrence of the event and the presumed reference value of the plan. Therefore, this estimate depends on factors that may vary over time and variables that the directors might find it hard to predict and determine. Changes in these items may significantly influence the assessments made by the directors and therefore result in changes in the estimates.
PROVISIONS FOR RISKS AND CHARGESProvisions representing the risk of a negative outcome are recognised for legal and tax risks. The amount of provisions recorded in the financial statements in relation to these risks represents the best estimate to deal with potential risks. This estimate entails the use of assumptions that depend on factors that might change over time and that might therefore have significant effects compared with the current estimates used to prepare the financial statements.
VALUATION OF DERIVATIVESThe determination of the fair value of unlisted financial assets, such as derivatives, takes place using commonly used valuation techniques that require basic assumptions and estimates. These assumptions may not occur within the time frames and in the manner envisaged. Estimates of derivatives may therefore differ from the final figures.
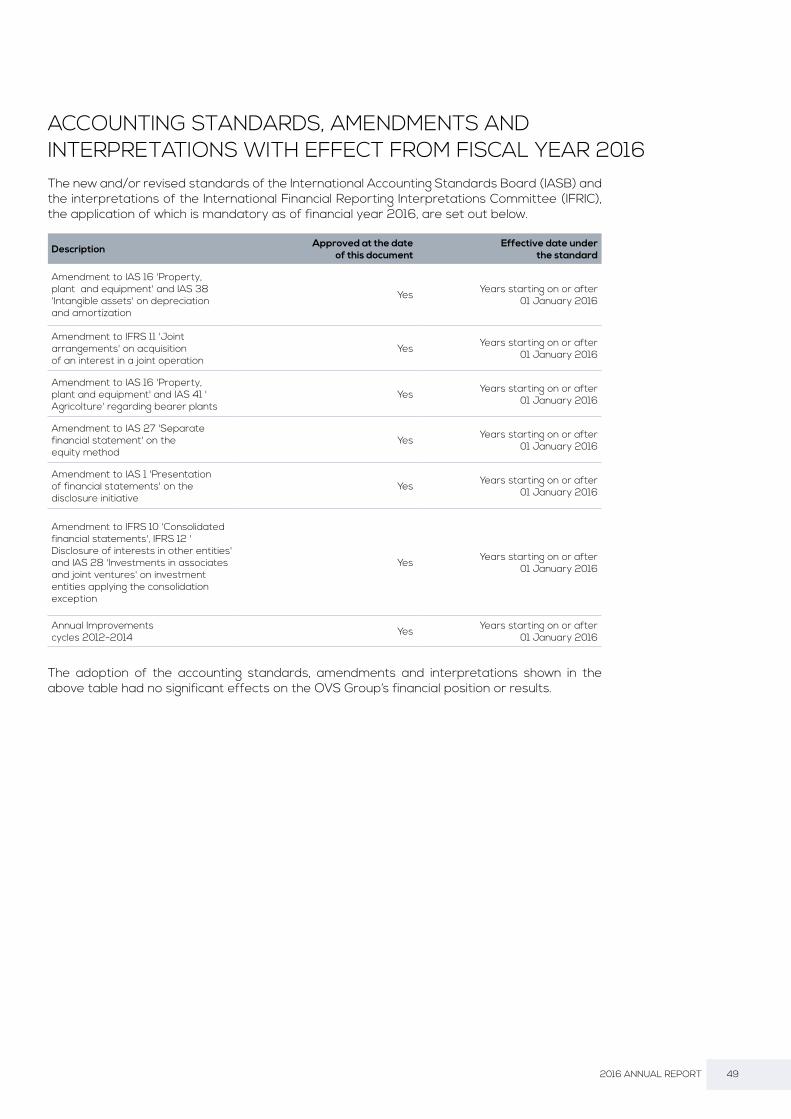
49 2016 ANNUAL REPORT
The new and/or revised standards of the International Accounting Standards Board (IASB) and the interpretations of the International Financial Reporting Interpretations Committee (IFRIC), the application of which is mandatory as of financial year 2016, are set out below.
The adoption of the accounting standards, amendments and interpretations shown in the above table had no significant effects on the OVS Group’s financial position or results.
ACCOUNTING STANDARDS, AMENDMENTS AND INTERPRETATIONS WITH EFFECT FROM FISCAL YEAR 2016
Description Approved at the date of this document
Effective date under the standard
Amendment to IAS 16 'Property, plant and equipment' and IAS 38 'Intangible assets' on depreciation and amortization
Yes Years starting on or after 01 January 2016
Amendment to IFRS 11 'Joint arrangements' on acquisition of an interest in a joint operation
Yes Years starting on or after 01 January 2016
Amendment to IAS 16 'Property, plant and equipment' and IAS 41 'Agricolture' regarding bearer plants
Yes Years starting on or after 01 January 2016
Amendment to IAS 27 'Separate financial statement' on the equity method
Yes Years starting on or after 01 January 2016
Amendment to IAS 1 'Presentation of financial statements' on the disclosure initiative
Yes Years starting on or after 01 January 2016
Amendment to IFRS 10 'Consolidated financial statements', IFRS 12 'Disclosure of interests in other entities' and IAS 28 'Investments in associates and joint ventures' on investment entities applying the consolidation exception
Yes Years starting on or after 01 January 2016
Annual Improvements cycles 2012-2014 Yes Years starting on or after
01 January 2016

50 OVS SpA
On 22 September 2016, the European Union issued Regulation 2016/1905, which approved IFRS 15 - Revenue from Contracts with Customers. IFRS 15 requires the recognition of revenue in an amount reflecting the consideration to which the entity believes it is entitled in exchange for the transfer of goods or services to the customer. The new standard will replace all current IFRS requirements relating to revenue recognition. The standard will be effective for financial years starting on or after 1 January 2018, with full retrospective or amended application.Early application is permitted. The Group plans to apply the new standard from the mandatory effective date.The assessment of the effects of the new standard is in the preliminary phase of a broader project that will take shape during 2017. Contracts with customers in which the sale of goods is the only obligation are not expected to have an impact when the new principle is applied. The Group expects that revenue recognition will take place as soon as control of the asset has been transferred to the customer, generally at the time of delivery of the asset. The Group therefore does not anticipate any material effects on its shareholders’ equity, but reserves the right to carry out, as previously mentioned, a more detailed analysis that takes account of all the available information.
On 22 November 2016, the European Union issued Regulation 2016/2067, which approved IFRS 9 - Financial Instruments, which replaces IAS 39 - Financial Instruments: Recognition and Measurement and all previous versions of IFRS 9. IFRS 9 brings together all aspects relating to the accounting of financial instruments, including classification and measurement, impairment and hedge accounting. The standard will be effective for financial years starting on or after 1 January 2018; early application is permitted. With the exception of hedge accounting (which is applied prospectively, with some exceptions), retrospective application of the principle is required, but the provision of comparative information is not mandatory. The Group will adopt the new standard from the effective date. The Group does not expect the application of the classification and measurement requirements of IFRS 9 to have material effects on its financial statements, including in respect of expected losses on receivables, although it reserves the right to carry out a more detailed analysis. Lastly, as regards hedge accounting, it should be noted that the Group does not currently have hedging relationships designated as effective hedges under IAS 39.
NEW ACCOUNTING STANDARDS AND INTERPRETATIONS APPROVED BY THE EUROPEAN UNION AND EFFECTIVE FOR FINANCIAL YEARS STARTING ON OR AFTER 31 JANUARY 2017

51 2016 ANNUAL REPORT
The international accounting standards, interpretations, amendments to existing accounting standards and interpretations, or specific provisions contained in the standards and interpretations approved by the IASB, not yet approved for adoption in Europe at the approval date of this document, are set out below:
It should be noted that IFRS 16 (not yet endorsed by the European Union) was published in January 2016 and replaces IAS 17, IFRIC 4, SIC-15 and SIC-27. IFRS 16 defines principles for the recognition, measurement, presentation and disclosure of leases, and requires lessees to account for all lease agreements in the balance sheet based on a single model, similar to that used to account for finance leases under IAS 17. The standard provides for two exemptions for lessee recognition of lease agreements for “low value” assets (such as personal computers) and short-term lease agreements (e.g. agreements ending within 12 months or less). At the beginning of the lease agreement, the lessee will recognise a liability for the payments provided for under the lease agreement and an intangible asset that represents the right to use the underlying asset for the duration of the lease. Lessees will have to recognise interest expense for lease liabilities and amortisation of the right to the intangible assets separately. Lessees will also have to remeasure lease liabilities when certain events occur (for example, a change in the
ACCOUNTING STANDARDS, AMENDMENTS AND INTERPRETATIONS NOT YET APPLICABLE AND NOT ADOPTED IN ADVANCE BY THE OVS GROUP
Description Approved at the date of this document
Effective date under the standard
IFRIC Interpretation 22 Foreign Currency Transactions and Advance Consideration
No Years starting on or after 01 January 2018
Amendment to IAS 40: Transfers of Investment property No Years starting on or after
01 January 2018
Amendment to IFRS 4: Applying IFRS 9 Financial Instruments with IFRS 4 Insurance contracts
No Years starting on or after 01 January 2018
Clarifications to IFRS 15 ‘Revenue from contracts with customers’ No Years starting on or after
01 January 2018
Amendments to IFRS 10, ‘Consoli-dated financial statements’ and IAS 28 ‘Investments in associates and joint ventures’; Sale or contribution of assets between an investor and its associate/joint venture
No Suspended
Amendment to IAS 7 'Statement of cash flow' on disclosure initiative No Years starting on or after
01 January 2017
Amendment to IAS 12 'Income taxes' on Recognition of deferred tax assets for unrealized losses
No Years starting on or after 01 January 2017
IFRS 16 'Leases' No
Years starting on or after 01 January 2019, with early
adoption permitted if together with the adoption of IFRS 15
Amendment to IFRS 2 'Share based payments' on clarifying how to account for certain types of share-based payment transactions
No Years starting on or after 01 January 2018
Annual Improvements cycles 2014-2016 No Years starting on or after
01 January 2018
52 OVS SpA
terms of the lease agreement, or a change in future lease payments resulting from the change in an index or rate used to determine those payments). IFRS 16 will be effective for financial years starting on or after 1 January 2019, with full retrospective or amended application. Early application is permitted, but not before the entity has adopted IFRS 15. The Group plans to apply the new standard from the mandatory effective date.In view of the number of passive lease agreements entered into by the OVS Group, relating to its DOS, it is reasonable to anticipate a very significant impact on its shareholders’ equity and profit. Consequently, also in the case of this new standard, the assessment of its associated effects is in the preliminary phase of a broader project that will take shape during 2017.
Finally, it should be noted that no accounting standards and/or interpretations for which application is mandatory for periods beginning on or after 1 February 2016 have been applied early.

53 2016 ANNUAL REPORT
The main corporate risks identified, monitored and - as specified below - actively managed by the OVS Group are as follows:
• market risk (defined as foreign exchange risk and interest rate risk);
• credit risk (relating both to normal commercial relationships with customers and to financing activity); and
• liquidity risk (relating to the availability of financial resources and access to the credit market, and to financial instruments in general).
The OVS Group aims to maintain balanced management of its financial exposure over time, to ensure that its liability structure is in balance with the composition of its balance-sheet assets and to provide the necessary operational flexibility through the use of cash generated by current operating assets and bank loans.Management of the relative risks is centrally guided and monitored. Specifically, the central finance function is responsible for evaluating and approving projected financial requirements, monitoring progress and establishing appropriate corrective action if necessary.The financial instruments most used by the OVS Group are as follows:
• medium/long-term loans to cover investments in non-current assets;
• short-term loans and use of credit lines on current accounts to fund working capital.
The OVS Group has also signed financial instruments to hedge the risks of fluctuating interest rates and derivative instruments, in order to reduce exchange rate risk in respect of the US dollar.
The following section provides qualitative and quantitative information on the impact of these risks on the OVS Group’s business.
Credit risk
Credit risk represents the OVS Group’s exposure to the risk of potential losses arising from default by counterparties.In the year under review, there were no significant concentrations of credit risk, as this risk is mitigated by the fact that credit exposure is spread over a large number of customers, mainly in Italy.To reduce credit risk, the OVS Group also obtains guarantees in the form of sureties in respect of loans granted for the supply of goods. At 31 January 2017, total guarantees amounted to €43.5 million, including €15.7 million in overdue receivables (€37.9 million at 31 January 2016, including €15.1 million in overdue receivables).Trade receivables are recognised net of write-downs calculated on the basis of the risk of counterparty default, determined by using available information on the solvency of the customer and taking historical data into account. Positions that are particularly significant, and that are objectively partially or totally irrecoverable, are written down individually. Trade receivables totalled €75.3 million at 31 January 2017 (€71.0 million at 31 January 2016).Written-down receivables came in at €8.1 million at 31 January 2017 (€7.5 million at 31 January 2016).Overdue receivables not written down, as the situation with regard to collection is not critical, amounted to €19.4 million (€23.6 million at 31 January 2016).The following tables provide a breakdown of trade receivables at 31 January 2017 and at 31
INFORMATION ON FINANCIAL RISKS

54 OVS SpA
January 2016, grouped according to maturity and net of the provision for doubtful accounts:
Liquidity risk
Liquidity risk can arise through an inability to access, under economically viable conditions, the financial resources necessary for the OVS Group to operate. The two main factors influencing the OVS Group’s liquidity levels are:
• the financial resources generated or absorbed by operating and investment activities;
• the expiry and renewal of financial debt.
The OVS Group’s liquidity requirements are monitored by the treasury function, in order to guarantee effective access to financial resources and adequate liquidity investment/yield levels.Management believes that the funds and credit lines currently available, in addition to those generated by operating and financing activities, will enable the OVS Group to meet its requirements in respect of investment activities, management of working capital and the repayment of debt when it is contractually due.The following table breaks down financial liabilities (including trade and other payables): in particular, all the flows shown are nominal future undiscounted cash flows, calculated with reference to residual contractual maturities (for both the principal portion and the interest portion). Loans have been included based on the contractual maturity of the repayment.
(*) The amount includes interest accrued but not yet paid at 31 January 2017.(**) The amount was calculated by applying the forward curve recorded at 31 January 2017 to the loan repayment plan. For the Revolving Line, an average utilisation level of 50% was assumed. The aggregate also includes the nominal value of interest on lease agreements until maturity and the value arising from future cash flows generated for derivative contracts that have a negative fair value at the reporting date.
(amounts in millions of euros) At 31 January 2017
Not yet matured
Matured within
90 days
Matured between 90
and 180 days
Matured beyond 180
days
Trade receivables 83.4 51.8 21.0 0.8 9.8Provision for doubtful accounts (8.1) - - - (8.1)Net value 75.3 51.8 21.0 0.8 1.7
(amounts in millions of euros) At 31 January 2016
Not yet matured
Matured within
90 days
Matured between 90
and 180 days
Matured beyond 180
days
Trade receivables 78.5 43.6 23.8 1.6 9.5Provision for doubtful accounts (7.5) - - - (7.5)Net value 71.0 43.6 23.8 1.6 2.0
(amounts in millions of euros)Balance at
31 January 2017
< 1 year 1-5 years > 5 years Total
Trade payables 367.6 367.3 0.3 - 367.6Payables to banks (*) 379.0 4.0 375.0 - 379.0Other financial payables 3.2 1.1 2.1 - 3.2Financial expenses payable to banks (**) 34.8 10.9 24.0 - 34.8Total 784.6 383.2 401.3 - 784.6
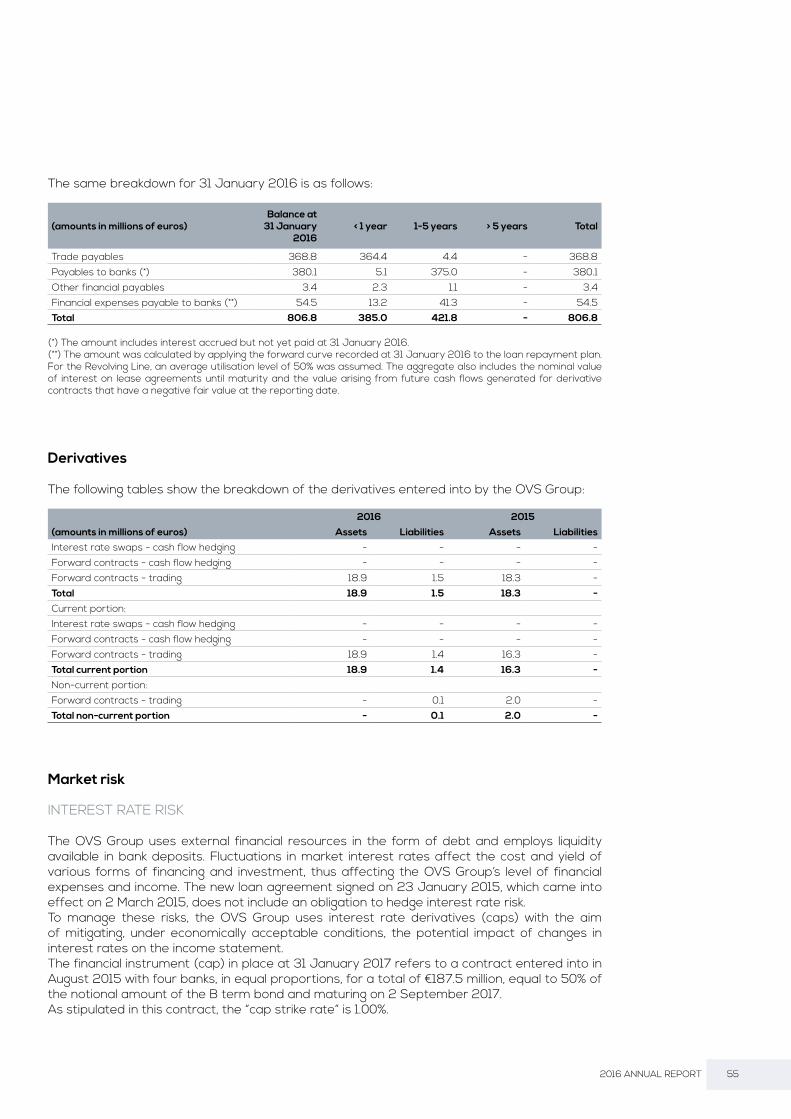
55 2016 ANNUAL REPORT
The same breakdown for 31 January 2016 is as follows:
(*) The amount includes interest accrued but not yet paid at 31 January 2016.(**) The amount was calculated by applying the forward curve recorded at 31 January 2016 to the loan repayment plan. For the Revolving Line, an average utilisation level of 50% was assumed. The aggregate also includes the nominal value of interest on lease agreements until maturity and the value arising from future cash flows generated for derivative contracts that have a negative fair value at the reporting date.
Derivatives
The following tables show the breakdown of the derivatives entered into by the OVS Group:
Market risk
INTEREST RATE RISK
The OVS Group uses external financial resources in the form of debt and employs liquidity available in bank deposits. Fluctuations in market interest rates affect the cost and yield of various forms of financing and investment, thus affecting the OVS Group’s level of financial expenses and income. The new loan agreement signed on 23 January 2015, which came into effect on 2 March 2015, does not include an obligation to hedge interest rate risk.To manage these risks, the OVS Group uses interest rate derivatives (caps) with the aim of mitigating, under economically acceptable conditions, the potential impact of changes in interest rates on the income statement. The financial instrument (cap) in place at 31 January 2017 refers to a contract entered into in August 2015 with four banks, in equal proportions, for a total of €187.5 million, equal to 50% of the notional amount of the B term bond and maturing on 2 September 2017. As stipulated in this contract, the “cap strike rate” is 1.00%.
2016 2015(amounts in millions of euros) Assets Liabilities Assets LiabilitiesInterest rate swaps - cash flow hedging - - - -Forward contracts - cash flow hedging - - - -Forward contracts - trading 18.9 1.5 18.3 -Total 18.9 1.5 18.3 -Current portion:Interest rate swaps - cash flow hedging - - - -Forward contracts - cash flow hedging - - - -Forward contracts - trading 18.9 1.4 16.3 -Total current portion 18.9 1.4 16.3 -Non-current portion:Forward contracts - trading - 0.1 2.0 -Total non-current portion - 0.1 2.0 -
(amounts in millions of euros)Balance at
31 January 2016
< 1 year 1-5 years > 5 years Total
Trade payables 368.8 364.4 4.4 - 368.8Payables to banks (*) 380.1 5.1 375.0 - 380.1Other financial payables 3.4 2.3 1.1 - 3.4Financial expenses payable to banks (**) 54.5 13.2 41.3 - 54.5Total 806.8 385.0 421.8 - 806.8

56 OVS SpA
The main features of the contract are summarised below:
SENSITIVITY ANALYSIS
The OVS Group’s exposure to interest rate risk was measured using a sensitivity analysis that shows the effects on the income statement and on shareholders’ equity of a hypothetical change in market rates to 40 bps higher or lower than the hypothetical forward rate curve at 31 January 2017. This analysis is based on the assumption of a general and instantaneous change in benchmark interest rates.Excluding the effect of derivatives on interest rates and the amortised cost of loans, the results of this hypothetical, instant and favourable (unfavourable) change in the short-term interest rates applied to the OVS Group’s variable-rate financial liabilities are shown in the following table:
No effects on equity connected to the only existing cap instrument were recorded, as hedge accounting will not be applied to this instrument.
The same figure at 31 January 2016 is shown below:
EXCHANGE RATE RISK
Exposure to the risk of exchange rate fluctuations derives from the OVS Group’s commercial activities that are also conducted in currencies other than the euro. Revenues and costs denominated in foreign currencies can be affected by exchange rate fluctuations, with an impact on sales margins (economic risk), and payables and receivables in foreign currencies may be affected by the conversion rates used, with an impact on the income statement (transactional risk). The main exchange rate to which the OVS Group is significantly exposed is the EUR/USD, in relation to purchases in dollars made in the Far East and on other markets in which the dollar is the trading currency.The Group is also exposed to the EUR/HKD exchange rate in relation to the translation risk of investee company OVS Hong Kong Sourcing Limited. The conversion effects of the other foreign companies for which the euro is not the functional currency are marginal.Exchange rate fluctuations may result in the realisation or reporting of positive or negative exchange rate differences. The OVS Group also hedges orders that are highly probable although not acquired, pursuing the management aim of minimising the risks to which the Group is exposed.
Effect of change on financial expenses - income statement(amounts in millions of euros) - 40 bps + 40 bps
At 31 January 2017 (0,0) 3.8
Effect of change on financial expenses - income statement(amounts in millions of euros) - 40 bps + 40 bps
At 31 January 2016 0.3 0.8
(amounts in thousands of euros)
Derivative contracts Date entered into
Maturity date
Value nominal at 31 Jan 17
Fair value at 31 Jan 17
CAP 3 August 2015 2 September 2017 187,500 0
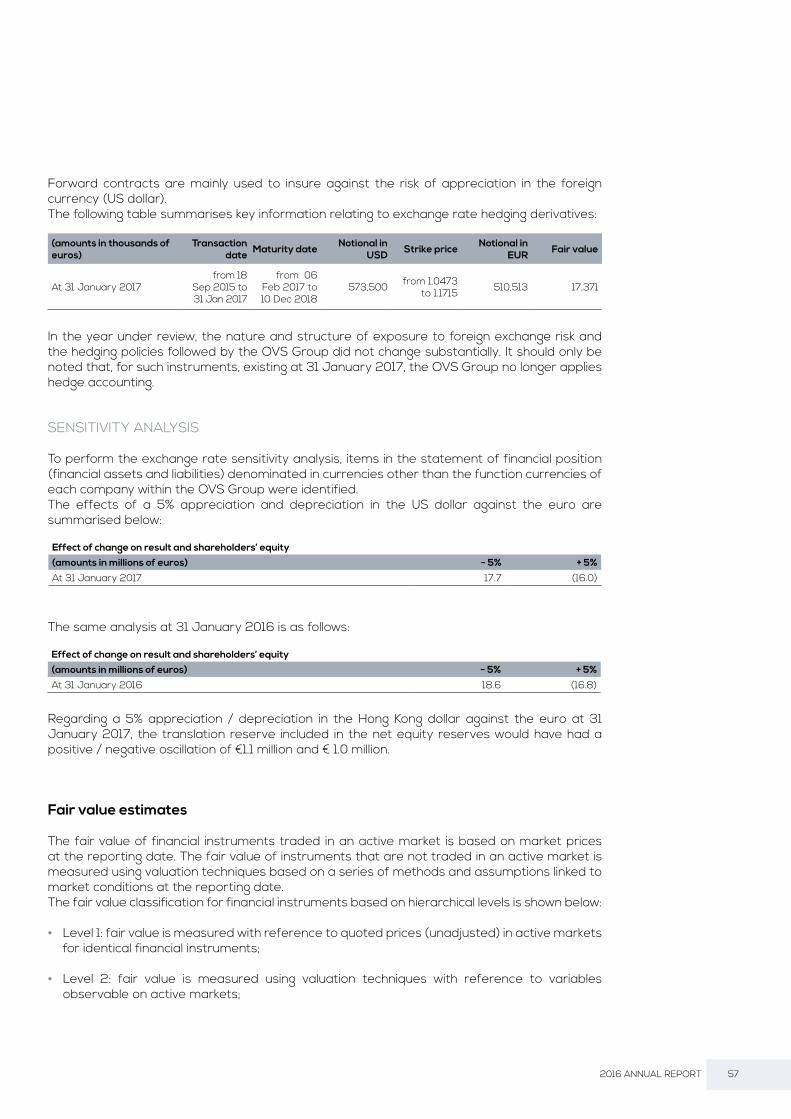
57 2016 ANNUAL REPORT
Forward contracts are mainly used to insure against the risk of appreciation in the foreign currency (US dollar). The following table summarises key information relating to exchange rate hedging derivatives:
In the year under review, the nature and structure of exposure to foreign exchange risk and the hedging policies followed by the OVS Group did not change substantially. It should only be noted that, for such instruments, existing at 31 January 2017, the OVS Group no longer applies hedge accounting.
SENSITIVITY ANALYSIS
To perform the exchange rate sensitivity analysis, items in the statement of financial position (financial assets and liabilities) denominated in currencies other than the function currencies of each company within the OVS Group were identified.The effects of a 5% appreciation and depreciation in the US dollar against the euro are summarised below:
The same analysis at 31 January 2016 is as follows:
Regarding a 5% appreciation / depreciation in the Hong Kong dollar against the euro at 31 January 2017, the translation reserve included in the net equity reserves would have had a positive / negative oscillation of €1.1 million and € 1.0 million.
Fair value estimates
The fair value of financial instruments traded in an active market is based on market prices at the reporting date. The fair value of instruments that are not traded in an active market is measured using valuation techniques based on a series of methods and assumptions linked to market conditions at the reporting date.The fair value classification for financial instruments based on hierarchical levels is shown below:
• Level 1: fair value is measured with reference to quoted prices (unadjusted) in active markets for identical financial instruments;
• Level 2: fair value is measured using valuation techniques with reference to variables observable on active markets;
(amounts in thousands of euros)
Transaction date Maturity date Notional in
USD Strike price Notional in EUR Fair value
At 31 January 2017from 18
Sep 2015 to 31 Jan 2017
from 06 Feb 2017 to 10 Dec 2018
573,500 from 1.0473to 1.1715 510,513 17,371
Effect of change on result and shareholders’ equity(amounts in millions of euros) - 5% + 5%
At 31 January 2017 17.7 (16.0)
Effect of change on result and shareholders’ equity(amounts in millions of euros) - 5% + 5%
At 31 January 2016 18.6 (16.8)

58 OVS SpA
Financial assets/
liabilities at fair value through
profit or loss
Loans and borrowings
Held to maturity
Assets available
for sale
Liabilities measured
at amortised cost
Liabilities measured according
to IAS 17
Total
Current assets
Cash and banks - 89,713 - - - - 89,713Trade receivables - 75,259 - - - - 75,259Financial assets 18,897 - - - - - 18,897
Non-current assetsFinancial assets - 5,491 - - - - 5,491
Current liabilitiesFinancial liabilities - - - - 5,417 1,142 6,559Trade payables - - - - 367,662 - 367,662
Non-current liabilitiesFinancial liabilities - - - - 371,311 2,052 373,363
• Level 3: fair value is measured using valuation techniques with reference to variables unobservable on active markets;
The financial instruments shown at fair value of the OVS Group are classified as Level 2, and the general criterion used to calculate it is the present value of future cash flows expected from the instrument being valued.Liabilities relating to bank borrowings are measured using the “amortised cost” criterion.Trade receivables and payables were measured at their carrying value as this is deemed to be close to the current value.In addition to the information on financial risk, the following is a reconciliation between classes of financial assets and liabilities as identified in the Group’s statement of financial position, and the types of financial assets and liabilities identified pursuant to IFRS 7 at 31 January 2017:

59 2016 ANNUAL REPORT
The same reconciliation for 31 January 2016 is provided below:
Financial assets/
liabilities at fair value through
profit or loss
Loans and borrowings
Held to maturity
Assets available
for sale
Liabilities measured
at amortised cost
Liabilities measured according
to IAS 17
Total
Current assets
Cash and banks - 125,636 - - - - 125,636Trade receivables - 71,025 - - - - 71,025Financial assets 16,308 - - - - - 16,308
Non-current assetsFinancial assets 1,988 - - - - - 1,988
Current liabilitiesFinancial liabilities - - - - 5,210 2,145 7,355Trade payables - - - - 368,834 - 368,834
Non-current liabilitiesFinancial liabilities - - - - 370,435 1,166 371,601

60 OVS SpA
Pursuant to IFRS 8, management has identified the following operating segments:
• OVS, active in the value fashion market, offering stylish and high-quality clothing at competitive prices, with a focus on the latest trends and fashions; and
• Upim, active in the value segment of the Italian market, offering women’s, men’s and children’s clothing products, homeware and fragrance, with particularly competitive price positioning and a key focus on the family.
The results of the operating segments are measured by analysing EBITDA and adjusted EBITDA, defined respectively as earnings before depreciation and amortisation, asset write-downs, financial income and expenses and tax, and EBITDA after non-recurring income and expenses.Specifically, management believes that EBITDA and adjusted EBITDA provide a good performance indicator as they are not affected by tax legislation or depreciation/amortisation policy.
INFORMATION ON OPERATING SEGMENTS
31 January 2017 31 January 2016(thousands of euros) OVS UPIM Total OVS UPIM TotalRevenues by segment 1,150,897 211,727 1,362,624 1,116,878 202,602 1,319,480
EBITDA (A) 159,123 21,266 180,389 156,900 14,415 171,315 % of revenues 13.8% 10.0% 13.2% 14.0% 7.1% 13.0%Non-recurring expenses 3,072 723 3,795 3,985 2,896 6,881 Stock Option plan 2,102 387 2,489 1,179 214 1,393 EBITDA Adjusted 164,297 22,376 186,673 162,064 17,525 179,589 % of revenues 14.3% 10.6% 13.7% 14.5% 8.6% 13.6%
Depreciation, amortisation and write-downs of assets (B) (59,050) (58,193)
Profit before net financial expenses and taxes (A-B) 121,339 113,122 Financial income 200 118 Financial expenses (15,817) (26,926)Foreign exchange gains and losses 67 12,147 Gains (losses) from equity investments 0 47 Net result before tax 105,789 98,508 Taxes (27,774) (11,881)Net result 78,015 86,627


NOTES TO THE CONSOLIDATED STATEMENT OF FINANCIAL POSITION

64 OVS SpA
Business combinations
ACQUISITION OF OVS FASHION ESPAÑA S.L.
On 30 September 2016, and with effect from 1 October 2016, OVS SpA completed the acquisition of 100% of the share capital of Shopping Day S.L. (with HQ in Madrid), which manages the sales network in Spain, with 41 stores under franchise and one directly managed store.
As stipulated by IFRS 3 - Business Combinations, the acquisition gave rise to a business combination, and as such was recognised according to the purchase method.It should be noted that, given the limited size of the acquisition and the substantial absence of any change in the fair value of the assets, liabilities and contingent liabilities acquired by comparison with the apparent accounting situation at the acquisition date, the recognition of the above business combination was definitively completed in the same financial year as the acquisition.The information on the business combination required by IFRS 3 is provided below.
Entities participating in the combinationThe entities taking part in the combination are OVS S.p.A., as the acquiring entity, and Shopping Day S.L. (now OVS Fashion España SL) as the acquired entity.
Cost of the business combinationThe cost of the business combination was €100,000, which was the total sum paid to acquire 100% of the instruments representing the share capital of the acquired company.Any transaction-related costs were recognised in the income statement in the period in which they were incurred (as required by the accounting standard in question).
Fair value of assets, liabilities and contingent liabilities acquiredThe fair value of the net assets acquired was negative in the amount of €524,000, corresponding to the book value of the company’s shareholders’ equity at the acquisition date (as no fair value adjustments were made).
Goodwill recognised after the business combinationThe comparison between the cost of the business combination and the acquirer’s share of the net fair value of the acquired assets and liabilities showed residual goodwill of €624,000 (at 30 September 2016).

65 2016 ANNUAL REPORT
ACQUISITION OF BUSINESS UNITS FROM GRUPPO COIN SPA
During the year, OVS SpA acquired business units from Parent Company Gruppo Coin SpA, for the purpose of the direct management of stores in Pordenone, Ravenna, Pisa, Rome, Milan, Taranto, Reggio Calabria and Reggio Emilia.According to the Assirevi (Italian Association of Auditors) Preliminary Guidelines on IFRS (OPI 1 (revised)), this acquisition is classed as an operation involving “business combinations under common control” and is therefore excluded from the scope of mandatory application of IFRS 3 - Business Combinations.With reference to IAS 8.10, the emphasis was placed on the economic substance of the operation, which corresponds to the generation of value-added for the parties and is realised in substantial changes in the future cash flows of the net assets transferred.The OVS Group therefore recognised the net assets transferred at fair value at the time of the operation, entering this value at cost, totalling €3,931 thousand, including €2.2 million allocated to commercial licences.

66 OVS SpA
Details of the content of and changes in the most significant items are provided below (unless otherwise specified, amounts are in thousands of euros).
The balance represents cash and cash equivalents at the reporting date and breaks down as follows (in thousands of euros):
Cash and cash equivalents consists of cash, bank and post office deposits, checks and cash on hand at the head office and stores in the direct sales network.
In addition, at 31 January 2017, ordinary current accounts were set up as pledges to secure the New Loan Agreement (described in note 11 below), in the amount of €64,373 thousand, and foreign currency current accounts in the amount of USD7,818 thousand, corresponding to €7,471 thousand, the balance of which is still fully available to the OVS Group.
The breakdown of trade receivables was as follows (amounts in thousands of euros):
Receivables for wholesale sales derive from sales to affiliates.Receivables from services mainly include charges for department management and subletting to external managers. Disputed receivables mainly consist of receivables for problem loans. Most of these receivables are written down by recognising a specific provision for doubtful accounts.The write-downs relate to receivables from affiliates or business partners, for whom collection is presumed to be difficult, or for disputes, or, in the majority of cases, for legal proceedings in progress against customers.Trade receivables from related parties primarily include receivables from Gruppo Coin SpA of €1.0 million, related to receivables for services, and from Coin Srl, for €1.9 million, related to brokerage fees for procurement (€0.6 million) and receivables for services (€1.3 million). The amount also includes receivables from Charles Vögele Mode AG for sales of goods for €3.5 million.Also note that trade receivables (mainly for the provision of products to the franchising affiliates) amounting to €73.1 million were also transferred to secure the New Loan Agreement at 31 January 2017.
31.01.2017 31.01.2016 change
1 Cash and banks 89,713 125,636 (35,923)
31.01.2017 31.01.2016 change
2 Trade receivables 75,259 71,025 4,234
31.01.2017 31.01.2016 changeTrade receivables
Receivables for retail sales 858 759 99Receivables for wholesale sales 61,477 64,413 (2,936)Receivables for services rendered 8,513 3,366 5,147Disputed receivables 6,115 6,262 (147)Trade receivables from related parties 6,608 3,955 2,653Subtotal 83,571 78,755 4,816(Provision for doubtful accounts) (8,312) (7,730) (582)Total 75,259 71,025 4,234
31.01.2017 31.01.2016 change1) Bank and post office deposits 83,562 118,740 (35,178)2) Cheques 9 14 (5)3) Cash and cash equivalents on hand 6,142 6,882 (740)Total 89,713 125,636 (35,923)

67 2016 ANNUAL REPORT
The provision for doubtful accounts amounted to €8,312 thousand. At 31 January 2017, €612 thousand had been used and the provision amounted to €1,200 thousand.Changes in the provision for doubtful accounts are shown below:
The change in the provision for doubtful accounts in the previous year is as follows:
The allocation to the “Provision for doubtful accounts” expresses the presumed realisable amount of receivables that are still collectable at the closing date of the year. The draw-downs for the period relate to receivable positions for which elements of certainty and accuracy, or the presence of competitive procedures, determine the removal of the position itself. Given the types of products and services sold by the OVS Group, there is no significant concentration of revenues and trade receivables with individual customers.
The breakdown of inventories is shown in the following table:
This item includes stocks of merchandise at warehouses and points of sale at the reporting date. The amount is largely in line with the amounts that would be obtained by valuing the inventories at current cost at the reporting date.The provision for depreciation reflects management’s best estimate based on the breakdown by type and season of inventories, considerations arising from past experience and the outlook for sales volumes. The provision for inventory differences includes the estimate of inventory differences at the end of each of the periods under review, in view of the fact that the OVS Group carries out a physical inventory in June of each year. These provisions are based on the management best estimate and are therefore believed by management to be consistent with their respective purposes.
(amounts in thousands of euros)Balance at 31 January 2016 7,730
Allocations in the period 1,200Utilisations in the period (612)Effect of exchange rate adjustment (6)Balance at 31 January 2017 8,312
(amounts in thousands of euros)Balance at 31 January 2015 12,323
Allocations in the period 1,800Utilisations in the period (6,390)Effect of exchange rate adjustment (3)Balance at 31 January 2016 7,730
(amounts in thousands of euros) 31.01.2017 31.01.2016Goods 366,706 314,877Gross stock 366,706 314,877Provision for depreciation (17,249) (15,301)Provision for inventory differences (8,880) (9,901)Total provision for stock write-downs (26,129) (25,202)Total 340,577 289,675
31.01.2017 31.01.2016 change
3 Inventories 340,577 289,675 50,902

68 OVS SpA
Changes in the provision for depreciation and the provision for inventory differences for the year ended 31 January 2017 are shown below:
The change in the same provisions for the previous period is as follows:
The breakdown of the “Financial assets” item into current and non-current at 31 January 2017 and at 31 January 2016 is shown below:
Derivatives include the fair value of hedge derivatives on purchases of merchandise in currencies other than the euro.
The amount of non-current financial assets relates to the loan granted to Sempione Retail AG in several tranches. This loan (the so-called “Shareholders’ Loan Agreement”), which stood at CHF5,900 thousand at 31 January 2017, is a shareholders’ loan subordinated to all the liabilities of Sempione Retail AG and all of its subsidiaries, including Charles Vögele.Repayment will be made in a lump sum (bullet loan) on a date to be agreed, but at least six months after the due date of the debt disbursed by third parties other than the shareholders. The shareholders’ loan is interest-bearing and provides for the payment of interest every six months. The annual interest rate is calculated as the sum of:- the basic rate, i.e. the interbank rate with a floor equal to 0 and a cap equal to the maximum interest
rate applicable for intra-group financing according to the Swiss Federal Tax Administration;- a spread, calculated in turn as the sum of: • the spread applied to loans disbursed to Sempione Retail by third parties other than
shareholders (pursuant to the Credit Facility Agreement entered between Sempione Retail and a pool of bank);
• plus 2%.
(amounts in thousands of euros) Provision for depreciation
Provision for inven-tory differences Total
Balance at 31 January 2016 15,301 9,901 25,202
Allocation 15,984 13,682 29,666Utilisation (14,036) (14,703) (28,739)Balance at 31 January 2017 17,249 8,880 26,129
(amounts in thousands of euros) Provision for depreciation
Provision for inven-tory differences Total
Balance at 31 January 2015 13,589 8,058 21,647
Allocation 13,678 19,249 32,927Utilisation (11,966) (17,406) (29,372)Balance at 31 January 2016 15,301 9,901 25,202
(amounts in thousands of euros) 31.01.2017 31.01.2016Derivatives (current portion) 18,897 16,308Total current financial assets 18,897 16,308Derivatives (non-current portion) 0 1,988Financial loan to related company 5,491 0Total non-current financial assets 5,491 1,988Total 24,388 18,296
31.01.2017 31.01.2016 change
4 Current financial assets 18,897 16,308 2,589
31.01.2017 31.01.2016 change
5 Current tax assets 1,120 923 197
4 Non-current financial assets 5,491 1,988 3,503

69 2016 ANNUAL REPORT
It mainly consists of receivables for withholding tax on fees (€989 thousand) and other tax receivables and receivables for tax withheld at source. It should be noted that, during April 2016, when Gruppo Coin SpA no longer met the requirements for control over OVS SpA pursuant to tax law, group taxation was stopped. Consequently, the consolidating company and the consolidated company opted back out of the tax consolidation scheme, with effect from fiscal 2016. After the option had been taken up in 2014, the companies in question had entered into specific agreements governing their behaviour and providing for the transfer of IRES payables/receivables.
Other receivables break down as follows:
The “Other current receivables” item relates to guarantee deposits made for new leases amounting to €120 thousand, receivables for business unit disposals amounting to €160 thousand, while the remainder refers to social security receivables and advances to suppliers and shippers. Receivables from insurance companies mainly comprise the scheduled reimbursement for fire damage to stores in Genoa (€33 thousand) and damage to goods in transit (€115 thousand). The item “Accrued income and prepaid expenses - other” primarily includes prepayments of advertising and marketing services for €1,798 thousand and the share of deferred financial fees (€329 thousand) incurred to obtain medium/long-term revolving lines of credit and to obtain lines of credit described in more detail in the “Financial liabilities” section below. The residual amount mainly refers to prepaid expenses on utilities costs, costs for services and reimbursement of training costs.Also note that, to serve as collateral for the New Loan Agreement, at 31 January 2017 insurance receivables were sold by warranty for €0.2 million.“Other non-current receivables” included security deposits that relate mainly to securities paid under leases, utilities and deposits with customs to guarantee goods imports. The “Minor investments” item mainly includes equity investments in consortia recognised at cost.The “Other non-current receivables” item includes receivables from affiliates due beyond 12 months for €131 thousand and the medium/long-term portion of deferred financial fees for €615 thousand.
31.01.2017 31.01.2016 changeOther receivables 657 1,171 (514)
Receivables from insurance companies for claims reimbursements 169 292 (123)
Receivables from employees 1,517 1,436 81
Accrued income and prepaid expenses - rents and service charges 22,275 22,460 (185)
Accrued income and prepaid expenses - insurance 143 3,083 (2,940)
Accrued income and prepaid expenses - interest on security deposits 30 25 5
Accrued income and prepaid expenses - other 6,268 4,939 1,329Total current receivables 31,059 33,406 (2,347)Tax receivables 1,072 1,070 2Security deposits 3,383 3,509 (126)Minor investments 19 20 (1)Other receivables 746 1,034 (288)Total non-current receivables 5,220 5,633 (413)
31.01.2017 31.01.2016 change
6 Other current receivables 31,059 33,406 (2,347)
6 Other non-current receivables 5,220 5,633 (413)

70 OVS SpA
Appendix 1 shows the historical cost for each item, the accumulated depreciation and amortisation, changes during the year and the final balances.Investments in the period mainly related to:
• expenses for modernising, renovating and upgrading points of sale in the commercial network;
• purchases of furniture and fittings for the commercial network to furnish both newly opened and renovated branches.
Leasehold improvements, allocated to the items in question, mainly refer to renovations of points of sale not under direct ownership.
Pursuant to IAS 36, for businesses showing signs of impairment the Group assessed the recoverability of the relative assets using the discounted cash flow method. The analysis did not show any impairment during the year.
In addition, pursuant to the New Loan Agreement, at 31 January 2017 a lien was created on property in the amount of €167.6 million.
Appendix 2 of these explanatory notes shows the change in each item during the year.
Intangible assets at 31 January 2017 mainly include the amounts allocated to the OVS Group deriving from the acquisition of Gruppo Coin by Icon. At 31 January 2017, these amounts included:
• The OVS brand for €377.5 million, with an indefinite life (included under “Concessions, licences and brands”);
• The Upim brand for €13.3 million, with an indefinite life (included under “Concessions, licences and brands”);
• The OVS franchising network for €79.6 million, amortised over 20 years (included under “Other intangible assets”);
• The Upim franchising network for €31.6 million, amortised over 20 years (included under “Other intangible assets”);
• Licences relating to OVS stores for €92.7 million, amortised over 40 years (included under “Concessions, licences and brands”);
• Licences relating to Upim stores for €17.4 million, amortised over 40 years (included under “Concessions, licences and brands”);
• Licences relating to former Bernardi stores for €4.0 million, amortised over 40 years (included under “Concessions, licences and brands”).
The brands attributed to the OVS Group are regarded as having an indefinite useful life.To establish this, a management analysis was performed on all relevant factors (legal, judicial, contractual, competitive, economic and other) relating to the brands. The conclusion was reached that there is no foreseeable time limit for the generation of cash inflows for the OVS Group.
31.01.2017 31.01.2016 change
7 Property, plant and equipment 267,359 260,083 7,276
31.01.2017 31.01.2016 change
8 Intangible assets 639,924 644,412 (4,489)

71 2016 ANNUAL REPORT
The recoverability of the value of these brands was measured using the discounted cash flow method for the CGUs to which these brands are allocated. Please see the following section, “Impairment testing”, for the outcome of the assessments carried out.
Note that the useful life of the licences is 40 years.This was estimated on the basis of historical analyses carried out within the OVS Group.It should be noted, in this regard, that the time limit placed on the duration of the leases is insignificant. In fact, there are protections provided to the tenant in market practice and under specific legal provisions; in addition, a strategy of gradual further expansion of the network is being implemented by the OVS Group, which usually renews leases before they expire naturally. All these factors have resulted over time in the almost completely successful implementation of the renovation policy. Also note that we have identified a component of residual value (non-amortised residual value at the end of the useful life) calculated over 18 monthly rental payments, representing the amount payable by the lessor if the lease is not renewed for a reason not attributable to the OVS Group.
The remainder of the item mainly consists of rights to industrial patents and intellectual property rights relating to investments in software programmes.
Also note that, pursuant to the New Loan Agreement, at 31 January 2017 a lien was created on OVS Group brands in the amount of €390.8 million.
The goodwill allocated to Gruppo OVS mainly relates to the acquisition of Gruppo Coin by Icon on 30 June 2011, for €451,778 thousand. The increase of the year is entirely attributable to the acquisition of OVS Fashion España SL previously mentioned.Goodwill was tested for impairment: the results are shown in the “Impairment testing” section below.
Impairment testing
Pursuant to IAS 36, the Group verifies the recoverability of intangible assets with an indefinite useful life (goodwill and brands) when indicators of impairment are identified, and in any event at the closing date of the year, while for tangible assets and other assets with a finite useful life this takes place when indicators of impairment are identified. The recoverable amount of the cash-generating units (CGUs) to which the individual assets are allocated is verified by calculating their value in use and/or fair value.
A) OVS CGU
Impairment testing entailed the comparison of the carrying amount of the cash generating unit (CGU) and its value in use (VIU). Note that the carrying amount of the OVS CGU includes goodwill, entirely allocated to the CGU, of €453.2 million, and the OVS brand for €377.5 million, both with an indefinite useful life.The cash generating units identified by management coincide with the OVS and Upim operating segments, which include all services and products provided to customers.The estimated value in use of the OVS operating segment for the purposes of impairment testing is based on the discounting of provisional data for the OVS CGU, determined on the basis of the following assumptions:
31.01.2017 31.01.2016 change
9 Goodwill 453,165 452,541 624

72 OVS SpA
• the projected cash flows for the OVS operating segment were extrapolated from the business plan for the three years from 2017 to 2019, drawn up by management. Provisional cash flows for the OVS CGU were determined according to growth levels of turnover and EBITDA, based on both past operating and profit performance and on future projections;
• future cash flows, standardised to use for the terminal value, were constructed by consistently applying a growth rate “g” for EBITDA of 2% annually, applied to EBITDA in the final year of the Plan. Annual investments were estimated consistently on the basis of the last year of the Plan (€41.5 million): this amount is believed to be representative of the normalised investments needed to maintain existing fixed assets. Moreover, a negative change in net working capital amounting to €2 million was believed to be reasonable in light of the specific business in which the CGU operates, assuming an almost perfect balance in the long term between i) trade receivables and payables and ii) inventories.
• the discount rate (WACC) used to estimate the present value of cash flows is 6.5%, determined on the basis of the following assumptions: i) the risk-free rate used is 1.49% equivalent of yields on 10-year Italian government bonds; ii) the equity risk premium is 5.5%, an average rate in line with both the results of long-term analyses of industrialised countries and professional practices; iii) the beta coefficient was estimated based on a panel of comparable listed companies operating in the retail clothing segment; iv) the cost of financial debt (2.3%) was estimated as the 1-month average for the 10-year EurIRS rate, plus a spread of 190 bps; and v) the debt-to-equity ratio used was calculated on the basis of average data from a panel of comparable companies.
Based on the above considerations, the value in use of the OVS CGU at 31 January 2017 was €2,158.4 million. The comparison between the VIU (€2,158.4 million) and the carrying amount (net invested capital) of the OVS CGU (€1,046.9 million) shows that the value in use of the CGU is higher than its carrying amount: therefore, there is no impairment to be recognised.
B) UPIM CGU
Although no goodwill amount has been allocated to the Upim CGU, the Group has carried out impairment testing on it, in view of the fact that it includes an amount allocated to the brand of €13.3 million, with an indefinite useful life. The estimated value in use of the Upim operating segment for the purposes of impairment testing is based on the discounting of provisional data for the Upim CGU, determined on the basis of the following assumptions:
• the projected cash flows for the Upim operating segment were extrapolated from the business plan for the three years from 2017 to 2019, drawn up by management. Provisional cash flows for the Upim CGU were determined according to growth levels of turnover and EBITDA, based on both past operating and profit performance and on future projections;
• future cash flows, standardised to use for the terminal value, were constructed by consistently applying a growth rate “g” for EBITDA of 2% annually, applied to EBITDA in the final year of the Plan. Annual investments were estimated consistently on the basis of the last year of the Plan (€19.1 million): this amount is believed to be representative of the normalised investments needed to maintain existing fixed assets. Moreover, the change in net working capital was substantially taken as zero (negative for €0.1 million): this was believed to be reasonable in light of the specific business in which the CGU operates, assuming an almost perfect balance in the long term between i) trade receivables and payables and ii) inventories.
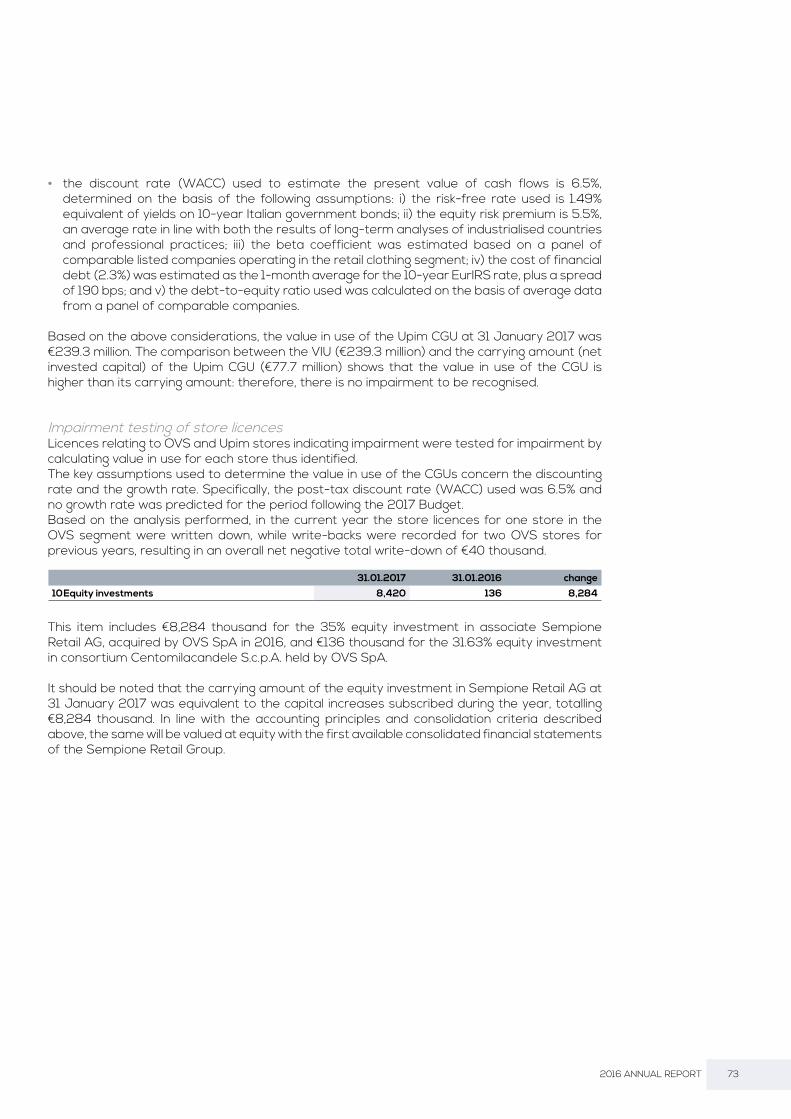
73 2016 ANNUAL REPORT
• the discount rate (WACC) used to estimate the present value of cash flows is 6.5%, determined on the basis of the following assumptions: i) the risk-free rate used is 1.49% equivalent of yields on 10-year Italian government bonds; ii) the equity risk premium is 5.5%, an average rate in line with both the results of long-term analyses of industrialised countries and professional practices; iii) the beta coefficient was estimated based on a panel of comparable listed companies operating in the retail clothing segment; iv) the cost of financial debt (2.3%) was estimated as the 1-month average for the 10-year EurIRS rate, plus a spread of 190 bps; and v) the debt-to-equity ratio used was calculated on the basis of average data from a panel of comparable companies.
Based on the above considerations, the value in use of the Upim CGU at 31 January 2017 was €239.3 million. The comparison between the VIU (€239.3 million) and the carrying amount (net invested capital) of the Upim CGU (€77.7 million) shows that the value in use of the CGU is higher than its carrying amount: therefore, there is no impairment to be recognised.
Impairment testing of store licencesLicences relating to OVS and Upim stores indicating impairment were tested for impairment by calculating value in use for each store thus identified.The key assumptions used to determine the value in use of the CGUs concern the discounting rate and the growth rate. Specifically, the post-tax discount rate (WACC) used was 6.5% and no growth rate was predicted for the period following the 2017 Budget.Based on the analysis performed, in the current year the store licences for one store in the OVS segment were written down, while write-backs were recorded for two OVS stores for previous years, resulting in an overall net negative total write-down of €40 thousand.
This item includes €8,284 thousand for the 35% equity investment in associate Sempione Retail AG, acquired by OVS SpA in 2016, and €136 thousand for the 31.63% equity investment in consortium Centomilacandele S.c.p.A. held by OVS SpA.
It should be noted that the carrying amount of the equity investment in Sempione Retail AG at 31 January 2017 was equivalent to the capital increases subscribed during the year, totalling €8,284 thousand. In line with the accounting principles and consolidation criteria described above, the same will be valued at equity with the first available consolidated financial statements of the Sempione Retail Group.
31.01.2017 31.01.2016 change
10 Equity investments 8,420 136 8,284

74 OVS SpA
The breakdown of the “Current financial liabilities” and “Non-current financial liabilities” items at 31 January 2017 and 31 January 2016 is shown below:
Current and non-current bank payables and the current portion of long-term debt
The OVS Group’s current and non-current bank payables at 31 January 2017 are shown below:
The lines of credit available to the Group, at 31 January 2017, refer to the loan agreement signed on 23 January 2015 and disbursed on 2 March 2015 (the New Loan Agreement) totalling €475,000,000. This agreement provides for the granting of a medium/long-term line of credit of €375,000,000, which, together with the income from the capital increase servicing the global offer, was intended to repay the pre-existing debt of the Issuer and to pay costs associated with the listing process (the “Senior Loan”), and a revolving line of credit of €100,000,000 that may be drawn down in different currencies (the “Revolving Line of Credit”).The Senior Loan was disbursed as trading of the Company’s shares began on the MTA. On the date when trading in the shares started on the MTA, the Company therefore fully repaid the previous loan agreement (which therefore ceased to be effective). The applicable interest rate for both the senior loan and the revolving line of credit is now equal to the sum of (i) the margin of 2.5% per annum (the “Margin”) and (ii) the Euribor or, if the currency used is not the euro, the Libor (the “Interest”). The Interest will be calculated on a quarterly or half-yearly basis for the senior loan, and on a monthly or quarterly or half-yearly basis for the Revolving Line (unless otherwise agreed between the parties).The Margin may be reduced or increased further according to the ratio of average total net debt to EBITDA (as contractually specified), calculated on the basis, depending on the case, of the consolidated financial statements (audited) at 31 January and the consolidated half-year report (not audited) at 31 July, drawn up pursuant to IFRS. Specifically, the New Loan Agreement stipulates that:
• if the ratio is greater than or equal to 3.00:1, the applicable Margin will be 3.50%;
• if the ratio is less than 3.00:1 but greater than or equal to 2.00:1, the applicable Margin will
(amounts in thousands of euros) 31.01.2017 31.01.2016Current bank payables 0 0Current portion of non-current debt 3,958 5,102Other current financial payables 2,601 2,253Current financial liabilities 6,559 7,355Non-current bank payables 371,190 370,380Other non-current financial payables 2,173 1,221Non-current financial liabilities 373,363 371,601
(amounts in thousands of euros) Maturity date Interest rate
At 31 January 2017
Totalof which
non-current portion
of which current portion
Facility B 2020 Euribor + 2.50% 375,000 375,000 -Due for financial expenses 3,958 - 3,958Finance costs (3,810) (3,810) -Non-current bank payables 375,148 371,190 3,958
31.01.2017 31.01.2016 change
11 Current financial liabilities 6,559 7,355 (796)
11 Non-current financial liabilities 373,363 371,601 1,762
(migliaia di Euro) Scadenza Tasso di interesse
Al 31 gennaio 2017
Totale di cui quota non corrente
di cui quota corrente
Facility B 2020 Euribor + 2,50% 375.000 375.000 -Debito per oneri finanziari 3.958 - 3.958Oneri accessori ai finanziamenti (3.810) (3.810) -Debiti bancari non correnti 375.148 371.190 3.958
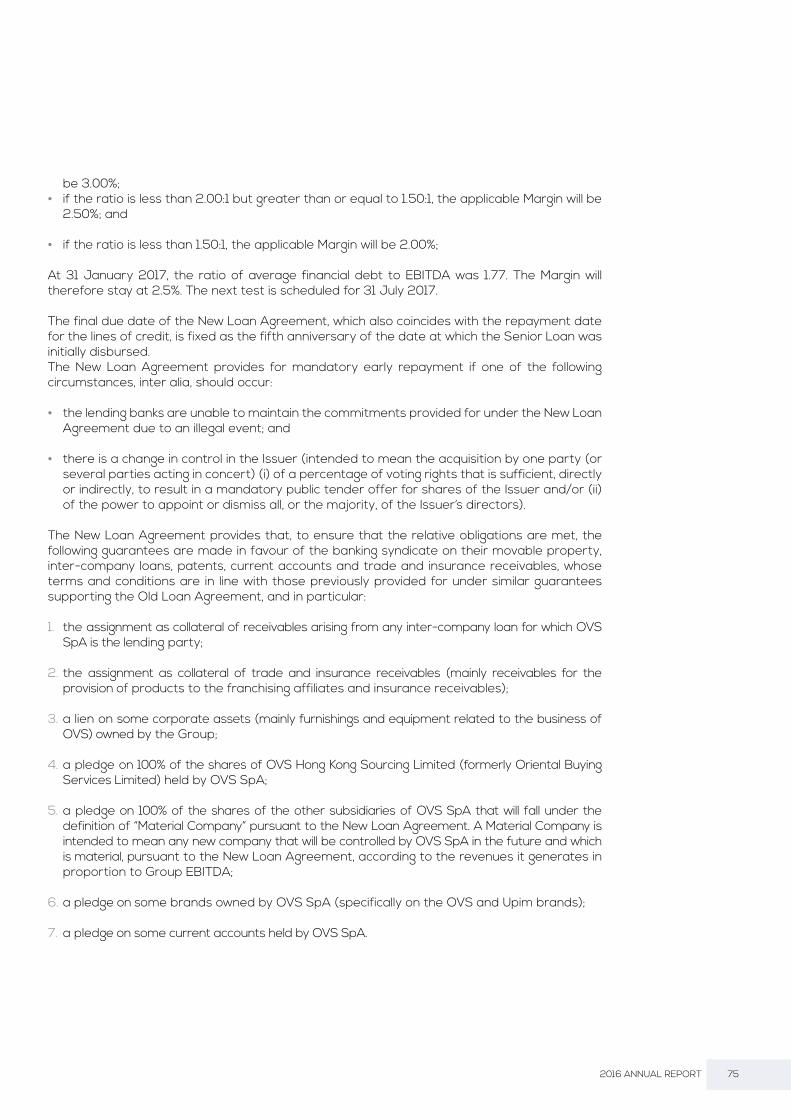
75 2016 ANNUAL REPORT
be 3.00%; • if the ratio is less than 2.00:1 but greater than or equal to 1.50:1, the applicable Margin will be
2.50%; and
• if the ratio is less than 1.50:1, the applicable Margin will be 2.00%;
At 31 January 2017, the ratio of average financial debt to EBITDA was 1.77. The Margin will therefore stay at 2.5%. The next test is scheduled for 31 July 2017.
The final due date of the New Loan Agreement, which also coincides with the repayment date for the lines of credit, is fixed as the fifth anniversary of the date at which the Senior Loan was initially disbursed. The New Loan Agreement provides for mandatory early repayment if one of the following circumstances, inter alia, should occur:
• the lending banks are unable to maintain the commitments provided for under the New Loan Agreement due to an illegal event; and
• there is a change in control in the Issuer (intended to mean the acquisition by one party (or several parties acting in concert) (i) of a percentage of voting rights that is sufficient, directly or indirectly, to result in a mandatory public tender offer for shares of the Issuer and/or (ii) of the power to appoint or dismiss all, or the majority, of the Issuer’s directors).
The New Loan Agreement provides that, to ensure that the relative obligations are met, the following guarantees are made in favour of the banking syndicate on their movable property, inter-company loans, patents, current accounts and trade and insurance receivables, whose terms and conditions are in line with those previously provided for under similar guarantees supporting the Old Loan Agreement, and in particular:
1. the assignment as collateral of receivables arising from any inter-company loan for which OVS SpA is the lending party;
2. the assignment as collateral of trade and insurance receivables (mainly receivables for the provision of products to the franchising affiliates and insurance receivables);
3. a lien on some corporate assets (mainly furnishings and equipment related to the business of OVS) owned by the Group;
4. a pledge on 100% of the shares of OVS Hong Kong Sourcing Limited (formerly Oriental Buying Services Limited) held by OVS SpA;
5. a pledge on 100% of the shares of the other subsidiaries of OVS SpA that will fall under the definition of “Material Company” pursuant to the New Loan Agreement. A Material Company is intended to mean any new company that will be controlled by OVS SpA in the future and which is material, pursuant to the New Loan Agreement, according to the revenues it generates in proportion to Group EBITDA;
6. a pledge on some brands owned by OVS SpA (specifically on the OVS and Upim brands);
7. a pledge on some current accounts held by OVS SpA.

76 OVS SpA
OVS SpA undertakes to announce the occurrence of any significant adverse events or default events that could restrict and/or impede the ability of OVS SpA or any guarantor to meet its contractual obligations under the New Loan Agreement.In terms of financial obligations, the only parameter that OVS SpA is committed to comply with is the leverage ratio, i.e. the OVS Group’s ratio of net debt to EBITDA, on a consolidated basis. From 31 July 2015, this parameter must be equal to or less than 3.50:1 for each 12-month period ending in a reporting date (i.e. 31 January and 31 July of each year), according to a calculation based on the consolidated financial statements and consolidated half-year reports of OVS Group, with the exception of the tests of July 2015 and January 2016, in which average financial debt was calculated on the final value of each month that has actually passed since the date of disbursement. As previously mentioned, at 31 January 2017, the ratio of average financial debt to EBITDA was 1.77. The obligation is therefore completely fulfilled.The New Loan Agreement is governed by UK law and any disputes relating thereto are under the exclusive jurisdiction of the UK courts.Any breach of the contractual covenants is a default event that the Group has the power to rectify within 15 working days from the expiry of the obligation to send the compliance certificate relating to the calculation period. However, default may be prevented by an intervention by shareholders to ensure that the new calculation of the covenant complies with the contractual limits at the reporting date, if the shareholder intervention takes place before this date. The shareholder intervention might take the form, for example, of a subordinated loan or a new issue of OVS shares.If the default is not rectified, Banca IMI as the Agent Bank may (but is not obliged to) demand early payment of the loan, including by activating the guarantees granted.
The breakdown of the consolidated net financial debt of the OVS Group at 31 January 2017 and 31 January 2016, determined according to the provisions of the Consob Communication of 28 July 2006 and pursuant to the ESMA/2013/319 Recommendations, is shown below:
(amounts in thousands of euros) 31.01.2017 31.01.2016Net debt
A. Cash 89,713 125,636B. Cash equivalents - -C. Securities held for trading - -D. Liquid assets (A)+(B)+(C) 89,713 125,636E. Current financial receivables 18,897 16,308F. Current bank payables (3,958) (5,102)G. Current portion of non-current debt - -H. Other current financial payables (2,601) (2,253)I. Current debt (F)+(G)+(H) (6,559) (7,355)J. Net current debt (I)+(E)+(D) 102,051 134,589K. Non-current bank payables (371,190) (370,380)L. Bonds issued - -M. Other non-current financial payables (2,173) (1,221)N. Non-current debt (K)+(L)+(M) (373,363) (371,601)O. Net debt (J)+(N) (271,312) (237,012)
Non-current financial receivables 5,491 1,988Net financial position (265,821) (235,024)

77 2016 ANNUAL REPORT
Other current and non-current financial payables
The following table shows the breakdown of other current and non-current financial payables at 31 January 2017 and at 31 January 2016.
The breakdown by maturity of minimum payments and principal amounts on finance leases is shown below:
The reconciliation between the minimum payments owed to the leasing companies and their present value (principal) is as follows:
The Group leases equipment and fittings. The weighted average duration of the leases is around four years. The interest rates are set at the date on which the contract is entered into and are indexed to the 3-month Euribor. All lease agreements are repayable in equal instalments, and no restructuring of the original repayment plan is provided for contractually.All the agreements are denominated in the accounting currency (Euro).Payables to leasing companies are guaranteed to the lessor by means of rights over the leased assets.
(amounts in thousands of euros) 31.01.2017 31.01.2016Derivatives 1,404 -Payables for finance leases 1,142 2,145Financial payable to parent company - -Payables to factoring companies - -Other loans and minor financial payables 55 108Other current financial payables 2,601 2,253Derivatives 121 -Payables for finance leases 2,052 1,166Other loans and minor financial payables - 55Other non-current financial payables 2,173 1,221
Minimum payments owed for finance leases Principal amount
31 Jan 2017 31 Jan 2016 31 Jan 2017 31 Jan 2016Within 1 year 1,325 2,371 1,142 2,145From 1 to 5 years 2,204 1,500 2,052 1,166Beyond 5 years 0 0 0 0Total 3,529 3,871 3,194 3,311
31 Jan 2017 31 Jan 2016Minimum payments owed for finance leases 3,529 3,871(Future financial expenses) (335) (560)Present value of payables for finance leases 3,194 3,311
31.01.2017 31.01.2016 change
12 Trade payables 367,662 368,834 (1,172)

78 OVS SpA
The breakdown of the “Trade payables” item at 31 January 2017 and 31 January 2016 is provided below:
This item includes payables relating to the OVS Group’s normal course of operations, in respect of the supply of goods, assets and services.The balance includes trade payables to foreign suppliers (mainly in Asia) amounting to €194,735 thousand; it also includes exposure in foreign currency (mainly USD) amounting to USD175,845 thousand.Also note that at these dates there were no payables with a residual life of more than five years in the statement of financial position.
The amount shown includes IRES (corporation tax) payables of €3.7 million and IRAP (regional production tax) payables of €0.2 million (net of payments on account and tax credits of €21.5 million and €5.4 million respectively), as well as taxes paid by the foreign companies for the year. This item also includes payables to Gruppo Coin SpA for the acquisition of part of the excess IRES resulting from the 2016 Consolidated Corporate Income Tax Return (CNM) submitted by Gruppo Coin SpA, amounting to €11,460 thousand (the nominal value is €12,000 thousand). This operation was agreed and settled by the parties on 8 March 2016 and 31 October 2016.
The breakdown of the “Other payables” item into current and non-current at 31 January 2017 and at 31 January 2016 is shown below:
(amounts in thousands of euros) 31.01.2017 31.01.2016 changePayables to third-party suppliers 366,417 367,027 (610)Payables to related parties 1,245 1,807 (562)Trade payables 367,662 368,834 (1,172)
31.01.2017 31.01.2016 change
13 Current tax liabilities 15,796 23,771 (7,975)
31.01.2017 31.01.2016 change
14 Other current payables 95,420 101,895 (6,475)
14 Other non-current payables 17,030 11,776 5,254
(amounts in thousands of euros) 31.01.2017 31.01.2016 change
Payables to employees for unused leave and related contributions 7,840 7,755 85
Payables to employees for deferred salaries, overtime, bonuses and related contributions 21,771 19,172 2,599
Payables to Directors and Auditors for emoluments 388 384 4Other payables 6,682 5,788 894Payables to pension and social security institutions 6,658 6,495 163VAT payables 29,048 37,019 (7,971)Other tax payables 3,109 2,918 191Other payables - to customers 129 102 27Accrued expenses/deferred income - rents and leasing 9,088 7,539 1,549Accrued expenses and deferred income - utilities 2,437 2,610 (173)Accrued expenses and deferred income - insurance 401 94 307Accrued expenses and deferred income - other 7,869 12,019 (4,150)Total current payables 95,420 101,895 (6,475)Linearisation of rents 12,179 10,237 1,942Accrued expenses and deferred income - other 4,851 1,539 3,312Total non-current payables 17,030 11,776 5,254

79 2016 ANNUAL REPORT
“Payables to employees” relates to benefits accrued and not paid out at 31 January 2017.“Other payables” mainly refers to customer advances to book goods and purchases of goods vouchers for €3,372 thousand, payables for deposits received from customers as guarantees for an affiliation agreement for €2,802 thousand, and payables to a former Upim Srl supplier for a legal dispute amounting to €340 thousand.The increase in payables to pension and social security institutions reflects payables to the INPS.At the reporting date the Group had a VAT payable deriving from retail and wholesale sales and to a lesser extent from the sale of goods and services.
The “Other tax payables” item includes IRPEF (personal tax) on employees, payables to tax offices and payables for unpaid withholding tax.Note that the “Other accrued expenses/deferred income” item includes €3,963 thousand in accrued expenses for local taxes, €1,224 thousand for travel expenses, €356 thousand for banking expenses and €843 thousand in deferred income for contributions payable by partners and lessors.It also includes €240 thousand relating to the current portion of the extension of software usage rights to Gruppo Coin SpA for a five-year period (the non-current portion, recognised under “Other accrued expenses/deferred income - non-current”, amounts to €360 thousand).
Non-current payables refer, in the amount of €12,179 thousand, to the recognition of the payable due to the linearisation of leases with payment instalments that increase throughout the life of the lease. The same item includes the €360 thousand already mentioned in the previous item and €857 thousand relating to the deferral of the contribution deriving from investments in new capital goods, which benefited from the “Tremonti-quater” exemption. Note that investments were booked including the contribution amount, which was spread throughout the period of depreciation of the goods concerned.This item also includes €3,633 thousand as the non-current portion of deferred income for contributions recognised by lessors after store restructurings and conversions. These contributions were discounted based on the term of the lease.
The item mainly includes the provisions made by the Parent Company OVS SpA for accrued employee severance benefits. Post-employment benefits are guaranteed by the Group as part of its defined benefit plans. The defined benefit plans include the provision for employee severance benefits accrued at 31 December 2006, the date since which, due to the reform that has taken place, the provision has been identified as a defined contribution provision.As already mentioned, from 1 January 2007, the 2007 Budget and the associated implementing decrees introduced significant amendments to the rules on employee severance benefits, including options for employees with regard to the allocation of their accruing severance benefits. Specifically, new flows of severance benefits may be directed by the employee to preselected or company pension schemes (in the latter case, the company will pay severance benefit contributions into a treasury account set up with the INPS (the Italian social security and welfare institution)).
The change in the “Employee benefits” item is shown below.
31.01.2017 31.01.2016 change
15 Employee benefits 39,906 40,529 (623)
(amounts in thousands of euros) 31.01.2017 31.01.2016Balance at beginning of year 40,529 44,445
Increase in period 1,157 872Actuarial (gains)/losses 323 (2,239)Contributions made/benefits paid (2,103) (2,549)Balance at end of year 39,906 40,529

80 OVS SpA
The item also includes €77 thousand relating to the pension provision, which is disbursed when employees retire. Like the employee severance benefits, the provision is calculated on an actuarial basis using the projected unit credit method.
The economic and demographic assumptions used for actuarial evaluation are listed below:
Demographic assumptions:
• for the expectation of death, the IPS55 demographic, broken down by gender;
• for the expectation of disability, the assumptions used by the INPS model for projections to 2010. Expectations are constructed starting with the distribution by age and gender of pensions in force at 1 January 1987 starting in 1984, 1985 and 1986 relating to personnel in the credit unit;
• for the age of retirement of the general working population, achievement of the first retirement requirement applicable for Mandatory General Insurance was assumed;
• for the probability of leaving employment for reasons other than death, based on statistics provided by the Group, an annual frequency rate of 5.00% was assumed;
• for the probability of early retirement, an year-on-year figure of 3.00% was assumed.
Economic and financial assumptions:
The iBoxx Eurozone Corporates AA 10+ at the calculation date was used as the benchmark for the discount rate. This expiry relates to the average remaining period of service at the company of the employees of Group Companies, weighted with the expected payment.
Sensitivity analysis
As required by the revised version of IAS 19, a sensitivity analysis was carried out on changes in the key actuarial assumptions included in the calculation model. The above scenario was used as the baseline scenario; from this, the most significant assumptions - i.e. the average annual discount rate, the average inflation rate and the turnover rate - were increased and decreased by one half, one quarter and two percentage points respectively. The results obtained are summarised in the following table:
Annual discount rate 1.50%Annual inflation rate 1.50%Annual increase in employee severance benefits 2.63%
(amounts in millions of euros)
Annual discount rate Annual inflation rate Annual turnover rate+0.50% -0.50% +0.25% -0.25% +2.00% -2.00%
OVS 38.7 42.2 40.9 39.9 39.7 40.2

81 2016 ANNUAL REPORT
Future cash flowsAs required by IAS 19 Revised, the expected payment flows for the next few years were calculated, as the following table shows (in millions of euros):
The average number of personnel during the year just ended was 85 managers, 6,285 white-collar workers and 256 blue-collar workers.At 31 January 2017, the Group had 87 managers, 6,300 white-collar workers and 254 blue-collar workers in its own employ.
Changes in the “Provision for risks and charges” item are shown below:
The provision is made for the risk of disputes with suppliers in relation to product sales and marketing, public entities, former employees and third parties of various kinds.The outcome of these risks cannot be defined with certainty, and the amount recorded therefore represents the best estimate of the presumed charge at year-end.
years Cash flow0 - 1 3.11 - 2 2.82 - 3 2.73 - 4 2.94 - 5 3.05 - beyond 31.8
31.01.2017 31.01.2016 change
16 Provisions for risks and charges 7,785 8,216 (431)
31.01.2017 31.01.2016 change
17 Deferred tax liabilities 140,939 142,733 (1,794)
(amounts in thousands of euros) 31.01.2017 31.01.2016Balance at beginning of year 8,216 9,395
Allocations in the period 0 0Utilisations in the period (431) (1,179)Balance at end of year 7,785 8,216

82 OVS SpA
The change in the “Deferred tax liabilities” item is shown below.
The same details are shown for the previous year:
Deferred tax liabilities related to the higher value of intangible assets in the financial statements were mainly due to their recognition at fair value according to the acquisition method at the time of the business combination. The “IRES rate adjustment effect” column included, at 31 January 2016, changes in the recalculation of deferred tax following the reduction as of 2017 of the IRES rate from 27.5% to 24%, pursuant to the 2016 Stability Law (208/2015).
(amounts in thousands of euros) Balance at 31.01.2015
Allocated/ released
to income statement
Allocated/ relea-sed to statement
of comprehensive income
Allocated/ released to
reserve
IRES rate adjustment
effect
Balance at 31.01.2016
Provision for stock write-downs 5,824 1,096 6,920Appropriation for local taxes 899 100 999Provisions for risks and charges 2,511 (252) 2,259Doubtful accounts 2,360 383 (49) 2,694Tangible and intangible assets (179,390) (49) 20,076 (159,363)Currency hedging derivatives (7,303) 0 7,303 0
Employee severance benefits calculated according to IAS 19 1,019 0 (616) 403
Other minor 5,574 (4,828) 2,879 (270) 3,355Total net prepaid (deferred) (168,506) (3,550) 6,687 2,879 19,757 (142,733)
(amounts in thousands of euros) Balance at 31.01.2016
Allocated/ released
to income statement
Allocated/ relea-sed to statement
of comprehensive income
Allocated/ released to
reserve
IRES rate adjustment
effect
Balance at 31.01.2017
Provision for stock write-downs 6,920 (662) 6,258Appropriation for local taxes 999 (119) 880Provisions for risks and charges 2,259 (391) 1,868Doubtful accounts 2,694 (168) 2,526Tangible and intangible assets (159,363) 3,555 (155,808)
Employee severance benefits calculated according to IAS 19 403 0 26 429
Provision for Collective Agreements 0 419 419Other minor 3,355 (866) 2,489Total net prepaid (deferred) (142,733) 1,768 26 0 0 (140,939)

83 2016 ANNUAL REPORT
Shareholders’ equity came in at €871.7 million.Details of changes in the items included in shareholders’ equity are provided in the relative accounting schedule.
18 Share capital
At 31 January 2017, the share capital of OVS SpA amounted to €227,000,000, comprising 227,000,000 ordinary shares with no par value. OVS was incorporated on 14 May 2014 with share capital of €10,000.The Transferral of the OVS-Upim Business Unit by then sole shareholder Gruppo Coin, which took effect from 31 July 2014, entailed a share capital increase from €10,000 to €140,000,000, with a premium of €249,885,000.Lastly, on 24 February 2015, the global offer for subscription and sale of ordinary shares of OVS SpA, with the aim of listing this company on the MTA, was successfully completed. The subscription operation entailed an additional capital increase of €87,000,000, taking the share capital from €140,000,000 to €227,000,000, divided into 227,000,000 ordinary shares with no par value.
18 Other reserves
The breakdown of other reserves is as follows:
The share premium reserve, amounting to €512.0 million, derives from increases in the capital of OVS SpA, as previously mentioned, and is shown net of listing costs of €7,590 thousand (gross costs of €10,469 thousand and deferred tax of €2,879 thousand).With regard to the accounting treatment applied to these costs, pursuant to IAS 32, following the positive outcome of the listing process, the ratio between the number of new shares/number of shares post-listing determined the percentage of charges registered as a direct reduction in shareholders’ equity, while the remainder was recognised under costs in the income statement. The legal reserve came to €4.1 million, and was created when earnings for the year ended 31 January 2016 were allocated.There are also other reserves with a positive net balance of €50.6 million, mainly including the effects of retained earnings of €44.7 million, the effects of booking directly to equity the actuarial gains/(losses) relating to employee severance benefits, the translation reserve and the effects of booking directly to equity reserve the management incentive plans, in accordance with IFRS 2 (also see note 22 (“Staff costs”)).
SHAREHOLDERS’ EQUITY

84 OVS SpA
Changes in the cash flow hedging reserve were as follows:
Changes in the reserve for actuarial gains/(losses) were as follows:
For further details on changes during the year, please see the consolidated statement of changes in shareholders’ equity.
(amounts in thousands of euros) 2016 2015Value at beginning of year 0 19,255
Release to cost of sales of the portion relating to instruments for which the hedging relationship was entered into 0 (25,615)
Deferred tax effect 0 7,044
Release to change in inventories of the portion relating to instruments for which the hedging relationship was entered into 0 (5,138)
Deferred tax effect 0 1,413
Release to income statement of fair value on instruments for which the hedging relationship has ended 0 0
Deferred tax effect 0 0Change in fair value 0 4,195Deferred tax effect 0 (1,154)Total change 0 (19,255)Value at end of year 0 0
(amounts in thousands of euros) 2016 2015Value at beginning of year (1,063) (2,687)
Change in provision for employee severance benefits under IAS 19 (323) 2,240Deferred tax effect 89 (616)Tax effect - adjustment IRES rate (63) 0Total change (297) 1,624Value at end of year (1,360) (1,063)


NOTES TO THE CONSOLIDATEDINCOME STATEMENT
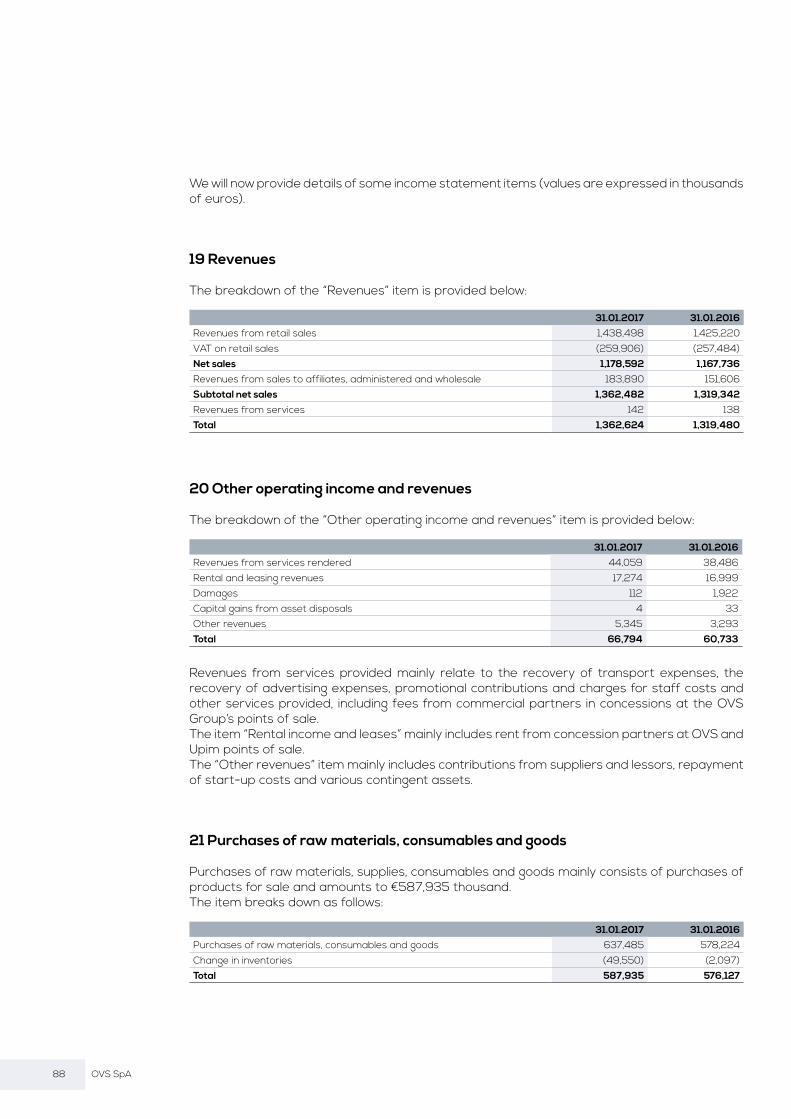
88 OVS SpA
We will now provide details of some income statement items (values are expressed in thousands of euros).
19 Revenues
The breakdown of the “Revenues” item is provided below:
20 Other operating income and revenues
The breakdown of the “Other operating income and revenues” item is provided below:
Revenues from services provided mainly relate to the recovery of transport expenses, the recovery of advertising expenses, promotional contributions and charges for staff costs and other services provided, including fees from commercial partners in concessions at the OVS Group’s points of sale.The item “Rental income and leases” mainly includes rent from concession partners at OVS and Upim points of sale.The “Other revenues” item mainly includes contributions from suppliers and lessors, repayment of start-up costs and various contingent assets.
21 Purchases of raw materials, consumables and goods
Purchases of raw materials, supplies, consumables and goods mainly consists of purchases of products for sale and amounts to €587,935 thousand. The item breaks down as follows:
31.01.2017 31.01.2016Revenues from retail sales 1,438,498 1,425,220VAT on retail sales (259,906) (257,484)Net sales 1,178,592 1,167,736Revenues from sales to affiliates, administered and wholesale 183,890 151,606Subtotal net sales 1,362,482 1,319,342Revenues from services 142 138Total 1,362,624 1,319,480
31.01.2017 31.01.2016Revenues from services rendered 44,059 38,486Rental and leasing revenues 17,274 16,999Damages 112 1,922Capital gains from asset disposals 4 33Other revenues 5,345 3,293Total 66,794 60,733
31.01.2017 31.01.2016Purchases of raw materials, consumables and goods 637,485 578,224Change in inventories (49,550) (2,097)Total 587,935 576,127

89 2016 ANNUAL REPORT
The consideration in euros for purchases abroad, mainly in dollars, including ancillary costs, is €540,653 thousand.
22 Staff costs
The breakdown of the “Staff costs” item is provided below:
The number of employees, expressed as the “full-time equivalent” headcount, was 5,788 at the end of the year, compared with 5,639 at 31 January 2016.
MANAGEMENT INCENTIVE PLANS
Approval of the Stock Option Plan On 26 May 2015, the shareholders’ meeting approved the 2015-2020 Stock Option Plan (hereinafter, the “Plan”), to be implemented through the granting of free options for subscription to ordinary newly issued shares of OVS SpA. The Plan is reserved for directors who are also employees, managers with strategic responsibilities and/or other employees of OVS SpA and its subsidiaries. The Plan is intended to create value for shareholders by improving long-term corporate performance and attracting personnel that play a key role in the Group Company’s development.The Plan provides for the issue of up to 5,107,500 options, which will be freely allocated to the Beneficiaries if certain performance targets are met, and confers on each of them the right to subscribe to one ordinary share of the Company for each option assigned.The same meeting was also convened in an extraordinary session to resolve upon the proposal to give the Board of Directors, for a period of five years from the date of the resolution, the power to increase the share capital, pursuant to Article 2443 of the Italian Civil Code, in tranches, excluding option rights pursuant to Article 2441, paragraph 8 of the Italian Civil Code, for a total maximum nominal amount of €35,000,000, through the issue, in one or more tranches, of up to 5,107,500 ordinary shares with no par value, to be reserved for the Beneficiaries of the “2015-2020 Stock Option Plan”, with the consequent amendment of Article 5 of the Articles of Association.
Implementation of the “2015-2020 Stock Option Plan”On 8 June 2015, the Board of Directors, implementing the resolutions passed by the shareholders’ meeting of 26 May 2015, resolved to execute the mandate to increase the share capital, pursuant to Article 2443 of the Italian Civil Code, granted to the Board of Directors by the extraordinary shareholders’ meeting of 26 May 2015, and, for this purpose, resolved upon a capital increase to service the stock option plan named the “2015-2020 Stock Option Plan”, which was approved by the same shareholders’ meeting. In particular, pursuant to the mandate granted by the extraordinary shareholders’ meeting of 26 May 2015, the Board of Directors resolved to carry out a paid share capital increase by the deadline of 8 June 2025, by issuing, in one or more tranches, up to 5,107,500 new ordinary shares of OVS, constituting 2.25% of the current share capital of OVS SpA, subscribed and paid up, with no par value, with
31.01.2017 31.01.2016Wages and salaries 204,305 191,637Social security charges 59,211 57,286Employee severance benefits 12,464 11,691Other staff costs 1,043 530Directors' fees 793 786Total 277,815 261,930

90 OVS SpA
the same characteristics as the ordinary shares outstanding on the issue date, with ordinary rights, excluding option rights pursuant to Article 2441, paragraph 8, of the Italian Civil Code, to be reserved for subscription by the Beneficiaries of the aforementioned stock option plan called the “2015-2020 Stock Option Plan”.
The key elements of the Stock Option Plan are as follows.
The reasons for the adoption of the 2015-2020 Stock Option Plan, which was approved by the shareholders’ meeting of 26 May 2015, are the need to offer, on conditions that take account of the current value from time to time of the OVS stock, a system of remuneration that incentives managers and key personnel of the Company and the Subsidiaries, linking the variable portion of the remuneration to the Group’s actual performance and the creation of new value for shareholders, as well as an incentive system designed to attract individuals who are highly qualified in management. The Stock Option Plan is reserved for individuals who, at the option grant date, hold the role of executive directors and/or will have an employment relationship of indefinite duration with one of the Group’s companies. This plan provides for the free granting of options (the “Options”) that will give Beneficiaries the right to subscribe to ordinary shares of OVS (in the ratio of 1 (one) ordinary share for every 1 (one) Option exercised) arising from the paid share capital increase in tranches described above, for a nominal amount of up to €35,000,000, excluding option rights pursuant to Article 2441, paragraphs 5 and 6 of the Italian Civil Code, through the issue of up to 5,107,500 new ordinary shares of OVS.For each Beneficiary and for the first cycle of options granted under the Plan, the exercise price of the shares is set at €4.88 per share. The exercise price for the first cycle of options, established by the Company’s Board of Directors on 22 April 2015 after consultation with the Appointments and Remuneration Committee, is equal to the definitive unit price at which OVS shares were placed under the global offer between 16 February 2015 and 24 February 2015, which comprised a public offer to the general public in Italy and an institutional placement for qualified investors in Italy and institutional investors abroad, for the purpose of listing shares of OVS, as of 2 March 2015, on the Mercato Telematico Azionario, organised and managed by Borsa Italiana SpA, (“MTA”), at €4.10 for each OVS share subject to the global offer, plus 19.1%. The exercise of the Options is subject to the achievement of predetermined and measurable performance targets, which include, inter alia, the parameter of EBITDA, as indicated by the Board of Directors after consultation with the Remuneration Committee, for the reference period under the Group’s business plan and/or budget.The Stock Option Plan authorises Beneficiaries to exercise the options early if certain events occur, including:
• a change of control within the meaning of Article 93 of the TUF, including if this does not entail a public tender offer obligation;
• a public tender offer for the Company’s shares pursuant to Article 102 et seq. of the TUF; or
• resolutions on transactions that could result in the delisting of ordinary shares of OVS.
The Stock Option Plan also requires, as a condition for participation in the plan itself, that the employee relationship of indeterminate duration or executive management with OVS or a subsidiary, depending on the type of Beneficiary (the “Relationship”), be maintained. In particular, the Stock Option Plan provides that, on termination of the Relationship due to a “bad leaver” scenario, all Options awarded to the Beneficiary, including Options that have become effective but have not yet been exercised, will automatically lapse and will have no effect or validity.The following events are regarded as “bad leaver” scenarios, depending on the case: (i) dismissal of the Beneficiary, termination of the post as director and/or the powers of the Beneficiary, or non-renewal of the position as board member and/or the powers of the Beneficiary, all of the

91 2016 ANNUAL REPORT
above for just cause; and (ii) termination of the Relationship due to voluntary resignation by the Beneficiary not justified by a “good leaver” scenario.If the Relationship is terminated due to a “good leaver” scenario, the Beneficiary or his/her heirs, provided that the obligations, terms and conditions set out in the Stock Option Plan are adhered to, will retain the right to exercise the Options granted, taking account of the time at which the Relationship was terminated in accordance with the procedures set out in the Plan.The following events are regarded as “good leaver” scenarios, depending on the case: (i) dismissal without just cause; (ii) termination of the post of director or non-renewal of the post of board member without just cause; (iii) resignation as a board member when the Beneficiary, without just cause, suffers a termination or non-confirmation of powers, so that his/her relationship with the Company or the Subsidiary is substantially altered; and (iv) resignation from the post or withdrawal from the employment relationship in the event of any one of the following cases: (a) permanent physical or psychological incapacity (due to illness or accident) of the Beneficiary; or (b) decease of the Beneficiary. The Stock Option Plan will end on 31 December 2020 and provides for a vesting period for the Options granted to the Beneficiary.
As already mentioned, the Stock Option Plan will end on 8 June 2025 (the expiration date, by which the exercisable Options must be exercised on penalty of forfeiture). There are three vesting periods for the Options granted to the Beneficiaries, with the following scope and terms:
• 1/3 of the Options are exercisable after 36 months from the grant date (First Vesting Period);
• 1/3 of the Options are exercisable after 48 months from the grant date (Second Vesting Period);
• 1/3 of the Options are exercisable after 60 months from the grant date (Third Vesting Period).
At 31 January 2017, 5,021,375 option rights had been granted in two different tranches, by resolution of the Board of Directors at its meeting of 8 June 2015.The Plan described above is defined as equity-settled pursuant to IFRS 2. In accordance with this accounting standard, the fair value of the Plan was estimated at the grant date, using the Black-Scholes method.The portion of the overall fair value of the Plan pertaining to the reporting period has therefore been recognised in the consolidated income statement. In particular, staff costs attributable to the granting of OVS shares, amounting to €3,882 thousand (already booked in the amount of €1,393 thousand at 31 January 2016), were recognised with a contra-entry in shareholders’ equity.For further details of the Plan, see the Report of the Board of Directors and the information memorandum, pursuant to Article 84-bis of Consob Regulation 11971/1999, which is available on the Company website at www.ovscorporate.it, in the Governance/Shareholders’ Meeting section.
Also note that, as part of the operation to acquire an equity investment in Gruppo Coin by funds assisted by BC Partners, which was completed on 30 June 2011, Icon 1 S.A., a holding company operating under Luxembourg law, issued a series of financial instruments to serve the acquisition, assigned to a range of classes of persons, including some managers at Gruppo Coin and now at the OVS Group.
For details of the characteristics of these financial instruments and the related accounting treatment used by the conferor, Gruppo Coin SpA, please see the information provided in the prospectus prepared for listing, section carve-out balances (chapter 20.1.3) published in the “Investor Relations” section of the Company’s website.

92 OVS SpA
For completeness of information, note that, when another three managers became shareholders of Icon 1 S.A., the characteristics of these instruments were redefined, partly with the aim of rebalancing the position of the managers, which had been prejudiced by the issue by Icon 1 S.A. of a special financial instrument. These changes did not affect the OVS Group’s financial position and profit performance, given that in June 2015 the managers added to the initial payments made based on the fair value of the financial instruments, recalculated at the effective date of the changes.
23 Depreciation, amortisation and write-downs of assets
The breakdown of the “Depreciation, amortisation and write-downs of assets” item is provided below:
Note that the amount relating to write-downs of tangible and intangible assets in the appendices in question was included in the amounts shown in the “Disposals” and “Write-downs” columns.Write-downs refer to assets written down due to store closures that have already taken place or are planned, and/or the results of impairment testing.
24 Other operating expenses: Service costs
Service costs, which reflect the Group’s use of external resources, can be broken down as follows:
31.01.2017 31.01.2016Amortisation of intangible assets 14,674 14,118Depreciation of tangible assets 42,718 40,437Write-downs of tangible and intangible assets 1,658 3,638Total 59,050 58,193
31.01.2017 31.01.2016Advertising 24,084 25,440Utilities 32,360 33,265Miscellaneous sales costs 42,205 41,290Service costs - professional and consulting services 23,425 19,000Travel and other employee expenses 13,185 12,464Insurance 3,326 3,345Maintenance, cleaning and security 33,010 32,114Service costs - other services 4,640 4,454Board of Statutory Auditors' fees / Supervisory Body 192 188Total 176,427 171,560
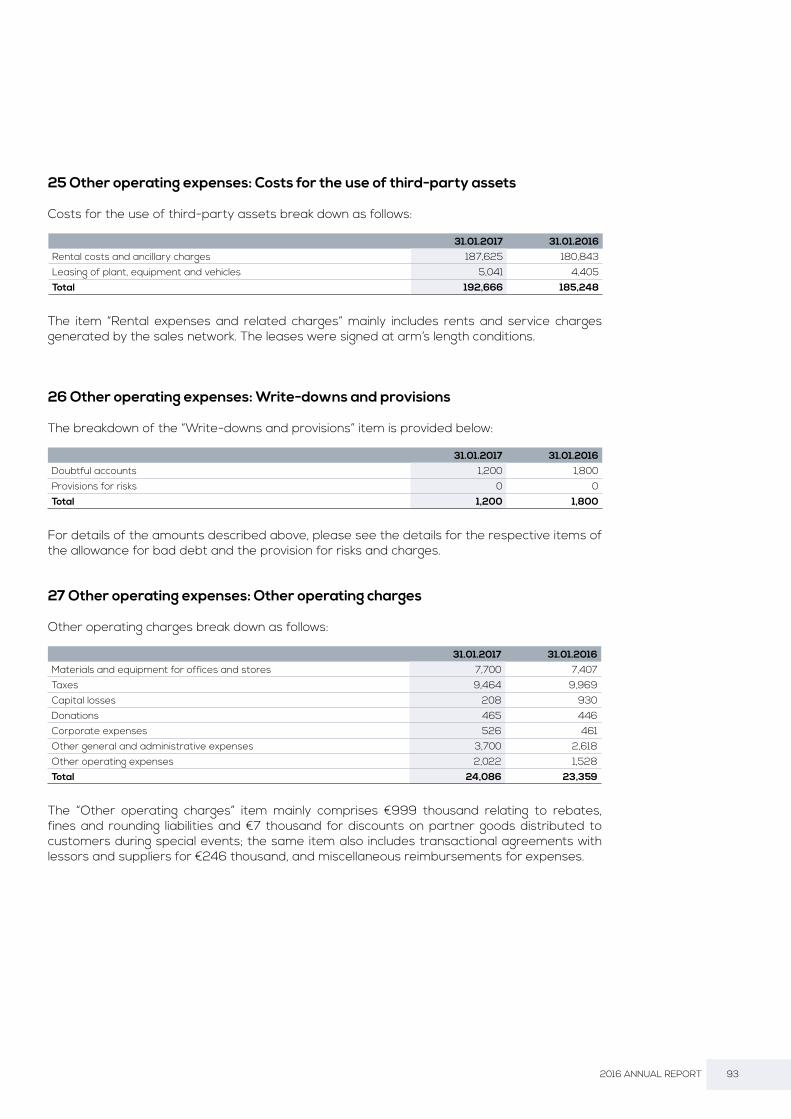
93 2016 ANNUAL REPORT
25 Other operating expenses: Costs for the use of third-party assets
Costs for the use of third-party assets break down as follows:
The item “Rental expenses and related charges” mainly includes rents and service charges generated by the sales network. The leases were signed at arm’s length conditions.
26 Other operating expenses: Write-downs and provisions
The breakdown of the “Write-downs and provisions” item is provided below:
For details of the amounts described above, please see the details for the respective items of the allowance for bad debt and the provision for risks and charges.
27 Other operating expenses: Other operating charges
Other operating charges break down as follows:
The “Other operating charges” item mainly comprises €999 thousand relating to rebates, fines and rounding liabilities and €7 thousand for discounts on partner goods distributed to customers during special events; the same item also includes transactional agreements with lessors and suppliers for €246 thousand, and miscellaneous reimbursements for expenses.
31.01.2017 31.01.2016Rental costs and ancillary charges 187,625 180,843Leasing of plant, equipment and vehicles 5,041 4,405Total 192,666 185,248
31.01.2017 31.01.2016Doubtful accounts 1,200 1,800Provisions for risks 0 0Total 1,200 1,800
31.01.2017 31.01.2016Materials and equipment for offices and stores 7,700 7,407Taxes 9,464 9,969Capital losses 208 930Donations 465 446Corporate expenses 526 461Other general and administrative expenses 3,700 2,618Other operating expenses 2,022 1,528Total 24,086 23,359

94 OVS SpA
28 Financial income (expenses)
FINANCIAL INCOME
FINANCIAL EXPENSES
Other financial expenses on loans mainly include fees associated with existing loans.
EXCHANGE RATE GAINS AND LOSSES
29 Taxes
The following is a breakdown of the charge to the income statement:
31.01.2017 31.01.2016Financial income on bank current accounts 52 63Financial income from miscellaneous sources 48 55Income from related company 100 0Total 200 118
31.01.2017 31.01.2016Financial expenses on bank current accounts 23 59Financial expenses on loans 11,532 21,164Financial expenses payable to other lenders 199 314Interest cost on provision for employee severance benefits 712 539Other financial expenses/fees 3,350 4,850Total 15,817 26,926
31.01.2017 31.01.2016Foreign exchange gains 13,701 16,386Foreign exchange losses (1,617) (461)Gains (losses) on the change in fair value of currency derivatives (917) 15,619
Gains (losses) on the change in fair value of currency derivatives in hedge accounting 0 (8,271)
Total 11,167 23,273
31.01.2017 31.01.2016IRES tax 25,164 23,327IRAP tax 5,670 5,451Tax on foreign companies 457 490Deferred tax (net change) (3,517) (17,387)Total 27,774 11,881

95 2016 ANNUAL REPORT
The following table shows the reconciliation of the theoretical tax charge with the effective tax charge:
For the year ended 31 January 2016, an amount of €19,757 thousand was booked deriving from the recalculation of deferred tax at the close of the year, based on the lower IRES rate of 24% (rather than 27.5%) defined in the 2016 Stability Law. Net of this effect, the tax rate at 31 January 2016 would have been 32.1%.
EARNINGS PER SHAREAs previously indicated, after the Company was listed the current share capital was divided into 227,000,000 with no par value.Earnings per share was calculated by dividing profit for the year by the average weighted number of shares of the Company outstanding in the period. The following table provides details of the calculation:
There were no significant dilutive effects at 31 January 2017 deriving from the stock option plan: the figure for diluted net earnings is therefore the same as for basic net earnings.
(amounts in thousands of euros) 31.01.2017 % 31.01.2016 %Net result for the year before tax 105,789 98,508Theoretical income tax (IRES) (29,092) (27.5)% (27,090) (27.5)%IRAP (5,670) (5.4)% (5,457) (5.5)%
Tax effect of permanent differences and other differences 6,988 6.6% 909 0.9%
IRES rate adjustment effect 0 0.0% 19,757 20.1%Taxes (27,774) (11,881)Effective tax rate (26.3)% (12.1)%
31.01.2017 31.01.2016Result for the year (in thousands of euros) 78,015 86,627Number of ordinary shares at end of year 227,000,000 227,000,000
Average weighted number of shares outstanding for the calculation of basic earnings per share 227,000,000 220,087,671
Basic earnings per share (in euros) 0.34 0.39Diluted earnings per share (in euros) 0.34 0.39


RELATIONS WITH RELATED PARTIES

98 OVS SpA
Rel
atio
ns w
ith r
elat
ed p
artie
s m
ainl
y co
ncer
n th
e P
aren
t C
omp
any,
Gru
pp
o C
oin
Sp
A, a
nd it
s su
bsi
diar
ies.
The
follo
win
g ta
ble
sum
mar
ises
Gru
pp
o O
VS
’s le
ndin
g an
d b
orro
win
g re
latio
nshi
ps
with
rel
ated
par
ties,
as
def
ined
by
IAS
24
:
With
reg
ard
to 3
1 Jan
uary
20
17, b
usin
ess
rela
tions
with
Gru
pp
o C
oin
and
its s
ubsi
diar
ies
mai
nly
rela
te t
o th
e p
rovi
sion
of
serv
ices
and
goo
ds b
roke
rage
fe
es.
Rel
atio
nshi
ps
with
Cen
tom
ilaca
ndel
e S
cpA
. rel
ate
to t
he p
rovi
sion
of
serv
ices
for
the
pur
chas
e of
ele
ctric
ity. C
ento
mila
cand
ele
S.c
.p.A
. is
a no
n-p
rofit
co
nsor
tium
com
pan
y, e
ngag
ed in
the
sup
ply
of
elec
tric
ity a
nd n
atur
al g
as u
nder
the
bes
t p
ossi
ble
con
ditio
ns t
o th
e co
nsor
tium
ent
ities
.
(am
ount
s in
th
ousa
nds
of e
uros
)R
elat
ed p
arti
es
Gru
pp
o
Co
in
S.p
.A.
CO
SI -
C
onc
ept
of
Sty
le
Ital
y S
.p.A
.
Exc
elsi
or
Ver
ona
S
.r.l.
in
liqui
daz
ione
GC
F S
.p.A
.
Gru
pp
o
Co
in
Inte
rnat
iona
l S
.A.
Cen
tom
ila-
cand
ele
S.c
.p.a
.
Sem
pio
ne
Ret
ail A
G
Cha
rles
V
ögel
e M
ode
AG
Coi
n S
.r.l.
Exc
elsi
or
Mila
no
S.r
.l.
Dir
ecto
rs a
nd
man
ager
s w
ith
stra
tegi
c re
spon
sib
iliti
es
Tota
lTo
tal
bal
ance
sh
eet i
tem
Per
cent
age
of b
alan
ce
shee
t ite
m
Trad
e re
ceiv
able
s
At
31 J
anua
ry 2
017
1,00
45
25
2 -
12
83
,53
11,9
27
4 -
6
,60
875
,259
8.8
%A
t 3
1 Jan
uary
20
163
,181
717
33
23
1 -
-
-
-
-
-
3
,95
571
,20
55
.6%
Non
-cur
rent
fi
nanc
ial a
sset
s
At
31 J
anua
ry 2
017
-
-
-
-
-
-
5,4
91
-
-
-
-
5,4
91
5,4
91
100
.0%
At
31 J
anua
ry 2
016
-
-
-
-
-
-
-
-
-
-
-
01,9
88
n.a.
Trad
e p
ayab
les
A
t 3
1 Jan
uary
20
17 -
-
-
-
-
(1
,237
) -
-
(8
) -
-
(1
,24
5)
(367
,66
2)
0.3
%A
t 3
1 Jan
uary
20
16(1
47)
-
-
-
-
(1,6
60
) -
-
-
-
-
(1
,807
)(3
68
,83
4)
0.5
%C
urre
nt ta
x lia
bili
ties
At
31 J
anua
ry 2
017
(11,4
60
) -
-
-
-
-
-
-
-
-
-
(1
1,46
0)
(15
,79
6)
72.6
%A
t 3
1 Jan
uary
20
16(2
3,5
06
) -
-
-
-
-
-
-
-
-
-
(2
3,5
06
)(2
3,7
71)
98
.9%
Oth
er c
urre
nt
pay
able
s
At
31 J
anua
ry 2
017
-
-
-
-
-
-
-
-
-
-
(2,0
18)
(2,0
18)
(95
,42
0)
2.1%
At
31 J
anua
ry 2
016
-
-
-
-
-
-
-
-
-
-
(2,7
01)
(2,7
01)
(10
1,89
5)
2.7
%
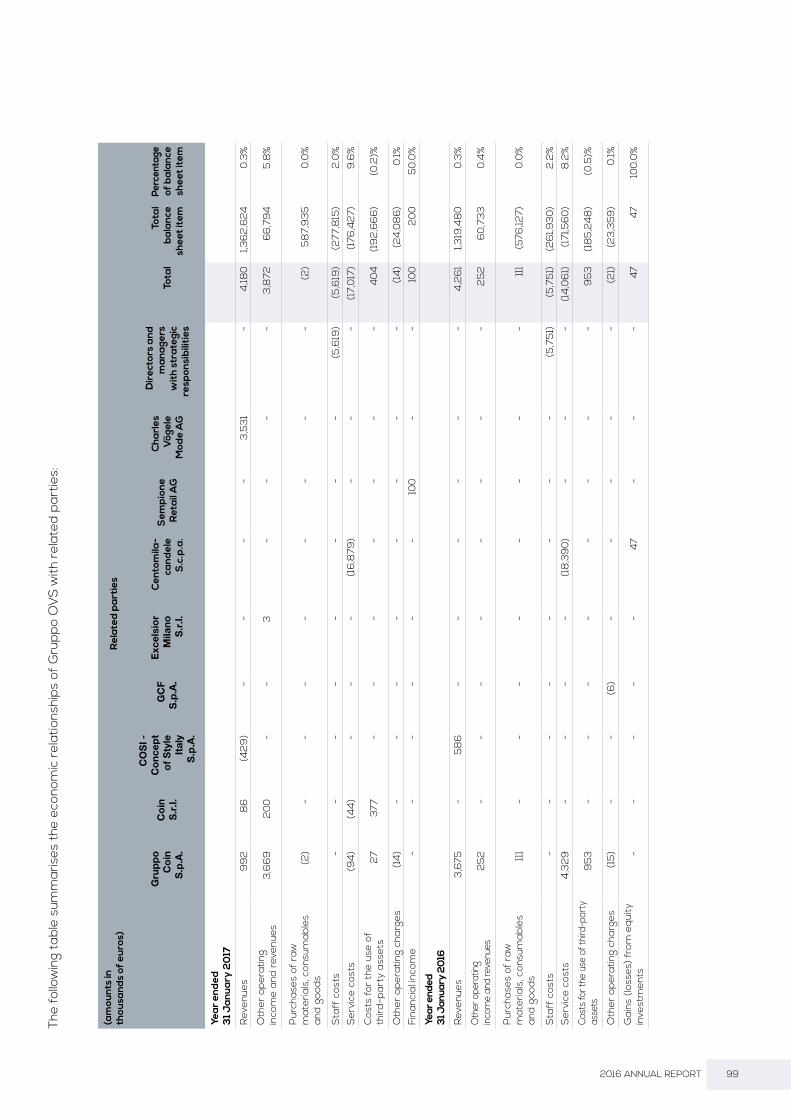
99 2016 ANNUAL REPORT
(am
ount
s in
th
ousa
nds
of e
uros
)R
elat
ed p
arti
es
Gru
pp
o
Co
in
S.p
.A.
Co
in
S.r
.l.
CO
SI -
C
onc
ept
of
Sty
le
Ital
y S
.p.A
.
GC
F S
.p.A
.
Exc
elsi
or
Mila
no
S.r
.l.
Cen
tom
ila-
cand
ele
S.c
.p.a
.
Sem
pio
ne
Ret
ail A
G
Cha
rles
V
ögel
e M
ode
AG
Dir
ecto
rs a
nd
man
ager
s w
ith
stra
tegi
c re
spon
sib
iliti
es
Tota
lTo
tal
bal
ance
sh
eet i
tem
Perc
enta
ge
of b
alan
ce s
heet
item
Year
end
ed
31 J
anua
ry 2
017
Rev
enue
s9
92
86
(42
9)
-
-
-
-
3,5
31
-
4,18
01,3
62
,62
40
.3%
Oth
er o
per
atin
g in
com
e an
d re
venu
es3
,66
92
00
-
-
3
-
-
-
-
3,8
726
6,7
94
5.8
%
Pur
chas
es o
f ra
w
mat
eria
ls, c
onsu
mab
les
and
good
s(2
) -
-
-
-
-
-
-
-
(2
)5
87,
93
50
.0%
Sta
ff c
osts
-
-
-
-
-
-
-
-
(5,6
19)
(5,6
19)
(277
,815
)2
.0%
Ser
vice
cos
ts
(94
)(4
4)
-
-
-
(16
,879
) -
-
-
(1
7,0
17)
(176
,42
7)9
.6%
Cos
ts fo
r th
e us
e of
th
ird-p
arty
ass
ets
27
377
-
-
-
-
-
-
-
40
4(1
92
,66
6)
(0.2
)%
Oth
er o
per
atin
g ch
arge
s(1
4)
-
-
-
-
-
-
-
-
(14
)(2
4,0
86
)0
.1%Fi
nanc
ial i
ncom
e -
-
-
-
-
-
10
0
-
-
100
20
05
0.0
%
Year
end
ed
31 J
anua
ry 2
016
Rev
enue
s3
,675
-
58
6
-
-
-
-
-
-
4,2
61
1,319
,48
00
.3%
Oth
er o
pera
ting
inco
me
and
reve
nues
25
2 -
-
-
-
-
-
-
-
2
52
60
,73
30
.4%
Pur
chas
es o
f ra
w
mat
eria
ls, c
onsu
mab
les
and
good
s11
1 -
-
-
-
-
-
-
-
11
1(5
76,12
7)0
.0%
Sta
ff c
osts
-
-
-
-
-
-
-
-
(5,7
51)
(5,7
51)
(26
1,93
0)
2.2
%S
ervi
ce c
osts
4
,32
9 -
-
-
-
(1
8,3
90
) -
-
-
(1
4,0
61)
(171
,56
0)
8.2
%
Cost
s fo
r the
use
of t
hird
-par
ty
asse
ts9
53
-
-
-
-
-
-
-
-
95
3(1
85
,24
8)
(0.5
)%
Oth
er o
per
atin
g ch
arge
s(1
5)
-
-
(6)
-
-
-
-
-
(21)
(23
,359
)0
.1%
Gai
ns (
loss
es)
from
equ
ity
inve
stm
ents
--
--
-47
--
-47
4710
0.0
%
The
follo
win
g ta
ble
sum
mar
ises
the
eco
nom
ic r
elat
ions
hip
s of
Gru
pp
o O
VS
with
rel
ated
par
ties:
100 OVS SpA
The main economic relationships with related parties are as follows:
• procurement brokerage fees for services provided by subsidiary OVS Hong Kong Sourcing Limited to Gruppo Coin and Coin, included in the “Revenues” item;
• chargebacks to Gruppo Coin and Coin of costs for central IT, logistics and leasing services incurred by Gruppo OVS, included in the “Other income and operating revenues” item;
• the provision of services relating to the purchase of electricity by Centomilacandele ScpA, included in the “Service costs” items;
and
• interest accrued on financial receivables from Sempione Retail AG, included in the item “Financial income”.

101 2016 ANNUAL REPORT
The
cash
flo
ws
show
n in
the
follo
win
g ta
ble
rep
rese
nt t
he a
ctua
l pay
men
ts a
nd r
ecei
pts
reg
iste
red
with
rel
ated
par
ties,
rat
her
than
cha
nges
dur
ing
the
year
in t
he b
alan
ce s
heet
item
to
whi
ch t
hey
rela
te.
The
follo
win
g tr
ansa
ctio
ns li
sted
too
k p
lace
und
er a
rm’s
leng
th c
ondi
tions
.
(am
ount
s in
thou
sand
s of
eur
os)
Rel
ated
par
ties
Gru
pp
o
Co
in
S.p
.A.
Co
in
S.r
.l.
CO
SI -
C
onc
ept
of
Sty
le
Ital
y S
.p.A
.
Exc
elsi
or
Ver
ona
S
.r.l.
in
liqui
daz
ione
GC
F S
.p.A
.
Cen
tom
ila-
cand
ele
S.c
.p.a
.
Sem
pio
ne
Ret
ail A
G
Dir
ecto
rs
and
man
ager
s w
ith
stra
tegi
c re
spon
sib
iliti
es
Tota
l
Tota
l cas
h fl
ow fr
om
the
cash
flow
st
atem
ent
Per
cent
age
of b
alan
ce
shee
t ite
m
Year
end
ed 3
1 Jan
uary
20
17
Cas
h flo
w g
ener
ated
(ab
sorb
ed)
by o
per
atin
g ac
tiviti
es(1
3,7
14)
(83
)19
33
32
3(2
0,7
04
)(2
8)
(4,7
12)
(38
,99
2)
75,2
64
(51.8
)%
Cas
h flo
w g
ener
ated
(ab
sorb
ed)
by in
vest
ing
activ
ities
(3,9
31)
--
--
-(8
,28
4)
-(1
2,2
15)
(73
,79
9)
16.6
%
Cas
h flo
w g
ener
ated
(ab
sorb
ed)
by f
inan
cing
act
iviti
es-
--
--
-(5
,49
1)-
(5,4
91)
(37,
38
8)
14.7
%
Year
end
ed 3
1 Jan
uary
20
16
Cas
h flo
w g
ener
ated
(ab
sorb
ed)
by o
per
atin
g ac
tiviti
es9
,271
-17
-(6
)(2
2,2
57)
-(2
,99
5)
(15
,970
)12
5,0
61
(12
.8)%
Cas
h flo
w g
ener
ated
(ab
sorb
ed)
by in
vest
ing
activ
ities
--
--
-47
--
47(6
7,5
04
)(0
.1)%
Cas
h flo
w g
ener
ated
(ab
sorb
ed)
by f
inan
cing
act
iviti
es59
,65
0-
--
--
--
59,6
50
27,
745
215
.0%

102 OVS SpA
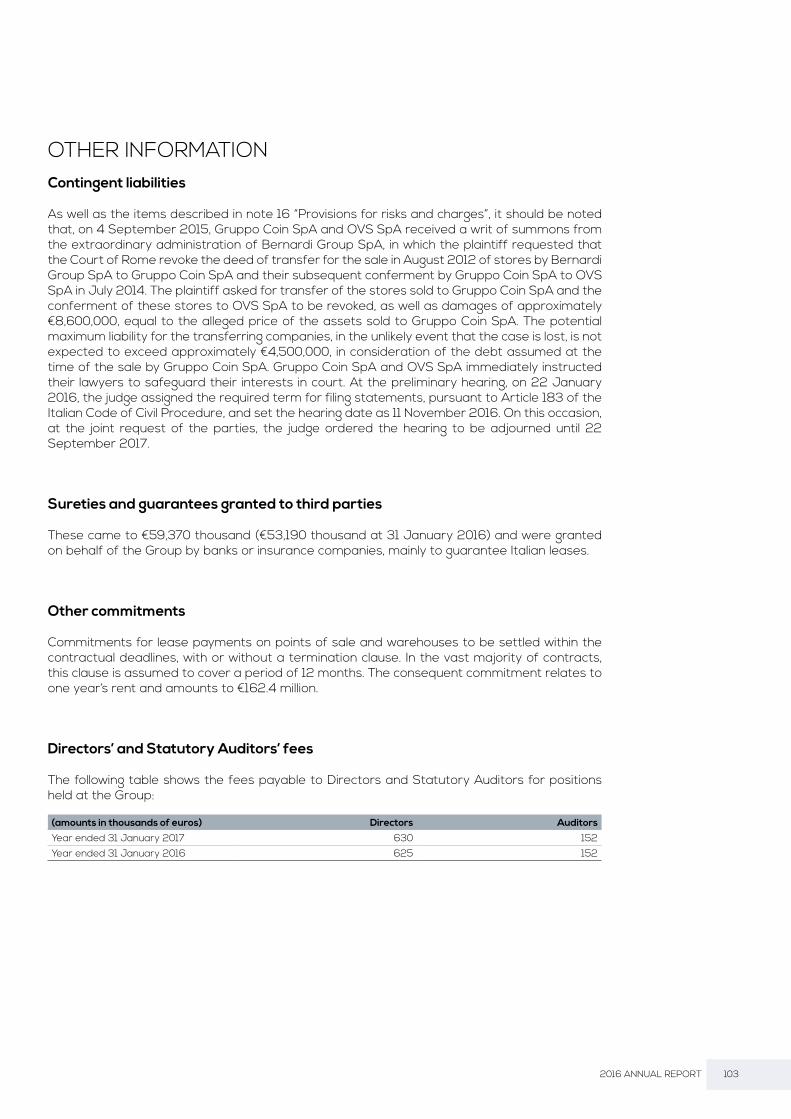
103 2016 ANNUAL REPORT
OTHER INFORMATION
(amounts in thousands of euros) Directors Auditors
Year ended 31 January 2017 630 152Year ended 31 January 2016 625 152
Contingent liabilities
As well as the items described in note 16 “Provisions for risks and charges”, it should be noted that, on 4 September 2015, Gruppo Coin SpA and OVS SpA received a writ of summons from the extraordinary administration of Bernardi Group SpA, in which the plaintiff requested that the Court of Rome revoke the deed of transfer for the sale in August 2012 of stores by Bernardi Group SpA to Gruppo Coin SpA and their subsequent conferment by Gruppo Coin SpA to OVS SpA in July 2014. The plaintiff asked for transfer of the stores sold to Gruppo Coin SpA and the conferment of these stores to OVS SpA to be revoked, as well as damages of approximately €8,600,000, equal to the alleged price of the assets sold to Gruppo Coin SpA. The potential maximum liability for the transferring companies, in the unlikely event that the case is lost, is not expected to exceed approximately €4,500,000, in consideration of the debt assumed at the time of the sale by Gruppo Coin SpA. Gruppo Coin SpA and OVS SpA immediately instructed their lawyers to safeguard their interests in court. At the preliminary hearing, on 22 January 2016, the judge assigned the required term for filing statements, pursuant to Article 183 of the Italian Code of Civil Procedure, and set the hearing date as 11 November 2016. On this occasion, at the joint request of the parties, the judge ordered the hearing to be adjourned until 22 September 2017.
Sureties and guarantees granted to third parties
These came to €59,370 thousand (€53,190 thousand at 31 January 2016) and were granted on behalf of the Group by banks or insurance companies, mainly to guarantee Italian leases.
Other commitments
Commitments for lease payments on points of sale and warehouses to be settled within the contractual deadlines, with or without a termination clause. In the vast majority of contracts, this clause is assumed to cover a period of 12 months. The consequent commitment relates to one year’s rent and amounts to €162.4 million.
Directors’ and Statutory Auditors’ fees
The following table shows the fees payable to Directors and Statutory Auditors for positions held at the Group:

104 OVS SpA
RECONCILIATION OF SHAREHOLDERS’ EQUITY AND RESULT FOR THE YEAR OF THE PARENT COMPANY WITH CONSOLIDATED SHAREHOLDERS’ EQUITY AND RESULT FOR THE YEAR
(amounts in thousands of euros) Result for the year
Shareholders' equity
Financial statements of OVS S.p.A. at 31 January 2017, prepared according to the international reporting standards (IFRS) 76,507 855,275
Shareholders' equity and profit for the year of the fully consolidated subsidiaries, net of the carrying amount of the equity investments 20,699 8,341
Elimination of infra-group dividends (20,926) 0Elimination of unrealised infra-group results net of the relative tax effect (101) (352)
Exchange rate gains or losses from the translation of financial statements in foreign currencies 0 971
Change on consolidation scope 0 624Elimination of inter-company write-downs 1,836 6,885
Consolidated financial statements of OVS Group at 31 January 2017, prepared according to the international reporting standards (IFRS) 78,015 871,744
31.01.2017 31.01.2016Other revenues 0 (49)Staff costs 161 301Service costs 889 2,053Costs for the use of third-party assets 48 1,017Other operating charges 2,697 3,559Financial expenses 0 6,774Taxes (1,044) (23,512)Total 2,751 (9,857)
Transactions arising from atypical and/or unusual operations
In accordance with the Consob Communication of 28 July 2006, note that in 2016, no atypical and/or unusual operations were entered into as defined by the Communication.
Significant non-recurring events and operations
In accordance with the Consob Communication of 28 July 2006, note that the Group’s results for 2016 were influenced by non-recurring net expenses of €2,751 thousand.
Non-recurring charges mainly refer to:
• €597 thousand for consulting and legal fees relating to the Swiss development project, recognised under “Service costs”;
• €2,694 thousand for charges, consulting and corporate expenses relating to the Swiss development project, recognised under “Other operating charges”;
For the year ended 31 January 2016, an amount of €19,757 thousand was included in non-recurring revenues, referred to taxes arising from IRES adjustment from 27.5% to 24%, which came into force on 1 January 2017.

105 2016 ANNUAL REPORT
Significant events after the period
No significant events occurred after the reporting period.Please see also the Report on Operations.


APPENDICES TO THE CONSOLIDATEDFINANCIAL STATEMENTS
108 OVS SpA
The following documents contain additional information on the consolidated financial statements for the year ended 31 January 2017.
Appendices:
1. Property, plant and equipment at 31 January 2017,
2. Intangible assets at 31 January 2017,
3. Property, plant and equipment at 31 January 2016,
4. Intangible assets at 31 January 2016.

109 2016 ANNUAL REPORT
Property, plant and equipment
The composition and changes during the period were as follows (amounts in thousands of euros):
(1) Of this amount, €1,978 thousand represents assets under construction at 31/01/2016, reclassified to the specific asset categories in 2016. (2) Includes €1,599 thousand relating to fixed assets disposed of and written down in the period due to the closure of p.o.s.
APPENDIX 1
Movements during the year
Balance at 31.01.2016 Purchases Sales/
disposalsAmortisation/
write-downsBalance at 31.01.2017
Leasehold improvements
initial cost 196,713 11,504 (1,059) 0 207,158write-downs 0 0 0 0 0amortisation (143,600) 0 658 (8,679) (151,621)net 53,113 11,504 (401) (8,679) 55,537
Land and buildingsinitial cost 33,901 449 0 0 34,350write-downs 0 0 0 0 0amortisation (7,934) 0 0 (693) (8,627)net 25,967 449 0 (693) 25,723
Plant and machineryinitial cost 278,711 11,871 (1,565) 0 289,017write-downs 0 0 0 0 0amortisation (191,839) 0 994 (12,962) (203,807)net 86,872 11,871 (571) (12,962) 85,210
Industrial and commercial equipment
initial cost 306,473 24,032 (4,964) 0 325,541write-downs 0 0 0 0 0amortisation (220,361) 0 4,207 (18,628) (234,782)net 86,112 24,032 (757) (18,628) 90,759
Other assetsinitial cost 54,045 3,299 (81) 0 57,263write-downs 0 0 0 0 0amortisation (49,174) 0 75 (1,756) (50,855)net 4,871 3,299 (6) (1,756) 6,408
Assets under construction and payments on account
initial cost 3,148 2,552 (1,978) 0 3,722write-downs 0 0 0 0 0amortisation 0 0 0 0 0net 3,148 2,552 (1,978) 0 3,722
Totalinitial cost 872,991 53,707 (9,647) 0 917,051write-downs 0 0 0 0 0amortisation (612,908) 0 5,934 (42,718) (649,692)net 260,083 53,707 (3,713) (42,718) 267,359
(1)
(2)

110 OVS SpA
Intangible assets
The composition and changes during the period were as follows (amounts in thousands of euros):
(1) Of this amount, €700 thousand represents assets under construction at 31/01/2016, reclassified to the specific asset categories in 2016. (2) Includes €19 thousand relating to fixed assets disposed of and written down in the period due to the closure of p.o.s. (3) Includes €40 thousand relating to assets written down after impairment testing of the p.o.s. (4) Includes €624 thousand relating to goodwill recognition after purchasing of OVS Fashion España S.L. on 30/09/2016.
Movements during the year
Balance at 31.01.2016 Purchases Sales/
disposalsAmortisation/
write-downsBalance at 31.01.2017
Rights to industrial patents and intellectual property rights
initial cost 117,587 7,778 (281) 0 125,084write-downs 0 0 0 0 0amortisation (101,267) 0 266 (5,827) (106,828)net 16,320 7,778 (15) (5,827) 18,256
Concessions, licences and trademarks
initial cost 518,394 2,339 (799) 0 519,934write-downs (5,852) 0 771 (40) (5,121)amortisation (4,781) 0 9 (1,016) (5,788)net 507,761 2,339 (19) (1,056) 509,025
Assets under construction and payments on account
initial cost 700 681 (700) 0 681write-downs 0 0 0 0 0amortisation 0 0 0 0 0net 700 681 (700) 0 681
Other intangible assetsinitial cost 162,806 162 0 0 162,968write-downs 0 0 0 0 0amortisation (43,175) 0 0 (7,831) (51,006)net 119,631 162 0 (7,831) 111,962
Totalinitial cost 799,487 10,960 (1,780) 0 808,667write-downs (5,852) 0 771 (40) (3) (5,121)amortisation (149,223) 0 275 (14,674) (163,622)net 644,412 10,960 (734) (14,714) 639,924
Goodwillinitial cost 452,541 624 0 0 453,165write-downs 0 0 0 0 0amortisation 0 0 0 0 0net 452,541 624 0 0 453,165
APPENDIX 2
(1)
(2)
(4)

111 2016 ANNUAL REPORT
Property, plant and equipment
The composition and changes during the period were as follows (amounts in thousands of euros):
(1) Of this amount, €2,348 thousand represents assets under construction at 31/01/2015, reclassified to the specific asset categories in 2015. (2) Includes €3,251 thousand relating to fixed assets disposed of and written down in the period due to the closure of p.o.s.
APPENDIX 3
Movements during the year
Balance at 31.01.2015 Purchases Sales/
disposalsAmortisation/
write-downsBalance at 31.01.2016
Leasehold improvements
initial cost 191,492 12,059 (6,838) 0 196,713write-downs (149) 0 149 0 0amortisation (140,975) 0 5,815 (8,440) (143,600)net 50,368 12,059 (874) (8,440) 53,113
Land and buildings
initial cost 33,563 338 0 0 33,901
write-downs 0 0 0 0 0amortisation (7,226) 0 0 (708) (7,934)net 26,337 338 0 (708) 25,967
Plant and machineryinitial cost 262,954 26,186 (10,429) 0 278,711write-downs 0 0 0 0 0amortisation (188,216) 0 8,803 (12,426) (191,839)net 74,738 26,186 (1,626) (12,426) 86,872
Industrial and commercial equipment
initial cost 298,176 22,474 (14,177) 0 306,473write-downs (48) 0 48 0 0amortisation (215,445) 0 12,193 (17,109) (220,361)net 82,683 22,474 (1,936) (17,109) 86,112
Other assetsinitial cost 56,813 2,425 (5,193) 0 54,045write-downs 0 0 0 0 0amortisation (52,414) 0 4,994 (1,754) (49,174)net 4,399 2,425 (199) (1,754) 4,871
Assets under construction and payments on account
initial cost 2,992 2,504 (2,348) 0 3,148write-downs 0 0 0 0 0amortisation 0 0 0 0 0net 2,992 2,504 (2,348) 0 3,148
Totalinitial cost 845,990 65,986 (38,985) 0 872,991write-downs (197) 0 197 0 0amortisation (604,276) 0 31,805 (40,437) (612,908)net 241,517 65,986 (6,983) (40,437) 260,083
(1)
(2)

112 OVS SpA
Intangible assets
The composition and changes during the period were as follows (amounts in thousands of euros):
(1) Of this amount, €808 thousand represents assets under construction at 31/01/2015, reclassified to the specific asset categories in 2015. (2) Includes €32 thousand relating to fixed assets disposed of and written down in the period due to the closure of p.o.s. (3) Includes €355 thousand relating to assets written down after impairment testing of the p.o.s.
Movements during the year
Balance at 31.01.2015 Purchases Sales/
disposalsAmortisation/
write-downsBalance at 31.01.2016
Rights to industrial patents and intellectual property rights
initial cost 109,708 8,618 (739) 0 117,587write-downs 0 0 0 0 0amortisation (96,593) 0 635 (5,309) (101,267)net 13,115 8,618 (104) (5,309) 16,320
Concessions, licences and trademarks
initial cost 519,593 1,195 (2,394) 0 518,394write-downs (7,240) 0 1,743 (355) (5,852)amortisation (3,821) 0 19 (979) (4,781)net 508,532 1,195 (632) (1,334) 507,761
Assets under construction and payments on account
initial cost 808 700 (808) 0 700write-downs 0 0 0 0 0amortisation 0 0 0 0 0net 808 700 (808) 0 700
Other intangible assetsinitial cost 162,630 176 0 0 162,806write-downs 0 0 0 0 0amortisation (35,345) 0 0 (7,830) (43,175)net 127,285 176 0 (7,830) 119,631
Totalinitial cost 792,739 10,689 (3,941) 0 799,487write-downs (7,240) 0 1,743 (355) (3) (5,852)amortisation (135,759) 0 654 (14,118) (149,223)net 649,740 10,689 (1,544) (14,473) 644,412
Goodwillinitial cost 452,541 0 0 0 452,541write-downs 0 0 0 0 0amortisation 0 0 0 0 0net 452,541 0 0 0 452,541
APPENDIX 4
(1)
(2)

113 2016 ANNUAL REPORT
1. We, the undersigned, Stefano Beraldo, as the Chief Executive Officer, and Nicola Perin, as the Director responsible for preparing the corporate accounting statements of OVS SpA, hereby declare, also taking account of article 154-bis, paragraphs 3 and 4, of Legislative Decree 58 of 24 February 1998:
• the adequacy with respect to the characteristics of the Company and • the effective application
of the administrative and accounting procedures for the preparation of the consolidated financial statements in the period from 1 February 2016 to 31 January 2017.
2. The evaluation of the adequacy of the administrative and accounting procedures used in the preparation of the consolidated financial statements at 31 January 2017 was based on a process defined by OVS SpA consistent with the Internal Control Integrated Framework issued by the Committee of Sponsoring Organizations of the Treadway Commission (CoSO), which is a generally accepted international framework.
3. Moreover:
3.1 the consolidated financial statements:a. were prepared in compliance with the international accounting standards recognised
by the European Community pursuant to (EC) Regulation 1606/2002 of the European Parliament and of the Council of 19 July 2002;
b. correspond to the accounting books and records;c. are suitable to provide a true and fair representation of the financial position and
profit performance of the issuer and all the companies included within the scope of consolidation.
3.2 The Report on Operations includes a reliable analysis of the performance and operating results, as well as the situation, of the issuer and all the companies included within the scope of consolidation, as well as a description of the main risks and uncertainties to which they are exposed.
Venice - Mestre, 18 April 2017
Stefano Beraldo Nicola Perin Chief Executive Officer Director responsible for preparing the corporate accounting statements
CERTIFICATION OF THE CONSOLIDATED FINANCIAL STATEMENTS PURSUANT TO ARTICLE 81-TER OF CONSOB REGULATION 11971 OF 14 MAY 1999, AS SUBSEQUENTLY AMENDED AND SUPPLEMENTED.


115 2016 ANNUAL REPORT
INDEPENDENT AUDITORS’ REPORT IN ACCORDANCE WITH ARTICLES 14 AND 16 OF LEGISLATIVE DECREE No. 39 OF 27 JANUARY 2010
To the shareholders of OVS SpA
Report on the consolidated financial statements
We have audited the accompanying consolidated financial statements of the OVS Group, which comprise the statement of financial position as of 31 January 2017, the income statement, the statement of comprehensive income, the statement of changes in shareholders’ equity and the statement of cash flows for the year then ended, a summary of significant accounting policies and other explanatory notes.
Directors’ responsibility for the consolidated financial statements
The directors of OVS SpA are responsible for the preparation of consolidated financial statements that give a true and fair view in compliance with International Financial Reporting Standards as adopted by the European Union, as well as with the regulations issued to implement article 9 of Legislative Decree No. 38/2005.
Auditors’ responsibility
Our responsibility is to express an opinion on these consolidated financial statements based on our audit. We conducted our audit in accordance with International Standards on Auditing (ISA Italia) drawn up pursuant to article 11 of Legislative Decree No. 39 of 27 January 2010. Those standards require that we comply with ethical requirements and plan and perform the audit to obtain reasonable assurance about whether the consolidated financial statements are free from material misstatement.
An audit involves performing audit procedures to obtain audit evidence about the amounts and disclosures in the consolidated financial statements. The audit procedures selected depend on the auditor’s professional judgment, including the assessment of the risks of material misstatement of the consolidated financial statements, whether due to fraud or error. In making those risk assessments, the auditor considers internal control relevant to the entity’s preparation of consolidated financial statements that give a true and fair view, in order to design audit procedures that are appropriate in the circumstances, but not for the purpose of expressing an opinion on the effectiveness of the entity’s internal control. An audit also includes evaluating the appropriateness of accounting policies used and the reasonableness of accounting estimates made by the directors, as well as evaluating the overall presentation of the consolidated financial statements.

116 OVS SpA
2 of 2
We believe that the audit evidence we have obtained is sufficient and appropriate to provide a basis for our audit opinion.
Opinion
In our opinion, the consolidated financial statements give a true and fair view of the financial position of the OVS Group as of 31 January 2017 and of the result of its operations and cash flows for the year then ended in compliance with International Financial Reporting Standards as adopted by the European Union, as well as with the regulations issued to implement article 9 of Legislative Decree No. 38/2005.
Report on compliance with other laws and regulations
Opinion on the consistency with the consolidated financial statements of the report on operations and of certain information set out in the report on corporate governance and ownership structure
We have performed the procedures required under auditing standard (SA Italia) No. 720B in order to express an opinion, as required by law, on the consistency of the report on operations and of the information set out in the report on corporate governance and ownership structure referred to in article 123-bis, paragraph 4, of Legislative Decree No. 58/98, which are the responsibility of the directors of OVS SpA, with the consolidated financial statements of the OVS Group as of 31 January 2017. In our opinion, the report on operations and the information in the report on corporate governance and ownership structure mentioned above are consistent with the consolidated financial statements of the OVS Group as of 31 January 2017.
Treviso, 9 May 2017
PricewaterhouseCoopers SpA
Signed by
Massimo Dal Lago (Partner)
This report has been translated into English from the Italian original solely for the convenience of international readers


SEPARATE FINANCIAL STATEMENTS OF OVS S.P.A. AT 31 JANUARY 2017
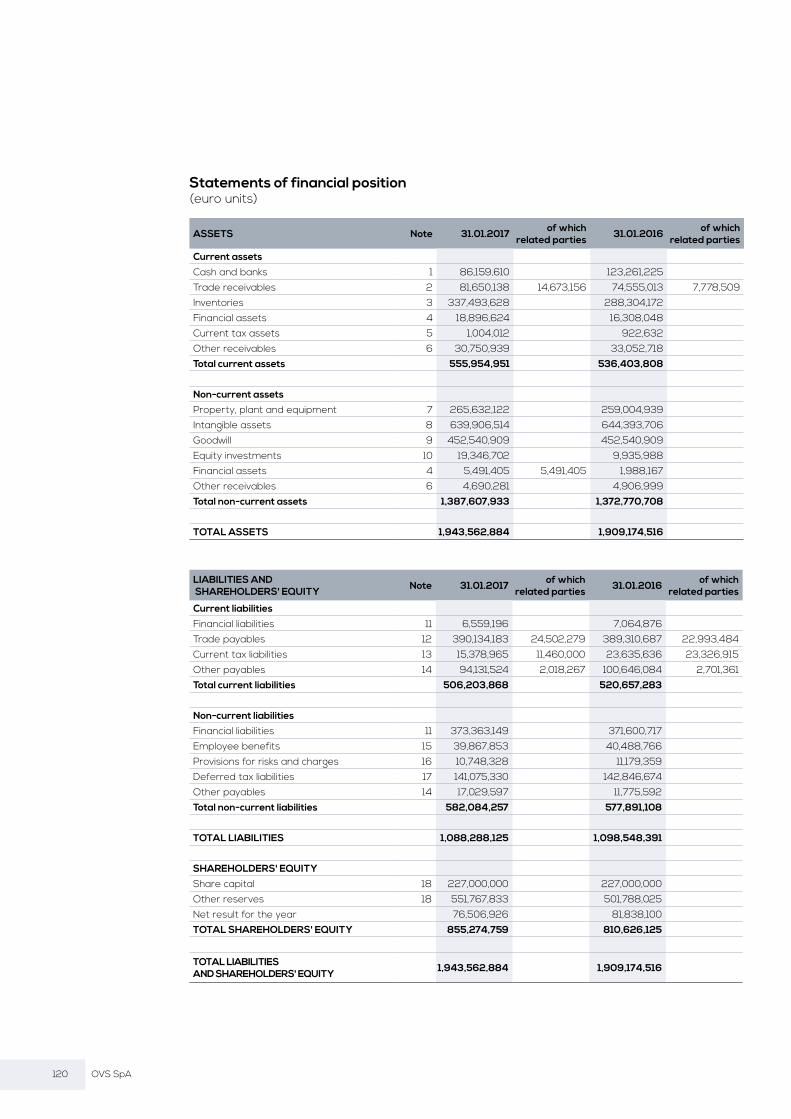
120 OVS SpA
Statements of financial position(euro units)
ASSETS Note 31.01.2017 of which related parties 31.01.2016 of which
related parties
Current assets
Cash and banks 1 86,159,610 123,261,225Trade receivables 2 81,650,138 14,673,156 74,555,013 7,778,509Inventories 3 337,493,628 288,304,172Financial assets 4 18,896,624 16,308,048Current tax assets 5 1,004,012 922,632Other receivables 6 30,750,939 33,052,718Total current assets 555,954,951 536,403,808
Non-current assetsProperty, plant and equipment 7 265,632,122 259,004,939Intangible assets 8 639,906,514 644,393,706Goodwill 9 452,540,909 452,540,909Equity investments 10 19,346,702 9,935,988Financial assets 4 5,491,405 5,491,405 1,988,167Other receivables 6 4,690,281 4,906,999Total non-current assets 1,387,607,933 1,372,770,708
TOTAL ASSETS 1,943,562,884 1,909,174,516
LIABILITIES AND SHAREHOLDERS' EQUITY Note 31.01.2017 of which
related parties 31.01.2016 of which related parties
Current liabilities
Financial liabilities 11 6,559,196 7,064,876Trade payables 12 390,134,183 24,502,279 389,310,687 22,993,484Current tax liabilities 13 15,378,965 11,460,000 23,635,636 23,326,915Other payables 14 94,131,524 2,018,267 100,646,084 2,701,361Total current liabilities 506,203,868 520,657,283
Non-current liabilitiesFinancial liabilities 11 373,363,149 371,600,717Employee benefits 15 39,867,853 40,488,766Provisions for risks and charges 16 10,748,328 11,179,359Deferred tax liabilities 17 141,075,330 142,846,674Other payables 14 17,029,597 11,775,592Total non-current liabilities 582,084,257 577,891,108
TOTAL LIABILITIES 1,088,288,125 1,098,548,391
SHAREHOLDERS' EQUITYShare capital 18 227,000,000 227,000,000Other reserves 18 551,767,833 501,788,025Net result for the year 76,506,926 81,838,100TOTAL SHAREHOLDERS' EQUITY 855,274,759 810,626,125
TOTAL LIABILITIES AND SHAREHOLDERS' EQUITY 1,943,562,884 1,909,174,516

121 2016 ANNUAL REPORT
Income statement(euro units)
Note 31.01.2017 of which non-recurring
of which related parties 31.01.2016 of which
non-recurringof which
related parties
Revenues 19 1,357,882,693 9,510,459 1,314,088,503 7,530,919Other operating income and revenues 20 66,072,426 3,828,479 60,242,889 49,083 480,339Total revenues 1,423,955,119 0 1,374,331,392 49,083
Purchases of raw materials, consumables and goods 21 620,435,575 33,012,489 606,127,366 30,795,896
Staff costs 22 268,558,256 161,367 5,111,782 254,183,103 300,657 5,751,164
Depreciation, amortisation and write-downs of assets 23 58,454,604 57,204,682
Other operating expensesService costs 24 173,528,273 888,905 17,086,549 168,894,488 2,053,617 14,109,671Costs for the use of third-party assets 25 189,693,128 48,386 (403,686) 182,397,679 1,017,063 (953,202)Write-downs and provisions 26 1,200,000 1,800,000Other operating charges 27 23,231,628 2,696,380 (157,008) 22,569,415 3,559,095 21,204
Result before net financial expenses and taxes 88,853,655 (3,795,038) 81,154,659 (6,881,349)
Financial income 28 186,631 101,852 92,909Financial expenses (15,774,731) (26,826,067) (6,774,118)Exchange rate gains and losses 11,579,165 20,769,206Gains (losses) from equity investments 19,001,120 19,001,120 18,055,715 18,055,715Net result for the year before tax 103,845,840 (3,795,038) 93,246,422 (13,655,467)Taxes 29 (27,338,914) 1,043,635 (11,408,322) 23,511,964Net result for the year 76,506,926 (2,751,403) 81,838,100 9,856,497