ANNUAL REPORT - beerwahshs.eq.edu.au · School Overview Welcome to Beerwah State High School....
20
1 ANNUAL REPORT Beerwah State High School Inspiring minds. Creating opportunities. Shaping Queensland’s future. Every student succeeding. State Schools Strategy 2016-2020 Department of Education and Training 2016 Queensland State School Reporting
Transcript of ANNUAL REPORT - beerwahshs.eq.edu.au · School Overview Welcome to Beerwah State High School....
1
ANNUAL REPORT
Beerwah State High School
Inspiring minds. Creating opportunities. Shaping Queensland’s future. Every student succeeding. State Schools Strategy 2016-2020
Department of Education and Training
2016
Queensland State School
Reporting
2
Contact Information
Postal address: PO Box 198 Beerwah 4519
Phone: (07) 5436 5333
Fax: (07) 5436 5300
Email: [email protected]
Webpages: Additional reporting information pertaining to Queensland state schools is located on the My School website and the Queensland Government data website.
Contact Person: Mr Glen Robinson ( Principal)
School Overview
Welcome to Beerwah State High School.
Beerwah State High School is situated in the Glasshouse Mountains township of Beerwah and
services the communities from Mooloolah to Elimbah. We are a coeducational school catering
for grades 7 to 12. The school was established in 1992 and even though we are a relatively
young school, we have developed a culture and traditions that one would expect to find in a
much older school. The school values of RESPECT, RESPONSIBILITY and SAFETY resonate
throughout the school with a very visible presence. The school motto SUCCESS FOR ALL links
closely with the State Schooling strategic goal of “Every Child Succeeding”.
This Annual Report will outline many aspects of the school including:
- Attainment of identified goals
- Curriculum offerings - Student outcomes - Staff qualifications
- Future perspectives
Principal’s Foreword
Introduction
School Progress towards its goals in 2016
Beerwah State High School has made excellent progress towards addressing many of the key goals that were identified in the 2016 Annual Implementation Plan. We have continued to develop our Junior School Curriculum for the expansion of the National Curriculum. 2016 saw a sustained focus on Reading as the main Literacy Strategy with all teachers in-serviced in a number of strategies including the Tactical Teaching of Reading and a strategy from the QCAA called the “Eagle and Wolf” strategy. Our year 7 and 9 students also underwent the NAPLAN testing with a number of preparation
programs being run to assist the students with the test conditions and structure.
We have continued to progress our Positive Behaviour for Learning agenda, with more students successfully gaining a gold card and explicit behaviour lessons being rolled out across all year levels outlining expected behaviours.
In our Senior School we have continued to offer a number of diverse pathways for our
students, including School–Based Traineeships and Apprenticeships as well as options to
attend TAFE. Head-start Programs offered by the various Universities have been actively
taken up by a number of students, with many of them receiving excellent results.
Our OP results for 2016 were high with 80 % of eligible students receiving an OP 1-15,
increasing from 78% (2015) and 76 % (2014).
100% Percent of Year 12 students were completing or completed a SAT or were awarded
one or more of the following: QCE, IBD, VET qualification.
Our Independent Learning Centre will continue to cater for the needs of our senior students
who are participating in traineeships, apprenticeship or TAFE and provides them with a place
for independent learning.
We have seen an increase in the number of students accessing courses through the Brisbane
School of Distance Education and theses students are also supported within the ILC.
We have continued to progress our Positive Behaviour for Learning agenda with more
students successfully gaining a gold cards. In addition to this, explicit behaviour lessons are
rolled out across all year levels outlining expected behaviours.
Future Outlook
2017 will see a continuation of the key target areas from 2016. These will include-
1. LITERACY – Ensuring that the READING strategies delivered in 2016 are provided to
all new staff and are revisited throughout the year. A whole of school approach to
writing will be introduced in 2017. There will be a focus on paragraph writing
2. NUMERACY – There will be two key strategies to develop student Numeracy skills.
These will include
- the implementation of a ‘number facts’ program into year 7 and 8.
- embedding “Inquiry Warm-Ups” as part of Jnr Maths program to improve
problem solving strategies
3. STUDENT ENGAGEMENT with a focus on student attendance and behaviour. There
will be a continuation of the Positive Behaviour for Learning framework and the
introduction of the REBOOT program.
In 2017 strategic teams will be established to plan for future improvement in a variety of
areas including:
- E- Learning for 21st Century students
- Effective Teaching Practice in every classroom including a project around New
Pedagogies for Deep Learning
- STEM – Science Technology, Engineering and Mathematics
- Senior Assessment and the move to external assessment and the ATAR system.
Our School at a Glance
School Profile
Coeducational or single sex: Coeducational
Independent Public School: No
Year levels offered in 2016: Year 7 - Year 12
Student enrolments for this
school:
Total Girls Boys Indigenous
Enrolment
Continuity
(Feb – Nov)
2014 866 430 436 57 91%
2015* 992 473 519 79 91%
2016 972 478 494 83 90%
Student counts are based on the Census (August) enrolment collection.
*From 2015, data for all state high schools include Year 7 students. Prior to 2015, only state high schools offering Year 7 had these students included in their counts.
In 2016, there were no students enrolled in a pre-Prep** program.
** pre-Prep is a kindergarten program for Aboriginal and Torres Strait Islander children,
living across 35 Aboriginal and Torres Strait Islander communities, in the year before school
(http://deta.qld.gov.au/earlychildhood/families/pre-prep-indigenous.html).
Characteristics of the Student Body
Overview
The majority of students’ families are of mid socio-economic status. The local community is
experiencing growth as the local shopping precinct has expanded recently and there are a
number of property developments in the area. The student body is comprised of 47.7%
female students and 52.3 % male students. There were 8.35 % of students who identify as
Indigenous and there were 7.9% of students with varying levels of disability, who were
supported by our Education Services Department, either in mainstream classes or in
specialist programs.
Average Class Sizes The following table shows the average class size information for each phase of schooling.
AVERAGE CLASS SIZES
Phase 2014 2015* 2016
Prep – Year 3
Year 4 – Year 7
Year 8 – Year 10 24 23 22
Year 11 – Year 12 17 18 18
*From 2015, data for all state high schools include Year 7 students. Prior to 2015, only state high
schools offering Year 7 had these students included in their counts.
Curriculum Delivery
Our Approach to Curriculum Delivery
The curriculum is structured around a junior school (Year 7, 8 and 9) and a senior school
(Year 10, 11 and 12). The Junior Secondary School Curriculum is based around the eight
national Key Learning Areas and is reflective of the National Curriculum (ACARA). All faculties
have had professional development in planning and reporting in the new framework.
A specialist Athletics Extension Program operates from Years 8 to 10. This program provides
students the opportunity to reach their potential in a challenging learning environment in an
area that meets their individual interest.
Special Needs teachers assist students with specific learning difficulties (for example,
difficulties in reading, spelling or an inability to cope with basic Mathematics) by
collaboratively designing and implementing educational programs more suited to a student’s
individual needs. Students identified with special needs may receive in class support,
individual support programs, withdrawal sessions or individual student help with class work
and assignments. Several intensive support programs cater for students in Year 7 and 8 who
have weaknesses in either literacy or numeracy.
Beerwah State High School offers a large selection of subjects in the senior school. The
curriculum allows students to pursue multiple pathways including a rigorous academic program,
a contemporary arts program or a skills based vocational program. Flexible learning options
such as the Sunshine Coast Trade Training Centre (SCTTTC), TAFE courses in Health related
fields, School based Apprenticeships and Traineeships (SATs) and Brisbane School of Distance
Education (BSDE) remain popular alternative senior course options. The school continued to
investigate and expand its vocational certificate courses in 2016.
Co-curricular Activities Many opportunities exist for student participation in a range of extra-curricular activities.
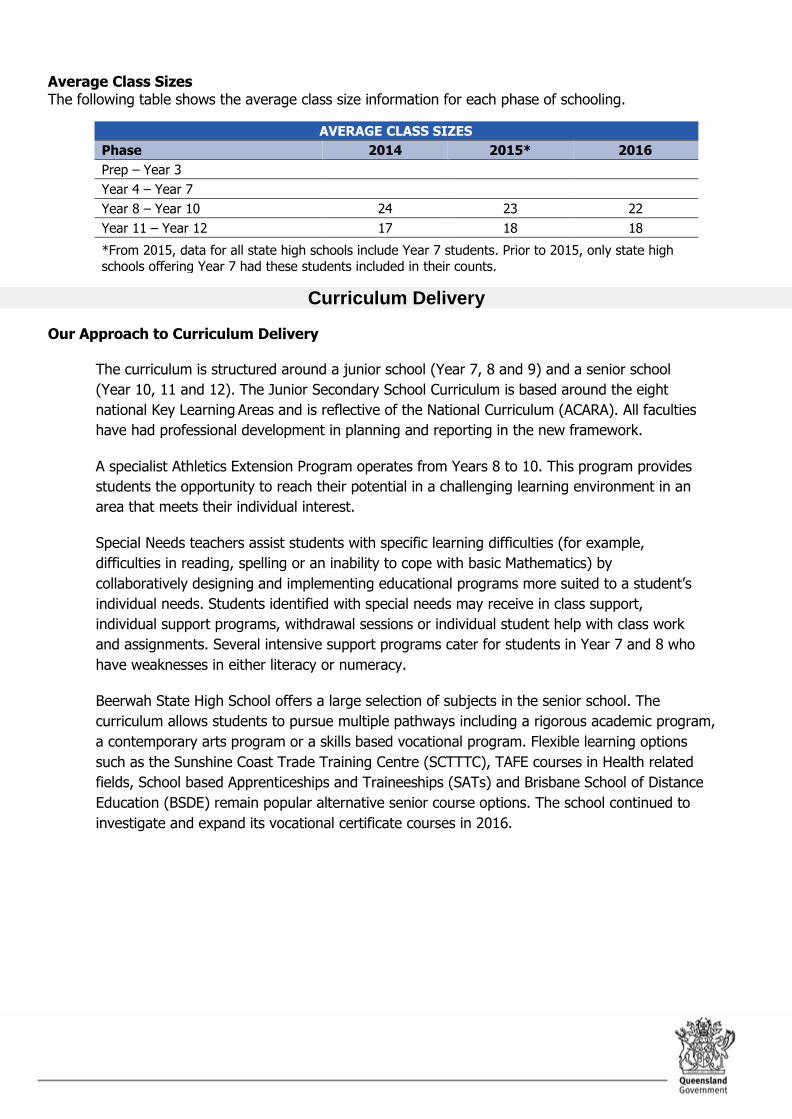
Beerwah High has a strong tradition of involvement and success in sports. A variety of
sporting activities are offered to male and female students - an important aspect of which is
that most are team sports. There are six inter-house events during the year:
Swimming
Cross Country
Athletics Carnivals
Triathlon
Run the Corridors
Cheer Cup
Other activities include:
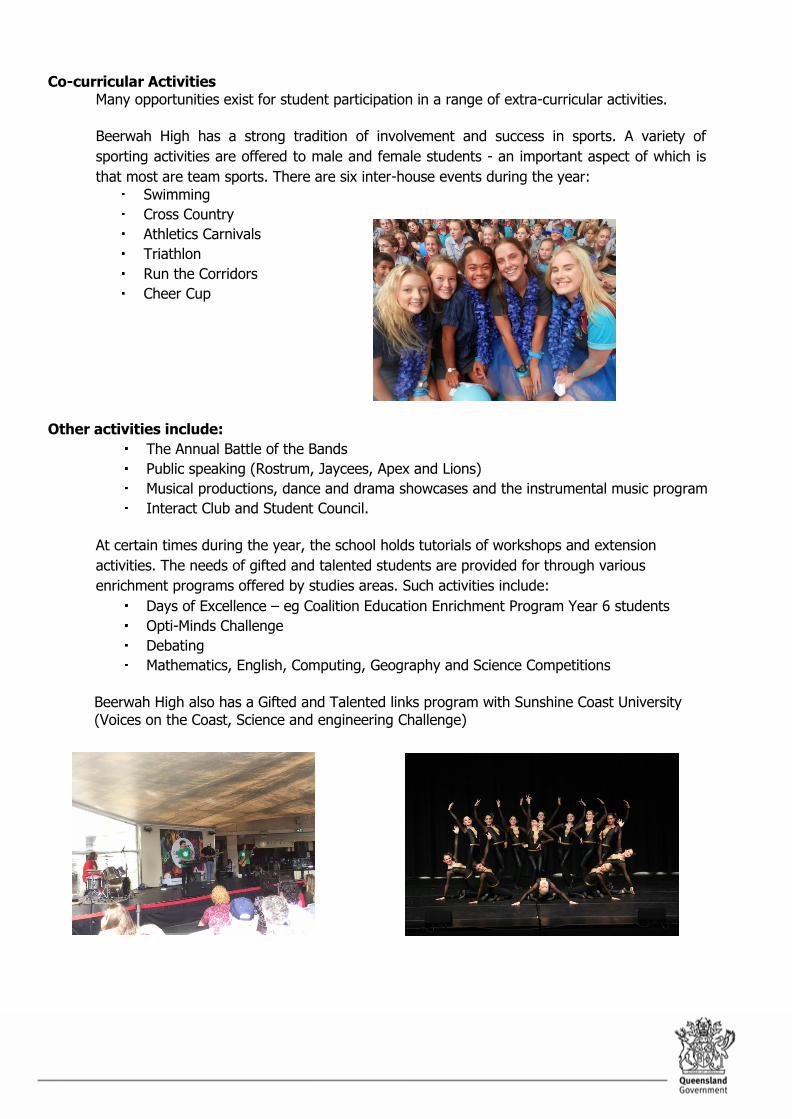
The Annual Battle of the Bands
Public speaking (Rostrum, Jaycees, Apex and Lions)
Musical productions, dance and drama showcases and the instrumental music program
Interact Club and Student Council.
At certain times during the year, the school holds tutorials of workshops and extension
activities. The needs of gifted and talented students are provided for through various
enrichment programs offered by studies areas. Such activities include:
Days of Excellence – eg Coalition Education Enrichment Program Year 6 students
Opti-Minds Challenge
Debating
Mathematics, English, Computing, Geography and Science Competitions
Beerwah High also has a Gifted and Talented links program with Sunshine Coast University (Voices on the Coast, Science and engineering Challenge)
How Information and Communication Technologies are used to Assist Learning Beerwah SHS is a C4T school and therefore each staff member has access to a personal laptop for their use.
This has allowed for the development of ICT skills within the staff and further implementation of ICTs into
the classroom. We have extended our availability of ICTs and have equipped the school with 60 fixed data
projectors, 530 student laptops and 315 desktop computers.
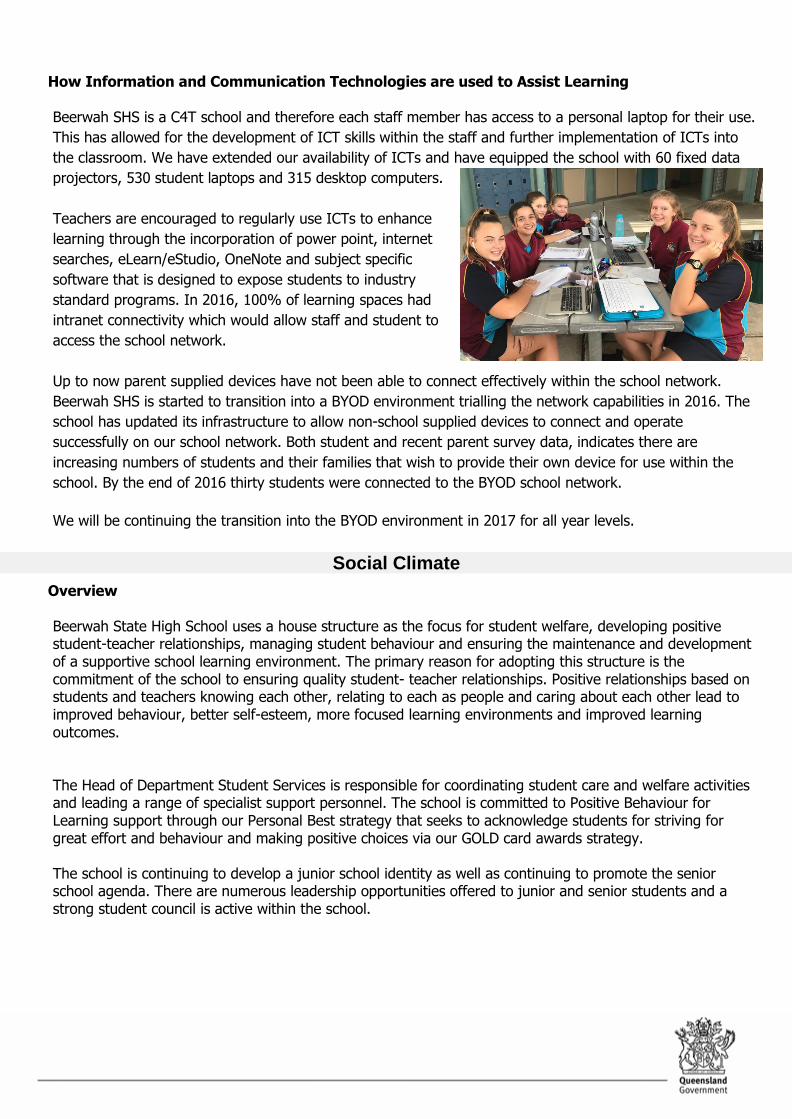
Teachers are encouraged to regularly use ICTs to enhance
learning through the incorporation of power point, internet
searches, eLearn/eStudio, OneNote and subject specific
software that is designed to expose students to industry
standard programs. In 2016, 100% of learning spaces had
intranet connectivity which would allow staff and student to
access the school network.
Up to now parent supplied devices have not been able to connect effectively within the school network.
Beerwah SHS is started to transition into a BYOD environment trialling the network capabilities in 2016. The
school has updated its infrastructure to allow non-school supplied devices to connect and operate
successfully on our school network. Both student and recent parent survey data, indicates there are
increasing numbers of students and their families that wish to provide their own device for use within the
school. By the end of 2016 thirty students were connected to the BYOD school network.
We will be continuing the transition into the BYOD environment in 2017 for all year levels.
Social Climate
Overview
Beerwah State High School uses a house structure as the focus for student welfare, developing positive student-teacher relationships, managing student behaviour and ensuring the maintenance and development of a supportive school learning environment. The primary reason for adopting this structure is the commitment of the school to ensuring quality student- teacher relationships. Positive relationships based on students and teachers knowing each other, relating to each as people and caring about each other lead to improved behaviour, better self-esteem, more focused learning environments and improved learning outcomes. The Head of Department Student Services is responsible for coordinating student care and welfare activities and leading a range of specialist support personnel. The school is committed to Positive Behaviour for Learning support through our Personal Best strategy that seeks to acknowledge students for striving for great effort and behaviour and making positive choices via our GOLD card awards strategy. The school is continuing to develop a junior school identity as well as continuing to promote the senior school agenda. There are numerous leadership opportunities offered to junior and senior students and a strong student council is active within the school.
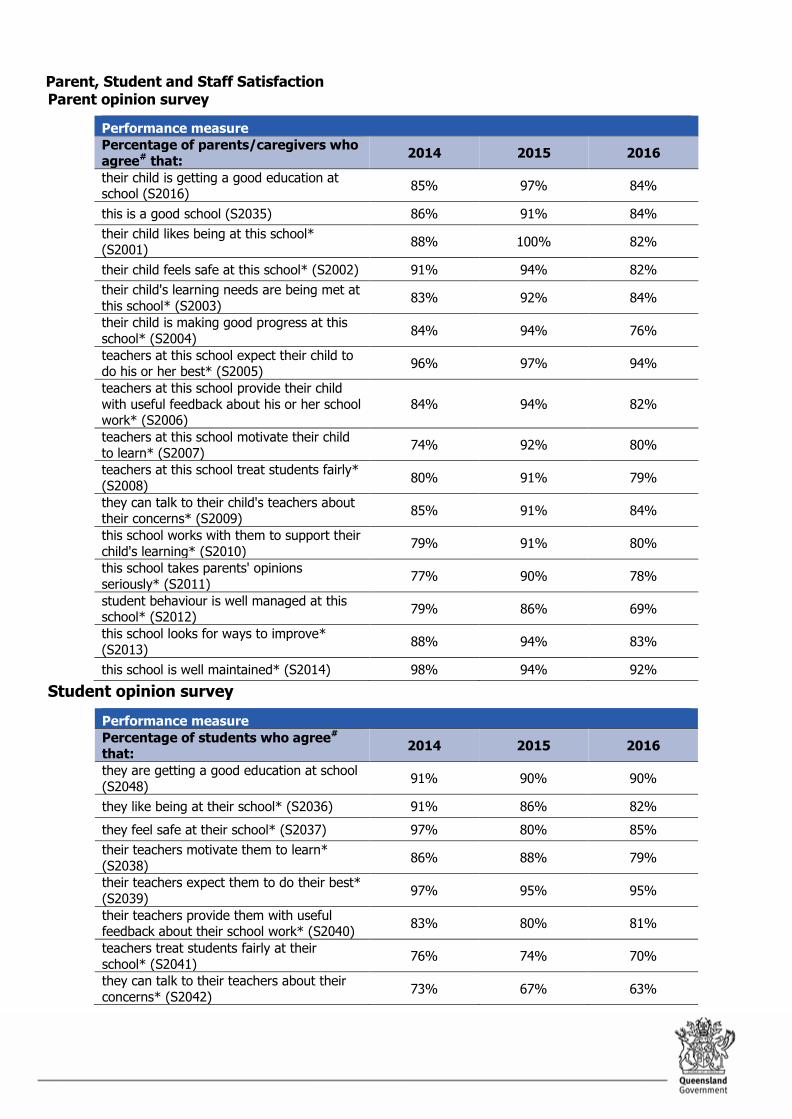
Parent, Student and Staff Satisfaction Parent opinion survey
Performance measure
Percentage of parents/caregivers who
agree# that: 2014 2015 2016
their child is getting a good education at school (S2016)
85% 97% 84%
this is a good school (S2035) 86% 91% 84%
their child likes being at this school* (S2001)
88% 100% 82%
their child feels safe at this school* (S2002) 91% 94% 82%
their child's learning needs are being met at
this school* (S2003) 83% 92% 84%
their child is making good progress at this
school* (S2004) 84% 94% 76%
teachers at this school expect their child to do his or her best* (S2005)
96% 97% 94%
teachers at this school provide their child
with useful feedback about his or her school work* (S2006)
84% 94% 82%
teachers at this school motivate their child
to learn* (S2007) 74% 92% 80%
teachers at this school treat students fairly*
(S2008) 80% 91% 79%
they can talk to their child's teachers about their concerns* (S2009)
85% 91% 84%
this school works with them to support their
child's learning* (S2010) 79% 91% 80%
this school takes parents' opinions
seriously* (S2011) 77% 90% 78%
student behaviour is well managed at this school* (S2012)
79% 86% 69%
this school looks for ways to improve*
(S2013) 88% 94% 83%
this school is well maintained* (S2014) 98% 94% 92%
Student opinion survey
Performance measure
Percentage of students who agree# that:
2014 2015 2016
they are getting a good education at school
(S2048) 91% 90% 90%
they like being at their school* (S2036) 91% 86% 82%
they feel safe at their school* (S2037) 97% 80% 85%
their teachers motivate them to learn*
(S2038) 86% 88% 79%
their teachers expect them to do their best*
(S2039) 97% 95% 95%
their teachers provide them with useful feedback about their school work* (S2040)
83% 80% 81%
teachers treat students fairly at their
school* (S2041) 76% 74% 70%
they can talk to their teachers about their
concerns* (S2042) 73% 67% 63%
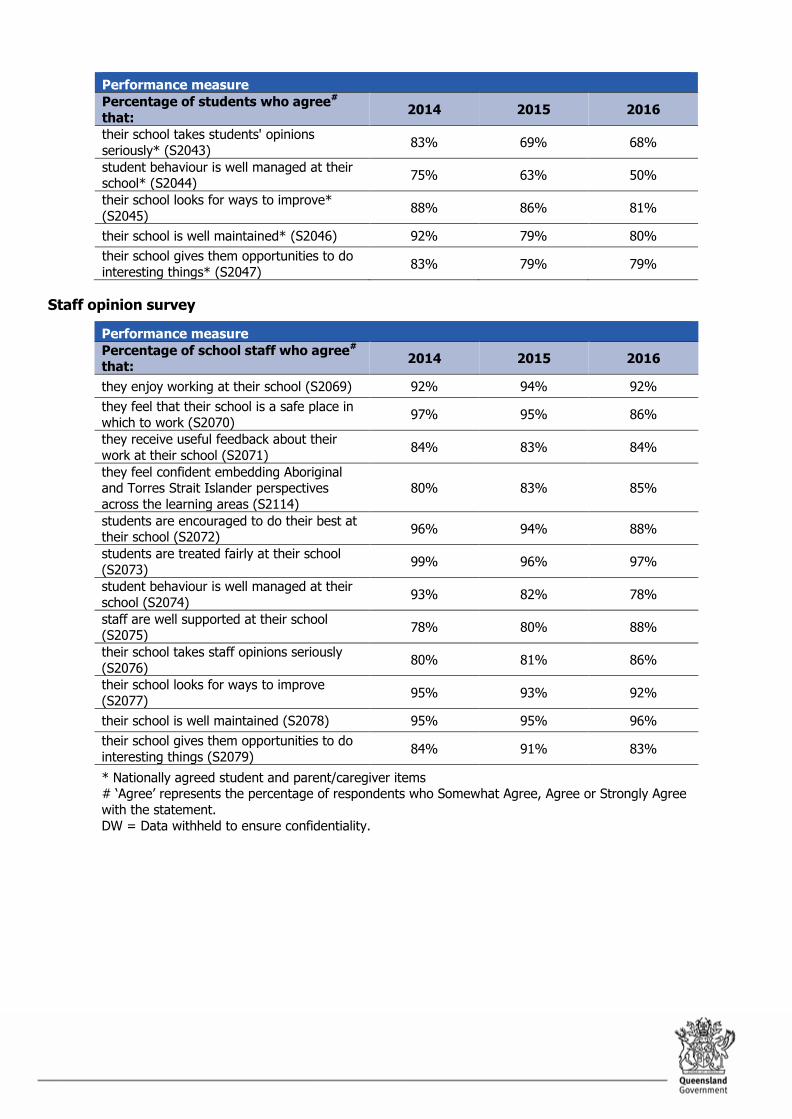
Performance measure
Percentage of students who agree#
that: 2014 2015 2016
their school takes students' opinions
seriously* (S2043) 83% 69% 68%
student behaviour is well managed at their school* (S2044)
75% 63% 50%
their school looks for ways to improve*
(S2045) 88% 86% 81%
their school is well maintained* (S2046) 92% 79% 80%
their school gives them opportunities to do
interesting things* (S2047) 83% 79% 79%
Staff opinion survey
Performance measure
Percentage of school staff who agree# that:
2014 2015 2016
they enjoy working at their school (S2069) 92% 94% 92%
they feel that their school is a safe place in
which to work (S2070) 97% 95% 86%
they receive useful feedback about their
work at their school (S2071) 84% 83% 84%
they feel confident embedding Aboriginal and Torres Strait Islander perspectives
across the learning areas (S2114)
80% 83% 85%
students are encouraged to do their best at their school (S2072)
96% 94% 88%
students are treated fairly at their school
(S2073) 99% 96% 97%
student behaviour is well managed at their
school (S2074) 93% 82% 78%
staff are well supported at their school (S2075)
78% 80% 88%
their school takes staff opinions seriously
(S2076) 80% 81% 86%
their school looks for ways to improve
(S2077) 95% 93% 92%
their school is well maintained (S2078) 95% 95% 96%
their school gives them opportunities to do
interesting things (S2079) 84% 91% 83%
* Nationally agreed student and parent/caregiver items # ‘Agree’ represents the percentage of respondents who Somewhat Agree, Agree or Strongly Agree
with the statement.
DW = Data withheld to ensure confidentiality.
Parent and community engagement
Our community actively participates in the life of the school through the Parents’ and Citizens’ Association, Student Council, committees, canteen helpers, Library
volunteers and voluntary tutoring in reading. A monthly online newsletter is available for each family and community
consultation is welcomed via online surveys and also consultation meetings when changes to school organisation are being considered.
2016 saw the introduction of a school Facebook page to continue to promote the success of students and staff.
Student reports are provided at the end of each term/semester and parent teacher interviews take place at the early in terms 2 and 3.
A welcome to secondary school and meet the teachers evening is held early in term 1 for new parents and students entering year 7.
A subject selection expo is held end of term 2 to ensure that parents and students are adequately informed in relation to making subject choices for learning pathways in choosing electives for years 9 and 10 and for students moving into year 11 and the senior phase.
Year 10 parents participate in interviews with key school personnel as part of the development of the Senior Education and Training Plan and also for subject selection.
Staff are encouraged to communicate regularly with parent/caregivers throughout the year to discuss their child’s progress and learning.
Parents of Year 12 students play an integral part in their graduation celebrations during the
final week of schooling. An Academic, Vocational, Sport and Cultural Awards Evening is held in term four to
celebrate student effort and achievement. Our school actively participates in the community by staging musical and other artistic
performances, through work experience programs and school based traineeships, supporting established community events, often with one of our three bands, by providing volunteers for local charities and service club projects and through providing resources for local events.
The school has also encouraged selected parents to be involved in a Positive Parenting Program in an effort to engage students who might be at risk of disengaging from the school environment.
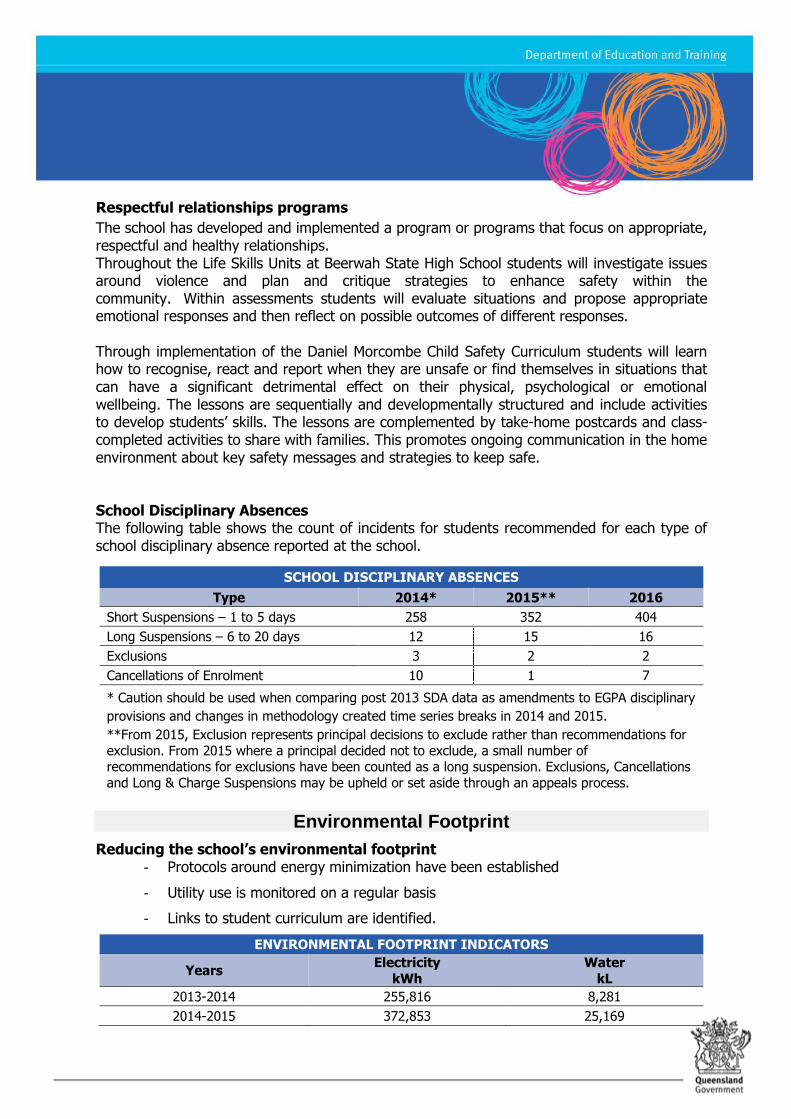
Respectful relationships programs
The school has developed and implemented a program or programs that focus on appropriate, respectful and healthy relationships. Throughout the Life Skills Units at Beerwah State High School students will investigate issues around violence and plan and critique strategies to enhance safety within the community. Within assessments students will evaluate situations and propose appropriate emotional responses and then reflect on possible outcomes of different responses. Through implementation of the Daniel Morcombe Child Safety Curriculum students will learn how to recognise, react and report when they are unsafe or find themselves in situations that can have a significant detrimental effect on their physical, psychological or emotional wellbeing. The lessons are sequentially and developmentally structured and include activities to develop students’ skills. The lessons are complemented by take-home postcards and class-completed activities to share with families. This promotes ongoing communication in the home environment about key safety messages and strategies to keep safe. School Disciplinary Absences The following table shows the count of incidents for students recommended for each type of school disciplinary absence reported at the school.
SCHOOL DISCIPLINARY ABSENCES
Type 2014* 2015** 2016
Short Suspensions – 1 to 5 days 258 352 404
Long Suspensions – 6 to 20 days 12 15 16
Exclusions 3 2 2
Cancellations of Enrolment 10 1 7
* Caution should be used when comparing post 2013 SDA data as amendments to EGPA disciplinary
provisions and changes in methodology created time series breaks in 2014 and 2015.
**From 2015, Exclusion represents principal decisions to exclude rather than recommendations for
exclusion. From 2015 where a principal decided not to exclude, a small number of recommendations for exclusions have been counted as a long suspension. Exclusions, Cancellations
and Long & Charge Suspensions may be upheld or set aside through an appeals process.
Environmental Footprint
Reducing the school’s environmental footprint - Protocols around energy minimization have been established
- Utility use is monitored on a regular basis
- Links to student curriculum are identified.
ENVIRONMENTAL FOOTPRINT INDICATORS
Years Electricity
kWh
Water
kL
2013-2014 255,816 8,281
2014-2015 372,853 25,169
ENVIRONMENTAL FOOTPRINT INDICATORS
Years Electricity
kWh
Water
kL
2015-2016 383,116 2,997
The consumption data is compiled from sources including ERM, Ergon reports and utilities data
entered into One School by each school. The data provides an indication of the consumption trend
in each of the utility categories which impact on the school’s environmental footprint.
School Funding
School income broken down by funding source School income, reported by financial year accounting cycle using standardized national methodologies and broken down by funding source is available via the My School website at http://www.myschool.edu.au/.
To access our income details, click on the My School link above. You will then be taken to the My School website with the following ‘Find a school’ text box.
Where it states ‘School name’, type in the name of the school you wish to view, select the school from the drop-down list and select <GO>. Read and follow the instructions on the next screen; you will be asked to confirm that you are not a robot then by clicking continue, you acknowledge that you have read, accepted and agree to the Terms of Use and Privacy Policy before being given access to the school’s profile webpage.
School financial information is available by selecting ‘School finances’ in the menu box in the top left corner of the school’s profile webpage. If you are unable to access the internet, please contact the school for a paper copy of income by funding source.
Our Staff Profile
Workforce Composition
Staff composition, including Indigenous staff
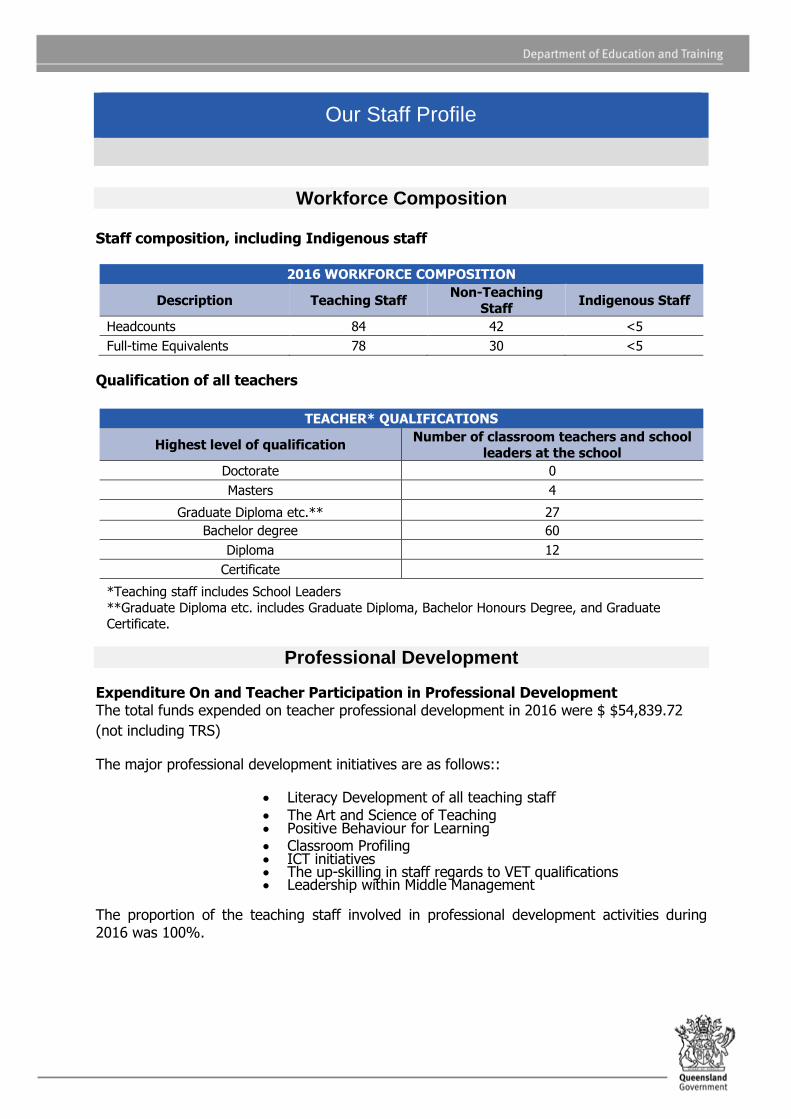
2016 WORKFORCE COMPOSITION
Description Teaching Staff Non-Teaching
Staff Indigenous Staff
Headcounts 84 42 <5
Full-time Equivalents 78 30 <5
Qualification of all teachers
TEACHER* QUALIFICATIONS
Highest level of qualification Number of classroom teachers and school
leaders at the school
Doctorate 0
Masters 4
Graduate Diploma etc.** 27
Bachelor degree 60
Diploma 12
Certificate
*Teaching staff includes School Leaders
**Graduate Diploma etc. includes Graduate Diploma, Bachelor Honours Degree, and Graduate
Certificate.
Professional Development
Expenditure On and Teacher Participation in Professional Development The total funds expended on teacher professional development in 2016 were $ $54,839.72
(not including TRS)
The major professional development initiatives are as follows::
Literacy Development of all teaching staff The Art and Science of Teaching Positive Behaviour for Learning Classroom Profiling ICT initiatives The up-skilling in staff regards to VET qualifications Leadership within Middle Management
The proportion of the teaching staff involved in professional development activities during 2016 was 100%.
Staff Attendance and Retention
Staff attendance
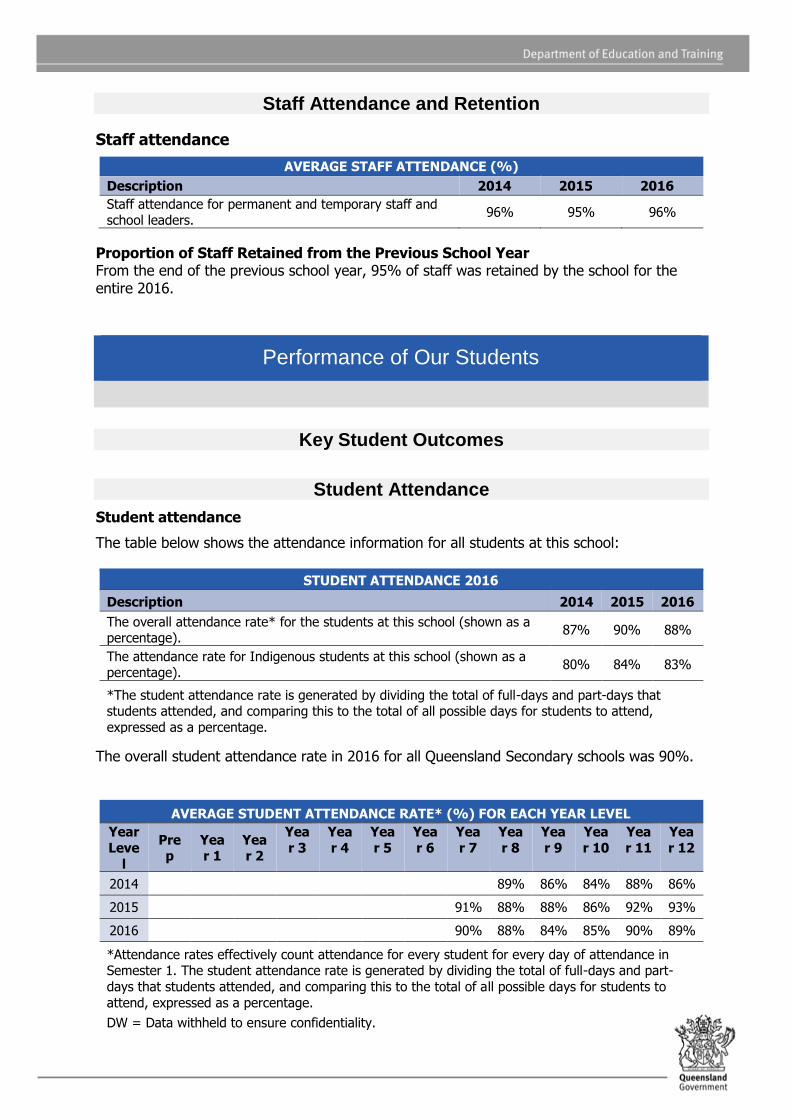
AVERAGE STAFF ATTENDANCE (%)
Description 2014 2015 2016
Staff attendance for permanent and temporary staff and school leaders.
96% 95% 96%
Proportion of Staff Retained from the Previous School Year From the end of the previous school year, 95% of staff was retained by the school for the entire 2016.
Performance of Our Students
Key Student Outcomes
Student Attendance
Student attendance
The table below shows the attendance information for all students at this school:
STUDENT ATTENDANCE 2016
Description 2014 2015 2016
The overall attendance rate* for the students at this school (shown as a percentage).
87% 90% 88%
The attendance rate for Indigenous students at this school (shown as a percentage).
80% 84% 83%
*The student attendance rate is generated by dividing the total of full-days and part-days that students attended, and comparing this to the total of all possible days for students to attend,
expressed as a percentage.
The overall student attendance rate in 2016 for all Queensland Secondary schools was 90%.
AVERAGE STUDENT ATTENDANCE RATE* (%) FOR EACH YEAR LEVEL
Year
Leve
l
Prep
Year 1
Year 2
Yea
r 3
Yea
r 4
Yea
r 5
Yea
r 6
Yea
r 7
Yea
r 8
Yea
r 9
Yea
r 10
Yea
r 11
Yea
r 12
2014 89% 86% 84% 88% 86%
2015 91% 88% 88% 86% 92% 93%
2016 90% 88% 84% 85% 90% 89%
*Attendance rates effectively count attendance for every student for every day of attendance in Semester 1. The student attendance rate is generated by dividing the total of full-days and part-
days that students attended, and comparing this to the total of all possible days for students to
attend, expressed as a percentage.
DW = Data withheld to ensure confidentiality.
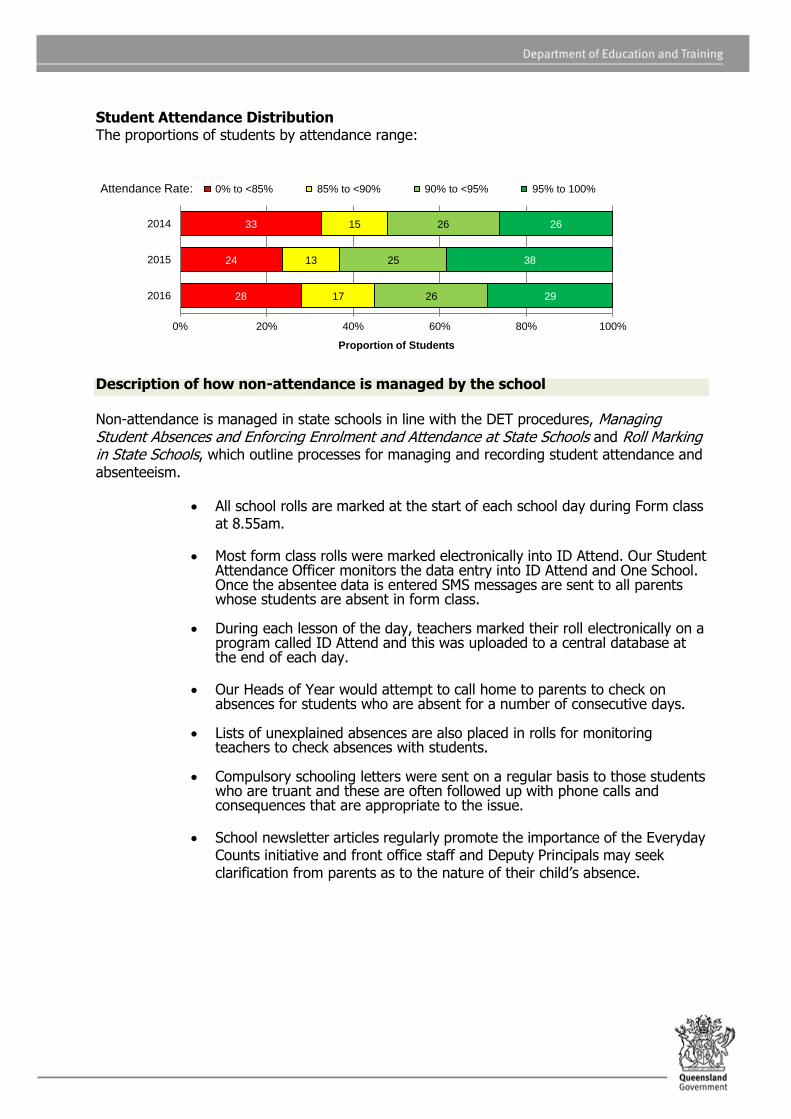
Student Attendance Distribution The proportions of students by attendance range:
Description of how non-attendance is managed by the school Non-attendance is managed in state schools in line with the DET procedures, Managing Student Absences and Enforcing Enrolment and Attendance at State Schools and Roll Marking in State Schools, which outline processes for managing and recording student attendance and absenteeism.
All school rolls are marked at the start of each school day during Form class at 8.55am.
Most form class rolls were marked electronically into ID Attend. Our Student
Attendance Officer monitors the data entry into ID Attend and One School. Once the absentee data is entered SMS messages are sent to all parents whose students are absent in form class.
During each lesson of the day, teachers marked their roll electronically on a
program called ID Attend and this was uploaded to a central database at the end of each day.
Our Heads of Year would attempt to call home to parents to check on
absences for students who are absent for a number of consecutive days.
Lists of unexplained absences are also placed in rolls for monitoring teachers to check absences with students.
Compulsory schooling letters were sent on a regular basis to those students
who are truant and these are often followed up with phone calls and consequences that are appropriate to the issue.
School newsletter articles regularly promote the importance of the Everyday Counts initiative and front office staff and Deputy Principals may seek clarification from parents as to the nature of their child’s absence.
28
24
33
17
13
15
26
25
26
29
38
26
0% 20% 40% 60% 80% 100%
2016
2015
2014
Proportion of Students
Attendance Rate: 0% to <85% 85% to <90% 90% to <95% 95% to 100%
NAPLAN
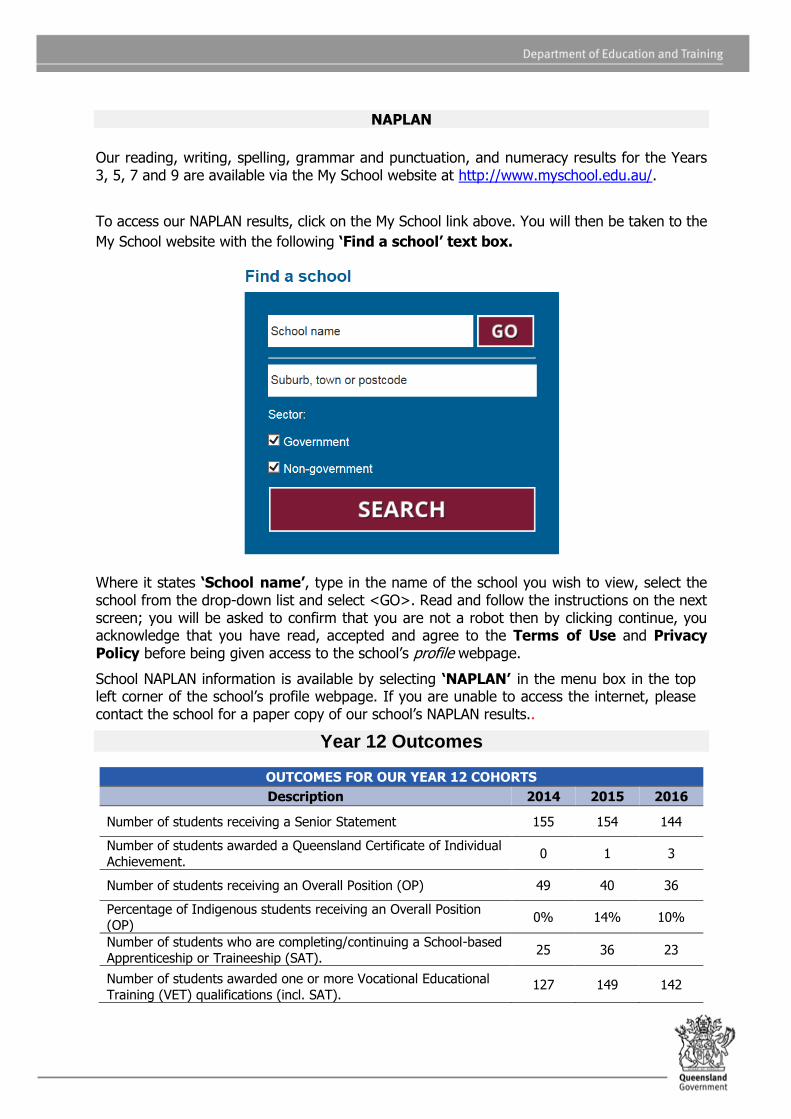
Our reading, writing, spelling, grammar and punctuation, and numeracy results for the Years 3, 5, 7 and 9 are available via the My School website at http://www.myschool.edu.au/.
To access our NAPLAN results, click on the My School link above. You will then be taken to the
My School website with the following ‘Find a school’ text box.
Where it states ‘School name’, type in the name of the school you wish to view, select the school from the drop-down list and select <GO>. Read and follow the instructions on the next screen; you will be asked to confirm that you are not a robot then by clicking continue, you acknowledge that you have read, accepted and agree to the Terms of Use and Privacy Policy before being given access to the school’s profile webpage.
School NAPLAN information is available by selecting ‘NAPLAN’ in the menu box in the top left corner of the school’s profile webpage. If you are unable to access the internet, please contact the school for a paper copy of our school’s NAPLAN results..
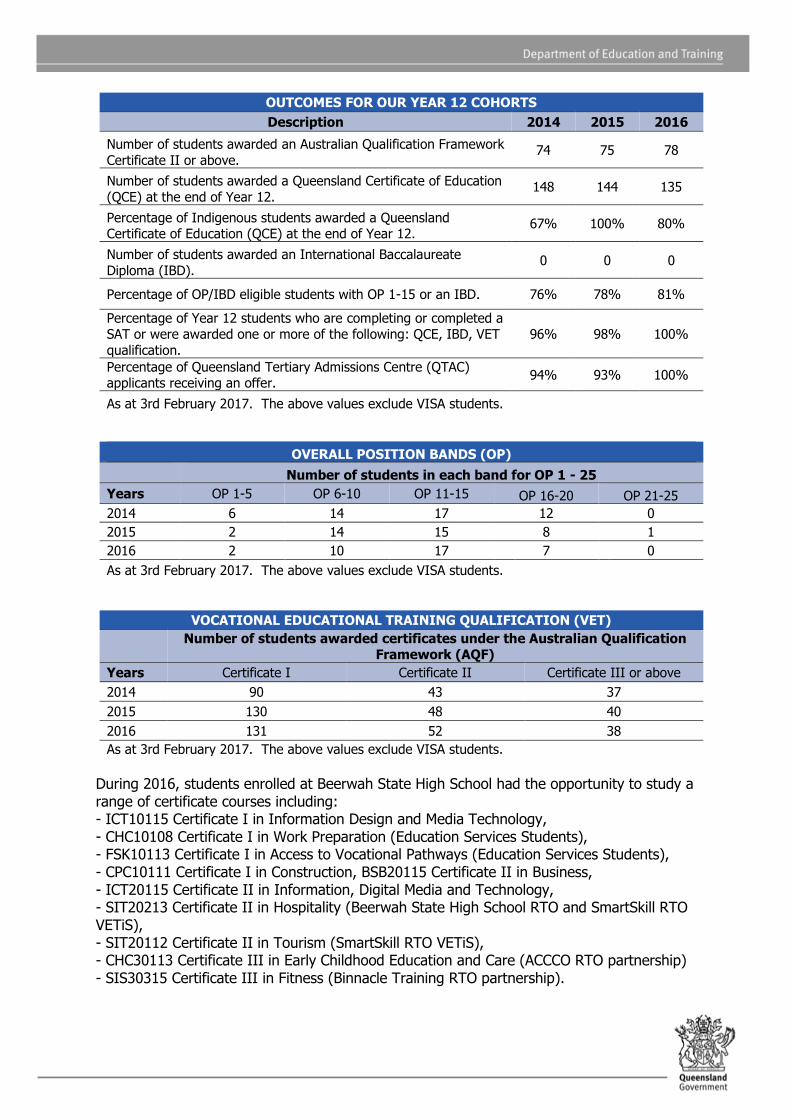
Year 12 Outcomes
OUTCOMES FOR OUR YEAR 12 COHORTS
Description 2014 2015 2016
Number of students receiving a Senior Statement 155 154 144
Number of students awarded a Queensland Certificate of Individual
Achievement. 0 1 3
Number of students receiving an Overall Position (OP) 49 40 36
Percentage of Indigenous students receiving an Overall Position (OP)
0% 14% 10%
Number of students who are completing/continuing a School-based
Apprenticeship or Traineeship (SAT). 25 36 23
Number of students awarded one or more Vocational Educational
Training (VET) qualifications (incl. SAT). 127 149 142
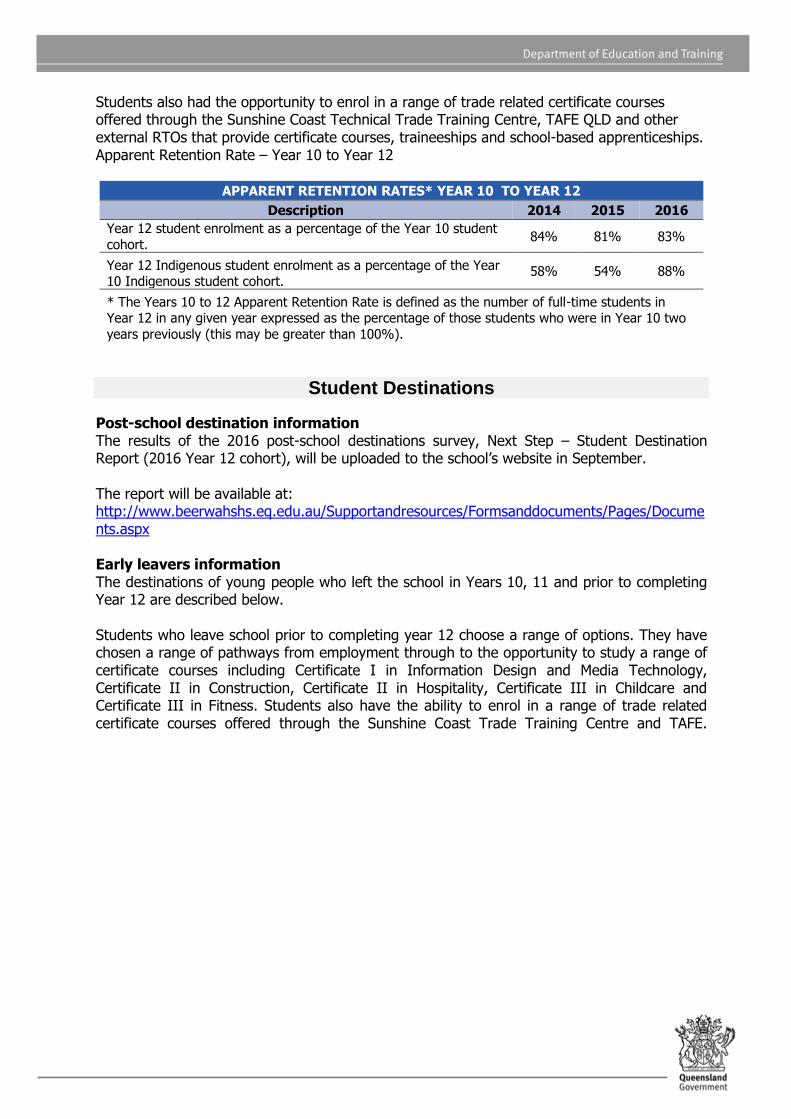
OUTCOMES FOR OUR YEAR 12 COHORTS
Description 2014 2015 2016
Number of students awarded an Australian Qualification Framework
Certificate II or above. 74 75 78
Number of students awarded a Queensland Certificate of Education
(QCE) at the end of Year 12. 148 144 135
Percentage of Indigenous students awarded a Queensland Certificate of Education (QCE) at the end of Year 12.
67% 100% 80%
Number of students awarded an International Baccalaureate
Diploma (IBD). 0 0 0
Percentage of OP/IBD eligible students with OP 1-15 or an IBD. 76% 78% 81%
Percentage of Year 12 students who are completing or completed a SAT or were awarded one or more of the following: QCE, IBD, VET
qualification.
96% 98% 100%
Percentage of Queensland Tertiary Admissions Centre (QTAC) applicants receiving an offer.
94% 93% 100%
As at 3rd February 2017. The above values exclude VISA students.
OVERALL POSITION BANDS (OP)
Number of students in each band for OP 1 - 25
Years OP 1-5 OP 6-10 OP 11-15 OP 16-20 OP 21-25
2014 6 14 17 12 0
2015 2 14 15 8 1
2016 2 10 17 7 0
As at 3rd February 2017. The above values exclude VISA students.
VOCATIONAL EDUCATIONAL TRAINING QUALIFICATION (VET)
Number of students awarded certificates under the Australian Qualification
Framework (AQF)
Years Certificate I Certificate II Certificate III or above
2014 90 43 37
2015 130 48 40
2016 131 52 38
As at 3rd February 2017. The above values exclude VISA students.
During 2016, students enrolled at Beerwah State High School had the opportunity to study a range of certificate courses including: - ICT10115 Certificate I in Information Design and Media Technology, - CHC10108 Certificate I in Work Preparation (Education Services Students), - FSK10113 Certificate I in Access to Vocational Pathways (Education Services Students), - CPC10111 Certificate I in Construction, BSB20115 Certificate II in Business, - ICT20115 Certificate II in Information, Digital Media and Technology, - SIT20213 Certificate II in Hospitality (Beerwah State High School RTO and SmartSkill RTO VETiS), - SIT20112 Certificate II in Tourism (SmartSkill RTO VETiS), - CHC30113 Certificate III in Early Childhood Education and Care (ACCCO RTO partnership) - SIS30315 Certificate III in Fitness (Binnacle Training RTO partnership).
Students also had the opportunity to enrol in a range of trade related certificate courses offered through the Sunshine Coast Technical Trade Training Centre, TAFE QLD and other external RTOs that provide certificate courses, traineeships and school-based apprenticeships. Apparent Retention Rate – Year 10 to Year 12
APPARENT RETENTION RATES* YEAR 10 TO YEAR 12
Description 2014 2015 2016
Year 12 student enrolment as a percentage of the Year 10 student
cohort. 84% 81% 83%
Year 12 Indigenous student enrolment as a percentage of the Year 10 Indigenous student cohort.
58% 54% 88%
* The Years 10 to 12 Apparent Retention Rate is defined as the number of full-time students in Year 12 in any given year expressed as the percentage of those students who were in Year 10 two
years previously (this may be greater than 100%).
Student Destinations
Post-school destination information The results of the 2016 post-school destinations survey, Next Step – Student Destination Report (2016 Year 12 cohort), will be uploaded to the school’s website in September. The report will be available at: http://www.beerwahshs.eq.edu.au/Supportandresources/Formsanddocuments/Pages/Documents.aspx Early leavers information The destinations of young people who left the school in Years 10, 11 and prior to completing Year 12 are described below.
Students who leave school prior to completing year 12 choose a range of options. They have chosen a range of pathways from employment through to the opportunity to study a range of certificate courses including Certificate I in Information Design and Media Technology, Certificate II in Construction, Certificate II in Hospitality, Certificate III in Childcare and Certificate III in Fitness. Students also have the ability to enrol in a range of trade related certificate courses offered through the Sunshine Coast Trade Training Centre and TAFE.
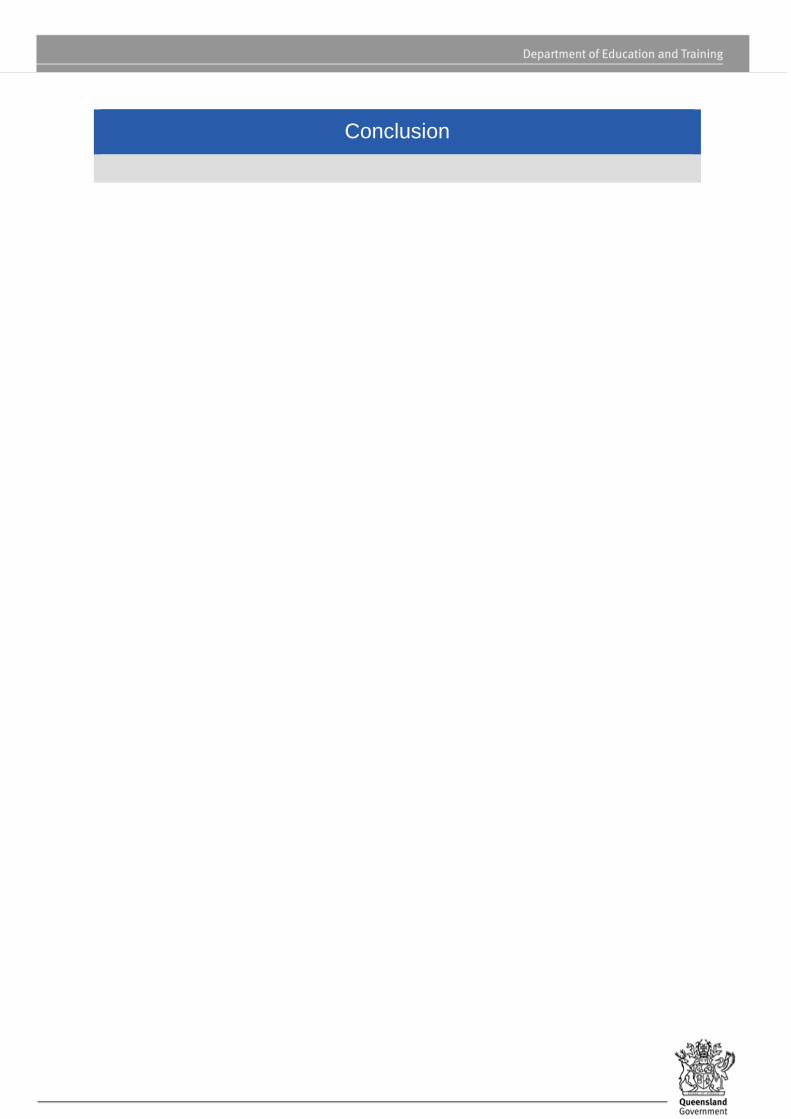
Conclusion