
Annual Report ofthe Hydrology Study ofthe Geothermal … Report ofthe Hydrology Study ofthe...
13
Annual Report of the Hydrology Study of the Geothermal Project September 14, 1993 Principal Investigator: Aly El-Kadi Co-Principal Investigator: Frank Peterson Graduate Research Assistant: Stephen Gingerich
Transcript of Annual Report ofthe Hydrology Study ofthe Geothermal … Report ofthe Hydrology Study ofthe...
Annual Report of the Hydrology Study
of the Geothermal Project
September 14, 1993
Principal Investigator: Aly El-Kadi
Co-Principal Investigator: Frank Peterson
Graduate Research Assistant: Stephen Gingerich

Published literature review and data compilation
The first step of the project involved compiling a collection of
over 50 documents and reports concerning the hydrology and
relevant geology of Kilauea and the Kilauea East Rift Zone
(KERZ). The report authors include the Department of Land and
Natural Resources (DLNR), University of Hawaii, Hawaii Institute
of Geophysics (HIG) and the Hawaii Natural Energy Institute
(HNEI) researchers, the U.S. Geological Survey (USGS), Puna
Geothermal venture (PGV) and private consultants (Geothermex and
ENEL) .
The information gathered from these reports allows a conceptual
model of the near-surface flow system to be formulated. This
information includes details of: aquifer geometry (from SOH and
PGV drilling reports), recharge (from USGS reports and PGV
rainfall data), fluid properties (from past modeling studies in
Hawaii and other geothermal sites), rock matrix properties (from
drill reports, past models in Hawaii and other geothermal
sites), aquifer flow characteristics (from drilling reports,
numerical models in Hawaii, and USGS reports), fluid, energy and
solute sources and sinks (USGS and HIG reports), and current
groundwater parameters (USGS files, HIG reports, State of Hawaii
Files).
water levels, groundwater temperatures and groundwater chloride
or salinity measurements are considered the most important data

for understanding the aquifer flow system. This data was
obtained from several sources including USGS files, DLNR files,
PGV reports, published literature and on-going monitoring
projects being conducted by UH researchers. Getting accurate
water levels has turned out to be the most troublesome aspect of
the project. The ideal situation would provide a water level
measured at each well in the study area on a single day.
Currently, we lack current water levels for several of the
critical wells in the study area. For example, the most current
water level from the Pahoa wells is from 1987. Unreliable water
levels are also a problem. The water level measurements from PGV
monitoring wells MW1 and MW3 differ by over 8 feet and the wells
are only about 100 yards apart. Although such changes in head
over a short distance are possible in a rift zone, we have not
been able to confirm this with same day measurements of both
wells.
Tidal analysis of continuous monitoring data
continuous hourly water level, temperature and conductivity data
have been collected from Kapoho Airstrip, PGV MW2, GTW3, Malama
Ki and Hawaiian Paradise wells by Elizabeth Novak and Don Thomas.
In addition, continuous pressure measurements have been recorded
in SOH1,SOH2 and SOH4 by the HNEI. These continuous records show
daily fluctuations caused by ocean and earth tide loading. .By
comparing well water level data with ocean tide data one can
determine tidal efficiency and tidal lag. This information was

then used with a numerical simulation to determine transmissive
and storage properties for the aquifer. Also, by removing the
tidal signal from the aquifer, it allows us to determine what
effect recharge has on water level.
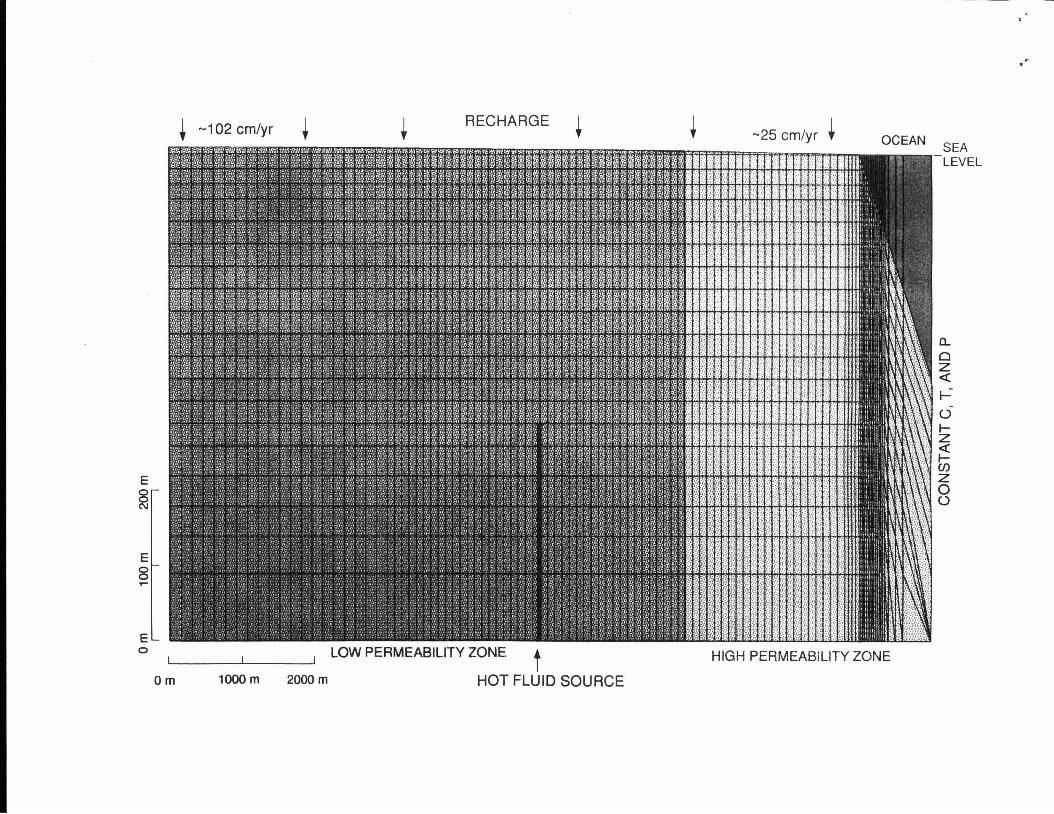
Numerical simulation of the aquifer
An extensive search for an acceptable numerical · simulation code
involved contacting USGS, Battelle and Lawrence Berkeley Lab
personnel to evaluate numerical models capable of handling heat
and solute transport in an unconfined aquifer. Models considered
included SUTRA, TOUGH, HST3D and CFEST. We acquired a copy of
the Coupled Fluid, Energy, and Solute Transport (CFEST) code and
documentation from Battelle. with this model, it is possible to
simulate a cross-section of the shallow aquifer perpendicular to
the ERZ. This cross-section passes through public water-supply
wells, PGV monitoring wells and geothermal wells, Malama Ki well
and a thermal spring discharge at the ocean (see Figures of ERZ,
mesh, and conceptual cross-section of the aquifer).
There has not been any pUblished attempts to numerically simulate
a geothermal convection system superimposed on an oceanic-island
freshwater lens. This type of numerical simulation is quite
complicated due to the non-linear nature of the mathematical
equations needed to solve the problem. For each point or node in
the cross-sectional mesh, the program must solve a groundwater

flow equation, a solute transport equation and a heat transport
equation. The difficulty arises because all three equations
depend on each other; when the result of one equation changes the
others must be solved again with the new values. The computer
program solves the equations thousands of times iteratively until
the changes in the head, concentration and heat values are below
a preset tolerance. A single solution sequence takes severa l
hours to complete, and when changes are made in the model input
parameters, the whole sequence must start over again. Currently,
we are concentrating on investigating the solute transport
characteristics of the aquifer. Once we establish a steady-state
freshwater lens we will begin to incorporate heat transport in
the system.
Once the computer model is calibrated to known head,
concentrations and temperatures, it will be used to make
predictions about future scenarios. It will allow us to make
estimates of the volume of hot fluid leaking into the shallow
aquifer and what may happen if the volume increases or decreases.
The model will also allow us to track the flow velocities of
contaminants in the aquifer. We will be able to predict the
length of time it will take a contaminant, such as a pulse of
brine, to travel from the geothermal site downgradient towards a
discharge point at the ocean.
Project needs

1. We have not been updated by GeothermEx as to the
progress of their geothermal system modeling. The
amount of heated fluid escaping upwards from the
geothermal system is a critical factor in developing
the shallow model. We will need to get this
information from the results of the GeothermEx modeling
work.
2. We need a cooperative effort between the state and PGV to
obtain water level measurements in the Pahoa wells, the PGV
monitoring wells and Malama Ki well in a single day. It is
especially critical to get water level values from MW1 and
MW3 due to the large difference in previous known water
levels. An accurate conceptual model of the rift zone flow
system is impossible without this information.
3. We need to keep receiving as much data as possible from
the on-going continuous monitoring project headed by
Don Thomas although we recognize the difficulty
encountered in collecting this data due to the harsh
environment in the monitoring wells. The information
is critical for determining aquifer response to
recharge events.
4. We are waiting for a copy of the final version of the
geologic map of the KERZ on arc-info GIS format to be
submitted to the state by the HVO. We can incorporate

this into our map-info program which lists well
locations, etc.

LEGEND
'tL IG H1'H O USE S PRIN G
• G EOTH E RM ALPR ODU CTION W EL L
v (i l l l E r:.;~.:H i·.L L V i! ,'11::LL
• PRO D UCT ION WE LL
• (, EO TH ERt.1ALE :-< P LO RP. 1' IO t~ W ELL
t S PR IN G
• WA RM W AT ER PLUMEON INFRA RED IMAGE
tt VACAT IONLA N D SPRIN G
KA PO HO BE ACHL01'S PON D
•. WAY NE 'S S PR ING
I~ .
.. POH OIKI SPRING S
·' LLI ·:;or~
c, nv -·,
.,
.-
. .... .. .
,v
i<i\ F'Or:O .t-.II-,
KA POHO C RAT ER .// ./
/ ./· · ' SOH -2 .... . •
'/GR EEN LAKE ./ . . ,
././ .
././
././
./»:
L ANIP UN.A b././
. ./
.// ../
.,
,.• ~ ' LOCATION OF MODELING
• CROSS -SECTION· ' ~ 111 OPIH IKAO SPR ING
M J>,LAII.1 A K I
MW 3 MW 1
.y:Vs 2 . ~ - ,G1'W -3
b' C' '1 " I ..' ~ \ <« ~.\'$ 8
" ":-.'. "
" .. -
' . . " ./" . HAW AII AN SHORES ,i ./:
' .' / .«HAWAIIAN BEACHES .... V , ./ '
~. , . < ./..... . ' , .:: .., .:" . ./.<./
>/;:>;/..., ;,r :
..KS 1
K6g~' ."',' ' KC' 1~ . .. . " ,"-" .V \.J \ p :• ..:.> I
~' " :' _'~ ~_ ' ' } ..1VV 2H GP .A f\ S .J. . .' ,
!LAN IPU N A I
" . /
. //// /
GTW- I. \ 'I ././
).. ./,.' : '; ". 'y .- .....
.)' OTZt~>,~/ji</ .:,
. - - SO H- 4
~,K E ON EPOK O .NUl. ... " ",
, ,,":
.; '; . , ," b 0 «: ,:i/ '~" : C; \ '~"v . , ~V
"0 , ",0 :<1-°.,"~«; i " .
A S HI DA NO 1

mE OCEAN TIDAL SIGNAL TRAVELS AS A PRESSURE RESPONSE mROUGH THE AQUIF ERAND CAN BE MEASURED IN MONITORING WELLS AWAY FROM THE COAST
1.0m
OCEAN
III 'III
~U~hjI ~~~VVWV~
RELATIVEAMPUTUDE:
2650m
MALAMAKI... :
! 4200 mIIIIII
~III
0.34 m·
PGVMW2
0.014 m EXPONENTIALOECAY
RELATIVETIME LAG: ohr 2.5 hr 3.5 hr LINEAR OECAY
FROM THESE RELATIONSHIPS, THE AQUIFER'S TRANSMISSIVE AND STORAGE PROPERTIESARE ESTIMATED BY USING A NUMERICAL SIMULATION OF TIDAL SIGNAL PROPAGATION
THROUGH THE AQUIFER

.-Q
OJ
o
.
.-
~.-
~.-
~.-
672576480288 384
HOURS IN JUNE
MALAMA KI WATER LEVEL DATA
19296o
RAW WATER LEVEL DATAWITIDAL SIGNAL
->-
- N ~ ~
~J ~t Kr
~r---",., ,..
r-.t'-h.
l~r--.~
IJ ... I~rr ijl
-,..
-~
SMOOTHED WATER LEVELW/OUT TIDAL SIGNAL
I "1I IOJ
ci
Q.-
~.-
~.-
-E~'"-'
-J .-LlJ
~a::LlJ!¢ "r:~ .-

SMOOTHED WATER LEVEL MEASUREMENTS
20 i I I I I I i II
..~MAU\M.A. K I
~.........-'
~-'a:lJ.J
~~lJ.J>
5lJ.Ja:
1.6
1.0
0.6
o611192 611192 711192
HILO TIDE
/
811192
w
911.092
/J10/1192 1111192 1211192
.~
I I ILOW PERMEABILITY ZONE
SEALEVEL
a..ozc:(
1--
oIZc:(I(f)
Zoo
OCEAN-25 cm/yr +
HIGH PERMEABILITY ZONE
++
tHOT FLUID SOURCE
RECHARGE++
2000m1000m
+ -102 cm/yr
Om
Ea~
Ea
E8....

•...
o8o,...oo~oos000'"~
0E
00"'--"
(D
CDo0
c00
CO1
0U50
08...o8C
':)
oo@oo~o
(w)
UO
!lBA
813
ooo,....
ooC)l
oot:?oo":
g.oo"9

![[Hydrology] Groundwater Hydrology - David K. Todd (2005)](https://static.fdocuments.us/doc/165x107/548ce7beb47959e2288b45f9/hydrology-groundwater-hydrology-david-k-todd-2005.jpg)


![[Hydrology] groundwater hydrology david k. todd (2005)](https://static.fdocuments.us/doc/165x107/55a8e6001a28ab6c2f8b4687/hydrology-groundwater-hydrology-david-k-todd-2005-55b0d9a792c06.jpg)