ANNUAL REPORT OCTOBER 31, 2018 THE INTERNATIONAL …
88
ANNUAL REPORT OCTOBER 31, 2018 THE INTERNATIONAL FUND THE EMERGING MARKETS FUND THE AMERICAN OPPORTUNITIES FUND
Transcript of ANNUAL REPORT OCTOBER 31, 2018 THE INTERNATIONAL …

ANNUAL REPORTOCTOBER 31, 2018
THE INTERNATIONAL FUNDTHE EMERGING MARKETS FUND
THE AMERICAN OPPORTUNITIES FUND


CONTENTS
MESSAGE TO SHAREHOLDERS 1
MANAGER COMMENTS, PERFORMANCE AND INVESTMENT PORTFOLIO
THOMAS WHITE INTERNATIONAL FUND 6
THOMAS WHITE EMERGING MARKETS FUND 20
THOMAS WHITE AMERICAN OPPORTUNITIES FUND 32
STATEMENTS OF ASSETS AND LIABILITIES 43
STATEMENTS OF OPERATIONS 45
STATEMENTS OF CHANGES IN NET ASSETS 46
NOTES TO FINANCIAL STATEMENTS 49
FINANCIAL HIGHLIGHTS 64
REPORT OF INDEPENDENT REGISTERED PUBLIC ACCOUNTING FIRM 69
DISCLOSURE OF FUND EXPENSES 72
QUARTERLY PORTFOLIO SCHEDULE AND PROXY VOTING POLICIES 73
APPROVAL OF NEW INVESTMENT ADVISORY AGREEMENTS 74


Message to Shareholders
Dear Shareholders and Friends:
In September 2018, we announced thatThomas S. White, Jr., Founder and ChiefInvestment Officer, and Stathy White,Chairman of Thomas White International, theAdvisor to the Funds, would retire effectivethe end of that month. Tom and Stathy leftMorgan Stanley Asset Management to startthe firm in 1992. Over the ensuing years, anexpanding number of home-grown researchanalysts have developed the valuation-oriented stock selection techniques thatestablished the firm as a manager of domesticand international portfolios, including theThomas White Funds. As of September 30,2018, our employees acquired Tom White’sfull ownership interest in the firm. The resultis that Thomas White International is nowbroadly owned by twelve long-termemployees, who average 17 years at the firm.The firm is also now 54% minority-ownedand 19% woman-owned.
On November 30, 2018, we are pleased toreport that you, the Funds’ shareholders,overwhelmingly approved the change ofcontrol at Thomas White International. Asidefrom Tom White’s retirement, there will beno change in the members of the InvestmentCommittee who manage our firm’sportfolios, including the Thomas WhiteFunds. We believe the depth of experiencedemployee shareholders reflects our long-heldgoal to assure firm continuity andsustainability on behalf of all our clients.
Tom and Stathy White, as well as all theprofessionals at Thomas White International,thank you for your long-held trust in ourorganization. Our team looks forward tocontinue serving your investment needs formany years to come.
Global Uncertainty / Rising PoliticalUncertainty
As was noted in the most recent Semi-Annual Report, corporate earnings and cashflows remained robust in early 2018 despiteincreased market volatility and risinguncertainty. Over the next twelve months,the United States economy is forecast toslow from the above-normal growthachieved through the 2017 tax cuts. Themodest slowdown is also driven in part bythe tightening of interest rate policy via theU.S. Federal Reserve throughout 2018 andpotentially into 2019.
Uncertainty surrounding global trade policy,particularly between the U.S. and China, isalso contributing to a domestic and globalslowdown. As continuing trade tensionsweakened the global growth outlook,consensus views of U.S. growth expectationsfor next year have softened as well. WhileU.S. inflation remains just below the Fed’s2% target and domestic unemployment ratesremain near record lows, the economy couldreturn to strong growth with less disruptivefiscal and trade policies.
www.thomaswhitefunds.com 1

There is no doubt the U.S. has an upper handin trade negotiations now, as the domesticeconomy is stronger than that of Chinawhich is more dependent on trade. This isevident in the relatively controlled responsesfrom China to heightened U.S. rhetoric. Yet,the U.S. cannot remain shielded from theglobal slowdown that will most likely followif the trade wars drag on. Some large U.S.corporations have already started reportingweaker overseas demand and others areexpected to follow sooner rather than later.
Some of the major areas of dispute betweenthe U.S. and China, such as better protectionof intellectual property rights, could takeseveral years to resolve. However, there areother areas that could be addressed withinshorter time frames. This includes increasedsourcing of farm produce and industrialequipment from the U.S. as well as improvedmarket access for foreign companies inChina. The Chinese government has alreadytaken some initial steps such as allowingmajority ownership in local ventures toforeign auto companies and lower tariffs onimports. The flexibility shown by the U.S.administration in renegotiating the North
American Free Trade Agreement (NAFTA)suggests that it is possible to arrive at a dealthat will avoid further tariffs and controls.
Political changes over the past 24 months incountries ranging from the U.S., France,Brazil, Mexico and Korea, to name just afew, have also created new opportunities andnew risks. Changing domestic policies havedirectly influenced potential capitalinvestment across major sectors.Simultaneously, these changes haveimpacted evolving international tradingrelationships ranging from U.K.’s ongoingnegotiations with the European Union overBrexit to the increased trade tension betweenChina and the U.S., as well as the continuingapproval process of the new United States-Mexico-Canada Agreement (USMCA), orrevised NAFTA, between the US, Mexicoand Canada. Despite a cloudy outlook, weexpect the U.S. to lead growth in thedeveloped markets and for emerging marketgrowth to also remain solid. We believe atrade agreement between the U.S. and Chinain early 2019 could be a significant catalystfor rising earnings growth in both developedand emerging economies.
2 www.thomaswhitefunds.com

World U.S. Eurozone Japan EM China India South EastAsia
3.7%3.7%
2.5%2.9%
2.0% 1.9%
1.1%0.9%
4.7% 4.7%
6.2%
7.3%7.4%
5.3%5.2%
6.6%
2018 2019
Annualized GDP Growth Forecasts in %; Source: International Monetary Fund (IMF) World Economic Outlook Oct 2018
Portfolio Strategy
We believe global equity market valuationsremain compelling. This year’s early fourthquarter underperformance has pushedinternational and emerging market equityvaluations to multi-year lows. As the CAPE(Cyclically Adjusted Price-to-Earnings) ratiodata, through August 2018, in the chart on thefollowing page shows, the U.S. equityvaluations remain slightly above their long-term average while the Emerging Markets andJapan are nearing their lows seen during the2008 financial crisis. However, most emergingmarket corporations appear to be in muchbetter financial health than they were duringthe global recession. We also believe that therisks faced by these businesses, both domesticand external, are also generally lower. Thoughearnings and cash flows in select markets andindustries have fallen short of forecasts thisyear, they continue to expand at a moderatepace. That is in stark contrast to 2008 when
earnings declined sharply and the recoveryrequired large scale fiscal stimulus measures.
While it is true that leverage has gone upappreciably in emerging economies over thelast decade, in most major economies,including China, much of the debt is in localcurrency. This reduces the vulnerability toexternal shocks and the impact of higher ratesin the developed countries. Most governmentsin emerging countries are friendly to business,and their policies are largely supportive offaster economic growth. The new governmentin Brazil is expected to push much-neededreform measures. In Mexico, the governmentis likely to be more realistic than suggested bythe recent rhetoric that has spooked investors.Even if India and Indonesia see leadershipchanges after next year’s national elections,the broader economic policy approaches areunlikely to change.
www.thomaswhitefunds.com 3

-3
-2
-1
0
1
2
3
4
1/1/1990 1/1/1995 1/1/2000 1/1/2005 1/1/2010 1/1/2015
Cyclically Adjusted Price-to-Earnings RatiosDeviation from Mean (z-score)
Japan United States Emerging markets
Source: International Monetary Fund (IMF) Global Financial Stability Report Oct 2018, data through August 2018.
Continuation of the trade disputes, tightermonetary policy, and any unexpected U.S.growth slowdown are the significant risks forthe coming year. The larger U.S.corporations that draw a significant share ofrevenues from overseas markets havebecome more cautious about their revenueand earnings outlooks. Investors are worriedabout the impact of higher interest rates onthe domestic economy, if the FederalReserve decides to trim its balance sheetsooner than currently expected. There arealso renewed doubts about the expectedfederal spending on infrastructure, as themid-term elections reduced the likelihood ofgaining Congressional approval for suchmeasures or renegotiated multi-lateral tradedeals.
We want to thank all of our shareholders forworking with us during the proxy votingprocess and the Special Shareholder Meetingand keeping your trust in the Thomas WhiteFunds. Our employees remain committed tohelping you achieve your long-terminvestment goals. Please feel free to visit ourwebsite www.thomaswhitefunds.com or callus at 1-800-811-0535 with any questions.
Douglas M. Jackman, CFA
President and Portfolio ManagerThomas White International andThomas White Funds
4 www.thomaswhitefunds.com

Past performance is not a guarantee of future results.
Opinions expressed are subject to change, are not guaranteed and should not be consideredrecommendations to buy or sell any security.
Must be preceded or accompanied by a prospectus.
Mutual fund investing involves risk. Principal loss is possible. Investing in internationalmarkets may involve additional risks such as social and political instability, marketilliquidity, exchange-rate fluctuations, a high level of volatility and limited regulation.These risks are greater for emerging markets. Investing in small and mid-cap companiescan involve more risk than investing in larger companies.
Diversification does not assure a profit nor protect against loss in a declining market.
Earnings growth for a Fund holding does not guarantee a corresponding increase in themarket value of the holding of the Fund.
The Thomas White Funds are distributed by Quasar Distributors, LLC.
It is not possible to invest directly in an index.
Cash Flow: Measures the cash generating capability of a company by adding non-cash charges(i.e. depreciation) and interest expense to pretax income.
CAPE Ratio: The cyclically adjusted price-to-earnings ratio, commonly known as CAPE, is avaluation measure usually applied to equity markets. It is defined as price divided by theaverage of ten years of earnings, adjusted for inflation.
Z-Score: A measure of how many standard deviations below or above the population mean araw score is. A standard deviation is a measure that is used to quantify the amount of variationor dispersion of a set of data values.
www.thomaswhitefunds.com 5

THOMAS WHITE INTERNATIONAL FUND
Unaudited
SalesCharge
DeferredSales
Charge
AdministrativeServices
Fee 12b-1 FeesOperating
Expenses1,3
ProspectusGrossAnnual
OperatingExpense2
ProspectusNet
AnnualOperatingExpense2,3
InvestorClass None None Up to 0.25% None 1.24% 1.36% 1.24%
Class I None None None None 0.99% 1.14% 0.99%
1 In the absence of the fee deferral/expense reimbursement arrangement for the International Fund, the ratio of expenses toaverage net assets would have been 1.34% for Investor Class shares and 1.18% for Class I shares.2 Gross Annual Operating Expense and Net Annual Operating Expense are based on the most recent prospectus and may differfrom other expense ratios appearing in this report.3 Thomas White International, Ltd. (“Advisor”) has agreed to defer its fees and/or reimburse the Fund to the extent that theoperating expenses for Investor Class and Class I shares exceed (as a percentage of average daily net assets) 1.24% and0.99%, respectively. The fee deferral/expense reimbursement agreement expires February 28, 2019. The Fund has agreed torepay the Advisor for amounts deferred or reimbursed by the Advisor pursuant to the agreement provided that such repaymentdoes not cause the Fund to exceed the above limits and the repayment is made within three years after the year in which theAdvisor incurred the expense. The fee deferral/expense reimbursement agreement may only be amended or terminated by theFund’s Board of Trustees.
NAV Net Assets Redemption Fee Portfolio Turnover
Investor Class $13.86 $29.5 million 2.00%on shares held
less than 60 days38%
Class I $13.81 $181.2 million
6 www.thomaswhitefunds.com

OCTOBER 31, 2018
Average Annual Returns as of October 31, 2018 (Unaudited)
Class Sales Charge 6 monthCalendar
YTD 1 Yr 3 Yrs 5 Yrs 10 Yrs
SinceInception
(6/28/1994)*
Investor Class shares (TWWDX) None -14.13% -14.08% -12.01% 1.27% -1.04% 5.23% 6.23%
Class I shares1 (TWWIX) None -14.07% -13.98% -11.80% 1.49% -0.81% 5.39% 6.29%
MSCI All Country World ex USIndex2 N/A -11.32% -10.97% -8.24% 4.37% 1.63% 6.92% 4.93%
* The inception date of the Investor Class shares.1 Performance figures for Class I shares, first offered on August 31, 2012, include the historical performance of Investor Classshares through August 30, 2012.2 The MSCI All Country World ex US Index is a free float-adjusted market capitalization-weighted index of both developed andemerging markets. The index is unmanaged and returns assume the reinvestment of dividends. It is not possible to invest directlyin an index.
Returns of each share class reflect differences in expenses applicable to each class which are primarilydifferences in service fees.
The returns do not reflect the deduction of taxes that a shareholder would pay on Fund distributions or theredemption of Fund shares. The returns reflect the actual performance for each period and do not include theimpacts of trades executed on the last business day of the period that were recorded on the first business dayof the next period.
Performance data is based upon past performance, which is no guarantee of future results. The investmentreturn and principal value of an investment will fluctuate so that an investor’s shares, when redeemed, may beworth more or less than their original cost. Current performance may be higher or lower than the performancedata quoted. Please call 1-800-811-0535 to obtain performance data as of the most recent month-end. TheFund imposes a 2% redemption fee on shares held less than 60 days. Performance data does not reflect theredemption fee. If reflected, total returns would be lower. Investment performance reflects any fee waivers thatwere in effect. In the absence of such waivers, total return would have been reduced. The Gross ExpenseRatios, based on the most recent prospectus, are 1.36% (Investor Class) and 1.14% (Class I).
www.thomaswhitefunds.com 7

THOMAS WHITE INTERNATIONAL FUND
GROWTH OF A $10,000 INVESTMENT WITH DIVIDENDS REINVESTED (Unaudited)
$30Thomas White International Fund - Investor Class
VA
LU
E (
IN T
HO
US
AN
DS
)
$20
$10
$0All data calculated from 10/31/08.
10/08 10/1810/12 10/13 10/14 10/1610/15 10/1710/09 10/1110/10
MSCI All Country World ex US Index
$16,653
$19,528
This chart illustrates the performance of a hypothetical $10,000 investment made in the Fund’sInvestor Class shares and its benchmark, the MSCI All Country World ex US Index, for the past10 years through October 31, 2018. It assumes reinvestment of dividends and capital gains, but doesnot reflect the effect of any applicable redemption fees. This chart does not imply future performance.Past performance does not guarantee future results. The cumulative ten year return was 66.53% forthe Fund’s Investor Class shares and 95.28% for the benchmark. The Fund’s Investor Class sharesaverage annual total return since inception on June 28, 1994 was 6.23%. The MSCI All Country Worldex US Index is a free float-adjusted market capitalization-weighted index of both developed andemerging markets. The index is unmanaged and returns assume the reinvestment of dividends. It isnot possible to invest directly in an index. During the periods shown, the Fund’s manager reimbursedcertain Fund expenses. Absent this reimbursement, performance would have been lower. Performancewill vary from class to class based on differences in class-specific expenses.
8 www.thomaswhitefunds.com

OCTOBER 31, 2018
The Thomas White International Fundprimarily invests in equity securities ofcompanies located in the world’sdeveloped countries outside of the U.S.There may also be a portion of theFund’s assets invested in companieslocated in emerging market countries.
Portfolio Managers
Jinwen Zhang, Ph.D., CFADouglas M. Jackman, CFAWei Li, Ph.D., CFAJohn Wu, Ph.D., CFARex Mathew, CFA, CMARamkumar Venkatramani, CFA
Performance Review
The Thomas White International FundClass I shares returned -11.80% for theone-year period ended October 31, 2018,compared to -8.24% for the benchmarkMSCI All Country World ex US Index.Since its inception on June 28, 1994, theFund’s Class I shares have returned +6.29%*annualized while the benchmark indexreturned +4.93% for the same period.
Trade Conflicts and Slower EuropeanGrowth Hurt International Equities
Despite a strong start, international equityprices declined during the one-year reviewperiod as investors were alarmed by theescalating trade tensions between the U.S.and the rest of the world. As higher tradetariffs came into effect, global trade volumesweakened and clouded the economic growthoutlook. Earnings expectations forcorporations with significant overseas
revenue exposures, including several largeU.S. corporations, were revised lower.Weakened trade growth had adisproportionately larger impact on Europeaneconomies such as Germany that slowedmore than forecast. In addition, thecontinuing budget stalemate between Italyand the European Union dented investorsentiment in Europe.
Robust U.S. domestic growth in the secondand third quarters of this year pushed upexpectations of further interest rate hikesfrom the U.S. Federal Reserve. Though theseexpectations have eased more recently, theU.S. Dollar was relatively strong for most ofthe review period and restricted investorappetite for international equities. Japan,Canada and Australia outperformed otherinternational developed markets during thereview period as broader economic trends inthese countries were relatively healthier.
Emerging markets lagged the developedmarkets during the period as their economiesare likely to be hurt more by the trade spats.Much of the tariffs imposed by the U.S. areon imports from China, where thegovernment has been trying to limit thedownside risks to growth while the economyis in transition. Political risks in Turkey andMexico have also made investors cautious.Brazil has been the brightest spot amongemerging markets during the second half ofthe review period, helped by the election of apresident who is seen as more pro-business.
Reviewing the Portfolio
The energy sector outperformed as crude oilprices remained elevated for most of the
* Performance for Class I shares includes the historical performance of Investor Class shares through August 30, 2012.
www.thomaswhitefunds.com 9

THOMAS WHITE INTERNATIONAL FUND
review period, before the recent correction.Healthcare and consumer staples sectors alsobenefited as investors sought relatively stableassets during increased market volatility.Technology holdings underperformed duringthe period as investors became skepticalabout future revenue growth at several of theleading ecommerce, online service providersand semiconductor manufacturers in Asia.The consumer discretionary sector was hurtby concerns about slowing demand growthfor durables and services in major markets.The financials sector also lagged on doubtsabout the sustainability of interest ratemargins and fee income growth.
Russian oil producer Lukoil contributed themost to Fund returns as higher crude oilprices boosted margins and cash flows.Safran, a European manufacturer of aircraftengines and aerospace equipment, advancedon robust demand growth for its products.CSL Limited, a biopharmaceuticalmanufacturer based in Australia, benefitedfrom better than expected earnings growth.Ping An, a leading Chinese insurer,produced strong returns on sustainedearnings expansion. Europeanpharmaceuticals manufacturer Shireoutperformed after Japanese competitorTakeda made an acquisition offer that wasaccepted.
Spanish lender Banco Bilbao detracted themost from Fund returns for the period onconcerns about its exposure to selectemerging markets such as Turkey andMexico with higher policy and regulatoryrisks. Dutch financial services group ING aswell as Italian bank UniCredit also declinedas credit demand has been lower thanexpected. Advertising group WPP was hurt
by lower revenue guidance on a continuingdecline in client spending. Bearings andindustrial components manufacturer SKFunderperformed as demand outlook softened,especially in the automobile industry.
International Valuations AppearAttractive, Though a Slower Europe WillChallenge PolicymakersGrowth in the Eurozone has fallen short ofexpectations this year as the region continuesto face multiple headwinds. The decline inglobal trade and domestic political discontenthave weakened the growth outlook forGermany and France, the largest economiesin the region. The fragmented politicalstructure in Italy, without a clear leadership,has delayed the resolution of itsdisagreements with the European Union overits budget. With only months remaining untilthe Brexit deadline, the U.K. still has notrade agreement with the European Union. Ifthe U.K. leaves without any deal, it could bevery disruptive for businesses on both sides.
Nevertheless, we believe the relativelyinexpensive equity valuations across Europehave largely priced in these concerns.Though past negotiations have been futile,most of these challenges can still be resolvedif the leaders show enough flexibility andfocus on the long-term economic stability ofthe region. If some of these downside risksfade, it is likely that investors will turn moreoptimistic about European equities. On itspart, the European Central Bank couldpossibly delay the winding down of itsquantitative easing if economic growthcontinues to underwhelm.
Trade uncertainties and natural disasters hurtthe Japanese economy during the thirdquarter of 2018, but is expected to recover in
10 www.thomaswhitefunds.com

OCTOBER 31, 2018
the coming quarters. The renewed politicalmandate should allow the government toinitiate much needed policy initiatives suchas the recently announced migrant workervisa program. The Bank of Japan is likely tocontinue its asset purchase program asgrowth and inflation remain below targets.Japanese equity valuations are attractive,particularly in the light of relatively healthycorporate earnings and cash flows.
Emerging market equity valuations are atmulti-year lows, even though theireconomies are likely to see average growthof close to 5% over the next two years. Astrade tensions ease, we believe the Chinesegovernment has enough policy flexibility to
maintain aggregate growth at current levels.India and Indonesia are also likely tomaintain their current pace next year, whennational elections are scheduled in bothcountries. The Brazilian economy is likely tosee faster expansion in 2019, helped byfavorable policies of the new governmentand higher capital investments. We believefears about adverse policy steps from thenew Mexican government are overstated andthe country should benefit once therenegotiated North American trade deal isapproved by the U.S. Congress.
Thank you for your confidence in theThomas White International Fund.
www.thomaswhitefunds.com 11

THOMAS WHITE INTERNATIONAL FUND
Portfolio Country and Industry Allocation as of October 31, 2018 (Unaudited)
Country Allocation % of TNA
Australia 6.2%
Belgium 1.2%
Brazil 2.2%
Canada 5.0%
China 7.3%
Finland 2.3%
France 5.7%
Germany 3.8%
Hong Kong 1.8%
India 4.4%
Indonesia 2.3%
Ireland 1.1%
Italy 1.1%
Japan 13.2%
Mexico 1.9%
Netherlands 3.8%
Peru 1.4%
Russia 2.4%
Singapore 1.1%
South Africa 1.9%
South Korea 4.0%
Spain 2.9%
Sweden 2.6%
Switzerland 2.2%
Taiwan 2.0%
Thailand 3.1%
Turkey 0.5%
United Kingdom 10.4%
Cash & Other 2.2%
Industry Allocation % of TNA
Automobiles & Components 3.2%
Banks 18.1%
Capital Goods 10.1%
Commercial & Professional Services 2.2%
Consumer Durables & Apparel 2.8%
Consumer Services 2.3%
Diversified Financials 4.2%
Energy 7.1%
Food, Beverage & Tobacco 2.8%
Health Care Equipment & Services 2.7%
Household & Personal Products 2.8%
Insurance 2.4%
Materials 11.0%
Media & Entertainment 5.2%
Pharmaceuticals, Biotechnology & Life Sciences 3.4%
Retailing 2.3%
Semiconductors & Semiconductor Equipment 3.4%
Software & Services 1.2%
Technology Hardware & Equipment 2.2%
Telecommunication Services 3.0%
Transportation 5.4%
Cash & Other 2.2%
TNA - Total Net Assets
Fund holdings and industry allocations are subject to change and should not beconsidered a recommendation to buy or sell any securities. For a complete list of Fundholdings, please refer to the Investment Portfolio section of this report.
12 www.thomaswhitefunds.com
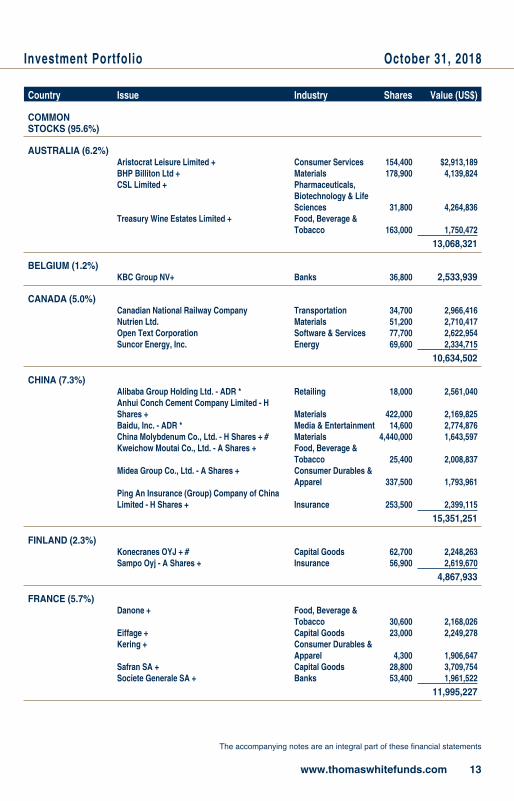
Investment Portfolio October 31, 2018
Country Issue Industry Shares Value (US$)
COMMONSTOCKS (95.6%)
AUSTRALIA (6.2%)Aristocrat Leisure Limited + Consumer Services 154,400 $2,913,189BHP Billiton Ltd + Materials 178,900 4,139,824CSL Limited + Pharmaceuticals,
Biotechnology & LifeSciences 31,800 4,264,836
Treasury Wine Estates Limited + Food, Beverage &Tobacco 163,000 1,750,472
13,068,321
BELGIUM (1.2%)KBC Group NV+ Banks 36,800 2,533,939
CANADA (5.0%)Canadian National Railway Company Transportation 34,700 2,966,416Nutrien Ltd. Materials 51,200 2,710,417Open Text Corporation Software & Services 77,700 2,622,954Suncor Energy, Inc. Energy 69,600 2,334,715
10,634,502
CHINA (7.3%)Alibaba Group Holding Ltd. - ADR * Retailing 18,000 2,561,040Anhui Conch Cement Company Limited - HShares + Materials 422,000 2,169,825Baidu, Inc. - ADR * Media & Entertainment 14,600 2,774,876China Molybdenum Co., Ltd. - H Shares + # Materials 4,440,000 1,643,597Kweichow Moutai Co., Ltd. - A Shares + Food, Beverage &
Tobacco 25,400 2,008,837Midea Group Co., Ltd. - A Shares + Consumer Durables &
Apparel 337,500 1,793,961Ping An Insurance (Group) Company of ChinaLimited - H Shares + Insurance 253,500 2,399,115
15,351,251
FINLAND (2.3%)Konecranes OYJ + # Capital Goods 62,700 2,248,263Sampo Oyj - A Shares + Insurance 56,900 2,619,670
4,867,933
FRANCE (5.7%)Danone + Food, Beverage &
Tobacco 30,600 2,168,026Eiffage + Capital Goods 23,000 2,249,278Kering + Consumer Durables &
Apparel 4,300 1,906,647Safran SA + Capital Goods 28,800 3,709,754Societe Generale SA + Banks 53,400 1,961,522
11,995,227
The accompanying notes are an integral part of these financial statements
www.thomaswhitefunds.com 13

Thomas White International Fund
Country Issue Industry Shares Value (US$)
GERMANY (3.8%)Bayer AG + Materials 17,500 $1,343,576Bayerische Motoren WerkeAktiengesellschaft +
Automobiles &Components 35,200 3,036,320
Fresenius SE & Co KGaA + Health CareEquipment & Services 25,200 1,605,990
Scout24 AG + Media & Entertainment 47,200 1,959,637
7,945,523
HONG KONG (1.8%)Hong Kong Exchanges & Clearing Limited + Diversified Financials 56,400 1,503,949Techtronic Industries Company Limited + Consumer Durables &
Apparel 482,000 2,262,834
3,766,783
INDIA (4.4%)Exide Industries Ltd. + Automobiles &
Components 716,000 2,585,369HDFC Bank Ltd. - ADR Banks 29,000 2,578,390Larsen & Toubro Ltd + Capital Goods 124,300 2,185,131Vedanta Limited + Materials 652,700 1,864,177
9,213,067
INDONESIA (2.3%)PT Bank Central Asia Tbk + Banks 1,534,900 2,390,054PT Telekomunikasi Indonesia Persero Tbk + Telecommunication
Services 10,091,400 2,551,033
4,941,087
IRELAND (1.1%)CRH PLC + Materials 81,100 2,423,283
ITALY (1.1%)Intesa Sanpaolo S.p.A. + Banks 1,029,000 2,274,911
JAPAN (13.2%)DAIKIN INDUSTRIES, LTD. + Capital Goods 21,300 2,465,410H.I.S. Co., Ltd. + Consumer Services 62,500 1,907,584Hoya Corp + Technology
Hardware & Equipment 39,800 2,254,064Kansai Paint Co., Ltd. + # Materials 124,400 1,832,578KOSE Corporation + Household & Personal
Products 11,000 1,634,078M3, Inc. + Health Care
Equipment & Services 126,400 2,051,445Nintendo Co., Ltd. + Media & Entertainment 5,600 1,736,014Nitori Holdings Co., Ltd. + Retailing 16,900 2,216,454ORIX Corporation + Diversified Financials 174,100 2,830,337Park24 Co., Ltd. + Commercial &
Professional Services 89,700 2,355,304SMC Corp/Japan + Capital Goods 9,000 2,862,806SoftBank Corp. + Telecommunication
Services 45,500 3,689,069
27,835,143
The accompanying notes are an integral part of these financial statements
14 www.thomaswhitefunds.com

Investment Portfolio October 31, 2018
Country Issue Industry Shares Value (US$)
MEXICO (1.9%)Cemex SAB de CV * Materials 2,915,524 $1,461,117Grupo Aeroportuario del Sureste SAB de CV -Class B Transportation 155,900 2,571,900
4,033,017
NETHERLANDS (3.8%)ING Groep N.V. + Banks 249,100 2,947,072Royal Dutch Shell PLC - B Shares + Energy 154,700 5,036,982
7,984,054
PERU (1.4%)Credicorp Ltd. Banks 13,200 2,979,372
RUSSIA (2.4%)LUKOIL PJSC - ADR + Energy 40,300 3,009,185Sberbank of Russia PJSC - ADR + Banks 168,000 1,974,728
4,983,913
SINGAPORE (1.1%)DBS Group Holdings Limited + Banks 134,600 2,283,878
SOUTH AFRICA (1.9%)FirstRand Limited + Diversified Financials 509,200 2,213,534Naspers Limited - N Shares + Media & Entertainment 10,000 1,751,553
3,965,087
SOUTH KOREA (4.0%)KB Financial Group Inc. + Banks 45,250 1,882,804LG Household & Health Care Ltd. + Household & Personal
Products 2,225 2,048,266POSCO + Materials 6,750 1,522,788Samsung Electronics Co., Ltd. + Semiconductors &
SemiconductorEquipment 77,650 2,904,081
8,357,939
SPAIN (2.9%)Aena SME, S.A. + Transportation 15,800 2,522,924Banco Bilbao Vizcaya Argentaria, S.A. + Banks 636,600 3,514,206
6,037,130
SWEDEN (2.6%)Hexagon AB - B Shares + Technology
Hardware & Equipment 50,100 2,452,603SKF AB - B Shares + Capital Goods 192,800 3,093,324
5,545,927
SWITZERLAND (2.2%)Credit Suisse Group AG + Diversified Financials 180,000 2,345,910IWG PLC + Commercial &
Professional Services 800,000 2,351,115
4,697,025
The accompanying notes are an integral part of these financial statements
www.thomaswhitefunds.com 15

Thomas White International Fund
Country Issue Industry Shares Value (US$)
TAIWAN (2.0%)Taiwan Semiconductor ManufacturingCompany, Ltd. +
Semiconductors &SemiconductorEquipment 104,000 $772,682
Taiwan Semiconductor ManufacturingCompany, Ltd. - ADR
Semiconductors &SemiconductorEquipment 93,000 3,543,300
4,315,982
THAILAND (3.1%)Airports of Thailand Public Company Ltd. + Transportation 1,658,800 3,210,279Kasikornbank Public Company Limited + Banks 547,200 3,298,814
6,509,093
TURKEY (0.5%)Tofas Turk Otomobil Fabrikasi A.S. + Automobiles &
Components 277,700 1,047,466
UNITED KINGDOM (10.4%)Antofagasta plc + Materials 199,100 1,994,998Ashtead Group Plc + Capital Goods 95,300 2,355,670BP p.l.c. + Energy 625,200 4,528,650Lloyds Banking Group plc + Banks 4,166,800 3,046,299Reckitt Benckiser Group PLC + Household & Personal
Products 26,500 2,142,754SHIRE PLC + Pharmaceuticals,
Biotechnology & LifeSciences 49,600 2,966,749
Smith & Nephew plc + Health CareEquipment & Services 129,000 2,097,911
WPP plc + Media & Entertainment 238,500 2,706,376
21,839,407
Total CommonStocks (Cost $194,082,519) 201,430,260
PREFERREDSTOCK (2.2%)
BRAZIL (2.2%)Itau Unibanco Holding S.A. (2/5/19, 0.35%) ^ Banks 345,360 4,560,256
Total PreferredStock (Cost $3,251,982) 4,560,256
Total Investments 97.8% (Cost $197,334,501) $205,990,516Other Assets, LessLiabilities 2.2% 4,660,969
Total Net Assets: 100.0% $210,651,485
The accompanying notes are an integral part of these financial statements
16 www.thomaswhitefunds.com

Investment Portfolio October 31, 2018
* Non-Income Producing Securities
# All or a portion of securities on loan at October 31, 2018. The market value of the securities loaned was $3,964,624. Theloaned securities were secured with non-cash collateral with a value of $4,247,803. The non-cash collateral received consistsof short term investments and long term bonds, and is held for the benefit of the Fund at the Fund’s custodian. The Fundcannot repledge or resell this collateral. Collateral is calculated based on prior day’s prices. - See Note 1(I) to FinancialStatements
^ Maturity Date and Preferred Dividend Rate of Preferred Stock
+ Fair Valued Security
ADR - American Depositary Receipt
Industry classifications shown in the Investment Portfolio are based off of the Global Industry ClassificationStandard (GICS®). GICS was developed by and/or is the exclusive property of MSCI, Inc. and Standard &Poor’s Financial Services LLC (“S&P”). GICS is a service mark of MSCI and S&P and has been licensed foruse by U.S. Bancorp Fund Services, LLC.
The accompanying notes are an integral part of these financial statements
www.thomaswhitefunds.com 17

Thomas White International Fund
The following table summarizes the inputs used, as of October 31, 2018, in valuating the Fund’sassets:
Level 1 Level 2 Level 3 Total
Common Stocks
Australia $------- $13,068,321 $------- $13,068,321
Belgium ------- 2,533,939 ------- 2,533,939
Canada 10,634,502 ------- ------- 10,634,502
China 5,335,916 10,015,335 ------- 15,351,251
Finland ------- 4,867,933 ------- 4,867,933
France ------- 11,995,227 ------- 11,995,227
Germany ------- 7,945,523 ------- 7,945,523
Hong Kong ------- 3,766,783 ------- 3,766,783
India 2,578,390 6,634,677 ------- 9,213,067
Indonesia ------- 4,941,087 ------- 4,941,087
Ireland ------- 2,423,283 ------- 2,423,283
Italy ------- 2,274,911 ------- 2,274,911
Japan ------- 27,835,143 ------- 27,835,143
Mexico 4,033,017 ------- ------- 4,033,017
Netherlands ------- 7,984,054 ------- 7,984,054
Peru 2,979,372 ------- ------- 2,979,372
Russia ------- 4,983,913 ------- 4,983,913
Singapore ------- 2,283,878 ------- 2,283,878
South Africa ------- 3,965,087 ------- 3,965,087
South Korea ------- 8,357,939 ------- 8,357,939
Spain ------- 6,037,130 ------- 6,037,130
Sweden ------- 5,545,927 ------- 5,545,927
Switzerland ------- 4,697,025 ------- 4,697,025
Taiwan 3,543,300 772,682 ------- 4,315,982
Thailand ------- 6,509,093 ------- 6,509,093
Turkey ------- 1,047,466 ------- 1,047,466
United Kingdom ------- 21,839,407 ------- 21,839,407
Total Common Stocks $29,104,497 $172,325,763 $------- $201,430,260
Preferred Stock
Brazil $4,560,256 $------- $------- $4,560,256
Total Preferred Stock $4,560,256 $------- $------- $4,560,256
Total Investments $33,664,753 $172,325,763 $------- $205,990,516
For more information on valuation inputs, please refer to Note 1 (A) of the accompanying Notesto Financial Statements.
The accompanying notes are an integral part of these financial statements
18 www.thomaswhitefunds.com

Investment Portfolio October 31, 2018
The Fund’s assets assigned to Level 2 include certain foreign securities for which a third partystatistical pricing service may be employed for purposes of fair market valuation. There were notransfers into or out of Level 3 during the reporting period, as compared to their classificationfrom the prior annual report.
The accompanying notes are an integral part of these financial statements
www.thomaswhitefunds.com 19

THOMAS WHITE EMERGING MARKETS FUND
Unaudited
SalesCharge
DeferredSales
Charge
AdministrativeServices
Fee 12b-1 FeesOperating
Expenses1,3
ProspectusGrossAnnual
OperatingExpense2
ProspectusNet AnnualOperatingExpense2,3
InvestorClass None None Up to 0.25% None 1.34% 1.49% 1.35%
Class I None None None None 1.09% 1.42% 1.10%
1 In the absence of the fee deferral/expense reimbursement arrangement for the Emerging Markets Fund, the ratio of expenses toaverage net assets would have been 1.54% for Investor Class shares and 1.51% for Class I shares.2 Gross Annual Operating Expense and Net Annual Operating Expense are based on the most recent prospectus and may differfrom other expense ratios appearing in this report.3 Thomas White International, Ltd. (“Advisor”) has agreed to defer its fees and/or reimburse the Fund to the extent that theoperating expenses for Investor Class and Class I shares exceed (as a percentage of average daily net assets) 1.34% and1.09%, respectively. The fee deferral/expense reimbursement agreement expires February 28, 2019. The Fund has agreed torepay the Advisor for amounts deferred or reimbursed by the Advisor pursuant to the agreement provided that such repaymentdoes not cause the Fund to exceed the above limits and the repayment is made within three years after the year in which theAdvisor incurred the expense. The fee deferral/expense reimbursement agreement may only be amended or terminated by theFund’s Board of Trustees.
NAV Net Assets Redemption Fee Portfolio Turnover
Investor Class $9.87 $1.7 million 2.00%on shares held
less than 60 days
34%
Class I $9.97 $31.9 million
20 www.thomaswhitefunds.com

OCTOBER 31, 2018
Average Annual Returns as of October 31, 2018 (Unaudited)
Class Sales Charge 6 monthCalendar
YTD 1 Yr 3 Yrs 5 Yrs
SinceInception
(6/28/2010)*
Investor Class shares (TWEMX) None -15.69% -14.98% -11.59% 2.63% -2.30% 1.03%
Class I shares1 (TWIIX) None -15.56% -14.77% -11.33% 2.88% -2.04% 1.21%
MSCI Emerging Markets Index2 N/A -16.53% -15.72% -12.52% 6.52% 0.78% 2.51%
* The inception date of the Investor Class shares.1 Performance figures for Class I shares, first offered on August 31, 2012, include the historical performance of Investor Classshares through August 30, 2012.2 The MSCI Emerging Markets Index is a free float-adjusted market capitalization index that is designed to measure equity marketperformance of emerging markets. The index is unmanaged and returns assume the reinvestment of dividends. It is not possibleto invest directly in an index.
Returns of each share class reflect differences in expenses applicable to each class which are primarilydifferences in service fees.
The returns do not reflect the deduction of taxes that a shareholder would pay on Fund distributions or theredemption of Fund shares. The returns reflect the actual performance for each period and do not include theimpacts of trades executed on the last business day of the period that were recorded on the first business dayof the next period.
Performance data is based upon past performance, which is no guarantee of future results. The investmentreturn and principal value of an investment will fluctuate so that an investor’s shares, when redeemed, may beworth more or less than their original cost. Current performance may be higher or lower than the performancedata quoted. Please call 1-800-811-0535 to obtain performance data as of the most recent month-end. TheFund imposes a 2% redemption fee on shares held less than 60 days. Performance data does not reflect theredemption fee. If reflected, total returns would be lower. Investment performance reflects any fee waivers thatwere in effect. In the absence of such waivers, total return would have been reduced. The Gross ExpenseRatios, based on the most recent prospectus, are 1.49% (Investor Class) and 1.42% (Class I).
www.thomaswhitefunds.com 21

THOMAS WHITE EMERGING MARKETS FUND
GROWTH OF A $10,000 INVESTMENT WITH DIVIDENDS REINVESTED (Unaudited)
$20
$15
Thomas White Emerging Markets Fund - Investor Class
VA
LU
E (
IN T
HO
US
AN
DS
)
$10
$5
$0All data calculated from 06/28/10.
06/10 10/1810/13 10/14 10/15 10/16 10/1710/1110/10 10/12
MSCI Emerging Markets Index
$10,892
$12,295
This chart illustrates the performance of a hypothetical $10,000 investment made in the Fund’sInvestor Class shares and its benchmark, the MSCI Emerging Markets Index, since inception onJune 28, 2010 through October 31, 2018. It assumes reinvestment of dividends and capital gains, butdoes not reflect the effect of any applicable redemption fees. This chart does not imply futureperformance. Past performance does not guarantee future results. The cumulative return sinceinception was 8.92% for the Fund’s Investor Class shares and 22.95% for the benchmark. The Fund’sInvestor Class shares average annual total return since inception on June 28, 2010 was 1.03%. TheMSCI Emerging Markets Index is a free float-adjusted market capitalization index that is designed tomeasure equity market performance of emerging markets. The index is unmanaged and returnsassume the reinvestment of dividends. It is not possible to invest directly in an index. During theperiods shown, the Fund’s manager reimbursed certain Fund expenses. Absent this reimbursement,performance would have been lower. Performance will vary from class to class based on differences inclass-specific expenses.
22 www.thomaswhitefunds.com

OCTOBER 31, 2018
The Thomas White Emerging MarketsFund invests primarily in securities ofcompanies located in or whosebusinesses are closely associated withthe world’s emerging markets countries.
Portfolio Managers
Jinwen Zhang, Ph.D., CFADouglas M. Jackman, CFAWei Li, Ph.D., CFAJohn Wu, Ph.D., CFARex Mathew, CFA, CMARamkumar Venkatramani, CFA
Performance Review
During the one-year period endedOctober 31, 2018, the Thomas WhiteEmerging Markets Fund Class I sharesreturned -11.33%, compared to -12.52% forthe benchmark MSCI Emerging MarketsIndex. Since its inception on June 28, 2010,the Fund’s Class I shares have returned+1.21%* annualized, against +2.51% for thebenchmark index.
Trade Related Headwinds RestrictEmerging Markets
After the strong gains in 2017, emergingmarket equities corrected as investorsbecame concerned about the impact ofcontinuing trade disputes between the U.S.and the rest of the world. Though aggregategrowth rates in most emerging economiesremain relatively stable, some of them couldsee a slowdown if U.S. import tariffs areincreased further. Valuations of severalemerging market companies that derivesubstantial revenues from exports have
declined this year, after their managementsbecame more cautious about new orderinflows.
Expectations of further rate increases by theU.S. Federal Reserve also made investorsless keen on emerging market assets thisyear. Faster U.S. economic growth duringthe second and third quarters of 2018increased the possibility of higher rates andkept the U.S. Dollar stronger relative to othercurrencies. Though U.S. rate hikeexpectations have declined more recently,investors remain cautious about the prospectsof relatively higher external debt.
Higher political risks in Turkey and Russiaalso weakened emerging market investorsentiment during the review period. On thepositive side, the leadership change in Brazilhas encouraged investors. The risk ofexpensive fuel prices hurting growth inimporting countries such as China, India andIndonesia also unnerved investors earlier thisyear, but has eased in recent months as crudeoil prices moderated.
Portfolio Review
Energy was the best performing sector forthe Fund as crude oil prices remained highfor most of the review period. Despite thedecline in prices of select commodities suchas copper, costlier iron ore and highercement demand in several large countrieshelped the materials sector. Wider netinterest margins and fading concerns aboutloan losses boosted the financials sectorduring the review period. The technologysector was hurt by concerns about slowingdemand growth for ecommerce, online
* Performance for Class I shares includes the historical performance of Investor Class shares through August 30, 2012.
www.thomaswhitefunds.com 23

THOMAS WHITE EMERGING MARKETS FUND
services and semiconductors, after theaccelerated expansion in recent years. Theconsumer discretionary sector was negativelyaffected by doubts about the demand outlookfor durables and services. The industrialssector also underperformed as global demandfor capital goods and components remainedbelow expectations.
The Fund’s energy holdings contributed themost to returns for the period on higher crudeoil prices when compared to recent years.These companies have seen much highermargins and appear better placed to reduceleverage and increase dividend payouts.Stocks that gained include Brazilianintegrated energy group Petrobras, Russianoil producer Lukoil and Thai energy groupPTT Exploration and Production. Vale,the world’s largest iron ore miner, based inBrazil, benefited from strong Chinesedemand for higher quality iron ore. B3,which operates equity and derivativesexchanges in Brazil, outperformed astransaction volumes have increasedsubstantially in recent months.
Select Fund holdings in the Asianecommerce and online services industriesdetracted from returns for the period. Thoughthese companies continue to report strongearnings expansion, investors have becomeless hopeful of the strong growth pacecontinuing in the future. Some of thesecompanies have become very large and theywill have to aggressively expand into newgeographies and market segments to sustaingrowth. The stocks that underperformedincluded Asian ecommerce leader Alibabaand Tencent, which provides online gamingand instant communication services. SouthAfrican holding company Naspers, which is
the largest shareholder of Tencent, alsodeclined. Doubts about future demand formemory chips as well as chipsets used insmartphones negatively affected SamsungElectronics. Brilliance China Automotiveunderperformed after its partner BMWdecided to acquire majority control of thejoint venture for nearly $4 billion.
Inexpensive Emerging Markets May OfferAttractive Risk-Reward Opportunities
This year’s underperformance has pusheddown emerging market equity valuations tomulti-year lows. For some countries andsectors within the emerging market universe,valuations are nearing their lows seen duringthe 2008 financial crisis. However, mostemerging market corporations appear to be inmuch better financial health than they wereduring the global recession. The risks facedby these businesses, both domestic andexternal, are also generally lower. Thoughearnings and cash flows in select marketsand industries have fallen short of forecaststhis year, they continue to expand at amoderate pace. That is in stark contrast to2008 when earnings declined sharply and therecovery required large scale fiscal stimulusmeasures.
The ongoing trade related frictions betweenthe U.S. and the rest of the world havecreated a lot of volatility in global equitymarkets, especially in emerging markets.Some of the major areas of dispute betweenthe U.S. and China, such as better protectionof intellectual property rights, could takeseveral years to resolve. However, there areother areas that could be addressed withinshorter time frames. This includes increasedsourcing of farm produce and industrial
24 www.thomaswhitefunds.com

OCTOBER 31, 2018
equipment from the U.S. as well as improvedmarket access for foreign companies inChina. The relatively controlled responsefrom China to heightened U.S. rhetoric andthe flexibility shown by the U.S.administration in renegotiating the NorthAmerican Free Trade Agreement (NAFTA)suggests that it is possible to arrive at a dealthat will avoid further tariffs and controls.
While it is true that leverage has gone upappreciably in emerging economies over thelast decade, in most major economies,including China, much of the debt is in localcurrency. This reduces the vulnerability toexternal shocks and the impact of higherrates in the developed countries. Thegovernments in emerging economies havealso been more proactive in limiting theircurrent and fiscal deficits. When faced withmarket volatility, they have not shied away
from taking the required steps to stabilizetheir currencies. Rate hikes and control ofpublic spending by Indonesia is a goodrecent example.
Most governments in emerging countries are
friendly to business, and their policies are
largely supportive of faster economic
growth. The new government in Brazil is
expected to push much-needed reform
measures. In Mexico, the government is
likely to be more realistic than suggested by
the recent rhetoric that has spooked
investors. Even if India and Indonesia see
leadership changes after next year’s national
elections, the broader economic policy
approaches are unlikely to change.
We thank you for investing in the ThomasWhite Emerging Markets Fund.
www.thomaswhitefunds.com 25

THOMAS WHITE EMERGING MARKETS FUND
Portfolio Country and Industry Allocation as of October 31, 2018 (Unaudited)
Country Allocation % of TNA
Brazil 13.0%
China 29.2%
Hong Kong 1.9%
India 9.7%
Indonesia 2.4%
Malaysia 1.3%
Mexico 4.0%
Peru 1.1%
Philippines 0.9%
Poland 0.7%
Russia 5.2%
South Africa 3.9%
South Korea 12.7%
Taiwan 8.8%
Thailand 3.2%
Turkey 0.6%
Cash & Other 1.4%
Industry Allocation % of TNA
Automobiles & Components 2.5%
Banks 20.4%
Capital Goods 2.2%
Consumer Durables & Apparel 2.7%
Diversified Financials 3.6%
Energy 12.4%
Food, Beverage & Tobacco 0.7%
Household & Personal Products 2.2%
Insurance 2.3%
Materials 10.6%
Media & Entertainment 11.8%
Real Estate 1.4%
Retailing 5.7%
Semiconductors & Semiconductor Equipment 11.0%
Software & Services 1.5%
Technology Hardware & Equipment 2.9%
Telecommunication Services 0.5%
Transportation 4.2%
Cash & Other 1.4%
TNA - Total Net Assets
Fund holdings and industry allocations are subject to change and should not beconsidered a recommendation to buy or sell any securities. For a complete list of Fundholdings, please refer to the Investment Portfolio section of this report.
26 www.thomaswhitefunds.com

Investment Portfolio October 31, 2018
Country Issue Industry Shares Value (US$)
COMMONSTOCKS (90.1%)
BRAZIL (5.7%)B3 SA - Brasil Bolsa Balcao Diversified Financials 78,500 $ 562,989Hypera SA Household & Personal
Products 36,900 293,197Vale SA Materials 69,122 1,045,699
1,901,885
CHINA (29.2%)Alibaba Group Holding Ltd. - ADR * Retailing 11,125 1,582,865Anhui Conch Cement Company Limited - HShares + Materials 138,900 714,191Baidu, Inc. - ADR * Media & Entertainment 2,475 470,398China Construction Bank Corp. - H Shares + Banks 1,053,000 832,738China Overseas Land & Investment Limited + Real Estate 146,000 456,194China Petroleum and Chemical Corporation(Sinopec) - H Shares + Energy 656,000 530,481Ctrip.com International, Ltd. - ADR * Retailing 9,800 326,144Haier Electronics Group Co., Ltd. + Consumer Durables &
Apparel 119,000 247,986Kweichow Moutai Co., Ltd. - A Shares + Food, Beverage &
Tobacco 2,800 221,447Midea Group Co., Ltd. - A Shares + Consumer Durables &
Apparel 33,000 175,410Momo Inc. - ADR * Media & Entertainment 12,600 422,982NetEase, Inc. - ADR Media & Entertainment 2,315 481,173Ping An Insurance (Group) Company of ChinaLimited - H Shares + Insurance 80,200 759,010Shanghai International Airport Co., Ltd. - AShares + Transportation 37,000 263,675SINA Corporation * Media & Entertainment 4,300 272,233Tencent Holdings Limited + Media & Entertainment 45,400 1,538,835ZTO Express (Cayman) Inc. - ADR # Transportation 30,600 496,332
9,792,094
HONG KONG (1.9%)Brilliance China Automotive Holdings Ltd. + Automobiles &
Components 188,000 165,234Shenzhou International Group Holdings Ltd. + Consumer Durables &
Apparel 44,000 484,723
649,957
INDIA (9.7%)Cholamandalam Investment and FinanceCompany Limited + Diversified Financials 20,100 346,618Eicher Motors Ltd. + Capital Goods 800 237,514Exide Industries Ltd. + Automobiles &
Components 94,300 340,503HDFC Bank Ltd. - ADR Banks 4,800 426,768Larsen & Toubro Ltd + Capital Goods 18,200 319,947Mahindra & Mahindra Ltd. - GDR + Automobiles &
Components 33,698 348,613
The accompanying notes are an integral part of these financial statements
www.thomaswhitefunds.com 27

Thomas White Emerging Markets Fund
Country Issue Industry Shares Value (US$)
INDIA (CONT.)Reliance Industries Ltd. + Energy 36,900 $524,303WNS (Holdings) Ltd. - ADR * Software & Services 9,900 496,881YES BANK Limited + Banks 78,400 199,488
3,240,635
INDONESIA (2.4%)PT Bank Negara Indonesia (Persero) Tbk + Banks 772,800 374,535PT United Tractors Tbk + Energy 189,400 417,893
792,428
MALAYSIA (1.3%)CIMB Group Holdings Berhad + Banks 312,800 427,973
MEXICO (4.0%)Cemex SAB de CV * Materials 534,720 267,975Grupo Aeroportuario del Sureste SAB de CV -Class B Transportation 21,300 351,389Grupo Financiero Banorte, S.A.B. de C.V. -Class O Banks 129,100 711,748
1,331,112
PERU (1.1%)Credicorp Ltd. Banks 1,700 383,707
PHILIPPINES (0.9%)Metropolitan Bank & Trust Company + Banks 253,972 311,535
POLAND (0.7%)KGHM Polska Miedz S.A. * + Materials 10,600 239,965
RUSSIA (5.2%)LUKOIL PJSC - ADR + Energy 14,700 1,097,643Sberbank of Russia PJSC - ADR + Banks 56,075 659,124
1,756,767
SOUTH AFRICA (3.9%)Absa Group Limited + Banks 24,500 247,027FirstRand Limited + Diversified Financials 71,000 308,643Naspers Limited - N Shares + Media & Entertainment 4,350 761,926
1,317,596
SOUTH KOREA (11.5%)KB Financial Group Inc. + Banks 10,550 438,974Korea Zinc Co Ltd + Materials 1,075 358,849LG Chem Ltd. + Materials 875 267,628LG Household & Health Care Ltd. + Household & Personal
Products 490 451,079POSCO + Materials 1,425 321,477Samsung Electronics Co., Ltd. + Semiconductors &
SemiconductorEquipment 39,950 1,494,115
Shinhan Financial Group Co., Ltd. + Banks 14,025 521,265
3,853,387
The accompanying notes are an integral part of these financial statements
28 www.thomaswhitefunds.com

Investment Portfolio October 31, 2018
Country Issue Industry Shares Value (US$)
TAIWAN (8.8%)Airtac International Group + Capital Goods 21,000 $183,332Catcher Technology Co., Ltd + Technology
Hardware & Equipment 33,000 335,641Largan Precision Company Limited + Technology
Hardware & Equipment 3,000 325,739Pegatron Corporation + Technology
Hardware & Equipment 170,000 307,338Taiwan Semiconductor Manufacturing Company,Ltd. +
Semiconductors &SemiconductorEquipment 240,700 1,788,313
2,940,363
THAILAND (3.2%)Airports of Thailand Public Company Ltd. + Transportation 162,400 314,293Kasikornbank Public Company Limited + Banks 48,400 291,781PTT Exploration and Production Public CompanyLimited + Energy 108,100 456,546
1,062,620
TURKEY (0.6%)Turkcell Iletisim Hizmetleri AS + Telecommunication
Services 91,600 186,660
Total CommonStocks (Cost $27,042,572) 30,188,684
PREFERREDSTOCKS (8.5%)
BRAZIL (7.3%)Banco Bradesco S.A. (2/1/19, N/A) ^ Banks 33,000 302,378Gerdau S.A. (2/28/19, 1.72%) ^ Materials 75,900 329,787Itau Unibanco Holding S.A. (2/5/19, 0.35%) ^ Banks 53,949 712,362Petroleo Brasileiro SA Petrobras (3/15/19, N/A) ^ Energy 151,600 1,124,728
2,469,255
SOUTH KOREA (1.2%)Samsung Electronics Co., Ltd. (1/9/19, 4.06%) ^ + Semiconductors &
SemiconductorEquipment 12,500 393,900
Total PreferredStocks (Cost $2,415,364) 2,863,155
SHORT TERMINVESTMENT (1.4%)
MONEY MARKET FUND (1.4%)Northern Institutional Treasury Portfolio, 2.04% (a) 462,129 462,129
Total Short TermInvestment (Cost $462,129) 462,129
Total Investments 100.0% (Cost $29,920,065) $33,513,968Liabilities inexcess of otherassets (0.0)% (2,242)Total Net Assets: 100.0% $33,511,726
The accompanying notes are an integral part of these financial statements
www.thomaswhitefunds.com 29

Thomas White Emerging Markets Fund
* Non-Income Producing Securities
# All or a portion of securities on loan at October 31, 2018. The market value of the securities loaned was $157,334. Theloaned securities were secured with non-cash collateral with a value of $152,102. The non-cash collateral received consistsof short term investments and long term bonds, and is held for the benefit of the Fund at the Fund’s custodian. The Fundcannot repledge or resell this collateral. Collateral is calculated based on prior day’s prices. - See Note 1(I) to FinancialStatements
^ Maturity Date and Preferred Dividend Rate of Preferred Stock
+ Fair Valued Security
(a) 7-day yield
ADR - American Depositary Receipt
GDR - Global Depositary Receipt
Industry classifications shown in the Investment Portfolio are based off of the Global Industry ClassificationStandard (GICS®). GICS was developed by and/or is the exclusive property of MSCI, Inc. and Standard &Poor’s Financial Services LLC (“S&P”). GICS is a service mark of MSCI and S&P and has been licensed foruse by U.S. Bancorp Fund Services, LLC.
The accompanying notes are an integral part of these financial statements
30 www.thomaswhitefunds.com

Investment Portfolio October 31, 2018
The following table summarizes the inputs used, as of October 31, 2018, in valuating the Fund’sassets:
Level 1 Level 2 Level 3 Total
Common Stocks
Brazil $1,901,885 $------- $------- $1,901,885
China 4,052,127 5,739,967 ------- 9,792,094
Hong Kong ------- 649,957 ------- 649,957
India 923,649 2,316,986 ------- 3,240,635
Indonesia ------- 792,428 ------- 792,428
Malaysia ------- 427,973 ------- 427,973
Mexico 1,331,112 ------- ------- 1,331,112
Peru 383,707 ------- ------- 383,707
Philippines ------- 311,535 ------- 311,535
Poland ------- 239,965 ------- 239,965
Russia ------- 1,756,767 ------- 1,756,767
South Africa ------- 1,317,596 ------- 1,317,596
South Korea ------- 3,853,387 ------- 3,853,387
Taiwan ------- 2,940,363 ------- 2,940,363
Thailand ------- 1,062,620 ------- 1,062,620
Turkey ------- 186,660 ------- 186,660
Total Common Stocks $8,592,480 $21,596,204 $------- $30,188,684
Preferred Stocks
Brazil $2,469,255 $------- $------- $2,469,255
South Korea ------- 393,900 ------- 393,900
Total Preferred Stocks $2,469,255 $393,900 $------- $2,863,155
Short Term Investment $462,129 $------- $------- $462,129
Total Investments $11,523,864 $21,990,104 $------- $33,513,968
For more information on valuation inputs, please refer to Note 1 (A) of the accompanying Notesto Financial Statements.
The Fund’s assets assigned to Level 2 include certain foreign securities for which a third partystatistical pricing service may be employed for purposes of fair market valuation. There were notransfers into or out of Level 3 during the reporting period, as compared to their classificationfrom the prior annual report.
The accompanying notes are an integral part of these financial statements
www.thomaswhitefunds.com 31

THOMAS WHITE AMERICAN OPPORTUNITIES FUND
Unaudited
SalesCharge
DeferredSales
Charge
AdministrativeServices
Fee 12b-1 FeesOperating
Expenses1,3
ProspectusGrossAnnual
OperatingExpense2
ProspectusNet AnnualOperatingExpense2,3
InvestorClass None None Up to 0.25% None 1.34% 1.19% 1.19%
1 In the absence of the fee deferral/expense reimbursement arrangement for the American Opportunities Fund, the ratio ofexpenses to average net assets would have been 1.43% for Investor Class shares.2 Gross Annual Operating Expense and Net Annual Operating Expense are based on the most recent prospectus and may differfrom other expense ratios appearing in this report.3 Thomas White International, Ltd. (“Advisor”) has agreed to defer its fees and/or reimburse the Fund to the extent that theoperating expenses for Investor Class shares exceed 1.34% of its average daily net assets. The fee deferral/expensereimbursement agreement expires February 28, 2019. The Fund has agreed to repay the Advisor for amounts deferred orreimbursed by the Advisor pursuant to the agreement provided that such repayment does not cause the Fund to exceed theabove limits and the repayment is made within three years after the year in which the Advisor incurred the expense. The feedeferral/expense reimbursement agreement may only be amended or terminated by the Fund’s Board of Trustees.
NAV Net Assets Redemption Fee Portfolio Turnover
Investor Class $15.81 $41.0 million 2.00%on shares held
less than 60 days21%
32 www.thomaswhitefunds.com

OCTOBER 31, 2018
Average Annual Returns as of October 31, 2018 (Unaudited)
Class 6 monthCalendar
YTD 1 Yr 3 Yrs 5 Yrs 10 Yrs
SinceInception(3/4/1999)
Investor Class shares (TWAOX) -1.29% -3.70% 0.50% 5.82% 7.84% 10.76% 7.74%
Russell Midcap Index1 -0.86% -1.47% 2.79% 9.04% 8.97% 14.19% 9.21%
S&P 500 Index1 3.40% 3.01% 7.35% 11.52% 11.34% 13.24% 6.03%
1 The Russell Midcap Index measures the performance of the 800 smallest companies in the Russell 1000 Index. Theserepresent approximately 31% of the total market capitalization of the Russell 1000 Index. The S&P 500 Index measures theperformance of 500 leading companies in leading industries of the U.S. economy, capturing 80% coverage of U.S. equities. Bothindices are unmanaged and returns assume the reinvestment of dividends. It is not possible to invest directly in an index.
The returns do not reflect the deduction of taxes that a shareholder would pay on Fund distributions or theredemption of Fund shares. The returns reflect the actual performance for each period and do not include theimpacts of trades executed on the last business day of the period that were recorded on the first business dayof the next period.
Performance data is based upon past performance, which is no guarantee of future results. The investmentreturn and principal value of an investment will fluctuate so that an investor’s shares, when redeemed, may beworth more or less than their original cost. Current performance may be higher or lower than the performancedata quoted. Please call 1-800-811-0535 to obtain performance data as of the most recent month-end. TheFund imposes a 2% redemption fee on shares held less than 60 days. Performance data does not reflect theredemption fee. If reflected, total returns would be lower. Investment performance reflects any fee waivers thatwere in effect. In the absence of such waivers, total return would have been reduced. The Investor ClassGross Expense Ratio, based on the most recent prospectus, is 1.19%.
www.thomaswhitefunds.com 33

THOMAS WHITE AMERICAN OPPORTUNITIES FUND
GROWTH OF A $10,000 INVESTMENT WITH DIVIDENDS REINVESTED (Unaudited)
$50
$40
$30
Thomas White American Opportunities Fund - Investor Class
VA
LU
E (
IN T
HO
US
AN
DS
)
$20
$10
$0All data calculated from 10/31/08.
10/08 10/09 10/10 10/11 10/12 10/13 10/14 10/1710/15 10/16 10/18
Russell Midcap Index $37,708$34,668
$27,782
S&P 500 Index
This chart illustrates the performance of a hypothetical $10,000 investment made in the Fund’sInvestor Class shares, its primary benchmark, the Russell Midcap Index, and its secondary benchmark,the S&P 500 Index, for the past 10 years through October 31, 2018. It assumes reinvestment ofdividends and capital gains, but does not reflect the effect of any applicable redemption fees. This chartdoes not imply future performance. Past performance does not guarantee future results. Thecumulative ten year return was 177.82% for the Fund’s Investor Class shares, 277.08% for the primarybenchmark, and 246.68% for the secondary benchmark. The Fund’s Investor Class shares averageannual total return since inception on March 4, 1999 was 7.74%. The Russell Midcap Index measuresthe performance of the 800 smallest companies in the Russell 1000 Index. These representapproximately 31% of the total market capitalization of the Russell 1000 Index. The S&P 500 Indexmeasures the performance of 500 leading companies in leading industries of the U.S. economy,capturing 80% coverage of U.S. equities. Both indices are unmanaged and returns assume thereinvestment of dividends. It is not possible to invest directly in an index. During the periods shown, theFund’s manager reimbursed certain Fund expenses. Absent this reimbursement, performance wouldhave been lower.
34 www.thomaswhitefunds.com

OCTOBER 31, 2018
The Thomas White AmericanOpportunities Fund primarily invests inequity securities of mid-size U.S.companies. The Fund may also invest inequity securities of smaller and largersize U.S. companies.
Portfolio Managers
Jinwen Zhang, Ph.D., CFADouglas M. Jackman, CFAWei Li, Ph.D., CFAJohn Wu, Ph.D., CFARex Mathew, CFA, CMARamkumar Venkatramani, CFA
Performance Review
The Thomas White American OpportunitiesFund Investor Class shares returned +0.50%during the one-year period ended October 31,2018 while the Fund’s primary benchmark,the Russell Midcap Index, returned +2.79%and the secondary benchmark S&P 500 Indexreturned +7.35% during the same period.Since its inception on March 4, 1999, theFund’s Investor Class shares annualizedreturns are +7.74%, compared to +9.21% forthe Russell Midcap Index and +6.03% for theS&P 500 Index for the period.
Doubts About Earnings Growth Outlookand Interest Rates Trigger Correction
U.S. equities saw moderate gains during thefirst half of the one-year review period andoutperformed most other developed marketsas well as emerging markets for most of theperiod. The domestic economy acceleratedand the annualized growth rate exceeded 4%during the second quarter. Corporateearnings in the U.S. saw a meaningful jumpwhen compared to the previous period, partly
helped by the tax cuts implemented at thebeginning of this year. Consumers remainedvery optimistic through most of the period asthe economy continued to create new jobsand household incomes expanded. The onlymajor weak spot was the moderation in thehousing market, a result of more expensivehomes and higher mortgage interest rates.
However, as trade tensions escalated, the fallin trade volumes led to downward revisionsto global growth for this year as well 2019.Consequently, some of the larger U.S.corporations that draw a large share ofrevenues from overseas markets havebecome more cautious about their revenueand earnings outlook. Investors are worriedabout the impact of higher interest rates onthe domestic economy if the Federal Reservedecides to trim its balance sheet sooner thancurrently expected. There are also reneweddoubts about the expected federal spendingon infrastructure, as the mid-term electionsreduced the likelihood of gainingCongressional approval for such measures orrenegotiated multi-lateral trade deals. Theseapprehensions made investors more cautiousduring the last three months of the reviewperiod and equity prices saw a meaningfulcorrection.
Portfolio Review
Despite the correction during the last quarterof the review period, technology holdingsoutperformed significantly as mostcompanies in the sector continued to seerobust earnings growth. The healthcaresector received renewed investor interest,after underperforming in previous periods, assome of the concerns about pricing andregulatory risks eased. Consumer staples
www.thomaswhitefunds.com 35

THOMAS WHITE AMERICAN OPPORTUNITIES FUND
holdings also outperformed as the largercompanies within the sector are seeing bettermargins and cash flows. The materials andindustrials sectors underperformed as pricesof industrial commodities corrected this year,and demand for capital goods andcomponents has remained tepid. Despitestrong reported earnings growth, thefinancials sector also lagged as the Fed’sinterest rate policy path remains uncertain.
NetApp, a provider of storage and datamanagement solutions, contributed the mostto Fund returns as demand for its servicessaw strong growth. Discount apparel retailerRoss Stores was helped by healthy revenueand earnings growth through the year. Betterthan expected earnings also helped businessand financial management software servicesprovider Intuit. Keurig Dr. Pepper, amanufacturer of coffee and non-alcoholicbeverages, advanced on expectations ofsustained earnings growth. Oil refinerAndeavor, acquired by Marathon Petroleum,also outperformed during the review period.
Natural gas producer EQT detracted themost from Fund returns during the periodafter it reduced volume guidance andincreased capital outlays. However, EQT isexpected to extract meaningful efficiencygains from its recently completedacquisitions. Thor Industries, amanufacturer of recreational vehicles,declined as earnings fell short ofexpectations on softer demand. Cruise lineoperator Royal Caribbean was hurt byconcerns about slower demand growth inAsia, though it continues to see stable pricingin the North American market. Owens-Illinois, a manufacturer of glass packagingproducts, was negatively affected by lower
earnings guidance for the current year. Auto-parts supplier BorgWarner underperformedas tariffs on cars could restrict volumegrowth.
Wage Growth May Determine Fed PolicyPath
We believe the biggest uncertainty facingfinancial markets in 2019 is the U.S. FederalReserve’s monetary policy stance. As theU.S. economy accelerated this year, theFed’s interest rate guidance built in more ratehikes in 2019 and beyond. Though inflationrisks remained under control, the Fedcontinued to assess the economic growthoutlook as robust. This implied that the Fed’starget rate is not yet near neutral, the levelwhich neither bolsters nor restrains economicactivity. After continuing trade tensionsweakened the global growth outlook,consensus views of U.S. growth expectationsfor next year have also softened. Recentstatements from Fed officials also appearedto acknowledge this assessment, and marketsnow expect fewer rate hikes in 2019 and anextended pause after that.
Leaving aside the housing slowdown, whichis not unexpected, there are not many datapoints that suggest an imminent decline inU.S. economic activity. Surveys indicaterobust manufacturing and services sectorgrowth continuing in the U.S. throughNovember, while the rest of the worldshowed trade-induced weakness. Labormarkets have strengthened further, withsurprisingly high monthly job additionnumbers this late in the economic cycle.Consumer sentiment remains healthy and therecent fall in fuel prices should provide aboost in the coming months. Nevertheless,
36 www.thomaswhitefunds.com

OCTOBER 31, 2018
from the high base set in 2018, U.S.economic growth rate could moderate in2019 and it is reasonable for the Fed to shiftto a more gradual rate hike path.
What could change this emerging consensusabout Fed policy and make it more hawkish?In our view, the most likely andunderappreciated trigger is an unexpectedspurt in wage inflation. With theunemployment rate at record lows, there islittle slack left in the labor markets. Thepersistently lower labor force participation in
recent years is generally due to structuralreasons that are less likely to reverse quickly.Hence, continued hiring by businesses, newgovernment jobs, tighter immigration policyand border controls, and a moderate increasein fiscal spending could lead to anacceleration in wage growth. Such a scenariomay quickly force the Fed to conclude that itis safer to err on the side of caution andrevert to a more hawkish policy posture.
We thank you for investing in the ThomasWhite American Opportunities Fund.
www.thomaswhitefunds.com 37

THOMAS WHITE AMERICAN OPPORTUNITIES FUND
Portfolio Industry Allocation and Market Capitalization as of October 31, 2018 (Unaudited)
Industry Allocation % of TNA
Automobiles & Components 1.8%
Banks 7.4%
Capital Goods 12.1%
Consumer Durables & Apparel 2.8%
Consumer Services 2.9%
Diversified Financials 4.0%
Energy 5.4%
Food, Beverage & Tobacco 2.3%
Health Care Equipment & Services 7.5%
Insurance 3.0%
Materials 7.3%
Media & Entertainment 1.3%
Pharmaceuticals, Biotechnology &Life Sciences 4.2%
REITs 4.0%
Retailing 3.4%
Semiconductors & SemiconductorEquipment 4.1%
Software & Services 11.9%
Technology Hardware & Equipment 2.2%
Transportation 3.6%
Utilities 7.7%
Cash & Other 1.1%
Portfolio Market Cap Mix % of TNA
Large Cap (over $15.2 billion) 57.8%
Mid Cap ($2.3 - $15.2 billion) 41.1%
Cash & Other 1.1%
TNA - Total Net Assets
Fund holdings and industry allocations are subject to change and should not beconsidered a recommendation to buy or sell any securities. For a complete list of Fundholdings, please refer to the Investment Portfolio section of this report.
38 www.thomaswhitefunds.com

Thomas White American Opportunities Fund
Industry Issue Shares Value
COMMON STOCKS (94.9%)
AUTOMOBILES & COMPONENTS (1.8%)BorgWarner, Inc. 12,000 $ 472,920Thor Industries, Inc. 3,775 262,891
735,811
BANKS (7.4%)Citizens Financial Group, Inc. 15,100 563,985Comerica Incorporated 9,250 754,430Fifth Third Bancorp 13,600 367,064Regions Financial Corporation 37,100 629,587Zions Bancorporation, N.A. 14,900 701,045
3,016,111
CAPITAL GOODS (12.1%)Carlisle Companies Incorporated 3,530 340,963Cummins Inc. 2,600 355,394Huntington Ingalls Industries, Inc. 4,140 904,507Ingersoll-Rand PLC ^ 5,000 479,700The Middleby Corporation * 3,400 381,820Parker-Hannifin Corporation 2,550 386,656Sensata Technologies Holding plc * ^ 15,704 736,518Snap-on Incorporated 4,350 669,639Spirit AeroSystems Holdings, Inc. -Class A 8,250 693,083
4,948,280
CONSUMER DURABLES & APPAREL (2.8%)Lennar Corporation - Class A 8,250 354,585NVR, Inc. * 165 369,440Polaris Industries Inc. 4,900 436,002
1,160,027
CONSUMER SERVICES (2.9%)Aramark 11,987 430,573Royal Caribbean Cruises Ltd. ^ 7,400 775,002
1,205,575
DIVERSIFIED FINANCIALS (4.0%)Ameriprise Financial, Inc. 3,500 445,340Intercontinental Exchange, Inc. 6,500 500,760Voya Financial, Inc. 15,500 678,280
1,624,380
ENERGY (5.4%)CNX Resources Corporation * 21,600 338,040EQT Corporation 9,400 319,318Marathon Petroleum Corporation 12,054 849,204Noble Energy, Inc. 15,800 392,630TechnipFMC plc ^ 11,247 295,796
2,194,988
The accompanying notes are an integral part of these financial statements
www.thomaswhitefunds.com 39

Investment Portfolio October 31, 2018
Industry Issue Shares Value
FOOD, BEVERAGE & TOBACCO (2.3%)The Hershey Company 5,000 $535,750Molson Coors Brewing Company -Class B 6,600 422,400
958,150
HEALTH CARE EQUIPMENT & SERVICES (7.5%)Boston Scientific Corporation * 19,230 694,972Centene Corporation * 4,600 599,472Hill-Rom Holdings, Inc. 5,290 444,783Laboratory Corporation of AmericaHoldings * 5,120 822,016Zimmer Biomet Holdings, Inc. 4,600 522,514
3,083,757
INSURANCE (3.0%)Assurant, Inc. 4,600 447,166Everest Re Group, Ltd. ^ 1,700 370,362The Hartford Financial Services Group,Inc. 9,300 422,406
1,239,934
MATERIALS (7.3%)AptarGroup, Inc. 4,400 448,624Ball Corporation 14,100 631,680Martin Marietta Materials, Inc. 2,900 496,712PPG Industries, Inc. 6,460 678,881The Sherwin-Williams Company 1,840 723,985
2,979,882
MEDIA & ENTERTAINMENT (1.3%)CBS Corporation - Class B Non-Voting 9,366 537,140
PHARMACEUTICALS, BIOTECHNOLOGY & LIFE SCIENCES (4.2%)Agilent Technologies, Inc. 7,200 466,488Charles River Laboratories International,Inc. * 5,890 717,520Jazz Pharmaceuticals Public LimitedCompany * ^ 3,300 524,106
1,708,114
RETAILING (3.4%)AutoZone, Inc. * 694 509,028Ross Stores, Inc. 9,100 900,900
1,409,928
SEMICONDUCTORS & SEMICONDUCTOR EQUIPMENT (4.1%)Analog Devices, Inc. 4,030 337,351Lam Research Corporation 1,870 265,035Skyworks Solutions, Inc. 6,300 546,588Xilinx, Inc. 6,200 529,294
1,678,268
The accompanying notes are an integral part of these financial statements
40 www.thomaswhitefunds.com

Thomas White American Opportunities Fund
Industry Issue Shares Value
SOFTWARE & SERVICES (11.9%)Alliance Data Systems Corporation 1,400 $288,652CA, Inc. 11,600 514,576Cadence Design Systems, Inc. * 17,900 797,803Check Point Software TechnologiesLtd. * ^ 7,170 795,870Fidelity National Information Services,Inc. 7,800 811,980FleetCor Technologies Inc. * 2,950 590,088Intuit Inc. 5,100 1,076,100
4,875,069
TECHNOLOGY HARDWARE & EQUIPMENT (2.2%)NetApp, Inc. 11,250 883,013
TRANSPORTATION (3.6%)Old Dominion Freight Line, Inc. 8,300 1,082,486Southwest Airlines Co. 8,100 397,710
1,480,196
UTILITIES (7.7%)Alliant Energy Corporation 14,000 601,720Ameren Corporation 11,300 729,754CMS Energy Corporation 13,050 646,236DTE Energy Company 5,200 584,480Xcel Energy, Inc. 12,050 590,571
3,152,761
Total Common Stocks (Cost $30,663,778) 38,871,384
REAL ESTATE INVESTMENT TRUSTS (REITS) (4.0%)
REITS (4.0%)Crown Castle International Corp. 5,650 614,381Digital Realty Trust, Inc. 4,700 485,322Prologis, Inc. 8,400 541,548
1,641,251
Total REITs (Cost $1,539,584) 1,641,251
Total Investments 98.9% (Cost $32,203,362) $40,512,635Other Assets, Less Liabilities 1.1% 456,803
Total Net Assets: 100.0% $40,969,438
* Non-Income Producing Securities
^ Foreign Issued Securities
Industry classifications shown in the Investment Portfolio are based off of the Global Industry ClassificationStandard (GICS®). GICS was developed by and/or is the exclusive property of MSCI, Inc. and Standard &Poor’s Financial Services LLC (“S&P”). GICS is a service mark of MSCI and S&P and has been licensed foruse by U.S. Bancorp Fund Services, LLC.
The accompanying notes are an integral part of these financial statements
www.thomaswhitefunds.com 41

Investment Portfolio October 31, 2018
The following table summarizes the inputs used, as of October 31, 2018, in valuating the Fund’sassets:
Level 1 Level 2 Level 3 Total
Common Stocks
Automobiles & Components $735,811 $------- $------- $735,811
Banks 3,016,111 ------- ------- 3,016,111
Capital Goods 4,948,280 ------- ------- 4,948,280
Consumer Durables & Apparel 1,160,027 ------- ------- 1,160,027
Consumer Services 1,205,575 ------- ------- 1,205,575
Diversified Financials 1,624,380 ------- ------- 1,624,380
Energy 2,194,988 ------- ------- 2,194,988
Food, Beverage & Tobacco 958,150 ------- ------- 958,150
Health Care Equipment & Services 3,083,757 ------- ------- 3,083,757
Insurance 1,239,934 ------- ------- 1,239,934
Materials 2,979,882 ------- ------- 2,979,882
Media & Entertainment 537,140 ------- ------- 537,140
Pharmaceuticals, Biotechnology & Life Sciences 1,708,114 ------- ------- 1,708,114
Retailing 1,409,928 ------- ------- 1,409,928
Semiconductors & Semiconductor Equipment 1,678,268 ------- ------- 1,678,268
Software & Services 4,875,069 ------- ------- 4,875,069
Technology Hardware & Equipment 883,013 ------- ------- 883,013
Transportation 1,480,196 ------- ------- 1,480,196
Utilities 3,152,761 ------- ------- 3,152,761
Total Common Stocks $38,871,384 $------- $------- $38,871,384
Real Estate Investment Trusts (REITs)
REITs $1,641,251 $------- $------- $1,641,251
Total REITs $1,641,251 $------- $------- $1,641,251
Total Investments $40,512,635 $------- $------- $40,512,635
For more information on valuation inputs, please refer to Note 1(A) of the accompanying Notesto Financial Statements.
No transfers in and/or out between Levels 1, 2 or 3 were observed during the reporting period,as compared to their classification from the prior annual report.
The accompanying notes are an integral part of these financial statements
42 www.thomaswhitefunds.com

THOMAS WHITE FUNDS
Statements of Assets and LiabilitiesOctober 31, 2018
InternationalFund
EmergingMarkets
Fund
AmericanOpportunities
Fund
ASSETS:
Investments in securities at market value1,3 $ 205,990,516 $ 33,513,968 $ 40,512,635
Foreign currency2 6 ------- -------
Cash 3,230,194 ------- 454,755
Receivables:
Securities Lending ------- 276 -------
Dividends and interest 299,320 20,971 12,065
Reclaims 1,593,975 12,022 3,975
Fund shares sold 108,280 20,000 -------
Prepaid expenses 29,028 16,275 24,087
Total assets 211,251,319 33,583,512 41,007,517
LIABILITIES:
Management and administrative fees payable 154,282 13,302 4,715
Business management fees payable 26,237 2,783 1,962
Accrued expenses 160,590 55,701 31,402
Payable for fund shares redeemed 258,725 ------- -------
Total liabilities 599,834 71,786 38,079
Net Assets $ 210,651,485 $ 33,511,726 $ 40,969,438
NET ASSETS
Source of Net Assets:
Net capital paid in on shares of beneficial interest $ 203,545,796 $ 38,539,655 $ 32,669,061
Total distributable earnings 7,105,689 (5,027,929) 8,300,377
Net assets $ 210,651,485 $ 33,511,726 $ 40,969,438
The accompanying notes are an integral part of these financial statements.
www.thomaswhitefunds.com 43

THOMAS WHITE FUNDS
Statements of Assets and LiabilitiesOctober 31, 2018
InternationalFund
EmergingMarkets
Fund
AmericanOpportunities
Fund
INVESTOR CLASS SHARES
Net assets $ 29,472,943 $ 1,650,887 $ 40,969,438
Shares outstanding4 2,127,022 167,213 2,590,600
Net asset value and offering price per share $ 13.86 $ 9.87 $ 15.81
CLASS I SHARES
Net assets $ 181,178,542 $ 31,860,839
Shares outstanding4 13,116,474 3,194,854
Net asset value and offering price per share $ 13.81 $ 9.97
1 Cost Basis of Investments:International Fund: $197,334,501Emerging Markets Fund: $29,920,065American Opportunities Fund: $32,203,362
2 Cost Basis of Cash denominated in foreigncurrencies:International Fund: $6Emerging Markets Fund: $0
3 Value of securities out on loan at 10/31/2018:International Fund: $3,964,624Emerging Markets Fund: $157,334
4 There are an unlimited number of $.01 par valueshares of beneficial interest authorized.
The accompanying notes are an integral part of these financial statements.
44 www.thomaswhitefunds.com

THOMAS WHITE FUNDS
Statements of OperationsYear Ended October 31, 2018
InternationalFund
EmergingMarkets
Fund
AmericanOpportunities
Fund
INVESTMENT INCOME
Income:Dividends1 $ 7,272,615 $ 846,026 $ 726,989Interest 6,116 9,696 —Securities lending income (Note 1) 10,806 2,827 —
Total investment income 7,289,537 858,549 726,989Expenses:
Investment management fees (Note 4) 2,443,157 342,088 373,395Business management fees (Note 4) 100,601 14,086 15,375Accounting fees 94,388 21,429 16,981Administration fees
Class I Shares 85,176 15,611 —Investor Class Shares 13,400 818 15,675
Custodian fees 121,124 65,682 10,610Transfer agent fees
Class I Shares 76,731 26,868 —Investor Class Shares 12,060 1,399 17,812
Trustees’ fees and expenses 101,643 13,931 14,083Audit fees and expenses 23,273 20,379 14,550Registration fees
Class I Shares 34,628 35,917 —Investor Class Shares 5,447 1,862 8,246
Printing expensesClass I Shares 50,816 5,981 —Investor Class Shares 7,868 300 6,489
Legal fees and expenses 130,162 17,676 18,373Administrative Service Fee:
Investor Class Shares 64,842 543 105,061Other expenses 93,260 23,880 11,711
Total expenses 3,458,576 608,450 628,361Reimbursement of Class I Expenses (Note 4) (221,555) (84,367) —Reimbursement of Management Fees (Note 4)
Class I Shares (243,870) (74,962) —Investor Class Shares (38,381) (3,875) 37,957
Net expenses 2,954,770 445,246 590,404Net investment income 4,334,767 413,303 136,585
REALIZED AND UNREALIZED GAIN/(LOSS) ON INVESTMENTS
Net realized gain on investments & foreigncurrency transactions 21,287,918 3,213,563 1,298,075Net change in unrealized depreciation oninvestments and foreign currency transactions (54,785,026) (7,169,007) (1,223,886)Net gain (loss) on investments (33,497,108) (3,955,444) 74,189Net increase (decrease) in net assets from operations $ (29,162,341) $ (3,542,141) $ 210,774
1 Net of foreign taxes withheld of:International Fund: $805,542Emerging Markets Fund: $120,467American Opportunities Fund: $949The accompanying notes are an integral part of these financial statements.
www.thomaswhitefunds.com 45

THOMAS WHITE FUNDS
Statements of Changes in Net AssetsInternational Fund
Year EndedOctober 31,
2018
Year EndedOctober 31,
2017
Change in net assets from operations:Net investment income $ 4,334,767 $ 6,323,524
Net realized gain on investments 21,287,918 64,693,543
Net unrealized appreciation / depreciation on investments and foreign currencytransactions (54,785,026) 20,182,751
Net increase (decrease) in net assets from operations (29,162,341) 91,199,818
Distributions:Distributable earnings - Investor Class (3,523,265) (1,290,752)
Distributable earnings - Class I (21,768,071) (10,361,280)
Distributable earnings - Class A ------- (252)
Total distributions (25,291,336) (11,652,284)2
Fund share transactions (Note 3)1 (55,993,715) (330,906,023)
Total decrease (110,447,392) (251,358,489)
Net assets:Beginning of period 321,098,877 572,457,366
End of period $ 210,651,485 $ 321,098,8773
1 Class A and Class C shares closed on February 28, 2017.
2 Includes net investment income distributions of $694,712, $6,586,716 and $252, and net realized gain distributions of$596,040, $3,774,564 and $0 for the Investor Class, Class I and Class A shares respectively.
3 Includes accumulated undistributed net investment loss of $503,923.
The accompanying notes are an integral part of these financial statements.
46 www.thomaswhitefunds.com

THOMAS WHITE FUNDS
Statements of Changes in Net AssetsEmerging Markets Fund
Year EndedOctober 31,
2018
Year EndedOctober 31,
2017
Change in net assets from operations:Net investment income $ 413,303 $ 666,193
Net realized gain on investments 3,213,563 2,104,763
Net unrealized appreciation / depreciation on investments and foreign currencytransactions (7,169,007) 6,615,755
Net increase (decrease) in net assets from operations (3,542,141) 9,386,711
Distributions:Distributable earnings - Investor Class (19,106) (29,005)
Distributable earnings - Class I (372,630) (871,551)
Total distributions (391,736) (900,556)2
Fund share transactions (Note 3)1 (9,948,857) (39,470,584)
Total decrease (13,882,734) (30,984,429)
Net assets:Beginning of period 47,394,460 78,378,889
End of period $ 33,511,726 $ 47,394,4603
1 Class A and Class C shares closed on February 28, 2017.
2 Includes net investment income distributions of $29,005 and $871,551 for the Investor Class and Class I shares respectively.There were no net realized gain distributions for either class during this period.
3 Includes accumulated undistributed net investment loss of $2,592.
The accompanying notes are an integral part of these financial statements.
www.thomaswhitefunds.com 47

THOMAS WHITE FUNDS
Statements of Changes in Net AssetsAmerican Opportunities Fund
Year EndedOctober 31,
2018
Year EndedOctober 31,
2017
Change in net assets from operations:Net investment income $ 136,585 $ 115,757
Net realized gain on investments 1,298,075 2,563,472
Net unrealized appreciation / depreciation on investments and foreigncurrency transactions (1,223,886) 4,796,761
Net increase in net assets from operations 210,774 7,475,990
Total distributions (1,874,691) (3,573,880)1
Fund share transactions (Note 3) 1,200,124 714,978
Total increase (decrease) (463,793) 4,617,088
Net assets:Beginning of period 41,433,231 36,816,143
End of period $ 40,969,438 $ 41,433,2312
1 Includes net investment income distributions of $354,402 and net realized gain distributions of $3,219,478.
2 Includes accumulated undistributed net investment income of $15,478.
The accompanying notes are an integral part of these financial statements.
48 www.thomaswhitefunds.com

Notes to Financial Statements Period Ended October 31, 2018
NOTE 1. SUMMARY OF ACCOUNTING POLICIES
Lord Asset Management Trust (the “Trust”) was organized as a Delaware business trust onFebruary 9, 1994, as an open-end diversified management investment company. The Trustcurrently has three series of shares (collectively referred to as the “Funds”) - the Thomas WhiteInternational Fund (the “International Fund”), which commenced operations with the sale ofInvestor Class shares on June 28, 1994 and the sale of Class I shares, Class A shares and Class Cshares on August 31, 2012; the Thomas White Emerging Markets Fund (the “Emerging MarketsFund”), which commenced operations with the sale of Investor Class shares on June 28, 2010and the sale of Class I shares, Class A shares and Class C shares on August 31, 2012; and theThomas White American Opportunities Fund (the “American Opportunities Fund”), whichcommenced operations with the sale of Investor Class shares on March 4, 1999. Class A andClass C shares of the International Fund and Emerging Markets Fund closed on February 28,2017 and effective at the close of business on that date, the outstanding Class A and Class Cshares of those Funds were converted to Class I shares, as applicable. The investment objectiveof each Fund is to seek long-term capital growth. The International Fund invests in equitysecurities of companies located in the world’s developed countries outside of the U.S. TheEmerging Markets Fund invests in securities of companies located in or whose businesses areclosely associated with the world’s emerging markets countries. The American OpportunitiesFund primarily invests in U.S. equity securities, with a focus on mid-size and small companies.The following is a summary of significant accounting policies followed in the preparation of theTrust’s financial statements.
(A) VALUATION OF SECURITIES
Securities listed or traded on a recognized national or foreign stock exchange or NASDAQ arevalued at the last reported sales prices on the principal exchange on which the securities aretraded. NASDAQ National Market securities are valued at the NASDAQ official closing price.Over-the-counter securities and listed securities for which no closing sale price is reported arevalued at the mean between the last current bid and ask price. Securities for which marketquotations are not readily available are valued at fair value under the Trust’s ValuationProcedures as determined by management and approved in good faith by the Board of Trustees.As of October 31, 2018, all securities within each Fund’s portfolio were valued at the lastreported sales price on the principal exchange on which the securities are traded and, for theInternational and Emerging Markets Funds, adjusted by a fair value factor when necessary andas further described below. The Trust has retained an independent statistical fair value pricingservice to assist in the fair valuation process for securities principally traded in a foreign marketin order to adjust for changes in value that may occur between the close of the foreign exchangeand the time at which Fund shares are priced. Short term investments are valued at original cost,which combined with accrued interest, approximates market value.
www.thomaswhitefunds.com 49

Notes to Financial Statements Period Ended October 31, 2018
Fair value is defined as the price that would be received to sell an asset or paid to transfer aliability (i.e., the “exit price”) in an orderly transaction between market participants at themeasurement date. In determining fair value, the Fund uses various valuation approaches. Athree-tiered fair value hierarchy for inputs is used in measuring fair value that maximizes the useof observable inputs and minimizes the use of unobservable inputs by generally requiring thatthe most observable inputs be used when available. Observable inputs are those that marketparticipants would use in pricing the asset or liability based on market data obtained fromsources independent of a Fund. Unobservable inputs reflect the Fund’s assumptions about theinputs market participants would use in pricing the asset or liability developed based on the bestinformation available in the circumstances. The inputs or methodologies used for valuingsecurities are not necessarily an indication of the risks associated with investing in thosesecurities.
The fair value hierarchy is categorized into three levels based on the inputs as follows:
Level 1 - Valuations based on unadjusted quoted prices in active markets for identicalassets.
Level 2 - Valuations based on quoted prices for similar securities or in markets that are notactive or for which all significant inputs are observable, either directly or indirectly.
Level 3 - Valuations based on inputs that are unobservable and significant to the overallfair value measurement.
(B) MULTI-CLASS OPERATIONS AND ALLOCATIONS
Expenses of the Funds that are not directly attributable to a specific class of shares are proratedamong the classes based on the relative net assets of each class. Expenses directly attributable toa class of shares, which presently include administrative services fees, transfer agent fees andregistration fees, are recorded to the specific class.
Income, realized and unrealized capital gains and losses of the Funds are prorated among theclasses based on the relative net assets of each class within each specific Fund.
(C) MARKET RISK
Investing in securities of foreign companies and foreign governments involves special risks andconsiderations not typically associated with investing in U.S. companies and securities of theU.S. Government. These risks include revaluation of currencies and future adverse political andeconomic developments. Moreover, securities of many foreign companies and foreigngovernments and their markets may be less liquid and their prices more volatile than securitiesof comparable U.S. companies and securities of the U.S. Government.
50 www.thomaswhitefunds.com

Notes to Financial Statements Period Ended October 31, 2018
(D) FOREIGN CURRENCY TRANSLATION
Portfolio securities and other assets and liabilities denominated in foreign currencies aretranslated into U.S. dollar amounts at date of valuation. Purchases and sales of portfoliosecurities and income items denominated in foreign currencies are translated into U.S. dollaramounts on the respective dates of such transactions. When a Fund purchases or sells a foreignsecurity, it will customarily enter into a foreign exchange contract to minimize foreign exchangerisk from the trade date to the settlement date of such transaction.
The Funds do not isolate the portion of the results of operations resulting from changes inforeign exchange rates on investments from the fluctuations arising from changes in marketprices of securities held. Such fluctuations are included with the net realized and unrealized gainor loss from investments.
Net realized gain (loss) on investments and foreign currency transactions include those gainsand losses arising from the sale of foreign currencies, currency gains or losses realized betweenthe trade and settlement dates on securities transactions, the differences between the amounts ofdividends, and foreign withholding taxes recorded on a Fund’s books, and the U.S. dollarequivalent of the amounts actually received or paid. Net unrealized appreciation (depreciation)on investments and foreign currency translation includes changes in the value of assets andliabilities resulting from exchange rates.
(E) INCOME TAXES
Each Fund is a separate taxpayer for federal income tax purposes. Each Fund intends todistribute substantially all of its net investment income and net capital gains to its shareholdersand to otherwise comply with the requirements of Subchapter M of the Internal Revenue Codeapplicable to regulated investment companies. Therefore, no federal income tax provision isrequired.
All open tax years and major jurisdictions have been reviewed for the Funds and, based on thisreview, there are no significant uncertain tax positions that would require recognition in thefinancial statements. Open tax years are those that are open for exam by taxing authorities and,as of October 31, 2018, open Federal tax years include the tax years ended October 31, 2015through 2018. The Funds have no examinations in progress and are also not aware of any taxpositions for which it is reasonably possible that the total amounts of unrecognized tax benefitswill significantly change in the next twelve months.
The Funds accrue for such material foreign taxes on net realized and unrealized gains at theappropriate rate for each country. Based on rates ranging from approximately 10% to 15%, therewere no material accruals at period end.
www.thomaswhitefunds.com 51

Notes to Financial Statements Period Ended October 31, 2018
(F) USE OF ESTIMATES
The preparation of financial statements in conformity with generally accepted accountingprinciples requires management to make estimates and assumptions that affect the reportedamounts of assets and liabilities and disclosure of contingent liabilities at the date of thefinancial statements and the reported amounts of increases and decreases in net assets fromoperations during the period. Actual results could differ from these estimates.
The Funds are investment companies and follow accounting and reporting guidance under theFinancial Accounting Standards Board (“FASB”) Accounting Standards Codification (“ASC”)Topic 946, “Financial Services-Investment Companies”.
(G) SECURITY TRANSACTIONS AND INVESTMENT INCOME
Security transactions are accounted for on a trade date basis. Interest is accrued on a daily basisand dividend income is recorded on the ex-dividend date, except that certain dividends fromforeign securities are recorded when the information is available to the Fund. Realized gains andlosses are determined using specific identification.
(H) DISTRIBUTIONS TO SHAREHOLDERS
The Funds usually declare and pay dividends from net investment income annually, but may doso more frequently to avoid excise tax. Distributions of net realized capital gains, if any, will bedistributed at least annually.
(I) SECURITIES LENDING
The Funds may lend investment securities to investors who borrow securities in order to completecertain transactions. By lending investment securities, a Fund attempts to increase its net investmentincome through the receipt of interest earned on loan collateral. Any increase or decline in themarket price of the securities loaned that might occur and any interest earned or dividends declaredduring the term of the loan would be for the account of the Fund. Risks of delay in recovery of thesecurities or even loss of rights in the collateral may occur should the borrower of the securities failfinancially. Risk may also arise to the extent that the value of the securities loaned increases abovethe value of the collateral received. It is each Fund’s policy to obtain additional collateral from orreturn excess collateral to the borrower by the end of the next business day. Therefore, the value ofthe collateral may be temporarily less than the value of the securities on loan.
Funds that lend securities receive cash, cash equivalents, or other securities as collateral. Initialcollateral levels shall not be less than 102% of the market value of the borrowed securities (105%if the collateral and the borrowed securities are denominated in different currencies). Marking tomarket is performed every business day (subject to de minimis rules of change in market value) foreach Fund and each borrower is required to deliver additional collateral when necessary so that thetotal collateral held in the account for all loans of the Fund to the borrower will not be less than
52 www.thomaswhitefunds.com

Notes to Financial Statements Period Ended October 31, 2018
100% of the market value of all the borrowed securities loaned to the borrower by the Fund. Anycash, cash equivalents, or other securities received as collateral is invested by the securities lendingagent, Northern Trust, in accordance with pre-established guidelines as set forth in the securitieslending agreement. The cash collateral would be invested in the Northern Institutional Liquid AssetPortfolio (an open-end regulated investment company) and would be shown on the investmentportfolio for the Emerging Markets Fund. The cash collateral, if any, is reflected in the Funds’Statements of Assets and Liabilities in the line item labeled “Investments in securities at marketvalue.” Non-cash collateral is not shown in the Funds’ investment portfolios nor disclosed in theStatements of Assets and Liabilities as it is held by the lending agent on behalf of the Funds, andthe Funds do not have the ability to re-hypthecate those securities. A portion of the interestreceived on the loan collateral is retained by the Fund and the remainder is rebated to the borrowerof the securities. From the interest retained by the Funds, 50% is paid to the securities lendingagent for the International Fund and Emerging Markets Fund for its services. The net amount ofinterest earned, after the interest rebate and the allocation to the securities lending agent, is includedin the statement of operations as securities lending income. The value of loaned securities andrelated collateral outstanding at October 31, 2018 are as follows:
Fund
Value ofLoaned
Securities
Value ofCash
Collateral
Value ofNon-CashCollateral*
TotalCollateral
Thomas White International Fund $3,964,624 $0 $4,247,803 $4,247,803
Thomas White Emerging Markets Fund $157,334 $0 $152,102 $152,102
* Funds cannot repledge or dispose of this collateral, nor do the Funds earn any income or receive dividends with respect tothis collateral.
The International Fund and the Emerging Markets Fund have earned income on securitieslending (after rebates to borrowers and allocation to the securities lending agent) as follows:
Fund Net Income Earned
Thomas White International Fund $10,806
Thomas White Emerging Markets Fund $2,827
The Funds recently adopted guidance requiring entities to present gross obligations for securedborrowings by the type of collateral pledged and remaining time to maturity. There were nosuch obligations at October 31, 2018.
(J) REDEMPTION FEE
The Funds assess a 2% fee on redemptions (including exchanges) of Fund shares held for lessthan sixty days. Redemption fees are paid to each Fund to help offset transaction costs and toprotect the Fund’s long-term shareholders. Each Fund will use the “first-in, first-out” (FIFO)method to determine the sixty-day holding period. Under this method, the date of the
www.thomaswhitefunds.com 53

Notes to Financial Statements Period Ended October 31, 2018
redemption or exchange will be compared to the earliest purchase date of shares held in theaccount. If this holding period is less than sixty days, the fee will be charged. The InternationalFund Investor Class and Class I shares charged $497 and $8, respectively, the EmergingMarkets Fund Investor Class charged $34 and the American Opportunities Fund charged $180in redemption fees for the year ended October 31, 2018, which were included in net capital paid.
(K) REAL ESTATE INVESTMENT TRUSTS
The American Opportunities Fund has made certain investments in real estate investment trusts(“REITs”), which pay dividends to their shareholders based upon funds available fromoperations. It is quite common for these dividends to exceed the REITs’ taxable earnings andprofits resulting in the excess portion of such dividends being designated as a return of capital.The American Opportunities Fund intends to include the gross dividends from such REITs in itsannual distributions to its shareholders and, accordingly, a portion of the distributions receivedby the Fund’s shareholders may also be designated as a return of capital.
(L) RECENT ACCOUNTING PRONOUNCEMENT
In August 2018, FASB issued ASU 2018-13, Fair Value Measurement (Topic 820): DisclosureFramework - Changes to the Disclosure Requirements for Fair Value Measurement (“ASU2018-13”). The primary focus of ASU 2018-13 is to improve the effectiveness of the disclosurerequirements for fair value measurements. The changes affect all companies that are required toinclude fair value measurement disclosures. In general, the amendments in ASU 2018-13 areeffective for all entities for fiscal years and interim periods within those fiscal years, beginningafter December 15, 2019. An entity is permitted to early adopt the removed or modifieddisclosures upon the issuance of ASU 2018-13 and may delay adoption of the additionaldisclosures, which are required for public companies only, until their effective date.Management is currently evaluating the impact these changes will have on the Funds’ financialstatements and disclosures.
NOTE 2. SIGNIFICANT SHAREHOLDER
The following table indicates the number of shareholders who held a significant portion of theshares of each Class’s outstanding shares as of October 31, 2018. Investment activities of theseshareholders could have a material effect on each Fund.
Unaudited
Fund Share ClassNumber of
Shareholders % Held
International Fund Investor Class 1 11.2%
Emerging Markets Fund Investor Class 2 76.8%
Emerging Markets Fund Class I 1 18.3%
American Opportunities Fund Investor Class 1 20.1%
54 www.thomaswhitefunds.com

Notes to Financial Statements Period Ended October 31, 2018
NOTE 3. TRANSACTIONS IN SHARES OF BENEFICIAL INTEREST
As of October 31, 2018, there were an unlimited number of $0.01 par value shares of beneficialinterest authorized. Transactions are summarized as follows:
International Fund
Year Ended October 31, 2018 Year Ended October 31, 2017
Investor Class Investor Class
Shares Amount Shares Amount
Shares sold 36,613 $ 655,799 272,988 $ 4,206,966
Shares issued on reinvestment ofdividends & distributions 239,520 3,228,728 68,249 1,205,839
Shares redeemed (598,797) (10,572,135)^ (10,409,121) (165,146,599)
Net decrease (322,664) $ (6,687,608) (10,067,884) $ (159,733,794)
Shares outstanding:Beginning of period 2,449,686 12,517,570
End of period 2,127,022 2,449,686
^ Includes redemption fees of $497
Year Ended October 31, 2018 Year Ended October 31, 2017
Class I Class I
Shares Amount Shares Amount
Shares sold 852,416 $ 15,132,987 2,183,721 $ 34,990,899
Sales in connection with reorganization ------- ------- 68,548 1,053,314
Shares issued on reinvestment ofdividends & distributions 1,261,639 16,956,419 482,969 8,346,920
Shares redeemed (4,582,847) (81,395,513)^ (12,780,743) (214,500,761)
Net decrease (2,468,792) $ (49,306,107) (10,045,505) $ (170,109,628)
Shares outstanding:Beginning of period 15,585,266 25,630,771
End of period 13,116,474 15,585,266
^ Includes redemption fees of $8
www.thomaswhitefunds.com 55

Notes to Financial Statements Period Ended October 31, 2018
Year Ended October 31, 2018 Year Ended October 31, 2017
Class A* Class A
Shares Amount Shares Amount
Shares sold ------- $ ------- 12,622 $ 184,030Shares issued on reinvestment ofdividends & distributions ------- ------- 11 158Shares redeemed ------- ------- (9,221) (135,830)Shares exchanged in connection withreorganization ------- ------- (59,809) (915,341)
Net decrease ------- $ ------- (56,397) $ (866,983)
Shares outstanding:Beginning of period 0 56,397
End of period 0 0
* Class Reorganized into Class I shares on February 28, 2017.
Year Ended October 31, 2018 Year Ended October 31, 2017
Class C* Class C
Shares Amount Shares Amount
Shares sold ------- $ ------- ------- $ -------Shares issued on reinvestment ofdividends & distributions ------- ------- ------- -------Shares redeemed ------- ------- (3,843) (57,645)Shares exchanged in connection withreorganization ------- ------- (8,983) (137,973)
Net decrease ------- $ ------- (12,826) $ (195,618)
Shares outstanding:Beginning of period 0 12,826
End of period 0 0
* Class Reorganized into Class I shares on February 28, 2017.
Emerging Markets Fund
Year Ended October 31, 2018 Year Ended October 31, 2017
Investor Class Investor Class
Shares Amount Shares Amount
Shares sold 5,032 $ 56,877 919 $ 9,450Shares issued on reinvestment ofdividends & distributions 1,122 10,728 1,525 16,822Shares redeemed (16,212) (184,376)^ (10,560) (108,272)
Net decrease (10,058) $ (116,771) (8,116) $ (82,000)
Shares outstanding:Beginning of period 177,271 185,387
End of period 167,213 177,271
^ Includes redemption fees of $34
56 www.thomaswhitefunds.com

Notes to Financial Statements Period Ended October 31, 2018
Year Ended October 31, 2018 Year Ended October 31, 2017
Class I Class I
Shares Amount Shares Amount
Shares sold 312,421 $ 3,543,325 230,984 $ 2,485,119
Sales in connection with reorganization ------- ------- 32,678 323,653
Shares issued on reinvestment ofdividends & distributions 38,575 372,630 69,841 772,245
Shares redeemed (1,144,555) (13,748,041) (4,062,521) (42,645,912)
Net decrease (793,559) $ (9,832,086) (3,729,018) $ (39,064,895)
Shares outstanding:Beginning of period 3,988,413 7,717,431
End of period 3,194,854 3,988,413
Year Ended October 31, 2018 Year Ended October 31, 2017
Class A* Class A
Shares Amount Shares Amount
Shares sold ------- $ ------- ------- $ -------
Shares issued on reinvestment ofdividends & distributions ------- ------- ------- -------
Shares redeemed ------- ------- (2) (18)
Shares exchanged in connection withreorganization ------- ------- (8,360) (82,158)
Net decrease ------- $ ------- (8,362) $ (82,176)
Shares outstanding:Beginning of period 0 8,362
End of period 0 0
* Class Reorganized into Class I shares on February 28, 2017.
Year Ended October 31, 2018 Year Ended October 31, 2017
Class C* Class C
Shares Amount Shares Amount
Shares sold ------- $ ------- ------- $ -------
Shares issued on reinvestment ofdividends & distributions ------- ------- ------- -------
Shares redeemed ------- ------- (2) (18)
Shares exchanged in connection withreorganization ------- ------- (24,712) (241,495)
Net decrease ------- $ ------- (24,714) $ (241,513)
Shares outstanding:Beginning of period 0 24,714
End of period 0 0
* Class Reorganized into Class I shares on February 28, 2017.
www.thomaswhitefunds.com 57

Notes to Financial Statements Period Ended October 31, 2018
American Opportunities Fund
Year Ended October 31, 2018 Year Ended October 31, 2017
Investor Class Investor Class
Shares Amount Shares Amount
Shares sold 95,707 $ 1,603,940 43,875 $ 739,907
Shares issued on reinvestment ofdividends & distributions 116,726 1,782,396 205,012 3,387,229
Shares redeemed (134,381) (2,186,212)^ (205,152) (3,412,158)
Net increase 78,052 $ 1,200,124 43,735 $ 714,978
Shares outstanding:Beginning of period 2,512,548 2,468,813
End of period 2,590,600 2,512,548
^ Includes redemption fees of $180
NOTE 4. INVESTMENT MANAGEMENT FEES AND OTHERTRANSACTIONS WITH AFFILIATES
Each Fund pays a monthly investment management fee to Thomas White International, Ltd. (the“Advisor”) at the rate of 0.85% of the Fund’s average daily net assets annually. For the yearended October 31, 2018, the International Fund, Emerging Markets Fund and AmericanOpportunities Fund paid the Advisor $2,443,157, $342,088 and $373,395, respectively, ininvestment management fees.
During the year ended October 31, 2018, the Advisor has contractually agreed to reimburse itsmanagement fee and/or reimburse the Funds’ operating expenses to the extent necessary toensure that each Fund’s annual operating expenses do not exceed the following percentages ofaverage daily net assets:
Investor Class Class I
International Fund 1.24% 0.99%
Emerging Markets Fund 1.34% 1.09%
American Opportunities Fund 1.34% n/a
These agreements to reimburse fees renew automatically unless the Advisor gives written noticeto end them.
The Advisor may recoup any previously waived amount from a Fund pursuant to the expenselimitation agreements if such reimbursement does not cause the Fund to exceed either (i) thecurrent expense limitation or (ii) the expense limitation in effect at the time the expense is waived,
58 www.thomaswhitefunds.com

Notes to Financial Statements Period Ended October 31, 2018
provided the reimbursement is made within three years after the year in which the Advisor incurredthe expense. For the year ended October 31, 2018, the Advisor recouped the following amounts:
Fund Share ClassRecoupment
Amount
International Fund Investor Class $9,193
As of October 31, 2018, the International and Emerging Markets Funds had the followingamounts (and year of expiration) subject to repayment to the Advisor:
Fund Share Class Year Fees Waived Repayment Expires Balance
International Fund Investor Class 2016 2019 $185,995
International Fund Investor Class 2017 2020 $115,940
International Fund Investor Class 2018 2021 $47,574
International Fund Class I 2016 2019 $376,987
International Fund Class I 2017 2020 $535,417
International Fund Class I 2018 2021 $465,425
Emerging Markets Fund Investor Class 2017 2020 $2,618
Emerging Markets Fund Investor Class 2018 2021 $3,875
Emerging Markets Fund Class I 2016 2019 $150,335
Emerging Markets Fund Class I 2017 2020 $195,908
Emerging Markets Fund Class I 2018 2021 $159,329
American Opportunities Fund Investor Class 2018 2021 $37,957
The Funds and U.S. Bancorp Fund Services, LLC (the “Administrator”) are parties to a FundAdministration Servicing Agreement. The Administrator provides administrative and fundaccounting services pursuant to this agreement.
The Advisor and the Funds have adopted a Business Management Agreement under which theAdvisor provides certain business management services to the Funds, including, without limitation,monitoring of the Funds’ relationships with third-party service providers and assisting withnecessary and appropriate services to the Board of Trustees of the Trust, as well as either providingthe Trust with or procuring for the Trust the services of a Chief Compliance Officer in accordancewith Rule 38a-1 of the 1940 Act, in the event so requested. For these services, the Advisor isentitled to receive a fee from each Fund at a rate of 0.035% of the Fund’s average daily net assets.For the year ended October 31, 2018, for the services provided under the Business ManagementAgreement, the International Fund, Emerging Markets Fund, and American Opportunities Fundpaid the Advisor $100,601, $14,086 and $15,375, respectively.
www.thomaswhitefunds.com 59

Notes to Financial Statements Period Ended October 31, 2018
The Funds have adopted an Administrative Services Plan pursuant to which the Investor Classshares are authorized to make payments to certain entities, which may include banks, broker-dealers and other types of service providers, for providing administrative services with respectto shares of the Funds attributable to or held in the name of the service provider for its clients orcustomers with whom they have a servicing relationship. Under the terms of the AdministrativeServices Plan, Investor Class shares are authorized to make payments up to a maximum rateof 0.25% of the average daily net assets of the shares attributable to or held in the name of theservice provider for providing the types of applicable administrative services covered under theterms of the Plan. For the year ended October 31, 2018, fees incurred by the International Fundpursuant to the Administrative Services Plan were $64,842 for Investor Class. For the yearended October 31, 2018, fees incurred by the Emerging Markets Fund pursuant to theAdministrative Services Plan were $543 for Investor Class. For the year ended October 31,2018, fees incurred by the American Opportunities Fund pursuant to the AdministrativeServices Plan were $105,061 for Investor Class shares.
NOTE 5. CUSTODIAN AND TRANSFER AGENT FEES
Custodian Fees - Northern Trust is the custodian for the International Fund and EmergingMarkets Fund. U.S. Bank is the custodian for the American Opportunities Fund. Northern Trustbills the International Fund and the Emerging Markets Fund quarterly based on the value of theirholdings as of the previous quarter end plus transaction fees. U.S. Bank bills the AmericanOpportunities Fund monthly based on the ending value of its holdings plus transaction fees.
Transfer Agent - U.S. Bancorp serves as the Funds’ transfer agent. Under the terms of thetransfer agent agreement, U.S. Bancorp is entitled to account-based fees along withreimbursement of out-of-pocket expenses incurred in providing transfer agent services.
NOTE 6. INVESTMENT TRANSACTIONS
During the year ended October 31, 2018, the cost of purchases and the proceeds from sales ofinvestment securities, other than short-term investments, were as follows:
Fund Purchases Sales
International Fund $106,832,496 $183,868,058
Emerging Markets Fund 13,337,741 23,309,417
American Opportunities Fund 9,078,568 8,985,740
The American Opportunities Fund did not purchase or sell long-term U.S. Governmentsecurities during the year ended October 31, 2018. The International Fund and EmergingMarkets Fund did not directly purchase or sell long term U.S. Government securities, except forpurposes of securities lending during the year ended October 31, 2018.
60 www.thomaswhitefunds.com

Notes to Financial Statements Period Ended October 31, 2018
At October 31, 2018, the aggregate gross unrealized appreciation and depreciation of portfoliosecurities, based upon cost for federal income tax purposes, were as follows:
Fund Tax CostUnrealized
AppreciationUnrealized
Depreciation
Net UnrealizedAppreciation/
(Depreciation)
International Fund $198,810,095 $27,568,220 $(20,387,799) $7,180,421
Emerging Markets Fund 29,967,815 6,814,494 (3,268,341) 3,546,153
American Opportunities Fund 32,212,258 9,599,088 (1,298,711) 8,300,377
Distributions to Shareholders
The Funds will distribute net investment income and net realized gains, if any, at least once ayear. The amount of distributions from net investment income and net realized gains aredetermined in accordance with federal income tax regulations, which may differ from generallyaccepted accounting principles. These “book/tax” differences are either temporary or permanentin nature and are primarily due to differing treatments for passive foreign investment companiesand losses deferred due to wash sales. Permanent differences, primarily due to reclassification ofREIT income, resulted in reclassifications among the Funds’ components of net assets atOctober 31, 2018, the Funds’ tax year-end. For the International Fund, permanent differencesresulted in reclassification of ($798,980) in distributable earnings and $798,980 in paid incapital. For the Emerging Markets Fund, permanent differences resulted in reclassification of$10,567 in distributable earnings and ($10,567) in paid in capital. For the AmericanOpportunities Fund, permanent differences resulted in reclassification of ($11,431) indistributable earnings and $11,431 in paid in capital.
Fund
UndistributedOrdinary
Income
UndistributedLong-term
Gains
NetUnrealized
Appreciation
OtherAccumulated
Losses
TotalDistributable
Earnings
International Fund $------- $------- $7,180,421 $(74,732) $7,105,689
Emerging MarketsFund ------- ------- 3,546,153 (8,574,082) (5,027,929)
AmericanOpportunities Fund ------- ------- 8,300,377 ------- 8,300,377
Under the Regulated Investment Company Modernization Act of 2010, the Funds are permittedto carry forward capital losses incurred in taxable years beginning after December 22, 2010 foran unlimited period, and such capital losses will retain their character as either short-term orlong-term capital losses.
As of October 31, 2018, the Emerging Markets Fund had $6,851,969 in short-term capital losscarry forwards with no expiration, and had $1,718,242 in long-term capital loss carryforwardswith no expiration.
www.thomaswhitefunds.com 61

Notes to Financial Statements Period Ended October 31, 2018
The tax character of distributions paid during the periods shown below were as follows:
Year Ended October 31, 2018
OrdinaryIncome
Return ofCapital
Long-TermCapital Gains
TotalDistributions
International Fund $4,008,212 $------- $21,283,124 $25,291,336
Emerging Markets Fund 391,736 ------- ------- 391,736
American Opportunities Fund 122,005 ------- 1,752,686 1,874,691
Year Ended October 31, 2017
OrdinaryIncome
Return ofCapital
Long-TermCapital Gains
TotalDistributions
International Fund $7,248,662 $------- $4,403,622 $11,652,284
Emerging Markets Fund 900,556 ------- ------- 900,556
American Opportunities Fund 352,734 ------- 3,221,146 3,573,880
NOTE 7. REORGANIZATION OF SHARE CLASSES
Effective upon the close of business on February 28, 2017, the outstanding Class A and Class Cshares of the Thomas White International Fund and the Thomas White Emerging Markets Fundwere converted into Class I shares of their respective Funds, as applicable (the “Class Conversion”)pursuant to the Supplement to the Prospectus dated January 31, 2017. The Class Conversion wascompleted based on the share classes’ relative net asset values on the Conversion Date, without theimposition of any sales charge or any other charge as detailed below:
International FundShares
OutstandingNet
AssetsNAV
per ShareShare
Conversion Ratio
Class A 59,809 $915,341 $15.30 0.9954
Class C 8,983 $137,973 $15.36 0.9993
Class I (Before Conversion) 24,117,542 $370,573,288 $15.37 -------
Class I (After Conversion) 24,186,090 $371,626,602 $15.37 -------
Emerging Markets FundShares
OutstandingNet
AssetsNAV
per ShareShare
Conversion Ratio
Class A 8,360 $82,158 $9.83 0.9929
Class C 24,712 $241,495 $9.77 0.9869
Class I (Before Conversion) 7,301,169 $72,300,755 $9.90 -------
Class I (After Conversion) 7,333,847 $72,624,408 $9.90 -------
62 www.thomaswhitefunds.com

Notes to Financial Statements Period Ended October 31, 2018
NOTE 8. SUBSEQUENT EVENTS
In preparing these financial statements, the Trust has evaluated events after October 31, 2018and determined that there were no significant subsequent events that would require adjustmentto or additional disclosure in these financial statements.
RESULTS OF SPECIAL MEETING OF SHAREHOLDERS (UNAUDITED)
A special meeting of shareholders (the “Special Meeting”) of the Thomas White Funds was heldon November 30, 2018. At the Special Meeting, shareholders were asked to vote on thefollowing proposals: to approve new Investment Advisory Agreements between the Trust andThomas White International, Ltd.; to elect Trustees to the Board of Trustees of the Trust; toapprove the removal of the fundamental investment restriction on investing in other open-endinvestment companies applicable to the International Fund and the American OpportunitiesFund.
The details of how the proposals were voted on are included below:
Proposal 1Number ofVotes For
Number ofVotes
Against
% of OutstandingShares VotedAffirmatively
Approval of the new Investment AdvisoryAgreement 17,428,403 4,454 84.61%
Proposal 2
NomineeNumber ofVotes For
Number ofVotes
Withheld
% of OutstandingShares VotedAffirmatively
Arthur Fiocco, Jr. 19,606,290 20,337 95.18%
Geri Sands Hansen 19,604,873 21,754 95.17%
William H. Woolverton 19,606,290 20,337 95.18%
Douglas M. Jackman 19,606,290 20,337 95.18%
Proposal 3*Number ofVotes For
Number ofVotes
Against
% of OutstandingShares VotedAffirmatively
Approval to remove the fundamental investmentrestriction 14,720,664 19,781 85.08%
* Proposal 3 was voted on by shareholders of the International Fund and American Opportunities Fund. The EmergingMarkets Fund does not have this investment restriction.
www.thomaswhitefunds.com 63

Year Ended October 31, 2018
FINANCIAL HIGHLIGHTSThomas White International Fund - Investor Class
YearEnded
October 31,2018
YearEnded
October 31,2017
YearEnded
October 31,2016
YearEnded
October 31,2015
YearEnded
October 31,2014
Per share operating performance (For a share outstanding throughout each period)Net asset value, beginning of period $ 17.88 $ 14.97 $ 15.77 $ 16.95 $ 19.16
Income from investment operations:Net investment income 1 0.25 0.14 0.17 0.19 0.26Net realized and unrealized gains/(losses) (2.44) 3.30 (0.81) (1.17) (0.89)
Total from investment operations (2.19) 3.44 (0.64) (0.98) (0.63)
Distributions:From net investment income (0.29) (0.28) (0.16) (0.20) (0.26)From net realized gains (1.54) (0.25) ------- ------- (1.32)
Total Distributions (1.83) (0.53) (0.16) (0.20) (1.58)
Change in net asset value for the period (4.02) 2.91 (0.80) (1.18) (2.21)
Net asset value, end of period $ 13.86 $ 17.88 $ 14.97 $ 15.77 $ 16.95
Total Return (12.01)% 23.06% (4.08)% (5.77)% (3.00)%
Ratios/supplemental dataNet assets, end of period (000) $ 29,473 $ 43,811 $ 187,408 $ 268,518 $ 369,098
Ratio to average net assets:Expenses (net of reimbursement) 1.24% 1.24% 1.24% 1.24% 1.24%Expenses (prior to reimbursement) 1.34% 1.36% 1.33% 1.32% 1.27%Net investment income(net of reimbursement) 1.32% 0.90% 1.16% 1.16% 1.36%Net investment income(prior to reimbursement) 1.22% 0.78% 1.07% 1.08% 1.33%Portfolio turnover rate 2 38% 48% 60% 57% 62%
(1) Net investment income per share represents net investment income divided by the average shares outstanding throughoutthe period.
(2) Portfolio turnover is calculated on the basis of the Fund as a whole without distinguishing between the classes of sharesissued.
The accompanying notes are an integral part of these financial statements
64 www.thomaswhitefunds.com

Year Ended October 31, 2018
FINANCIAL HIGHLIGHTSThomas White International Fund - Class I
YearEnded
October 31,2018
YearEnded
October 31,2017
YearEnded
October 31,2016
YearEnded
October 31,2015
YearEnded
October 31,2014
Per share operating performance (For a share outstanding throughout each period)Net asset value, beginning of period $ 17.79 $ 14.98 $ 15.78 $ 16.97 $ 19.18
Income from investment operations:Net investment income 1 0.27 0.25 0.23 0.23 0.30Net realized and unrealized gains/(losses) (2.42) 3.22 (0.83) (1.17) (0.89)
Total from investment operations (2.15) 3.47 (0.60) (0.94) (0.59)
Distributions:From net investment income (0.29) (0.41) (0.20) (0.25) (0.30)From net realized gains (1.54) (0.25) ------- ------- (1.32)
Total Distributions (1.83) (0.66) (0.20) (0.25) (1.62)
Change in net asset value for the period (3.98) 2.81 (0.80) (1.19) (2.21)
Net asset value, end of period $ 13.81 $ 17.79 $ 14.98 $ 15.78 $ 16.97
Total Return (11.80)% 23.23% (3.81)% (5.56)% (2.76)%
Ratios/supplemental dataNet assets, end of period (000) $ 181,179 $ 277,287 $ 384,017 $ 300,331 $ 443,397
Ratio to average net assets:Expenses (net of reimbursement) 0.99% 0.99% 0.99% 0.99% 0.99%Expenses (prior to reimbursement) 1.18% 1.14% 1.10% 1.08% 1.05%Net investment income(net of reimbursement) 1.53% 1.53% 1.53% 1.40% 1.59%Net investment income(prior to reimbursement) 1.34% 1.38% 1.42% 1.31% 1.53%Portfolio turnover rate 2 38% 48% 60% 57% 62%
(1) Net investment income per share represents net investment income divided by the average shares outstanding throughoutthe period.
(2) Portfolio turnover is calculated on the basis of the Fund as a whole without distinguishing between the classes of sharesissued.
The accompanying notes are an integral part of these financial statements
www.thomaswhitefunds.com 65

Year Ended October 31, 2018
FINANCIAL HIGHLIGHTSThomas White Emerging Markets Fund - Investor Class
YearEnded
October 31,2018
YearEnded
October 31,2017
YearEnded
October 31,2016
YearEnded
October 31,2015
YearEnded
October 31,2014
Per share operating performance (For a share outstanding throughout each period)Net asset value, beginning of period $ 11.30 $ 9.80 $ 9.46 $ 11.55 $ 11.72
Income from investment operations:Net investment income 1 0.10 0.09 0.05 0.08 0.13Net realized and unrealized gains/(losses) (1.41) 1.57 0.37 (2.08) (0.18)
Total from investment operations (1.31) 1.66 0.42 (2.00) (0.05)
Distributions from net investment income (0.12) (0.16) (0.08) (0.09) (0.12)
Change in net asset value for the period (1.43) 1.50 0.34 (2.09) (0.17)
Net asset value, end of period $ 9.87 $ 11.30 $ 9.80 $ 9.46 $ 11.55
Total Return (11.59)% 17.02% 4.48% (17.31)% (0.40)%
Ratios/supplemental data
Net assets, end of period (000) $ 1,651 $ 2,002 $ 1,816 $ 4,172 $ 5,182
Ratio to average net assets:Expenses(net of reimbursement/recoupment) 1.34% 1.34% 1.34% 1.34% 1.34%Expenses(prior to reimbursement/recoupment) 1.54% 1.48% 1.31% 1.27% 1.29%Net investment income(net of reimbursement/recoupment) 0.85% 0.90% 0.59% 0.75% 1.16%Net investment income(prior to reimbursement/recoupment) 0.65% 0.76% 0.62% 0.82% 1.21%Portfolio turnover rate 2 34% 67% 57% 27% 64%
(1) Net investment income per share represents net investment income divided by the average shares outstanding throughoutthe period.
(2) Portfolio turnover is calculated on the basis of the Fund as a whole without distinguishing between the classes of sharesissued.
The accompanying notes are an integral part of these financial statements
66 www.thomaswhitefunds.com

Year Ended October 31, 2018
FINANCIAL HIGHLIGHTSThomas White Emerging Markets Fund - Class I
YearEnded
October 31,2018
YearEnded
October 31,2017
YearEnded
October 31,2016
YearEnded
October 31,2015
YearEnded
October 31,2014
Per share operating performance (For a share outstanding throughout each period)Net asset value, beginning of period $ 11.38 $ 9.88 $ 9.52 $ 11.59 $ 11.73
Income from investment operations:Net investment income 1 0.12 0.11 0.09 0.11 0.14Net realized and unrealized gains/(losses) (1.41) 1.59 0.36 (2.09) (0.16)
Total from investment operations (1.29) 1.70 0.45 (1.98) (0.02)
Distributions from net investment income (0.12) (0.20) (0.09) (0.09) (0.12)
Change in net asset value for the period (1.41) 1.50 0.36 (2.07) (0.14)
Net asset value, end of period $ 9.97 $ 11.38 $ 9.88 $ 9.52 $ 11.59
Total Return (11.33)% 17.29% 4.69% (17.06)% (0.12)%
Ratios/supplemental dataNet assets, end of period (000) $ 31,861 $ 45,392 $ 76,240 $ 79,656 $ 76,705
Ratio to average net assets:Expenses (net of reimbursement) 1.09% 1.09% 1.09% 1.09% 1.09%Expenses (prior to reimbursement) 1.51% 1.41% 1.29% 1.25% 1.25%Net investment income (net of reimbursement) 1.04% 1.07% 0.92% 1.04% 1.18%Net investment income(prior to reimbursement) 0.62% 0.75% 0.72% 0.88% 1.02%Portfolio turnover rate 2 34% 67% 57% 27% 64%
(1) Net investment income per share represents net investment income divided by the average shares outstanding throughoutthe period.
(2) Portfolio turnover is calculated on the basis of the Fund as a whole without distinguishing between the classes of sharesissued.
The accompanying notes are an integral part of these financial statements
www.thomaswhitefunds.com 67

Year Ended October 31, 2018
FINANCIAL HIGHLIGHTSThomas White American Opportunities Fund - Investor Class
YearEnded
October 31,2018
YearEnded
October 31,2017
YearEnded
October 31,2016
YearEnded
October 31,2015
YearEnded
October 31,2014
Per share operating performance (For a share outstanding throughout each period)Net asset value, beginning of period $ 16.49 $ 14.91 $ 15.60 $ 15.84 $ 15.12
Income from investment operations:Net investment income 0.06 0.04 0.11 1 0.08 1 0.07 1
Net realized and unrealized gains/(losses) ------- 3.00 (0.44) 0.96 2.21
Total from investment operations 0.06 3.04 (0.33) 1.04 2.28
Distributions:From net investment income (0.05) (0.14) (0.00)2 (0.07) (0.07)From net realized gains (0.69) (1.32) (0.36) (1.21) (1.49)
Total Distributions (0.74) (1.46) (0.36) (1.28) (1.56)
Change in net asset value for the period (0.68) 1.58 (0.69) (0.24) 0.72
Net asset value, end of period $ 15.81 $ 16.49 $ 14.91 $ 15.60 $ 15.84
Total Return 0.50% 20.45% (2.12)% 6.69% 15.38%
Ratios/supplemental dataNet assets, end of period (000) $ 40,969 $ 41,433 $ 36,816 $ 35,875 $ 33,830
Ratio to average net assets:Expenses(net of reimbursement/ recoupment) 1.34% 1.19% 1.20% 1.18% 1.24%Expenses(prior to reimbursement/recoupment) 1.43% 1.19% 1.20% 1.18% 1.15%Net investment income (net of reimbursement/recoupment) 0.31% 0.28% 0.78% 0.52% 0.45%Net investment income(prior to reimbursement/recoupment) 0.22% 0.28% 0.78% 0.52% 0.54%Portfolio turnover rate 21% 29% 60% 38% 32%
(1) Per share net investment income was calculated prior to tax adjustments.
(2) Amount is less than $0.005.
The accompanying notes are an integral part of these financial statements
68 www.thomaswhitefunds.com

Report of Independent Registered Public Accounting Firm
To the Shareholders of andThe Board of Trustees ofLord Asset Management Trust
Opinion on the Financial Statements
We have audited the accompanying statement of assets and liabilities of Thomas WhiteInternational Fund, Thomas White Emerging Markets Fund, and Thomas White AmericanOpportunities Fund (the “Funds”), each a series of Lord Asset Management Trust, including theschedule of investments, as of October 31, 2018, the related statement of operations for the yearthen ended, the statements of changes in net assets for each of the two years in the period thenended, financial highlights for each of the five years in the period then ended, and the relatednotes (collectively referred to as the “financial statements”). In our opinion, the financialstatements present fairly, in all material respects, the financial position of the Funds as ofOctober 31, 2018, the results of their operations for the year then ended, the changes in its netassets for each of the two years in the period then ended, and the financial highlights for each ofthe five years in the period then ended, in conformity with accounting principles generallyaccepted in the United States of America.
Basis for Opinion
These financial statements are the responsibility of the Funds’ management. Our responsibilityis to express an opinion on the Funds’ financial statements based on our audits. We are a publicaccounting firm registered with the Public Company Accounting Oversight Board (UnitedStates) (“PCAOB”) and are required to be independent with respect to the Funds in accordancewith the U.S. federal securities laws and the applicable rules and regulations of the Securitiesand Exchange Commission and the PCAOB. We have served as the auditor of one or more ofthe funds in the Trust since 2014.
We conducted our audits in accordance with the standards of the PCAOB. Those standardsrequire that we plan and perform the audit to obtain reasonable assurance about whether thefinancial statements are free of material misstatement, whether due to error or fraud. The Fundsare not required to have, nor were we engaged to perform, an audit of its internal control overfinancial reporting. As part of our audits we are required to obtain an understanding of internalcontrol over financial reporting, but not for the purpose of expressing an opinion on theeffectiveness of the Funds’ internal control over financial reporting. Accordingly, we express nosuch opinion.
Our audits included performing procedures to assess the risks of material misstatement of thefinancial statements, whether due to error or fraud, and performing procedures that respond tothose risks. Such procedures included examining, on a test basis, evidence regarding theamounts and disclosures in the financial statements. Our audits also included evaluating theaccounting principles used and significant estimates made by management, as well as evaluating
www.thomaswhitefunds.com 69

Report of Independent Registered Public Accounting Firm
the overall presentation of the financial statements. Our procedures included confirmation ofsecurities owned as of October 31, 2018 by correspondence with the custodians. We believe thatour audits provide a reasonable basis for our opinion.
TAIT, WELLER & BAKER LLP
Philadelphia, PennsylvaniaDecember 31, 2018
70 www.thomaswhitefunds.com

Tax Information (Unaudited)
The Funds have elected to pass through to their shareholders the foreign taxes paid for the yearended October 31, 2018 as follows:
Foreign DividendIncome
Foreign TaxesPaid
Foreign Taxes Paidper share
International Fund $6,229,723 $770,681 $0.0506
Emerging Markets Fund 902,584 119,746 0.0356
QUALIFYING DIVIDEND INCOME
For the International Fund, Emerging Markets Fund and American Opportunities Fund, 100% ofthe income dividend is qualified.
ORDINARY INCOME DIVIDEND AND FOREIGN TAX CREDIT
The International Fund and the Emerging Markets Fund have made an election under Section853 of the Internal Revenue Code to provide to their shareholders the benefit of foreign taxcredits in the per share amount designated below. Therefore, shareholders who must file a U.S.Federal Income tax return will be entitled to a foreign tax credit or an itemized deduction in anamount equal to $0.0490 per share of the International Fund and $0.0322 per share of EmergingMarkets Fund for each share owned on October 26, 2018, in computing their tax liability. It isgenerally more advantageous to claim a credit than a deduction.
www.thomaswhitefunds.com 71

THOMAS WHITE FUNDS
DISCLOSURE OF FUND EXPENSES (Unaudited)
As a shareholder of the Funds you incur two types of costs : (1) transaction costs, includingsales charges (loads) on purchase payments or contingent deferred sales charges onredemptions, if any, or redemption fees; and (2) ongoing costs, including management fees;distribution fees (12b-1); and other Fund expenses. This example is intended to help youunderstand your ongoing costs (in dollars) of investing in the Funds and to compare these costswith the ongoing costs of investing in other mutual funds.
The example is based on an investment of $1,000 invested at the beginning of the period andheld for the entire period, May 1, 2018 through October 31, 2018 for the Funds’ Investor Classand Class I, as applicable.
ACTUAL EXPENSES
The third and fourth columns of the table below provide information about actual account valuesand actual expenses. You may use the information in this line together with the amount youinvested to estimate the expenses you paid over the period. Simply divide your account value by$1,000 (for example, an $8,600 account value divided by $1,000=8.6), then multiply the resultby the number in the fourth column under the heading entitled “Expenses Paid During Period”to estimate the expenses you paid on your own account during this period. IRA accounts arecharged a $15.00 fee annually in September that is not reflected in the actual expense example.If you hold your Fund shares through an IRA account, you should add this cost to the expensespaid shown below.
HYPOTHETICAL EXAMPLE FOR COMPARISON PURPOSES
The fifth and sixth columns of the table below provide information about hypothetical accountvalues and hypothetical expenses based on each Fund’s actual expense ratio and an assumed rateof return of 5% per year before expenses, which is not the Fund’s actual return. The hypotheticalaccount values and expenses may not be used to estimate the actual ending account balance orexpenses you paid for the period. You may use this information to compare the ongoing costs ofinvesting in the Funds and other funds. To do so, compare this 5% hypothetical example withthe 5% hypothetical examples that appear in the shareholder reports of the other funds. IRAaccounts are charged a $15.00 fee annually in September that is not reflected in the hypotheticalexpense example. If you hold your Fund shares through an IRA account, you should separatelycompare the Funds’ IRA fees to the IRA fees of other funds.
Please note that the expenses shown in the table are meant to highlight your ongoing costs onlyand do not reflect any transactional costs such as sales charges (loads) or purchase payments orcontingent deferred sales charges on redemptions, if any, or redemption fees. Therefore the sixthcolumn of the table is useful in comparing ongoing costs only, and will not help you determinethe relative costs of owning different funds. In addition, if these transactional costs wereincluded, your costs may have been higher.
72 www.thomaswhitefunds.com

THOMAS WHITE FUNDS
ActualHypothetical (5% return
before expenses)
Fund’sAnnualized
ExpenseRatio*
BeginningAccount
ValueMay 1,
2018
EndingAccount
ValueOctober 31,
2018
ExpensesPaid
DuringPeriod
EndingAccount
ValueOctober 31,
2018
ExpensesPaid
DuringPeriod
International Fund
Investor ClassShares 1.24% $1,000.00 $858.70 $5.81 $1,018.95 $6.31
Class I Shares 0.99% $1,000.00 $859.30 $4.64 $1,020.21 $5.04
Emerging Markets Fund
Investor ClassShares 1.34% $1,000.00 $843.10 $6.23 $1,018.45 $6.82
Class I Shares 1.09% $1,000.00 $844.40 $5.07 $1,019.71 $5.55
American Opportunities Fund
Investor Class 1.34% $1,000.00 $987.10 $6.71 $1,018.45 $6.82
* Expenses for the International, Emerging Markets and American Opportunities Funds’ annualized expense ratio (after waiverand reimbursement), multiplied by the average account value over the period, multiplied by 184/365 (to reflect the one-halfyear period).
QUARTERLY FORM N-Q PORTFOLIO SCHEDULE
The Funds file their complete schedule of portfolio holdings with the Securities and ExchangeCommission (“SEC”) for the first and third quarters of each fiscal year on Form N-Q. EachFund’s Form N-Q is available on the SEC’s website at http://www.sec.gov. The Funds’ FormsN-Q may be reviewed and copied at the SEC’s Public Reference Room in Washington, D.C.Information on the operation of the SEC’s Public reference Room may be obtained by calling1-800-SEC-0330. Additionally, you may obtain copies of Forms N-Q from the Funds uponrequest by calling 1-800-811-0535.
PROXY VOTING POLICIES, PROCEDURES AND RECORD
You may obtain a description of the Funds’ (1) proxy voting policies, (2) proxy votingprocedures and (3) information regarding how the Funds voted any proxies related to portfoliosecurities during the most recent 12 month period ended June 30 for which an SEC filing hasbeen made, without charge, upon request by calling the Funds at 1-800-811-0535 or on theEDGAR database on the SEC’s website (http://www.sec.gov).
www.thomaswhitefunds.com 73

Approval of New Investment Advisory Agreements
Effective as of September 30, 2018, Thomas White International, Ltd., the investment adviser tothe Funds (the “Adviser”) and Thomas S. White, Jr., the founder of the firm, completed atransaction pursuant to which Mr. White sold his entire majority-ownership interest in the firmto the Adviser in exchange for cash (the “Transaction”). The Transaction was part of a transitionplan pursuant to which various officers and employees of the Adviser increased their ownershipinterests in the firm in connection with Mr. White’s retirement from the Adviser. Due to thesubstantial change in the ownership arrangements of the Adviser, the closing of the Transactionresulted in a change of control of the Adviser (the “Change of Control”). As required by theInvestment Company Act of 1940, as amended (the “1940 Act”), the then-effective InvestmentAdvisory Agreements between the Adviser and the Funds (the “Prior Advisory Agreements”)each contained a provision that the Prior Advisory Agreements would automatically terminate inthe event of their “assignment” (as defined in the 1940 Act). The Change of Control caused theassignment of each of the Prior Advisory Agreements and thus resulted in the automatictermination of each of the Prior Advisory Agreements.
The Board of Trustees of the Funds therefore met at an in-person meeting of the Board that washeld on September 21, 2018 at which the members of the Board approved proposed newInvestment Advisory Agreements (the “New Advisory Agreements”) with respect to the Fundsbetween the Adviser, under its new ownership arrangements (referred to herein solely for thesepurposes as “New TWI”) and the Trust, on behalf of the Funds, and the New AdvisoryAgreements were approved by shareholders of each respective Fund at a Special Meeting ofShareholders that was held on November 30, 2018.
In accordance with relevant provisions of the 1940 Act, the Board of Trustees of the Funds wasrequired to consider the initial approval of each of the New Advisory Agreements with NewTWI, and this action was required to take place at an in-person meeting of the Board. Therelevant provisions of the 1940 Act specifically provide that it is the duty of the Board to requestand evaluate such information as the Board determines is necessary to allow them to properlyconsider the approval of the New Advisory Agreements, and it is the duty of the investmentadviser to furnish the Trustees with such information that is responsive to their request.Accordingly, in determining whether to approve the adoption of the New Advisory Agreements,the Board of Trustees requested, and TWI provided, information and data relevant to theBoard’s consideration. This included materials prepared by the Adviser for the Board thatprovided them with information regarding the investment performance of the Funds andinformation regarding the proposed fees and expenses of the Funds, compared to other similarmutual funds.
Following their consideration and review of the New Advisory Agreements, the Trusteesdetermined that each Agreement would enable shareholders of the Fund to which it applies tocontinue to obtain high quality services at a cost that is appropriate, reasonable, and in the bestinterests of its shareholders. Accordingly, the Board, including all of the Independent Trustees,unanimously approved the adoption of the New Advisory Agreements. In reaching their
74 www.thomaswhitefunds.com

Approval of New Investment Advisory Agreements
decisions, the Trustees requested and obtained from TWI such information as they deemedreasonably necessary to evaluate the New Advisory Agreements. The Trustees also carefullyconsidered the information regarding the anticipated level of profitability of New TWI andcomparative fee, expense and performance information prepared by Trust management. TheBoard also considered the similarity of each of the New Advisory Agreements to the respectivePrior Advisory Agreements, noting that the material terms and conditions were not changing. Inconsidering the adoption of the New Advisory Agreements, the Trustees evaluated a number ofconsiderations that they believed, in light of the legal advice furnished to them by Trust counseland their own reasonable business judgment, to be relevant. They based their decisions on thefollowing considerations, among others, although they did not identify any one specificconsideration or particular information that was controlling of their decisions:
• The nature, extent and quality of the advisory services expected to be provided. TheTrustees concluded that New TWI will be capable of providing high quality services toeach Fund, as indicated by the nature and quality of services previously provided in thepast by TWI, New TWI’s expected management capabilities as demonstrated withrespect to the Funds, the professional qualifications and experience of the Funds’portfolio managers who would be working for New TWI, New TWI’s investment andmanagement oversight processes as explained to the Board, and the overall long-terminvestment performance of the Funds while under the management of TWI. TheTrustees also determined that New TWI proposed to provide investment advisoryservices that were of the same quality as services that TWI has previously provided tothe Funds in the past, and that these services are appropriate in scope and extent in lightof the Funds’ operations, the competitive landscape of the investment company businessand investor needs.
• The expected investment performance of the Funds. With respect to each Fund, theTrustees concluded on the basis of information derived from the performance data thatTWI had achieved investment performance that was competitive relative to comparablefunds over various trailing time periods, including over longer-term trailing time periods,and the Trustees took into consideration the fact that had TWI focused on long-termperformance results with respect to their management of the Funds. The Trustees tookinto consideration that all of the current co-portfolio managers of the Funds, with theexception of Mr. White, would be working at New TWI. On the basis of the Trustees’assessment of the nature, extent and quality of advisory services expected to be providedby New TWI, the Trustees concluded that New TWI would be capable of generating alevel of long-term investment performance that is appropriate in light of the Funds’investment objectives, policies and strategies and competitive with many otherinvestment companies.
• The cost of advisory services to be provided and the expected level of profitability.On the basis of comparative information derived from the expense data, the Trustees
www.thomaswhitefunds.com 75

Approval of New Investment Advisory Agreements
determined that the overall expense ratio of each Fund, on a net basis, was expected tobe competitive with industry averages, particularly with respect to mutual funds ofcomparable asset size. The Trustees also noted that New TWI had proposed to enter intoa contractual commitment for the benefit of Fund shareholders to limit the operatingexpenses of each of the classes of shares of the Funds. The Board took into considerationinformation regarding the fees that New TWI would be charging to other accounts,non-U.S. funds and private funds for similar investment advisory services, and theTrustees noted that the fees were comparable based on the relevant circumstances of thetypes of accounts involved. The Board also considered New TWI’s expected level ofprofitability with respect to its proposed management of the Funds, and noted that NewTWI’s anticipated level of profitability was acceptable and not excessive and consistentwith applicable industry averages and that New TWI expressed its commitment to usingits own resources to help grow the Funds. The Trustees also took into consideration thenature and extent of other expenses that were undertaken to be borne directly by NewTWI from its own financial resources in order to help to market and promote the Funds.Accordingly, on the basis of the Board’s review of the fees proposed to be charged byNew TWI for investment advisory services, the investment advisory and other servicesproposed to be provided to the Funds by New TWI, and the estimated profitability ofNew TWI’s relationship with each Fund, the Board concluded that the level ofinvestment advisory fees and New TWI’s anticipated level of profitability wereappropriate in light of the investment advisory fees, overall expense ratios andinvestment performance of comparable investment companies and the historicalprofitability of the relationship between each Fund and TWI. The Trustees consideredthe anticipated level of profitability of New TWI both before and after the impact of themarketing related expenses that New TWI anticipates incurring out of its own resourcesin connection with its planned management of the Funds.
• The extent to which economies of scale will be realized as the Funds grow andwhether the advisory fees reflect economies of scale. While the Funds’ investmentadvisory fees do not decrease as Fund assets grow because the Funds are not subject toinvestment advisory fee breakpoints, the Trustees concluded that the Funds’ investmentadvisory fees are appropriate in light of the current size of the Funds, and appropriatelyreflect the current economic environment for New TWI and the competitive nature of themutual fund market. The Trustees noted that New TWI had undertaken to limit theFunds’ total annual operating expenses by waiving fees and/or reimbursing certain Fundexpenses. The Trustees then noted that they will have the opportunity to periodicallyre-examine whether a Fund has achieved economies of scale, and the appropriateness ofinvestment advisory fees payable to New TWI, in the future.
• Benefits to New TWI from its relationship with the Funds (and any correspondingbenefits to the Funds). The Trustees concluded that other benefits that may be derived
76 www.thomaswhitefunds.com

Approval of New Investment Advisory Agreements
by New TWI from its relationship with the Funds, including “soft dollar” benefits inconnection with Fund brokerage transactions and use of the Funds’ performance trackrecords in advertising materials, are reasonable and fair, and consistent with industrypractice and the best interests of the Funds and their shareholders. In addition, theTrustees determined that the Funds could be expected to benefit from their relationshipto New TWI by virtue of New TWI’s proposed provision of business managementservices, in addition to investment advisory services, at a cost to the Funds that isgenerally comparable to the cost of an outside service provider, which the Trusteesdetermined to be reasonable, fair and in the best interests of Fund shareholders in light ofthe nature and quality of the services provided and the necessity of the services for theFunds’ operations. In considering information regarding the business management feespayable by the Funds to New TWI under the terms of the Business ManagementAgreement, the Board members indicated that they had considered various factors withrespect to the proposed business management fees, including the level and amount ofthese fees and the services to be provided by New TWI in connection with the BusinessManagement Agreement, in determining the reasonableness of the total fees that are tobe paid by the Funds to New TWI for the overall level of services that New TWIproposes to provide to the Funds and their shareholders. In considering the nature andextent of these non-advisory business management services that are proposed to beprovided to the Funds by New TWI, the Board took into consideration: (i) whether theBusiness Management Agreement is in the best interest of the Funds and theirshareholders; (ii) whether the services to be performed under the Business ManagementAgreement are required for the operation of the Funds; (iii) whether the servicesprovided are of a nature and quality at least equal to the same or similar servicesprovided by independent third parties; and (iv) whether the fees for the services are fairand reasonable in light of the usual and customary charges made by others for servicesof the same nature and quality.
• Other Considerations. In approving the New Advisory Agreements, the Trusteesdetermined that New TWI will be making a substantial commitment to the recruitmentand retention of high quality personnel, and has undertaken to maintain the same level offinancial, compliance and operational resources reasonably necessary to manage theFunds in a professional manner that is consistent with the best interests of the Funds andtheir shareholders that TWI has been providing. The Trustees also considered that NewTWI has undertaken to make a significant entrepreneurial commitment to themanagement and success of the Funds, which is expected to entail a substantial financialand professional commitment, including the implementation of the Expense LimitationAgreements with respect to each Fund under which New TWI has undertaken to waive aportion of its fees to the benefit of Fund shareholders to the extent necessary inaccordance with the terms of the Expense Limitation Agreements, subject to applicablerecoupment provisions. The Board also considered matters with respect to the proposed
www.thomaswhitefunds.com 77

Approval of New Investment Advisory Agreements
brokerage practices of New TWI, including its soft dollar arrangements and its best-execution procedures, and noted that these were reasonable and consistent with standardindustry practice.
In reaching their conclusion with respect to the proposed adoption of each of the New AdvisoryAgreements and the level of fees to be paid under the New Advisory Agreements, the Trusteesdid not identify any one single factor as being controlling. Rather, the Board took note of acombination of factors that had influenced their decision making process. They noted theexpected level and quality of investment advisory services proposed to be provided by NewTWI to each of the Funds, and they found that these proposed services should be expected tobenefit the shareholders of the Funds and also reflected the new management team’s overallcommitment to the continued growth and development of the Funds. Based upon theirconsideration and review of these factors and other matters deemed relevant by the Board inreaching an informed business judgment, the Trustees, including a majority of the IndependentTrustees, concluded that the terms of the New Advisory Agreements were fair and reasonable inlight of the services proposed to be provided by New TWI and the Board therefore voted toapprove the adoption of the New Advisory Agreements, as presented.
78 www.thomaswhitefunds.com

THOMAS WHITE FUNDS
TRUSTEE AND OFFICER DISCLOSURE OCTOBER 31, 2018
Name, Addressand Age
Positionsheld withFunds
Lengthof TimeServed
PrincipalOccupationDuring PastFive Years
Number ofPortfoliosoverseenby Trustee
OtherDirectorshipsHeld by Trustee
Douglas M. Jackman425 S. Financial Pl.Suite 3900Chicago, IL 6060551
Trustee,President
0 Years* President of Thomas WhiteInternational, Ltd. (since 1996)
3 None
David M. Sullivan II425 S. Financial Pl.Suite 3900Chicago, IL 60605,46
VicePresidentandTreasurer
18 years Treasurer of the Thomas White Funds;Executive Vice President of ThomasWhite International, Ltd.
N/A N/A
J. Ryan Conner425 S. Financial Pl.Suite 3900Chicago, IL 60605,38
Secretaryand ChiefComplianceOfficer
7 years Senior Vice President of Thomas WhiteInternational, Ltd.
N/A N/A
Independent Trustees:
Arthur J. Fiocco, Jr.425 S. Financial Pl.Suite 3900Chicago, IL 6060561
Trustee 3 Years Vice President of Operations of BaxterInternational, Inc. (medical products)(since 2016, prior to which he was aDirector (since 2015)); Former CorporateVice President of Hospira, Inc.(pharmaceutical company) (2004-2014).
3 None
Geri Sands Hansen425 S. Financial Pl.Suite 3900Chicago, IL 6060557
Trustee 0 Years* Retired; Co-Founder and ChiefInvestment Officer of Attucks AssetManagement, LLC (2001-2015).
3 None
Elizabeth G. Montgomery425 S. Financial Pl.Suite 3900Chicago, IL 60605,74
Trustee 17 years Retired; former President, GrahamGroup (management consulting).
3 None
Robert W. Thomas425 S. Financial Pl.Suite 3900Chicago, IL 60605,74
Trustee 12 years Retired; former President of ThomasLaboratories, Inc. (pharmaceuticalcompany).
3 None
John N. Venson425 S. Financial Pl.Suite 3900Chicago, IL 60605,71
Trustee 24 years Retired; former Dean of the CaliforniaSchool of Podiatric Medicine(2008-2017); Doctor of PodiatricMedicine.
3 None
William H. Woolverton425 S. Financial Pl.Suite 3900Chicago, IL 6060567
Trustee,Chairman
3 Years Managing Director of DMS GovernanceLtd. (fund governance) (since 2016);Former Senior Managing Director andGeneral Counsel of Gottex FundManagement (investment advisory firm)(2005-2016).
3 None
* Trustees elected through a shareholder vote held November 30, 2018
ADDITIONAL INFORMATIONThe Statement of Additional Information contains additional information regarding the Fundsand Trustees, and is available upon request without charge by calling 1-800-811-0535.
www.thomaswhitefunds.com 79

Privacy Policy
LORD ASSET MANAGEMENT TRUST
THOMAS WHITE INTERNATIONAL, LTD.
I. Commitment to Consumer* Privacy
The Thomas White Funds Family and Thomas White International, Ltd. (collectively, “we” or“us”) are committed to handling consumer information responsibly. We recognize and respectthe privacy expectations of our consumers, and we believe that the confidentiality and securityof consumers’ personal financial information is one of our fundamental responsibilities.
II. Collection of Consumer Information
We collect, retain and use consumer information only where we reasonably believe it would beuseful to the consumer and allowed by law. Consumer information collected by us generallycomes from the following sources:
• Information we receive on applications or other forms;
• Information about consumers’ transactions with us, our affiliates, or others.
III. Disclosure of Consumer Information
We may disclose all of the consumer information we collect to affiliated financial institutionsand to third parties who are not our affiliates:
• to perform marketing services on our behalf or pursuant to a joint marketing agreementbetween us and another party; and
• as otherwise permitted by law.
We do not disclose any consumer information about our former customers* to anyone except aspermitted by law.
IV. Security of Customer Information
We are committed to, and also require our service providers to:
• maintain policies and procedures designed to assure only appropriate access to, and use ofinformation about our customers; and
• maintain physical, electronic and procedural safeguards that comply with federal standardsto guard non-public personal information of our customers.
* As defined in Regulation S-P
80 www.thomaswhitefunds.com

This page is intentionally left blank.

This page is intentionally left blank.

OFFICERS AND TRUSTEESWilliam H. WoolvertonChairman of the Board
Arthur J. Fiocco, Jr.Trustee
Geri Sands HansenTrustee
Elizabeth G. MontgomeryTrustee
Robert W. ThomasTrustee
John N. Venson, D.P.M.Trustee
Douglas M. JackmanPresident and Trustee
David M. Sullivan IIVice President, Treasurer andAssistant Secretary
J. Ryan ConnerSecretary and Chief Compliance Officer
INVESTMENT ADVISOR AND OTHER SERVICE PROVIDERSThomas White International, Ltd.425 S Financial Place, Suite 3900Chicago, Illinois 60605-1028
CUSTODIANSThe Northern Trust CompanyChicago, Illinois
U.S. Bank, N.A.Milwaukee, Wisconsin
LEGAL COUNSELDechert LLPWashington, DC
INDEPENDENT REGISTERED PUBLIC ACCOUNTING FIRMTait, Weller & Baker, LLPPhiladelphia, Pennsylvania
ADMINISTRATOR and TRANSFER AGENTU.S. Bancorp Fund Services, LLCMilwaukee, Wisconsin
DISTRIBUTORQuasar Distributors, LLCMilwaukee, Wisconsin
FOR CURRENT PERFORMANCE, NET ASSET VALUE OR FOR ASSISTANCE WITH YOUR ACCOUNT,PLEASE CONTACT THE THOMAS WHITE FUNDS AT 800-811-0535 OR VISIT OUR WEB SITE ATWWW.THOMASWHITEFUNDS.COM

ww
w.th
omas
whi
tefu
nds.
com