Annual Report - Meiji Holdings€¦ · 04 Annual Report 2017 Meiji Group’s System of Principles...
90
Annual Report Year ended March 31, 2017
Transcript of Annual Report - Meiji Holdings€¦ · 04 Annual Report 2017 Meiji Group’s System of Principles...

Annual ReportYear ended March 31, 2017
SustainabilityProvides details about the latest measures the Group has taken based on the CSR philosophy outlined in this annual report Home > Sustainability
For further information, please contact:Meiji Holdings Co., Ltd.Tel: +81-3-3273-4001 (Business hours: 9:00–17:00 / except Saturdays, Sundays, and public holidays)
Editorial PolicyThe Meiji Group has issued this annual report to inform stakeholders about its business management strategies, priority measures, and CSR initiatives.
To provide further information, we have prepared our website.
http://www.meiji.com/global/

03Our Activities
for Sustainability Corporate InformationIntroduction Financial SectionOur Strategy
Contents
Notes:
The content of this annual report is predominantly based on results from fiscal 2016, ended March 31, 2017. However, the report also includes details about certain activities after fiscal 2016.
Statements with respect to plans, strategies, and future business results that are not historical facts are forward-looking statements. Meiji Holdings Co., Ltd., therefore wishes to caution that various factors could cause actual results to differ materially from those pre-sented in forward-looking state-ments. Further, unless specifically stated otherwise, information is as of August 2017.
Introduction04 Meiji Group’s System of Principles
05 The Meiji Group Now
06 The Meiji Group’s Market Presence
08 The Meiji Group’s Value Creation
26 The Meiji Group’s Sustainability Information
42 Directors and Audit & Supervisory Board Members
44 Three Outside Directors Discuss the Meiji Group
48 Corporate Governance
Our Activities for Sustainability
52 Review and Analysis of FYE March 2017 Results
56 Consolidated Balance Sheet
58 Consolidated Statement of Income
59 Consolidated Statement of Comprehensive Income
60 Consolidated Statement of Changes in Net Assets
61 Consolidated Statement of Cash Flows
62 Notes to Consolidated Financial Statements
85 Independent Auditor’s Report
Financial Section
86 Operating Bases and Group Companies
88 Corporate Data / Stock Information
89 History
Corporate Information
Our Strategy10 A Message from the President
12 Realizing Sustainable Growth and Enhancing Corporate Value
14 Financial and Non-Financial Highlights
16 Progress under Medium-Term Business Plan STEP UP 17
18 Business Results and Strategies by Segment
18 Food Segment
22 Pharmaceutical Segment
Our responsibility as “Food and Health” professionals is to continue finding
innovative ways to meet our customers’ needs, today and tomorrow.
04 Annual Report 2017
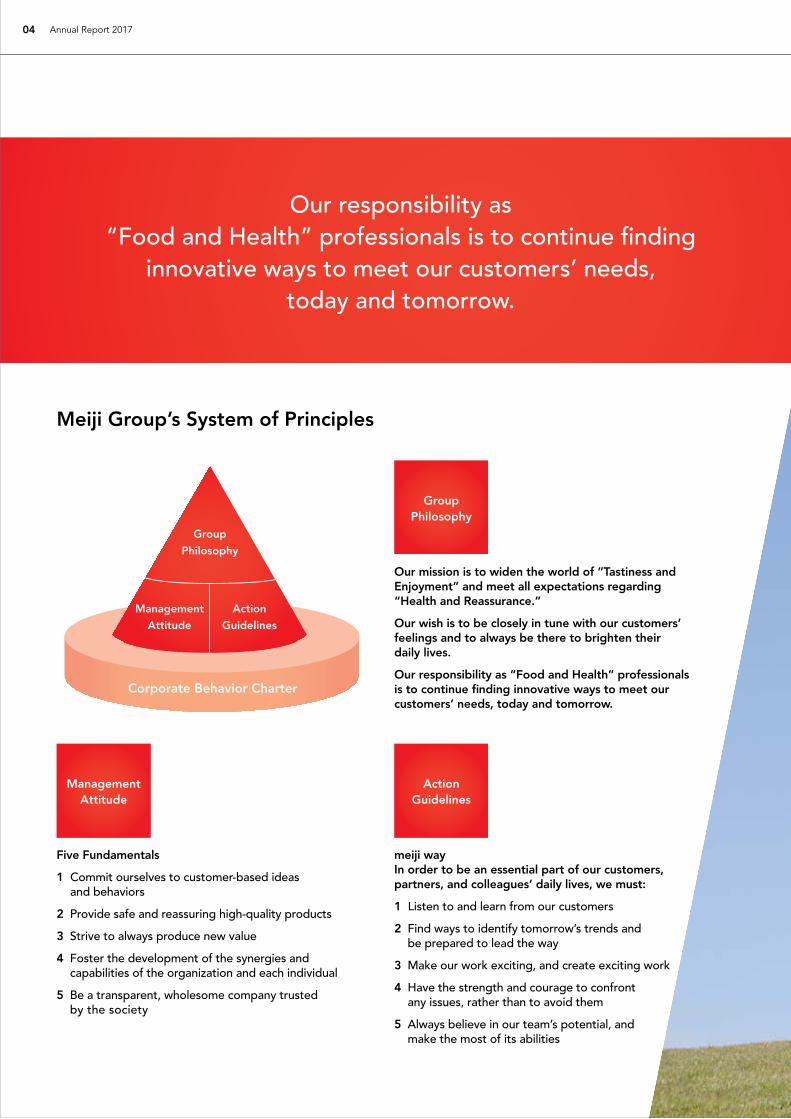
Meiji Group’s System of Principles
Management Attitude
Five Fundamentals
1 Commit ourselves to customer-based ideas and behaviors
2 Provide safe and reassuring high-quality products
3 Strive to always produce new value
4 Foster the development of the synergies and capabilities of the organization and each individual
5 Be a transparent, wholesome company trusted by the society
meiji way In order to be an essential part of our customers, partners, and colleagues’ daily lives, we must:
1 Listen to and learn from our customers
2 Find ways to identify tomorrow’s trends and be prepared to lead the way
3 Make our work exciting, and create exciting work
4 Have the strength and courage to confront any issues, rather than to avoid them
5 Always believe in our team’s potential, and make the most of its abilities
Group
Philosophy
Management
Attitude
Action
Guidelines
Corporate Behavior Charter
Action Guidelines
Our mission is to widen the world of “Tastiness and Enjoyment” and meet all expectations regarding “Health and Reassurance.”
Our wish is to be closely in tune with our customers’ feelings and to always be there to brighten their daily lives.
Our responsibility as “Food and Health” professionals is to continue finding innovative ways to meet our customers’ needs, today and tomorrow.
Group Philosophy
Our responsibility as “Food and Health” professionals is to continue finding
innovative ways to meet our customers’ needs, today and tomorrow.
05Our Activities
for Sustainability Corporate InformationIntroduction Financial SectionOur Strategy
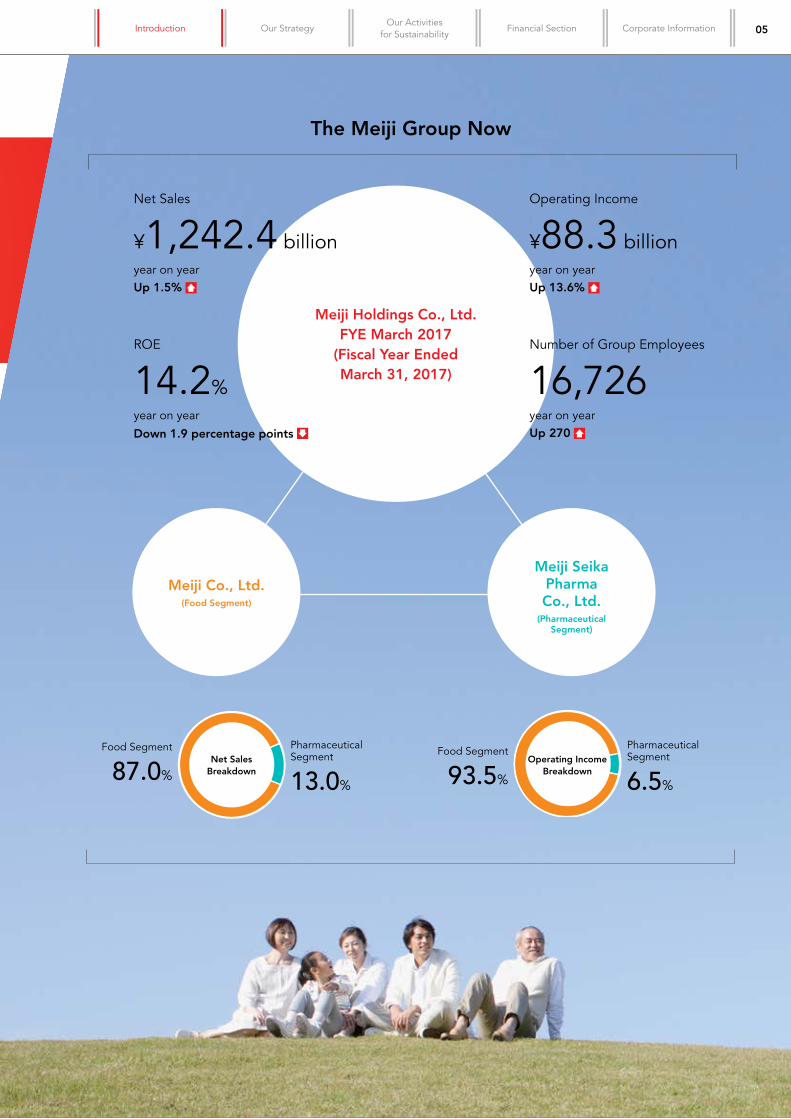
The Meiji Group Now
Net Sales Breakdown
Food Segment
87.0%
Pharmaceutical Segment
13.0%
Operating Income Breakdown
Food Segment
93.5%
Pharmaceutical Segment
6.5%
Meiji Co., Ltd.(Food Segment)
Meiji Seika Pharma Co., Ltd.
(Pharmaceutical Segment)
Number of Group Employees
16,726
year on yearUp 270
Net Sales
¥1,242.4 billion
year on yearUp 1.5%
Operating Income
¥88.3 billion
year on yearUp 13.6%
ROE
14.2%
year on year
Down 1.9 percentage points
Meiji Holdings Co., Ltd.FYE March 2017
(Fiscal Year EndedMarch 31, 2017)

06 Annual Report 2017
The Meiji Group's Market Presence
* SR I: Market value estimates based on point-of-sales data for food products and daily sundry goods that INTAGE Inc. collected from retail outlets nationwide.
The Meiji Group has established strong market positions by taking advantage of its strengths and providing unique value to its customers. Our products offer “Tastiness and Enjoyment” as well as nutrition and contribute to customers’ physical and emotional well-being. We market dairy products, confectioneries, nutritional products, and pharmaceuticals that are indispensable for daily life to customers of all ages, from infants to the elderly.
Food Segment
Drinking Milk
23.6%Source: INTAGE Inc., SRI* (drinking milk market)
April 2016–March 2017 market share (money amount)
Market Share
No.1 in Japan
Yogurt
43.7%Based on Meiji data as of March 2017
Market Share
No.1 in Japan
Food for the Elderly, Enteral Formula (consumer products)
31.4%Based on Meiji data as of March 2017
Market Share
No.1 in Japan
Chocolate
24.7%Source: INTAGE Inc., SRI* (chocolate market)
April 2016–March 2017 market share (money amount)
Market Share
No.1 in Japan

07Our Activities
for Sustainability Corporate InformationIntroduction Financial SectionOur Strategy
The Meiji Group's Market Presence
Manufacturer of Generic Drugs among Brand-Name Drug Companies
No.1in JapanSource: CRECON RESEARCH & CONSULTING, INC.,
fiscal 2016
Pharmaceutical Segment
Rice Blast Preventives(agricultural chemicals)
39.2%Source: Japan Crop Protection Association,
2016 agricultural chemical year (October 2015–September 2016)
Market Share
No.1 in Japan
Antidepressant Drugs
18.7%Copyright (c) 2017QuintilesIMS. Calculated based on JPM 2017 Mar MAT Reprinted with permission Market scope as defined by Meiji Seika Pharma
Market Share
No.2 in Japan
Systemic Antibacterial Drugs
14.3%Copyright (c) 2017QuintilesIMS. Calculated based on JPM 2017 Mar MAT Reprinted with permission Market scope as defined by Meiji Seika Pharma
Market Share
No.1 in Japan

Unique Strengths
Human resources supporting growth
Management policy and strategies
Corporate governance
Experience and knowledge accumulated over 100 years
08 Annual Report 2017
Unique Strengths
The Meiji Group’s Value Creation
Since our founding in 1916, as “Food and Health” professionals we have been innovating to meet our customers’ needs by drawing on our extensive experience and accumulated knowledge and by taking advantage of unique strengths. Because we have followed this process for 100 years, we have been able to brighten customers’ daily lives and earn widespread recognition and endorsement—from society and customers—for meiji as a trusted corporate brand. We will continue heightening customers’ trust in us.
Trust fromcustomers
Unique StrengthsUnique Strengths
Quality that ensures safety and reliability
Marketing and sales
capabilities
Uni
que
Stre
ngths
Tastiness, Enjoyment, Health, and Reassurance
The Meiji Group’s Products,Services, and Information
Wealth of superior materials and outstanding R&D capabilities
Uni
que
Strengths

09Our Activities
for Sustainability Corporate InformationIntroduction Financial SectionOur Strategy
Contribution to
the Food and
Health fields

10 Annual Report 2017
A Message from the President
Preparing the Meiji Group 2026 VisionIn 2010, the Meiji Group prepared the Meiji Group 2020 Vision as a long-term guide for the Group’s business management. Based on this vision, we are implementing the medium-term business plan ”STEP UP 17,“ which covers fiscal 2015 through fiscal 2017. We have surpassed this plan’s earnings targets significantly and grown returns to shareholders every year. As for corporate governance, we increased the number of outside directors from two to three in June 2016. Also, in June 2017 we revised executive compensation by increasing the percentage of performance-linked compensation and introducing a restricted stock compensation plan. We enhanced the transparency and objectivity of business management and created a shared interest between executives and shareholders. In this way, we have established a system that increases executives’ motivation to accomplish management goals. In light of the abovementioned achievements and to tackle new management challenges, we reconsidered our long-term vision. As a result, we prepared Meiji Group 2026 Vision (outline) and announced it in May 2017. At this juncture, however, we have only established a Groupwide vision (outline). We plan to establish a vision for each business in fiscal 2017. We will provide details in May 2018, when announcing the medium-term management plan for fiscal 2018 through fiscal 2020.
The Meiji Group will sustain growth by creating progressive value in Food and Health in Japan and worldwide.
Masahiko MatsuoPresident and Representative Director
11Our Activities
for Sustainability Corporate InformationIntroduction Financial SectionOur Strategy
Meiji Group 2026 Vision (outline)The Meiji Group’s Target Corporate ProfileThe Meiji Group will combine advantages cultivated over the past 100 years with new technology and knowledge to create progressive value in the Food and Health fields. We will keep growing in Japan and overseas.
Sustaining GrowthIn preparing the Meiji Group 2026 Vision, we are focusing on following three operating environment trends.
In Japan, the population is decreasing and rapidly aging, and people are increasingly interested in extending healthy life expectancy and preventing disease. Meanwhile, some surveys indicate that the middle class* is accounting for a larger percentage of populations of certain Asia and African countries. Consequently, as purchasing power rises, demand for luxury food products and health-related products is expected to grow. Finding ways to access overseas markets that promise dramatic expansion will be the key to the Meiji Group’s long-term sustained growth.
* Social group living on US$5 or more but less than US$50 per day
Given these trends, the Meiji Group 2026 Vision sets out the following key strategies for sustaining growth.
In Japan, our core businesses will secure overwhelming advantages, enhance profitability, and become cash cows. Overseas, products catering to consumer health consciousness and aging societies will be our advantages. Since we have many products with distinctive features in Japan, we can offer new value and inno-vate and develop high-value-added overseas businesses that contribute to earnings. We will apply advanced knowledge accumulated in the nutrition and pharmaceutical fields and utilize open innovation to provide new nutritional value in the health and disease prevention field. We will address social issues to enhance the physical and mental health of people worldwide and increase corporate value. The Meiji Group will sustain growth by earning the trust of customers in Japan and worldwide while creating progressive value in the Food and Health fields continuously.
Meiji Group 2026 Vision Targets
Operating income growth rate
Mid-to-high single-digit CAGR
Overseas sales ratio
20% or more
ROE
Maintain at 10% or more
Operating Environment Trends
1. Aging society2. Increasing consciousness of health and disease prevention3. Growing middle class globally
Meiji Group 2026 Vision Key Strategies
1. Secure overwhelming advantages in core businesses
2. Establish growth foundations in overseas markets
3. Create new nutritional value4. Address social issues
12 Annual Report 2017
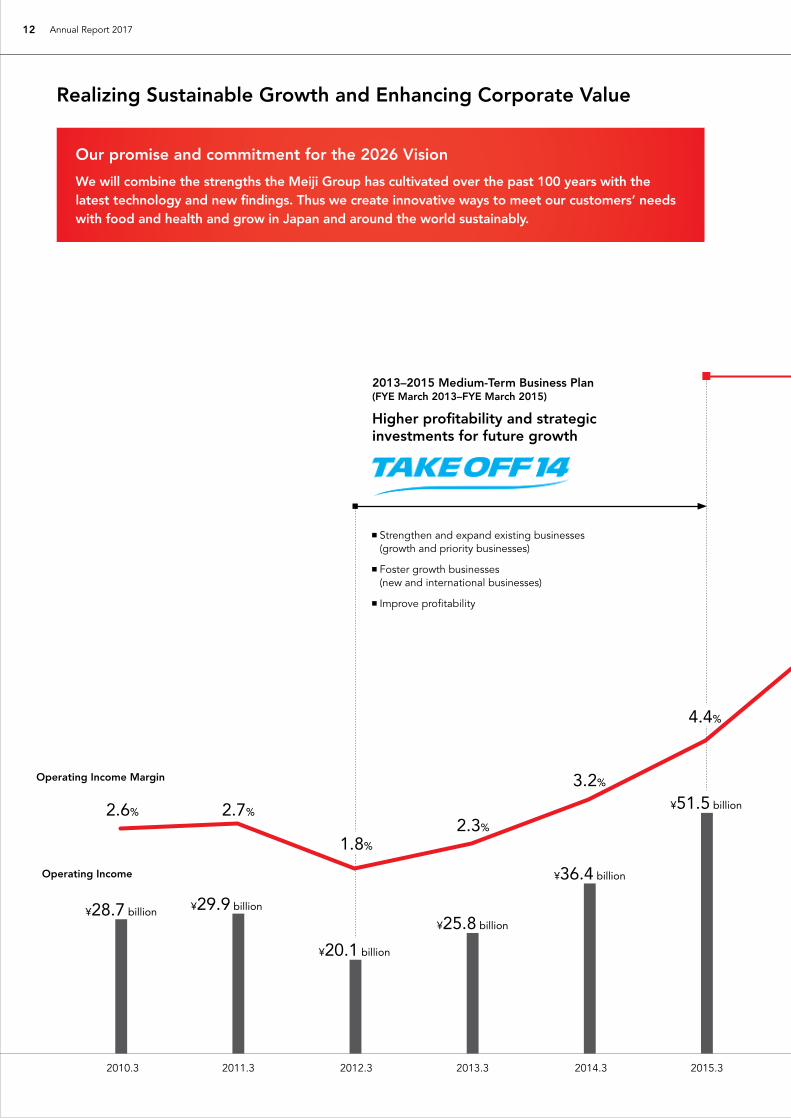
Higher profitability and strategic investments for future growth
Operating Income
2014.32013.3
Strengthen and expand existing businesses (growth and priority businesses)
Foster growth businesses (new and international businesses)
Improve profitability
Realizing Sustainable Growth and Enhancing Corporate Value
Our promise and commitment for the 2026 Vision
We will combine the strengths the Meiji Group has cultivated over the past 100 years with the latest technology and new findings. Thus we create innovative ways to meet our customers’ needs with food and health and grow in Japan and around the world sustainably.
¥28.7 billion
2013–2015 Medium-Term Business Plan(FYE March 2013–FYE March 2015)
2015.3
2.6%
Operating Income Margin
2012.32011.32010.3
2.7%
1.8%
2.3%
4.4%
3.2%
¥29.9 billion
¥20.1 billion
¥25.8 billion
¥36.4 billion
¥51.5 billion

13Our Activities
for Sustainability Corporate InformationIntroduction Financial SectionOur Strategy
2017.32016.3
Accelerate growth and achieve further improvement in profitability
2016–2018 Medium-Term Business Plan(FYE March 2016–FYE March 2018)
Strengthen priority businesses and take on challenges for future growth
Improve profitability to withstand harsh economic environments
Pursue global expansion
Evolve the management system
6.4%
7.1%
¥77.7 billion
¥88.3 billionOperating income CAGR*
Mid to high single-digit growth
Overseas sales ratio
20% or more
ROE Maintain
10% or more
* CAGR: Compound annual growth rate (%)
Operating income level
about ¥120 billion
Set up next Medium-Term Business Plan in FYE March 2018
Target for
2026 Vision
2018.3
2020
2023
2026

14 Annual Report 2017
Financial and Non-Financial Highlights
Net Sales(Billions of yen)
Operating Income / Operating Income Margin(Billions of yen) (%)
Operating income (Left scale) Operating income margin (Right scale)
ROE(%)
EPS(Yen)
80
60
40
100
0
25.8
2.3
36.4
3.2
77.7
6.4
20
8
6
4
10
0
2
51.5
4.4
¥88.3(+13.6%)
7.1%
13.3 14.3 15.3 17.316.3
1,200
900
600
1,500
0
13.3 14.3 15.3 17.316.3
1,126.5 1,148.0
1,223.7
300
1,161.1
¥1,242.4(+1.5%)
15
10
5
20
0
5.5 6.0
16.1
8.9
14.2%
13.3 14.3 15.3 17.316.3
400
300
200
100
500
0
112.99 129.40
425.06
209.79
¥413.11
13.3 14.3 15.3 17.316.3

15Our Activities
for Sustainability Corporate InformationIntroduction Financial SectionOur Strategy
Millions of yenThousands of U.S. dollars*1
(Fiscal years ended March 31) 2013 2014 2015 2016 2017 2017
For the fiscal year
Net sales ¥1,126,520 ¥1,148,076 ¥1,161,152 ¥1,223,746 ¥1,242,480 $11,074,785
Food segment 1,001,551 1,015,265 1,021,806 1,061,398 1,082,115 9,645,383
Pharmaceutical segment 127,361 135,105 141,338 164,542 161,620 1,440,599
Cost of sales 743,835 754,013 757,766 778,184 781,153 6,962,771
Selling, general and administrative
(SG&A) expenses 356,825 357,565 351,842 367,780 372,931 3,324,108
Operating income 25,859 36,496 51,543 77,781 88,395 787,905
Ordinary income 29,131 39,089 53,582 81,826 88,839 791,862
Profit attributable to owners of parent 16,646 19,060 30,891 62,580 60,786 541,816
Capital expenditures*2 35,275 44,407 62,152 40,078 48,670 433,824
Research and development costs 26,199 26,067 26,105 27,308 26,162 233,195
Depreciation and amortization*3 40,821 40,972 41,885 42,077 45,872 408,878
Net cash provided by operating activities 50,622 63,847 86,487 105,155 81,888 729,913
At fiscal year-end
Total assets ¥ 785,514 ¥ 779,461 ¥ 877,367 ¥ 856,115 ¥ 883,895 $ 7,878,559
Total net assets 320,609 328,121 380,302 419,152 457,190 4,075,147
Yen U.S. dollars*1
Per share data*4
Profit ¥ 112.99 ¥ 129.40 ¥ 209.79 ¥ 425.06 ¥ 413.11 $ 3.68
Net assets*5 2,127.28 2,175.98 2,515.26 2,777.28 3,064.91 27.32
Cash dividends 40 40 50 90 110 0.98
Ratios (%)
ROE 5.5 6.0 8.9 16.1 14.2
ROA 2.2 2.4 3.7 7.2 7.0
Other data
Energy consumption volume
(Fuel oil conversion: 1,000 kl)*6, 7 258 256 253 249 245
CO2 emissions (1,000 t-CO2)*6, 7 524 559 552 537 513
Trends in industrial waste volume (1,000t)*6 81 72 74 56 54
N umber of employees 14,819 15,033 16,559 16,456 16,726
(Average number of part-time employees not included in above figures) (10,919) (9,366) (10,295) (10,003) (9,654)
*1. U.S. dollar amounts are provided solely for the convenience of readers based on an exchange rate of US$1 = ¥112.19, the exchange rate prevailing on March 31, 2017.*2. Figures for capital expenditures only represent property, plants and equipment based on the consolidated statement of cash flows.*3. Figures for depreciation and amortization represent property, plants and equipment and intangible fixed assets based on the consolidated statement of cash flows.*4. Figures per share are calculated by retroactively applying the number of shares resulting from the two-for-one stock split carried out on October 1, 2015.*5. Net assets per share = (Total net assets – Non-controlling interests) ÷ (Number of shares of common stock issued – Number of shares of treasury stock)*6. Based on figures for the Meiji Group's main domestic subsidiaries.*7. Re-calculated in accordance with the new standard method.

16 Annual Report 2017
Progress under Medium-Term Business Plan STEP UP 17
In fiscal 2015, ended March 31, 2016, we began implementing the strategies based on STEP UP 17. The main focus of the medium-term business plan is to accelerate growth and achieve further improvement in profitability.
1 Strengthen priority businesses and take on challenges for future growthFood:
Selection and concentration - Sales ratio of core products increased
Pharmaceutical:
Launched new products in core domains, contribution to income expected in and after FYE March 2018
2 Improve profitability to withstand harsh economic environmentsFood:
Increased income, steady advancement of structural reforms
Pharmaceutical:
Delay in realization of strategy benefits, drastic change in business environment
4 Evolve the management system
Reviewed directors’ compensation structure
Improved management transparency and objectivity - increased number of outside directors
3 Pursue global expansionFood:
Broke even overall for overseas businesses
Pharmaceutical:
Increased presence as income contributor
Summary—Progress in STEP UP 17 Basic Policies

17Our Activities
for Sustainability Corporate InformationIntroduction Financial SectionOur Strategy
STEP UP 17 targetsFYE March 2016business results
FYE March 2017business results
FYE March 2018plan
Net sales ¥1,260.0 billion ¥1,223.7 billion ¥1,242.4 billion ¥1,261.0 billion
Operating income ¥64.0 billion ¥77.7 billion ¥88.3 billion ¥94.5 billion
Operating income margin 5% 6.4% 7.1% 7.5%
ROE more than 8% 16.1% 14.2% 13.2%
Consolidated overseas sales ¥104.0 billion ¥80.2 billion ¥76.9 billion ¥80.8 billion
Investment amounts ¥188.0 billion* ¥42.3 billion ¥50.4 billion ¥66.9 billion
R&D costs ¥81.7 billion* ¥27.3 billion ¥26.1 billion ¥26.0 billion
* Cumulative 3-year total
Consolidated Growth Target
Growth Targets by Business Segment
STEP UP 17 targets FYE March 2016business results
FYE March 2017 business results
FYE March 2018plan
Food segment
Net sales ¥1,080.0 billion ¥1,061.3 billion ¥1,082.1 billion ¥1,087.0 billion
Segment income ¥50.0 billion ¥68.2 billion ¥82.9 billion ¥84.0 billion
Pharmaceutical segment
Net sales ¥180.0 billion ¥164.5 billion ¥161.6 billion ¥175.6 billion
Segment income ¥14.0 billion ¥10.1 billion ¥5.7 billion ¥11.0 billion
Analysis of Change in Operating Income (Billions of yen)
Impact of drug price revisions
Increase due to increased sales
Cost of goods sold decrease
Change in other SG&A expenses
Other (including changein results of subsidiaries)
FYE March 2017
FYE March 2016 77.7
88.3
+15.9
–9.2
+6.8
-5.0
+2.1

18 Annual Report 2017
Business Results and Strategies by Segment
Food Segment
Business Results and Plans(Billions of yen) (Billions of yen)
Net sales (Left scale) Segment income (Right scale)
13.3 14.3 15.3 16.3 18.3 (Plan)17.30
300
600
900
1,200
0
25
50
75
100
1,001.5
19.3
1,015.2 1,021.8 1,061.3 1,087.0
68.2
1,082.182.9 84.0
41.6
28.1
Net Sales by BusinessFYE March 2017
Fresh and Fermented Dairy Business 40.7%Yogurt, drinking milk, beverages, etc.
Other Business 26.8%Overseas, food stuffs, livestock products, sugar and corn sweeteners, transportation, etc.
Processed Food Business 13.7%Cheese, butter and margarine, cream, ice cream, frozen food, etc.
Confectionery Business 12.0%Chocolate, gummies, chewing gum, etc.
Nutritionals Business 6.8%Sports nutrition, infant formula, enteral formula, beauty supplements, OTC drugs, etc.
We will maintain a balance between sales in Japan and overseas while increasing sales of core products that enjoy competitive advantages.
Kazuo KawamuraPresident and Representative Director
Meiji Co., Ltd.

19Our Activities
for Sustainability Corporate InformationIntroduction Financial SectionOur Strategy
In fiscal 2016, ended March 31, 2017, we achieved favorable results, posting year-on-year increases of 2.0% in net sales to ¥1,082.1 billion and 21.5% in operating income to ¥82.9 billion. Earnings grew significantly due to product mix improvement that resulted from allocating our resources to core products, reduction of logistics costs, and decreases in raw material costs.
FYE March 2017 Results
Allocating Our Resources to Core Products
The fresh and fermented dairy business continued to perform well. Plain yogurt sales were up 4.1% year on year thanks to successful marketing to create demand by proposing a vari-ety of eating styles. Functional yogurt sales grew a significant 12.1% year on year, to approximately ¥120 billion, reflecting continuing strong demand.
Japan’s Yogurt Market Size* and the Meiji Group’s Sales of Yogurt Products(Billions of yen) (Billions of yen)
Yogurt products (Left scale) Market size (Right scale)* Market size based on Meiji Holdings’ research
240
0
400
180 300
120 200
60 100
0
13.3 14.3 15.3 16.3 17.3 18.3
400.5
Target
Sales of Functional Yogurts(Billions of yen) 125
0
75
100
50
25
13.3 14.3 15.3 16.3 17.3 18.3
119.6 122.4
Target
212.0206.2
Sales of Meiji Bulgaria Yogurt(Billions of yen) 100
0
60
80
40
20
13.3 14.3 15.3 16.3 17.3 18.3Target
80.3 81.6
Meiji Bulgaria Yogurt
Functional Yogurts
20 Annual Report 2017
Business Results and Strategies by Segment
Food Segment
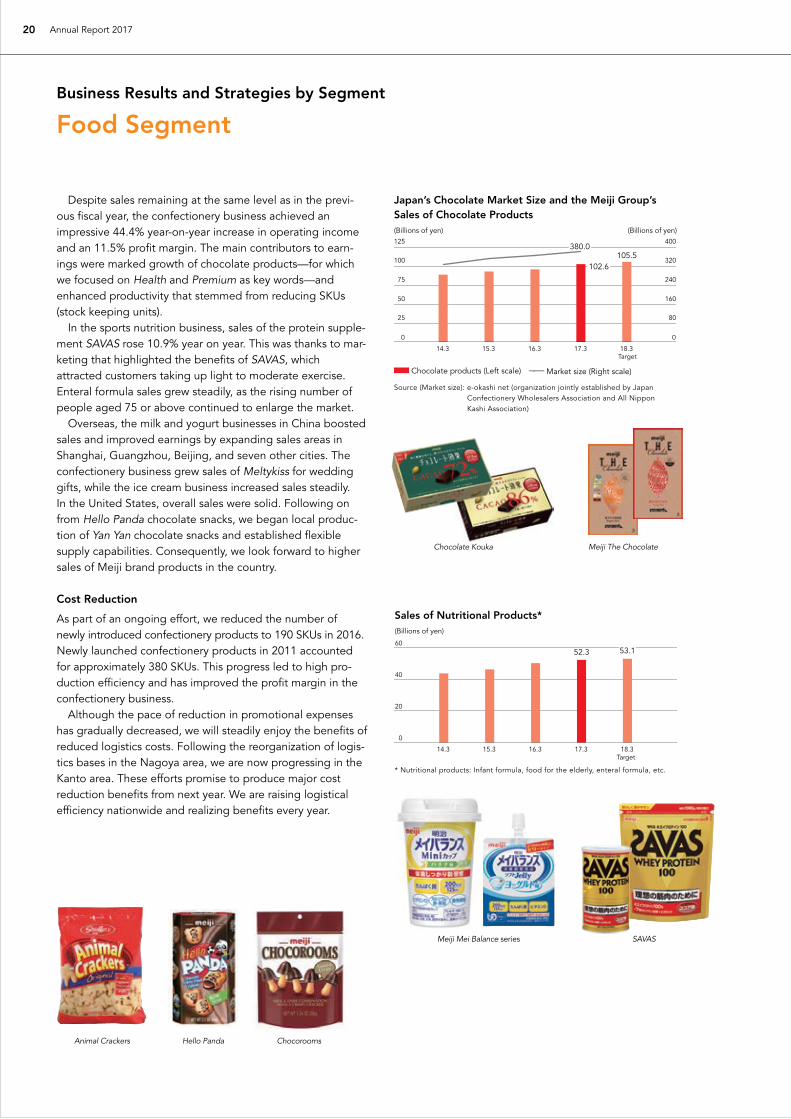
Despite sales remaining at the same level as in the previ-ous fiscal year, the confectionery business achieved an impressive 44.4% year-on-year increase in operating income and an 11.5% profit margin. The main contributors to earn-ings were marked growth of chocolate products—for which we focused on Health and Premium as key words—and enhanced productivity that stemmed from reducing SKUs (stock keeping units). In the sports nutrition business, sales of the protein supple-ment SAVAS rose 10.9% year on year. This was thanks to mar-keting that highlighted the benefits of SAVAS, which attracted customers taking up light to moderate exercise.Enteral formula sales grew steadily, as the rising number of people aged 75 or above continued to enlarge the market. Overseas, the milk and yogurt businesses in China boosted sales and improved earnings by expanding sales areas in Shanghai, Guangzhou, Beijing, and seven other cities. The confectionery business grew sales of Meltykiss for wedding gifts, while the ice cream business increased sales steadily.In the United States, overall sales were solid. Following on from Hello Panda chocolate snacks, we began local produc-tion of Yan Yan chocolate snacks and established flexible supply capabilities. Consequently, we look forward to higher sales of Meiji brand products in the country.
Cost Reduction
As part of an ongoing effort, we reduced the number of newly introduced confectionery products to 190 SKUs in 2016. Newly launched confectionery products in 2011 accounted for approximately 380 SKUs. This progress led to high pro-duction efficiency and has improved the profit margin in the confectionery business. Although the pace of reduction in promotional expenses has gradually decreased, we will steadily enjoy the benefits of reduced logistics costs. Following the reorganization of logis-tics bases in the Nagoya area, we are now progressing in the Kanto area. These efforts promise to produce major cost reduction benefits from next year. We are raising logistical efficiency nationwide and realizing benefits every year.
Meiji Mei Balance series SAVAS
Sales of Nutritional Products*(Billions of yen)
0
20
40
60
14.3 15.3 16.3 17.3 18.3
52.3 53.1
Target
* Nutritional products: Infant formula, food for the elderly, enteral formula, etc.
Animal Crackers Hello Panda Chocorooms
Japan’s Chocolate Market Size and the Meiji Group’s Sales of Chocolate Products(Billions of yen) (Billions of yen)125
14.3 15.3 16.3 17.3 18.3
0
400
75 240
100 320
50 160
25 80
0
102.6
380.0
Chocolate products (Left scale) Market size (Right scale)
Source (Market size): e-okashi net (organization jointly established by Japan Confectionery Wholesalers Association and All Nippon Kashi Association)
Target
105.5
Meiji The ChocolateChocolate Kouka

21Our Activities
for Sustainability Corporate InformationIntroduction Financial SectionOur Strategy
In fiscal 2017, ending March 31, 2018, the basic strategy will remain unchanged: allocate our resources to core products and promote structural reform. However, we expect earnings growth to soften given projections of a hike in raw material costs due to raw material market conditions and exchange rates.
FYE March 2018 Plans
Mainstay Product Trends
The vitality of consumer spending has been diminishing since the end of last year. Further, we are concerned about signs of lower pricing. For example, some major convenience stores and supermarkets announced price reductions in April 2017. We will not reduce the price of our products. Our strategy is to emphasize Value of our products rather than price because lower pricing will damage our products’ brand equity. Once the brand equity is damaged, it is very hard to recover. Mainstay product sales trends in the fiscal year ending March 31, 2018 will be as follows. Sales of functional yogurts are transitioning from a rapid growth phase to one of stable growth. We are aiming for annual growth between 3% and 5%. We will increase sales of plain yogurt steadily to ¥100 billion, the target we set previously. Since September last year, we started selling Meiji Oishii Gyunyu 900 mL in Kyushu areas and plan to expand the product’s sales area. Meiji Oishii Gyunyu 900 mL is our mainstay milk brand with new packaging. Thus we will improve profitability of the milk business. As for chocolate, we will continue marketing aimed at further increasing sales of premium chocolate and chocolate for health-conscious customers. Because we are forecasting sales growth, we need to raise chocolate production capacity in the near future; we will consider the timing of capital invest-ment. With the approach of the Tokyo 2020 Olympic and Paralympic Games, the protein supplement market is likely to expand. Therefore, we will increase production capacity for SAVAS to cater to market demand.
Overseas
Launched five years ago, the milk and yogurt businesses in China are close to profitability in the fiscal year ending March 31, 2018. Consequently, we look forward to becoming profit-able in China overall. The fact that the milk and yogurt busi-nesses are on the cusp of profitability in only five years gives us great confidence in the potential of China’s market. In the United States, the profitability of the confectionery business will improve significantly through full-fledged local production of high-value-added Meiji brand products, Hello Panda and Yan Yan. In Southeast Asia, we purchased shares of respective joint venture partners in Indonesia and Thailand, thereby making them wholly owned subsidiaries. We will boost confectionery buisiness futher in Southeast Asia. In the fiscal year ending March 31, 2018, we are planning to launch new product line-ups and accelerate business growth in both countries. In Taiwan, infant formula sales have been surging since we changed the local office into our subsidiary and switched to direct sales. We believe this business has a promising future. In these ways, the strategies for our overseas businesses are steadily bearing fruit. Once overseas businesses move into the black and contribute earnings in the fiscal year ending March 31, 2018, we will grow rapidly in the future.
Structural Reform
We focus on core products and streamline product lineup through the selection and concentration strategy. After com-pleting reorganization of logistics bases in the Kanto area, we will examine reorganization in the Kansai area. As the sales of some core products grow, we will need to increase their pro-duction capacity quickly. We will increase production efficiency and develop stable supply systems to establish optimal pro-duction capabilities. This will be a management task for the medium-to-long term rather than for a single year.
In Japan and overseas, business and economic conditions are not wholly favorable. However, we believe our approach can sus-tain growth. Specifically, we will maintain a balance between sales in Japan and overseas while increasing sales of core products that enjoy competitive advantages. Currently, we are preparing the next medium-term management plan, covering the period through the fiscal year ending March 31, 2021. By then, we aim to realize operating income of ¥110 billion. In May next year, we will announce a detailed plan.
For Sustained Growth

22 Annual Report 2017
Business Results and Strategies by Segment
Pharmaceutical Segment
Daikichiro KobayashiPresident and Representative Director
Meiji Seika Pharma Co., Ltd.
Business Results and Plans(Billions of yen) (Billions of yen)
Net sales (Left scale) Segment income (Right scale)
13.3 14.3 15.3 16.3 18.3 (Plan)17.30
50
100
150
200
0
4
8
12
16
6.4
127.3
8.3
135.1 141.3
164.5 161.6
5.7
175.6
11.010.110.0
Net Sales by BusinessFYE March 2017
NHI price revisions
NHI price revisions
Ethical Pharmaceuticals Business 87.9%
Agricultural Chemicals and Veterinary Drugs Business 12.1%
We will continue making an effort to ensure growth in Japan and overseas.
We Will Maintain a Balance Between Sales in Japan and Overseas While Increasing Sales of Core Products That Enjoy Competitive Advantages
23Our Activities
for Sustainability Corporate InformationIntroduction Financial SectionOur Strategy
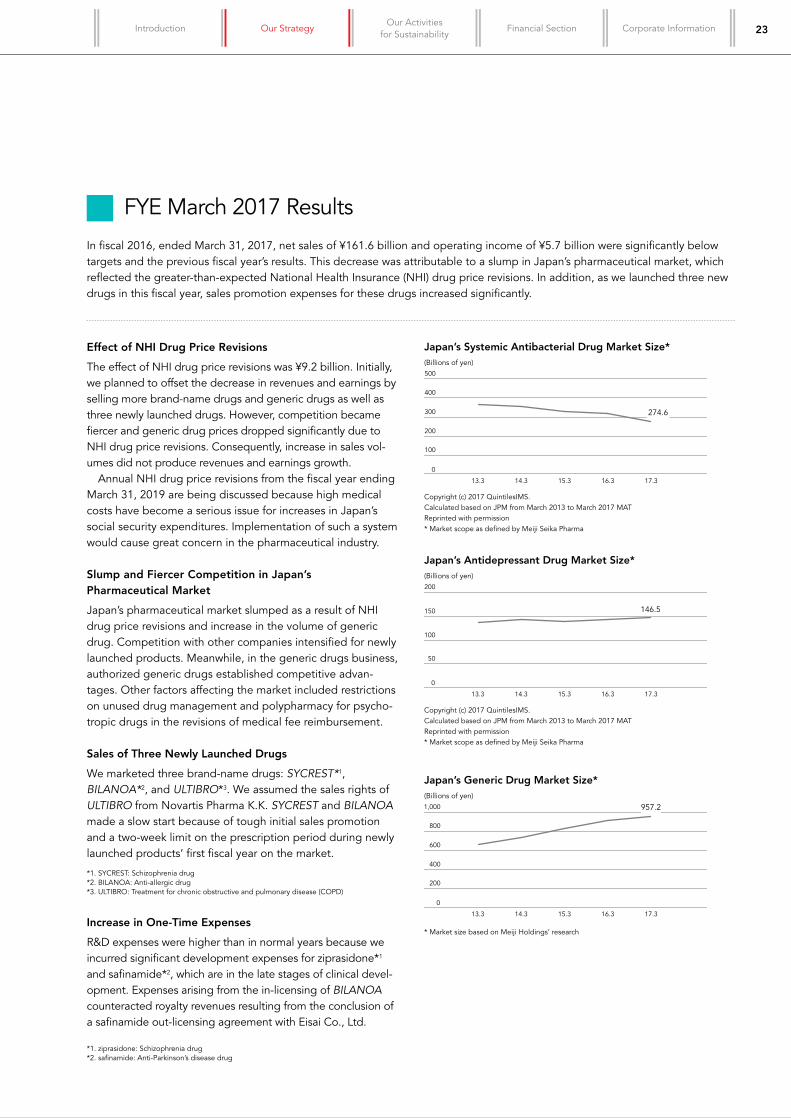
In fiscal 2016, ended March 31, 2017, net sales of ¥161.6 billion and operating income of ¥5.7 billion were significantly below targets and the previous fiscal year’s results. This decrease was attributable to a slump in Japan’s pharmaceutical market, which reflected the greater-than-expected National Health Insurance (NHI) drug price revisions. In addition, as we launched three new drugs in this fiscal year, sales promotion expenses for these drugs increased significantly.
FYE March 2017 Results
Effect of NHI Drug Price Revisions
The effect of NHI drug price revisions was ¥9.2 billion. Initially, we planned to offset the decrease in revenues and earnings by selling more brand-name drugs and generic drugs as well as three newly launched drugs. However, competition became fiercer and generic drug prices dropped significantly due to NHI drug price revisions. Consequently, increase in sales vol-umes did not produce revenues and earnings growth. Annual NHI drug price revisions from the fiscal year ending March 31, 2019 are being discussed because high medical costs have become a serious issue for increases in Japan’s social security expenditures. Implementation of such a system would cause great concern in the pharmaceutical industry.
Slump and Fiercer Competition in Japan’s Pharmaceutical Market
Japan’s pharmaceutical market slumped as a result of NHI drug price revisions and increase in the volume of generic drug. Competition with other companies intensified for newly launched products. Meanwhile, in the generic drugs business, authorized generic drugs established competitive advan-tages. Other factors affecting the market included restrictions on unused drug management and polypharmacy for psycho-tropic drugs in the revisions of medical fee reimbursement.
Sales of Three Newly Launched Drugs
We marketed three brand-name drugs: SYCREST*1, BILANOA*2, and ULTIBRO*3. We assumed the sales rights of ULTIBRO from Novartis Pharma K.K. SYCREST and BILANOA made a slow start because of tough initial sales promotion and a two-week limit on the prescription period during newly launched products’ first fiscal year on the market.
*1. SYCREST: Schizophrenia drug*2. BILANOA: Anti-allergic drug*3. ULTIBRO: Treatment for chronic obstructive and pulmonary disease (COPD)
Increase in One-Time Expenses
R&D expenses were higher than in normal years because we incurred significant development expenses for ziprasidone*1 and safinamide*2, which are in the late stages of clinical devel-opment. Expenses arising from the in-licensing of BILANOA counteracted royalty revenues resulting from the conclusion of a safinamide out-licensing agreement with Eisai Co., Ltd.
*1. ziprasidone: Schizophrenia drug*2. safinamide: Anti-Parkinson’s disease drug
We Will Maintain a Balance Between Sales in Japan and Overseas While Increasing Sales of Core Products That Enjoy Competitive Advantages
* Market size based on Meiji Holdings’ research
Japan’s Systemic Antibacterial Drug Market Size* (Billions of yen)500
0
300
400
200
100
13.3 14.3 15.3 16.3 17.3
Copyright (c) 2017 QuintilesIMS.Calculated based on JPM from March 2013 to March 2017 MATReprinted with permission* Market scope as defined by Meiji Seika Pharma
Japan’s Antidepressant Drug Market Size* (Billions of yen)200
0
150
100
50
13.3 14.3 15.3 16.3 17.3
Copyright (c) 2017 QuintilesIMS.Calculated based on JPM from March 2013 to March 2017 MATReprinted with permission* Market scope as defined by Meiji Seika Pharma
Japan’s Generic Drug Market Size* (Billions of yen)1,000
0
600
800
400
200
13.3 14.3 15.3 16.3 17.3
274.6
146.5
957.2

24 Annual Report 2017
In fiscal 2017, ending March 31, 2018, realizing returns on fiscal year ending March 31, 2017’s prior investments will be our main challenge. In the current fiscal year, we will concentrate efforts on three tasks: 1) increase sales of brand-name drugs, 2) expand the generic drug business, and 3) increase earnings of international businesses.
FYE March 2018 Plans
Increase Sales of Brand-name Drugs
We will promote brand-name drugs and generic drugs with our Speciality and Generic, fusion strategy in the priority fields of infectious diseases and drugs for central nervous system (CNS) disorders. We will grow sales by stepping up promotional activities targeting large hospitals in our strate-gic therapeutic fields, otolaryngology and psychiatry. In Japan we will keep our No. 1 market share of systemic anti-bacterial drug sales as well as the No. 2 combined market share for antidepressant drugs and antipsychotic drugs. We will increase sales of the mainstay product REFLEX. As for the newly launched SYCREST and BILANOA, the lifting of the two-week limit on the prescription period in this fiscal year will allow us to grow sales significantly. Brand-name drugs call for the provision of highly specialized information. Accordingly, our newly established Medical Science Section will accumulate scientific evidence to maximize product value and garner prescriptions.
Expand the Generic Drug Business
We will maintain the No. 1 sales of generic drugs among brand-name drug companies.Japan’s government has set out an increase in the use of generic drugs to 80% by early 2020 as a target. Thus, annual NHI drug price revisions are likely to lower generic drug prices significantly. While demand will rise, stable supplies at low prices are crucial. Our strategy to increase generic drug business is to split it into two categories: speciality generic drugs and essential generic drugs. For speciality generic drugs, our medical rep-resentatives will promote both our generic and brand-name drugs with our fusion strategy in the infectious diseases and CNS disorders fields. As for essential generic drugs, we will provide stable supplies of products at low prices without using the resources of our medical representatives in the lifestyle related diseases and gastrointestinal fields. Indian subsidiary Medreich Limited will play a major role in this effort. By importing products that Medreich manufactures at low cost, we will build a business model that can win out in price competition in Japan’s generic drug market. We believe it is a social responsibility for us to provide stable supplies at low prices for patients taking drugs over long periods of their lives.
Business Results and Strategies by Segment
Pharmaceutical Segment
The Meiji Group’s Sales of Drugs for CNS Disorders(Billions of yen)40
0
30
20
10
13.3 14.3 15.3 16.3 17.3 18.3
33.7
39.1
Target
The Meiji Group’s Sales of Drugs for Infectious Diseases(Billions of yen)50
0
30
40
20
10
13.3 14.3 15.3 16.3 17.3 18.3
36.6 37.9
Target
The Meiji Group’s Sales of Generic Drugs(Billions of yen)50
0
30
40
20
10
13.3 14.3 15.3 16.3 17.3 18.3
42.548.3
Target
Antibiotic MEIACT Calcium channel blocker AMLODIPINE TABLETS MEIJI
Antidepressant drug REFLEX

25Our Activities
for Sustainability Corporate InformationIntroduction Financial SectionOur Strategy
Increase Earnings of International Businesses
The pharmaceutical markets in ASEAN countries are expand-ing as they develop social security systems. Our subsidiaries, PT. Meiji Indonesian Pharmaceutical Industries and Thai Meiji Pharmaceutical Co., Ltd. will accelerate business expansion. Further, we will expand our exporting business to Vietnam. Medreich of India will also add ASEAN countries to its exist-ing sales areas of Europe and Africa.
Biopharmaceutical Business
Biopharmaceuticals have greater growth potential than small molecule compounds. We established DM Bio Limited, a joint venture with Dong-A Socio Holdings Co., Ltd. of South Korea. DM Bio will conduct research and development focused on biosimilars. It began Contract Manufacturing Organization (CMO) operations for biopharmaceuticals in fiscal year ended March 31, 2017 and plans to increase the range of products that it manufactures.
In Japan, the number of people aged 75 or over is projected to rise markedly. In 2020, the number of people in this category will surpass those aged between 65 and 74. By 2025, there will be 20 million people aged 75 or over. As the elderly increase in number, medical and healthcare demands will grow. The sales volume of generic drugs will increase but further drug price revi-sions will continue as the government is keen to reduce its fiscal burden in Japan. In response to these conditions, Meiji Seika Pharma has been making an effort to ensure growth in Japan and overseas. In Japan, we will promote brand-name drugs and generic drugs with the Speciality and Generic, fusion strategy and steadily expand sales, as mentioned above. We will manufacture generic drugs in Medreich and provide a stable supply of high-quality products at low prices. Thus, we will secure profits despite frequent NHI drug price revisions. In international businesses, Medreich will grow CMO and contract development and manufacturing organization (CDMO) businesses and increase sales in the ASEAN region. Through collaborations with academic institutions, we will use open innovation to acquire technology, discover new drug can-didates, and build networks of contacts.
For Sustained Growth
2018.3 2019.3 2020.3
2018.3 2019.3 2020.3
Infe
ctio
us
dis
ease
s ME1111: In-house / Antionychomycosis
OP0595: In-house / Out-licensed to F. Hoffmann-La Roche / β-lactamase inhibitor
DEPROMEL (SME3110 Fluvoxamine): SSRI, Pediatric OCD / Expanded indication
REFLEX (Org3770 Mirtazapine): Fibromyalgia treatment / Expanded indication
ME2112 (Ziprasidone): Antipsychotic
ME2125 (Safinamide): In-house / Out-licensed to Eisai / Anti-Parkinson’s disease
ME1100 (ARBEKACIN): In-house / HABP / VABP
DMB-3111 (Trastuzumab biosimilar): In-house / Out-licensed to Gedeon Richter / Breast cancer, Gastric cancer
DMB-3113 (Adalimumab biosimilar): In-house / Rheumatoid Arthritis / TNF α inhibitor
CN
S d
iso
rder
sN
ew fi
eld
s
R&D Pipeline of Ethical Pharmaceuticals 2018.3 2019.3 2020.3
Phase II
Phase Ib
Phase I
R&D Pipeline of Agricultural Chemicals
R&D Pipeline of Veterinary Drugs
Approve
ME5382 (Flupyrimin): Insecticide
ME4129: Injectable antibacterial drugs / Expanded indication
ANM-138 (Flometoguin): In-house / Joint development with Nippon Kayaku / Insecticide
ME4137: Injectable antibacterial drugs
ME5223 (Fenpicoxamid): In-house / Out-licensed to Dow AgroSciences / Fungicide
ME4624 (Vaccine)
ME5343 (Afidopyropen): In-house with Kitasato Institute / Out-licensed to BASF / Insecticide
ME4136: Injectable antibacterial drugs
Applied
SP-02L (Darinaparsin): Relapsed and refractory peripheral T-cell lymphoma (PTCL)
Phase III including long-term study
Phase II / III
Phase II
Applied
Approve
Approve
Apply
Apply
Apply Approve
Approve
Approve
Approve
Japan Overseas
FYE
FYE
FYE
Phase II
Phase I
ApproveApplied
Apply
Apply
Applied
26 Annual Report 2017
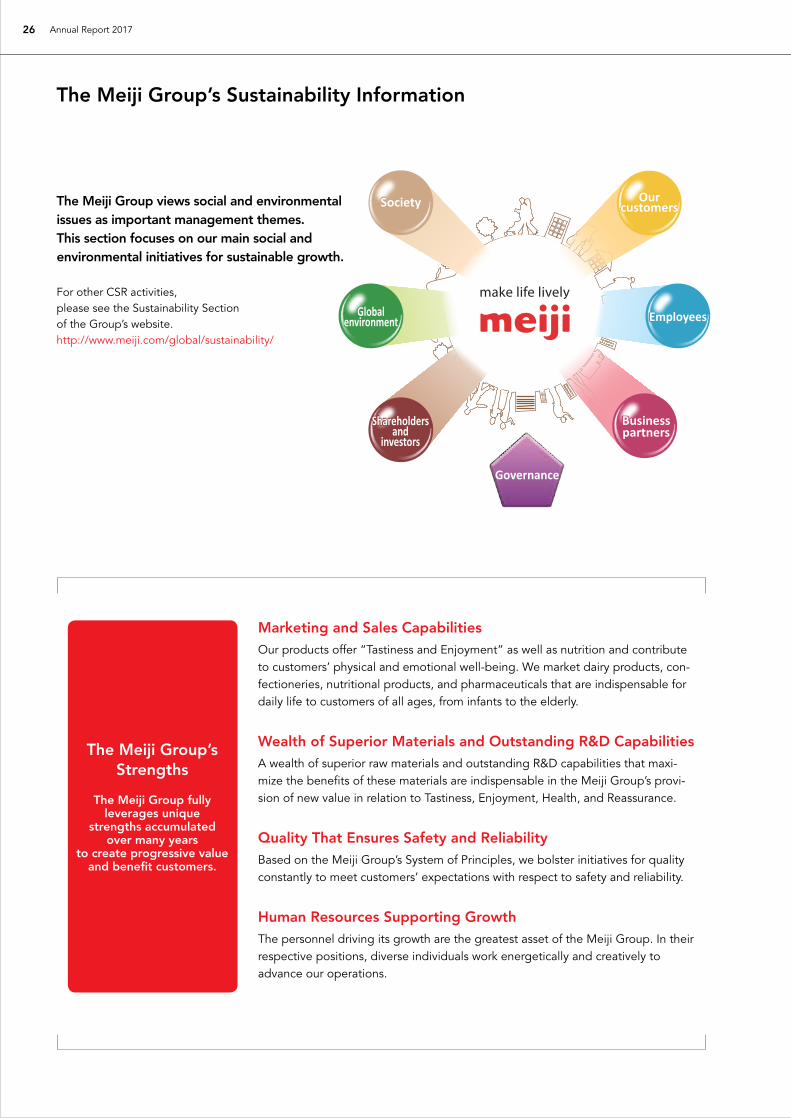
The Meiji Group’s Sustainability Information
The Meiji Group views social and environmental issues as important management themes. This section focuses on our main social and environmental initiatives for sustainable growth.
For other CSR activities, please see the Sustainability Section of the Group’s website.http://www.meiji.com/global/sustainability/
The Meiji Group’s Strengths
The Meiji Group fully leverages unique
strengths accumulated over many years
to create progressive value and benefit customers.
Marketing and Sales CapabilitiesOur products offer “Tastiness and Enjoyment” as well as nutrition and contribute to customers’ physical and emotional well-being. We market dairy products, con-fectioneries, nutritional products, and pharmaceuticals that are indispensable for daily life to customers of all ages, from infants to the elderly.
Wealth of Superior Materials and Outstanding R&D CapabilitiesA wealth of superior raw materials and outstanding R&D capabilities that maxi-mize the benefits of these materials are indispensable in the Meiji Group’s provi-sion of new value in relation to Tastiness, Enjoyment, Health, and Reassurance.
Quality That Ensures Safety and ReliabilityBased on the Meiji Group’s System of Principles, we bolster initiatives for quality constantly to meet customers’ expectations with respect to safety and reliability.
Human Resources Supporting GrowthThe personnel driving its growth are the greatest asset of the Meiji Group. In their respective positions, diverse individuals work energetically and creatively to advance our operations.

27Our Activities
for Sustainability Corporate InformationIntroduction Financial SectionOur Strategy
Basic ApproachThe Meiji Group’s mission is to enrich the daily lives of cus-tomers of all ages, from infants to the elderly, by providing them with “Tastiness and Enjoyment” as well as products that contribute to their physical and emotional well-being.
R&D SystemThe Meiji Group conducts R&D in the Food segment and the Pharmaceutical segment. In fiscal 2016, total R&D expenses were ¥26.1 billion, up from ¥23.8 billion in fiscal 2011, when we established our present business management system. In the Food segment, we conduct R&D at two bases: Tsurugashima in Saitama Prefecture and Odawara in Kanagawa Prefecture. The R&D Division comprises five labo-ratories—Confectionery R&D Labs., Research & Development Labs., Food Science Research Labs., Food Technology Research Labs., and Food Quality Research Labs. The Research Planning Department has overall control of these laboratories. In 2018, we will establish new laboratories in Hachioji, Tokyo, and integrate our R&D functions. We will consolidate in-house and external expertise and technology and establish advanced, influential laboratories that achieve breakthrough innovation. In the Pharmaceutical segment, we create valuable prod-ucts by conducting in-house R&D at a research center and three laboratories: Pharmaceutical Research Center, CMC Laboratories, Bioscience Laboratories, and Agricultural & Veterinary Research Laboratories. We have begun collaborative research efforts with aca-demic institutions in new fields of innovative pharmaceuticals, including autoimmune disease and cancer treatments and regenerative medicine.
Superior Materials and R&D CapabilitiesIn the Food segment, we have been conducting extensive research to offer new nutritional value to customers. Our functional yogurts were developed through research on lactobacilli. In the Food Science Research Labs., we have a lactobacillus library that contains approximately 5,500 strains of lactobacilli. Also, we have garnered considerable expertise in relation to cocoa beans through many years of experience in manufacturing and selling chocolate. We also conduct research on cacao polyphenols and cocoa proteins, and we
have shown the health benefits of chocolate. In the Pharmaceutical segment, each employee is dedi-cated to meeting all expectations regarding “Health and Reassurance” in accordance with the Group Philosophy. As well as conducting research and development in the fields of infectious diseases and central nervous system (CNS) disor-ders, we develop generic drugs and conduct research and development of agricultural chemicals and veterinary drugs.
Provision of Products for the Health ConsciousIn the Food segment, we develop products catering to health-conscious customers. For example, we offer low-sugar / low-fat drinking milk, yogurt, and margarine. Further, our use of food additives complies with laws and regulations. We have low-ered the amount of trans-fatty acids in margarine so that cus-tomers can consume it without ingesting excessive amounts of trans-fatty acids. We disclose the amount of trans-fatty acids in our margarine* on our Japanese website. Through such products, we support healthy diets.
* Our margarine products are only sold in Japan.
1 Nutrition
28 Annual Report 2017
The Meiji Group’s Sustainability Information
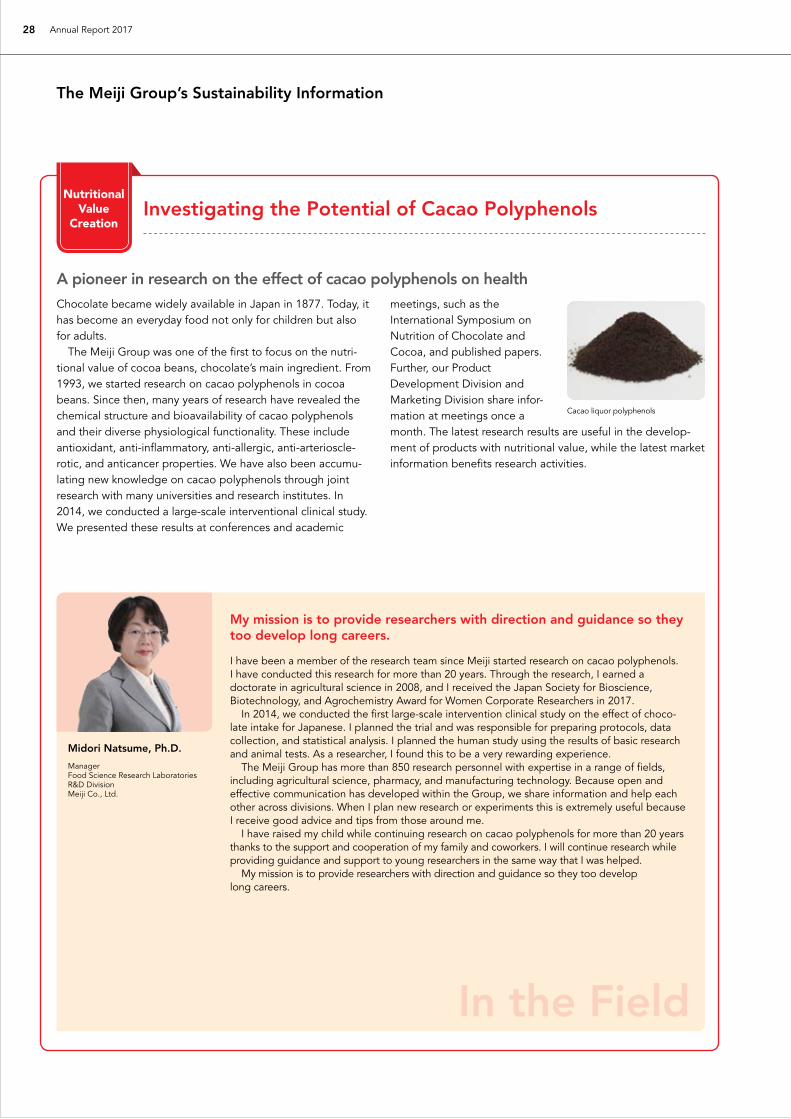
A pioneer in research on the effect of cacao polyphenols on healthChocolate became widely available in Japan in 1877. Today, it has become an everyday food not only for children but also for adults. The Meiji Group was one of the first to focus on the nutri-tional value of cocoa beans, chocolate’s main ingredient. From 1993, we started research on cacao polyphenols in cocoa beans. Since then, many years of research have revealed the chemical structure and bioavailability of cacao polyphenols and their diverse physiological functionality. These include antioxidant, anti-inflammatory, anti-allergic, anti-arterioscle-rotic, and anticancer properties. We have also been accumu-lating new knowledge on cacao polyphenols through joint research with many universities and research institutes. In 2014, we conducted a large-scale interventional clinical study. We presented these results at conferences and academic
meetings, such as the International Symposium on Nutrition of Chocolate and Cocoa, and published papers. Further, our Product Development Division and Marketing Division share infor-mation at meetings once a month. The latest research results are useful in the develop-ment of products with nutritional value, while the latest market information benefits research activities.
My mission is to provide researchers with direction and guidance so they too develop long careers.
I have been a member of the research team since Meiji started research on cacao polyphenols. I have conducted this research for more than 20 years. Through the research, I earned a doctorate in agricultural science in 2008, and I received the Japan Society for Bioscience, Biotechnology, and Agrochemistry Award for Women Corporate Researchers in 2017. In 2014, we conducted the first large-scale intervention clinical study on the effect of choco-late intake for Japanese. I planned the trial and was responsible for preparing protocols, data collection, and statistical analysis. I planned the human study using the results of basic research and animal tests. As a researcher, I found this to be a very rewarding experience. The Meiji Group has more than 850 research personnel with expertise in a range of fields, including agricultural science, pharmacy, and manufacturing technology. Because open and effective communication has developed within the Group, we share information and help each other across divisions. When I plan new research or experiments this is extremely useful because I receive good advice and tips from those around me. I have raised my child while continuing research on cacao polyphenols for more than 20 years thanks to the support and cooperation of my family and coworkers. I will continue research while providing guidance and support to young researchers in the same way that I was helped. My mission is to provide researchers with direction and guidance so they too develop long careers.
Midori Natsume, Ph.D.
ManagerFood Science Research LaboratoriesR&D DivisionMeiji Co., Ltd.
In the Field
Cacao liquor polyphenols
Investigating the Potential of Cacao PolyphenolsNutritional
Value Creation

29Our Activities
for Sustainability Corporate InformationIntroduction Financial SectionOur Strategy
We will help extend healthy life expectancy.
In Japan, it is not widely known that many of the elderly suffer from malnutrition. We believe that it is important to increase awareness of malnutrition and improve the nutrition of the elderly. We visit healthcare professionals at long-term care health facilities and in-home-care support centers and explain the risks of malnutrition and how to prevent it. They have shown great interest and incorporate what they have learned in their day-to-day duties. Often, the elderly suffer from malnutrition despite thinking that they are eating enough. We tell elderly people whose intake of essential nutrition is insufficient about the importance of meals and suggest balanced meals. We design products with customers in mind and apply the results of many years of research on infant formula. In collaboration with doctors, we conduct research on improving the nutrition and motor function of the elderly and use the accumulated data in product development. Other initiatives include designing packaging for elderly people receiving nursing care at home. Our cup-shaped container for enteral formula is slim so that the elderly can hold it easily, and we have placed an arrow showing where to push the straw through the lid. Moreover, mindful that some of the elderly find sucking through a straw difficult, we have included a thick straw and adjusted the content volume to make the product easy to drink. The basic approach to improving nutrition should be through meals. However, we believe that our enteral formula can help elderly people with malnutrition. Our enteral formula provides nutritional value to elderly people receiving nursing care at home and offers value to families by giving them peace of mind. Through these activities, we will help extend healthy life expectancy.
Yasuhiro Fuji
ManagerMedical Nutritionals DepartmentNutritionals Sales DivisionMeiji Co., Ltd.
In the Field
Educational Activities Aimed at Preventing MalnutritionNutritional
Value Creation
Malnutrition: A Social IssueJapan has become a super-aging society, with more than a quarter of its population over the age of 65. While obesity and metabolic syndrome are attracting attention, some elderly people suffer from malnutrition. Malnutrition means having insufficient nutrition to be active due to inadequate intake of
foods and protein. The elderly suffer from malnutrition because they eat less or their diets lack variety. These habits stem from changes in living situations or from weakening of bodily functions with age.
Meiji’s InitiativesWe conduct educational activities focused on malnutrition and its prevention. Our goal is for the elderly to avoid malnutrition and lead active daily lives. We hold seminars about malnutri-tion and how to prevent it that target healthcare professionals at in-home-care support centers, drug store employees, and the elderly. Specifically, we explain the nutrition and meals recommended for the elderly. Also, we explain how to make meals that are easier to eat for elderly people who have dif-ficulty swallowing. In fiscal 2016, more than 50,000 people throughout Japan participated in our seminars.
Also, we are conducting research and product development related to malnutrition. Our advantage is the unique nutrition engineering technology that we have accumulated through many years of research on infant formula. We design the nutri-tion of food products for the elderly based on clinical nutrition research focused on the elderly. Moreover, we improve exist-ing products to make them easier to handle and drink at home.

30 Annual Report 2017
Basic ApproachThe Meiji Group will win the trust and ensure the satisfaction of customers by providing safe, high-quality products and services and appropriate information.
Food SegmentQuality ControlIn the Food segment, we have established an original quality management system “Meiji Quality Communication.” The system includes the Quality Policy, Quality Assurance Regulations, and Quality Assurance Standards. Each func-tional division—development and design, procurement, manufacturing, logistics, and sales and communications— conducts operations based on the Quality Policy. Quality Assurance Regulations stipulate important items for maintain-ing quality, and Quality Assurance Standards detail specific duties and assessment criteria. The Food segment applies “Meiji Quality Communication” and conducts stringent quality control under a system that is integrated from raw material procurement through to sales. Our hygiene control system is based on the Hazard Analysis and Critical Control Point system. Some of our production lines have received Global Food Safety Initiative and other third-party certification. In addition, we conduct various testing of products before shipment, including physical and chemical tests. Through a range of tests, we check that products have been manufac-tured in accordance with established procedures.
Quality Assurance Advancement SystemIn the Food segment, the Meiji Quality Comm Review Meeting leads quality assurance advancement activities. Held biannu-ally and chaired by the president and representative director of Meiji Co., Ltd., the meeting checks the progress of quality-related initiatives and discusses measures to address issues. Further, the Food segment’s Meiji Food Safety Committee is chaired by the Director of the R&D Division and discusses a wide range of topics approximately twice a year. The commit-tee invites experts in such fields as food chemicals and micro-organisms to identify and reduce food risks. Also, in the Food segment, members of one of the special-ized teams in the Quality Department audit compliance with Quality Assurance Regulations based on a checklist. The audits identify issues and enhance quality assurance capabilities.
2 Quality
The Meiji Group’s Sustainability Information
Quality Policy
Quality Assurance Regulations
Quality Assurance Standards
Quality Policy
We intend to widen the world of “Tastiness and Enjoyment,” meet all expectations regarding “Health and Reassurance,” and provide all our customers with our “Promised Quality,” thus producing shared value. As “Food and Health” professionals with a dedication to food quality and safety, we believe our responsibility is to meet all of our customers’ expectations by following the principles below.
1. We promise to enforce strict quality assurance at every step of our food chain by implementing the best system possible in each department and for every product in order to ensure our “Promised Quality.”
2. We promise to maintain a close relationship with our customers and immediately respond to customer inquiries, questions, or concerns. We also promise to maintain the trust of our customers by understanding their expectations and constantly striving to satisfy their needs and expectations.
3. We promise to comply with all applicable laws and regulations and provide high-quality, safe products and services.
Meiji Quality Comm Review Meeting (biannual)Chairperson: President and representative director of Meiji Co., Ltd.Secretariat: Quality Management Division, Quality Auditing Department
Divisions and operating bases(Implement “Meiji Quality Communication” policy)
Meiji Quality Comm Planning Liaison CommitteeOverall control: Director, Quality Management Division
Meiji Food Safety CommitteeChairperson: Director, R&D Division
Submits food safety recommendations

31Our Activities
for Sustainability Corporate InformationIntroduction Financial SectionOur Strategy
Pharmaceutical SegmentPharmaceuticals and Medical Devices Reliability AssuranceThe Pharmaceutical segment’s Reliability Assurance Policy assures the reliability of pharmaceuticals and medical devices. It states: “We will contribute to society by earning the trust of patients and healthcare professionals.” Accurate information is essential for the appropriate use of pharmaceuticals. We make available to users all information related to our products, which we obtain during product development, clinical studies, and post-marketing surveillance. Based on the Reliability Assurance Policy, we have estab-lished the Reliability Assurance Guidelines. Based on these guidelines, we try our best to enhance the reliability of our products and activities.
Reliability Assurance Guidelines and Reliability Assurance SystemThe Ministry of Health, Labour and Welfare enforces stringent standards for all aspects of pharmaceuticals, from R&D, man-ufacturing, and shipment through to the gathering of infor-mation on adverse reactions and the provision of information on proper use. At each operational stage, we have established original standards and manuals based on laws and regulations. We ensure the reliability of data and information through rigorous efforts to conduct appropriate tests and gather accurate data from them. Moreover, the Reliability Assurance Policy is also applicable to Group companies. The Reliability & Quality Assurance Division ensures reli-ability by conducting internal audits, as required, of compli-ance with standards and policies based on the Reliability Assurance Policy. The division is independent from R&D, pro-duction, and sales departments. In this way, we have estab-lished a system that ensures reliability through objective assessment. We have established Operational Rules of Quality Management Review. This is a system that achieves continu-ous improvement through plan–do–check–act cycles aimed at not only ensuring but also enhancing product reliability. Based on the Quality Assurance Policy, the Pharmaceutical segment ensures quality globally. In these activities, we assure quality across the entire supply chain, from raw mate-rial procurement and manufacturing through to distribution and the post-marketing gathering of information on side-effects. For example, we visit not only our plants but also those of manufacturing subcontractors and raw material sup-pliers in Japan and overseas to ensure the quality of our pharmaceuticals. Pursuant to the relevant law, an authorized person approves shipment to market after checking all manufactur-ing-related records. In this way, we provide pharmaceuticals that healthcare professionals and patients can use with com-plete confidence.
GCP
• QMS : Quality Management System• GCP : Good Clinical Practice• GMP : Good Manufacturing Practice• GQP : Good Quality Practice• GVP : Good Vigilance Practice• GPSP : Good Post-marketing Study Practice
Quality Assurance Standards
Reliability Assurance Policy
Reliability Assurance Guidelines
(Supplementary)Operational Rules of Quality
Management Review
GQP GVP
Reliability Standards for Application Documents
Other activities
GCPQMS GMP GPSP

32 Annual Report 2017
Flow of information Value-adding activities
Quality Improvement and Personnel DevelopmentWe foster employees’ ability to improve operations proac-tively. We hold meetings to share and discuss the achieve-ments of quality improvement activities. Through such opportunities, we develop personnel.
Customer Help DesksWe believe that listening to customer feedback and learning from customers is important. The Food segment operates the Customer Service Center and a Counseling Office for Mothers with Infants, while the Pharmaceutical segment has a
Medicine Support Center. We respond to feedback and inquiries from customers, patients, and healthcare professionals.
Response to Quality-Related IncidentsIf a quality-related incident occurs, quality information is collected from plants, affiliated companies, and respective departments in head office; summarized; and shared with senior management. We take necessary measures and pre-ventive measures rapidly.
The Meiji Group’s Sustainability Information
Establishment of a Reliability and Quality Assurance System for Medical Devices
Meiji Seika Pharma Co., Ltd. acquired a first class medical devices marketing license, and in 2016, began the manufacture and sale of photodynamic therapy* (PDT) semiconductor lasers and related devices, which are class III specially controlled medical devices. In response, based on the Meiji Seika Pharma Reliability Assurance Policy, the Quality Assurance Department has established a strin-gent quality management system for medical devices similar to the one established for pharmaceuticals. We built a network for close collaboration with relevant organizations with our sales, research and development, and production divisions. Also, we have introduced the principle of Meiji Quality at the contract man-ufacturing facility. Our aim is to ensure the quality value of medi-cal devices and establish a highly reliable manufacturing system. Moreover, we are sourcing the latest information in Japan and overseas to improve the quality management system, thereby heightening the value of Meiji Quality. The above efforts repay the trust of patients and health-care professionals. We promote the appropriate use of products at medical institutions and improve them. At the same time, in supplying products, we assess and check the appropriateness of production control and testing for each production lot.
* PDT is a topical treatment that entails the injection of a photosensitizing agent and the use of laser light to irradiate lesions. The photosensitizing agent has a high affinity with tumors, and the laser light causes tumor tissue degeneration or necrosis. PDT is a minimally invasive treatment method. Meiji Seika Pharma has the drug and the laser equipment required for PDT.
Yasuhiro Gyobu
Quality Assurance DepartmentReliability & Quality Assurance DivisionMeiji Seika Pharma Co., Ltd.
In the Field
Quality
Laser device for photodynamic therapy (PDT)
CHECK• Results of pharmaceutical
audit/self-inspection• Information from users• Implementation status of
actions for change/deviation
• Information of regulations/guidance of regulatory authorities
ACTIONImprovement instruction
Management review
DO• Improvement of the Quality Management System• Improvement of organizations/activity process• Risk management• Human resource development
PLAN• Input of management
resources• Establishment/review of
quality objectives• Preparation of improve-
ment plan
Top ManagementQuality policies Customers
Customers/Regulatory Authorities
Information provision etc.
Regulatory information etc.
Customer satisfaction/claims
Spiral up

33Our Activities
for Sustainability Corporate InformationIntroduction Financial SectionOur Strategy
Basic ApproachAt the Meiji Group, we seek to provide our customers with high-quality, safe, and secure products. We are committed to fair and transparent transactions and maintain compliance with all laws and regulations. In cooperation with our part-ners, we work to ensure that all procurement activities fulfill our social responsibilities, including those related to human rights and the environment.
PoliciesIn April 2016, we established the Meiji Group Procurement Policy and the Meiji Group Policy on Human Rights, which are available in Japanese and English on our website. In fiscal 2016, we conducted a survey of certain raw material and packaging primary subcontractors and suppliers in Japan. We checked their measures for addressing social issues and established shared approaches.
Quality Management FrameworkIn the Food segment, we conduct document-based inspec-tions and on-site audits. When concluding contracts with new suppliers, we check whether they can supply raw materials conforming to specifications stably. When extending con-tracts, we visit suppliers and audit safety and quality to verify compliance. The Pharmaceutical segment assures quality across the entire supply chain from raw material procurement through to manufacturing, distribution, and post-marketing safety management operations. In a timely and reliable manner, we provide patients with high-quality pharmaceuticals that are safe and reassuring.
Sustainable ProcurementWe realize sustainable procurement. The quality and quantity of raw milk largely depends on the health and rearing environment of dairy cattle. Therefore, the Meiji Group collaborates with dairy farmers and agricultural cooperatives to ensure stable procurement of high-quality raw milk. Since 2009, we have been working with dairy farm-ers to enhance the value of raw milk. We support continuous and prosperous development of both dairy farmers and the dairy industry. Our key goal is to raise consumer awareness and appreciation of dairy farming’s value. As part of these efforts, we have been certifying and awarding dairy farms producing “good quality milk.” Our standards for certification include the maintenance of hygienic operations and operat-ing environments as well as the beautification of raw milk
processing rooms and cow-sheds. As of March 2017, approxi-mately 250 dairy farms had earned “good-quality-milk-pro-ducing farm” certificates. Cocoa beans, the main ingredient of chocolate, are an indis-pensable raw material for us. Worldwide demand for cocoa beans is rising rapidly. Therefore, we implement a program, Meiji Cocoa Support, to support farmers, secure multiple sup-pliers, and procure high-quality cocoa beans stably. Every year, our research personnel and technical experts visit cocoa-pro-ducing countries to check supply chains from farms through to ports. We source high-quality cocoa beans by using our origi-nal fermentation method. With local partners, we establish seedling-supply centers and hold seminars on agricultural technology that boosts harvests and controls plant diseases and insect damage. In addition, we are supporting cocoa farmers and their com-munities by, for example, building wells, donating school sup-plies, and supporting environment-friendly farming practices. Our assistance program has included support for farmers through the World Cocoa Foundation since we joined it in 2006. The foundation’s wide-ranging activities cover Africa, Latin America, and Asia. We will support the realization of sustainable farming to procure high-quality cocoa beans.
Palm Oil Procurement InitiativesThe Food segment became a member of the Roundtable on Sustainable Palm Oil (RSPO) in March 2016. By 2023, we will change over to RSPO-certified palm oil.
Meiji Group Procurement Policy / Meiji Group Policy on Human Rightshttp://www.meiji.com/global/sustainability/
Meiji Cocoa Supporthttp://www.meiji.com/global/sustainability/with-business-partners/
3 Supply Chain

34 Annual Report 2017
Stable Procurement of Cocoa
The Meiji Group’s Sustainability Information
Improving Cocoa Sustainability and
Supporting Cocoa-Producing CommunitiesFor Meiji, stable procurement of high quality cocoa is impor-tant to make delicious chocolate. Chocolate consumption has been increasing worldwide. From a long-term viewpoint, how-ever, there is concern that production of cocoa beans might not meet the demand for a number of reasons. Cocoa farmers face a number of challenges, such as aged cocoa trees, difficulties in obtaining seedlings and inputs, limited modern farming techniques, abnormal weather, and so on. Further, some cocoa-producing countries do not have adequate social infrastructure. To improve sustainable production of cocoa beans, We began Meiji Cocoa Support in 2006. Meiji personnel regularly visit cocoa-producing communities to identify their needs and decide on programs to offer support.
Through Meiji Cocoa Support, We will Continue to Contribute to the Sustainable Production of Cocoa.
In Ghana, as well as helping farmers learn about farming technology for boosting yields and pro-ducing high quality cocoa beans, we help them improve everyday life in villages. The wells we donated attract people and become the hubs of communities. Also, we are organizing art classes for children. The future of countries and cocoa production depend on coming generations. We began art classes as a way of fostering children’s imaginations. In Latin America, our activities cover agricultural technology and increasing farmers’ income. For example, we provide technical assistance on fermentation to produce high-quality cocoa beans. As a new program in Ghana, we have opened a Meiji Demonstration Farm, where farmers prac-tice techniques learned at seminars. Our aim is to have farmers experience a bountiful harvest and encourage investment in farms. As for Latin America, we have plans to distribute seedlings and establish tool banks for agricul-ture in communities and donate school equipment and stationery for children. We believe it is very important to visit cocoa-producing countries and work closely with communities and farmers. Through Meiji Cocoa Support, we will continue to contribute to the sustainable production of cocoa.
Yoshinori Doi
Associate General ManagerTechnology DepartmentProduction DivisionMeiji Co., Ltd.
In the Field
Supply Chain
Cocoa Production and Grindings(1,000 t)
2010/11 2011/12 2012/13 2013/14 2014/15 2015/16 2016/17(Forecasts)
0
1,000
2,000
3,000
4,000
5,000
Production Grindings
* October to September of the subsequent year
Source: World Cocoa Directory 2015/2016 No. 2, International Cocoa Organization (ICCO)
Cocoa Year*

35Our Activities
for Sustainability Corporate InformationIntroduction Financial SectionOur Strategy
Basic ApproachThe Meiji Group is committed to fair and transparent transac-tions. We maintain compliance with all laws and regulations.
Compliance Advancement MeasuresEmployees always carry our Compliance Card, which includes the Corporate Behavior Charter and the contact details of a compliance counseling desk. The Meiji Group ensures strict adherence to the Corporate Behavior Charter. At the same time, the Group cultivates and entrenches compliance aware-ness by enhancing in-house education and training and dis-seminating information through the intranet. Also, we have established in-house regulations that protect the privacy and prohibit disadvantageous treatment of whistleblowers.
Advertising and Promotional ActivitiesIn advertising and promotional activities, our basic approach is to respect laws, regulations, and corporate ethics and use fair content and expressions to avoid false or exaggerated claims. The Food segment has related in-house departments and external advertising companies check the content and expressions of advertising for issues. In the Pharmaceutical segment, pamphlets used in promo-tional activities targeting doctors and pharmacists are referred to as “Product Information Summaries.” We prepare these summaries pursuant to Guidelines for Specifying Product Information Summaries for Prescription Drugs, stipulated by the Japan Pharmaceutical Manufacturers Association (JPMA).
When launching brand-name drugs, we prepare product information summaries. Then, JPMA inspects these summa-ries and requests revisions. Once these have been reflected, we are permitted to use the summaries. For other materials, we have checks conducted by an internal committee that includes university professors with expertise in pharmaceuti-cal sciences.
Animal WelfareWe have set out a policy on animal welfare. We conduct animal experiments after receiving approval from an internal laboratory animal ethics committee. The experiments are based on the 3Rs principle of reduction: using fewer animals; replacement: seeking experiments that do not use animals; and refinement: mitigating animal suffering.
Third-Party CertificationThe Food segment has received accreditation from the Japanese Society for Laboratory Animal Resources. The Pharmaceutical segment has received certification from the Japan Health Sciences Foundation.
4 Compliance
Compliance Card

36 Annual Report 2017
The Meiji Group’s Sustainability Information
Approach to Human ResourcesOur approach to human resources is to foster personnel who set innovative and ambitious goals by themselves and achieve these goals by drawing on their expertise and the Group’s strengths. In other words, our goal is to develop indi-viduals who realize the Group Philosophy and the meiji way and follow our Action Guidelines.
Group Philosophy, Action Guidelines, the meiji way, Management Attitude, and Corporate Behavior Charter http://www.meiji.com/global/about-us/mission-and-vision/
The Meiji Group Policy on Human Rights http://www.meiji.com/global/about-us/mission-and-vision/pdf/Policy_on_Human_Rights.pdf
5 Human Resources System
meiji way, our Action Guidelines
Group PhilosophyOur responsibility as “Food and Health”
professionals is to continue finding innovative ways to
meet our customers’ needs, today and tomorrow.
Listen to and learn from our customers
Approach to Human ResourcesFoster personnel who set innovative and ambitious
goals by themselves and achieve these goals by draw-ing on their expertise and the Group’s strengths
Draw on expertise
Find ways to identify future trends and be prepared to
lead the way
Increase and draw on the Group’s strengths
Always believe in our team’s potential, and make
the most of its abilities
Set innovative and ambitious goals
Make our work exciting, and create exciting work
Perform duties
Have the strength and courage to confront any issues, rather than avoid
them

37Our Activities
for Sustainability Corporate InformationIntroduction Financial SectionOur Strategy
Personnel DevelopmentOne of the fundamentals of our Management Attitude states our approach to personnel development. It calls on the Group to “Foster the development of the synergies and
capabilities of the organization and each individual.” In light of our approach to human resources, the medium-term busi-ness plan STEP UP 17 sets out basic policies for developing the capabilities of personnel.
1 Develop personnel who have the proactive mindset—as well as the expertise, creativity, and practical skills—needed to take on and achieve ambitious targets
2 Spur the Group’s expansion by growing individuals, develop independent-minded personnel who help raise Groupwide capabilities
3 Develop personnel who fully understand the Group Philosophy and can put the meiji way into practice at an advanced level
Basic Policies for Developing the Capabilities of Personnel
In Japan, we have dedicated training centers with accom-modation facilities and a skills training center. We conduct planned and continuing education and training at these train-ing centers. Our programs include training on the basic knowledge and mindset that Meiji Group new employees need as well as training that develops employees’ qualities and capabilities as business leaders. For example, our
training improves the ability of managers to develop their subordinates, enhances senior management team members’ ability to energize organizations, and cultivates self-reform among prospective business leaders. We provide a wide variety of training programs to develop personnel capable of working globally.
1 Self-development language courses
2 Language training in English-speaking and Chinese-speaking countries aimed at acquiring effective language-learning methods and understanding different cultures
3 Programs that send selected personnel to business language schools to acquire practical language skills
4 Programs that inculcate perseverance, understanding of diversity, and mental toughness by sending personnel overseas to gain firsthand experience of business customs in challenging conditions
Training Programs for the Development of Personnel Capable of Working Globally
In developing personnel who have a proactive mindset, we support their efforts to improve their abilities. Also, we have a self-assessment system in which employ-ees discuss career plans and their jobs with superiors. It is a
very good opportunity for employees to think about their work styles and careers, and we use the resulting insights when developing employees and considering the roles to which they are best suited.

38 Annual Report 2017
Empowerment of Female EmployeesTo empower female employees, we help employees to meet work and family commitments while encouraging women to take on diverse jobs. The aim of these efforts is to improve corporate competitiveness. In fiscal 2016, more than 200 employees newly registered for childcare leave. In addition, more than 200 employees returned to their jobs and used a reduced working-hour system to meet parenting responsibilities. The Meiji Group is creating an environment for employees keep realizing their professional abilities while entering new life stages. Also, we will steadily increase female leaders through boosting hiring of women, career advancement training, and job rotation.
Employment of People with DisabilitiesWe meet the statutory employment rate for people with dis-abilities. Moreover, we create workplaces that allow employ-ees to fully realize their capabilities regardless of whether or not they have disabilities. Our numerous employees with disabilities work at more than 40 bases around Japan.
Employment Rate for People with Disabilities
FYE March 2017 2.10%
FYE March 2016 2.10%
FYE March 2015 2.13%
Retiree ReemploymentAfter reaching the retirement age of 60, our employees have the option of continuing to work up to the age of 65. Reemployed personnel guide and lead young employees and set a good example. All applicants have been reem-ployed since 2010.
Diverse EmployeesOur Corporate Behavior Charter calls for respect for the diversity of employees. Further, the Meiji Group Policy on Human Rights declares zero tolerance for discrimination. We have more than 30 Group companies in Japan and more than 20 overseas. In Japan and overseas, many differ-ent employees contribute to operations in a range of work-places. The diversity of our workforce encompasses nationality, gender, and age as well as people with disabili-ties, regional employees, fixed-term employees, and employ-ees with childcare or nursing care commitments. We will
develop the human resources system and workplace condi-tions so that each individual is motivated and fulfills themselves. We cultivate solidarity among Group companies worldwide by holding Group Philosophy briefings overseas and issuing a Group newsletter featuring events in Japan and overseas. Moreover, employees of overseas Group companies partici-pate in study tours of plants and research laboratories in Japan, and we conduct personnel exchange training among overseas and domestic employees.
Number of Employees Overseas (Main Countries)
JapanUnited States
Spain China Indonesia Singapore Thailand India
FYE March 2017 11,613 588 354 1,118 792 278 404 1,579
FYE March 2016 11,655 564 353 995 671 265 381 1,572
FYE March 2015 11,828 583 331 914 725 270 359 1,549
The Meiji Group’s Sustainability Information

39Our Activities
for Sustainability Corporate InformationIntroduction Financial SectionOur Strategy
Uniting Employees and Advancing toward the Next Stage
The Meiji Group was established through the management integration of Meiji Seika Kaisha, Ltd., and Meiji Dairies Corporation in 2009. After two years of preparation, we revamped the human resources system during the operational reorganization in 2011. At this time, we began personnel integration. Creating a new human resources system was very difficult. Although the companies were sister subsidiaries, they had followed different paths for many years. Consequently, they had developed different ways of thinking. We discussed everything, from the definitions of terms through to our approach to each system, personnel composition, and labor-management rela-tions. At times, there were disagreements. However, two years of extensive discussions built mutual trust. Ultimately, we reached a consensus on creating a new system befitting the Meiji Group. To this day, those involved remain connected by the challenging tasks they shared. Unsurprisingly, personnel integration caused tensions, but eventually integration came about naturally in the Meiji Group. This was not because of a human resources initiative, but because employees worked together and went through good and bad times in the same workplace. At the time, it was tough. Looking back, however, the work was thoroughly rewarding and enjoy-able. It was a valuable experience; I talked to people with different views, and this broadened my horizons and led me to consider the basics of the human resources system from scratch. We are in the seventh year since operational reorganization in 2011. Already, one in six employees has joined the Group under the new human resources systems. I feel that the Meiji Group is ready to advance toward the next stage. Growth in overseas markets will be a major task in the next stage. All of the Meiji Group’s employees are competent. We will develop them into personnel who succeed on the global stage. I want employees to drive our growth in over-seas markets. My ambition is to make the Meiji Group a corporate group that employees and their families can be proud of. I am sure that Meiji Group employees will realize even greater strength.
Akihiro Tokutome
ManagerHR Group HR & General Affairs DepartmentMeiji Holdings Co., Ltd.
Human Resources System
In the Field

40 Annual Report 2017
Basic ApproachThe Meiji Group establishes safe working conditions to elimi-nate occupational accidents. We are improving health and safety education and increasing employees’ safety awareness based on the view that “safety takes priority over everything.”
Policy and Management SystemThe Meiji Group established an Occupational Health and Safety Policy in April 2017. We have set fiscal year targets and started activities in businesses and at operating bases.
Meiji Group Policy on Occupational Health and Safety http://www.meiji.com/global/sustainability/
Occupational Accident CountermeasuresWe have set up the Health & Safety Committee. If an occupa-tional accident occurs, we investigate the cause, share infor-mation, and take Groupwide measures to prevent recurrence. The Meiji Group conducts in-house training to prevent occupational accidents. We conduct health and safety train-ing for new employees and for each operating base, includ-ing plants and sales bases.
Occupational Accident OccurrenceTo eliminate occupational accidents, we increase the safety awareness of employees at each site and reduce risks associ-ated with objects, equipment, and operations in collabora-tion with partner companies.
Rate of lost-worktime injuries (permanent employment basis, Japan)
0.42 (FYE March 2017)
Coverage: Plants and research laboratories in Japan (excluding Meiji Feed Co., Ltd., and OHKURA Pharmaceutical Co., Ltd.)
Rate of lost-worktime injuries: Lost-worktime accidents ÷ total labor hours × 1 million
Basic ApproachWe, the Meiji Group, in recognition of the fact that our busi-ness operations originate from the bounty of nature, will con-tribute to the creation of a sustainable society. To this end, we harmonize our business activities with the global environment and protect the environment.
Policy and Management SystemThrough the leadership of responsible departments and the task force in each segment, we have introduced an environ-mental management system. We reduce the environmental burden associated with our business activities and ensure that they are in harmony with the natural environment.
Third-Party Certification
Food segment ISO 14001: MultisiteEco-Action 21: Eight Group companies
Pharmaceutical segment ISO 14001: Two plants, one research laboratory
Prevention of Global WarmingWe are saving resources and energy by introducing energy-saving equipment, improving production equipment, and changing over to energy sources with lower CO2 emission volumes.
TargetsIn response to the Paris Agreement, the Meiji Group is pre-paring CO2 emission reduction targets for 2030.
6 Occupational Health and Safety
7 The Environment
The Meiji Group’s Sustainability Information

41Our Activities
for Sustainability Corporate InformationIntroduction Financial SectionOur Strategy
Basic ApproachWe will conduct our business activities in compliance with the laws and regulations of each country and region, and with respect for their culture and customs. We will strive to deepen our social interaction with local communities as a good corpo-rate citizen, and to provide broad contributions to society.
Food EducationWe support food education by explaining the value and health benefits of food at various events. We conduct food seminars for people of all generations, from children through to seniors, and increase interest in healthy diets. In fiscal 2016, we held more than 2,900 food seminars in which more than 130,000 people participated.
Plant ToursVisitors to our food plants enjoy observing and learning about production processes. In this way, we enhance their understanding of our commitment to food safety and reliabil-ity. Seven plants nationwide welcomed roughly 170,000 visi-tors in fiscal 2016.
DonationWe want our business activities to benefit society. Through The UN Refugee Agency (UNHCR), every year we donate a portion of our Meiji Milk Chocolate sales during January and February to a program that improves child refugees’ nutrition. Between 2009 and 2017, we donated approximately ¥63.8 million. Also, we support the activities of the nonprofit organization Japan Hospital Clowns Association, which brings smiles to children fighting diseases, children’s families, and others involved in children’s lives.
Disaster Area SupportThe northeastern part of Japan was hit by a devastating earthquake on March 11, 2011, the Great East Japan Earthquake. In southern Japan, a strong earthquake centered in Kumamoto Prefecture in Kyushu occurred in the evening of April 14, 2016, followed by a second even stronger earth-quake in the early morning of April 16, 2016. The Meiji Group gives donations, infant formula, confectioneries, and other items to those in disaster areas. Other support activities include holding such events as nutritional seminars to main-tain the health of evacuees. The Meiji Group participates in the support projects of the Reconstruction Agency. To support the restoration of the disaster areas of the Kumamoto Earthquake and the Great East Japan Earthquake, Group companies held a market in the Meiji Group’s head office building in January 2017. Many of our employees took part in the market.
8 Local Communities
Reduction of Environmental Load SubstancesTo protect a finite global environment, the Group is reducing waste and using resources effectively. We are managing chemical inventories appropriately and reducing emissions of chemical waste to minimize environmental impact.
Meiji Group Environmental Policyhttp://www.meiji.com/global/sustainability/
Wastewater Treatment InitiativesTo prevent water pollution, the Meiji Group has established self-regulation by applying wastewater standards that are stricter than those required by Japanese law. For plants and manufacturing processes with significant drainage loads, we reduce the environmental impact of wastewater by installing wastewater treatment facilities. While discharging wastewater into rivers or sewerage systems, we regulate drainage loads.

42 Annual Report 2017
Directors and Audit & Supervisory Board Members (As of June 29, 2017)
1 President and Representative Director
Masahiko Matsuo
Apr. 1969 Joined Meiji SeikaJun. 2001 Executive Officer, Meiji SeikaJun. 2002 Director, Meiji SeikaJun. 2003 Managing Executive Officer, Meiji SeikaJun. 2007 Senior Managing Executive Officer, Meiji SeikaApr. 2009 Member of the Board, Meiji HoldingsApr. 2011 Member of the Board, Meiji Seika Pharma
(incumbent)Apr. 2011 President and Representative Director,
Meiji Seika PharmaJun. 2014 President and Representative Director,
Meiji Holdings (incumbent)Jun. 2014 Member of the Board, Meiji (incumbent)
Significant concurrent positions
Member of the Board, MeijiMember of the Board, Meiji Seika PharmaChairman, Japan Foods & Biotechnology Intellectual Property Rights Center
2 Member of the Board and Senior Managing Executive Officer
Michiro Saza
Jun. 1978 Joined Meiji SeikaJun. 2008 Executive Officer, Meiji SeikaApr. 2009 Executive Officer, Meiji HoldingsApr. 2009 General Manager, Corporate Development
Department, Meiji HoldingsJun. 2012 Member of the Board and Executive Officer, Meiji
HoldingsJun. 2013 Member of the Board and Managing Executive
Officer, Meiji HoldingsJun. 2016 Member of the Board, Meiji Seika Pharma (incumbent)Jun. 2016 Member of the Board and Managing Executive Officer
(Corporate Development Dept.), Meiji HoldingsJun. 2017 Member of the Board and Senior Managing Executive
Officer (Corporate Development Dept. and HR & General Affairs Dept.), Meiji Holdings (incumbent)
Significant concurrent position
Member of the Board, Meiji Seika Pharma
3 Member of the Board and Managing Executive Officer
Koichiro Shiozaki
Apr. 1978 Joined Meiji DairiesApr. 2011 Executive Officer, MeijiJun. 2015 Member of the Board and Executive Officer,
Meiji HoldingsJun. 2015 General Manager, Financial & Accounting
Department, Meiji Holdings (incumbent)Jun. 2017 Member of the Board and Managing Executive
Officer (incumbent)
2
7 6
14 13 1112 3 4 5
1 1098
43Our Activities
for Sustainability Corporate InformationIntroduction Financial SectionOur Strategy
8 Member of the Board (Outside)
Yoko Sanuki
Apr. 1981 Registered as Attorney at LawNov. 2001 Opened NS Law OfficeJun. 2007 Auditor, Meiji DairiesApr. 2009 Member of the Board, Meiji Holdings (incumbent)
Significant concurrent positions
Attorney at LawOutside Director, Resona Holdings, Inc.
9 Member of the Board (Outside)
Tomochika Iwashita
Jul. 1969 Joined The Tokio Marine & Fire InsuranceJun. 1998 Director, The Tokio Marine & Fire InsuranceApr. 2000 Managing Director,
The Tokio Marine & Fire InsuranceSep. 2000 Senior Managing Executive Officer,
The Nippon Credit BankDec. 2000 Senior Managing Director,
The Nippon Credit BankJun. 2002 Managing Director,
The Tokio Marine & Fire InsuranceJun. 2003 Senior Managing Director,
The Tokio Marine & Fire InsuranceOct. 2004 Senior Managing Director,
Tokio Marine & Nichido Fire InsuranceJun. 2005 Executive Vice President,
Tokio Marine & Nichido Fire InsuranceJun. 2006 President, Tokio Marine & Nichido Life InsuranceJun. 2011 Outside Corporate Auditor, Honda MotorJun. 2016 Member of the Board, Meiji Holdings (incumbent)
Significant concurrent position
Director (External), DCM Holdings Co., Ltd.
4 Member of the Board and Executive Officer
Jun Furuta
Apr. 1981 Joined Meiji SeikaJun. 2013 Executive Officer, MeijiJun. 2014 Member of the Board and Executive Officer,
Meiji Holdings (incumbent)Jun. 2014 General Manager, PR & IR Department,
Meiji Holdings (incumbent)
5 Member of the Board and Executive Officer
Shuichi Iwashita
Apr. 1977 Joined Meiji DairiesJun. 2014 Member of the Board and Executive Officer,
Meiji Holdings (incumbent)Jun. 2014 General Manager, HR & General Affairs Department,
Meiji Holdings (incumbent)
6 Member of the Board
Kazuo Kawamura
Apr. 1976 Joined Meiji DairiesJun. 2007 Director, Meiji DairiesJun. 2009 Executive Officer, Meiji DairiesJun. 2010 Director and Managing Executive Officer,
Meiji DairiesApr. 2011 Member of the Board and Senior Managing
Executive Officer, MeijiJun. 2012 President and Representative Director,
Meiji (incumbent)Jun. 2012 Member of the Board, Meiji Holdings (incumbent)
Significant concurrent positions
President and Representative Director, MeijiChairman, All Nippon Kashi AssociationChairman, Japan Milk Fair Trade Conference
7 Member of the Board
Daikichiro Kobayashi
Apr. 1979 Joined Meiji SeikaJun. 2010 Executive Officer, Meiji SeikaApr. 2011 Executive Officer, Meiji Seika PharmaJun. 2013 Member of the Board and Managing Executive
Officer, Meiji Seika PharmaJun. 2014 President and Representative Director,
Meiji Seika Pharma (incumbent)Jun. 2014 Member of the Board, Meiji Holdings (incumbent)
Significant concurrent position
President and Representative Director, Meiji Seika Pharma
10 Member of the Board (Outside)
Tohru Murayama
Apr. 1980 Joined Andersen Consulting (currently Accenture Japan)
Apr. 2003 Representative Director and President, Accenture Japan
Apr. 2006 Director and Vice Chairman, Accenture JapanSep. 2007 Director and Chairman, Accenture JapanApr. 2015 Visiting Professor, Faculty of Science and
Engineering, Waseda University (incumbent)Jun. 2016 Member of the Board, Meiji Holdings (incumbent)
Significant concurrent position
External Director, FAST RETAILING CO., LTD.
11 Audit & Supervisory Board Member
Mineo Matsuzumi
Apr. 1978 Joined Meiji SeikaJun. 2014 Member of the Board,
Meiji Seika PharmaJun. 2014 Executive Officer, Meiji Seika PharmaJun. 2016 Managing Executive Officer,
Meiji Seika PharmaJun. 2016 Managing Executive Officer (General
Affairs, Financial, and HR Dept.), Meiji Seika Pharma
Jun. 2017 Audit & Supervisory Board Member, Meiji Holdings (incumbent)
12 Audit & Supervisory Board Member
Hiroyuki Tanaka
Apr. 1977 Joined Meiji DairiesApr. 2011 Executive Officer, MeijiApr. 2015 Executive Officer, Information Systems
Dept., (Administration Div.), MeijiApr. 2017 Assistant to the President, MeijiJun. 2017 Audit & Supervisory Board Member,
Meiji Holdings (incumbent)
13 Audit & Supervisory Board Member (Outside)
Hajime Watanabe
Apr. 1987 Registered as Attorney at LawApr. 1987 Joined Mori Sogo Law OfficeSep. 1994 Registered as Foreign Legal Consultant
in Illinois, the United StatesMay 1995 Registered as Attorney at Law
in New York, the United StatesApr. 2007 Opened Sueyoshi Sogo Law Office
(current STW & PARTNERS Law Office)Jun. 2010 Alternate Auditor, Meiji HoldingsJun. 2013 Audit & Supervisory Board Member,
Meiji Holdings (incumbent)
Significant concurrent positions
Attorney at LawOutside Audit & Supervisory Board Member, SEIKO PMC CORPORATIONOutside Audit & Supervisory Board Member, FURYU Corporation
14 Audit & Supervisory Board Member (Outside)
Makoto Ando
Oct. 1984 Joined Sanwa Tokyo Marunouchi Office Audit Corporation (currently Deloitte Touche Tohmatsu LLC)
Dec. 1988 Joined KPMG Peat Marwick New York Office
Apr. 1991 Joined Sakurai Accounting OfficeApr. 1994 Joined Tokyo Metropolitan Police
DepartmentApr. 2002 Joined Ando Tax & Accounting Office
(currently Hibiki Tax Corporation)Apr. 2002 Joined Ando Certified Public Accountant
Joint OfficeJun. 2017 Outside Audit & Supervisory Board
Member, Meiji Holdings (incumbent)
Significant concurrent position
Certified Public AccountantUnaffiliated Auditor, Nippon Concrete Industries Co., Ltd.

44 Annual Report 2017
Three Outside Directors Discuss the Meiji Group
Yoko Sanuki (Senior Independent Director)
In June 2017, Meiji Holdings Co., Ltd. (the Company), changed the composition of the Board of Directors to seven internal directors and three outside directors to improve its functions and ensure effective corpo-rate governance. We invited the outside directors to participate in a wide-ranging discussion about cor-porate governance, sustaining growth, and other topics. Ms. Yoko Sanuki has been the Company’s outside director since its establishment in 2009, and Mr. Tomochika Iwashita and Mr. Tohru Murayama were appointed as outside directors at the General Meeting of Shareholders in June 2016.
Tomochika Iwashita(Independent Director)
Tohru Murayama(Independent Director)
Q: Tell us about the recent atmosphere in the Board of Directors and your impressions about it.
Sanuki: I have been an outside director for eight years. I feel the Board of Directors is motivated and we are having active discussions. Even though we have many agenda items, we discuss each one of them extensively. Further, listening to reports from the Executive Committee before we discuss agenda items helps me to better understand the points. The reports include detailed discussions and issues specified by internal officers before they submit to the Board of Directors. Last year, executive officers in operating companies gave us overviews of their operations, so I could better understand each of the Group’s business lines. It was useful to talk with the executive officers and get a sense of frontline operations.
Iwashita: While some companies are scrambling to superficially meet the requirements of Japan’s Corporate Governance Code, I think the Company’s governance is genuinely effective rather than just superficial. The Company is eager to seek the opinions of outside directors. Even when we bring up difficult issues, I feel that the senior management team tries hard to tackle them. Also, the Company provides us with a lot of internal information, which it deserves credit for. In preparing the recently

45Our Activities
for Sustainability Corporate InformationIntroduction Financial SectionOur Strategy
announced Meiji Group 2026 Vision (outline), the Company involved us in a great deal of discussions held over a long period. Given these points, I believe we can vouch for the progress of the Company’s corporate governance. If I had to mention an issue, I would say that internal directors should proactively state opinions about the Meiji Group from a Groupwide point of view as directors, rather than confining themselves to state-ments about operations under their authority as executive officers.
Murayama: I think members of the Board of Directors appropriately discuss the items that ought to be addressed. The Company manages and supervises both operating companies efficiently. Accordingly, I am impressed that the three companies have built very good relationships with each other.
Q: What role do you think Meiji Holdings should play?
Murayama: The Company has successfully integrated Meiji Seika Kaisha, Ltd. and Meiji Dairies Corporation and established the Meiji Group. Following management integration, the Company worked to share corporate philosophies and values throughout the Group. The Company then created a Group Vision, prepared business plans reflecting it, carried out the plans, and followed up on progress under the plans. So far, Meiji Holdings has handled this tough process well, unified the Group, and achieved successes. Taking a long-term view, however, the Company is still only half way through the process. I think the Company will have a new mission to challenge for the Meiji Group.
Iwashita: Sometimes holding companies tend to control operating companies too much and overly manage or become bloated. But that’s not the case for the Company. The Meiji Group has established favorable relationships.
Sanuki: After the management integration in 2009, the Company played a criti-cal role in addressing business reorganization, a major management issue, which it implemented in 2011. With business reorganization behind it, the Company should tackle the difficult tasks that will emerge going forward. Without being complacent about its successes to date, the Company should discuss the difficult tasks based on a healthy sense of crisis.
Q: What are the Meiji Group’s unique strengths and issues?
Murayama: I admire that the people in the Meiji Group are earnest, dependable, and prudent. These traits attribute to the current favorable performance. However, being earnest, dependable, and prudent can sometimes lead to a loss of momentum. Therefore, I would like the Group to step up the pace of strategic initiatives. One thing that slightly concerns me is the Group’s modesty. The Group has a host of tangible and intangible assets that have been accumulated during a hundred-year long history. I believe the Group should be proud of them and let them be widely known internally and publically.
Iwashita: With respect to earnestness, the Group is working very hard at basic research and develop-ment. For example, it conducts research on lactobacilli and cacao polyphenols. These efforts have pro-duced major tangible and intangible assets, which are the Group’s precious strengths. I think the Group should leverage such assets even more.

46 Annual Report 2017
Murayama: I believe the Meiji Group is, in fact, very innovative too. For example, the Food segment is reducing SKUs (stock keeping units) through selection and concentration initiatives to increase profitability. Implementing these initiatives has been more difficult than one might expect since they significantly affect how the Group manages purchasing, manufacturing, and sales. Nonetheless, a corporate group that can achieve such worthwhile change is progressive. Further, the Company decided to acquire Medreich Limited of India to expand the generic drugs business in the Pharmaceutical segment. I believe this was a very progres-sive decision.
Iwashita: Because the confectionery business has been advancing selection and concentration initiatives decisively, it has improved its operating income margin fivefold since the management integration in 2009. In my experience, this huge improvement is remarkable. I respect this amazing accomplishment.
Sanuki: The Meiji Group has been exploiting its strengths to realize outstanding initiatives, but I feel that these successes are not necessarily shared among the Group employees. One of the examples is the Group’s proactive initiatives for the procurement of cocoa, chocolate’s basic ingredient. Meiji supports cocoa farmers in Africa and Latin America to improve their living conditions so that they can achieve sustainable cocoa production. I’m afraid such ground-breaking initiatives are not widely known. I suggest giving these initiatives a higher profile within the Group.
Q: What are your views on sustaining growth, particularly regarding overseas business development and diversity?
Murayama: I think it is naive if you believe that simply venturing overseas will generate sales. First, Meiji should create the best product in Japan. Being No. 1 in Japan means that the product has significant added value and that it will become a promising product overseas. Therefore, the Meiji Group should embark upon overseas business rollouts of its products that offer unique added value. Overseas sales currently account for only a small portion of the Meiji Group’s revenues. This may be because a prudent management stance and relatively few non-Japanese employees have resulted in slow operations overseas. Perhaps a new, accelerated overseas strategy is needed.
Iwashita: I’m afraid that not so many employees are aware of diversity. When employees are immersed in their company’s culture or way of thinking, they lose creativity and innovation becomes difficult in general. In that sense, we should be open to other people’s ideas. I think diversifying the employee mix will create a more conducive corporate culture that develops new creative ideas. You can improve the employee mix by promoting joint research and exchanges with outside organizations and increasing mid-career hiring and the loaning of employees.
Murayama: I truly think that the Meiji Group is good at incorporating other cul-tures. I say this because it has successfully integrated the different cultures of Meiji Seika and Meiji Dairies. Also, the Group has been working to steadily get operations on track since acquiring Medreich of India. In-house, the Company makes effective use of personnel exchanges and transfers. I believe these measures have underpinned the remarkable business results of recent years. If the numbers of non-Japanese and mid-career employees rise, I expect the Group will handle such changes with a similar deftness.
Three Outside Directors Discuss the Meiji Group

47Our Activities
for Sustainability Corporate InformationIntroduction Financial SectionOur Strategy
Sanuki: The Group will absorb different cultures by loaning employees to companies in other industries or, conversely, accepting personnel from other companies or government agencies. Often, companies can learn many things even from companies that, at first sight, appear to have nothing to do with their mainstay operations. I believe such initiatives will broaden networks of personal contacts beyond the Group and establish a more open and innovative corporate culture.
Murayama: Overseas business development requires personnel who can manage local organizations properly. Naturally, candidates for such roles need not be limited to Japanese personnel but should include non-Japanese personnel. The Group should avoid the pitfall of having numerous globally com-petitive products while lacking the personnel to drive overseas rollouts.
Q: Lastly, what are your expectations of the Meiji Group and ambitions as outside directors?
Sanuki: Since the business reorganization in 2011, the Meiji Group has grown a lot. At this juncture, however, the Group should set out a new vision because it is proceeding to its next growth phase. While Meiji Group 2026 Vision (outline) will provide a basis in this regard, I think our new roles must be to help translate the vision into concrete measures and to help realize its goals. I am very happy to do that.
Iwashita: The challenge will be to realize Meiji Group 2026 Vision (outline). This calls for setting out clear strategies and tasks and ensuring that each employee understands, internalizes, and rigorously imple-ments them. I believe that the Meiji Group has yet to fully realize its strengths and can, therefore, grow more. I have high hopes of even stronger development.
Murayama: Some people may think that the Meiji Group’s businesses have already matured but I think that would be a complete misunderstanding. When we consider the Group within the health field, it is right at the center of a growth industry. I believe the Group is more than capable of launching its next growth phase by thoroughly implementing strategies based on Meiji Group 2026 Vision (outline). I will provide all of the support and advice that I can to accelerate realizing the vision.
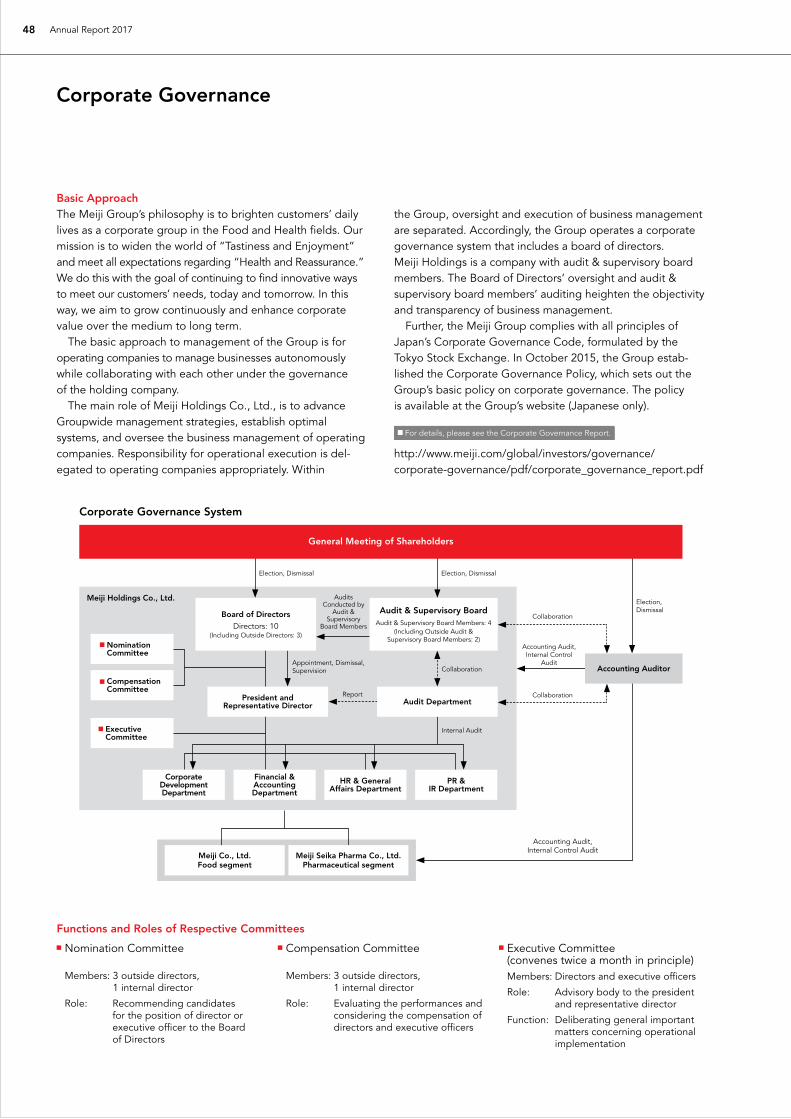
48 Annual Report 2017
Corporate Governance
Functions and Roles of Respective Committees
Nomination Committee
Members: 3 outside directors, 1 internal director
Role: Recommending candidates for the position of director or executive officer to the Board of Directors
Compensation Committee
Members: 3 outside directors, 1 internal director
Role: Evaluating the performances and considering the compensation of directors and executive officers
Executive Committee (convenes twice a month in principle)
Members: Directors and executive officers
Role: Advisory body to the president and representative director
Function: Deliberating general important matters concerning operational implementation
Basic ApproachThe Meiji Group’s philosophy is to brighten customers’ daily lives as a corporate group in the Food and Health fields. Our mission is to widen the world of “Tastiness and Enjoyment” and meet all expectations regarding “Health and Reassurance.” We do this with the goal of continuing to find innovative ways to meet our customers’ needs, today and tomorrow. In this way, we aim to grow continuously and enhance corporate value over the medium to long term. The basic approach to management of the Group is for operating companies to manage businesses autonomously while collaborating with each other under the governance of the holding company. The main role of Meiji Holdings Co., Ltd., is to advance Groupwide management strategies, establish optimal systems, and oversee the business management of operating companies. Responsibility for operational execution is del-egated to operating companies appropriately. Within
the Group, oversight and execution of business management are separated. Accordingly, the Group operates a corporate governance system that includes a board of directors. Meiji Holdings is a company with audit & supervisory board members. The Board of Directors’ oversight and audit & supervisory board members’ auditing heighten the objectivity and transparency of business management. Further, the Meiji Group complies with all principles of Japan’s Corporate Governance Code, formulated by the Tokyo Stock Exchange. In October 2015, the Group estab-lished the Corporate Governance Policy, which sets out the Group’s basic policy on corporate governance. The policy is available at the Group’s website (Japanese only).
For details, please see the Corporate Governance Report.
http://www.meiji.com/global/investors/governance/ corporate-governance/pdf/corporate_governance_report.pdf
Corporate Governance System
General Meeting of Shareholders
Nomination Committee
Compensation Committee
Executive Committee
Collaboration
Internal Audit
Accounting Audit,Internal Control
Audit
Accounting Audit,Internal Control Audit
Meiji Holdings Co., Ltd. Audits Conducted by
Audit & Supervisory
Board Members
CollaborationReport
Collaboration
Election, Dismissal
Election,Dismissal
Election, Dismissal
Appointment, Dismissal, Supervision
Financial & Accounting Department
HR & General Affairs Department
Corporate Development Department
PR & IR Department
President and Representative Director
Accounting Auditor
Audit & Supervisory BoardAudit & Supervisory Board Members: 4
(Including Outside Audit & Supervisory Board Members: 2)
Audit Department
Board of DirectorsDirectors: 10
(Including Outside Directors: 3)
Meiji Co., Ltd.Food segment
Meiji Seika Pharma Co., Ltd.Pharmaceutical segment

49Our Activities
for Sustainability Corporate InformationIntroduction Financial SectionOur Strategy
Business Management System FeaturesWe are strengthening our corporate governance structure through the following initiatives.1. Added one outside director through a resolution of the
General Meeting of Shareholders in June 2016 to give a total of five outside directors and outside audit & supervisory board members, all of whom are designated as independent directors
2. Limited the term of service for directors to one year3. Introduced an executive officer system to separate business
execution and audit functions, accelerate management decisions, and clarify management responsibility
4. Appointed one female director and one female audit & supervisory board member as part of efforts to promote women to executive positions
5. Enhanced functions of the Board of Directors 1) Evaluated the effectiveness of the Board with reference to
members’ replies to an annual questionnaire 2) Addressed issues identified The Company has verified that the Board of Directors is func-
tioning properly based on the results of self-evaluations by directors and audit & supervisory board members. To further enhance the effectiveness of the Board of Directors, the Company will continue to improve the way it addresses reported matters and the way it briefs outside directors and outside audit & supervisory board members on the Group’s management strategy and businesses.
Attendance of Outside Directors and Outside Audit & Supervisory Board Members at Meetings of the Board of Directors and the Audit & Supervisory Board FYE March 2017
Board of Directors Audit & Supervisory Board
Outside directors 97% —
Outside audit & super-visory board members 100% 100%
Criteria for the Assessment of Independence when Appointing Outside Directors and Outside Audit & Supervisory Board MembersThe role of outside directors is to provide appropriate advice and decisions from objective, neutral viewpoints and in light of exten-sive knowledge and experience. The role of outside audit & supervisory board members is to provide appropriate indications and auditing with respect to the compliance and validity of our implementation of operations. They perform this role from objec-tive, neutral viewpoints and in light of expertise and experience. We have established criteria for assessing the independence of outside directors and outside audit & supervisory board mem-bers (Criteria for Independence).
For details, please see the Investors section of the Group’s website.
http://www.meiji.com/global/investors/governance/corporate-governance/
Reasons for Appointment of Outside Directors Yoko Sanuki (Senior Independent Director) The Company has appointed Ms. Sanuki because extensive experience as an attorney and a high degree of expertise in corporate law enable her to provide a wide range of advice on the Company’s business management and appropriate oversight of operational implementation.
Attendance at meetings of the Board of Directors: 13 / 13 meetings
Tomochika Iwashita
The Company has appointed Mr. Iwashita because a long career as a corporate manager and extensive knowledge enable him to provide a wide range of advice on the Company’s business management and appropriate oversight of operational implementation. Mr. Iwashita served as Executive Vice President of Tokio Marine & Nichido Fire Insurance Co., Ltd., and as President of Tokio Marine & Nichido Life Insurance Co., Ltd.
Attendance at meetings of the Board of Directors: 9 / 10 meetings
Organizational structure
Company with Audit & Supervisory Board
Chairman of the Board of Directors
President and representative director
Directors
10(including 3 outside directors)
Audit & supervisory board members
4(including 2 outside audit & supervisory board members)
Appointment of independent directors / auditors
5(outside directors and outside audit & supervisory board members)
Number of times the Board of Directors convened in FYE March 2017
13Number of times the Audit & Supervisory Board convened in FYE March 2017
15

50 Annual Report 2017
Corporate Governance
Tohru Murayama
The Company has appointed Mr. Murayama because he is able to provide advice on the Company’s business manage-ment from a global perspective and appropriate oversight of operational implementation. Mr. Murayama served as Representative Director and President and Director and Chairman of Accenture Japan Ltd., a management consulting firm headquartered in the United States, and has contributed to the management strategies of various global companies.
Attendance at meetings of the Board of Directors: 10 / 10 meetings
Reasons for Appointment of Outside Audit & Supervisory Board MembersHajime Watanabe
The Company has appointed Mr. Watanabe because extensive experience and a high degree of expertise in corporate interna-tional transactions law accumulated during his career as an attorney enable him to audit impartially and objectively.
Attendance at meetings of the Board of Directors: 13 / 13 meetings
Attendance at meetings of the Audit & Supervisory Board: 15 / 15 meetings
Makoto Ando (Newly Appointed Independent Director)
The Company has appointed Ms. Ando because her exten-sive career and expertise enable her to audit impartially and objectively. Ms. Ando has worked in major audit firms and accounting firms in Japan and overseas as a certified public accountant and has worked in the public sector.
Training Opportunities for Directors and Audit & Supervisory Board MembersThe Company provides directors, audit & supervisory board members, and executive officers with training opportunities as necessary to develop their understanding of their legal liabilities and the roles and responsibilities they are expected to perform with respect to corporate governance, compli-ance, and risk management as well as opportunities to learn about the Group’s businesses, organizational structure, and financial status. The Company briefs outside directors and outside audit & supervisory board members to further their understanding of the Group’s management strategy and businesses. In addition, out-side directors and outside audit & supervisory board members are taken on inspection tours of plants and research laboratories.
Auditing Structure
Independent auditor Ernst & Young ShinNihon LLC
Audit department (internal auditing) Audit Department
Principal meetings auditors attend
Board of Directors, Executive Committee, Audit & Supervisory Board, Audit Department Liaison Meeting, and others
Compensation of Directors and Auditors
Method of Determination
Directors:Internal directors receive basic compensation, performance-linked compensation, and stock compensation. Performance-linked compensation and stock compensation are incentive compensation, which increases commensurately with the sig-nificance of a director’s role in and responsibility for the Group’s consolidated performance. Basic compensation is paid at a fixed rate based on position. Performance-linked compensation is paid proportionate to the financial results of the Group on a consolidated basis and of operating compa-nies (sales, operating income, etc.) as well as the performance of the director concerned in the previous fiscal year. Regarding stock compensation, restricted stock awards were introduced in June 2017. The aim of introducing this system is to incentivize internal directors to enhance the cor-porate value of the Group continuously as well as to encour-age them to appreciate the perspective of its shareholders even further. With respect to total compensation, the ratio of fixed compensation (basic compensation) to variable compen-sation (performance-linked compensation + stock compensa-tion) is approximately 6:4. Also, until the previous fiscal year, stock compensation was paid as portion of basic compensa-tion. Under this system, capital was paid for the purchase of stock through an executive stock ownership program.
Outside Directors:For outside directors, who are not involved in the execution of business, the Company pays fixed compensation only; no incentive compensation is paid. To ensure objectivity and transparency in the process for determining the above compensation system and the levels of compensation, the Compensation Committee, which com-prises three outside directors and one internal director, is conferred with, after which a decision is reached on separate compensation amounts by the Board of Directors.
Audit & Supervisory Board Members:Compensation is determined based on mutual consultation with audit & supervisory board members and maintained within the total amount approved by a resolution of the General Meeting of Shareholders.

51Our Activities
for Sustainability Corporate InformationIntroduction Financial SectionOur Strategy
Details of the Compensation of Directors and Audit & Supervisory Board Members FYE March 2017
Position
Number of persons
provided with compensation
Compensation (¥ million)
Directors (excluding outside directors)
9 367
Audit & supervisory board members (excluding outside audit & supervisory board members)
2 58
Outside directors and audit & supervisory board members
6 66
Total 17 491
*1. Resolution of the General Meeting of Shareholders sets a limit of ¥1 billion on the compensation of directors for one year.
*2. Resolution of the General Meeting of Shareholders sets a limit of ¥300 million on the compensation of audit & supervisory board members for one year.
Dialogue with Shareholders and Other InvestorsWe emphasize active dialogue with shareholders and other investors. We provide timely, appropriate disclosures of busi-ness results and other financial information. We also disclose non-financial information about management strategies and tasks, risk, and governance. Furthermore, we reflect feedback from share holders and investors in business management to enhance corporate value. In recognition of these business management efforts, Meiji Holdings Co., Ltd., received an Excellence Award at the 5th Corporate Value Improvement Award (FY2016), organized by Japan Exchange Group, Inc.
IR Activities for Institutional Investors and Analysts FYE March 2017
Activity details
Financial results briefing 2 (209 participants)
Roundtable meeting attended by president, institutional investors, and asset owners 7 (53 companies)
IR visit by president in Japan 6 companies
IR overseas roadshow:New York, Boston, Chicago, Toronto, Hong Kong, Singapore, Kuala Lumpur
46 companies
One-on-one meetings with institutional investors and analysts from Japan and overseas, including telephone interviews
363 (606 people)
Conference organized separately by securities company 4 (51 participants)
Facility tours: Osaka Plant 1 (20 participants)
Briefing on pharmaceutical business 1 (62 participants)
Internal Control SystemWe provide products and services to a large number of customers through our food and pharmaceutical business operations. In accordance with the Corporate Behavior Charter, we have established an internal control system befitting
the Group and the Group companies. The system that is based on mutual collaboration and multifaceted checking functions to ensure directors, executive officers, and other employees comply with the Food Sanitation Act, the Pharmaceutical and Medical Device Act, and other statutory laws and regulations and the Articles of Incorporation. The Group’s internal control system thereby ensures fair and sound business activities firmly rooted in compliance.
ComplianceRegarding “compliance as the cornerstone of its operations,” we abide by statutory laws and regulations, international agreements, social norms, and the regulations of respective Group companies. We advance concerted initiatives aimed at inculcating and entrenching compliance awareness to ensure that employees carry out their duties equitably and honestly and based on a well-developed awareness of compliance and high ethical standards. Such efforts include improving and expanding educational and training programs, disseminating information through an in-house intranet, and making hot-lines available.
For details, please see page 35.
Risk Management SystemWe have established specific rules for risk management and constructed an appropriate risk management system. For the whole Group, we systemically conduct precise risk manage-ment. In addition, we have established systems to minimize damage in the event of an emergency. In light of lessons learned from the Great East Japan Earthquake in March 2011, the Group has established basic policies for business continuity plans as stated below.
Basic Policies for Business Continuity Plans
To ensure the Meiji Group can provide customers with the products and services they require, even in disaster, we have set out business continuity plans based on the following policies.1. Ensure the safety of the lives of persons involved in the Group
and their families2. Discharge our social responsibility3. Minimize damage to businesses arising from the cessation
of operations
Disclosure Policy Include basic principles of disclosure on the Investors section of the Group’s website http://www.meiji.com/global/investors/disclosure-policy/
Post disclosure information, other important information, and documents of financial results briefings, in principle, in both Japanese and English on the Investors section of the Group’s website as quickly as possible

52 Annual Report 2017
Review and Analysis of FYE March 2017 Results
Overall Operating Results Business OverviewDuring the fiscal year ended March 31, 2017, the Japanese economy transitioned on a mild recovery trend as we saw signs of recovery in consumer spending and capital expendi-tures amid continued improvements to hiring and wage environments. However, due to the risks of a downturn in overseas economies and the concerns regarding the impact of currency market fluctuations on the Japanese economy, we should continue to pay close attention to future economic trends.
Management ResultsAmid such conditions, the Meiji Group entered the second year of STEP UP 17, the Group’s medium-term business plan. Based on our core policy to accelerate growth and achieve further improvement in profitability, we promoted our growth strategy aimed at increasing corporate value. These initiatives include: Strengthen Priority Businesses and Take on the Challenge for Future Growth, Improve Profitability to Withstand Harsh Economic Environments, Pursue Global Expansion, and Evolve Our Management System. In the food segment, we continued to advance selection and concentration strategy and structural reforms based on the core themes outlined in STEP UP 17 in order to achieve stable growth. In the pharmaceutical segment, despite the significant impact of NHI drug price revisions in April 2016, we aggres-sively promoted newly launched drugs in addition to the products in our core domains, drugs for infectious diseases and central nervous system disorders. These factors resulted in net sales of ¥1,242,480 million (up 1.5% year on year), operating income of ¥88,395 million (up 13.6% year on year), and ordinary income of ¥88,839 million (up 8.6% year on year) during the fiscal year ended March 31, 2017. Profit attributable to owners of parent was ¥ 60,786 mil-lion (down 2.9% year on year). This reflects the reverse effect of extraordinary income from gains on sales related to the transfer of fixed assets in the first quarter of the previous year.
Segment Results Food SegmentNet sales increased to ¥1,082,115 million, up 2.0% year on year. Net sales of the fresh and fermented dairy business and other business increased year on year. Net sales of the confec-tionery business were largely unchanged from the previous year. Net sales of processed food business and nutritionals business decreased year on year due to SKU reduction. Operating income of each business increased significantly to ¥82,950 million, up 21.5% year on year. This is because the product mix was improved thanks to the sales growth of mainstay products. We also underwent structural reforms such as on optimizing production and distribution and maxi-mizing expenditure efficiency.
Pharmaceutical SegmentNet sales decreased by 1.8% year on year to ¥161,620 mil-lion. Net sales in the domestic ethical pharmaceuticals busi-ness decreased year on year due to the price reduction of NHI drug price in April 2016. Net sales in the agricultural chemicals and veterinary drugs business decreased year on year. Net sales of the international business decreased year on year due to the impact of foreign exchange rates, although making China’s Shantou Meiji Pharmaceuticals Co., Ltd. into a consolidated subsidiary in April 2016 contributed to sales. Operating income decreased significantly by 42.9% year on year to ¥5,781 million. Income was impacted significantly by decreases in revenue due to NHI drug price revisions, and increases in expenses on promotional activities for newly launched drugs and one-time contract payments for in-licensed drugs.
Millions of yen Yen
Net Sales Operating IncomeProfit Attributable to
Owners of ParentProfit Per Share
FYE March 2017 ¥1,242,480 ¥88,395 ¥60,786 ¥413.11
FYE March 2016 1,223,746 77,781 62,580 425.06*
Year-on-year change (%) 1.5% 13.6% –2.9% –2.8%
* The Company carried out a two-for-one stock split on October 1, 2015. The indicated per-share profit amounts for FYE March 2016 reflect this stock split.
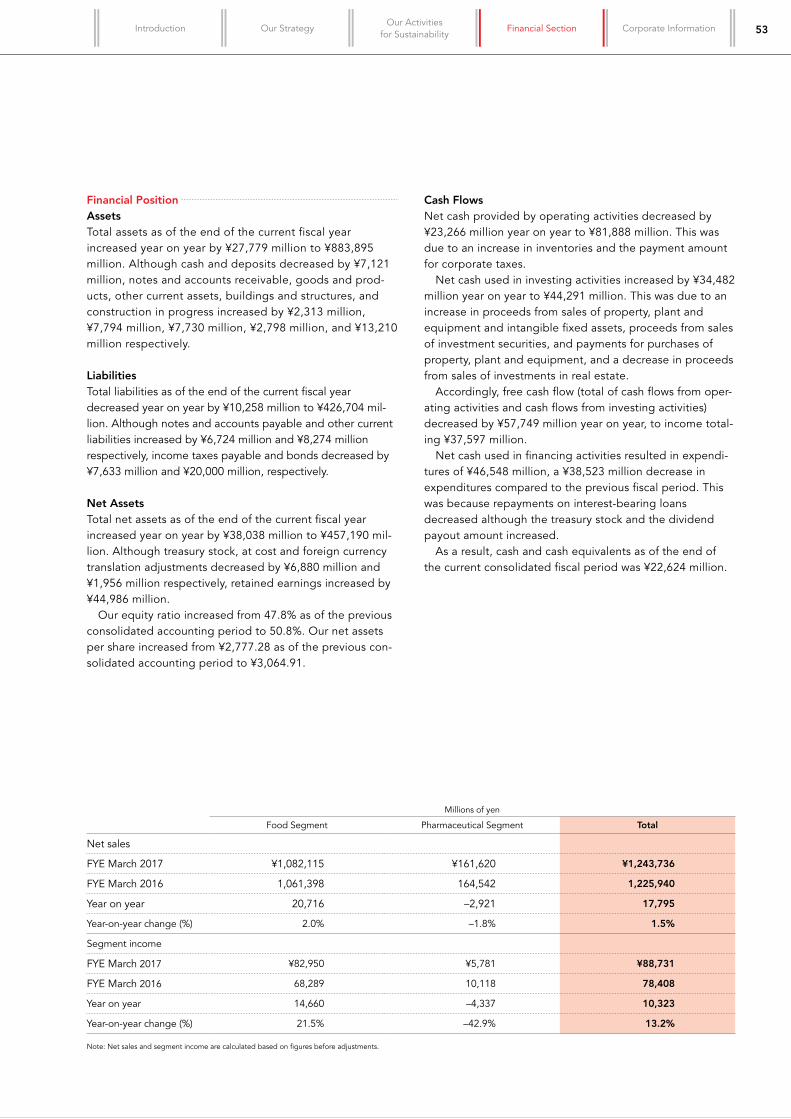
53Our Activities
for Sustainability Corporate InformationIntroduction Financial SectionOur Strategy
Financial Position AssetsTotal assets as of the end of the current fiscal year increased year on year by ¥27,779 million to ¥883,895 million. Although cash and deposits decreased by ¥7,121 million, notes and accounts receivable, goods and prod-ucts, other current assets, buildings and structures, and construction in progress increased by ¥2,313 million, ¥7,794 million, ¥7,730 million, ¥2,798 million, and ¥13,210 million respectively.
LiabilitiesTotal liabilities as of the end of the current fiscal year decreased year on year by ¥10,258 million to ¥426,704 mil-lion. Although notes and accounts payable and other current liabilities increased by ¥6,724 million and ¥8,274 million respectively, income taxes payable and bonds decreased by ¥7,633 million and ¥20,000 million, respectively.
Net AssetsTotal net assets as of the end of the current fiscal year increased year on year by ¥38,038 million to ¥457,190 mil-lion. Although treasury stock, at cost and foreign currency translation adjustments decreased by ¥6,880 million and ¥1,956 million respectively, retained earnings increased by ¥44,986 million. Our equity ratio increased from 47.8% as of the previous consolidated accounting period to 50.8%. Our net assets per share increased from ¥2,777.28 as of the previous con-solidated accounting period to ¥3,064.91.
Cash FlowsNet cash provided by operating activities decreased by ¥23,266 million year on year to ¥81,888 million. This was due to an increase in inventories and the payment amount for corporate taxes. Net cash used in investing activities increased by ¥34,482 million year on year to ¥44,291 million. This was due to an increase in proceeds from sales of property, plant and equipment and intangible fixed assets, proceeds from sales of investment securities, and payments for purchases of property, plant and equipment, and a decrease in proceeds from sales of investments in real estate. Accordingly, free cash flow (total of cash flows from oper-ating activities and cash flows from investing activities) decreased by ¥57,749 million year on year, to income total-ing ¥37,597 million. Net cash used in financing activities resulted in expendi-tures of ¥46,548 million, a ¥38,523 million decrease in expenditures compared to the previous fiscal period. This was because repayments on interest-bearing loans decreased although the treasury stock and the dividend payout amount increased. As a result, cash and cash equivalents as of the end of the current consolidated fiscal period was ¥22,624 million.
Millions of yen
Food Segment Pharmaceutical Segment Total
Net sales
FYE March 2017 ¥1,082,115 ¥161,620 ¥1,243,736
FYE March 2016 1,061,398 164,542 1,225,940
Year on year 20,716 –2,921 17,795
Year-on-year change (%) 2.0% –1.8% 1.5%
Segment income
FYE March 2017 ¥82,950 ¥5,781 ¥88,731
FYE March 2016 68,289 10,118 78,408
Year on year 14,660 –4,337 10,323
Year-on-year change (%) 21.5% –42.9% 13.2%
Note: Net sales and segment income are calculated based on figures before adjustments.
54 Annual Report 2017
Dividends and Basic Policy Concerning Profit Dividends The dividend as of the end of the fiscal period is ¥65.00 per share, consisting of ordinary dividend ¥45.00 and commemo-rative dividend ¥20.00. The annual dividend amount, which includes the dividend paid at the end of the second quarter, ¥45.00 per share, will be ¥110.00 per share, representing a consolidated dividend payout ratio of 26.6%. Basic policy concerning the return of profits to sharehold-ers is as follows. Meiji Holdings contributes to the lifelong health and food lifestyles of our customers. Securing the medium- and long-term stability of our business foundation is vital. It is important to ensure the internal retention necessary for future capital investments, investment and financing capital, R&D investments, etc., and stable, sustainable profit returns for shareholders are crucial. Our basic policy concerning profit dividends shall be a consolidated dividend payout ratio of around 30%. If the extraordinary factors influence profit attrib-utable to owners of parent significantly, that influence may be removed from the determination of the dividend amount.
Business Risks Outlined below are the major risks identified by the Meiji Group that could have an impact on the Group’s business results and financial position and which may materially influence investors’ decisions. Forward-looking statements included in the outline below are the views held by the Group as of the submission date of securities report (June 29, 2017) and include uncertainties related to future developments.
1. Prices Increases of Raw MaterialsPrices of the Meiji Group’s key raw materials (milk, dairy prod-ucts, cocoa beans, nuts, etc.) and energy commodities may be affected by supply and demand conditions and specula-tive influences, etc., in Japan and abroad. Such high prices have the potential to greatly impact procurement and pro-duction costs.
2. Effect of Business GlobalizationThe Meiji Group purchases some of its raw materials and goods from overseas. It also operates businesses overseas. Therefore, unexpectedly dramatic foreign currency fluctua-tions or the impediment of business activities due to unforeseen events, such as war, terrorism, or political or social changes, could affect the Group’s business results and financial position.
3. WeatherThe Meiji Group’s food business may be affected by the weather. For example, a cool summer can decrease sales of ice cream and dairy products. Extreme heat can decrease sales of chocolate and other confectionery goods. These have the potential to impact the Group’s business results and financial position.
4. Changes in the Business Environment Faced by the Dairy Products Industry
In the Meiji Group’s food business, sudden changes in the international trade system, such as customs duties, in the dairy farming system, such as the Act on Temporary Measures concerning Compensation Price for Producers of Milk for Manufacturing Use, or in practices have the potential to impact the Group’s business results and financial position.
5. Food Product SafetyThe Meiji Group takes various actions to ensure product safety and preventative measures against risks foreseen to occur throughout production. However, if there is a large-scale product recall, or even if there is not any direct problem with the Group’s products, rumors in the food industry might affect the Group’s products, which could result in a drop in sales, huge costs, etc. These have the potential to impact the Group’s business results and financial position.
6. Side Effects in PharmaceuticalsThe Meiji Group conducts product development, manufac-turing, and marketing for the pharmaceuticals business in compliance with various laws and standards enforced by regulatory authorities. Nevertheless, unforeseen side effects have the potential to occur during development and after product release. The Group prepares for such incidents by carrying appropriate insurance coverage for various types of liabilities, including product liability. However, there is no guarantee that insurance will be sufficient to cover all dam-ages associated with such liabilities. Unforeseen side effects therefore have the potential to impact the Group’s business results and financial position.
Review and Analysis of FYE March 2017 Results

55Our Activities
for Sustainability Corporate InformationIntroduction Financial SectionOur Strategy
7. Government Trends in Medical CareIn the Meiji Group’s pharmaceuticals business, prices of medical-care pharmaceuticals are affected by government medical policies, including drug price revisions and the healthcare insurance system. These have the potential to impact the Group’s business results and financial position.
8. Research and Development in the Pharmaceuticals Business
New product development for the Meiji Group’s pharmaceuticals business implements extended periods of product testing, which requires significant expenses. Instances occur in which safety or efficacy issues compel the Group to extend, suspend, or discontinue research and development projects. The progress status of research and development has the potential to impact the Meiji Group’s business results and financial position. Moreover, launches of products developed by the Group may be delayed if research and development does not proceed as planned, which could require the Group to utilize products of other companies. Such cases have the potential to increase out-lays for intellectual property rights and licensing.
9. LawsuitsIn research and development and other business activities, the Meiji Group takes care to avoid infringing on intellectual property rights of third parties. However, the outcomes of unexpected litigation by third parties who claim infringement on their intellectual property rights have the potential to impact the Group’s business results and financial position.
10. Information LeaksThe Meiji Group has large amounts of confidential informa-tion that is required in business operations, including such personal information as that of customers, and important information concerning its management. For the manage-ment of this information, the Group takes appropriate actions, including system controls; it established the Information Management Committee and provides training to employees, etc. However, there is the risk that currently unforeseeable unauthorized access or computer virus infection will cause leaks, falsification, or the loss of confidential information, or that the computer system could become temporarily unusable, etc. If such a situation occurs, it has the potential to impact the Group’s business results and financial position.
11. Natural DisastersIn its facilities and production plants, the Meiji Group estab-lishes and implements a risk management system to ensure that it can continue business activities when natural disasters occur. However, an unanticipatedly large earthquake and/or other disaster or large-scale destruction of social infrastructure or the widespread outbreak of an infectious disease could have a negative impact on the Group’s business results or financial position due to such factors as disruptions in product supply, damage resulting from a loss of assets, the destruction of facilities, or delays in supply chains.
Further, the above list does not include all of the risks the Group faces.

AssetsMillions of yen
Thousands of U.S. dollars
2017 2016 2017
Current assets:
Cash and deposits (Notes 11,19) ¥ 24,761 ¥ 31,883 $ 220,712
Notes and accounts receivable 190,503 188,276 1,698,047
Inventories (Note 10) 134,234 123,603 1,196,492
Deferred tax assets (Note 12) 9,438 9,387 84,132
Other current assets 19,139 10,191 170,595
Allowance for doubtful accounts (370) (423) (3,299)
Total current assets 377,707 362,919 3,366,680
Fixed assets:
Property, plant and equipment:
Buildings and structures (Note 11) 301,158 292,439 2,684,360
Machinery, equipment, vehicles and fixtures (Note 11) 553,638 547,968 4,934,826
Land (Note 11) 72,603 72,837 647,144
Lease assets 3,972 4,833 35,407
Construction in progress (Note 11) 24,733 11,522 220,458
Accumulated depreciation (590,118) (580,287) (5,259,995)
Total property, plant and equipment (net) 365,986 349,314 3,262,202
Investments and other assets:
Investment securities (Note 8) 63,527 66,151 566,247
Investment securities (unconsolidated subsidiaries and affiliates) (Note 14) 14,334 14,083 127,772
Intangible assets (Note 16) 25,936 29,100 231,185
Deferred tax assets (Note 12) 7,193 6,614 64,121
Net defined benefit asset (Note 13) 20,418 18,588 181,996
Other 8,898 9,527 79,314
Allowance for doubtful accounts (107) (183) (962)
Total investments and other assets 140,201 143,881 1,249,676
Total fixed assets 506,187 493,196 4,511,878
Total assets ¥ 883,895 ¥ 856,115 $ 7,878,559
See accompanying notes to consolidated financial statements.
Consolidated Balance SheetMeiji Holdings Co., Ltd. / As of March 31, 2017
56 Annual Report 2017
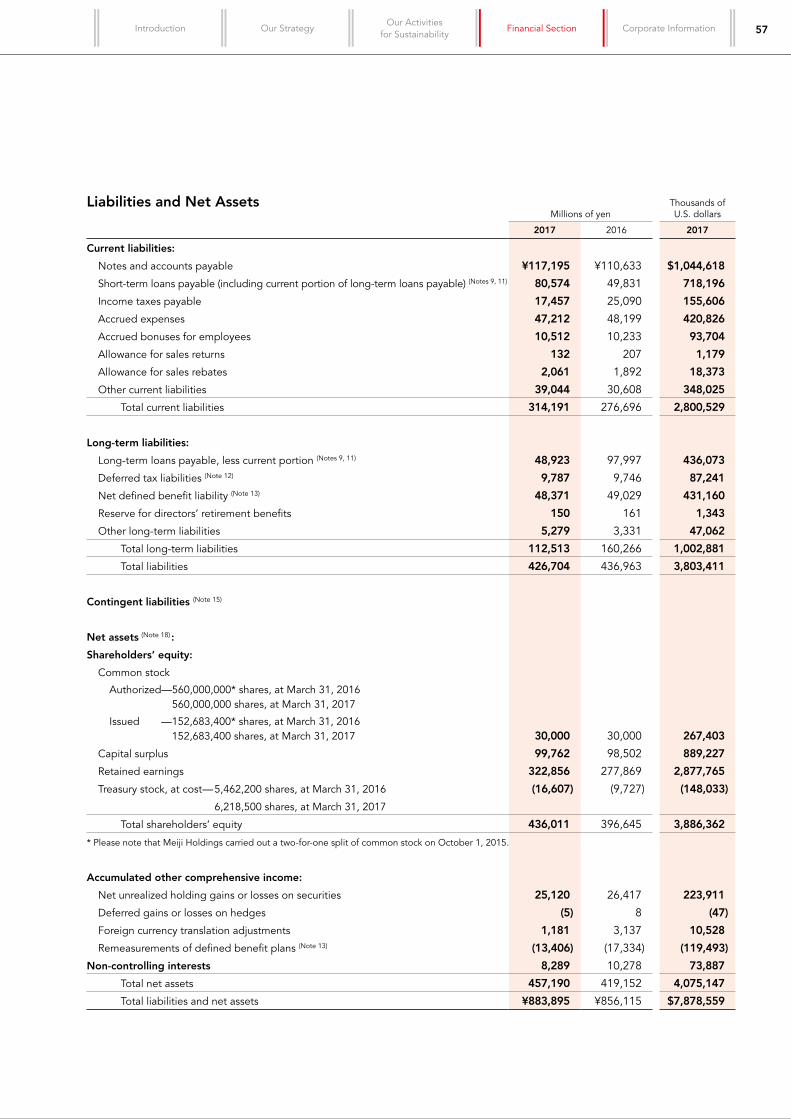
Liabilities and Net AssetsMillions of yen
Thousands of U.S. dollars
2017 2016 2017
Current liabilities:
Notes and accounts payable ¥117,195 ¥110,633 $1,044,618
Short-term loans payable (including current portion of long-term loans payable) (Notes 9, 11) 80,574 49,831 718,196
Income taxes payable 17,457 25,090 155,606
Accrued expenses 47,212 48,199 420,826
Accrued bonuses for employees 10,512 10,233 93,704
Allowance for sales returns 132 207 1,179
Allowance for sales rebates 2,061 1,892 18,373
Other current liabilities 39,044 30,608 348,025
Total current liabilities 314,191 276,696 2,800,529
Long-term liabilities:
Long-term loans payable, less current portion (Notes 9, 11) 48,923 97,997 436,073
Deferred tax liabilities (Note 12) 9,787 9,746 87,241
Net defined benefit liability (Note 13) 48,371 49,029 431,160
Reserve for directors’ retirement benefits 150 161 1,343
Other long-term liabilities 5,279 3,331 47,062
Total long-term liabilities 112,513 160,266 1,002,881
Total liabilities 426,704 436,963 3,803,411
Contingent liabilities (Note 15)
Net assets (Note 18) :
Shareholders’ equity:
Common stock
Authorized— 560,000,000* shares, at March 31, 2016 560,000,000 shares, at March 31, 2017
Issued — 152,683,400* shares, at March 31, 2016 152,683,400 shares, at March 31, 2017 30,000 30,000 267,403
Capital surplus 99,762 98,502 889,227
Retained earnings 322,856 277,869 2,877,765
Treasury stock, at cost — 5,462,200 shares, at March 31, 2016 (16,607) (9,727) (148,033)
6,218,500 shares, at March 31, 2017
Total shareholders’ equity 436,011 396,645 3,886,362
* Please note that Meiji Holdings carried out a two-for-one split of common stock on October 1, 2015.
Accumulated other comprehensive income:
Net unrealized holding gains or losses on securities 25,120 26,417 223,911
Deferred gains or losses on hedges (5) 8 (47)
Foreign currency translation adjustments 1,181 3,137 10,528
Remeasurements of defined benefit plans (Note 13) (13,406) (17,334) (119,493)
Non-controlling interests 8,289 10,278 73,887
Total net assets 457,190 419,152 4,075,147
Total liabilities and net assets ¥883,895 ¥856,115 $7,878,559
57Our Activities
for Sustainability Corporate InformationIntroduction Financial SectionOur Strategy
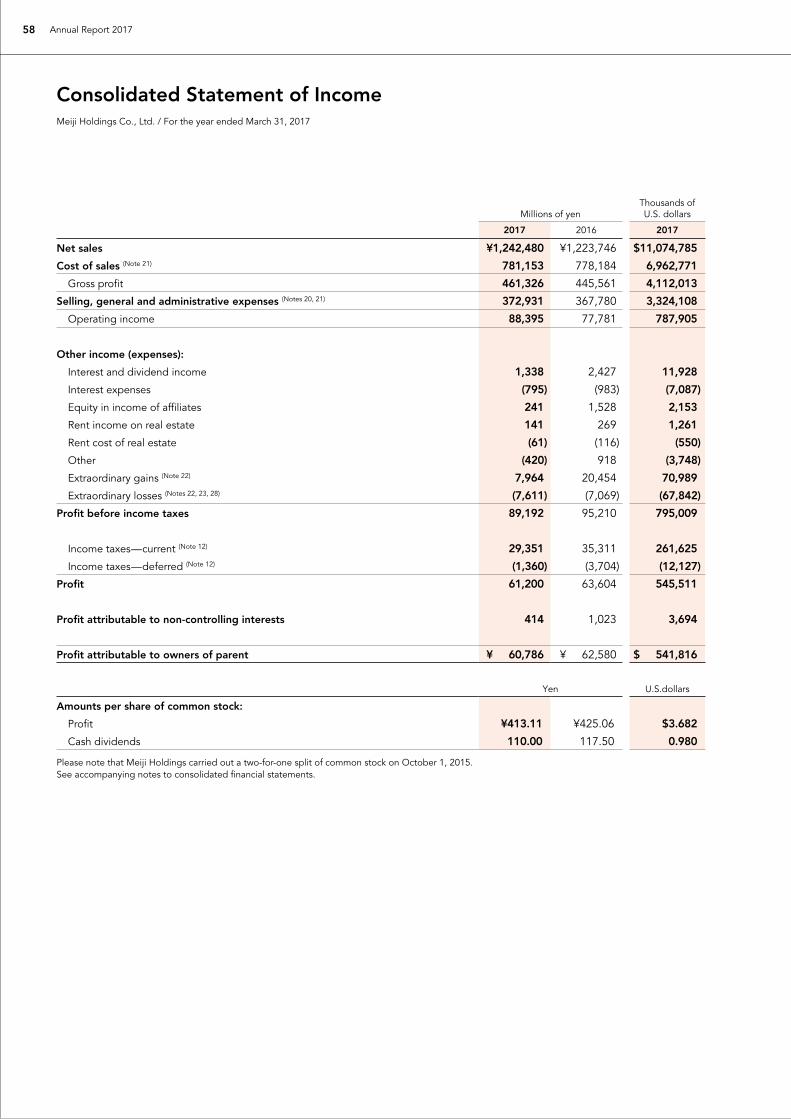
Millions of yenThousands of U.S. dollars
2017 2016 2017
Net sales ¥1,242,480 ¥1,223,746 $11,074,785
Cost of sales (Note 21) 781,153 778,184 6,962,771
Gross profit 461,326 445,561 4,112,013
Selling, general and administrative expenses (Notes 20, 21) 372,931 367,780 3,324,108
Operating income 88,395 77,781 787,905
Other income (expenses):
Interest and dividend income 1,338 2,427 11,928
Interest expenses (795) (983) (7,087)
Equity in income of affiliates 241 1,528 2,153
Rent income on real estate 141 269 1,261
Rent cost of real estate (61) (116) (550)
Other (420) 918 (3,748)
Extraordinary gains (Note 22) 7,964 20,454 70,989
Extraordinary losses (Notes 22, 23, 28) (7,611) (7,069) (67,842)
Profit before income taxes 89,192 95,210 795,009
Income taxes—current (Note 12) 29,351 35,311 261,625
Income taxes—deferred (Note 12) (1,360) (3,704) (12,127)
Profit 61,200 63,604 545,511
Profit attributable to non-controlling interests 414 1,023 3,694
Profit attributable to owners of parent ¥ 60,786 ¥ 62,580 $ 541,816
Yen U.S.dollars
Amounts per share of common stock:
Profit ¥413.11 ¥425.06 $3.682
Cash dividends 110.00 117.50 0.980
Please note that Meiji Holdings carried out a two-for-one split of common stock on October 1, 2015.See accompanying notes to consolidated financial statements.
Consolidated Statement of IncomeMeiji Holdings Co., Ltd. / For the year ended March 31, 2017
58 Annual Report 2017

Millions of yenThousands of U.S. dollars
2017 2016 2017
Profit ¥61,200 ¥ 63,604 $545,511
Other comprehensive income (Note 24):
Net unrealized holding gains or losses on securities (1,273) (553) (11,347)
Deferred gains or losses on hedges (12) (77) (112)
Foreign currency translation adjustments (1,731) (4,702) (15,436)
Remeasurements of defined benefit plans 3,941 (10,626) 35,132
Equity in affiliates accounted for by the equity method (357) 107 (3,190)
Total other comprehensive income 566 (15,853) 5,045
Comprehensive income ¥61,766 ¥ 47,750 $550,556
(Breakdown)
Comprehensive income attributable to owners of parent ¥61,447 ¥ 46,911 $547,711
Comprehensive income attributable to non-controlling interests 319 838 2,845
See accompanying notes to consolidated financial statements.
Consolidated Statement of Comprehensive IncomeMeiji Holdings Co., Ltd. / For the year ended March 31, 2017
59Our Activities
for Sustainability Corporate InformationIntroduction Financial SectionOur Strategy
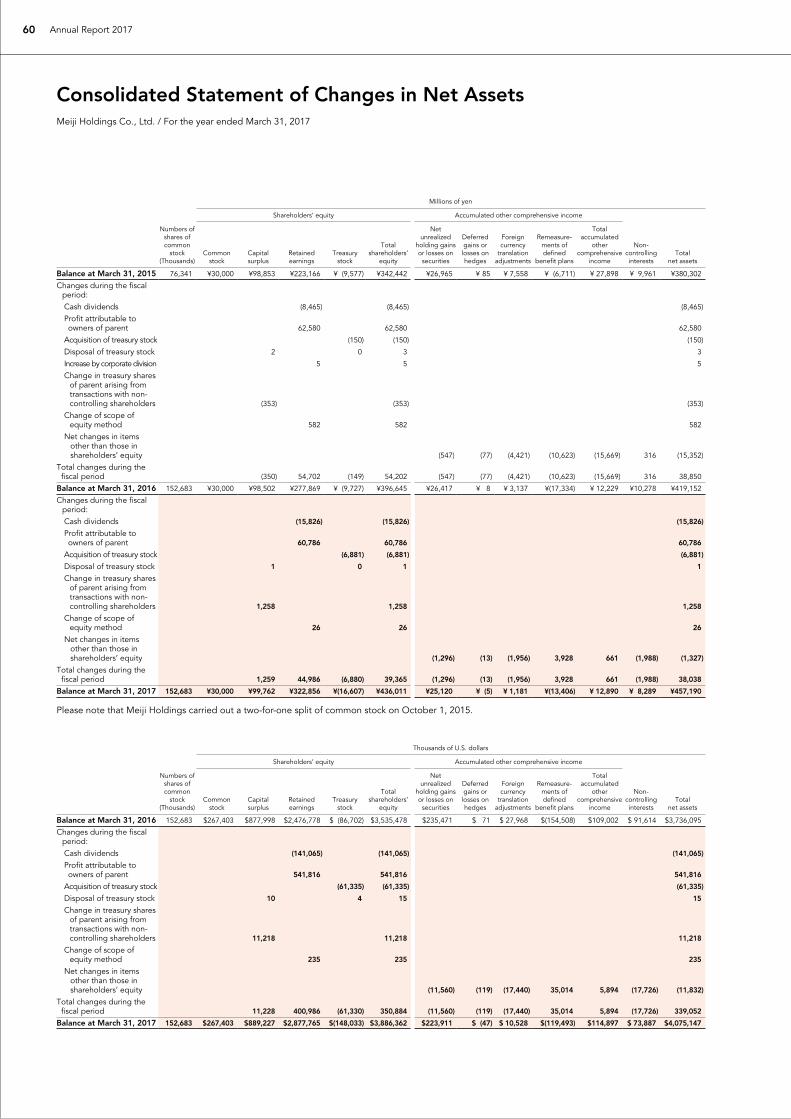
Millions of yen
Shareholders’ equity Accumulated other comprehensive income
Numbers of shares of common
stock (Thousands)
Common stock
Capital surplus
Retained earnings
Treasury stock
Total shareholders’
equity
Net unrealized
holding gains or losses on
securities
Deferred gains or losses on hedges
Foreign currency
translation adjustments
Remeasure-ments of defined
benefit plans
Total accumulated
other comprehen sive
income
Non-controlling interests
Total net assets
B alance at March 31, 2015 76,341 ¥30,000 ¥98,853 ¥223,166 ¥ (9,577) ¥342,442 ¥26,965 ¥ 85 ¥ 7,558 ¥ (6,711) ¥ 27,898 ¥ 9,961 ¥380,302
C hanges during the fiscal period:
Cash dividends (8,465) (8,465) (8,465)
Profit attributable to owners of parent 62,580 62,580 62,580
A cquisition of treasury stock (150) (150) (150)
Disposal of treasury stock 2 0 3 3
Increase by corporate division 5 5 5
C hange in treasury shares of parent arising from transactions with non-controlling shareholders (353) (353) (353)
C hange of scope of equity method 582 582 582
N et changes in items other than those in shareholders’ equity (547) (77) (4,421) (10,623) (15,669) 316 (15,352)
T otal changes during the fiscal period (350) 54,702 (149) 54,202 (547) (77) (4,421) (10,623) (15,669) 316 38,850
Balance at March 31, 2016 152,683 ¥30,000 ¥98,502 ¥277,869 ¥ (9,727) ¥396,645 ¥26,417 ¥ 8 ¥ 3,137 ¥(17,334) ¥ 12,229 ¥10,278 ¥419,152
C hanges during the fiscal period:
Cash dividends (15,826) (15,826) (15,826)
Profit attributable to owners of parent 60,786 60,786 60,786
A cquisition of treasury stock (6,881) (6,881) (6,881)
Disposal of treasury stock 1 0 1 1
C hange in treasury shares of parent arising from transactions with non-controlling shareholders 1,258 1,258 1,258
C hange of scope of equity method 26 26 26
N et changes in items other than those in shareholders’ equity (1,296) (13) (1,956) 3,928 661 (1,988) (1,327)
T otal changes during the fiscal period 1,259 44,986 (6,880) 39,365 (1,296) (13) (1,956) 3,928 661 (1,988) 38,038
Balance at March 31, 2017 152,683 ¥30,000 ¥99,762 ¥322,856 ¥(16,607) ¥436,011 ¥25,120 ¥ (5) ¥ 1,181 ¥(13,406) ¥ 12,890 ¥ 8,289 ¥457,190
Please note that Meiji Holdings carried out a two-for-one split of common stock on October 1, 2015.
Thousands of U.S. dollars
Shareholders’ equity Accumulated other comprehensive income
Numbers of shares of common
stock (Thousands)
Common stock
Capital surplus
Retained earnings
Treasury stock
Total shareholders’
equity
Net unrealized
holding gains or losses on
securities
Deferred gains or losses on hedges
Foreign currency
translation adjustments
Remeasure-ments of defined
benefit plans
Total accumulated
other comprehen sive
income
Non-controlling interests
Total net assets
B alance at March 31, 2016 152,683 $267,403 $877,998 $2,476,778 $ (86,702) $3,535,478 $235,471 $ 71 $ 27,968 $(154,508) $109,002 $ 91,614 $3,736,095
C hanges during the fiscal period:
Cash dividends (141,065) (141,065) (141,065)
Profit attributable to owners of parent 541,816 541,816 541,816
A cquisition of treasury stock (61,335) (61,335) (61,335)
Disposal of treasury stock 10 4 15 15
C hange in treasury shares of parent arising from transactions with non-controlling shareholders 11,218 11,218 11,218
C hange of scope of equity method 235 235 235
N et changes in items other than those in shareholders’ equity (11,560) (119) (17,440) 35,014 5,894 (17,726) (11,832)
T otal changes during the fiscal period 11,228 400,986 (61,330) 350,884 (11,560) (119) (17,440) 35,014 5,894 (17,726) 339,052
Balance at March 31, 2017 152,683 $267,403 $889,227 $2,877,765 $(148,033) $3,886,362 $223,911 $ (47) $ 10,528 $(119,493) $114,897 $ 73,887 $4,075,147
Consolidated Statement of Changes in Net AssetsMeiji Holdings Co., Ltd. / For the year ended March 31, 2017
60 Annual Report 2017

Millions of yenThousands of U.S. dollars
2017 2016 2017
Cash flows from operating activities: Profit before income taxes ¥ 89,192 ¥ 95,210 $ 795,009 Depreciation and amortization 45,872 42,077 408,878 Impairment loss 754 1,859 6,727 Amortization of goodwill 1,605 1,777 14,314 Loss (gain) on disposal of property, plant and equipment 3,691 3,414 32,902 Loss (gain) on valuation of investment securities 52 905 464 Increase (decrease) in allowance for doubtful accounts 291 24 2,602 Increase (decrease) in accrued bonuses for employees 276 418 2,460 Increase (decrease) in net defined benefit liability 3,192 4,141 28,456 Interest and dividend income (1,338) (2,427) (11,928) Interest expenses 795 983 7,087 Equity in loss (income) of affiliates (241) (1,528) (2,153) Loss (gain) on sales of property, plant and equipment (5,316) (19,707) (47,388) Loss (gain) on sales of investment securities (2,317) (71) (20,656) Decrease (increase) in trade receivables (3,183) (8,988) (28,378) Decrease (increase) in inventories (10,668) 5,329 (95,091) Increase (decrease) in notes and accounts payable 5,219 (673) 46,520 Other (5,374) 4,359 (47,909) Subtotal 122,502 127,104 1,091,916 Interest and dividends received 1,346 2,824 11,997 Interest paid (779) (1,009) (6,947) Income taxes paid (41,179) (23,763) (367,052) Net cash provided by operating activities 81,888 105,155 729,913
Cash flows from investing activities: Payments for purchases of property, plant and equipment (48,670) (40,078) (433,824) Payments for purchases of intangible fixed assets (1,746) (2,276) (15,571) Proceeds from sales of property, plant and equipment and intangible fixed assets 6,872 2,352 61,261 Proceeds from sales of investments in real estate 118 33,918 1,058 Payments for purchases of investment securities (667) (6,286) (5,949) Proceeds from sales of investment securities 2,957 3,619 26,359 P roceeds from sales of investments in subsidiaries
resulting in change in scope of consolidation 17 1,273 155 P ayments for purchases of investments in subsidiaries
resulting in change in scope of consolidation (Note 19) — (446) — Other (3,173) (1,885) (28,282) Net cash used in investing activities (44,291) (9,809) (394,792)
Cash flows from financing activities: Increase (decrease) in short-term loans payable 1,572 (19,084) 14,016 Increase (decrease) in commercial paper — (38,000) — Proceeds from long-term loans payable 3,968 2,501 35,372 Repayment of long-term loans payable (3,742) (4,550) (33,357) Payments for redemption of bonds (20,000) (15,373) (178,269) Decrease (increase) in treasury stock (6,048) (147) (53,909) Cash dividends paid (15,772) (8,441) (140,591) Cash dividends paid to non-controlling shareholders (177) (113) (1,583) Payments made to trust account for acquisition of treasury stock (4,001) — (35,664) Other (2,346) (1,862) (20,919) Net cash used in financing activities (46,548) (85,071) (414,904)Effect of exchange rate changes on cash and cash equivalents (318) (669) (2,840)Net increase (decrease) in cash and cash equivalents (9,269) 9,605 (82,624)Cash and cash equivalents at beginning of the year 31,516 21,912 280,918Increase in cash and cash equivalents from newly consolidated subsidiaries 378 — 3,371Decrease in cash and cash equivalents due to changes in scope of consolidation — (1) —Cash and cash equivalents at end of the year (Note 19) ¥ 22,624 ¥ 31,516 $ 201,665
See accompanying notes to consolidated financial statements.
Consolidated Statement of Cash FlowsMeiji Holdings Co., Ltd. / For the year ended March 31, 2017
61Our Activities
for Sustainability Corporate InformationIntroduction Financial SectionOur Strategy

1. Basis of Presenting Consolidated Financial Statements
The accompanying consolidated financial statements of Meiji Holdings Co., Ltd. (the “Company”) and its consolidated subsidiaries have been prepared from the consolidated financial statements in Japanese filed with the Kanto Local Finance Bureau as required by the Financial Instruments and Exchange Law. The statements conform to generally accepted accounting principles and practices in Japan (“Japan GAAP”), which are different in certain respects regarding the application and disclosure requirements of International Financial Reporting Standards (“IFRS”). The consolidated financial statements are not intended to present the financial position, results of operations or cash flows in accordance with accounting principles and practices generally accepted in countries and jurisdictions other than Japan. In preparing the accompanying consolidated financial state-ments, certain reclassifications have been made to present the information in a form familiar to readers outside Japan. The accounts and the financial statements of the Company and its subsidiaries are maintained in Japanese yen. For the conve-nience of the reader, the accompanying consolidated financial statements are also presented in U.S. dollars by converting Japanese yen amounts at the exchange rate of ¥112.19 to US$1, the amount prevailing on March 31, 2017. This transla-tion should not be construed as a representation that amounts shown could be converted into U.S. dollars at such rate. Amounts less than one million yen and one thousand U.S. dollars have been rounded down. The total Japanese yen and U.S. dollar amounts shown in the financial statements and notes do not necessarily agree with the sum of the individual amounts. Certain amounts in prior years’ financial statements have been reclassified to conform to the current year’s presentation.
2. Significant Accounting Policiesa) Consolidation PolicyThe accompanying consolidated financial statements include the accounts of the Company and significant subsidiaries over which the Company has power of control through majority voting rights or existence of certain conditions evidencing control by the Company. Investments in affiliates over which the Company has the ability to exercise significant influence over operating and financial policies of the investees are accounted for by the equity method. The consolidated financial statements consist of the Company and its 58 consolidated subsidiaries. All significant intercompany transactions and accounts have been elimi-nated. Accounts of subsidiaries whose fiscal year-ends are December 31 have been included using financial information at that date with appropriate adjustment where necessary.
Investments in six affiliates are accounted for by the equity method. The difference between the cost and underlying net equity at acquisition of investments in consolidated subsidiaries and affiliates is allocated to identifiable assets based on fair value at the date of acquisition. The unallo-cated portion is recognized as goodwill and amortized over a period of 5–10 years on a straight-line basis.
b) Translation of Foreign CurrencyMonetary receivables and payables denominated in foreign currencies are translated into Japanese yen at the exchange rate at the consolidated balance sheet date. The difference arising from the translation is accounted for as a gain or loss. The assets and liabilities of overseas subsidiaries are trans-lated into Japanese yen at the year-end rate, whereas the income and expenses of overseas subsidiaries are translated into Japanese yen using the average exchange rate during the fiscal year. The translation adjustments are included in foreign currency translation adjustments and non-controlling interests in the net assets section of the consolidated balance sheet.
c) Investment SecuritiesInvestment securities are valued using the following standards and methods.Other securities Securities that have market prices: By the market value method based on market prices
at the consolidated fiscal year-end. Unrealized holding gains or losses, net of the appli-
cable income taxes, are included directly in net assets, and cost of security sold is calculated using the moving-average method.
Securities that have no market prices: Primarily by the cost method based on the moving-
average method.
d) DerivativesDerivatives are valued by the market value method.
e) InventoriesInventories are stated at cost determined mainly based on the average method (cost is written down to reflect the decline in their profitability).
f) Property, Plant and Equipment (excluding lease assets)The Company and its domestic consolidated subsidiariesIn the domestic consolidated subsidiaries, the straight-line method is primarily used for depreciation (the declining balance method is used for the property, plant and equip-ment of headquarters (excluding the headquarters building), branches, research laboratories and confectionery plants and
Notes to Consolidated Financial StatementsMeiji Holdings Co., Ltd.
62 Annual Report 2017

others). For the assets owned by the Company, the declining balance method is used for depreciation. Further, depreciation of buildings (excluding attached fixtures) acquired on or after April 1, 1998, and facilities attached to buildings and structures acquired on or after April 1, 2016, is calculated by the straight-line method.
Overseas consolidated subsidiariesThe straight-line method is primarily used for depreciation.
The estimated useful lives of the assets are as follows: Buildings and structures 2–60 years Machinery, equipment and vehicles 2–18 years Tools, furniture and fixtures 2–20 years
g) Intangible Fixed Assets (Excluding Lease Assets)Amortization of intangible fixed assets is calculated primarily by the straight-line method. Amortization of internal-use software is calculated by the straight-line method based on the estimated useful lives of five years.
h) Lease AssetsFinance lease assets whose ownership does not transfer to the lesseeFor the depreciation of lease assets, the straight-line method is applied based on the lease term as the useful life of the asset and the residual value of zero.
i) Investments in Real EstateThe straight-line method is primarily used for depreciation.
j) Allowance for Doubtful AccountsTo provide for losses on doubtful accounts such as notes and accounts receivable, the Company and its consolidated subsid-iaries primarily record allowances based on actual loss experi-ence for normal accounts, and an amount estimated to be unrecoverable for individual companies in financial difficulty.
k) Accrued Bonuses for EmployeesTo provide for payment of bonuses to employees existing on the consolidated balance sheet date, the amount expected to be paid for the subject period is recorded.
l) Allowance for Sales ReturnsAt some of the Company’s consolidated subsidiaries, in order to provide for losses due to returns of goods and products sold, an allowance is recorded by multiplying the accounts receivable balance, the actual return ratio and the gross margin ratio.
m) Allowance for Sales RebatesAt some of the Company’s consolidated subsidiaries, in order to provide for sales discounts on goods and products sold, an allowance is recorded at the estimated amount in consid-eration of the discount ratio.
n) Reserve for Directors’ Retirement BenefitsThe Company and its consolidated subsidiaries provide for retirement benefits for directors and corporate auditors based on the amount required to be paid at the end of the fiscal year under the Company bylaws.
o) Retirement and Severance Benefits(1) Method used to attribute expected benefit payments
to periodsIn calculating retirement benefit obligation, the benefit formula basis method is used to attribute expected benefit payments to the period extending up to the end of the fiscal year.(2) Method of amortizing actuarial gains or losses, prior
service costsActuarial gains or losses are amortized from the consolidated fiscal year following the year in which the gain or loss is incurred by the straight-line method for a certain number of years (7–15 years) not longer than employees’ average remaining years of service. Prior service costs are amortized from the time they accrue by the straight-line method for a certain number of years (principally 4 years) within employees’ average remaining years of service.(3) Accounting treatment for unrecognized actuarial gains or
losses, unrecognized prior service costsUnrecognized actuarial gains or losses and unrecognized prior service costs are adjusted for tax effect and then recorded in remeasurements of defined benefit plans under accumulated other comprehensive income in the net assets portion of the consolidated balance sheet.
63Our Activities
for Sustainability Corporate InformationIntroduction Financial SectionOur Strategy

p) Cash and Cash EquivalentsCash and cash equivalents in the consolidated statement of cash flows are composed of cash on hand, bank deposits available for withdrawal on demand and short-term invest-ments with original maturity of three months or less, which have minor risk of fluctuations in value.
q) Derivative Financial Instruments(1) Method of hedge accountingThe deferral hedge accounting method is applied under which the unrealized gain or loss is deferred as a component of net assets when certain criteria are met. For forward foreign exchange contracts, etc., the allocation method is applied when the relevant criteria are met. For interest rate and currency swaps, the integrated method (the shortcut method, the allocation method) is applied when the relevant criteria are met.(2) Hedge instruments and hedged items
Hedge instruments: Hedged items:
Forward foreign exchange contracts and other instruments
Trade payables and receivables denominated in foreign currencies and forecasted transactions denominated in foreign currencies
Interest rate and currency swap contracts
Interest on loans payable and loans payable
(3) Hedge policySome of the Company’s consolidated subsidiaries use forward foreign exchange contracts and other instruments to mitigate the currency exchange rate risk associated with import and export transactions conducted in the normal course of business. The Company uses interest rate and currency swap transactions to reduce the interest rate and foreign exchange rate fluctuation risk involved in procuring funds. The Company and its consolidated subsidiaries do not use derivatives for speculative purposes.(4) Method of evaluating the effectiveness of the hedgeAs forward foreign exchange contracts, etc., are used as a hedge against trade payables and receivables denominated in foreign currencies to fix the yen-denominated future cash flows, the allocation method is applied, and the requirements of assessing the effectiveness of the hedge on a periodic basis are satisfied. For forecasted transactions denominated in foreign currencies, suitability for hedging is investigated with consideration of whether the transaction is highly likely to be executed. The assessment of the hedge effectiveness is omitted when the interest rate and currency swaps meet the integrated method (the shortcut method, the allocation method) with a high correla-tion between the hedged items and hedging instruments.
r) Other Important Matters for the Preparation and Presentation of Consolidated Financial Statements
Bond issuance cost is recognized in expenses as incurred. Consumption taxes and local consumption taxes are accounted for using the tax exclusion method.
3. Changes in Accounting PolicyApplication of the Practical Solution on a Change in Depre-ciation Method Due to Tax Reform 2016In accordance with the amendment of the Corporation Tax Act, the Company and certain of its domestic consolidated subsidiaries have adopted the Practical Solution on a Change in Depreciation Method Due to Tax Reform 2016 (Accounting Standards Board of Japan (ASBJ) Practical Issues Task Force (PITF) No. 32, June 17, 2016) as of the fiscal year ended March 31, 2017, and have changed the depreciation method for facilities attached to buildings and structures acquired on or after April 1, 2016, from the declining balance method to the straight-line method. Further, the effect of these changes on the consolidated financial statements for the fiscal year ended March 31, 2017, is immaterial.
4. Change in Accounting Estimates(Change in useful lives)In the fiscal year ended March 31, 2017, due to the relocation of the head office and research laboratories of Meiji Co., Ltd. in relation to buildings (including attached fixtures) and struc-tures, the Company reduced the useful lives of assets that are expected to be abandoned following the relocation and has applied this change prospectively. As a result of this change, compared to calculations based on the previous method, operating income and profit before income taxes for the fiscal year ended March 31, 2017, each decreased by ¥2,103 million ($18,746 thousand). Further-more, profit per share for the fiscal year ended March 31, 2017, decreased by ¥14.29 ($0.12).
5. Additional InformationApplication of Implementation Guidance on Recoverability of Deferred Tax AssetsThe Company and its consolidated subsidiaries have adopted Implementation Guidance on Recoverability of Deferred Tax Assets (ASBJ Guidance No. 26, March 28, 2016) as of the fiscal year ended March 31, 2017.
Notes to Consolidated Financial Statements
64 Annual Report 2017

6. Notes Regarding Lease TransactionsFinance lease transactions (lessee side)Finance lease transactions whose ownership does not transfer(1) Content of lease assetsProperty, plant and equipmentMainly sales of equipment (equipment and fixtures), production facilities in manufacturing plants (machinery and vehicles) and testing and research equipment (machinery, equipment and fixtures).(2) Method of depreciation of lease assetsAs described in “2. Significant Accounting Policies, h) Lease Assets.”
7. Notes Regarding Financial Instruments1) Overview of financial instruments(1) Policy for financial instrumentsThe Meiji Group (the “Group”) raises necessary funds (primarily through bank loans and bond issuance) based on its capital investment and working capital plans, mainly to engage in the business of manufacturing and selling dairy products, confec-tioneries, food products and pharmaceuticals. The Company manages temporary surplus funds through highly secured financial instruments and raises short-term operating funds by issuing commercial paper, etc. Derivatives are used to mitigate the risks described below. Consequently, the Company does not enter into any speculative deals.(2) Content and risks of financial instrumentsNotes and accounts receivable that are trade receivables are exposed to the credit risk of customers. Also, foreign currency-denominated trade receivables arise from operating businesses globally; these are exposed to currency fluctua-tion risk, but some consolidated subsidiaries hedge such risk using forward foreign exchange contracts, etc. Investment securities are mainly shares held in relation to business with partner companies, capital alliances, etc.; these are exposed to fluctuation risk of market prices. Notes and accounts payable that are trade payables are almost all payable within one year. Also, some of these are foreign currency-denominated, resulting from the import of raw materials; these are exposed to currency fluctuation risk, but some consolidated subsidiaries use forward foreign exchange contracts, etc., to hedge such risk. Loans, commercial paper and bonds are mainly used to raise funds for capital investment and working capital. Their redemption dates are at maximum 11 years and one month after the balance sheet date. Some of these have forward foreign exchange contracts and variable interest rates and currency, thus they are exposed to interest rate and currency fluctuation risk. However, the Group uses derivative transac-tions (interest rate and currency swap transactions) to hedge such risk.
Derivative transactions are transactions such as forward foreign exchange contracts, etc., used to hedge currency fluctuation risk related to foreign currency-denominated trade receivables and payables, and interest rate and currency swap transactions used to hedge interest rate fluctuation risk related to variable interest rate and currency payments on loans payable.(3) Risk management for financial instruments[1] Management of credit risk (risk such as default of contract
by customers)In accordance with receivables management rules, etc., each management department in each business unit of the Group periodically monitors the status of major customers, and due dates and balances are managed for each customer. The Group makes efforts for early detection and reduction of collection concerns due to deterioration in financial conditions, etc., of customers. Derivative transactions are only executed with highly rated financial institutions to reduce counterparty risk.[2] Management of market risk (the risk of fluctuation in
exchange rates, interest rates, etc.)For foreign currency-denominated trade receivables and payables, some consolidated subsidiaries use forward foreign exchange contracts, etc., to hedge the currency fluctuation risk identified by currency and by month. Further, the Company uses interest rate and currency swap transactions to curb the interest rate and currency fluctuation risk related to interest payments on loans. At some consolidated subsidiaries, each related depart-ment engages in derivative transactions based on derivative transaction management rules, which establish the transac-tion authority and amount limitations.[3] Management of liquidity risk regarding fund procurement
(the risk of becoming unable to make payment on the payment date)
Based on reports from each business unit, the Group creates and updates cash flow plans in a timely manner, and manages liquidity risk.(4) Supplemental explanation of matters related to
the fair value, etc., of financial instrumentsFair value of financial instruments includes prices based on market prices, and prices rationally calculated in cases where there are no market prices. Variable factors are incorporated into the calculation of such prices, therefore, different assumptions could result in different prices.
2) Matters related to the fair value, etc., of financial instruments
The carrying value, fair value and their difference as of March 31, 2017 and 2016, are presented in the following tables. The tables do not include financial instruments for which it is extremely difficult to determine the fair value (see Note 2).
65Our Activities
for Sustainability Corporate InformationIntroduction Financial SectionOur Strategy

Notes to Consolidated Financial Statements
Millions of yen Thousands of U.S. dollars
As of March 31, 2017 Carrying value Fair value Difference Carrying value Fair value Difference
(1) Cash and deposits ¥ 24,761 ¥ 24,761 ¥ — $ 220,712 $ 220,712 $ —(2) Notes and accounts receivable 183,807 183,807 — 1,638,357 1,638,357 —(3) Investment securities: Other securities 61,271 61,271 — 546,137 546,137 — Total assets 269,840 269,840 — 2,405,206 2,405,206 —(4) Notes and accounts payable 110,730 110,730 — 986,990 986,990 —(5) Short-term loans payable 27,995 27,995 — 249,535 249,535 —(6) Accrued expenses 47,212 47,212 — 420,826 420,826 —(7) Bonds 30,000 30,042 42 267,403 267,777 374(8) Long-term loans payable 71,502 71,045 (457) 637,331 633,257 (4,073) Total liabilities ¥287,440 ¥287,025 ¥(415) $2,562,086 $2,558,387 $(3,699)
(Note 1) Method of calculating the fair value of financial instruments and matters related to securities (1) Cash and deposits and (2) Notes and accounts receivable These are valued at the carrying values as they are to be settled within a short period and their fair values are almost equal to the carrying values. (3) Investment securities Equity securities are valued at the price quoted in the stock exchange. Debt securities are calculated based on the present value, which is the total of the principal and interest discounted by an interest rate that
takes into account the credit risk. (4) Notes and accounts payable, (5) Short-term loans payable and (6) Accrued expenses These are valued at the carrying values as they are to be settled within a short period and their fair values are almost equal to the carrying values. (7) Bonds The fair value of bonds issued by the Group is calculated based on the market price. (8) Long-term loans payable The fair value of long-term loans payable is calculated based on the total of the principal and interest discounted by the interest rate that is
assumed if new borrowings were made with similar terms.(Note 2) Unlisted stocks (carrying value on the consolidated balance sheet: ¥16,591 million ($147,883 thousand)) are not included in other securities under
“(3) Investment securities” above as their market prices are not available and it is extremely difficult to determine the fair value.
Millions of yen
As of March 31, 2016 Carrying value Fair value Difference
(1) Cash and deposits ¥ 31,883 ¥ 31,883 ¥ —(2) Notes and accounts receivable 181,493 181,493 —(3) Investment securities: Other securities 63,802 63,802 — Total assets 277,180 277,180 —(4) Notes and accounts payable 104,006 104,006 —(5) Short-term loans payable 26,515 26,515 —(6) Accrued expenses 48,199 48,199 —(7) Bonds 50,000 50,151 151(8) Long-term loans payable 71,313 71,101 (211) Total liabilities ¥300,034 ¥299,973 ¥ (60)
(Note) Unlisted stocks (carrying value on the consolidated balance sheet: ¥16,432 million) are not included in other securities under “(3) Investment securities” above as their market prices are not available and it is extremely difficult to determine the fair value.
66 Annual Report 2017

8. Investment SecuritiesInformation regarding securities held by the Company and its consolidated subsidiaries is as follows:1) Held-to-maturity securities As of March 31, 2017NoneAs of March 31, 2016None
2) Other securities with market prices as of March 31, 2017 and 2016
Millions of yen Thousands of U.S. dollars
As of March 31, 2017 Carrying value Acquisition costUnrealized gain (loss) Carrying value Acquisition cost
Unrealized gain (loss)
Securities whose carrying value exceeds their acquisition cost:
Stocks ¥60,878 ¥25,205 ¥35,672 $542,640 $224,670 $317,969
Other
Subtotal 60,878 25,205 35,672 542,640 224,670 317,969
Securities whose acquisition cost exceeds their carrying value:
Stocks 392 486 (93) 3,497 4,334 (837)
Other
Subtotal 392 486 (93) 3,497 4,334 (837)
Total ¥61,271 ¥25,692 ¥35,579 $546,137 $229,005 $317,131
(Note) Unlisted stocks (carrying value on the consolidated balance sheet: ¥2,256 million ($20,110 thousand)) are not included in the table above as their market prices are not available and it is extremely difficult to determine the fair value.
Millions of yen
As of March 31, 2016 Carrying value Acquisition costUnrealized gain (loss)
Securities whose carrying value exceeds their acquisition cost:
Stocks ¥62,679 ¥24,696 ¥37,983
Other
Subtotal 62,679 24,696 37,983
Securities whose acquisition cost exceeds their carrying value:
Stocks 1,122 1,310 (187)
Other
Subtotal 1,122 1,310 (187)
Total ¥63,802 ¥26,006 ¥37,796
(Note) Unlisted stocks (carrying value on the consolidated balance sheet: ¥2,349 million) are not included in the table above as their market prices are not available and it is extremely difficult to determine the fair value.
67Our Activities
for Sustainability Corporate InformationIntroduction Financial SectionOur Strategy

3) Other securities sold during the fiscal years ended March 31, 2017 and 2016
Millions of yenThousands of U.S. dollars
2017 2016 2017
Sales amounts ¥2,957 ¥119 $26,359
Total gains on sales 2,318 72 20,662
Total losses on sales 0 0 5
4) Securities that were subject to impairment in the fiscal years ended March 31, 2017 and 2016Impairment loss recorded in the fiscal year ended March 31, 2017, was ¥52 million (other securities: ¥52 million ($464 thousand)). Impairment loss recorded in the fiscal year ended March 31, 2016, was ¥905 million (other securities: ¥905 million). Impairment is taken for all securities when the year-end market value has declined by 50% or more below the acquisition cost. For securities with the year-end market value that has declined by 30%–50% below the acquisition cost, impairment is taken at an amount necessary in consideration of the potential for recovery and other factors.
9. Short-Term Loans Payable and Long-Term Loans PayableAs of March 31, 2017 and 2016, short-term loans payable and long-term loans payable are as follows:1) Short-term loans payable
Weighted-average interest rate
Millions of yenThousands of U.S. dollars
2017 2016 2017
Short-term loans payable 0.96% ¥27,995 ¥26,515 $249,535
Current portion of long-term loans payable 0.73% 22,579 3,316 201,257
Current portion of long-term loans payable (bonds) 0.32% 30,000 20,000 267,403
Total ¥80,574 ¥49,831 $718,196
2) Long-term loans payable
Millions of yenThousands of U.S. dollars
2017 2016 2017
Unsecured bonds due 2016, 0.49% ¥ — ¥ 20,000 $ —
Unsecured bonds due 2018, 0.76% (Note 15, 2nd series) — — —
Unsecured bonds due 2017, 0.31% 10,000 10,000 89,134
Unsecured bonds due 2019, 0.51% (Note 15, 4th series) — — —
Unsecured bonds due 2017, 0.33% 20,000 20,000 178,269
Unsecured bonds due 2021, 0.52% (Note 15, 6th series) — — —
Loans from domestic banks, insurance companies, government agencies and others, due 2017 to 2025 71,502 71,313 637,331
Subtotal 101,502 121,313 904,735
Current portion of long-term loans payable (22,579) (3,316) (201,257)
Current portion of long-term loans payable (bonds) (30,000) (20,000) (267,403)
Total ¥ 48,923 ¥ 97,997 $ 436,073
Notes to Consolidated Financial Statements
68 Annual Report 2017

As of March 31, 2017, the aggregate annual maturities of long-term loans payable are as follows (other than bonds):
Millions of yenThousands of U.S. dollars
2017 2017
More than one year up to two years ¥13,412 $119,547
More than two years up to three years 3,779 33,691
More than three years up to four years 5,814 51,823
More than four years up to five years 23,996 213,889
More than five years 1,920 17,122
Total ¥48,923 $436,073
11. Collateral and Secured LiabilitiesA summary of assets pledged as collateral for liabilities as of March 31, 2017 and 2016, is as follows:
Millions of yenThousands of U.S. dollars
2017 2016 2017
Cash and deposits ¥ 146 ¥ 146 $ 1,306
Buildings and structures 1,970 3,369 17,567
Machinery, equipment, vehicles and fixtures 1,758 2,783 15,670
Land 1,780 2,607 15,874
Construction in progress — 3,696 —
Total ¥5,656 ¥12,603 $50,418
A summary of secured liability as of March 31, 2017 and 2016, is as follows:
Millions of yenThousands of U.S. dollars
2017 2016 2017
Short-term loans payable ¥4,617 ¥3,628 $41,155
Long-term loans payable 3,484 6,140 31,056
Total ¥8,101 ¥9,769 $72,211
10. InventoriesInventories as of March 31, 2017 and 2016, are as follows:
Millions of yenThousands of U.S. dollars
2017 2016 2017
Goods and products ¥ 88,524 ¥ 80,729 $ 789,057
Work in progress 4,114 3,365 36,670
Raw materials and supplies 41,596 39,509 370,765
Total ¥134,234 ¥123,603 $1,196,492
69Our Activities
for Sustainability Corporate InformationIntroduction Financial SectionOur Strategy

Notes to Consolidated Financial Statements
12. Deferred Tax Assets and Liabilities1) The significant components of deferred tax assets and liabilities as of March 31, 2017 and 2016, are as follows:
Millions of yenThousands of U.S. dollars
2017 2016 2017
Deferred tax assets:
Net defined benefit liability ¥ 17,174 ¥ 18,279 $ 153,083
Accrued enterprise tax and others 1,013 1,833 9,030
Accrued expenses 2,509 2,198 22,364
Investment securities 1,183 1,186 10,552
Accrued bonuses for employees 3,250 3,175 28,972
Depreciation of fixed assets 5,890 3,649 52,504
Unrealized gain 840 807 7,493
Investment subsidiary basis differences 877 876 7,820
Losses carried forward 2,009 917 17,913
Other 6,758 7,034 60,244
Subtotal 41,507 39,958 369,979
Valuation allowance (6,061) (5,672) (54,032)
Total deferred tax assets 35,446 34,286 315,946
Deferred tax liabilities:
Advanced depreciation reserve for fixed assets (7,421) (6,485) (66,153)
Unrealized holding gains or losses on securities (10,369) (11,326) (92,432)
Net defined benefit asset (5,807) (6,195) (51,762)
Valuation difference due to purchase of investments in subsidiaries (3,907) (2,833) (34,825)
Other (1,095) (1,289) (9,764)
Total deferred tax liabilities (28,601) (28,130) (254,937)
Net deferred tax assets (liabilities) ¥ 6,844 ¥ 6,155 $ 61,008
2) An analysis of the significant differences between the statutory tax rate and the Company’s effective tax rate for the fiscal years ended March 31, 2017 and 2016, is as follows:
2017 2016
Statutory tax rate 30.9% 33.1%
Entertainment and other permanently non-deductible expenses 1.0 1.0
Dividend and other permanently non-taxable income (0.1) (0.2)
Per capital inhabitant’s tax 0.4 0.4
Tax credit for experimentation and research expenses (1.7) (1.9)
Increase (decrease) in valuation allowance 0.5 (0.2)
Downward adjustment to deferred tax assets and liabilities at end of period accompanying change in tax rate — 0.6
Other 0.4 0.4
Effective tax rate 31.4% 33.2%
70 Annual Report 2017

Defined benefit plans1) Reconciliation of the beginning and ending balances of retirement benefit obligations
Millions of yenThousands of U.S. dollars
2017 2016 2017
Beginning balance of retirement benefit obligations ¥139,538 ¥127,140 $1,243,767
Service cost 5,253 4,645 46,827
Interest cost 747 1,898 6,666
Actuarial gains or losses 138 13,026 1,235
Retirement benefits paid (7,912) (7,140) (70,530)
Other (43) (31) (388)
Ending balance of retirement benefit obligations ¥137,722 ¥139,538 $1,227,578
(Note) In regard to the multi-employer defined benefit pension plan, the amount of retirement benefit obligation has not been included in the afore- mentioned data because of the difficulty in reasonably calculating the amount of plan assets corresponding to the Group’s contributions.
2) Reconciliation of the beginning and ending balances of plan assets
Millions of yenThousands of U.S. dollars
2017 2016 2017
Beginning balance of plan assets ¥109,096 ¥115,933 $972,427
Expected return on plan assets 2,514 2,627 22,416
Actuarial gains or losses 1,678 (5,827) 14,957
Contributions from employer 1,338 1,343 11,926
Retirement benefits paid (4,801) (4,970) (42,801)
Other (57) (9) (511)
Ending balance of plan assets ¥109,768 ¥109,096 $978,414
(Note) The multi-employer defined benefit pension plan is not included in plan assets.
13. Retirement and Severance BenefitsOutline of the retirement benefit plans adopted by the Group (As of March 31, 2017)The Group adopts employees’ retirement benefit plans, consisting of lump-sum severance payment plans based on retirement benefits rules, defined benefit plans, defined contribution pension plans and employees’ pension funds. There are also cases in which additional retirement benefits are paid when employees leave the Group before retirement age. Some consolidated subsidiaries have established defined contribution plans, and some domestic consolidated subsidiaries have joined the Smaller Enterprise Retirement Allowance Mutual Aid system. Some consolidated subsidiaries have established retirement benefit trusts.
71Our Activities
for Sustainability Corporate InformationIntroduction Financial SectionOur Strategy

Notes to Consolidated Financial Statements
3) Reconciliation of the ending balances of retirement benefit obligations and plan assets with the net defined benefit liability and net defined benefit asset recorded on the consolidated balance sheet
Millions of yenThousands of U.S. dollars
2017 2016 2017
Retirement benefit obligations of funded plans ¥ 132,313 ¥ 134,453 $1,179,365
Plan assets (109,768) (109,096) (978,414)
22,544 25,357 200,950
Retirement benefit obligations of non-funded plans 5,409 5,084 48,213
Net amount of liability and asset recorded on the consolidated balance sheet 27,953 30,441 249,163
Net defined benefit liability 48,371 49,029 431,160
Net defined benefit asset (20,418) (18,588) (181,996)
Net amount of liability and asset recorded on the consolidated balance sheet ¥ 27,953 ¥ 30,441 $ 249,163
4) Components of retirement benefit cost
Millions of yenThousands of U.S. dollars
2017 2016 2017
Service cost ¥ 5,253 ¥ 4,645 $ 46,827
Interest cost 747 1,898 6,666
Expected return on plan assets (2,514) (2,627) (22,416)
Amortization of actuarial gains or losses 4,182 3,670 37,282
Amortization of prior service cost 1 71 16
Other 17 17 151
Retirement benefit cost related to defined benefit plans ¥ 7,688 ¥ 7,676 $ 68,529
(Note) Includes cost calculated using the simplified method (excluding cost arising from the differences at transition of accounting standards) and excludes employees’ contributions to the corporate pensions funds.
5) Remeasurements of defined benefit plans recorded in the consolidated statement of comprehensive incomeThe breakdown of items recorded in remeasurements of defined benefit plans in other comprehensive income (before tax effect) is as follows:
Millions of yenThousands of U.S. dollars
2017 2016 2017
Amortization of actuarial gains or losses ¥5,746 ¥(15,183) $51,218
Amortization of net retirement benefit obligation at transition — 1 —
Amortization of prior service cost 1 71 16
Total ¥5,748 ¥(15,111) $51,235
72 Annual Report 2017

6) Remeasurements of defined benefit plans recorded in the consolidated balance sheetThe breakdown of items recorded in remeasurements of defined benefit plans in accumulated other comprehensive income (before tax effect) is as follows:
Millions of yenThousands of U.S. dollars
2017 2016 2017
Unrecognized actuarial gains or losses ¥19,202 ¥24,948 $171,158
Unrecognized prior service cost 107 109 960
Total ¥19,310 ¥25,058 $172,119
7) Plan assets(1) Major categories of plan assets as a percentage of total plan assets are as follows:
2017 2016
Bonds 41% 51%
Equities 19 15
Alternatives 25 23
Cash and deposits 3 3
Other 12 8
Total 100% 100%
(Note 1) “Alternatives” includes multi-asset management, hedge funds, and investment in real estate and other investments.(Note 2) The total amount of plan assets includes the retirement benefit trust for corporate pensions funds and the lump-sum severance payment plan
representing 13% in the current consolidated accounting period and 11% in the previous consolidated accounting period.
(2) Method of determining long-term expected rate of return on plan assetsTo determine the long-term expected rate of return on plan assets, reference was made to the current and expected future allocations of plan assets and to the current and expected future long-term rate of returns on the various assets that make up the plan assets.
8) Actuarial assumptionsActuarial assumptions are as follows:
2017 2016
Discount rate 0.2–0.9% 0.2–0.9%
Expected future salary increase rate Principally 1.4% Principally 1.4%
Long-term expected rate of return on assets Principally 2.5% Principally 2.5%
Defined contribution plansThe amount of required contribution to defined contribution plans for the consolidated subsidiaries is ¥1,301 million ($11,602 thousand) in the current consolidated accounting period and ¥1,319 million in the previous consolidated accounting period.
73Our Activities
for Sustainability Corporate InformationIntroduction Financial SectionOur Strategy

Notes to Consolidated Financial Statements
14. Unconsolidated Subsidiaries and AffiliatesAs of March 31, 2017 and 2016, investment in capital of unconsolidated subsidiaries and affiliates is as follows:
Millions of yenThousands of U.S. dollars
2017 2016 2017
Other (investments in capital) ¥ — ¥632 $ —
15. Contingent LiabilitiesAs of March 31, 2017 and 2016, contingent liabilities are as follows:1) Guaranteed obligationsThe Group is contingently liable as guarantor of loans from financial institutions to the following unconsolidated subsidiaries and employees:
Millions of yenThousands of U.S. dollars
2017 2016 2017
P.T. Ceres Meiji Indotama ¥224 ¥255 $2,000
Sendai Feed Co., Ltd. 101 291 906
Employees 114 164 1,023
Total ¥440 ¥711 $3,930
The following bonds have been transferred in accordance to a bond trust-type debt assumption agreement concluded with a bank. As a result, the transfer obligations related to these bonds are counterbalanced through the payment amount associated with the agreement. However, the Company’s bond redemption obligations to bond holders will remain until the bonds have been redeemed.
Millions of yenThousands of U.S. dollars
2017 2017
2nd Series of Unsecured Straight Bonds (Note 9) ¥15,000 $133,701
4th Series of Unsecured Straight Bonds (Note 9) 20,000 178,269
6th Series of Unsecured Straight Bonds (Note 9) 15,000 133,701
Total ¥50,000 $445,672
2) Notes receivables discounted and endorsed
Millions of yenThousands of U.S. dollars
2017 2016 2017
Notes receivables discounted ¥ — ¥178 $ —
Notes receivables endorsed 66 115 596
74 Annual Report 2017

16. GoodwillAs of March 31, 2017 and 2016, goodwill is as follows:
Millions of yenThousands of U.S. dollars
2017 2016 2017
Goodwill ¥12,840 ¥14,560 $114,454
17. Commitment Line AgreementsThe Company enters into commitment line agreements with seven financial institutions for the purpose of securing a flexible measure for raising funds and improving capital efficiency. The unused portion of the commitment line based on these agreements as of March 31, 2017 and 2016, is as follows:
Millions of yenThousands of U.S. dollars
2017 2016 2017
Maximum loan amount ¥40,000 ¥40,000 $356,538
Used portion of the commitment line — — —
Balance ¥40,000 ¥40,000 $356,538
18. Net Assets1) Matters related to types and total numbers of outstanding shares and treasury stock
2017
Type of shares
Number of shares as of March 31, 2016
(Thousands)Increase
(Thousands)Decrease
(Thousands)
Number of shares as of March 31, 2017
(Thousands)
Outstanding shares:
Common stock 152,683 — — 152,683
Treasury stock:
Common stock (Notes 1, 2) 5,462 756 0 6,218
(Note 1) The increase in treasury common stock of 756 thousand shares was attributable to the acquisition of 662 thousand shares of treasury stock based on a Board of Directors’ resolution, the purchases of 88 thousand shares from untraceable shareholders, and the purchases of 5 thousand shares that were less than one unit.
(Note 2) Treasury common stock decreased by 0 thousand shares due to the sales of shares that are less than one unit.
2016
Type of shares
Number of shares as of March 31, 2015
(Thousands)Increase
(Thousands)Decrease
(Thousands)
Number of shares as of March 31, 2016
(Thousands)
Outstanding shares:
Common stock (Note 1) 76,341 76,341 — 152,683
Treasury stock:
Common stock (Notes 2, 3) 2,722 2,739 0 5,462
(Note 1) Meiji Holdings carried out a two-for-one split of common stock on October 1, 2015.(Note 2) The increase in treasury common stock of 2,739 thousand shares was attributable to an increase of 2,722 thousand shares due to a stock split
(assumed to have been executed at the beginning of the current consolidated accounting period) and an increase of 17 thousand shares due to the purchase of shares that were less than one unit.
(Note 3) Treasury common stock decreased by 0 thousand shares due to the sales of shares that are less than one unit.
75Our Activities
for Sustainability Corporate InformationIntroduction Financial SectionOur Strategy
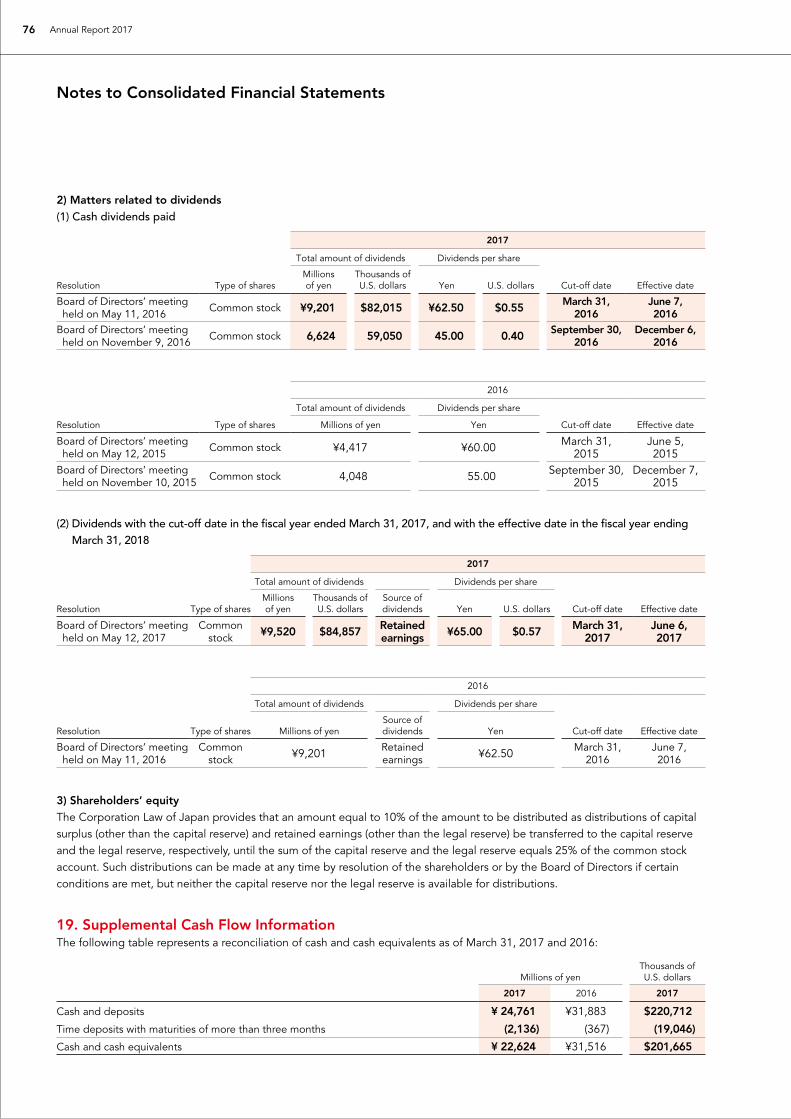
Notes to Consolidated Financial Statements
19. Supplemental Cash Flow InformationThe following table represents a reconciliation of cash and cash equivalents as of March 31, 2017 and 2016:
Millions of yenThousands of U.S. dollars
2017 2016 2017
Cash and deposits ¥ 24,761 ¥31,883 $220,712
Time deposits with maturities of more than three months (2,136) (367) (19,046)
Cash and cash equivalents ¥ 22,624 ¥31,516 $201,665
2) Matters related to dividends(1) Cash dividends paid
Resolution Type of shares
2017
Total amount of dividends Dividends per share
Cut-off date Effective dateMillions of yen
Thousands of U.S. dollars Yen U.S. dollars
Board of Directors’ meeting held on May 11, 2016 Common stock ¥9,201 $82,015 ¥62.50 $0.55 March 31,
2016June 7, 2016
Board of Directors’ meeting held on November 9, 2016 Common stock 6,624 59,050 45.00 0.40 September 30,
2016December 6,
2016
Resolution Type of shares
2016
Total amount of dividends Dividends per share
Cut-off date Effective dateMillions of yen Yen
Board of Directors’ meeting held on May 12, 2015 Common stock ¥4,417 ¥60.00 March 31,
2015June 5, 2015
Board of Directors’ meeting held on November 10, 2015 Common stock 4,048 55.00 September 30,
2015December 7,
2015
(2) Dividends with the cut-off date in the fiscal year ended March 31, 2017, and with the effective date in the fiscal year ending March 31, 2018
Resolution Type of shares
2017
Total amount of dividends Dividends per share
Cut-off date Effective dateMillions of yen
Thousands of U.S. dollars
Source of dividends Yen U.S. dollars
Board of Directors’ meeting held on May 12, 2017
Common stock ¥9,520 $84,857 Retained
earnings ¥65.00 $0.57 March 31, 2017
June 6, 2017
Resolution Type of shares
2016
Total amount of dividends Dividends per share
Cut-off date Effective dateMillions of yenSource of dividends Yen
Board of Directors’ meeting held on May 11, 2016
Common stock ¥9,201 Retained
earnings ¥62.50 March 31, 2016
June 7, 2016
3) Shareholders’ equityThe Corporation Law of Japan provides that an amount equal to 10% of the amount to be distributed as distributions of capital surplus (other than the capital reserve) and retained earnings (other than the legal reserve) be transferred to the capital reserve and the legal reserve, respectively, until the sum of the capital reserve and the legal reserve equals 25% of the common stock account. Such distributions can be made at any time by resolution of the shareholders or by the Board of Directors if certain conditions are met, but neither the capital reserve nor the legal reserve is available for distributions.
76 Annual Report 2017
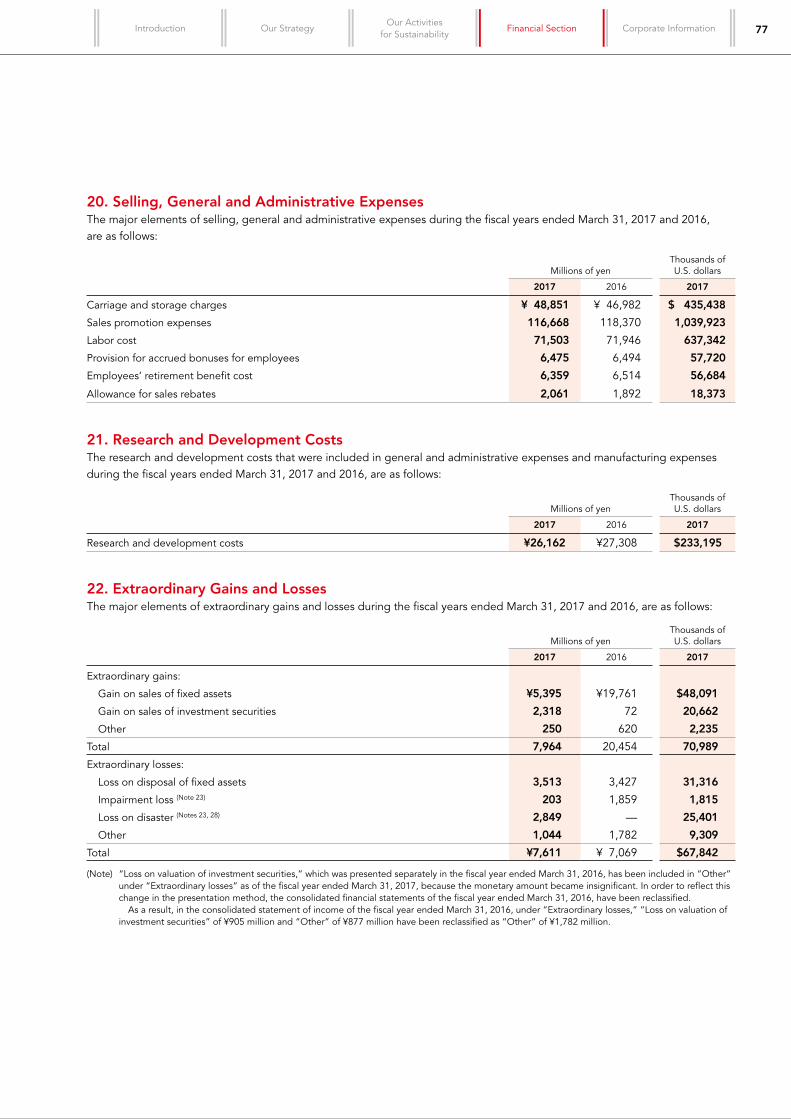
20. Selling, General and Administrative ExpensesThe major elements of selling, general and administrative expenses during the fiscal years ended March 31, 2017 and 2016, are as follows:
Millions of yenThousands of U.S. dollars
2017 2016 2017
Carriage and storage charges ¥ 48,851 ¥ 46,982 $ 435,438
Sales promotion expenses 116,668 118,370 1,039,923
Labor cost 71,503 71,946 637,342
Provision for accrued bonuses for employees 6,475 6,494 57,720
Employees’ retirement benefit cost 6,359 6,514 56,684
Allowance for sales rebates 2,061 1,892 18,373
21. Research and Development CostsThe research and development costs that were included in general and administrative expenses and manufacturing expenses during the fiscal years ended March 31, 2017 and 2016, are as follows:
Millions of yenThousands of U.S. dollars
2017 2016 2017
Research and development costs ¥26,162 ¥27,308 $233,195
22. Extraordinary Gains and LossesThe major elements of extraordinary gains and losses during the fiscal years ended March 31, 2017 and 2016, are as follows:
Millions of yenThousands of U.S. dollars
2017 2016 2017
Extraordinary gains:
Gain on sales of fixed assets ¥5,395 ¥19,761 $48,091
Gain on sales of investment securities 2,318 72 20,662
Other 250 620 2,235
Total 7,964 20,454 70,989
Extraordinary losses:
Loss on disposal of fixed assets 3,513 3,427 31,316
Impairment loss (Note 23) 203 1,859 1,815
Loss on disaster (Notes 23, 28) 2,849 — 25,401
Other 1,044 1,782 9,309
Total ¥7,611 ¥ 7,069 $67,842
(Note) “Loss on valuation of investment securities,” which was presented separately in the fiscal year ended March 31, 2016, has been included in “Other” under “Extraordinary losses” as of the fiscal year ended March 31, 2017, because the monetary amount became insignificant. In order to reflect this change in the presentation method, the consolidated financial statements of the fiscal year ended March 31, 2016, have been reclassified.
As a result, in the consolidated statement of income of the fiscal year ended March 31, 2016, under “Extraordinary losses,” “Loss on valuation of investment securities” of ¥905 million and “Other” of ¥877 million have been reclassified as “Other” of ¥1,782 million.
77Our Activities
for Sustainability Corporate InformationIntroduction Financial SectionOur Strategy

Notes to Consolidated Financial Statements
Impairment losses for the fiscal year ended March 31, 2016, are as follows:
Application Type Location
Business assets Machinery, equipment and buildings, etc. Yokohama-shi, Kanagawa Prefecture
Business assets Machinery, equipment and buildings, etc. Aki-gun, Hiroshima Prefecture
Business assets Buildings Kitakyusyu-shi, Fukuoka Prefecture
Business assets Machinery and equipment, etc. Sakado-shi, Saitama Prefecture
Rental assets Land Kashiwa-shi, Chiba Prefecture
Business assets Buildings and land, etc. Togitsu-shi, Nagasaki Prefecture
Business assets Structures Fukuoka-shi, Fukuoka Prefecture
Business assets Machinery and equipment, etc. Fujieda-shi, Shizuoka Prefecture
Idle assets Buildings Chikugo-shi, Fukuoka Prefecture
The asset groupings in the Group are in principle based on the type of business. Rental assets and idle assets are grouped by individual asset. In the current consolidated accounting period, because a subsidiary withdrew from certain businesses and the Company decided to sell rental assets, the carrying values of the said assets were reduced to recoverable amounts, and the reductions were recognized as impairment loss of ¥1,859 million under “Extraordinary losses”.
Of this amount, regarding business assets, ¥1,164 million was buildings and structures; ¥573 million was machinery, equipment and vehicles; ¥4 million was tools, furniture and fixtures; ¥27 million was land; and ¥27 million was intangible fixed assets. Further, regarding rental assets, ¥50 million was land. In addition, regarding idle assets, ¥9 million was buildings. Also, the recoverable amounts of these assets have been measured based on net selling values and reduced to residual values or the expected sale amount.
23. Impairment LossImpairment losses for the fiscal year ended March 31, 2017, are as follows:
Application Type Location
Business assets Machinery, equipment and buildings, etc. Fujimino-shi, Saitama Prefecture
Business assets Structures, machinery and equipment Sakado-shi, Saitama Prefecture
Business assets Machinery, equipment and buildings Kasaoka-shi, Okayama Prefecture
Business assets Machinery and equipment Kaminoyama-shi, Yamagata Prefecture
Idle assets Buildings, machinery and equipment, etc. Togitsu-shi, Nagasaki Prefecture
Idle assets Buildings Sapporo-shi, Hokkaido Prefecture
Idle assets Machinery and equipment Kaizuka-shi, Osaka Prefecture
Idle assets Land Nasu-machi, Tochigi Prefecture
Idle assets Machinery, equipment and buildings, etc. Memuro-cho, Hokkaido Prefecture
The asset groupings in the Group are in principle based on the type of business. Rental assets and idle assets are grouped by individual asset. In the fiscal year ended March 31, 2017, due to typhoon damage and withdrawal from certain businesses in a subsidiary, the carrying values of the said assets were reduced to recoverable amounts, and the reductions were recognized as impairment loss of ¥203 million ($1,815 thousand), and “Loss on disaster” of ¥551 million ($4,912 thousand) under “Extraordinary losses”. Of this amount, regarding business assets, ¥27 million
($249 thousand) was buildings and structures; ¥69 million ($623 thousand) was machinery, equipment and vehicles; and ¥0 million ($0 thousand) was tools, furniture and fixtures. In addition, regarding idle assets, ¥1,164 million ($10,336 thousand) was buildings and structures; ¥5 million ($51 thousand) was machinery and equipment; ¥503 million ($4,487 thousand) was tools, furniture and fixtures; and ¥16 million ($144 thousand) was land. Also, the recoverable amounts of these assets have been measured based on net selling values and reduced to residual values or the expected sale amount.
78 Annual Report 2017
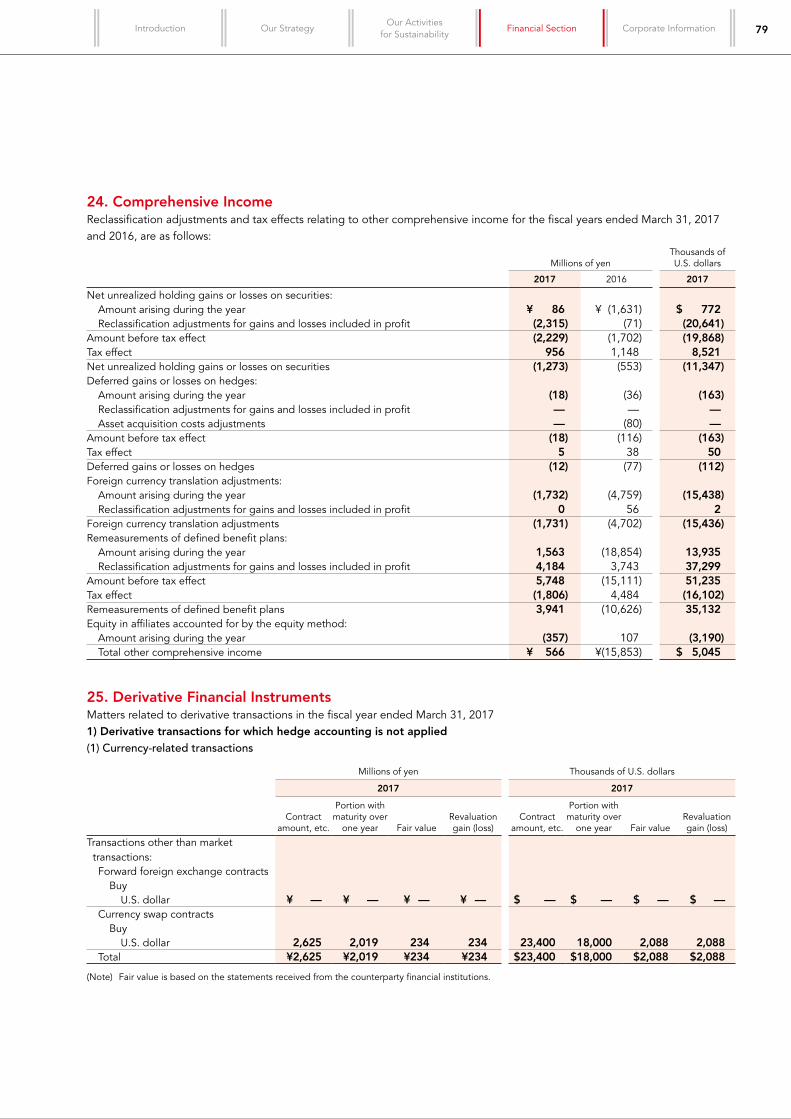
24. Comprehensive IncomeReclassification adjustments and tax effects relating to other comprehensive income for the fiscal years ended March 31, 2017 and 2016, are as follows:
Millions of yenThousands of U.S. dollars
2017 2016 2017
Net unrealized holding gains or losses on securities: Amount arising during the year ¥ 86 ¥ (1,631) $ 772 Reclassification adjustments for gains and losses included in profit (2,315) (71) (20,641)Amount before tax effect (2,229) (1,702) (19,868)Tax effect 956 1,148 8,521Net unrealized holding gains or losses on securities (1,273) (553) (11,347)Deferred gains or losses on hedges: Amount arising during the year (18) (36) (163) Reclassification adjustments for gains and losses included in profit — — — Asset acquisition costs adjustments — (80) —Amount before tax effect (18) (116) (163)Tax effect 5 38 50Deferred gains or losses on hedges (12) (77) (112)Foreign currency translation adjustments: Amount arising during the year (1,732) (4,759) (15,438) Reclassification adjustments for gains and losses included in profit 0 56 2Foreign currency translation adjustments (1,731) (4,702) (15,436)Remeasurements of defined benefit plans: Amount arising during the year 1,563 (18,854) 13,935 Reclassification adjustments for gains and losses included in profit 4,184 3,743 37,299Amount before tax effect 5,748 (15,111) 51,235Tax effect (1,806) 4,484 (16,102)Remeasurements of defined benefit plans 3,941 (10,626) 35,132Equity in affiliates accounted for by the equity method: Amount arising during the year (357) 107 (3,190) Total other comprehensive income ¥ 566 ¥(15,853) $ 5,045
25. Derivative Financial InstrumentsMatters related to derivative transactions in the fiscal year ended March 31, 20171) Derivative transactions for which hedge accounting is not applied(1) Currency-related transactions
Millions of yen Thousands of U.S. dollars
2017 2017
Contract amount, etc.
Portion with maturity over
one year Fair valueRevaluation gain (loss)
Contract amount, etc.
Portion with maturity over
one year Fair valueRevaluation gain (loss)
Transactions other than market transactions: Forward foreign exchange contracts Buy U.S. dollar ¥ — ¥ — ¥ — ¥ — $ — $ — $ — $ — Currency swap contracts Buy U.S. dollar 2,625 2,019 234 234 23,400 18,000 2,088 2,088 Total ¥2,625 ¥2,019 ¥234 ¥234 $23,400 $18,000 $2,088 $2,088
(Note) Fair value is based on the statements received from the counterparty financial institutions.
79Our Activities
for Sustainability Corporate InformationIntroduction Financial SectionOur Strategy
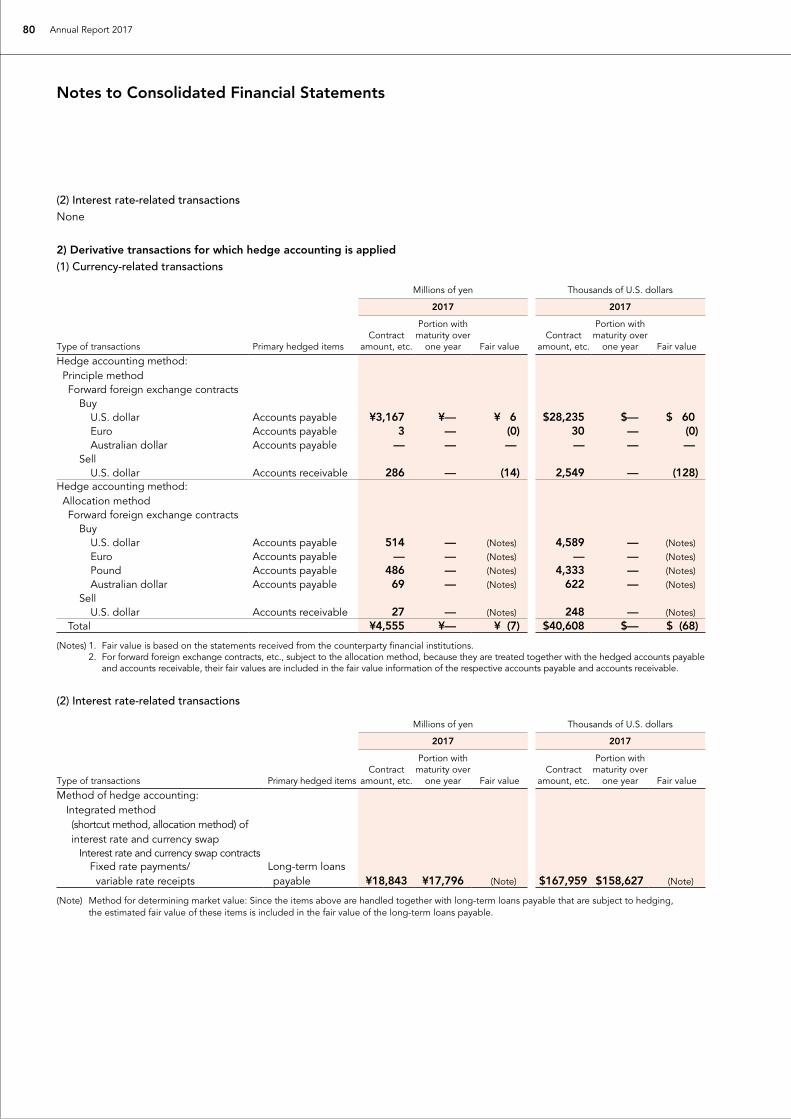
Notes to Consolidated Financial Statements
(2) Interest rate-related transactionsNone
2) Derivative transactions for which hedge accounting is applied(1) Currency-related transactions
Millions of yen Thousands of U.S. dollars
2017 2017
Type of transactions Primary hedged itemsContract
amount, etc.
Portion with maturity over
one year Fair valueContract
amount, etc.
Portion with maturity over
one year Fair value
Hedge accounting method: Principle method Forward foreign exchange contracts Buy U.S. dollar Accounts payable ¥3,167 ¥— ¥ 6 $28,235 $— $ 60 Euro Accounts payable 3 — (0) 30 — (0) Australian dollar Accounts payable — — — — — — Sell U.S. dollar Accounts receivable 286 — (14) 2,549 — (128)Hedge accounting method: Allocation method Forward foreign exchange contracts Buy U.S. dollar Accounts payable 514 — (Notes) 4,589 — (Notes) Euro Accounts payable — — (Notes) — — (Notes) Pound Accounts payable 486 — (Notes) 4,333 — (Notes) Australian dollar Accounts payable 69 — (Notes) 622 — (Notes) Sell U.S. dollar Accounts receivable 27 — (Notes) 248 — (Notes) Total ¥4,555 ¥— ¥ (7) $40,608 $— $ (68)
(Notes) 1. Fair value is based on the statements received from the counterparty financial institutions. 2. For forward foreign exchange contracts, etc., subject to the allocation method, because they are treated together with the hedged accounts payable
and accounts receivable, their fair values are included in the fair value information of the respective accounts payable and accounts receivable.
(2) Interest rate-related transactions
Millions of yen Thousands of U.S. dollars
2017 2017
Type of transactions Primary hedged itemsContract
amount, etc.
Portion with maturity over
one year Fair valueContract
amount, etc.
Portion with maturity over
one year Fair value
M ethod of hedge accounting: Integrated method (shortcut method, allocation method) of interest rate and currency swap
Interest rate and currency swap contracts F ixed rate payments/
variable rate receiptsLong-term loans payable ¥18,843 ¥17,796 (Note) $167,959 $158,627 (Note)
(Note) Method for determining market value: Since the items above are handled together with long-term loans payable that are subject to hedging, the estimated fair value of these items is included in the fair value of the long-term loans payable.
80 Annual Report 2017

Matters related to derivative transactions in the fiscal year ended March 31, 20161) Derivative transactions for which hedge accounting is not applied(1) Currency-related transactions
Millions of yen
2016
Contract amount, etc.
Portion with maturity over
one year Fair valueRevaluation gain (loss)
Transactions other than market transactions: Forward foreign exchange contracts Buy U.S. dollar ¥ 584 ¥ — ¥ (33) ¥ (33) Currency swap contracts Buy U.S. dollar 3,042 2,636 234 234 Total ¥3,627 ¥2,636 ¥200 ¥200
(Note) Fair value is based on the statements received from the counterparty financial institutions.
(2) Interest rate-related transactionsNone
2) Derivative transactions for which hedge accounting is applied(1) Currency-related transactions
Millions of yen
2016
Type of transactions Primary hedged itemsContract
amount, etc.
Portion with maturity over
one year Fair value
Hedge accounting method: Principle method Forward foreign exchange contracts Buy U.S. dollar Accounts payable ¥6,047 ¥— ¥(129) Euro Accounts payable 102 — (6) Australian dollar Accounts payable 5 — 0 Sell U.S. dollar Accounts receivable 1,740 — 146Hedge accounting method: Allocation method Forward foreign exchange contracts Buy U.S. dollar Accounts payable 986 — (Notes) Euro Accounts payable 9 — (Notes) Pound Accounts payable 276 — (Notes) Australian dollar Accounts payable 23 — (Notes) Sell U.S. dollar Accounts receivable 207 — (Notes) Total ¥9,398 ¥— ¥ 10
(Notes) 1. Fair value is based on the statements received from the counterparty financial institutions. 2. For forward foreign exchange contracts, etc., subject to the allocation method, because they are treated together with the hedged accounts
payable and accounts receivable, their fair values are included in the fair value information of the respective accounts payable and accounts receivable.
(2) Interest rate-related transactionsNone
81Our Activities
for Sustainability Corporate InformationIntroduction Financial SectionOur Strategy

Notes to Consolidated Financial Statements
27. Segment InformationReporting segments of the Group are components of the Group by which separate financial information is available and evalu-ated regularly by the Board of Directors in deciding how to allocate resources and assessing performance. The Group has operational subsidiaries organized based on products and services. Operational subsidiaries develop their business activities by formulating comprehensive strategies for Japan and overseas with respect to their products and services. Accordingly, the Group comprises segments based on operational subsidiaries and has two reporting segments: the Food segment and the Pharmaceuticals segment.
Millions of yen
2017
Reporting segments
Adjustments
Amount presented in consolidated
statement of incomeFood Pharmaceuticals Total
Sales, operating income (loss) and assetsSales(1) Sales to third parties ¥1,081,577 ¥160,902 ¥1,242,480 ¥ — ¥1,242,480(2) Intersegment sales and transfers 538 718 1,256 (1,256) — Total ¥1,082,115 ¥161,620 ¥1,243,736 ¥ (1,256) ¥1,242,480Segment income (loss) ¥ 82,950 ¥ 5,781 ¥ 88,731 ¥ (336) ¥ 88,395Segment assets 630,185 215,824 846,010 37,885 883,895Other itemsDepreciation ¥ 39,914 ¥ 5,730 ¥ 45,644 ¥ 227 ¥ 45,872Equity in income of affiliates 5,169 6,418 11,587 — 11,587Increase in property, plant and equipment / intangible fixed assets 59,475 6,207 65,682 60 65,743
26. Business Combination(Fiscal year ended March 31, 2017)Transaction under common control, etc.Additional purchases of subsidiary’s shares
1. Overview of transaction(1) Name and principal business of combined company
Name of combined company: Meiji Chewing Gum Co., Ltd. Principal business: Manufacture and sale of chewing gum, candy and other confectioneries
(2) Date of business combination April 28, 2016
(3) Legal form of business combination Acquisition of shares from non-controlling shareholders
(4) Name of the company after the combination No change
(5) Other items related to the transaction The Company executed the additional acquisition of shares owned by non-controlling shareholders to strengthen Group management capabilities and increase the efficiency of consolidated business management.
2. Overview of accounting treatment Based on the Accounting Standard for Business Combina-tions (ASBJ Statement No. 21, September 13, 2013) and the Guidance on Accounting Standard for Business Combi-nations and Accounting Standard for Business Divestitures (ASBJ Guidance No. 10, September 13, 2013), the Com-pany has treated the transaction as a transaction with non-controlling shareholders, which falls under the category of a transaction under common control, etc.
3. Items related to additional acquisition of subsidiary’s shares Acquisition cost and breakdown Consideration for the acquisition; cash and deposits, ¥955 million ($8,516 thousand) Direct acquisition cost: ¥955 million ($8,516 thousand)
4. Items related to change in the Company’s ownership interest resulting from the transaction with non-controlling shareholders
(1) Main cause of change in capital surplus Additional acquisition of subsidiary’s shares
(2) Increase in capital surplus due to the transaction with non-controlling shareholders ¥1,093 million ($9,749 thousand)
82 Annual Report 2017

Thousands of U.S. dollars
2017
Reporting segments
Adjustments
Amount presented in consolidated
statement of incomeFood Pharmaceuticals Total
Sales, operating income (loss) and assetsSales(1) Sales to third parties $9,640,587 $1,434,197 $11,074,785 $ — $11,074,785(2) Intersegment sales and transfers 4,795 6,402 11,198 (11,198) — Total $9,645,383 $1,440,599 $11,085,983 $ (11,198) $11,074,785Segment income (loss) $ 739,375 $ 51,530 $ 790,905 $ (3,000) $ 787,905Segment assets 5,617,129 1,923,740 7,540,870 337,689 7,878,559Other itemsDepreciation $ 355,771 $ 51,079 $ 406,851 $ 2,026 $ 408,878Equity in income of affiliates 46,077 57,208 103,286 — 103,286Increase in property, plant and equipment / intangible fixed assets 530,130 55,330 585,461 542 586,003
Millions of yen
2016
Reporting segments
Adjustments
Amount presented in consolidated
statement of incomeFood Pharmaceuticals Total
Sales, operating income (loss) and assetsSales(1) Sales to third parties ¥1,060,775 ¥162,970 ¥1,223,746 ¥ — ¥1,223,746(2) Intersegment sales and transfers 623 1,571 2,194 (2,194) — Total ¥1,061,398 ¥164,542 ¥1,225,940 ¥ (2,194) ¥1,223,746Segment income (loss) ¥ 68,289 ¥ 10,118 ¥ 78,408 ¥ (626) ¥ 77,781Segment assets 592,149 200,569 792,718 63,396 856,115Other itemsDepreciation ¥ 36,513 ¥ 5,311 ¥ 41,825 ¥ 251 ¥ 42,077Equity in income of affiliates 4,357 7,102 11,460 — 11,460Increase in property, plant and equipment / intangible fixed assets 39,941 5,528 45,469 43 45,513
83Our Activities
for Sustainability Corporate InformationIntroduction Financial SectionOur Strategy

Notes to Consolidated Financial Statements
29. Significant Subsequent EventsThe meeting of the Board of Directors, held on April 18, 2017, approved the following comprehensive resolution concerning the issuance of domestic unsecured straight bonds.
(1) Issuing amount ¥30 billion ($267,403 thousand) or less However, multiple issuances within this range shall be permitted.
(2) Planned issue period From April 2017 to March 2018 Additionally, in case the bond subscription was offered during the said period, it shall be included even if the payment date falls after this period.
(3) Amount of payment ¥100 ($0.89) or more per corporate bond amount of ¥100 ($0.89)
(4) Interest rate Swap rate with same maturity as corporate bonds plus no more than 0.5%
(5) Maturity 10 years or less
(6) Redemption method Lump-sum redemption upon maturity
(7) Purpose of the funds Operating funds, capital expenditures, investment capital, loan repayment capital, bond redemption capital and commercial paper redemption capital
(8) Special conditions The said corporate bonds include a negative pledge clause.
(9) Others Decisions concerning the matters set forth in the provi-sions of Article 676 of the Companies Act of Japan and all other matters required for the issuance of corporate bonds shall be made at the discretion of the president and representative director within the aforementioned limits and shall be reported at the first Board of Directors’ meeting held after a decision has been made.
28. Loss on DisasterThe domestic subsidiary of the Company, Nihon Kanzume, Inc recorded the “Loss on disaster” of ¥2,849 million ($25,401 thousand) due to the damage of the typhoon occurred in 2016. The breakdown of items recorded in Loss on disaster is as follows:
Millions of yenThousands of U.S. dollars
2017 2017
Inventory loss ¥ 193 $ 1,729
Loss on disposal of fixed assets and restoration cost 997 8,889
Impairment loss of fixed assets 551 4,912
Loss on compensation to suppliers 1,107 9,870
¥2,849 $25,401
84 Annual Report 2017

Independent Auditor’s Report
85Our Activities
for Sustainability Corporate InformationIntroduction Financial SectionOur Strategy
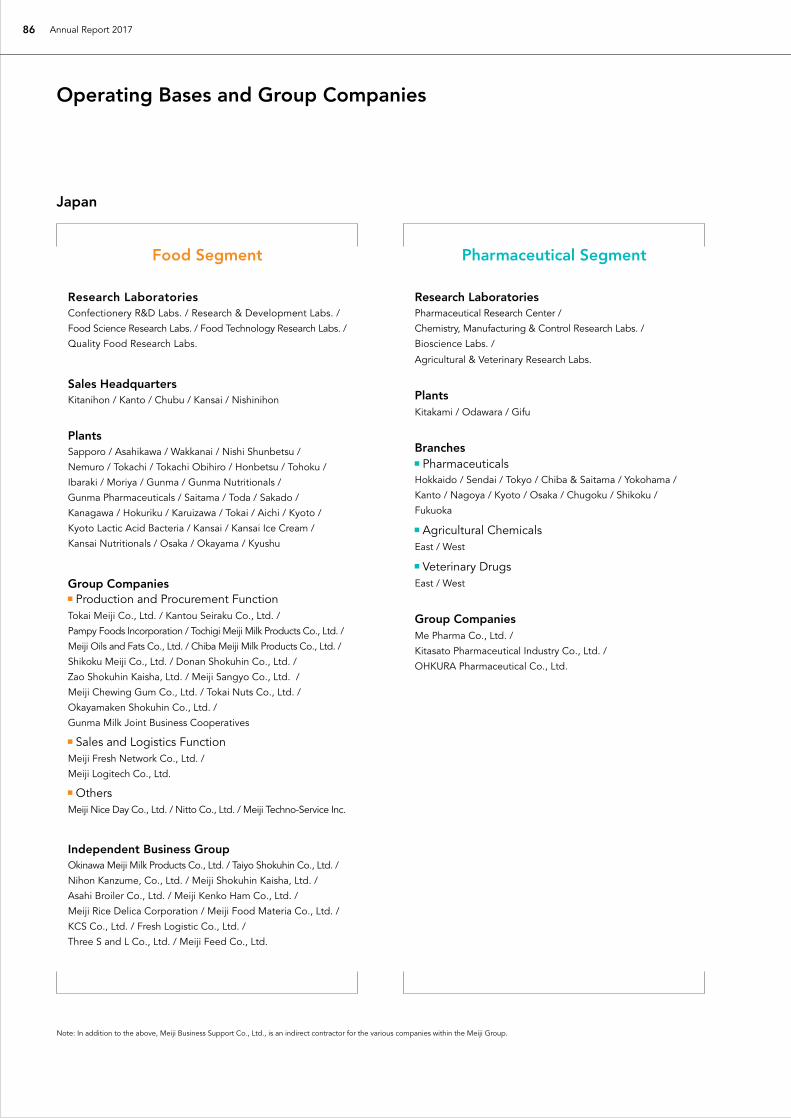
Research Laboratories Confectionery R&D Labs. / Research & Development Labs. /
Food Science Research Labs. / Food Technology Research Labs. /
Quality Food Research Labs.
Sales Headquarters Kitanihon / Kanto / Chubu / Kansai / Nishinihon
Plants Sapporo / Asahikawa / Wakkanai / Nishi Shunbetsu /
Nemuro / Tokachi / Tokachi Obihiro / Honbetsu / Tohoku /
Ibaraki / Moriya / Gunma / Gunma Nutritionals /
Gunma Pharmaceuticals / Saitama / Toda / Sakado /
Kanagawa / Hokuriku / Karuizawa / Tokai / Aichi / Kyoto /
Kyoto Lactic Acid Bacteria / Kansai / Kansai Ice Cream /
Kansai Nutritionals / Osaka / Okayama / Kyushu
Group Companies Production and Procurement Function
Tokai Meiji Co., Ltd. / Kantou Seiraku Co., Ltd. /
Pampy Foods Incorporation / Tochigi Meiji Milk Products Co., Ltd. /
Meiji Oils and Fats Co., Ltd. / Chiba Meiji Milk Products Co., Ltd. /
Shikoku Meiji Co., Ltd. / Donan Shokuhin Co., Ltd. /
Zao Shokuhin Kaisha, Ltd. / Meiji Sangyo Co., Ltd. /
Meiji Chewing Gum Co., Ltd. / Tokai Nuts Co., Ltd. /
Okayamaken Shokuhin Co., Ltd. /
Gunma Milk Joint Business Cooperatives
Sales and Logistics Function Meiji Fresh Network Co., Ltd. /
Meiji Logitech Co., Ltd.
Others Meiji Nice Day Co., Ltd. / Nitto Co., Ltd. / Meiji Techno-Service Inc.
Independent Business Group Okinawa Meiji Milk Products Co., Ltd. / Taiyo Shokuhin Co., Ltd. /
Nihon Kanzume, Co., Ltd. / Meiji Shokuhin Kaisha, Ltd. /
Asahi Broiler Co., Ltd. / Meiji Kenko Ham Co., Ltd. /
Meiji Rice Delica Corporation / Meiji Food Materia Co., Ltd. /
KCS Co., Ltd. / Fresh Logistic Co., Ltd. /
Three S and L Co., Ltd. / Meiji Feed Co., Ltd.
Research Laboratories Pharmaceutical Research Center /
Chemistry, Manufacturing & Control Research Labs. /
Bioscience Labs. /
Agricultural & Veterinary Research Labs.
Plants Kitakami / Odawara / Gifu
Branches Pharmaceuticals
Hokkaido / Sendai / Tokyo / Chiba & Saitama / Yokohama /
Kanto / Nagoya / Kyoto / Osaka / Chugoku / Shikoku /
Fukuoka
Agricultural Chemicals East / West
Veterinary Drugs East / West
Group Companies Me Pharma Co., Ltd. /
Kitasato Pharmaceutical Industry Co., Ltd. /
OHKURA Pharmaceutical Co., Ltd.
Note: In addition to the above, Meiji Business Support Co., Ltd., is an indirect contractor for the various companies within the Meiji Group.
43
12 13
27
2616
2311
8
241071
259
2019
17
2
5
6
21 22
15
18
14
Operating Bases and Group Companies
Japan
Pharmaceutical SegmentFood Segment
86 Annual Report 2017
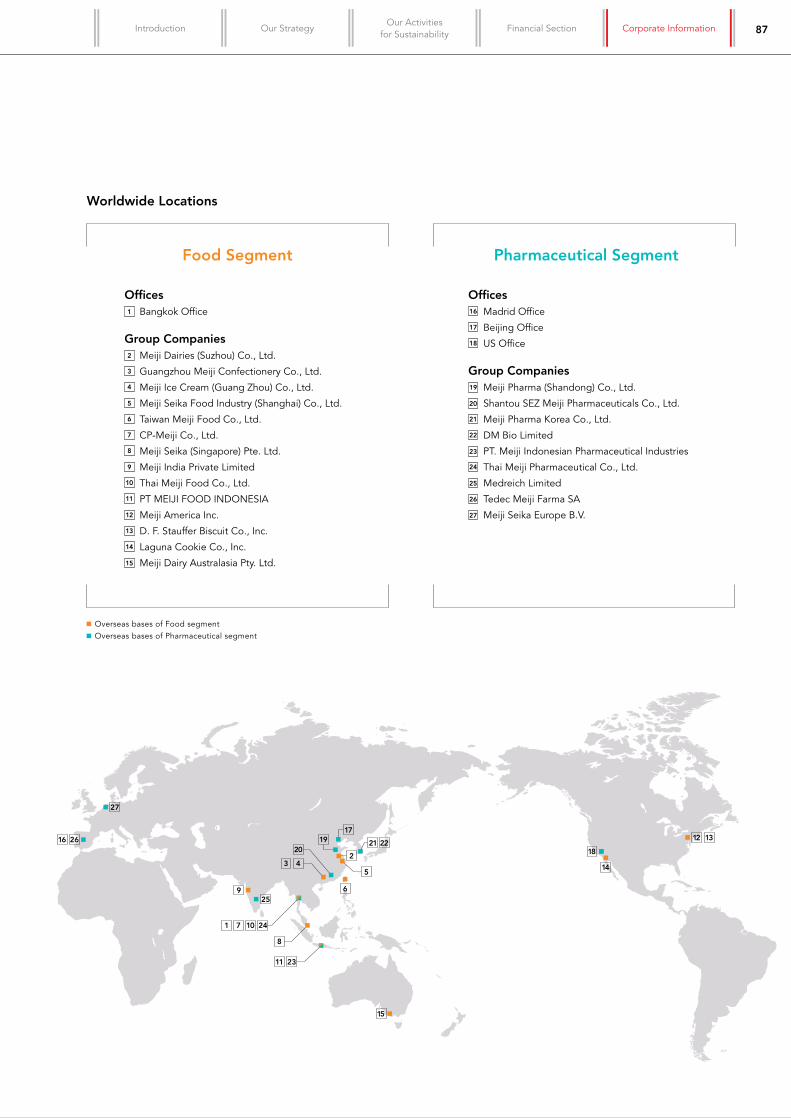
Offices1 Bangkok Office
Group Companies 2 Meiji Dairies (Suzhou) Co., Ltd.3 Guangzhou Meiji Confectionery Co., Ltd.4 Meiji Ice Cream (Guang Zhou) Co., Ltd.5 Meiji Seika Food Industry (Shanghai) Co., Ltd.6 Taiwan Meiji Food Co., Ltd.7 CP-Meiji Co., Ltd.8 Meiji Seika (Singapore) Pte. Ltd.9 Meiji India Private Limited10 Thai Meiji Food Co., Ltd.11 PT MEIJI FOOD INDONESIA12 Meiji America Inc.13 D. F. Stauffer Biscuit Co., Inc.14 Laguna Cookie Co., Inc.
15 Meiji Dairy Australasia Pty. Ltd.
Offices16 Madrid Office17 Beijing Office18 US Office
Group Companies19 Meiji Pharma (Shandong) Co., Ltd.
20 Shantou SEZ Meiji Pharmaceuticals Co., Ltd.21 Meiji Pharma Korea Co., Ltd.22 DM Bio Limited
23 PT. Meiji Indonesian Pharmaceutical Industries24 Thai Meiji Pharmaceutical Co., Ltd.
25 Medreich Limited
26 Tedec Meiji Farma SA
27 Meiji Seika Europe B.V.
43
12 13
27
2616
2311
8
241071
259
2019
17
2
5
6
21 22
15
18
14
Overseas bases of Food segment Overseas bases of Pharmaceutical segment
Worldwide Locations
Pharmaceutical SegmentFood Segment
87Our Activities
for Sustainability Corporate InformationIntroduction Financial SectionOur Strategy

88 Annual Report 2017
Major Shareholders
Name
Number of shares held (Thousands)
Percentage of total shares issued (%)
The Master Trust Bank of Japan, Ltd. (Trust Account) 9,790 6.41
Japan Trustee Services Bank, Ltd. (Trust Account) 6,492 4.25
Mizuho Bank, Ltd. 5,942 3.89
Nippon Life Insurance Company 3,348 2.19
JP MORGAN CHASE BANK 380055 3,094 2.03
Resona Bank, Limited 3,047 2.00
The Norinchukin Bank 2,892 1.89
MSIP CLIENT SECURITIES 2,775 1.82
Meiji Holdings Trading-Partner Shareholding Association 2,554 1.67
Meiji Holdings Employee Shareholding Association 2,515 1.65
Total of Top 10 Shareholders 42,452 27.80
Note: In addition to the shares above, the Company owns 6,218,500 shares of treasury stock (a 4.07% shareholding).
Shareholding by Type of Shareholder
■ Financial Institutions 39.94%
■ Individuals and Others 23.18%
■ Foreign Companies, etc. 25.14%
■ Other Companies 10.15%
■ Financial Instruments Dealers 1.59%
■ Government and Public Bodies —
Note: “Individuals and Others” includes treasury stock.
152,683Thousand
shares
Corporate Data
Stock Information*
Corporate Data / Stock Information (As of March 31, 2017)
Company Name Meiji Holdings Co., Ltd. (Securities code: 2269)
Head Office 2-4-16, Kyobashi, Chuo-ku, Tokyo 104-0031, Japan
Incorporated April 1, 2009
Paid-in Capital ¥30 billion
Common Stock Issued 152,683,400*
Stock Listing Tokyo
Fiscal Year-End March 31
Ordinary General Late in June Meeting of Shareholders
Transfer Agent of Mitsubishi UFJ Trust and Banking Common Stock Corporation
Public Notices Public notices given by the Company are issued electronically.(URL: http://www.meiji.com/global/)
However, in the event that public notices cannot be issued electronically due to an accident or some other unavoidable circumstances, public notices given by the Company shall be carried in the Nihon Keizai Shimbun. It should be noted that pursuant to Article 440, Paragraph 4 of the Companies Act, public notices of financial statements are not given.
Number of Group 16,726 Employees
Stock Price and Trading VolumeStock price (Yen) Trading volume (Thousand shares)
Meiji Holdings Co., Ltd.Tel: +81-3-3273-4001 (Business hours: 9:00–17:00 / except Saturdays, Sundays, and public holidays)
Meiji Holdings Co., Ltd., provides information on its website:http://www.meiji.com/global/
For further information, please contact:
0
3,000
6,000
9,000
12,000
0
10,000
20,000
30,000
40,000
Apr. May July Aug.
2016 2017
Sept. Oct. Nov. Dec. Jan. Feb. Mar.June
* Please note that Meiji Holdings carried out a two-for-one split of common stock on October 1, 2015. The above figures reflect this stock split.
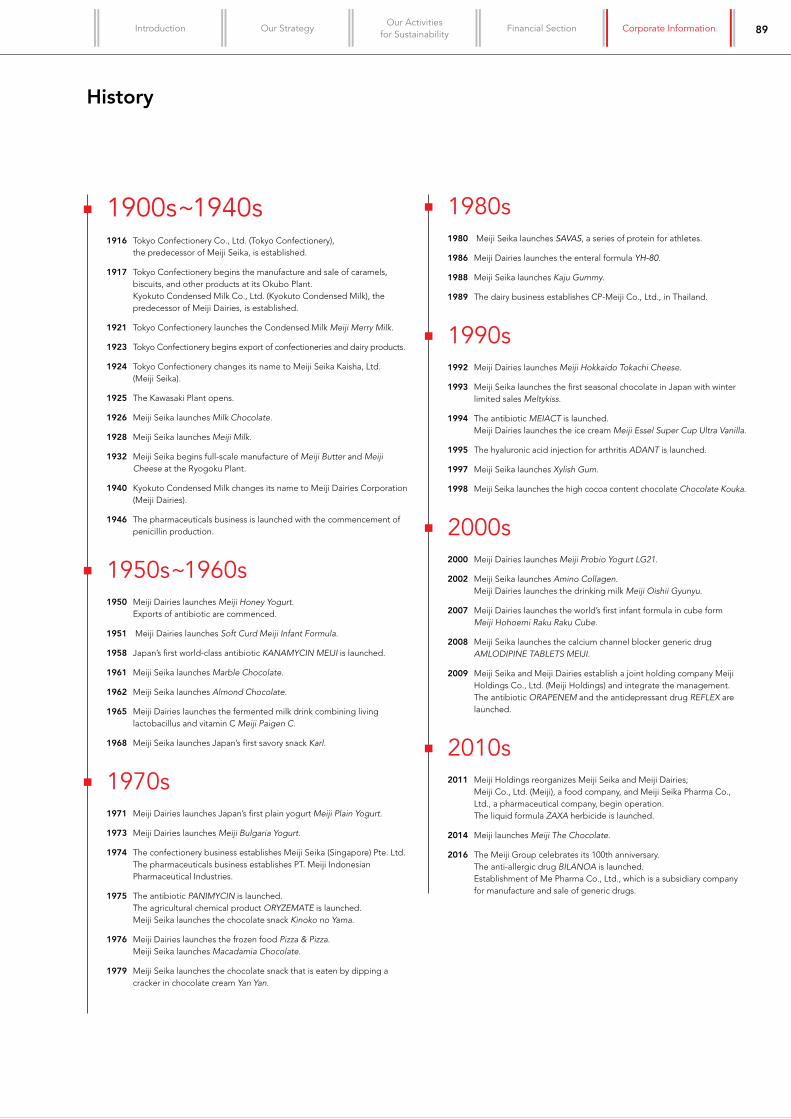
89Our Activities
for Sustainability Corporate InformationIntroduction Financial SectionOur Strategy
History
1900s~1940s1916 Tokyo Confectionery Co., Ltd. (Tokyo Confectionery),
the predecessor of Meiji Seika, is established.
1917 Tokyo Confectionery begins the manufacture and sale of caramels, biscuits, and other products at its Okubo Plant. Kyokuto Condensed Milk Co., Ltd. (Kyokuto Condensed Milk), the predecessor of Meiji Dairies, is established.
1921 Tokyo Confectionery launches the Condensed Milk Meiji Merry Milk.
1923 Tokyo Confectionery begins export of confectioneries and dairy products.
1924 Tokyo Confectionery changes its name to Meiji Seika Kaisha, Ltd. (Meiji Seika).
1925 The Kawasaki Plant opens.
1926 Meiji Seika launches Milk Chocolate.
1928 Meiji Seika launches Meiji Milk.
1932 Meiji Seika begins full-scale manufacture of Meiji Butter and Meiji Cheese at the Ryogoku Plant.
1940 Kyokuto Condensed Milk changes its name to Meiji Dairies Corporation (Meiji Dairies).
1946 The pharmaceuticals business is launched with the commencement of penicillin production.
1950s~1960s1950 Meiji Dairies launches Meiji Honey Yogurt.
Exports of antibiotic are commenced.
1951 Meiji Dairies launches Soft Curd Meiji Infant Formula.
1958 Japan’s first world-class antibiotic KANAMYCIN MEIJI is launched.
1961 Meiji Seika launches Marble Chocolate.
1962 Meiji Seika launches Almond Chocolate.
1965 Meiji Dairies launches the fermented milk drink combining living lactobacillus and vitamin C Meiji Paigen C.
1968 Meiji Seika launches Japan’s first savory snack Karl.
1970s1971 Meiji Dairies launches Japan’s first plain yogurt Meiji Plain Yogurt.
1973 Meiji Dairies launches Meiji Bulgaria Yogurt.
1974 The confectionery business establishes Meiji Seika (Singapore) Pte. Ltd. The pharmaceuticals business establishes PT. Meiji Indonesian Pharmaceutical Industries.
1975 The antibiotic PANIMYCIN is launched. The agricultural chemical product ORYZEMATE is launched. Meiji Seika launches the chocolate snack Kinoko no Yama.
1976 Meiji Dairies launches the frozen food Pizza & Pizza. Meiji Seika launches Macadamia Chocolate.
1979 Meiji Seika launches the chocolate snack that is eaten by dipping a cracker in chocolate cream Yan Yan.
1980s1980 Meiji Seika launches SAVAS, a series of protein for athletes.
1986 Meiji Dairies launches the enteral formula YH-80.
1988 Meiji Seika launches Kaju Gummy.
1989 The dairy business establishes CP-Meiji Co., Ltd., in Thailand.
1990s1992 Meiji Dairies launches Meiji Hokkaido Tokachi Cheese.
1993 Meiji Seika launches the first seasonal chocolate in Japan with winter limited sales Meltykiss.
1994 The antibiotic MEIACT is launched. Meiji Dairies launches the ice cream Meiji Essel Super Cup Ultra Vanilla.
1995 The hyaluronic acid injection for arthritis ADANT is launched.
1997 Meiji Seika launches Xylish Gum.
1998 Meiji Seika launches the high cocoa content chocolate Chocolate Kouka.
2000s2000 Meiji Dairies launches Meiji Probio Yogurt LG21.
2002 Meiji Seika launches Amino Collagen. Meiji Dairies launches the drinking milk Meiji Oishii Gyunyu.
2007 Meiji Dairies launches the world’s first infant formula in cube form Meiji Hohoemi Raku Raku Cube.
2008 Meiji Seika launches the calcium channel blocker generic drug AMLODIPINE TABLETS MEIJI.
2009 Meiji Seika and Meiji Dairies establish a joint holding company Meiji Holdings Co., Ltd. (Meiji Holdings) and integrate the management. The antibiotic ORAPENEM and the antidepressant drug REFLEX are launched.
2010s2011 Meiji Holdings reorganizes Meiji Seika and Meiji Dairies;
Meiji Co., Ltd. (Meiji), a food company, and Meiji Seika Pharma Co., Ltd., a pharmaceutical company, begin operation. The liquid formula ZAXA herbicide is launched.
2014 Meiji launches Meiji The Chocolate.
2016 The Meiji Group celebrates its 100th anniversary. The anti-allergic drug BILANOA is launched. Establishment of Me Pharma Co., Ltd., which is a subsidiary company for manufacture and sale of generic drugs.

Meiji Holdings Co., Ltd.2-4-16, Kyobashi, Chuo-ku, Tokyo 104-0031, Japan
Tel: +81-3-3273-4001
http://www.meiji.com/global/ Printed in Japan
Annual ReportYear ended March 31, 2017
Annual R
epo
rt 2017