ANNUAL REPORT - Longreach State School€¦ · School engagement is complemented by an ... A Year 6...
12
1 Longreach State School 2016 ANNUAL REPORT Queensland State School Reporting Inspiring minds. Creating opportunities. Shaping Queensland’s future. Every student succeeding. State Schools Strategy 2016-2020 Department of Education and Training
-
Upload
phungtuong -
Category
Documents
-
view
215 -
download
0
Transcript of ANNUAL REPORT - Longreach State School€¦ · School engagement is complemented by an ... A Year 6...

1
Longreach State School
2016 ANNUAL REPORT
Queensland State School Reporting
Inspiring minds. Creating opportunities. Shaping Queensland’s future. Every student succeeding. State Schools Strategy 2016-2020
Department of Education and Training

2
Contact Information
Postal address: PO Box 250 Longreach 4730
Phone: (07) 4652 6333
Fax: (07) 4658 2183
Email: [email protected]
Webpages: Additional reporting information pertaining to Queensland state schools is located on the My School website and the Queensland Government data website.
Contact Person: The Principal (Mrs Vicki Rayner)
School Overview
At Longreach State School we place people first. Our primary goal is the education and care of our students from Prep to Year 6. Our goal is for every student to excel academically, socially, physically and culturally. We provide every student with quality learning experiences differentiated according to individual needs. We maximise each student’s potential in a secure and challenging environment. Parent participation and involvement is highly valued. High quality teaching practices delivered through an explicit teaching framework, supported by our school based Pedagogy in Practice program, ensures individual student goal success. Student success is a feature of our Talking Targets Program. Both these components inform our school improvement agenda and are articulated in our school vision statement “Highly Effective Practices for Continuous Achievement in Student Learning”. Outstanding curriculum practices have been validated by 2010 and 2012 Teaching and Learning Audits. A high level of pride exists in our school, reflected in our standard of behaviour and dress, and our sporting, cultural and academic performance. School engagement is complemented by an extensive extra-curricular program which includes unique features such as Food and Design Technology in the Middle Years, Instrumental Music and a Sports Development program. Since 1893 our school infrastructure has grown to include historic buildings which house modern eLearning and Performance Arts, contemporary and vibrant classrooms all of which have 21st Century technology, a newly refurbished special education unit, and extensive sporting and cultural facilities which include our school Hall, kitchens for cooking, a design workshop and an award-winning teacher resource room. Outside we have well-kept sporting grounds and multiple undercover play areas that support our sun safe policies.

3
Principal’s Foreword
Introduction Queensland schools annually publish information to parents about student and school performance. This document contains important information about our school’s journey in 2016. The report is available on the school website and by hard copy at the school office (by request).
To ensure that each student receives the best education possible we highly value parent participation and involvement. In 2016 this was most evident through a range of highly successful fundraising support and other parent/community participation.
School Progress towards its goals in 2016
Longreach State School made progress against all 2016 Annual Implementation Plan priorities:
AIP PRIORITY AREA PROGRESS
Writing The explicit teaching of writing has been embedded through a 5 week “On Demand” writing cycle
with data tracked across the whole school to inform action planning for differentiation.
Reading The explicit teaching of reading has been embedded in daily Literacy Blocks
GRG “High 5” Reading extended based on success data from 2015
Numeracy Master Teacher role extended with a focus on research based use of Concrete-Representational-
Abstract model for teaching mathematical concepts
Science Formed part of Professional Learning and Collaborative Practice Plan
Retention Student retention declined in parallel with changing community context
Attainment Students’ academic grading for Achievement tracked and monitored to informed action planning
for differentiation (intervention and extension)
Transition Kindergarten Partnership Program embedded to support student transitions into Prep
Attendance Regularly promoted to parents through Parent Newsletter and Weekly Reports
Closing the Gap Closing the Gap Reading Intervention implemented with targeted students
ACARA Implementation HPE implemented and embedded within Explicit Instruction and Pedagogical Framework
High Quality Teachers Lead Teacher Team provided instructional coaching for performance, Data Discussions and Action
Planning.
Future Outlook
Longreach State School Strategic Priorities for 2017 are based on the 2014-2017 Strategic plan. Our ongoing focus will be to continue improving literacy, numeracy and science across the whole school. The teaching of literacy, numeracy and science will be strengthened through a continuing emphasis on explicit teaching practices. Strategic Priorities for 2017 are:
Core Priorities: Writing, Reading, Numeracy, Science.
School Priorities: High Quality Teachers through a Master Teacher and Lead Teacher professional learning and capacity building approach.

4
Our School at a Glance
School Profile
Coeducational or single sex: Coeducational
Independent Public School: No
Year levels offered in 2016: Early Childhood - Year 6
Student enrolments for this school:
Total Girls Boys Indigenous
Enrolment Continuity
(Feb – Nov)
2014 262 121 141 28 89%
2015* 225 104 121 20 88%
2016 190 91 99 23 91%
Student counts are based on the Census (August) enrolment collection.
In 2016, there were no students enrolled in a pre-Prep** program.
** pre-Prep is a kindergarten program for Aboriginal and Torres Strait Islander children, living across 35 Aboriginal and Torres Strait Islander
communities, in the year before school (http://deta.qld.gov.au/earlychildhood/families/pre-prep-indigenous.html).
Characteristics of the Student Body
Overview Longreach State School is a rural school with 10% indigenous enrolment. In 2016 enrolments stabilised after several years of declining enrolment that was consistent with the changing community context.
Average Class Sizes The following table shows the average class size information for each phase of schooling.
AVERAGE CLASS SIZES
Phase 2014 2015* 2016
Prep – Year 3 25 25 23
Year 4 – Year 6 30 26 27
5
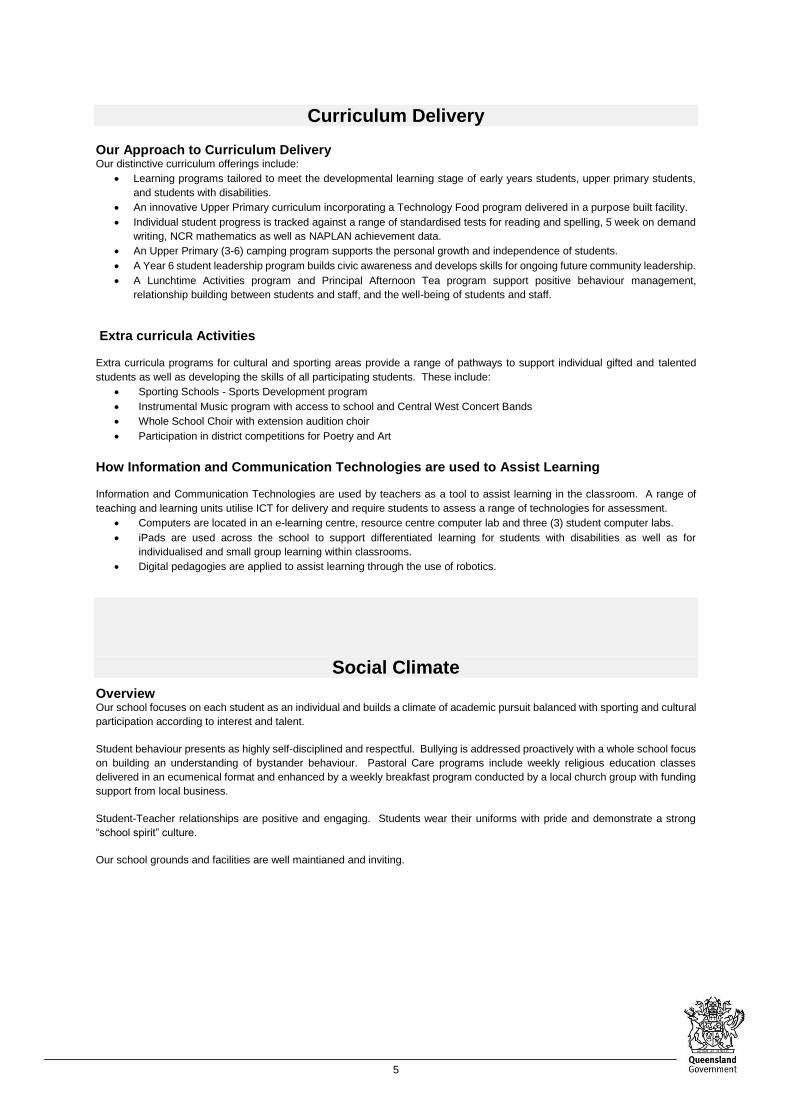
Curriculum Delivery
Our Approach to Curriculum Delivery Our distinctive curriculum offerings include:
Learning programs tailored to meet the developmental learning stage of early years students, upper primary students,
and students with disabilities.
An innovative Upper Primary curriculum incorporating a Technology Food program delivered in a purpose built facility.
Individual student progress is tracked against a range of standardised tests for reading and spelling, 5 week on demand
writing, NCR mathematics as well as NAPLAN achievement data.
An Upper Primary (3-6) camping program supports the personal growth and independence of students.
A Year 6 student leadership program builds civic awareness and develops skills for ongoing future community leadership.
A Lunchtime Activities program and Principal Afternoon Tea program support positive behaviour management,
relationship building between students and staff, and the well-being of students and staff.
Extra curricula Activities
Extra curricula programs for cultural and sporting areas provide a range of pathways to support individual gifted and talented
students as well as developing the skills of all participating students. These include:
Sporting Schools - Sports Development program
Instrumental Music program with access to school and Central West Concert Bands
Whole School Choir with extension audition choir
Participation in district competitions for Poetry and Art
How Information and Communication Technologies are used to Assist Learning
Information and Communication Technologies are used by teachers as a tool to assist learning in the classroom. A range of
teaching and learning units utilise ICT for delivery and require students to assess a range of technologies for assessment.
Computers are located in an e-learning centre, resource centre computer lab and three (3) student computer labs.
iPads are used across the school to support differentiated learning for students with disabilities as well as for
individualised and small group learning within classrooms.
Digital pedagogies are applied to assist learning through the use of robotics.
Social Climate
Overview Our school focuses on each student as an individual and builds a climate of academic pursuit balanced with sporting and cultural
participation according to interest and talent.
Student behaviour presents as highly self-disciplined and respectful. Bullying is addressed proactively with a whole school focus
on building an understanding of bystander behaviour. Pastoral Care programs include weekly religious education classes
delivered in an ecumenical format and enhanced by a weekly breakfast program conducted by a local church group with funding
support from local business.
Student-Teacher relationships are positive and engaging. Students wear their uniforms with pride and demonstrate a strong
“school spirit” culture.
Our school grounds and facilities are well maintianed and inviting.

6
Parent, Student and Staff Satisfaction Parent opinion survey
Performance measure
Percentage of parents/caregivers who agree# that: 2014 2015 2016
their child is getting a good education at school (S2016)
100% 100% 91%
this is a good school (S2035) 94% 100% 91%
their child likes being at this school* (S2001) 100% 100% 100%
their child feels safe at this school* (S2002) 100% 100% 100%
their child's learning needs are being met at this school* (S2003)
100% 100% 91%
their child is making good progress at this school* (S2004)
94% 100% 91%
teachers at this school expect their child to do his or her best* (S2005)
100% 100% 95%
teachers at this school provide their child with useful feedback about his or her school work* (S2006)
94% 100% 91%
teachers at this school motivate their child to learn* (S2007)
100% 100% 95%
teachers at this school treat students fairly* (S2008) 83% 100% 95%
they can talk to their child's teachers about their concerns* (S2009)
100% 100% 95%
this school works with them to support their child's learning* (S2010)
100% 100% 95%
this school takes parents' opinions seriously* (S2011) 94% 88% 86%
student behaviour is well managed at this school* (S2012)
89% 100% 86%
this school looks for ways to improve* (S2013) 100% 100% 91%
this school is well maintained* (S2014) 94% 94% 100%
Student opinion survey
Performance measure
Percentage of students who agree# that: 2014 2015 2016
they are getting a good education at school (S2048) 94% 97% 99%
they like being at their school* (S2036) 96% 94% 96%
they feel safe at their school* (S2037) 93% 93% 96%
their teachers motivate them to learn* (S2038) 99% 98% 99%
their teachers expect them to do their best* (S2039) 100% 100% 100%
their teachers provide them with useful feedback about their school work* (S2040)
99% 99% 99%
teachers treat students fairly at their school* (S2041) 90% 97% 95%
they can talk to their teachers about their concerns* (S2042)
89% 88% 88%
their school takes students' opinions seriously* (S2043)
94% 88% 89%
student behaviour is well managed at their school* (S2044)
93% 88% 90%
their school looks for ways to improve* (S2045) 96% 97% 96%
their school is well maintained* (S2046) 94% 98% 95%
their school gives them opportunities to do interesting things* (S2047)
99% 99% 97%

7
Staff opinion survey
Performance measure
Percentage of school staff who agree# that: 2014 2015 2016
they enjoy working at their school (S2069) 81% 86% 100%
they feel that their school is a safe place in which to work (S2070)
94% 95% 100%
they receive useful feedback about their work at their school (S2071)
88% 86% 100%
they feel confident embedding Aboriginal and Torres Strait Islander perspectives across the learning areas (S2114)
82% 91% 80%
students are encouraged to do their best at their school (S2072)
88% 95% 100%
students are treated fairly at their school (S2073) 88% 86% 88%
student behaviour is well managed at their school (S2074)
88% 90% 94%
staff are well supported at their school (S2075) 69% 71% 81%
their school takes staff opinions seriously (S2076) 75% 65% 75%
their school looks for ways to improve (S2077) 94% 90% 100%
their school is well maintained (S2078) 94% 95% 100%
their school gives them opportunities to do interesting things (S2079)
75% 86% 94%
* Nationally agreed student and parent/caregiver items # ‘Agree’ represents the percentage of respondents who Somewhat Agree, Agree or Strongly Agree with the statement. DW = Data withheld to ensure confidentiality.
Parent and community engagement Our partnership with parents is regarded as a vital component of successful student learning at Longreach State School. Active
parent participation in classroom and extra curricula programs supports and maintains well established school-community
relationships.
Parents are involved in the following ways:
Daily home reading and homework programs
Weekly Progress Reports, Semester Reports and interviews
Daily classroom reading programs, activitivies and other events
Tuckshop and other fundraising activities
P&C and consultative committees as needed
Regular attendance at school parades
Maintenance of reading resources
Attendance at Focused Parent Information sessions
Parent consultation processes regarding the adjustments made to assist students with diverse needs to access and participate
fully at Longreach state School include:
Case management through Social Justice committee
Parent meetings to:
outline adjustments and support proposals
endorse procedures including ICPs, NAPLAN adjustments and classroom modifications
review programs in line with reporting cycle
Respectful relationships programs The school has developed and implemented programs that focus on appropriate, respectful and healthy relationships.
School Rules provides a core foundation with the rule “Respect yourself and others” anchoring discussions around positive interpersonal relationships and ways of managing difference.
Restorative Chat is a whole school strategy embedded in the Responsible Behavior Plan that enables socially just conflict resolution for all participants.

8
School Disciplinary Absences The following table shows the count of incidents for students recommended for each type of school disciplinary absence reported at the school.
SCHOOL DISCIPLINARY ABSENCES
Type 2014* 2015** 2016
Short Suspensions – 1 to 5 days 10 0 0
Long Suspensions – 6 to 20 days 0 0 0
Exclusions 0 0 0
Cancellations of Enrolment 0 0 0
* Caution should be used when comparing post 2013 SDA data as amendments to EGPA disciplinary provisions and changes in methodology
created time series breaks in 2014 and 2015.
**From 2015, Exclusion represents principal decisions to exclude rather than recommendations for exclusion. From 2015 where a principal decided not to exclude, a small number of recommendations for exclusions have been counted as a long suspension. Exclusions, Cancellations and Long & Charge Suspensions may be upheld or set aside through an appeals process.

9
Environmental Footprint
Reducing the school’s environmental footprint The 2013-2014 water consumption is a data error. Increased water consumption 2015-2016 was required to maintain garden and grounds in the ongoing drought conditions.
ENVIRONMENTAL FOOTPRINT INDICATORS
Years Electricity
kWh Water
kL
2013-2014 181,175 139,389
2014-2015 178,495 16,534
2015-2016 167,566 27,535
The consumption data is compiled from sources including ERM, Ergon reports and utilities data entered into OneSchool by each school. The data provides an indication of the consumption trend in each of the utility categories which impact on the school’s environmental footprint.
School Funding
School income broken down by funding source School income, reported by financial year accounting cycle using standardized national methodologies and broken down by funding source is available via the My School website at http://www.myschool.edu.au/.
To access our income details, click on the My School link above. You will then be taken to the My School website with the following ‘Find a school’ text box.
Where it states ‘School name’, type in the name of the school you wish to view, select the school from the drop-down list and select <GO>. Read and follow the instructions on the next screen; you will be asked to confirm that you are not a robot then by clicking continue, you acknowledge that you have read, accepted and agree to the Terms of Use and Privacy Policy before being given access to the school’s profile webpage.
School financial information is available by selecting ‘School finances’ in the menu box in the top left corner of the school’s profile webpage. If you are unable to access the internet, please contact the school for a paper copy of income by funding source.

10
Our Staff Profile
Workforce Composition
Staff composition, including Indigenous staff
2016 WORKFORCE COMPOSITION
Description Teaching Staff Non-Teaching Staff Indigenous Staff
Headcounts 18 19 <5
Full-time Equivalents 17 13 <5
Qualification of all teachers
TEACHER* QUALIFICATIONS
Highest level of qualification Number of classroom teachers and school leaders at the
school
Doctorate 0
Masters 1
Graduate Diploma etc.** 2
Bachelor degree 14
Diploma 1
Certificate
*Teaching staff includes School Leaders **Graduate Diploma etc. includes Graduate Diploma, Bachelor Honours Degree, and Graduate Certificate.
Professional Development Expenditure On and Teacher Participation in Professional Development
The total funds expended on teacher professional development in 2016 were $15, 500.
The major professional development initiatives are as follows:
Age Appropriate Pedagogies
Words Their Way
LitBit - Literacy
Leadership skills for middle managers on Leadership Team
Early Start Workshops
HPE – Australian Curriculum
National School Improvement Tool
Community of Practice
The proportion of the teaching staff involved in professional development activities during 2016 was 100%.

11
Staff Attendance and Retention Staff attendance
AVERAGE STAFF ATTENDANCE (%)
Description 2014 2015 2016
Staff attendance for permanent and temporary staff and school leaders. 98% 98% 98%
Proportion of Staff Retained from the Previous School Year From the end of the previous school year, 76% of staff was retained by the school for the entire 2016.
Performance of Our Students
Key Student Outcomes
Student Attendance
Student attendance
The table below shows the attendance information for all students at this school:
STUDENT ATTENDANCE 2016
Description 2014 2015 2016
The overall attendance rate* for the students at this school (shown as a percentage). 92% 93% 93%
The attendance rate for Indigenous students at this school (shown as a percentage). 84% 90% 89%
*The student attendance rate is generated by dividing the total of full-days and part-days that students attended, and comparing this to the total of all possible days for students to attend, expressed as a percentage.
The overall student attendance rate in 2016 for all Queensland Primary schools was 93%.
AVERAGE STUDENT ATTENDANCE RATE* (%) FOR EACH YEAR LEVEL
Year Level
Prep Year
1 Year
2 Year
3 Year
4 Year
5 Year
6 Year
7 Year
8 Year
9 Year 10
Year 11
Year 12
2014 91% 93% 91% 94% 90% 91% 92% 95%
2015 93% 92% 95% 93% 94% 94% 93%
2016 92% 91% 94% 96% 93% 94% 92%
*Attendance rates effectively count attendance for every student for every day of attendance in Semester 1. The student attendance rate is generated by dividing the total of full-days and part-days that students attended, and comparing this to the total of all possible days for students to attend, expressed as a percentage.
DW = Data withheld to ensure confidentiality.

12
Student Attendance Distribution The proportions of students by attendance range:
Description of how non-attendance is managed by the school Non-attendance is managed in state schools in line with the DET procedures, Managing Student Absences and Enforcing Enrolment and Attendance at State Schools and Roll Marking in State Schools, which outline processes for managing and recording student attendance and absenteeism.
Class rolls are marked at the beginning of morning session and afternoon session. All unexplained absences at morning roll marking are followed up with a phone call to parents. If a parent is non-contactable and the absence is without explanation for 3 days, a letter is sent to parents. A letter is included in school reports for students with 5 days or more absent in the semester.
NAPLAN Our reading, writing, spelling, grammar and punctuation, and numeracy results for the Years 3, 5, 7 and 9 are available via the My School website at http://www.myschool.edu.au/.
To access our NAPLAN results, click on the My School link above. You will then be taken to the My School website with the
following ‘Find a school’ text box.
Where it states ‘School name’, type in the name of the school you wish to view, select the school from the drop-down list and select <GO>. Read and follow the instructions on the next screen; you will be asked to confirm that you are not a robot then by clicking continue, you acknowledge that you have read, accepted and agree to the Terms of Use and Privacy Policy before being given access to the school’s profile webpage.
School NAPLAN information is available by selecting ‘NAPLAN’ in the menu box in the top left corner of the school’s profile webpage. If you are unable to access the internet, please contact the school for a paper copy of our school’s NAPLAN results.
11
12
14
13
9
17
26
29
25
50
50
44
0% 20% 40% 60% 80% 100%
2016
2015
2014
Proportion of Students
Attendance Rate: 0% to <85% 85% to <90% 90% to <95% 95% to 100%