ANNUAL REPORT FOR THE YEAR ENDED 30TH JUNE, · PDF fileANNUAL REPORT FOR THE YEAR ENDED 30TH...
114
THE UNITED REPUBLIC OF TANZANIA ANNUAL REPORT FOR THE YEAR ENDED 30 TH JUNE, 2016 December, 2016 Energy and Water Utilities Regulatory Authority (EWURA) Plot 11&12 Block D, Along New Bagamoyo Road, Opp. Makumbusho Village, Kijitonyama, 7 th Floor, LAPF Pensions Fund Towers, P.O. Box 72175, Dar es Salaam - Tanzania. Tel: +255 (0) 22 292 3513-18 • Fax: +255 (0) 22 292 35190 • E-mail: [email protected] Website: www.ewura.go.tz
Transcript of ANNUAL REPORT FOR THE YEAR ENDED 30TH JUNE, · PDF fileANNUAL REPORT FOR THE YEAR ENDED 30TH...
THE UNITED REPUBLIC OF TANZANIA
ANNUAL REPORT FOR THE
YEAR ENDED 30TH JUNE, 2016
December, 2016
Energy and Water Utilities Regulatory Authority (EWURA)Plot 11&12 Block D, Along New Bagamoyo Road, Opp. Makumbusho Village, Kijitonyama,
7th Floor, LAPF Pensions Fund Towers, P.O. Box 72175, Dar es Salaam - Tanzania.
Tel: +255 (0) 22 292 3513-18 • Fax: +255 (0) 22 292 35190 • E-mail: [email protected]
Website: www.ewura.go.tz
ANNUAL REPORT FOR THE YEAR ENDED 30TH JUNE, 2016
iiii
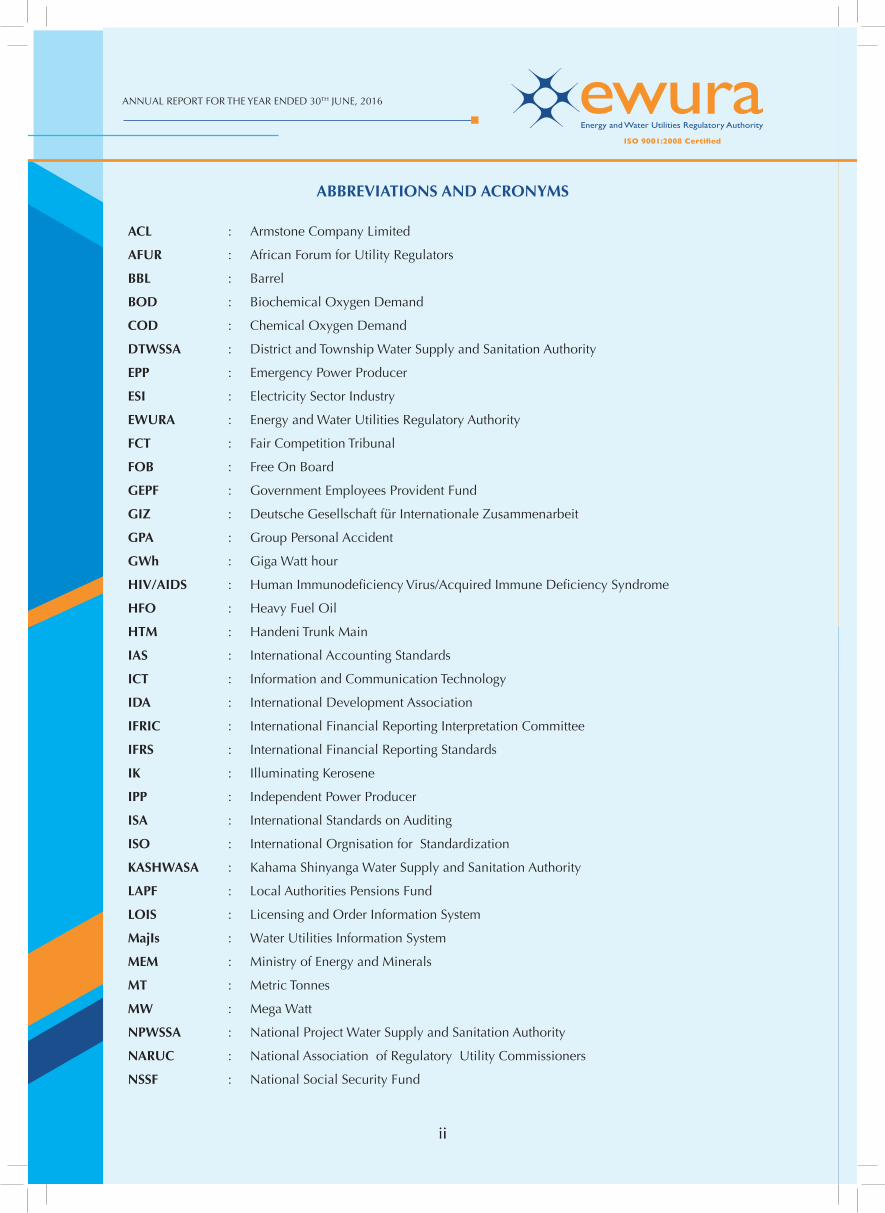
ABBREVIATIONS AND ACRONYMS
ACL : Armstone Company Limited
AFUR : African Forum for Utility Regulators
BBL : Barrel
BOD : Biochemical Oxygen Demand
COD : Chemical Oxygen Demand
DTWSSA : District and Township Water Supply and Sanitation Authority
EPP : Emergency Power Producer
ESI : Electricity Sector Industry
EWURA : Energy and Water Utilities Regulatory Authority
FCT : Fair Competition Tribunal
FOB : Free On Board
GEPF : Government Employees Provident Fund
GIZ : Deutsche Gesellschaft für Internationale Zusammenarbeit
GPA : Group Personal Accident
GWh : Giga Watt hour
HIV/AIDS : Human Immunodefi ciency Virus/Acquired Immune Defi ciency Syndrome
HFO : Heavy Fuel Oil
HTM : Handeni Trunk Main
IAS : International Accounting Standards
ICT : Information and Communication Technology
IDA : International Development Association
IFRIC : International Financial Reporting Interpretation Committee
IFRS : International Financial Reporting Standards
IK : Illuminating Kerosene
IPP : Independent Power Producer
ISA : International Standards on Auditing
ISO : International Orgnisation for Standardization
KASHWASA : Kahama Shinyanga Water Supply and Sanitation Authority
LAPF : Local Authorities Pensions Fund
LOIS : Licensing and Order Information System
MajIs : Water Utilities Information System
MEM : Ministry of Energy and Minerals
MT : Metric Tonnes
MW : Mega Watt
NPWSSA : National Project Water Supply and Sanitation Authority
NARUC : National Association of Regulatory Utility Commissioners
NSSF : National Social Security Fund
iii
ANNUAL REPORT FOR THE YEAR ENDED 30TH JUNE, 2016
iii
PAA : Public Audit Act 2008
PICL : Petroleum Importation Coordinator Ltd
PPF : Parastatal Pensions Fund
PPSDP : Privatization and Private Sector Development Project
PSPF : Public Service Pensions Fund
RERA : Regional Electricity Regulators Association
RWSSA : Regional Water Supply and Sanitation Authority
SPP : Small Power Producer
TANESCO : Tanzania Electric Supply Company
TBS : Tanzania Bureau of Standards
TZS : Tanzania Shillings
URT : United Republic of Tanzania
WSSA : Water Supply and Sanitation Authority
ZECO : Zanzibar Electric Company
ZESCO : Zambia Electricity Corporation
ANNUAL REPORT FOR THE YEAR ENDED 30TH JUNE, 2016
iviv
LETTER OF TRANSMITTAL
Hon. Eng. Gerson Lwenge (MP),Minister for Water and Irrigation,Ministry of Water and Irrigation,426 Morogoro Road,14473 DAR ES SALAAM.
Honourable Minister,
I have the honour to submit to you the Annual Report and Audited Accounts of the Energy and Water Utilities Regulatory Authority (EWURA) for the fi nancial year ended 30th June, 2016 as per Section 48 of the EWURA Act, Cap. 414 of the Laws of Tanzania.
The report outlines the major activities accomplished by the Authority during the year under review.I submit.
Eng. Prof.Jamidu H.Y. KatimaChairman, EWURA Board of Directors
December, 2016
v
ANNUAL REPORT FOR THE YEAR ENDED 30TH JUNE, 2016
v
VISION, MISSION AND CORE VALUES
Vision: To be a world class regulator of energy and water services.
Mission: To regulate the energy and water services in a transparent, effective and effi cient manner that promotes investments and enhances the socio-economic welfare of the Tanzanian society.
Core Values:
a) Transparency EWURA operates in a fully transparent manner. All regulatory decisions are conducted without prejudice,
with respect for the interests of all stakeholders and in a fair and completely transparent manner. Information on regulatory decisions is openly communicated to all stakeholders using various media.
b) Integrity EWURA Board members and staff are not allowed to offer, solicit or accept gifts, favours, inducements,
fi nancial or otherwise, in the course of discharging their duties.
c) Courtesy EWURA Board members and staff treat their clients and colleagues with courtesy and regard themselves
as servants of the people; and will be particularly considerate when dealing with vulnerable members of the public such as the elderly, the poor, the sick and people with disabilities and disadvantaged groups in society.
d) Accountability EWURA Board members and staff discharge duties including making decisions with which they are bound
and answerable. Their conduct is in a manner that shows readiness to take full liability and responsibility for the outcome of their decisions.
e) Professionalism EWURA Board members and staff attend to their duties with the highest degree of professionalism.
f) Equity EWURA Board members and staff treat all stakeholders with impartiality and fairness. The duty of EWURA
as a regulator is to set a level playing fi eld and balance interests of all stakeholders. The conduct of all staff and the individual decisions as well as those of the Authority at all times should refl ect this value.
Strategic ObjectivesThe Authority is determined to increase its contribution to national economic development and improve the welfare of the Tanzanian society through delivery of regulated services. It is within this drive that the Authority set out fi ve objectives in its Strategic Plan (2012/13 - 2016/17) with a view to enabling it to address imminent and medium-term regulatory challenges in all the sectors it regulates. These strategic objectives are:
(a) least cost investments in the regulated sectors promoted; (b) quality and access of regulated services improved;(c) public knowledge, awareness and understanding of regulatory functions in the regulated sectors enhanced;(d) EWURA functions effectively and effi ciently managed; and(e) Interventions against HIV/AIDS enhanced.
ANNUAL REPORT FOR THE YEAR ENDED 30TH JUNE, 2016
vivi
TABLE OF CONTENTS
ABBREVIATIONS AND ACRONYMS ................................................................................................................. ii
LETTER OF TRANSMITTAL ............................................................................................................................... iv
VISION, MISSION AND CORE VALUES ........................................................................................................... v
INTRODUCTION .......................................................................................................................................... viiiObjectives of the Report ................................................................................................................................. viii
CHAIRMAN’S STATEMENT ...............................................................................................................................1Board Management Structure ............................................................................................................................2Board of Directors .............................................................................................................................................7Board Committees .............................................................................................................................................7Internal Monitoring System ................................................................................................................................7Litigation ...........................................................................................................................................................7Finance and Budget Administration ...................................................................................................................7Procurement Management .................................................................................................................................8Code of Conduct ...............................................................................................................................................8Internal Audit and Risk Management .................................................................................................................8
1.0 GENERAL INSTITUTIONAL PERFORMANCE REVIEW .........................................................................9 During the period under review, the Authority performed various
activities related to regulatory matters as summarised below: ..............................................................9 1.1 Staffi ng and Institutional Capacity Building ..............................................................................9 1.2 Regional Co-operation and Collaboration ................................................................................9 1.3 Information and Communication Technology (ICT) ................................................................10 1.4 Public Register .......................................................................................................................10 1.5 Financial Performance Review ...............................................................................................11 1.6 Key Achievements and Challenges .........................................................................................11
2.0 ELECTRICITY SECTOR PERFORMANCE AND REGULATION .............................................................13 2.1 Overview ...............................................................................................................................13 2.2 Licensing ...............................................................................................................................14 2.3 Performance Monitoring ........................................................................................................15 2.4 Tariff Review and Approval of Power Projects.........................................................................17 2.5 Regulatory Tools .....................................................................................................................18 2.6 Complaints and Dispute Resolutions ......................................................................................18 2.7 Health, Safety and Environmental Matters ..............................................................................18 2.8 Key Achievements and Challenges .........................................................................................18
3.0 PETROLEUM SECTOR PERFORMANCE AND REGULATION ..............................................................20 3.1 Overview ...............................................................................................................................20 3.2 Petroleum Products Supply and Stock Monitoring ..................................................................20 3.3 Petroleum Products Prices ......................................................................................................26 3.4 Compliance Monitoring .........................................................................................................32 3.5 Monitoring adherence to Health, Safety and Environmental (HSE) requirements ....................35 3.6 Licensing Activities ................................................................................................................38
vii
ANNUAL REPORT FOR THE YEAR ENDED 30TH JUNE, 2016
vii
3.7 Legislative Regulatory Tools ....................................................................................................39 3.8 Awareness Campaign .............................................................................................................39 3.9 Key Achievements and Challenges .........................................................................................40 4.0 NATURAL GAS SECTOR PERFORMANCE AND REGULATION ..........................................................41 4.1 Overview ...............................................................................................................................41 4.2 Performance Monitoring ........................................................................................................41 4.3 Level of Investment in Gas Infrastructure Development ..........................................................44 4.4 Health, Safety and Environment .............................................................................................44 4.5 Local Content ........................................................................................................................45 4.6 Licensing. ..............................................................................................................................45 4.7 Determination of Rates and Charges ......................................................................................45 4.8 Legislative Matters ..................................................................................................................45 4.9 Disputes and Complaints .......................................................................................................45 4.10 Litigation ................................................................................................................................45 4.11 Key Achievements and Challenges .........................................................................................46
5.0 WATER SUPPLY AND SANITATION SERVICES REGULATION ............................................................47 5.1 Overview ...............................................................................................................................47 5.2 Performance Monitoring ........................................................................................................47 5.3 Review of WSSAs’ Business Plans ..........................................................................................48 5.4 Water Utilities Performance Review Report ............................................................................48 5.5 Licensing ...............................................................................................................................49 5.6 Determination of rates and charges ........................................................................................49 5.7 Complaints Handling and Dispute Resolution ........................................................................50 5.8 Litigation ................................................................................................................................50 5.9 Health, Safety and Environmental Matters ..............................................................................50 5.10 Capacity Building ..................................................................................................................51 5.11 Other Interventions in the Water Sector ..................................................................................51 5.12 Key Achievements and Challenges .........................................................................................53
6.0 COMMUNICATIONS AND PUBLIC AWARENESS PROGRAMME ......................................................54 6.1 Overview ...............................................................................................................................54 6.2 Public Awareness Programmes ...............................................................................................54 6.3 Press Conferences and Media Coverage .................................................................................54 6.4 Advertisements .......................................................................................................................54 6.5 Exhibitions .............................................................................................................................54 6.6 Publicity Materials .................................................................................................................55 6.7 Donations and contributions ..................................................................................................55 6.8 Impact of Public Awareness Campaigns .................................................................................55 6.9 Key Achievement and Challenges ..........................................................................................55
7.0 STAKEHOLDERS CONSULTATIONS ...................................................................................................56
8.0 DECLARATION OF CONFLICT OF INTEREST ....................................................................................56
9.0 CONCLUSION AND FUTURE OUTLOOK .........................................................................................56
10.0 REPORT FROM THE CONTROLLER AND AUDITOR GENERAL .........................................................59
ANNUAL REPORT FOR THE YEAR ENDED 30TH JUNE, 2016
viiiviii
INTRODUCTION
This is the 10th Annual report that presents the performance of the Energy and Water Utilities Regulatory Authority (EWURA) for the year that ended on 30th June, 2016. The report summarizes the executed activities, challenges encountered and achievements attained during the period under review.
The Authority was established under the EWURA Act, Cap. 414 of the Laws of Tanzania, and started its operations in June 2006 as a multi-sector regulatory authority. The Authority carries out economic and technical regulation of the energy (electricity, petroleum, and natural gas) and water sectors. The functions of the Authority as spelt out in the Act are to:
(a) Perform all functions conferred on it by EWURA Act and sector legislation;(b) issue, renew and cancel licences;(c) establish standards for goods and services;(d) establish standards for terms and conditions of supply of goods and services;(e) regulate rates and charges;(f) make rules;(g) monitor performance of regulated sectors in relation to availability, quality, standards of services, cost of
services, effi ciency of production, investment levels and distribution of services; (h) facilitate resolution of complaints and disputes; and(i) Disseminate information about matters relevant to its functions.
Further, Section 6 of the EWURA Act requires the Authority to assume the following duties in the course of carrying out its functions:
(a) promote effective competition and economic effi ciency;(b) promote the interests of consumers;(c) protect the fi nancial viability of effi cient suppliers;(d) promote the availability of regulated services to all consumers, including low income, rural and
disadvantaged consumers;(e) enhance public knowledge, awareness and understanding of the regulated sectors including the rights
and obligations of consumers and regulated suppliers, the ways in which complaints and disputes may be initiated and resolved, and the duties, functions and activities of the Authority; and
(f) protect and preserve the environment.
Objectives of the Report
This annual report for 2015/16 fulfi ls the following objectives:
(a) to comply to the requirements of Section 48 of EWURA Act, Cap. 414;(b) to inform the public on the Authority’s performance in regulation of energy and water sectors;(c) to educate stakeholders of regulated sectors and the general public on regulatory matters; and(d) to provide a source of reliable information on the regulated sectors.
1
ANNUAL REPORT FOR THE YEAR ENDED 30TH JUNE, 2016
1
CHAIRMAN’S STATEMENT
On behalf of the Board of Directors of the Energy and Water Utilities Regulatory Authority (EWURA), I am pleased to give a brief overview of EWURA’s performance for the Financial Year ending June 30th 2016. Over the last 10 years we have seen a steady growth in energy and water sectors in terms of quality
of service was enhanced by EWURA’s regulatory interventions. Although the regulatory regime faces many challenges, the Authority continued to implement regulatory best practices to champion the delivery of quality energy and water services.
This being the fi rst Annual Report under my Chairmanship of the Board of Directors of the Authority, I am pleased to be part of a reputable institution that stands fi rm in implementing regulatory principles and values. The Board of Directors continued to oversee the regulatory functions in various aspects in order to make the Authority maintain its vision of becoming a world class regulator.
I would like to express my sincere thanks to the Government of the United Republic of Tanzania and other stakeholders for creating a conducive environment which enabled the Authority to conduct its functions effectively and effi ciently. I wish to extend my special appreciation to the Minister for Water and Irrigation, Hon. Eng. Gerson Lwenge (MP) and the Minister for Energy and Minerals, Hon. Prof. Sospeter Muhongo (MP) for supporting the Authority in achieving its intended goals.
Finally, let me take this opportunity to congratulate the Board members, Management and Staff for their undivided commitment, dedication and hardworking during the year under review.
Eng. Prof. Jamidu H. Y. KatimaBoard Chairman
ANNUAL REPORT FOR THE YEAR ENDED 30TH JUNE, 2016
22
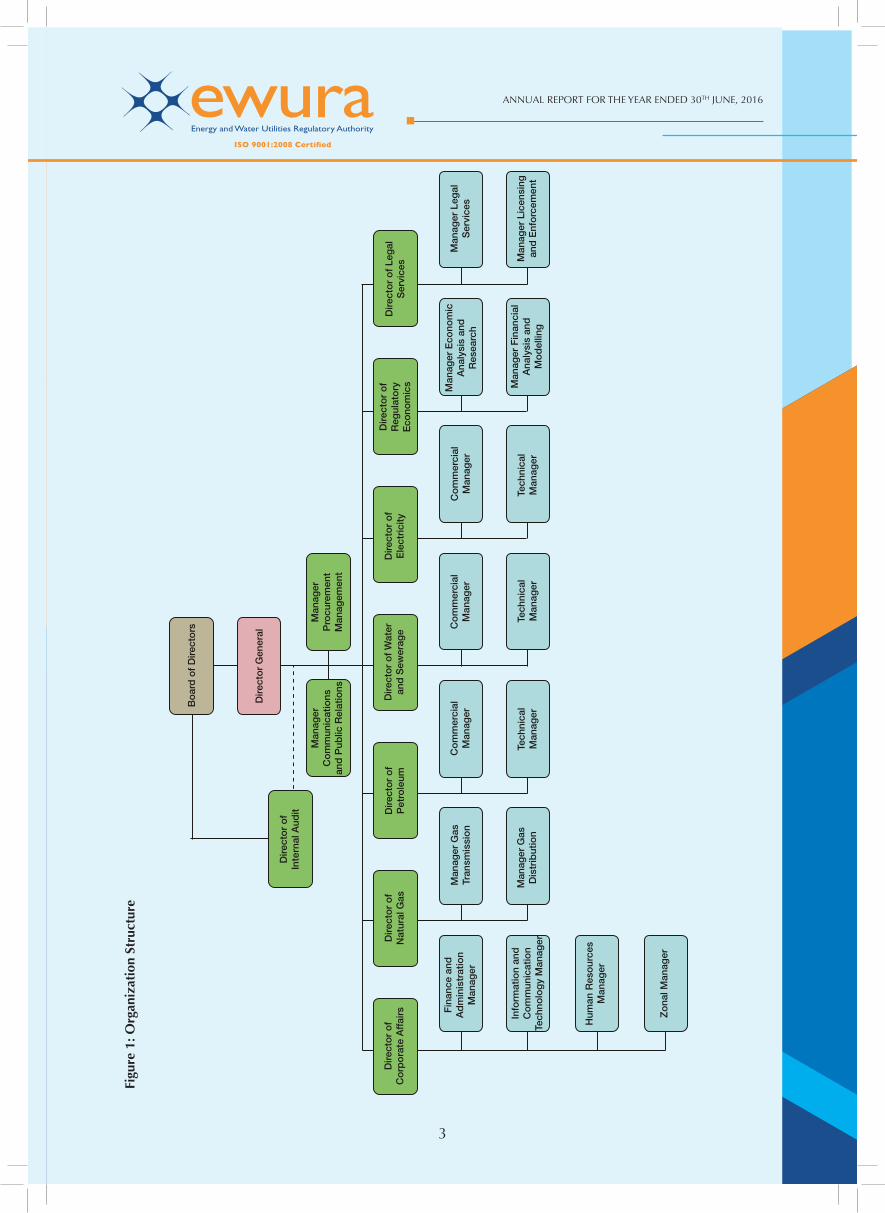
BOARD AND MANAGEMENT STRUCTURE
The Authority maintains a cost-effective organisation structure that facilitates effi cient regulation of the energy (electricity, petroleum, natural gas) and water and sanitation sectors; good corporate governance; and effi cient provision of cross-cutting services. The structure has the Board of Directors as the top
decision-making and oversight body, the Director General as the overall overseer of the day to day activities of the Authority and eight Divisions headed by Directors. There are also heads of units who report directly to the Director General namely: Manager Procurement Management and Manager Communications and Public Relations. The organisation structure is as shown in Figure 1.
Board of DirectorsEWURA is governed by a Board of Directors which is the highest decision-making organ of the Authority established under section 8 of the EWURA Act. The Board consists of the non-executive Chairman appointed by the President of the United Republic of Tanzania, fi ve (5) non-executive members and the Director General who are appointed by the Minister responsible for EWURA after consultation with the Minister for Energy and Minerals.
In order to fulfi l its oversight responsibilities, the Board has established fi ve (5) Board Committees based on sectoral and cross-cutting issues. These are Audit, Legal and Corporate Affairs, Electricity and Natural Gas, Petroleum, and Water Board Committees.
ManagementThe Director General is the in charge of management and is assisted by divisional directors and heads of units reporting to the director general. The Director General is appointed under section 14 of the EWURA Act and is responsible for the day-to-day operations of the Authority, subject to the directions of the Board.
The Divisional Directors are namely Director of Electricity, Director of Petroleum, Director of Natural Gas, Director of Water and Sanitation, Director of Regulatory Economics, Director of Legal Services and Director of Corporate Affairs. The Director of Internal Audit reports to the Board’s Audit Committee on audit functions and to the Director General on administrative matters. Communications and Public Relations, and Procurement Management functions are headed by managers under the Director General’s Offi ce.
3
ANNUAL REPORT FOR THE YEAR ENDED 30TH JUNE, 2016
3
Dire
ctor
of
Cor
pora
te A
ffai
rs
Boa
rd o
f Dire
ctor
s
Dire
ctor
of
Inte
rnal
Aud
it
Dire
ctor
Gen
eral
Man
ager
C
omm
unic
atio
ns
and
Pub
lic R
elat
ions
Man
ager
P
rocu
rem
ent
Man
agem
ent
Fina
nce
and
Adm
inis
trat
ion
Man
ager
Info
rmat
ion
and
Com
mun
icat
ion
Tech
nolo
gy M
anag
er
Hum
an R
esou
rces
M
anag
er
Zon
al M
anag
er
Man
ager
Gas
D
istr
ibut
ion
Tech
nica
l M
anag
erTe
chni
cal
Man
ager
Tech
nica
l M
anag
er
Man
ager
Fin
anci
al
Ana
lysi
s an
d M
odel
ling
Man
ager
Lic
ensi
ngan
d E
nfor
cem
ent
Man
ager
Gas
Tr
ansm
issi
onC
omm
erci
al
Man
ager
Com
mer
cial
M
anag
erC
omm
erci
al
Man
ager
Man
ager
Eco
nom
ic
Ana
lysi
s an
d R
esea
rch
Man
ager
Leg
al
Ser
vice
s
Dire
ctor
of
Nat
ural
Gas
Dire
ctor
of
Pet
role
umD
irect
or o
f Wat
er
and
Sew
erag
eD
irect
or o
f E
lect
ricity
Dire
ctor
of
Reg
ulat
ory
Eco
nom
ics
Dire
ctor
of L
egal
S
ervi
ces
Figu
re 1
: Org
aniz
atio
n St
ruct
ure
ANNUAL REPORT FOR THE YEAR ENDED 30TH JUNE, 2016
44
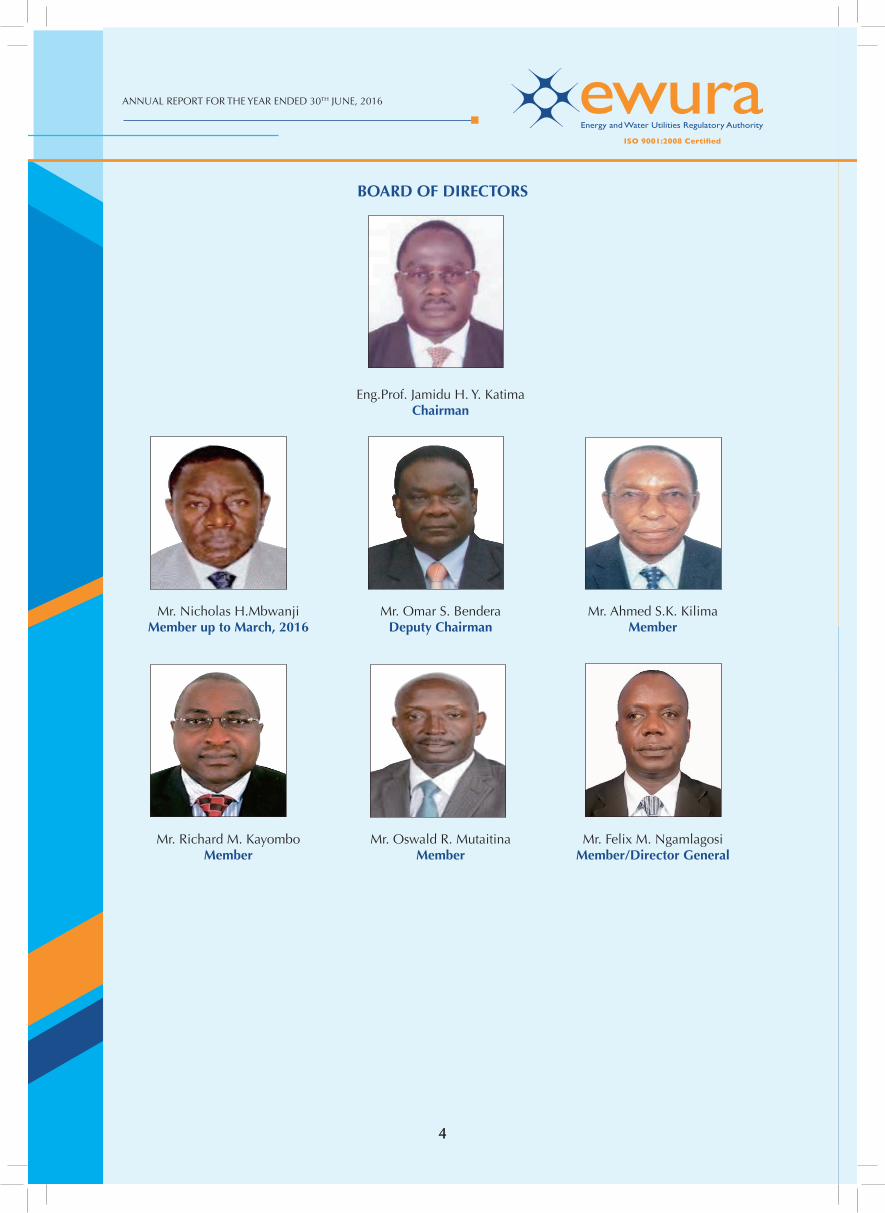
BOARD OF DIRECTORS
Eng.Prof. Jamidu H. Y. KatimaChairman
Mr. Nicholas H.MbwanjiMember up to March, 2016
Mr. Omar S. BenderaDeputy Chairman
Mr. Ahmed S.K. KilimaMember
Mr. Richard M. KayomboMember
Mr. Oswald R. MutaitinaMember
Mr. Felix M. NgamlagosiMember/Director General
5
ANNUAL REPORT FOR THE YEAR ENDED 30TH JUNE, 2016
5
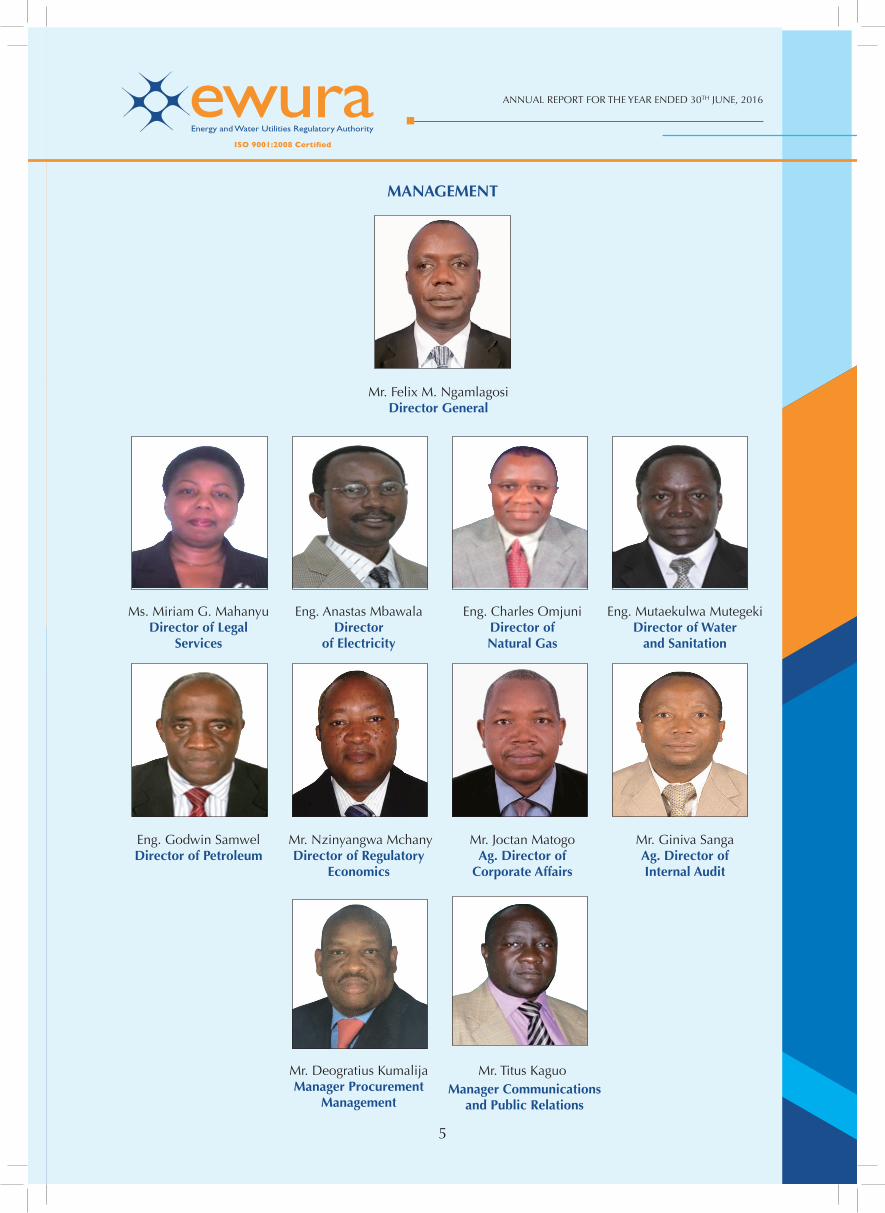
MANAGEMENT
Mr. Felix M. NgamlagosiDirector General
Ms. Miriam G. MahanyuDirector of Legal
Services
Eng. Anastas MbawalaDirector
of Electricity
Eng. Charles OmjuniDirector of Natural Gas
Eng. Mutaekulwa MutegekiDirector of Water
and Sanitation
Eng. Godwin SamwelDirector of Petroleum
Mr. Nzinyangwa MchanyDirector of Regulatory
Economics
Mr. Joctan MatogoAg. Director of
Corporate Affairs
Mr. Giniva SangaAg. Director of Internal Audit
Mr. Deogratius KumalijaManager Procurement
Management
Mr. Titus KaguoManager Communications
and Public Relations
ANNUAL REPORT FOR THE YEAR ENDED 30TH JUNE, 2016
66
DIRECTOR GENERAL’S STATEMENT
It is my pleasure to present the 10th Annual Report of the Energy and Water Utilities Regulatory Authority (EWURA) for the period covering 1st July 2015 to 30th June 2016. This is the 10th year since the Authority became operational in 2006 with the role of overseeing economic and technical regulation of Energy (Electricity,
Petroleum and Natural Gas) and Water sectors.
During the year under review, the Authority recorded various achievements including acquiring certifi cation for the International Organisation for Standardisation; namely ISO 9001:2008. The certifi cation means a lot to the Authority as its operational procedures for implementing roles and functions are now internationally recognised and therefore, complimenting with EWURA’s vision of becoming a world class regulator. The Authority also developed a Client Service Charter which is used to guide on the level of quality of service delivery to our customers.
The Authority reviewed various regulatory tools and developed new ones. Most of the tools were developed to meet the requirements of the Electricity Supply Industry Reform Strategy and Roadmap (ESIRSR) and the new Petroleum Act, 2015.
The Authority continued to monitor importation of petroleum products through the Bulk Procurement System, and during the period under review, the Authority approved importation of petroleum products through Tanga Port.
In the water sector, the Authority conducted trainings on the preparation of business plans to 42 District towns and National projects Water Supply and Sanitation Authorities (WSSAs). A signifi cant number of water utilities have been able to prepare their plans using comprehensive business planning guidelines. This enabled the utilities to streamline their operations, among other things, assist in determining appropriate tariff, setting appropriate performance targets and attracting sustainable investment in the water sector.
One of the Authority’s key functions is to make sure that there is suffi cient supply of regulated goods and services. During the period under review, the Authority continued to conduct monitoring and inspection of its regulated sectors. This has improved the quality of regulated products, services, and standards of infrastructure.
The Authority continued to cooperate with other Government institutions such as Tanzania Bureau of Standards (TBS), National Environment Management Council (NEMC), Tanzania Revenue Authority (TRA) and Police Force, on matters that required EWURA’s cooperation or intervention, or vice versa, for the country’s interest.
I would like to take this opportunity to thank the EWURA Board of Directors, Management, staff and all our stakeholders in general for supporting the Authority in fostering the social and economic welfare of our society.
Felix M. NgamlagosiDirector General
7
ANNUAL REPORT FOR THE YEAR ENDED 30TH JUNE, 2016
7
CORPORATE GOVERNANCE
Board of DirectorsThe Board of Directors of EWURA as the highest decision making organ, is established under Section 8 of the EWURA Act, Cap. 414. The Board consists of six non-executive members including the Chairman and one executive member who is also the Director General. The Chairman is appointed by the President of the United Republic of Tanzania while the remaining fi ve non-executive members and the Director General are appointed by the Minister responsible for EWURA after consultation with the relevant sector Ministers. During the year under review a total of 28 Board Meetings were conducted, out of which 12 were ordinary and 16 were extraordinary.
Board CommitteesThe committees of the Board of Directors are established in accordance with Section 21 of the EWURA Act, Cap. 414 to fulfi l its oversight responsibilities. The Board has fi ve Committees based on sectoral and cross-cutting issues. These are Audit, Legal and Corporate Affairs, Electricity and Natural Gas, Petroleum, and Water Committees. During the period under review, 27 meetings were conducted by these Committees as shown in Table 1.
Table 1: Board Committees Meetings
S/N Board Committee Number of Meetings1 Audit 5
2 Legal and Corporate Affairs 6
3 Electricity and Natural Gas 7
4 Petroleum 5
5 Water 4
Total 27
Internal Monitoring SystemThe Authority has established an Internal Monitoring System in line with relevant public sector legislation, regulations, rules and procedures. The internal administrative monitoring system is achieved through, among other things, fi nancial controls, and the Code of Conduct and Internal Audit functions.
LitigationDuring the year under review, the Authority was a party to 15 cases which are pending at various registries of the High Court of Tanzania, the Fair Competition Tribunal and Resident Magistrate Courts. The Authority was also a party to two labour cases at the Commission of Mediation and Arbitration (CMA).
Finance and Budget AdministrationThe fi nancial matters of the Authority are governed by the Public Finance Act, 2002 and international fi nancial best practices. The Authority’s Annual Plan and Budget are prepared in accordance with the Five Years Strategic Plan (FYSP) of 2012/13 – 2016/17 of the Authority and is based on Medium Term Expenditure Framework (MTEF).Pursuant to Section 21 of the Budget Act, 2015, the Authority is required to prepare budget estimates and submit to the Permanent Secretary of the Ministry of Finance and Planning for scrutiny and approval. After being approved the budget is submitted to the Minister responsible for EWURA in line with the provisions of section 49 of the EWURA Act. Resources used to implement the Annual Budget are derived from regulatory levies and fees collected from regulated utilities and consumers. The outcome of the implementation of annual budget is presented to the Minister responsible for the Authority through an Annual Report and Accounts in line with the provisions of section 48 of the EWURA Act.
ANNUAL REPORT FOR THE YEAR ENDED 30TH JUNE, 2016
88
Procurement ManagementThe Authority has a Tender Board and a Procurement Management Unit (PMU) established in accordance with the Public Procurement Act Cap 410. In order to comply with the requirements of the Public Procurement Act and its related Regulations, members of the Tender Board, Staff of the Procurement Management Unit and user departments attended various training courses being conducted by the Public Procurement Regulatory Authority (PPRA).
During the procurement compliance audit conducted by the Public Procurement Regulatory Authority in May 2016, the Authority was assessed to have performed well with a compliance level of 81.5%.
Code of ConductThe Authority’s Code of Conduct binds both Members of the Board of Directors and Staff. The Code of Conduct explicitly underlines that the Authority has zero tolerance to fraud and corruption. All incidents of fraud and corruption are reported to appropriate Authorities. During the year under review, the Authority did not encounter any incident of fraud or corruption related to conduct of its Board Members or employees. The Integrity Management Committee was formed in May 2016 whose functions is to deal with matters related to corruption and conduct within the Authority.
Internal Audit and Risk ManagementThe Internal Audit functions that entail giving assurance on risk management, control processes and governance processes, were carried out in accordance with the Internal Audit Charter, Annual Audit Plan and International Standards for Professional Practices of Internal Auditing.
During the period under review, the Authority witnessed a smooth running of various processes under the guidance of the oversight bodies which include the Board of Directors and its committees. The Internal Audit activity continued to assist the Board and Management in ensuring that there is improvement in the effectiveness of risk management, control and governance processes.
9
ANNUAL REPORT FOR THE YEAR ENDED 30TH JUNE, 2016
9
1.0 GENERAL INSTITUTIONAL PERFORMANCE REVIEW During the period under review, the Authority performed various activities related to regulatory matters
as summarised below:
1.1 Staffi ng and Institutional Capacity Building
1.1.1 Recruitment The Authority maintained its recruitment policy by providing equal opportunity to all. In so doing,
the Authority recruited the most appropriate candidates available in the market in a competitive and transparent manner in order to ensure that the functions and duties of the Authority are performed effi ciently and effectively.
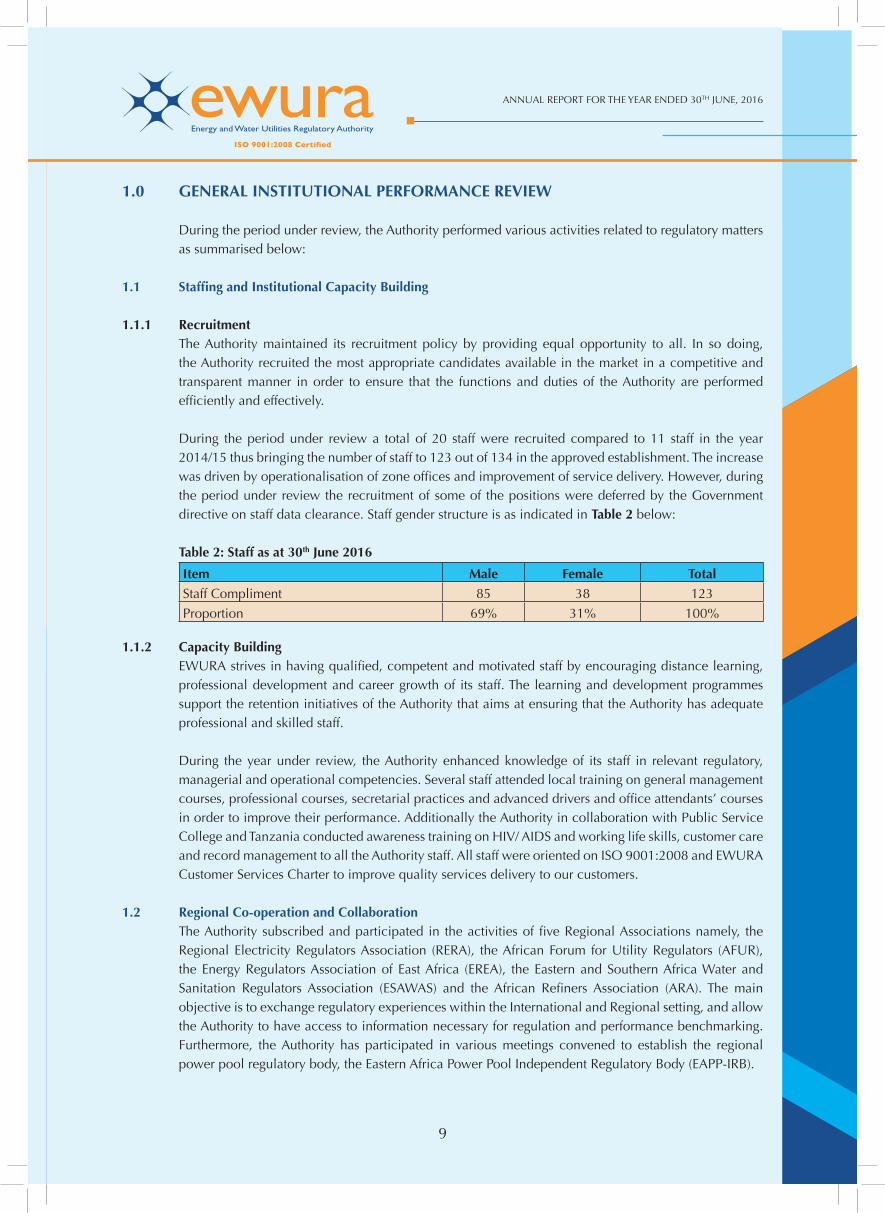
During the period under review a total of 20 staff were recruited compared to 11 staff in the year 2014/15 thus bringing the number of staff to 123 out of 134 in the approved establishment. The increase was driven by operationalisation of zone offi ces and improvement of service delivery. However, during the period under review the recruitment of some of the positions were deferred by the Government directive on staff data clearance. Staff gender structure is as indicated in Table 2 below:
Table 2: Staff as at 30th June 2016
Item Male Female TotalStaff Compliment 85 38 123
Proportion 69% 31% 100%
1.1.2 Capacity Building EWURA strives in having qualifi ed, competent and motivated staff by encouraging distance learning,
professional development and career growth of its staff. The learning and development programmes support the retention initiatives of the Authority that aims at ensuring that the Authority has adequate professional and skilled staff.
During the year under review, the Authority enhanced knowledge of its staff in relevant regulatory, managerial and operational competencies. Several staff attended local training on general management courses, professional courses, secretarial practices and advanced drivers and offi ce attendants’ courses in order to improve their performance. Additionally the Authority in collaboration with Public Service College and Tanzania conducted awareness training on HIV/ AIDS and working life skills, customer care and record management to all the Authority staff. All staff were oriented on ISO 9001:2008 and EWURA Customer Services Charter to improve quality services delivery to our customers.
1.2 Regional Co-operation and Collaboration The Authority subscribed and participated in the activities of fi ve Regional Associations namely, the
Regional Electricity Regulators Association (RERA), the African Forum for Utility Regulators (AFUR), the Energy Regulators Association of East Africa (EREA), the Eastern and Southern Africa Water and Sanitation Regulators Association (ESAWAS) and the African Refi ners Association (ARA). The main objective is to exchange regulatory experiences within the International and Regional setting, and allow the Authority to have access to information necessary for regulation and performance benchmarking. Furthermore, the Authority has participated in various meetings convened to establish the regional power pool regulatory body, the Eastern Africa Power Pool Independent Regulatory Body (EAPP-IRB).
ANNUAL REPORT FOR THE YEAR ENDED 30TH JUNE, 2016
1010
1.3 Information and Communication Technology (ICT)
1.3.1 Regulatory and Management Information Systems The Authority’s Information Communication and Technology (ICT) System continued to support
regulatory functions. It is the Authority’s policy to ensure that the public is provided with timely and accurate information. The Authority’s website provides access to regulatory information including publications of all decisions made by the Board.
The Authority has developed a system that enable general public to get access of petroleum price at any point in Tanzania through mobile phone. Monthly fuel prices are updated in this system for public consumption. Information can be accessed by dial *152*00# and follow other instructions.
The Authority maintained the performance of Water Supply and Sanitation Authorities (WSSA) by using the Water Utilities Information System (MajIs). MajIs serves to improve accessibility to data and information for monitoring, planning and decision-making.
Likewise, the Authority maintained the Electricity Regulatory Information System (ERIS) and Asset Register (AR). The system is used to collect information from electricity service providers.
Furthermore, the Authority was fi nalising the Licensing and Order Information System (LOIS) under the support of GIZ. LOIS has been designed to facilitate online application, issuing, revocation and transfer of licences and tariff for regulated sectors Testing of LOIS by its developer, M/s Exact Software is in fi nal stages.
Finance and accounting activities of the Authority are managed through EPICOR accounting software which provides accurate data and timely reporting. A remote data recovery centre has been improved to strengthen the security of the Authority’s data in the event of a disaster to ensure business continuity.
1.3.2 Relocation ICT Infrastructure EWURA relocated its offi ce from Harbour View Tower to Kijitonyama LAPF Millennium Tower in January,
2016. Offi ce relocation exercise was a response to a long time need for improvement of working environment and space needed for EWURA operations. Offi ce relocation necessitated also relocation of ICT infrastructure from old offi ce to new offi ce. Computer, telephone network and record centre were relocated together with servers and all associated services. The exercise was well planned as there were minimal service interruptions and there was no loss or leakage of information. Special care was taken to ensure that all ICT items are under full control of the Authority during the relocation exercise.
1.4 Public Register Provision of the Public Access Register is now accessible in a well-furnished and equipped room
following the offi ce relocation at Head Quarters in Dar es salaam. During the year the registry was used by the public for research and information. The registry is open all time during offi ce hours from 0800 to 1700. The register provides access to the Code of Conduct adopted by the Authority, regulatory information and all regulatory decisions made by the Authority and published in the Government Gazette such as rules, tariff orders, awards and licences. The public has the right to get correct and accurate information from the Authority relating to the regulated entities. The main objective of the Public Registry is to ensure transparency of the Authority activities.
11
ANNUAL REPORT FOR THE YEAR ENDED 30TH JUNE, 2016
11
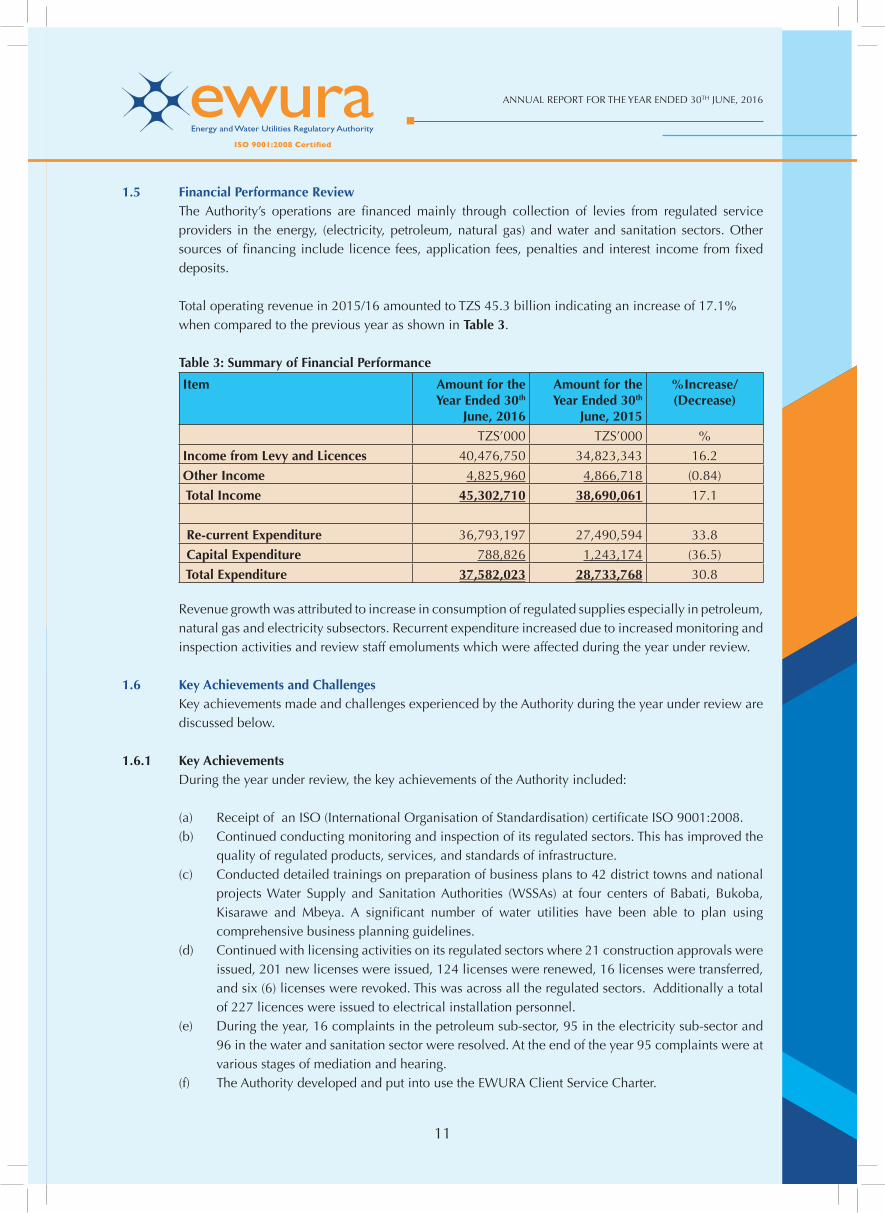
1.5 Financial Performance Review The Authority’s operations are fi nanced mainly through collection of levies from regulated service
providers in the energy, (electricity, petroleum, natural gas) and water and sanitation sectors. Other sources of fi nancing include licence fees, application fees, penalties and interest income from fi xed deposits.
Total operating revenue in 2015/16 amounted to TZS 45.3 billion indicating an increase of 17.1% when compared to the previous year as shown in Table 3.
Table 3: Summary of Financial Performance
Item Amount for the Year Ended 30th
June, 2016
Amount for the Year Ended 30th
June, 2015
%Increase/(Decrease)
TZS’000 TZS’000 %
Income from Levy and Licences 40,476,750 34,823,343 16.2
Other Income 4,825,960 4,866,718 (0.84)
Total Income 45,302,710 38,690,061 17.1
Re-current Expenditure 36,793,197 27,490,594 33.8
Capital Expenditure 788,826 1,243,174 (36.5)
Total Expenditure 37,582,023 28,733,768 30.8
Revenue growth was attributed to increase in consumption of regulated supplies especially in petroleum, natural gas and electricity subsectors. Recurrent expenditure increased due to increased monitoring and inspection activities and review staff emoluments which were affected during the year under review.
1.6 Key Achievements and Challenges Key achievements made and challenges experienced by the Authority during the year under review are
discussed below.
1.6.1 Key Achievements During the year under review, the key achievements of the Authority included:
(a) Receipt of an ISO (International Organisation of Standardisation) certifi cate ISO 9001:2008. (b) Continued conducting monitoring and inspection of its regulated sectors. This has improved the
quality of regulated products, services, and standards of infrastructure. (c) Conducted detailed trainings on preparation of business plans to 42 district towns and national
projects Water Supply and Sanitation Authorities (WSSAs) at four centers of Babati, Bukoba, Kisarawe and Mbeya. A signifi cant number of water utilities have been able to plan using comprehensive business planning guidelines.
(d) Continued with licensing activities on its regulated sectors where 21 construction approvals were issued, 201 new licenses were issued, 124 licenses were renewed, 16 licenses were transferred, and six (6) licenses were revoked. This was across all the regulated sectors. Additionally a total of 227 licences were issued to electrical installation personnel.
(e) During the year, 16 complaints in the petroleum sub-sector, 95 in the electricity sub-sector and 96 in the water and sanitation sector were resolved. At the end of the year 95 complaints were at various stages of mediation and hearing.
(f) The Authority developed and put into use the EWURA Client Service Charter.
ANNUAL REPORT FOR THE YEAR ENDED 30TH JUNE, 2016
1212
(g) The Authority reviewed 32 tariff review applications from Water Supply and Sanitation Authorities, two (2) applications from the electricity sub-sector specifi cally from TANESCO and Armstone Co. Ltd, reviewed the Small Power Projects Tariff (SPPT) for 2016; and had four (4) meetings regarding review of petroleum pricing formula.
(h) The Authority made improvements in importation of petroleum products in the country by including Tanga port as an addition point of entry.
(i) The Authority established the use of mobile phone SMS application that enables customers and general public to access petroleum products prices.
(j) The Authority obtained the Title Deed in respect of its Plot No.1/4 Block L located at Ubungo Area, Dar es salaam.
1.6.2 Key Challenges The key challenges and their respective mitigation measures are as outlined below:
(a) There is an increasing demand of the professionals in the petroleum and natural gas which the local market cannot support right now. The Authority shall continue to endeavour in monitoring the local content compliance to investors in the relevant sectors and to train its staff in foreign countries in short term courses, conferences and attachments. These courses are expensive hence very few staff get this opportunity.
(b) Hidden ineffi ciencies in the electricity sector due to the vertically integrated structure of the Electricity Supply Industry in Tanzania. However, the Government in June 2014 announced Electricity Sector Industry (ESI) reforms whereby the unbundling process of TANESCO into two separate companies of generation, transmission and distribution will be carried out until 2025 in alignment with Tanzania Development Vision, 2025.
(c) There are 130 WSSAs in the country. Generally, WSSAs at district and small town level have weak managerial, fi nancial and technical capacity. The Authority will continue to utilize its available resources to conduct capacity building activities, inspections and monitoring. The Authority will also continue proposing the clustering of the WSSAs.
(d) Inadequate capacity of the WSSAs to prepare Business Plans which are compliant to the EWURA Business Plan Guidelines. The Authority will continue with capacity building activities to WSSAs and is committed to set aside funds for the capacity building in the future years’ budgets.
(e) Low investments in Water Supply and Sanitation which results into a slow pace towards moving to 100% service coverage (currently, it is around 86% in urban areas). EWURA has prepared Business Planning guidelines which assist WSSAs to plan towards cost recovery tariffs. EWURA approves a three year tariff corresponding to the Business Plan. In addition, EWURA has been collaborating with the MoWI and DPs to put in place incentives for WSSAs to involve PPP’s and to acquire loans for investments.
(f) Slow decision making by other institutions which EWURA collaborate with in the course of carrying out its regulatory functions. One of the areas affected is the licensing of competitive projects in the regulated sectors, where other institutions such as NEMC are involved in the approval process. Frequent negotiations with these institutions has proved to mitigate this challenge.
13
ANNUAL REPORT FOR THE YEAR ENDED 30TH JUNE, 2016
13
2.0 ELECTRICITY SECTOR PERFORMANCE AND REGULATION
2.1 Overview Regulatory activities performed by the Authority in the electricity supply industry include, among
other things, issuing licences, approving initiation of procurement of power projects, approving Power Purchase Agreements (PPA), tariff setting and compliance monitoring of operations and regulated infrastructure to ensure quality and reliability of services. The regulated infrastructure includes power generating plants, power transmission lines, distribution substations and distributions lines, which are operated by private and public entities.
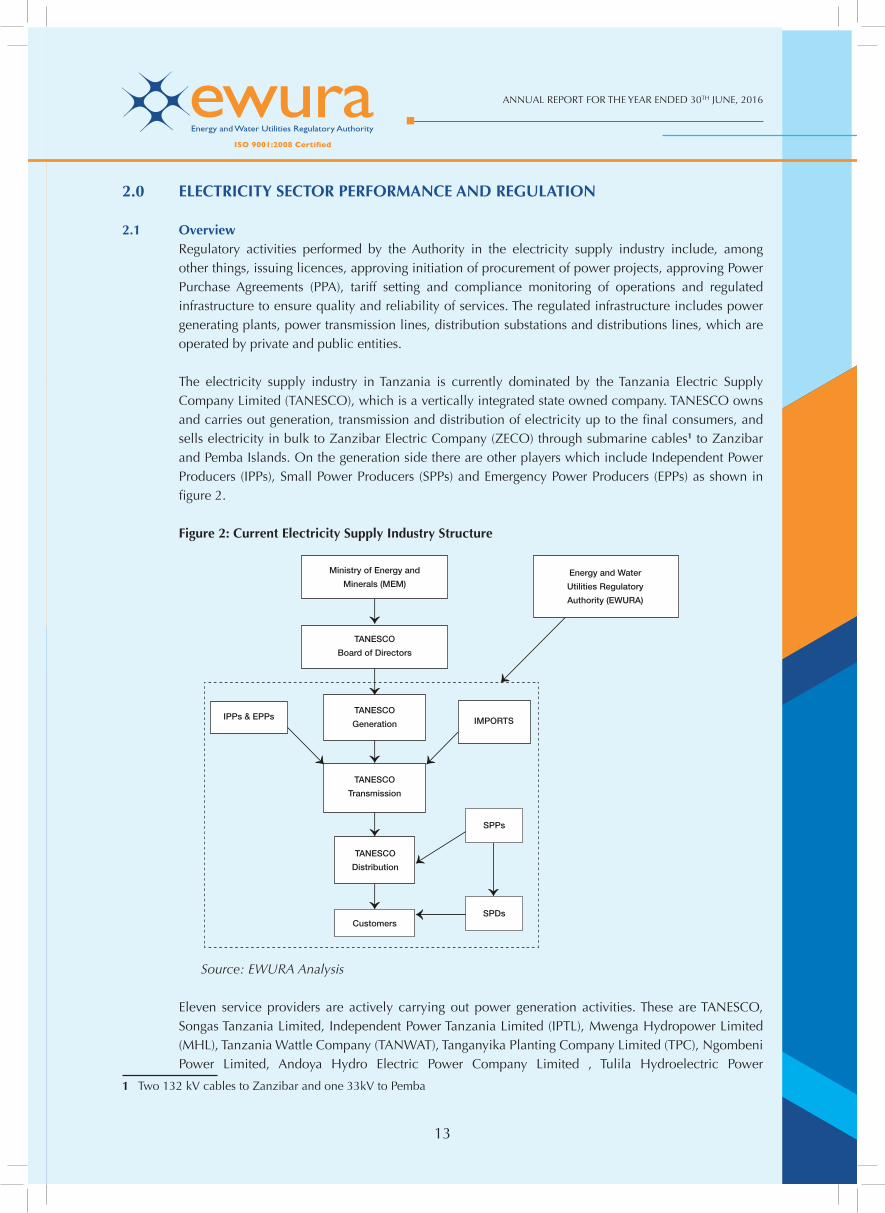
The electricity supply industry in Tanzania is currently dominated by the Tanzania Electric Supply Company Limited (TANESCO), which is a vertically integrated state owned company. TANESCO owns and carries out generation, transmission and distribution of electricity up to the final consumers, and sells electricity in bulk to Zanzibar Electric Company (ZECO) through submarine cables1 to Zanzibar and Pemba Islands. On the generation side there are other players which include Independent Power Producers (IPPs), Small Power Producers (SPPs) and Emergency Power Producers (EPPs) as shown in fi gure 2.
Figure 2: Current Electricity Supply Industry Structure
Source: EWURA Analysis
Eleven service providers are actively carrying out power generation activities. These are TANESCO, Songas Tanzania Limited, Independent Power Tanzania Limited (IPTL), Mwenga Hydropower Limited (MHL), Tanzania Wattle Company (TANWAT), Tanganyika Planting Company Limited (TPC), Ngombeni Power Limited, Andoya Hydro Electric Power Company Limited , Tulila Hydroelectric Power
1 Two 132 kV cables to Zanzibar and one 33kV to Pemba
Ministry of Energy and
Minerals (MEM)Energy and Water
Utilities Regulatory
Authority (EWURA)
TANESCO
Board of Directors
TANESCO
Generation
TANESCO
Transmission
IPPs & EPPs IMPORTS
SPPs
TANESCO
Distribution
CustomersSPDs
ANNUAL REPORT FOR THE YEAR ENDED 30TH JUNE, 2016
1414
Company Limited, Yovi Hydropower Company Limited and Darakuta Hydropower Development Company Limited. Service providers actively carrying out distribution and supply activities are TANESCO and Mwenga Hydropower Limited. The power transmission services are still under TANESCO monopoly. Towards the end of the period under review, Aggreko’s PPA with TANESCO expired and was not renewed hence stopped generation of power since 21st March 2016. In addition, Symbion Power (T) Limited 112 MW stopped generation on 24th May 2016 pending discussions on implementation of the PPA. Some PPAs came to an end due to additional sources of power such as Natural Gas.
2.2 Licensing
2.2.1 Power Supply Licensing During the period under review the Authority approved nine generation licences (two permanent
generation licence, one generation for own use, and six provisional generation licences), with a potential generation capacity of 627 MW, compared with six licences issued last year with 164 MW potential generation capacity only. However, 352 MW out of 627 MW was based on the extension of two licences. There was one provisional distribution licence issued to Fondazione ACRA- CCS and no transmission licence issued during the period under review. There were no pending application at the end of the fi nancial year.
Power Supply Registration Service providers of electricity services conducting generation, distribution and supply with capacity
below 1 MW are not required by law to be licensed, however, have to be registered by the Authority. During the period under review the Authority registered one service provider namely Jumeme Rural Power Supply Ltd that is conducting generation and distribution activities with installed capacity of 90 kW in Bwisya, Ukara Islands in Ukerewe district located in Lake Victoria.
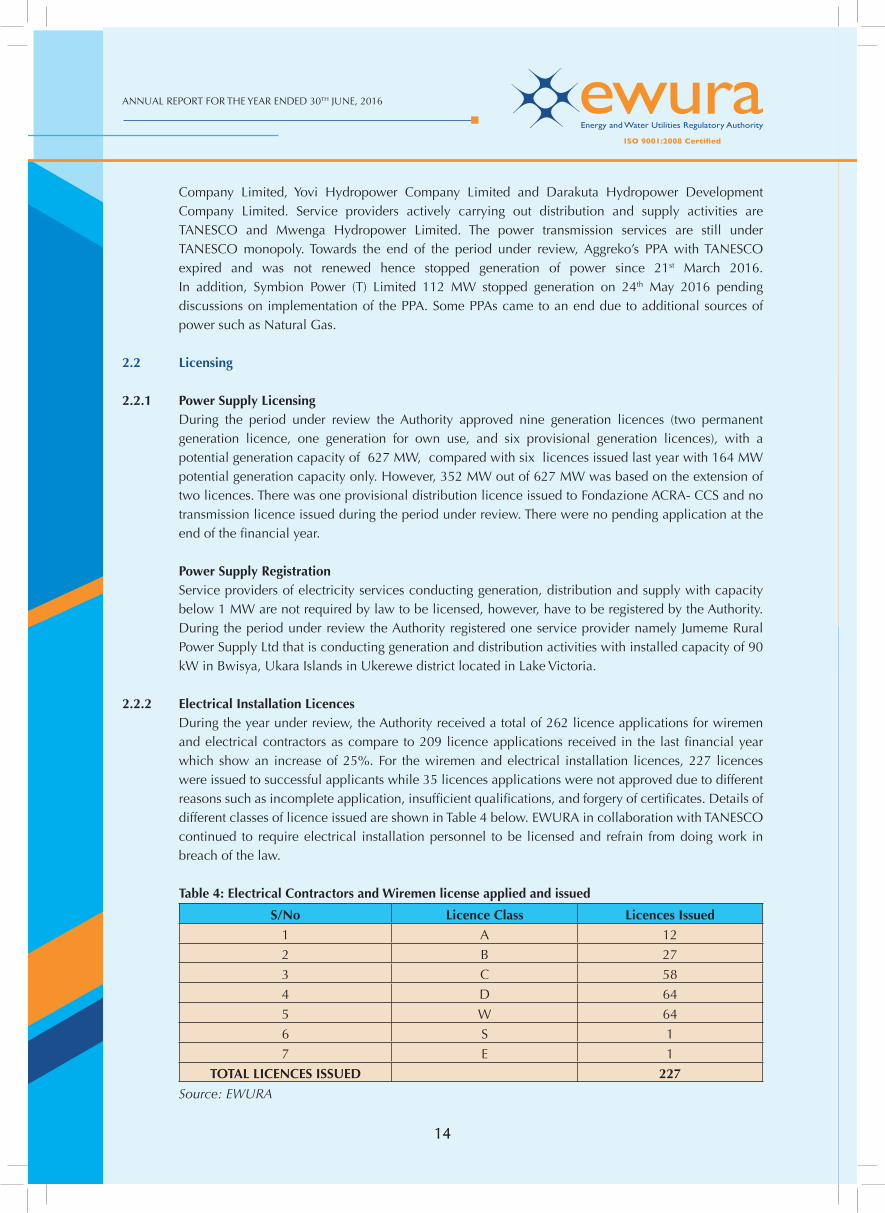
2.2.2 Electrical Installation Licences During the year under review, the Authority received a total of 262 licence applications for wiremen
and electrical contractors as compare to 209 licence applications received in the last fi nancial year which show an increase of 25%. For the wiremen and electrical installation licences, 227 licences were issued to successful applicants while 35 licences applications were not approved due to different reasons such as incomplete application, insuffi cient qualifi cations, and forgery of certifi cates. Details of different classes of licence issued are shown in Table 4 below. EWURA in collaboration with TANESCO continued to require electrical installation personnel to be licensed and refrain from doing work in breach of the law.
Table 4: Electrical Contractors and Wiremen license applied and issued
S/No Licence Class Licences Issued
1 A 12
2 B 27
3 C 58
4 D 64
5 W 64
6 S 1
7 E 1
TOTAL LICENCES ISSUED 227
Source: EWURA
15
ANNUAL REPORT FOR THE YEAR ENDED 30TH JUNE, 2016
15
2.3 Performance Monitoring
2.3.1 Reporting System Pursuant to Section 15(4) of the Electricity Act, 2008, every electricity service provider is required to
submit to the Authority, data and information relating to performance of its functions. During the period under review, the Authority continued to receive and maintain periodic data submitted by licensed power utilities and suppliers directly and through the daily system reports submitted by TANESCO through email distribution list. Capturing of data through ERIS and Asset Register (AR) has been very low due to outages of the system and other challenges faced. The Consultant (CRISIL of India) did resolve technical issues related to system availability, while EWURA worked on issues related to system to ensure the system is always realiable.
2.3.2 Monitoring and Inspection During the period under review the Authority conducted routine inspection on Low Voltage (LV) and
Medium Voltage (MV) distribution networks. The inspections were conducted for Electricity Distribution infrastructure’s in 11 regions namely Singida, Mtwara, Shinyanga, Kilimanjaro, Geita, Tanga, Mbeya, Katavi, Rukwa, Kagera and Iringa. Among the defects found during inspection were leaning and rotten poles, defective switchgears, leaning insulators, transformer oil leakages and unrated fuse wires. Also some areas were observed to have low voltage caused by lines extended beyond the standard limit and overloaded transformers. The Authority instructed TANESCO to rectify the anomalies as detailed in the inspection reports given to them.
Apart from above inspections, the Authority also conducted meeting with TANESCO Zonal Managers to discuss the inspection fi nding and emphasize on implementation of EWURA recommendations towards rectifi cation of the defects and anomalies observed during inspections.
The Authority conducted eleven pre-licensing inspections for Kilombero Sugar Company Limited; Yovi Hydropower Company Limited; Darakuta Hydropower Development Company Limited; Kagera Sugar Limited; Mtibwa Sugar Estate Limited; Tanga Cement PLC; Maweni Limestone Limited; Geita Gold Mining Limited; Fondazione ACRA- CCS; Ludewa Clean Energy Limited; and East Coast Oils and Fats Limited. Among the tasks performed during pre- licensing inspection include verifi cation of documents submitted and conducting licensing awareness to entities owning generation facility above 1 MW for their own use.
Quality and Standard of Services The Authority continued to monitor quality of service through the set standards with a focus on system
disturbances such as low frequency, high frequency, low voltage, power outages and load shedding. It was revealed that the system experienced frequent voltages and frequencies fluctuations because of aged equipment and lack of adequate maintenance. Furthermore, the Authority monitored activities conducted by utilities which included generation capacity, generation mix, customers connected with electricity and outages in order to advise licensed Utilities on areas which require improvements.
2.3.3 Generation Capacity The installed capacity in the Isolated Grid was 84 MW, while installed capacity in the Main Grid was
1,358 MW. The Maximum Demand attained was 1026 MW, recorded on 15th March 2016. During the period under review, a total of 6,449 GWh were available for sale as shown in Table 6, which implies a 2.9% increase as compared to 6,262 GWh reported during the previous year. These units were received from TANESCO plants, IPPs, SPPs and imports from neighbouring countries.
ANNUAL REPORT FOR THE YEAR ENDED 30TH JUNE, 2016
1616
Table 5: Electricity Generation and Imports
No. Utility Electricity Generation and Imports [GWh]
Percentage of Contribution [%]
1 TANESCO 3,915.54 60.72%
2 Songas 1,316.84 20.42%
3 IPTL 404.82 6.28%
4 Aggreko 231.97 3.60%
5 SPPs 54.41 0.84%
6 Symbion 439.02 6.81%
7 Cross Border Imports 85.77 1.33%
Total 6,448.37 100%
Source: EWURA
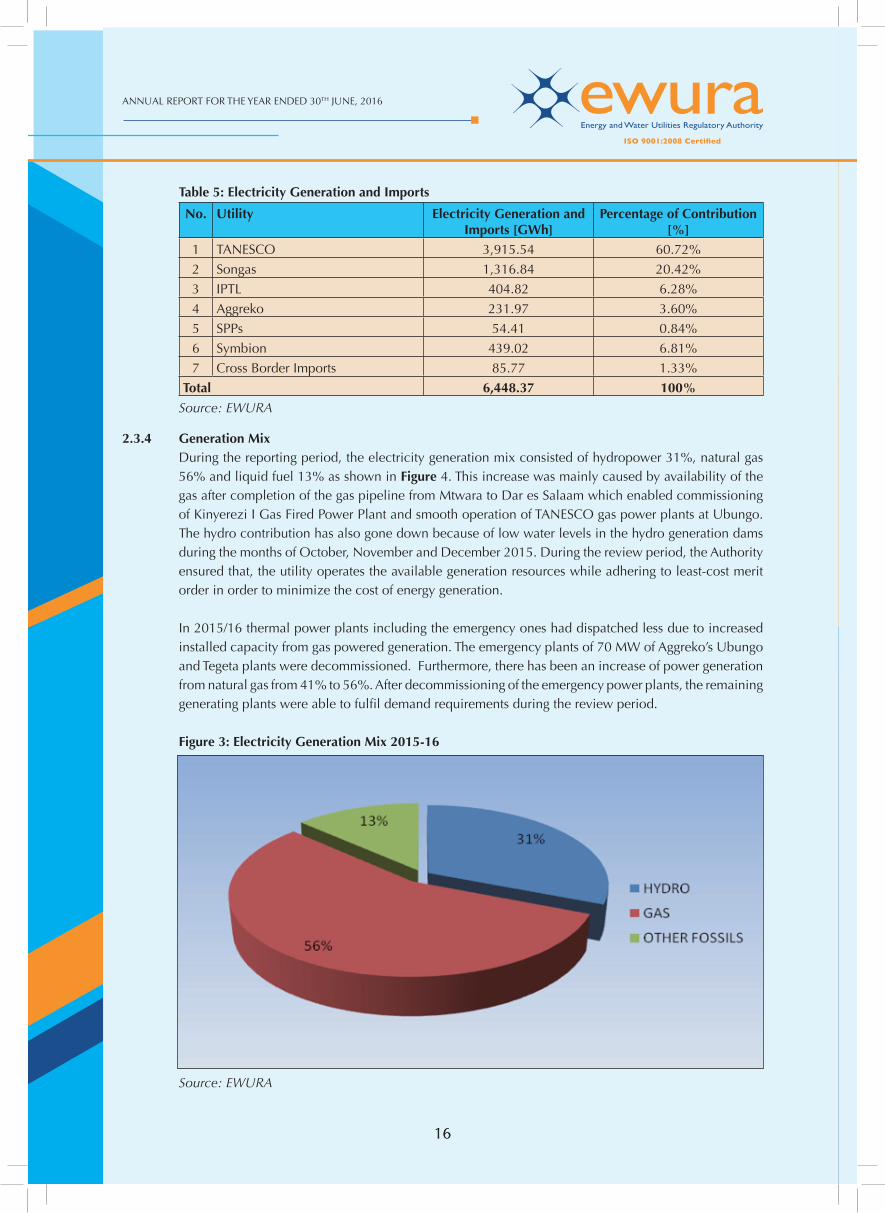
2.3.4 Generation Mix During the reporting period, the electricity generation mix consisted of hydropower 31%, natural gas
56% and liquid fuel 13% as shown in Figure 4. This increase was mainly caused by availability of the gas after completion of the gas pipeline from Mtwara to Dar es Salaam which enabled commissioning of Kinyerezi I Gas Fired Power Plant and smooth operation of TANESCO gas power plants at Ubungo. The hydro contribution has also gone down because of low water levels in the hydro generation dams during the months of October, November and December 2015. During the review period, the Authority ensured that, the utility operates the available generation resources while adhering to least-cost merit order in order to minimize the cost of energy generation.
In 2015/16 thermal power plants including the emergency ones had dispatched less due to increased installed capacity from gas powered generation. The emergency plants of 70 MW of Aggreko’s Ubungo and Tegeta plants were decommissioned. Furthermore, there has been an increase of power generation from natural gas from 41% to 56%. After decommissioning of the emergency power plants, the remaining generating plants were able to fulfi l demand requirements during the review period.
Figure 3: Electricity Generation Mix 2015-16
Source: EWURA
17
ANNUAL REPORT FOR THE YEAR ENDED 30TH JUNE, 2016
17
2.3.5 Customer Base During the year under review, the number of connected TANESCO customers was 1,743,820 customers
compared to the previous year, which was 1,502,474. The growth in customer connection was on record high due to an extensive grid extension of the distribution network funded by the Rural Energy Fund. As at 30th June 2016, Mwenga Hydro Limited of Mufi ndi District which has generation and distribution licences had connected 1826 customers as compared to 1312 customers in the previous year. The increase of 514 customers is due to normal planned growth of its distribution network.
2.4 Tariff Review and Approval of Power Projects
2.4.1 Tariff Review Section 23 of the Electricity Act, Cap. 131 mandates the Authority to approve and enforce tariff and
charges. EWURA conducted tariff adjustment review for TANESCO during the Third Quarter of the fi nancial year 2015/16. The Authority on 29th March, 2016 approved a decrease in tariff within the range of 1.5% to 2.4% effective from 1st April, 2016.
2.4.2 Small Power Projects Tariff The Authority approved Standardised Small Power Purchase Tariff effective from 1st April 2016, for SPPs
that will continue to use year 2008 avoided cost tariff setting methodology will be as shown in the Table 6 and 7.
Table 6: Main Grid Connection using Avoided Cost Tariff
Description2015 Tariff(TZS/kWh)
2016 Approved
Tariff(TZS/kWh)
Percentage Change
Standardized Small Power Purchase Tariff 190.94 190.46 -0.25%
Seasonally adjusted Standardized SPPT Payable in
Dry season 229.13 228.58 -0.25%
Wet season 171.85 171.42 -0.25%
Table 7: Mini Grid Connection using Avoided Cost Tariff
Description2015 Tariff(TZS/kWh)
2016 Approved
Tariff(TZS/kWh)
Percentage Change
Standardized SPP Tariff 490.39 477.16 -3.40%
The Authority also determined tariffs that will be applicable to Solar and wind projects with a capacity of up to 1MW as depicted in Table 8 below.
Table 8: Solar and Wind Connection Tariff
DescriptionApproved Tariff
(US$/kWh)
Standardized Small Power Purchase Tariff for Solar and Wind projects of up to 1MW connected to the Main Grid
0.165
Standardized Small Power Purchase Tariff for Solar and Wind projects of up to 1MW connected to the Mini Grid
0.181
ANNUAL REPORT FOR THE YEAR ENDED 30TH JUNE, 2016
1818
2.4.3 Approval for Initiation of Procurement of Power Projects andPower Purchase Agreements During the year under review, the Authority approved initiation of procurement of two power projects,
namely 300 MW Kinyerezi III Gas Fired Power Project by Shangtan Power Limited; and 72 MW Masigira Hydropower Project by Tanzania Masigira Power Limited. Furthermore, the Authority reviewed and approved the PPA between Symbion Power Tanzania Limited (112 MW) and TANESCO.
Additionally, the Authority participated in the preparation of the competitive bidding documents (RFQs and RFPs) for power projects for solar, wind, hydro, coal and natural gas technologies Small Power Projects above 1 MW.
2.5 Regulatory Tools During the period under review, the Authority developed the following tools:
(a) Electricity (Electrical Installation Services) Rules, 2015, - GN No. 404 of 2015. (b) Regulatory tools to facilitate designation of Independent System Operator(ISO) and Independent
Market Operator (IMO) which are Electricity System Operations Corporation (Establishment) Order, 2016; Electricity (System Operations Services) Rules, 2016; Electricity (Market Operations Services) Rules, 2016; Electricity (Tariff Setting) Rules, 2016; System Operator Licence Template; and Market Operator Licence Template;
(c) The Electricity (Development of Small Power Projects) Rules-2016, Small Power Purchase Tariff Orders and Small Power Purchase Agreement.
2.6 Complaints and Dispute Resolutions During the period under review, a total of 25 complaints were attended by the Authority on various
matters raised by customers from the public. Out of these, ten complaints have been closed, two complaints were dismissed, one complaint was settled amicably by the parties and hearing of 12 remaining complaints were on going.
2.7 Health, Safety and Environmental Matters The Authority continued to sensitize electricity service providers on the need to keep their power supply
facilities and workplaces at highest level of safety. The service providers were reminded to disseminate information to the public on the safe use of electricity and abide with HSE when conducting their operations. To ensure compliance to HSE the Authority carried out inspection of power supply facilities, including power stations, substations, and distribution lines and service line entries. Several challenges were noted, including old equipment, low hanging distribution lines, unprotected transformers, and unsatisfactory dangerous clearance of electricity conductors from building structures thus posing risk of electrocutions. The findings of the Authority during inspections were forwarded to the service providers for rectification.
2.8 Key Achievements and Challenges
2.8.1 Achievements The achievements made by the Authority during the period under review include the following: (a) reviewed Second Generation SPP Framework which included technology based Renewable
Feed-in Tariffs (REFITs) for Small Power Projects meant to attract investments in renewable energy. Solar and wind projects will be procured through competitive bidding process. The Authority managed to complete the competitive bidding documents;
(b) increased level of awareness to electrical installation licencees;
19
ANNUAL REPORT FOR THE YEAR ENDED 30TH JUNE, 2016
19
(c) issued 227 electrical installation licences and eight operational licences; (d) established key regulatory tools for better improvements of EWURA regulatory activities; and (e) inspected utility’s distribution infrastructure and submitted the fi ndings to TANESCO for corrective
actions.
2.8.2 Challenges and way forward The following are some of the major challenges the Authority faced during the year under review:
(a) unreliable electricity supply due to infrastructure related problems and lack of generation reserves. The Authority is carrying out regular inspections and has continued to instruct TANESCO to take corrective measures to improve the network; and
(b) despite the fact that the Authority has developed regulatory tools to attract private investments in electricity sub sector the pace of investment is not suffi cient to meet the rapid growing demand. The Authority, in collaboration with the Government and other stakeholders is working on strategies to increase electrification.
ANNUAL REPORT FOR THE YEAR ENDED 30TH JUNE, 2016
2020
3.0 PETROLEUM SECTOR PERFORMANCE AND REGULATION
3.1 Overview The Authority continued to regulate the downstream petroleum sub-sector in Mainland Tanzania,
covering technical and commercial aspects. The regulated service providers include Oil Marketing Companies, Retail Outlets, Lubricants and Liquefi ed Petroleum Gas (LPG) Wholesalers.
EWURA is committed to continuously improve standards of petroleum products and facilities. Furthermore, the Authority continued with its efforts to ensure that there were adequate and stable supplies of petroleum products in the country at all times, and that these products are not sold above the monthly published cap prices.
3.2 Petroleum Products Supply and Stock Monitoring
3.2.1 Petroleum Products Supply
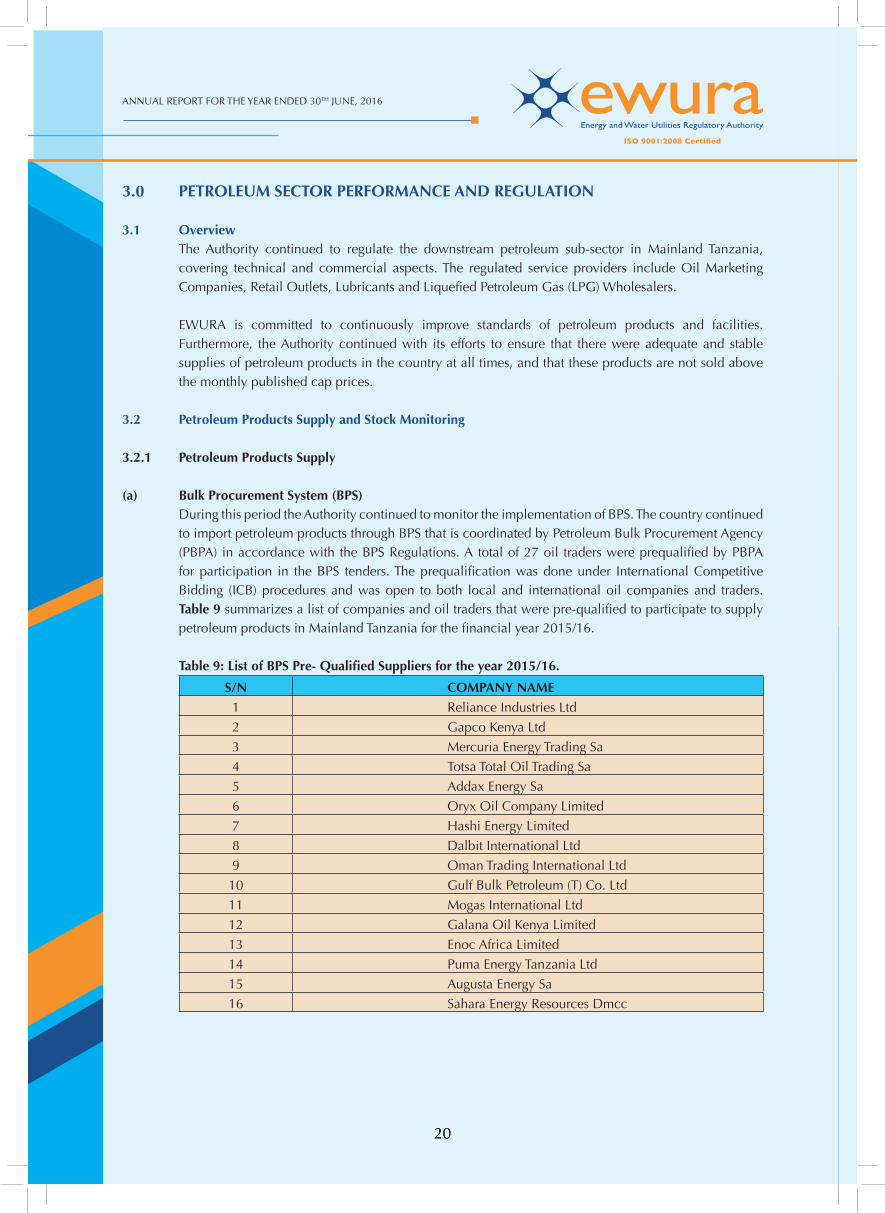
(a) Bulk Procurement System (BPS) During this period the Authority continued to monitor the implementation of BPS. The country continued
to import petroleum products through BPS that is coordinated by Petroleum Bulk Procurement Agency (PBPA) in accordance with the BPS Regulations. A total of 27 oil traders were prequalifi ed by PBPA for participation in the BPS tenders. The prequalifi cation was done under International Competitive Bidding (ICB) procedures and was open to both local and international oil companies and traders. Table 9 summarizes a list of companies and oil traders that were pre-qualifi ed to participate to supply petroleum products in Mainland Tanzania for the fi nancial year 2015/16.
Table 9: List of BPS Pre- Qualifi ed Suppliers for the year 2015/16.
S/N COMPANY NAME1 Reliance Industries Ltd
2 Gapco Kenya Ltd
3 Mercuria Energy Trading Sa
4 Totsa Total Oil Trading Sa
5 Addax Energy Sa
6 Oryx Oil Company Limited
7 Hashi Energy Limited
8 Dalbit International Ltd
9 Oman Trading International Ltd
10 Gulf Bulk Petroleum (T) Co. Ltd
11 Mogas International Ltd
12 Galana Oil Kenya Limited
13 Enoc Africa Limited
14 Puma Energy Tanzania Ltd
15 Augusta Energy Sa
16 Sahara Energy Resources Dmcc
21
ANNUAL REPORT FOR THE YEAR ENDED 30TH JUNE, 2016
21
S/N COMPANY NAME17 Noble Clean Fuels Limited
18 Trafi gura Pte Limited
19 Nimex Petroleum Limited
20 Glencore Energy Uk Ltd
21 Swiss Singapore Overseas Enterprises Pte Ltd
22 Vitol Bahrein E.C
23 Augusta Energy Tanzania Ltd
24 Gapco Tanzania Ltd
25 Soccar Trading Middle East DMCC
26 Bb Energy (Gulf) DMCC
27 Litasco Middle East DMCC
Source: PBPA
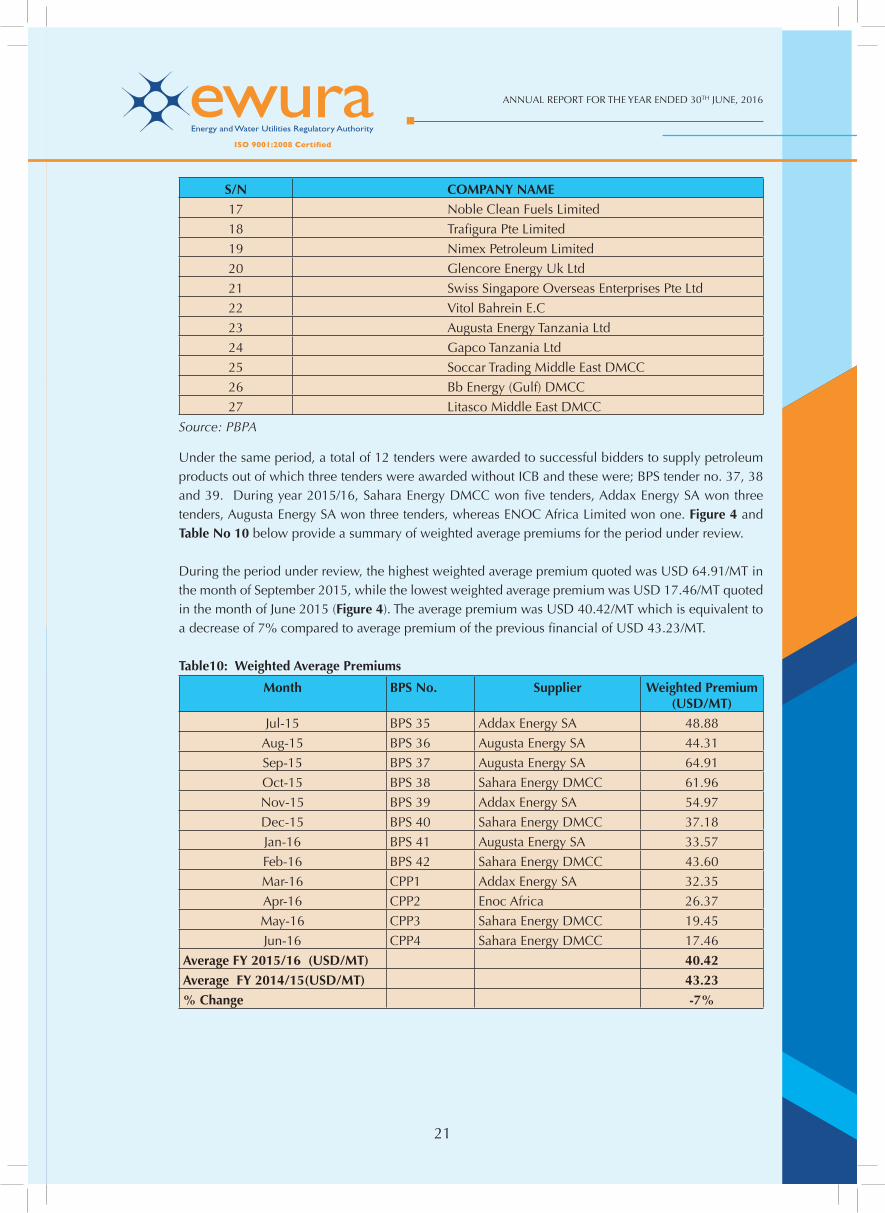
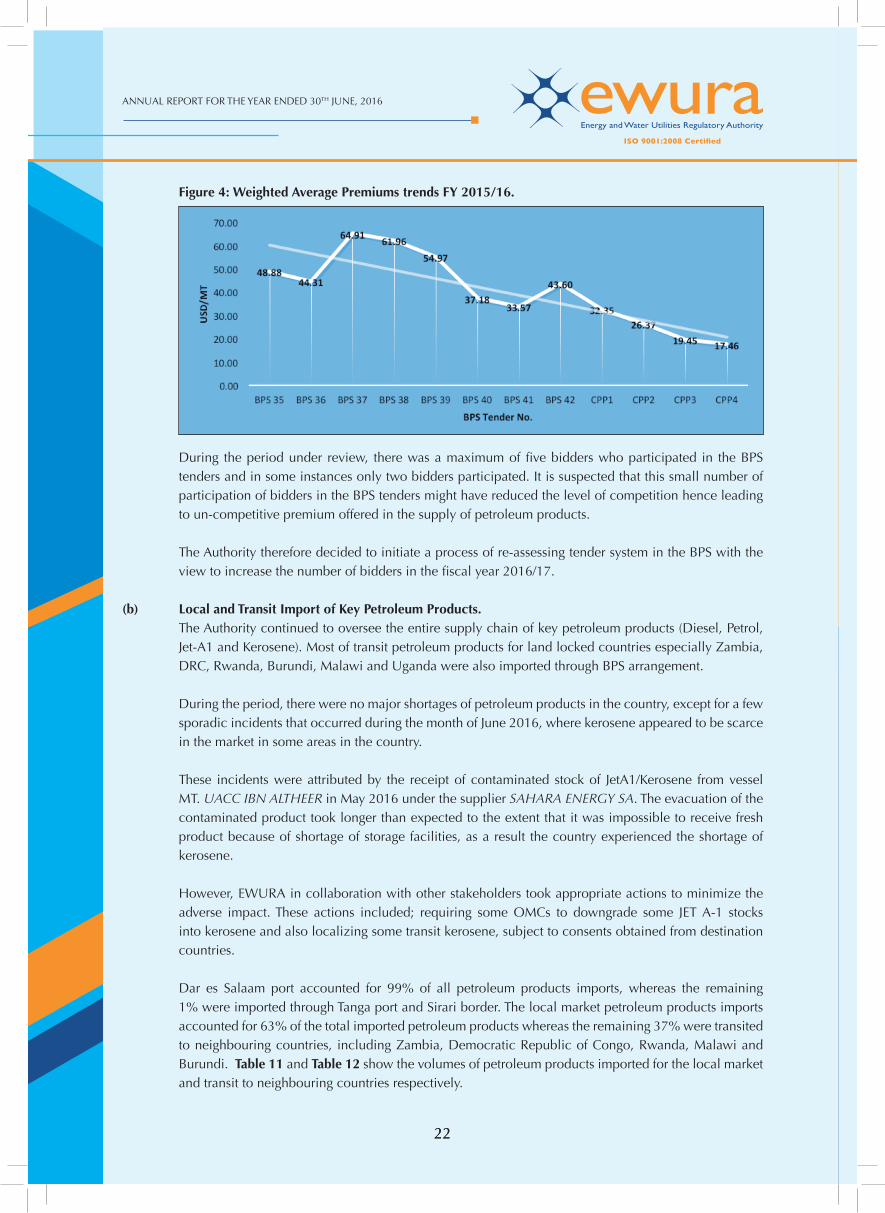
Under the same period, a total of 12 tenders were awarded to successful bidders to supply petroleum products out of which three tenders were awarded without ICB and these were; BPS tender no. 37, 38 and 39. During year 2015/16, Sahara Energy DMCC won fi ve tenders, Addax Energy SA won three tenders, Augusta Energy SA won three tenders, whereas ENOC Africa Limited won one. Figure 4 and Table No 10 below provide a summary of weighted average premiums for the period under review.
During the period under review, the highest weighted average premium quoted was USD 64.91/MT in the month of September 2015, while the lowest weighted average premium was USD 17.46/MT quoted in the month of June 2015 (Figure 4). The average premium was USD 40.42/MT which is equivalent to a decrease of 7% compared to average premium of the previous fi nancial of USD 43.23/MT.
Table10: Weighted Average Premiums
Month BPS No. Supplier Weighted Premium (USD/MT)
Jul-15 BPS 35 Addax Energy SA 48.88
Aug-15 BPS 36 Augusta Energy SA 44.31
Sep-15 BPS 37 Augusta Energy SA 64.91
Oct-15 BPS 38 Sahara Energy DMCC 61.96
Nov-15 BPS 39 Addax Energy SA 54.97
Dec-15 BPS 40 Sahara Energy DMCC 37.18
Jan-16 BPS 41 Augusta Energy SA 33.57
Feb-16 BPS 42 Sahara Energy DMCC 43.60
Mar-16 CPP1 Addax Energy SA 32.35
Apr-16 CPP2 Enoc Africa 26.37
May-16 CPP3 Sahara Energy DMCC 19.45
Jun-16 CPP4 Sahara Energy DMCC 17.46
Average FY 2015/16 (USD/MT) 40.42
Average FY 2014/15(USD/MT) 43.23
% Change -7%
ANNUAL REPORT FOR THE YEAR ENDED 30TH JUNE, 2016
2222
Figure 4: Weighted Average Premiums trends FY 2015/16.
During the period under review, there was a maximum of fi ve bidders who participated in the BPS tenders and in some instances only two bidders participated. It is suspected that this small number of participation of bidders in the BPS tenders might have reduced the level of competition hence leading to un-competitive premium offered in the supply of petroleum products.
The Authority therefore decided to initiate a process of re-assessing tender system in the BPS with the view to increase the number of bidders in the fi scal year 2016/17.
(b) Local and Transit Import of Key Petroleum Products. The Authority continued to oversee the entire supply chain of key petroleum products (Diesel, Petrol,
Jet-A1 and Kerosene). Most of transit petroleum products for land locked countries especially Zambia, DRC, Rwanda, Burundi, Malawi and Uganda were also imported through BPS arrangement.
During the period, there were no major shortages of petroleum products in the country, except for a few sporadic incidents that occurred during the month of June 2016, where kerosene appeared to be scarce in the market in some areas in the country.
These incidents were attributed by the receipt of contaminated stock of JetA1/Kerosene from vessel MT. UACC IBN ALTHEER in May 2016 under the supplier SAHARA ENERGY SA. The evacuation of the contaminated product took longer than expected to the extent that it was impossible to receive fresh product because of shortage of storage facilities, as a result the country experienced the shortage of kerosene.
However, EWURA in collaboration with other stakeholders took appropriate actions to minimize the adverse impact. These actions included; requiring some OMCs to downgrade some JET A-1 stocks into kerosene and also localizing some transit kerosene, subject to consents obtained from destination countries.
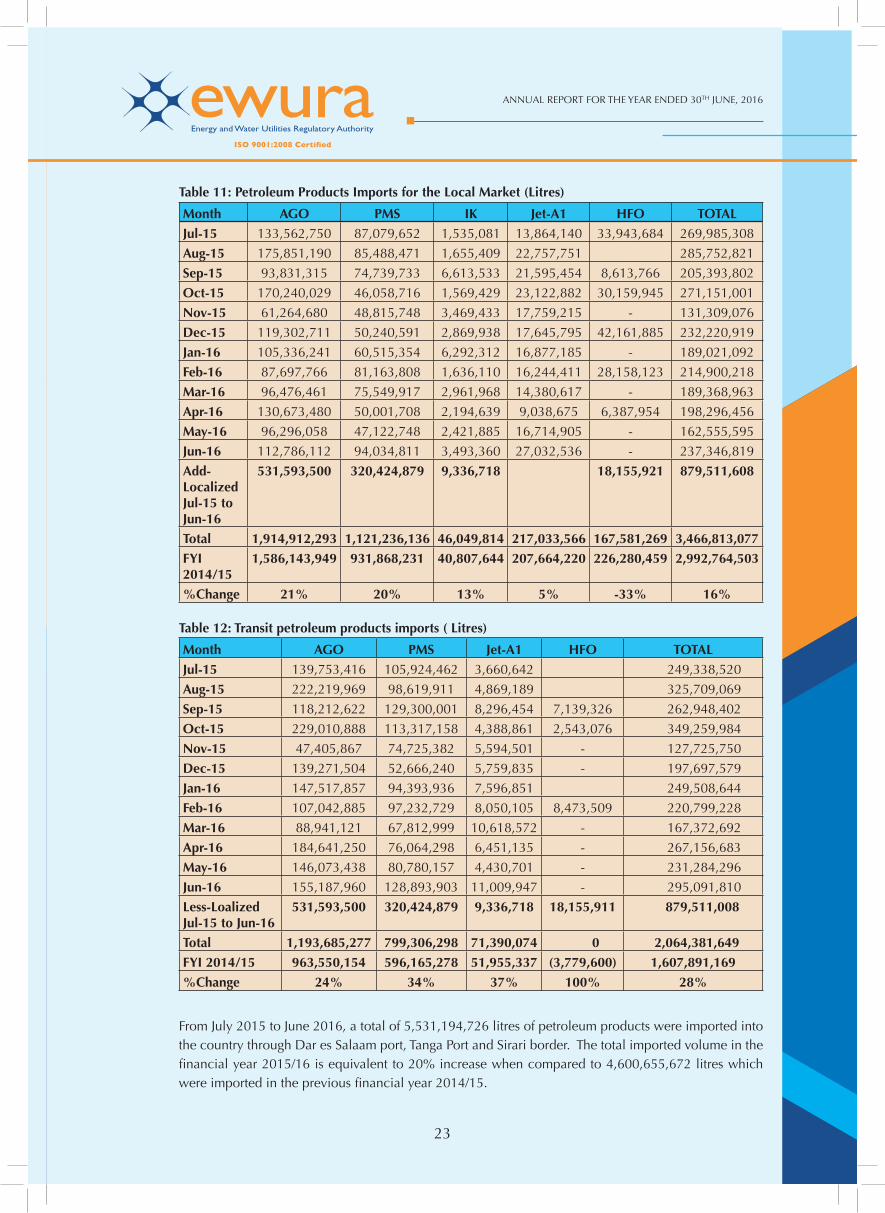
Dar es Salaam port accounted for 99% of all petroleum products imports, whereas the remaining 1% were imported through Tanga port and Sirari border. The local market petroleum products imports accounted for 63% of the total imported petroleum products whereas the remaining 37% were transited to neighbouring countries, including Zambia, Democratic Republic of Congo, Rwanda, Malawi and Burundi. Table 11 and Table 12 show the volumes of petroleum products imported for the local market and transit to neighbouring countries respectively.
23
ANNUAL REPORT FOR THE YEAR ENDED 30TH JUNE, 2016
23
Table 11: Petroleum Products Imports for the Local Market (Litres)
Month AGO PMS IK Jet-A1 HFO TOTAL
Jul-15 133,562,750 87,079,652 1,535,081 13,864,140 33,943,684 269,985,308
Aug-15 175,851,190 85,488,471 1,655,409 22,757,751 285,752,821
Sep-15 93,831,315 74,739,733 6,613,533 21,595,454 8,613,766 205,393,802
Oct-15 170,240,029 46,058,716 1,569,429 23,122,882 30,159,945 271,151,001
Nov-15 61,264,680 48,815,748 3,469,433 17,759,215 - 131,309,076
Dec-15 119,302,711 50,240,591 2,869,938 17,645,795 42,161,885 232,220,919
Jan-16 105,336,241 60,515,354 6,292,312 16,877,185 - 189,021,092
Feb-16 87,697,766 81,163,808 1,636,110 16,244,411 28,158,123 214,900,218
Mar-16 96,476,461 75,549,917 2,961,968 14,380,617 - 189,368,963
Apr-16 130,673,480 50,001,708 2,194,639 9,038,675 6,387,954 198,296,456
May-16 96,296,058 47,122,748 2,421,885 16,714,905 - 162,555,595
Jun-16 112,786,112 94,034,811 3,493,360 27,032,536 - 237,346,819
Add-Localized Jul-15 to Jun-16
531,593,500 320,424,879 9,336,718 18,155,921 879,511,608
Total 1,914,912,293 1,121,236,136 46,049,814 217,033,566 167,581,269 3,466,813,077
FYI 2014/15
1,586,143,949 931,868,231 40,807,644 207,664,220 226,280,459 2,992,764,503
%Change 21% 20% 13% 5% -33% 16%
Table 12: Transit petroleum products imports ( Litres)
Month AGO PMS Jet-A1 HFO TOTAL
Jul-15 139,753,416 105,924,462 3,660,642 249,338,520
Aug-15 222,219,969 98,619,911 4,869,189 325,709,069
Sep-15 118,212,622 129,300,001 8,296,454 7,139,326 262,948,402
Oct-15 229,010,888 113,317,158 4,388,861 2,543,076 349,259,984
Nov-15 47,405,867 74,725,382 5,594,501 - 127,725,750
Dec-15 139,271,504 52,666,240 5,759,835 - 197,697,579
Jan-16 147,517,857 94,393,936 7,596,851 249,508,644
Feb-16 107,042,885 97,232,729 8,050,105 8,473,509 220,799,228
Mar-16 88,941,121 67,812,999 10,618,572 - 167,372,692
Apr-16 184,641,250 76,064,298 6,451,135 - 267,156,683
May-16 146,073,438 80,780,157 4,430,701 - 231,284,296
Jun-16 155,187,960 128,893,903 11,009,947 - 295,091,810
Less-Loalized Jul-15 to Jun-16
531,593,500 320,424,879 9,336,718 18,155,911 879,511,008
Total 1,193,685,277 799,306,298 71,390,074 0 2,064,381,649
FYI 2014/15 963,550,154 596,165,278 51,955,337 (3,779,600) 1,607,891,169
%Change 24% 34% 37% 100% 28%
From July 2015 to June 2016, a total of 5,531,194,726 litres of petroleum products were imported into the country through Dar es Salaam port, Tanga Port and Sirari border. The total imported volume in the fi nancial year 2015/16 is equivalent to 20% increase when compared to 4,600,655,672 litres which were imported in the previous fi nancial year 2014/15.
ANNUAL REPORT FOR THE YEAR ENDED 30TH JUNE, 2016
2424
On the other hand, the total imported volume for local consumption was 3,480,324,018 litres equivalent to an increase of 16% when compared to 2,992,764,503 litres imported in the previous fi nancial year 2014/15.
Likewise, the total imported volume for transit purpose was 2,050,870,708 litres equivalent to an increase of 28% when compared to 1,607,891,169 litres imported in the previous fi nancial year 2014/15. Such signifi cant increase in transit imports can be explained by the fact that, apart from improved level of economic activities which consume petroleum products, transparent and cost effective BPS tendering process, improvement in port’s effi ciency especially SBM performance and the closure of Zambia Refi nery, were some of the key driving factors for the increase.
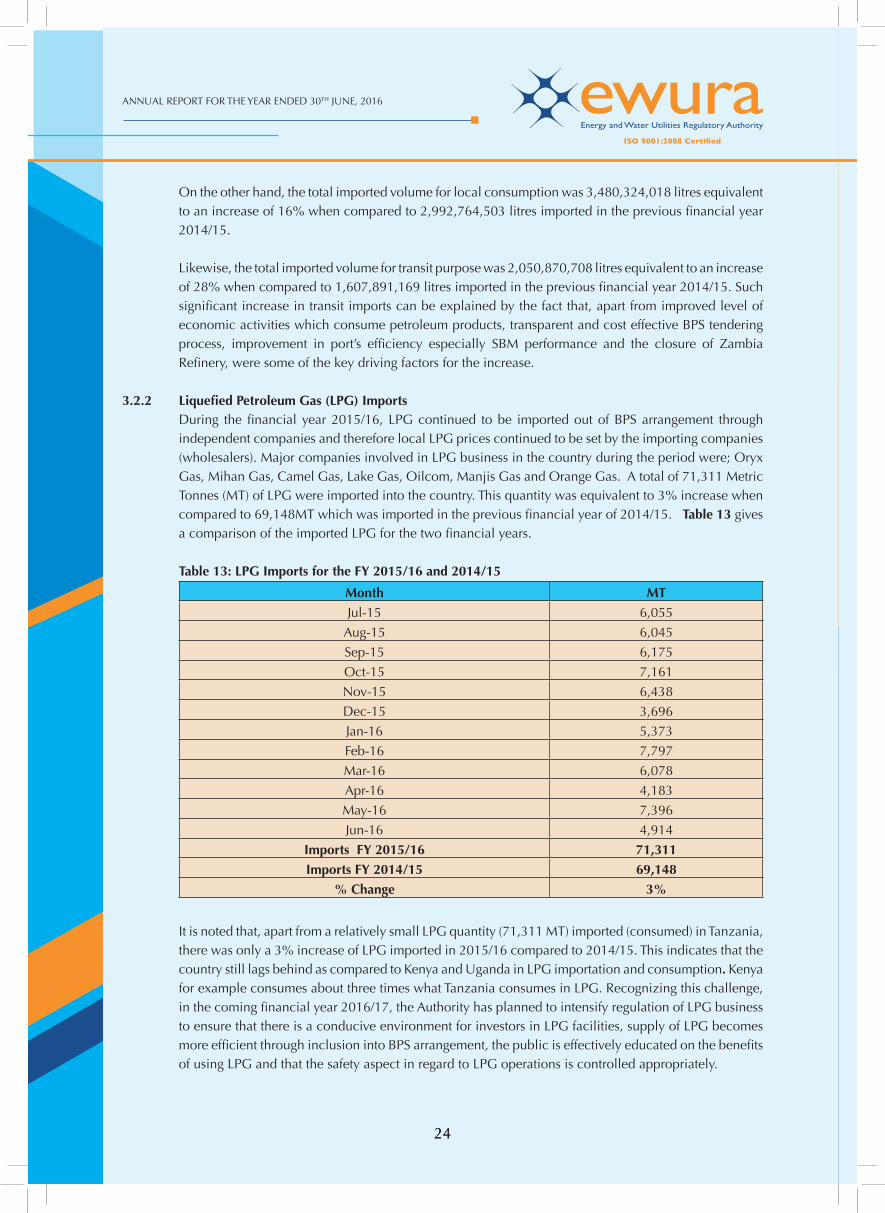
3.2.2 Liquefi ed Petroleum Gas (LPG) Imports During the fi nancial year 2015/16, LPG continued to be imported out of BPS arrangement through
independent companies and therefore local LPG prices continued to be set by the importing companies (wholesalers). Major companies involved in LPG business in the country during the period were; Oryx Gas, Mihan Gas, Camel Gas, Lake Gas, Oilcom, Manjis Gas and Orange Gas. A total of 71,311 Metric Tonnes (MT) of LPG were imported into the country. This quantity was equivalent to 3% increase when compared to 69,148MT which was imported in the previous fi nancial year of 2014/15. Table 13 gives a comparison of the imported LPG for the two fi nancial years.
Table 13: LPG Imports for the FY 2015/16 and 2014/15
Month MTJul-15 6,055
Aug-15 6,045
Sep-15 6,175
Oct-15 7,161
Nov-15 6,438
Dec-15 3,696
Jan-16 5,373
Feb-16 7,797
Mar-16 6,078
Apr-16 4,183
May-16 7,396
Jun-16 4,914
Imports FY 2015/16 71,311
Imports FY 2014/15 69,148
% Change 3%
It is noted that, apart from a relatively small LPG quantity (71,311 MT) imported (consumed) in Tanzania,
there was only a 3% increase of LPG imported in 2015/16 compared to 2014/15. This indicates that the country still lags behind as compared to Kenya and Uganda in LPG importation and consumption. Kenya for example consumes about three times what Tanzania consumes in LPG. Recognizing this challenge, in the coming fi nancial year 2016/17, the Authority has planned to intensify regulation of LPG business to ensure that there is a conducive environment for investors in LPG facilities, supply of LPG becomes more effi cient through inclusion into BPS arrangement, the public is effectively educated on the benefi ts of using LPG and that the safety aspect in regard to LPG operations is controlled appropriately.
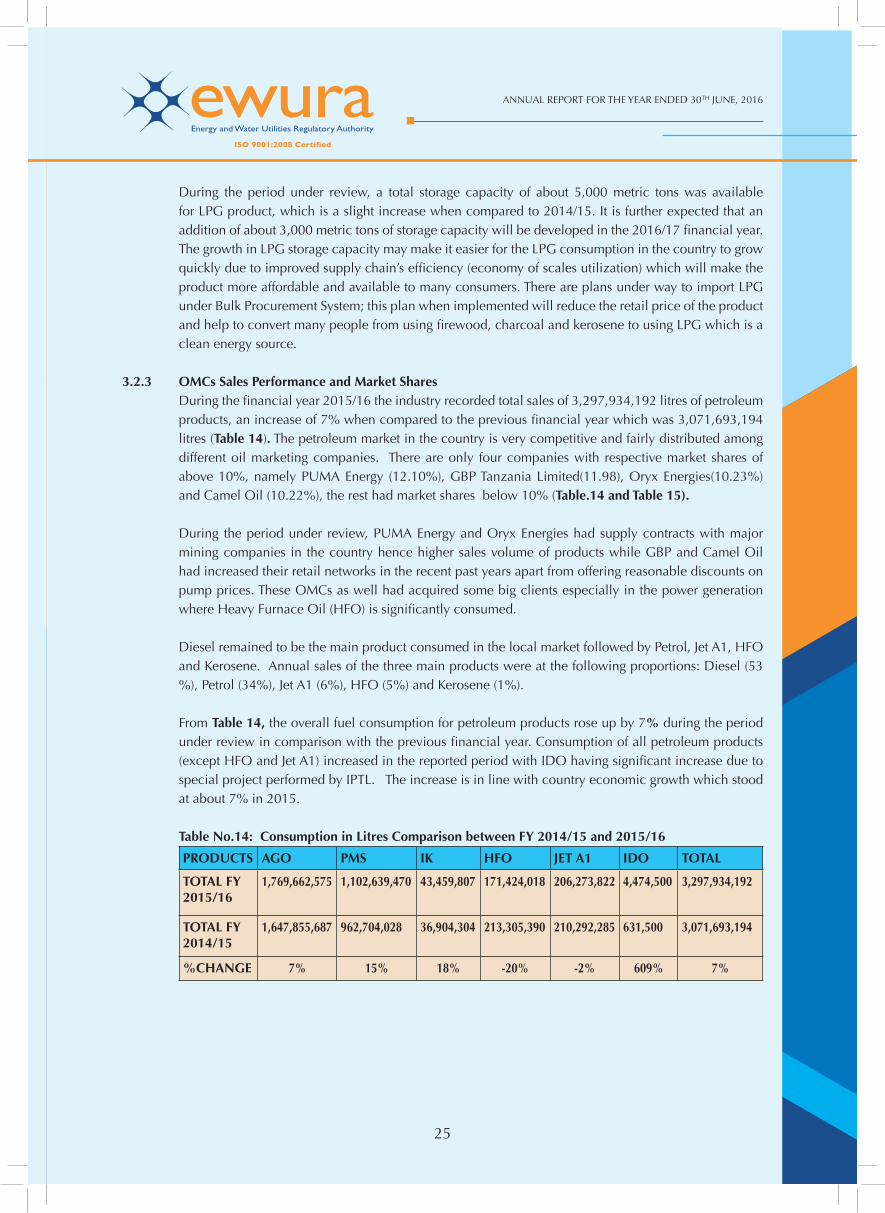
25
ANNUAL REPORT FOR THE YEAR ENDED 30TH JUNE, 2016
25
During the period under review, a total storage capacity of about 5,000 metric tons was available for LPG product, which is a slight increase when compared to 2014/15. It is further expected that an addition of about 3,000 metric tons of storage capacity will be developed in the 2016/17 fi nancial year. The growth in LPG storage capacity may make it easier for the LPG consumption in the country to grow quickly due to improved supply chain’s effi ciency (economy of scales utilization) which will make the product more affordable and available to many consumers. There are plans under way to import LPG under Bulk Procurement System; this plan when implemented will reduce the retail price of the product and help to convert many people from using fi rewood, charcoal and kerosene to using LPG which is a clean energy source.
3.2.3 OMCs Sales Performance and Market Shares During the fi nancial year 2015/16 the industry recorded total sales of 3,297,934,192 litres of petroleum
products, an increase of 7% when compared to the previous fi nancial year which was 3,071,693,194 litres (Table 14). The petroleum market in the country is very competitive and fairly distributed among different oil marketing companies. There are only four companies with respective market shares of above 10%, namely PUMA Energy (12.10%), GBP Tanzania Limited(11.98), Oryx Energies(10.23%) and Camel Oil (10.22%), the rest had market shares below 10% (Table.14 and Table 15).
During the period under review, PUMA Energy and Oryx Energies had supply contracts with major mining companies in the country hence higher sales volume of products while GBP and Camel Oil had increased their retail networks in the recent past years apart from offering reasonable discounts on pump prices. These OMCs as well had acquired some big clients especially in the power generation where Heavy Furnace Oil (HFO) is signifi cantly consumed.
Diesel remained to be the main product consumed in the local market followed by Petrol, Jet A1, HFO and Kerosene. Annual sales of the three main products were at the following proportions: Diesel (53 %), Petrol (34%), Jet A1 (6%), HFO (5%) and Kerosene (1%).
From Table 14, the overall fuel consumption for petroleum products rose up by 7% during the period under review in comparison with the previous fi nancial year. Consumption of all petroleum products (except HFO and Jet A1) increased in the reported period with IDO having signifi cant increase due to special project performed by IPTL. The increase is in line with country economic growth which stood at about 7% in 2015.
Table No.14: Consumption in Litres Comparison between FY 2014/15 and 2015/16
PRODUCTS AGO PMS IK HFO JET A1 IDO TOTAL
TOTAL FY 2015/16
1,769,662,575 1,102,639,470 43,459,807 171,424,018 206,273,822 4,474,500 3,297,934,192
TOTAL FY 2014/15
1,647,855,687 962,704,028 36,904,304 213,305,390 210,292,285 631,500 3,071,693,194
%CHANGE 7% 15% 18% -20% -2% 609% 7%
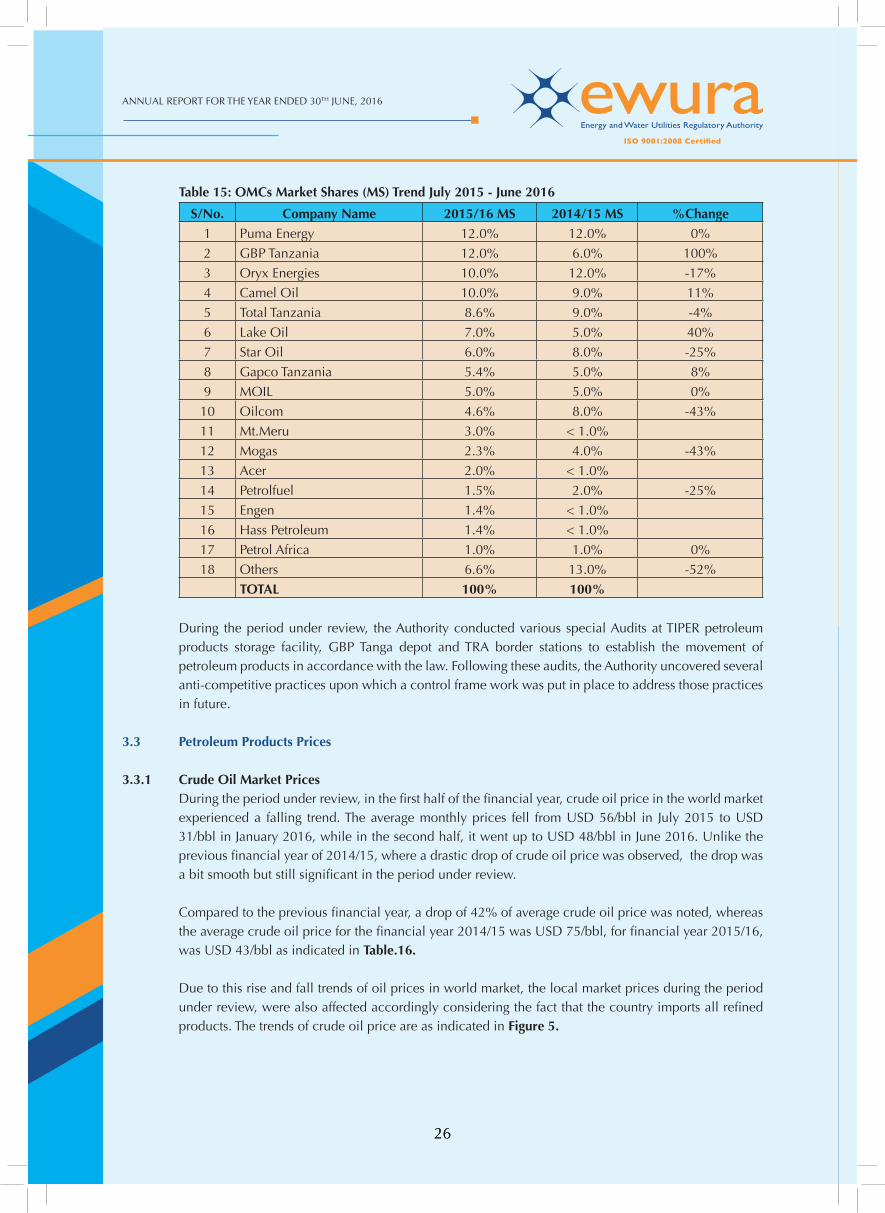
ANNUAL REPORT FOR THE YEAR ENDED 30TH JUNE, 2016
2626
Table 15: OMCs Market Shares (MS) Trend July 2015 - June 2016
S/No. Company Name 2015/16 MS 2014/15 MS %Change1 Puma Energy 12.0% 12.0% 0%
2 GBP Tanzania 12.0% 6.0% 100%
3 Oryx Energies 10.0% 12.0% -17%
4 Camel Oil 10.0% 9.0% 11%
5 Total Tanzania 8.6% 9.0% -4%
6 Lake Oil 7.0% 5.0% 40%
7 Star Oil 6.0% 8.0% -25%
8 Gapco Tanzania 5.4% 5.0% 8%
9 MOIL 5.0% 5.0% 0%
10 Oilcom 4.6% 8.0% -43%
11 Mt.Meru 3.0% < 1.0%
12 Mogas 2.3% 4.0% -43%
13 Acer 2.0% < 1.0%
14 Petrolfuel 1.5% 2.0% -25%
15 Engen 1.4% < 1.0%
16 Hass Petroleum 1.4% < 1.0%
17 Petrol Africa 1.0% 1.0% 0%
18 Others 6.6% 13.0% -52%
TOTAL 100% 100%
During the period under review, the Authority conducted various special Audits at TIPER petroleum products storage facility, GBP Tanga depot and TRA border stations to establish the movement of petroleum products in accordance with the law. Following these audits, the Authority uncovered several anti-competitive practices upon which a control frame work was put in place to address those practices in future.
3.3 Petroleum Products Prices
3.3.1 Crude Oil Market Prices During the period under review, in the fi rst half of the fi nancial year, crude oil price in the world market
experienced a falling trend. The average monthly prices fell from USD 56/bbl in July 2015 to USD 31/bbl in January 2016, while in the second half, it went up to USD 48/bbl in June 2016. Unlike the previous fi nancial year of 2014/15, where a drastic drop of crude oil price was observed, the drop was a bit smooth but still signifi cant in the period under review.
Compared to the previous fi nancial year, a drop of 42% of average crude oil price was noted, whereas the average crude oil price for the fi nancial year 2014/15 was USD 75/bbl, for fi nancial year 2015/16, was USD 43/bbl as indicated in Table.16.
Due to this rise and fall trends of oil prices in world market, the local market prices during the period under review, were also affected accordingly considering the fact that the country imports all refi ned products. The trends of crude oil price are as indicated in Figure 5.
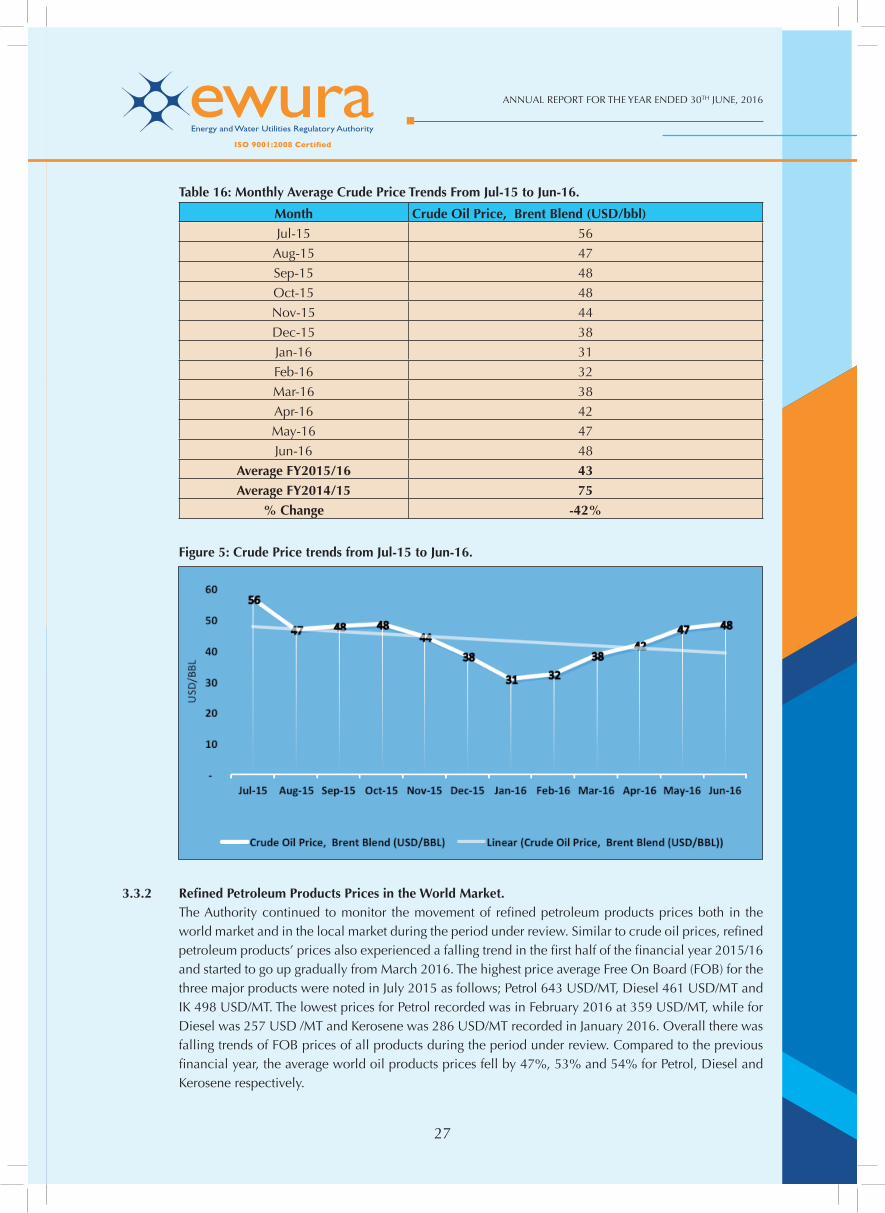
27
ANNUAL REPORT FOR THE YEAR ENDED 30TH JUNE, 2016
27
Table 16: Monthly Average Crude Price Trends From Jul-15 to Jun-16.
Month Crude Oil Price, Brent Blend (USD/bbl)Jul-15 56
Aug-15 47
Sep-15 48
Oct-15 48
Nov-15 44
Dec-15 38
Jan-16 31
Feb-16 32
Mar-16 38
Apr-16 42
May-16 47
Jun-16 48
Average FY2015/16 43
Average FY2014/15 75
% Change -42%
Figure 5: Crude Price trends from Jul-15 to Jun-16.
3.3.2 Refi ned Petroleum Products Prices in the World Market. The Authority continued to monitor the movement of refi ned petroleum products prices both in the
world market and in the local market during the period under review. Similar to crude oil prices, refi ned petroleum products’ prices also experienced a falling trend in the fi rst half of the fi nancial year 2015/16 and started to go up gradually from March 2016. The highest price average Free On Board (FOB) for the three major products were noted in July 2015 as follows; Petrol 643 USD/MT, Diesel 461 USD/MT and IK 498 USD/MT. The lowest prices for Petrol recorded was in February 2016 at 359 USD/MT, while for Diesel was 257 USD /MT and Kerosene was 286 USD/MT recorded in January 2016. Overall there was falling trends of FOB prices of all products during the period under review. Compared to the previous fi nancial year, the average world oil products prices fell by 47%, 53% and 54% for Petrol, Diesel and Kerosene respectively.
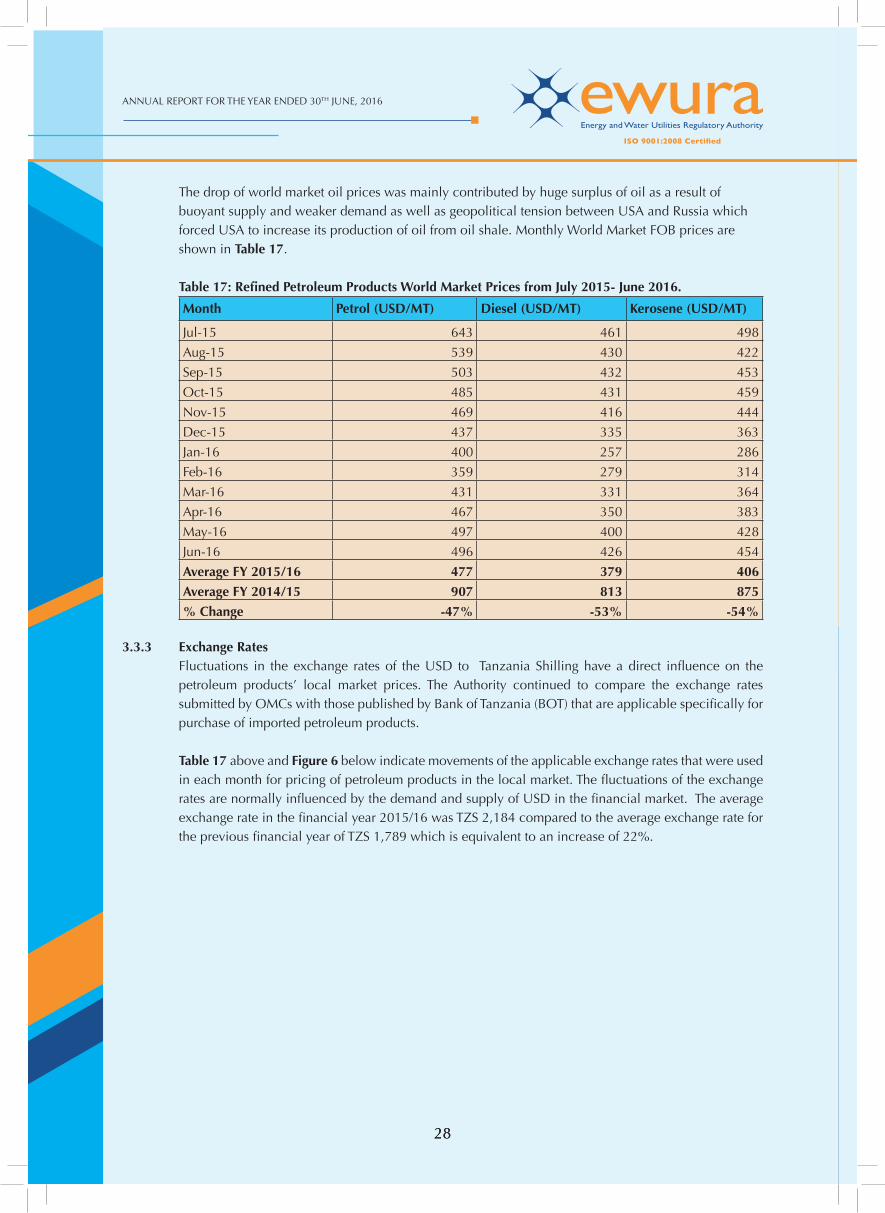
ANNUAL REPORT FOR THE YEAR ENDED 30TH JUNE, 2016
2828
The drop of world market oil prices was mainly contributed by huge surplus of oil as a result of buoyant supply and weaker demand as well as geopolitical tension between USA and Russia which forced USA to increase its production of oil from oil shale. Monthly World Market FOB prices are shown in Table 17.
Table 17: Refi ned Petroleum Products World Market Prices from July 2015- June 2016.
Month Petrol (USD/MT) Diesel (USD/MT) Kerosene (USD/MT)
Jul-15 643 461 498
Aug-15 539 430 422
Sep-15 503 432 453
Oct-15 485 431 459
Nov-15 469 416 444
Dec-15 437 335 363
Jan-16 400 257 286
Feb-16 359 279 314
Mar-16 431 331 364
Apr-16 467 350 383
May-16 497 400 428
Jun-16 496 426 454
Average FY 2015/16 477 379 406
Average FY 2014/15 907 813 875
% Change -47% -53% -54%
3.3.3 Exchange Rates Fluctuations in the exchange rates of the USD to Tanzania Shilling have a direct infl uence on the
petroleum products’ local market prices. The Authority continued to compare the exchange rates submitted by OMCs with those published by Bank of Tanzania (BOT) that are applicable specifi cally for purchase of imported petroleum products.
Table 17 above and Figure 6 below indicate movements of the applicable exchange rates that were used in each month for pricing of petroleum products in the local market. The fl uctuations of the exchange rates are normally infl uenced by the demand and supply of USD in the fi nancial market. The average exchange rate in the fi nancial year 2015/16 was TZS 2,184 compared to the average exchange rate for the previous fi nancial year of TZS 1,789 which is equivalent to an increase of 22%.
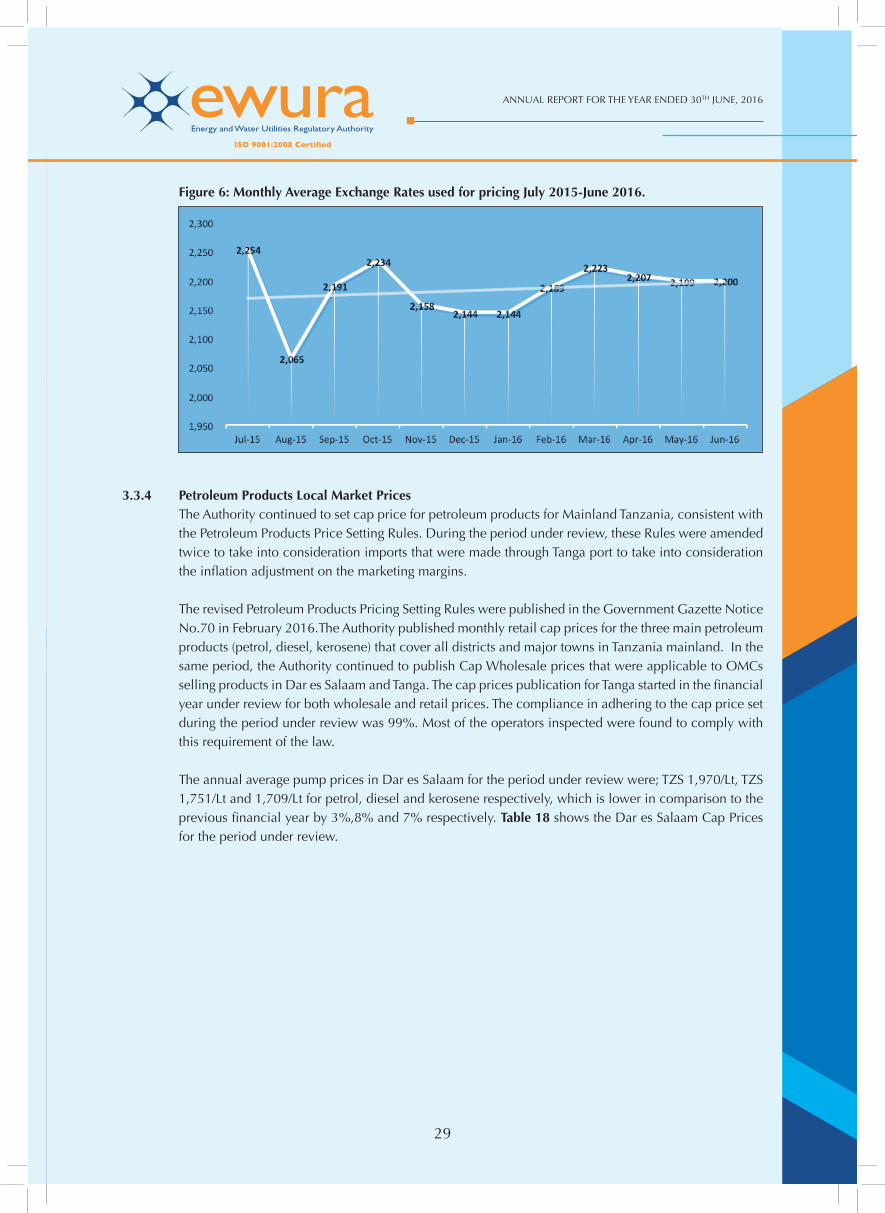
29
ANNUAL REPORT FOR THE YEAR ENDED 30TH JUNE, 2016
29
Figure 6: Monthly Average Exchange Rates used for pricing July 2015-June 2016.
3.3.4 Petroleum Products Local Market Prices The Authority continued to set cap price for petroleum products for Mainland Tanzania, consistent with
the Petroleum Products Price Setting Rules. During the period under review, these Rules were amended twice to take into consideration imports that were made through Tanga port to take into consideration the infl ation adjustment on the marketing margins.
The revised Petroleum Products Pricing Setting Rules were published in the Government Gazette Notice No.70 in February 2016.The Authority published monthly retail cap prices for the three main petroleum products (petrol, diesel, kerosene) that cover all districts and major towns in Tanzania mainland. In the same period, the Authority continued to publish Cap Wholesale prices that were applicable to OMCs selling products in Dar es Salaam and Tanga. The cap prices publication for Tanga started in the fi nancial year under review for both wholesale and retail prices. The compliance in adhering to the cap price set during the period under review was 99%. Most of the operators inspected were found to comply with this requirement of the law.
The annual average pump prices in Dar es Salaam for the period under review were; TZS 1,970/Lt, TZS 1,751/Lt and 1,709/Lt for petrol, diesel and kerosene respectively, which is lower in comparison to the previous fi nancial year by 3%,8% and 7% respectively. Table 18 shows the Dar es Salaam Cap Prices for the period under review.
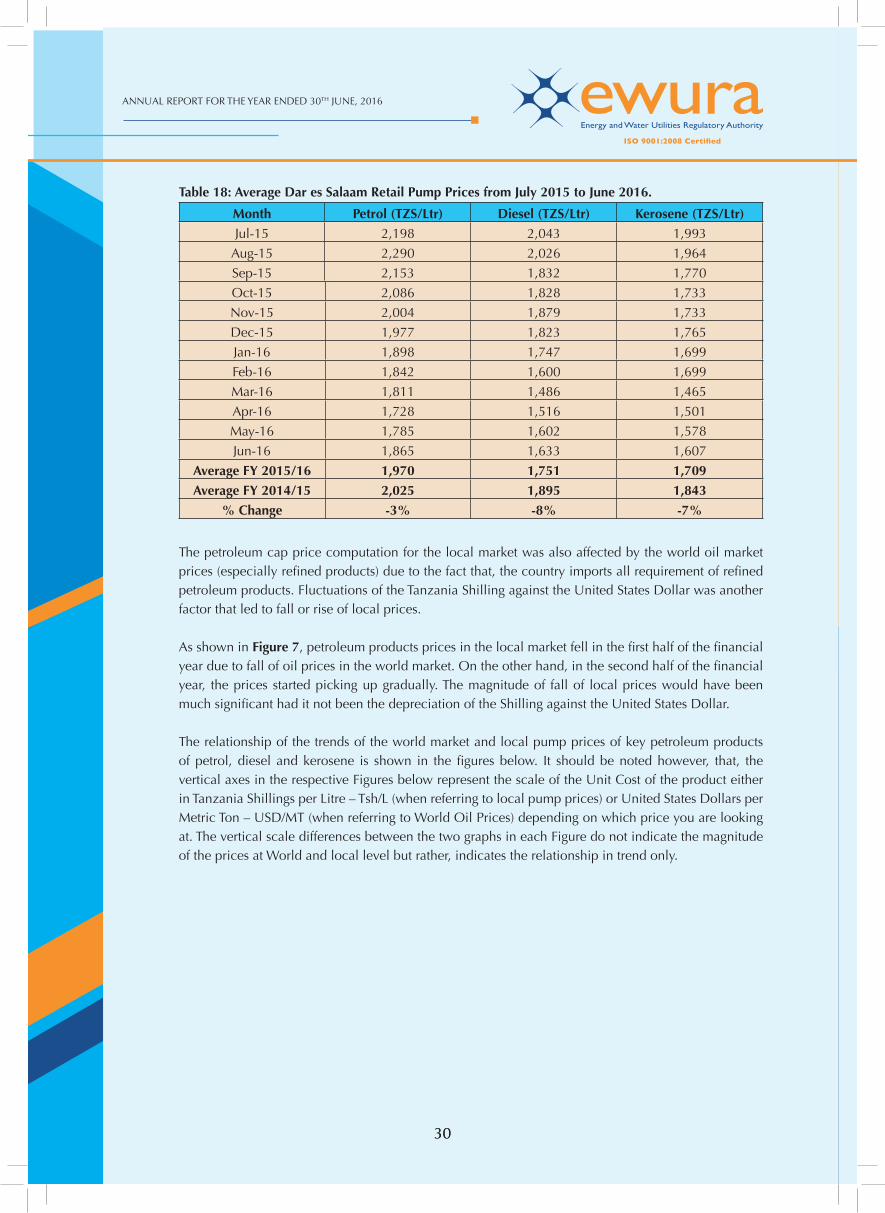
ANNUAL REPORT FOR THE YEAR ENDED 30TH JUNE, 2016
3030
Table 18: Average Dar es Salaam Retail Pump Prices from July 2015 to June 2016.
Month Petrol (TZS/Ltr) Diesel (TZS/Ltr) Kerosene (TZS/Ltr)Jul-15 2,198 2,043 1,993
Aug-15 2,290 2,026 1,964
Sep-15 2,153 1,832 1,770
Oct-15 2,086 1,828 1,733
Nov-15 2,004 1,879 1,733
Dec-15 1,977 1,823 1,765
Jan-16 1,898 1,747 1,699
Feb-16 1,842 1,600 1,699
Mar-16 1,811 1,486 1,465
Apr-16 1,728 1,516 1,501
May-16 1,785 1,602 1,578
Jun-16 1,865 1,633 1,607
Average FY 2015/16 1,970 1,751 1,709
Average FY 2014/15 2,025 1,895 1,843
% Change -3% -8% -7%
The petroleum cap price computation for the local market was also affected by the world oil market prices (especially refi ned products) due to the fact that, the country imports all requirement of refi ned petroleum products. Fluctuations of the Tanzania Shilling against the United States Dollar was another factor that led to fall or rise of local prices.
As shown in Figure 7, petroleum products prices in the local market fell in the fi rst half of the fi nancial year due to fall of oil prices in the world market. On the other hand, in the second half of the fi nancial year, the prices started picking up gradually. The magnitude of fall of local prices would have been much signifi cant had it not been the depreciation of the Shilling against the United States Dollar.
The relationship of the trends of the world market and local pump prices of key petroleum products of petrol, diesel and kerosene is shown in the fi gures below. It should be noted however, that, the vertical axes in the respective Figures below represent the scale of the Unit Cost of the product either in Tanzania Shillings per Litre – Tsh/L (when referring to local pump prices) or United States Dollars per Metric Ton – USD/MT (when referring to World Oil Prices) depending on which price you are looking at. The vertical scale differences between the two graphs in each Figure do not indicate the magnitude of the prices at World and local level but rather, indicates the relationship in trend only.
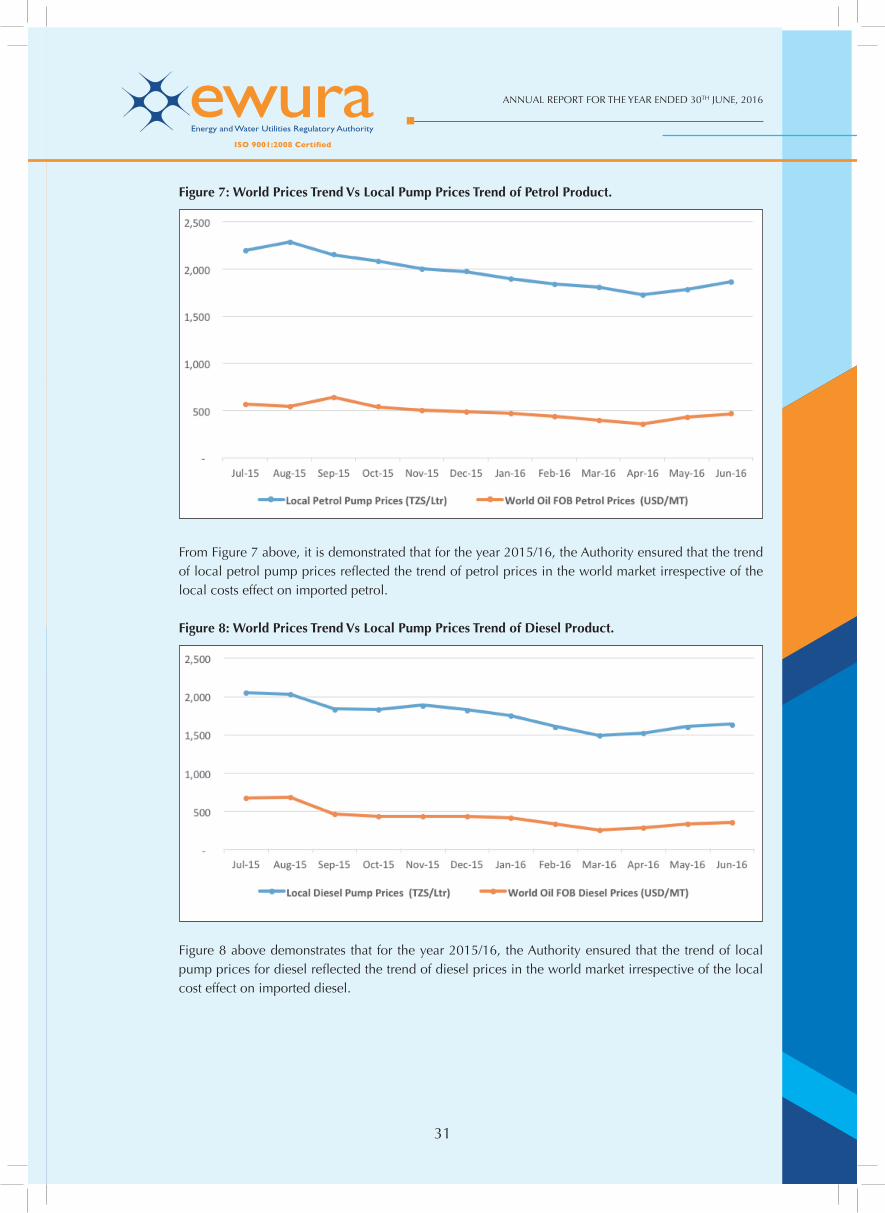
31
ANNUAL REPORT FOR THE YEAR ENDED 30TH JUNE, 2016
31
Figure 7: World Prices Trend Vs Local Pump Prices Trend of Petrol Product.
From Figure 7 above, it is demonstrated that for the year 2015/16, the Authority ensured that the trend
of local petrol pump prices refl ected the trend of petrol prices in the world market irrespective of the local costs effect on imported petrol.
Figure 8: World Prices Trend Vs Local Pump Prices Trend of Diesel Product.
Figure 8 above demonstrates that for the year 2015/16, the Authority ensured that the trend of local pump prices for diesel refl ected the trend of diesel prices in the world market irrespective of the local cost effect on imported diesel.
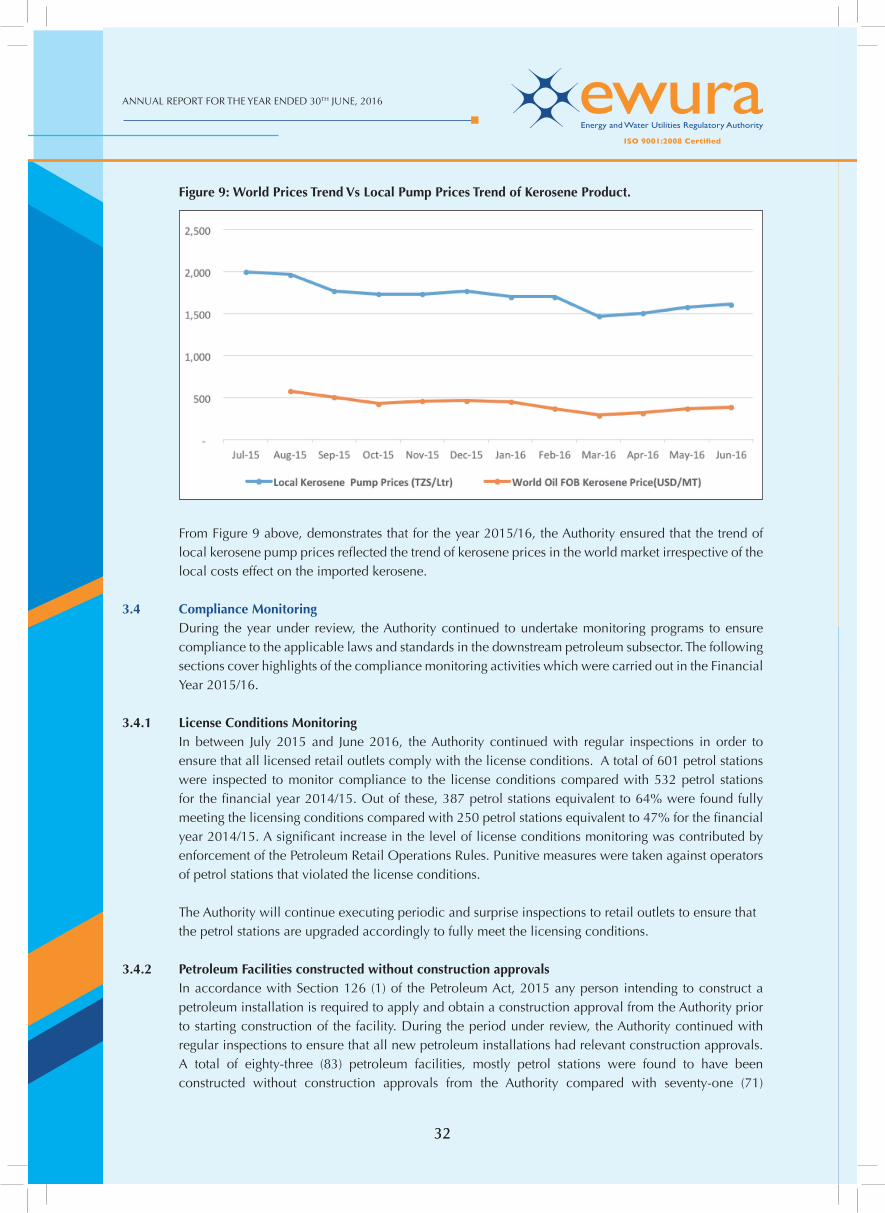
ANNUAL REPORT FOR THE YEAR ENDED 30TH JUNE, 2016
3232
Figure 9: World Prices Trend Vs Local Pump Prices Trend of Kerosene Product.
From Figure 9 above, demonstrates that for the year 2015/16, the Authority ensured that the trend of
local kerosene pump prices refl ected the trend of kerosene prices in the world market irrespective of the local costs effect on the imported kerosene.
3.4 Compliance Monitoring During the year under review, the Authority continued to undertake monitoring programs to ensure
compliance to the applicable laws and standards in the downstream petroleum subsector. The following sections cover highlights of the compliance monitoring activities which were carried out in the Financial Year 2015/16.
3.4.1 License Conditions Monitoring In between July 2015 and June 2016, the Authority continued with regular inspections in order to
ensure that all licensed retail outlets comply with the license conditions. A total of 601 petrol stations were inspected to monitor compliance to the license conditions compared with 532 petrol stations for the fi nancial year 2014/15. Out of these, 387 petrol stations equivalent to 64% were found fully meeting the licensing conditions compared with 250 petrol stations equivalent to 47% for the fi nancial year 2014/15. A signifi cant increase in the level of license conditions monitoring was contributed by enforcement of the Petroleum Retail Operations Rules. Punitive measures were taken against operators of petrol stations that violated the license conditions.
The Authority will continue executing periodic and surprise inspections to retail outlets to ensure that the petrol stations are upgraded accordingly to fully meet the licensing conditions.
3.4.2 Petroleum Facilities constructed without construction approvals In accordance with Section 126 (1) of the Petroleum Act, 2015 any person intending to construct a
petroleum installation is required to apply and obtain a construction approval from the Authority prior to starting construction of the facility. During the period under review, the Authority continued with regular inspections to ensure that all new petroleum installations had relevant construction approvals. A total of eighty-three (83) petroleum facilities, mostly petrol stations were found to have been constructed without construction approvals from the Authority compared with seventy-one (71)
33
ANNUAL REPORT FOR THE YEAR ENDED 30TH JUNE, 2016
33
petroleum facilities for the fi nancial year 2014/2015, an increase of 17%. Punitive measures were taken against defaulters.
3.4.3 Petroleum Products Quality Monitoring From July 2015 to June 2016 the Authority continued with its role of monitoring quality of petroleum
products so as to ensure that required quality petroleum products were offered for sale to consumers. Sampling of petroleum products was carried out from various facilities including petrol stations, road tankers, storage depots and Kurasini Oil Jetty.
A total of 321 samples of petroleum products were collected from the above mentioned facilities for laboratory testing against quality specifi cations approved by the Tanzania Bureau of Standards (TBS) compared with 371 samples for the fi nancial year 2014/2015. Out of 321, only 31 samples (equivalent to 9.7%) did not conform to TBS specifi cations compared with 28 samples (equivalent to 8%) for the fi nancial year 2014/2015. The 31 samples include 16 samples of Jet A1 which was contaminated with MSP during discharge from the Vessel MT UACC IBM ALTHEER in May, 2016. Punitive measures were taken against operators of the facilities who were found with products that failed to conform.
There is a continued improvement on compliance by service providers by selling petroleum products which conform to TBS specifi cations. This trend is a clear indication that the Authority has controls in place that ensure petroleum products offered for sale are of the right quality.
During the same period, samples of lubricants were collected and tested to check the quality of lubricants offered for sale in the market and to identify substandard products. A total of 28 samples were collected for laboratory analysis compared with 64 samples in fi nancial year 2014/2015. The laboratory test results indicate that all lubricants samples collected in 2015/16 met the TBS specifi cations while 18.75% were found to be out of TBS specifi cations during the fi nancial year 2014/2015. The standards used included TZS 647:2001 ICS 75.100 “Tanzania Standard for Engine Oils - Minimum Performance – Specifi cation and TZS 675:2001 ICS 75.100 “Tanzania Standard for Multipurpose Automotive Gear Lubricant (EP) - Specifi cation.
3.4.4 Monitoring compliance to the price Setting Rules During the year under review, the Authority continued to monitor compliance to the price setting Rules.
A total of 1,061 petrol stations were inspected compared with 817 petrol stations for the fi nancial year 2014/2015. Out of these, only seven (7) petrol stations equivalent to 0.66% were found selling petroleum products above cap price compared with three (3) petrol stations equivalent to 0.37% for the fi nancial year 2014/2015. Punitive measures were taken against the defaulters.
3.4.5 Fuel Marking Program In the period under review the Authority continued to implement the fuel marking program which is
done by the Contractor, M/S Global Fluids International Tanzania Limited (GFI). The objectives of the program are to curb dumping of untaxed petroleum products into the local market and fuel adulteration malpractices but also create a level playing fi eld amongst operators.
3.4.6 Quantity of petroleum products marked A total of 2,766,042,059 litres of petroleum products (diesel, petrol and kerosene) were marked in the
period from July 2015 to June 2016 as compared to 2,459,244,678 litres marked in the fi nancial year 2014/2015. When compared with the products volume marked in the last fi nancial year, there was an increment of 15% for MSP, 10% for AGO and 36% for IK.
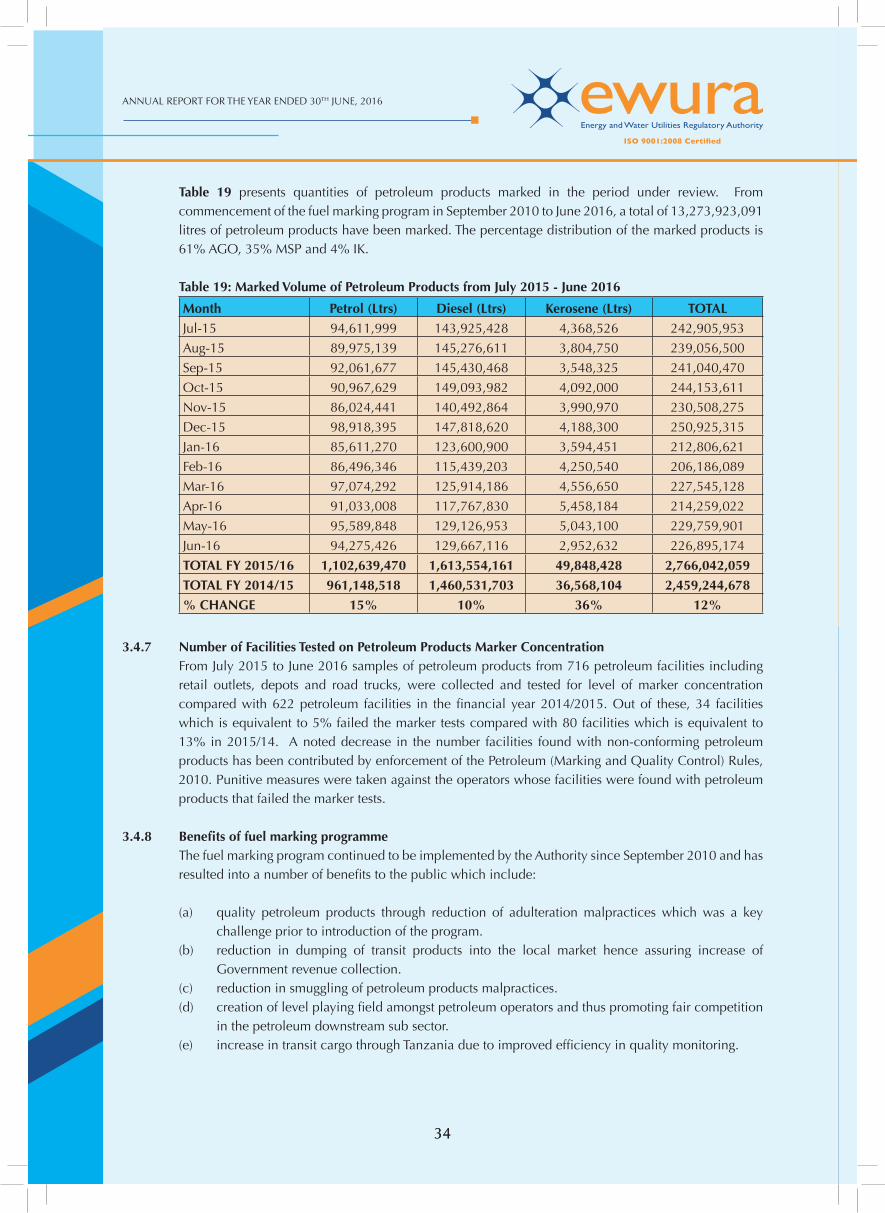
ANNUAL REPORT FOR THE YEAR ENDED 30TH JUNE, 2016
3434
Table 19 presents quantities of petroleum products marked in the period under review. From commencement of the fuel marking program in September 2010 to June 2016, a total of 13,273,923,091 litres of petroleum products have been marked. The percentage distribution of the marked products is 61% AGO, 35% MSP and 4% IK.
Table 19: Marked Volume of Petroleum Products from July 2015 - June 2016
Month Petrol (Ltrs) Diesel (Ltrs) Kerosene (Ltrs) TOTALJul-15 94,611,999 143,925,428 4,368,526 242,905,953
Aug-15 89,975,139 145,276,611 3,804,750 239,056,500
Sep-15 92,061,677 145,430,468 3,548,325 241,040,470
Oct-15 90,967,629 149,093,982 4,092,000 244,153,611
Nov-15 86,024,441 140,492,864 3,990,970 230,508,275
Dec-15 98,918,395 147,818,620 4,188,300 250,925,315
Jan-16 85,611,270 123,600,900 3,594,451 212,806,621
Feb-16 86,496,346 115,439,203 4,250,540 206,186,089
Mar-16 97,074,292 125,914,186 4,556,650 227,545,128
Apr-16 91,033,008 117,767,830 5,458,184 214,259,022
May-16 95,589,848 129,126,953 5,043,100 229,759,901
Jun-16 94,275,426 129,667,116 2,952,632 226,895,174
TOTAL FY 2015/16 1,102,639,470 1,613,554,161 49,848,428 2,766,042,059
TOTAL FY 2014/15 961,148,518 1,460,531,703 36,568,104 2,459,244,678
% CHANGE 15% 10% 36% 12%
3.4.7 Number of Facilities Tested on Petroleum Products Marker Concentration From July 2015 to June 2016 samples of petroleum products from 716 petroleum facilities including
retail outlets, depots and road trucks, were collected and tested for level of marker concentration compared with 622 petroleum facilities in the fi nancial year 2014/2015. Out of these, 34 facilities which is equivalent to 5% failed the marker tests compared with 80 facilities which is equivalent to 13% in 2015/14. A noted decrease in the number facilities found with non-conforming petroleum products has been contributed by enforcement of the Petroleum (Marking and Quality Control) Rules, 2010. Punitive measures were taken against the operators whose facilities were found with petroleum products that failed the marker tests.
3.4.8 Benefi ts of fuel marking programme The fuel marking program continued to be implemented by the Authority since September 2010 and has
resulted into a number of benefi ts to the public which include:
(a) quality petroleum products through reduction of adulteration malpractices which was a key challenge prior to introduction of the program.
(b) reduction in dumping of transit products into the local market hence assuring increase of Government revenue collection.
(c) reduction in smuggling of petroleum products malpractices. (d) creation of level playing fi eld amongst petroleum operators and thus promoting fair competition
in the petroleum downstream sub sector. (e) increase in transit cargo through Tanzania due to improved effi ciency in quality monitoring.
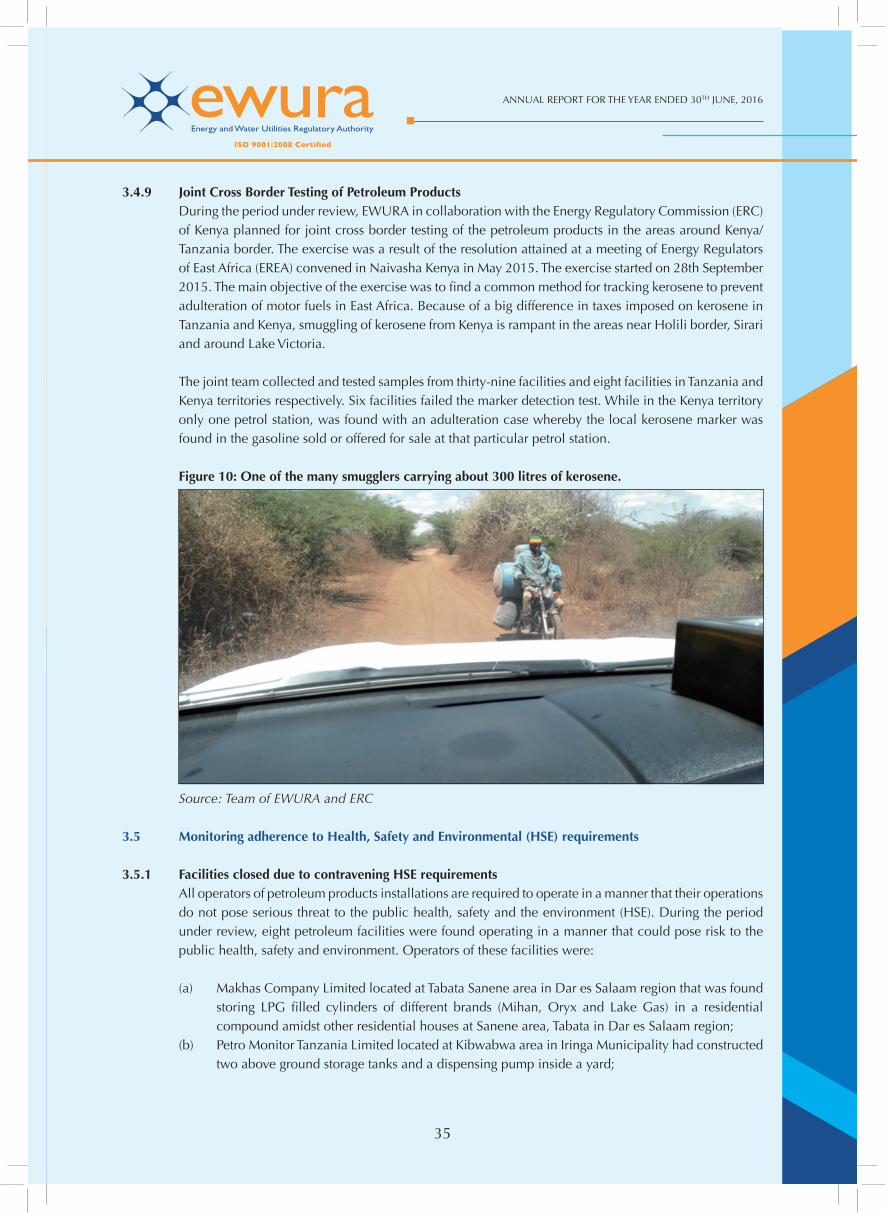
35
ANNUAL REPORT FOR THE YEAR ENDED 30TH JUNE, 2016
35
3.4.9 Joint Cross Border Testing of Petroleum Products During the period under review, EWURA in collaboration with the Energy Regulatory Commission (ERC)
of Kenya planned for joint cross border testing of the petroleum products in the areas around Kenya/Tanzania border. The exercise was a result of the resolution attained at a meeting of Energy Regulators of East Africa (EREA) convened in Naivasha Kenya in May 2015. The exercise started on 28th September 2015. The main objective of the exercise was to fi nd a common method for tracking kerosene to prevent adulteration of motor fuels in East Africa. Because of a big difference in taxes imposed on kerosene in Tanzania and Kenya, smuggling of kerosene from Kenya is rampant in the areas near Holili border, Sirari and around Lake Victoria.
The joint team collected and tested samples from thirty-nine facilities and eight facilities in Tanzania and Kenya territories respectively. Six facilities failed the marker detection test. While in the Kenya territory only one petrol station, was found with an adulteration case whereby the local kerosene marker was found in the gasoline sold or offered for sale at that particular petrol station.
Figure 10: One of the many smugglers carrying about 300 litres of kerosene.
Source: Team of EWURA and ERC
3.5 Monitoring adherence to Health, Safety and Environmental (HSE) requirements
3.5.1 Facilities closed due to contravening HSE requirements All operators of petroleum products installations are required to operate in a manner that their operations
do not pose serious threat to the public health, safety and the environment (HSE). During the period under review, eight petroleum facilities were found operating in a manner that could pose risk to the public health, safety and environment. Operators of these facilities were:
(a) Makhas Company Limited located at Tabata Sanene area in Dar es Salaam region that was found storing LPG fi lled cylinders of different brands (Mihan, Oryx and Lake Gas) in a residential compound amidst other residential houses at Sanene area, Tabata in Dar es Salaam region;
(b) Petro Monitor Tanzania Limited located at Kibwabwa area in Iringa Municipality had constructed two above ground storage tanks and a dispensing pump inside a yard;
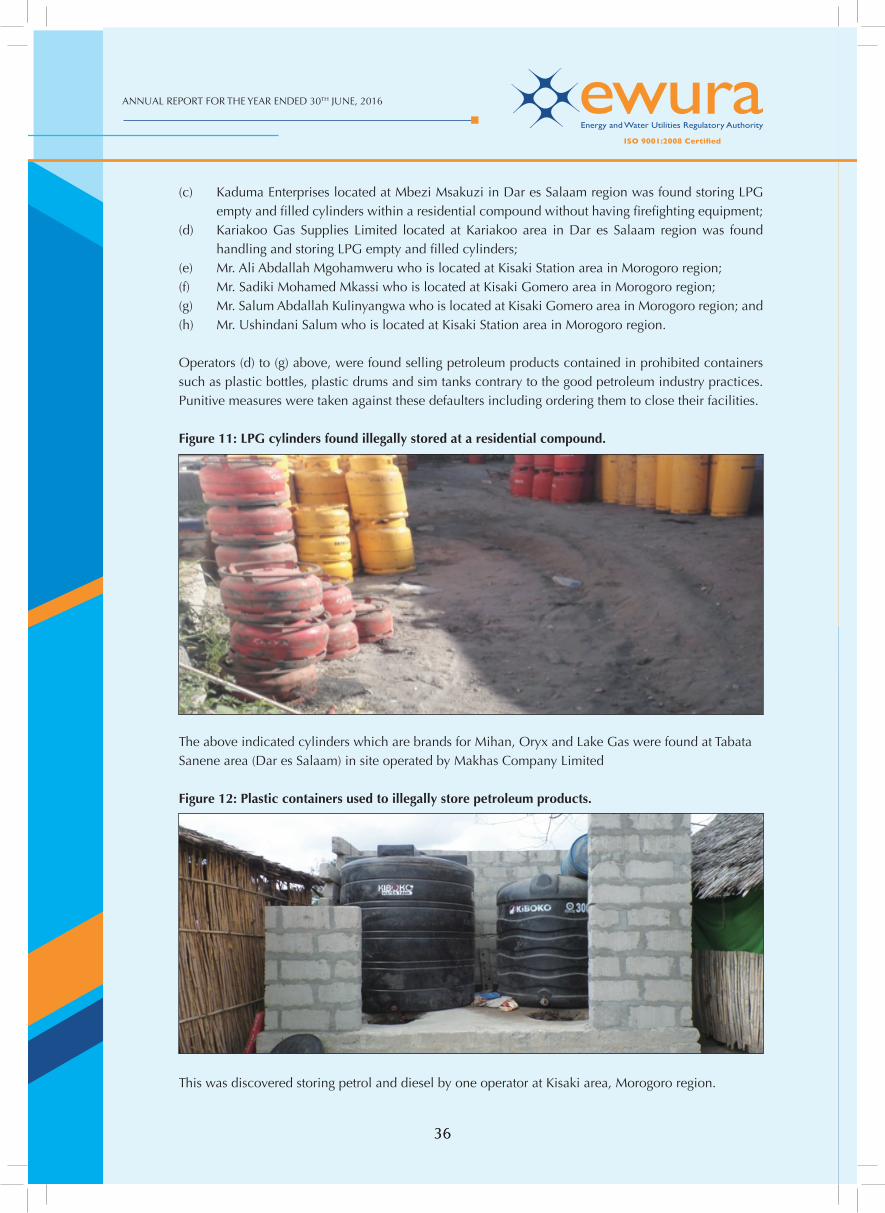
ANNUAL REPORT FOR THE YEAR ENDED 30TH JUNE, 2016
3636
(c) Kaduma Enterprises located at Mbezi Msakuzi in Dar es Salaam region was found storing LPG empty and fi lled cylinders within a residential compound without having fi refi ghting equipment;
(d) Kariakoo Gas Supplies Limited located at Kariakoo area in Dar es Salaam region was found handling and storing LPG empty and fi lled cylinders;
(e) Mr. Ali Abdallah Mgohamweru who is located at Kisaki Station area in Morogoro region; (f) Mr. Sadiki Mohamed Mkassi who is located at Kisaki Gomero area in Morogoro region; (g) Mr. Salum Abdallah Kulinyangwa who is located at Kisaki Gomero area in Morogoro region; and (h) Mr. Ushindani Salum who is located at Kisaki Station area in Morogoro region.
Operators (d) to (g) above, were found selling petroleum products contained in prohibited containers such as plastic bottles, plastic drums and sim tanks contrary to the good petroleum industry practices. Punitive measures were taken against these defaulters including ordering them to close their facilities.
Figure 11: LPG cylinders found illegally stored at a residential compound.
The above indicated cylinders which are brands for Mihan, Oryx and Lake Gas were found at Tabata Sanene area (Dar es Salaam) in site operated by Makhas Company Limited
Figure 12: Plastic containers used to illegally store petroleum products.
This was discovered storing petrol and diesel by one operator at Kisaki area, Morogoro region.
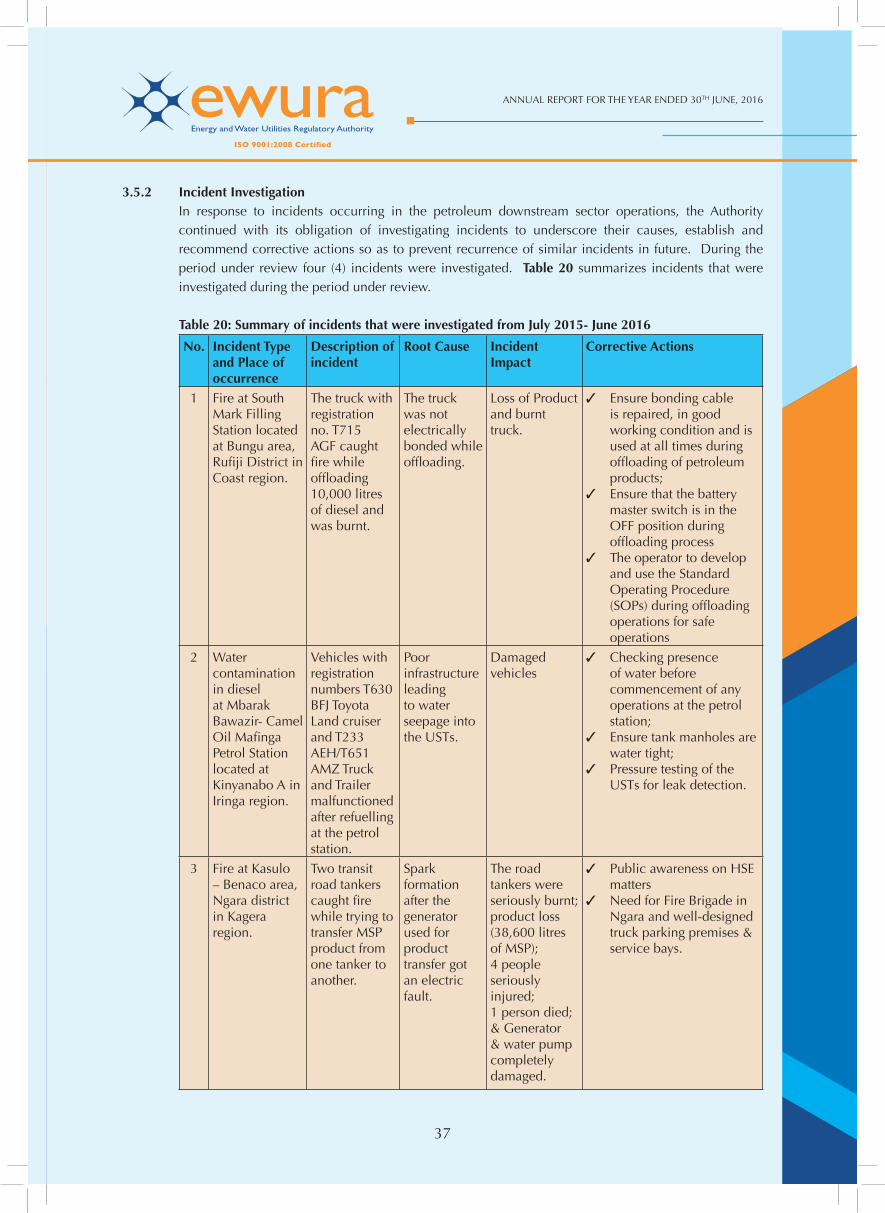
37
ANNUAL REPORT FOR THE YEAR ENDED 30TH JUNE, 2016
37
3.5.2 Incident Investigation In response to incidents occurring in the petroleum downstream sector operations, the Authority
continued with its obligation of investigating incidents to underscore their causes, establish and recommend corrective actions so as to prevent recurrence of similar incidents in future. During the period under review four (4) incidents were investigated. Table 20 summarizes incidents that were investigated during the period under review.
Table 20: Summary of incidents that were investigated from July 2015- June 2016
No. Incident Type and Place of occurrence
Description of incident
Root Cause Incident Impact
Corrective Actions
1 Fire at South Mark Filling Station located at Bungu area, Rufi ji District in Coast region.
The truck with registration no. T715 AGF caught fi re while offl oading 10,000 litres of diesel and was burnt.
The truck was not electrically bonded while offl oading.
Loss of Product and burnt truck.
✓ Ensure bonding cable is repaired, in good working condition and is used at all times during offl oading of petroleum products;
✓ Ensure that the battery master switch is in the OFF position during offl oading process
✓ The operator to develop and use the Standard Operating Procedure (SOPs) during offl oading operations for safe operations
2 Water contamination in diesel at Mbarak Bawazir- Camel Oil Mafi nga Petrol Station located at Kinyanabo A in Iringa region.
Vehicles with registration numbers T630 BFJ Toyota Land cruiser and T233 AEH/T651 AMZ Truck and Trailer malfunctioned after refuelling at the petrol station.
Poor infrastructure leading to water seepage into the USTs.
Damaged vehicles
✓ Checking presence of water before commencement of any operations at the petrol station;
✓ Ensure tank manholes are water tight;
✓ Pressure testing of the USTs for leak detection.
3 Fire at Kasulo – Benaco area, Ngara district in Kagera region.
Two transit road tankers caught fi re while trying to transfer MSP product from one tanker to another.
Spark formation after the generator used for product transfer got an electric fault.
The road tankers were seriously burnt; product loss (38,600 litres of MSP);4 people seriously injured;1 person died; & Generator & water pump completely damaged.
✓ Public awareness on HSE matters
✓ Need for Fire Brigade in Ngara and well-designed truck parking premises & service bays.
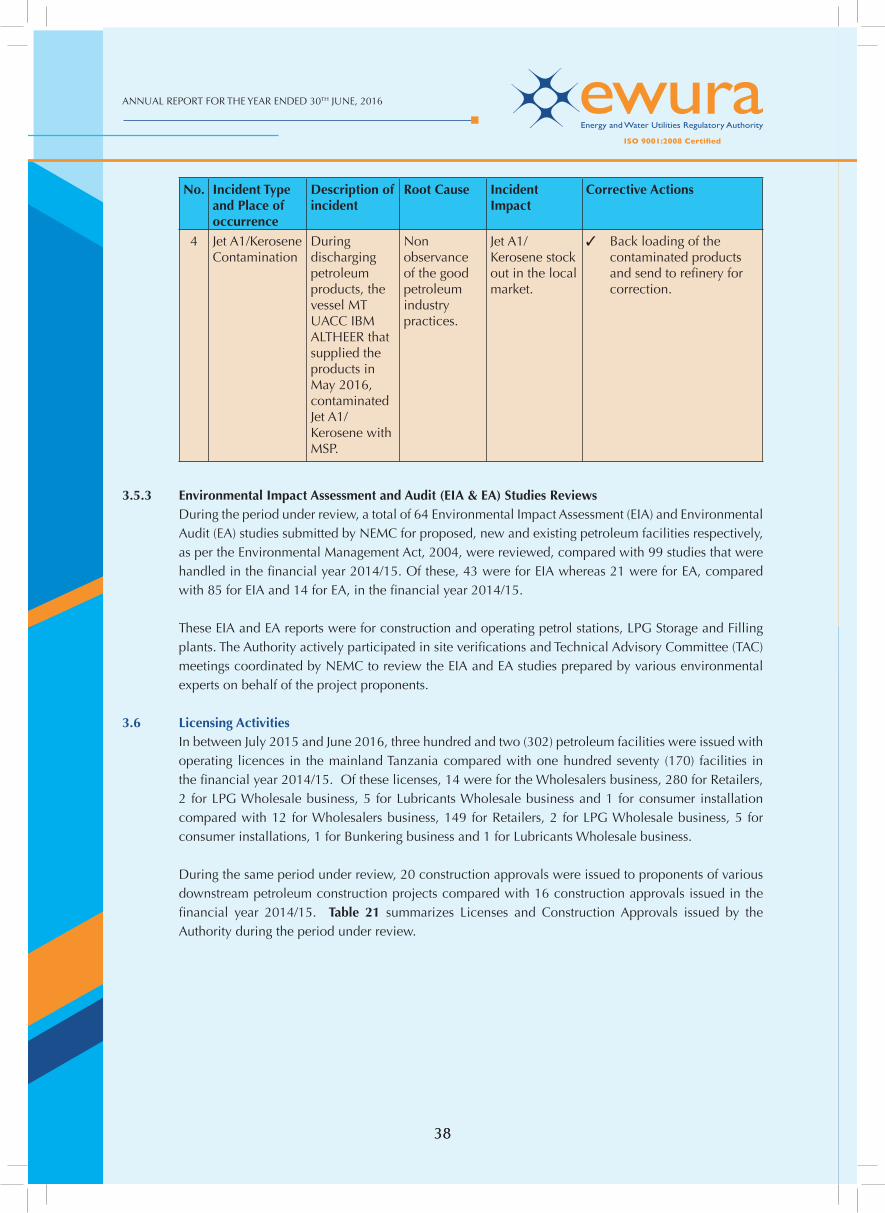
ANNUAL REPORT FOR THE YEAR ENDED 30TH JUNE, 2016
3838
No. Incident Type and Place of occurrence
Description of incident
Root Cause Incident Impact
Corrective Actions
4 Jet A1/Kerosene Contamination
During discharging petroleum products, the vessel MT UACC IBM ALTHEER that supplied the products in May 2016, contaminated Jet A1/Kerosene with MSP.
Non observance of the good petroleum industry practices.
Jet A1/ Kerosene stock out in the local market.
✓ Back loading of the contaminated products and send to refi nery for correction.
3.5.3 Environmental Impact Assessment and Audit (EIA & EA) Studies Reviews During the period under review, a total of 64 Environmental Impact Assessment (EIA) and Environmental
Audit (EA) studies submitted by NEMC for proposed, new and existing petroleum facilities respectively, as per the Environmental Management Act, 2004, were reviewed, compared with 99 studies that were handled in the fi nancial year 2014/15. Of these, 43 were for EIA whereas 21 were for EA, compared with 85 for EIA and 14 for EA, in the fi nancial year 2014/15.
These EIA and EA reports were for construction and operating petrol stations, LPG Storage and Filling plants. The Authority actively participated in site verifi cations and Technical Advisory Committee (TAC) meetings coordinated by NEMC to review the EIA and EA studies prepared by various environmental experts on behalf of the project proponents.
3.6 Licensing Activities In between July 2015 and June 2016, three hundred and two (302) petroleum facilities were issued with
operating licences in the mainland Tanzania compared with one hundred seventy (170) facilities in the fi nancial year 2014/15. Of these licenses, 14 were for the Wholesalers business, 280 for Retailers, 2 for LPG Wholesale business, 5 for Lubricants Wholesale business and 1 for consumer installation compared with 12 for Wholesalers business, 149 for Retailers, 2 for LPG Wholesale business, 5 for consumer installations, 1 for Bunkering business and 1 for Lubricants Wholesale business.
During the same period under review, 20 construction approvals were issued to proponents of various downstream petroleum construction projects compared with 16 construction approvals issued in the fi nancial year 2014/15. Table 21 summarizes Licenses and Construction Approvals issued by the Authority during the period under review.
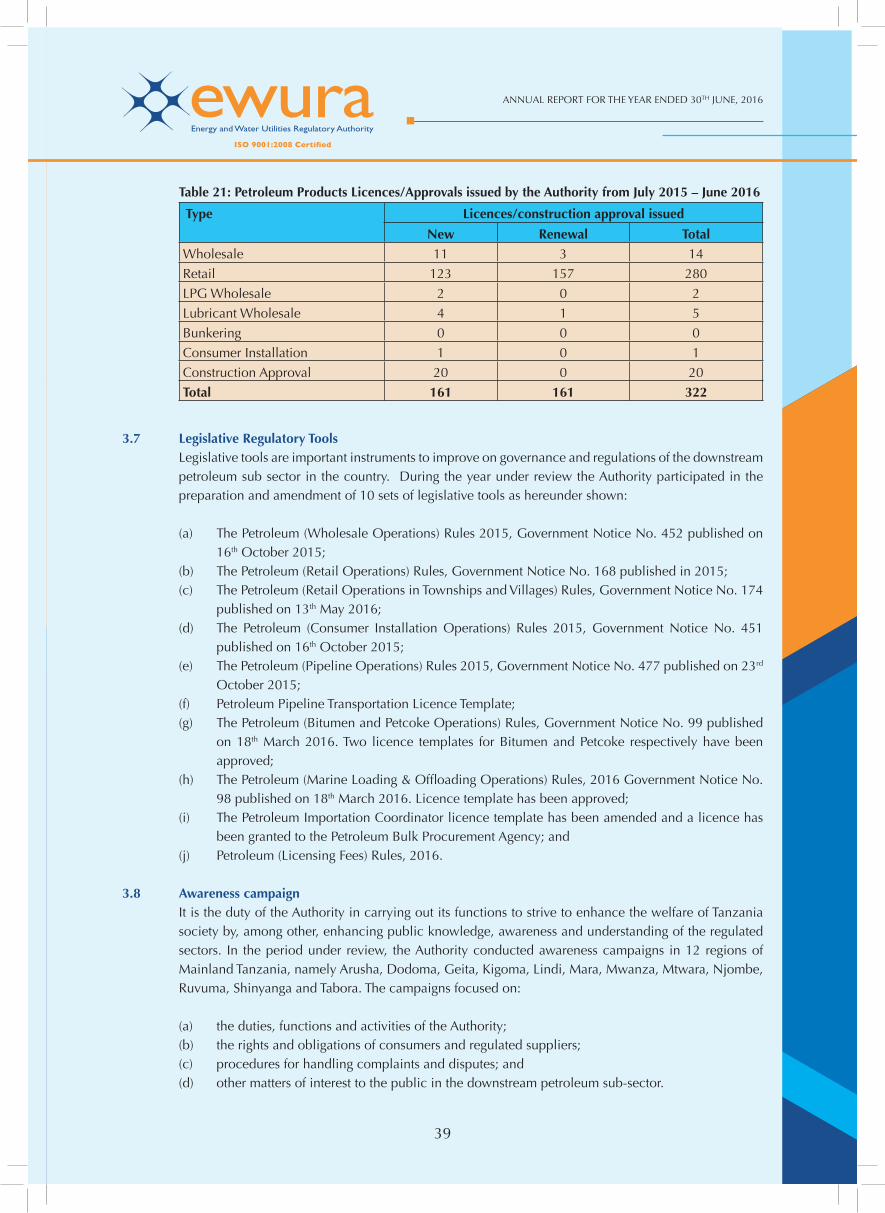
39
ANNUAL REPORT FOR THE YEAR ENDED 30TH JUNE, 2016
39
Table 21: Petroleum Products Licences/Approvals issued by the Authority from July 2015 – June 2016
Type Licences/construction approval issued
New Renewal TotalWholesale 11 3 14
Retail 123 157 280
LPG Wholesale 2 0 2
Lubricant Wholesale 4 1 5
Bunkering 0 0 0
Consumer Installation 1 0 1
Construction Approval 20 0 20
Total 161 161 322
3.7 Legislative Regulatory Tools Legislative tools are important instruments to improve on governance and regulations of the downstream
petroleum sub sector in the country. During the year under review the Authority participated in the preparation and amendment of 10 sets of legislative tools as hereunder shown:
(a) The Petroleum (Wholesale Operations) Rules 2015, Government Notice No. 452 published on 16th October 2015;
(b) The Petroleum (Retail Operations) Rules, Government Notice No. 168 published in 2015; (c) The Petroleum (Retail Operations in Townships and Villages) Rules, Government Notice No. 174
published on 13th May 2016; (d) The Petroleum (Consumer Installation Operations) Rules 2015, Government Notice No. 451
published on 16th October 2015; (e) The Petroleum (Pipeline Operations) Rules 2015, Government Notice No. 477 published on 23rd
October 2015; (f) Petroleum Pipeline Transportation Licence Template; (g) The Petroleum (Bitumen and Petcoke Operations) Rules, Government Notice No. 99 published
on 18th March 2016. Two licence templates for Bitumen and Petcoke respectively have been approved;
(h) The Petroleum (Marine Loading & Offl oading Operations) Rules, 2016 Government Notice No. 98 published on 18th March 2016. Licence template has been approved;
(i) The Petroleum Importation Coordinator licence template has been amended and a licence has been granted to the Petroleum Bulk Procurement Agency; and
(j) Petroleum (Licensing Fees) Rules, 2016.
3.8 Awareness campaign It is the duty of the Authority in carrying out its functions to strive to enhance the welfare of Tanzania
society by, among other, enhancing public knowledge, awareness and understanding of the regulated sectors. In the period under review, the Authority conducted awareness campaigns in 12 regions of Mainland Tanzania, namely Arusha, Dodoma, Geita, Kigoma, Lindi, Mara, Mwanza, Mtwara, Njombe, Ruvuma, Shinyanga and Tabora. The campaigns focused on:
(a) the duties, functions and activities of the Authority; (b) the rights and obligations of consumers and regulated suppliers; (c) procedures for handling complaints and disputes; and (d) other matters of interest to the public in the downstream petroleum sub-sector.
ANNUAL REPORT FOR THE YEAR ENDED 30TH JUNE, 2016
4040
The Authority will continue to conduct awareness campaigns in the other regions to ensure that it executes the duties entrusted to it diligently.
3.9 Key Achievements and Challenges
3.9.1 Achievements The Authority has recorded a number of achievements in the downstream petroleum sub-sector as
outlined hereunder:
(a) The level of petroleum adulteration has decreased from 77% in to about 5% in hence assuring local consumers of the quality petroleum products;
(b) Petroleum products pricing has been successful and stable; (c) Petroleum products supply in the country has been stable without and major shortage or stock
out recorded in the period under review; (d) Regulatory measures that are being taken by the Authority have resulted in the decrease of
dumping of transit and tax-exempted petroleum products in the local market. Consequently, consumers enjoyed buying quality petroleum products and the Government continued collecting lawful taxes on petroleum products;
(e) Various regulatory tools that were absent are now in place, others under preparation or have been revised and Standards of retail outlets in the country have signifi cantly improved because of compliance monitoring enforcement and the measures taken by the Authority.
3.9.2 Challenges Despite the above achievements, there are some challenges that have been encountered by the
Authority while discharging its regulatory roles in the downstream petroleum sub-sector in Tanzania. These challenges are shown below:
(a) Technical Know How and Expertise: Some operators still lack technical know-how and expertise in petroleum downstream operations. The Authority is continuing disseminating awareness and education to the petroleum operators in the country to deal with this challenge;
(b) Adulteration and Smuggling of Petroleum Products: The exercise of curbing sale of adulterated and also untaxed petroleum products alongside clean and fully tax paid products is bearing good results. However, this malpractice is not yet wiped out completely. EWURA is continuing to implement measures that are aimed at dealing with this menace. Also, joint efforts with other relevant authorities including TRA and the Police force will be continued; and
(c) Sale of sub-standard lubricants: Sale of sub-standard lubricants in the country is still rampant. EWURA has intensifi ed inspection to deal with these anomalies, but also educating lubricant stakeholders on the requirement to operate in compliance with the law.
(d) Low Consumption of LPG: Consumption of LPG is still very low. EWURA in collaboration with other stakeholders will continue educating consumers and stakeholders on the benefi ts of using this clean energy source. Also, for the purpose of ensuring that LPG is sold at fair prices, the Authority will start regulating LPG local prices once PBPA commence importation of the product in bulk.
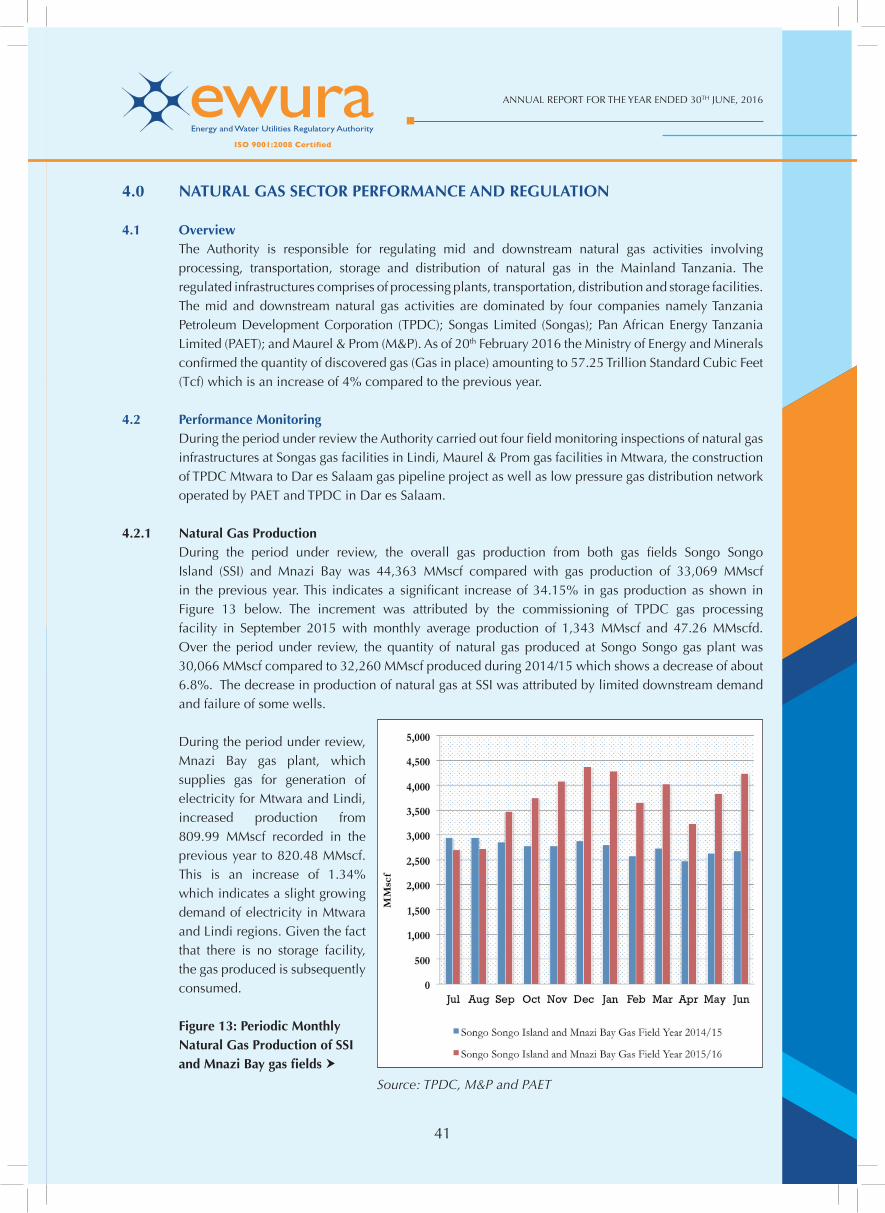
41
ANNUAL REPORT FOR THE YEAR ENDED 30TH JUNE, 2016
41
4.0 NATURAL GAS SECTOR PERFORMANCE AND REGULATION
4.1 Overview The Authority is responsible for regulating mid and downstream natural gas activities involving
processing, transportation, storage and distribution of natural gas in the Mainland Tanzania. The regulated infrastructures comprises of processing plants, transportation, distribution and storage facilities. The mid and downstream natural gas activities are dominated by four companies namely Tanzania Petroleum Development Corporation (TPDC); Songas Limited (Songas); Pan African Energy Tanzania Limited (PAET); and Maurel & Prom (M&P). As of 20th February 2016 the Ministry of Energy and Minerals confi rmed the quantity of discovered gas (Gas in place) amounting to 57.25 Trillion Standard Cubic Feet (Tcf) which is an increase of 4% compared to the previous year.
4.2 Performance Monitoring During the period under review the Authority carried out four fi eld monitoring inspections of natural gas
infrastructures at Songas gas facilities in Lindi, Maurel & Prom gas facilities in Mtwara, the construction of TPDC Mtwara to Dar es Salaam gas pipeline project as well as low pressure gas distribution network operated by PAET and TPDC in Dar es Salaam.
4.2.1 Natural Gas Production During the period under review, the overall gas production from both gas fi elds Songo Songo
Island (SSI) and Mnazi Bay was 44,363 MMscf compared with gas production of 33,069 MMscf in the previous year. This indicates a signifi cant increase of 34.15% in gas production as shown in Figure 13 below. The increment was attributed by the commissioning of TPDC gas processing facility in September 2015 with monthly average production of 1,343 MMscf and 47.26 MMscfd. Over the period under review, the quantity of natural gas produced at Songo Songo gas plant was 30,066 MMscf compared to 32,260 MMscf produced during 2014/15 which shows a decrease of about 6.8%. The decrease in production of natural gas at SSI was attributed by limited downstream demand and failure of some wells.
During the period under review, Mnazi Bay gas plant, which supplies gas for generation of electricity for Mtwara and Lindi, increased production from 809.99 MMscf recorded in the previous year to 820.48 MMscf. This is an increase of 1.34% which indicates a slight growing demand of electricity in Mtwara and Lindi regions. Given the fact that there is no storage facility, the gas produced is subsequently consumed.
Figure 13: Periodic Monthly Natural Gas Production of SSI and Mnazi Bay gas fi elds �
Source: TPDC, M&P and PAET

ANNUAL REPORT FOR THE YEAR ENDED 30TH JUNE, 2016
4242
4.2.2 The Demand – Supply Balance of Natural Gas During the period under review, the natural gas processing capacities at Mnazi Bay and Songo Songo
gas fi elds increased by 350 MMscfd of which 210 MMscfd commissioned in September 2015 and ongoing commissioning of 140 MMscfd gas processing facilities owned and operated by TPDC. The total average production was 131.91 MMscfd out of a total of 465 MMscfd installed capacity which is 28.37%.
The power generation sector consumed an average of 114.89 MMscfd to generate about 575 MW of electricity and the remained 17.09 MMscfd was consumed by industries located in Dar es Salaam. The analysis shows that, the processing plants and pipelines installed capacity in the country is suffi cient to meet the current natural gas demand for power generation and industrial usage.
4.2.3 Trend of Cost of Services During the period under review, the Authority monitored the natural gas price trend for power generation
and industrial usage. The Authority benchmarked the natural gas prices for thermal power generation and industrial usage in Tanzanian market to US market as shown in Figure 12 below. The average USA prices for power generation and Industrial usage was USD 2.8/MMBtu and 3.40US$/GJ respectively, which were benchmarked to USD 4.2 /MMBtu for protected gas supplied by TPDC, USD 3.45/MMBtu for addition gas supplied by PAET, USD 5.4/MMBtu for gas supplied by M&P, USD 5.14/MMBtu gas supplied by TPDC and USD 7.35/GJ for industries supplied by PAET.
The industrial average gas price slightly decreased from USD 7.39/GJ in previous year to USD 7.35/GJ. The USA market prices for both power and industrial users are lower than Tanzanian market due to the maturity of USA market, economies of scales (size of the market) and the fact that most of capital used has been recovered.
Figure 14: Natural Gas Price Trends for Power Generation for FY 2015/16
Source: TPDC and PAET
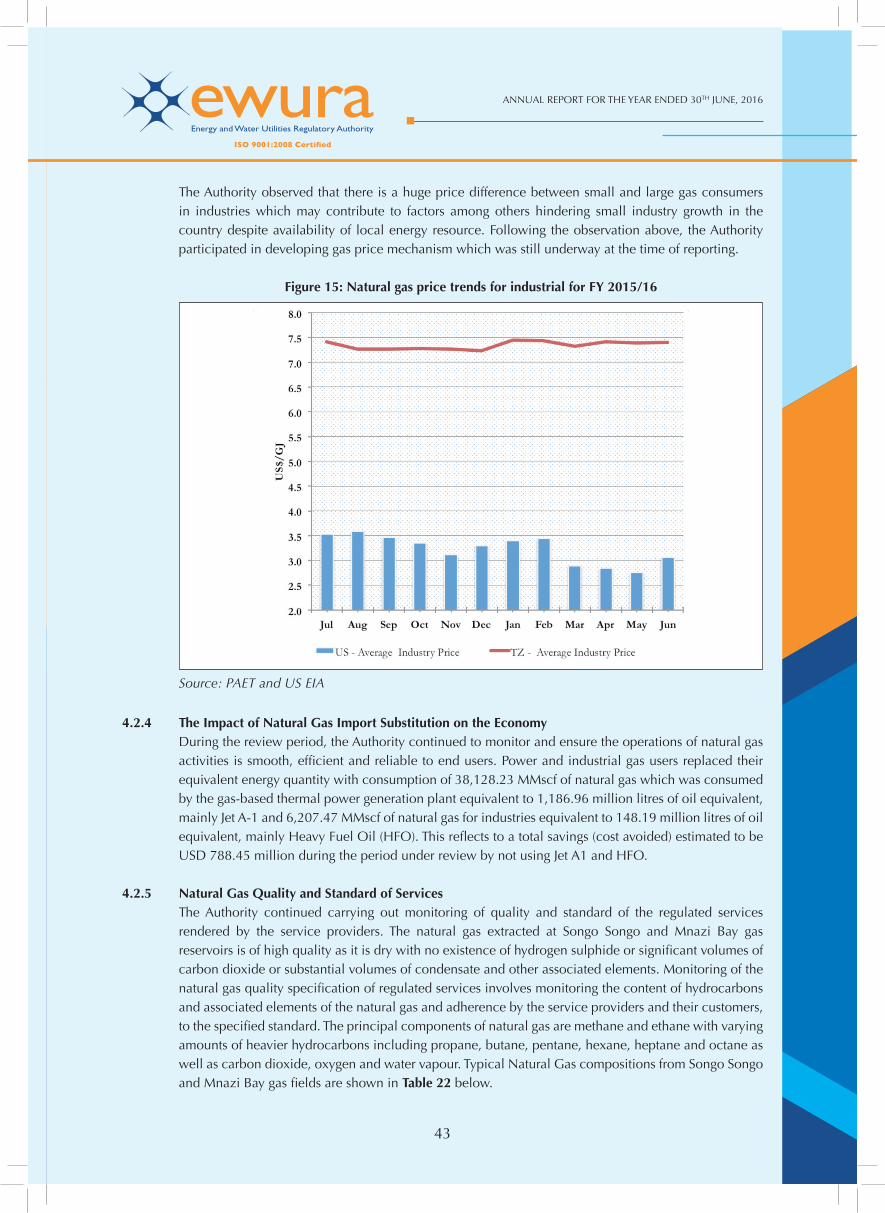
43
ANNUAL REPORT FOR THE YEAR ENDED 30TH JUNE, 2016
43
The Authority observed that there is a huge price difference between small and large gas consumers in industries which may contribute to factors among others hindering small industry growth in the country despite availability of local energy resource. Following the observation above, the Authority participated in developing gas price mechanism which was still underway at the time of reporting.
Figure 15: Natural gas price trends for industrial for FY 2015/16
Source: PAET and US EIA
4.2.4 The Impact of Natural Gas Import Substitution on the Economy During the review period, the Authority continued to monitor and ensure the operations of natural gas
activities is smooth, effi cient and reliable to end users. Power and industrial gas users replaced their equivalent energy quantity with consumption of 38,128.23 MMscf of natural gas which was consumed by the gas-based thermal power generation plant equivalent to 1,186.96 million litres of oil equivalent, mainly Jet A-1 and 6,207.47 MMscf of natural gas for industries equivalent to 148.19 million litres of oil equivalent, mainly Heavy Fuel Oil (HFO). This refl ects to a total savings (cost avoided) estimated to be USD 788.45 million during the period under review by not using Jet A1 and HFO.
4.2.5 Natural Gas Quality and Standard of Services The Authority continued carrying out monitoring of quality and standard of the regulated services
rendered by the service providers. The natural gas extracted at Songo Songo and Mnazi Bay gas reservoirs is of high quality as it is dry with no existence of hydrogen sulphide or signifi cant volumes of carbon dioxide or substantial volumes of condensate and other associated elements. Monitoring of the natural gas quality specifi cation of regulated services involves monitoring the content of hydrocarbons and associated elements of the natural gas and adherence by the service providers and their customers, to the specifi ed standard. The principal components of natural gas are methane and ethane with varying amounts of heavier hydrocarbons including propane, butane, pentane, hexane, heptane and octane as well as carbon dioxide, oxygen and water vapour. Typical Natural Gas compositions from Songo Songo and Mnazi Bay gas fi elds are shown in Table 22 below.
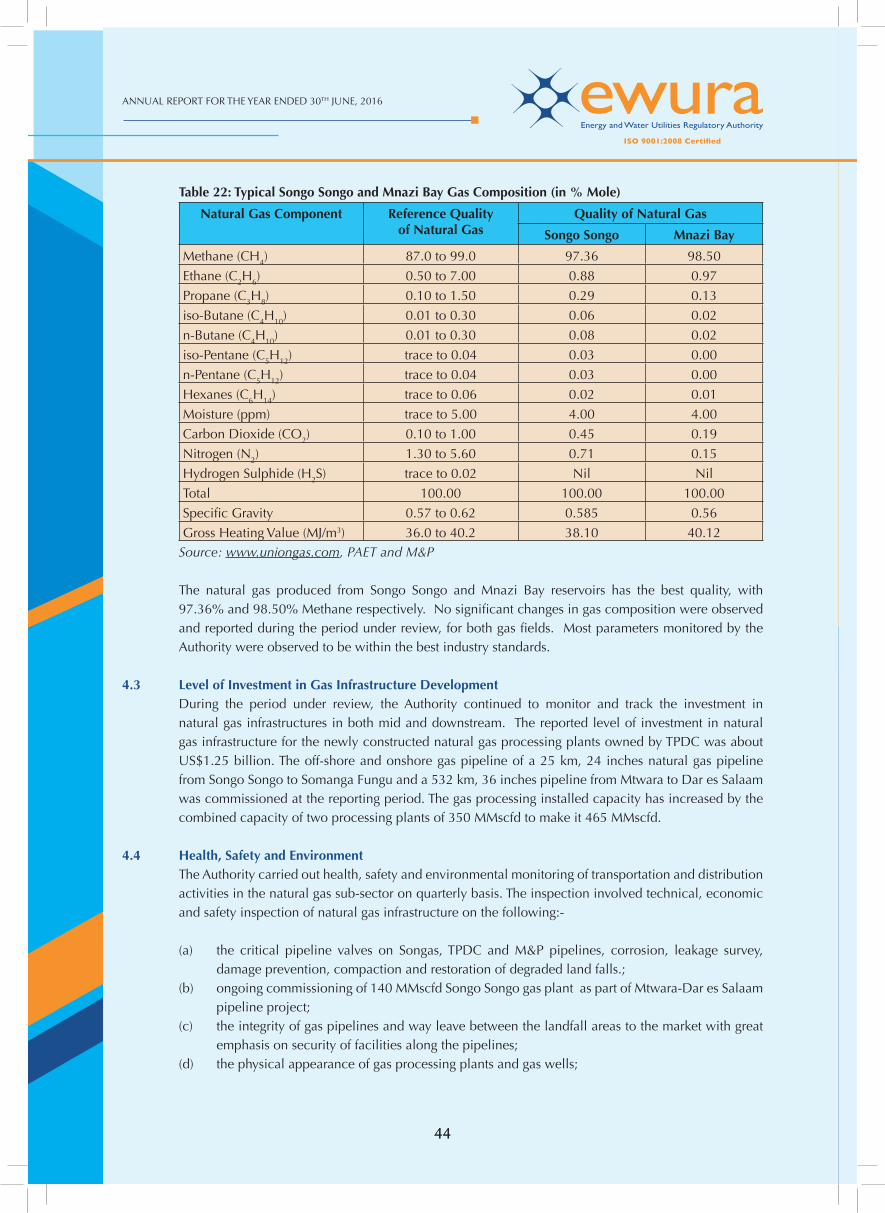
ANNUAL REPORT FOR THE YEAR ENDED 30TH JUNE, 2016
4444
Table 22: Typical Songo Songo and Mnazi Bay Gas Composition (in % Mole)
Natural Gas Component Reference Qualityof Natural Gas
Quality of Natural Gas
Songo Songo Mnazi Bay
Methane (CH4) 87.0 to 99.0 97.36 98.50
Ethane (C2H6) 0.50 to 7.00 0.88 0.97
Propane (C3H8) 0.10 to 1.50 0.29 0.13
iso-Butane (C4H10) 0.01 to 0.30 0.06 0.02
n-Butane (C4H10) 0.01 to 0.30 0.08 0.02
iso-Pentane (C5H12) trace to 0.04 0.03 0.00
n-Pentane (C5H12) trace to 0.04 0.03 0.00
Hexanes (C6H14) trace to 0.06 0.02 0.01
Moisture (ppm) trace to 5.00 4.00 4.00
Carbon Dioxide (CO2) 0.10 to 1.00 0.45 0.19
Nitrogen (N2) 1.30 to 5.60 0.71 0.15
Hydrogen Sulphide (H2S) trace to 0.02 Nil Nil
Total 100.00 100.00 100.00
Specifi c Gravity 0.57 to 0.62 0.585 0.56
Gross Heating Value (MJ/m3) 36.0 to 40.2 38.10 40.12Source: www.uniongas.com, PAET and M&P
The natural gas produced from Songo Songo and Mnazi Bay reservoirs has the best quality, with 97.36% and 98.50% Methane respectively. No signifi cant changes in gas composition were observed and reported during the period under review, for both gas fi elds. Most parameters monitored by the Authority were observed to be within the best industry standards.
4.3 Level of Investment in Gas Infrastructure Development During the period under review, the Authority continued to monitor and track the investment in
natural gas infrastructures in both mid and downstream. The reported level of investment in natural gas infrastructure for the newly constructed natural gas processing plants owned by TPDC was about US$1.25 billion. The off-shore and onshore gas pipeline of a 25 km, 24 inches natural gas pipeline from Songo Songo to Somanga Fungu and a 532 km, 36 inches pipeline from Mtwara to Dar es Salaam was commissioned at the reporting period. The gas processing installed capacity has increased by the combined capacity of two processing plants of 350 MMscfd to make it 465 MMscfd.
4.4 Health, Safety and Environment The Authority carried out health, safety and environmental monitoring of transportation and distribution
activities in the natural gas sub-sector on quarterly basis. The inspection involved technical, economic and safety inspection of natural gas infrastructure on the following:-
(a) the critical pipeline valves on Songas, TPDC and M&P pipelines, corrosion, leakage survey,
damage prevention, compaction and restoration of degraded land falls.; (b) ongoing commissioning of 140 MMscfd Songo Songo gas plant as part of Mtwara-Dar es Salaam
pipeline project; (c) the integrity of gas pipelines and way leave between the landfall areas to the market with great
emphasis on security of facilities along the pipelines; (d) the physical appearance of gas processing plants and gas wells;
45
ANNUAL REPORT FOR THE YEAR ENDED 30TH JUNE, 2016
45
(e) compressed natural gas dispensing facility for converted vehicles; (f) the gas mains, line valves pressure reduction stations at Ubungo and Namera; (g) the Compressed natural gas mother station at Ubungo and the virtual pipe comprised with
compressed natural gas daughter station at city centre; and (h) the status of the Dar es Salaam ring main serving about 40 industries and about 52km way leave
operated by PAET and 6km by TPDC.
During the period under review, processing plants operated by Songas, TPDC and M&P achieved no Lost Time Injuries (LTI). There was no “Near Miss Accident” or Major Accident to be reported. The Authority observed a trend of potential hydrogen (pH) ranging between 6.8 to 7.2 and oil in water content ranging from 1 to 7 ppm, which were within acceptable range. The allowable pH standard is between 6 to 8 while allowable oil in water content range is 0 to 29 ppm (parts per million). In conclusion, handling of produced water to all plants complied with Health, Safety and Environment (HSE) standards and the World Health Organization (WHO) standards.
4.5 Local Content During the period under review the Authority conducted local content awareness activities to natural
gas regulated service providers in the midstream and downstream so as to encourage local participation in all natural gas mid and downstream activities. Furthermore, the Authority participated in development of Petroleum (Local Content) Regulations, 2016 and the same was submitted to the Minister for Energy and Minerals for further actions.
4.6 Licensing The Authority is still fi nalizing the development of regulatory tools to enable commencement of licensing
natural gas operations that will allow the Authority to start licencing the operations of regulated activities in the natural gas sub-sector starting in year 2016/17.Therefore,there was no license issued.
4.7 Determination of Rates and Charges During the period under review, there was no Tariff issued. However, TPDC requested and extension
of Interim Tariff to 31st December, 2015 due to delay in completion of Mtwara – Dar gas infrastructure project.
4.8 Legislative Matters Following the enactment of the Petroleum Act, the Authority continued to develop inputs for regulatory
tools which include draft of Petroleum (Local Content) Regulations, 2016 and Petroleum (Corporate Integrity Pledge) Regulations, 2016were submitted to the Minister for approval process. This would enable development of rules and other related appropriate tools required by the Authority to enforce the Petroleum Act, 2015.
4.9 Disputes and Complaints There were no disputes or complaints brought to the attention of the Authority during the period under
review.
4.10 Litigation There was no litigation involving the Authority, the service providers, or other stakeholders during the
period under review.
ANNUAL REPORT FOR THE YEAR ENDED 30TH JUNE, 2016
4646
4.11 Key Achievements and Challenges
4.11.1 Achievement As a matter of policy, the Authority provided inputs to the Ministry and participated in drafting the
Petroleum (Local Content) Regulations, 2016; Petroleum (Corporate Integrity Pledge) Regulations, 2016 and Petroleum (Natural Gas Pricing) Regulations, 2016. The Regulations await the Minister approval.
4.11.2 Challenges The following are key challenges encountered so far, and the way forward being pursued by the Authority
and other stakeholders
(a) encroachment of gas way leave operated by TPDC and PAET, to address this challenge the Authority will intensify compliance to HSE requirements as well as conduct public awareness programme;
(b) absence of regulatory tools for regulating prices of natural gas in the sector results into large variations of gas prices between large and small industrial gas consumers. To address this matter the Authority has prepared the draft Petroleum (Natural Gas Pricing) Regulations, 2016 and submitted the same to Ministry of Energy and Minerals for appropriate action. If the regulations comes into force, will be useful in computation and setting prices for natural gas consumers; and
(c) following the enactment of Petroleum Act, 2015 and limitation of expertise especially in oil and gas, there is an increasing demand of the professionals which the local market cannot support right now. The Authority will continue to train its staff in short term course, conferences and attachments on oil and gas sector. These courses are expensive hence few staff will get this opportunity.
47
ANNUAL REPORT FOR THE YEAR ENDED 30TH JUNE, 2016
47
5.0 WATER SUPPLY AND SANITATION SERVICES REGULATION
5.1 Overview The Authority is responsible for regulating water utilities established under Section 9 of the Water
Supply and Sanitation Act, Cap. 272 and DAWASA Act, Cap. 273. As of 30th June 2016, there were 131 regulated water utilities. These included the Dar es Salaam Water and Sewerage Authority (DAWASA), Dar es Salaam Water Supply Corporation (DAWASCO), 23 Regional Water Supply and Sanitation Authorities (RWSSAs), 98 District and Township Water Supply and Sanitation Authorities (DTWSSAs) and eight National Projects Water Supply and Sanitation Authorities (NPWSSAs).
Water Supply and Sanitation Authorities were established under the Water Supply and Sanitation Act, Cap. 272 and are responsible for provision of Water and Sanitation Services in their designated areas and pursuant to the terms and conditions of licences issued by EWURA. Also, DAWASA was established by the DAWASA Act, Cap. 273 and DAWASCO was established under the Public Corporation Act, Cap. 257. DAWASA is the owner of the assets for water supply and sewerage services in Dar es Salaam Region and part of Kibaha and Bagamoyo districts. It is responsible for planning, procurement and implementation of strategic capital works. DAWASCO is responsible for providing water supply and sewerage services in the DAWASA designated area through a lease contract.
5.2 Performance Monitoring
5.2.1 Data Reporting The Authority maintains a web based software for reporting namely Water Utilities Information
System (MajIs). Through MajIs, WSSAs are obliged to submit electronically their monthly and annual performance data. During the period under review, DAWASA, DAWASCO, the 23 regional WSSAs, eight National Project WSSAs, and 60 districts and township WSSAs continued reporting through MajIs.
5.2.2 Site Inspections and Data Verifi cation The Authority conducts four types of inspections, namely, Routine Inspection, done regularly to monitor
utilities performance; Inspection for Tariff Review, done during the tariff reviews process; Special Inspection, done to establish the cause of utilities poor performance and Pre-licensing Inspections, done during the course of utilities licensing.
During the reported period, the Authority conducted inspection to a total of 88 WSSAs. Routine inspections were conducted to 15 RWSSAs (Lindi, Mtwara, Kigoma, Bukoba, Bariadi, Musoma, Geita, Bukoba, Songea, Sumbawanga, Mpanda, Babati, Moshi, Dodoma, Tabora), DAWASA and DAWASCO; 3 National Project WSSAs (Makonde, Mugango-Kiabakari and Maswa); and 49 DTWSSAs (Kilindoni, Utete, Liwale, Mkuranga, Ruangwa, Mangaka, Kilwa-masoko, Ushirombo, Isaka, Mwanhuzi, Kishapu, Magu, Bunda, Biharamulo, Ngara, Namtumbo, Tunduru, Ludewa, Makete, Rujewa, Namanyere, Vwawa, Tukuyu, Kyela, Kilolo, Mafi nga, Katesh, Gallapo, Magugu, Mwanga, Muheza, Lushoto, Handeni, Songe, Kibaya, Chamwino, Dakawa, Gairo, Ifakara, Kondoa, Sikonge, Manyoni, Kiomboi, Mbalizi, Tunduma, Mlowo, Kasumulu, Mombo and Turiani).
Inspections during tariff reviews were conducted to 10 RWSSAs (Iringa, Njombe, Moshi, Babati, Arusha, Morogoro, DAWASA, DAWASCO, Mwanza and Bukoba), 2 National Project WSSAs (Chalinze and Masasi-Nachingwea) and 7 DTWSSAs (Kisarawe, Kilwa-Masoko, Mbinga, Ifakara, Kongwa, Mpwapwa and Ngudu).
ANNUAL REPORT FOR THE YEAR ENDED 30TH JUNE, 2016
4848
Major activities conducted during routine inspections and inspections during tariff review were follow ups on implementation of WSSAs’ Business Plans, follow up on compliance to licensing requirements, inspection on performance of infrastructures and verifi cation of data for review of tariff applications. Regarding implementation of Business Plans, it was observed that some of the planned investment projects were not implemented mainly due to failure by WSSAs in achieving targeted revenue collections.
Special performance monitoring inspections were carried out to 3 WSSA’s of Chala, Wanging’ombe and Kibaigwa. The Pre-licence Inspections were conducted for the purpose of verifying and clarifying on all areas that lacked some details on the submitted licence application documents. During the visit, guidance on preparation of Business Plans were provided, which included aspects on Asset Management Plan (AMP). Other aspects of sites inspection included inspecting infrastructures for water sources, water tanks, kiosks and pipeline networks.
Follow-up inspections were conducted to DAWASA, DAWASCO, and 22 WSSAs of Morogoro, Mugango-Kiabakari, Maswa, Kilindoni, Utete, Liwale, Kisarawe, Mkuranga, Karagwe, Tarime, Vwawa, Namanyere, Itumba-Isongole, Chunya, Loliondo, Same, Monduli, Mahenge, Mikumi, Chamwino, Ilula and Mlowo. These inspections were done during data verifi cation for the purpose of preparation of District and Township WSSAs Annual Performance Report prepared and published in November, 2015 as well as Regional and National Projects WSSAs Annual Performance Report prepared and published in December, 2015.
5.3 Review of WSSAs’ Business Plans WSSAs are required to prepare their business plans according to EWURA Business Planning Guidelines
for Water Supply and Sanitation Authorities, 2011 and submit them to EWURA for review. Among other things, WSSAs’ business plans serve as essential tools for operational management and budgeting and securing fi nance for investments. Also, the business plans are among the key documents used by EWURA to set WSSAs’ tariffs and are the bases for EWURA to measure and monitor the performance of the WSSAs in achieving their desired objectives and targets.
During the year under review, the Authority revised business plans from 32 WSSAs namely Iringa, Njombe, Shinyanga, Ngudu, Ifakara, KASHWASA, Mpanda, Kongwa, Mpwapwa, Dodoma, Morogoro, Mpanda, Mbinga, Handeni Trunk Main, Pangani, Korogwe, Lushoto, Muheza, Songe, Katesh, Kibaya, Mwanga, Magugu, Galapo, Chalinze, Masasi-Nachingwea, Utete, Kilwa Masoko, Liwale and Ruangwa. As a result, fi nal Business Plans were submitted from 21 WSSAs namely Iringa, Njombe, Shinyanga, Ngudu, Ifakara, KASHWASA, Mpanda, Kongwa, Mpwapwa, Pangani, Korogwe, Mwanga, Mpwapwa, Kongwa, Igunga, Morogoro, Dodoma, Chalinze, Masasi-Nachingwea, Kilwa Masoko and Ruangwa.
Generally, it was noted that WSSAs have continued to improve the level of compliance to the EWURA Business Planning Guidelines for Water Supply and Sanitation Authorities, 2011 in terms of structure and contents. The revised business plans were used to set tariffs for the WSSAs which applied for tariffs.
5.4 Water Utilities Performance Review Report Pursuant to Section 28(1) of the Water Supply and Sanitation Act, Cap. 272, the Authority prepared
the Water Utilities Performance Report for the fi nancial year 2014/15. The report was prepared in two volumes, the fi rst for DTWSSAs and the second for RWSSAs, DAWASCO and NPWSSAs. The fi rst volume was launched on 24th May, 2016 while the second volume was launched on 17th June, 2016. During launching of the reports, best performing utilities for year 2014/15 were awarded certifi cates and/or trophies. Among others, it was agreed, during launching of the reports, that WSSAs should use
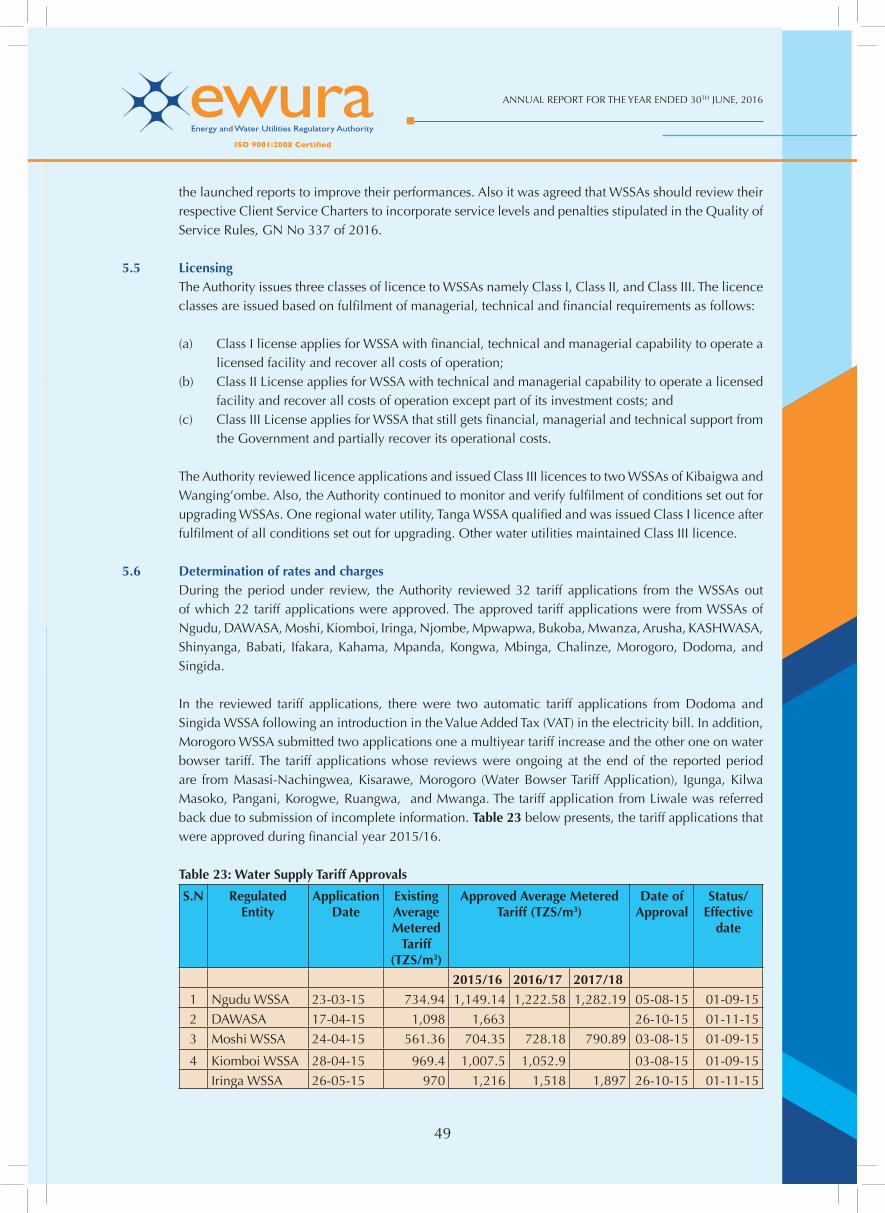
49
ANNUAL REPORT FOR THE YEAR ENDED 30TH JUNE, 2016
49
the launched reports to improve their performances. Also it was agreed that WSSAs should review their respective Client Service Charters to incorporate service levels and penalties stipulated in the Quality of Service Rules, GN No 337 of 2016.
5.5 Licensing The Authority issues three classes of licence to WSSAs namely Class I, Class II, and Class III. The licence
classes are issued based on fulfi lment of managerial, technical and fi nancial requirements as follows:
(a) Class I license applies for WSSA with fi nancial, technical and managerial capability to operate a licensed facility and recover all costs of operation;
(b) Class II License applies for WSSA with technical and managerial capability to operate a licensed facility and recover all costs of operation except part of its investment costs; and
(c) Class III License applies for WSSA that still gets fi nancial, managerial and technical support from the Government and partially recover its operational costs.
The Authority reviewed licence applications and issued Class III licences to two WSSAs of Kibaigwa and Wanging’ombe. Also, the Authority continued to monitor and verify fulfi lment of conditions set out for upgrading WSSAs. One regional water utility, Tanga WSSA qualifi ed and was issued Class I licence after fulfi lment of all conditions set out for upgrading. Other water utilities maintained Class III licence.
5.6 Determination of rates and charges During the period under review, the Authority reviewed 32 tariff applications from the WSSAs out
of which 22 tariff applications were approved. The approved tariff applications were from WSSAs of Ngudu, DAWASA, Moshi, Kiomboi, Iringa, Njombe, Mpwapwa, Bukoba, Mwanza, Arusha, KASHWASA, Shinyanga, Babati, Ifakara, Kahama, Mpanda, Kongwa, Mbinga, Chalinze, Morogoro, Dodoma, and Singida.
In the reviewed tariff applications, there were two automatic tariff applications from Dodoma and Singida WSSA following an introduction in the Value Added Tax (VAT) in the electricity bill. In addition, Morogoro WSSA submitted two applications one a multiyear tariff increase and the other one on water bowser tariff. The tariff applications whose reviews were ongoing at the end of the reported period are from Masasi-Nachingwea, Kisarawe, Morogoro (Water Bowser Tariff Application), Igunga, Kilwa Masoko, Pangani, Korogwe, Ruangwa, and Mwanga. The tariff application from Liwale was referred back due to submission of incomplete information. Table 23 below presents, the tariff applications that were approved during fi nancial year 2015/16.
Table 23: Water Supply Tariff Approvals
S.N Regulated Entity
Application Date
Existing Average Metered
Tariff (TZS/m3)
Approved Average Metered Tariff (TZS/m3)
Date of Approval
Status/ Effective
date
2015/16 2016/17 2017/181 Ngudu WSSA 23-03-15 734.94 1,149.14 1,222.58 1,282.19 05-08-15 01-09-15
2 DAWASA 17-04-15 1,098 1,663 26-10-15 01-11-15
3 Moshi WSSA 24-04-15 561.36 704.35 728.18 790.89 03-08-15 01-09-15
4 Kiomboi WSSA 28-04-15 969.4 1,007.5 1,052.9 03-08-15 01-09-15
Iringa WSSA 26-05-15 970 1,216 1,518 1,897 26-10-15 01-11-15
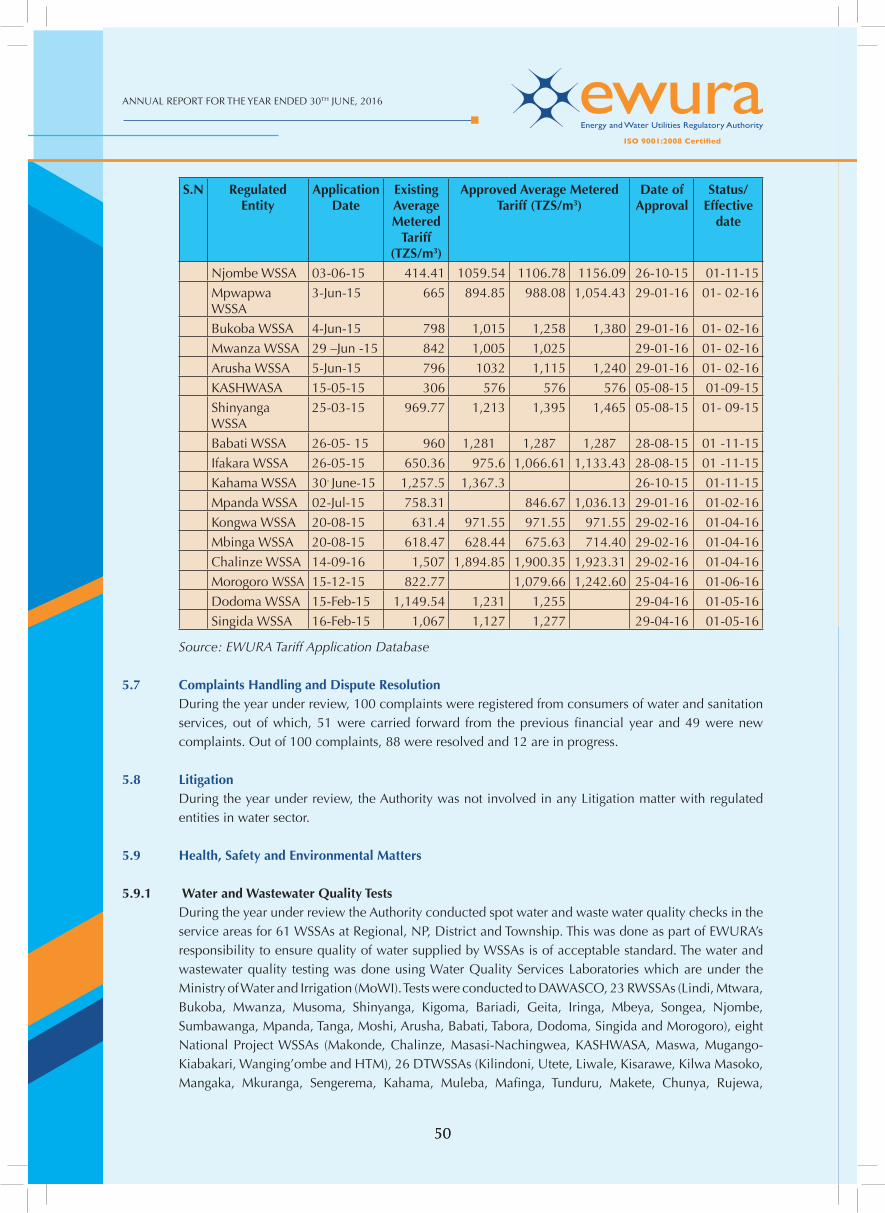
ANNUAL REPORT FOR THE YEAR ENDED 30TH JUNE, 2016
5050
S.N Regulated Entity
Application Date
Existing Average Metered
Tariff (TZS/m3)
Approved Average Metered Tariff (TZS/m3)
Date of Approval
Status/ Effective
date
Njombe WSSA 03-06-15 414.41 1059.54 1106.78 1156.09 26-10-15 01-11-15
Mpwapwa WSSA
3-Jun-15 665 894.85 988.08 1,054.43 29-01-16 01- 02-16
Bukoba WSSA 4-Jun-15 798 1,015 1,258 1,380 29-01-16 01- 02-16
Mwanza WSSA 29 –Jun -15 842 1,005 1,025 29-01-16 01- 02-16
Arusha WSSA 5-Jun-15 796 1032 1,115 1,240 29-01-16 01- 02-16
KASHWASA 15-05-15 306 576 576 576 05-08-15 01-09-15
Shinyanga WSSA
25-03-15 969.77 1,213 1,395 1,465 05-08-15 01- 09-15
Babati WSSA 26-05- 15 960 1,281 1,287 1,287 28-08-15 01 -11-15
Ifakara WSSA 26-05-15 650.36 975.6 1,066.61 1,133.43 28-08-15 01 -11-15
Kahama WSSA 30- June-15 1,257.5 1,367.3 26-10-15 01-11-15
Mpanda WSSA 02-Jul-15 758.31 846.67 1,036.13 29-01-16 01-02-16
Kongwa WSSA 20-08-15 631.4 971.55 971.55 971.55 29-02-16 01-04-16
Mbinga WSSA 20-08-15 618.47 628.44 675.63 714.40 29-02-16 01-04-16
Chalinze WSSA 14-09-16 1,507 1,894.85 1,900.35 1,923.31 29-02-16 01-04-16
Morogoro WSSA 15-12-15 822.77 1,079.66 1,242.60 25-04-16 01-06-16
Dodoma WSSA 15-Feb-15 1,149.54 1,231 1,255 29-04-16 01-05-16
Singida WSSA 16-Feb-15 1,067 1,127 1,277 29-04-16 01-05-16
Source: EWURA Tariff Application Database
5.7 Complaints Handling and Dispute Resolution During the year under review, 100 complaints were registered from consumers of water and sanitation
services, out of which, 51 were carried forward from the previous fi nancial year and 49 were new complaints. Out of 100 complaints, 88 were resolved and 12 are in progress.
5.8 Litigation During the year under review, the Authority was not involved in any Litigation matter with regulated
entities in water sector.
5.9 Health, Safety and Environmental Matters
5.9.1 Water and Wastewater Quality Tests During the year under review the Authority conducted spot water and waste water quality checks in the
service areas for 61 WSSAs at Regional, NP, District and Township. This was done as part of EWURA’s responsibility to ensure quality of water supplied by WSSAs is of acceptable standard. The water and wastewater quality testing was done using Water Quality Services Laboratories which are under the Ministry of Water and Irrigation (MoWI). Tests were conducted to DAWASCO, 23 RWSSAs (Lindi, Mtwara, Bukoba, Mwanza, Musoma, Shinyanga, Kigoma, Bariadi, Geita, Iringa, Mbeya, Songea, Njombe, Sumbawanga, Mpanda, Tanga, Moshi, Arusha, Babati, Tabora, Dodoma, Singida and Morogoro), eight National Project WSSAs (Makonde, Chalinze, Masasi-Nachingwea, KASHWASA, Maswa, Mugango-Kiabakari, Wanging’ombe and HTM), 26 DTWSSAs (Kilindoni, Utete, Liwale, Kisarawe, Kilwa Masoko, Mangaka, Mkuranga, Sengerema, Kahama, Muleba, Mafi nga, Tunduru, Makete, Chunya, Rujewa,
51
ANNUAL REPORT FOR THE YEAR ENDED 30TH JUNE, 2016
51
Vwawa, Usa River, Magugu, Songe, Handeni, Ifakara, Mpwapwa, Kongwa, Kondoa, Nzega, Igunga, Makambako, Mbalizi and Gairo.
The spot tests were conducted to verify the physical, bacteriological and chemical water and wastewater quality data reported by the utilities. Also, the tests were carried out to check whether water supplied and effl uent from waste water systems comply with standards issued by TBS. Quality Parameters tested are pH, turbidity, residual chlorine and faecal coliforms (E-Coli) for drinking water and BOD5 and COD for waste water. Generally, results of the tests showed good compliance to pH and turbidity standards. However, compliance to E-Coli requirements in some of the utilities was found not satisfactory mainly due to failure to maintain the required amount of residual chlorine in their distribution systems. With regard to wastewater, compliance to BOD5 and COD standards was not attained by some of the utilities. As a result of the fi ndings of the water and wastewater quality tests, each utility was given directives for remedial measures whose implementation will be followed up as part of the Authority’s regular monitoring of the performance of water utilities.
5.9.2 Inspection Manual for Water Utilities, 2015 During the year under review, the Authority issued Inspection Manual for Water Utilities, 2015. The
rationale for the preparation of the manual is to have documented and streamlined procedures for inspection of water utilities. The Manual shall serve as a point of reference for EWURA in carrying out inspection and shall provide guidance on all inspections that will be carried out to Water Utilities. The Manual is a result of recognition of the need to effectively and transparently monitor the provision of water supply and sanitation services.
5.10 Capacity Building In a bid to enhance improvement of performance of regulated water utilities, the Authority continued
to implement capacity building measures to water utilities. During the year under review, the Authority conducted training on preparation of Business Plans to 36 DTWSSAs and NPWSSAs namely, Korogwe, Mombo, Handeni, Lushoto, Songe, Pangani, HTM, Magugu, Mbulu, Katesh, Bashnet, Gallapo, Dareda, Kibaya, Kisarawe, Mkuranga, Kilindoni, Utete, Kilwa Masoko, Igunga, Nzega, Urambo, Sikonge, Muleba, Karagwe, Biharamulo, Ngara, Mugumu, Chunya, Kyela, Tukuyu, Vwawa, Mbalizi, Makambako, Kasumulu, and Wanging’ombe.
The training sessions were hands on and have enabled the WSSAs to prepare their Business Plans and submit to EWURA for review. Also, the Authority participated in training sessions for 94 DTWSSAs and NPWSSAs that were supported by GIZ. The training sessions were aimed at imparting technical, commercial and managerial skills for the DTWSSAs and NPWSSAs. EWURA’s input in the training was on Business Planning and MAJIS. Regarding MajIs, the Authority conducted training to six WSSAs which are Songea, Ruangwa, Kilindoni and Mkuranga, Biharamulo and Ngara so as to enhance the knowledge to some staff that were selected to use the system by respective WSSAs.
5.11 Other Interventions in the Water Sector
(a) Water Sector Development Programme During the year under review, the Authority collaborated with the Ministry of Water and Irrigation
(MoWI) and other stakeholders to improve service delivery in WSSAs. This included participation in the Water Sector Development Programme (WSDP) thematic working groups on urban water supply. The activities of the urban water supply thematic group include, setting indicators for monitoring, carrying out joint inspection and evaluation of WSDP projects implemented by
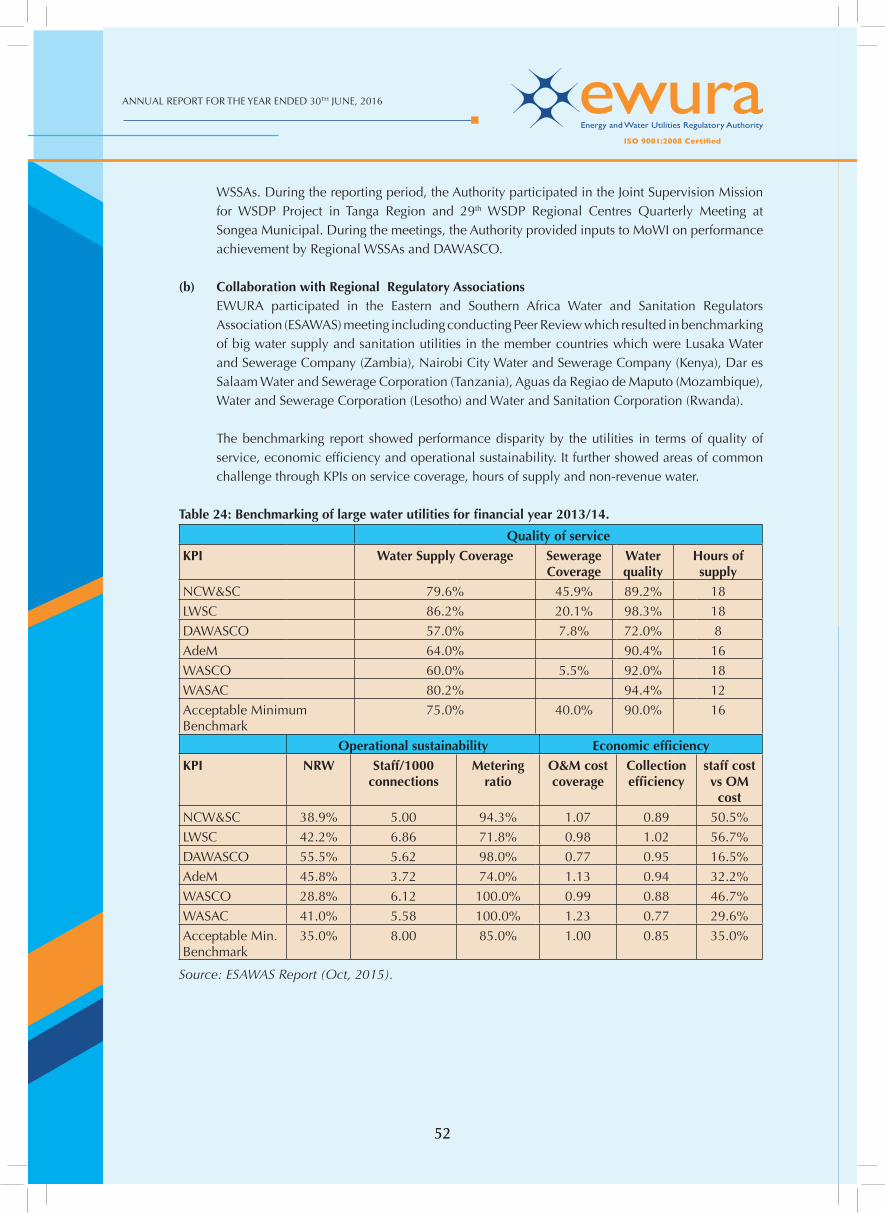
ANNUAL REPORT FOR THE YEAR ENDED 30TH JUNE, 2016
5252
WSSAs. During the reporting period, the Authority participated in the Joint Supervision Mission for WSDP Project in Tanga Region and 29th WSDP Regional Centres Quarterly Meeting at Songea Municipal. During the meetings, the Authority provided inputs to MoWI on performance achievement by Regional WSSAs and DAWASCO.
(b) Collaboration with Regional Regulatory Associations EWURA participated in the Eastern and Southern Africa Water and Sanitation Regulators
Association (ESAWAS) meeting including conducting Peer Review which resulted in benchmarking of big water supply and sanitation utilities in the member countries which were Lusaka Water and Sewerage Company (Zambia), Nairobi City Water and Sewerage Company (Kenya), Dar es Salaam Water and Sewerage Corporation (Tanzania), Aguas da Regiao de Maputo (Mozambique), Water and Sewerage Corporation (Lesotho) and Water and Sanitation Corporation (Rwanda).
The benchmarking report showed performance disparity by the utilities in terms of quality of service, economic effi ciency and operational sustainability. It further showed areas of common challenge through KPIs on service coverage, hours of supply and non-revenue water.
Table 24: Benchmarking of large water utilities for fi nancial year 2013/14.
Quality of service
KPI Water Supply Coverage Sewerage Coverage
Water quality
Hours of supply
NCW&SC 79.6% 45.9% 89.2% 18
LWSC 86.2% 20.1% 98.3% 18
DAWASCO 57.0% 7.8% 72.0% 8
AdeM 64.0% 90.4% 16
WASCO 60.0% 5.5% 92.0% 18
WASAC 80.2% 94.4% 12
Acceptable Minimum Benchmark
75.0% 40.0% 90.0% 16
Operational sustainability Economic effi ciency
KPI NRW Staff/1000 connections
Metering ratio
O&M cost coverage
Collection effi ciency
staff cost vs OM cost
NCW&SC 38.9% 5.00 94.3% 1.07 0.89 50.5%
LWSC 42.2% 6.86 71.8% 0.98 1.02 56.7%
DAWASCO 55.5% 5.62 98.0% 0.77 0.95 16.5%
AdeM 45.8% 3.72 74.0% 1.13 0.94 32.2%
WASCO 28.8% 6.12 100.0% 0.99 0.88 46.7%
WASAC 41.0% 5.58 100.0% 1.23 0.77 29.6%
Acceptable Min. Benchmark
35.0% 8.00 85.0% 1.00 0.85 35.0%
Source: ESAWAS Report (Oct, 2015).
53
ANNUAL REPORT FOR THE YEAR ENDED 30TH JUNE, 2016
53
5.12 Key Achievements and Challenges
5.12.1 Achievements The achievements made by the Authority during the period under review included the following:
(a) The Authority reviewed the EWURA Business Planning Guidelines, 2011. The revised edition shall assist WSSAs to improve the preparation and review of their Business Plans and Tariff Applications;
(b) The Authority issued Inspection Manual for Water Utilities, 2015. The Manual shall serve as a point of reference for EWURA in doing inspection and shall provide guidance on all inspections that will be carried out to Water Utilities.
(c) The Authority reviewed 32 tariff applications submitted by WSSAs out of which 22 were approved; and
(d) The Authority conducted detailed trainings on preparation on Business Plans to 42 DTWSSAs and NPWSSAs at four centres of Babati, Bukoba, Kisarawe and Mbeya.
5.12.2 Challenges The main challenges facing the Authority in regulating the water sector are described below:
(a) low compliance to regulatory directives by District and Township WSSAs due to inadequate of skills, fi nancial resources and manpower. To address this challenge, the Authority shall continue to conduct capacity building workshops to enhance the skills of the DTWSSAs and NPWSSAs on technical, commercial and managerial matters.
(b) low investment in the water supply and sanitation sector which results into a slow pace towards moving to 100% service coverage (currently the coverage is about 86% in urban areas). To address this challenge, EWURA has prepared a Business Planning Guidelines to assists WSSAs to plan towards cost recovery tariffs. EWURA approves a three-year tariff corresponding to the Business plans.
(c) WSSAs are many and diverse in size, capacity and spread out throughout the country. To address this challenge, the Authority shall support the clustering of WSSAs.
ANNUAL REPORT FOR THE YEAR ENDED 30TH JUNE, 2016
5454
6.0 COMMUNICATIONS AND PUBLIC RELATIONS
6.1 Overview Implementation of public awareness programmes and management of public relations is an integral
part of the Authority’s functions in order to enhance public knowledge, awareness and understanding of the regulated sectors.
Public awareness activities performed during the year under review targeted to increase stakeholders’ knowledge on their rights and obligations and complaints handling procedures.
During the period under review, various means of communication channels were used to reach a diversifi ed stakeholders including electronic media, face to face meetings, print media, public hearings and consultations.
6.2 Public Awareness Programmes During the period under review, the Authority aired 53 and 66weekly Television and Radio programmes,
respectively. In contrast with the previous fi nancial year, there has been a notable increase in radio programmes. A diverse of local TV stations were used to air the famous EWURA NA UCHUMI TV Programme, while Radio stations were used to air live interviews and jingles. The Authority also coordinated 24 printed feature articles in various newspapers.
In the same period, the Authority also conducted stakeholders’ seminars in the electricity and petroleum sectors. The seminars for electricity were conducted in Dar es Salam and Arusha regions, targeting Electrical contractors and wiremen. The seminars were aimed at creating awareness to stakeholders on the possible avoidance or reduction of fi re accidents that the Authority has witnessed during the period under review.
For petroleum sector, stakeholders’ public awareness campaign were conducted in Lindi, Mtwara, Songea, Mafi nga, Mbeya, Sumbawanga, Njombe, Iringa, Mwanza, Mara, Geita, Shinyanga and Kigoma.
6.3 Press Conferences and Media Coverage During the period under review, the Authority conducted a total of fi ve press conferences held at
EWURA offi ces for the purpose of communicating to the public on issues related to tariffs, regulated services supply and licensing.
6.4 Advertisements During the period under review, the Authority published 54 batches of various advertisements. The
advertisements were mainly on petroleum cap price and public notices on Licence and tariff applications. Print media was the most used media of advertisement since it is the relatively economical mode of communication.
6.5 Exhibitions The Authority participated in the Dar es Salaam International Trade Fair (DITF) namely Sabasaba. During
the fair, the Authority conducted public awareness, information and education activities where various publications such as brochures, Newsletter and EWURA reports were issued to the public. At the end of seven days exhibitions, the Authority served more than 200 registered visitors at EWURA booth.
55
ANNUAL REPORT FOR THE YEAR ENDED 30TH JUNE, 2016
55
6.6 Publicity Materials During the year under review the Authority facilitated the distribution of EWURA’s education and
information materials to the Government and the general public through various events such as Sabasaba exhibitions, Public inquiry meetings and in stakeholders’ meetings.
The Authority also facilitated the printing of promotional materials such as Wall Calendars, Executive Diaries, Notebooks, branded pens and EWURA T-shirts.
During the year under review, the Authority also facilitated the publication and distribution of EWURA Annual report, Water sector reports Volume I and II, Petroleum subsector report, Customer Service Charter and EWURA Newsletters.
6.7 Donations and contributions The Authority makes donations and contributions to various institutions to support activities of national
interest in line with its donation and contribution policy. The involvement of the Authority in offering Donations and Contributions has continued to enhance its image and values to the public.
During the period under review, the Authority supported various institutions that included Heart Foundation of Tanzania, Mvuti Secondary School, Tanzania Women Judges, Mwanza Regional Offi ce, Dar es Salaam Regional Offi ce, National Committee for UNESCO, Presidents Offi ce Public Service Management, Ikwiriri Children Homes, and Institute for Internal Auditors. The Authority also supports higher learning education initiatives in the country whereby it offered fi eld attachment to 49 students of various disciplines.
6.8 Impact of Public Awareness Campaigns There was a general trend of increased recognition of the Authority’s activities by the public and the
regulated suppliers. Through public awareness campaigns regulated suppliers are becoming compliant with the licensing conditions. In other way there has been an increased complains from various consumers of the regulated services.
The outcome of such awareness programmes is an increased number of inquiries and consultations on issues related to regulations, from both consumers as well as potential investors, on one hand, and cemented relationship between the Authority and Service providers, on the other.
6.9 Key Achievement and Challenges
6.9.1 Key Achievements
(a) The Authority continued to maintain good rapport with its stakeholders, including its peers, Gov-ernment institutions, politicians, regulated entities, the media and the general public.
(b) Various programmes targeting increased public awareness have been implemented as scheduled, thereby increasing the public knowledge and understanding the regulated sectors.
6.9.2 Key Challenges
(a) The high cost of newspapers, radio and television media of communication makes public awareness a costly activity, therefore limiting the Authority from effectively extending its plans
ANNUAL REPORT FOR THE YEAR ENDED 30TH JUNE, 2016
5656
on public awareness campaigns. THE Authority will endeavour to allocate enough resources to undertake the public awareness activities.
(b) Insuffi cient public knowledge in understanding of rights and obligations of consumers and regulated suppliers. The Authority shall continue to strengthen the implementation of public awareness programme to address this challenge.
(c) The geographical size of the country, coupled with poor communication infrastructure continued to have negative impact on television and radio coverage. In order to contain this challenge, the Authority is exploring ways of reaching the rural public using local government network and EWURA zonal offi ces.
7.0 STAKEHOLDERS CONSULTATIONS
The Authority conducted various stakeholders’ consultations during the year under review as they are a crucial part in the decision making process. Stakeholders involved during this fi nancial year included the Consumer Consultative Council (CCC), Government Consultative Council (GCC), Ministries and Government Departments, regulated entities, media and the general public.
During the period under review, the Authority developed 18 regulatory tools of which stakeholders were fully involved through consultations. The Authority also conducted 12 public inquiry meetings of which six related to water, one to electricity, four to petroleum and one to Natural Gas operations.
8.0 DECLARATION OF CONFLICT OF INTEREST
The Authority did not register any confl ict of interest from Board Members and staff while discharging their duties during the year under review.
9.0 THE WAY FORWARD
The regulatory decisions made by the Authority continued to support the Government’s efforts to eradicate poverty and strive to attract investments in the regulated sectors and enhance the socio-economic welfare of the Tanzanian society through delivery of quality services.
The Authority aims at taking measures to achieve the necessary impact as listed below:
(a) To continue implementing the Strategic Plan 2012/13-2016/17 that guides the Authority’s operations for the remaining period of the plan and prepare a new one that will guide future operations and enhancing service delivery to the public.
(b) To make sure the Authority continues to be the best centre for attracting investments in the regulated sectors by creating an enabling environment to all investors.
(c) To ensure that there is the highest level of compliance by all regulated operators. (d) To continue with the capacity building activities for the Authority’s staff in technical, managerial
as well as regulatory skills, in order to execute regulatory duties effectively and effi ciently; (e) Continue improving service delivery to the public by implementing the EWURA Client Service
Charter, quality standards under ISO certifi cation and the Open Performance Review and Appraisal System (OPRAS).
(f) To promote investment in the energy and water sectors through development of investor friendly regulatory tools.
(g) Continue enhancing public knowledge, awareness and understanding of regulatory functions in
57
ANNUAL REPORT FOR THE YEAR ENDED 30TH JUNE, 2016
57
the regulated sectors for the benefi t of consumers, regulated operators, Government offi cials and the public at large
(h) To strengthen working relationships and collaborating with other government institutions and the private sector in order to improve the business environment.
(i) Intensifying inspections in order to improve the quality of the infrastructure, products and services in the regulated sectors.
(j) Expanding EWURA operations by establishing and strengthening zonal offi ces. In the next fi nancial year zonal offi ces of Southern Highlands (Mbeya); Northern (Arusha); and Central (Dodoma) are planned to be established.
(k) Promoting investment in LPG infrastructure so that the market expands to other regions in the current.
(l) Computerizing various processes in order to expedite issuing of license, tariff review, revenue collection and submission of reports by the regulated providers. Currently, EWURA has been able to develop various information systems including Licencing and Order Information System (LOIS), Water Sector Information System(Majis), National Petroleum Information System (NPIS), and Electricity Regulatory Information System (ERIS).
(m) Acquiring own offi ce space in order to minimize costs. (n) To develop more regulatory tools as and when required in order for consumers and regulated
suppliers to comply with issues of standards on the one hand and enhancing transparency and predictability to all stakeholders on the other hand.
ANNUAL REPORT FOR THE YEAR ENDED 30TH JUNE, 2016
5858
59
ANNUAL REPORT FOR THE YEAR ENDED 30TH JUNE, 2016
59
10.0 REPORT FROM THE CONTROLLER AND AUDITOR GENERAL
THE UNITED REPUBLIC OF TANZANIA
NATIONAL AUDIT OFFICE
REPORT OF THE CONTROLLER AND AUDITOR GENERAL ON THE
FINANCIAL STATEMENTS OF ENERGY AND WATER UTILITIES REGULATORY
AUTHORITY FOR THE YEAR ENDED 30TH JUNE, 2016
The Controller and Auditor General,National Audit Offi ce,16 Samora Avenue/Ohio Street,P.O. Box 9080,11101 Dar es salaam, Tanzania.
Telegram: ‘’Ukaguzi’’Tel: 255 (022) 2115157/8,Fax: 255 (022) 2117527,E-mail: [email protected]: www.nao.go.tz
December, 2016 AR/EWURA/2016
ANNUAL REPORT FOR THE YEAR ENDED 30TH JUNE, 2016
6060
TABLE OF CONTENTS
Offi ce of the Contoller and Auditor General ................................................................................................... 61
Abbreviations and Acronyms .......................................................................................................................... 62
1.0. INTRODUCTION .............................................................................................................................. 63
2.0. ESTABLISHMENT .............................................................................................................................. 63
3.0. VISION .............................................................................................................................................. 63
4.0. MISSION ........................................................................................................................................... 63
5.0. PRINCIPAL ACTIVITIES ...................................................................................................................... 63
6.0. COMPOSITION OF THE BOARD OF DIRECTORS ............................................................................ 63
7.0. CORPORATE GOVERNANCE ............................................................................................................ 64
8.0. BOARD COMMITTEES ...................................................................................................................... 64
9.0. RELATED PARTY TRANSACTIONS .................................................................................................... 65
10.0. MANAGEMENT ................................................................................................................................. 65
11.0. KEY STRENGHTH AND RESOURCES ................................................................................................ 66
12.0. OPERATIONAL AND FINANCIAL PERFORMANCE ........................................................................... 67
13.0. RECRUITMENT ................................................................................................................................. 74
14.0. RISK MANAGEMENT AND CONTROL ............................................................................................. 74
15.0. STAFF WELFARE ................................................................................................................................ 75
16.0. EMPLOYEE BENEFIT PLAN ................................................................................................................ 75
17.0. GENDER PARITY ............................................................................................................................... 75
18.0. POLITICAL DONATIONS .................................................................................................................. 75
19.0. CORPORATE SOCIAL RESPONSIBILITIES ......................................................................................... 76
20.0. RELATED PARTY................................................................................................................................ 76
21.0. ENVIRONMENTAL CONTROL PROGRAMME .................................................................................. 76
22.0. PERSONS WITH DISABILITIES .......................................................................................................... 76
23.0. KEY CHALLENGES AND THE WAY FORWARD ................................................................................. 76
24.0. EVENTS AFTER THE REPORTING PERIOD ........................................................................................ 77
25.0. SOLVENCY ........................................................................................................................................ 78
26.0. AUDIT MANDATE ............................................................................................................................. 78
27.0. STATEMENT OF DIRECTORS’ RESPONSIBILITIES ............................................................................. 79
28.0. NOTES TO THE FINANCIAL STATEMENTS ........................................................................................ 88
61
ANNUAL REPORT FOR THE YEAR ENDED 30TH JUNE, 2016
61
Offi ce of the Controller and Auditor General
National Audit Offi ce
The United Republic of Tanzania
(Established under Article 143 of the Constitution of the URT)
The statutory duties and responsibilities of the controller and Auditor General are enshrined under Article 143 of the Constitution of the URT of 1977 and further amplifi ed under Sect. 10 of the Public Audit Act No. 11 of 2008.
VisionTo be a Centre of excellence in public sector auditing.
MissionTo provide effi cient audit services in order to enhance accountability and value for money in the collection and use of public resources.
In providing quality services, NAO is guided by the following Core Values:
ü Objectivity: We are an impartial organization, offering services to our clients in an objective and unbiased manner;
ü Excellence: We are professionals providing high quality audit services based on best practices;
ü Integrity: We observe and maintain high standards of ethical behaviour and the rule of law;
ü People focus: We focus on stakeholders’ needs building a culture of good customer care having competent and motivated work force;
ü Innovation: We are a creative organization that constantly promotes a culture of developing and accepting new ideas from inside and outside the organization; and
ü Best resource utilization: We are an organization that values and uses public resources entrusted to it in effi cient, economic and effective manner.
We do this by: -
• Contributing to better stewardship of public funds by ensuring that our clients are accountable for the resources entrusted to them;
• Helping to improve the quality of public services by supporting innovation on the use of public resources;• Providing technical advice to our clients on operational gaps in their operating systems;• Systematically involve our clients in the audit process and audit cycles; and• Providing audit staff with adequate working process tools and facilities that promote independence.
© This audit report is intended for use by the EWURA Management. However, upon adoption of the report by the EWURA this report becomes a matter of public record and its distribution may not be limited.
ANNUAL REPORT FOR THE YEAR ENDED 30TH JUNE, 2016
6262
Abbreviations and Acronyms
AFUR : African Forum for Utility Regulators
ARAATAWAS
::
African Refi ners Association
Association of Tanzania Water Suppliers
CAG : Controller and Auditor General
DPs : Development Partners
DTWSSA : District and Township Water Supply Sanitation Authority
EREA : Energy Regulators Association of East Africa
ESAWAS : Eastern and Southern Africa Water and Sanitation Regulators Association
ESI : Electricity Sector Industry
EWURA : Energy and Water Utilities Regulatory Authority
FCT : Fair Competition Tribunal
GEPF : Government Employees Provident Fund
GIZ : Deutche Gesellschaft fur International Zusammernarbeit
GPA : Group Personal Accident
HIV/AIDS : Human Immunodefi ciency Virus/Acquired Immune Defi ciency Syndrome
IDA : International Development Association
IFRIC : International Financial Reporting Interpretations Committee
ISA : International Standards on Auditing
ISSAIs : International Standards of Supreme Audit Institutions
LAPF : Local Authorities Pensions Fund
LPG : Liquefi ed Petroleum Gas
MoWI : Ministry of Water and Irrigation
NAO : National Audit Offi ce
NARUC : National Association of Regulatory Utility Commissioners
NSSF : National Social Security Fund
NPWSSA : National Project Water Supply and Sanitation Authority
PAA : Public Audit Act 2008
PPA : Public Procurement Act, 2011
PPF : Parastatal Pension Fund
PPP : Public Private Partnership
PSPF : Public Service Pensions Fund
RERA : Regional Electricity Regulators Association
TBS : Tanzania Bureau of Standards
TZS : Tanzania Shillings
URT : United Republic of Tanzania
WSSAs : Water Supply and Sanitation Authorities
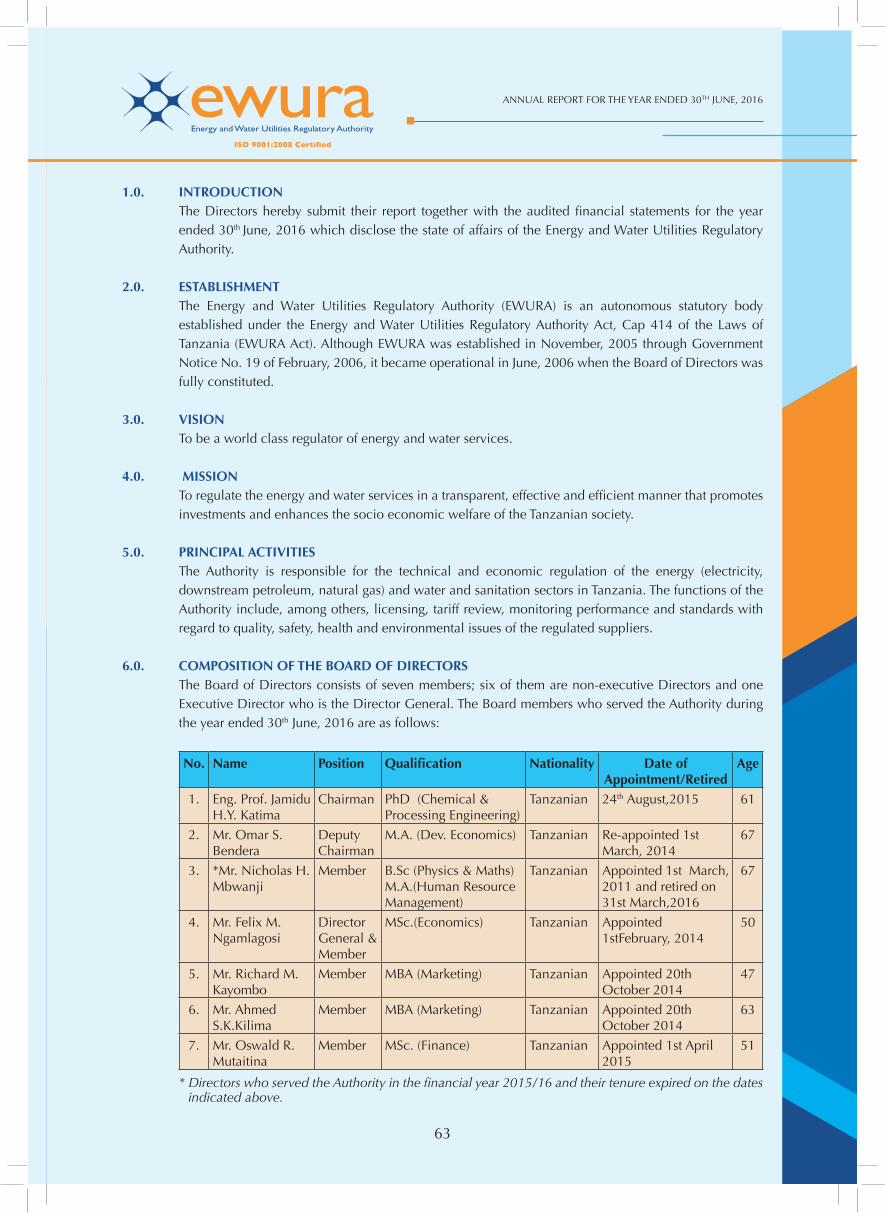
63
ANNUAL REPORT FOR THE YEAR ENDED 30TH JUNE, 2016
63
1.0. INTRODUCTION The Directors hereby submit their report together with the audited fi nancial statements for the year
ended 30th June, 2016 which disclose the state of affairs of the Energy and Water Utilities Regulatory Authority.
2.0. ESTABLISHMENT The Energy and Water Utilities Regulatory Authority (EWURA) is an autonomous statutory body
established under the Energy and Water Utilities Regulatory Authority Act, Cap 414 of the Laws of Tanzania (EWURA Act). Although EWURA was established in November, 2005 through Government Notice No. 19 of February, 2006, it became operational in June, 2006 when the Board of Directors was fully constituted.
3.0. VISION To be a world class regulator of energy and water services.
4.0. MISSION To regulate the energy and water services in a transparent, effective and effi cient manner that promotes
investments and enhances the socio economic welfare of the Tanzanian society.
5.0. PRINCIPAL ACTIVITIES The Authority is responsible for the technical and economic regulation of the energy (electricity,
downstream petroleum, natural gas) and water and sanitation sectors in Tanzania. The functions of the Authority include, among others, licensing, tariff review, monitoring performance and standards with regard to quality, safety, health and environmental issues of the regulated suppliers.
6.0. COMPOSITION OF THE BOARD OF DIRECTORS The Board of Directors consists of seven members; six of them are non-executive Directors and one
Executive Director who is the Director General. The Board members who served the Authority during the year ended 30th June, 2016 are as follows:
No. Name Position Qualifi cation Nationality Date of Appointment/Retired
Age
1. Eng. Prof. Jamidu H.Y. Katima
Chairman PhD (Chemical & Processing Engineering)
Tanzanian 24th August,2015 61
2. Mr. Omar S. Bendera
Deputy Chairman
M.A. (Dev. Economics) Tanzanian Re-appointed 1st March, 2014
67
3. *Mr. Nicholas H. Mbwanji
Member B.Sc (Physics & Maths) M.A.(Human Resource Management)
Tanzanian Appointed 1st March, 2011 and retired on 31st March,2016
67
4. Mr. Felix M. Ngamlagosi
Director General & Member
MSc.(Economics) Tanzanian Appointed 1stFebruary, 2014
50
5. Mr. Richard M. Kayombo
Member MBA (Marketing) Tanzanian Appointed 20th October 2014
47
6. Mr. Ahmed S.K.Kilima
Member MBA (Marketing) Tanzanian Appointed 20th October 2014
63
7. Mr. Oswald R. Mutaitina
Member MSc. (Finance) Tanzanian Appointed 1st April 2015
51
* Directors who served the Authority in the fi nancial year 2015/16 and their tenure expired on the dates indicated above.
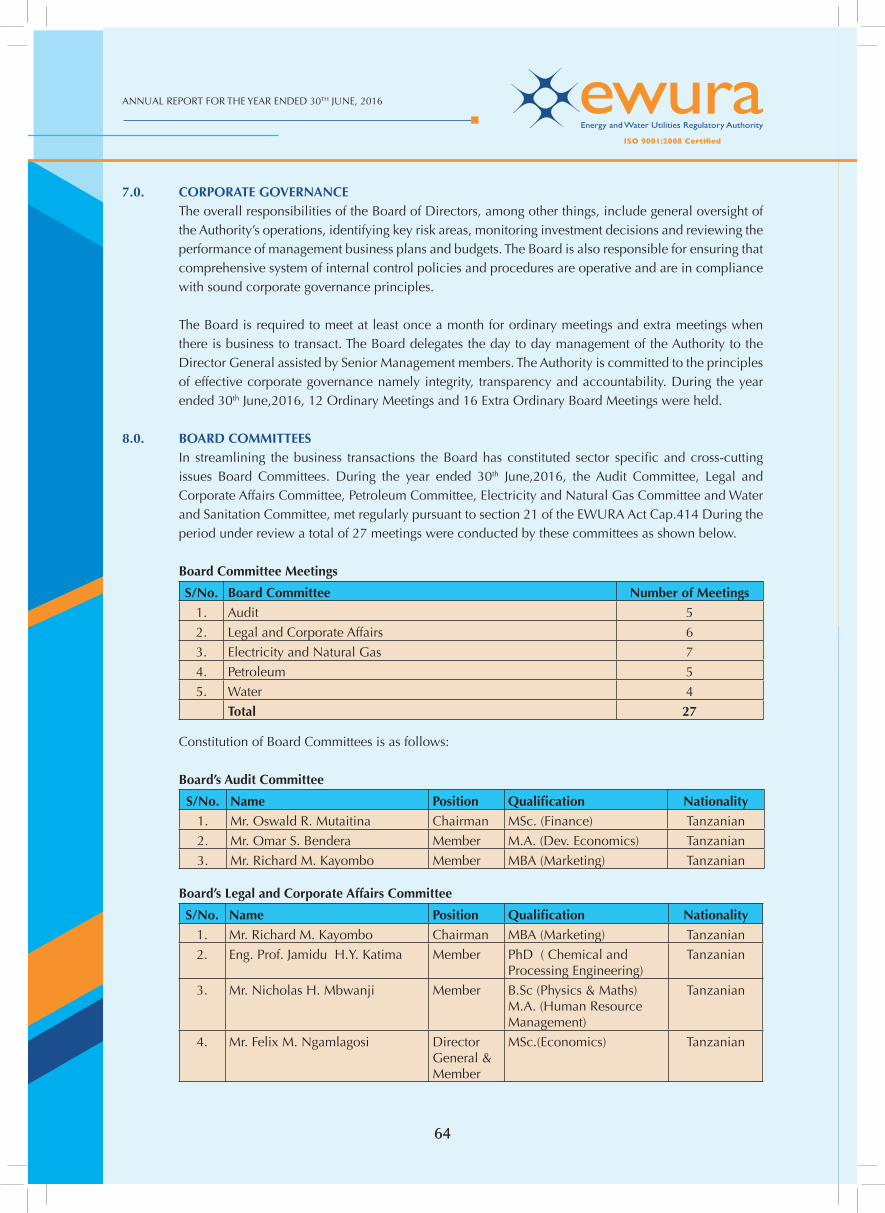
ANNUAL REPORT FOR THE YEAR ENDED 30TH JUNE, 2016
6464
7.0. CORPORATE GOVERNANCE The overall responsibilities of the Board of Directors, among other things, include general oversight of
the Authority’s operations, identifying key risk areas, monitoring investment decisions and reviewing the performance of management business plans and budgets. The Board is also responsible for ensuring that comprehensive system of internal control policies and procedures are operative and are in compliance with sound corporate governance principles.
The Board is required to meet at least once a month for ordinary meetings and extra meetings when there is business to transact. The Board delegates the day to day management of the Authority to the Director General assisted by Senior Management members. The Authority is committed to the principles of effective corporate governance namely integrity, transparency and accountability. During the year ended 30th June,2016, 12 Ordinary Meetings and 16 Extra Ordinary Board Meetings were held.
8.0. BOARD COMMITTEES In streamlining the business transactions the Board has constituted sector specifi c and cross-cutting
issues Board Committees. During the year ended 30th June,2016, the Audit Committee, Legal and Corporate Affairs Committee, Petroleum Committee, Electricity and Natural Gas Committee and Water and Sanitation Committee, met regularly pursuant to section 21 of the EWURA Act Cap.414 During the period under review a total of 27 meetings were conducted by these committees as shown below.
Board Committee Meetings
S/No. Board Committee Number of Meetings1. Audit 5
2. Legal and Corporate Affairs 6
3. Electricity and Natural Gas 7
4. Petroleum 5
5. Water 4
Total 27
Constitution of Board Committees is as follows:
Board’s Audit Committee
S/No. Name Position Qualifi cation Nationality1. Mr. Oswald R. Mutaitina Chairman MSc. (Finance) Tanzanian
2. Mr. Omar S. Bendera Member M.A. (Dev. Economics) Tanzanian
3. Mr. Richard M. Kayombo Member MBA (Marketing) Tanzanian
Board’s Legal and Corporate Affairs Committee
S/No. Name Position Qualifi cation Nationality1. Mr. Richard M. Kayombo Chairman MBA (Marketing) Tanzanian
2. Eng. Prof. Jamidu H.Y. Katima Member PhD ( Chemical and Processing Engineering)
Tanzanian
3. Mr. Nicholas H. Mbwanji Member B.Sc (Physics & Maths) M.A. (Human Resource Management)
Tanzanian
4. Mr. Felix M. Ngamlagosi Director General & Member
MSc.(Economics) Tanzanian
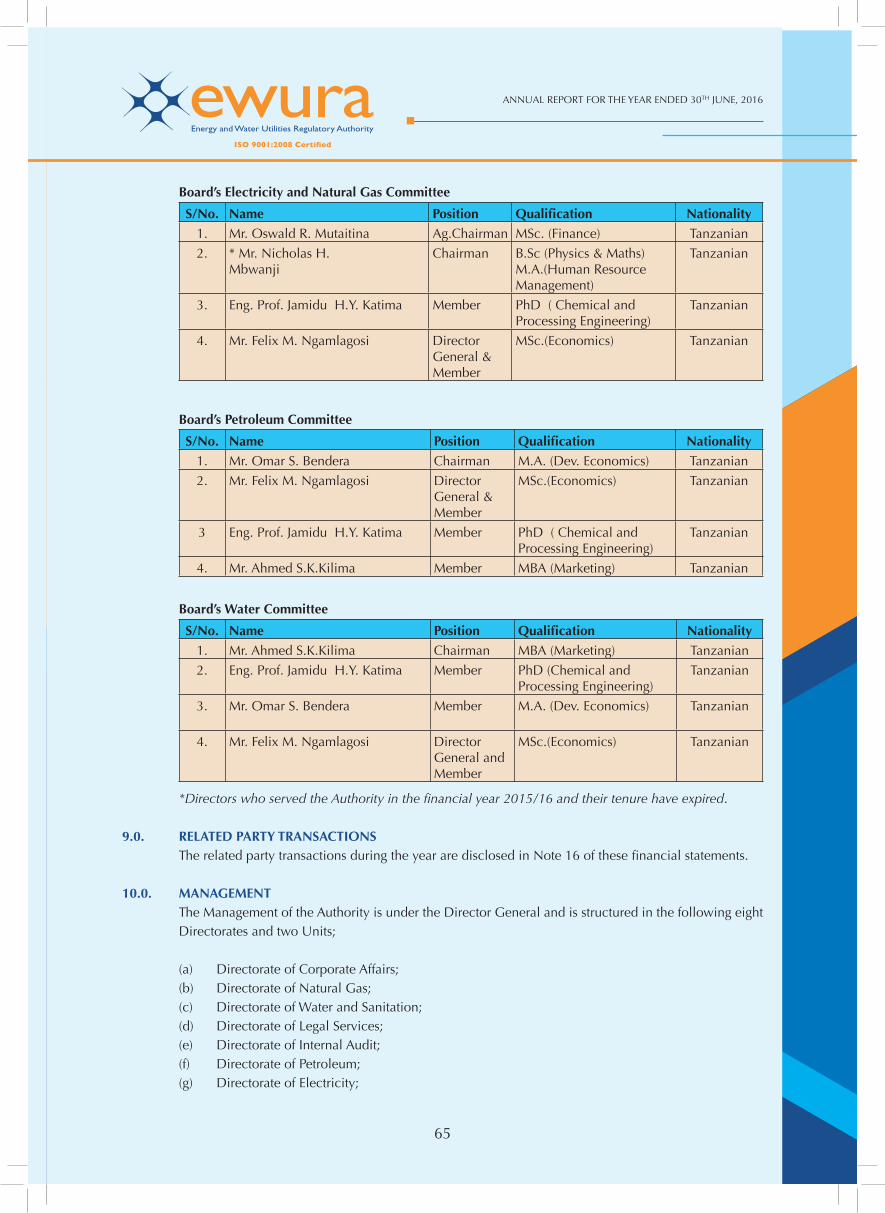
65
ANNUAL REPORT FOR THE YEAR ENDED 30TH JUNE, 2016
65
Board’s Electricity and Natural Gas Committee
S/No. Name Position Qualifi cation Nationality1. Mr. Oswald R. Mutaitina Ag.Chairman MSc. (Finance) Tanzanian
2. * Mr. Nicholas H.Mbwanji
Chairman B.Sc (Physics & Maths) M.A.(Human Resource Management)
Tanzanian
3. Eng. Prof. Jamidu H.Y. Katima Member PhD ( Chemical and Processing Engineering)
Tanzanian
4. Mr. Felix M. Ngamlagosi Director General & Member
MSc.(Economics) Tanzanian
Board’s Petroleum Committee
S/No. Name Position Qualifi cation Nationality1. Mr. Omar S. Bendera Chairman M.A. (Dev. Economics) Tanzanian
2. Mr. Felix M. Ngamlagosi Director General & Member
MSc.(Economics) Tanzanian
3 Eng. Prof. Jamidu H.Y. Katima Member PhD ( Chemical and Processing Engineering)
Tanzanian
4. Mr. Ahmed S.K.Kilima Member MBA (Marketing) Tanzanian
Board’s Water Committee
S/No. Name Position Qualifi cation Nationality1. Mr. Ahmed S.K.Kilima Chairman MBA (Marketing) Tanzanian
2. Eng. Prof. Jamidu H.Y. Katima Member PhD (Chemical and Processing Engineering)
Tanzanian
3. Mr. Omar S. Bendera Member M.A. (Dev. Economics) Tanzanian
4. Mr. Felix M. Ngamlagosi Director General and Member
MSc.(Economics) Tanzanian
*Directors who served the Authority in the fi nancial year 2015/16 and their tenure have expired.
9.0. RELATED PARTY TRANSACTIONS The related party transactions during the year are disclosed in Note 16 of these fi nancial statements.
10.0. MANAGEMENT The Management of the Authority is under the Director General and is structured in the following eight
Directorates and two Units;
(a) Directorate of Corporate Affairs; (b) Directorate of Natural Gas; (c) Directorate of Water and Sanitation; (d) Directorate of Legal Services; (e) Directorate of Internal Audit; (f) Directorate of Petroleum; (g) Directorate of Electricity;
ANNUAL REPORT FOR THE YEAR ENDED 30TH JUNE, 2016
6666
(h) Directorate of Regulatory Economics (i) Communication and Public Relations Unit; and (j) Procurement Management Unit.
11.0. KEY STRENGHTH AND RESOURCES The Authority continues to give its top priority to key resources which are people, tangible and
intangible resources such as state of the art technology which contribute in strengthening service delivery, productivity and fi nancial sustainability. These strengths and resources are explained briefl y in the following paragraphs;
11.1 Human Resources and Customer Care Customer satisfaction is mostly anchored on people and hence employees continue to be the most
important assets. Their zeal, hardworking and commitments have made the Authority to perform professionally well. The Authority has skilled, motivated and experienced employees who are considered as key resources in pursuing its objectives. The Authority encourages and supports capacity building programmes to impart the required knowledge to employees to give them an edge in performing their activities. During the year under review 81 staff were sponsored by the Authority to attend to different trainings within and outside the country. The Authority also encourages employee participation in decision making processes and encourages open and honest communications.
11.2 Cooperation and Support from various Stakeholders The Authority has internal and external stakeholders and has been encouraging harmonious
relationship with them. Their support and involvement in EWURA activities makes a signifi cant impact and contribution to service delivery to the public. The Authority has continued receiving enormous support from the Ministry of Water and Irrigation, Ministry of Energy and Minerals, EWURA Consumer Consultative Council (EWURA CCC), Government Consultative Council, Tanzania Oil Marketing Companies (TAOMAC), Association of Tanzania Water Suppliers (ATAWAS), Ministry of Finance, Treasury Registrar, Police and other Regulatory Authorities in the country.
The Authority has strong ties and working relationships with relevant International organisations such as AFUR, EREA, RERA, NARUC and GIZ.
11.3 Legal Framework In discharging its duties and functions, the Authority is guided by its establishing Act and Subsidiary
legislations in the Water and Sanitation, Electricity and Petroleum. The EWURA Act, Cap. 414 together with sector legislation, govern the conduct of the activities of the Authority. The sector legislation includes the Electricity Act, Cap. 131, Water and Sanitation Act, Cap. 272, DAWASA Act, Cap. 273 and the Petroleum Act, 2015. These tools were key and useful during the fi nancial year under review.
11.4 Financial Performance and Sustainability The Authority’s sources of revenue are provided under Section 43(1) of the establishing Act Cap 414.
The funds and resources of the Authority consist of:
(a) fees collected by the Authority including, fees payable for the grant and renewal of licences; (b) levies collected from regulated suppliers; (c) all other payments or property due to the Authority in respect of any matter incidental to its
functions; and (d) any grants, donations, bequest or other contributions made to the Authority
67
ANNUAL REPORT FOR THE YEAR ENDED 30TH JUNE, 2016
67
The Authority has been earning and administering its revenues prudently. During the year the Authority earned a total revenue of TZS 45.3bn (2015: 38.7bn) an increment of 17%. The Authority spent a total of TZS 36.8bn (2015: 27.5bn) on recurrent expenditure out of the revenue. The level of revenue and the instituted internal controls has enabled the Authority to discharge its regulatory functions and meet its customers and stakeholders expectations.
12.0. OPERATIONAL AND FINANCIAL PERFORMANCE During the year, EWURA focused on the implementation of its strategic objectives which guide the
Authority in achieving its vision and mission, championing good governance and facilitating the attainment of vibrant and thriving energy and water sectors in Tanzania.
The Strategic Objectives which are also its Key Performance Indicators are as follows:
(a) To have a Least - Cost Investments framework for electricity, natural gas, water and petroleum regulated sectors;
(b) To ensure EWURA’s functions are effi ciently and effectively managed; (c) To have public knowledge, awareness and understanding of the regulatory functions and the
regulated sectors enhanced; (d) To have quality service standards and codes of regulated sectors of electricity, water and petroleum
enforced; and (e) To have an effective intervention strategy against HIV/AIDS for enhanced productivity.
During the year, the Authority continued implementing its Strategic Plan for the year 2012/13 – 2016/17 that guided the Authority’s operations in fi ve years period.
12.1 Achievements During the year, the Authority witnessed signifi cant achievements in mobilization of fi nancial and non-
fi nancial resources as follows;
(a) The Authority received an ISO (International Organisation of Standardisation) certifi cate ISO 9001:2008 through Certifi cate Identity Number TZ15/90332.
(b) The Authority continued to review various regulatory tools and develop new ones. Most of the tools were developed to meet the requirements of the Electricity Supply Industry (ESI) Reform Strategy and Roadmap with technical assistance from EU and the new Petroleum Act, 2015.
(c) The Authority continued to implement the Bulk Procurement System of petroleum products and facilitated its operations.
(d) The Authority continued to conduct monitoring and inspection of its regulated sectors. This has improved the quality of regulated products, services, and standards of infrastructure.
(e) The Authority continued to cooperate with other Government institutions such as Tanzania Bureau of Standards (TBS), National Environment Management Council (NEMC), Tanzania Revenue Authority (TRA) and Police Force, on matters that required EWURA’s cooperation or intervention, or vice versa, for the country’s interest.
(f) The Authority conducted detailed trainings on preparation of business plans to 42 district towns and national projects Water Supply and Sanitation Authorities (WSSAs) at four centers of Babati, Bukoba, Kisarawe and Mbeya. A signifi cant number of water utilities have been able to plan using comprehensive business planning guidelines.
(g) The Authority continued with licensing activities on its regulated sectors where 21 construction approvals were issued, 201 new licenses were issued, 124 licenses were renewed, 16 licenses
ANNUAL REPORT FOR THE YEAR ENDED 30TH JUNE, 2016
6868
were transferred, and six (6) licenses were revoked. This was across all the regulated sectors. (h) The Authority attended to complaints against suppliers of regulated goods or services in relation
to any matter connected with the supply, possible supply or proposed supply of goods or services. During the year, 16 complaints in the petroleum sub-sector, 95 in the electricity sub-sector and 96 in the water and sanitation sector were resolved. At the end of the year 95 complaints were at various stages of mediation and hearing.
(i) The Authority continued to conduct public awareness campaigns and seminars on the roles and responsibilities of the Authority, rights and obligations of the service providers and consumers and complaints handling mechanism.
(j) The Authority developed a Client Service Charter which is used to guide on the measure of the level of customer satisfaction.
(k) The Authority reviewed 32 tariff applications from Water Supply and Sewerage Authorities, two (2) applications from the electricity sub-sector specifi cally from TANESCO and Armstone Co. Ltd, reviewed the Small Power Projects Tariff (SPPT) for 2016; and had four (4) matters regarding review of petroleum pricing formula.
(l) The Authority approved the importation of petroleum products through Tanga port and reviewed the petroleum products pricing rules accordingly.
(m) The Authority facilitated the establishment of mobile phone SMS application that enables customers and general public to access petroleum products prices published through mobile phones;
(n) The Authority established the Licensing and Ordering Information System (LOIS) for the purpose of electronic management of the licences, compliance orders, complaints and tariff reviews;
(o) The Authority managed to get a Title Deed for its plot No.1/4 Block L Ubungo. (p) The Authority successfully made disbursements to EWURA Consumer Consultative Council
(CCC), Fair Competition Tribunal (FCT), Fair Competition Commission (FCC), and the Treasury. (q) The Authority successfully relocated its Head Offi ce from the City Center to LAPF Towers at
Kijitonyama in Dar es Salaam and thereafter paid all expenditures to facilitate conducive working environment at the new Offi ce.
(r) The Authority recruited twenty (20) new staff to fi ll various positions for its Head Offi ce and Zonal offi ce in Mwanza.
(s) The Authority paid annual subscriptions to various bodies including Platts/McGraw Hill, African Refi neries Association (ARA), Eastern and Southern Africa Water and Sanitation Regulators Association (ESAWAS), Regional Electricity Regulators Association (RERA), Independent Regulatory Board - East African Power Pool (IRB-EAPP), African Forum of Utility Regulators (AFUR), Institute of Internal Auditors, Tanganyika Law Society, National Board of Auditors and Accountants (NBAA) and Tanganyika Library Association. A total of TZS 229 million was spent on this activity.
(t) The Authority strengthened its Lake Zonal Offi ce in Mwanza through recruitment and procurement of working tools and set aside funds to open up three new zonal offi ces in Mbeya, Arusha and Dodoma during the fi nancial year, 2016/17.
12.2 Financing The Authority’s operations are fi nanced mainly through levies collected from regulated service providers
in the energy sector (electricity, downstream petroleum, natural gas) and water and sanitation sector. Other sources of fi nancing include licence fees and application fees.
During the year under review total revenue amounting to TZS 45.3 billion was earned indicating an increase of 17% compared to the previous year as shown in Table 1 below.
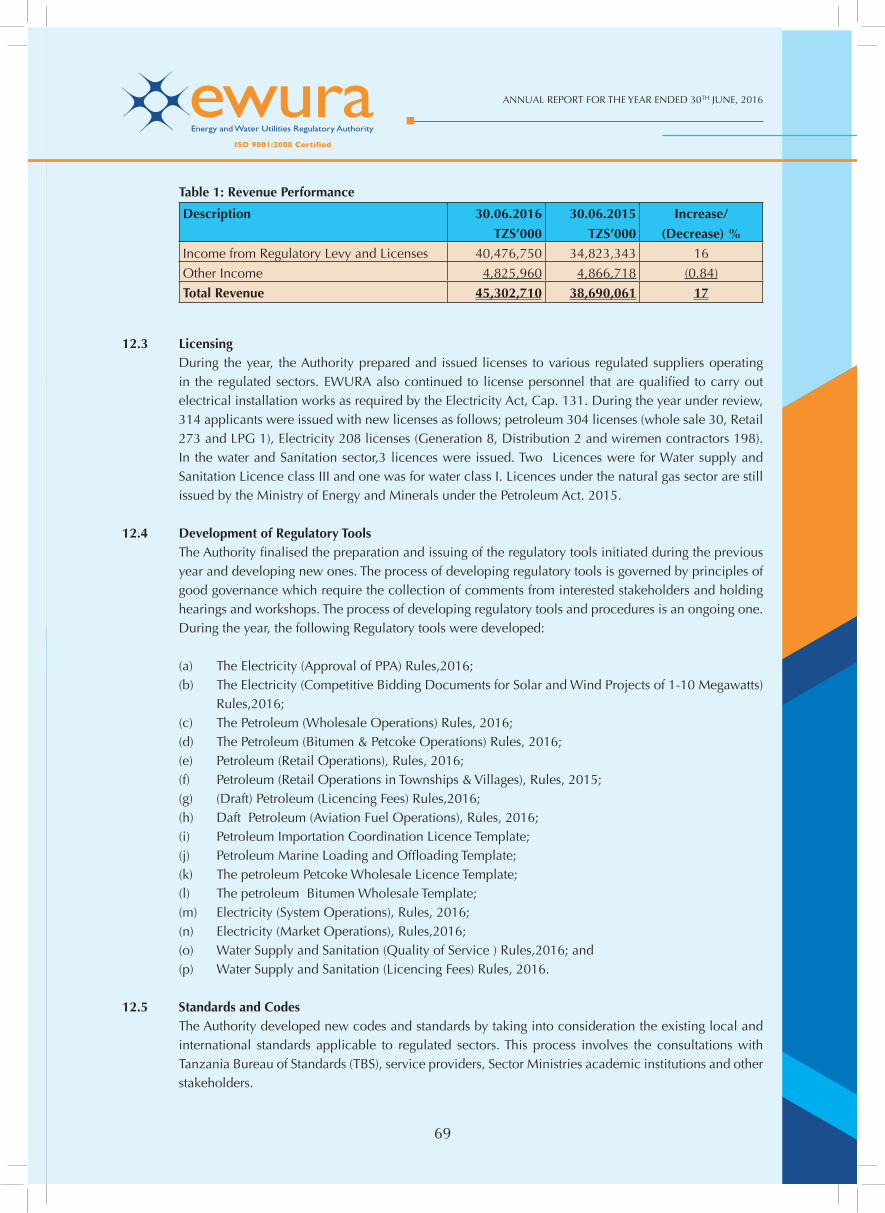
69
ANNUAL REPORT FOR THE YEAR ENDED 30TH JUNE, 2016
69
Table 1: Revenue Performance
Description 30.06.2016
TZS’000
30.06.2015
TZS’000
Increase/
(Decrease) %Income from Regulatory Levy and Licenses 40,476,750 34,823,343 16
Other Income 4,825,960 4,866,718 (0.84)
Total Revenue 45,302,710 38,690,061 17
12.3 Licensing During the year, the Authority prepared and issued licenses to various regulated suppliers operating
in the regulated sectors. EWURA also continued to license personnel that are qualifi ed to carry out electrical installation works as required by the Electricity Act, Cap. 131. During the year under review, 314 applicants were issued with new licenses as follows; petroleum 304 licenses (whole sale 30, Retail 273 and LPG 1), Electricity 208 licenses (Generation 8, Distribution 2 and wiremen contractors 198).In the water and Sanitation sector,3 licences were issued. Two Licences were for Water supply and Sanitation Licence class III and one was for water class I. Licences under the natural gas sector are still issued by the Ministry of Energy and Minerals under the Petroleum Act. 2015.
12.4 Development of Regulatory Tools The Authority fi nalised the preparation and issuing of the regulatory tools initiated during the previous
year and developing new ones. The process of developing regulatory tools is governed by principles of good governance which require the collection of comments from interested stakeholders and holding hearings and workshops. The process of developing regulatory tools and procedures is an ongoing one.
During the year, the following Regulatory tools were developed:
(a) The Electricity (Approval of PPA) Rules,2016; (b) The Electricity (Competitive Bidding Documents for Solar and Wind Projects of 1-10 Megawatts)
Rules,2016; (c) The Petroleum (Wholesale Operations) Rules, 2016; (d) The Petroleum (Bitumen & Petcoke Operations) Rules, 2016; (e) Petroleum (Retail Operations), Rules, 2016; (f) Petroleum (Retail Operations in Townships & Villages), Rules, 2015; (g) (Draft) Petroleum (Licencing Fees) Rules,2016; (h) Daft Petroleum (Aviation Fuel Operations), Rules, 2016; (i) Petroleum Importation Coordination Licence Template; (j) Petroleum Marine Loading and Offl oading Template; (k) The petroleum Petcoke Wholesale Licence Template; (l) The petroleum Bitumen Wholesale Template; (m) Electricity (System Operations), Rules, 2016; (n) Electricity (Market Operations), Rules,2016; (o) Water Supply and Sanitation (Quality of Service ) Rules,2016; and (p) Water Supply and Sanitation (Licencing Fees) Rules, 2016.
12.5 Standards and Codes The Authority developed new codes and standards by taking into consideration the existing local and
international standards applicable to regulated sectors. This process involves the consultations with Tanzania Bureau of Standards (TBS), service providers, Sector Ministries academic institutions and other stakeholders.
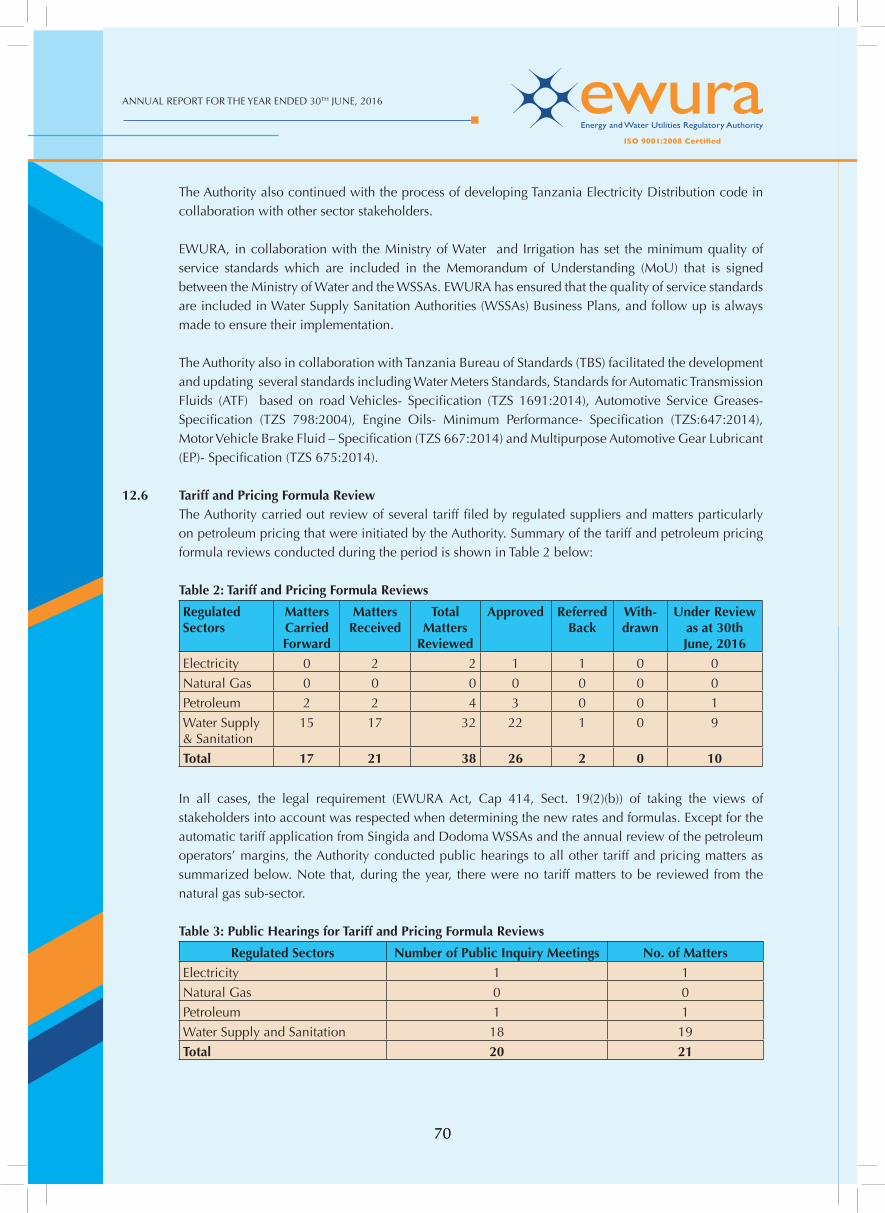
ANNUAL REPORT FOR THE YEAR ENDED 30TH JUNE, 2016
7070
The Authority also continued with the process of developing Tanzania Electricity Distribution code in collaboration with other sector stakeholders.
EWURA, in collaboration with the Ministry of Water and Irrigation has set the minimum quality of service standards which are included in the Memorandum of Understanding (MoU) that is signed between the Ministry of Water and the WSSAs. EWURA has ensured that the quality of service standards are included in Water Supply Sanitation Authorities (WSSAs) Business Plans, and follow up is always made to ensure their implementation.
The Authority also in collaboration with Tanzania Bureau of Standards (TBS) facilitated the development and updating several standards including Water Meters Standards, Standards for Automatic Transmission Fluids (ATF) based on road Vehicles- Specifi cation (TZS 1691:2014), Automotive Service Greases- Specifi cation (TZS 798:2004), Engine Oils- Minimum Performance- Specifi cation (TZS:647:2014), Motor Vehicle Brake Fluid – Specifi cation (TZS 667:2014) and Multipurpose Automotive Gear Lubricant (EP)- Specifi cation (TZS 675:2014).
12.6 Tariff and Pricing Formula Review The Authority carried out review of several tariff fi led by regulated suppliers and matters particularly
on petroleum pricing that were initiated by the Authority. Summary of the tariff and petroleum pricing formula reviews conducted during the period is shown in Table 2 below:
Table 2: Tariff and Pricing Formula Reviews
Regulated Sectors
Matters Carried Forward
Matters Received
Total Matters
Reviewed
Approved Referred Back
With-drawn
Under Review as at 30th June, 2016
Electricity 0 2 2 1 1 0 0
Natural Gas 0 0 0 0 0 0 0
Petroleum 2 2 4 3 0 0 1
Water Supply & Sanitation
15 17 32 22 1 0 9
Total 17 21 38 26 2 0 10
In all cases, the legal requirement (EWURA Act, Cap 414, Sect. 19(2)(b)) of taking the views of stakeholders into account was respected when determining the new rates and formulas. Except for the automatic tariff application from Singida and Dodoma WSSAs and the annual review of the petroleum operators’ margins, the Authority conducted public hearings to all other tariff and pricing matters as summarized below. Note that, during the year, there were no tariff matters to be reviewed from the natural gas sub-sector.
Table 3: Public Hearings for Tariff and Pricing Formula Reviews
Regulated Sectors Number of Public Inquiry Meetings No. of MattersElectricity 1 1
Natural Gas 0 0
Petroleum 1 1
Water Supply and Sanitation 18 19
Total 20 21
71
ANNUAL REPORT FOR THE YEAR ENDED 30TH JUNE, 2016
71
12.7 Sector Monitoring and Inspection During the year, the Authority conducted performance monitoring in the activities of regulated service
providers among the regulated sectors. Key objectives for sector monitoring include the following:
(a) to promote effective competition and economic effi ciency; (b) to protect the interest of the consumers and fi nancial viability of effi cient service providers; (c) to promote the availability of regulated services to all consumers including low income, rural and
disadvantaged consumers; and (d) to protect and preserve the environment.
12.7.1 Sector Monitoring and Inspection - Petroleum sub sector The Authority continued executing periodic and unscheduled inspections to the petroleum facilities
to ensure that there is continuous compliance to Standards that are in place. During the period under review the following petroleum facilities and installations were inspected:-
(a) Conducted pre-licencing inspection to 274 petroleum facilities. Out of these, 139 facilities met licencing requirements and hence recommended issuance of licence.
(b) Inspected 601 petrol stations to monitor compliance to the license conditions. 387 petrol station 64.4% were found dully meeting the licence conditions. Defaulters were penalized and closures of petrol stations until licence conditions were met.
(c) Inspected 1,061 petrol stations to monitor compliance to the Price Setting Rules. Only seven (7) petrol stations (0.66%) were found defaulting the Rules and appropriate legal actions were taken.
The Authority also continued to ensure that petroleum products of the right quality were offered for sale to consumers by carrying out frequent and random sampling for quality and marker tests. Punitive measures were taken against operators of the facilities that were found with products that failed the tests. In accordance with the Petroleum (Sampling and Testing) Rules, 2010 and the petroleum (Marking and Quality Control) Rules, 2010, the following activities were carried out:
(a) Conducted fuel marker detection to 716 facilities in order to curb dumping of untaxed petroleum products into local market and adulteration. 34 facilities (4.75%) were found with non-conforming products. Appropriate legal actions were taken against the defaulters. These actions included being served with compliance orders, charged penalties and revocation of licences until licence conditions are met.
(b) A total of 321 samples of petroleum products were taken from petroleum facilities in order to monitor compliance to the TBS specifi cation. Thirty one (31) samples (or 9.66%) were found not conforming to TBS specifi cations. Appropriate legal actions were taken against the defaulters.
12.7.2 Sector Monitoring and Inspection - Electricity sub sector During the year the Authority conducted inspections on Electricity Utility’s Distribution infrastructure
in 12 Regions namely; Singida, Mtwara, Shinyanga, Kilimanjaro, Geita, Tanga, Mbeya, Kigoma, Katavi, Rukwa, Kagera and Iringa. Among the defects found during inspection were leaning and rotten poles, defective switchgears, leaning insulators, transformer oil leakages, use of unrated fuse wires, vegetation/trees touching feeder lines, improperly done connections, poor housekeeping in primary substations, missing fi re extinguishers in substations, broken drainage systems, and excessive sag on power distribution lines. Also, some areas were observed to have Low voltages caused by lines extended beyond the standard limit and overloaded transformers. The Authority instructed TANESCO to rectify the anomalies as detailed in the inspection reports submitted to them. The Authority conducted effective
ANNUAL REPORT FOR THE YEAR ENDED 30TH JUNE, 2016
7272
inspections on Utilities Electricity Distribution Infrastructure in the year 2014, and up to June, 2016, seventeen inspections have been conducted in seventeen regions.
During the year, EWURA conducted a meeting with TANESCO Zonal Managers to discuss the inspection fi ndings and emphasize on implementation of EWURA recommendations towards rectifi cation of the defects and anomalies observed during inspections. TANESCO submitted a report of status of implementation of the fi ndings. The report indicated that 50% of the inspection fi ndings which did not require additional budget have been rectifi ed by TANESCO.
12.7.3 Sector Monitoring and Inspection - Water Supply and Sanitation During the year the Authority embarked on various activities including Inspections for monitoring
and verifi cation of data and information reported by WSSAs. The data for the following WSSAs were conducted; Kigoma, Kahama, Kilwa Masoko, Iringa, Mbeya, Sumbawanga WSSAs and DAWASCO.
The Authority also, prepared two Water Utilities Performance Review Reports for 2014/15 for Regional Water Utilities, National Water Projects and DAWASCO and District and small Towns Water Supply and Sanitation Authorities respectively. The reports covered among other things the technical, commercial and fi nancial performance of the water utilities. During the launching of the report best performing utilities were recognized by awarding them with certifi cates and trophies.
During the year, the Authority revised business plans from 32 WSSAs namely Iringa, Njombe, Shinyanga, Ngudu, Ifakara, Kahama-Shinyanga (KASHWASA), Mpanda, Kongwa, Mpwapwa, Dodoma, Morogoro and Iringa. Others were Mpanda, Njombe, Mbinga, Handeni Trunk Main, Pangani, Korogwe, Lushoto, Muheza, Songe, Katesh, Kibaya, Mwanga, Magugu and Galapo. The list also included Chalinze, Masasi-Nachingwea, Utete, Kilwa Masoko, Liwale and Ruangwa. As a result, fi nal Business Plans have been submitted from 21 WSSAs namely Iringa, Njombe, Shinyanga, Ngudu, Ifakara, KASHWASA, Mpanda, Kongwa, Mpwapwa, Pangani, Korogwe and Mwanga. Others were Mpwapwa, Kongwa, Igunga, Morogoro, Dodoma, Chalinze, Masasi-Nachingwea, Kilwa Masoko and Ruangwa.
The Authority has ensured that the Key Performance Indicators targets are included in the WSSAs’ Business Plans and follow up is regularly made to ensure their implementation. Implementation of KPIs is being monitored monthly through the Water Utilities Information System (MaJIs) and Quarterly Performance Reports from Water Utilities
Generally, it was noted WSSAs have continued to improve the level of compliance to the EWURA Business Planning Guidelines for Water Supply and Sanitation Authorities, 2011 in terms of structure and contents. The revised business plans were used to set tariffs for the WSSAs which applied for tariffs.
In a bid to improve performance of regulated water utilities, the Authority continued to implement capacity building measures to water utilities. During the year under review, the Authority conducted training on preparation of Business Plans to 36 District, Township and National project WSSAs namely, (Korogwe, Mombo, Handeni, Lushoto, Songe, Pangani, HTM, Magugu, Mbulu, Katesh, Bashnet, Gallapo, Dareda, Kibaya, Kisarawe, Mkuranga, Kilindoni, Utete, Kilwa Masoko, Igunga, Nzega, Urambo, Sikonge, Muleba, Karagwe, Biharamulo, Ngara, Mugumu, Chunya, Kyela, Tukuyu, Vwawa, Mbalizi, Makambako, Kasumulu, and Wanging’ombe National Project).
The training sessions were hands on and have enabled the WSSAs to prepare their Business Plans and submit to EWURA for review.
73
ANNUAL REPORT FOR THE YEAR ENDED 30TH JUNE, 2016
73
Also, the Authority participated in training sessions for 94 DTWSSAs and NPWSSAs that were organized by GIZ. The training sessions were aimed at imparting technical, commercial and managerial skills for the DTWSSAs and NPWSSAs.
EWURA’s input in the training was on Business Planning and MajiIS. Regarding MajIs, the Authority conducted training to 8 WSSAs (Songea, Ruangwa, Kilindoni and Mkuranga, Biharamulo and Ngara) so as to enhance the knowledge to some staff that were selected to use the system by respective WSSAs. Water quality monitoring was conducted to 88 water utilities including DAWASCO and DAWASA. The Authority carried out water and waste water quality monitoring in order to establish whether water supplied and effl uent from waste water systems comply with TBS Standards.
12.7.4 Sector Monitoring and Inspection - Natural Gas Subsector The Authority carried out quarterly fi eld inspections to the natural gas infrastructures operated by
Songas, Ndovu Resources, PanAfrican Energy, TPDC, Maurel et Prom for High Pressure Transmission Pipeline and Dar es Salaam Natural Gas Distribution Network to ascertain the infrastructure integrity and its safety. During the fi eld inspections, the Authority had an opportunity to verify the information received from the regulated service providers based on daily, weekly and monthly reports which form part of the basis of monitoring the performance.
However, in the absence of sector Regulations and Rules the Authority could not carry out enforcement activities but advised the service providers to take safety precautionary measures to ensure the public are not at any risk associated with natural gas activities.
12.8 Public Awareness During the fi nancial year 2015/16, the Authority continued to undertake Communications and Public
Relations activities as planned, focusing on attaining EWURA’s strategic objective of among other things; to enhance public knowledge, awareness and understanding of the regulated sectors pursuant to Section 6(e) of EWURA Act, Cap.414.
During the period 2015/2016, the Authority carried out the following major activities: (a) Participated at the Dar es Salaam International Trade Fair exhibitions (b) Coordinated the production and airing of 53 EWURA NA UCHUMI TV programmes on TBC1,
ITV, Star TV, Clouds TV, TV1, Azam TV and Channel Ten. (c) Coordinated airing of 66 radio programmes on the following Radio stations: TBC Taifa, Radio
Free Africa, Radio One, EFM Radio, Clouds FM Radio, Mambo Jambo Radio, Storm FM, Dream FM, Magic FM, ABM FM, Ebony FM and Wapo FM.
(d) Participated in awareness campaigns for stakeholders in Petroleum and Electricity sub sectors countrywide.
(e) Coordinated publishing and distribution of 2014/2015 EWURA Annual Report, Clients Service Charter, Downstream Petroleum Subsector Performance Review Report and the Water Sector Performance Review Reports.
(f) Coordinated impromptu media interviews (live and Recorded), prepared and disseminated press releases and prepared various press conferences;
(g) Published monthly petroleum products cap prices as per legal requirement; (h) Coordinated the publications of various features into various media houses; and (i) Sensitized the public on the use of code number *152*00# to download petroleum products cap
prices.
ANNUAL REPORT FOR THE YEAR ENDED 30TH JUNE, 2016
7474
12.9 Complaints and Disputes The Authority attended to complaints against suppliers of regulated goods or services in relation to any
matter connected with the supply, possible supply or proposed supply of goods or services. A summary of complaints received and settled in each sector is shown in Table 4 below.
Table 4: Complaints and Disputes Attended
Regulated Sector Previous
Complaints
Complaints
Received During
the Year
Complaints
Resolved
Complaints in
Progress
Petroleum 10 25 16 19
Electricity 103 55 95 63
Water Supply and Sanitation 60 48 96 12
Natural Gas 0 1 0 1
Total 173 129 207 95
At the end of the year a total of 95 complaints were at were at various stages of mediation and hearing.
12.10 Regional Cooperation Meetings The main objective of regional cooperation is to exchange regulatory experiences within the Interna-
tional and Regional settings, and allow EWURA to have access to information necessary for regulation and performance benchmarking.The Authority participated in the activities of four Regional Associa-tions namely; Regional Electricity Regulators Association (RERA), African Forum for Utility Regulators (AFUR), Energy Regulators Association of East Africa (EREA),African Refi ners Association (ARA) and the Eastern and Southern Africa Water and Sanitation Regulators Association (ESAWAS).
Furthermore, EWURA has participated in various meetings convened to establish the Eastern Africa Power Pool Regulatory Body (EAPP-IRB) . EAPP-IRB members include Libya, Egypt, Sudan, Ethiopia, Kenya, Tanzania, Uganda, Rwanda, Burundi and the Democratic Republic of Congo.
13.0. RECRUITMENT During the year, the Authority recruited 20 employees thus bringing the total number of staff to 123.
The number of staff planned during the year was 134. Staff gender structure was as indicated in Table 5 below:
Table 5: Staff Complement
Item Male Female TotalStaff Complement 85 38 123Percentage 69 31 100
The Authority has a staff complement of highly qualifi ed and motivated professionals who bring with them their diverse experience in their area of professionalism.
14.0. RISK MANAGEMENT AND CONTROL The Board assumes fi nal responsibility for the risk management and internal control system of the
Authority. It is the task of the Board to ensure that adequate internal fi nancial and operational control systems are developed, improved and maintained on an ongoing basis in order to provide reasonable assurance regarding:
75
ANNUAL REPORT FOR THE YEAR ENDED 30TH JUNE, 2016
75
(a) the effectiveness and effi ciency of operations; (b) the safeguarding of the Authority’s assets; (c) compliance with the applicable laws and regulations; (d) reliability of accounting records; (e) business suitability under normal as well as adverse conditions; and (f) responsible behaviors towards stakeholders.
15.0. STAFF WELFARE
15.1 Staff Relations Good relationship between employees and management of the Authority was observed and maintained
during the year under review.
15.2 Capacity Building The Authority’s policy is to equip its staff with relevant regulatory, managerial and operational
competencies to enhance their service delivery to the public. During the year under review, new senior staff attended general courses on Public Utility Regulation and Strategy. Several Staff also attended international and local training on general management courses, secretarial practices and advanced drivers and offi ce attendants training courses in order to improve their performance.
15.3 Medical Services The Authority provides free medical care to all staff, spouses and up to four legal children not exceeding
18 years of age. The Authority commits suffi cient funds to cater for evacuation of staff for overseas treatment, where necessary.
15.4 Health and Safety The Authority takes all reasonable and practicable steps to safeguard health, safety and welfare of its
employees. A safe and comfortable working environment is maintained for all employees by providing adequate and proper protective gears (during fi eld work), training and supervision as necessary. The Authority observes the Safety and Health Administration (OSHA) guidelines and ensures full compliance.
15.5 HIV/AIDS Intervention During the period under review, the Authority conducted a seminar to all staff on HIV/AIDS. This involved
awareness on HIV/AIDS related issues, training on causes and prevention measures and testing.
16.0. EMPLOYEE BENEFIT PLAN The Authority pays contributions to publicly administered Pension Funds as required by law.
17.0. GENDER PARITY During the year, the Authority had 123 employees, out of whom 85 were male and 38 were female. The
Authority is an equal opportunity employer.
18.0. POLITICAL DONATIONS The Authority did not make any donations during the year under review towards political activities.
ANNUAL REPORT FOR THE YEAR ENDED 30TH JUNE, 2016
7676
19.0. CORPORATE SOCIAL RESPONSIBILITIES The Authority makes contributions to different institutions to support activities of national interest.
During the period under review, EWURA instituted new guidelines for Donations and Contributions, with a view to improving its service to stakeholders and the society at large.
Institutions supported by the Authority during the year included the Institute for Internal Auditors, Heart Foundation of Tanzania, Mvuti Secondary School, Tanzania Women Judges Association and Mwanza Region Offi ce. Others were Dar es Salaam Region Offi ce, President Offi ce (Establishment) and Ikwiriri Orphanage Fund, of which in total, the Authority spent TZS 51 million.
Also as part and parcel of supporting higher learning education in the country, the Authority offered fi eld attachment to 31 students and spent a total of TZS 20m.
The involvement of the Authority in offering Donations and Contributions has continued to enhance its image and values to the public.
20.0. RELATED PARTY EWURA regards a related party as a person or an entity with the ability to exert control individually
or jointly, or to exercise signifi cant infl uence over the Authority. Members of the key Management are regarded as related parties and comprise of members of the Board of Directors, whether executive or otherwise, the Director General, Divisional Directors and Head of Units.
21.0. ENVIRONMENTAL CONTROL PROGRAMME The Authority, in collaboration with the National Environmental Management Council (NEMC) and
other stakeholders, continued to participate in compliance monitoring on matters related to protection of environment. In considering any application for a license or construction approval, the authority takes into account the need to protect and preserve the environment as required by the Environmental Management Act, 2004.
22.0. PERSONS WITH DISABILITIES The Authority believes and provides equal opportunities to persons with disabilities. People with
disabilities are encouraged and are given full and fair consideration to job applications.
23.0. KEY CHALLENGES AND THE WAY FORWARD The Authority encountered various challenges in the course of discharging its functions during the year
under review. Key challenges encountered included the following;
(a) The Authority faces a challenge of the growing demand of its services given the vast nature of the country. The Authority plans to open three more zonal offi ces in addition to the one in Lake zone in Mwanza.
(b) Given the enactment of the Petroleum Act, 2015 and a limitation of expertise especially in oil and gas as there is an increasing demand of the professionals which the local market cannot support right now. The Authority trains its staff in foreign countries in short term courses, conferences and attachments. These courses are expensive hence very few staff get this opportunity.
(c) Hidden ineffi ciencies in the electricity sector due to the vertically integrated structure of the Electricity Supply Industry in Tanzania. However, the Government in June 2014 announced
77
ANNUAL REPORT FOR THE YEAR ENDED 30TH JUNE, 2016
77
Electricity Sector Industry (ESI) reforms whereby the unbundling process of TANESCO into generation, transmission and distribution will be carried out until 2025 in alignment with Tanzania Development Vision, 2025.
(d) WSSAs are many and diverse in size, capability and capacity. There are 130 WSSAs in the country. Generally, WSSAs at district and small town level have weak managerial, fi nancial and technical capacity. The Authority will continue to utilize its available resources to conduct capacity building activities, inspections and monitoring. The Authority will also support the clustering of the WSSAs.
(e) Inadequate capacity of the WSSAs to prepare Business Plans which are compliant to the EWURA Business Plan Guidelines continue to be a challenge. The Authority has considered continuing with capacity building to WSSAs and is committed to set aside funds for the capacity building in the future years’ budgets.
(f) Low investments in Water Supply and Sanitation which results into a slow pace towards moving to 100% service coverage (currently, it is around 86% in urban areas). EWURA has prepared Business Planning guidelines which assist WSSAs to plan towards cost recovery tariffs. EWURA approves a three year tariff corresponding to the Business Plan. In addition, EWURA has been collaborating with the MoWI and DPs to put in place incentives for WSSAs to involve PPP’s and to acquire loans for investments.
(g) Insuffi cient public knowledge in the understanding of rights and obligations of consumers and the regulated suppliers. The Authority shall continue to strengthen the implementation of Public Awareness Programme to address this challenge.
(h) Slow decision making by other institutions which EWURA collaborate with in the course of carrying out its regulatory functions. One of the areas affected is the licensing of competitive projects in the regulated sectors, where other institutions such as NEMC are involved in the approval process. Frequent negotiations with these institutions has proved to mitigate this challenge.
(i) Delays by TANESCO to pay for the power which is purchased from small power producers has led to numerous operational diffi culties to these producers. These delays may also be a hindering factor to small power investment in the sector. For example, investors may get diffi cult fi nancing conditions in order to invest in the country. The government has prepared strategies to ensure that TANESCO pays power projects in time as per their agreements.
(j) Poor power distribution infrastructure coupled with inadequate conserved areas for power generation is still a problem to power distributors and generators, respectively. In order to address this challenge, the current plan is to have Key Performance Indicators which will be agreed between generators and distributors of electricity. Periodic assessments will be done by EWURA to make the service providers accountable and thereby ensure that this challenge is fully addressed.
(k) Increased smuggling of kerosene from Kenya and Uganda especially in the Northern and Lake Zones and selling of transit and tax exempted products is still a problem. EWURA plans to increase the level and frequency of marker detection exercises, especially in areas bordering Kenya. EWURA will also continue cooperating with TRA in conducting joint inspections.
24.0. EVENTS AFTER THE REPORTING PERIOD There were no material events, adjusting or non-adjusting, which had occurred between the reporting
date and the date when the Financial Statements are authorized for issue.
ANNUAL REPORT FOR THE YEAR ENDED 30TH JUNE, 2016
7878
25.0. SOLVENCY Since its establishment, the Authority has managed to fi nance its operations through sources specifi ed
under the EWURA Act. The Directors consider the Authority to be solvent on the strength of its fi nancial position as at 30th June, 2016 as set out in pages 30 to 34 of these fi nancial statements and the Notes thereon.
26.0. AUDIT MANDATE The Controller and Auditor General is the Statutory Auditor of Energy and Water Regulatory Authority
by virtue of Article 143 of the Constitution of the United Republic of Tanzania (URT) and as amplifi ed in Section 10 of the Public Audit Act No. 11 of 2008. However, in accordance with Section 33 (1) of the same Act, M/s BDO East Africa were authorized to carry out audit of the Commission on behalf of the Controller and Auditor General for the fi nancial statements of the year ended 30th June, 2016.
…………………………… ….………………………………. ENG. PROF. JAMIDU KATIMA FELIX NGAMLAGOSI CHAIRMAN DIRECTOR GENERAL
Date -------------------------------- Date --------------------------------
19th December 2016 19th December 2016
79
ANNUAL REPORT FOR THE YEAR ENDED 30TH JUNE, 2016
79
27.0. STATEMENT OF DIRECTORS’ RESPONSIBILITIES These fi nancial statements have been prepared by the management of the Energy and Water Utilities
Regulatory Authority in accordance with the provisions of section 46 of the EWURA Act and section 25(4) of the Public Finance Act, Cap 348 of 2008.
The Directors of EWURA are responsible for establishing and maintaining a system of effective internal control designed to give reasonable assurance that the transactions recorded in the fi nancial statements are within the statutory requirement and that they contain the receipts and use of resources by the Authority.
The Directors of EWURA are responsible for keeping proper accounting records which disclose with reasonable accuracy at any time the fi nancial position of the Authority, and which enable them to ensure that the fi nancial statements comply with the EWURA Act. They are also responsible for safeguarding the assets of EWURA and hence for taking reasonable steps for the prevention and detection of fraud, error and other irregularities.
The Directors confi rm that suitable accounting policies have been used and applied consistently, and reasonable and prudent judgment and estimates have been made in the preparation of the fi nancial statements for the year ended 30th June, 2016. The Directors also confi rm that International Public Sector Accounting Standards have been followed and that the fi nancial statements have been prepared on the going concern basis.
To the best of the Directors knowledge, the internal control system has operated adequately throughout the reporting period and the accounting and underlying records provide a reasonable basis for the preparation of the fi nancial statements for the year ended 30th June, 2016.
Directors accept responsibility for the integrity of the Financial Statements, the information they contain and their compliance with International Public Sector Accounting Standards. Nothing has come to the attention of the Directors to indicate that EWURA will not remain a going concern for at least the next twelve months from the date of the Statement.
Approved by the Board of Directors 19th December, 2016 and signed on its behalf by:
…………………………… ….………………………………. ENG. PROF. JAMIDU KATIMA FELIX NGAMLAGOSI CHAIRMAN DIRECTOR GENERAL
Date -------------------------------- Date --------------------------------
19th December 2016 19th December 2016
ANNUAL REPORT FOR THE YEAR ENDED 30TH JUNE, 2016
8080
DECLARATION OF HEAD OF FINANCE OF ENERGY AND WATER UTILITIES REGULATORY AUTHORITY
The National Board of Accountants and Auditors (NBAA) according to the power conferred under the Auditors and Accountants (Registration) Act. No. 33 of 1972, as amended by Act No.2 of 1995, requires fi nancial statements to be accompanied with a Statement of Declaration issued by the Head of Finance/Accounting responsible for the preparation of fi nancial statements of the entity concerned.
It is the duty of a professional accountant to assist the Board of Directors/ Governing Body/ Management to discharge the responsibility of preparing fi nancial Statements of an entity showing the true and fair view of the entity in accordance with international accounting standards and statutory reporting requirements. Full legal responsibility for fi nancial statements rests with the Board of Directors/ Governing Body as under Directors Responsibility statement on an earlier page.
I, Joctan Matogo, being the head of fi nance (Acting Director of Corporate Affairs) of Energy and Water Utilities Regulatory Authority hereby acknowledge my responsibility of ensuring that Financial Statements for the year ended 30th June 2016 have been prepared in compliance with applicable accounting standards and statutory requirements.
I thus confi rm that the Financial Statements give a true and fair view position of Energy and Water Utilities Regulatory Authority as on that date and they have been prepared based on properly maintained fi nancial records.
Signed by:…………………………………
Position:…………………………………………………
NBAA Membership No.: FCPA 959
Date: …………………………
Ag. Director of Corporate Affairs
19th December 2016
81
ANNUAL REPORT FOR THE YEAR ENDED 30TH JUNE, 2016
81
AUDIT REPORT ON FINANCIAL STATEMENTS
To: Chairman of the Board, Energy and Water Utilities Regulatory Authority, P.O. Box 72175, DAR ES SALAAM.
RE: REPORT OF THE CONTROLLER AND AUDITOR GENERAL ON THE FINANCIAL STATEMENTS OF ENERGY AND WATER UTILITIES REGULATORY AUTHORITY (EWURA) FOR THE YEAR ENDED 30TH JUNE, 2016
IntroductionI have audited the fi nancial statements of Energy and Water Utilities Regulatory Authority for the fi nancial year ended 30th June, 2016, which comprises Statement of Financial Position, Statement of Financial Performance, Statement of Changes in Equity, Statement of Cash Flows, Statement of Comparison of Budget and Actual Amounts for the year then ended, and a summary of signifi cant accounting policies and other explanatory notes set out from page 88 to 106 of this report.
Director’s Responsibilities for the fi nancial statementsThe Board of Directors of the Energy and Water Utilities Regulatory Authority is responsible for the preparation and fair presentation of these fi nancial statements in accordance with International Public Sector Accounting Standards. This responsibility includes designing, implementing and maintaining internal control relevant to the preparation and fair presentation of fi nancial statements that are free from material misstatement, whether due to fraud or error, selecting and applying appropriate accounting policies and making accounting estimates that are reasonable in the circumstances.
Responsibilities of the Controller and Auditor GeneralMy responsibility as an auditor is to express an independent opinion on the fi nancial statements based on the audit. The audit was conducted in accordance with International Standard of Supreme Audit Institutions (ISSAIs) and such other audit procedures I considered necessary in the circumstances. These standards require that I comply with ethical requirements and plan and perform the audit to obtain reasonable assurance about whether the fi nancial statements are free from material misstatement.
An audit involves performing procedures to obtain audit evidence about the amounts and disclosures in the fi nancial statements. The procedures selected depend on the auditor’s judgment, including the assessment of the risks of material misstatement of the fi nancial statements, whether due to fraud or error. In making those risk assessments, the auditor considers internal control relevant to EWURA’s preparation and fair presentation of the fi nancial Statements in order to design audit procedures that are appropriate in the circumstances, but not for the purpose of expressing an opinion on the effectiveness of EWURA’s internal control. An audit also includes evaluating the appropriateness of accounting policies used and the reasonableness of accounting estimates made by management, as well as evaluating the overall presentation of the fi nancial statements.
In addition, Sect. 10 (2) of the PAA No. 11 of 2008 requires me to satisfy myself that the accounts have been prepared in accordance with the appropriate accounting standards and that; reasonable precautions have been taken to safeguard the collection of revenue, receipt, custody, disposal, issue and proper use of public property, and that the law, directions and instructions applicable thereto have been duly observed and expenditures of public monies have been properly authorized.
ANNUAL REPORT FOR THE YEAR ENDED 30TH JUNE, 2016
8282
Further, Sect. 48(3) of the Public Procurement Act No. 7 of 2011 and Reg. No. 269 (1) of the Public Procurement Regulations of 2013 requires me to state in my annual audit report whether or not the auditee has complied with the provisions of the Law and its Regulations.
I believe that the audit evidence I have obtained is suffi cient and appropriate to provide a basis for my audit opinion.
Unqualifi ed opinionIn my opinion, the fi nancial statements present fairly, in all material respects, the fi nancial position of Energy and Water Utilities Regulatory Authority (EWURA) as at 30th June, 2016 and of its fi nancial performance and its cash fl ows for the year then ended in accordance with International Public Sector Accounting Standards and the Energy and Water Utilities Regulatory Authority Act, Cap 414.
Report on Compliance with Procurement Legislation
Compliance with Public Procurement ActIn view of my responsibility on the procurement legislation, and taking into consideration the procurement transactions and processes I have reviewed as part of this audit, I state that Energy and Water Utilities Regulatory Authority procurement has generally complied with the requirements of the Public Procurement Act, 2011 and its related Regulations of 2013.
Prof. Mussa Juma AssadCONTROLLER AND AUDITOR GENERAL
National Audit Offi ceDAR ES SALAAM
Date: …………………………21st December 2016
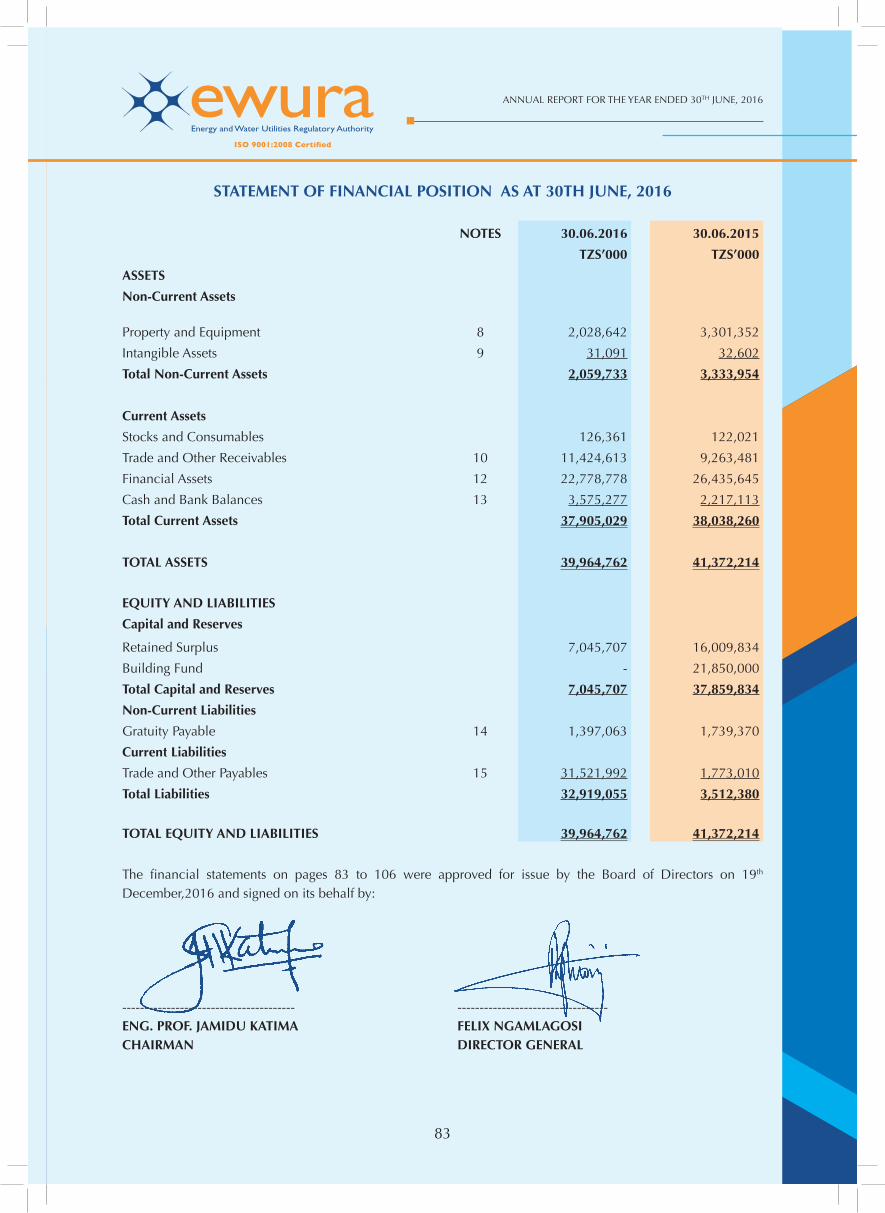
83
ANNUAL REPORT FOR THE YEAR ENDED 30TH JUNE, 2016
83
STATEMENT OF FINANCIAL POSITION AS AT 30TH JUNE, 2016
NOTES 30.06.2016 30.06.2015
TZS’000 TZS’000
ASSETS
Non-Current Assets
Property and Equipment 8 2,028,642 3,301,352
Intangible Assets 9 31,091 32,602
Total Non-Current Assets 2,059,733 3,333,954
Current Assets
Stocks and Consumables 126,361 122,021
Trade and Other Receivables 10 11,424,613 9,263,481
Financial Assets 12 22,778,778 26,435,645
Cash and Bank Balances 13 3,575,277 2,217,113
Total Current Assets 37,905,029 38,038,260
TOTAL ASSETS 39,964,762 41,372,214
EQUITY AND LIABILITIES
Capital and Reserves
Retained Surplus 7,045,707 16,009,834
Building Fund - 21,850,000
Total Capital and Reserves 7,045,707 37,859,834
Non-Current Liabilities
Gratuity Payable 14 1,397,063 1,739,370
Current Liabilities
Trade and Other Payables 15 31,521,992 1,773,010
Total Liabilities 32,919,055 3,512,380
TOTAL EQUITY AND LIABILITIES 39,964,762 41,372,214
The fi nancial statements on pages 83 to 106 were approved for issue by the Board of Directors on 19th December,2016 and signed on its behalf by:
--------------------------------------- ----------------------------------ENG. PROF. JAMIDU KATIMA FELIX NGAMLAGOSICHAIRMAN DIRECTOR GENERAL
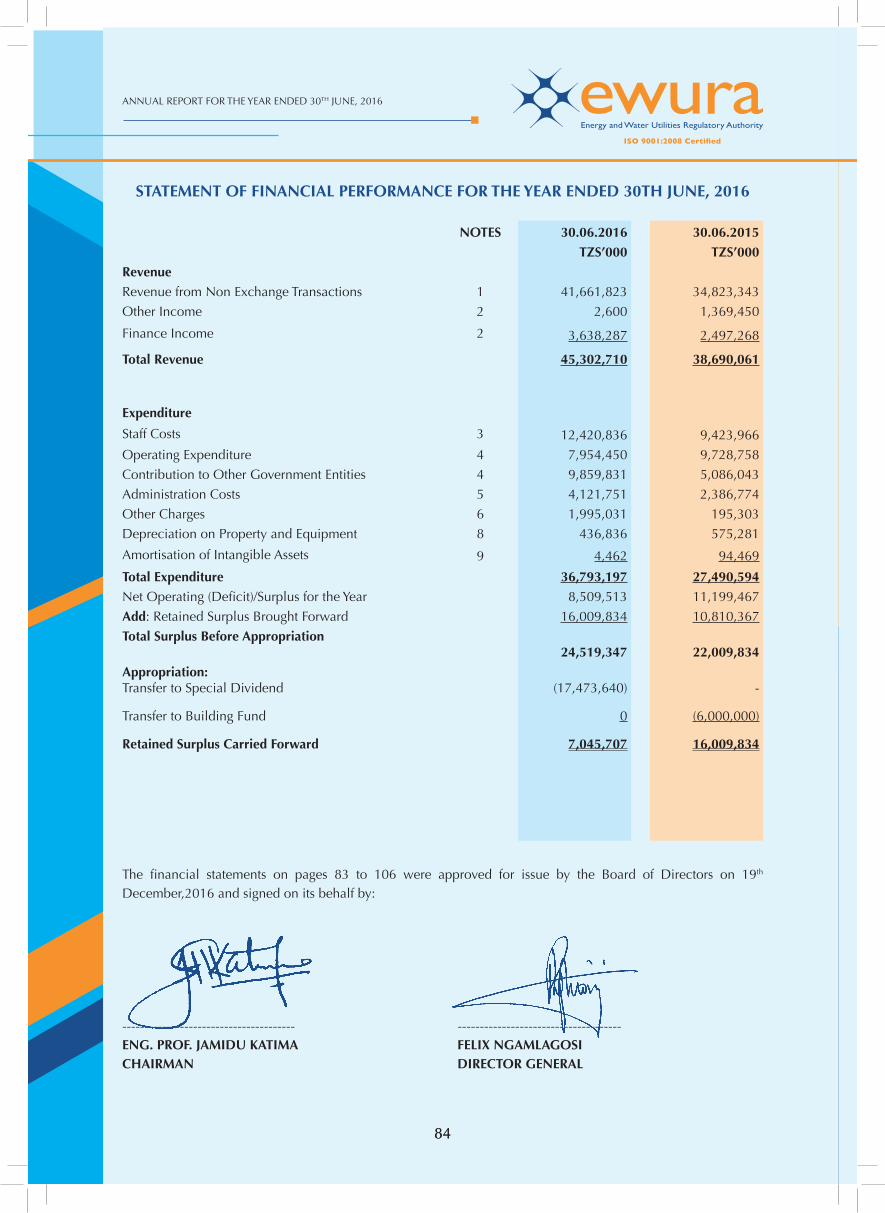
ANNUAL REPORT FOR THE YEAR ENDED 30TH JUNE, 2016
8484
STATEMENT OF FINANCIAL PERFORMANCE FOR THE YEAR ENDED 30TH JUNE, 2016
NOTES 30.06.2016 30.06.2015
TZS’000 TZS’000
RevenueRevenue from Non Exchange Transactions 1 41,661,823 34,823,343
Other Income 2 2,600 1,369,450
Finance Income 2 3,638,287 2,497,268
Total Revenue 45,302,710 38,690,061
Expenditure
Staff Costs 3 12,420,836 9,423,966
Operating Expenditure 4 7,954,450 9,728,758
Contribution to Other Government Entities 4 9,859,831 5,086,043
Administration Costs 5 4,121,751 2,386,774
Other Charges 6 1,995,031 195,303
Depreciation on Property and Equipment 8 436,836 575,281
Amortisation of Intangible Assets 9 4,462 94,469
Total Expenditure 36,793,197 27,490,594Net Operating (Defi cit)/Surplus for the Year 8,509,513 11,199,467
Add: Retained Surplus Brought Forward 16,009,834 10,810,367
Total Surplus Before Appropriation24,519,347 22,009,834
Appropriation:Transfer to Special Dividend (17,473,640) -
Transfer to Building Fund 0 (6,000,000)
Retained Surplus Carried Forward 7,045,707 16,009,834
The fi nancial statements on pages 83 to 106 were approved for issue by the Board of Directors on 19th December,2016 and signed on its behalf by:
--------------------------------------- -------------------------------------ENG. PROF. JAMIDU KATIMA FELIX NGAMLAGOSICHAIRMAN DIRECTOR GENERAL
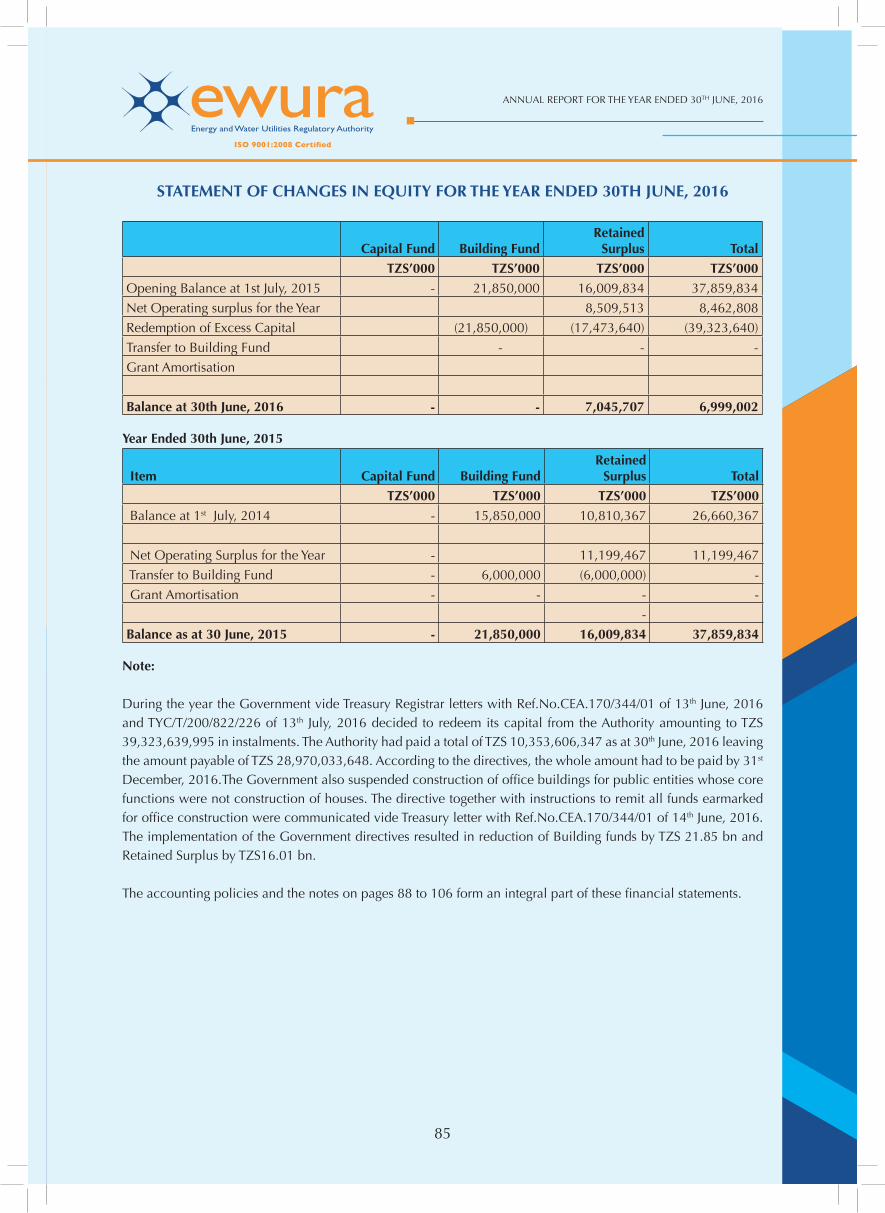
85
ANNUAL REPORT FOR THE YEAR ENDED 30TH JUNE, 2016
85
STATEMENT OF CHANGES IN EQUITY FOR THE YEAR ENDED 30TH JUNE, 2016
Capital Fund Building FundRetained
Surplus Total
TZS’000 TZS’000 TZS’000 TZS’000Opening Balance at 1st July, 2015 - 21,850,000 16,009,834 37,859,834
Net Operating surplus for the Year 8,509,513 8,462,808
Redemption of Excess Capital (21,850,000) (17,473,640) (39,323,640)
Transfer to Building Fund - - -
Grant Amortisation
Balance at 30th June, 2016 - - 7,045,707 6,999,002
Year Ended 30th June, 2015
Item Capital Fund Building Fund Retained
Surplus Total
TZS’000 TZS’000 TZS’000 TZS’000 Balance at 1st July, 2014 - 15,850,000 10,810,367 26,660,367
Net Operating Surplus for the Year - 11,199,467 11,199,467
Transfer to Building Fund - 6,000,000 (6,000,000) -
Grant Amortisation - - - -
-
Balance as at 30 June, 2015 - 21,850,000 16,009,834 37,859,834
Note:
During the year the Government vide Treasury Registrar letters with Ref.No.CEA.170/344/01 of 13th June, 2016 and TYC/T/200/822/226 of 13th July, 2016 decided to redeem its capital from the Authority amounting to TZS 39,323,639,995 in instalments. The Authority had paid a total of TZS 10,353,606,347 as at 30th June, 2016 leaving the amount payable of TZS 28,970,033,648. According to the directives, the whole amount had to be paid by 31st December, 2016.The Government also suspended construction of offi ce buildings for public entities whose core functions were not construction of houses. The directive together with instructions to remit all funds earmarked for offi ce construction were communicated vide Treasury letter with Ref.No.CEA.170/344/01 of 14th June, 2016. The implementation of the Government directives resulted in reduction of Building funds by TZS 21.85 bn and Retained Surplus by TZS16.01 bn.
The accounting policies and the notes on pages 88 to 106 form an integral part of these fi nancial statements.
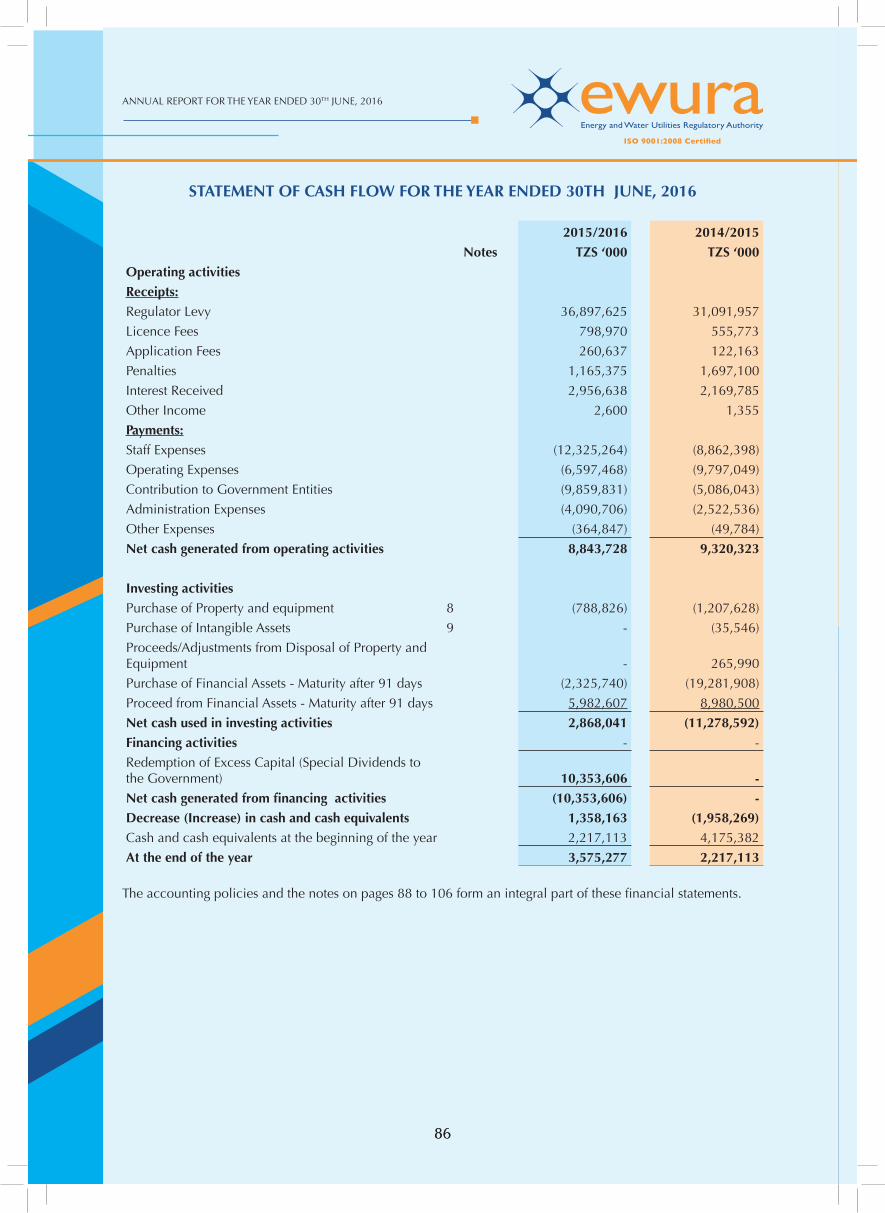
ANNUAL REPORT FOR THE YEAR ENDED 30TH JUNE, 2016
8686
STATEMENT OF CASH FLOW FOR THE YEAR ENDED 30TH JUNE, 2016
2015/2016 2014/2015
Notes TZS ‘000 TZS ‘000
Operating activities
Receipts:Regulator Levy 36,897,625 31,091,957
Licence Fees 798,970 555,773
Application Fees 260,637 122,163
Penalties 1,165,375 1,697,100
Interest Received 2,956,638 2,169,785
Other Income 2,600 1,355
Payments:Staff Expenses (12,325,264) (8,862,398)
Operating Expenses (6,597,468) (9,797,049)
Contribution to Government Entities (9,859,831) (5,086,043)
Administration Expenses (4,090,706) (2,522,536)
Other Expenses (364,847) (49,784)
Net cash generated from operating activities 8,843,728 9,320,323
Investing activitiesPurchase of Property and equipment 8 (788,826) (1,207,628)
Purchase of Intangible Assets 9 - (35,546)
Proceeds/Adjustments from Disposal of Property and Equipment - 265,990
Purchase of Financial Assets - Maturity after 91 days (2,325,740) (19,281,908)
Proceed from Financial Assets - Maturity after 91 days 5,982,607 8,980,500
Net cash used in investing activities 2,868,041 (11,278,592)
Financing activities - -
Redemption of Excess Capital (Special Dividends to the Government) 10,353,606 -
Net cash generated from fi nancing activities (10,353,606) -
Decrease (Increase) in cash and cash equivalents 1,358,163 (1,958,269)Cash and cash equivalents at the beginning of the year 2,217,113 4,175,382
At the end of the year 3,575,277 2,217,113
The accounting policies and the notes on pages 88 to 106 form an integral part of these fi nancial statements.
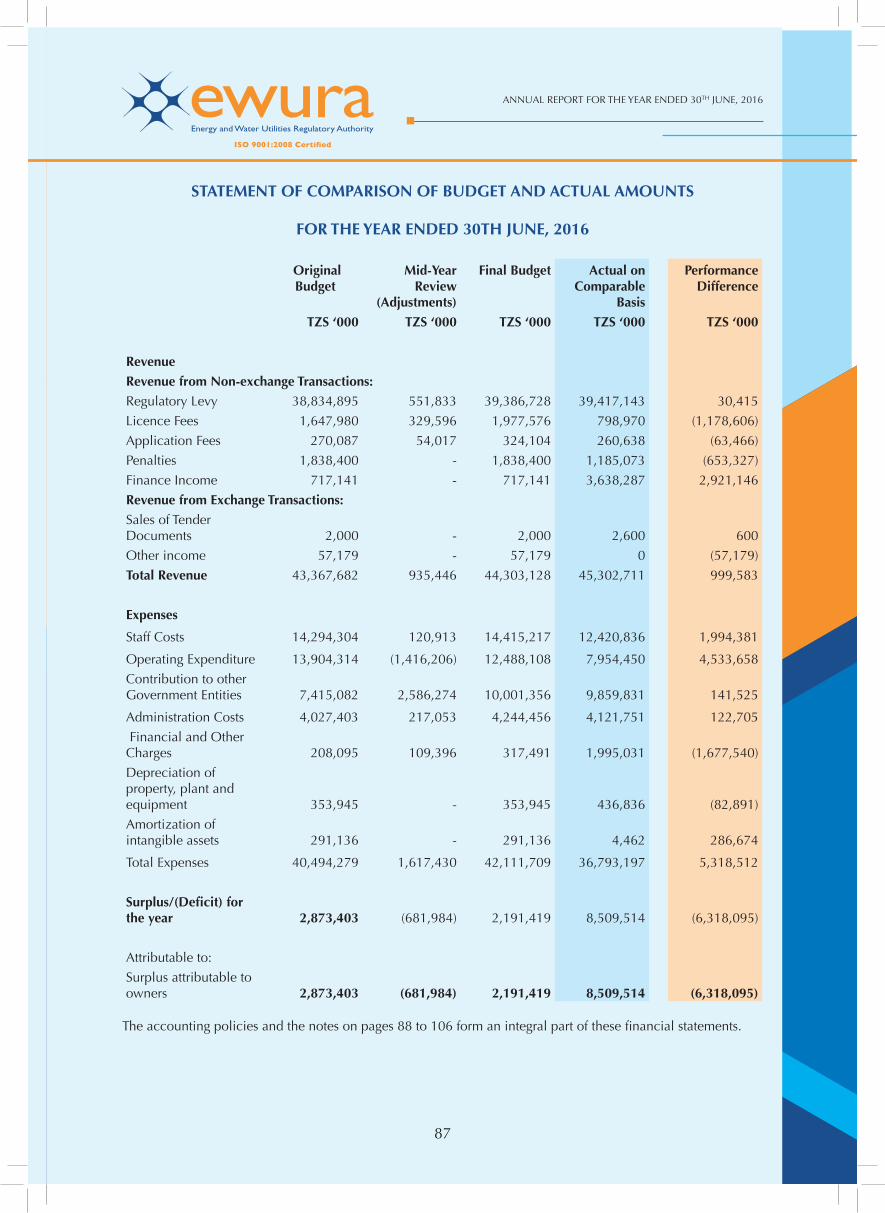
87
ANNUAL REPORT FOR THE YEAR ENDED 30TH JUNE, 2016
87
STATEMENT OF COMPARISON OF BUDGET AND ACTUAL AMOUNTS
FOR THE YEAR ENDED 30TH JUNE, 2016
Original Budget
Mid-Year Review
(Adjustments)
Final Budget Actual on Comparable
Basis
Performance Difference
TZS ‘000 TZS ‘000 TZS ‘000 TZS ‘000 TZS ‘000
Revenue
Revenue from Non-exchange Transactions:Regulatory Levy 38,834,895 551,833 39,386,728 39,417,143 30,415
Licence Fees 1,647,980 329,596 1,977,576 798,970 (1,178,606)
Application Fees 270,087 54,017 324,104 260,638 (63,466)
Penalties 1,838,400 - 1,838,400 1,185,073 (653,327)
Finance Income 717,141 - 717,141 3,638,287 2,921,146
Revenue from Exchange Transactions:Sales of Tender Documents 2,000 - 2,000 2,600 600
Other income 57,179 - 57,179 0 (57,179)
Total Revenue 43,367,682 935,446 44,303,128 45,302,711 999,583
Expenses
Staff Costs 14,294,304 120,913 14,415,217 12,420,836 1,994,381
Operating Expenditure 13,904,314 (1,416,206) 12,488,108 7,954,450 4,533,658
Contribution to other Government Entities 7,415,082 2,586,274 10,001,356 9,859,831 141,525
Administration Costs 4,027,403 217,053 4,244,456 4,121,751 122,705
Financial and Other Charges 208,095 109,396 317,491 1,995,031
(1,677,540)
Depreciation of property, plant and equipment 353,945 - 353,945 436,836 (82,891)
Amortization of intangible assets 291,136 - 291,136 4,462 286,674
Total Expenses 40,494,279 1,617,430 42,111,709 36,793,197 5,318,512
Surplus/(Defi cit) for the year 2,873,403 (681,984) 2,191,419 8,509,514 (6,318,095)
Attributable to:
Surplus attributable to owners 2,873,403 (681,984) 2,191,419 8,509,514 (6,318,095)
The accounting policies and the notes on pages 88 to 106 form an integral part of these fi nancial statements.
ANNUAL REPORT FOR THE YEAR ENDED 30TH JUNE, 2016
8888
28.0. NOTES TO THE FINANCIAL STATEMENTS
GENERAL INFORMATION The Energy and Water Utilities Regulatory Authority (EWURA) was established under the Energy and
Water Utilities Regulatory Authority Act Cap 414 of the Laws of Tanzania (EWURA Act). Although EWURA was established in November, 2005 through Government Notice No. 19 of February, 2006, it became operational in June, 2006 when the Board of Directors was fully established. The address of its registered offi ce is:
7 Floor LAPF Pensions Fund Towers, Opposite Makumbusho Village, Kijitonyama, P O Box 72175, Dar es Salaam, Tanzania.
PRINCIPAL ACCOUNTING POLICIES The principal accounting policies adopted in the preparation of these fi nancial statements are set out
below. These policies have been consistently applied to all the years presented unless otherwise stated.
(a) Basis of Preparation The fi nancial statements are prepared in accordance with International Public Sector Accounting
Standards (IPSAS). The measurement basis used is the historical cost basis except where otherwise stated in the accounting policies below. The fi nancial statements have been prepared on a going concern basis which assumes that the Authority will continue in operational existence for the foreseeable future.
The preparation of fi nancial statements in conformity with IPSAS requires the use of certain critical accounting estimates and assumptions. It also requires management to exercise its judgment in the process of applying the Authority’s accounting policies. The areas involving a higher degree of judgment or complexity, or where assumptions and estimates are signifi cant to the fi nancial statements are disclosed in accounting policy (b).
(b) Standards, amendments and interpretations to the Authority’s operations The Authority has adopted the following new International Public Sector Accounting Standards
(IPSASs) as of 1 July 2015. The standard has no impact in the fi nancial statements of the Authority.
v The IPSASB issued IPSAS 32 in October 2011 to address a lack of guidance on how public sector entities should account for service concession arrangements from a grantor’s perspective. The standard applies the principles in IFRIC 12 Service Concession Arrangements for determining whether the grantor or the operator should recognize the asset used in a service concession arrangement. This standard is effective for annual periods beginning on or after 1 January 2014, with earlier application permitted. The standard has no impact in the fi nancial statements of the Authority.
(c) Revenue Recognition Revenue comprises of infl ows of economic benefi ts received and receivable by the reporting entity,
which represents an increase in net assets/equity, other than increases relating to contributions from owners.
89
ANNUAL REPORT FOR THE YEAR ENDED 30TH JUNE, 2016
89
The amount of revenue is not considered to be reliably measured until all contingencies relating to the levy have been resolved. The Authority bases its estimates on historical results, taking into consideration the type of regulated supplier, type of transaction and specifi cs of each arrangement.
Revenue from Non-Exchange Transactions Revenue is recognized to the extent that it is probable that the economic benefi ts will fl ow to the
Authority and the revenue can be reliably measured
Revenue from Levies Revenue is recognized upon regulated supplier’s acceptance of demand note.
Donor and Government Funds Funds from the World Bank and Government Funds are reported as Deferred Revenue and
recognized as revenue when there is reasonable assurance that the Authority will comply with the conditions attached to them and the grants will be received.
(i) Operating Grant This is normally in the form of cash and is recognized as income in the year it is received.
(ii) Grant Related to Assets Grants related to assets, including non-monetary grants (such as land or other resources)
are recognized as deferred revenue at fair value and released to statement of fi nancial performance over the useful life of a depreciable asset.
Revenue from Exchange Transactions
Interest income: Is accounted for in the period in which it is earned. For all fi nancial instruments measured at
amortized cost and interest bearing fi nancial assets classifi ed as available-for-sale, interest in-come or expense is recorded using the effective interest rate (EIR), which is the rate that exactly discounts the estimated future cash payments or receipts through the expected life of the fi nan-cial instrument or a shorter period, where appropriate, to the net carrying amount of the fi nancial asset or liability. Interest income is included as other income in the Statement of Financial Perfor-mance.
Other sources of revenue are recognized and accounted for as income to the Authority in the
period in which it is earned.
(d) Property and Equipment All property, plant and equipment are recorded at cost less and thereafter stated at historical cost
less depreciation, less any cumulative asset impairment. Historical cost comprises expenditure initially incurred to bring the asset to its location and condition ready for its intended use.
Subsequent expenditures are capitalized only when they increase the current economic bene-fi ts and meet the recognition criteria. Expenditure incurred to replace a component of item of property and equipment is accounted for separately and capitalized while the major replaced component is derecognized. All other expenditure items, which do not meet recognition criteria, are recognized in the Statement of Financial Performance as expenses as they are incurred.

ANNUAL REPORT FOR THE YEAR ENDED 30TH JUNE, 2016
9090
Depreciation on assets is calculated on the straight line basis to write down the cost of each asset, to its residual value over their estimated useful lives. Full year depreciation is charged to the asset in the year of acquisition irrespective of the date of acquisition, while no depreciation is charged during the year of disposal
The following annual rates are applied:
Category of Assets Rate (%)Leasehold Improvement 20
Technical Equipment 12.5
Motor Vehicles 20
Furniture and Fittings 12.5
Offi ce Equipment 12.5
Computers 33.33
The assets residual values and useful lives are reviewed, and adjusted if appropriate, at each statement of fi nancial position date.
An asset’s carrying amount is written down immediately to its recoverable amount if the asset’s carrying amount is greater than its estimated recoverable amount.
Gains and losses on disposal of property and equipment are determined by comparing the
proceeds with the carrying amount and are taken into account in determining operating profi t.
Intangible Assets Intangible assets consist of computer software licenses which are capitalized on the basis of the
costs incurred to acquire and bring to use the specifi c software. These costs are amortized over their estimated useful lives which are estimated to be 3 years. Intangible assets are carried at cost less any accumulated amortization and accumulated impairment losses. Intangible assets are amortised over the useful economic life and assessed at each reporting date whether there is any indication that an asset may be impaired. If any such indication exists, the entity shall estimate the recoverable service amount of the asset. Generally, costs associated with developing computer software programmes are recognised as an expense when incurred. Intangible assets acquired are measured on initial recognition at cost. Internally generated intangible assets are not capitalised and expenditure is charged against profi ts in the year in which the expenditure is incurred.
(e) Financial Instruments
Classifi cation The Authority classifi es fi nancial assets and fi nancial liabilities into the following categories: ✓ Held-to-maturity investment ✓ Loans and receivables ✓ Financial liabilities measured at amortized cost
Classifi cation depends on the purpose for which the fi nancial instruments were obtained / incurred and takes place at initial recognition.
91
ANNUAL REPORT FOR THE YEAR ENDED 30TH JUNE, 2016
91
Initial Recognition and Measurement Financial instruments are recognized initially when the Authority becomes a party to the
contractual provisions of the instruments.
The Authority classifi es fi nancial instruments, or their component parts, on initial recognition as a fi nancial asset, a fi nancial liability or an equity instrument in accordance with the substance of the contractual arrangement.
Financial instruments are measured initially at fair value, except for equity investments for which a fair value is not determinable, which are measured at cost and are classifi ed as available-for-sale fi nancial assets.
For fi nancial instruments which are not at fair value through profi t or loss, transaction costs are included in the initial measurement of the instrument.
Transaction costs on fi nancial instruments at fair value through profi t or loss are recognized in profi t or loss.
Subsequent Measurement Loans and receivables are subsequently measured at amortized cost, using the effective interest
method, less accumulated impairment losses.
Held-to-maturity investments are subsequently measured at amortized cost, using the effective interest method, less accumulated impairment losses.
Gains and losses arising from changes in fair value are recognized in other comprehensive income and accumulated in equity until the asset is disposed of or determined to be impaired.
Financial liabilities at amortized cost are subsequently measured at amortized cost, using the effective interest method.
De-recognition Financial assets are de-recognized when the rights to receive cash fl ows from the investments
have expired or have been transferred and the Authority has transferred substantially all risks and rewards of ownership.
Impairment of Financial Assets At each reporting date the Authority assesses all fi nancial assets, other than those at fair value
through profi t or loss, to determine whether there is objective evidence that a fi nancial asset or group of fi nancial assets has been impaired.
For amounts due to the Authority, signifi cant fi nancial diffi culties of the debtor, probability that the debtor will enter bankruptcy and default of payments are all considered to be indicators of impairment. Impairment losses are recognized in profi t or loss.
Impairment losses are reversed when an increase in the fi nancial asset’s recoverable amount can be related objectively to an event occurring after the impairment was recognized, subject to the restriction that the carrying amount of the fi nancial asset at the date that the impairment
ANNUAL REPORT FOR THE YEAR ENDED 30TH JUNE, 2016
9292
is reversed shall not exceed what the carrying amount would have been had the impairment not been recognized.
Reversals of impairment losses are recognized in profi t or loss except for equity investments classifi ed as available-for-sale.
Where fi nancial assets are impaired through use of an allowance account, the amount of the loss is recognized in profi t or loss within operating expenses. When such assets are written off, the write off is made against the relevant allowance account. Subsequent recoveries of amounts previously written off are credited against operating expenses.
(f) Loans to Staff These fi nancial assets are classifi ed as loans and receivables.
(g) Trade and Other Receivables Trade receivables are measured at initial recognition at fair value, and are subsequently measured
at amortized cost using the effective interest rate method. Appropriate allowances for estimated irrecoverable amounts are recognized in profi t or loss when there is objective evidence that the asset is impaired. The allowance recognized is measured as the difference between the asset’s carrying amount and the present value of estimated future cash fl ows discounted at the effective interest rate computed at initial recognition.
The carrying amount of the asset is reduced through the use of an allowance account, and the amount of the loss is recognized in profi t or loss within operating expenses. When a trade receivable is uncollectable, it is written off against the allowance account for trade receivables. Subsequent recoveries of amounts previously written off are credited against operating expenses in profi t or loss.
Trade and other receivables are classifi ed as loans and receivables.
(h) Trade and Other Payables Trade payables are initially measured at fair value, and are subsequently measured at amortized
cost, using the effective interest rate method.
(i) Cash and Cash Equivalents Cash and cash equivalents comprise cash on hand and demand deposits and other short-term
highly liquid investments that are readily convertible to a known amount of cash and are subject to an insignifi cant risk of changes in value. These are initially and subsequently recorded at fair value.
(j) Held to Maturity These fi nancial assets are initially measured at fair value plus transaction costs. At subsequent reporting dates these are measured at amortized cost using the effective
interest rate method, less any impairment loss recognized to refl ect irrecoverable amounts. An impairment loss is recognized in profi t or loss when there is objective evidence that the asset is impaired, and is measured as the difference between the investment’s carrying amount and the present value of estimated future cash fl ows discounted at the effective interest rate computed

93
ANNUAL REPORT FOR THE YEAR ENDED 30TH JUNE, 2016
93
at initial recognition. Impairment losses are reversed in subsequent periods when an increase in the investment’s recoverable amount can be related objectively to an event occurring after the impairment was recognized, subject to the restriction that the carrying amount of the investment at the date the impairment is reversed shall not exceed what the amortized cost would have been had the impairment not been recognized.
Financial assets that the Authority has the positive intention and ability to hold to maturity are classifi ed as held to maturity.
(k) Inventories There were no Inventories held for sale.
Inventories for consumption (Stocks and Consumables), i.e. stationeries, are measured at cost upon initial recognition. After initial recognition inventory is measured at the lower of cost and current replacement cost.
Cost is determined by the First-In-First-Out (FIFO) method. Current replacement cost is the cost the entity would incur to acquire the asset on the reporting date.
(l) Provision Provisions are recognised when the Authority has a present legal or constructive obligation as
a result of past events, for which it is probable that an outfl ow of economic benefi ts will be re-quired to settle the obligation, and a reliable estimate can be made of the amount of the obliga-tion.
Where the Authority expects some or all of a provision to be reimbursed, for example under an insurance contract, the reimbursement is recognised as a separate asset but only when the reim-bursement is virtually certain. The expense relating to any provision is presented in the Statement of Financial Performance net of any reimbursement. If the effect of the time value of money is material, provisions are discounted using a current pre tax rate that refl ects, where appropriate, the risks specifi c to the liability. Where discounting is used, the increase in the provision due to the passage of time is recognised as a fi nance cost.
(m) Translation of Foreign Currencies Transactions in foreign currencies during the year are converted into Tanzania Shillings (functional
currency), at rates ruling at the transaction dates. Monetary assets and liabilities at the Statement of Financial Position date which are expressed in foreign currencies are translated into Tanzania Shillings at rates ruling at that date. Non-monetary items that are measured in terms of historical cost in a foreign currency are not retranslated. The resulting differences from conversion and translation are dealt with in the Statement of Comprehensive Income in the period in which they arise.
(n) Functional and presentation currency Items included in the fi nancial statements of the Authority are measured using the currency of
the primary economic environment in which the Authority operates (“the functional currency”). The fi nancial statements are presented in Tanzanian Shillings, which is the Authority functional and presentation currency and all values are rounded to the nearest thousand (TZS’000) except where otherwise indicated.
ANNUAL REPORT FOR THE YEAR ENDED 30TH JUNE, 2016
9494
(o) Employee Entitlements Employee entitlements to gratuity and long-term service awards are recognized when they accrue
to employees. A provision is made for the estimated liability for such entitlements as result of services rendered by employees up to the Statement of Financial Position date.
The estimated monetary liability for employees’ accrued annual leave entitlement at the Statement of Financial Position date is recognized as an expense accrual.
Retirement Benefi t Obligation
a. Approved Pension Scheme The Authority contributes to statutory defi ned pension contribution plans for its employees at the
rate of 15% of basic salary to either Parastatal Pension Fund (PPF) or National Social Security Fund (NSSF) or Government Employees Provident Fund (GEPF) or Public Service Pensions Fund (PSPF) or Local Authorities Pensions Fund (LAPF).
b. Gratuity In addition to pension scheme, the Authority sets aside 15% of employee’s last basic salary
as gratuity payable at the end of the contract. The contract period is normally fi ve (5) years. A provision is made for the estimated gratuity liability as a result of service rendered by the employees up to the Statement of Financial Position date.
(p) Accounting for Leases Leases of assets under which a signifi cant portion of the risks and rewards of ownership are
effectively retained by the lessor are classifi ed as operating leases. Payments made under operating leases are charged to the Statement of Comprehensive Income on a straight line basis over the period of the lease.
(q) Comparatives Comparative fi gures have been adjusted to conform to changes in presentation in the current year
where necessary.
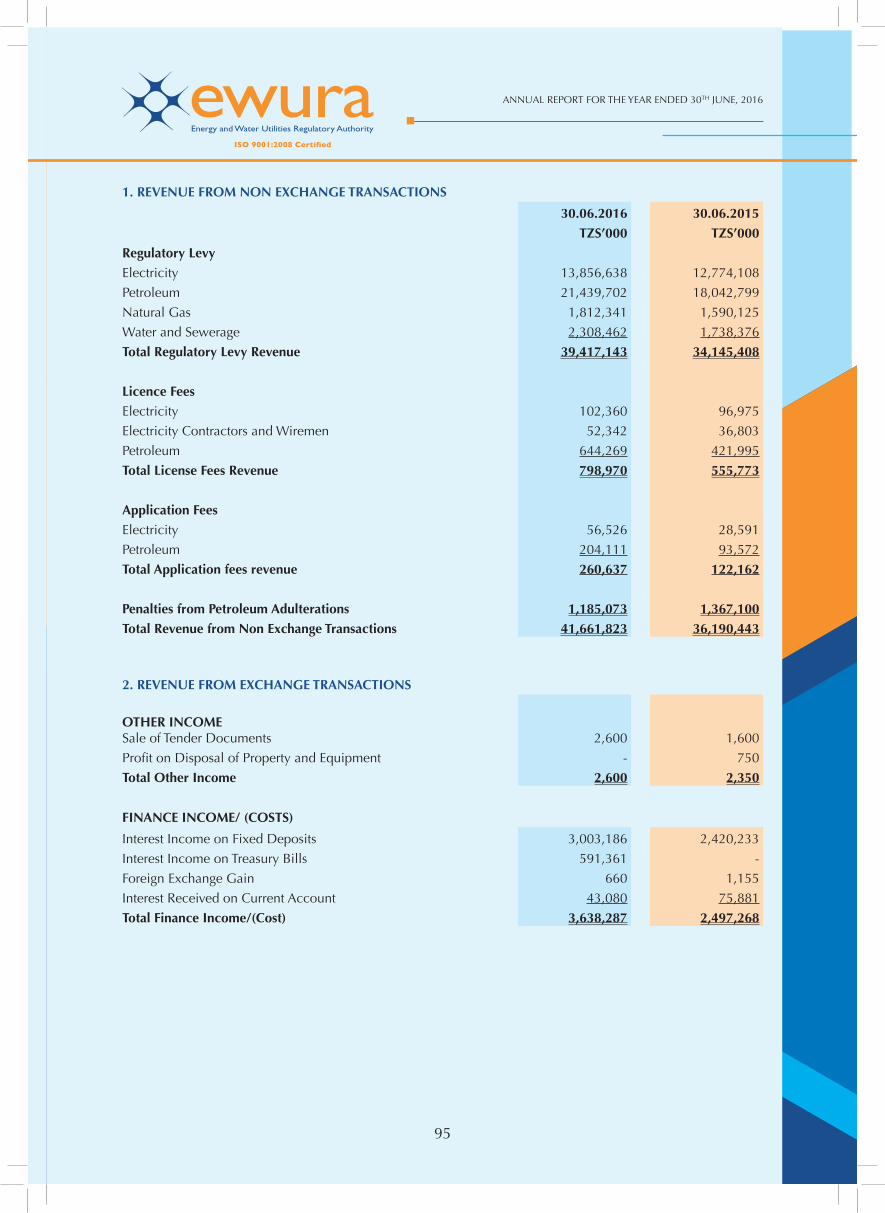
95
ANNUAL REPORT FOR THE YEAR ENDED 30TH JUNE, 2016
95
1. REVENUE FROM NON EXCHANGE TRANSACTIONS
30.06.2016 30.06.2015
TZS’000 TZS’000
Regulatory LevyElectricity 13,856,638 12,774,108
Petroleum 21,439,702 18,042,799
Natural Gas 1,812,341 1,590,125
Water and Sewerage 2,308,462 1,738,376
Total Regulatory Levy Revenue 39,417,143 34,145,408
Licence FeesElectricity 102,360 96,975
Electricity Contractors and Wiremen 52,342 36,803
Petroleum 644,269 421,995
Total License Fees Revenue 798,970 555,773
Application FeesElectricity 56,526 28,591
Petroleum 204,111 93,572
Total Application fees revenue 260,637 122,162
Penalties from Petroleum Adulterations 1,185,073 1,367,100
Total Revenue from Non Exchange Transactions 41,661,823 36,190,443
2. REVENUE FROM EXCHANGE TRANSACTIONS
OTHER INCOMESale of Tender Documents 2,600 1,600
Profi t on Disposal of Property and Equipment - 750
Total Other Income 2,600 2,350
FINANCE INCOME/ (COSTS)
Interest Income on Fixed Deposits 3,003,186 2,420,233
Interest Income on Treasury Bills 591,361 -
Foreign Exchange Gain 660 1,155
Interest Received on Current Account 43,080 75,881
Total Finance Income/(Cost) 3,638,287 2,497,268
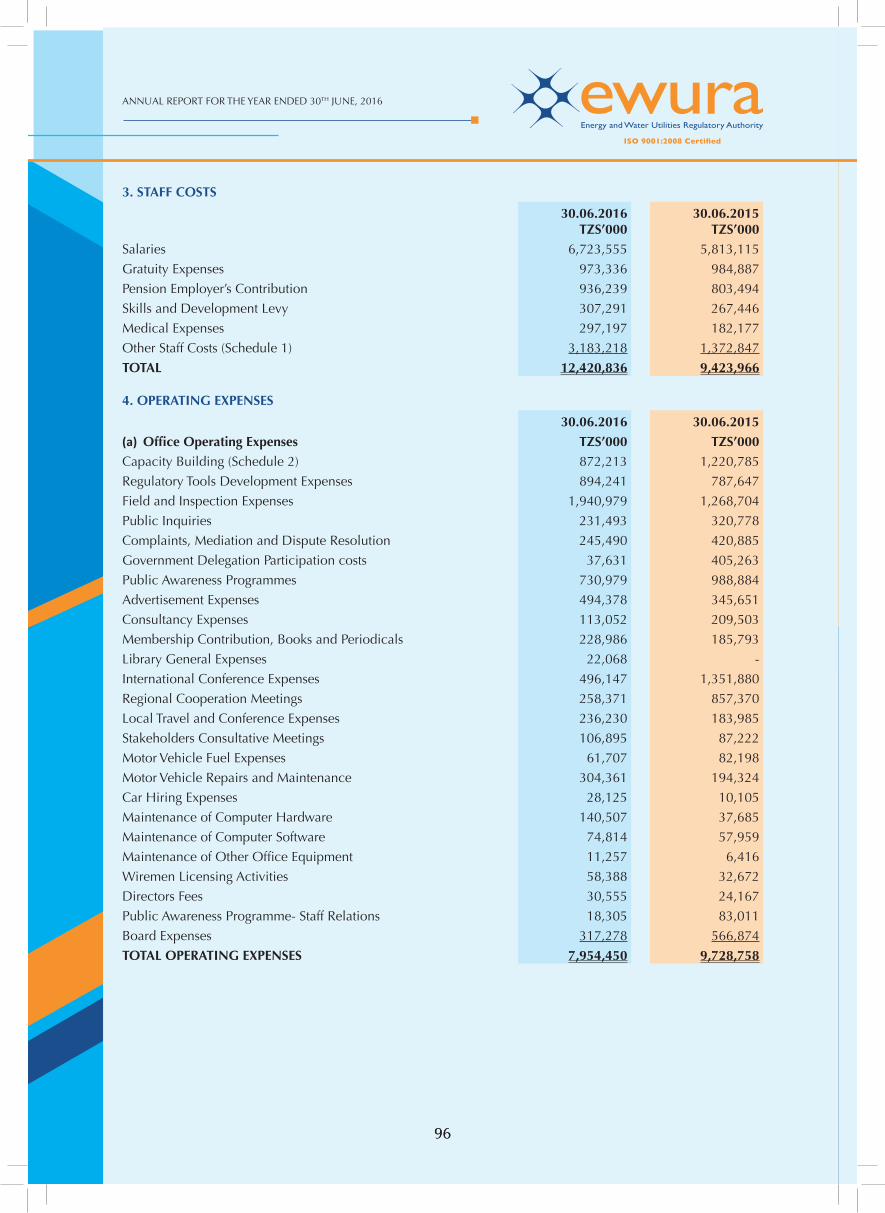
ANNUAL REPORT FOR THE YEAR ENDED 30TH JUNE, 2016
9696
3. STAFF COSTS
30.06.2016 TZS’000
30.06.2015 TZS’000
Salaries 6,723,555 5,813,115
Gratuity Expenses 973,336 984,887
Pension Employer’s Contribution 936,239 803,494
Skills and Development Levy 307,291 267,446
Medical Expenses 297,197 182,177
Other Staff Costs (Schedule 1) 3,183,218 1,372,847
TOTAL 12,420,836 9,423,966
4. OPERATING EXPENSES
30.06.2016 30.06.2015
(a) Offi ce Operating Expenses TZS’000 TZS’000Capacity Building (Schedule 2) 872,213 1,220,785
Regulatory Tools Development Expenses 894,241 787,647
Field and Inspection Expenses 1,940,979 1,268,704
Public Inquiries 231,493 320,778
Complaints, Mediation and Dispute Resolution 245,490 420,885
Government Delegation Participation costs 37,631 405,263
Public Awareness Programmes 730,979 988,884
Advertisement Expenses 494,378 345,651
Consultancy Expenses 113,052 209,503
Membership Contribution, Books and Periodicals 228,986 185,793
Library General Expenses 22,068 -
International Conference Expenses 496,147 1,351,880
Regional Cooperation Meetings 258,371 857,370
Local Travel and Conference Expenses 236,230 183,985
Stakeholders Consultative Meetings 106,895 87,222
Motor Vehicle Fuel Expenses 61,707 82,198
Motor Vehicle Repairs and Maintenance 304,361 194,324
Car Hiring Expenses 28,125 10,105
Maintenance of Computer Hardware 140,507 37,685
Maintenance of Computer Software 74,814 57,959
Maintenance of Other Offi ce Equipment 11,257 6,416
Wiremen Licensing Activities 58,388 32,672
Directors Fees 30,555 24,167
Public Awareness Programme- Staff Relations 18,305 83,011
Board Expenses 317,278 566,874
TOTAL OPERATING EXPENSES 7,954,450 9,728,758
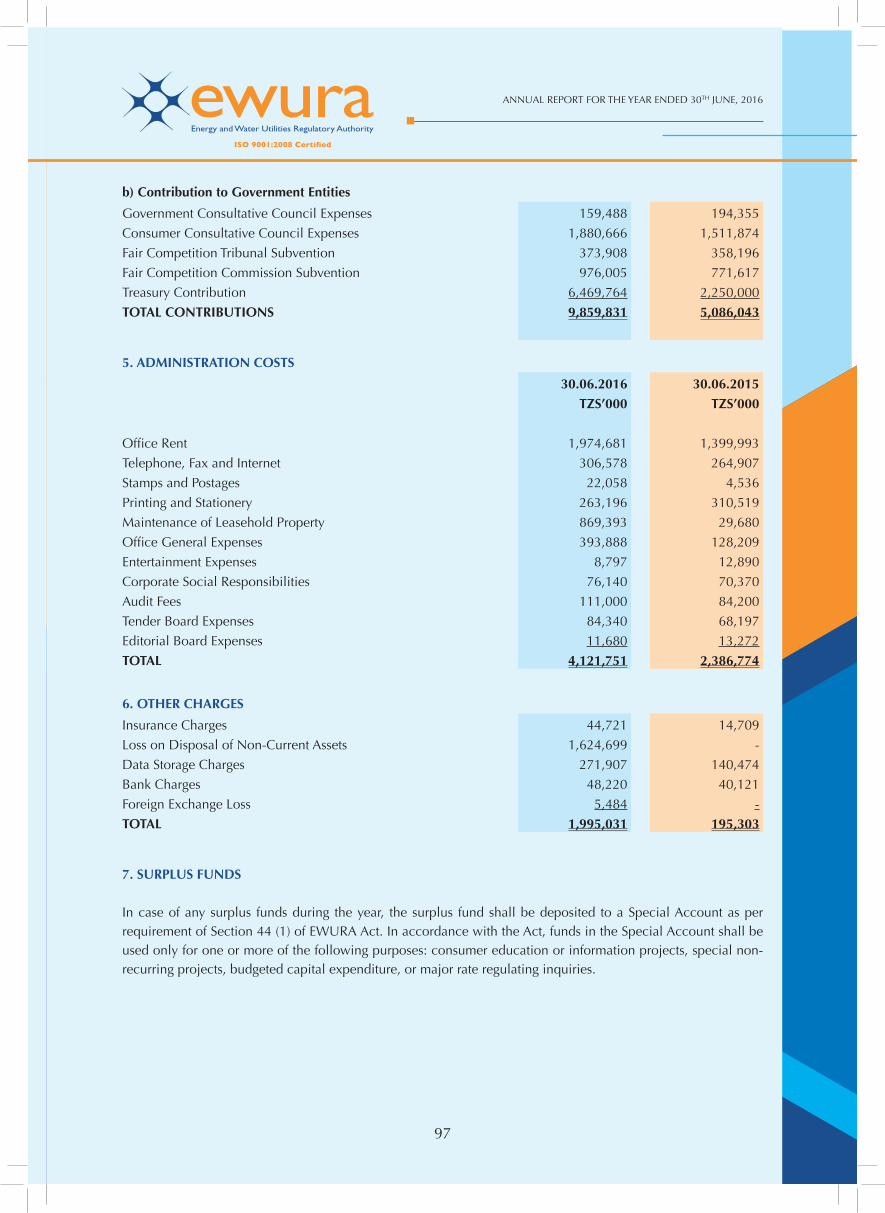
97
ANNUAL REPORT FOR THE YEAR ENDED 30TH JUNE, 2016
97
b) Contribution to Government Entities
Government Consultative Council Expenses 159,488 194,355
Consumer Consultative Council Expenses 1,880,666 1,511,874
Fair Competition Tribunal Subvention 373,908 358,196
Fair Competition Commission Subvention 976,005 771,617
Treasury Contribution 6,469,764 2,250,000
TOTAL CONTRIBUTIONS 9,859,831 5,086,043
5. ADMINISTRATION COSTS
30.06.2016 30.06.2015
TZS’000 TZS’000
Offi ce Rent 1,974,681 1,399,993
Telephone, Fax and Internet 306,578 264,907
Stamps and Postages 22,058 4,536
Printing and Stationery 263,196 310,519
Maintenance of Leasehold Property 869,393 29,680
Offi ce General Expenses 393,888 128,209
Entertainment Expenses 8,797 12,890
Corporate Social Responsibilities 76,140 70,370
Audit Fees 111,000 84,200
Tender Board Expenses 84,340 68,197
Editorial Board Expenses 11,680 13,272
TOTAL 4,121,751 2,386,774
6. OTHER CHARGES
Insurance Charges 44,721 14,709
Loss on Disposal of Non-Current Assets 1,624,699 -
Data Storage Charges 271,907 140,474
Bank Charges 48,220 40,121
Foreign Exchange Loss 5,484 -
TOTAL 1,995,031 195,303
7. SURPLUS FUNDS
In case of any surplus funds during the year, the surplus fund shall be deposited to a Special Account as per requirement of Section 44 (1) of EWURA Act. In accordance with the Act, funds in the Special Account shall be used only for one or more of the following purposes: consumer education or information projects, special non-recurring projects, budgeted capital expenditure, or major rate regulating inquiries.
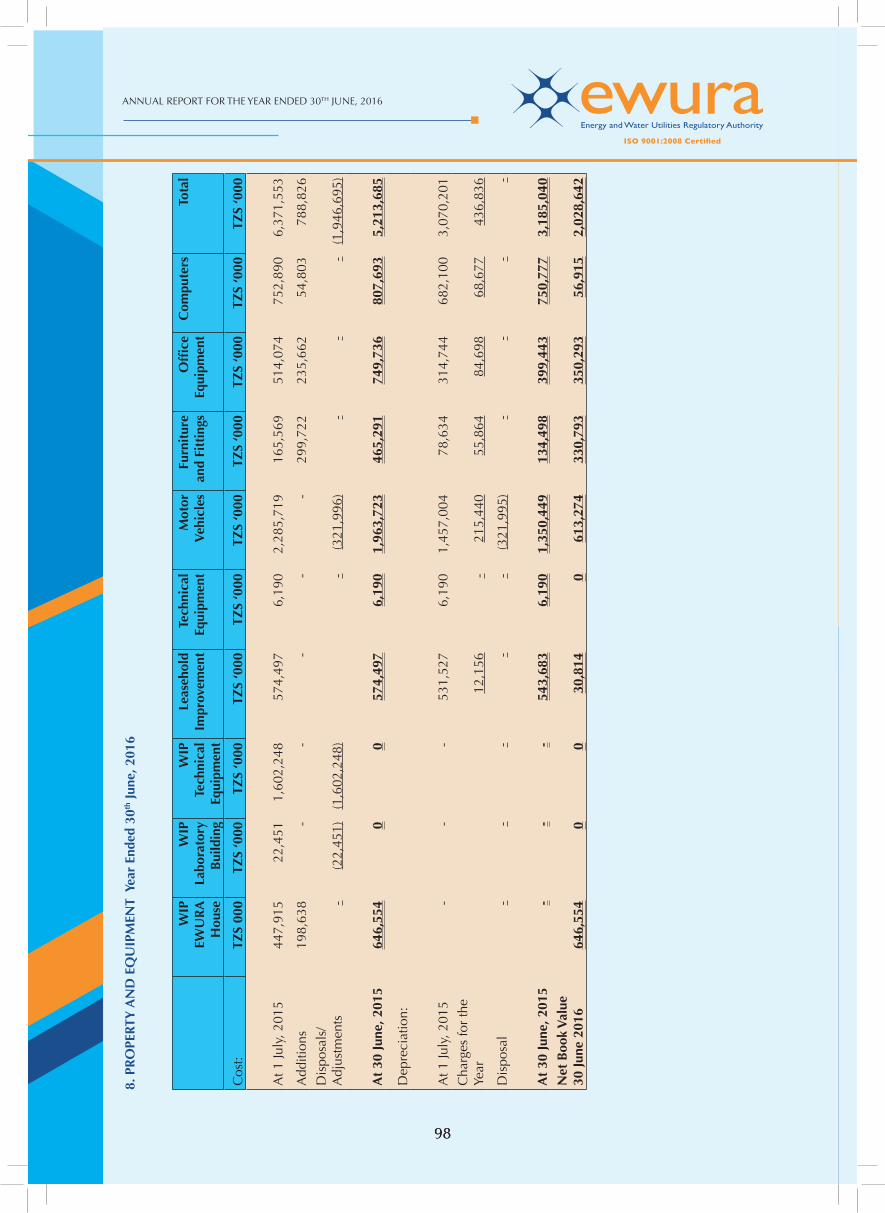
ANNUAL REPORT FOR THE YEAR ENDED 30TH JUNE, 2016
9898
8. P
RO
PERT
Y A
ND
EQ
UIP
MEN
T Y
ear
Ende
d 30
th Ju
ne, 2
016
WIP
EW
UR
A
Hou
se
WIP
La
bora
tory
B
uild
ing
WIP
Te
chni
cal
Equi
pmen
t
Leas
ehol
d Im
prov
emen
tTe
chni
cal
Equi
pmen
tM
otor
V
ehic
les
Furn
itur
e an
d Fi
ttin
gsO
ffi c
e Eq
uipm
ent
Com
pute
rs T
otal
Cos
t:TZ
S 00
0TZ
S ‘0
00TZ
S ‘0
00TZ
S ‘0
00TZ
S ‘0
00TZ
S ‘0
00TZ
S ‘0
00TZ
S ‘0
00TZ
S ‘0
00TZ
S ‘0
00
At 1
July
, 201
544
7,91
522
,451
1,60
2,24
857
4,49
76,
190
2,28
5,71
916
5,56
951
4,07
475
2,89
06,
371,
553
Add
ition
s19
8,63
8-
--
--
299,
722
235,
662
54,8
0378
8,82
6
Dis
posa
ls/
Adj
ustm
ents
-(2
2,45
1)(1
,602
,248
)-
(321
,996
)-
--
(1,9
46,6
95)
At
30 Ju
ne, 2
015
646,
554
00
574,
497
6,19
01,
963,
723
465,
291
749,
736
807,
693
5,21
3,68
5
Dep
reci
atio
n:
At 1
July
, 201
5-
--
531,
527
6,19
01,
457,
004
78,6
3431
4,74
468
2,10
03,
070,
201
Cha
rges
for
the
Year
12,1
56-
215,
440
55,8
6484
,698
68,6
7743
6,83
6
Dis
posa
l-
--
--
(321
,995
)-
--
-
At
30 Ju
ne, 2
015
--
-54
3,68
36,
190
1,35
0,44
913
4,49
839
9,44
375
0,77
73,
185,
040
Net
Boo
k V
alue
30
June
201
664
6,55
40
030
,814
061
3,27
433
0,79
335
0,29
356
,915
2,02
8,64
2

99
ANNUAL REPORT FOR THE YEAR ENDED 30TH JUNE, 2016
99
PRO
PERT
Y A
ND
EQ
UIP
MEN
T (C
onti
nued
) Yea
r En
ded
30th Ju
ne, 2
016
WIP
EW
UR
A
Hou
se
WIP
Lab
Eq
uipm
ent
WIP
Te
chni
cal
Equi
pmen
t
Leas
ehol
d Im
prov
emen
tTe
chni
cal
Equi
pmen
tM
otor
V
ehic
les
Furn
itur
e an
d Fi
ttin
gsO
ffi c
e Eq
uipm
ent
Com
pute
rsTo
tal
TZS’
000
TZS’
000
TZS’
000
TZS’
000
TZS’
000
TZS’
000
TZS’
000
TZS’
000
TZS’
000
TZS’
000
Cos
t:A
t 1st
July
, 201
440
7,89
622
,451
1,86
5,24
854
1,99
06,
190
1,31
5,24
113
2,18
544
4,99
474
7,21
15,
483,
406
Add
ition
s40
,020
--
32,5
0797
0,47
738
,304
76,0
9750
,223
1,20
7,62
8
Adj
ustm
ents
--
(262
,999
)-
--
(4,9
20)
(7,0
16)
(44,
545)
(319
,480
)
At
30th
June
, 20
1544
7,91
522
,451
1,60
2,24
857
4,49
76,
190
2,28
5,71
916
5,56
951
4,07
475
2,89
06,
371,
553
Dep
reci
atio
n:
At 1
st Ju
ly, 2
014
--
-50
4,77
85,
523
1,06
9,43
662
,158
262,
954
644,
311
2,54
9,16
0
Cha
rge
for
the
Year
-
--
26,7
4966
838
7,56
920
,511
57,4
5082
,334
575,
281
Adj
ustm
ents
--
--
--
(4,0
35)
(5,6
60)
(44,
545)
(54,
240)
At
30th
June
, 20
15-
--
531,
527
6,19
01,
457,
004
78,6
3431
4,74
468
2,10
03,
070,
201
Net
Boo
k V
alue
30th
June
, 201
444
7,91
522
,451
1,60
2,24
842
,970
-82
8,71
486
,934
199,
330
70,7
893,
301,
352
In th
e op
inio
n of
the
dire
ctor
s, th
ere
is n
o im
pair
men
t in
the
valu
e of
pro
pert
y an
d eq
uipm
ent.
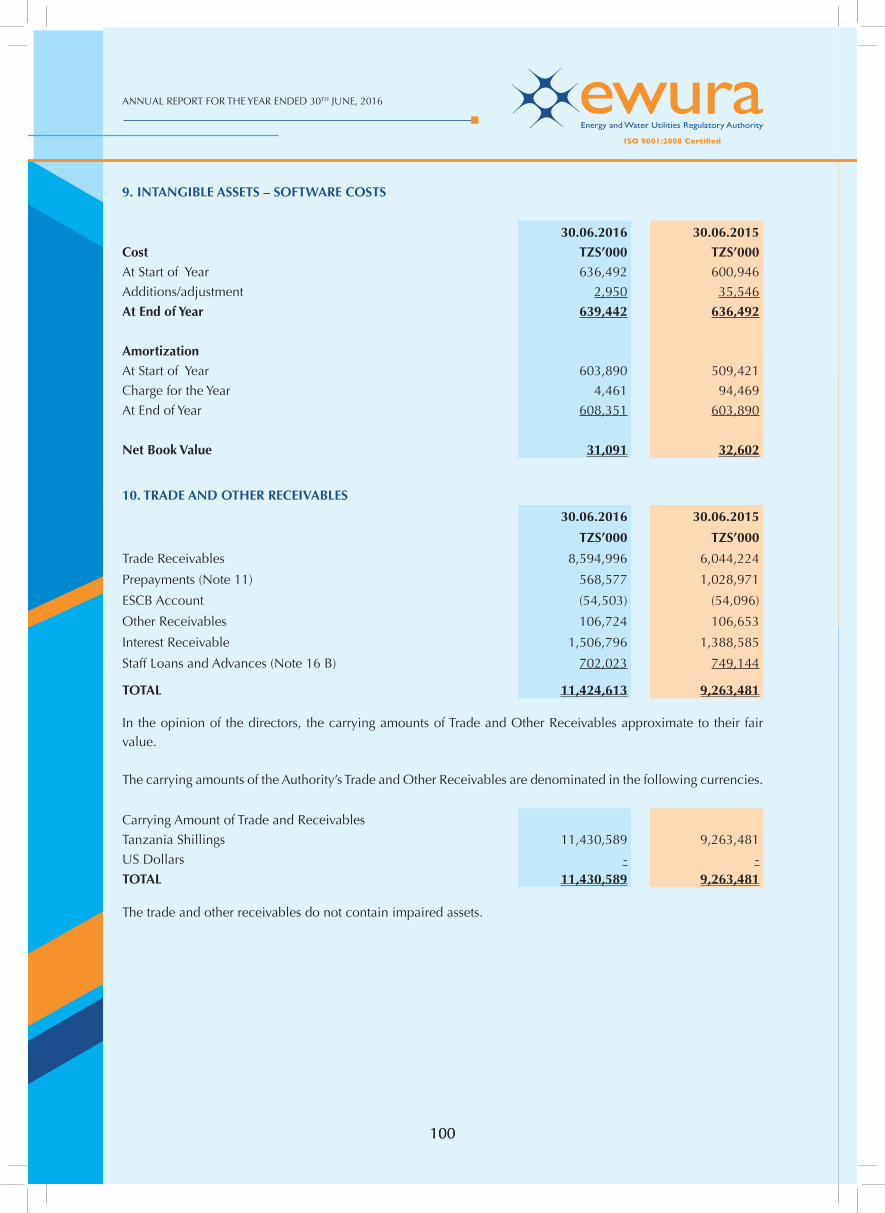
ANNUAL REPORT FOR THE YEAR ENDED 30TH JUNE, 2016
100100
9. INTANGIBLE ASSETS – SOFTWARE COSTS
30.06.2016 30.06.2015
Cost TZS’000 TZS’000At Start of Year 636,492 600,946
Additions/adjustment 2,950 35,546
At End of Year 639,442 636,492
AmortizationAt Start of Year 603,890 509,421
Charge for the Year 4,461 94,469
At End of Year 608,351 603,890
Net Book Value 31,091 32,602
10. TRADE AND OTHER RECEIVABLES
30.06.2016 30.06.2015
TZS’000 TZS’000
Trade Receivables 8,594,996 6,044,224
Prepayments (Note 11) 568,577 1,028,971
ESCB Account (54,503) (54,096)
Other Receivables 106,724 106,653
Interest Receivable 1,506,796 1,388,585
Staff Loans and Advances (Note 16 B) 702,023 749,144
TOTAL 11,424,613 9,263,481
In the opinion of the directors, the carrying amounts of Trade and Other Receivables approximate to their fair value.
The carrying amounts of the Authority’s Trade and Other Receivables are denominated in the following currencies.
Carrying Amount of Trade and Receivables
Tanzania Shillings 11,430,589 9,263,481
US Dollars - -
TOTAL 11,430,589 9,263,481
The trade and other receivables do not contain impaired assets.
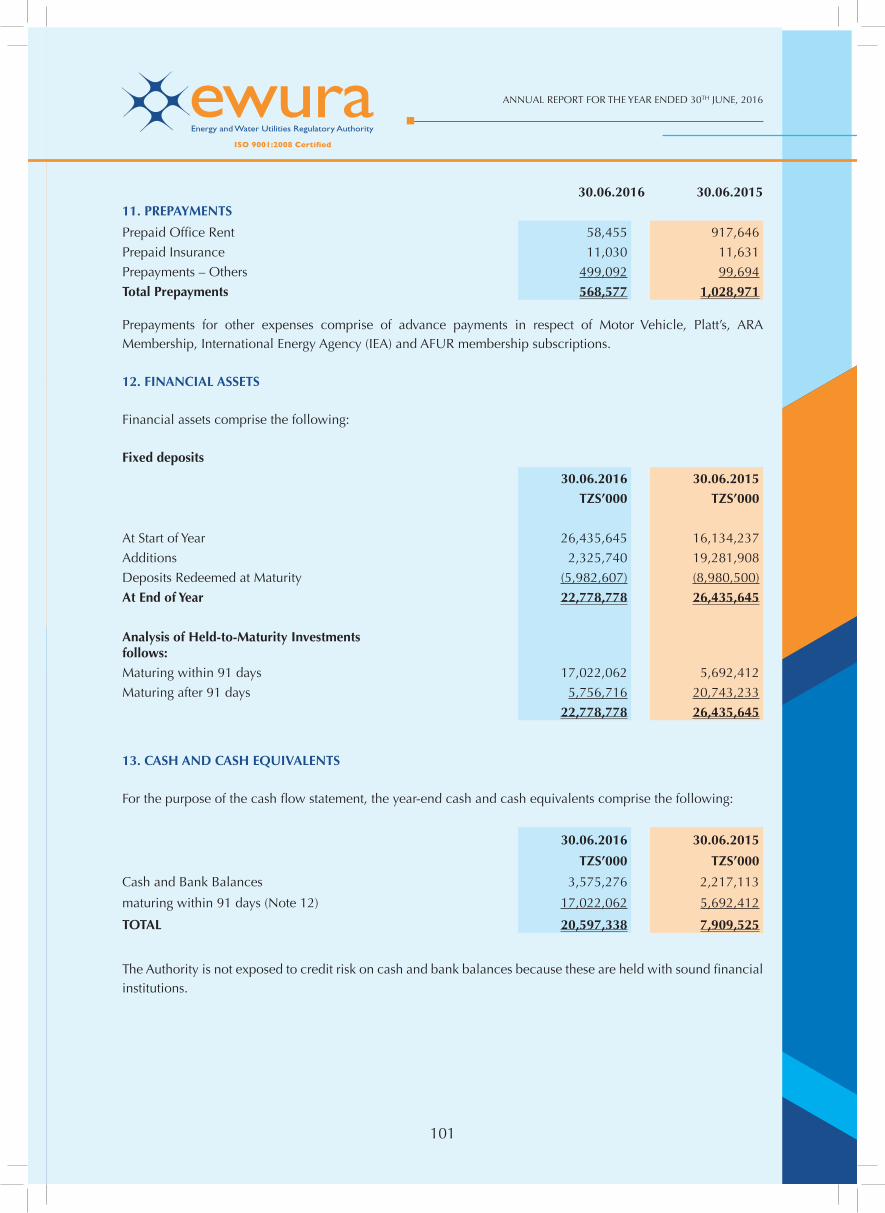
101
ANNUAL REPORT FOR THE YEAR ENDED 30TH JUNE, 2016
101
30.06.2016 30.06.201511. PREPAYMENTS
Prepaid Offi ce Rent 58,455 917,646
Prepaid Insurance 11,030 11,631
Prepayments – Others 499,092 99,694
Total Prepayments 568,577 1,028,971
Prepayments for other expenses comprise of advance payments in respect of Motor Vehicle, Platt’s, ARA Membership, International Energy Agency (IEA) and AFUR membership subscriptions.
12. FINANCIAL ASSETS
Financial assets comprise the following:
Fixed deposits
30.06.2016 30.06.2015
TZS’000 TZS’000
At Start of Year 26,435,645 16,134,237
Additions 2,325,740 19,281,908
Deposits Redeemed at Maturity (5,982,607) (8,980,500)
At End of Year 22,778,778 26,435,645
Analysis of Held-to-Maturity Investments follows:Maturing within 91 days 17,022,062 5,692,412
Maturing after 91 days 5,756,716 20,743,233
22,778,778 26,435,645
13. CASH AND CASH EQUIVALENTS
For the purpose of the cash fl ow statement, the year-end cash and cash equivalents comprise the following:
30.06.2016 30.06.2015
TZS’000 TZS’000
Cash and Bank Balances 3,575,276 2,217,113
maturing within 91 days (Note 12) 17,022,062 5,692,412
TOTAL 20,597,338 7,909,525
The Authority is not exposed to credit risk on cash and bank balances because these are held with sound fi nancial institutions.

ANNUAL REPORT FOR THE YEAR ENDED 30TH JUNE, 2016
102102
The carrying amounts of the Authority’s cash and cash equivalents are denominated in the following currencies:
30.06.2016 30.06.2015
TZS’000 TZS’000NBC Account 8,609 10,891
CRDB Main Account 588,960 134,010
CRDB Revolving Fund Account 837,235 85,446
CRDB Surplus Account 15,208 10,368
Bank ABC Gratuity Account 24,682 783,622
Bank ABC Building Fund 7,351 618,775
Bank ABC Sinking Fund 8,146 270,629
BOT-Energy Sector Capacity Building Project 54,503 54,503
Revenue and Collection Account-USD 722,579 -
Revenue and Collection Account - TZS 1,286,417 -
CRDB USD 21,586 248,869
TOTAL 3,575,277 2,217,113
14. GRATUITY PAYABLE
Non-current liabilities portion at the statement of fi nancial position date amounted to TZS 1,397,063,335. This is part of gratuity provision amounting to TZS 2,631,734,123 as analyzed below:
30.06.2016 30.06.2015
TZS’000 TZS’000At start of the year 2,667,360 2,033,500
Charge for the Year 973,336 984,887
Released During the Year (1,008,962) (351,027)
At End of Year 2,631,734 2,667,360Categorized As:
Current Liabilities (Note 15) 1,234,671 927,989
Non-Current Liabilities 1,397,063 1,739,371
TOTAL 2,631,734 2,667,360
15. TRADE AND OTHER PAYABLES
30.06.2016 30.06.2015
TZS’000 TZS’000Trade Payables 3,065 3,886
Special Dividends Payable 28,969,884 -
Gratuity Payable (Note 14) within the year 1,234,671 927,989
Audit Fees 79,956 58,036
Annual Leave Payable 90,275 25,489
Withholding Tax 11,700 (19,949)
GPA Sinking Fund 382,089 269,955
Pensions Payable 12,374
EREA Fund 162,841 30,263
Other Payables and Accruals 575,137 477,342
TOTAL 31,521,992 1,773,011
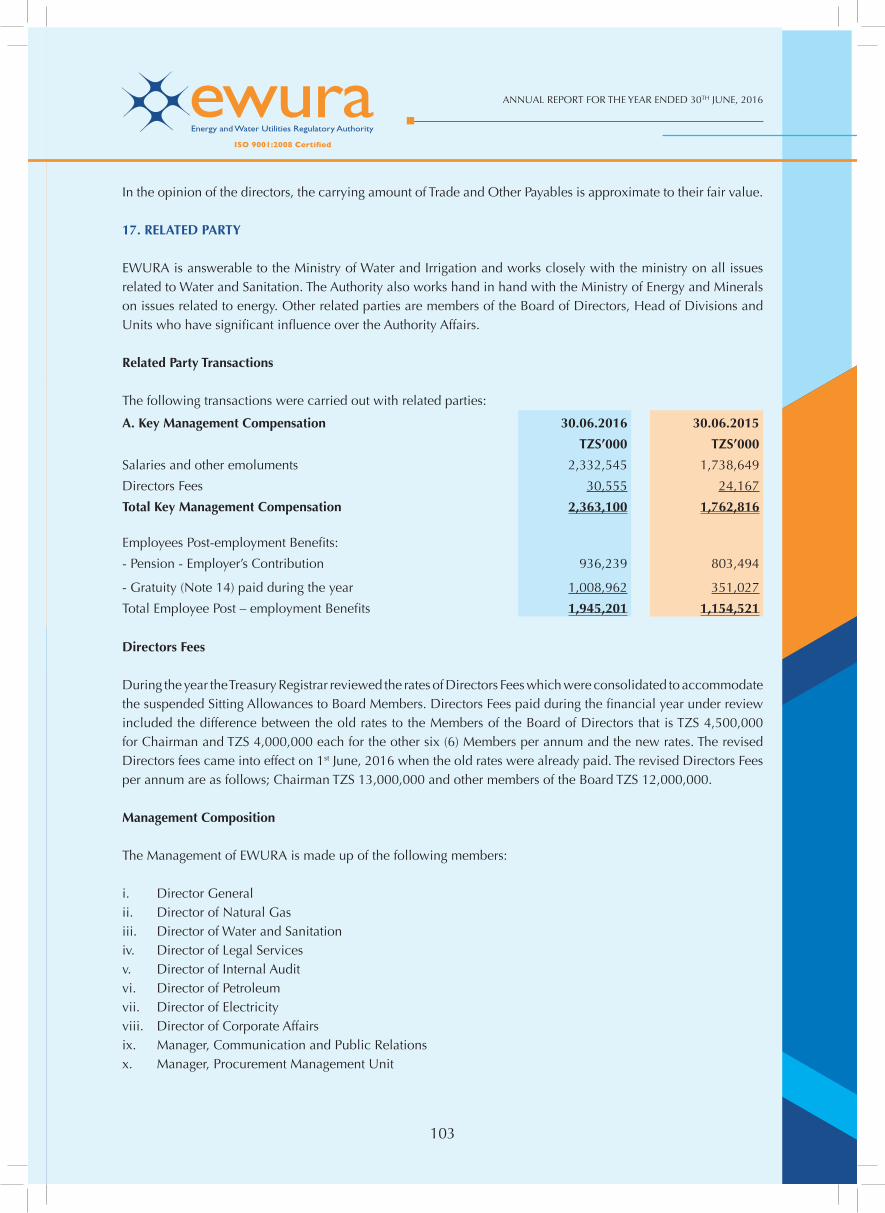
103
ANNUAL REPORT FOR THE YEAR ENDED 30TH JUNE, 2016
103
In the opinion of the directors, the carrying amount of Trade and Other Payables is approximate to their fair value.
17. RELATED PARTY
EWURA is answerable to the Ministry of Water and Irrigation and works closely with the ministry on all issues related to Water and Sanitation. The Authority also works hand in hand with the Ministry of Energy and Minerals on issues related to energy. Other related parties are members of the Board of Directors, Head of Divisions and Units who have signifi cant infl uence over the Authority Affairs.
Related Party Transactions
The following transactions were carried out with related parties:
A. Key Management Compensation 30.06.2016 30.06.2015
TZS’000 TZS’000
Salaries and other emoluments 2,332,545 1,738,649
Directors Fees 30,555 24,167
Total Key Management Compensation 2,363,100 1,762,816
Employees Post-employment Benefi ts:
- Pension - Employer’s Contribution 936,239 803,494
- Gratuity (Note 14) paid during the year 1,008,962 351,027
Total Employee Post – employment Benefi ts 1,945,201 1,154,521
Directors Fees
During the year the Treasury Registrar reviewed the rates of Directors Fees which were consolidated to accommodate the suspended Sitting Allowances to Board Members. Directors Fees paid during the fi nancial year under review included the difference between the old rates to the Members of the Board of Directors that is TZS 4,500,000 for Chairman and TZS 4,000,000 each for the other six (6) Members per annum and the new rates. The revised Directors fees came into effect on 1st June, 2016 when the old rates were already paid. The revised Directors Fees per annum are as follows; Chairman TZS 13,000,000 and other members of the Board TZS 12,000,000. Management Composition
The Management of EWURA is made up of the following members:
i. Director Generalii. Director of Natural Gasiii. Director of Water and Sanitationiv. Director of Legal Servicesv. Director of Internal Auditvi. Director of Petroleumvii. Director of Electricityviii. Director of Corporate Affairsix. Manager, Communication and Public Relationsx. Manager, Procurement Management Unit
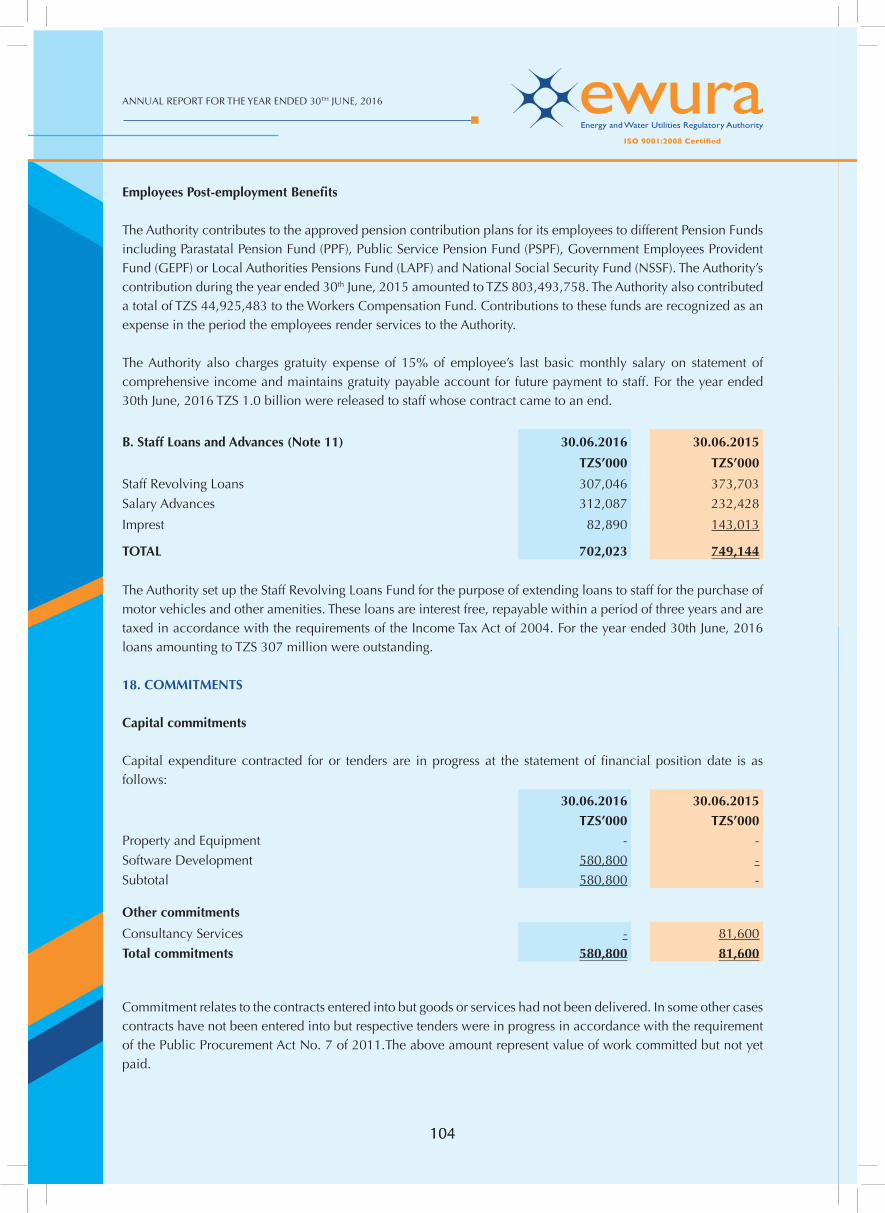
ANNUAL REPORT FOR THE YEAR ENDED 30TH JUNE, 2016
104104
Employees Post-employment Benefi ts
The Authority contributes to the approved pension contribution plans for its employees to different Pension Funds including Parastatal Pension Fund (PPF), Public Service Pension Fund (PSPF), Government Employees Provident Fund (GEPF) or Local Authorities Pensions Fund (LAPF) and National Social Security Fund (NSSF). The Authority’s contribution during the year ended 30th June, 2015 amounted to TZS 803,493,758. The Authority also contributed a total of TZS 44,925,483 to the Workers Compensation Fund. Contributions to these funds are recognized as an expense in the period the employees render services to the Authority.
The Authority also charges gratuity expense of 15% of employee’s last basic monthly salary on statement of comprehensive income and maintains gratuity payable account for future payment to staff. For the year ended 30th June, 2016 TZS 1.0 billion were released to staff whose contract came to an end.
B. Staff Loans and Advances (Note 11) 30.06.2016 30.06.2015
TZS’000 TZS’000
Staff Revolving Loans 307,046 373,703
Salary Advances 312,087 232,428
Imprest 82,890 143,013
TOTAL 702,023 749,144
The Authority set up the Staff Revolving Loans Fund for the purpose of extending loans to staff for the purchase of motor vehicles and other amenities. These loans are interest free, repayable within a period of three years and are taxed in accordance with the requirements of the Income Tax Act of 2004. For the year ended 30th June, 2016 loans amounting to TZS 307 million were outstanding.
18. COMMITMENTS
Capital commitments
Capital expenditure contracted for or tenders are in progress at the statement of fi nancial position date is as follows:
30.06.2016 30.06.2015
TZS’000 TZS’000Property and Equipment - -
Software Development 580,800 -
Subtotal 580,800 -
Other commitments
Consultancy Services - 81,600
Total commitments 580,800 81,600
Commitment relates to the contracts entered into but goods or services had not been delivered. In some other cases contracts have not been entered into but respective tenders were in progress in accordance with the requirement of the Public Procurement Act No. 7 of 2011.The above amount represent value of work committed but not yet paid.
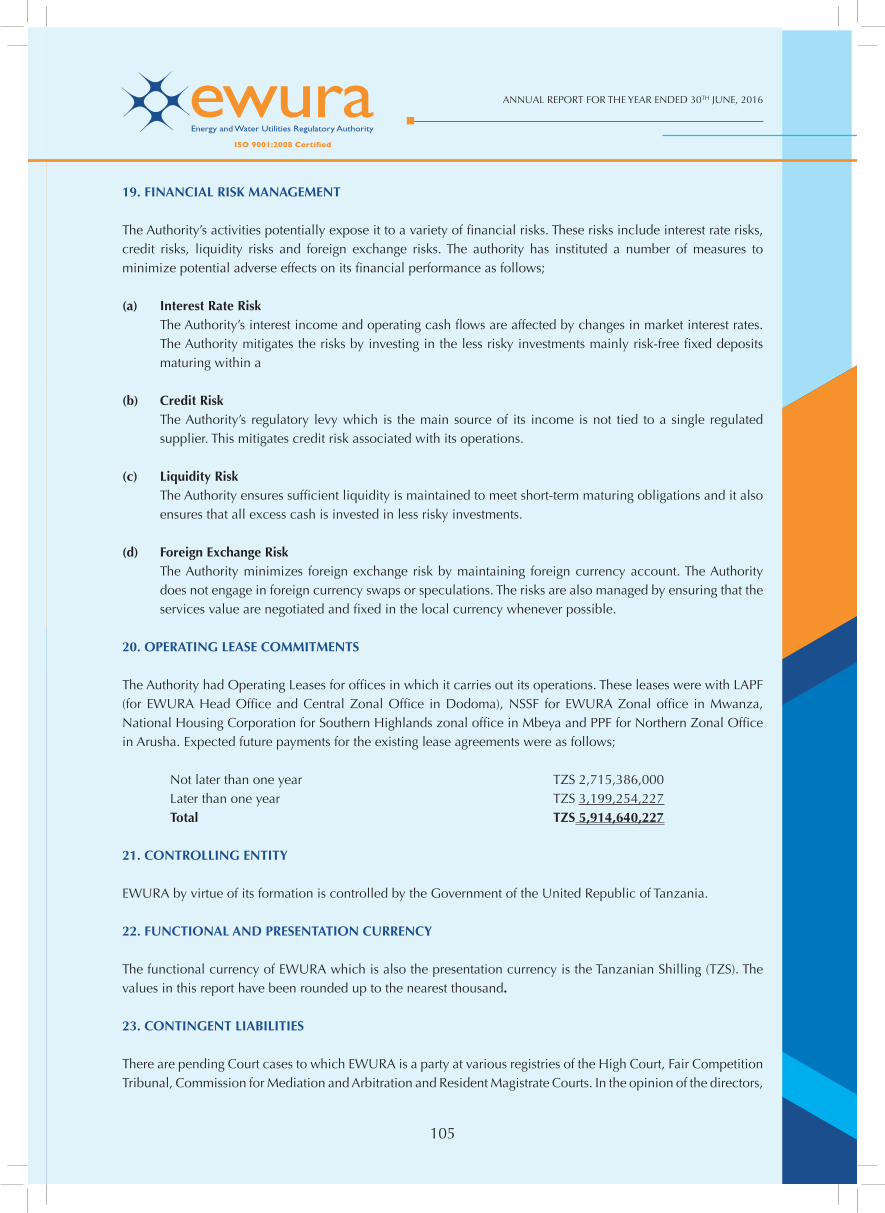
105
ANNUAL REPORT FOR THE YEAR ENDED 30TH JUNE, 2016
105
19. FINANCIAL RISK MANAGEMENT
The Authority’s activities potentially expose it to a variety of fi nancial risks. These risks include interest rate risks, credit risks, liquidity risks and foreign exchange risks. The authority has instituted a number of measures to minimize potential adverse effects on its fi nancial performance as follows;
(a) Interest Rate Risk The Authority’s interest income and operating cash fl ows are affected by changes in market interest rates.
The Authority mitigates the risks by investing in the less risky investments mainly risk-free fi xed deposits maturing within a
(b) Credit Risk The Authority’s regulatory levy which is the main source of its income is not tied to a single regulated
supplier. This mitigates credit risk associated with its operations.
(c) Liquidity Risk The Authority ensures suffi cient liquidity is maintained to meet short-term maturing obligations and it also
ensures that all excess cash is invested in less risky investments.
(d) Foreign Exchange Risk The Authority minimizes foreign exchange risk by maintaining foreign currency account. The Authority
does not engage in foreign currency swaps or speculations. The risks are also managed by ensuring that the services value are negotiated and fi xed in the local currency whenever possible.
20. OPERATING LEASE COMMITMENTS
The Authority had Operating Leases for offi ces in which it carries out its operations. These leases were with LAPF (for EWURA Head Offi ce and Central Zonal Offi ce in Dodoma), NSSF for EWURA Zonal offi ce in Mwanza, National Housing Corporation for Southern Highlands zonal offi ce in Mbeya and PPF for Northern Zonal Offi ce in Arusha. Expected future payments for the existing lease agreements were as follows;
Not later than one year TZS 2,715,386,000 Later than one year TZS 3,199,254,227 Total TZS 5,914,640,227
21. CONTROLLING ENTITY
EWURA by virtue of its formation is controlled by the Government of the United Republic of Tanzania.
22. FUNCTIONAL AND PRESENTATION CURRENCY
The functional currency of EWURA which is also the presentation currency is the Tanzanian Shilling (TZS). The values in this report have been rounded up to the nearest thousand.
23. CONTINGENT LIABILITIES
There are pending Court cases to which EWURA is a party at various registries of the High Court, Fair Competition Tribunal, Commission for Mediation and Arbitration and Resident Magistrate Courts. In the opinion of the directors,
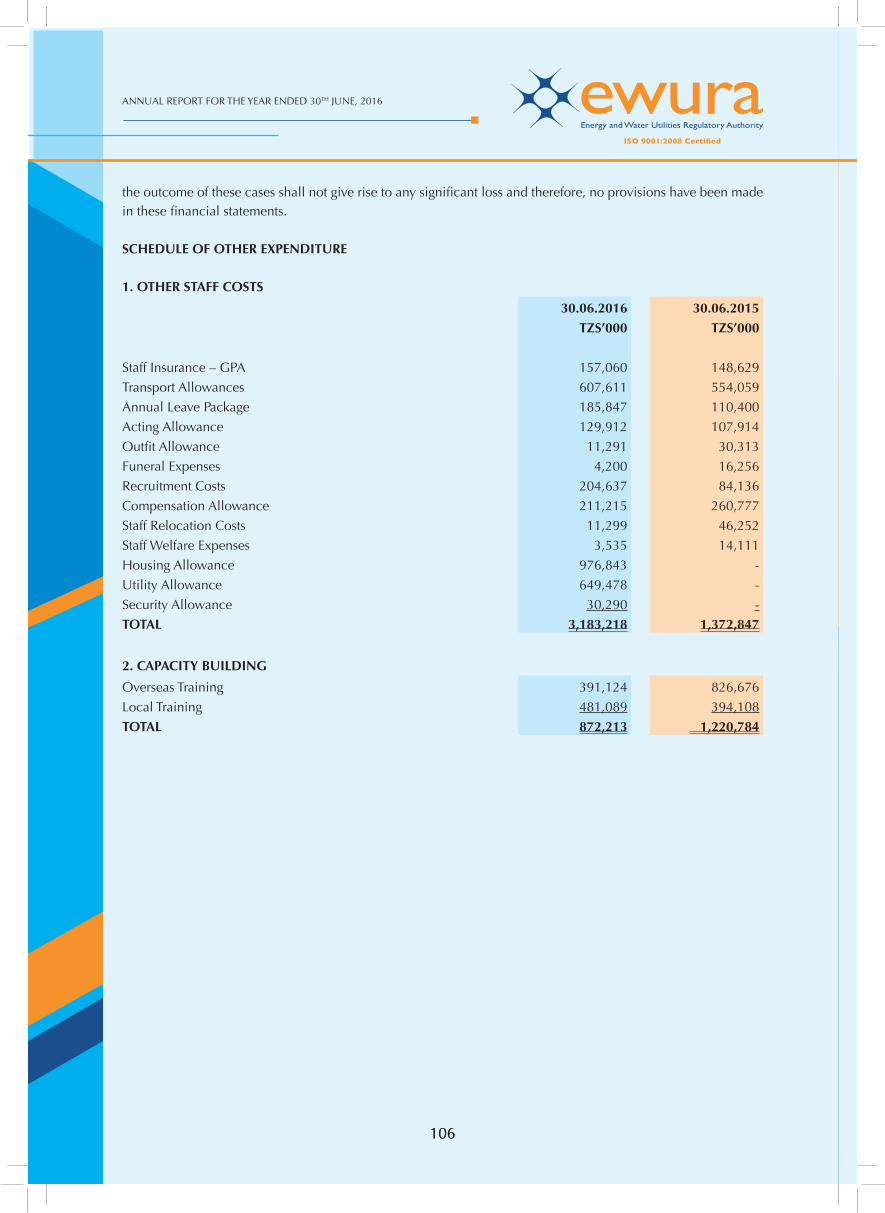
ANNUAL REPORT FOR THE YEAR ENDED 30TH JUNE, 2016
106106
the outcome of these cases shall not give rise to any signifi cant loss and therefore, no provisions have been made in these fi nancial statements.
SCHEDULE OF OTHER EXPENDITURE
1. OTHER STAFF COSTS
30.06.2016 30.06.2015
TZS’000 TZS’000
Staff Insurance – GPA 157,060 148,629
Transport Allowances 607,611 554,059
Annual Leave Package 185,847 110,400
Acting Allowance 129,912 107,914
Outfi t Allowance 11,291 30,313
Funeral Expenses 4,200 16,256
Recruitment Costs 204,637 84,136
Compensation Allowance 211,215 260,777
Staff Relocation Costs 11,299 46,252
Staff Welfare Expenses 3,535 14,111
Housing Allowance 976,843 -
Utility Allowance 649,478 -
Security Allowance 30,290 -
TOTAL 3,183,218 1,372,847
2. CAPACITY BUILDING
Overseas Training 391,124 826,676
Local Training 481,089 394,108
TOTAL 872,213 1,220,784