Annual Report - ECB Reports/EC… · · 2017-10-192.2 Board Governance and Performance Agreements...
92
Annual Report
Transcript of Annual Report - ECB Reports/EC… · · 2017-10-192.2 Board Governance and Performance Agreements...

Annual Report

1
ECB Vision, Mission and Values 5 ECB Members of the Board 6 ECB Management 7 Board Chairperson’s Report 8 Chief Executive Officer’s Report 12
1 ECB Legislative Mandate 15 1.1 Electricity and Namibia Energy Regulatory Authority Bills 16
1.2 Gas Bill 16
1.3 Regulatory Instruments 16
2 Corporate Governance Matters 18 2.1 Corporate Governance Information 19
2.2 Board Governance and Performance Agreements 19
2.3 Board Meetings and Attendance 19
2.4 Board Committees 20
2.5 Board Appraisal 20
3 Legal 21 3.1 Legal Projects 22
3.2 Litigation 22
3.3 Future Outlook 22
4 Financial Planning, Monitoring and Reporting 23 4.1 Revenue 24
4.2 Investments 24
4.3 Financial operations 25
4.3.1 Operational Expenditure 25
4.3.2 Capital Expenditure 25
4.4 Internal Audit 25
4.5 Projects 25
4.6 Future Outlook 25
5 Human Resources (HR) 26 5.1 Organisational Structure (Current status) 27
5.2 Performance Management Implementation 27
5.3 Organisational Transformation 27
5.4 Future Outlook 28
5.4.1 Organisational design 28
5.4.2 Capacity 28
Contents
2
6 Corporate Communications & Stakeholder Management 29 6.1 Corporate Communications 30
6.2 Stakeholder Management 30
6.2.1 Public Awareness and Sensitisation 30
6.2.2 Corporate Social Responsibility 30
6.3 Future Outlook 30
7 Information Technology 31 7.1 Major Developments in IT Operations 32
7.2 IT Projects 32
7.3 Future Outlook 32
8 Economic Regulation 33 8.1 Tariffs 34
8.1.1 Bulk Tariffs 34
8.1.2 Distribution Tariffs 37
8.1.3 IPP Tariffs 38
8.1.4 Renewable Energy Feed-in Tariffs (REFIT) 38
8.2 Economic Regulation Projects 39
8.2.1 Transformation of the Single Buyer Market Model (SBMM) 39
8.2.2 Net Metering Rules 39
8.2.3 Review of NamPower Transmission Assets 39
8.2.4 Projects approved by Cabinet 39
8.3 Future Outlook 40
9 Technical Regulation 41 9.1 Quality of Supply Standards 42
9.2 Quality of Service Standards 42
9.3 DemandSideManagement(DSM)andEnergyEfficiency(EE)StudyReviewandUpdate 42
9.4 Technical Regulation Projects 42
9.4.1 Technical Compliance Audits 42
9.4.2 The National Integrated Resource Plan (NIRP) 42
9.4.3 NamPower (NP) Transmission Losses 42
9.4.4 Distribution Losses 42
9.4.5 Contestable Customers Project 43
9.4.6 Technical Regulatory Tools 43
9.4.7 Wiremen’s Licensing Project 43
9.4.8 Renewable Energy Grid Integration Study Project 43
9.4.9 Electrical Installation Standards Project 43
9.5 Future Outlook 43
10 Regulatory Support Services 44 10.1 LicensingStatusandUpdate 45
10.1.1 Licences Issued 45
10.1.2 Licences Amended 45
10.1.3 Licences Transferred 45 10.1.4 Licences Renewed 45
10.1.5 LicencesUnderReview 46
10.2 Independent Power Producers 46
10.2.1 Interim REFIT Programme 46

3
10.2.2 UnsolicitedIPPs 46
10.2.3 Solicited IPPs 46
10.3 Licensee Compliance 48
10.3.1 Licensee Compliance Audits Conducted 48
10.4 Customer Complaints 49
10.5 Industry Performance Analysis 49
10.5.1 NamPower Performance Review 49
10.5.1.1RevenueStreams,ProfitabilityandOperatingLeverage 49
10.5.1.2 NamPower Returns 50
10.5.2 NamPower Accounts Receivable and Solvency 51
10.5.3 NamPower Gearing / Cash Flow and Liquidity 52
10.5.4 NamPowerProductivity&Efficiency 52
10.5.5 Overview of NamPower Generation Licence Performance 53
10.5.6 Overview of NamPower Transmission Licence Performance 53
10.6 Overview of Distribution Licensee Performance 54
10.6.1 Erongo RED Performance Results 55
10.6.2 NORED Performance Results 57
10.6.3 CENORED Performance Results 57
10.6.4 Other Commercialised Distribution Performance Results 59
10.7 Key ESI Statistics 60
10.7.1 National Electricity Supply 60
10.7.1.1 Namibia’s Electricity Sources 60
10.7.1.2 Annual Peak Demand vs Generation Capacity 61
10.7.1.3 Imports vs Exports of Electricity in Namibia 61
10.7.2 Electricity Distribution 62
10.7.2.1 Total Number of Customers in the Distribution Sector 62
10.7.2.2 Total Electricity Consumption 62
10.7.2.3 Electricity Average Annual Tariffs per Customer Category 63
10.7.2.4 Total Revenue Collected from Customers 63
10.7.2.5 Total Revenue as per Customer Category 64
10.8 Regulatory Support Services Projects 64
10.8.1 The Establishment of the Knowledge Hub 64
10.8.2 National Policies Developed and Finalised 64
10.8.3 IPP Policy 65
10.8.4 Renewable Energy Policy 65
10.8.5 National Energy Policy 65
10.8.6 EDI Reform 65 10.9 Future Outlook 65
11. Regional And International Activities 66 11.1 Regional Electricity Regulators Association of Southern Africa (RERA) 67
11.2 AfricanForumforUtilityRegulators(AFUR) 67
11.3 African Electrotechnical Standardisation Commission (AFSEC) and
International Electrotechnical Commission (IEC) 67
11.4 World Energy Council (WEC) 67
Annual Financial Statements 68
4
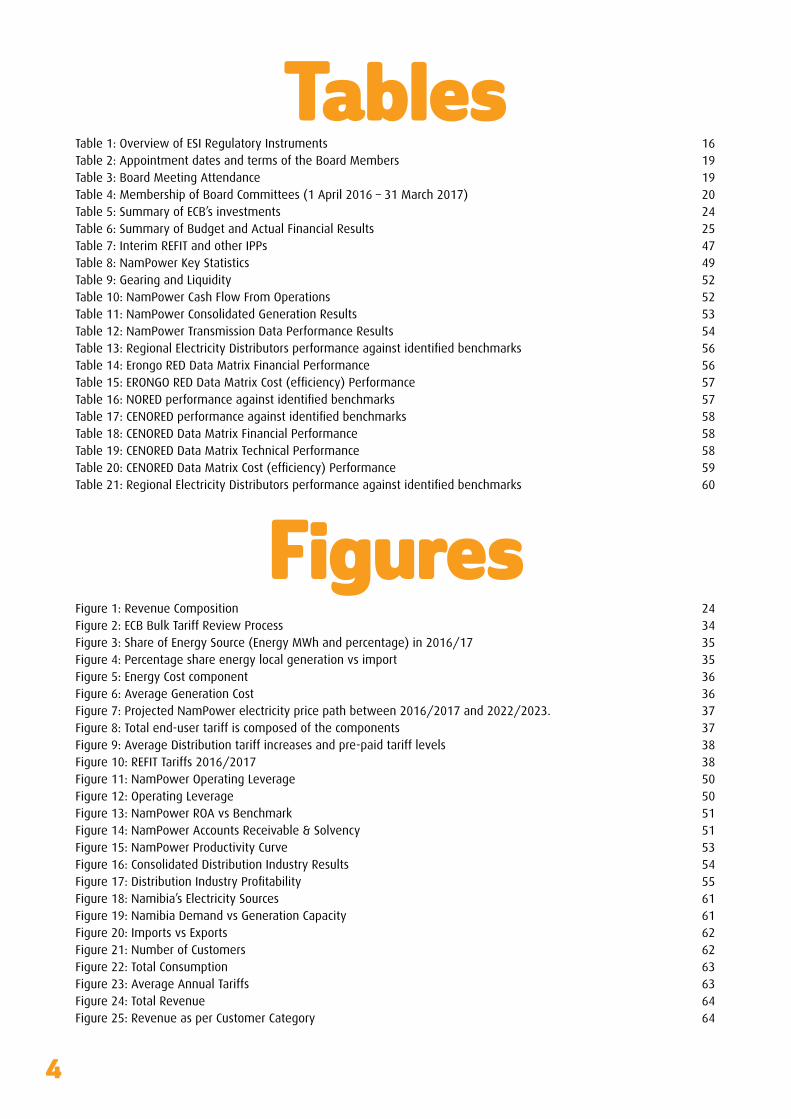
Figure 1: Revenue Composition 24Figure 2: ECB Bulk Tariff Review Process 34Figure 3: Share of Energy Source (Energy MWh and percentage) in 2016/17 35Figure 4: Percentage share energy local generation vs import 35Figure 5: Energy Cost component 36Figure 6: Average Generation Cost 36Figure 7: Projected NamPower electricity price path between 2016/2017 and 2022/2023. 37Figure 8: Total end-user tariff is composed of the components 37Figure 9: Average Distribution tariff increases and pre-paid tariff levels 38Figure 10: REFIT Tariffs 2016/2017 38Figure 11: NamPower Operating Leverage 50Figure 12: Operating Leverage 50Figure 13: NamPower ROA vs Benchmark 51Figure 14: NamPower Accounts Receivable & Solvency 51Figure 15: NamPower Productivity Curve 53Figure 16: Consolidated Distribution Industry Results 54Figure17:DistributionIndustryProfitability 55Figure 18: Namibia’s Electricity Sources 61Figure 19: Namibia Demand vs Generation Capacity 61Figure 20: Imports vs Exports 62Figure 21: Number of Customers 62Figure 22: Total Consumption 63Figure 23: Average Annual Tariffs 63Figure 24: Total Revenue 64Figure 25: Revenue as per Customer Category 64
Tables
Figures
Table 1: Overview of ESI Regulatory Instruments 16Table 2: Appointment dates and terms of the Board Members 19Table 3: Board Meeting Attendance 19Table 4: Membership of Board Committees (1 April 2016 – 31 March 2017) 20Table 5: Summary of ECB’s investments 24Table 6: Summary of Budget and Actual Financial Results 25Table 7: Interim REFIT and other IPPs 47Table 8: NamPower Key Statistics 49Table 9: Gearing and Liquidity 52Table 10: NamPower Cash Flow From Operations 52Table 11: NamPower Consolidated Generation Results 53Table 12: NamPower Transmission Data Performance Results 54Table13:RegionalElectricityDistributorsperformanceagainstidentifiedbenchmarks 56Table 14: Erongo RED Data Matrix Financial Performance 56Table15:ERONGOREDDataMatrixCost(efficiency)Performance 57Table16:NOREDperformanceagainstidentifiedbenchmarks 57Table17:CENOREDperformanceagainstidentifiedbenchmarks 58Table 18: CENORED Data Matrix Financial Performance 58Table 19: CENORED Data Matrix Technical Performance 58Table20:CENOREDDataMatrixCost(efficiency)Performance 59Table21:RegionalElectricityDistributorsperformanceagainstidentifiedbenchmarks 60

5
VisionTo be a leading regulator for achieving optimum viability and competition in the Namibian energy industry, whilst upholding the principles of
fairness, integrity and transparency.
MissionTo exercise control over and regulate the Namibian energy industry in a sustainable manner, in the interest of all stakeholders with regards to
price, quality, reliability, viability and safety.
ValuesProfessionalism
To conduct every task to a standard of excellence and to maintain the highest level of competence andpersonalintegrity/efficiencysoastoensurethesatisfactionofallstakeholders;
IntegrityTo be transparent, open, honest and fair in all dealings and communications with stakeholders,
AccountabilityTo be accountable and act in accordance with government policy and accept full responsibility
fordecisionsandactions;
InnovationTo innovate through continuous learning, knowledge-sharing and teamwork while delivering
excellentservice;and
SustainabilityTo ensure the endowment of Namibia’s energy resources are available to present and future
generations by considering our economic, environmental and social responsibility.

6
Board
From left to right
Mr. Gottlieb HindaChairperson
Ms. Panduleni Shimutwikeni Vice Chairperson
Ms. Helene Vosloo - Member
Ms. Evangelina Nailenge - Member
Mr. Albertus Basson - Member
Members of the

7
Seated from left to right
Ms. Foibe L. Namene Chief Executive Officer
Mr. Rojas Manyame General Manager Regulation
Mr. Johann Malan Manager Corporate Communication
and Legal Services
Ms. Mara Uazenga General Manager Finance & Admin
ECBManagement
Standing from left to right
Mr. Francois Robinson Manager Regulatory Support Services
Ms. Rachel BooisManager Finance
Mr. Pinehas Mutota Manager Economic Regulation
Dr. Maxwell Muyambo Manager Technical Regulation
Mr John Mukoya Manager Human Resources & Admin

8
ReportThe ECB has made big strides in coming to
grips with the challenges of a dynamic industry.
We responded by anticipating industry
trends bearing economic, technological,
environmental and social impact, and developed
regulatory tools and policies.
Board Chairperson’s
9
In my maiden Report as Chairperson of the Board of Directors of the ECB, I committed to the following:
• Securityofsupplythroughthecreationofanequitableandfairinvestmentenvironment;
• Faircompetitionintheindustry,leadingtoaffordabletariffsintheend;
• Benchmarkingandcontinuousreferencetointernationalbestpractices;
• Developmentandeffectiveimplementationofresponsiveregulatorytools;
• Strengthenindustrycompliancetoregulatorydirectives;and
• Adherence to the highest standards of corporate governance.
I also pledged to enhance:
• Licensee accountability on matters relating to safety, security and quality of supply and service;
• Sector sustainability through cost-reflective tariffs, compliance monitoring andenforcement;
• Internal as well as industry competency levels through supporting capacity building initiatives;and
• Participation of Namibians in the energy industry.
Havingreiteratedtheearlierpromise,Ireflectwithhumilitytheprogressmadeontheroadtravelled and the challenges encountered. Our dedicated efforts were towards a robust electricity industry that contributes to national growth, employment creation and poverty eradication. I wish to acknowledge with graciousness the role played by the Namibian Government, the electricity supply industry as well as end users in achieving such a feat. Through their active participation in the industry, including its regulation, these players called for pro-activeness in harnessing the full potential of the electricity industry in transforming the economy and the lives of ordinary Namibians.
The ECB has made big strides in coming to grips with the challenges of a dynamic industry. We responded by anticipating industry trends bearing economic, technological, environmental and social impact, and developed regulatory tools and policies.
To ensure that the ECB delivers on its mandate, some of these regulatory processes, procedures and systems have already come into effect. Linking these responses with the earlier promise, I wish to report on:
Security of supply through the creation of equitable and fair investment environment: TheECBempoweredthenationalelectricityutility,NamPower,tofulfillitsmandateandensurecontinued, uninterrupted supply of electricity, as well as honour its business obligations. The ECB decided that the bulk tariff for NamPower be increased to 16.71%. NamPower’s application was received on 4 February 2016. Stakeholder workshops were held where NamPower presented its application. Stakeholders were afforded the opportunity to present
It gives me immense pleasure to present the Annual Report for 2016/2017 on behalf of the Electricity Control Board (ECB).

10
their views, facts and evidence by giving written submissions. It is the intention of the ECB to, in future, conduct public
hearings. In this regard, the Public Hearing Rules are being finalised.
Fair competition in the industry, leading to affordable tariffs in the end: Private sector role in energy generation
is crucial, because it creates competition, reduces the funding burden on the Government, relieves NamPower’s borrowing
requirements and it also introduces generation technology traditionally outside the utility’s core functions. The ECB
allowed orderly development in the energy sector through the greater participation of Independent Power Producers
(IPPs), with a fair regulated return. This is in line with the commitment to put up a strong regulatory system which
allows for certainty, encourages international investment and confidenceinthelong-termreliabilityofsupplyrequiredby
industries, and lay down a transparent system that can be benchmarked against any similar system in the world.
Strengthen industry compliance to regulatory directives: The ECB operationalised its Market Performance Framework
which has been well received by regulated entities. On internal as well as industry competency levels through
supporting capacity building initiatives, the ECB continues to aid struggling licensees, while allowing cross-capacitation in
the industry where Memoranda of Agreements exist.
Licensee accountability on matters relating to safety, security and quality of supply and service: the ECB
implemented its Industry Performance and Maintenance Plan which increased its audits of licensees, who continue
to cooperate.
Sector sustainability through cost-reflective tariffs, compliance monitoring and enforcement: The ECB continues to keepNamibia on a cost-reflective tariff path,
and with no licensee worse-off. The ECB operates in a rapidly changing environment. Electricity has always been,
and will always be the catalyst for economic development. It is constantly evolving and continuously changing, with
potentially far-reaching consequences for the energy market. We therefore remain aware of the need to continuously reviewandimprovetheeffectivenessandefficiencyofour
functions as a Regulator.
Participation of Namibians in the energy industry: The ECB issued licenses to Namibian companies, some of which
participated in the Interim Renewable Energy Feed-In Tariffs (REFIT) Programme. These companies are listed on Table 7
on page 47 and 48. I am glad to report that of those 14 REFIT participants, two, namely Osona Energy and Hopsol Energy
successfully commissioned their plants during the period under review.
11
While we pride ourselves on these achievements, we remain cognisant of the complex challenges that must be conquered
in 2018 and beyond. The challenges of security of supply and investment in infrastructure, as well as affordability and access
to energy resources. We are also aware of the challenges facing the energy sector in the region. As part of the regional grouping,
we continue to play our part in the programmes and initiatives of the Regional Electricity Regulators Association of Southern Africa
(RERA), such as Cross-Border Energy Trading.
“These are the aspirations of our National Development Plans. Energy security is essential if we are to achieve the economic
growth target of NDP 4. Our role in realising this goal is pivotal, and we will draw all our internal and external resources to ensure
that it is achieved,” President Hage Geingob emphasised in his State of the Nation Address.
In conclusion, the year under review was challenging for the industry and the country. It is clear that we face a multitude of
challenges as we attempt to balance between the interests of the consumers and those of regulated parties. But we continue
moving forward to remain relevant and sustainable, adhere to internationally accepted regulatory principles of transparency,
neutrality, consistency and predictability, independence, accountability,integrityandefficiency.Weareconfidentthatwith
the support and guidance of the Minister of Mines and Energy, Hon. Obeth Kandjoze, we will effectively address the challenges
we face whilst striving towards achieving our Vision of being “a leading Regulator for achieving optimum viability and competition
in the Namibian energy industry, whilst upholding the principles of fairness, integrity and transparency.”
The success of the past year could not have been achieved without the dedication of Management and staff. We are fortunate to
have an excellent relationship. The envisaged transformation of the ECB into the Namibia Energy Regulatory Authority (NERA)
remains both exciting and challenging. The promulgation of both the Electricity Bill and the Namibia Energy Regulatory Authority
(NERA) Bill remains of utmost importance to the ECB.
While we pride ourselves on these achievements,
we remain cognisant of the complex challenges
that must be conquered in 2018 and beyond.
12
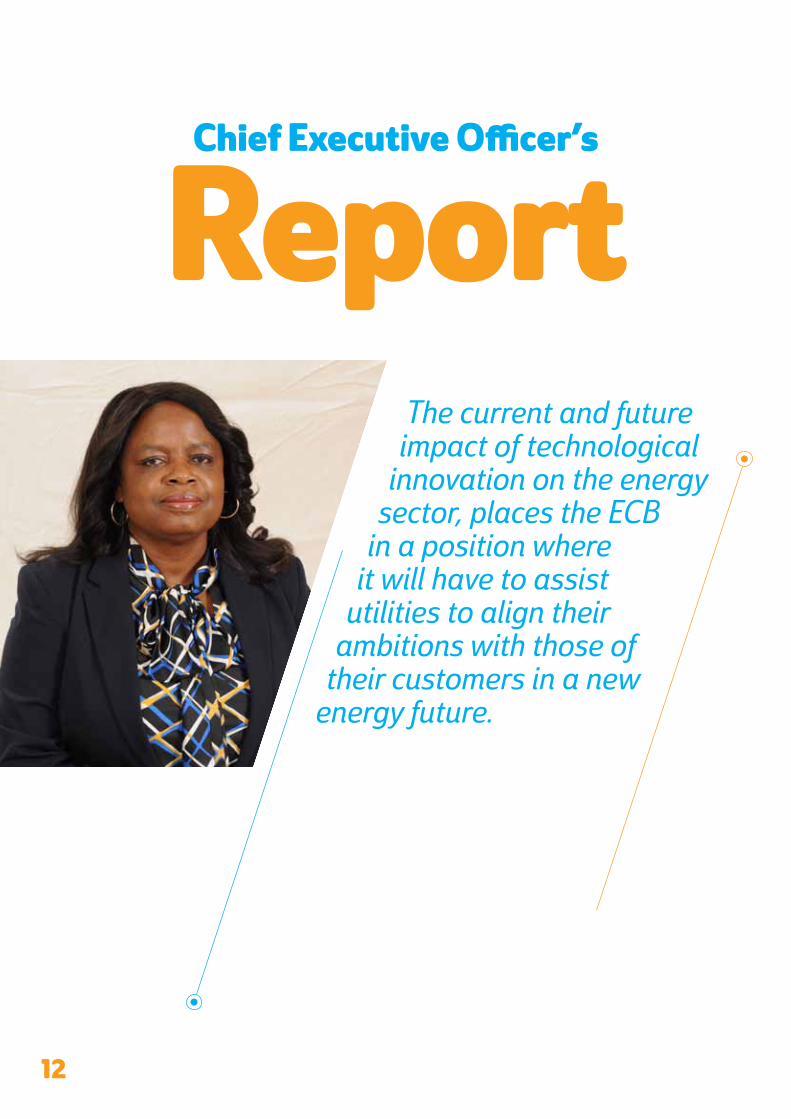
ReportChief Executive Officer’s
The current and future impact of technological
innovation on the energy sector, places the ECB
in a position where it will have to assist
utilities to align their ambitions with those of
their customers in a new energy future.
13
Regulators around the world have been challenged to proactively engage the future and ensuretheirrelevance.Thatchallengehasmainlybeenonfourfronts:technologicalinnovation;private sector participation, demand for stakeholder engagement and customer service and reliability and safety and security of supply, and climate or environmental concerns. Just like any regulator, the ECB has not been spared and had to dig deep during the reporting period. As a Regulator, it is expected of us to conduct business in a fair, just and equitable manner. It is therefore imperative that we place strong emphasis on individual and organizational integrity.
While the conversation on renewable energy came a long way, technological innovation has changed market and customer behaviour towards renewable energy. It has given impetus in Namibia to calls for the acceleration of renewable energy power to play its role in the country’s generation mix. The realisation led to a rush in rooftop system installations by customers. This development triggered the ECB to develop the Net Metering Rules that were promulgated in November 2016. The Rules have since been gazetted and implemented, and their effectiveness is being monitored.
The innovation in renewable technologies, especially solar photovoltaics (PV), has opened the possibilityofelectrificationof thoseruralcommunitiesin Namibia that are currently not served by the grid.
The shift in market and customer behaviour brought about by technological innovation in the electricity sector
challenges the ECB to proactively regulate and ensure its relevance. As highlighted in the Chairperson’s report we
operate in a rapidly changing environment and over a dynamic industry. It requires continuous review and improvement as
well as the development and implementation of regulatory methodologies, procedures, processes and systems. I am proud
to report that we have done that and will strive to continuously deliver on that promise. We have come a long way and ECB has
matured into an organization that truly subscribes to continuous improvement.
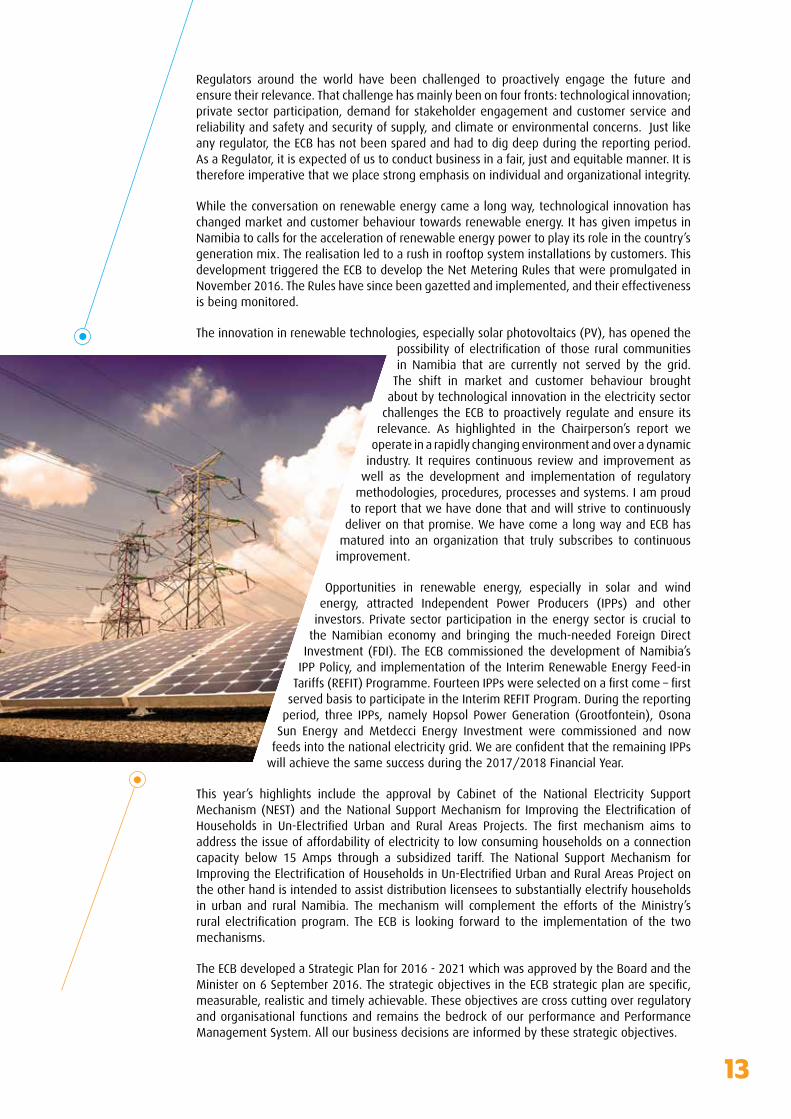
Opportunities in renewable energy, especially in solar and wind energy, attracted Independent Power Producers (IPPs) and other
investors. Private sector participation in the energy sector is crucial to the Namibian economy and bringing the much-needed Foreign Direct
Investment (FDI). The ECB commissioned the development of Namibia’s IPP Policy, and implementation of the Interim Renewable Energy Feed-in Tariffs(REFIT)Programme.FourteenIPPswereselectedonafirstcome–first
served basis to participate in the Interim REFIT Program. During the reporting period, three IPPs, namely Hopsol Power Generation (Grootfontein), Osona
Sun Energy and Metdecci Energy Investment were commissioned and now feedsintothenationalelectricitygrid.WeareconfidentthattheremainingIPPs
will achieve the same success during the 2017/2018 Financial Year.
This year’s highlights include the approval by Cabinet of the National Electricity Support Mechanism(NEST)andtheNationalSupportMechanismfor Improving theElectrificationofHouseholds in Un-Electrified Urban and Rural Areas Projects. The first mechanism aims toaddress the issue of affordability of electricity to low consuming households on a connection capacity below 15 Amps through a subsidized tariff. The National Support Mechanism for ImprovingtheElectrificationofHouseholdsinUn-ElectrifiedUrbanandRuralAreasProjectonthe other hand is intended to assist distribution licensees to substantially electrify households in urban and rural Namibia. The mechanism will complement the efforts of the Ministry’s rural electrificationprogram. The ECB is looking forward to the implementationof the twomechanisms.
The ECB developed a Strategic Plan for 2016 - 2021 which was approved by the Board and the Ministeron6September2016.ThestrategicobjectivesintheECBstrategicplanarespecific,measurable, realistic and timely achievable. These objectives are cross cutting over regulatory and organisational functions and remains the bedrock of our performance and Performance Management System. All our business decisions are informed by these strategic objectives.

14
We look forward to share progress on the implementation of the Plan as we continue to implement the Strategic Plan.
Thedemandforelectricitycontinuetorisesignificantly.Howeverthecountry’ssupplyfromitsown resources remain unbalanced with the demand not fully met by local supply. We are still dependent on imported electricity. Although this is a concern for the Regulator, we remain optimisticthatthefinalisationoftheNationalIntegratedResourcePlan(NIRP)anditsfinalimplementation will successfully address this challenge.
Another challenge remains the slow pace in the Electricity Distribution Industry (EDI) restructuring process following the EDI Summit held in October 2014. Various stakeholder consultations on how best to address the EDI Reform took place. These platforms were overwhelmingly in favour of the establishment of Southern RED (SORED). The ECB is hopeful that efforts towards the creation of SORED will bear fruits, and thereafter allow the Ministry of Mines and Energy and the Regulator to concentrate on the remaining RED, namely Central RED.
In line with the focus on public awareness, education and branding several workshops and initiatives on the Electricity Bill; IPP Policy and InvestmentFramework;RenewableEnergyPolicy;EnergyPolicy;InterimREFITProgramme;NetMeteringRules;SupportTariffMechanism;NationalIntegratedResourcePlan(NIRP) and Low Voltage Installation Wiring License amongst other were held.
As a responsible corporate citizen, we have contributed to various social and community projects to the value of N$ 250 000.00 and will ensure to deliver on this promise with the resources at our disposal.
Finally, the current and future impact of technological innovation on the energy sector, places the ECB in a position where it will have to assist utilities to align their ambitions with those of their customers in a new energy future. Such interventions will have to be geared towardsensuringthatutilitiesremaincost-reflectiveandtheirservicesrelevant.
As we continue our journey to being transformed into an Energy Regulator responsible for downstream gas pipelines and storage, downstream petroleum pipelines and storage in addition to electricity, we continue leveraging on our unique position and experience to bring about change in the industry. The ECB is fortunate to have access to expertise (internal or external) in the electricity regulation sector whose knowledge, expertise and experience is matched only by their dedication, passion and energy. It is through the dedication of each and every ECB employee that we are able to ensure that the ECB acquits itself excellently against the demanding targets and high expectations set by the industry, and that the ECB is able to deliver on its objectives and mandate.
We could also not have made the achievements without the support of the industry, the public, state organs and other stakeholders. I take this opportunity to thank all the individuals and institutions that supported us, to ensure that we effectively discharge our national duties of regulating the electricity industry. The ECB appreciates the efforts of all the stakeholders in the ESI to help transform the ECB in an efficient regulatorwhich drives changes in and responds to the demands of the industry.
15
MandateThe main objectives of the ECB are to
exercise control over and regulating the
provision, use and consumption of electricity
in Namibia, overseeing the efficient functioning
and development of the electricity industry and
security of electricity provision, amongst
others.
Electricity Control Board Legislative
1
16
The regulator of the electricity industry in Namibia, the Electricity Control Board (ECB), was created under the Electricity Act, Act No 2 of 2000, an Act which was repealed by the Electricity Act No. 4 of 2007. The main objectives of the ECB are to exercisecontroloverandregulatingtheprovision,useandconsumptionofelectricityinNamibia,overseeingtheefficientfunctioning and development of the electricity industry and security of electricity provision, amongst others. The Electricity Act also provides for a licensing system for operators in the electricity industry (generation, trading, transmission, supply, distribution, import and export) as well as for independent tariff regulation by the ECB. There were no changes to the ECB’s legislative mandate during 2016/2017. Net Metering Rules that regulate the generation of electricity by customer-generators and the export of surplus electricity generated into the grid were published in November 2016. The Rules are expected to become operational in May 2017.
1.1. Electricity and Namibia Energy Regulatory Authority Bills
The Electricity Act is currently under revision. The new Electricity Bill will introduce the required changes to give effect to theenvisagedestablishmentoftheNamibiaEnergyRegulatoryAuthority(NERA).UndertheNamibiaEnergyRegulatoryAuthority Bill, the ECB will be transformed into the Energy Regulatory Authority (NERA). NERA will, in addition to electricity, regulate downstream gas pipelines and storage, downstream petroleum pipelines and storage and renewable energy. Each sectorwillberegulatedinaccordancewithenergy-specificlegislation.
TheMinister’sfinalcommentsonthedraftElectricityandtheNamibiaEnergyRegulatoryAuthorityBillsareawaited.TheBillsareexpectedtobefinalisedinthe2017/2018reportingperiod.
1.2. Gas BillThe draft Gas Bill provides for the establishment of a regulatory and licensing framework for gas transportation and distributionnetworks,licensingforthedownstreamgasindustrytoensuresafety,efficiencyandenvironmentalresponsibilityin the transportation and distribution of natural gas, and to create a framework to encourage investment in the sector and to promote competition. During the reporting period, no progress was made on the development of the Gas Bill. Direction from the Ministry of Mines and Energy is awaited.
1.3. Regulatory Instruments
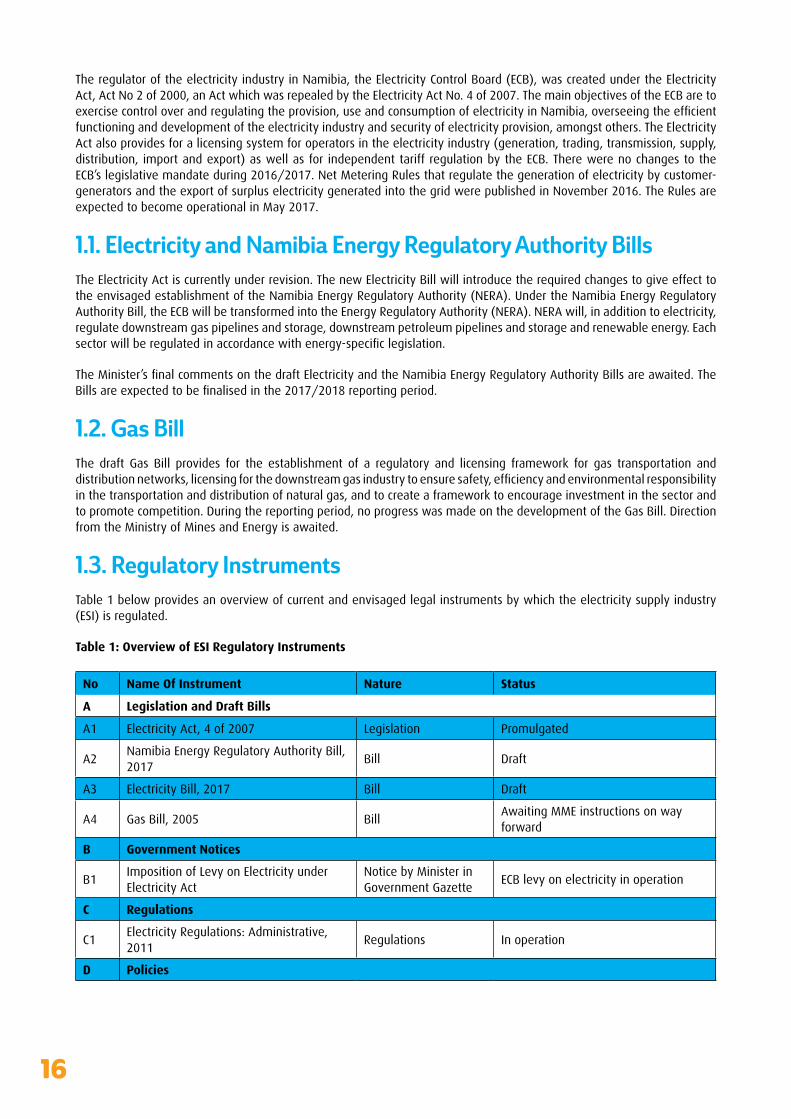
Table 1 below provides an overview of current and envisaged legal instruments by which the electricity supply industry (ESI) is regulated.
Table 1: Overview of ESI Regulatory Instruments
No Name Of Instrument Nature Status
A Legislation and Draft Bills
A1 Electricity Act, 4 of 2007 Legislation Promulgated
A2Namibia Energy Regulatory Authority Bill, 2017
Bill Draft
A3 Electricity Bill, 2017 Bill Draft
A4 Gas Bill, 2005 Bill Awaiting MME instructions on way forward
B Government Notices
B1Imposition of Levy on Electricity under Electricity Act
Notice by Minister in Government Gazette
ECB levy on electricity in operation
C Regulations
C1Electricity Regulations: Administrative, 2011
Regulations In operation
D Policies

17
No Name Of Instrument Nature Status
D1 National Integrated Resource Plan Approved by Board To be approved by Cabinet
D2 Renewable Energy Policy Approved by Board To be approved by Cabinet
D3 National Energy Policy Approved by Board To be approved by Cabinet
D4 IPP Policy Underdevelopment
D5 National Connection Charge Policy Policy Adopted by Cabinet in 2012
E ECB Rules, Codes, Standards and Guidelines
E1 Technical Rules, 2016 ECB Rules In operation
E2 Economic Rules, 2016 ECB Rules In operation
E3 Net Metering Rules, 2016 ECB Rules Promulgated on 15 November 2016
E4 Reseller Rules ECB Rules Underdevelopment
E5 REFIT Rules ECB Rules Underdevelopment
E6 Support Tariff Mechanism Mechanism
Support Tariff Mechanism approved by Cabinet in 2016. Implementation to start in Oshakati in 2017 with national roll-out in 2018
E7 ElectrificationSupportMechanism MechanismSupport Tariff Mechanism approved by Cabinet in 2016
E8 Transmission Grid Code ECB Code Awaiting promulgation
E9 Distribution Grid Code ECB Code Awaiting promulgation
E10 Safety Code ECB Code In operation
E11 Distribution Infrastructure Standards ECB Standards Awaiting promulgation
E12 Maintenance Guidelines ECB Guidelines Awaiting promulgation
E13 Quality of Supply and Service Standards ECB Standards Awaiting promulgation
E14 GuidelinesforFarmers’ElectricityUtilities ECB Guidelines Awaiting promulgation
F ECB Methodologies
F1 Generation Tariff MethodologyInternal ECB methodology
Approved by Board in 2001
F2 Transmission Tariff MethodologyInternal ECB methodology
Approved by Board in 2001
F3 Distribution Tariff MethodologyInternal ECB methodology
Approved by Board in 2001
G ECB Internal Procedures
G1 ECB Complaints Procedure Internal ECB procedure Approved by Board in 2010
G2 Mediation Procedures Internal ECB procedure Approved by Board in 2010
G3 Public Hearing Rules Internal ECB procedure ApprovedbyBoardin2010.Underreview.
18
MattersThe ECB is committed to complying with principles
of good corporate governance and
applicable legislation, most notably the
Electricity Act, Act No 4 of 2007 and the Public
Enterprises Governance Act, Act No 2 of 2006.
Corporate Governance
2

19
2.1. Corporate Governance Information
The ECB is committed to complying with principles of good corporate governance and applicable legislation, most notably the Electricity Act, Act No 4 of 2007 and the Public Enterprises Governance Act, Act No 2 of 2006.
In addition to the legislation mentioned above, the ECB applies the principles of the Corporate Governance Code for Namibia (NamCode) and its guidance on best practice principles in its operations insofar as applicable to the ECB.
The Board approved a Board Charter in 2010 and a Governance Framework in 2012. These documents have been reviewed duringthereportingperiod,andwillbesubmittedtotheBoardforapprovalinthenewfinancialyear.
2.2. Board Governance and Performance Agreements
In line with Sections 17 and 18 of the Public Enterprises Governance Act, a governance agreement between the portfolio MinisterandtheBoardwasfinalisedandexecuted.PerformanceagreementsbetweentheportfolioMinisterandindividualBoard members were also concluded.
2.3. Board Meetings and Attendance
Table 2: Appointment dates and terms of the Board Members
Board Member StatusDate of Current Appointment
Date of Expiry of Term
Current Term
Mr Gottlieb Hinda Chairperson 14 December 2015 13 December 2019 4 years
Ms Panduleni N. Shimutwikeni Vice-Chairperson 14 December 2015 13 December 2019 4 years
Mr Albertus Basson Member 14 December 2015 13 December 2019 4 years
Ms Evangelina Nailenge Member 14 December 2015 13 December 2019 4 years
Ms Helene Vosloo Member 14 December 2015 13 December 2019 4 years
Ms Foibe L Namene* Ex-officio member 1 June 2014 31 May 2019 5 Years
*In terms of Section 11(2)(a) of the Electricity Act, the ECB’s CEO is an ex officio member of the Board but has no right to vote.
In terms of Section 7(1) of the Electricity Act, the Board is required to meet at least once every three months. During the period covered by this Annual Report (1 April 2016 – 31 March 2017), the Board held four ordinary meetings.
The attendance at the Board meetings is as shown in Table 3.
Table 3: Board Meeting Attendance
ELECTRICITY CONTROL BOARD MEETINGS 2016/17
Board Member Status Meetings Attended
Mr Gottlieb Hinda Chairperson 4
Ms Panduleni N. Shimutwikeni Vice-Chairperson 4
Mr Albertus Basson Member 4
Ms Evangelina Nailenge Member 3
Ms Helene Vosloo Member 4
Ms Foibe L. Namene* CEO 4
*In terms of Section 11(2)(a) of the Electricity Act, the CEO is an ex- officio member of the Board but has no right to vote.

20
2.4. Board Committees
The Board established three Board Committees - the Regulation Committee, the Finance, Audit and Risk Committee, and the Human Resources and Remuneration Committee. Membership of Committees and attendance of meetings are set out intheTable4.Duringthefinancialyear,sixRegulationCommitteemeetingstookplace,andfoureachinrespectoftheHRand Remuneration Committee, and the Finance, Audit and Risk Committee.
Table 4: Membership of Board Committees (1 April 2016 – 31 March 2017)
Finance, Audit and Risk Committee
Regulation CommitteeHuman Resources and Remuneration Committee
Mr Albertus Basson (Chairperson)
Ms Evangelina Nailenge (Chairperson)
Ms Panduleni Shimutwikeni (Chairperson)
Ms Evangelina Nailenge Mr Gottlieb Hinda Mr Albertus Basson
Ms Helene Vosloo Ms Helene Vosloo Mr Gottlieb Hinda
Ms Foibe L Namene* Ms Foibe L Namene* Ms Foibe L Namene*
*The CEO is an ex- officio member of the Board Committees but has no right to vote.
2.5. Board Appraisal
Inlinewithcorporategovernancebestpractices,BoardandBoardCommitteeappraisalswilltakeplaceinthenewfinancialyear with the aim of enhancing the effectiveness of the Board.
21
LegalThe promulgation of the NERA and Electricity
Bills will require changes in the regulatory
framework. Following the outcome of the
market framework study that was commenced in
February 2017, market rules and attendant
licences will be developed in the new financial year.
3
22
3.1. Legal Projects
3.1.1. Drafting of NERA and Electricity Bills
Steady progress has been made on the drafting of the above Bills. The draft Bills were presented to the Minister on two occasions during the reporting
period, and his comments were incorporated in revisions of the Bills. The public was called upon to comment on the powers of the Minister in respect
of the clause on procurement of new generation.
Themainoutstandingissuestobefinalisedarethefinallicensingauthorityunder the Electricity Bill and the strengthening of the compliance enforcement
procedures under the two Bills. Proposals have been submitted to the Minister for consideration.
TheBillswillbefinalisedinthenewreportingperiod.
3.1.2. Farmer Schemes Project
Progress was made during the year on the Farmers’ Schemes Project. The finalprojectreport,draftfarmerschemesguidelines,amodelshareholders’
agreement and a model supply agreement were submitted. These documents willbefinalisedinthenextfinancialyear.
3.1.3. Enforcement Mechanisms Project
Little progress was made on the Enforcement Mechanisms Project. Enforcement procedures have been strengthened in the Electricity Bill
through the introduction of directives and administrative penalties. The Projectwillbefinalisedinthe2017/2018financialyear.
3.2. Litigation
Arandis Power lodged a review of the award of the 250MW tender to Xaris Energy by NamPower in the High Court of Namibia, which matter was heard duringthe2016/2017financialyear.ArandisPowerappealedthedecision.
The appeal has not yet been heard.
3.3. Future Outlook
The promulgation of the NERA and Electricity Bills will require changes in the regulatory framework. Following the outcome of the market framework
study that was commenced in February 2017, market rules and attendant licenceswillbedevelopedinthenewfinancialyear.
23
ReportingOnce transformed into NERA, alternative
funding sources will be needed for the additional
sectors of gas and petroleum. A study will
be carried out in the next financial year to explore
suitable funding models.
Financial Planning, Monitoring and
4
24
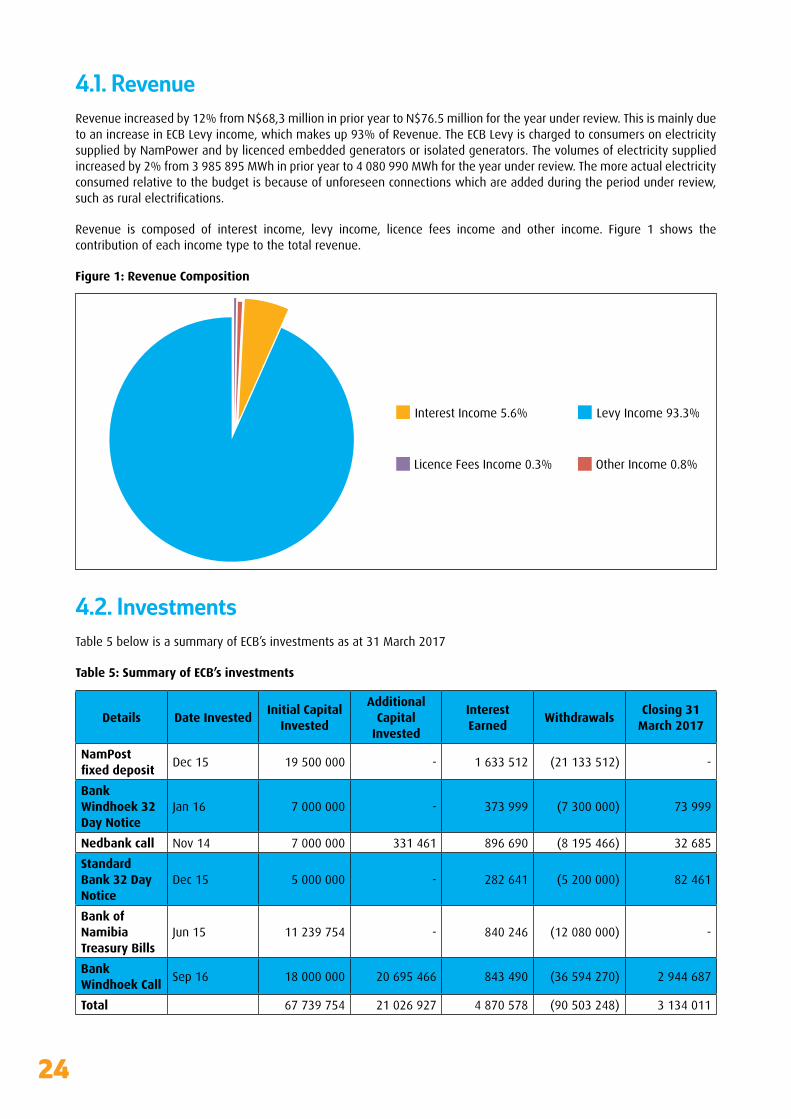
4.1. Revenue
Revenue increased by 12% from N$68,3 million in prior year to N$76.5 million for the year under review. This is mainly due to an increase in ECB Levy income, which makes up 93% of Revenue. The ECB Levy is charged to consumers on electricity supplied by NamPower and by licenced embedded generators or isolated generators. The volumes of electricity supplied increasedby2%from3 985 895MWhinprioryearto4 080 990MWhfortheyearunderreview.Themoreactualelectricityconsumed relative to the budget is because of unforeseen connections which are added during the period under review, suchasruralelectrifications.
Revenue is composed of interest income, levy income, licence fees income and other income. Figure 1 shows the contribution of each income type to the total revenue.
Figure 1: Revenue Composition
4.2. InvestmentsTable 5 below is a summary of ECB’s investments as at 31 March 2017
Table 5: Summary of ECB’s investments
Details Date InvestedInitial Capital
Invested
Additional Capital
Invested
Interest Earned
WithdrawalsClosing 31
March 2017
NamPost fixed deposit
Dec 15 19 500 000 - 1 633 512 (21 133 512) -
Bank Windhoek 32 Day Notice
Jan 16 7 000 000 - 373 999 (7 300 000) 73 999
Nedbank call Nov 14 7 000 000 331 461 896 690 (8 195 466) 32 685
Standard Bank 32 Day Notice
Dec 15 5 000 000 - 282 641 (5 200 000) 82 461
Bank of Namibia Treasury Bills
Jun 15 11 239 754 - 840 246 (12 080 000) -
Bank Windhoek Call
Sep 16 18 000 000 20 695 466 843 490 (36 594 270) 2 944 687
Total 67 739 754 21 026 927 4 870 578 (90 503 248) 3 134 011
25
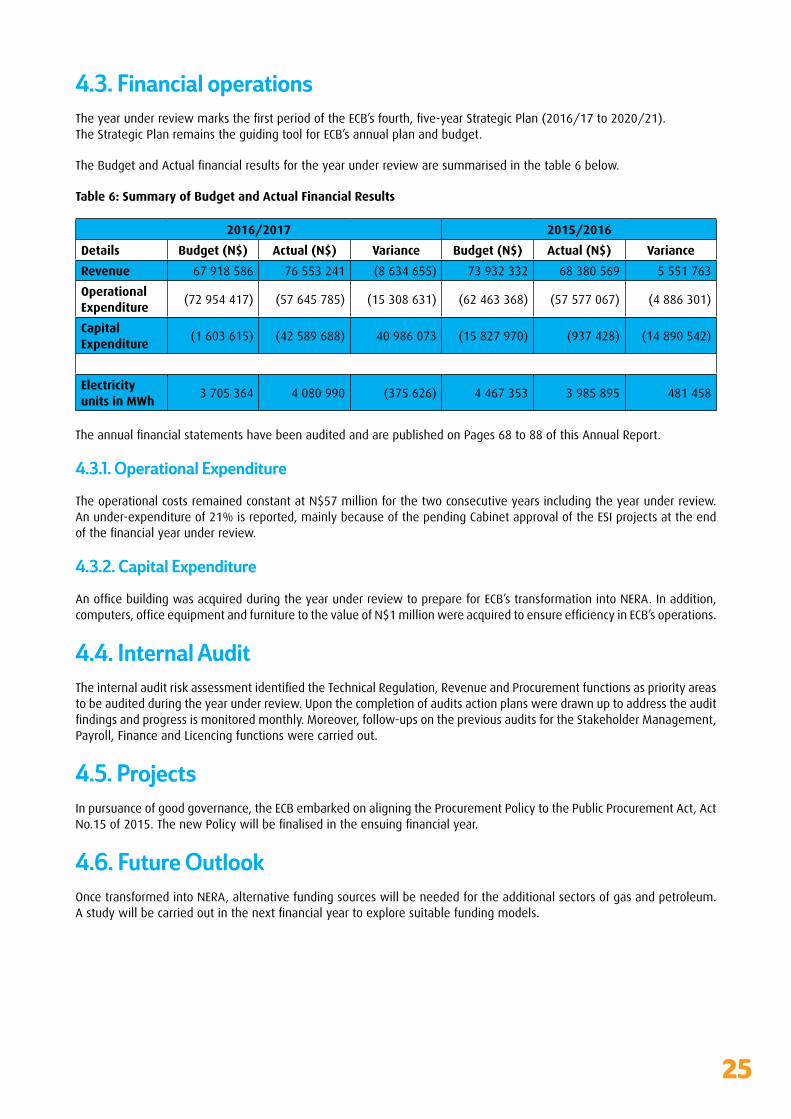
4.3. Financial operationsTheyearunderreviewmarksthefirstperiodoftheECB’sfourth,five-yearStrategicPlan(2016/17to2020/21).The Strategic Plan remains the guiding tool for ECB’s annual plan and budget.
TheBudgetandActualfinancialresultsfortheyearunderreviewaresummarisedinthetable6below.
Table 6: Summary of Budget and Actual Financial Results
2016/2017 2015/2016
Details Budget (N$) Actual (N$) Variance Budget (N$) Actual (N$) Variance
Revenue 67 918 586 76 553 241 (8 634 655) 73 932 332 68 380 569 5 551 763
Operational Expenditure
(72 954 417) (57 645 785) (15 308 631) (62 463 368) (57 577 067) (4 886 301)
Capital Expenditure
(1 603 615) (42 589 688) 40 986 073 (15 827 970) (937 428) (14 890 542)
Electricity units in MWh
3 705 364 4 080 990 (375 626) 4 467 353 3 985 895 481 458
TheannualfinancialstatementshavebeenauditedandarepublishedonPages68to88ofthisAnnualReport.
4.3.1. Operational Expenditure
The operational costs remained constant at N$57 million for the two consecutive years including the year under review. An under-expenditure of 21% is reported, mainly because of the pending Cabinet approval of the ESI projects at the end ofthefinancialyearunderreview.
4.3.2. Capital Expenditure
AnofficebuildingwasacquiredduringtheyearunderreviewtoprepareforECB’stransformationintoNERA.Inaddition,computers,officeequipmentandfurnituretothevalueofN$1millionwereacquiredtoensureefficiencyinECB’soperations.
4.4. Internal AuditTheinternalauditriskassessmentidentifiedtheTechnicalRegulation,RevenueandProcurementfunctionsaspriorityareastobeauditedduringtheyearunderreview.Uponthecompletionofauditsactionplansweredrawnuptoaddresstheauditfindingsandprogressismonitoredmonthly.Moreover,follow-upsonthepreviousauditsfortheStakeholderManagement,Payroll, Finance and Licencing functions were carried out.
4.5. ProjectsIn pursuance of good governance, the ECB embarked on aligning the Procurement Policy to the Public Procurement Act, Act No.15of2015.ThenewPolicywillbefinalisedintheensuingfinancialyear.
4.6. Future OutlookOnce transformed into NERA, alternative funding sources will be needed for the additional sectors of gas and petroleum. Astudywillbecarriedoutinthenextfinancialyeartoexploresuitablefundingmodels.

26
ResourcesFollowing the approval of the Performance
Management Policy, the new Performance
Management System (PMS) was rolled out
and implemented. The objective of the PMS is to
inculcate a performance driven culture in the ECB.
Human
5

27
5.1. Organisational Structure (Current status)The staff complement stands at 37. The ECB organisational structure comprises of the Officeof the Chief Executive wherein the corporate communication and legal / company secretariat services sections are embedded, and two departments, namely Regulation, and Finance and Administration. The Regulation Department is responsible for Regulation of the Electricity Supply Chain, namely the Generation, Transmission, Distribution and Supply, whereas the Finance and AdministrationDepartmentisresponsibleforthefinance,HR,administration,fleetmanagement,logistics, cleaning service, security, and maintenance of the ECB buildings.
During the period under review, the HR manual was reviewed and new key HR policies were developed and approved by the Board in September and November 2017 respectively. The objective of the policy development was to ensure that the organisation has sound HR systems in place, to ensure consistent decision making and compliance with the relevant labour legislations. The ultimate goal is to have sound employment relations, resulting in a great work environment.
5.2. Performance Management ImplementationFollowing the approval of the Performance Management Policy, the new Performance Management System (PMS) was rolled out and implemented. The objective of the PMS is to inculcate a performancedrivenculture intheECB.ThePMSisalignedtothefinancialyear.Thealignmentbetweenthefinancialcycleandtheperformancemanagementcycleprocessisimperative,asitdemonstratesthelinkbetweentheplannedperformanceobjectives/goals,financialresourcesand the measurable outcomes for the period under review - thus giving meaning to the intrinsic and extrinsic rewards paid to employees.
5.3. Organisational TransformationOwing to the imminent enactment of the National Energy Regulatory Authority bill (NERA Bill), the ECB is preparing for the transformation of the ECB from an electricity control board to the national energy regulatory authority.
28
Due to the anticipated transition to NERA, it was necessary for ECB to initiate an organisational change process. Thus, during the period under review the HR Department embarked upon the design / re-design of the organisational structure.
5.4. Future OutlookThe future outlook is categorised in the following components:
5.4.1. Organisational design
The expected change of organisational structure is due to the anticipated additional functions that will result in new roles. The staff complement is expected to increase two-fold. The said change is expected to affect the organisational design and span of control.
5.4.2. Capacity
The envisaged organisational change is expected to have a domino effect on both human and technological capacity. To address the pressure on the organisational capacity, the ECB therefore will embark upon a Business Process Review exercise. This exercise will analyse the current status of the business processes and develop and plan for new process that canimprovethebusinessprocessestoensureefficiencyandorganisationaleffectiveness.
To ensure a smooth transition, the ECB will embark upon the following projects:
• Conduct a COPS (Culture, Organisation, People, Systems) Analysis
• Develop a Transformation Blue Print
• Finalise the development and design or re-design of the organisational structure
• Develop a Change Management Strategy & Plan
• Develop and implement a Strategic Talent Management Plan
Based on the processes mentioned above, and in anticipation of such change we are developing a transformation blue print which will have organisational elements, systems, policy and procedures.
29
Corporate
Public awareness and sensitisation were
achieved through the use of mainstream print
and electronic media, routine audit inspections
as well as participation in local exhibitions such
as the Ongwediva Trade Fair and the
Windhoek Industrial and Agricultural Show.
Communications & Stakeholder Management
6

30
6.1. Corporate Communications
Corporate Communications and stakeholder engagements were more targeted during the period under review in line with the 2016 – 2021
Business and Strategic Plan. Emphasis was placed on communication with stakeholders through the Corporate Communications Strategy and
the Stakeholder Engagement Framework. The underlying principles of the two documents are transparency, clear, accurate and timely
communication, and meaningful participation of stakeholders in the regulation of the Namibian ESI. Such participation was evident during
the development of rules, codes and policies such as the National Energy Policy (NEP), Renewable Energy Policy (REP) and the Independent
Power Producers (IPP) Framework, as well as implementation of other ECB projects.
6.2. Stakeholder Management6.2.1. Public Awareness and Sensitisation
Public awareness and sensitisation were achieved through the use of mainstream print and electronic media, routine audit inspections as
well as participation in local exhibitions such as the Ongwediva Trade Fair and the Windhoek Industrial and Agricultural Show. Key messages
were communicated via the ECB website, media articles, informative advertorials,brochuresandleafletsaswellastheSPARKnewsletterand
Statistical Bulletin. The Bulletin, which is published annually, is based onactualdatacollectedbytheECBandvalidatedfromauditedfinancial
statements. The main data sources are the Regional Electricity Distributors (REDs), Local Authorities (LAs), NamPower, Namibia Statistics Agency,
Bank of Namibia as well as other external sources. The publication is compiled with government decision makers, REDs, LAs, investors,
scholars, researchers, planners and all other stakeholders in mind, to help them make informed decisions on the future of the Namibian ESI.
Feedback from these interventions were used to develop new messages for effective public awareness and sensitisation campaigns.
6.2.2. Corporate Social Responsibility
The ECB takes pride in its Corporate Social Responsibility contributions during the reporting period, which totalled over N$500 000. Of this
amount, more than N$360 000 was committed for bursaries while approximately N$230 000 benefitted individuals in need, welfare
organisations and tertiary institutions for research and benchmarking.
6.3 Future OutlookContinued efforts will be made for the structured and coherent
implementation of approved communications and stakeholder engagement instruments to maintain the desired rapport with
stakeholder groups, and in the process improved brand perception and understanding.

31
Technology
Going forward, the ECB’s IT section will endeavour
to increase the value derived from IT services
by the ECB by exploiting new technologies, and
reinforcing governance and risk management
practices.
Information
7
32
7.1. Major Developments in IT OperationsDuring the period under review the ECB’s IT security was strengthened with the implementation of a new Firewall that enhanced internal and external network access controls. In addition, a new server was purchased to improve application availability and responsiveness.
7.2. IT Projects7.2.1. Electronic Document and Records Management System (EDRMS)
The aim of this project is to establish a Filing Policy, develop a File Plan that meets the requirements of the National Archives of Namibia and to implement an Electronic Document and Records Management System (EDRMS).
A File Plan was developed and workshopped by ECB staff to solicit buy-in and ensure that it meets the needs of the variousECBfunctions.TheFilePlaniscurrentlybeingfine-
tuned before submission to the National Archives for approval.
7.2.2. ESI Investor Information Portal
The ESI Investor Portal will be a section of the ECB website that will serve as a repository for information required by potential
and current investors in the Namibian ESI. A list of documents and resources has been compiled and will be available on the website in thenextfinancialyear.
7.2.3. Customer Complaints Handling System (CCHS) Project
The outcome of this project is the creation of a web-based system that accepts external customer complaints as per the ECB’s Customer Complaints
policy. Furthermore, it will also assist ECB staff to track and resolve complaints received from the public regarding licensees. The system is currently being
piloted internally and new features are being added.
7.3. Future OutlookGoing forward, the ECB’s IT section will endeavour to increase the value derived
from IT services by the ECB by exploiting new technologies, and reinforcing governance and risk management practices.

33
Regulation
The Economic Regulation department continues
to monitor the impact of the tariff on the customer
and the economy at large and will strive always
to balance the interest of the supplier and the
customer.
Economic
8
34
8.1. TariffsTariff regulation is a core responsibility of the ECB. Tariffs are regulated in accordance with the White Paper on Energy Policy of1998,whichstatesthattariffsshouldbecostreflective,reflecttheLong-RunMarginalCost(LRMC)ofsupply,andbebased on sound economic principles.
The ECB applies a tariff methodology known as “cost plus” method in determining the electricity tariffs. This methodology implies that the revenue requirement (i.e. the cost) of a utility plus a regulated return (i.e. the Weighted Average Cost of Capital) are considered to determine the end-user tariff. The revenue requirement includes all allowable costs of the licensee to cover the cost of supply including the primary energy generation, energy imports, bulk purchases, operating and maintenance costs, customer service costs, overheads, asset-related costs and investment costs.
In reviewing and determining the electricity tariff levels, the ECB consults and takes into consideration the expectations of key stakeholders including the Government, private sector, licensees and consumers. The Regulator further considers many factors including National Developmental Plans, Government Policies and Cabinet directives such as the 2005 Cabinet decisionthatresolvedthatNamPowertariffsshouldreachandremaincostreflectivebytheyear2012.
Before approving a tariff, the Regulator assesses the likely impacts that tariffs may have on the end-consumers and the Namibian economy at large. Each licensee needs to have all its tariffs approved by the ECB Board.
8.1.1. Bulk Tariffs
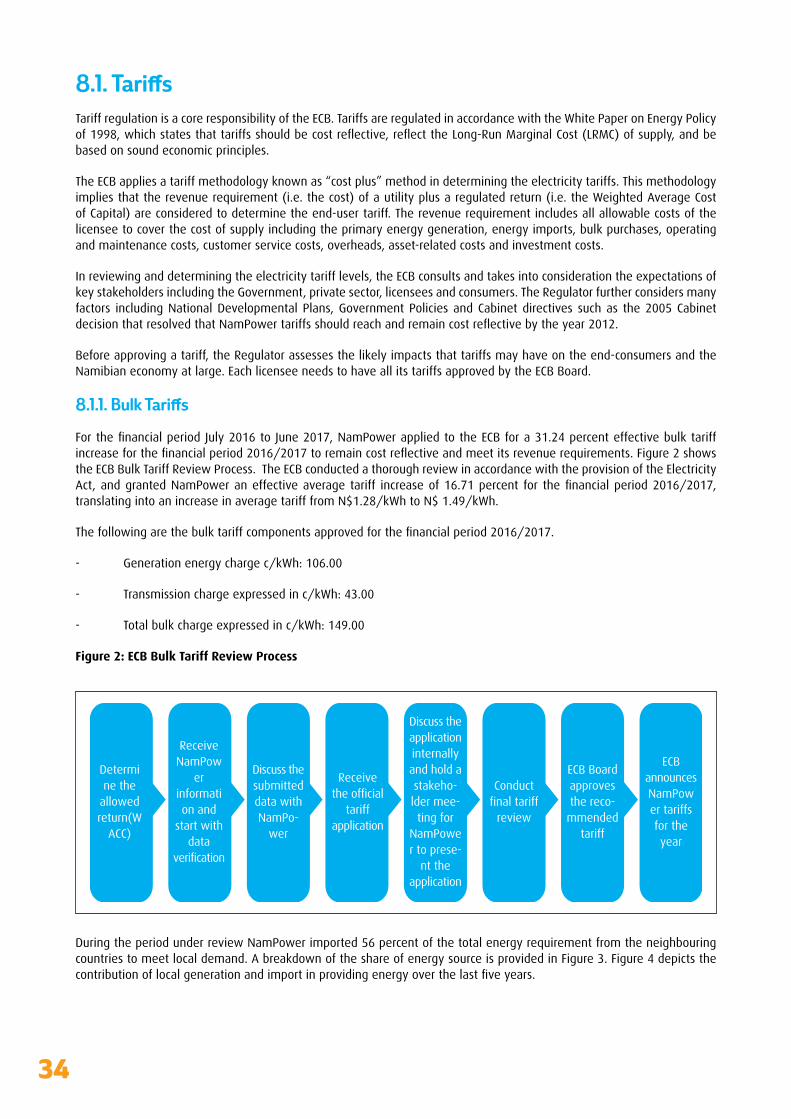
ForthefinancialperiodJuly2016to June2017,NamPowerappliedtotheECBfora31.24percenteffectivebulktariffincreaseforthefinancialperiod2016/2017toremaincostreflectiveandmeetitsrevenuerequirements.Figure2showsthe ECB Bulk Tariff Review Process. The ECB conducted a thorough review in accordance with the provision of the Electricity Act,andgrantedNamPoweraneffectiveaverage tariff increaseof16.71percent for thefinancialperiod2016/2017,translating into an increase in average tariff from N$1.28/kWh to N$ 1.49/kWh.
Thefollowingarethebulktariffcomponentsapprovedforthefinancialperiod2016/2017.
- Generation energy charge c/kWh: 106.00
- Transmission charge expressed in c/kWh: 43.00
- Total bulk charge expressed in c/kWh: 149.00
Figure 2: ECB Bulk Tariff Review Process
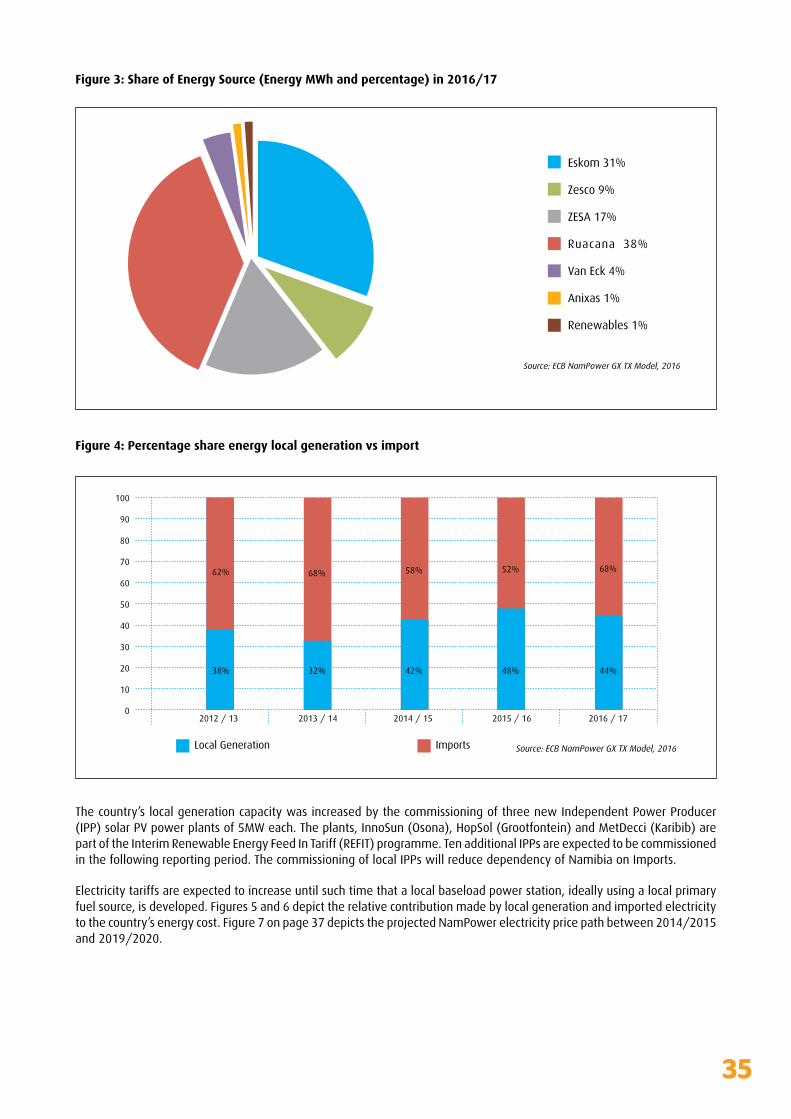
During the period under review NamPower imported 56 percent of the total energy requirement from the neighbouring countries to meet local demand. A breakdown of the share of energy source is provided in Figure 3. Figure 4 depicts the contributionoflocalgenerationandimportinprovidingenergyoverthelastfiveyears.
35
Figure 3: Share of Energy Source (Energy MWh and percentage) in 2016/17
Figure 4: Percentage share energy local generation vs import
The country’s local generation capacity was increased by the commissioning of three new Independent Power Producer (IPP) solar PV power plants of 5MW each. The plants, InnoSun (Osona), HopSol (Grootfontein) and MetDecci (Karibib) are part of the Interim Renewable Energy Feed In Tariff (REFIT) programme. Ten additional IPPs are expected to be commissioned in the following reporting period. The commissioning of local IPPs will reduce dependency of Namibia on Imports.
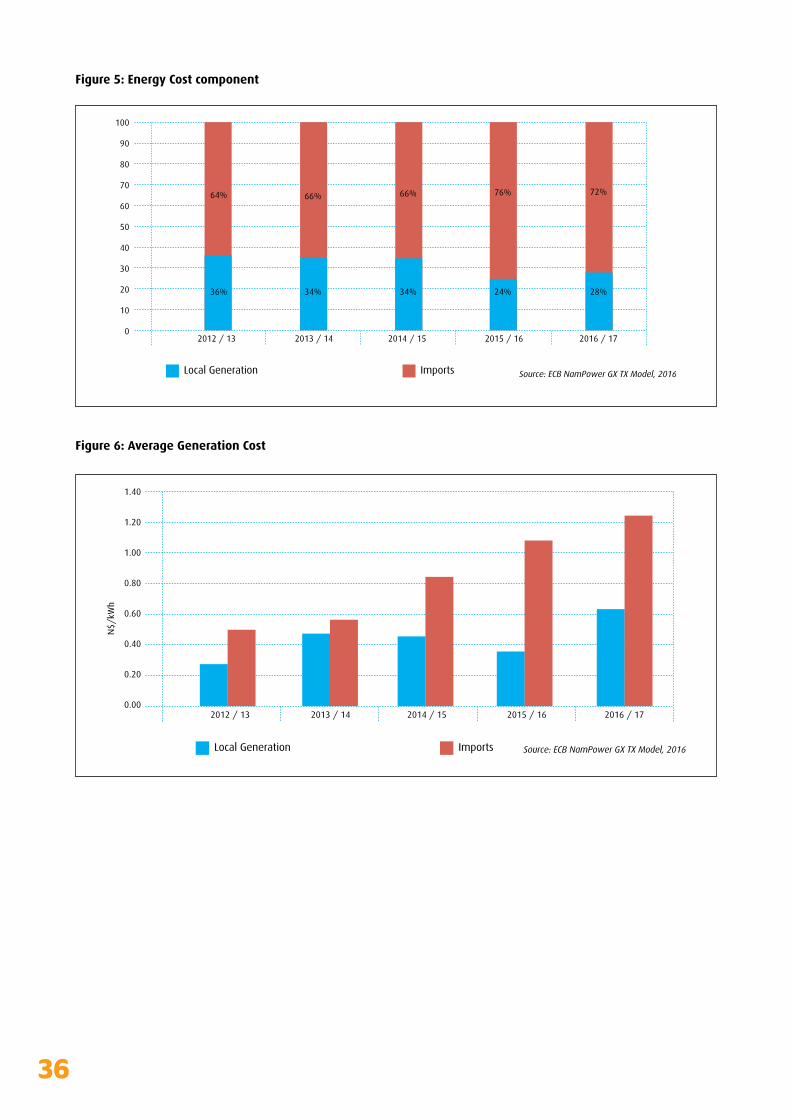
Electricity tariffs are expected to increase until such time that a local baseload power station, ideally using a local primary fuel source, is developed. Figures 5 and 6 depict the relative contribution made by local generation and imported electricity to the country’s energy cost. Figure 7 on page 37 depicts the projected NamPower electricity price path between 2014/2015 and 2019/2020.
36
Figure 5: Energy Cost component
Figure 6: Average Generation Cost
37
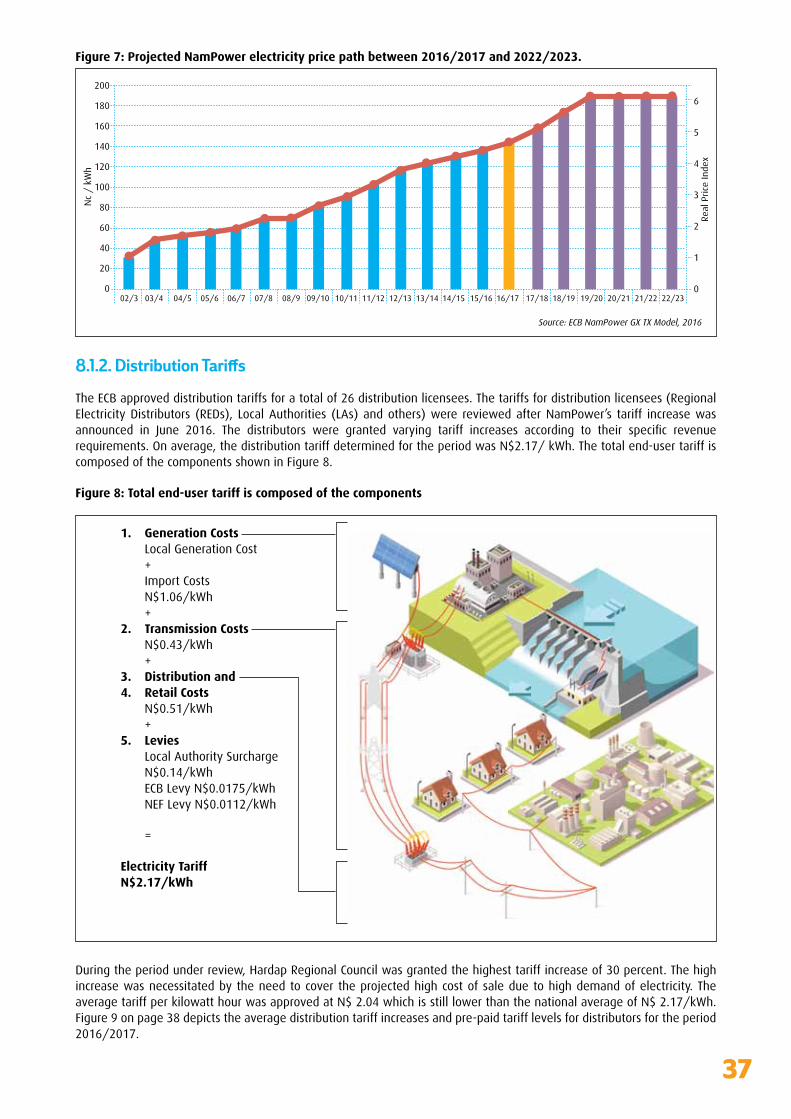
Figure 7: Projected NamPower electricity price path between 2016/2017 and 2022/2023.
8.1.2. Distribution Tariffs
The ECB approved distribution tariffs for a total of 26 distribution licensees. The tariffs for distribution licensees (Regional Electricity Distributors (REDs), Local Authorities (LAs) and others) were reviewed after NamPower’s tariff increase was announced in June 2016. The distributors were granted varying tariff increases according to their specific revenuerequirements. On average, the distribution tariff determined for the period was N$2.17/ kWh. The total end-user tariff is composed of the components shown in Figure 8.
Figure 8: Total end-user tariff is composed of the components
During the period under review, Hardap Regional Council was granted the highest tariff increase of 30 percent. The high increase was necessitated by the need to cover the projected high cost of sale due to high demand of electricity. The average tariff per kilowatt hour was approved at N$ 2.04 which is still lower than the national average of N$ 2.17/kWh. Figure 9 on page 38 depicts the average distribution tariff increases and pre-paid tariff levels for distributors for the period 2016/2017.
1. Generation Costs Local Generation Cost + Import Costs N$1.06/kWh +2. Transmission Costs N$0.43/kWh +3. Distribution and4. Retail Costs N$0.51/kWh +5. Levies Local Authority Surcharge N$0.14/kWh ECB Levy N$0.0175/kWh NEF Levy N$0.0112/kWh
=
Electricity TariffN$2.17/kWh

38
Figure 9: Average Distribution tariff increases and pre-paid tariff levels
8.1.3. IPP Tariffs
During the review period, the ECB Board approved tariffs for the following IPPs:
• Omburu 4.5MW
• OLC Arandis Solar Energy 3MW,
• GreeNam (Mariental 10MW) and (Kokerboom 10MW),
• Diaz Wind Power 44MW
8.1.4. Renewable Energy Feed-In Tariffs (REFIT)
During the period under review the applicable tariffs for the Interim REFIT programme are as per Figure 10 that illustrates the level of tariffs per technology.
Figure 10: REFIT Tariffs 2016/2017
39
8.2. Economic Regulation Projects
8.2.1. Transformation of the Single Buyer Market Model (SBMM)
In view of Namibia’s experiences in engaging with IPPs, the emergence of different market structures, funding requirements, significant cost reductions in photovoltaic and windtechnologies and the emergence of new storage technologies have prompted the ECB to re-examine the suitability of an exclusive Single Buyer Market Model for Namibia.
During the current period, the ECB commenced with the review of the current SBMM in light of the emerging market forces mentioned above. Based on the review, Namibia will either continue with the current model, albeit more vigorously enforced or possibly another model if deemed appropriate may be proposed. The project includes the development of market rules.
8.2.2. Net Metering Rules
The Rules are mainly intended to allow customers to reduce their electricity purchases from distribution networks through generating electricity for own consumption. Under the Net
Metering Rules, customers with small solar photovoltaic (solar PV) and micro-wind generators will be allowed to be connected to
the local distribution grids (less than 500kW). Net Metering Rules were promulgated in November 2016 and will become effective in
May 2017.
8.2.3. Review of NamPower Transmission Assets
The adopted cost-plus rate of return tariff methodology is based on the Weighted Average Cost of Capital (WACC) as the tariff methodology for theutilities.Thetransmissionundertaking(definedprincipallyasvoltage
levels of 66kV and above) is licensed to NamPower under the transmission license. The methodology allows a return on utility funded assets based on
the depreciated replacement value of transmission assets (substations and lines).ThetransmissionassetsarerevaluedbyNamPowerinfive-yearintervals
and the asset rate base is adjusted accordingly for the tariff by the Regulator.
The latest NamPower transmission asset revaluation was conducted in May 2011. NamPower conducted an asset revaluation for the period ended June 2015, for
inclusion in the tariff review 2017/2018 period.
The ECB reviewed NamPower’s revaluation report to ensure that the methodology has been applied correctly. The project has been completed.
8.2.4. Projects approved by Cabinet
The following projects were approved by Cabinet and implementation will commence in the following reporting period:
• National Electricity Support Tariff Mechanism (NEST)
• NationalSupportMechanismforImprovingElectrificationforNamibia(ESM)
• The NEST will be implemented on a pilot basis in Oshakati in 2017, followed by the planned national implementation in 2018.

40
8.3. Future Outlook
Namibia continues to import a large share of electricity needed, at times importing up to 70% of electricity requirements from the SADC region depending on the availability of water at the Ruacana Power Station. To address the situation several generation projects are planned in line with the National Integrated Resource Plan (NIRP).
During the period under review the power supply situation for Namibia and the Southern Africa region at large has been stable. This has been mainly attributed to new generation capacity added on the grid locally and regionally, as well as good rainfall received toward the end of 2016 for hydro power for Ruacana Power Station.
The Economic Regulation department continues to monitor the impact of the tariff on the customer and the economy at large and will always strive to balance the interests of the supplier and those of the customer. Electricity tariffs are expected toincreaseuntilsuchtimethatalocalbaseloadpowerstationisdeveloped,dependingonasufficientavailabilityofhydropower in the country complimented by thermal (coal) from the region. The ECB is optimistic that the tariff increases will be moderate in the coming years.

41
RegulationProgress was made in addressing critical issues
pertaining to network integrity, operational
capacity and safety concerns.
Technical
9

42
9.1. Quality of Supply Standards
During the period under review, the Quality of Supply Standards were submitted to the Legal Drafters for commencement of the promulgation process.
9.2. Quality of Service Standards
During the period under review, the Quality of Service Standards were submitted to the Legal Drafters for commencement of the promulgation process.
9.3. Demand Side Management (DSM) and Energy Efficiency (EE) Study Review and Update
The project was finalised and handed over to theNamibia Energy Institute (NEI) for complete takeover and implementationof specific recommendationsdocumented in
the project report, including establishment of a national DSM and EE Framework.
As an initial milestone, NEI presented an action plan which was accepted by the Minister for funding.
All matters pertaining to DSM and EE will fall under the custodianship of the NEI.
9.4. Technical Regulation Projects
9.4.1. Technical Compliance Audits
As per the audit plan, continued compliance monitoring and cooperation of keystakeholdersisexpectedtoenhanceimprovementofefficiency,safetyand
reliability of supply in the industry. Numerous technical compliance audits were conductedduringtheperiodunderreview.Asummaryofkeyfindingsforeach
audited entity is provided in the tracking sheet included in each report.
9.4.2. The National Integrated Resource Plan (NIRP)
Theprojectwasfinalisedincorporatingcommentsfromstakeholders.Boardapprovalwas secured and the presentation to the Minister of Mines and Energy was done in
December 2016. In March 2017, the Cabinet Committee on Trade and Economic Development (CCTED) endorsed the NIRP and made recommendations for submission to Cabinet for approval within a period of 4 months.
9.4.3. NamPower (NP) Transmission Losses
The outcome of the project on review of transmission losses recommended 8.62% as the value to be used in all NP tariff review processes. The 8.62% value was used for the 2016/2017 tariff review. It was concluded that for all future reviews, no value exceeding 8.62% will be accepted.
9.4.4. Distribution Losses
The project was discontinued before completion due to unforeseen challenges. It was concluded that the project would be resubmitted for tendering once all requisite data required for quantifying technical losses becomes available.

43
9.4.5. Contestable Customers Project
The economic impact analysis outcome recommended that it was not economically and financiallyjustifiablefortransmissioncustomerstomigratefromNamPowertotheREDs.TheECB informed all relevant stakeholders about the outcomes.
9.4.6. Technical Regulatory Tools
Information on the status of regulatory tools is summarised in table 1 under section 1.3 of the report. ECB engaged MME on the issue of delays experienced in the promulgation process. Going forward, it was agreed that the two parties would formulate concrete measures to fast track the promulgation process.
9.4.7. Wiremen’s Licensing Project
The Stakeholder Working Committee (SWC) finalised development of the draft Bill, draftRegulations and Guidelines. These draft documents will be submitted to the Ministry of Labour, Industrial Relations and Employment Creation (MLIREC) for promulgation before implementation, where necessary and applicable.
9.4.8. Renewable Energy Grid Integration Study Project
The ECB commissioned a project to assess the impact of grid integration of intermittent renewable energy. Following appointment of the consultant, an inception meeting was held in February 2017. The project is progressing well.
9.4.9. Electrical Installation Standards Project
The ECB advertised a tender to procure services of a consultant for developing Electrical InstallationStandards.Thetenderevaluationprocesswasfinalisedbythetenderevaluationcommittee which made recommendations for consideration by the Tender Committee and subsequently by the Board for approval before appointment of the Consultant.
9.5. Future OutlookProgress was made in addressing critical issues pertaining to network integrity, operational capacity and safety concerns. The commissioning of a network rehabilitation project in Maltahohe Village Council and the CENORED takeover of Okahandja Municipality Electricity Supply Business brought significant relief to concerned stakeholders. These developmentsbrought hope and anticipation to conclusively deal with the previously prevailing issues pertaining to safety, illegal connections and network maintenance.
44
Services
Regulatory Support Service will continue
to offer support to ESI stakeholders and
ensure that security of supply remains the
focus by ensuring that all interested investors
are afforded the same opportunity to enter the
sector.
Regulatory Support
10
45
10.1. Licensing Status and UpdateAs per the Electricity Act, Section 17, no person may establish or conduct any generation, trading, transmission, supply, distribution, import, or export of electricity without a licence (unless formally exempted under the Act).
During the year under review, the ECB issued a total of 3 new licences, of which 2 licences were issued for generation and 1 licence was issued for supply. The ECB amended 4 supply licences, transferred 1 licence, renewed 13 licences and 4 licenses are under review.
10.1.1. Licences issued
• AVENG Water Treatment (Pty) Ltd
• OLC Arandis Solar Energy (Pty) Ltd
• Mariental Bioenergy (Pty) Ltd
10.1.2. Licences amended
• NamEnergy Solar (Pty) Ltd,
• Xaris Energy (Pty) Ltd,
• Arandis Power (Pty) Ltd,
• Kokerboom Solar Power (Pty) Ltd,
10.1.3. Licences transferred
• Cenored-Okahandja Electricity Joint Venture
10.1.4. Licences renewed
• City of Windhoek
• Luderitz Town Council
• Keetmanshoop Municipality
• Gobabis Municipality
• Mariental Municipality
• Karasburg Town Council
• Okahandja Municipality
• Rehoboth Town Council
• Namibia Airport Company
• NamPower Distribution
• Namdeb Diamond Corporation
• Ongopolo Mine (Otjihase)
• RoshSkor Township
46
10.1.5. Licences under review
• Alten Solar Power (Hardap) Holdings (Pty) Ltd
• Maerua Mall (Pty) Ltd
• Phase Two Properties (Pty) Ltd
• Grove Mall (Pty) Ltd
10.2. Independent Power Producers
Introduction of IPPs in the Namibian Electricity Supply Industry (ESI) is crucial for adding to the generation capacity of Namibia in a sustainable manner. The ESI in Namibia needs to keep pace with the changing energy requirements and regional and global developments in the power sector including the global nature of the IPP industry.
Namibia has a well-developed ESI and the reforms introduced by the Government of Namibia, including the establishment of REDs, places the Namibian ESI at par with some of the best-run power systems internationally. NamPower, as the Government-owned utility, continues to be the dominant player in Namibia’s generation sector. Currently, NamPower acts as a single buyer with the responsibility for both indigenous power generation as well as power trading with the neighbouring countries. As a single buyer, NamPower is currently responsible for negotiating all Power Purchase Agreements (PPAs) and Transmission Connection Agreements (TCAs) with any power generators in the country. The review of the current SBMM is eminent to attract more IPPs into the Namibian ESI.
Current developments in the ESI see the role of IPPs increasing. NamPower recently signed Power Purchase Agreements (PPAs) with a number of individual companies that plan to develop some 70 MW of renewable power under the interim REFIT programme. Other additional IPP generation projects are also in the pipeline.
10.2.1. Interim REFIT Programme
The REFIT programme is designed to accelerate investment in renewable energy technologies by offering long-term contracts to renewable energy Independent Power Producers (IPPs).
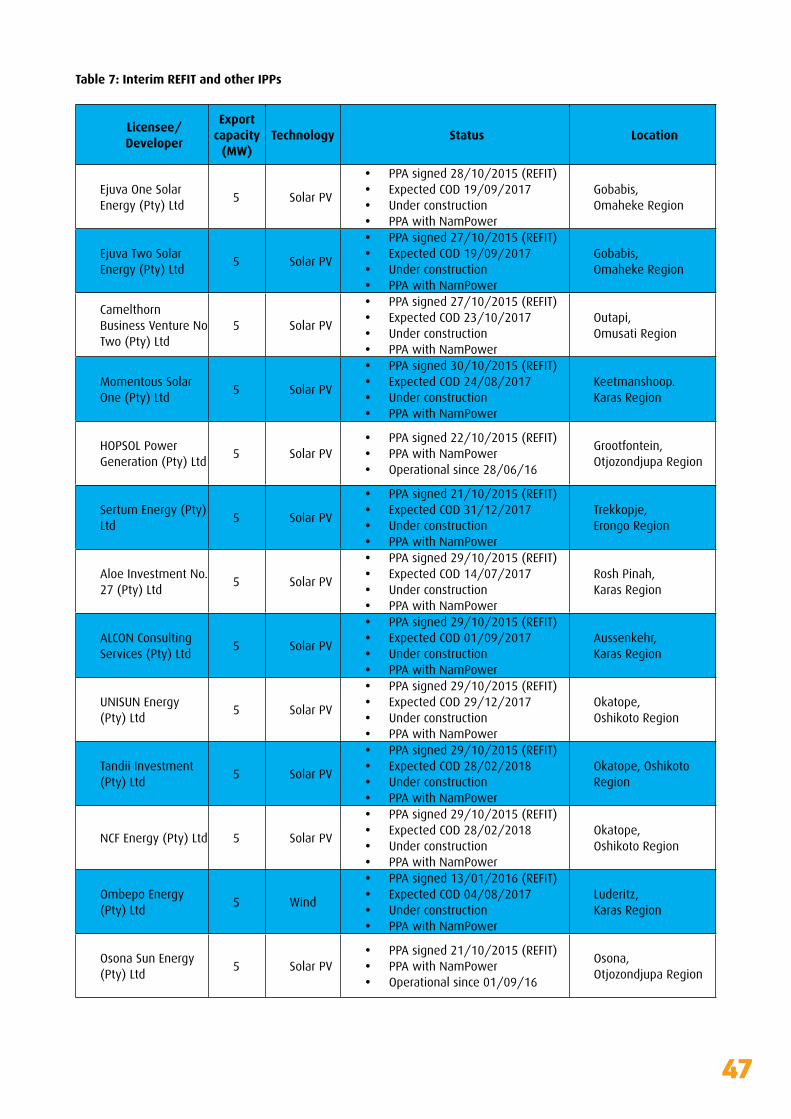
An installed generation capacity of 70 MW is expected to be added through the interim REFIT programme which translates to 14 IPPs (included in Table 7 below) each generating up to 5 MW. The 14 IPP projects will invest a combined total amount of approximately N$1.6 billion of foreign direct investment into the electricity sector and ultimately into the Namibian Economy.
10.2.2. Unsolicited IPPs
Several IPPs made unsolicited proposals to the ECB since 2007.
Since the country was in dire need of electricity generation capacity during the time, a number of licences were issued to prospective investors.
Many of the licenced companies could not bring their projects to fruition, and as a result the licences lapsed.
The companies that managed to meet the ECB’s requirements are provided on Table 7 below.
10.2.3. Solicited IPPs
NamPower as well as some of the REDs acquired the services of the IPPs through a solicited (tendering) process.
This solicitation process was mainly done through requests for proposals (RFP), or requests for quotations (RFQ), and requests for sealed bids, which were made public through advertising.
The companies that were awarded projects through the solicited means approached the ECB and were licenced as per the Electricity Act.
47
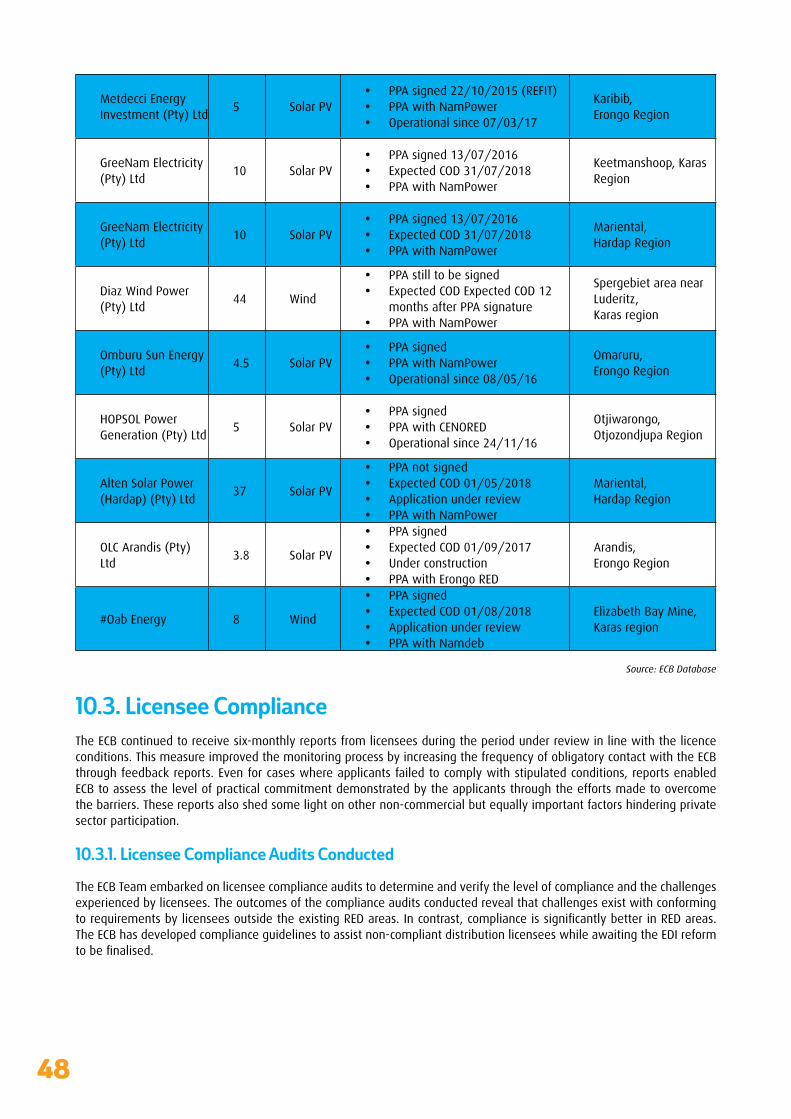
Table 7: Interim REFIT and other IPPs
Licensee/Developer
Export capacity
(MW)Technology Status Location
Ejuva One Solar Energy (Pty) Ltd
5 Solar PV
• PPA signed 28/10/2015 (REFIT)• Expected COD 19/09/2017• Underconstruction• PPA with NamPower
Gobabis,Omaheke Region
Ejuva Two Solar Energy (Pty) Ltd
5 Solar PV
• PPA signed 27/10/2015 (REFIT)• Expected COD 19/09/2017• Underconstruction• PPA with NamPower
Gobabis,Omaheke Region
Camelthorn Business Venture No Two (Pty) Ltd
5 Solar PV
• PPA signed 27/10/2015 (REFIT)• Expected COD 23/10/2017• Underconstruction• PPA with NamPower
Outapi,Omusati Region
Momentous Solar One (Pty) Ltd
5 Solar PV
• PPA signed 30/10/2015 (REFIT)• Expected COD 24/08/2017• Underconstruction• PPA with NamPower
Keetmanshoop.Karas Region
HOPSOL Power Generation (Pty) Ltd
5 Solar PV• PPA signed 22/10/2015 (REFIT)• PPA with NamPower• Operational since 28/06/16
Grootfontein,Otjozondjupa Region
Sertum Energy (Pty) Ltd
5 Solar PV
• PPA signed 21/10/2015 (REFIT)• Expected COD 31/12/2017• Underconstruction• PPA with NamPower
Trekkopje,Erongo Region
Aloe Investment No. 27 (Pty) Ltd
5 Solar PV
• PPA signed 29/10/2015 (REFIT)• Expected COD 14/07/2017• Underconstruction• PPA with NamPower
Rosh Pinah,Karas Region
ALCON Consulting Services (Pty) Ltd
5 Solar PV
• PPA signed 29/10/2015 (REFIT)• Expected COD 01/09/2017• Underconstruction• PPA with NamPower
Aussenkehr,Karas Region
UNISUNEnergy(Pty) Ltd
5 Solar PV
• PPA signed 29/10/2015 (REFIT)• Expected COD 29/12/2017• Underconstruction• PPA with NamPower
Okatope,Oshikoto Region
Tandii Investment (Pty) Ltd
5 Solar PV
• PPA signed 29/10/2015 (REFIT)• Expected COD 28/02/2018• Underconstruction• PPA with NamPower
Okatope, Oshikoto Region
NCF Energy (Pty) Ltd 5 Solar PV
• PPA signed 29/10/2015 (REFIT)• Expected COD 28/02/2018• Underconstruction• PPA with NamPower
Okatope,Oshikoto Region
Ombepo Energy (Pty) Ltd
5 Wind
• PPA signed 13/01/2016 (REFIT)• Expected COD 04/08/2017• Underconstruction• PPA with NamPower
Luderitz,Karas Region
Osona Sun Energy (Pty) Ltd
5 Solar PV• PPA signed 21/10/2015 (REFIT)• PPA with NamPower• Operational since 01/09/16
Osona,Otjozondjupa Region
48
Metdecci Energy Investment (Pty) Ltd
5 Solar PV• PPA signed 22/10/2015 (REFIT)• PPA with NamPower• Operational since 07/03/17
Karibib,Erongo Region
GreeNam Electricity (Pty) Ltd
10 Solar PV• PPA signed 13/07/2016• Expected COD 31/07/2018• PPA with NamPower
Keetmanshoop, Karas Region
GreeNam Electricity (Pty) Ltd
10 Solar PV• PPA signed 13/07/2016• Expected COD 31/07/2018• PPA with NamPower
Mariental,Hardap Region
Diaz Wind Power (Pty) Ltd
44 Wind
• PPA still to be signed • Expected COD Expected COD 12
months after PPA signature• PPA with NamPower
Spergebiet area near Luderitz,Karas region
Omburu Sun Energy (Pty) Ltd
4.5 Solar PV• PPA signed • PPA with NamPower• Operational since 08/05/16
Omaruru,Erongo Region
HOPSOL Power Generation (Pty) Ltd
5 Solar PV• PPA signed • PPA with CENORED• Operational since 24/11/16
Otjiwarongo, Otjozondjupa Region
Alten Solar Power (Hardap) (Pty) Ltd
37 Solar PV
• PPA not signed • Expected COD 01/05/2018• Application under review• PPA with NamPower
Mariental, Hardap Region
OLC Arandis (Pty) Ltd
3.8 Solar PV
• PPA signed • Expected COD 01/09/2017• Underconstruction• PPA with Erongo RED
Arandis,Erongo Region
#Oab Energy 8 Wind
• PPA signed • Expected COD 01/08/2018• Application under review• PPA with Namdeb
Elizabeth Bay Mine,Karas region
Source: ECB Database
10.3. Licensee Compliance
The ECB continued to receive six-monthly reports from licensees during the period under review in line with the licence conditions. This measure improved the monitoring process by increasing the frequency of obligatory contact with the ECB through feedback reports. Even for cases where applicants failed to comply with stipulated conditions, reports enabled ECB to assess the level of practical commitment demonstrated by the applicants through the efforts made to overcome the barriers. These reports also shed some light on other non-commercial but equally important factors hindering private sector participation.
10.3.1. Licensee Compliance Audits Conducted
The ECB Team embarked on licensee compliance audits to determine and verify the level of compliance and the challenges experienced by licensees. The outcomes of the compliance audits conducted reveal that challenges exist with conforming torequirementsbylicenseesoutsidetheexistingREDareas.Incontrast,complianceissignificantlybetterinREDareas.The ECB has developed compliance guidelines to assist non-compliant distribution licensees while awaiting the EDI reform tobefinalised.
49
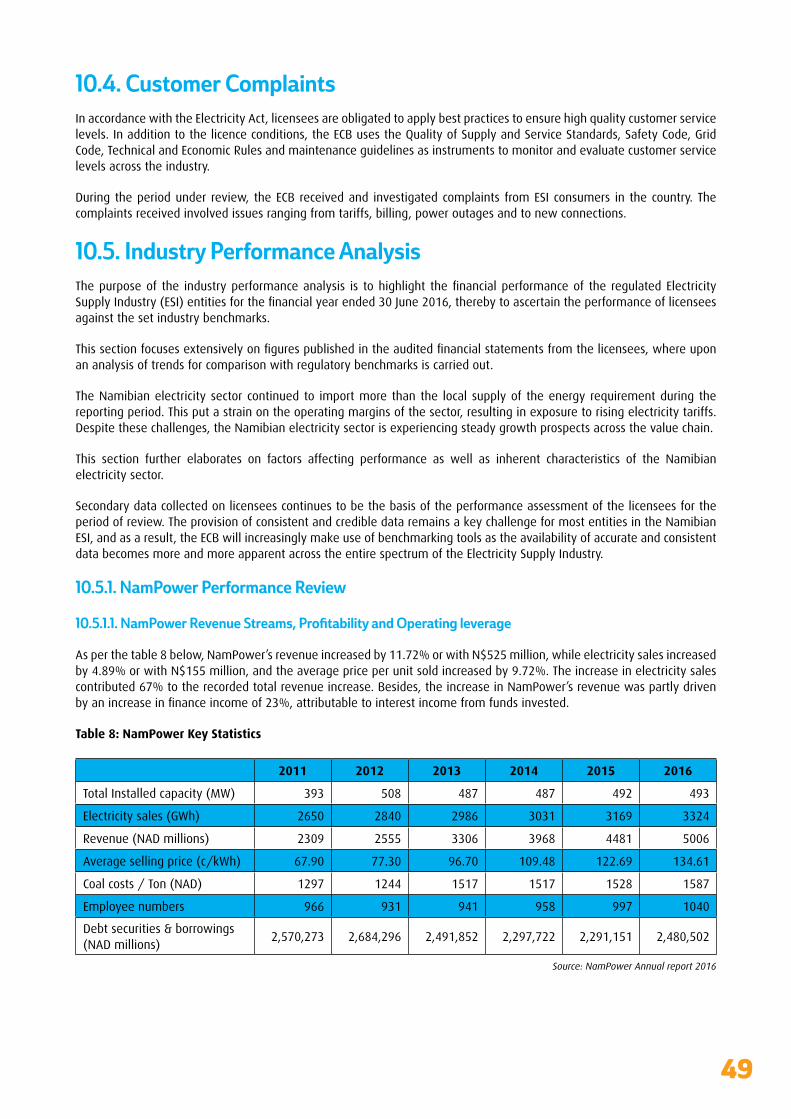
10.4. Customer Complaints
In accordance with the Electricity Act, licensees are obligated to apply best practices to ensure high quality customer service levels. In addition to the licence conditions, the ECB uses the Quality of Supply and Service Standards, Safety Code, Grid Code, Technical and Economic Rules and maintenance guidelines as instruments to monitor and evaluate customer service levels across the industry.
During the period under review, the ECB received and investigated complaints from ESI consumers in the country. The complaints received involved issues ranging from tariffs, billing, power outages and to new connections.
10.5. Industry Performance Analysis
Thepurposeof the industryperformanceanalysis is tohighlight thefinancialperformanceof the regulatedElectricitySupplyIndustry(ESI)entitiesforthefinancialyearended30June2016,therebytoascertaintheperformanceoflicenseesagainst the set industry benchmarks.
Thissectionfocusesextensivelyonfigurespublishedintheauditedfinancialstatementsfromthelicensees,whereuponan analysis of trends for comparison with regulatory benchmarks is carried out.
The Namibian electricity sector continued to import more than the local supply of the energy requirement during the reporting period. This put a strain on the operating margins of the sector, resulting in exposure to rising electricity tariffs. Despite these challenges, the Namibian electricity sector is experiencing steady growth prospects across the value chain.
This section further elaborates on factors affecting performance as well as inherent characteristics of the Namibian electricity sector.
Secondary data collected on licensees continues to be the basis of the performance assessment of the licensees for the period of review. The provision of consistent and credible data remains a key challenge for most entities in the Namibian ESI, and as a result, the ECB will increasingly make use of benchmarking tools as the availability of accurate and consistent data becomes more and more apparent across the entire spectrum of the Electricity Supply Industry.
10.5.1. NamPower Performance Review
10.5.1.1. NamPower Revenue Streams, Profitability and Operating leverage
As per the table 8 below, NamPower’s revenue increased by 11.72% or with N$525 million, while electricity sales increased by 4.89% or with N$155 million, and the average price per unit sold increased by 9.72%. The increase in electricity sales contributed 67% to the recorded total revenue increase. Besides, the increase in NamPower’s revenue was partly driven byanincreaseinfinanceincomeof23%,attributabletointerestincomefromfundsinvested.
Table 8: NamPower Key Statistics
2011 2012 2013 2014 2015 2016
Total Installed capacity (MW) 393 508 487 487 492 493
Electricity sales (GWh) 2650 2840 2986 3031 3169 3324
Revenue (NAD millions) 2309 2555 3306 3968 4481 5006
Average selling price (c/kWh) 67.90 77.30 96.70 109.48 122.69 134.61
Coal costs / Ton (NAD) 1297 1244 1517 1517 1528 1587
Employee numbers 966 931 941 958 997 1040
Debt securities & borrowings (NAD millions)
2,570,273 2,684,296 2,491,852 2,297,722 2,291,151 2,480,502
Source: NamPower Annual report 2016

50
Asperfigure11below,NamPower’soperatingprofitshavebeenundertremendouspressurefromoperating&administrationexpensesforpreviousperiods.Thistrendcontinuedfortheperiodunderreviewwithoperatingprofitsdecreasingby15%whileoperatingexpensesincreasedby32%.ThefollowingfiguredepictstheabovepositioninNamPower’soperationalperformance.
Figure 11: NamPower Operating Leverage
Asperfigure12below,operatingexpensesincreasedbyahighermarginthantheincreaseinoperatingincomeastheygrewby32%orN$1.19billionduringthe2015/2016financialperiod,whileoperatingincomeincreasedbyonly12%orN$525.4 million. The gap between operating income and operating expenses is the primary reason for the company’s operating losses.
Figure 12: Operating Leverage
10.5.1.2. NamPower Returns
Figure 13 on page 51 depicts NamPower’s ability to match the Return on Assets (ROA) benchmark set below a range of 1% minimumanduptoamaximumof7%.Asevidentinthefigure,NamPowerhasmaintaineditsperformancewithinthisrange,exceptforthecurrentperiodunderreview,whereprofitabilitywasnegativelyaffectedbyapoorROAperformanceof -1.8%.
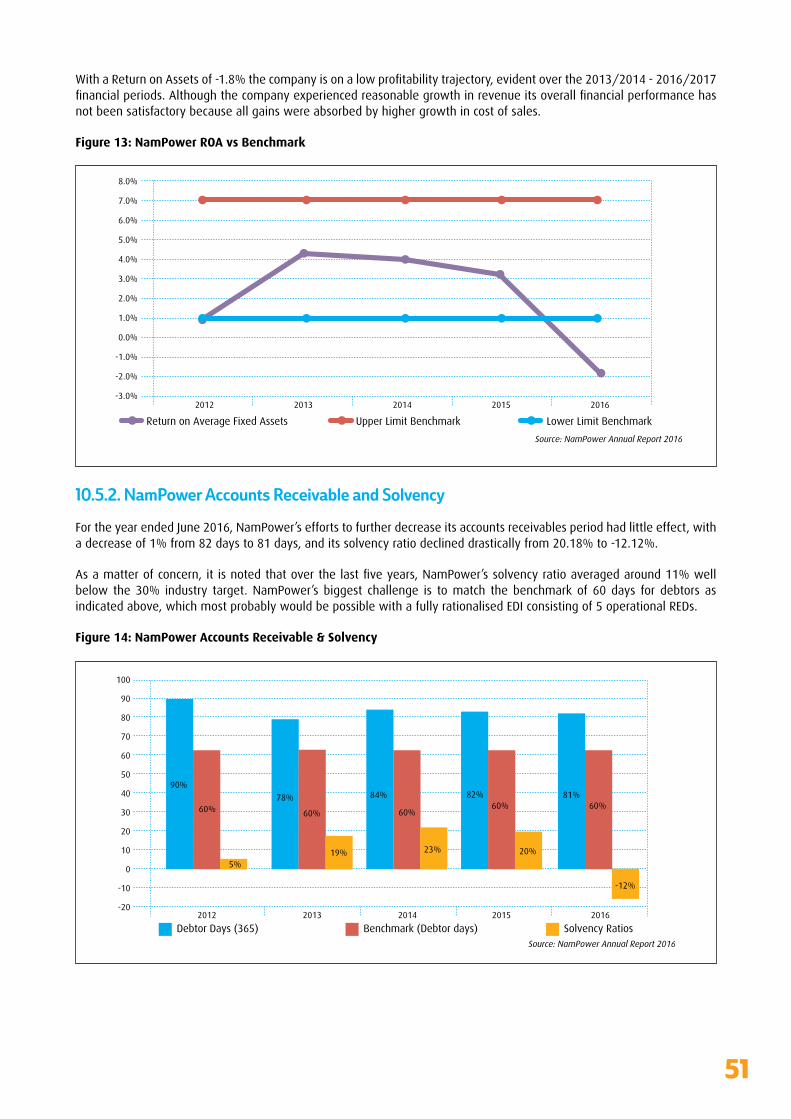
51
WithaReturnonAssetsof-1.8%thecompanyisonalowprofitabilitytrajectory,evidentoverthe2013/2014-2016/2017financialperiods.Althoughthecompanyexperiencedreasonablegrowthinrevenueitsoverallfinancialperformancehasnot been satisfactory because all gains were absorbed by higher growth in cost of sales.
Figure 13: NamPower ROA vs Benchmark
10.5.2. NamPower Accounts Receivable and Solvency
For the year ended June 2016, NamPower’s efforts to further decrease its accounts receivables period had little effect, with a decrease of 1% from 82 days to 81 days, and its solvency ratio declined drastically from 20.18% to -12.12%.
Asamatterofconcern,itisnotedthatoverthelastfiveyears,NamPower’ssolvencyratioaveragedaround11%wellbelow the 30% industry target. NamPower’s biggest challenge is to match the benchmark of 60 days for debtors as indicated above, which most probably would be possible with a fully rationalised EDI consisting of 5 operational REDs.
Figure 14: NamPower Accounts Receivable & Solvency
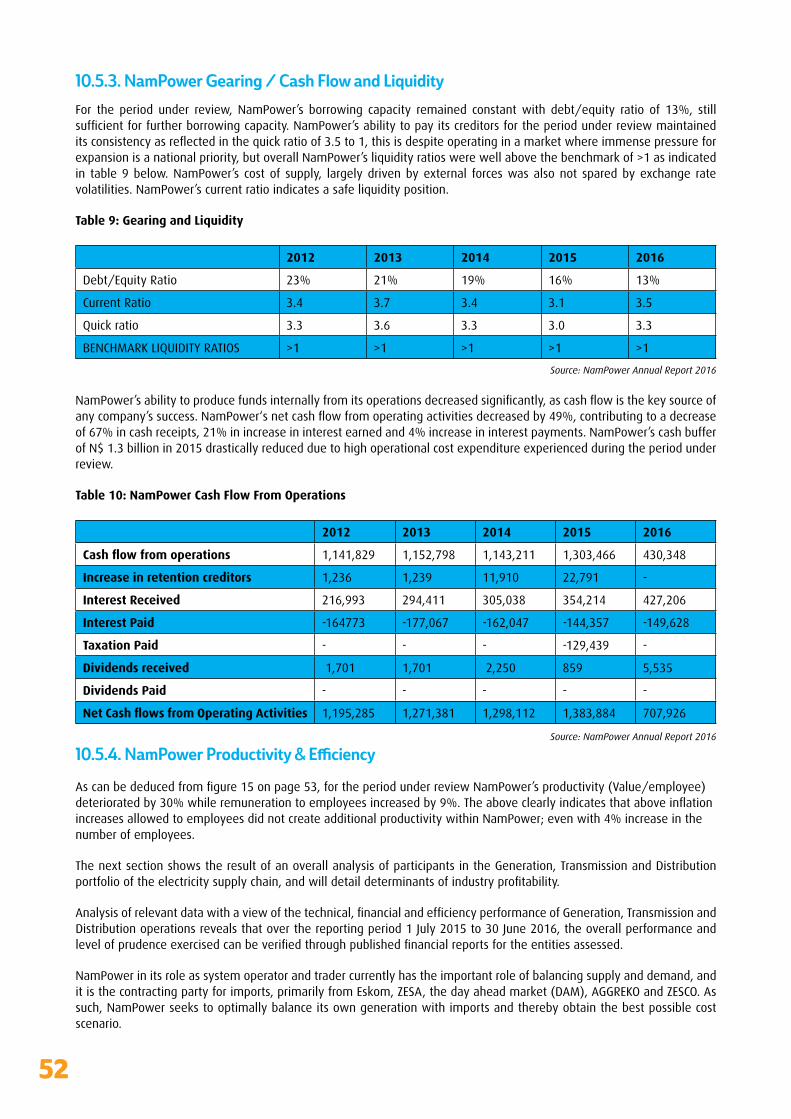
52
10.5.3. NamPower Gearing / Cash Flow and LiquidityFor the period under review, NamPower’s borrowing capacity remained constant with debt/equity ratio of 13%, still sufficientforfurtherborrowingcapacity.NamPower’sabilitytopayitscreditorsfortheperiodunderreviewmaintaineditsconsistencyasreflectedinthequickratioof3.5to1,thisisdespiteoperatinginamarketwhereimmensepressureforexpansion is a national priority, but overall NamPower’s liquidity ratios were well above the benchmark of >1 as indicated in table 9 below. NamPower’s cost of supply, largely driven by external forces was also not spared by exchange rate volatilities. NamPower’s current ratio indicates a safe liquidity position.
Table 9: Gearing and Liquidity
2012 2013 2014 2015 2016
Debt/Equity Ratio 23% 21% 19% 16% 13%
Current Ratio 3.4 3.7 3.4 3.1 3.5
Quick ratio 3.3 3.6 3.3 3.0 3.3
BENCHMARKLIQUIDITYRATIOS >1 >1 >1 >1 >1
Source: NamPower Annual Report 2016
NamPower’sabilitytoproducefundsinternallyfromitsoperationsdecreasedsignificantly,ascashflowisthekeysourceofanycompany’ssuccess.NamPower‘snetcashflowfromoperatingactivitiesdecreasedby49%,contributingtoadecreaseof 67% in cash receipts, 21% in increase in interest earned and 4% increase in interest payments. NamPower’s cash buffer of N$ 1.3 billion in 2015 drastically reduced due to high operational cost expenditure experienced during the period under review.
Table 10: NamPower Cash Flow From Operations
2012 2013 2014 2015 2016
Cash flow from operations 1,141,829 1,152,798 1,143,211 1,303,466 430,348
Increase in retention creditors 1,236 1,239 11,910 22,791 -
Interest Received 216,993 294,411 305,038 354,214 427,206
Interest Paid -164773 -177,067 -162,047 -144,357 -149,628
Taxation Paid - - - -129,439 -
Dividends received 1,701 1,701 2,250 859 5,535
Dividends Paid - - - - -
Net Cash flows from Operating Activities 1,195,285 1,271,381 1,298,112 1,383,884 707,926 Source: NamPower Annual Report 2016
10.5.4. NamPower Productivity & Efficiency
Ascanbededucedfromfigure15onpage53,fortheperiodunderreviewNamPower’sproductivity(Value/employee)deterioratedby30%whileremunerationtoemployeesincreasedby9%.TheaboveclearlyindicatesthataboveinflationincreasesallowedtoemployeesdidnotcreateadditionalproductivitywithinNamPower;evenwith4%increaseinthenumber of employees.
The next section shows the result of an overall analysis of participants in the Generation, Transmission and Distribution portfoliooftheelectricitysupplychain,andwilldetaildeterminantsofindustryprofitability.
Analysisofrelevantdatawithaviewofthetechnical,financialandefficiencyperformanceofGeneration,TransmissionandDistribution operations reveals that over the reporting period 1 July 2015 to 30 June 2016, the overall performance and levelofprudenceexercisedcanbeverifiedthroughpublishedfinancialreportsfortheentitiesassessed.
NamPower in its role as system operator and trader currently has the important role of balancing supply and demand, and it is the contracting party for imports, primarily from Eskom, ZESA, the day ahead market (DAM), AGGREKO and ZESCO. As such, NamPower seeks to optimally balance its own generation with imports and thereby obtain the best possible cost scenario.
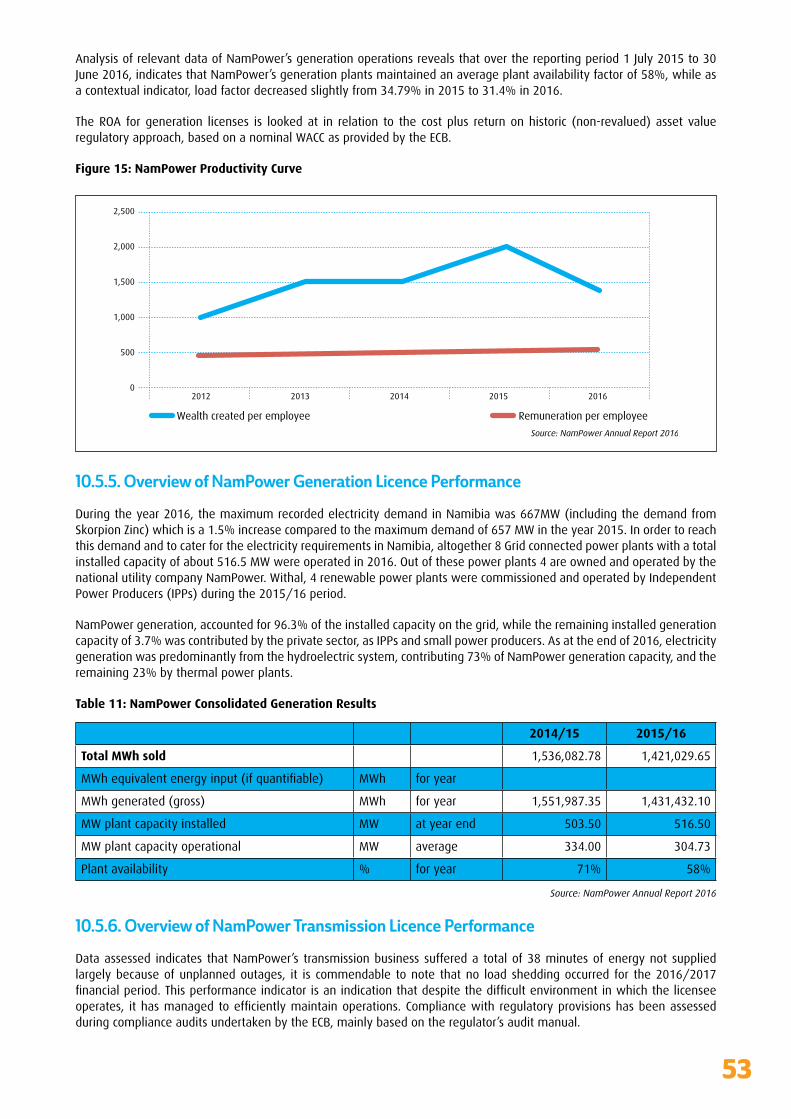
53
Analysis of relevant data of NamPower’s generation operations reveals that over the reporting period 1 July 2015 to 30 June 2016, indicates that NamPower’s generation plants maintained an average plant availability factor of 58%, while as a contextual indicator, load factor decreased slightly from 34.79% in 2015 to 31.4% in 2016.
The ROA for generation licenses is looked at in relation to the cost plus return on historic (non-revalued) asset value regulatory approach, based on a nominal WACC as provided by the ECB.
Figure 15: NamPower Productivity Curve
10.5.5. Overview of NamPower Generation Licence Performance
During the year 2016, the maximum recorded electricity demand in Namibia was 667MW (including the demand from Skorpion Zinc) which is a 1.5% increase compared to the maximum demand of 657 MW in the year 2015. In order to reach this demand and to cater for the electricity requirements in Namibia, altogether 8 Grid connected power plants with a total installed capacity of about 516.5 MW were operated in 2016. Out of these power plants 4 are owned and operated by the national utility company NamPower. Withal, 4 renewable power plants were commissioned and operated by Independent Power Producers (IPPs) during the 2015/16 period.
NamPower generation, accounted for 96.3% of the installed capacity on the grid, while the remaining installed generation capacity of 3.7% was contributed by the private sector, as IPPs and small power producers. As at the end of 2016, electricity generation was predominantly from the hydroelectric system, contributing 73% of NamPower generation capacity, and the remaining 23% by thermal power plants.
Table 11: NamPower Consolidated Generation Results
2014/15 2015/16
Total MWh sold 1,536,082.78 1,421,029.65
MWhequivalentenergyinput(ifquantifiable) MWh for year
MWh generated (gross) MWh for year 1,551,987.35 1,431,432.10
MW plant capacity installed MW at year end 503.50 516.50
MW plant capacity operational MW average 334.00 304.73
Plant availability % for year 71% 58%
Source: NamPower Annual Report 2016
10.5.6. Overview of NamPower Transmission Licence Performance
Data assessed indicates that NamPower’s transmission business suffered a total of 38 minutes of energy not supplied largely because of unplanned outages, it is commendable to note that no load shedding occurred for the 2016/2017 financialperiod.Thisperformanceindicatorisanindicationthatdespitethedifficultenvironmentinwhichthelicenseeoperates, ithasmanagedtoefficientlymaintainoperations.Compliancewith regulatoryprovisionshasbeenassessedduring compliance audits undertaken by the ECB, mainly based on the regulator’s audit manual.
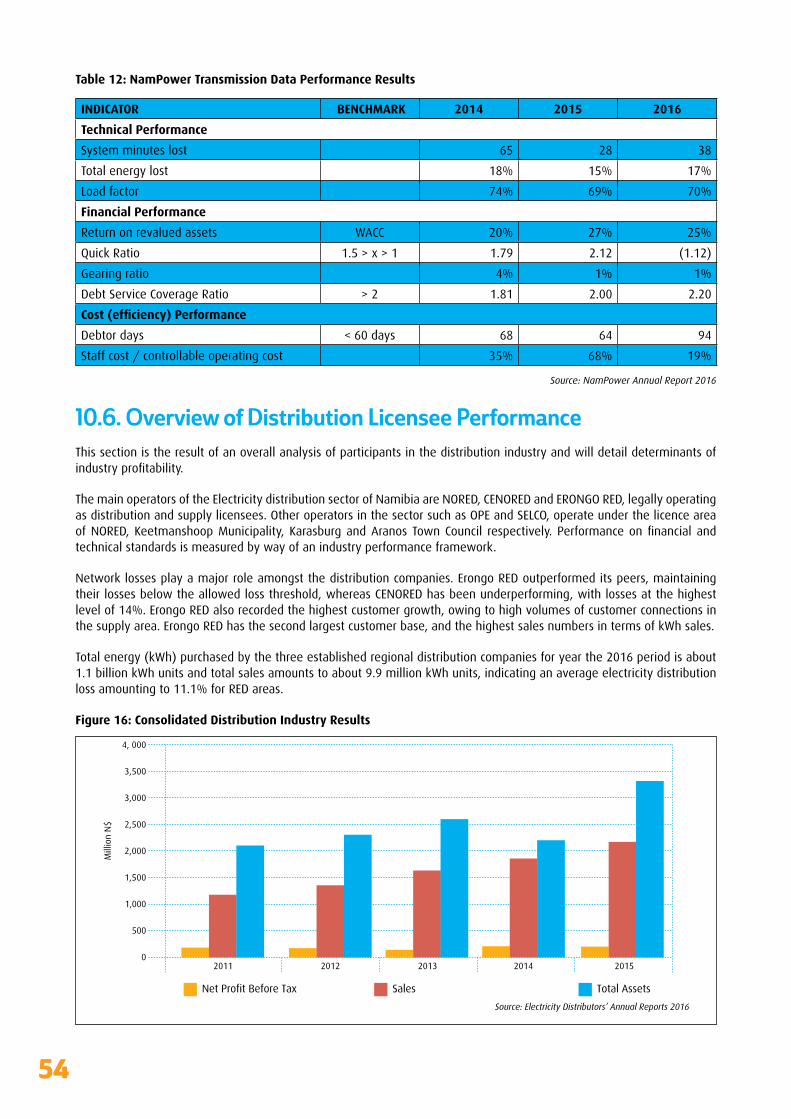
54
Table 12: NamPower Transmission Data Performance Results
INDICATOR BENCHMARK 2014 2015 2016
Technical Performance
System minutes lost 65 28 38
Total energy lost 18% 15% 17%
Load factor 74% 69% 70%
Financial Performance
Return on revalued assets WACC 20% 27% 25%
Quick Ratio 1.5 > x > 1 1.79 2.12 (1.12)
Gearing ratio 4% 1% 1%
Debt Service Coverage Ratio > 2 1.81 2.00 2.20
Cost (efficiency) Performance
Debtor days < 60 days 68 64 94
Staff cost / controllable operating cost 35% 68% 19%
Source: NamPower Annual Report 2016
10.6. Overview of Distribution Licensee Performance
This section is the result of an overall analysis of participants in the distribution industry and will detail determinants of industryprofitability.
The main operators of the Electricity distribution sector of Namibia are NORED, CENORED and ERONGO RED, legally operating as distribution and supply licensees. Other operators in the sector such as OPE and SELCO, operate under the licence area ofNORED,KeetmanshoopMunicipality, KarasburgandAranos TownCouncil respectively. Performanceonfinancial andtechnical standards is measured by way of an industry performance framework.
Network losses play a major role amongst the distribution companies. Erongo RED outperformed its peers, maintaining their losses below the allowed loss threshold, whereas CENORED has been underperforming, with losses at the highest level of 14%. Erongo RED also recorded the highest customer growth, owing to high volumes of customer connections in the supply area. Erongo RED has the second largest customer base, and the highest sales numbers in terms of kWh sales.
Total energy (kWh) purchased by the three established regional distribution companies for year the 2016 period is about 1.1 billion kWh units and total sales amounts to about 9.9 million kWh units, indicating an average electricity distribution loss amounting to 11.1% for RED areas.
Figure 16: Consolidated Distribution Industry Results
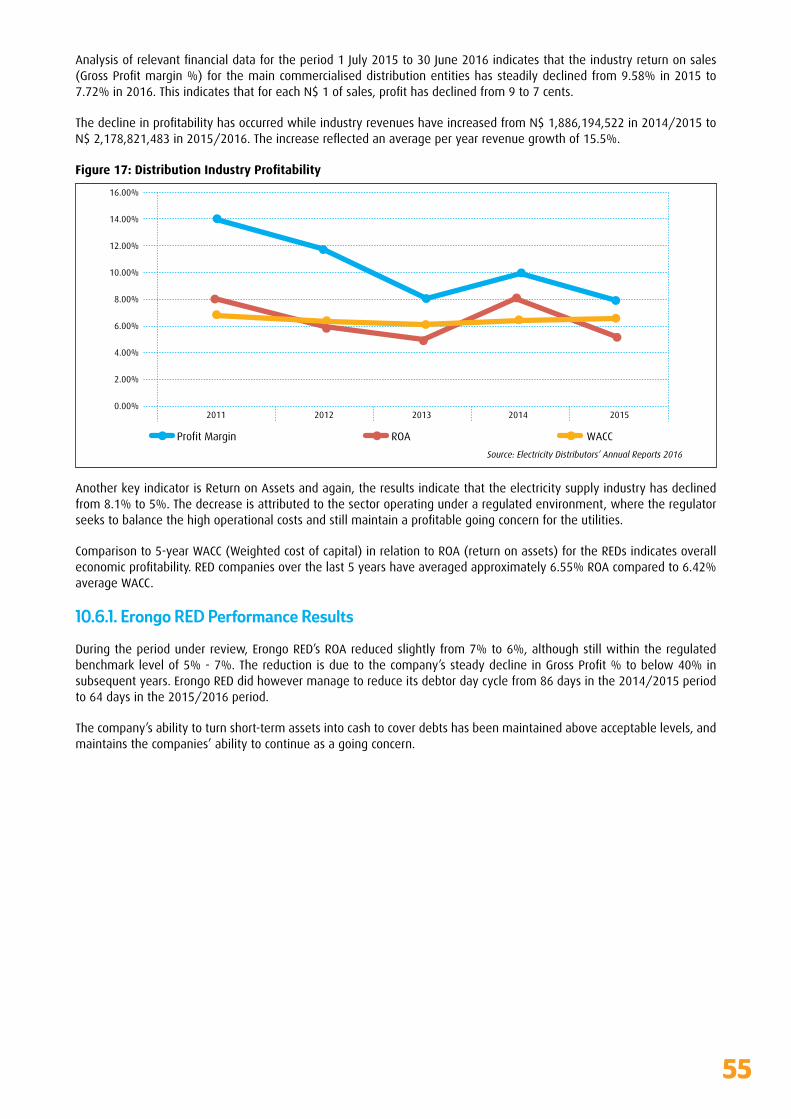
55
Analysisofrelevantfinancialdatafortheperiod1July2015to30June2016indicatesthattheindustryreturnonsales(GrossProfitmargin%)forthemaincommercialiseddistributionentitieshassteadilydeclinedfrom9.58%in2015to7.72%in2016.ThisindicatesthatforeachN$1ofsales,profithasdeclinedfrom9to7cents.
ThedeclineinprofitabilityhasoccurredwhileindustryrevenueshaveincreasedfromN$1,886,194,522in2014/2015toN$2,178,821,483in2015/2016.Theincreasereflectedanaverageperyearrevenuegrowthof15.5%.
Figure 17: Distribution Industry Profitability
Another key indicator is Return on Assets and again, the results indicate that the electricity supply industry has declined from 8.1% to 5%. The decrease is attributed to the sector operating under a regulated environment, where the regulator seekstobalancethehighoperationalcostsandstillmaintainaprofitablegoingconcernfortheutilities.
Comparison to 5-year WACC (Weighted cost of capital) in relation to ROA (return on assets) for the REDs indicates overall economicprofitability.REDcompaniesoverthelast5yearshaveaveragedapproximately6.55%ROAcomparedto6.42%average WACC.
10.6.1. Erongo RED Performance Results
During the period under review, Erongo RED’s ROA reduced slightly from 7% to 6%, although still within the regulated benchmarklevelof5%-7%.Thereductionisduetothecompany’ssteadydeclineinGrossProfit%tobelow40%insubsequent years. Erongo RED did however manage to reduce its debtor day cycle from 86 days in the 2014/2015 period to 64 days in the 2015/2016 period.
The company’s ability to turn short-term assets into cash to cover debts has been maintained above acceptable levels, and maintains the companies’ ability to continue as a going concern.
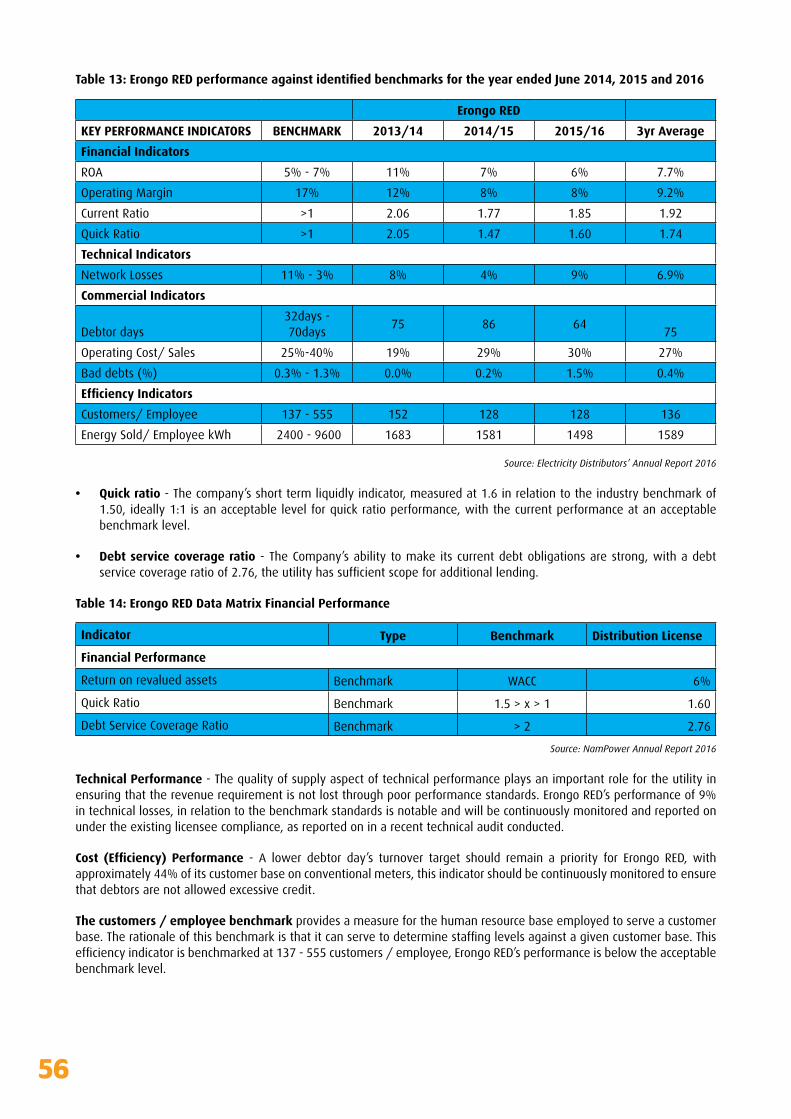
56
Table 13: Erongo RED performance against identified benchmarks for the year ended June 2014, 2015 and 2016
Erongo RED
KEY PERFORMANCE INDICATORS BENCHMARK 2013/14 2014/15 2015/16 3yr Average
Financial Indicators
ROA 5% - 7% 11% 7% 6% 7.7%
Operating Margin 17% 12% 8% 8% 9.2%
Current Ratio >1 2.06 1.77 1.85 1.92
Quick Ratio >1 2.05 1.47 1.60 1.74
Technical Indicators
Network Losses 11% - 3% 8% 4% 9% 6.9%
Commercial Indicators
Debtor days32days - 70days
75 86 6475
Operating Cost/ Sales 25%-40% 19% 29% 30% 27%
Bad debts (%) 0.3% - 1.3% 0.0% 0.2% 1.5% 0.4%
Efficiency Indicators
Customers/ Employee 137 - 555 152 128 128 136
Energy Sold/ Employee kWh 2400 - 9600 1683 1581 1498 1589
Source: Electricity Distributors’ Annual Report 2016
• Quick ratio - The company’s short term liquidly indicator, measured at 1.6 in relation to the industry benchmark of 1.50, ideally 1:1 is an acceptable level for quick ratio performance, with the current performance at an acceptable benchmark level.
• Debt service coverage ratio - The Company’s ability to make its current debt obligations are strong, with a debt servicecoverageratioof2.76,theutilityhassufficientscopeforadditionallending.
Table 14: Erongo RED Data Matrix Financial Performance
Indicator Type Benchmark Distribution License
Financial Performance
Return on revalued assets Benchmark WACC 6%
Quick Ratio Benchmark 1.5 > x > 1 1.60
Debt Service Coverage Ratio Benchmark > 2 2.76
Source: NamPower Annual Report 2016
Technical Performance - The quality of supply aspect of technical performance plays an important role for the utility in ensuring that the revenue requirement is not lost through poor performance standards. Erongo RED’s performance of 9% in technical losses, in relation to the benchmark standards is notable and will be continuously monitored and reported on under the existing licensee compliance, as reported on in a recent technical audit conducted.
Cost (Efficiency) Performance - A lower debtor day’s turnover target should remain a priority for Erongo RED, with approximately 44% of its customer base on conventional meters, this indicator should be continuously monitored to ensure that debtors are not allowed excessive credit.
The customers / employee benchmark provides a measure for the human resource base employed to serve a customer base.Therationaleofthisbenchmarkisthatitcanservetodeterminestaffinglevelsagainstagivencustomerbase.Thisefficiencyindicatorisbenchmarkedat137-555customers/employee,ErongoRED’sperformanceisbelowtheacceptablebenchmark level.

57
Table 15: ERONGO RED Data Matrix Cost (efficiency) Performance
Indicator Type Benchmark Distribution License
Debtor days excluding PPM sales Benchmark <60 days 64
Customer / Employee Benchmark individual 128
Annual MWH sold / Customer Context 12
Source: NamPower Annual Report 2016
Compliance with Regulatory Provisions - Erongo RED has managed to sustainably maintain a stable license compliance position over the operational period. Compliance with license conditions is critical to monitor since this has legal implications.
• Regulatory provisions are designed to protect licensees and customers, thereby compliance with these is aimed at protectingtheirinterests;
• Compliance with regulatory provisions has been assessed during audits undertaken by the ECB, mainly based on the regulator’s audit manual.
10.6.2. NORED Performance Results
During the period under review, NORED’s ROA position remained unchanged, still below the regulated benchmark level of 5% - 7%, but not a serious concern to the ECB. NORED’s performance levels have been consistent over the years, mirroring acceptable benchmark levels, which maintain the companies’ ability to continue as a going concern.
The customers / employee benchmark provides a measure for the human resource base employed to serve a customer base.Therationaleofthisbenchmarkisthatitcanservetodeterminestaffinglevelsagainstagivencustomerbase.Thisefficiencyindicatorisbenchmarkedat137-555customers/employee,NORED’sperformanceisatanacceptablelevel,and it records the highest number of customers/employee amongst its peers, which is also consistent with NORED having the largest customer base amongst its peers.
Table 16: NORED performance against identified benchmarks for the year ended June 2014, 2015 and 2016
NORED
KEY PERFORMANCE INDICATORS BENCHMARK 2012/13 2013/14 2014/15 2015/16 3yr Average
Financial Indicators
ROA 5% - 7% 3% 5% 4% 4% 4.3%
Operating Margin 17% 8% 9% 8% 8% 8.3%
Current Ratio >1 1.39 1.30 1.06 1.06 1.14
Quick Ratio >1 1.29 1.26 1.02 1.02 1.10
Technical Indicators
Network Losses 11% - 3% 8% 6% 9% 9% 8.2%
Commercial Indicators
Debtor days 32days - 70days 65 59 64 64 62
Operating Cost/ Sales 25%-40% 35% 29% 27% 27% 28%
Bad debts (%) 0.3% - 1.3% 0.0% 0.0% 0.0% 0.0% 0.0%
Efficiency Indicators
Customers/ Employee 137 - 555 371 316 429 432 392
Energy Sold/ Employee kWh 2400 - 9600 1721 1856 1991 1991 1946
Source: Electricity Distributors’ Annual Report 2016

58
10.6.3. CENORED Performance Results
Table 17: CENORED performance against identified benchmarks for the year ended June 2014, 2015 and 2016
CENORED
KEY PERFORMANCE INDICATORS BENCHMARK 2012/13 2013/14 2014/15 2015/16 3yr Average
Financial Indicators
ROA 5% - 7% 3% 5% 4% 6.0% 5.1%
Operating Margin 17% 5% 8% 5% 9% 7.6%
Current Ratio >1 1.56 1.82 2.64 2.19 2.21
Quick Ratio >1 1.35 1.65 2.26 1.87 1.93
Technical Indicators
Network Losses 11% - 3% 15% 18% 15% 14% 15.6%
Commercial Indicators
Debtor days 32days - 70days 47 44 28 33 35
Operating Cost/ Sales 25%-40% 26% 34% 32% 32% 33%
Bad debts (%) 0.3% - 1.3% 0.2% 0.1% -0.5% 0.2% -0.1%
Efficiency Indicators
Customers/ Employee 137 - 555 155 153 192 200 182
Energy Sold/ Employee kWh 2400 - 9600 964 979 1129 1251 1119
Source: Electricity Distributors’ Annual Report 2016
Financial Performance - During the period under review, CENORED’s ROA increased slightly from 4% to 6%, although stillwithintheregulatedbenchmarklevelof1%-7%.Thecompany’slevelofefficiencyincreasedasoperatingmarginincreased from 5% to 9% for the period under review. Network losses in the CENORED distribution area remain the highest amongst its peers, however it has improved over the last three years. CENORED’s performance in this area will be continuously monitored and reported on under the existing quality of supply standards, as reported on in a recent technical audit conducted.
• Quick ratio - The companies’ short term liquidly indicator, measured at 1.87 in relation to the industry benchmark of 1.50, indicative of its continued ability to use its quick assets (cash and cash equivalents, marketable securities and accounts receivable) to quickly convert into cash, to cover current liabilities. Ideally 1:1 is an acceptable level for quick ratio performance, with the current performance well above this level.
• Debt service coverage ratio - The companies’ ability to honour its current debt obligations are strong, with a debt servicecoverageratioof3.21,theUtilityiswithinacceptableperformancelevels.
Table 18: CENORED Data Matrix Financial Performance
Table XXX: CENORED Data Matrix Financial PerformanceIndicator Type Benchmark Distribution License
Financial Performance
Return on revalued assets Benchmark WACC 6%
Quick Ratio Benchmark 1.5 > x > 1 1.60
Gearing Ratio Context 22%
Debt Service Coverage Ratio Benchmark > 2 3.21
Source: Electricity Distributors’ Annual Report 2016
Technical Performance - The quality of supply aspect of technical performance plays an important role for the utility in ensuring that the revenue requirement is not lost through poor performance standards.
Table 19: CENORED Data Matrix Technical Performance
Indicator Type Distribution License
Total Energy Lost Track 14%
Load Factor Context 42.5%
Source: ECB Data Matrix 2016
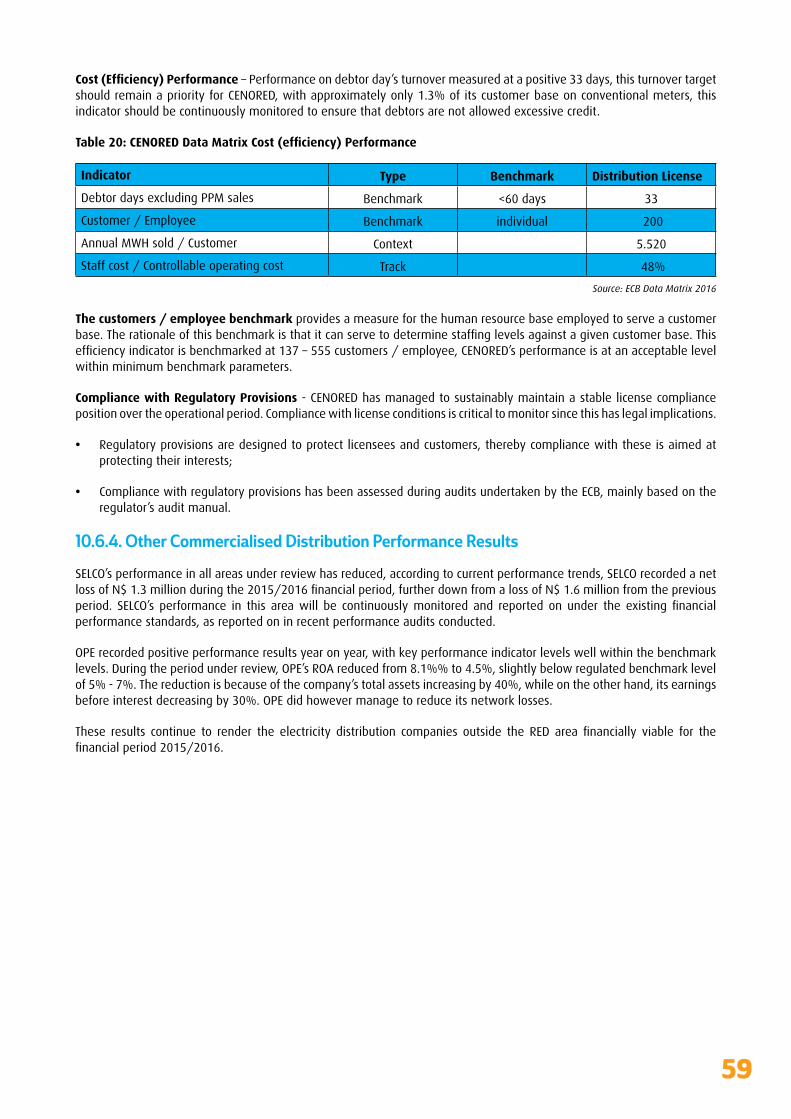
59
Cost (Efficiency) Performance – Performance on debtor day’s turnover measured at a positive 33 days, this turnover target should remain a priority for CENORED, with approximately only 1.3% of its customer base on conventional meters, this indicator should be continuously monitored to ensure that debtors are not allowed excessive credit.
Table 20: CENORED Data Matrix Cost (efficiency) Performance
Indicator Type Benchmark Distribution License
Debtor days excluding PPM sales Benchmark <60 days 33
Customer / Employee Benchmark individual 200
Annual MWH sold / Customer Context 5.520
Staff cost / Controllable operating cost Track 48%
Source: ECB Data Matrix 2016
The customers / employee benchmark provides a measure for the human resource base employed to serve a customer base.Therationaleofthisbenchmarkisthatitcanservetodeterminestaffinglevelsagainstagivencustomerbase.Thisefficiencyindicatorisbenchmarkedat137–555customers/employee,CENORED’sperformanceisatanacceptablelevelwithin minimum benchmark parameters.
Compliance with Regulatory Provisions - CENORED has managed to sustainably maintain a stable license compliance position over the operational period. Compliance with license conditions is critical to monitor since this has legal implications.
• Regulatory provisions are designed to protect licensees and customers, thereby compliance with these is aimed at protectingtheirinterests;
• Compliance with regulatory provisions has been assessed during audits undertaken by the ECB, mainly based on the regulator’s audit manual.
10.6.4. Other Commercialised Distribution Performance Results
SELCO’s performance in all areas under review has reduced, according to current performance trends, SELCO recorded a net lossofN$1.3millionduringthe2015/2016financialperiod,furtherdownfromalossofN$1.6millionfromthepreviousperiod. SELCO’s performance in this areawill be continuouslymonitored and reported on under the existing financialperformance standards, as reported on in recent performance audits conducted.
OPE recorded positive performance results year on year, with key performance indicator levels well within the benchmark levels. During the period under review, OPE’s ROA reduced from 8.1%% to 4.5%, slightly below regulated benchmark level of 5% - 7%. The reduction is because of the company’s total assets increasing by 40%, while on the other hand, its earnings before interest decreasing by 30%. OPE did however manage to reduce its network losses.
These results continue to render the electricity distribution companies outside the RED area financially viable for thefinancialperiod2015/2016.
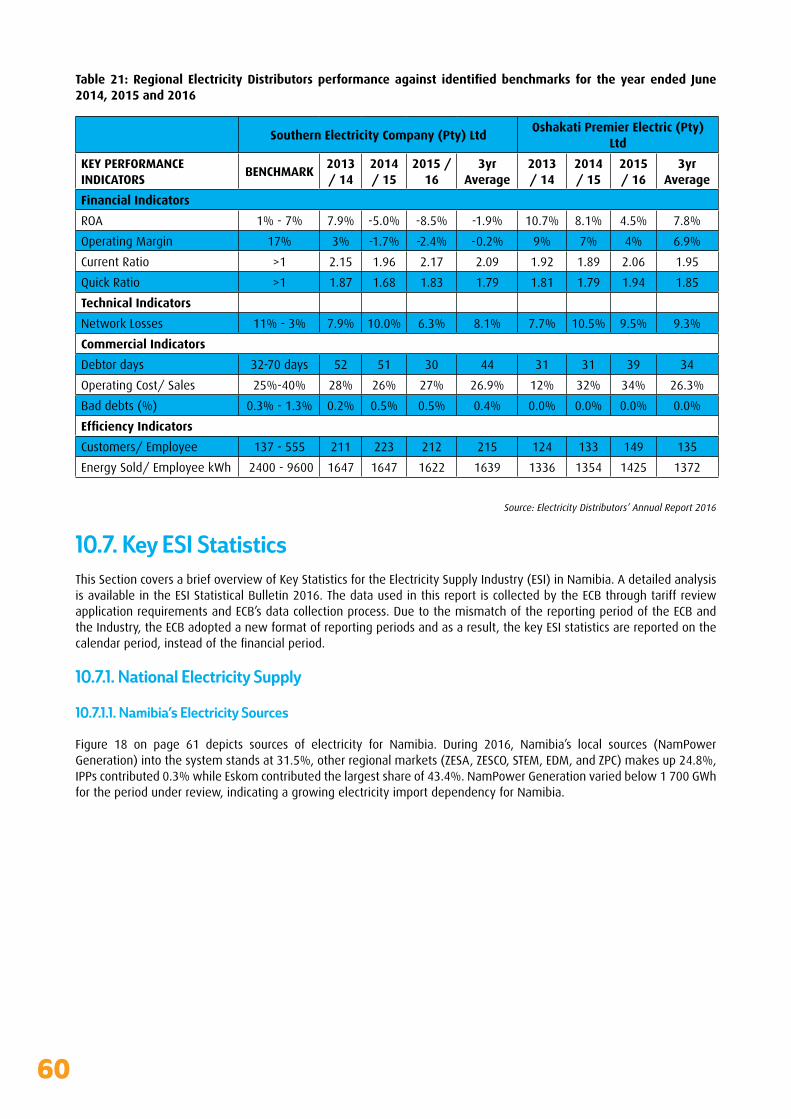
60
Table 21: Regional Electricity Distributors performance against identified benchmarks for the year ended June 2014, 2015 and 2016
Southern Electricity Company (Pty) Ltd
Oshakati Premier Electric (Pty) Ltd
KEY PERFORMANCE INDICATORS
BENCHMARK2013 / 14
2014 / 15
2015 / 16
3yr Average
2013 / 14
2014 / 15
2015 / 16
3yr Average
Financial Indicators
ROA 1% - 7% 7.9% -5.0% -8.5% -1.9% 10.7% 8.1% 4.5% 7.8%
Operating Margin 17% 3% -1.7% -2.4% -0.2% 9% 7% 4% 6.9%
Current Ratio >1 2.15 1.96 2.17 2.09 1.92 1.89 2.06 1.95
Quick Ratio >1 1.87 1.68 1.83 1.79 1.81 1.79 1.94 1.85
Technical Indicators
Network Losses 11% - 3% 7.9% 10.0% 6.3% 8.1% 7.7% 10.5% 9.5% 9.3%
Commercial Indicators
Debtor days 32-70 days 52 51 30 44 31 31 39 34
Operating Cost/ Sales 25%-40% 28% 26% 27% 26.9% 12% 32% 34% 26.3%
Bad debts (%) 0.3% - 1.3% 0.2% 0.5% 0.5% 0.4% 0.0% 0.0% 0.0% 0.0%
Efficiency Indicators
Customers/ Employee 137 - 555 211 223 212 215 124 133 149 135
Energy Sold/ Employee kWh 2400 - 9600 1647 1647 1622 1639 1336 1354 1425 1372
Source: Electricity Distributors’ Annual Report 2016
10.7. Key ESI Statistics
This Section covers a brief overview of Key Statistics for the Electricity Supply Industry (ESI) in Namibia. A detailed analysis is available in the ESI Statistical Bulletin 2016. The data used in this report is collected by the ECB through tariff review application requirements and ECB’s data collection process. Due to the mismatch of the reporting period of the ECB and the Industry, the ECB adopted a new format of reporting periods and as a result, the key ESI statistics are reported on the calendarperiod,insteadofthefinancialperiod.
10.7.1. National Electricity Supply
10.7.1.1. Namibia’s Electricity Sources
Figure 18 on page 61 depicts sources of electricity for Namibia. During 2016, Namibia’s local sources (NamPower Generation) into the system stands at 31.5%, other regional markets (ZESA, ZESCO, STEM, EDM, and ZPC) makes up 24.8%, IPPs contributed 0.3% while Eskom contributed the largest share of 43.4%. NamPower Generation varied below 1 700 GWh for the period under review, indicating a growing electricity import dependency for Namibia.

61
Figure 18: Namibia’s Electricity Sources
10.7.1.2. Annual Peak Demand vs Generation Capacity
Figure 19 below shows the annual peak demand for electricity in Namibia (excluding Skorpion Mine) and the installed localgenerationcapacity.ThefigureisclearlyindicatingthatthedemandhassurpassedgenerationcapacityinNamibia.The demand started to surpass the installed generation capacity from 2006 and it continued to grow higher each year. The Demand is still growing higher than generation capacity therefore measures need to be put in place to meet the demand as the trend is expected to continue if the installed generation capacity is not increased.
Figure 19: Namibia Demand vs Generation Capacity
10.7.1.3. Imports vs Exports of Electricity in Namibia
Figure20onpage62showstheannualimportsvsexportsofelectricityinNamibia.ThefigureshowsthatNamibiagreatlyrelies on imports of electricity that is consumed locally. This is due to ever increasing demand of electricity in the country as seen on Figure 19 on the previous page. The drought also has an impact on the exportation of electricity to neighbouring countries.
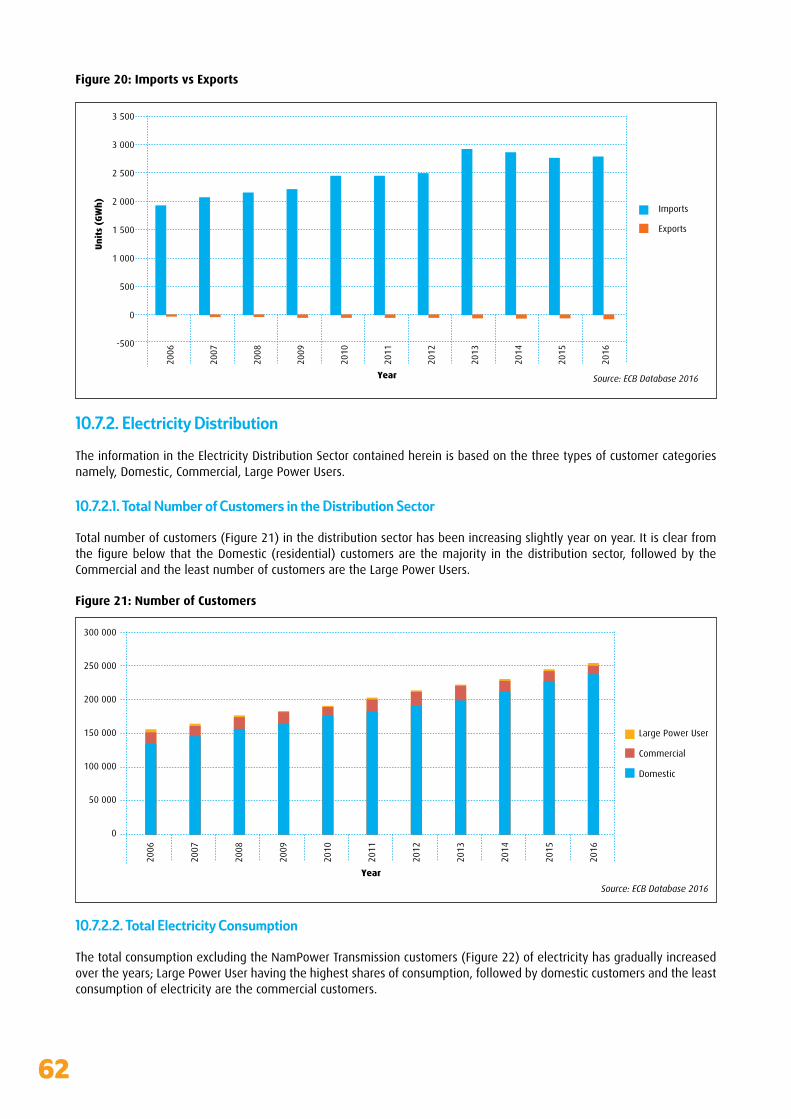
62
Figure 20: Imports vs Exports
10.7.2. Electricity Distribution
The information in the Electricity Distribution Sector contained herein is based on the three types of customer categories namely,Domestic,Commercial,LargePowerUsers.
10.7.2.1. Total Number of Customers in the Distribution Sector
Total number of customers (Figure 21) in the distribution sector has been increasing slightly year on year. It is clear from thefigurebelowthat theDomestic(residential)customersarethemajority in thedistributionsector, followedbytheCommercialandtheleastnumberofcustomersaretheLargePowerUsers.
Figure 21: Number of Customers
10.7.2.2. Total Electricity Consumption
The total consumption excluding the NamPower Transmission customers (Figure 22) of electricity has gradually increased overtheyears;LargePowerUserhavingthehighestsharesofconsumption,followedbydomesticcustomersandtheleastconsumption of electricity are the commercial customers.
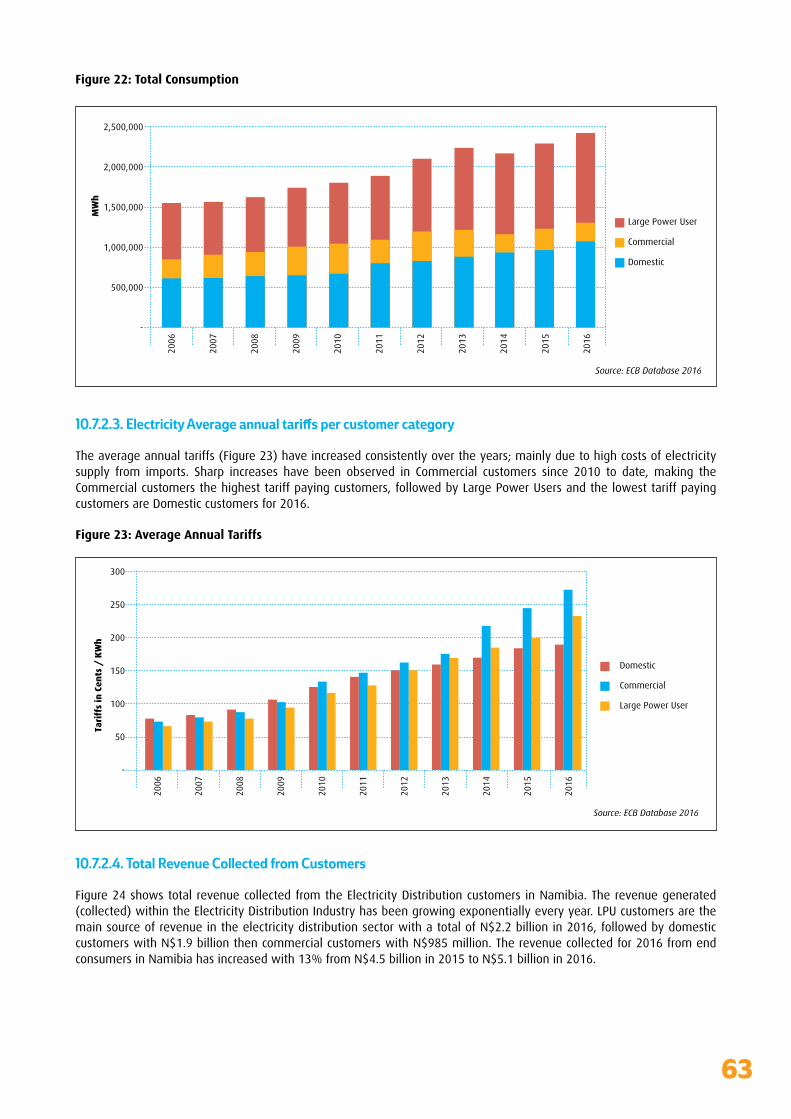
63
Figure 22: Total Consumption
10.7.2.3. Electricity Average annual tariffs per customer category
Theaverageannualtariffs(Figure23)haveincreasedconsistentlyovertheyears;mainlyduetohighcostsofelectricitysupply from imports. Sharp increases have been observed in Commercial customers since 2010 to date, making the Commercialcustomersthehighesttariffpayingcustomers,followedbyLargePowerUsersandthelowesttariffpayingcustomers are Domestic customers for 2016.
Figure 23: Average Annual Tariffs
10.7.2.4. Total Revenue Collected from Customers
Figure 24 shows total revenue collected from the Electricity Distribution customers in Namibia. The revenue generated (collected)withintheElectricityDistributionIndustryhasbeengrowingexponentiallyeveryyear.LPUcustomersarethemain source of revenue in the electricity distribution sector with a total of N$2.2 billion in 2016, followed by domestic customers with N$1.9 billion then commercial customers with N$985 million. The revenue collected for 2016 from end consumers in Namibia has increased with 13% from N$4.5 billion in 2015 to N$5.1 billion in 2016.

64
Figure 24: Total Revenue
10.7.2.5. Total Revenue as per customer category
Figure25belowshowsthatLPUarethemainsourceofrevenueintheelectricitysectorinNamibia,generating44%ofthe total revenue while the Domestic customers generated 37% and the Commercial customers generating only 19% of the total revenue.
Figure 25: Revenue as per Customer Category
10.8. Regulatory Support Services Projects10.8.1. The Establishment of the Knowledge Hub
Following its launching in December 2015, the ECB is currently in the process of converting the Knowledge Management Framework into a Knowledge Management Policy. The policy is needed for the ECB to align its knowledge Management strategy with the Business Strategy to create a result driven and knowledge based organisation.
10.8.2. National Policies Developed and Finalised
The Ministry of Mines and Energy mandated the ECB and the Namibia Energy Institute (NEI) to align the various Policies being drafted to ensure that the Policies do not contradict each other. The Polices have also been drafted after a review of numerous National Policies, strategies, vision documents and frameworks.

65
10.8.3. IPP Policy
ThedraftingofthispolicystartedinJanuary2016andthefinaldraftwasfinalisedinNovember2016.Thefinaldraftisinthe process of being submitted to the Minister of Mines and Energy for approval. During the next reporting period, it will be reportedonthestatusoftheIPPPolicyregardingCabinetendorsement.Thefinalisationofthisprojectsawtheformationof a National Policy as well as an operational framework to facilitate investments by IPPs in Namibia.
The IPP Policy outlines the key provisions of the Government’s commitment to encourage private investment in Namibia’s power sector and outlines the power market model, pricing regime, procurement approach, and the requirements for the IPPs to develop power generation projects and seek licenses for implementing the projects.
10.8.4. Renewable Energy Policy
A lack of a Renewable Energy Policy for Namibia coupled with a realistic and measurable Renewable Energy target prohibited an accelerated uptake of Renewable Energy projects in the country. The drafting process of the Renewable Energy Policy wasstartedinFebruary2016andwasfinalisedinDecember2016withtheMinister’sapproval.FollowingtheMinister’sapproval, a Cabinet submission was prepared for endorsement. The Renewable Energy Policy aims to make renewable energy a powerful tool for the Government of Namibia to meet its short-term and long-term national development goals. Itwillboostconfidence in investorswanting toenter theNamibianRenewableEnergysectorandallowNamibians toparticipate in the sector.
The Renewable Energy Policy also has an implementation plan that will see the implementation of various projects from differentstakeholdersovertheperiodoffiveyearswiththeassistanceoftheMinistryofMinesandEnergy.
10.8.5. National Energy Policy
ThedraftingoftheEnergyPolicycommencedinMarch2016andwasfinalisedinMarch2017withtheMinister’sapproval.Following the Minister’s approval, a Cabinet submission has been prepared for endorsement. The National Energy Policy maps out the direction in which the Namibian Government must go regarding its Energy sector. The main goals of the Policy are to,
• ensure the security of all relevant energy supplies to the country
• create cost-effective, affordable, reliable and equitable access to energy for all Namibians
•promotetheefficientuseofallformsofenergy
• incentivise the discovery, development and productive use of the country’s diverse energy resources.
The Policy document has an implementation plan, it provides a set of strategic actions required to implement the Policy, and gives an indication of when these actions should be undertaken and completed and the roles of the main institutional entities responsible for implementation.
10.8.6. EDI Reform
The Ministry of Mines and Energy (MME) is restructuring the ESI into a structured distribution industry through the creation of fiveREDs.NORED,CENOREDandErongoREDwereestablishedandareoperational.Theestablishmentandoperationalisationof the Central & Southern REDs is experiencing delays mainly due to on-going discussions on the REDs impact on the Local Authority revenue as well as shareholding issues.
Following the EDI Summit held in 2014 which concluded the establishment of the two remaining REDs, stakeholder consultations have been on-going. Some overall progress has been made during the period under review regarding the establishment of SORED. Consultations regarding Central RED is on-going. Commercial operationalisation of the two remaining REDs is expected to start in 2018.
10.9. Future OutlookThe Regulatory Support Service will continue to offer support to the ESI stakeholders and ensure that security of supply remain the focus by ensuring that all interested investors are afforded the same opportunity to enter the sector. It is our hope that the implementation of the various policies that have been developed will take off as per the work plan and that the stakeholders and institutions responsible will coordinate their efforts and resources to meet the various targets that have been set.

66
ActivitiesThe 13th Annual
Conference and Annual General Assembly, was
hosted by the African Development Bank, in
Côte D’ Ivoire. Amongst the papers presented
at the conference the Electricity Control Board
presented a well-received paper on Practical
Lessons derived from Regulatory Interventions
in Enhancing Quality of Service and Supply in
the Namibian Electricity Supply Industry.
Regional and International
11
67
11.1. Regional Electricity Regulators Association of Southern Africa (RERA)During the period under review, RERA continued to play its role in facilitating networking and capacity building activities among regulatory authorities and participating in the Southern African Development Community (SADC) energy sector development agenda conversations. Events of note included RERA’s facilitation of the peer review of the Zambia Energy Regulation Board (ERB).RERAalso tookpart inNARUC-coordinatedpeer reviewevents involvingECB,NERSA and the newly established Botswana Energy Regulation Authority (BERA). The establishment of BERA deserves special mention as a welcome addition to the RERA family.
RERA end of year activities were held in November 2016 in Maseru, Lesotho. As on previous occasions, the ECB participated in all scheduled subcommittee meetings.
11.2. African Forum for Utility Regulators (AFUR)The 13th Annual Conference and Annual General Assembly, was hosted by the African Development Bank, in Abidjan,
Côte D’ Ivoire from 27th February to 3rd March 2017. Amongst the papers presented at the conference, the Electricity Control
Board presented a well-received paper on Practical Lessons derived from Regulatory Interventions in Enhancing Quality of
Service and Supply in the Namibian Electricity Supply Industry.
11.3. African Electrotechnical Standardisation Commission (AFSEC)
and International Electrotechnical Commission (IEC)
Electrotechnical standards play a crucial role as a regulatory tool. The ECB participated in both the AFSEC Annual General Meeting and the IEC General
Assembly.
11.4. World Energy Council (WEC)Namibia’s membership in the World Energy Council remained active, with the ECB
CEO, Mrs Foibe Namene as Chairperson of Namibia’s WEC member committee. The committee consists of members from industry and government, energy experts,
research institutions and other energy-related organisations and individuals. During the 2015/16 period, the committee held 2 committee meetings and also participated
in the annually hosted Energy Indaba in Johannesburg South Africa, WEC’s regional energy forum.
The WEC Namibia member committee embarked on Namibia’s 2016 Issues Monitor, which enablesmembercountriestounderstanditsnationaldeep-divesandshowcasespecificareasof concern for national energy policy.
68
Contents Page
Boardmembers’responsibilityforfinancialreporting ............................................................................................................. 69
Boardmembers’approvaloftheannualfinancialstatements ............................................................................................... 69
Independent auditor’s report ..............................................................................................................................................70 - 71
Report of the Board members ................................................................................................................................................... 72
Statementofprofitorlossandothercomprehensiveincome ................................................................................................ 73
Statementoffinancialposition ................................................................................................................................................. 74
Statement of changes in equity ................................................................................................................................................ 75
Statementofcashflows ............................................................................................................................................................ 76
Notestotheannualfinancialstatements ..........................................................................................................................77 - 87
Detailedstatementofprofitandlossandothercomprehensiveincome ............................................................................. 88
Electricity Control BoardAnnual Financial Statements
for the year ended 31 March 2017

69 69
Board Members’ Responsibility for Financial ReportingThe members of the Board are responsible for the maintenance of adequate accounting records and the preparation and integrityoftheannualfinancialstatementsandrelatedfinancialinformation.Theannualfinancialstatementsarepreparedin accordance with International Financial Reporting Standards. The Board’s independent external auditors have audited the financialstatementsandtheirreportappearsonpages70to71.
The Boardmembers are also responsible for the systems of internal financial control. These are designed to providereasonable but not absolute assurance as to the reliability of the financial statements, and to adequately safeguard,verify and maintain accountability of assets, and to prevent and detect material misstatement and loss. The systems are implemented and monitored by suitably trained personnel with an appropriate segregation of authority and duties. Nothing has come to the attention of the Board members to indicate that any material breakdown in the functioning of these controls, procedures and systems has occurred during the year under review.
Theannualfinancialstatementsarepreparedonagoingconcernbasis.Pleaserefertopage72oftheBoardmembers’report where the appropriateness of the going concern assumption is discussed in detail.
Board Members’ Approval of the Annual Financial StatementsTheannualfinancialstatementssetoutonpages72to87wereapprovedbytheBoardmemberson24August2017andare signed on their behalf by:
………………………… …………………………
Board member Board member

70
Independent Auditor’s ReportTo the Directors of Electricity Control Board Opinion
Wehaveaudited thefinancial statementsof Electricity ControlBoard setoutonpages72 to87,which comprise thedirectors’report,thestatementoffinancialpositionasat31March2017,andthestatementofprofitorlossandothercomprehensiveincome,thestatementofchangesinequityandthestatementofcashflowsfortheyearthenended,andthenotestothefinancialstatements,includingasummaryofsignificantaccountingpoliciesandthedirector’sreport.
Inouropinion,thefinancialstatementspresentfairly,inallmaterialrespects,thefinancialpositionofElectricityControlBoardasat31March2017,and itsfinancialperformanceandcashflowsfor theyear thenended inaccordancewithInternational Financial Reporting Standards (IFRS) and the requirements of the Electricity Act.
Basis for Opinion
We conducted our audit in accordance with International Standards on Auditing (ISAs). Our responsibilities under those standards are further described in the Auditor’s Responsibilities for the Audit of the Financial Statements section of our report. We are independent of the entity in accordance with the independence requirements applicable to performing auditsoffinancialstatementsinNamibiawhichisconsistentwiththeInternationalEthicsStandardsBoardforAccountantsCodeofEthicsforProfessionalAccountants(PartsAandB).Wehavefulfilledourotherethicalresponsibilitiesinaccordancewith ethical requirements applicable to performing audits in Namibia. We believe that the audit evidence we have obtained issufficientandappropriatetoprovideabasisforouropinion.
Other Information
The directors are responsible for the other information. The other information comprises the general information and directors’responsibilitiesandapproval.Theotherinformationdoesnotincludethefinancialstatementsandourauditor’sreport thereon.
Ouropiniononthefinancialstatementsdoesnotcovertheotherinformationandwedonotexpressanauditopinionorany form of assurance conclusion thereon.
Inconnectionwithourauditofthefinancialstatements,ourresponsibilityistoreadtheotherinformationand,indoingso,considerwhethertheotherinformationismateriallyinconsistentwiththefinancialstatementsorourknowledgeobtainedin the audit, or otherwise appears to be materially misstated.
If, based on the work we have performed, we conclude that there is a material misstatement of this other information, we are required to report that fact. We have nothing to report in this regard.
Responsibilities of the Directors for the Financial Statements
Thedirectors are responsible for thepreparation and fair presentationof thefinancial statements in accordancewithInternational Financial Reporting Standards and the requirements of the Electricity Act and for such internal control as the directorsdetermineisnecessarytoenablethepreparationoffinancialstatementsthatarefreefrommaterialmisstatement,whether due to fraud or error.
Inpreparingthefinancialstatements,thedirectorsareresponsibleforassessingtheentity’sabilitytocontinueasagoingconcern, disclosing, as applicable, matters related to going concern and using the going concern basis of accounting unless the directors either intend to liquidate the entity or to cease operations, or have no realistic alternative but to do so.
71 71
Independent Auditor’s ReportTo the Members of Electricity Control Board (continued) Auditor’s Responsibilities for the Audit of the Financial Statements
Our objectives are to obtain reasonable assurance aboutwhether the financial statements as awhole are free frommaterial misstatement, whether due to fraud or error, and to issue an auditor’s report that includes our opinion. Reasonable assurance is a high level of assurance, but is not a guarantee that an audit conducted in accordance with ISAs will always detect a material misstatement when it exists. Misstatements can arise from fraud or error and are considered material if, individuallyorintheaggregate,theycouldreasonablybeexpectedtoinfluencetheeconomicdecisionsofuserstakenonthebasisofthesefinancialstatements.
As part of an audit in accordance with ISAs, we exercise professional judgement and maintain professional scepticism throughout the audit. We also:
• Identifyandassesstherisksofmaterialmisstatementofthefinancialstatements,whetherduetofraudorerror,designandperformauditproceduresresponsivetothoserisks,andobtainauditevidencethatissufficientandappropriatetoprovide a basis for our opinion. The risk of not detecting a material misstatement resulting from fraud is higher than for one resulting from error, as fraud may involve collusion, forgery, intentional omissions, misrepresentations, or the override of internal control.
• Obtain an understanding of internal control relevant to the audit in order to design audit procedures that are appropriate in the circumstances, but not for the purpose of expressing an opinion on the effectiveness of the entity’s internal control.
• Evaluate the appropriateness of accounting policies used and the reasonableness of accounting estimates and related disclosures made by the directors.
• Conclude on the appropriateness of the directors’ use of the going concern basis of accounting and based on the audit evidenceobtained,whetheramaterialuncertaintyexists relatedtoeventsorconditions thatmaycastsignificantdoubt on the entity’s ability to continue as a going concern. If we conclude that a material uncertainty exists, we arerequiredtodrawattentioninourauditor’sreporttotherelateddisclosuresinthefinancialstatementsor,ifsuchdisclosures are inadequate, to modify our opinion. Our conclusions are based on the audit evidence obtained up to the date of our auditor’s report. However, future events or conditions may cause the entity to cease to continue as a going concern.
• Evaluatetheoverallpresentation,structureandcontentof thefinancialstatements, includingthedisclosures,andwhetherthefinancialstatementsrepresenttheunderlyingtransactionsandevents inamannerthatachievesfairpresentation.
We communicate with the directors regarding, among other matters, the planned scope and timing of the audit and significantauditfindings,includinganysignificantdeficienciesininternalcontrolthatweidentifyduringouraudit.
Deloitte & ToucheRegistered Accountants and AuditorsChartered Accountants (Namibia)Per AA AkayombokwaPartnerWindhoek
12 September 2017
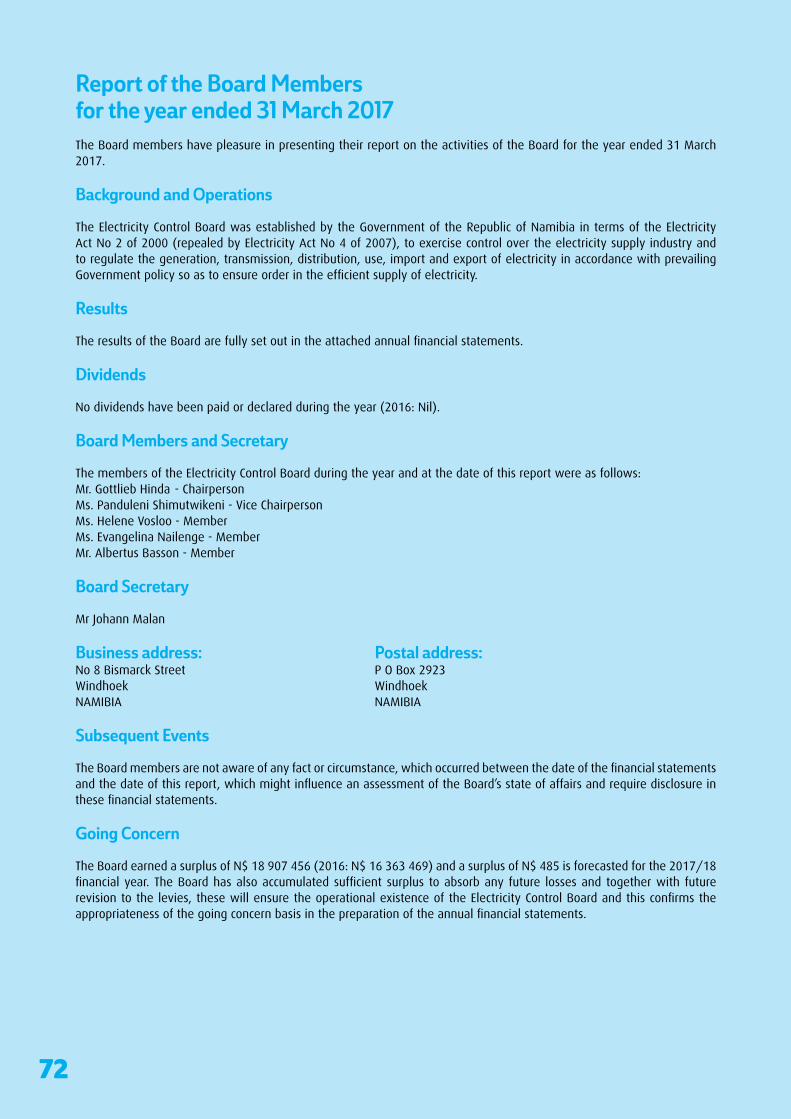
72
Report of the Board Membersfor the year ended 31 March 2017The Board members have pleasure in presenting their report on the activities of the Board for the year ended 31 March 2017.
Background and Operations
The Electricity Control Board was established by the Government of the Republic of Namibia in terms of the Electricity Act No 2 of 2000 (repealed by Electricity Act No 4 of 2007), to exercise control over the electricity supply industry and to regulate the generation, transmission, distribution, use, import and export of electricity in accordance with prevailing Governmentpolicysoastoensureorderintheefficientsupplyofelectricity.
Results
TheresultsoftheBoardarefullysetoutintheattachedannualfinancialstatements.
Dividends
No dividends have been paid or declared during the year (2016: Nil).
Board Members and Secretary
The members of the Electricity Control Board during the year and at the date of this report were as follows:Mr. Gottlieb Hinda - ChairpersonMs. Panduleni Shimutwikeni - Vice ChairpersonMs. Helene Vosloo - MemberMs. Evangelina Nailenge - MemberMr. Albertus Basson - Member
Board Secretary
Mr Johann Malan
Business address: Postal address:No 8 Bismarck Street P O Box 2923Windhoek WindhoekNAMIBIA NAMIBIA
Subsequent Events
TheBoardmembersarenotawareofanyfactorcircumstance,whichoccurredbetweenthedateofthefinancialstatementsandthedateofthisreport,whichmightinfluenceanassessmentoftheBoard’sstateofaffairsandrequiredisclosureinthesefinancialstatements.
Going Concern
TheBoardearnedasurplusofN$18 907456(2016:N$16 363469)andasurplusofN$485isforecastedforthe2017/18financialyear. TheBoardhasalsoaccumulatedsufficient surplus toabsorbany future lossesand togetherwith futurerevisiontothelevies,thesewillensuretheoperationalexistenceoftheElectricityControlBoardandthisconfirmstheappropriatenessofthegoingconcernbasisinthepreparationoftheannualfinancialstatements.

73 73
Statement of Profit or Loss and other Comprehensive Incomefor the Year Ended 31 March 2017
Notes 2017 2016 N$ N$
REVENuE 4 71 657 321 63 284 165Other income 603 494 67 808Operatingcosts (57 645785) (57 577 067)
SuRPLuS BEFORE INTEREST 14 615 030 5 774 906Interestreceived 4 292426 5 028596 SuRPLuS BEFORE TAXATION 5 18 907 456 10 803 502Taxation 7 - -OTHER COMPREHENSIVE INCOME 18 907 456 10 803 502Revaluationsurplus 8 - 5 559967
TOTAL SuRPLuS AND OTHER COMPREHENSIVEINCOME FOR THE YEAR 18 907 456 16 363 469

74
Statement of Financial Positionas at 31 March 2017
Notes 2017 2016 N$ N$
ASSETS NON-CuRRENT ASSETS Property,plantandequipment 8 54 654169 14 359741 CuRRENT ASSETS 53 172 369 75 303 445 Tradeandotherreceivables 9 7 014244 6 451479Cashandcashequivalent 10 46 158125 68 851966 TOTAL ASSETS 107 826 538 89 663 186 RESERVES AND LIABILITIES RESERVES 96 827 339 77 919 883 Revaluationreserve 9 696992 9 696992Accumulatedfunds 87 130347 68 222891 CuRRENT LIABILITIES 10 999 199 11 743 303 Tradeandotherpayables 11 10 170529 8 732717Trustfunds–MMEprojects 12 828670 3 010586 TOTAL RESERVES AND LIABILITIES 107 826 538 89 663 186
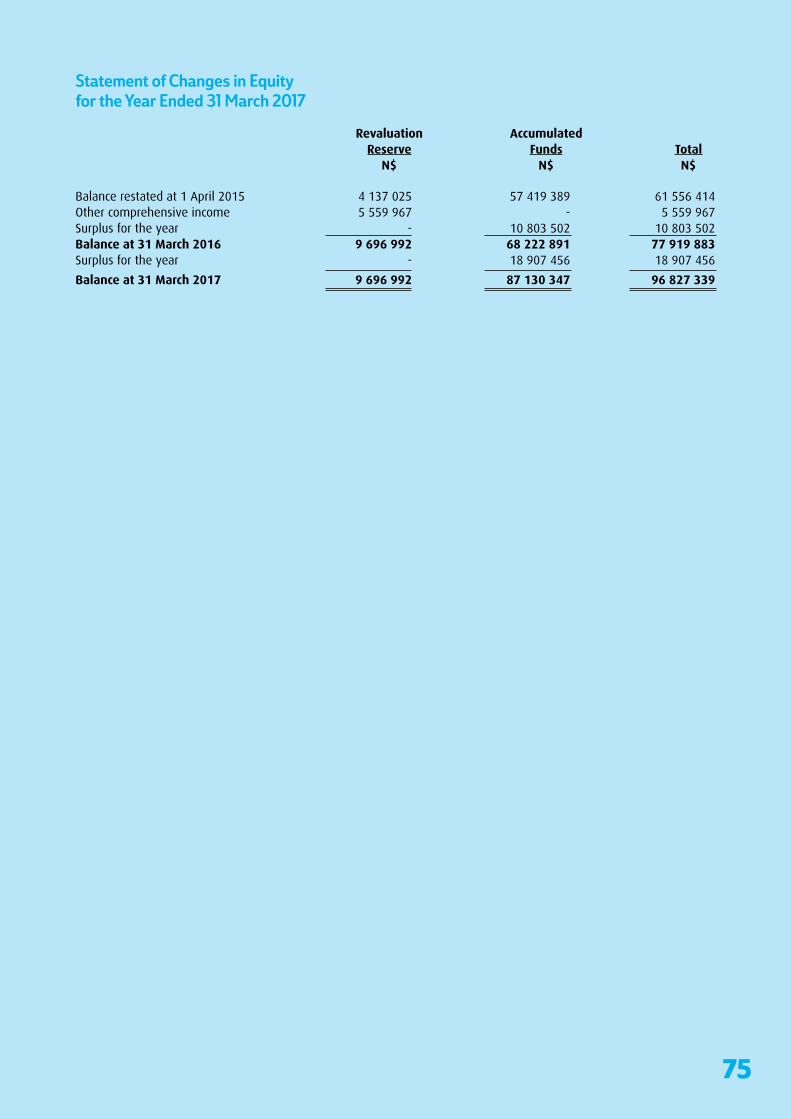
75 75
Statement of Changes in Equityfor the Year Ended 31 March 2017
Revaluation Accumulated Reserve Funds Total N$ N$ N$
Balancerestatedat1April2015 4 137025 57 419389 61 556414Othercomprehensiveincome 5 559967 - 5 559967Surplusfortheyear - 10 803502 10 803502Balance at 31 March 2016 9 696 992 68 222 891 77 919 883Surplusfortheyear - 18 907456 18 907456
Balance at 31 March 2017 9 696 992 87 130 347 96 827 339
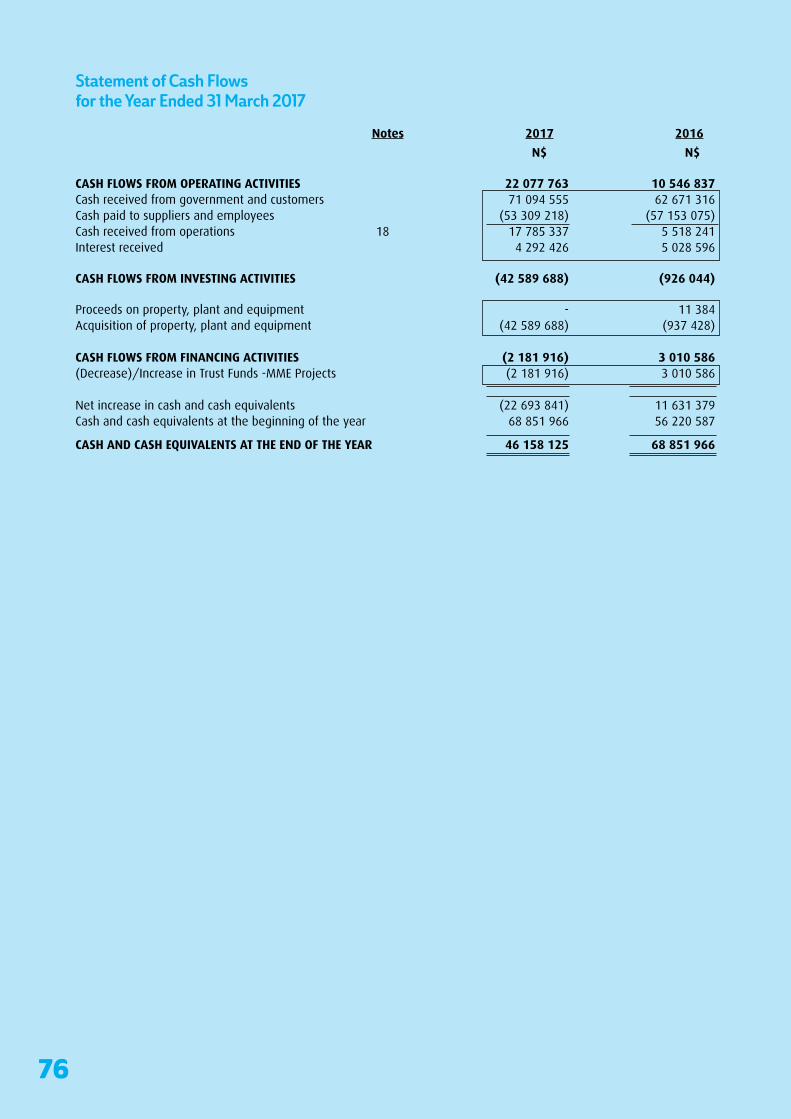
76
Statement of Cash Flows for the Year Ended 31 March 2017
Notes 2017 2016
N$ N$
CASH FLOWS FROM OPERATING ACTIVITIES 22 077 763 10 546 837Cashreceivedfromgovernmentandcustomers 71 094555 62 671316Cashpaidtosuppliersandemployees (53 309218) (57 153075)Cashreceivedfromoperations 18 17 785337 5 518241Interestreceived 4 292426 5 028596
CASH FLOWS FROM INVESTING ACTIVITIES (42 589 688) (926 044)
Proceeds on property, plant and equipment - 11 384Acquisitionofproperty,plantandequipment (42 589688) (937428)
CASH FLOWS FROM FINANCING ACTIVITIES (2 181 916) 3 010 586(Decrease)/IncreaseinTrustFunds-MMEProjects (2 181 916) 3 010586 Netincreaseincashandcashequivalents (22 693 841) 11 631379Cashandcashequivalentsatthebeginningoftheyear 68 851966 56 220587
CASH AND CASH EQUIVALENTS AT THE END OF THE YEAR 46 158 125 68 851 966

77 77
Notes to the Annual Financial Statementsfor the Year Ended 31 March 20171. Basis of preparation
Theannualfinancialstatementsarepreparedonthehistoricalcostbasis,exceptforfinancialinstrumentswhichare carried at fair value. The principal accounting policies, which have been consistently applied in all material respects, comply in all material respects with International Financial Reporting Standards (“IFRS”) adopted by the International Accounting Standard Board (IASB) and interpretations issued by the International Financial Reporting Interpretations Committee (IFRIC) of the IASB.
1.1. Standards, interpretations and amendments to published standards that are not yet effective
The Board has adopted all the new and revised Standards and Interpretations issued by the International Accounting Standards Board (the IASB) and the International Financial Reporting Committee (IFRIC) of the IASB that are relevant to its operations and effective for accounting years beginning on 1 April 2016. However, the adoption of the standardsandinterpretationsdidnotresultinanymaterialadjustmentstothereportedfigures.
IAS 16 Property, Plant and Equipment
IAS 27 Separate Financial Statements
None of the standards, as indicated above that were effective for the current accounting year, had an impact on the resultsorfinancialpositionoftheBoard.
Atthedateofauthorisationofthesefinancialstatements,thefollowingStandardsandInterpretationswereissuedbut not yet effective:
New/Revised International Financial Reporting Standards and interpretations Effective Date
IAS 7 Statement of Cash Flows 1 January 2017
IAS 12 Income Taxes 1 January 2017
IFRS 15 Revenue from Contract with Customers 1 January 2018
The Board members anticipate that the adoption of these statements and interpretations will have no material impactonthefinancialstatementsinfutureperiods.

78
Notes to the Annual Financial Statementsfor the Year Ended 31 March 2017 2. Significant Accounting Policies
2.1 Revenue
Revenue comprises levies, licence and registration fees collected in terms of the Electricity Act No 2 of 2000 (repealed by Electricity Act No 4 of 2007) to defray costs necessarily incurred by the Control Board and are recognised on an accrual basis.
2.2 Property, plant and equipment
Land and buildings held for use in the production or supply of goods or services, or for administrative purposes, arestated in thestatementoffinancialpositionat their revaluedamounts,being the fairvalueat thedateofrevaluation, less any subsequent accumulated depreciation and subsequent accumulated impairment losses. Revaluations are performed every three years such that the carrying amounts do not differ materially from those that would be determined using fair values at the end of each reporting period.
Any revaluation increase arising on the revaluation of such land and buildings is recognised in other comprehensive income and accumulated in equity, except to the extent that it reverses a revaluation decrease for the same asset previouslyrecognisedinprofitorloss,inwhichcasetheincreaseiscreditedtoprofitorlosstotheextentofthedecrease previously expensed. A decrease in the carrying amount arising on the revaluation of such land and buildings is recognised inprofitor loss to theextent that itexceeds thebalance, ifany,held in thepropertiesrevaluation reserve relating to a previous revaluation of that asset.
Depreciationonrevaluedbuildingsisrecognisedinprofitorloss.Onthesubsequentsaleorretirementofarevaluedproperty, the attributable revaluation surplus remaining in the properties revaluation reserve is transferred directly to retained earnings.
Freehold land is not depreciated.
Fixtures and equipment are stated at cost less accumulated depreciation and accumulated impairment losses.
Depreciation is recognised so as to write off the cost or valuation of assets (other than freehold land and properties under construction) less their residual values over their useful lives, using the straight-line method. The estimated useful lives, residual values and depreciation method are reviewed at the end of each reporting period, with the effect of any changes in estimate accounted for on a prospective basis.
Assetsheldunderfinance leasesaredepreciatedover theirexpecteduseful liveson thesamebasisasownedassets. However, when there is no reasonable certainty that ownership will be obtained by the end of the lease term, assets are depreciated over the shorter of the lease term and their useful lives.
Depreciation is calculated on a straight-line basis to write off assets to their estimated residual values over their anticipated useful lives as follows:
- Buildings 25 years (4% p.a.) - Furniture and equipment 5 years (20% p.a.) - Computer equipment 3 years (33.3% p.a.)
- Motor vehicles 4 years (25% p.a.)

79 79
Notes to the Annual Financial Statementsfor the Year Ended 31 March 2017 2. Significant Accounting Policies (Continued)
2.3 Retirement benefits
Contributions to retirement funds are charged against income in the year in which they become payable.
2.4 Provisions
Provisions for liabilities are recognised when the Board has a present legal or constructive obligation as a result of pastevents,forwhichitisprobablethatanoutflowofeconomicbenefitswilloccur,andwhereareliableestimatecan be made of the amount of the obligation.
2.5 Impairment of assets
At each reporting date, the Board reviews the carrying amounts of its assets to determine whether there is any indication that those assets have suffered an impairment loss. If any such indication exists, the recoverable amount of the asset is estimated in order to determine the extent of the impairment loss, if any. If the recoverable amount of an asset is estimated to be less than its carrying amount, its carrying amount is reduced to its recoverable amount and the impairment losses are recognised as an expense immediately.
If an impairment loss subsequently reverses, the carrying amount of the asset is increased to the revised estimate of its recoverable amount but limited to the carrying amount that would have been determined had no impairment loss been recognised in prior years. A reversal of an impairment loss is recognised in the statement of comprehensive income.
2.6 Cash and cash equivalents
Cash and cash equivalents are measured at fair value and comprise cash on hand, deposits held on call with banks andinvestmentsinmoneymarketinstruments,netofbankoverdraftsandcallloans.Inthestatementoffinancialposition, bank overdrafts are included in current liabilities. Interest-bearing bank overdrafts and other short-term borrowings are recorded at the proceeds received, net of direct issue costs.
Forthepurposeofthestatementofcashflows,theBoardconsidersallCashandcashequivalentwithamaturityofless than one year and bank overdrafts to be cash and cash equivalents.
2.7 Financial instruments
Initial measurement
FinancialassetsandfinancialliabilitiesarerecognisedonthestatementoffinancialpositionwhentheBoardhasbecome a party to the contractual provisions of the instrument. Financial instruments carried on the statement of financialpositionincludebankandcashbalances,tradeandotherreceivablesandtradeandotherpayables.
Subsequent measurement
Fairvaluesandtherecognitionmethodsof thedifferentfinancial instrumentsaredisclosed inthenotestotheannualfinancialstatements.Fairvaluerepresentsanapproximationoftheyearendvalue,whichmaydifferfromthevaluethatwillbefinallyrealised.
De-recognition
Financial instruments are offset when the Board has a legally enforceable right to offset and intends to settle either on a net basis or to realise the asset and settle the liability simultaneously.

80
Notes to the Annual Financial Statementsfor the Year Ended 31 March 2017 2. Significant Accounting Policies (Continued)
2.7 Financial instruments (continued)
Trade and other receivables
Trade receivables are measured at initial recognition at fair value, and are subsequently measured at amortised cost using effective interest rate method. Appropriate allowances for estimated irrecoverable amounts are recognised in the statement of comprehensive income when there is objective evidence that the asset is impaired. The allowance recognised is measured as the difference between the asset’s carrying amount and the present value of estimated futurecashflowsdiscountedattheeffectiveinterestratecomputedatinitialrecognition.
Trade and other payables
Trade payables are initially measured at fair value, and are subsequently measured at amortised cost, using the effective interest rate method.
2.8 Leasing
Leasesareclassifiedasfinance leaseswheneverthetermsof the leasetransfersubstantiallyall therightsandrewardsofownership to the lessee.Allother leasesare classifiedasoperating leasesand rentalsare chargedagainsttradingprofitastheybecomedue.
The Board as a lessee
AssetsheldunderfinanceleasearerecognisedasassetsoftheBoardatfairvalueatthedateofacquisition.Thecorrespondingliabilitytothelessorisincludedinthestatementoffinancialpositionasafinanceleaseobligation.Finance costs, which represent the difference between the total leasing commitments and the fair value of the assets acquired, are charged to the statement of comprehensive income over the term of the relevant lease so as to produce a constant periodic rate of interest on the remaining balance of the obligations for each period.
Rentals payable under operating leases are charged to income on a straight-line basis over the term of the relevant lease.
3. Judgements by management
Therewerenomaterial judgementsmadebymanagementthatcouldhaveasignificanteffectontheamountsrecognisedinthefinancialstatements.
3.1 Key sources of estimation uncertainty
There are no key assumptions concerning the future and other key sources of estimation uncertainty at the reporting datethatcouldhaveasignificantriskofcausingmaterialadjustmenttothecarryingamountsoftheassetsandliabilitieswithinthenextfinancialyear.
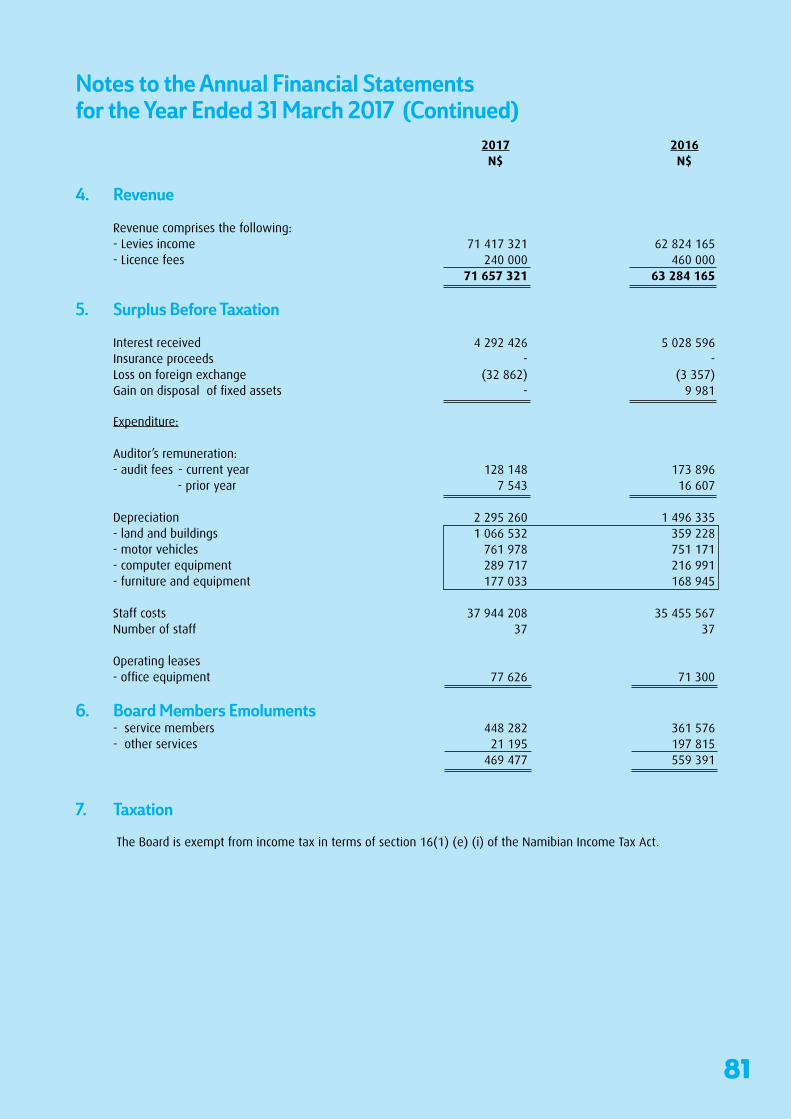
81 81
Notes to the Annual Financial Statementsfor the Year Ended 31 March 2017 (Continued) 2017 2016 N$ N$
4. Revenue Revenue comprises the following: -Leviesincome 71 417321 62 824165 - Licence fees 240 000 460 000 71 657 321 63 284 165
5. Surplus Before Taxation Interestreceived 4 292426 5 028596 Insurance proceeds - -Loss on foreign exchange (32 862) (3 357)Gainondisposaloffixedassets - 9981
Expenditure: Auditor’s remuneration: - audit fees - current year 128 148 173 896 - prior year 7 543 16 607 Depreciation 2 295260 1 496335-landandbuildings 1 066532 359228 - motor vehicles 761 978 751 171 - computer equipment 289 717 216 991 - furniture and equipment 177 033 168 945 Staffcosts 37 944208 35 455567 Number of staff 37 37 Operating leases -officeequipment 77626 71300
6. Board Members Emoluments - service members 448 282 361 576 - other services 21 195 197 815 469 477 559 391
7. Taxation
The Board is exempt from income tax in terms of section 16(1) (e) (i) of the Namibian Income Tax Act.

82
Notes to the Annual Financial Statementsfor the Year Ended 31 March 2017 (Continued)8. Property, Plant and Equipment
Land & Motor Computer Furniture & buildings Vehicles equipment equipment Total N$ N$ N$ N$ N$ 2017
Cost
At01April2016 13 424932 3 047913 1 222141 1 766116 19 461102Disposals - - - - -Revaluation - - - - -Additions 41 528124 640031 283485 138048 42 589688At 31 March 2017 54 953 056 3 687 944 1 505 626 1 904 164 62 050 790 Accumulated depreciation
At01April2016 1 924930 1 102045 809530 1 264856 3 693993Disposals - - - - -Depreciation 1 066532 761978 289717 177033 2 295260At 31 March 2017 2 991 462 1 864 023 1 099 247 1 441 889 7 396 621 Net book value at 01 April 2016 11 500 002 1 945 868 412 611 501 260 14 359 741Net book value at 31 March 2017 51 961 594 1 823 921 406 379 462 275 54 654 169
2016
Cost
At01April2015 7864965 2 529161 982291 1 677660 13 054077Disposals - - (57 860) (32 510) (90 370)Revaluation 5 559967 - - - 5 559967Additions - 518 752 297 710 120 966 937 428At 31 March 2016 13 424 932 3 047 913 1 222 141 1 766 116 19 461 102 Accumulated depreciation
At01April2015 1 565702 350874 648996 1128421 3 693993Disposals - - (56 457) (32 510) (88 967)Depreciation 359228 751171 216991 168945 1 496335At 31 March 2016 1 924 930 1 102 045 809 530 1 264 856 5 101 361 Net book value at 01 April 2015 6 299 263 2 178 287 333 295 549 239 9 360 084Net book value at 31 March 2016 11 500 002 1 945 868 412 611 501 260 14 359 741
Land and buildings comprises Erf 714, on 8 Bismarck Street, Windhoek. Revaluation is performed every three years. The prior year revaluation was performed by an independent sworn appraiser, P. J. J. Wilders - National Diploma PropertyValuations(TechSA).ThebookvalueoftheLandandbuildingathistoricalcostisN$1 254 454.
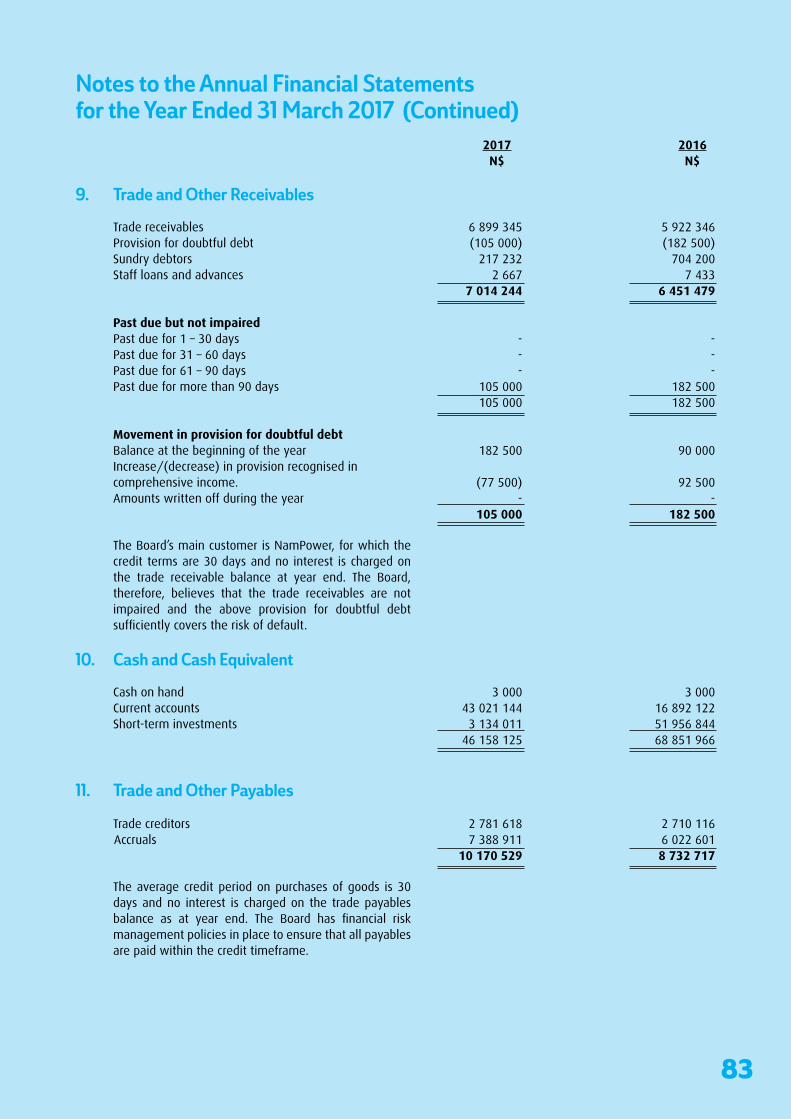
83 83
Notes to the Annual Financial Statementsfor the Year Ended 31 March 2017 (Continued) 2017 2016 N$ N$
9. Trade and Other Receivables
Tradereceivables 6 899345 5 922346Provisionfordoubtfuldebt (105000) (182 500)Sundry debtors 217 232 704 200Staff loans and advances 2 667 7 433 7 014 244 6 451 479 Past due but not impaired Past due for 1 – 30 days - - Past due for 31 – 60 days - - Past due for 61 – 90 days - - Past due for more than 90 days 105 000 182 500 105 000 182 500 Movement in provision for doubtful debt Balance at the beginning of the year 182 500 90 000Increase/(decrease) in provision recognised in comprehensiveincome. (77 500) 92500Amounts written off during the year - - 105 000 182 500
The Board’s main customer is NamPower, for which the credit terms are 30 days and no interest is charged on the trade receivable balance at year end. The Board, therefore, believes that the trade receivables are not impaired and the above provision for doubtful debt sufficientlycoverstheriskofdefault.
10. Cash and Cash Equivalent
Cash on hand 3 000 3 000Currentaccounts 43 021144 16 892122Short-terminvestments 3 134011 51 956844 46 158125 68 851966
11. Trade and Other Payables Tradecreditors 2 781618 2 710116Accruals 7 388911 6 022601 10 170 529 8 732 717
The average credit period on purchases of goods is 30 days and no interest is charged on the trade payables balance as at year end. The Board has financial riskmanagement policies in place to ensure that all payables are paid within the credit timeframe.

84
Notes to the Annual Financial Statementsfor the Year Ended 31 March 2017 (Continued) 2017 2016
N$ N$
12. Trust Funds – MME Projects
Balanceatbeginningofyear 3 010586 -Fundsreceived 4 699993 5 085411Disbursements (7 017630) (2 126 905) Interest and charges 135 721 52 080Balanceatendofyear 828670 3 010586
13. Retirement Benefits for Employees
Retirementbenefitsareprovidedforemployeesthroughan independent retirement fund known as NamflexProvident Fund. The retirement fund is governed by the NamibianPensionFundsActandisadefinedcontributionplan. All permanent employees qualify for the retirement benefits.CurrentyearcontributionstoretirementbenefitsamountedtoN$3 634529(2016:N$3 137747).The total value of contributions to the fund during the year amounted to:
Employeecontributions 1 251893 992384Employercontributions 2 382636 2 145363 3 634529 3 137747
According to Alexander Forbes, the value of the fund as at 31March2017isN$16 230876(2016:N$13 603 688).
14. Financial Instruments and Risk Management
14.1 Categories of financial instruments
Financial assets Tradeandotherreceivables 7 014244 6 454479Cashandcashequivalent 46 158125 68 851966 53 172369 75303445
Financial liabilities Tradeandotherpayables 10 170529 8 732717Trustfunds 828670 3 010586Liabilitiesatamortisedcost 10 999199 11 743303
14.2 Interest rate management
As part of the process of managing the Board’s interest rate risk, interest rate characteristics of new borrowings and therefinancingofexistingborrowingsarepositionedaccordingtoexpectedmovementsininterestrates.TheBoardcurrently has no exposure to interest rate risk as it does not have any interest bearing borrowings.
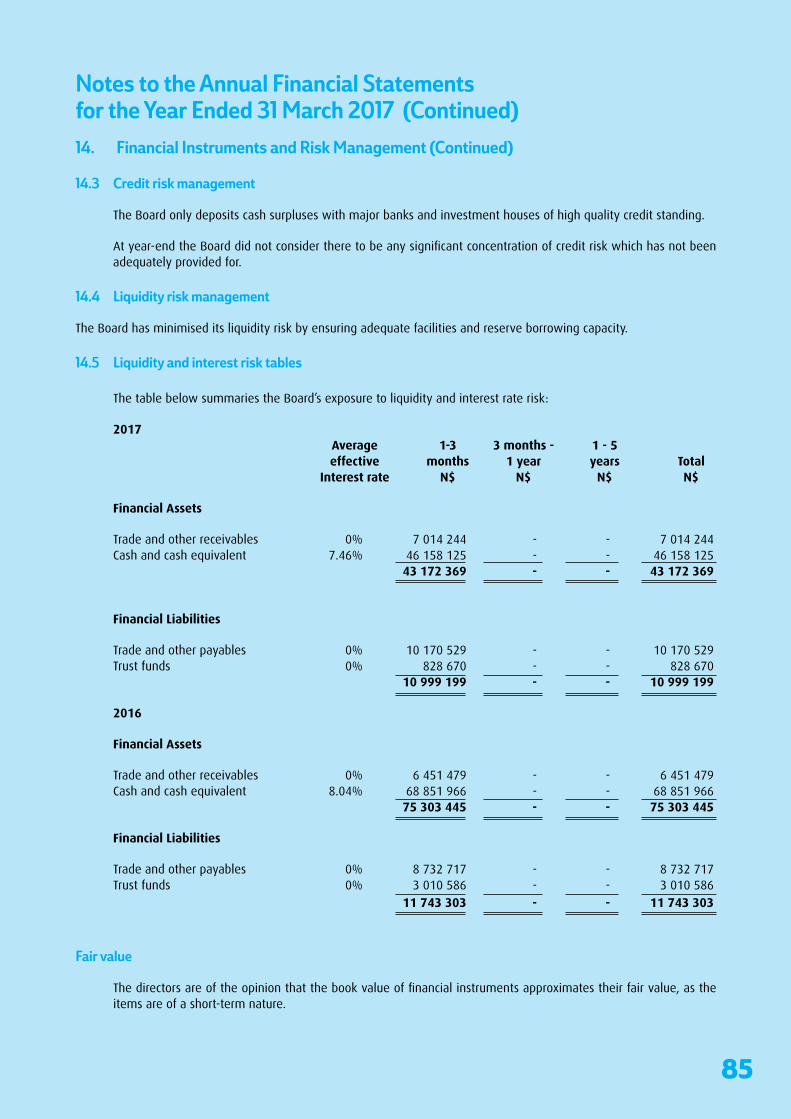
85 85
Notes to the Annual Financial Statementsfor the Year Ended 31 March 2017 (Continued) 14. Financial Instruments and Risk Management (Continued)
14.3 Credit risk management
The Board only deposits cash surpluses with major banks and investment houses of high quality credit standing.
Atyear-endtheBoarddidnotconsidertheretobeanysignificantconcentrationofcreditriskwhichhasnotbeenadequately provided for.
14.4 Liquidity risk management
The Board has minimised its liquidity risk by ensuring adequate facilities and reserve borrowing capacity.
14.5 Liquidity and interest risk tables
The table below summaries the Board’s exposure to liquidity and interest rate risk:
2017 Average 1-3 3 months - 1 - 5 effective months 1 year years Total Interest rate N$ N$ N$ N$
Financial Assets
Tradeandotherreceivables 0% 7 014244 - - 7 014244Cashandcashequivalent 7.46% 46 158125 - - 46 158125 43 172 369 - - 43 172 369 Financial Liabilities
Tradeandotherpayables 0% 10 170529 - - 10 170529Trust funds 0% 828 670 - - 828 670 10 999 199 - - 10 999 199
2016
Financial Assets
Tradeandotherreceivables 0% 6 451479 - - 6 451479Cashandcashequivalent 8.04% 68 851966 - - 68 851966 75 303 445 - - 75 303 445
Financial Liabilities
Tradeandotherpayables 0% 8 732717 - - 8 732717Trustfunds 0% 3 010586 - - 3 010586 11 743 303 - - 11 743 303
Fair value
Thedirectorsareoftheopinionthatthebookvalueoffinancialinstrumentsapproximatestheirfairvalue,astheitems are of a short-term nature.
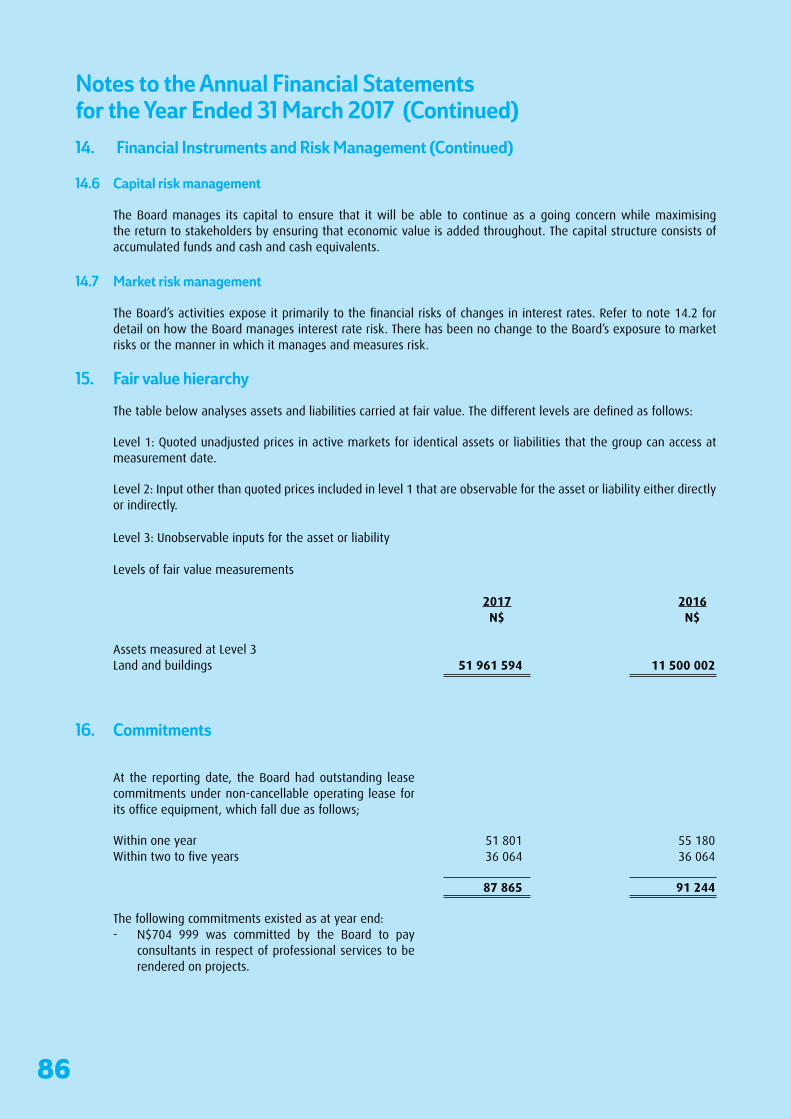
86
Notes to the Annual Financial Statementsfor the Year Ended 31 March 2017 (Continued) 14. Financial Instruments and Risk Management (Continued)
14.6 Capital risk management
The Board manages its capital to ensure that it will be able to continue as a going concern while maximising the return to stakeholders by ensuring that economic value is added throughout. The capital structure consists of accumulated funds and cash and cash equivalents.
14.7 Market risk management
TheBoard’sactivitiesexposeitprimarilytothefinancialrisksofchangesininterestrates.Refertonote14.2fordetail on how the Board manages interest rate risk. There has been no change to the Board’s exposure to market risks or the manner in which it manages and measures risk.
15. Fair value hierarchy
Thetablebelowanalysesassetsandliabilitiescarriedatfairvalue.Thedifferentlevelsaredefinedasfollows:
Level 1: Quoted unadjusted prices in active markets for identical assets or liabilities that the group can access at measurement date.
Level 2: Input other than quoted prices included in level 1 that are observable for the asset or liability either directly or indirectly.
Level3:Unobservableinputsfortheassetorliability
Levels of fair value measurements
2017 2016 N$ N$
Assets measured at Level 3 Land and buildings 51 961 594 11 500 002
16. Commitments
At the reporting date, the Board had outstanding lease commitments under non-cancellable operating lease for itsofficeequipment,whichfalldueasfollows;
Within one year 51 801 55 180 Withintwotofiveyears 36064 36064
87 865 91 244
The following commitments existed as at year end:- N$704 999 was committed by the Board to pay
consultants in respect of professional services to be rendered on projects.

87 87
Notes to the Annual Financial Statementsfor the Year Ended 31 March 2017 (Continued)17. Related Parties
2017 2016 N$ N$
The Board regards RERA, Government and other parastatals as related parties. The following were the transactions entered into during the year: Regional Electricity Regulator of Southern Africa (RERA) Subscription fees (membership) (719 509) (648 254)RERA (payable) 197 338 174 057NamPower(Levyincome) 71 241352 62 824165NamPower(receivable) (6 664 475) (5594 846)MinistryofMinesandEnergy(payable) 828670 3 010586 64 883 376 59 765 708
Compensation of key management personnel
Short-termbenefits 7 254333 7 355740 Post-employment 758 127 739 857 7 770 997 8 095 597
18. Reconciliation of Surplus Before Taxation to Cash Utilised by Operations
Surplusbeforetaxation 18 907456 10803502Adjusted for: (Gain)/Lossondisposaloffixedassets - (9981)Depreciation 2 295260 1 496335Interestreceived (4 292426) (5 028596) 16 910 290 7 261 260 Workingcapitalchanges 875047 (1 743019) Increase / (decrease) in trade and other receivables (562 765) (612 849)Increaseintradeandotherpayables 1 437811 (1 130 170)
CASH RECEIVED FROM OPERATIONS 17 785 337 5 518 241

88
Detailed Statement of Profit or Loss andother Comprehensive Incomefor the Year Ended 31 March 2017 2017 2016 N$ N$
INCOME Leviesreceived 71 417321 62 824165Licence fees 240 000 460 000Interestreceived 4 292426 5 028596Other income 603 494 67 808
TOTAL INCOME 76 553 241 68 380 569 EXPENDITuRE Advertising 1 041168 764618Audit fees - current year 128 148 173 896 - prior year 7 543 16 607Provisionfordoubtfuldebt (77 500) 92500Bank charges 107 052 46 168Bursaries 3 500 244 186Computer expenses 336 691 355 760Computer software expenses 268 098 135 893Conferenceandseminarexpenses 2 371018 2 068310Depreciation 2 295260 1 496335Members’ fees 469 477 559 391Donations 239 687 201 426Entertainment 351 396 475 752Foreign exchange losses 32 862 3 357Insurance 217 679 244 086Legal and professional fees 835 821 649 744Licences and permits 4 087 4 672Light, heat and water 243 669 286 265(Profit)/Lossondisposaloffixedassets - (9981)Maintenance 122 158 125 245Officeexpenses 213600 219597Postage and couriers 6 074 11 396Printing and stationary 489 896 563 293Projectcosts 4 717605 7 458876Recruitmentandstafftraining 1871911 2 659223Rent - equipment 77 626 71 300Rent-office 609626 559290Salariesandotherstaffcosts 37 944208 35 455566Staff welfare 171 356 84 163Security services 304 218 248 955Subscriptions 851752 1 121431Subsistence and travelling - staff members 816 761 516 443 - Board members 30 352 247 446Telephone and fax 307 403 298 332Vehicle expenses 235 583 127 526TOTAL EXPENDITURE 57 645 785 57 577 067SURLPUS for the year 18 907 456 10 803 502Othercomprehensiveincome - 5 559967TOTAL SURPLUS AND OTHER COMPREHENSIVE INCOME FOR THE YEAR 18 907 456 16 363 469