ANNUAL REPORT - Chicago Police Pension...
52
ANNUAL REPORT for the year ended December 31, 2009 P O L I C E P O L I C E — C I T Y O F C H I C A G O — I N C O R P O R A T E D 4 t h M A R C H 1 8 3 7
Transcript of ANNUAL REPORT - Chicago Police Pension...
ANNUAL REPORTfor the year ended December 31, 2009
P O L I C EP O L I C E
—CI
TYOF CHICAGO—
INCO
RP
O
RATED 4th MARCH
18
37
29527_Cover 9/10/10 2:59 PM Page 1

Robert F. ReuschePresident
Appointed member of theBoard since 1991. Retired as
Vice Chairman of the Board ofThe Northern Trust Company
in 1990 after 40 years withthe firm. Board member of
numerous civic organizationsincluding the Ohio State
University Foundation, ChicagoCommunity Trust, and Ravinia.
Michael J. LazzaroRecording Secretary
Elected to the Board inDecember 2005. Represents
Sergeants. A sworn member ofthe Chicago Police Department
since 1982. Promoted toSergeant in 1996.
Stephanie D. NeelyTreasurer
Appointed member of theBoard in December 2006.
Treasurer of the City of Chicago.Formerly Vice President, Global
Investments, The NorthernTrust Company. Received a
Master’s Degree in BusinessAdministration from the
University of Chicago anda Bachelor’s Degree in
Economics from Smith College.
Michael K. ShieldsTrustee
Elected member of the Boardin December 2008. RepresentsInvestigators, Patrolmen, and
equivalent ranks. Received aBachelor of Arts Degree from
DePaul University and aMaster’s Degree in Business
Administration from St. XavierUniversity. A sworn member ofthe Chicago Police Department
since 2000.
Kenneth A. HauserVice PresidentElected member of the Boardsince December 1993.Represents annuitants. Asworn member of the ChicagoPolice Department from 1968until 2005. President of theRetired Chicago PoliceAssociation and Board Memberof the Chicago Patrolman’sFederal Credit Union.
Gene R. SaffoldTrusteeAppointed member of theBoard in March 2009. ChiefFinancial Officer of the City ofChicago. Formerly ManagingDirector, National Accounts atJP Morgan Chase & Co andHead of Public FinanceInvestment Banking for JPMorgan Securities, Inc.
James P. MaloneyTrusteeElected member of the Boardin December 2005. RepresentsLieutenants, Captains, andsworn exempts. A swornmember of the Chicago PoliceDepartment since 1982.Received Masters’ Degrees inBusiness Administration andPublic Administration from theIllinois Institute of Technology.
Steven J. LuxTrusteeAppointed member of theBoard in March 2006.Comptroller of the City ofChicago. Formerly ManagingDeputy Comptroller of theCity of Chicago andAudit/Accounting Manager,Deloitte & Touche LLP.
Board of Directors
29527_Cover 10/4/10 4:47 PM Page 2
PROFESSIONAL STAFF
Executive Director Chief Investment Officer Comptroller Assistant ComptrollerJohn J. Gallagher, Jr. Samuel Kunz Regina M. Tuczak, CPA Pacifico V. Panaligan, CPA
INVESTMENT MANAGERS
ABR ChesapeakeAdams Street PartnersAetos Capital LLCAG RealtyApollo Real Estate AdvisorsAriel Capital ManagementArtisan PartnersAttucks Asset Management LLCCapital Guardian Trust Co.The Carlyle GroupChancellorChanning CapitalChicago Equity PartnersDearborn PartnersDeclaration ManagementDenali AdvisorsDRA Advisors LLCDV Urban RealtyEuropean Advisors Inc.Global Infrastructure PartnersGreat Lakes AdvisorsHarbourVest Partners, LLCHolland Capital ManagementING Clarion Real EstateInvesco Capital ManagementJP Morgan Asset ManagementK2 AdvisorsLM Capital GroupLone Star FundsMacquarie GroupMcKinley Capital ManagementMesirowMontag & CaldwellMorgan Stanley Real EstateMuller & MonroeNorthern Trust Global InvestmentsOaktree Capital ManagementPiedmont Investment AdvisorsPrudential Real EstateQuadrant Real Estate AdvisorsRCP AdvisorsShamrock-HostmarkTaplin, Canida, & HabachtUBS Global Asset ManagementWellington Management CompanyWells Capital ManagementWilliam Blair & Company
Table of Contents Page
Introductory Information........................................1
Executive Director Report.......................................2
Financial Statements.............................................11
Actuarial Information............................................32
Investment Information ........................................42
1
PROFESSIONAL CONSULTANTS
Legal Advisor
David R. Kugler, Esquire
Medical Advisor
Peter Orris, M.D.
Investment Consultants
Ennis, Knupp and AssociatesCourtland Partners, Ltd.
Consulting Actuary
Gabriel Roeder Smith & Co.
Auditor
Mitchell & Titus L.L.P.
Master Custodian
The Northern Trust Company
Commercial Bank
JP Morgan Chase Bank
29527_Body 10/4/10 4:45 PM Page 1
Retirement Board of the Policemen’s
Annuity and Benefit Fund of Chicago
Chicago, Illinois
Executive Director’s ReportJune 21, 2010
The Policemen's Annuity and Benefit Fund of Chicago (the Fund) hereby submits the annual report for the year endingDecember 31, 2009. The Fund accepts responsibility for the accuracy of the data and the completeness and fairness ofpresentation, including disclosures. To the best of our knowledge and belief, the enclosed data are accurate in all materialrespects and are reported in a manner designed to present fairly the financial position and results of operations of the Fund.All disclosures necessary to enable the reader to understand the Fund's financial activities have been included.
Any employee of the City of Chicago employed under the provisions of the municipal personnel ordinance as police serviceis covered by the Policemen's Annuity and Benefit Fund of Chicago. The Fund is governed under Illinois State Statutes(Chapter 40, Pension, Article 5, Illinois Compiled Statutes) and may be amended only by the Illinois Legislature.
The Fund was established in 1921 with the mission of providing retirement benefits to the members of the Chicago PoliceDepartment and their spouses. To properly execute this mission the Fund is administered by an eight (8) member Boardof Trustees. The Board is composed of four (4) elected members, with one elected from each rank of police officer, sergeant,lieutenant and above, and a member from the retired members and their widows. The Mayor of Chicago appoints fourmembers. The Retirement Board then elects a Board President, a Vice-President and a Recording Secretary from its ownmembership.
The Retirement Board is charged with many duties including: approval of all applications for benefits and annuities,investment of Fund monies in a manner prescribed by the State Statutes and Fund policy, adoption of rules and regulationsfor the proper conduct of the affairs of the Fund, an annual audit conducted by a certified public accountant certifyingfinancial results for each year and the filing of a detailed report of the affairs of the Fund to the State of Illinois Departmentof Insurance and the City of Chicago each year. A summary of plan provisions adopted by the Retirement Board arepresented as part of this Annual Report.
This report presents the financial activities of the Fund and includes 4 areas of information:
1. INTRODUCTORY — Contains the table of contents, this transmittal letter, a listing of the Retirement Board membersand office staff members, a listing of professional consultants, the Fund's organizational chart and a summary of planprovisions;
2. FINANCIAL — Contains the report of the independent auditors, management discussion and analysis, the financialstatements and accompanying notes, required supplementary information and supporting schedules of the Fund;
3. ACTUARIAL — Contains the report of the Fund's actuary with supporting actuarial assumptions, schedules and tables;
4. INVESTMENT — Reports on activity, policy, results, allocation, fees and commissions and includes an investmentsummary.
2
29527_Body 10/4/10 4:45 PM Page 2
Financial Information
The management of the Fund is responsible for establishing and maintaining an internal control structure designed to ensurethe safety of the Fund's assets from loss, theft or misuse and to ensure that adequate accounting data are compiled to allowfor the preparation of financial statements that conform to generally accepted accounting principles. The internal controlsystem is included in the auditor's review and is designed to provide reasonable, but not absolute, assurance that theseobjectives are being met. The concept of reasonable assurance recognizes that: (1) the cost of a control should not exceed thebenefits likely to be derived; and (2) the valuation of costs and benefits requires estimates and judgments by management.
Users of this report are strongly encouraged to review the Management’s Discussion and Analysis portion of the FinancialSection in order to obtain a more complete understanding of the Fund’s financial condition and activity.
Investment Performance and Policy
The Fund relies heavily upon the performance of its assets to fund benefits (augmented by both employer and employeecontributions). The severe dislocation created by market conditions has drastically reduced the performance of those assets.The impact of the sub-prime mortgage collapse on U.S. Equity markets in late 2007 preceded an overall economic collapsein 2008. 2008 saw the U.S. stock market suffering its worst year since the Great Depression with equity prices dropping anaverage of -37.2%. Global equity markets rebounded in 2009 which resulted in the Fund achieving a return of 21.5% for2009, with domestic and foreign equities being the two largest contributors. Domestic equity for the Fund returned 32.9%for the Fund while international equities returned 40.1%. Fixed income also delivered a positive return of 11.7%. TotalFund return compared very favorably with its positive portfolio performance throughout this past year. Investable marketsin 2009 and into 2010 remain volatile and credit dislocations continue to be a threat to a global economic recovery. While2009 was an impressive year on an absolute basis relative to losses endured in 2008, the Fund realizes it will take manyyears for assets to recover to levels seen in 2007 and is proceeding in a prudent manner.
47 professional investment management firms managed the investment portfolio at year-end 2009. These firms makeinvestment decisions under the Prudent Person Rule authorized by state statutes and the investment policy guidelinesadopted by the Board of Trustees. The Board also employs two investment consultants to monitor investment performance,to aid in the selection of investment management firms, and to assist in the development of investment policy.
Economic Condition and Outlook
Although the collapse in market prices has reduced the value of Fund net assets from $4.3 billion as of year-end 2007 to$3.3 billion as of year-end 2009, the Board of Directors and the Fund’s investment consultants feel that the Fund issufficiently structured and diversified to sustain prevailing market conditions. The Fund is undergoing a restructuringeffort towards greater allocation to alternative investments (Private equity, real estate, infrastructure, hedge fund-of-funds,and other opportunistic vehicles) which the Fund’s Board of Trustees and investment advisors feel constitutes a soundstrategy that should be continued despite intermittent market dislocations and volatility.
Current market conditions constitute an anomaly rarely seen in the history of the Fund since inception. The Fund needs asustained recovery in the market value of its assets in order to meet its future obligations to its annuitants. The paramountobjective of the Fund is to meet its long-term defined pension benefit obligations. The funding ratio of the Fund on a marketvalue basis declined substantially in 2008 and the Fund is clearly not alone among employee benefit plans in this occurrence.
Funding Status
The actuarial value of assets at year-end 2009, using the GASB 25 and 43 methods, was $3.88 billion with a correspondingactuarial liability of $8.90 billion. The GASB 25 actuarial liability increased approximately $250 million, up from $8.65billion total in 2008. Fund assets currently fund 43.65% of this liability, decreasing from a funded ratio of 47.31% in 2008.The decrease in the funded ratio largely resulted from the collapse of U.S. and global financial markets in 2008. Under GASB25 the Fund smoothes its investment returns over a five year period. As more of the losses from 2008 are recognized, thefunded ratio will continue to decrease. It should also be noted that there has been no increase in the employer contributionrequirement (tax multiplier) since 1982 when the rate was increased from 1.97 to 2.00 times the employee contributionsreceived two years prior.
The Budget Process
The Fund's budget is prepared through a process that originated in 1975. At that time, a budget for only the Fund'sadministrative expenses was prepared and approved. The 1990 budget was expanded to include all revenue and expensecategories, including employer and employee contributions, investment income, annuity, death, and disability benefit
3
29527_Body 9/13/10 7:45 AM Page 3

expenses. The 2009 budget process builds from recent years' strengths and includes additional charts and graphs. Policiesand procedures have remained substantially consistent with those of the prior year, with the exception that the ideas fornew projects were sought beginning in July. The current fiscal planning and budgeting process then formally begins in Julyand ends in December with the approval by the Board of Trustees.
Public Pensions Commission
Late in 2007, the Mayor of the City of Chicago announced the formation of a special commission to propose ways to improvethe financial strength of the City’s four pension funds. The Police Pension Fund has been experiencing a drag on its fundingprogress from the impact that negative cash flows have on long-term investment returns. Negative cash flow occurs whenemployee and employer contributions are not sufficient enough to offset total annual benefit expenses, requiring the Fundto tap into its investment portfolio to assist in paying benefits when due.
The executive directors from each of the four city pension funds served on this Mayoral commission as well as an elected trusteerepresenting each pension fund. Several union-appointed representatives and private-sector business leaders also served on theCommission. The Commission issued its report in 2010 and a copy is available on the Fund’s website at www.chipabf.org.
Major Initiatives
The Fund will continue to strive for customer service excellence by improving the operational efficiencies and servicedelivery to the membership. In August of 2007, the Board approved the hiring of a consultant to develop a new pensionaccounting and administration system which will significantly improve our ability to better serve our active and retiredparticipants. The new system became fully operational in 2009. The Fund will add enhancements to this system in 2010,one of which will be an online estimate program for members. We have also joined with several other local public pensionfunds in establishing a disaster recovery center.
Professional Services
The Fund's actuarial services are provided by Gabriel, Roeder, Smith & Company. The annual audit was conducted byMitchell & Titus LLP, Certified Public Accountants. The Fund’s primary investment consultant is Ennis, Knupp, andAssociates. In 2006, the Fund hired Courtland Partners, Ltd. as an additional consultant specializing in real estateinvestment. A complete listing of all investment managers is detailed in this Annual Report introductory section.
Awards
The Government Finance Officers Association of the United States and Canada (GFOA) awarded a Certificate of Achievementfor Excellence in Financial Reporting for the year ended December 31, 2008. The Certificate of Achievement is a prestigiousnational award recognizing conformance with the highest standards for preparation of state and local government financialreports and the Fund has received the certificate for 18 out of the past 19 years.
In order to be awarded a Certificate of Achievement, a government unit must publish an easily readable and efficientlyorganized comprehensive annual financial report. This report must satisfy both generally accepted accounting principlesand applicable legal requirements.
A Certificate of Achievement is valid for a period of one year only. We believe that our current comprehensive annualfinancial report continues to meet the Certificate of Achievement Program’s requirements and we are submitting it toGFOA to determine its eligibility for another certificate.
Acknowledgments
On behalf of the Board of Trustees, I wish to express appreciation to the staff and professional consultants who work soeffectively to ensure the continued successful operation of the Fund. It is an honor and a privilege to serve the men andwomen of the Chicago Police Department and the City of Chicago. I extend my appreciation to all Fund participants fortheir interest and involvement in all plan activities. With our new pension administration system, we will be better able toserve you going forward and, as always, welcome your comments or suggestions.
Respectfully submitted,
John J. Gallagher, Jr.Executive Director
4
29527_Body 9/13/10 7:46 AM Page 4

Mitchell & Titus LLP Phone: (312) 332-4964 333 West Wacker Drive Fax: (312) 332-0181 Chicago, IL 60606 www.mitchelltitus.com
REPORT OF INDEPENDENT AUDITORS
Board of Trustees Policemen’s Annuity and Benefit Fund of Chicago We have audited the accompanying statement of plan net assets of the Policemen’s Annuity and Benefit Fund of Chicago (the Fund) as of December 31, 2009 and 2008, and the related statement of changes in plan net assets for the years then ended. These financial statements are the responsibility of the Fund’s management. Our responsibility is to express an opinion on these financial statements based on our audits.
We conducted our audits in accordance with auditing standards generally accepted in the United States. Those standards require that we plan and perform the audit to obtain reasonable assurance about whether the financial statements are free of material misstatement. An audit includes consideration of internal control over financial reporting as a basis for designing audit procedures that are appropriate in the circumstances, but not for the purpose of expressing an opinion on the effectiveness of the Fund’s internal control over financial reporting. Accordingly, we express no such opinion. An audit also includes examining, on a test basis, evidence supporting the amounts and disclosures in the financial statements, assessing the accounting principles used and significant estimates made by management, as well as evaluating the overall financial statement presentation. We believe that our audits provide a reasonable basis for our opinion. In our opinion, the financial statements referred to above present fairly, in all material respects, the plan net assets of the Policemen’s Annuity and Benefit Fund of Chicago as of December 31, 2009 and 2008, and the changes in plan net assets for the years then ended in conformity with accounting principles generally accepted in the United States.
The accompanying management’s discussion and analysis and the required supplementary information as listed in the table of contents are not a required part of the basic financial statements but are supplementary information required by the Governmental Accounting Standards Board (GASB). We have applied certain limited procedures, which consisted principally of inquiries of management regarding the methods of measurement and presentation of the supplementary information. However, we did not audit the information and we express no opinion on it.
Our audit was conducted for the purpose of forming an opinion on the basic financial statements taken as a whole. The other supplementary schedules of administrative expenses, consulting costs, and investment fees are presented for the purpose of additional analysis and are not a required part of the basic financial statements. These other supplementary schedules have been subjected to the auditing procedures applied in the audit of the basic financial statements and, in our opinion, are fairly stated in all material respects in relation to the basic financial statements taken as a whole.
June 18, 2010
5
29527_Body 9/13/10 7:47 AM Page 5
6
Management’s Discussion and Analysis
The Management’s Discussion and Analysis section of this report is intended to serve as an introduction to the financialstatements of the Policemen’s Annuity and Benefit Fund of Chicago (the Fund) and to supplement the informationcontained therein.
Overview of Financial Statements and Accompanying Information
The basic financial statements are prepared in accordance with generally accepted accounting principles as established bythe Governmental Accounting Standards Board (GASB) and are described below:
• The Statements of Plan Net Assets report the Fund’s assets, liabilities, and the resultant net assets where assetsminus liabilities equal net assets available at the end of the year.
• The Statements of Changes in Plan Net Assets show the sources and uses of funds during the calendar year, whereadditions minus deductions equal the net increase (or decrease) in net assets available for the year.
• The Notes to the Financial Statements are an integral part of the financial statements and include importantinformation and schedules to provide a better understanding of the data provided in the financial statements.Information contained in the note disclosures includes the Fund’s accounting policies, benefits, contributions,investments, fund reserves, and various other relevant topics.
• Required Supplementary Information presents detailed required historical information and is presented after theNotes to the Financial Statements. This supplementary information includes data on funding progress and employercontributions, along with other information useful in evaluating the financial condition of the Fund.
Financial Highlights
• The net assets of the Fund increased by $325 million, or 10.8%, to $3.326 billion during 2009; increasing from $3.001billion at December 31, 2008.
• Fund investments earned, prior to consideration of investment-related expenses, approximately $576 million during2009 compared to a loss of approximately ($1,093) million during 2008. The positive return reflects the improvementin global capital markets, which delivered positive returns, as economic indicators hinted at stabilization. The mainpositive contributors to absolute performance were U.S. and International Equity. On a relative basis, U.S. Equity, FixedIncome, and to a lesser extent Real Estate compared favorably to their respective benchmarks. Private Equity was theweakest performer in the investment asset allocation, with negative returns on both a relative and absolute basis.
• The Fund received contributions of $95.6 million from members and $180.5 million from the City of Chicago in 2009,compared to contributions of $93.2 million from members and $181.5 million from the City of Chicago in 2008. Thenumber of active members declined by 1.6% from 2008 to 2009; however, active member purchases of prior servicecredit from prior law enforcement positions resulted in an increase in member contributions in 2009. Employercontributions from the City of Chicago decreased by 0.6%. Employer contributions are mandated by a statutorily setmultiplier of 2.0 times member contributions collected two years prior. The reduction in contributions is due to aspecial receipt of proceeds from a bond sale conducted by the City of Chicago, which was included in 2008contributions. Such contributions were in addition to the statutory requirement. Thus, although active membershipincreased two years prior, employer contributions declined from 2008 to 2009.
• Investment Activity Expenses declined by approximately $1.7 million in 2009, from $11.5 million in 2008 to $9.8million in 2009. The Fund’s investment management fees are based on the fair value of those assets. This decline of14.8% was primarily the result of a lower level of assets under management by active managers, due to thedeterioration of the financial global markets in 2008.
• Benefit payments, excluding death benefits and refunds, increased by approximately $17.1 million in 2009, from $489.8million in 2008 to $506.9 million in 2009. Although benefit payments increased, the number of retirees andbeneficiaries receiving benefit payments actually declined by .2%. The increase in benefit payments is due to annualcost of living increases provided to retirees born prior to January 1, 1955. Death benefits and refunds of employeedeductions remained consistent from 2008 to 2009 and accounted for approximately $7.9 million of benefit paymentsin each year.
29527_Body 9/13/10 7:48 AM Page 6
• Administrative expenses increased by approximately $.15 million, or 3.6%, from $4.154 million in 2008 to $4.304million in 2009. The increased administrative expense is primarily due to increased consulting fees related to actuarial,medical, and legal services. Additionally, health insurance expense for the Fund’s staff increased by $.102 millionduring 2009, due to rising premium costs.
• The funding objective of the Fund is to meet its long-term defined pension benefit obligations. The funding ratio of theFund on a fair value basis experienced an insignificant increase, from 34.7% at December 31, 2008 to 37.4% atDecember 31, 2009.
• Under Government Accounting Standard Board (GASB) numbers 25 and 43, the Fund uses a five-year actuarialsmoothing method in valuing its assets to determine its funded status and the contributions required to fund the plangoing forward. This actuarial valuation method reduces the effect of short-term market volatility and provides a morestable trend valuation for the Fund’s long-term planning needs. The funding ratio of the Fund using an actuarial valueof assets experienced an insignificant decrease, from 47.3% at December 31, 2008 to 43.7% at December 31, 2009.
• In compliance with GASB No. 45, the Fund recognizes a liability for other post-employment benefits (OPEB), whichrepresent health insurance coverage for active and retired employees of the Fund. This obligation was first accrued asan expense in the 2008 financial statements in the amount of $344,600 at December 31, 2008; expense of $173,600 wasrecognized in 2009, resulting in a total accrued liability of $518,200 as of December 31, 2009.
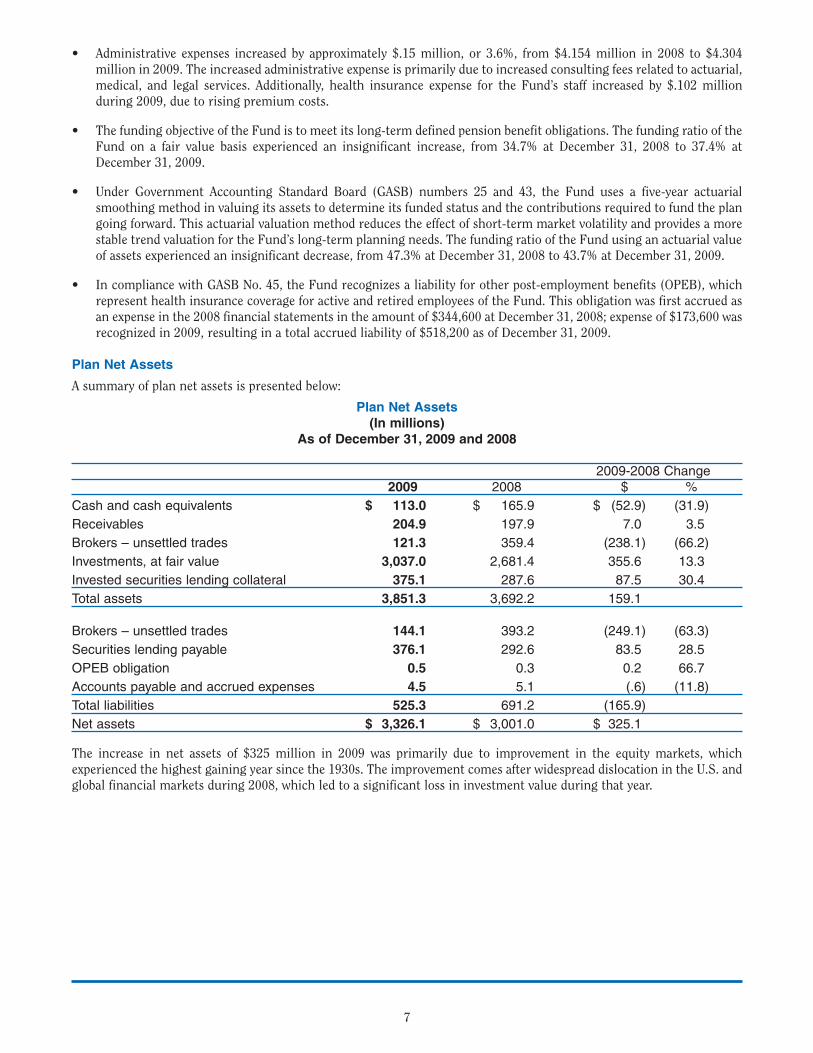
Plan Net Assets
A summary of plan net assets is presented below:
Plan Net Assets(In millions)
As of December 31, 2009 and 2008
2009-2008 Change2009 2008 $ %
Cash and cash equivalents $ 113.0 $ 165.9 $ (52.9) (31.9)
Receivables 204.9 197.9 7.0 3.5
Brokers – unsettled trades 121.3 359.4 (238.1) (66.2)
Investments, at fair value 3,037.0 2,681.4 355.6 13.3
Invested securities lending collateral 375.1 287.6 87.5 30.4
Total assets 3,851.3 3,692.2 159.1
Brokers – unsettled trades 144.1 393.2 (249.1) (63.3)
Securities lending payable 376.1 292.6 83.5 28.5
OPEB obligation 0.5 0.3 0.2 66.7
Accounts payable and accrued expenses 4.5 5.1 (.6) (11.8)
Total liabilities 525.3 691.2 (165.9)
Net assets $ 3,326.1 $ 3,001.0 $ 325.1
The increase in net assets of $325 million in 2009 was primarily due to improvement in the equity markets, whichexperienced the highest gaining year since the 1930s. The improvement comes after widespread dislocation in the U.S. andglobal financial markets during 2008, which led to a significant loss in investment value during that year.
7
29527_Body 9/14/10 2:34 PM Page 7
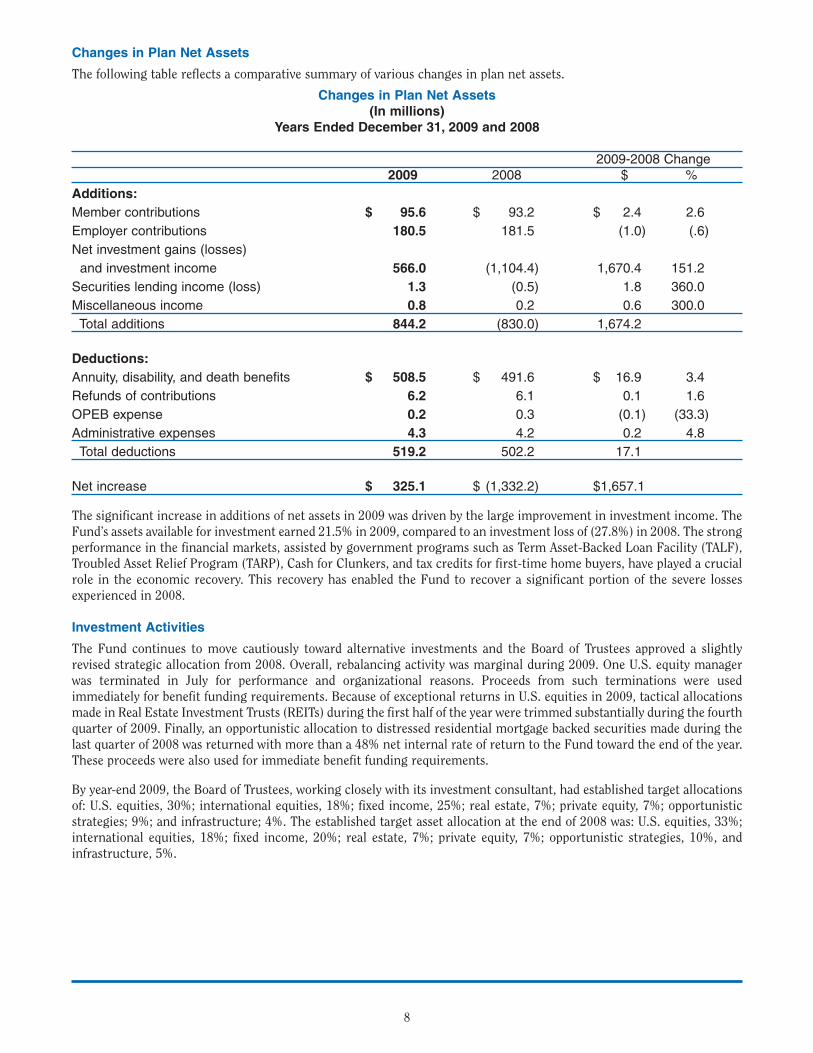
Changes in Plan Net Assets
The following table reflects a comparative summary of various changes in plan net assets.
Changes in Plan Net Assets(In millions)
Years Ended December 31, 2009 and 2008
2009-2008 Change2009 2008 $ %
Additions:
Member contributions $ 95.6 $ 93.2 $ 2.4 2.6
Employer contributions 180.5 181.5 (1.0) (.6)
Net investment gains (losses)
and investment income 566.0 (1,104.4) 1,670.4 151.2
Securities lending income (loss) 1.3 (0.5) 1.8 360.0
Miscellaneous income 0.8 0.2 0.6 300.0
Total additions 844.2 (830.0) 1,674.2
Deductions:
Annuity, disability, and death benefits $ 508.5 $ 491.6 $ 16.9 3.4
Refunds of contributions 6.2 6.1 0.1 1.6
OPEB expense 0.2 0.3 (0.1) (33.3)
Administrative expenses 4.3 4.2 0.2 4.8
Total deductions 519.2 502.2 17.1
Net increase $ 325.1 $ (1,332.2) $1,657.1
The significant increase in additions of net assets in 2009 was driven by the large improvement in investment income. TheFund’s assets available for investment earned 21.5% in 2009, compared to an investment loss of (27.8%) in 2008. The strongperformance in the financial markets, assisted by government programs such as Term Asset-Backed Loan Facility (TALF),Troubled Asset Relief Program (TARP), Cash for Clunkers, and tax credits for first-time home buyers, have played a crucialrole in the economic recovery. This recovery has enabled the Fund to recover a significant portion of the severe lossesexperienced in 2008.
Investment Activities
The Fund continues to move cautiously toward alternative investments and the Board of Trustees approved a slightlyrevised strategic allocation from 2008. Overall, rebalancing activity was marginal during 2009. One U.S. equity managerwas terminated in July for performance and organizational reasons. Proceeds from such terminations were usedimmediately for benefit funding requirements. Because of exceptional returns in U.S. equities in 2009, tactical allocationsmade in Real Estate Investment Trusts (REITs) during the first half of the year were trimmed substantially during the fourthquarter of 2009. Finally, an opportunistic allocation to distressed residential mortgage backed securities made during thelast quarter of 2008 was returned with more than a 48% net internal rate of return to the Fund toward the end of the year.These proceeds were also used for immediate benefit funding requirements.
By year-end 2009, the Board of Trustees, working closely with its investment consultant, had established target allocationsof: U.S. equities, 30%; international equities, 18%; fixed income, 25%; real estate, 7%; private equity, 7%; opportunisticstrategies; 9%; and infrastructure; 4%. The established target asset allocation at the end of 2008 was: U.S. equities, 33%;international equities, 18%; fixed income, 20%; real estate, 7%; private equity, 7%; opportunistic strategies, 10%, andinfrastructure, 5%.
8
29527_Body 9/13/10 7:49 AM Page 8
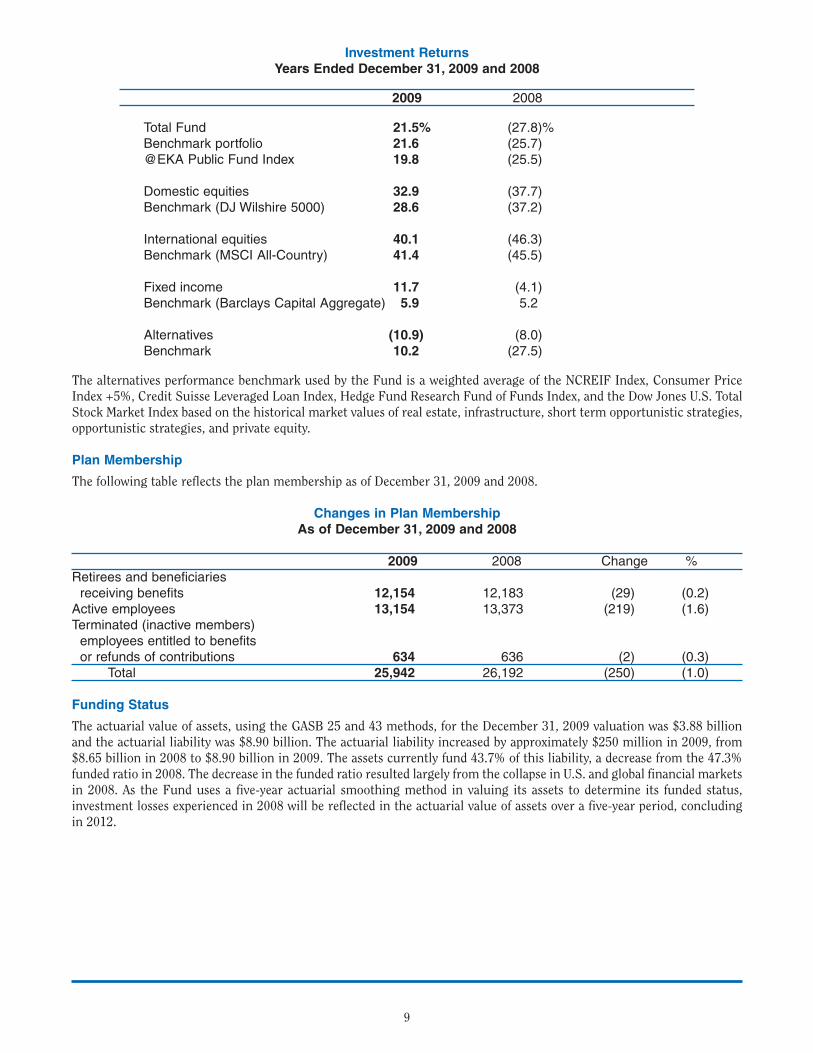
Investment ReturnsYears Ended December 31, 2009 and 2008
2009 2008
Total Fund 21.5% (27.8)%Benchmark portfolio 21.6 (25.7)@EKA Public Fund Index 19.8 (25.5)
Domestic equities 32.9 (37.7)Benchmark (DJ Wilshire 5000) 28.6 (37.2)
International equities 40.1 (46.3)Benchmark (MSCI All-Country) 41.4 (45.5)
Fixed income 11.7 (4.1)Benchmark (Barclays Capital Aggregate) 5.9 5.2
Alternatives (10.9) (8.0)Benchmark 10.2 (27.5)
The alternatives performance benchmark used by the Fund is a weighted average of the NCREIF Index, Consumer PriceIndex +5%, Credit Suisse Leveraged Loan Index, Hedge Fund Research Fund of Funds Index, and the Dow Jones U.S. TotalStock Market Index based on the historical market values of real estate, infrastructure, short term opportunistic strategies,opportunistic strategies, and private equity.
Plan Membership
The following table reflects the plan membership as of December 31, 2009 and 2008.
Changes in Plan MembershipAs of December 31, 2009 and 2008
2009 2008 Change %Retirees and beneficiaries
receiving benefits 12,154 12,183 (29) (0.2)Active employees 13,154 13,373 (219) (1.6)Terminated (inactive members)
employees entitled to benefitsor refunds of contributions 634 636 (2) (0.3)
Total 25,942 26,192 (250) (1.0)
Funding Status
The actuarial value of assets, using the GASB 25 and 43 methods, for the December 31, 2009 valuation was $3.88 billionand the actuarial liability was $8.90 billion. The actuarial liability increased by approximately $250 million in 2009, from$8.65 billion in 2008 to $8.90 billion in 2009. The assets currently fund 43.7% of this liability, a decrease from the 47.3%funded ratio in 2008. The decrease in the funded ratio resulted largely from the collapse in U.S. and global financial marketsin 2008. As the Fund uses a five-year actuarial smoothing method in valuing its assets to determine its funded status,investment losses experienced in 2008 will be reflected in the actuarial value of assets over a five-year period, concludingin 2012.
9
29527_Body 9/13/10 7:49 AM Page 9

The Board of Trustees is very concerned with the funded level of actuarial liabilities. The unfunded accrued actuarialliability for pension benefits and for the health insurance supplement increased from 2008 to 2009. Additionally, the annualrequired contribution for these benefits, as computed under GASB 25 and 43, was not reached in 2009 or 2008. However,the Board has taken steps to ensure a sufficient level of liquidity within the portfolio to fund monthly benefits, whilepursuing its long-term goal of maximum investment performance.
Contact Information
This financial report is designed to provide the employer, plan participants, and others with a general overview of the Fund’sfinances and to show accountability for the monies received. Questions concerning any data provided in this report can besubmitted to:
Mr. John J. Gallagher, Jr. Executive Director
Policemen’s Annuity and BenefitFund of Chicago221 N. LaSalle
Suite 1626Chicago, IL 60601
10
29527_Body 9/13/10 7:49 AM Page 10
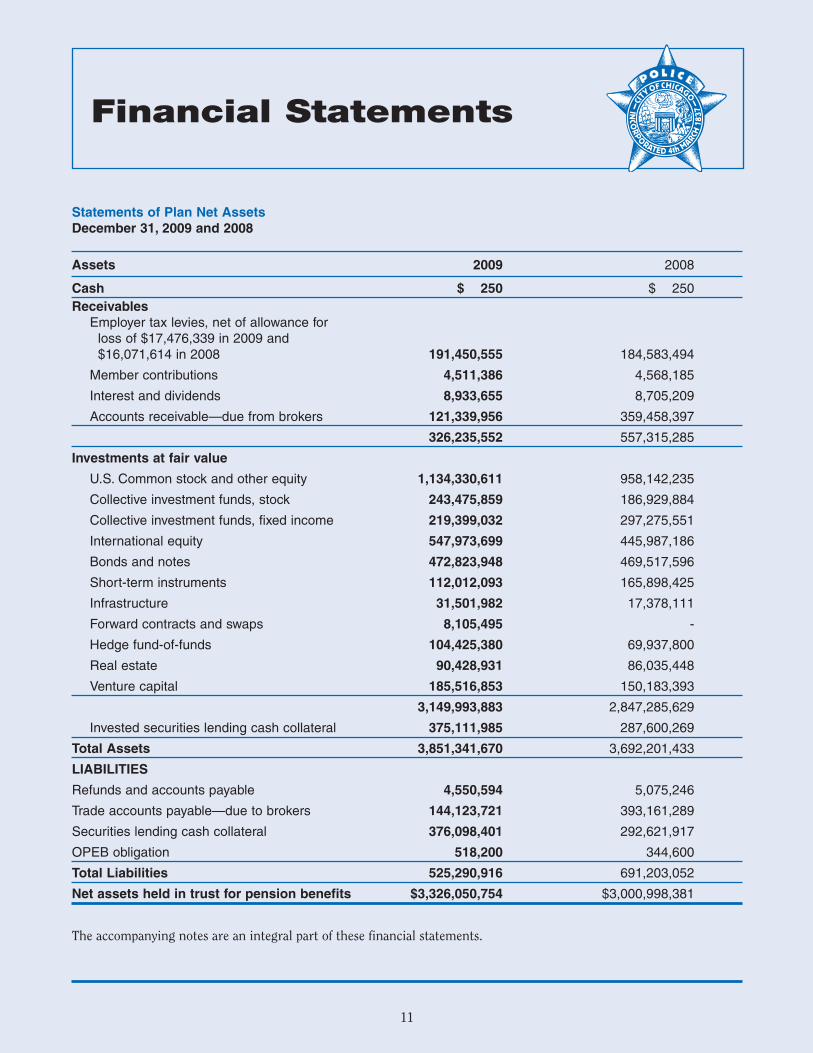
Statements of Plan Net AssetsDecember 31, 2009 and 2008
Assets 2009 2008
Cash $ 250 $ 250
ReceivablesEmployer tax levies, net of allowance for
loss of $17,476,339 in 2009 and $16,071,614 in 2008 191,450,555 184,583,494
Member contributions 4,511,386 4,568,185
Interest and dividends 8,933,655 8,705,209
Accounts receivable—due from brokers 121,339,956 359,458,397
326,235,552 557,315,285
Investments at fair value
U.S. Common stock and other equity 1,134,330,611 958,142,235
Collective investment funds, stock 243,475,859 186,929,884
Collective investment funds, fixed income 219,399,032 297,275,551
International equity 547,973,699 445,987,186
Bonds and notes 472,823,948 469,517,596
Short-term instruments 112,012,093 165,898,425
Infrastructure 31,501,982 17,378,111
Forward contracts and swaps 8,105,495 -
Hedge fund-of-funds 104,425,380 69,937,800
Real estate 90,428,931 86,035,448
Venture capital 185,516,853 150,183,393
3,149,993,883 2,847,285,629
Invested securities lending cash collateral 375,111,985 287,600,269
Total Assets 3,851,341,670 3,692,201,433
LIABILITIES
Refunds and accounts payable 4,550,594 5,075,246
Trade accounts payable—due to brokers 144,123,721 393,161,289
Securities lending cash collateral 376,098,401 292,621,917
OPEB obligation 518,200 344,600
Total Liabilities 525,290,916 691,203,052
Net assets held in trust for pension benefits $3,326,050,754 $3,000,998,381
The accompanying notes are an integral part of these financial statements.
11
Financial Statements
29527_Body 10/1/10 9:16 AM Page 11
12
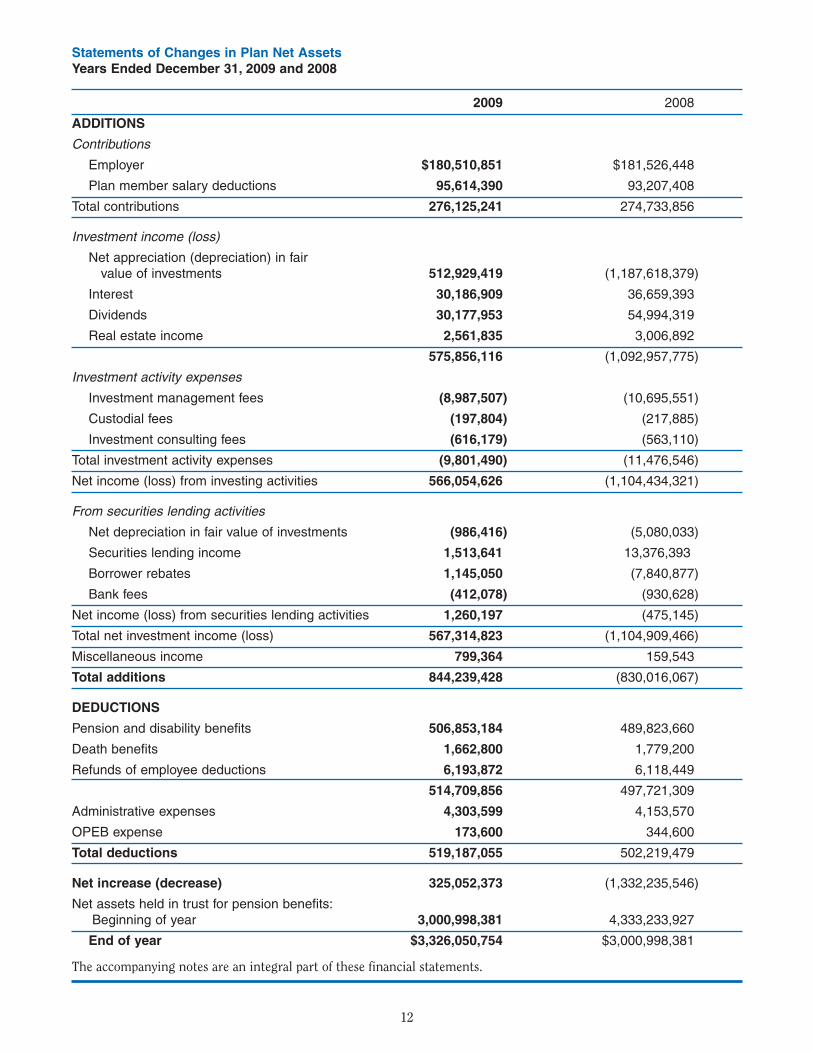
Statements of Changes in Plan Net AssetsYears Ended December 31, 2009 and 2008
2009 2008
ADDITIONS
Contributions
Employer $180,510,851 $181,526,448
Plan member salary deductions 95,614,390 93,207,408
Total contributions 276,125,241 274,733,856
Investment income (loss)
Net appreciation (depreciation) in fair value of investments 512,929,419 (1,187,618,379)
Interest 30,186,909 36,659,393
Dividends 30,177,953 54,994,319
Real estate income 2,561,835 3,006,892
575,856,116 (1,092,957,775)
Investment activity expenses
Investment management fees (8,987,507) (10,695,551)
Custodial fees (197,804) (217,885)
Investment consulting fees (616,179) (563,110)
Total investment activity expenses (9,801,490) (11,476,546)
Net income (loss) from investing activities 566,054,626 (1,104,434,321)
From securities lending activities
Net depreciation in fair value of investments (986,416) (5,080,033)
Securities lending income 1,513,641 13,376,393
Borrower rebates 1,145,050 (7,840,877)
Bank fees (412,078) (930,628)
Net income (loss) from securities lending activities 1,260,197 (475,145)
Total net investment income (loss) 567,314,823 (1,104,909,466)
Miscellaneous income 799,364 159,543
Total additions 844,239,428 (830,016,067)
DEDUCTIONS
Pension and disability benefits 506,853,184 489,823,660
Death benefits 1,662,800 1,779,200
Refunds of employee deductions 6,193,872 6,118,449
514,709,856 497,721,309
Administrative expenses 4,303,599 4,153,570
OPEB expense 173,600 344,600
Total deductions 519,187,055 502,219,479
Net increase (decrease) 325,052,373 (1,332,235,546)
Net assets held in trust for pension benefits:
Beginning of year 3,000,998,381 4,333,233,927
End of year $3,326,050,754 $3,000,998,381
The accompanying notes are an integral part of these financial statements.
29527_Body 9/14/10 2:35 PM Page 12
13
Notes to Financial StatementsYears Ended December 31, 2009 and 2008
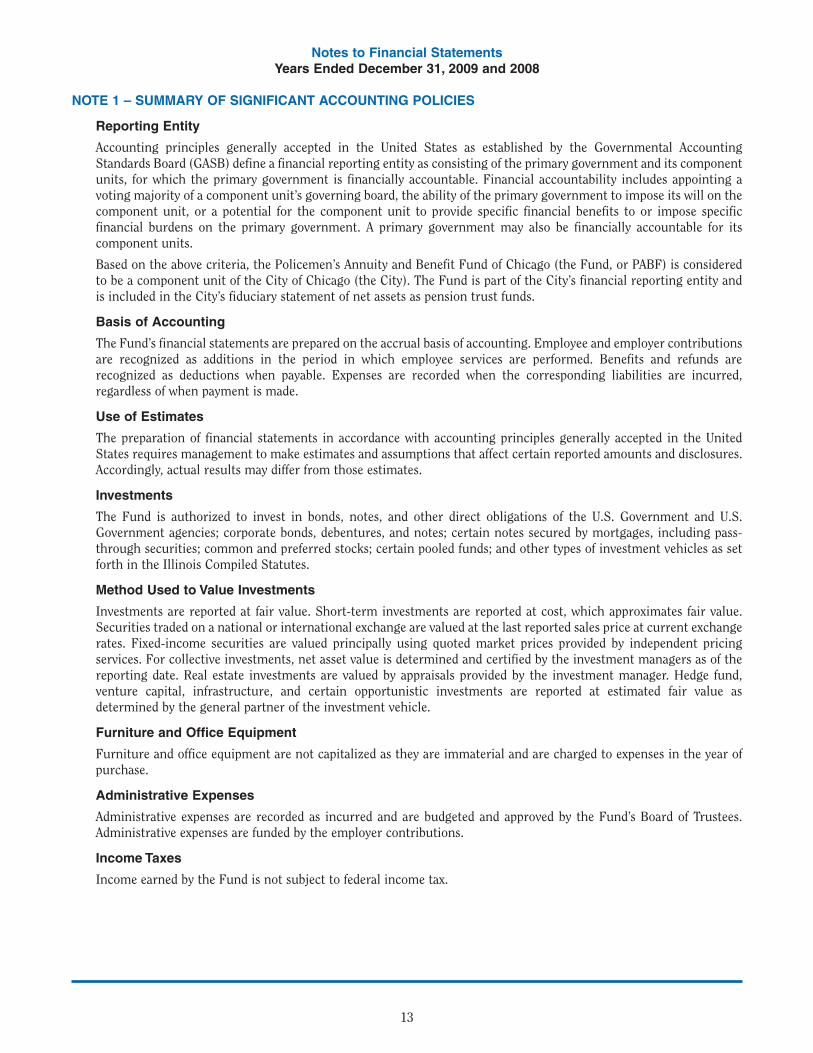
NOTE 1 – SUMMARY OF SIGNIFICANT ACCOUNTING POLICIES
Reporting Entity
Accounting principles generally accepted in the United States as established by the Governmental AccountingStandards Board (GASB) define a financial reporting entity as consisting of the primary government and its componentunits, for which the primary government is financially accountable. Financial accountability includes appointing avoting majority of a component unit’s governing board, the ability of the primary government to impose its will on thecomponent unit, or a potential for the component unit to provide specific financial benefits to or impose specificfinancial burdens on the primary government. A primary government may also be financially accountable for itscomponent units.
Based on the above criteria, the Policemen’s Annuity and Benefit Fund of Chicago (the Fund, or PABF) is consideredto be a component unit of the City of Chicago (the City). The Fund is part of the City’s financial reporting entity andis included in the City’s fiduciary statement of net assets as pension trust funds.
Basis of Accounting
The Fund’s financial statements are prepared on the accrual basis of accounting. Employee and employer contributionsare recognized as additions in the period in which employee services are performed. Benefits and refunds arerecognized as deductions when payable. Expenses are recorded when the corresponding liabilities are incurred,regardless of when payment is made.
Use of Estimates
The preparation of financial statements in accordance with accounting principles generally accepted in the UnitedStates requires management to make estimates and assumptions that affect certain reported amounts and disclosures.Accordingly, actual results may differ from those estimates.
Investments
The Fund is authorized to invest in bonds, notes, and other direct obligations of the U.S. Government and U.S.Government agencies; corporate bonds, debentures, and notes; certain notes secured by mortgages, including pass-through securities; common and preferred stocks; certain pooled funds; and other types of investment vehicles as setforth in the Illinois Compiled Statutes.
Method Used to Value Investments
Investments are reported at fair value. Short-term investments are reported at cost, which approximates fair value.Securities traded on a national or international exchange are valued at the last reported sales price at current exchangerates. Fixed-income securities are valued principally using quoted market prices provided by independent pricingservices. For collective investments, net asset value is determined and certified by the investment managers as of thereporting date. Real estate investments are valued by appraisals provided by the investment manager. Hedge fund,venture capital, infrastructure, and certain opportunistic investments are reported at estimated fair value asdetermined by the general partner of the investment vehicle.
Furniture and Office Equipment
Furniture and office equipment are not capitalized as they are immaterial and are charged to expenses in the year ofpurchase.
Administrative Expenses
Administrative expenses are recorded as incurred and are budgeted and approved by the Fund’s Board of Trustees.Administrative expenses are funded by the employer contributions.
Income Taxes
Income earned by the Fund is not subject to federal income tax.
29527_Body 9/13/10 7:53 AM Page 13
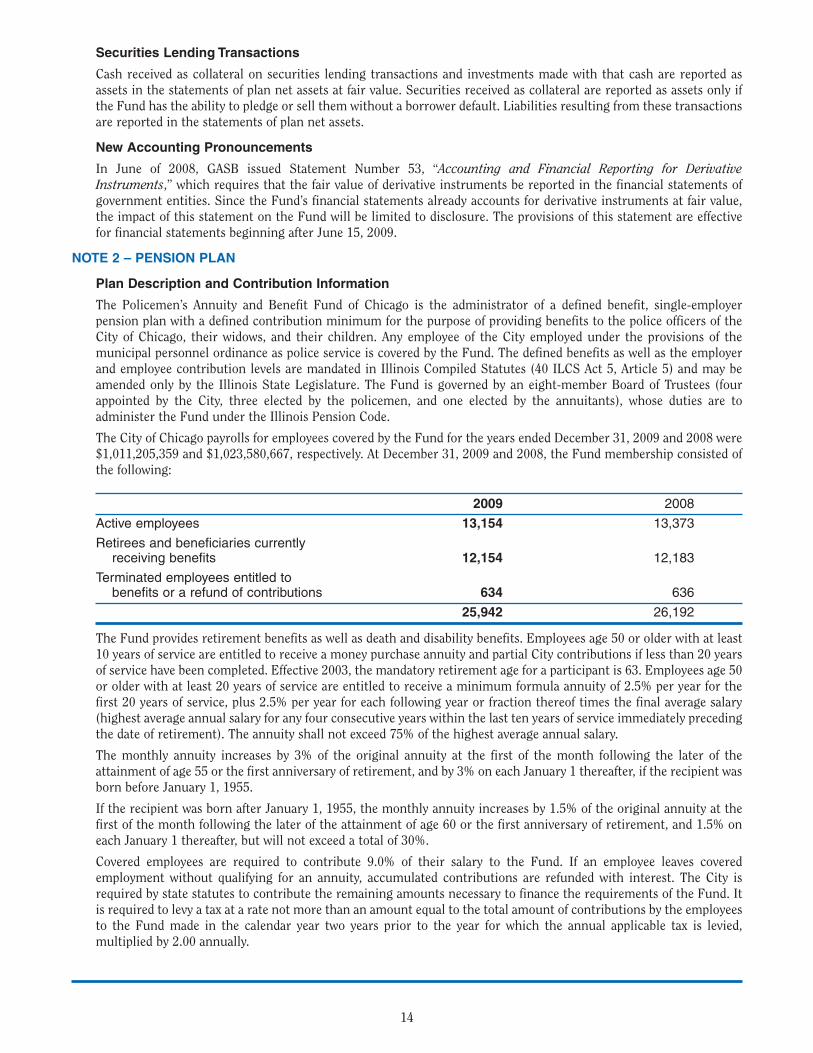
Securities Lending Transactions
Cash received as collateral on securities lending transactions and investments made with that cash are reported asassets in the statements of plan net assets at fair value. Securities received as collateral are reported as assets only ifthe Fund has the ability to pledge or sell them without a borrower default. Liabilities resulting from these transactionsare reported in the statements of plan net assets.
New Accounting Pronouncements
In June of 2008, GASB issued Statement Number 53, “Accounting and Financial Reporting for DerivativeInstruments,” which requires that the fair value of derivative instruments be reported in the financial statements ofgovernment entities. Since the Fund’s financial statements already accounts for derivative instruments at fair value,the impact of this statement on the Fund will be limited to disclosure. The provisions of this statement are effectivefor financial statements beginning after June 15, 2009.
NOTE 2 – PENSION PLAN
Plan Description and Contribution Information
The Policemen’s Annuity and Benefit Fund of Chicago is the administrator of a defined benefit, single-employerpension plan with a defined contribution minimum for the purpose of providing benefits to the police officers of theCity of Chicago, their widows, and their children. Any employee of the City employed under the provisions of themunicipal personnel ordinance as police service is covered by the Fund. The defined benefits as well as the employerand employee contribution levels are mandated in Illinois Compiled Statutes (40 ILCS Act 5, Article 5) and may beamended only by the Illinois State Legislature. The Fund is governed by an eight-member Board of Trustees (fourappointed by the City, three elected by the policemen, and one elected by the annuitants), whose duties are toadminister the Fund under the Illinois Pension Code.
The City of Chicago payrolls for employees covered by the Fund for the years ended December 31, 2009 and 2008 were$1,011,205,359 and $1,023,580,667, respectively. At December 31, 2009 and 2008, the Fund membership consisted ofthe following:
2009 2008
Active employees 13,154 13,373
Retirees and beneficiaries currently receiving benefits 12,154 12,183
Terminated employees entitled to benefits or a refund of contributions 634 636
25,942 26,192
The Fund provides retirement benefits as well as death and disability benefits. Employees age 50 or older with at least10 years of service are entitled to receive a money purchase annuity and partial City contributions if less than 20 yearsof service have been completed. Effective 2003, the mandatory retirement age for a participant is 63. Employees age 50or older with at least 20 years of service are entitled to receive a minimum formula annuity of 2.5% per year for thefirst 20 years of service, plus 2.5% per year for each following year or fraction thereof times the final average salary(highest average annual salary for any four consecutive years within the last ten years of service immediately precedingthe date of retirement). The annuity shall not exceed 75% of the highest average annual salary.
The monthly annuity increases by 3% of the original annuity at the first of the month following the later of theattainment of age 55 or the first anniversary of retirement, and by 3% on each January 1 thereafter, if the recipient wasborn before January 1, 1955.
If the recipient was born after January 1, 1955, the monthly annuity increases by 1.5% of the original annuity at thefirst of the month following the later of the attainment of age 60 or the first anniversary of retirement, and 1.5% oneach January 1 thereafter, but will not exceed a total of 30%.
Covered employees are required to contribute 9.0% of their salary to the Fund. If an employee leaves coveredemployment without qualifying for an annuity, accumulated contributions are refunded with interest. The City isrequired by state statutes to contribute the remaining amounts necessary to finance the requirements of the Fund. Itis required to levy a tax at a rate not more than an amount equal to the total amount of contributions by the employeesto the Fund made in the calendar year two years prior to the year for which the annual applicable tax is levied,multiplied by 2.00 annually.
14
29527_Body 10/1/10 9:16 AM Page 14
15
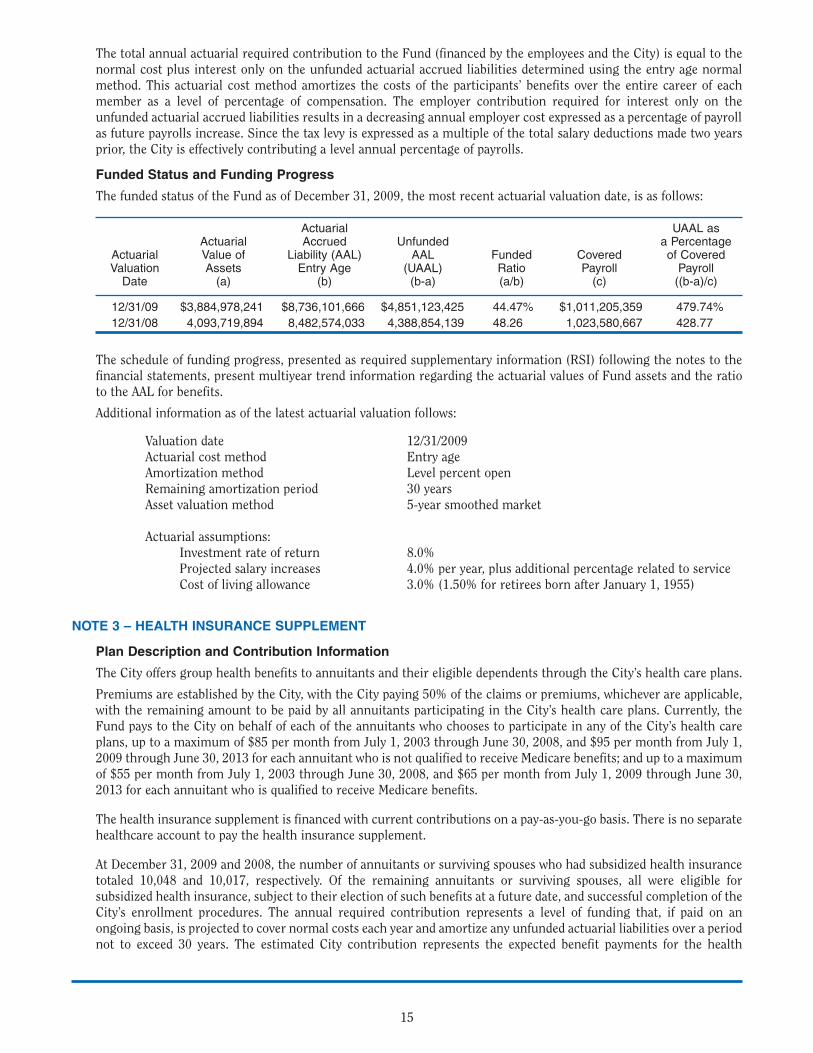
The total annual actuarial required contribution to the Fund (financed by the employees and the City) is equal to thenormal cost plus interest only on the unfunded actuarial accrued liabilities determined using the entry age normalmethod. This actuarial cost method amortizes the costs of the participants’ benefits over the entire career of eachmember as a level of percentage of compensation. The employer contribution required for interest only on theunfunded actuarial accrued liabilities results in a decreasing annual employer cost expressed as a percentage of payrollas future payrolls increase. Since the tax levy is expressed as a multiple of the total salary deductions made two yearsprior, the City is effectively contributing a level annual percentage of payrolls.
Funded Status and Funding Progress
The funded status of the Fund as of December 31, 2009, the most recent actuarial valuation date, is as follows:
Actuarial UAAL asActuarial Accrued Unfunded a Percentage
Actuarial Value of Liability (AAL) AAL Funded Covered of CoveredValuation Assets Entry Age (UAAL) Ratio Payroll Payroll
Date (a) (b) (b-a) (a/b) (c) ((b-a)/c)
12/31/09 $3,884,978,241 $8,736,101,666 $4,851,123,425 44.47% $1,011,205,359 479.74%
12/31/08 4,093,719,894 8,482,574,033 4,388,854,139 48.26 1,023,580,667 428.77
The schedule of funding progress, presented as required supplementary information (RSI) following the notes to thefinancial statements, present multiyear trend information regarding the actuarial values of Fund assets and the ratioto the AAL for benefits.
Additional information as of the latest actuarial valuation follows:
Valuation date 12/31/2009Actuarial cost method Entry ageAmortization method Level percent openRemaining amortization period 30 yearsAsset valuation method 5-year smoothed market
Actuarial assumptions:Investment rate of return 8.0%Projected salary increases 4.0% per year, plus additional percentage related to serviceCost of living allowance 3.0% (1.50% for retirees born after January 1, 1955)
NOTE 3 – HEALTH INSURANCE SUPPLEMENT
Plan Description and Contribution Information
The City offers group health benefits to annuitants and their eligible dependents through the City’s health care plans.
Premiums are established by the City, with the City paying 50% of the claims or premiums, whichever are applicable,with the remaining amount to be paid by all annuitants participating in the City’s health care plans. Currently, theFund pays to the City on behalf of each of the annuitants who chooses to participate in any of the City’s health careplans, up to a maximum of $85 per month from July 1, 2003 through June 30, 2008, and $95 per month from July 1,2009 through June 30, 2013 for each annuitant who is not qualified to receive Medicare benefits; and up to a maximumof $55 per month from July 1, 2003 through June 30, 2008, and $65 per month from July 1, 2009 through June 30,2013 for each annuitant who is qualified to receive Medicare benefits.
The health insurance supplement is financed with current contributions on a pay-as-you-go basis. There is no separatehealthcare account to pay the health insurance supplement.
At December 31, 2009 and 2008, the number of annuitants or surviving spouses who had subsidized health insurancetotaled 10,048 and 10,017, respectively. Of the remaining annuitants or surviving spouses, all were eligible forsubsidized health insurance, subject to their election of such benefits at a future date, and successful completion of theCity’s enrollment procedures. The annual required contribution represents a level of funding that, if paid on anongoing basis, is projected to cover normal costs each year and amortize any unfunded actuarial liabilities over a periodnot to exceed 30 years. The estimated City contribution represents the expected benefit payments for the health
29527_Body 9/13/10 7:54 AM Page 15
insurance supplement. In 2009 and 2008, the Fund received contributions of $9,266,431 and $8,850,186 from the City,and remitted contributions of insurance premiums to the City of $9,266,431 and $8,850,186, respectively.Contributions to the health insurance supplement are equal to insurance premium payments to the City. There wereno net assets to report for the health insurance supplement at December 31, 2009 or 2008.
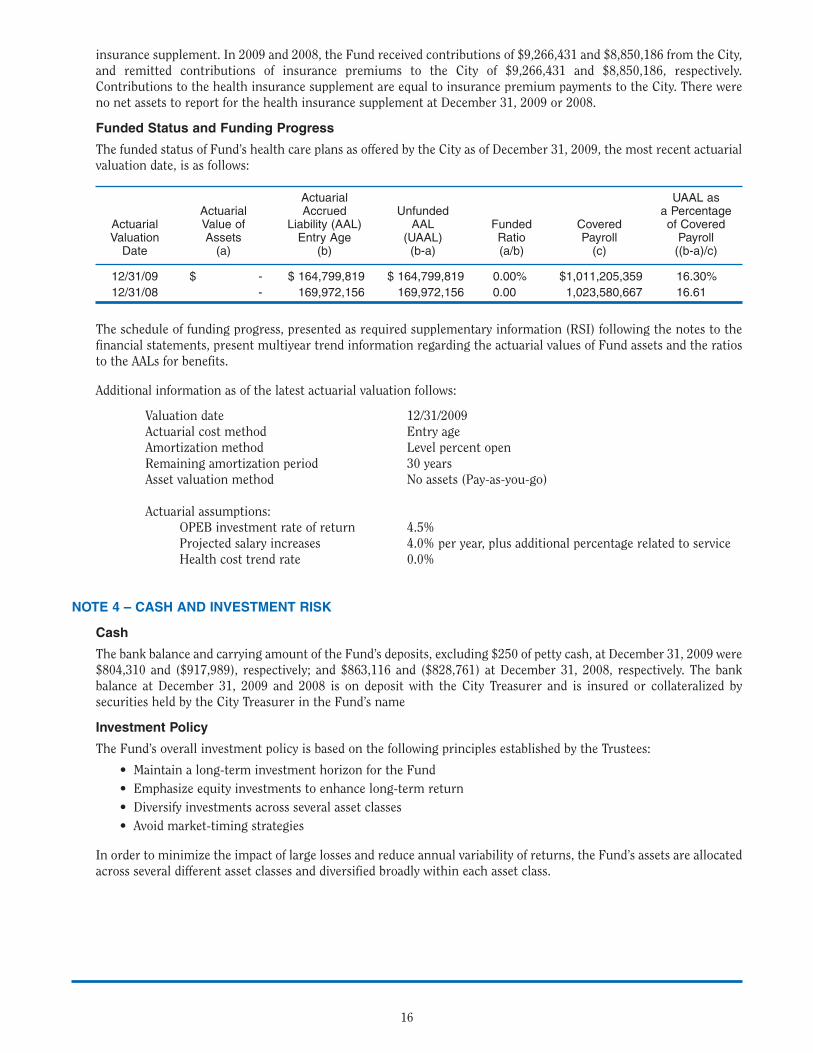
Funded Status and Funding Progress
The funded status of Fund’s health care plans as offered by the City as of December 31, 2009, the most recent actuarialvaluation date, is as follows:
Actuarial UAAL asActuarial Accrued Unfunded a Percentage
Actuarial Value of Liability (AAL) AAL Funded Covered of CoveredValuation Assets Entry Age (UAAL) Ratio Payroll Payroll
Date (a) (b) (b-a) (a/b) (c) ((b-a)/c)
12/31/09 $ - $ 164,799,819 $ 164,799,819 0.00% $1,011,205,359 16.30%
12/31/08 - 169,972,156 169,972,156 0.00 1,023,580,667 16.61
The schedule of funding progress, presented as required supplementary information (RSI) following the notes to thefinancial statements, present multiyear trend information regarding the actuarial values of Fund assets and the ratiosto the AALs for benefits.
Additional information as of the latest actuarial valuation follows:
Valuation date 12/31/2009Actuarial cost method Entry ageAmortization method Level percent openRemaining amortization period 30 yearsAsset valuation method No assets (Pay-as-you-go)
Actuarial assumptions:OPEB investment rate of return 4.5%Projected salary increases 4.0% per year, plus additional percentage related to serviceHealth cost trend rate 0.0%
NOTE 4 – CASH AND INVESTMENT RISK
Cash
The bank balance and carrying amount of the Fund’s deposits, excluding $250 of petty cash, at December 31, 2009 were$804,310 and ($917,989), respectively; and $863,116 and ($828,761) at December 31, 2008, respectively. The bankbalance at December 31, 2009 and 2008 is on deposit with the City Treasurer and is insured or collateralized bysecurities held by the City Treasurer in the Fund’s name
Investment Policy
The Fund’s overall investment policy is based on the following principles established by the Trustees:
• Maintain a long-term investment horizon for the Fund• Emphasize equity investments to enhance long-term return• Diversify investments across several asset classes• Avoid market-timing strategies
In order to minimize the impact of large losses and reduce annual variability of returns, the Fund’s assets are allocatedacross several different asset classes and diversified broadly within each asset class.
16
29527_Body 9/14/10 2:35 PM Page 16
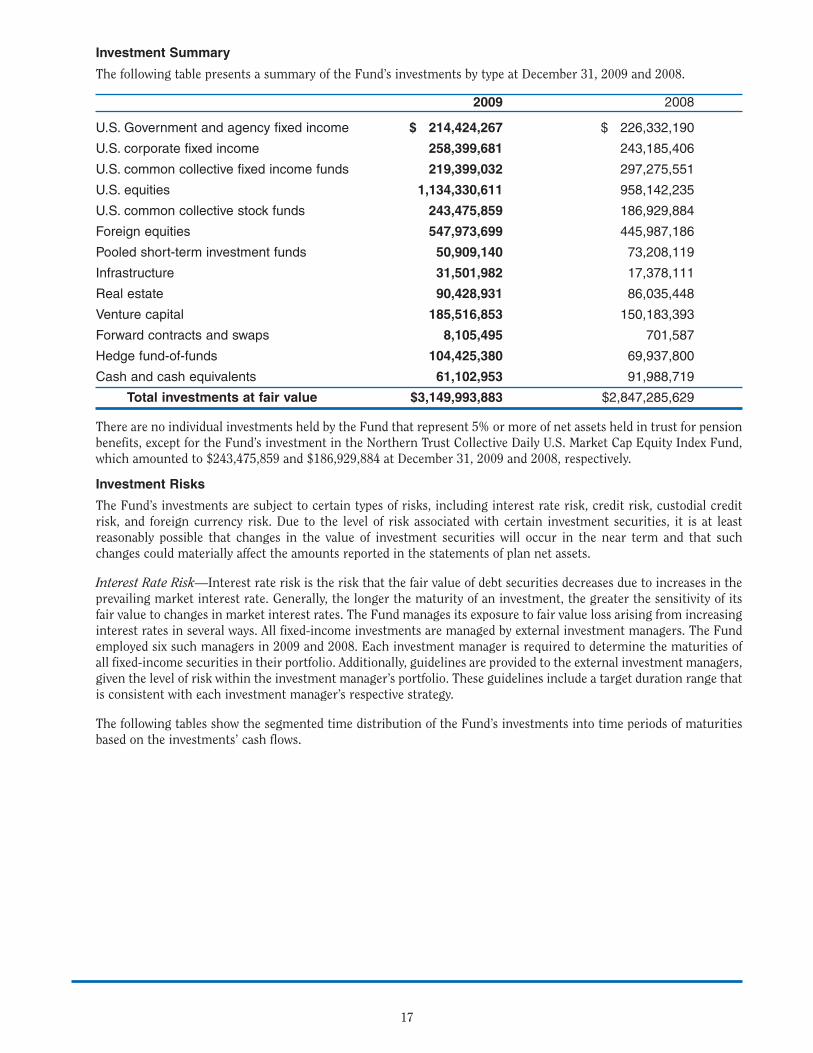
Investment Summary
The following table presents a summary of the Fund’s investments by type at December 31, 2009 and 2008.
2009 2008
U.S. Government and agency fixed income $ 214,424,267 $ 226,332,190
U.S. corporate fixed income 258,399,681 243,185,406
U.S. common collective fixed income funds 219,399,032 297,275,551
U.S. equities 1,134,330,611 958,142,235
U.S. common collective stock funds 243,475,859 186,929,884
Foreign equities 547,973,699 445,987,186
Pooled short-term investment funds 50,909,140 73,208,119
Infrastructure 31,501,982 17,378,111
Real estate 90,428,931 86,035,448
Venture capital 185,516,853 150,183,393
Forward contracts and swaps 8,105,495 701,587
Hedge fund-of-funds 104,425,380 69,937,800
Cash and cash equivalents 61,102,953 91,988,719
Total investments at fair value $3,149,993,883 $2,847,285,629
There are no individual investments held by the Fund that represent 5% or more of net assets held in trust for pensionbenefits, except for the Fund’s investment in the Northern Trust Collective Daily U.S. Market Cap Equity Index Fund,which amounted to $243,475,859 and $186,929,884 at December 31, 2009 and 2008, respectively.
Investment Risks
The Fund’s investments are subject to certain types of risks, including interest rate risk, credit risk, custodial creditrisk, and foreign currency risk. Due to the level of risk associated with certain investment securities, it is at leastreasonably possible that changes in the value of investment securities will occur in the near term and that suchchanges could materially affect the amounts reported in the statements of plan net assets.
Interest Rate Risk—Interest rate risk is the risk that the fair value of debt securities decreases due to increases in theprevailing market interest rate. Generally, the longer the maturity of an investment, the greater the sensitivity of itsfair value to changes in market interest rates. The Fund manages its exposure to fair value loss arising from increasinginterest rates in several ways. All fixed-income investments are managed by external investment managers. The Fundemployed six such managers in 2009 and 2008. Each investment manager is required to determine the maturities ofall fixed-income securities in their portfolio. Additionally, guidelines are provided to the external investment managers,given the level of risk within the investment manager’s portfolio. These guidelines include a target duration range thatis consistent with each investment manager’s respective strategy.
The following tables show the segmented time distribution of the Fund’s investments into time periods of maturitiesbased on the investments’ cash flows.
17
29527_Body 9/13/10 7:54 AM Page 17

At December 31, 2009, the Fund had the following investments and maturities related to certain fixed-incomesecurities (bonds and notes):
Investment Maturities
Fair Less than 1 to 6 7 to 10 More ThanInvestment Type Value 1 year years years 10 years
Asset backed securities $22,602,827 $ - $12,213,394 $3,942,795 $6,446,638
Commercial mortgage backed securities 44,894,255 - 661,503 622,956 43,609,796
Corporate bonds 181,709,894 4,013,217 62,205,179 68,199,262 47,292,236
Government agency securities 7,872,709 422,000 6,826,078 624,631 -
Government bonds 57,082,993 764,531 10,745,531 20,486,218 25,086,713
Government mortgage backed securities 135,226,796 - - 15,176,107 120,050,689
Government issued commercial mortgage backed securities 2,122,677 - - 2,122,677 -
Guaranteed fixed income 777,053 - 777,053 - -
Index linked government funds 6,739,265 - 3,073,584 3,665,681 -
Municipal principal bonds 5,379,827 - 2,471,827 487,558 2,420,442
Non-government backed collateralized mortgageobligations 8,415,652 - 259,444 2,277,706 5,878,502
Total $472,823,948 $5,199,748 $99,233,593 $117,605,591 $250,785,016
At December 31, 2008, the Fund had the following investments and maturities:
Investment Maturities
Fair Less than 1 to 6 7 to 10 More ThanInvestment Type Value 1 year years years 10 years
Asset-backed securities $41,488,871 $203,453 $23,949,417 $5,996,521 $11,339,480
Commercial mortgage-backed securities 39,671,716 - - 751,797 38,919,919
Corporate bonds 141,400,932 2,266,531 52,164,270 49,394,497 37,575,634
Government agency securities 15,699,981 - 8,594,980 1,659,303 5,445,698
Government bonds 39,311,798 2,001,771 3,261,405 11,152,109 22,896,513
Government mortgage-backed securities 170,985,707 - 709,798 15,664,365 154,611,544
Guaranteed fixed income 1,961,176 - 1,961,176 - -
Municipal principal bonds 334,704 - - - 334,704
Non-government-backed collateralized mortgageobligations 18,662,711 - 758,863 3,811,578 14,092,270
Total $469,517,596 $4,471,755 $91,399,909 $88,430,170 $285,215,762
18
29527_Body 9/13/10 7:55 AM Page 18
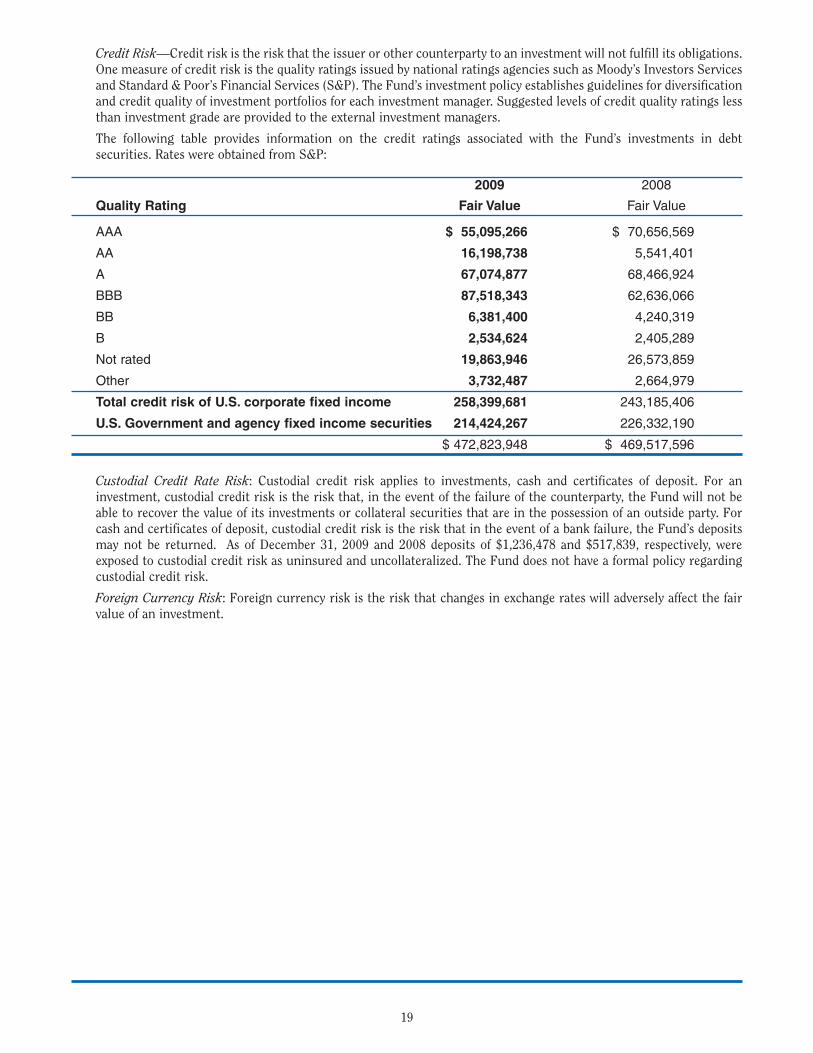
Credit Risk—Credit risk is the risk that the issuer or other counterparty to an investment will not fulfill its obligations.One measure of credit risk is the quality ratings issued by national ratings agencies such as Moody’s Investors Servicesand Standard & Poor’s Financial Services (S&P). The Fund’s investment policy establishes guidelines for diversificationand credit quality of investment portfolios for each investment manager. Suggested levels of credit quality ratings lessthan investment grade are provided to the external investment managers.
The following table provides information on the credit ratings associated with the Fund’s investments in debtsecurities. Rates were obtained from S&P:
2009 2008
Quality Rating Fair Value Fair Value
AAA $ 55,095,266 $ 70,656,569
AA 16,198,738 5,541,401
A 67,074,877 68,466,924
BBB 87,518,343 62,636,066
BB 6,381,400 4,240,319
B 2,534,624 2,405,289
Not rated 19,863,946 26,573,859
Other 3,732,487 2,664,979
Total credit risk of U.S. corporate fixed income 258,399,681 243,185,406
U.S. Government and agency fixed income securities 214,424,267 226,332,190
$ 472,823,948 $ 469,517,596
Custodial Credit Rate Risk: Custodial credit risk applies to investments, cash and certificates of deposit. For aninvestment, custodial credit risk is the risk that, in the event of the failure of the counterparty, the Fund will not beable to recover the value of its investments or collateral securities that are in the possession of an outside party. Forcash and certificates of deposit, custodial credit risk is the risk that in the event of a bank failure, the Fund’s depositsmay not be returned. As of December 31, 2009 and 2008 deposits of $1,236,478 and $517,839, respectively, wereexposed to custodial credit risk as uninsured and uncollateralized. The Fund does not have a formal policy regardingcustodial credit risk.
Foreign Currency Risk: Foreign currency risk is the risk that changes in exchange rates will adversely affect the fairvalue of an investment.
19
29527_Body 9/13/10 7:55 AM Page 19
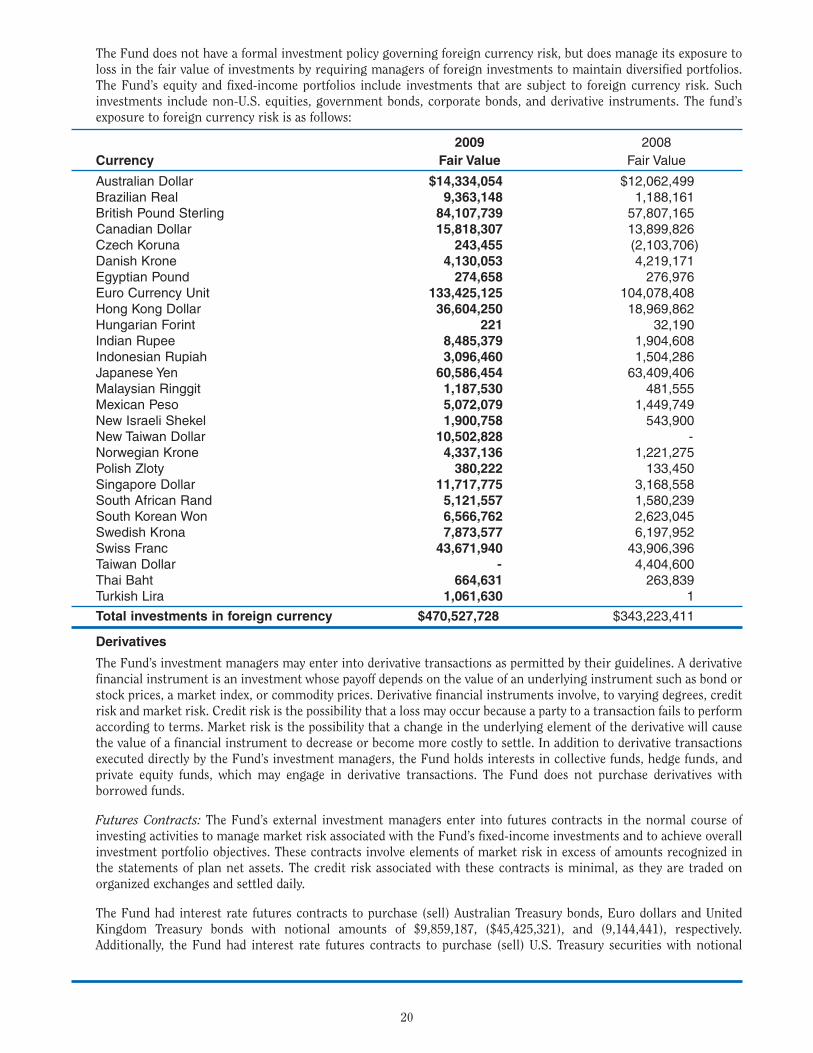
The Fund does not have a formal investment policy governing foreign currency risk, but does manage its exposure toloss in the fair value of investments by requiring managers of foreign investments to maintain diversified portfolios.The Fund’s equity and fixed-income portfolios include investments that are subject to foreign currency risk. Suchinvestments include non-U.S. equities, government bonds, corporate bonds, and derivative instruments. The fund’sexposure to foreign currency risk is as follows:
2009 2008
Currency Fair Value Fair Value
Australian Dollar $14,334,054 $12,062,499Brazilian Real 9,363,148 1,188,161British Pound Sterling 84,107,739 57,807,165Canadian Dollar 15,818,307 13,899,826Czech Koruna 243,455 (2,103,706)Danish Krone 4,130,053 4,219,171Egyptian Pound 274,658 276,976Euro Currency Unit 133,425,125 104,078,408Hong Kong Dollar 36,604,250 18,969,862Hungarian Forint 221 32,190Indian Rupee 8,485,379 1,904,608Indonesian Rupiah 3,096,460 1,504,286Japanese Yen 60,586,454 63,409,406Malaysian Ringgit 1,187,530 481,555Mexican Peso 5,072,079 1,449,749New Israeli Shekel 1,900,758 543,900New Taiwan Dollar 10,502,828 - Norwegian Krone 4,337,136 1,221,275Polish Zloty 380,222 133,450Singapore Dollar 11,717,775 3,168,558South African Rand 5,121,557 1,580,239South Korean Won 6,566,762 2,623,045Swedish Krona 7,873,577 6,197,952Swiss Franc 43,671,940 43,906,396Taiwan Dollar - 4,404,600Thai Baht 664,631 263,839Turkish Lira 1,061,630 1
Total investments in foreign currency $470,527,728 $343,223,411
Derivatives
The Fund’s investment managers may enter into derivative transactions as permitted by their guidelines. A derivativefinancial instrument is an investment whose payoff depends on the value of an underlying instrument such as bond orstock prices, a market index, or commodity prices. Derivative financial instruments involve, to varying degrees, creditrisk and market risk. Credit risk is the possibility that a loss may occur because a party to a transaction fails to performaccording to terms. Market risk is the possibility that a change in the underlying element of the derivative will causethe value of a financial instrument to decrease or become more costly to settle. In addition to derivative transactionsexecuted directly by the Fund’s investment managers, the Fund holds interests in collective funds, hedge funds, andprivate equity funds, which may engage in derivative transactions. The Fund does not purchase derivatives withborrowed funds.
Futures Contracts: The Fund’s external investment managers enter into futures contracts in the normal course ofinvesting activities to manage market risk associated with the Fund’s fixed-income investments and to achieve overallinvestment portfolio objectives. These contracts involve elements of market risk in excess of amounts recognized inthe statements of plan net assets. The credit risk associated with these contracts is minimal, as they are traded onorganized exchanges and settled daily.
The Fund had interest rate futures contracts to purchase (sell) Australian Treasury bonds, Euro dollars and UnitedKingdom Treasury bonds with notional amounts of $9,859,187, ($45,425,321), and (9,144,441), respectively.Additionally, the Fund had interest rate futures contracts to purchase (sell) U.S. Treasury securities with notional
20
29527_Body 9/13/10 7:55 AM Page 20
amounts of $5,408,862 and ($5,307,200), respectively. Notional amounts do not quantify risk or represent assets orliabilities of the Fund, but are used in the calculation of cash settlements under the contracts. The fair value of futurescontracts in the statements of plan net assets was zero at December 31, 2009, as settlements are by cash daily. Changesin fair value are accounted for as net appreciation (depreciation) in fair value of investments.
Interest Rate and Credit Default Swaps: The Fund’s external investment managers utilize interest rate and creditdefault swaps in the management of the Fund’s fixed-income portfolio. Swap agreements are contractual agreementsbetween two or more parties in which each party agrees to exchange sets of cash flows based on certain agreed-uponparameters. Gains and losses on swaps are determined based on market values and are recorded in the statements ofchanges in plan net assets. The market value of swaps outstanding at December 31, 2009 was a net unrealized loss of$2,534,915.
Forward Interest Rate Contracts: The Fund’s external investment managers entered into a forward contract topurchase U.S. Treasury strips during 2009. Forward contracts are contracts for delayed delivery of securities in whichthe seller agrees to make delivery at a specified future date of a specified instrument, at a specified price or yield. Theholder is exposed to credit risk for nonperformance and to market risk for changes in interest rates. These instrumentsinvolve, to varying degrees, elements of credit risk in excess of the amount recognized in the statements of plan netassets. The Fund’s external investment managers attempt to mitigate this credit risk through structured trading withreputable parties. The fair value of the forward contract was $7,098,810 as of December 31, 2009. The unrealized losson the contract was $516,467 during 2009 and is included in net appreciation (depreciation) in the fair value ofinvestments on the statements of changes in plan net assets.
NOTE 5 – SECURITIES LENDING PROGRAM
State statutes and Board of Trustees policies permit the Fund to lend its securities to broker-dealers and other entitieswith a simultaneous agreement to return the collateral for the same securities in the future. The Fund’s mastercustodian, Northern Trust Bank, lends securities of the type on loan at year-end for collateral in the form of cash,irrevocable letters of credit, or other securities to a minimum of 102% for U.S. securities and 105% for non-U.S.securities. The contract with the Fund’s master custodian requires it to indemnify the Fund if the borrowers fail toreturn the securities (and if the collateral is inadequate to replace the securities lent) or fail to pay the Fund for incomedistributions by the securities’ issuers while the securities are on loan.
All securities loans can be terminated on demand by either the Fund or the borrower, although the average term of theloans is 81 days. Cash collateral is invested in the lending agent’s Core USA Collateral Pool, which at December 31,2009, had a weighted-average life, as measured by interest sensitivity, of 41 days. The relationship between thematurities of the investment pool and the Fund’s loans is affected by the maturities of the securities loans made byother entities that use the agent’s pool, which the Fund cannot determine. The Fund cannot pledge or sell collateralsecurities received unless the borrower defaults.
21
29527_Body 9/13/10 7:57 AM Page 21
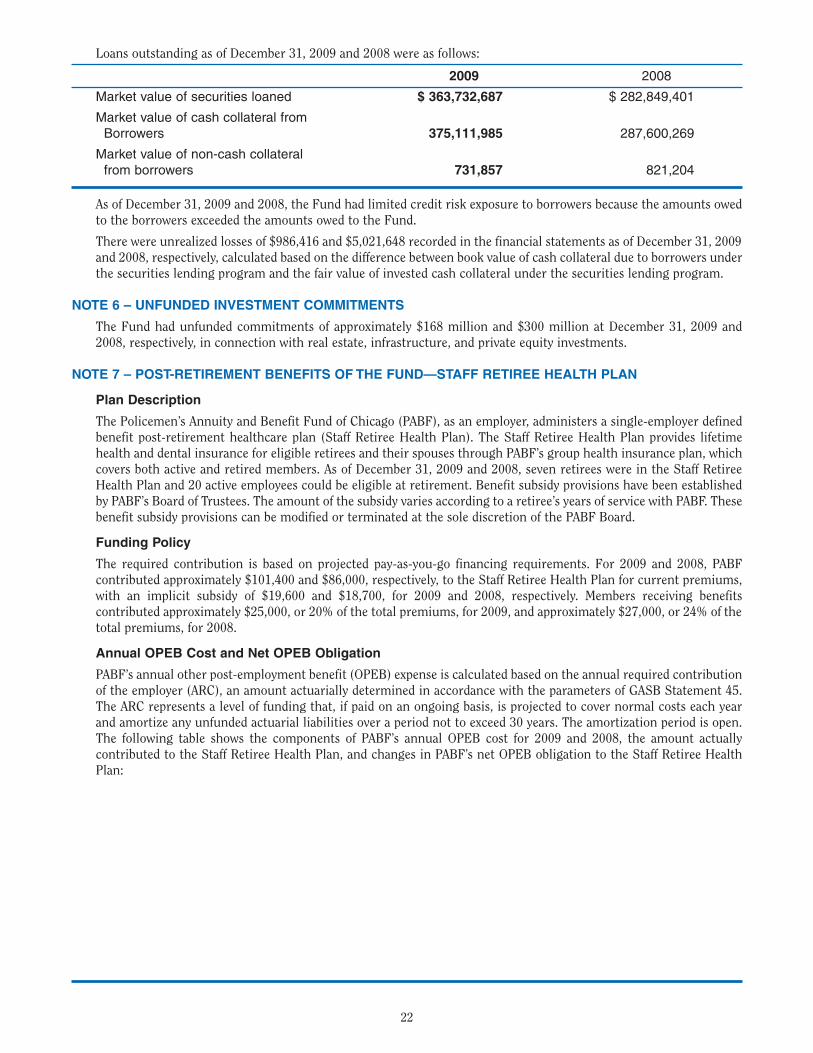
Loans outstanding as of December 31, 2009 and 2008 were as follows:
2009 2008
Market value of securities loaned $ 363,732,687 $ 282,849,401
Market value of cash collateral from Borrowers 375,111,985 287,600,269
Market value of non-cash collateral
from borrowers 731,857 821,204
As of December 31, 2009 and 2008, the Fund had limited credit risk exposure to borrowers because the amounts owedto the borrowers exceeded the amounts owed to the Fund.
There were unrealized losses of $986,416 and $5,021,648 recorded in the financial statements as of December 31, 2009and 2008, respectively, calculated based on the difference between book value of cash collateral due to borrowers underthe securities lending program and the fair value of invested cash collateral under the securities lending program.
NOTE 6 – UNFUNDED INVESTMENT COMMITMENTS
The Fund had unfunded commitments of approximately $168 million and $300 million at December 31, 2009 and2008, respectively, in connection with real estate, infrastructure, and private equity investments.
NOTE 7 – POST-RETIREMENT BENEFITS OF THE FUND—STAFF RETIREE HEALTH PLAN
Plan Description
The Policemen’s Annuity and Benefit Fund of Chicago (PABF), as an employer, administers a single-employer definedbenefit post-retirement healthcare plan (Staff Retiree Health Plan). The Staff Retiree Health Plan provides lifetimehealth and dental insurance for eligible retirees and their spouses through PABF’s group health insurance plan, whichcovers both active and retired members. As of December 31, 2009 and 2008, seven retirees were in the Staff RetireeHealth Plan and 20 active employees could be eligible at retirement. Benefit subsidy provisions have been establishedby PABF’s Board of Trustees. The amount of the subsidy varies according to a retiree’s years of service with PABF. Thesebenefit subsidy provisions can be modified or terminated at the sole discretion of the PABF Board.
Funding Policy
The required contribution is based on projected pay-as-you-go financing requirements. For 2009 and 2008, PABFcontributed approximately $101,400 and $86,000, respectively, to the Staff Retiree Health Plan for current premiums,with an implicit subsidy of $19,600 and $18,700, for 2009 and 2008, respectively. Members receiving benefitscontributed approximately $25,000, or 20% of the total premiums, for 2009, and approximately $27,000, or 24% of thetotal premiums, for 2008.
Annual OPEB Cost and Net OPEB Obligation
PABF’s annual other post-employment benefit (OPEB) expense is calculated based on the annual required contributionof the employer (ARC), an amount actuarially determined in accordance with the parameters of GASB Statement 45.The ARC represents a level of funding that, if paid on an ongoing basis, is projected to cover normal costs each yearand amortize any unfunded actuarial liabilities over a period not to exceed 30 years. The amortization period is open.The following table shows the components of PABF’s annual OPEB cost for 2009 and 2008, the amount actuallycontributed to the Staff Retiree Health Plan, and changes in PABF’s net OPEB obligation to the Staff Retiree HealthPlan:
22
29527_Body 9/13/10 7:58 AM Page 22

ANNUAL OPEB COST AND NET OPEB OBLIGATION
2009 2008
Annual required contribution $ 290,600 $ 274,600
Interest on net OPEB obligation 15,500 7,800
Adjustment to annual required contribution (11,500) (5,800)
Annual OPEB expense 294,600 276,600
Employer contributions made 121,000 104,700
Increase in net OPEB obligation 173,600 171,900
Net OPEB obligation at beginning of year 344,600 172,700
Net OPEB obligation at end of year $ 518,200 $ 344,600
The annual OPEB cost, the percentage of annual OPEB cost contributed to the Staff Retiree Health Plan, and the netOPEB obligation for 2009 and 2008 is as follows:
Percentage ofYear Annual Annual OPEB Net OPEB
Ended OPEB Cost Cost Contributed Obligation
12/31/2009 $ 290,600 41.6% $ 518,20012/31/2008 $ 274,600 38.1% $ 344,600
Funded Status and Funding Progress (unaudited)
The funded status of PABF’s Staff Retiree Health Plan as of December 31, 2009, and 2008, is as follows:
Actuarial UAAL asActuarial Accrued Unfunded a Percentage
Actuarial Value of Liability (AAL) AAL Funded Covered of CoveredValuation Assets Entry Age (UAAL) Ratio Payroll Payroll
Date (a) (b) (b-a) (a/b) (c) ((b-a)/c)
12/31/09 $ - $ 3,474,800 $ 3,474,800 0.00% $ 1,256,800 276.5%
12/31/08 - 3,239,700 3,239,700 0.00 1,202,700 269.4
Actuarial valuations of an ongoing plan involve estimates of the value of reported amounts and assumptions about theprobability of occurrence of events far into the future. Examples include assumptions about future employment,mortality, and the healthcare cost trend. Amounts determined regarding the funded status of the Staff Retiree HealthPlan and the annual required contributions of the employer are subject to continual revision as actual results arecompared with past expectations and new estimates are made about the future. The schedule of funding progress,presented as required supplementary information (RSI) following the notes to the financial statements, presentmultiyear trend information on the actuarial values of assets of the Staff Retiree Health Plan and its ratio to the AALfor benefits.
Actuarial Methods and Assumptions
Projections of benefits for financial reporting purposes are based on the substantive plan (the plan as understood bythe employer and the plan members) and include the types of benefits provided at the time of each valuation and thehistorical pattern of sharing of benefit costs between the employer and members to that point. The actuarial methodsand assumptions used include techniques that are designed to reduce the effects of short-term volatility in actuarialaccrued liabilities consistent with the long-term perspective of the calculations.
For the December 31, 2009 and 2008 actuarial valuations the entry age actuarial cost method was used. The actuarialassumptions included a 4.5% investment rate of return based on the employer’s assumed return on its assets and anannual healthcare cost trend rate of 9.0% initially, reduced by increments of 1.0 percentage point per year to anultimate rate of 5.0% after four years. Both rates include a 4.5% general inflation assumption. The unfunded actuarialaccrued liability is being amortized as a level percentage of projected payroll over a period of 30 years. The projectedsalary increase assumption was 4.5%.
23
29527_Body 9/14/10 2:35 PM Page 23
24
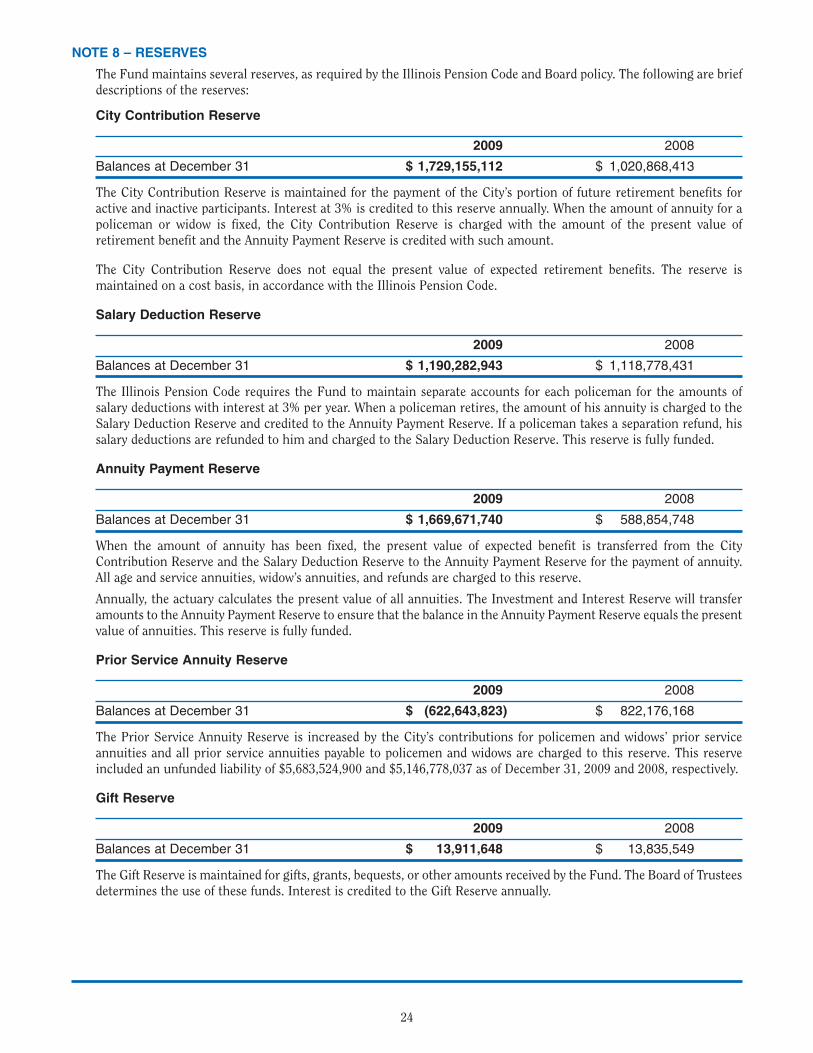
NOTE 8 – RESERVES
The Fund maintains several reserves, as required by the Illinois Pension Code and Board policy. The following are briefdescriptions of the reserves:
City Contribution Reserve
2009 2008
Balances at December 31 $ 1,729,155,112 $ 1,020,868,413
The City Contribution Reserve is maintained for the payment of the City’s portion of future retirement benefits foractive and inactive participants. Interest at 3% is credited to this reserve annually. When the amount of annuity for apoliceman or widow is fixed, the City Contribution Reserve is charged with the amount of the present value ofretirement benefit and the Annuity Payment Reserve is credited with such amount.
The City Contribution Reserve does not equal the present value of expected retirement benefits. The reserve ismaintained on a cost basis, in accordance with the Illinois Pension Code.
Salary Deduction Reserve
2009 2008
Balances at December 31 $ 1,190,282,943 $ 1,118,778,431
The Illinois Pension Code requires the Fund to maintain separate accounts for each policeman for the amounts ofsalary deductions with interest at 3% per year. When a policeman retires, the amount of his annuity is charged to theSalary Deduction Reserve and credited to the Annuity Payment Reserve. If a policeman takes a separation refund, hissalary deductions are refunded to him and charged to the Salary Deduction Reserve. This reserve is fully funded.
Annuity Payment Reserve
2009 2008
Balances at December 31 $ 1,669,671,740 $ 588,854,748
When the amount of annuity has been fixed, the present value of expected benefit is transferred from the CityContribution Reserve and the Salary Deduction Reserve to the Annuity Payment Reserve for the payment of annuity.All age and service annuities, widow’s annuities, and refunds are charged to this reserve.
Annually, the actuary calculates the present value of all annuities. The Investment and Interest Reserve will transferamounts to the Annuity Payment Reserve to ensure that the balance in the Annuity Payment Reserve equals the presentvalue of annuities. This reserve is fully funded.
Prior Service Annuity Reserve
2009 2008
Balances at December 31 $ (622,643,823) $ 822,176,168
The Prior Service Annuity Reserve is increased by the City’s contributions for policemen and widows’ prior serviceannuities and all prior service annuities payable to policemen and widows are charged to this reserve. This reserveincluded an unfunded liability of $5,683,524,900 and $5,146,778,037 as of December 31, 2009 and 2008, respectively.
Gift Reserve
2009 2008
Balances at December 31 $ 13,911,648 $ 13,835,549
The Gift Reserve is maintained for gifts, grants, bequests, or other amounts received by the Fund. The Board of Trusteesdetermines the use of these funds. Interest is credited to the Gift Reserve annually.
29527_Body 9/13/10 7:58 AM Page 24
25
Investment and Interest Reserve
All gains and losses from investments and investment earnings are recorded in the Investment and Interest Reserve.Interest due to the City Contribution Reserve, Salary Deduction Reserve, Prior Service Annuity Reserve, Gift Reserve,and Supplementary Payment Reserve is transferred from the Investment and Interest Reserve to those reserves.
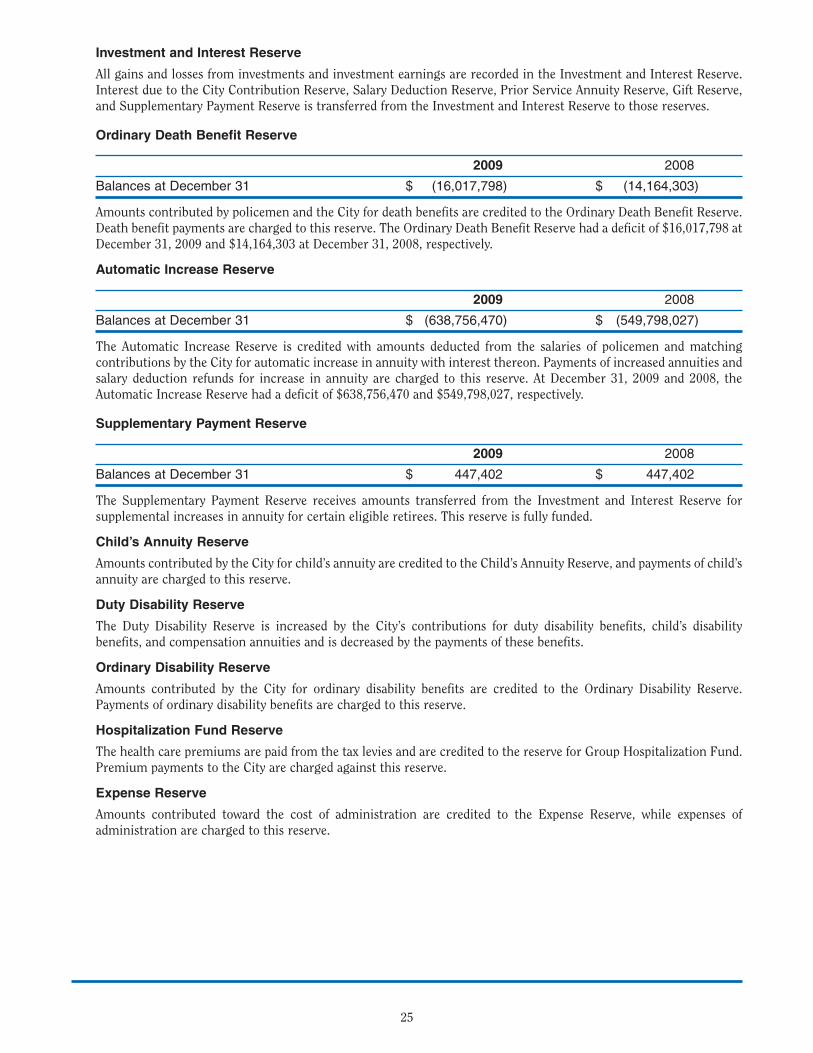
Ordinary Death Benefit Reserve
2009 2008
Balances at December 31 $ (16,017,798) $ (14,164,303)
Amounts contributed by policemen and the City for death benefits are credited to the Ordinary Death Benefit Reserve.Death benefit payments are charged to this reserve. The Ordinary Death Benefit Reserve had a deficit of $16,017,798 atDecember 31, 2009 and $14,164,303 at December 31, 2008, respectively.
Automatic Increase Reserve
2009 2008
Balances at December 31 $ (638,756,470) $ (549,798,027)
The Automatic Increase Reserve is credited with amounts deducted from the salaries of policemen and matchingcontributions by the City for automatic increase in annuity with interest thereon. Payments of increased annuities andsalary deduction refunds for increase in annuity are charged to this reserve. At December 31, 2009 and 2008, theAutomatic Increase Reserve had a deficit of $638,756,470 and $549,798,027, respectively.
Supplementary Payment Reserve
2009 2008
Balances at December 31 $ 447,402 $ 447,402
The Supplementary Payment Reserve receives amounts transferred from the Investment and Interest Reserve forsupplemental increases in annuity for certain eligible retirees. This reserve is fully funded.
Child’s Annuity Reserve
Amounts contributed by the City for child’s annuity are credited to the Child’s Annuity Reserve, and payments of child’sannuity are charged to this reserve.
Duty Disability Reserve
The Duty Disability Reserve is increased by the City’s contributions for duty disability benefits, child’s disabilitybenefits, and compensation annuities and is decreased by the payments of these benefits.
Ordinary Disability Reserve
Amounts contributed by the City for ordinary disability benefits are credited to the Ordinary Disability Reserve.Payments of ordinary disability benefits are charged to this reserve.
Hospitalization Fund Reserve
The health care premiums are paid from the tax levies and are credited to the reserve for Group Hospitalization Fund.Premium payments to the City are charged against this reserve.
Expense Reserve
Amounts contributed toward the cost of administration are credited to the Expense Reserve, while expenses ofadministration are charged to this reserve.
29527_Body 9/13/10 7:58 AM Page 25
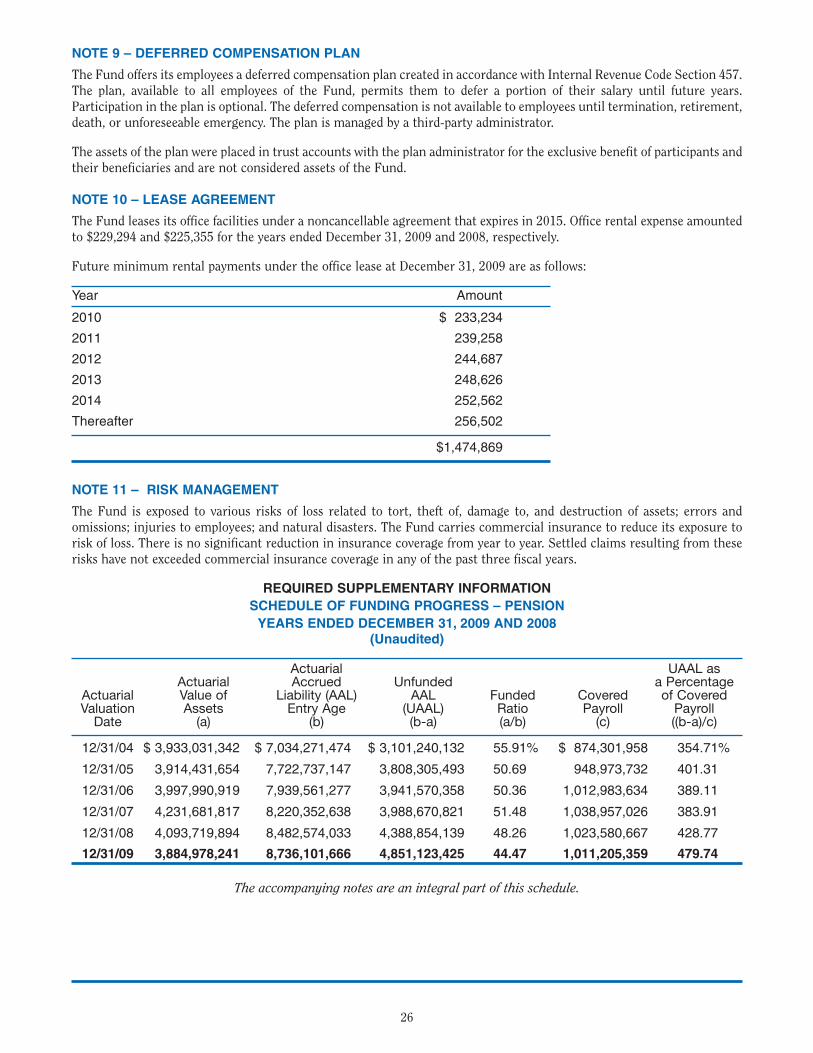
NOTE 9 – DEFERRED COMPENSATION PLAN
The Fund offers its employees a deferred compensation plan created in accordance with Internal Revenue Code Section 457.The plan, available to all employees of the Fund, permits them to defer a portion of their salary until future years.Participation in the plan is optional. The deferred compensation is not available to employees until termination, retirement,death, or unforeseeable emergency. The plan is managed by a third-party administrator.
The assets of the plan were placed in trust accounts with the plan administrator for the exclusive benefit of participants andtheir beneficiaries and are not considered assets of the Fund.
NOTE 10 – LEASE AGREEMENT
The Fund leases its office facilities under a noncancellable agreement that expires in 2015. Office rental expense amountedto $229,294 and $225,355 for the years ended December 31, 2009 and 2008, respectively.
Future minimum rental payments under the office lease at December 31, 2009 are as follows:
Year Amount
2010 $ 233,234
2011 239,258
2012 244,687
2013 248,626
2014 252,562
Thereafter 256,502
$1,474,869
NOTE 11 – RISK MANAGEMENT
The Fund is exposed to various risks of loss related to tort, theft of, damage to, and destruction of assets; errors andomissions; injuries to employees; and natural disasters. The Fund carries commercial insurance to reduce its exposure torisk of loss. There is no significant reduction in insurance coverage from year to year. Settled claims resulting from theserisks have not exceeded commercial insurance coverage in any of the past three fiscal years.
REQUIRED SUPPLEMENTARY INFORMATION
SCHEDULE OF FUNDING PROGRESS – PENSION
YEARS ENDED DECEMBER 31, 2009 AND 2008(Unaudited)
Actuarial UAAL asActuarial Accrued Unfunded a Percentage
Actuarial Value of Liability (AAL) AAL Funded Covered of CoveredValuation Assets Entry Age (UAAL) Ratio Payroll Payroll
Date (a) (b) (b-a) (a/b) (c) ((b-a)/c)
12/31/04 $ 3,933,031,342 $ 7,034,271,474 $ 3,101,240,132 55.91% $ 874,301,958 354.71%
12/31/05 3,914,431,654 7,722,737,147 3,808,305,493 50.69 948,973,732 401.31
12/31/06 3,997,990,919 7,939,561,277 3,941,570,358 50.36 1,012,983,634 389.11
12/31/07 4,231,681,817 8,220,352,638 3,988,670,821 51.48 1,038,957,026 383.91
12/31/08 4,093,719,894 8,482,574,033 4,388,854,139 48.26 1,023,580,667 428.77
12/31/09 3,884,978,241 8,736,101,666 4,851,123,425 44.47 1,011,205,359 479.74
The accompanying notes are an integral part of this schedule.
26
29527_Body 9/14/10 2:36 PM Page 26
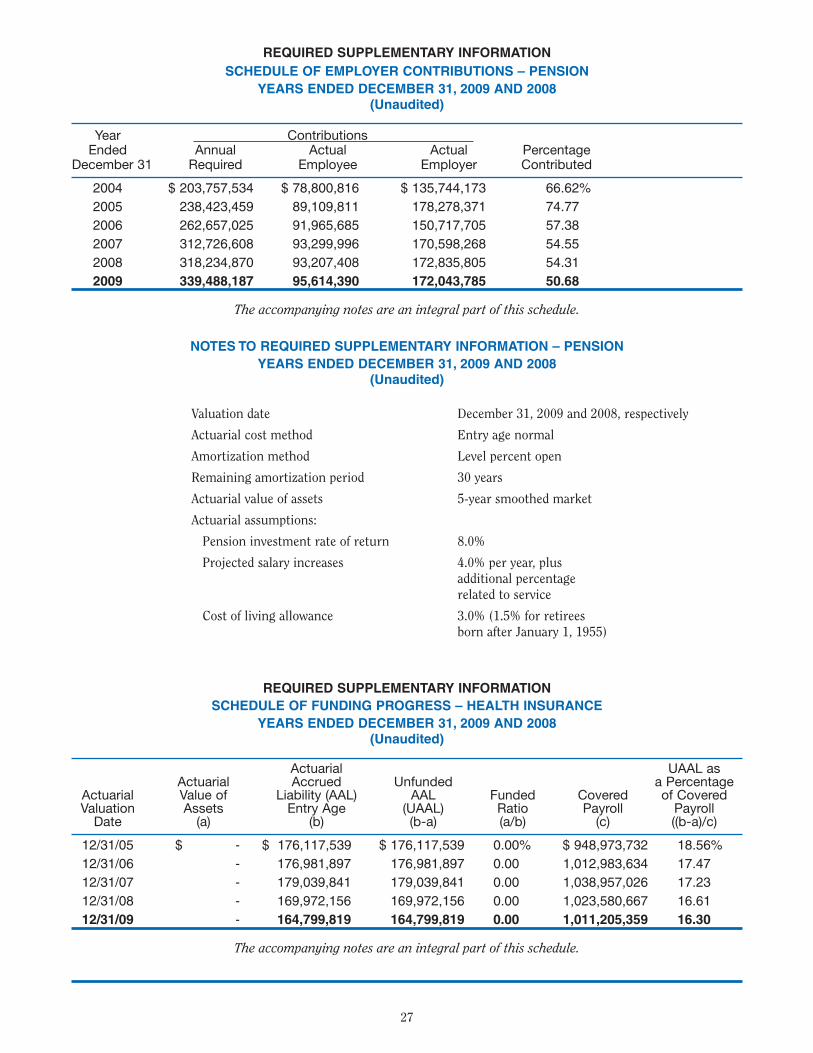
REQUIRED SUPPLEMENTARY INFORMATION
SCHEDULE OF EMPLOYER CONTRIBUTIONS – PENSION
YEARS ENDED DECEMBER 31, 2009 AND 2008(Unaudited)
Year Contributions Ended Annual Actual Actual Percentage
December 31 Required Employee Employer Contributed
2004 $ 203,757,534 $ 78,800,816 $ 135,744,173 66.62%
2005 238,423,459 89,109,811 178,278,371 74.77
2006 262,657,025 91,965,685 150,717,705 57.38
2007 312,726,608 93,299,996 170,598,268 54.55
2008 318,234,870 93,207,408 172,835,805 54.31
2009 339,488,187 95,614,390 172,043,785 50.68
The accompanying notes are an integral part of this schedule.
NOTES TO REQUIRED SUPPLEMENTARY INFORMATION – PENSION
YEARS ENDED DECEMBER 31, 2009 AND 2008(Unaudited)
Valuation date December 31, 2009 and 2008, respectively
Actuarial cost method Entry age normal
Amortization method Level percent open
Remaining amortization period 30 years
Actuarial value of assets 5-year smoothed market
Actuarial assumptions:
Pension investment rate of return 8.0%
Projected salary increases 4.0% per year, plusadditional percentagerelated to service
Cost of living allowance 3.0% (1.5% for retireesborn after January 1, 1955)
REQUIRED SUPPLEMENTARY INFORMATION
SCHEDULE OF FUNDING PROGRESS – HEALTH INSURANCE
YEARS ENDED DECEMBER 31, 2009 AND 2008(Unaudited)
Actuarial UAAL asActuarial Accrued Unfunded a Percentage
Actuarial Value of Liability (AAL) AAL Funded Covered of CoveredValuation Assets Entry Age (UAAL) Ratio Payroll Payroll
Date (a) (b) (b-a) (a/b) (c) ((b-a)/c)
12/31/05 $ - $ 176,117,539 $ 176,117,539 0.00% $ 948,973,732 18.56%
12/31/06 - 176,981,897 176,981,897 0.00 1,012,983,634 17.47
12/31/07 - 179,039,841 179,039,841 0.00 1,038,957,026 17.23
12/31/08 - 169,972,156 169,972,156 0.00 1,023,580,667 16.61
12/31/09 - 164,799,819 164,799,819 0.00 1,011,205,359 16.30
The accompanying notes are an integral part of this schedule.
27
29527_Body 9/14/10 2:36 PM Page 27
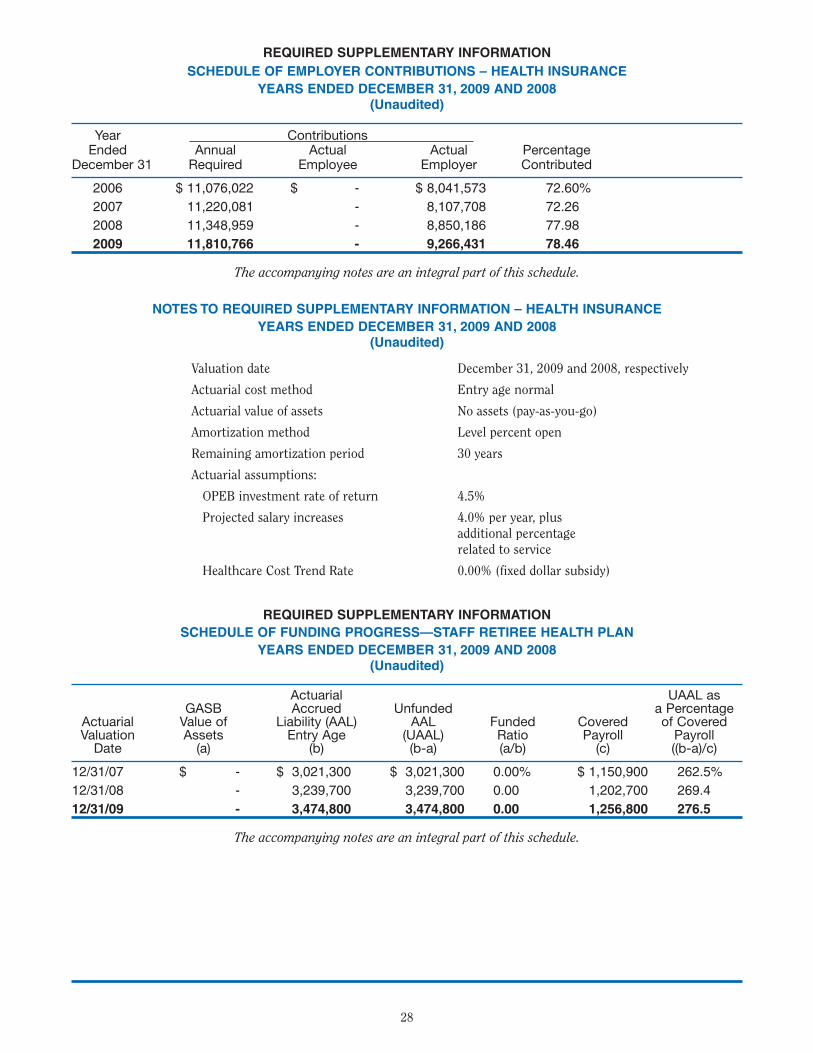
28
REQUIRED SUPPLEMENTARY INFORMATION
SCHEDULE OF EMPLOYER CONTRIBUTIONS – HEALTH INSURANCE
YEARS ENDED DECEMBER 31, 2009 AND 2008(Unaudited)
Year Contributions Ended Annual Actual Actual Percentage
December 31 Required Employee Employer Contributed
2006 $ 11,076,022 $ - $ 8,041,573 72.60%
2007 11,220,081 - 8,107,708 72.26
2008 11,348,959 - 8,850,186 77.98
2009 11,810,766 - 9,266,431 78.46
The accompanying notes are an integral part of this schedule.
NOTES TO REQUIRED SUPPLEMENTARY INFORMATION – HEALTH INSURANCE
YEARS ENDED DECEMBER 31, 2009 AND 2008(Unaudited)
Valuation date December 31, 2009 and 2008, respectively
Actuarial cost method Entry age normal
Actuarial value of assets No assets (pay-as-you-go)
Amortization method Level percent open
Remaining amortization period 30 years
Actuarial assumptions:
OPEB investment rate of return 4.5%
Projected salary increases 4.0% per year, plusadditional percentagerelated to service
Healthcare Cost Trend Rate 0.00% (fixed dollar subsidy)
REQUIRED SUPPLEMENTARY INFORMATION
SCHEDULE OF FUNDING PROGRESS—STAFF RETIREE HEALTH PLAN
YEARS ENDED DECEMBER 31, 2009 AND 2008(Unaudited)
Actuarial UAAL asGASB Accrued Unfunded a Percentage
Actuarial Value of Liability (AAL) AAL Funded Covered of CoveredValuation Assets Entry Age (UAAL) Ratio Payroll Payroll
Date (a) (b) (b-a) (a/b) (c) ((b-a)/c)
12/31/07 $ - $ 3,021,300 $ 3,021,300 0.00% $ 1,150,900 262.5%
12/31/08 - 3,239,700 3,239,700 0.00 1,202,700 269.4
12/31/09 - 3,474,800 3,474,800 0.00 1,256,800 276.5
The accompanying notes are an integral part of this schedule.
29527_Body 9/13/10 7:59 AM Page 28
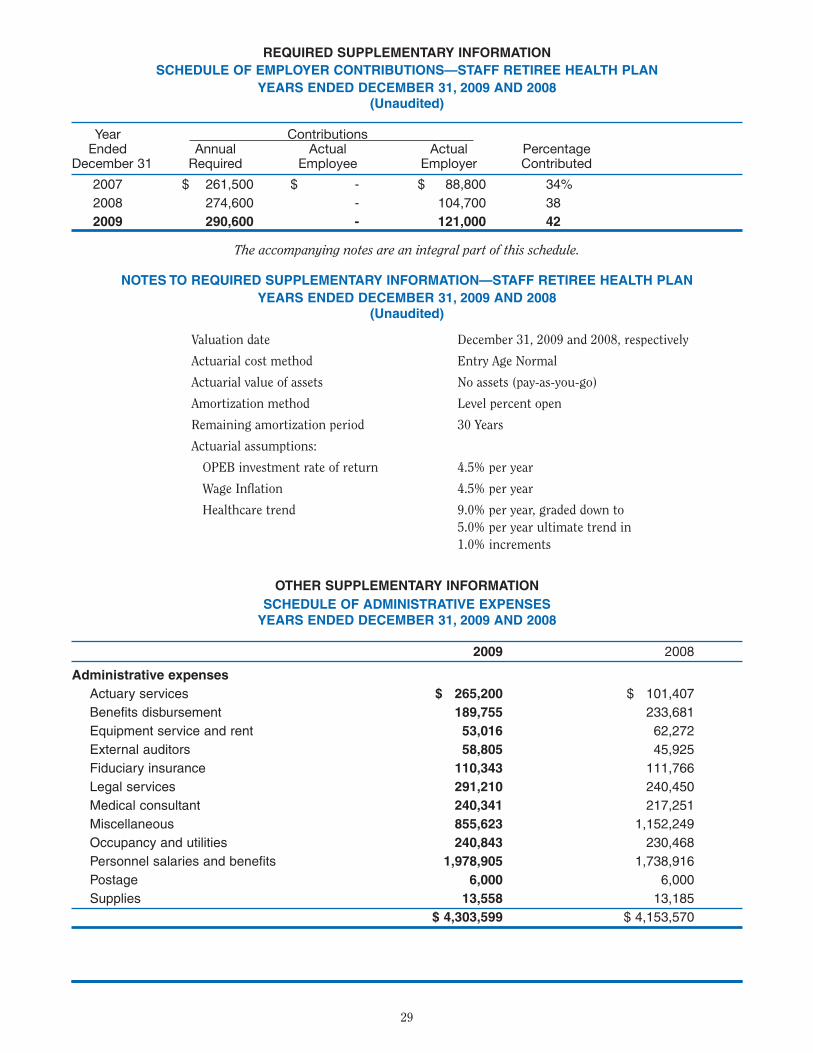
REQUIRED SUPPLEMENTARY INFORMATION
SCHEDULE OF EMPLOYER CONTRIBUTIONS—STAFF RETIREE HEALTH PLAN
YEARS ENDED DECEMBER 31, 2009 AND 2008(Unaudited)
Year Contributions Ended Annual Actual Actual Percentage
December 31 Required Employee Employer Contributed
2007 $ 261,500 $ - $ 88,800 34%
2008 274,600 - 104,700 38
2009 290,600 - 121,000 42
The accompanying notes are an integral part of this schedule.
NOTES TO REQUIRED SUPPLEMENTARY INFORMATION—STAFF RETIREE HEALTH PLAN
YEARS ENDED DECEMBER 31, 2009 AND 2008(Unaudited)
Valuation date December 31, 2009 and 2008, respectively
Actuarial cost method Entry Age Normal
Actuarial value of assets No assets (pay-as-you-go)
Amortization method Level percent open
Remaining amortization period 30 Years
Actuarial assumptions:
OPEB investment rate of return 4.5% per year
Wage Inflation 4.5% per year
Healthcare trend 9.0% per year, graded down to5.0% per year ultimate trend in1.0% increments
OTHER SUPPLEMENTARY INFORMATION
SCHEDULE OF ADMINISTRATIVE EXPENSESYEARS ENDED DECEMBER 31, 2009 AND 2008
2009 2008
Administrative expenses
Actuary services $ 265,200 $ 101,407
Benefits disbursement 189,755 233,681
Equipment service and rent 53,016 62,272
External auditors 58,805 45,925
Fiduciary insurance 110,343 111,766
Legal services 291,210 240,450
Medical consultant 240,341 217,251
Miscellaneous 855,623 1,152,249
Occupancy and utilities 240,843 230,468
Personnel salaries and benefits 1,978,905 1,738,916
Postage 6,000 6,000
Supplies 13,558 13,185
$ 4,303,599 $ 4,153,570
29
29527_Body 9/14/10 2:37 PM Page 29
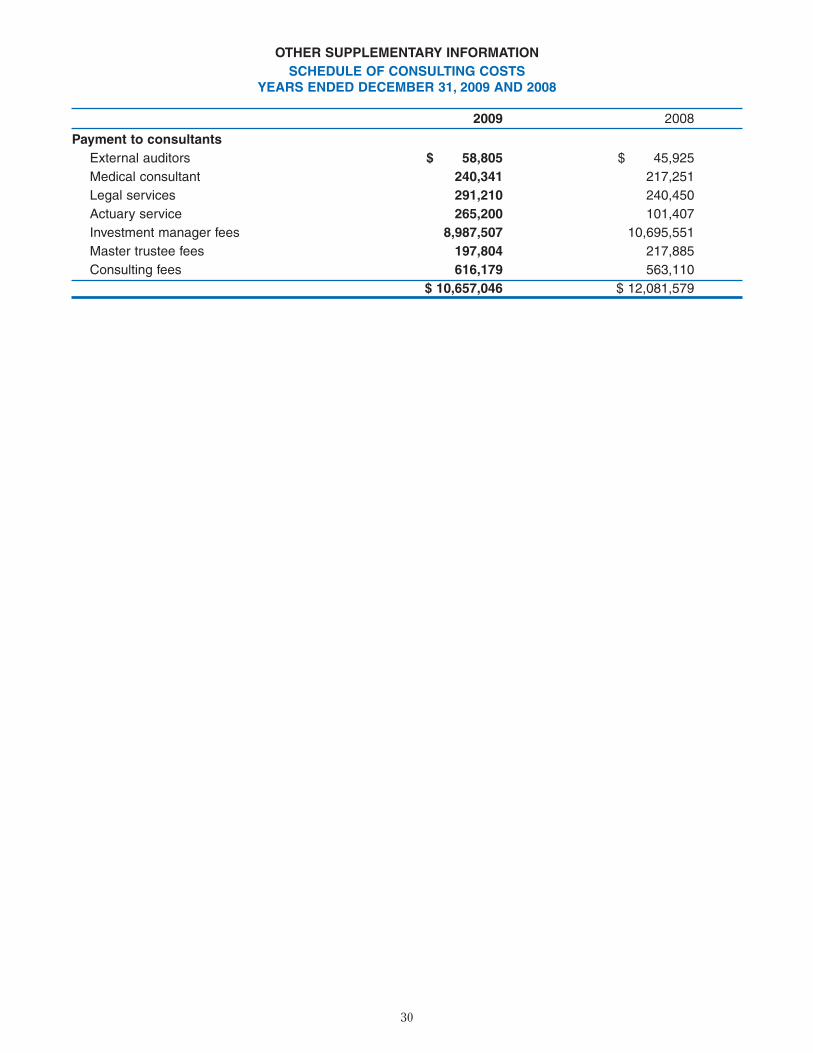
30
OTHER SUPPLEMENTARY INFORMATION
SCHEDULE OF CONSULTING COSTSYEARS ENDED DECEMBER 31, 2009 AND 2008
2009 2008
Payment to consultants
External auditors $ 58,805 $ 45,925
Medical consultant 240,341 217,251
Legal services 291,210 240,450
Actuary service 265,200 101,407
Investment manager fees 8,987,507 10,695,551
Master trustee fees 197,804 217,885
Consulting fees 616,179 563,110
$ 10,657,046 $ 12,081,579
29527_Body 9/13/10 8:00 AM Page 30
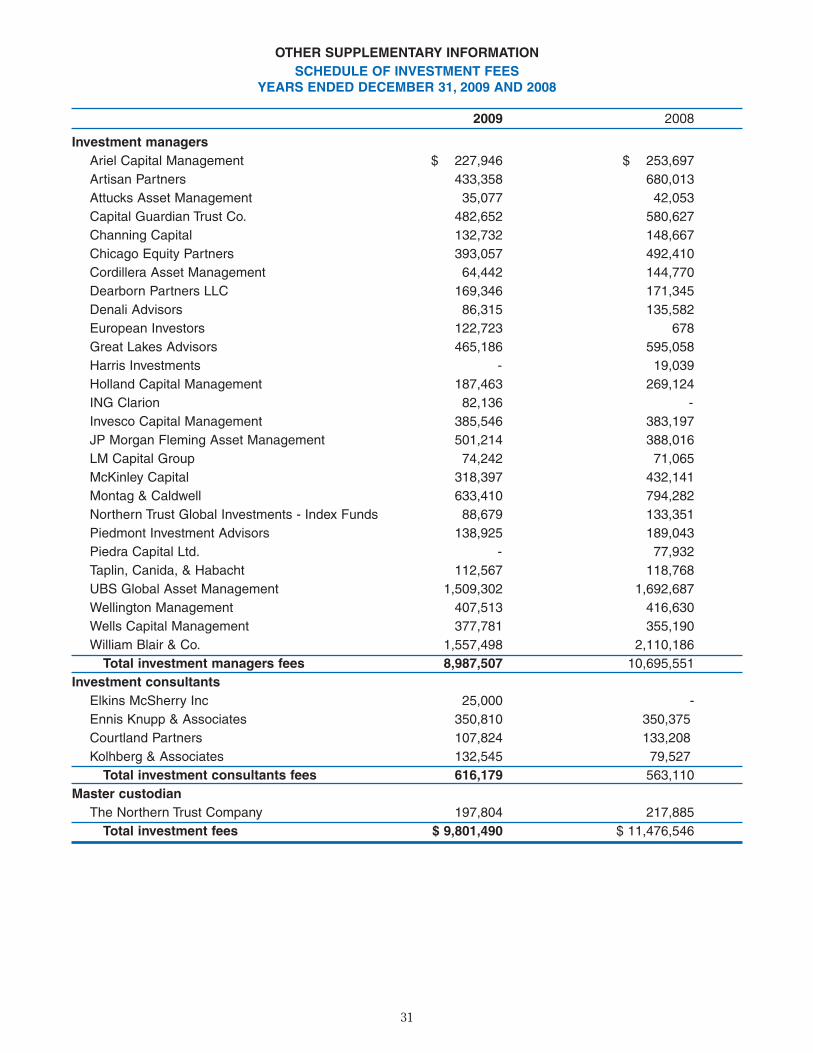
31
OTHER SUPPLEMENTARY INFORMATION
SCHEDULE OF INVESTMENT FEESYEARS ENDED DECEMBER 31, 2009 AND 2008
2009 2008
Investment managers
Ariel Capital Management $ 227,946 $ 253,697
Artisan Partners 433,358 680,013
Attucks Asset Management 35,077 42,053
Capital Guardian Trust Co. 482,652 580,627
Channing Capital 132,732 148,667
Chicago Equity Partners 393,057 492,410
Cordillera Asset Management 64,442 144,770
Dearborn Partners LLC 169,346 171,345
Denali Advisors 86,315 135,582
European Investors 122,723 678
Great Lakes Advisors 465,186 595,058
Harris Investments - 19,039
Holland Capital Management 187,463 269,124
ING Clarion 82,136 -
Invesco Capital Management 385,546 383,197
JP Morgan Fleming Asset Management 501,214 388,016
LM Capital Group 74,242 71,065
McKinley Capital 318,397 432,141
Montag & Caldwell 633,410 794,282
Northern Trust Global Investments - Index Funds 88,679 133,351
Piedmont Investment Advisors 138,925 189,043
Piedra Capital Ltd. - 77,932
Taplin, Canida, & Habacht 112,567 118,768
UBS Global Asset Management 1,509,302 1,692,687
Wellington Management 407,513 416,630
Wells Capital Management 377,781 355,190
William Blair & Co. 1,557,498 2,110,186
Total investment managers fees 8,987,507 10,695,551
Investment consultants
Elkins McSherry Inc 25,000 -
Ennis Knupp & Associates 350,810 350,375
Courtland Partners 107,824 133,208
Kolhberg & Associates 132,545 79,527
Total investment consultants fees 616,179 563,110
Master custodian
The Northern Trust Company 197,804 217,885
Total investment fees $ 9,801,490 $ 11,476,546
29527_Body 9/13/10 8:00 AM Page 31
April 19, 2010
Board of TrusteesPolicemen's Annuity and Benefit FundCity of Chicago221 North LaSalle Street, Suite 1626Chicago, IL 60601
Subject: Actuarial Valuation Report for the Year Ending December 31, 2009
Dear Members of the Board:
At your request, we have performed an actuarial valuation for the Policemen’s Annuity and Benefit Fund ofChicago (“the Fund”) as of December 31, 2009. This valuation has been performed to measure the funded statusof the Fund and to determine the contribution levels for 2010. In addition, it includes disclosure informationrequired under GASB Statement No. 25, Statement No. 27, Statement No. 43, and Statement No. 45. Theseactuarial valuations of the Fund are performed annually.
We have prepared the supporting schedules for the actuarial section of the comprehensive annual financialreport, including:
• Summary of Actuarial Valuation Methods and Assumptions• Schedule of Active Member Data• Retirements and Beneficiaries Added to and Removed from Rolls• Solvency (Termination) Test• Development of Annual Required Contributions under GASB Statements No. 25 and No. 43• Development of Actuarial Gains and Losses• Summary of Basic Actuarial Values• Schedule of Average Benefit Payments for New Annuities Granted in 2009• Schedule of Retired Members by Types and Amounts of Benefits
We have also provided the following schedules in the financial section of the report.
• Schedule of Funding Progress• Schedule of Employer Contributions• Notes to Required Supplementary Information
Actuarial Information
32
29527_Body 10/1/10 9:17 AM Page 32
This valuation is based upon:
Data relative to the members of the Fund ⎯ Data for active members and persons receiving benefits fromthe Fund was provided by the Fund’s staff. We have tested this data for reasonableness.
Asset Values ⎯ The value of assets of the Fund was provided by the Fund’s staff. Book values of assets areused to develop actuarial results for the state reporting basis. Actuarial value of assets are used for financialreporting under GASB Statement No. 25 and Statement No. 27.
Actuarial Method ⎯ The actuarial method utilized by the Fund is the Entry-Age Normal Actuarial CostMethod. The objective of this method is to amortize the costs of Fund benefits over the entire career of eachmember as a level of percentage of compensation. Any Unfunded Actuarial Accrued Liability (UAAL) underthis method is separately financed. All actuarial gains and losses under this method are reflected in theUAAL.
Actuarial Assumptions ⎯ The actuarial assumptions have been changed since the last report to reflect theresults of the experience study performed for the period of January 1, 2003 through December 31, 2008. Theassumptions used are set forth in Appendix 4: Actuarial Methods and Assumptions of the Valuation Report.
The funding objective is to provide employer and employee contributions sufficient to provide the benefits of theFund when due. The provision of State Law establishing the Fund constrains employer contributions to be twicethe employee contribution level in the second prior fiscal year. Thus, with an administrative lag, the employercontribution is designed to match the employee contribution in a 2:1 relationship. The most recent actuarialvaluation of the Fund on the State reporting basis shows that a ratio of 5.87:1 is needed to adequately financethe Fund.
The valuation results set forth in this report are based on the data and actuarial techniques described above, andupon the provision of the Fund as of the valuation date. Based on these items, we certify these results to be trueand correct.
Respectfully yours,
Alex Rivera, FSA Michael R. Kivi, FSASenior Consultant Senior Consultant
33
29527_Body 9/14/10 2:37 PM Page 33
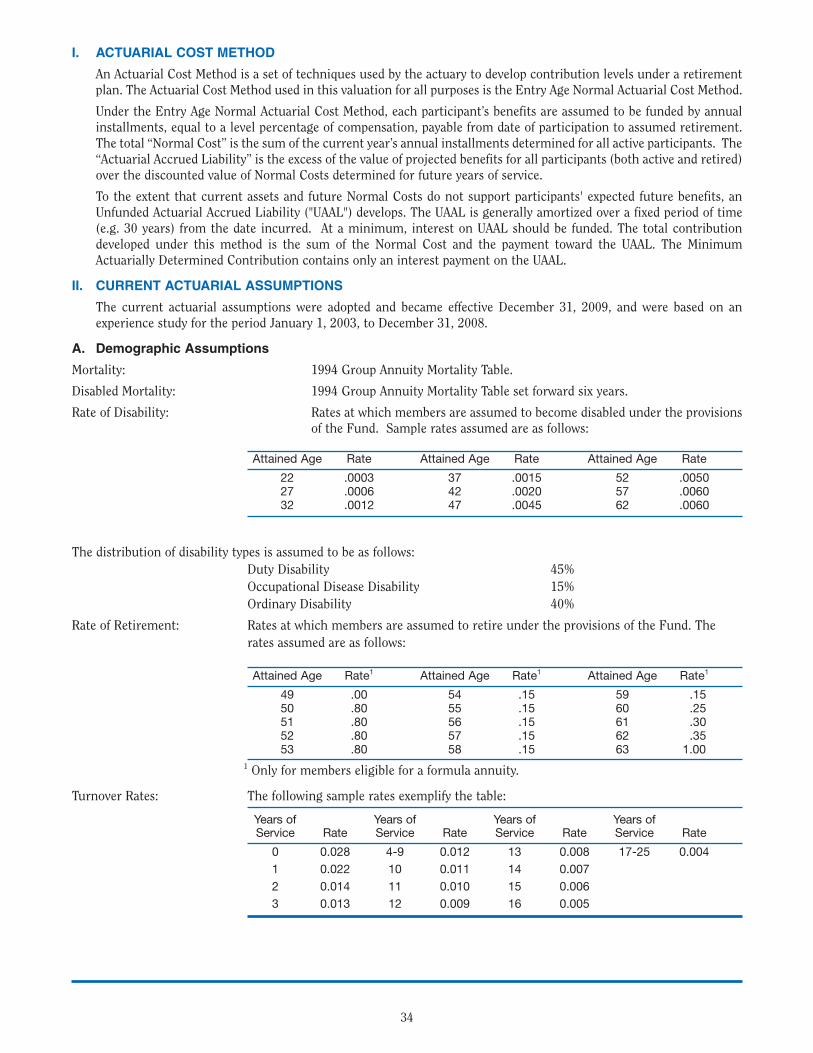
I. ACTUARIAL COST METHOD
An Actuarial Cost Method is a set of techniques used by the actuary to develop contribution levels under a retirementplan. The Actuarial Cost Method used in this valuation for all purposes is the Entry Age Normal Actuarial Cost Method.
Under the Entry Age Normal Actuarial Cost Method, each participant’s benefits are assumed to be funded by annualinstallments, equal to a level percentage of compensation, payable from date of participation to assumed retirement.The total “Normal Cost” is the sum of the current year’s annual installments determined for all active participants. The“Actuarial Accrued Liability” is the excess of the value of projected benefits for all participants (both active and retired)over the discounted value of Normal Costs determined for future years of service.
To the extent that current assets and future Normal Costs do not support participants' expected future benefits, anUnfunded Actuarial Accrued Liability ("UAAL") develops. The UAAL is generally amortized over a fixed period of time(e.g. 30 years) from the date incurred. At a minimum, interest on UAAL should be funded. The total contributiondeveloped under this method is the sum of the Normal Cost and the payment toward the UAAL. The MinimumActuarially Determined Contribution contains only an interest payment on the UAAL.
II. CURRENT ACTUARIAL ASSUMPTIONS
The current actuarial assumptions were adopted and became effective December 31, 2009, and were based on anexperience study for the period January 1, 2003, to December 31, 2008.
A. Demographic Assumptions
Mortality: 1994 Group Annuity Mortality Table.
Disabled Mortality: 1994 Group Annuity Mortality Table set forward six years.
Rate of Disability: Rates at which members are assumed to become disabled under the provisionsof the Fund. Sample rates assumed are as follows:
Attained Age Rate Attained Age Rate Attained Age Rate
22 .0003 37 .0015 52 .005027 .0006 42 .0020 57 .006032 .0012 47 .0045 62 .0060
The distribution of disability types is assumed to be as follows:Duty Disability 45%Occupational Disease Disability 15%Ordinary Disability 40%
Rate of Retirement: Rates at which members are assumed to retire under the provisions of the Fund. Therates assumed are as follows:
Attained Age Rate1 Attained Age Rate1 Attained Age Rate1
49 .00 54 .15 59 .1550 .80 55 .15 60 .2551 .80 56 .15 61 .3052 .80 57 .15 62 .3553 .80 58 .15 63 1.00
1 Only for members eligible for a formula annuity.
Turnover Rates: The following sample rates exemplify the table:
Years of Years of Years of Years ofService Rate Service Rate Service Rate Service Rate
0 0.028 4-9 0.012 13 0.008 17-25 0.0041 0.022 10 0.011 14 0.0072 0.014 11 0.010 15 0.0063 0.013 12 0.009 16 0.005
34
29527_Body 9/14/10 2:50 PM Page 34
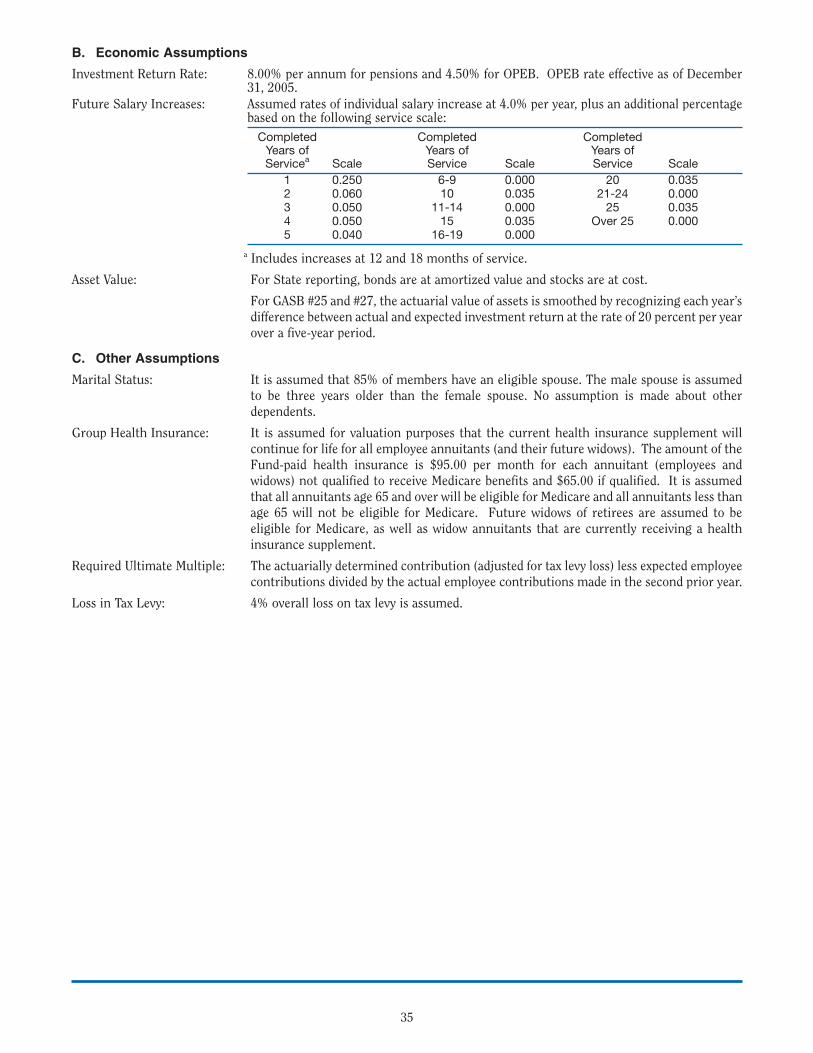
B. Economic Assumptions
Investment Return Rate: 8.00% per annum for pensions and 4.50% for OPEB. OPEB rate effective as of December31, 2005.
Future Salary Increases: Assumed rates of individual salary increase at 4.0% per year, plus an additional percentagebased on the following service scale:
Completed Completed CompletedYears of Years of Years ofServicea Scale Service Scale Service Scale
1 0.250 6-9 0.000 20 0.0352 0.060 10 0.035 21-24 0.0003 0.050 11-14 0.000 25 0.0354 0.050 15 0.035 Over 25 0.0005 0.040 16-19 0.000
a Includes increases at 12 and 18 months of service.
Asset Value: For State reporting, bonds are at amortized value and stocks are at cost.
For GASB #25 and #27, the actuarial value of assets is smoothed by recognizing each year’sdifference between actual and expected investment return at the rate of 20 percent per yearover a five-year period.
C. Other Assumptions
Marital Status: It is assumed that 85% of members have an eligible spouse. The male spouse is assumedto be three years older than the female spouse. No assumption is made about otherdependents.
Group Health Insurance: It is assumed for valuation purposes that the current health insurance supplement willcontinue for life for all employee annuitants (and their future widows). The amount of theFund-paid health insurance is $95.00 per month for each annuitant (employees andwidows) not qualified to receive Medicare benefits and $65.00 if qualified. It is assumedthat all annuitants age 65 and over will be eligible for Medicare and all annuitants less thanage 65 will not be eligible for Medicare. Future widows of retirees are assumed to beeligible for Medicare, as well as widow annuitants that are currently receiving a healthinsurance supplement.
Required Ultimate Multiple: The actuarially determined contribution (adjusted for tax levy loss) less expected employeecontributions divided by the actual employee contributions made in the second prior year.
Loss in Tax Levy: 4% overall loss on tax levy is assumed.
35
29527_Body 9/13/10 8:02 AM Page 35
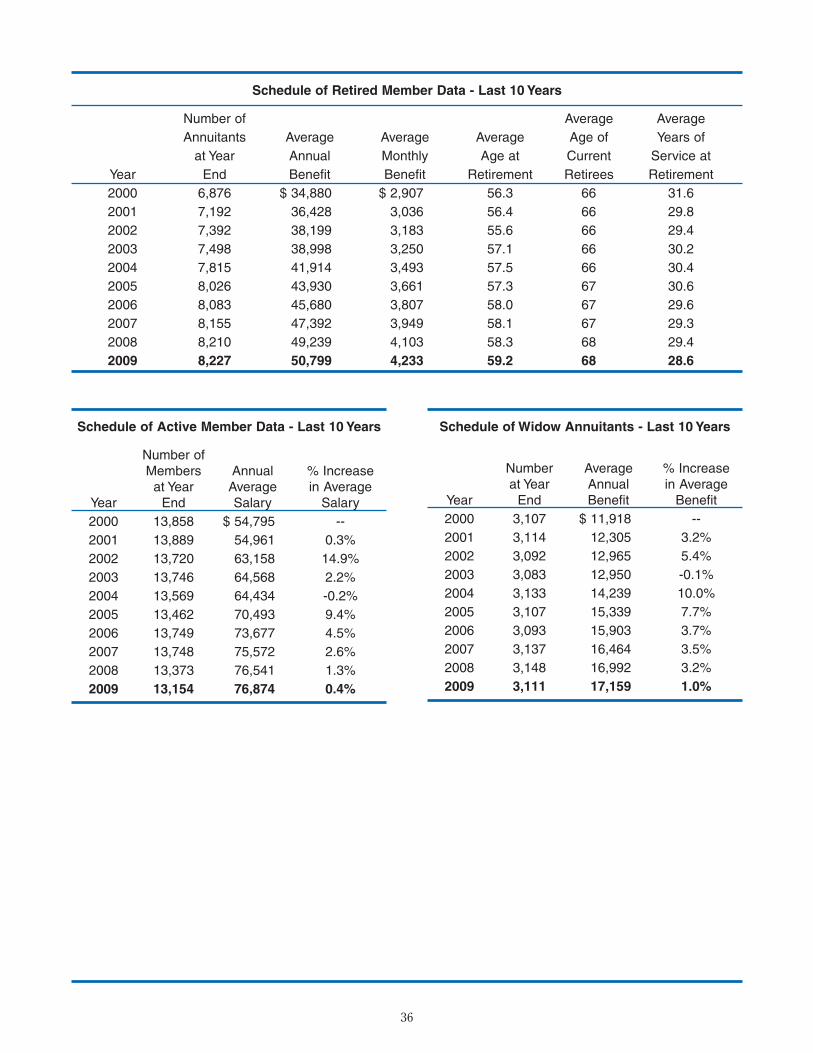
Schedule of Retired Member Data - Last 10 Years
Number of Average Average
Annuitants Average Average Average Age of Years of
at Year Annual Monthly Age at Current Service at
Year End Benefit Benefit Retirement Retirees Retirement
2000 6,876 $ 34,880 $ 2,907 56.3 66 31.6
2001 7,192 36,428 3,036 56.4 66 29.8
2002 7,392 38,199 3,183 55.6 66 29.4
2003 7,498 38,998 3,250 57.1 66 30.2
2004 7,815 41,914 3,493 57.5 66 30.4
2005 8,026 43,930 3,661 57.3 67 30.6
2006 8,083 45,680 3,807 58.0 67 29.6
2007 8,155 47,392 3,949 58.1 67 29.3
2008 8,210 49,239 4,103 58.3 68 29.4
2009 8,227 50,799 4,233 59.2 68 28.6
36
Schedule of Active Member Data - Last 10 Years
Number ofMembers Annual % Increase
at Year Average in AverageYear End Salary Salary
2000 13,858 $ 54,795 --
2001 13,889 54,961 0.3%
2002 13,720 63,158 14.9%
2003 13,746 64,568 2.2%
2004 13,569 64,434 -0.2%
2005 13,462 70,493 9.4%
2006 13,749 73,677 4.5%
2007 13,748 75,572 2.6%
2008 13,373 76,541 1.3%
2009 13,154 76,874 0.4%
Schedule of Widow Annuitants - Last 10 Years
Number Average % Increaseat Year Annual in Average
Year End Benefit Benefit
2000 3,107 $ 11,918 --
2001 3,114 12,305 3.2%
2002 3,092 12,965 5.4%
2003 3,083 12,950 -0.1%
2004 3,133 14,239 10.0%
2005 3,107 15,339 7.7%
2006 3,093 15,903 3.7%
2007 3,137 16,464 3.5%
2008 3,148 16,992 3.2%
2009 3,111 17,159 1.0%
29527_Body 10/1/10 9:17 AM Page 36
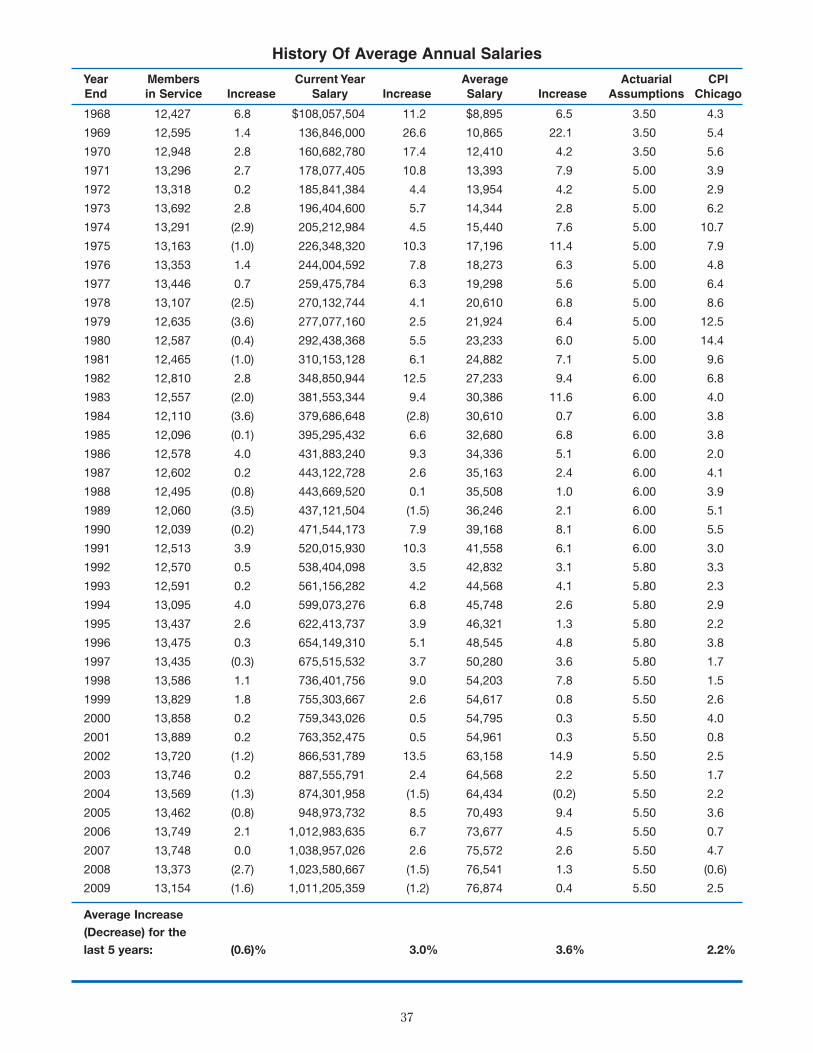
37
History Of Average Annual Salaries
Year Members Current Year Average Actuarial CPI
End in Service Increase Salary Increase Salary Increase Assumptions Chicago
1968 12,427 6.8 $108,057,504 11.2 $8,895 6.5 3.50 4.3
1969 12,595 1.4 136,846,000 26.6 10,865 22.1 3.50 5.4
1970 12,948 2.8 160,682,780 17.4 12,410 4.2 3.50 5.6
1971 13,296 2.7 178,077,405 10.8 13,393 7.9 5.00 3.9
1972 13,318 0.2 185,841,384 4.4 13,954 4.2 5.00 2.9
1973 13,692 2.8 196,404,600 5.7 14,344 2.8 5.00 6.2
1974 13,291 (2.9) 205,212,984 4.5 15,440 7.6 5.00 10.7
1975 13,163 (1.0) 226,348,320 10.3 17,196 11.4 5.00 7.9
1976 13,353 1.4 244,004,592 7.8 18,273 6.3 5.00 4.8
1977 13,446 0.7 259,475,784 6.3 19,298 5.6 5.00 6.4
1978 13,107 (2.5) 270,132,744 4.1 20,610 6.8 5.00 8.6
1979 12,635 (3.6) 277,077,160 2.5 21,924 6.4 5.00 12.5
1980 12,587 (0.4) 292,438,368 5.5 23,233 6.0 5.00 14.4
1981 12,465 (1.0) 310,153,128 6.1 24,882 7.1 5.00 9.6
1982 12,810 2.8 348,850,944 12.5 27,233 9.4 6.00 6.8
1983 12,557 (2.0) 381,553,344 9.4 30,386 11.6 6.00 4.0
1984 12,110 (3.6) 379,686,648 (2.8) 30,610 0.7 6.00 3.8
1985 12,096 (0.1) 395,295,432 6.6 32,680 6.8 6.00 3.8
1986 12,578 4.0 431,883,240 9.3 34,336 5.1 6.00 2.0
1987 12,602 0.2 443,122,728 2.6 35,163 2.4 6.00 4.1
1988 12,495 (0.8) 443,669,520 0.1 35,508 1.0 6.00 3.9
1989 12,060 (3.5) 437,121,504 (1.5) 36,246 2.1 6.00 5.1
1990 12,039 (0.2) 471,544,173 7.9 39,168 8.1 6.00 5.5
1991 12,513 3.9 520,015,930 10.3 41,558 6.1 6.00 3.0
1992 12,570 0.5 538,404,098 3.5 42,832 3.1 5.80 3.3
1993 12,591 0.2 561,156,282 4.2 44,568 4.1 5.80 2.3
1994 13,095 4.0 599,073,276 6.8 45,748 2.6 5.80 2.9
1995 13,437 2.6 622,413,737 3.9 46,321 1.3 5.80 2.2
1996 13,475 0.3 654,149,310 5.1 48,545 4.8 5.80 3.8
1997 13,435 (0.3) 675,515,532 3.7 50,280 3.6 5.80 1.7
1998 13,586 1.1 736,401,756 9.0 54,203 7.8 5.50 1.5
1999 13,829 1.8 755,303,667 2.6 54,617 0.8 5.50 2.6
2000 13,858 0.2 759,343,026 0.5 54,795 0.3 5.50 4.0
2001 13,889 0.2 763,352,475 0.5 54,961 0.3 5.50 0.8
2002 13,720 (1.2) 866,531,789 13.5 63,158 14.9 5.50 2.5
2003 13,746 0.2 887,555,791 2.4 64,568 2.2 5.50 1.7
2004 13,569 (1.3) 874,301,958 (1.5) 64,434 (0.2) 5.50 2.2
2005 13,462 (0.8) 948,973,732 8.5 70,493 9.4 5.50 3.6
2006 13,749 2.1 1,012,983,635 6.7 73,677 4.5 5.50 0.7
2007 13,748 0.0 1,038,957,026 2.6 75,572 2.6 5.50 4.7
2008 13,373 (2.7) 1,023,580,667 (1.5) 76,541 1.3 5.50 (0.6)
2009 13,154 (1.6) 1,011,205,359 (1.2) 76,874 0.4 5.50 2.5
Average Increase(Decrease) for thelast 5 years: (0.6)% 3.0% 3.6% 2.2%
29527_Body 9/13/10 8:03 AM Page 37
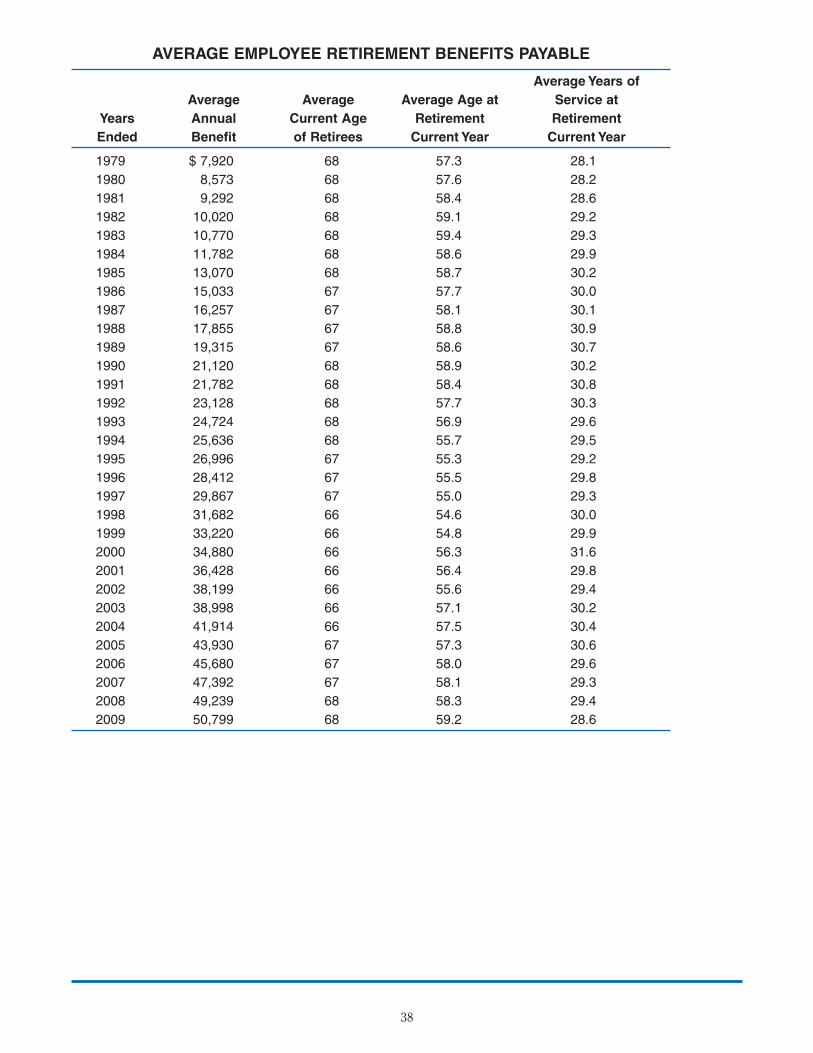
38
AVERAGE EMPLOYEE RETIREMENT BENEFITS PAYABLE
Average Years of
Average Average Average Age at Service at
Years Annual Current Age Retirement Retirement
Ended Benefit of Retirees Current Year Current Year
1979 $ 7,920 68 57.3 28.1
1980 8,573 68 57.6 28.2
1981 9,292 68 58.4 28.6
1982 10,020 68 59.1 29.2
1983 10,770 68 59.4 29.3
1984 11,782 68 58.6 29.9
1985 13,070 68 58.7 30.2
1986 15,033 67 57.7 30.0
1987 16,257 67 58.1 30.1
1988 17,855 67 58.8 30.9
1989 19,315 67 58.6 30.7
1990 21,120 68 58.9 30.2
1991 21,782 68 58.4 30.8
1992 23,128 68 57.7 30.3
1993 24,724 68 56.9 29.6
1994 25,636 68 55.7 29.5
1995 26,996 67 55.3 29.2
1996 28,412 67 55.5 29.8
1997 29,867 67 55.0 29.3
1998 31,682 66 54.6 30.0
1999 33,220 66 54.8 29.9
2000 34,880 66 56.3 31.6
2001 36,428 66 56.4 29.8
2002 38,199 66 55.6 29.4
2003 38,998 66 57.1 30.2
2004 41,914 66 57.5 30.4
2005 43,930 67 57.3 30.6
2006 45,680 67 58.0 29.6
2007 47,392 67 58.1 29.3
2008 49,239 68 58.3 29.4
2009 50,799 68 59.2 28.6
29527_Body 9/13/10 8:03 AM Page 38
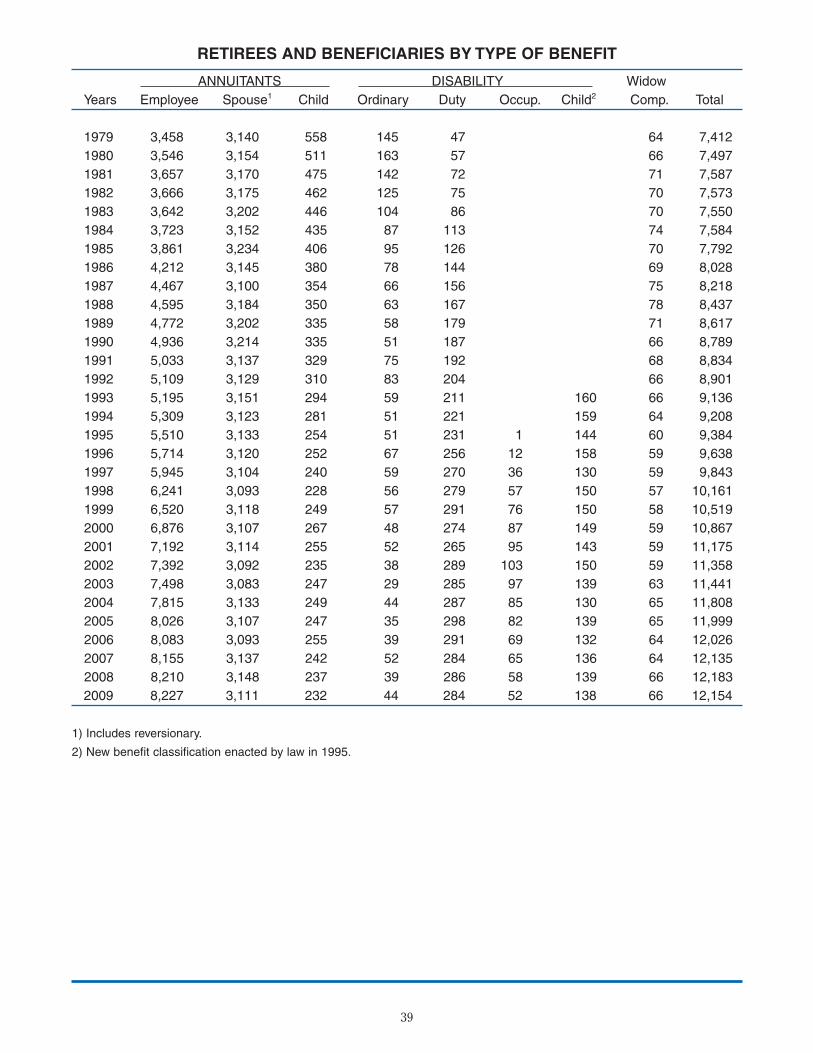
39
RETIREES AND BENEFICIARIES BY TYPE OF BENEFIT
ANNUITANTS DISABILITY Widow
Years Employee Spouse1 Child Ordinary Duty Occup. Child2 Comp. Total
1979 3,458 3,140 558 145 47 64 7,412
1980 3,546 3,154 511 163 57 66 7,497
1981 3,657 3,170 475 142 72 71 7,587
1982 3,666 3,175 462 125 75 70 7,573
1983 3,642 3,202 446 104 86 70 7,550
1984 3,723 3,152 435 87 113 74 7,584
1985 3,861 3,234 406 95 126 70 7,792
1986 4,212 3,145 380 78 144 69 8,028
1987 4,467 3,100 354 66 156 75 8,218
1988 4,595 3,184 350 63 167 78 8,437
1989 4,772 3,202 335 58 179 71 8,617
1990 4,936 3,214 335 51 187 66 8,789
1991 5,033 3,137 329 75 192 68 8,834
1992 5,109 3,129 310 83 204 66 8,901
1993 5,195 3,151 294 59 211 160 66 9,136
1994 5,309 3,123 281 51 221 159 64 9,208
1995 5,510 3,133 254 51 231 1 144 60 9,384
1996 5,714 3,120 252 67 256 12 158 59 9,638
1997 5,945 3,104 240 59 270 36 130 59 9,843
1998 6,241 3,093 228 56 279 57 150 57 10,161
1999 6,520 3,118 249 57 291 76 150 58 10,519
2000 6,876 3,107 267 48 274 87 149 59 10,867
2001 7,192 3,114 255 52 265 95 143 59 11,175
2002 7,392 3,092 235 38 289 103 150 59 11,358
2003 7,498 3,083 247 29 285 97 139 63 11,441
2004 7,815 3,133 249 44 287 85 130 65 11,808
2005 8,026 3,107 247 35 298 82 139 65 11,999
2006 8,083 3,093 255 39 291 69 132 64 12,026
2007 8,155 3,137 242 52 284 65 136 64 12,135
2008 8,210 3,148 237 39 286 58 139 66 12,183
2009 8,227 3,111 232 44 284 52 138 66 12,154
1) Includes reversionary.
2) New benefit classification enacted by law in 1995.
29527_Body 9/13/10 8:03 AM Page 39
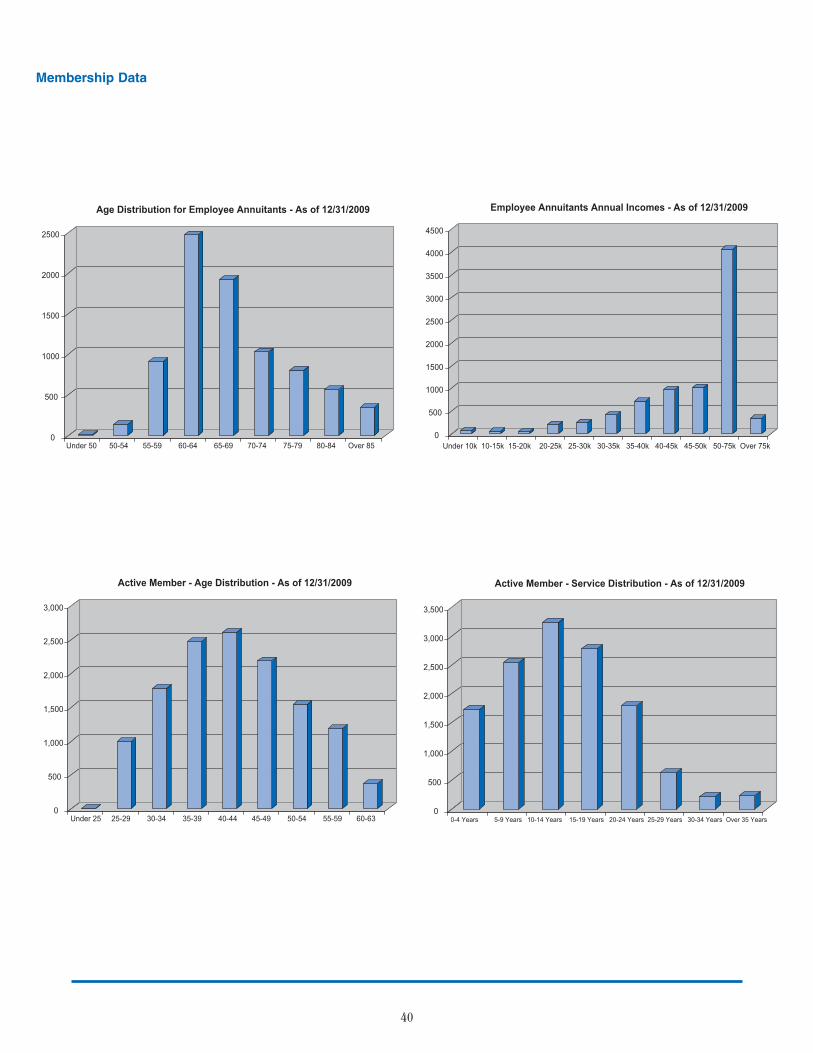
40
Membership Data
0
500
1000
1500
2000
2500
3000
3500
4000
4500
Under 10k 10-15k 15-20k 20-25k 25-30k 30-35k 35-40k 40-45k 45-50k 50-75k Over 75k
Employee Annuitants Annual Incomes - As of 12/31/2009
0
500
1000
1500
2000
2500
Under 50 50-54 55-59 60-64 65-69 70-74 75-79 80-84 Over 85
Age Distribution for Employee Annuitants - As of 12/31/2009
0
500
1,000
1,500
2,000
2,500
3,000
3,500
0-4 Years 5-9 Years 10-14 Years 15-19 Years 20-24 Years 25-29 Years 30-34 Years Over 35 Years
Active Member - Service Distribution - As of 12/31/2009
0
500
1,000
1,500
2,000
2,500
3,000
Under 25 25-29 30-34 35-39 40-44 45-49 50-54 55-59 60-63
Active Member - Age Distribution - As of 12/31/2009
29527_Body 10/1/10 9:18 AM Page 40
The Northern Trust Company50 South La Salle StreetChicago, Illinois 60603(312) 630-6000
41
29527_Body 10/1/10 9:18 AM Page 41
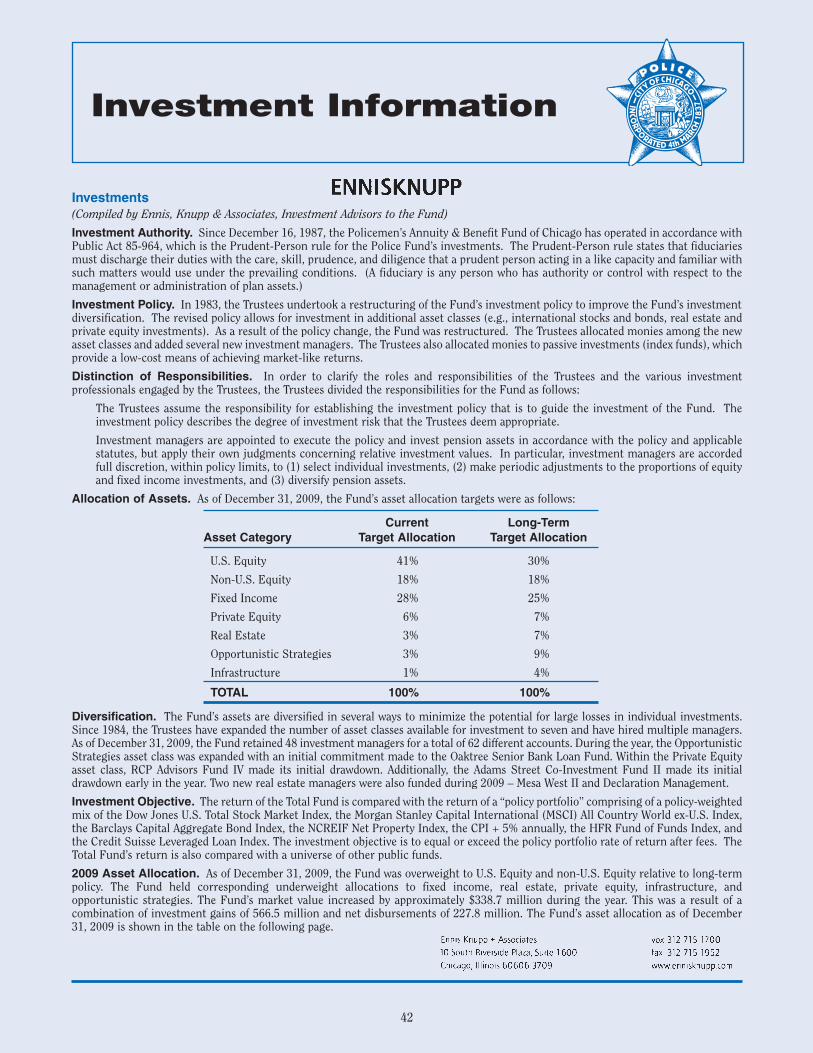
Investment Information
Investments(Compiled by Ennis, Knupp & Associates, Investment Advisors to the Fund)
Investment Authority. Since December 16, 1987, the Policemen’s Annuity & Benefit Fund of Chicago has operated in accordance withPublic Act 85-964, which is the Prudent-Person rule for the Police Fund’s investments. The Prudent-Person rule states that fiduciariesmust discharge their duties with the care, skill, prudence, and diligence that a prudent person acting in a like capacity and familiar withsuch matters would use under the prevailing conditions. (A fiduciary is any person who has authority or control with respect to themanagement or administration of plan assets.)
Investment Policy. In 1983, the Trustees undertook a restructuring of the Fund’s investment policy to improve the Fund’s investmentdiversification. The revised policy allows for investment in additional asset classes (e.g., international stocks and bonds, real estate andprivate equity investments). As a result of the policy change, the Fund was restructured. The Trustees allocated monies among the newasset classes and added several new investment managers. The Trustees also allocated monies to passive investments (index funds), whichprovide a low-cost means of achieving market-like returns.
Distinction of Responsibilities. In order to clarify the roles and responsibilities of the Trustees and the various investmentprofessionals engaged by the Trustees, the Trustees divided the responsibilities for the Fund as follows:
The Trustees assume the responsibility for establishing the investment policy that is to guide the investment of the Fund. Theinvestment policy describes the degree of investment risk that the Trustees deem appropriate.
Investment managers are appointed to execute the policy and invest pension assets in accordance with the policy and applicablestatutes, but apply their own judgments concerning relative investment values. In particular, investment managers are accordedfull discretion, within policy limits, to (1) select individual investments, (2) make periodic adjustments to the proportions of equityand fixed income investments, and (3) diversify pension assets.
Allocation of Assets. As of December 31, 2009, the Fund’s asset allocation targets were as follows:
Current Long-Term
Asset Category Target Allocation Target Allocation
U.S. Equity 41% 30%
Non-U.S. Equity 18% 18%
Fixed Income 28% 25%
Private Equity 6% 7%
Real Estate 3% 7%
Opportunistic Strategies 3% 9%
Infrastructure 1% 4%
TOTAL 100% 100%
Diversification. The Fund’s assets are diversified in several ways to minimize the potential for large losses in individual investments.Since 1984, the Trustees have expanded the number of asset classes available for investment to seven and have hired multiple managers.As of December 31, 2009, the Fund retained 48 investment managers for a total of 62 different accounts. During the year, the OpportunisticStrategies asset class was expanded with an initial commitment made to the Oaktree Senior Bank Loan Fund. Within the Private Equityasset class, RCP Advisors Fund IV made its initial drawdown. Additionally, the Adams Street Co-Investment Fund II made its initialdrawdown early in the year. Two new real estate managers were also funded during 2009 – Mesa West II and Declaration Management.
Investment Objective. The return of the Total Fund is compared with the return of a “policy portfolio” comprising of a policy-weightedmix of the Dow Jones U.S. Total Stock Market Index, the Morgan Stanley Capital International (MSCI) All Country World ex-U.S. Index,the Barclays Capital Aggregate Bond Index, the NCREIF Net Property Index, the CPI + 5% annually, the HFR Fund of Funds Index, andthe Credit Suisse Leveraged Loan Index. The investment objective is to equal or exceed the policy portfolio rate of return after fees. TheTotal Fund’s return is also compared with a universe of other public funds.
2009 Asset Allocation. As of December 31, 2009, the Fund was overweight to U.S. Equity and non-U.S. Equity relative to long-termpolicy. The Fund held corresponding underweight allocations to fixed income, real estate, private equity, infrastructure, andopportunistic strategies. The Fund’s market value increased by approximately $338.7 million during the year. This was a result of acombination of investment gains of 566.5 million and net disbursements of 227.8 million. The Fund’s asset allocation as of December31, 2009 is shown in the table on the following page.
42
29527_Body 10/1/10 9:18 AM Page 42
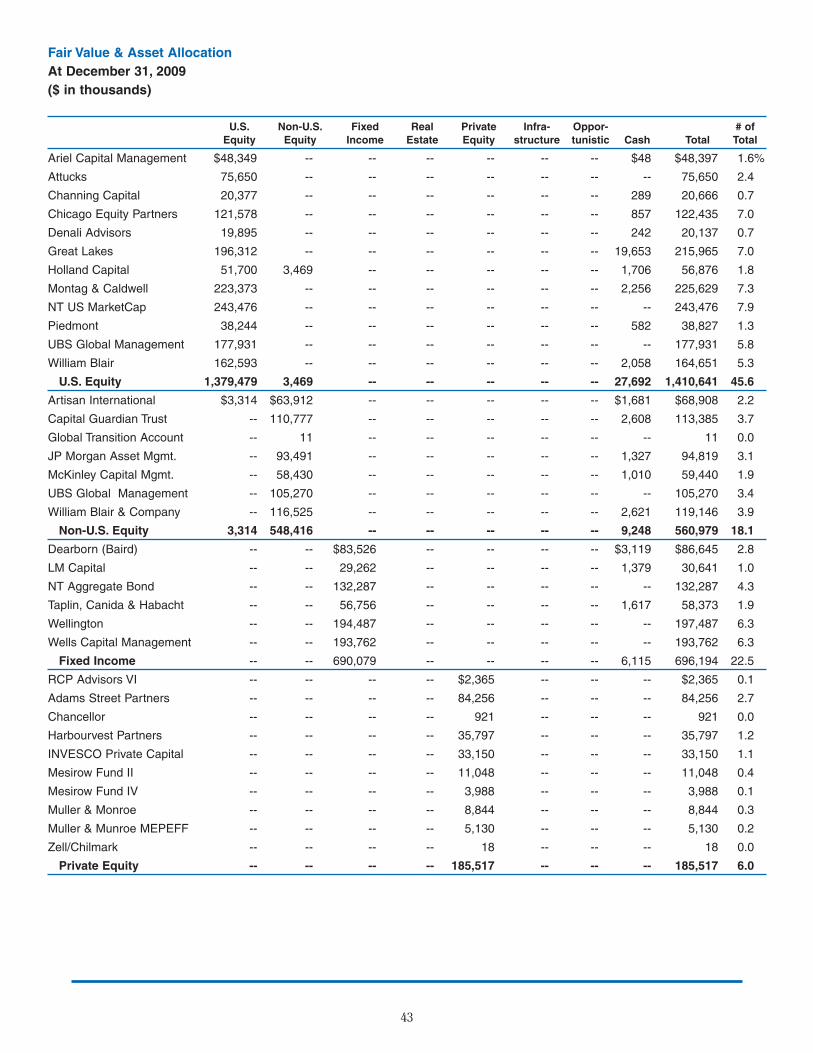
43
Fair Value & Asset Allocation
At December 31, 2009
($ in thousands)
U.S. Non-U.S. Fixed Real Private Infra- Oppor- # of
Equity Equity Income Estate Equity structure tunistic Cash Total Total
Ariel Capital Management $48,349 -- -- -- -- -- -- $48 $48,397 1.6%
Attucks 75,650 -- -- -- -- -- -- -- 75,650 2.4
Channing Capital 20,377 -- -- -- -- -- -- 289 20,666 0.7
Chicago Equity Partners 121,578 -- -- -- -- -- -- 857 122,435 7.0
Denali Advisors 19,895 -- -- -- -- -- -- 242 20,137 0.7
Great Lakes 196,312 -- -- -- -- -- -- 19,653 215,965 7.0
Holland Capital 51,700 3,469 -- -- -- -- -- 1,706 56,876 1.8
Montag & Caldwell 223,373 -- -- -- -- -- -- 2,256 225,629 7.3
NT US MarketCap 243,476 -- -- -- -- -- -- -- 243,476 7.9
Piedmont 38,244 -- -- -- -- -- -- 582 38,827 1.3
UBS Global Management 177,931 -- -- -- -- -- -- -- 177,931 5.8
William Blair 162,593 -- -- -- -- -- -- 2,058 164,651 5.3
U.S. Equity 1,379,479 3,469 -- -- -- -- -- 27,692 1,410,641 45.6
Artisan International $3,314 $63,912 -- -- -- -- -- $1,681 $68,908 2.2
Capital Guardian Trust -- 110,777 -- -- -- -- -- 2,608 113,385 3.7
Global Transition Account -- 11 -- -- -- -- -- -- 11 0.0
JP Morgan Asset Mgmt. -- 93,491 -- -- -- -- -- 1,327 94,819 3.1
McKinley Capital Mgmt. -- 58,430 -- -- -- -- -- 1,010 59,440 1.9
UBS Global Management -- 105,270 -- -- -- -- -- -- 105,270 3.4
William Blair & Company -- 116,525 -- -- -- -- -- 2,621 119,146 3.9
Non-U.S. Equity 3,314 548,416 -- -- -- -- -- 9,248 560,979 18.1
Dearborn (Baird) -- -- $83,526 -- -- -- -- $3,119 $86,645 2.8
LM Capital -- -- 29,262 -- -- -- -- 1,379 30,641 1.0
NT Aggregate Bond -- -- 132,287 -- -- -- -- -- 132,287 4.3
Taplin, Canida & Habacht -- -- 56,756 -- -- -- -- 1,617 58,373 1.9
Wellington -- -- 194,487 -- -- -- -- -- 197,487 6.3
Wells Capital Management -- -- 193,762 -- -- -- -- -- 193,762 6.3
Fixed Income -- -- 690,079 -- -- -- -- 6,115 696,194 22.5
RCP Advisors VI -- -- -- -- $2,365 -- -- -- $2,365 0.1
Adams Street Partners -- -- -- -- 84,256 -- -- -- 84,256 2.7
Chancellor -- -- -- -- 921 -- -- -- 921 0.0
Harbourvest Partners -- -- -- -- 35,797 -- -- -- 35,797 1.2
INVESCO Private Capital -- -- -- -- 33,150 -- -- -- 33,150 1.1
Mesirow Fund II -- -- -- -- 11,048 -- -- -- 11,048 0.4
Mesirow Fund IV -- -- -- -- 3,988 -- -- -- 3,988 0.1
Muller & Monroe -- -- -- -- 8,844 -- -- -- 8,844 0.3
Muller & Munroe MEPEFF -- -- -- -- 5,130 -- -- -- 5,130 0.2
Zell/Chilmark -- -- -- -- 18 -- -- -- 18 0.0
Private Equity -- -- -- -- 185,517 -- -- -- 185,517 6.0
29527_Body 10/1/10 9:19 AM Page 43
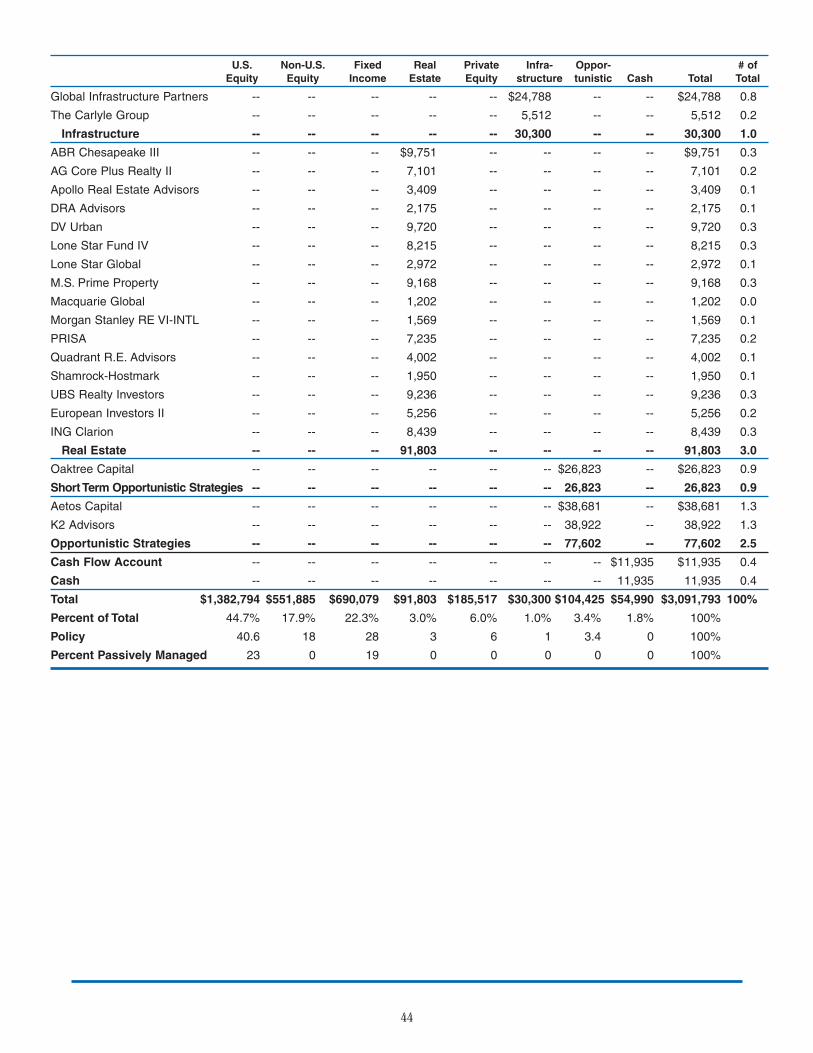
44
U.S. Non-U.S. Fixed Real Private Infra- Oppor- # of
Equity Equity Income Estate Equity structure tunistic Cash Total Total
Global Infrastructure Partners -- -- -- -- -- $24,788 -- -- $24,788 0.8
The Carlyle Group -- -- -- -- -- 5,512 -- -- 5,512 0.2
Infrastructure -- -- -- -- -- 30,300 -- -- 30,300 1.0
ABR Chesapeake III -- -- -- $9,751 -- -- -- -- $9,751 0.3
AG Core Plus Realty II -- -- -- 7,101 -- -- -- -- 7,101 0.2
Apollo Real Estate Advisors -- -- -- 3,409 -- -- -- -- 3,409 0.1
DRA Advisors -- -- -- 2,175 -- -- -- -- 2,175 0.1
DV Urban -- -- -- 9,720 -- -- -- -- 9,720 0.3
Lone Star Fund IV -- -- -- 8,215 -- -- -- -- 8,215 0.3
Lone Star Global -- -- -- 2,972 -- -- -- -- 2,972 0.1
M.S. Prime Property -- -- -- 9,168 -- -- -- -- 9,168 0.3
Macquarie Global -- -- -- 1,202 -- -- -- -- 1,202 0.0
Morgan Stanley RE VI-INTL -- -- -- 1,569 -- -- -- -- 1,569 0.1
PRISA -- -- -- 7,235 -- -- -- -- 7,235 0.2
Quadrant R.E. Advisors -- -- -- 4,002 -- -- -- -- 4,002 0.1
Shamrock-Hostmark -- -- -- 1,950 -- -- -- -- 1,950 0.1
UBS Realty Investors -- -- -- 9,236 -- -- -- -- 9,236 0.3
European Investors II -- -- -- 5,256 -- -- -- -- 5,256 0.2
ING Clarion -- -- -- 8,439 -- -- -- -- 8,439 0.3
Real Estate -- -- -- 91,803 -- -- -- -- 91,803 3.0
Oaktree Capital -- -- -- -- -- -- $26,823 -- $26,823 0.9
Short Term Opportunistic Strategies -- -- -- -- -- -- 26,823 -- 26,823 0.9
Aetos Capital -- -- -- -- -- -- $38,681 -- $38,681 1.3
K2 Advisors -- -- -- -- -- -- 38,922 -- 38,922 1.3
Opportunistic Strategies -- -- -- -- -- -- 77,602 -- 77,602 2.5
Cash Flow Account -- -- -- -- -- -- -- $11,935 $11,935 0.4
Cash -- -- -- -- -- -- -- 11,935 11,935 0.4
Total $1,382,794 $551,885 $690,079 $91,803 $185,517 $30,300 $104,425 $54,990 $3,091,793 100%
Percent of Total 44.7% 17.9% 22.3% 3.0% 6.0% 1.0% 3.4% 1.8% 100%
Policy 40.6 18 28 3 6 1 3.4 0 100%
Percent Passively Managed 23 0 19 0 0 0 0 0 100%
29527_Body 10/1/10 9:19 AM Page 44
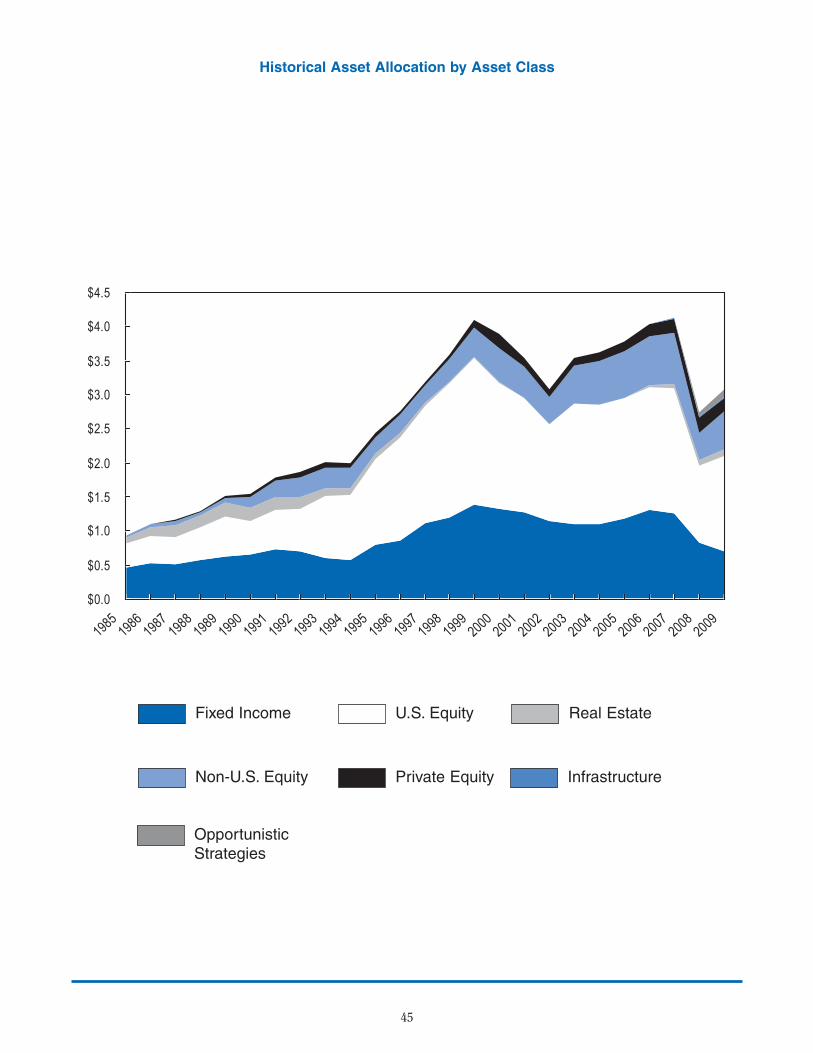
45
Fixed Income
Non-U.S. Equity
OpportunisticStrategies
U.S. Equity Real Estate
Private Equity Infrastructure
Historical Asset Allocation by Asset Class
$0.0
$0.5
$1.0
$1.5
$2.0
$2.5
$3.0
$3.5
$4.0
$4.5
1985
1986
1987
1988
1989
1990
1991
1992
1993
1994
1995
1996
1997
1998
1999
2000
2001
2002
2003
2004
2005
2006
2007
2008
2009
29527_Body 10/1/10 10:17 AM Page 45
Summary of 2009 Investment Activity
Investment Manager Changes. Several changes were made to the investment manager line-up during the year. OneU.S. equity manager was terminated and the account of a previously terminated fixed income manager was fully liquidated.Two new private equity partnerships began drawing down assets. Additionally, two real estate managers received initialfunding throughout the year. The Fund also made an allocation to a new opportunistic strategies manager based ondislocation opportunities in the credit markets.
Market Environment. The first two months of 2009 were, in large part, a continuation of the flight to quality of 2008.Equity markets reached a bottom on March 9, 2009, with the S&P 500 Index hitting a low of 676.53. Around this time, itbecame apparent that worldwide government intervention effectively staved off the possibility of a depression. The FederalReserve initiated a quantitative easing program intended to support a struggling housing market and provide liquidity tothe credit markets. In total, the Federal Reserved purchased $1.25 trillion in agency mortgage-backed securities as a resultof this program. With investor optimism of an economic recovery growing, the equity market rallied sharply during thefinal nine and a half months of the year. Within the credit markets, spreads in all non-Treasury sectors fell from theirhistorically levels leading to price improvements among the most distressed securities.
In total, the economy contracted 2.4% during 2009; however, real GDP rebounded during the final two quarters of the yearafter declining during the four previous quarters. Unemployment steadily increased throughout the year, beginning at 7.4%and ending the year at 10.0%. Inflation, as measured by the Consumer Price Index, remained relatively modest at 2.7% forthe year.
The domestic stock market finished 2009 with a return of 28.6%, making it the best year since 2003. Many market observersclassified the 2009 market upswing as a low-quality rally, meaning the riskiest stocks with the most questionablefundamentals were the strongest performers during the year. Comparatively, these stocks were the weakest performersduring the market downturn in 2008. Despite the rally, the U.S. stock market ended the year 24% below its October 2007highs.
On a style basis, growth stocks performed better than their value counterparts, and on a capitalization basis, mid cap stocksled the market, followed by small cap and large cap issues.
Non-U.S. stocks outperformed the U.S. market during the year, posting a 41.4% gain, as measured by the MSCI All CountryWorld ex-U.S. Index. The reversal of 2008’s flight to quality caused the dollar to depreciate relative to other currencies,especially those of emerging market countries. The declining dollar provided a boost for U.S. investors with exposure tonon-U.S. markets. Emerging markets dominated all other equity markets during the year with a return of 78.5%. Developedmarkets posted a more modest 24.7% return. Late in the year, concern grew that certain European countries, led by Greece,would be unable to repay their sovereign debt. This dampened investor sentiment heading into the new year.
The U.S. fixed income market generated a 5.9% return in aggregate during 2009. The Government sector was the onlysector to decline during the year (-2.2%) as 2008’s flight to quality reversed. Credit spreads declined throughout the year,translating to strong performance in the corporate (+16.0%) and asset-backed (+24.7%) sectors of the market. The highyield sector ended the year a record 58.2% higher, exceeding the next best year (1991) by twelve percentage points.
Real estate, as measured by the NCREIF Net Property Index, lost 16.9% during the year. Property values continuouslydeclined on a year-over-year basis. Demand remained weak in light of increasing job losses and a generally weak economicenvironment. Income growth within real estate and new construction tend to lag the broader economy.
Total Fund Performance. For 2009, the Total Fund posted a return of 21.5%, which matched the return of the policybenchmark. The policy benchmark represents a hypothetical portfolio invested solely in passive index funds in theproportion of the Fund’s allocation targets. Over the trailing three-year period, the Fund’s performance slightly lagged thepolicy portfolio and trailed the average public fund. For the trailing five-year period, the Fund’s return of 2.8%underperformed the 3.2% return of the policy portfolio.
Asset Class Performance. The Fund’s U.S. equity component posted a return of 32.9% and outperformed the returnof the Index by 4.3 percentage points during 2009. The Fund’s non-U.S. equity component produced a gain of 40.1% in2009, which fell short of the benchmark’s return of 41.4%. The fixed income component posted a return of 11.7% whichnearly doubled the benchmark’s return of 5.9%. The Real Estate component lost 9.1% during the year, but added valuerelative to the asset class benchmark. Valuations in private equity tend to lag the public markets; therefore, the privateequity portfolio experienced losses related to the 2008 market downturn in 2009. The asset class posted a loss of 21.3%during the year.
Longer-Term Performance. The table on the following page details the annual returns earned by the Fund over the pastfive calendar years, as well as the cumulative annualized returns for periods ending December 31, 2009. Also shown arethe returns of the Fund’s aggregate investments in each of the major asset classes, as well as those of the performancebenchmarks.
46
29527_Body 10/1/10 9:20 AM Page 46
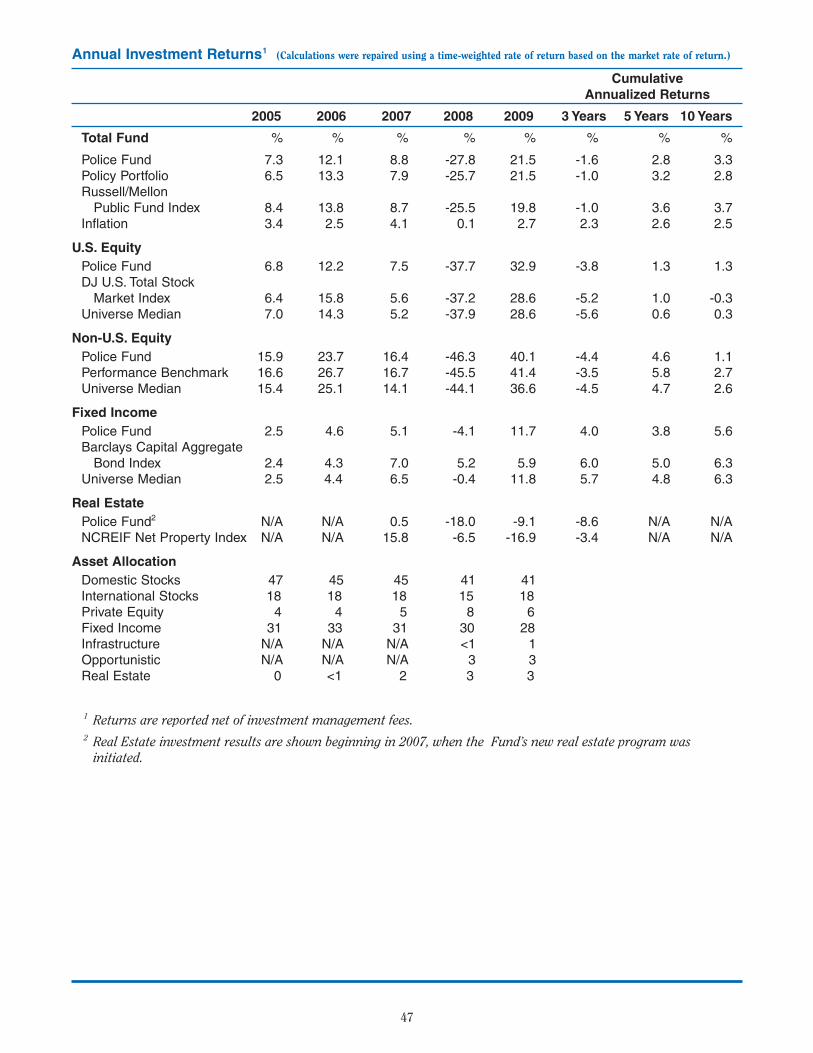
47
Annual Investment Returns1 (Calculations were repaired using a time-weighted rate of return based on the market rate of return.)
CumulativeAnnualized Returns
2005 2006 2007 2008 2009 3 Years 5 Years 10 Years
Total Fund % % % % % % % %
Police Fund 7.3 12.1 8.8 -27.8 21.5 -1.6 2.8 3.3Policy Portfolio 6.5 13.3 7.9 -25.7 21.5 -1.0 3.2 2.8Russell/Mellon
Public Fund Index 8.4 13.8 8.7 -25.5 19.8 -1.0 3.6 3.7Inflation 3.4 2.5 4.1 0.1 2.7 2.3 2.6 2.5
U.S. Equity
Police Fund 6.8 12.2 7.5 -37.7 32.9 -3.8 1.3 1.3DJ U.S. Total Stock
Market Index 6.4 15.8 5.6 -37.2 28.6 -5.2 1.0 -0.3Universe Median 7.0 14.3 5.2 -37.9 28.6 -5.6 0.6 0.3
Non-U.S. Equity
Police Fund 15.9 23.7 16.4 -46.3 40.1 -4.4 4.6 1.1Performance Benchmark 16.6 26.7 16.7 -45.5 41.4 -3.5 5.8 2.7Universe Median 15.4 25.1 14.1 -44.1 36.6 -4.5 4.7 2.6
Fixed Income
Police Fund 2.5 4.6 5.1 -4.1 11.7 4.0 3.8 5.6Barclays Capital Aggregate
Bond Index 2.4 4.3 7.0 5.2 5.9 6.0 5.0 6.3Universe Median 2.5 4.4 6.5 -0.4 11.8 5.7 4.8 6.3
Real Estate
Police Fund2 N/A N/A 0.5 -18.0 -9.1 -8.6 N/A N/ANCREIF Net Property Index N/A N/A 15.8 -6.5 -16.9 -3.4 N/A N/A
Asset Allocation
Domestic Stocks 47 45 45 41 41International Stocks 18 18 18 15 18 Private Equity 4 4 5 8 6 Fixed Income 31 33 31 30 28 Infrastructure N/A N/A N/A <1 1Opportunistic N/A N/A N/A 3 3Real Estate 0 <1 2 3 3
1 Returns are reported net of investment management fees.2 Real Estate investment results are shown beginning in 2007, when the Fund’s new real estate program was
initiated.
29527_Body 10/1/10 9:20 AM Page 47
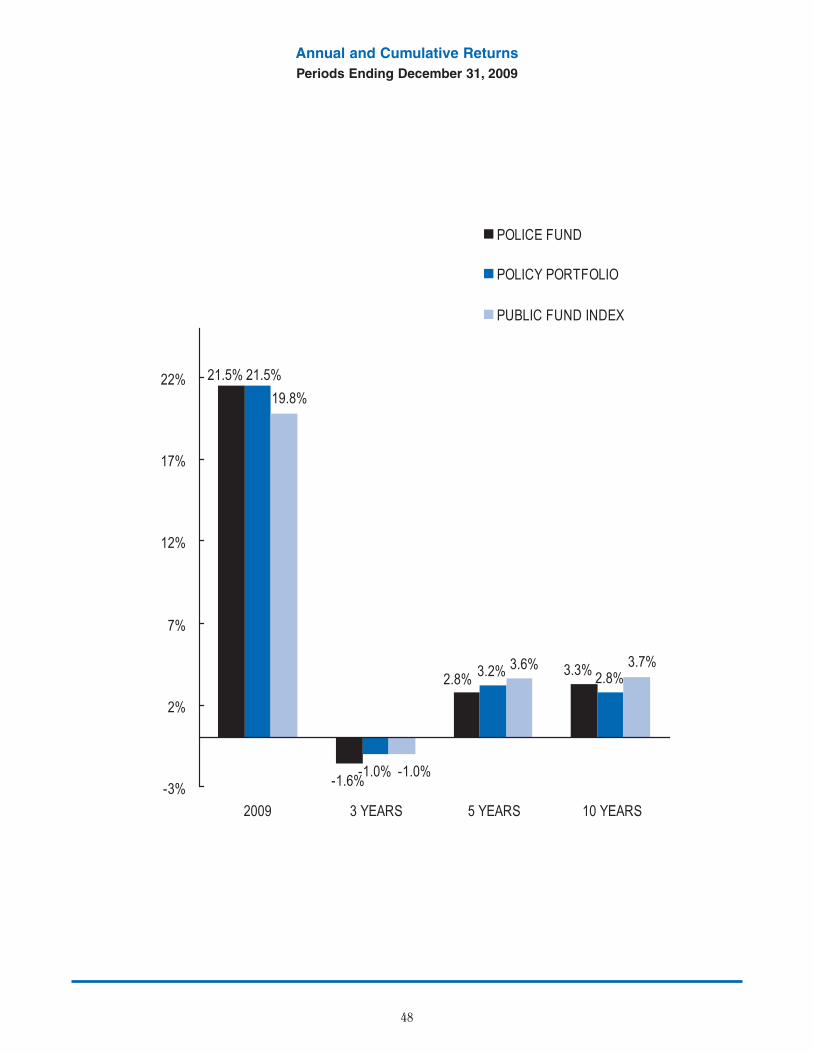
48
Annual and Cumulative Returns
Periods Ending December 31, 2009
-1.6%-1.0%
3.2% 2.8%3.3%2.8%
21.5% 21.5%
3.7%3.6%
-1.0%
19.8%
-3%
2%
7%
12%
17%
22%
2009 3 YEARS 5 YEARS 10 YEARS
POLICE FUND
POLICY PORTFOLIO
PUBLIC FUND INDEX
29527_Body 10/1/10 9:20 AM Page 48
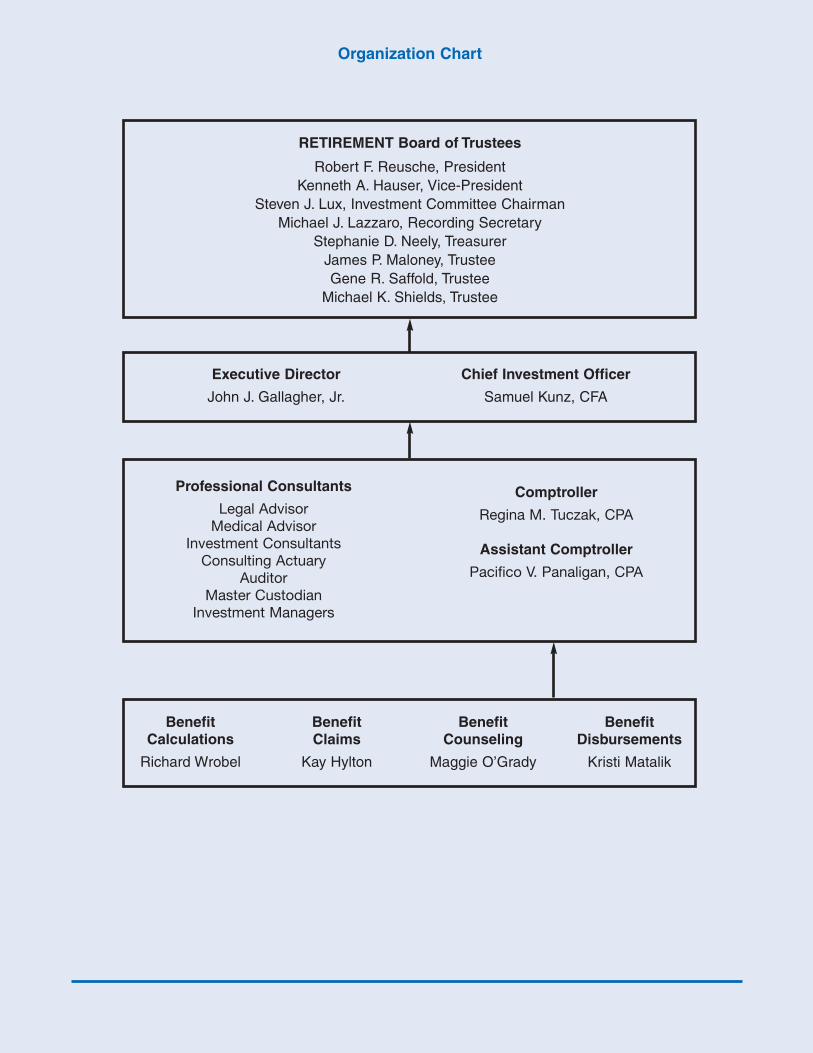
Organization Chart
RETIREMENT Board of Trustees
Robert F. Reusche, President
Kenneth A. Hauser, Vice-President
Steven J. Lux, Investment Committee Chairman
Michael J. Lazzaro, Recording Secretary
Stephanie D. Neely, Treasurer
James P. Maloney, Trustee
Gene R. Saffold, Trustee
Michael K. Shields, Trustee
Executive Director Chief Investment Officer
John J. Gallagher, Jr. Samuel Kunz, CFA
Professional Consultants
Legal AdvisorMedical Advisor
Investment ConsultantsConsulting Actuary
AuditorMaster Custodian
Investment Managers
Comptroller
Regina M. Tuczak, CPA
Assistant Comptroller
Pacifico V. Panaligan, CPA
BenefitCalculations
Richard Wrobel
BenefitClaims
Kay Hylton
BenefitCounseling
Maggie O’Grady
BenefitDisbursements
Kristi Matalik
29527_Cover 10/1/10 9:30 AM Page 3

POLICEMEN’S ANNUITY AND BENEFIT FUND221 North LaSalle Street, Room 1626
Chicago, Illinois 60601312.744.3891
29527_Cover 10/5/10 8:21 AM Page 4