Annual Report - Banca d'Italia
201
123 rd Financial Year 2016 123 rd FINANCIAL YEAR Annual Report Rome, 31 May 2017
Transcript of Annual Report - Banca d'Italia

123rd
Fina
ncia
l Yea
r
2016
123r
d fi
na
nc
ial y
ea
r
Annual ReportRome, 31 May 2017

Annual Report2016 – 123rd Financial Year
Rome, 31 May 2017

© Banca d’Italia, 2017
AddressVia Nazionale, 91 00184 Rome - Italy
Telephone+39 0647921
Websitewww.bancaditalia.it
All rights reserved. Reproduction for academic and non-commercial use is permitted, provided that the source is acknowledged.
ISSN 2239-9674 (print)ISSN 2280-4145 (online)
Printed by the Printing and Publishing Division of the Bank of Italy, Rome, August 2017
The statistical appendix to the Annual Report is available on the Bank of Italy’s website

BANCA D’ITALIA Annual ReportIII2016
CONTENTS
THE INTERNATIONAL ECONOMY AND THE EURO AREA
1. Macroeconomic developments and policies and the international financial markets 3
The main advanced countries 3 Box: The economic implications of Brexit 6The main emerging economies 8 Box: Productivity growth and allocative efficiency in the main emerging countries 9The financial and foreign exchange markets 13
2. World trade, commodity prices and payments balances 16
World trade 16 Box: Concerns about trade openness and exposure to the effects of globalization 18Commodity prices and markets 20Global imbalances 21
3. Macroeconomic developments and fiscal policies in the euro area 24
Cyclical developments 24Prices and costs 26 Box: The pass-through of oil prices to inflation expectations in the euro area 27The financial markets 29Fiscal policies 30 Box: Fiscal policy in the euro area during the crisis years 30 Box: Public investment in the euro area: forms of funding and effects on the economy 34European governance 37
4. Monetary policy in the euro area 40
Monetary policy action 40 Box: The determinants of low interest rates 42Monetary policy operations 44Interest rates and the exchange rate of the euro 44 Box: The monetary policy implications of low interest rates 46Money and credit 47
THE ITALIAN ECONOMY
5. Overview 51
Box: The determinants of economic activity in 2016 according to the Bank of Italy’s model 51 Box: Italy’s output gap 53 Box: Southern Italy’s economy after the recession 56

BANCA D’ITALIAAnnual Report2016IV
6. Firms 60
Economic developments 60 Box: The trend in investment and the cyclical recovery 63Sources of funding 68 Box: Credit allocation and firms’ characteristics 71
7. Households 74
Income and income distribution 74 Box: Inequality during the double-dip recession 76Consumption 78Household wealth, the housing market and borrowing 81 Box: The survey on adults’ financial literacy 84
8. The labour market 89
Employment and number of hours worked 89Unemployment and labour supply 92 Box: The lengthening of working life and the labour market 93Collective bargaining and industrial relations 95 Box: Current trends in industrial relations 95
9. Prices, costs and competitiveness 98
Consumer prices 98 Box: Inflation expectations of Italian firms according to the Bank of Italy-Il Sole 24 Ore Survey 100Producer and import prices 101Labour costs 102 Box: Competitiveness indicators in the euro area: prices, costs and margins 102Price competitiveness 105
10. Foreign demand and the balance of payments 107
Exports and imports 107 Box: The improvement in Italy’s goods exports since 2010 108The current and capital accounts 111 Box: The balance on net investment income since 1999 113The financial account 114 Box: The trend in the Bank of Italy’s balance in TARGET2 115The net international investment position 117
11. The public finances 119
The public finances in 2016 119Revenue 122Expenditure 124General government debt 125 Box: General government commercial debts 127The outlook 128 Box: Applying the BIMic microsimulation model to the changes in pensioners’ fourteenth month payment 129

BANCA D’ITALIA Annual ReportV2016
12. Business activity regulation and the institutional environment 132
Competition and market regulation 132 Box: Limiting red tape for start-ups 133The regulation of business activity 134 Box: Arrangements with creditors according to microdata on proceedings 135The institutional environment 136 Box: Court productivity and the length of proceedings 138 Box: Composition of employment in the general government sector and corruption indices 139 Box: The economic effects of the spread of organized crime in the Centre and North of Italy 141
13. Banks and institutional investors 143
The structure of Italy’s banking industry 144 Box: The banking resolution regime in the European Union and the United States 145Assets 147Impaired loans 149 Box: Bad loan recovery rates 150Funding 151Profitability and capital 152 Box: The profitability of the main Italian and European banks 153 Box: Public shareholdings in SSM supervised banks 156Measures to reinforce the banking system’s stability 157NON-BANK FINANCIAL INTERMEDIARIES AND LOAN GUARANTEE CONSORTIUMS 158INSTITUTIONAL INVESTORS 159
14. The money and financial markets 163
The money market 163Public sector securities 164 Box: Holders of Italian public sector securities 164 Box: Long-term yields and term premiums 166 Box: Recent developments in Italy’s sovereign spread 167Corporate bonds and bank bonds 169 Box: The impact of Eurosystem purchases of private sector bonds 170The equity market 172Market infrastructure 173
15. Productivity in Italy: performance and determinants 175
Productivity and growth 175 Box: Long-term trends in total factor productivity in Italy and other industrialized countries 177Productivity, allocative efficiency and firm demographics 179The determinants of productivity growth 181 Box: The assessment of the macroeconomic effects of the reforms 181
ADMINISTRATION OF THE BANK OF ITALY 191


THE INTERNATIONAL ECONOMY AND THE EURO AREA


BANCA D’ITALIA Annual Report32016
1. MACROECONOMIC DEVELOPMENTS AND POLICIES AND THE INTERNATIONAL FINANCIAL MARKETS
In 2016 the global economy grew more slowly than forecast (3.1 per cent). Growth in the emerging and developing countries was subdued. The United States and the United Kingdom, despite sound underlying trends, made a modest contribution to world growth, only partly offset by better than expected growth in Japan and the euro area.
Concern spread across international markets at the start of last year following uncertainty about the outlook for the Chinese economy. The subsequent publication of favourable data on the performance of the country’s economy helped to subdue the tensions.
The result of the UK referendum in June on withdrawal from the European Union (Brexit) led to temporary volatility on the markets, which then subsided. As yet there has been no deterioration in the short-term outlook for growth, partly thanks to the highly expansionary monetary policies put in place by the British authorities. The implications for the medium- and long-term are nevertheless still uncertain as they will depend on the negotiations, which promise to be extremely complex.
Global inflation rose slightly thanks to the revival of energy prices and an acceleration of the core component, which remained nonetheless weak. The Federal Reserve continued to raise its official rates, hinting at a slightly more rapid normalization of monetary policy; the dollar rallied. In Japan and the UK new expansionary measures were adopted.
The yields on long-term government bonds of the main advanced countries rose after the US elections; the stock markets reached new highs. However, there is still great uncertainty about the outlook for macroeconomic and trade policies, which is in contrast with the optimism prevailing on the markets. The financial situation of the emerging countries improved on the whole; capital outflows came to a stop.
The main advanced countries
The advanced economies grew by 1.7 per cent in 2016, 0.2 percentage points less than in 2015 and less than the IMF’s forecast a year ago.1 The contribution to growth from consumption increased, partly because of low energy costs, which had a positive effect on households’ purchasing power. In both the US and the UK economic activity strengthened in the second half of the year, continuing to benefit from the increase
1 IMF, World Economic Outlook, April 2016.

BANCA D’ITALIAAnnual Report20164
in employment. Japan’s economy, driven by the fiscal stimulus, grew by more than expected. Inflation was buoyed in the first half of the year by the rise in oil prices (which had been very low) and, in the second, by the progressive recovery of the economy.
Between 2010 and 2016 the increase in total factor productivity was 0.6 per cent compared with just over 1 per cent between 2000 and 2007. The low rate of increase in productivity in the advanced economies will continue to hold back growth: the IMF estimates it will rise marginally, to 0.7 per cent on average in the next five years.
United States. – GDP growth slowed to 1.6 per cent in 2016 from 2.6 per cent the previous year (Figure 1.1.a), almost 1 point lower than expected (the IMF forecast was 2.4 per cent). Private consumption and investment continued to make a positive contribution, although less so than in the previous year, while the negative contribution of net exports diminished despite the increase in the dollar in nominal effective terms. Growth expectations for 2017 stand at 2.3 per cent, a figure that has been revised slightly upwards because of the prospect of a strong fiscal stimulus on the part of the new administration (details of which are, however, still very uncertain). On 26 April some details of the tax reform were made available, involving among other things a reduction of the rate of income and corporation tax and the possibility of repatriation of profits under favourable conditions.
Figure 1.1
GDP and inflation in the main advanced economies (1)
(a) GDP growth (b) Inflation (2)
2016-1
0
1
2
3
4
5
-1
0
1
2
3
4
5
2011 2012 2013 2014 2015
United Kingdom United States
2016-1
0
1
2
3
4
5
-1
0
1
2
3
4
5
2011 2012 2013 2014 2015
Euro area Japan
Source: National statistics.(1) Annual data; percentage changes on previous year. – (2) For the United States, the consumption deflator; for Japan, the consumer price index; for the euro area and the United Kingdom, the Harmonized Index of Consumer Prices (HICP).
The creation of new jobs continued, although at a more moderate pace than in the previous year. The unemployment rate fell to 4.7 per cent in line with the long-term equilibrium rate estimated by the Federal Reserve. The under-employment rate, which also takes account of part-time workers seeking full-time work and ‘marginally attached’ workers (those who say they are interested in working but are not actively looking for a job), fell to 9.2 per cent from 9.9 per cent at the start of 2016; the pre-crisis figure had reached a low of 8 per cent. The progressive strengthening of the labour market contributed to a slight acceleration in wages. This was reflected in core inflation, i.e. excluding the most volatile components (food and energy goods), which rose to 1.7 per cent. Overall inflation did not exceed 1.1 per cent as a result of the base effects of the price of oil (Figure 1.1.b).

BANCA D’ITALIA Annual Report52016
In view of the gradual improvement in labour market conditions and the slightly higher short-term inflation expectations, last December the Federal Reserve raised the federal funds target range by 25 basis points to 0.50-0.75 per cent (Figure 1.2.a). At last March’s meeting the Federal Reserve, as the markets were expecting, once again raised the target range for the federal funds rate by 25 basis points to 0.75-1.00 per cent. At the same meeting there was a discussion on reducing the Federal Reserve’s balance sheet, which currently stands at around 24 per cent of GDP (Figure 1.2.b). This will probably be done gradually and mainly by progressively suspending the re-investment of the proceeds of redemptions.
Figure 1.2
Official interest rates and balance sheets of the main central banks
(a) Official interest rates (1)(daily data; per cent)
(b) Central bank assets (2)(monthly data; per cent of annual GDP)
2013 2014 2015 2016 2017-0.2
0.0
0.2
0.4
0.6
0.8
1.0
1.2
-0.2
0.0
0.2
0.4
0.6
0.8
1.0
1.2
United States United Kingdom
Japan Euro area
2013 2014 2015 2016 20170
10
20
30
40
50
60
70
80
90
100
Bank of Japan
Federal Reserve
Eurosystem
Bank of England
0
10
20
30
40
50
60
70
80
90
100
Sources: ECB and national statistics.(1) For the United States, federal funds target range; for Japan, uncollateralized overnight call rate (up to 15 February 2016 the Bank of Japan’s monetary policy was based on a quantitative target; since then it has also been based on the official reference rate; since 21 September 2016, the Bank of Japan has added control of the term structure of interest rates to its operating targets); for the euro area, rate on main refinancing operations; for the United Kingdom, rate on commercial banks’ reserve deposits with the Bank of England. – (2) For the Bank of England, from 2 October 2014, only assets purchased in monetary policy operations (over 90 per cent of the total).
Japan. – Economic activity continued to expand (by 1.0 per cent, which is 0.5 percentage points more than expected). Consumption returned to growth and investment expanded after stagnating the previous year, mainly thanks to the residential sector. Net exports continued to make a positive contribution to growth despite the appreciation of the yen.
The economic recovery programme launched in Japan in 2013 initially succeeded in boosting both economic growth and inflation but not labour productivity, which remains stable at below pre-crisis levels. The recovery should continue this year but, in the future, growth will be hampered by the removal of the fiscal stimulus, low productivity growth and the termination of investment incentives connected with the Tokyo Olympics.
Inflation fluctuated around an average of -0.1 per cent in 2016 (down from 0.8 per cent in 2015). Core inflation, which at the end of 2015 had risen to 1.2 per cent, subsided to practically zero at the end of the year. Medium- and long-term inflation expectations fell to 1.3 per cent from the peak of 1.7 per cent recorded in 2014.
In response to persistent deflationary pressures, in September the Bank of Japan introduced substantial changes to its operating framework, adopting a new

BANCA D’ITALIAAnnual Report20166
intermediate target that involves controlling the term structure of interest rates in order to maintain the ten-year rate close to zero. To support inflation expectations the Bank also entered into an inflation-overshooting commitment of 2 per cent for a prolonged period of time.
To boost demand, in August the government expanded its budget by about 1.5 per cent of GDP and postponed to October 2019 the second increase to the consumption tax, originally planned for April of this year, making it more difficult to achieve the target of a budget surplus by 2020.
United Kingdom. – The feared repercussions on the British economy of the Brexit referendum of 23 June 2016 have not materialized so far, mainly thanks to determinedly expansionary monetary policies; nevertheless, there is still great uncertainty about the future. In 2016 economy activity grew by 1.8 per cent, the unemployment rate fell by 0.3 percentage points to 4.8 per cent, leading to a modest acceleration of wages. Inflation rose from 0.2 to 1.6 per cent, chiefly as a result of the marked depreciation of sterling following the referendum.
To counter any possible slowdown of economy activity, on 3 August the Bank of England reduced the Bank Rate by 25 basis points. It revived its purchases of Treasury bonds and launched new programmes to purchase corporate bonds and to lend to commercial banks. The Treasury decided to slow its progress towards budgetary consolidation. As regards the medium-term outlook, there are still risks connected with uncertainty and with the possible consequences of the UK’s withdrawal from the European Union (see the box ‘The economic implications of Brexit’).
THE ECONOMIC IMPLICATIONS OF BREXIT
On 29 March the UK government notified the European Council of its intention to withdraw from the EU.1 This act formally initiated the Brexit process, which envisages three phases according to Article 50 of the Treaty on the European Union: the European Commission is given a mandate to negotiate the withdrawal agreement; the negotiations are conducted; and any agreement reached is ratified. The withdrawal must take account of future relationships with the EU, although they will be covered by a separate agreement (see the box ‘The implications of the referendum for relations between the United Kingdom and the European Union’, Economic Bulletin, 3, 2016).
In theory, there are four possibilities for future economic relations between the UK and the EU: (a) accession to the European Economic Area;2 (b) participation
1 The letter was signed under the European Union (Notification of Withdrawal) Act 2017 according to which the UK government, in compliance with the Supreme Court’s ruling of 24 January, authorized the Prime Minister to notify the EU of its intention to withdraw.
2 The European Economic Area, which includes EU member states together with Liechtenstein, Norway and Iceland, extends the EU’s single market and its four basic freedoms (free movement of goods, services, capital and people) to these three countries.

BANCA D’ITALIA Annual Report72016
in the EU customs union;3 (c) a bilateral agreement; and (d) no agreement. In the last case, trade relations would be governed by World Trade Organization (WTO) rules, which envisage the application of bilateral tariffs based on the Most Favoured Nation clause (MFN).
The UK government’s notification letter indicates its desire to maintain a special relationship with the EU by reaching a wide-ranging bilateral agreement on the trading of goods and services, but rules out participation in the European Economic Area or in the customs union. This only leaves the last two of the options described above.
On 29 April the European Council, following the UK’s notification of withdrawal, adopted the guidelines forming the basis for the Commission’s negotiation mandate: the negotiations should try to achieve an orderly exit from the EU and decide, among other things, on mutual guarantees to safeguard the rights of European and UK citizens affected by the withdrawal, and the settlement of all the UK’s financial obligations deriving from its EU membership. Contrary to the UK’s position, the European Council has indicated that it will only begin preliminary and preparatory negotiations for a trade agreement when it has established that there has been sufficient progress towards a satisfactory agreement on how to withdraw. The exit agreement will have to be approved by 29 March 2019 and the trade agreement may only be stipulated after that date.
The Brexit referendum outcome has not yet had the feared negative impact on economic activity in the UK, which actually accelerated over the second half of 2016. The economy has benefited from aggressively expansionary monetary policy measures, a more accommodative fiscal policy, the improvement in the international economy and the marked depreciation of sterling. The risk of a crisis of confidence among households, firms and investors has not materialized. The depreciation in the exchange rate has also contributed to the increase in current and expected inflation: according to the Bank of England, consumer prices are expected to rise to 2.8 per cent in the fourth quarter of the current year.
The prospects for the negotiation and thus the medium-term consequences of Brexit remain subject to considerable uncertainty. Trade in goods and services between the UK and the EU could be affected by the resulting increase in tariffs, especially if no trade agreement is reached and tariffs based on the MFN clause are then adopted. The economic costs would be even greater for the UK were a lesser degree of trade integration to have repercussions on foreign direct investment, on productivity and on the vitality of the UK economy.4
The effects of Brexit on the euro area and the rest of the EU would be more limited and vary from country to country according to the extent of their trade and
3 The customs union is a cornerstone of the EU and the single market: no customs duties are applied at internal EU borders, whereas a common customs tariff is applied to imports from outside the EU. Turkey, Andorra and San Marino are also in the EU customs union.
4 M. Pisani and F. Vergara Caffarelli, ‘What will Brexit mean for the UK and euro area economies? A model-based assessment of trade regimes’, Banca d’Italia, Temi di Discussione (Working Papers), forthcoming.

BANCA D’ITALIAAnnual Report20168
The EU countries of Central and Eastern Europe. – In the countries of this region that have not yet adopted the euro, GDP growth slowed last year to 3.0 per cent (from 3.8 per cent in 2015). At the end of last year inflation became positive and continued to rise rapidly in the early months of 2017, standing at 1.6 per cent in April; core inflation increased to 1.2 per cent. The monetary policy stance continued to be accommodative, partly with the adoption of new unconventional measures by some central banks. Financial conditions remained favourable, particularly in Hungary and the Czech Republic.2
The main emerging economies
In 2016 growth in the emerging and developing countries eased slightly overall to 4.1 per cent, the lowest level since 2009. In China the gradual slowing of economic activity continued, in line with the government’s forecast; fears of an abrupt contraction subsided.
China. – GDP eased to 6.7 per cent from 6.9 per cent the previous year (Figure 1.3.a); support from macroeconomic policies helped to stabilize economic activity in the second half of the year.
2 S. Auer, ‘A financial conditions index for the CEE economies’, Banca d’Italia, Temi di Discussione (Working Papers), forthcoming.
financial links with the UK (relatively limited for Italy; see the box ‘Trade and financial relations between Italy and the United Kingdom’, Economic Bulletin, 3, 2016). If, for example, the UK were to adopt an identical tariff system to that applied by the EU to third countries, given the sectoral composition of trade, UK exports would be subject to an average duty of 3.9 per cent. The corresponding figure for exports to the UK would be 5.3 per cent for Germany, slightly lower for France and Italy, and over 6 per cent for Ireland, Spain and Poland.5
The UK’s withdrawal could have a major impact on the financial services sector,6 which is especially important for the UK economy. In the absence of specific agreements, it will lead to revocation of the single passport, on the basis of which banks authorized to operate in one member state are automatically authorized throughout the EU. Many international banking groups currently operate in Europe through subsidiaries established in London. With the loss of the single passport, UK banks will have to obtain a licence in member states where they wish to operate and will become subject to supervision by the host authorities. Another important issue for London’s financial centre is possible future pressure to move elsewhere the clearing of euro-denominated financial instruments, currently conducted for the most part (and especially in the case of over-the-counter derivatives) at central counterparties in the UK.
5 R. Cappariello, ‘Brexit: estimating tariff costs for the EU countries in a new trade regime with the UK’, Banca d’Italia, Questioni di Economia e Finanza (Occasional Papers), forthcoming.
6 ‘Fact-finding enquiry on the future of the European project’, testimony of L.F. Signorini, Deputy Governor of the Bank of Italy, Joint III and XIV Standing Committees, Chamber of Deputies, Rome, 26 April 2016.

BANCA D’ITALIA Annual Report92016
Figure 1.3
GDP and inflation in the main emerging countries (1)
(a) GDP growth (quarterly data)
(b) Consumer inflation(monthly data)
20162012 2013 2014 2015 '170
3
6
9
12
15
18
Russia
2012 2013 2014 2015 2016 '17-9
-6
-3
0
3
6
9
-9
-6
-3
0
3
6
9
China IndiaBrazil
0
3
6
9
12
15
18
Source: National statistics.(1) Percentage changes on previous year.
Recent developments confirm the Chinese economy’s ongoing transition towards a model based more on household consumption on the demand side and on services on the supply side. Consumption has continued to be the main driver of growth (4.3 percentage points), given the smaller contribution of investment (down to 2.8 points) and the negative contribution of exports (-0.5 points). On the supply side, growth in value added was mainly driven by services, while slowing in industry.
Investment expenditure was influenced by reduced production capacity in heavy industry and mining and by the high level of indebtedness of firms, especially state-owned enterprises. The fall in productivity means that reallocating investments towards more productive uses has become a priority (see the box ‘Productivity growth and allocative efficiency in the main emerging countries’).
PRODUCTIVITY GROWTH AND ALLOCATIVE EFFICIENCY IN THE MAIN EMERGING COUNTRIES
Economic activity in the main emerging economies has progressively slowed over the last five years, repeatedly failing to meet the forecasts of the leading international organizations. According to the most recent International Monetary Fund (IMF) projections, in the next five years the GDP growth rate for the emerging economies as a whole, although recovering, is expected to remain under 5 per cent on average, well below the 6.7 per cent recorded in 2001-07.
The fall in the GDP growth rate is coupled with a more modest increase in labour productivity growth of around 1 percentage point (panel (a) of the figure). One third of this change is attributable to slower productivity growth within individual sectors and two thirds to the reduced contribution of labour force reallocation to more productive sectors.
Labour reallocation is a very important component of the catching-up process for emerging countries since they still have ample opportunity to structurally transform their economies. Diminished labour reallocation is attributable partly

BANCA D’ITALIAAnnual Report201610
to a slackening of the drive to alter output composition due to external factors, such as the integration of trade and production in global value chains, particularly for China, Mexico, India and Turkey. In a less favourable external environment, however, internal barriers to resource mobility would act as a brake as well.
These developments are reflected to varying degrees in a general slowdown in total factor productivity (TFP) growth, which, on the basis of Conference Board estimates, would almost entirely explain the deceleration in GDP growth (panel (b) of the figure). An economy’s TFP is derived from the productivity of its component sectors and their weight. The more capital and labour are channelled towards the most productive sectors, the higher the TFP for the entire economy: among the most widely studied causes of negative TFP performance is the inefficient allocation of capital and labour among the various productive sectors owing to economic distortions.1 This could be reflected in sectoral policies, factor market rigidities, underdeveloped financial markets or other market failures.
Estimates based on observed deviations between the various sectors’ marginal productivity of capital and labour and a benchmark for perfect competition in the factor market are used both to assess the existence of frictions (that hinder the absorption of resources by the most productive sectors) and to calculate their effects on the productivity of the entire economy. It appears that it is more difficult for emerging economies to overcome obstacles to an efficient allocation of resources among sectors than it is for advanced countries, entailing substantial losses in terms of value added. Assuming constant capital and labour, a more efficient allocation of
1 A similar argument could be made for productivity within sectors; in this case the existence of distortions can hinder the growth of the most productive companies and the liquidation of the less efficient. Only the distortions between sectors are examined in this analysis.
Developments in labour productivity and contributions of production factors to GDP growth in the main emerging countries (1)
(a) Growth in labour productivity: contributions of intrasectoral components
and of the reallocation of labour among sectors
(b) GDP growth: contributions of the single production factors
and of total factor productivity (TFP)
0
2
4
6
8
0
2
4
6
8
1995-2000 2001-07 2008-11 2012-15
Capital Human capital Labour TFP
0
2
4
6
8
0
2
4
6
8
1995-2000 2001-07 2008-11 2012-16
Intrasectoral Reallocation
Sources: Based on data from ILO, World Bank, Conference Board and IMF.(1) Purchasing-power-parity-GDP- weighted average of Brazil, China, India, Indonesia, Mexico, Russia, South Africa and Turkey.

BANCA D’ITALIA Annual Report112016
The slowdown in investment in the private sector was partially compensated by the increase in public investment on infrastructure, which grew by 10 per cent on average over the year. Support policies were funded through public development banks and by provincial governments making extensive use of public-private agreements, with a considerable increase in the liabilities on local government balance sheets.
Over the year as a whole, the consumer price index grew by 2 per cent (Figure 1.3.b); last October a long period of falling production prices came to an end after more than five years. Looking forward, the recovery of price growth could have a positive effect on firms’ profitability and their capacity to honour their debts. Business lending slowed but corporate debt rose to 170 per cent of GDP, 70 percentage points more than in 2008. In a climate of low profitability, there was a rapid increase in non-performing loans on banks’ balance sheets, although the total amount is still difficult to assess.
In 2016 the authorities launched a programme to convert banks’ business loans into risk capital, accessible to companies temporarily unable to service their debt but solvent in the medium and long term. This programme has not had much success to date, partly because of the limited number of firms that meet the necessary requirements and partly owing to the banks’ reluctance to participate in the risk capital of companies in difficulty.
The most recent IMF estimates show that the overall general government deficit stood at 3.7 per cent of GDP, the highest figure in the last thirty years. Consolidated public debt is, on the whole, modest (around 50 per cent of GDP), but local finances are still fragile and not very transparent.
these factors (especially capital) could improve TFP by up to 40 per cent in India, 30 per cent in China and 28 per cent in Mexico.2
Over the past ten years, while rapid capital formation in the emerging countries, particularly China, has helped to improve labour productivity, it has also spurred the expansion of sectors with lower marginal returns on investment. It is estimated that in 2010, the most recent year for which complete data are available, more than half of TFP revenue loss in China was attributable to an inefficient allocation of capital among sectors (the rest was due to inefficient labour allocation). Contributing to this is, among other things, the underdevelopment of the financial markets; this tends to penalize sectors with high external funding requirements for companies, such as those in which the ratio of investment expenditure to value added is greater, or sectors with a higher ratio of R&D spending to value added. Our analysis shows that inefficient capital allocation resulting from a lack of financial development could cause China to lose between 5 and 8 per cent in total productivity.
The obstacles to the efficient allocation of financial resources for new investments appear to be particularly severe in countries such as China, where rising corporate debt (with a high share of NPLs) and an ageing population are reducing the margins within which an economy can grow rapidly despite using its resources inefficiently.
2 D. Marconi and C. Upper, ‘Capital misallocation and financial development: a sector level analysis’, Banca d’Italia, Temi di Discussione (Working Papers), forthcoming.

BANCA D’ITALIAAnnual Report201612
Stabilizing growth has allowed China’s central bank to tighten policy since the end of 2016 in order to curb the expansion of short-term loans on the interbank market and, at the same time, stem capital outflows. Since last November the central bank has encouraged higher rates on the interbank market and introduced new macroprudential measures to align the capital requirements for off-balance-sheet loans with those included on the balance sheet. Nevertheless, these measures have created some tensions on the interbank and the bond markets.
India. – GDP growth was still robust at nearly 7 per cent, mainly thanks to the good performance of consumption and the support provided by public investment, which partly offset weak private investment. The latter was also affected by tighter credit supply policies, particularly those of the public banks, which hold more than 70 per cent of total bank assets and whose balance sheets are weighed down by the emergence of massive new bad loans.
In November and December 2016, economic activity slowed considerably as a result of the government’s decision to withdraw more than 85 per cent of all banknotes and replace them with new issues in order to counter corruption, money laundering and the informal economy. This operation had some temporary repercussions, especially on household spending, which is largely based on cash. India’s central bank expected the adverse effects on economic activity to be absorbed by early 2017 and said that the programme had been concluded successfully.3
Inflation declined significantly from the summer of 2016 thanks to the slowdown in the growth of food prices, falling well below the target of 5 per cent set by the central bank, which was therefore able to maintain a mildly expansionary stance.
In the fiscal year 2016-17, which ended on 31 March this year, central government net borrowing returned to the levels recorded before the global financial crisis, at 3.5 per cent of GDP. The reduction was partly offset by a slight rise in borrowing by the federal states, which are responsible for a large portion of spending on public transport, security and health. The government’s reform programme continued with a reorganization of indirect taxation to standardize the tax bands across the whole country by the end of 2017.
Brazil. – GDP contracted for the second year running, by 3.6 per cent. Despite an improvement in the confidence indicators, domestic demand remained weak, affected by high levels of business and household debt and by the difficult situation on the labour market. Consumption diminished by 4.3 per cent, investment by more than 10 per cent, with a total drop of almost 30 per cent since the start of the crisis in 2014. This led to a sharp reduction in the current account deficit of the balance of payments. Consumer price inflation fell to 4.1 per cent last April, mainly as a result of the appreciation of the exchange rate. The return of inflation expectations to the target of 4.5 per cent allowed the central bank to begin to ease monetary conditions from the end of 2016. Between October and April the reference rate fell by 300 basis points
3 Reserve Bank of India, Macroeconomic impact of demonetisation. A preliminary assessment, March 2017.

BANCA D’ITALIA Annual Report132016
to 11.25 per cent. The difficult economic situation led to a deterioration of the public finances. The budget deficit remained high at 9 per cent of GDP and the public debt rose to 78 per cent of GDP. In order to ensure the sustainability of the public finances in the medium term, Parliament approved a constitutional provision limiting any growth in central government spending and began to discuss the social security reform.
Russia. – GDP remained almost stationary in 2016, with recessionary pressures gradually diminishing. The stabilization of economic activity was fostered by the rise in oil prices, on which more than half of the country’s export and tax revenues depend. The rapid decline of inflation towards the central bank’s target rate of 4.0 per cent allowed for a progressive easing of monetary conditions. The monetary policy authority predicted a return to growth for GDP in the next five years, but at the very moderate rate of between 1 and 2 per cent owing to the country’s limited level of industrial diversification and the fiscal consolidation measures needed to guarantee the sustainability of the public finances while oil prices remain lower than in the past.
The financial and foreign exchange markets
Financial market volatility declined overall during 2016, although it increased temporarily at the time of the Brexit referendum result in June and the US elections in November. Nevertheless, reduced volatility on the financial markets was accompanied by a sharp increase in economic policy uncertainty as measured by the most consulted indicators, such as the economic policy uncertainty (EPU) index (see the box ‘The evolution of uncertainty regarding economic policy and the financial markets in the advanced countries’, Economic Bulletin, 2, 2017). These diverging trends, which continued in the first quarter of 2017, are unusual: in the past the dynamics of the two indicators have generally been positively correlated (Figure 1.4).
Figure 1.4
Global uncertainty index and VIX (1)
10
15
20
25
30
35
50
100
150
200
250
300
Q1 Q2 Q3 Q4
2011 2012 2013 2014 2015 2016 2017
Global EPU VIX (2)
Q1 Q2 Q3 Q4 Q1 Q2 Q3 Q4 Q1 Q2 Q3 Q4 Q1 Q2 Q3 Q4 Q1 Q2 Q3 Q4 Q1
Sources: EPU Index and Thompson Reuters Datastream.Quarterly data; index number and percentage points. – (2) Right-hand scale.
During the summer the decline in the long-term interest rate under way since mid-2015 picked up in all the main areas (Figure 1.5.a). The sharp increase in the United States was due to the steadily improving economic situation, which led to a

BANCA D’ITALIAAnnual Report201614
small recovery of inflation and growth expectations. This, together with the anticipated further relaxing of fiscal policy, meant that monetary stimulus was withdrawn more rapidly and risk propensity increased, encouraging investors to turn towards the share market. In the other main advanced economies the increase in long-term interest rates was countered in part by monetary policy decisions. Japan’s new monetary policy stance kept its target yield for ten-year bonds close to zero.
Figure 1.5
Long-term interest rates and share indices in the main advanced countries
(a) Ten-year government bond yields(daily data; per cent)
(b) Share indices(end-of-week data; 1 Jan. 2013=100)
2013 2014 2015 2016 201780
100
120
140
160
180
200
80
100
120
140
160
180
200
Euro area: Dow Jones Euro Stoxx
Japan: Nikkei 225
United Kingdom: FTSE All Share
United States: S&P 500
2013 2014 2015 2016 2017-0.5
0.0
0.5
1.0
1.5
2.0
2.5
3.0
3.5
-0.5
0.0
0.5
1.0
1.5
2.0
2.5
3.0
3.5
Germany Japan
United Kingdom United States
Source: Thomson Reuters Datastream.
Following significant reductions in the early months of 2016, share indices rose in all the main areas as fears of a sharp slowdown of the global economy began to dissipate: in the US and the UK share prices grew by 10 and 12 per cent respectively, reaching new peaks in the early months of 2017. Losses from the start of 2016 were completely recouped in Japan and the euro area and, in the latter, the indices continued to rise in 2017. All the markets were only temporarily affected by episodes of increased volatility (Figure 1.5.b).
The prices of securities in the banking sector rose in the US and the UK, while they fell in Japan and the euro area; in the latter they did, however, recoup the losses of the early months of 2017. Higher risk tolerance, encouraged by an improvement in the economic outlook, pushed high-yield bond rates down in the US. The rise in oil prices, driven by the recovery in demand, supported energy sector securities, which during 2016 made good the large losses recorded in 2105 (see Chapter 2, ‘World trade, commodity prices and payments balances’).
Between the start of January and the end of October last year, the dollar remained basically stable against the euro. After the US elections it appreciated by 4.4 per cent, reflecting expectations of a more rapid normalization of monetary policy. In November and December the dollar also strengthened against the yen (12.7 per cent), after depreciating by 14.6 per cent in the first ten months of the year. In 2016 it appreciated against the pound sterling by 20 per cent, mainly in the period following the Brexit

BANCA D’ITALIA Annual Report152016
referendum. In nominal effective terms, the euro, the dollar and the yen strengthened a little (by between 2 and 6 per cent), while sterling depreciated sharply by 14.7 per cent.
The financial conditions of the emerging countries improved steadily. In 2016 overall, net capital outflows slowed (Figure 1.6.a), mainly as a result of the trend in capital outflows from China, which the country’s authorities managed by applying more restrictive administrative controls. Sovereign risk premiums fell (Figure 1.6.b).
Figure 1.6
Capital flows and sovereign spreads in the emerging and developing countries
(a) Net capital flows (1)(billions of dollars
unless otherwise specified)
(b) Yield spreads between dollar-denominated long-term sovereign bonds
and the corresponding US Treasury securities(daily data; basis points)
2014 2015 2016 2017100
200
300
400
500
600
700
800
100
200
300
400
500
600
700
800
Total emerging countries
Latin America
Asia
Countries of Central and Eastern Europe (4)
'06 '07 '08 '09 '10 '11 '12 '13 '14 '15 '16-8
-6
-4
-2
0
2
4
6
8
-800
-600
-400
-200
0
200
400
600
800
Other investment (2)
Portfolio investment
Direct investment
Net financial flows
Net financial flows (as % of GDP) (3)
Sources: Based on data from IMF, Thomson Reuters Datastream and JP Morgan Chase Bank.(1) Balance of inflows and outflows of capital to and from the euro area; does not include changes in official reserves and other flows relating to the official sector. – (2) Other investment includes bank and commercial loans, currency deposits, and other assets and liabilities. – (3) Right-hand scale. – (4) Includes Russia.
For the most part, the emerging countries’ currencies depreciated against the dollar, mainly in response to the start of the normalization of US monetary policy. The Mexican peso and the Turkish lira lost more than 17 per cent. Raw material exporting countries were an exception as they benefited from the upturn in commodity prices. The renminbi depreciated by 6.5 per cent against the dollar, despite interventions by the authorities in support of the exchange rate. China’s official reserves fell to $3.1 trillion, the lowest point since 2010. The share indices, with the exception of China, recorded substantial increases, in particular in the raw material exporting countries like Brazil and Russia.

BANCA D’ITALIAAnnual Report201616
2. WORLD TRADE, COMMODITY PRICES AND PAYMENTS BALANCES
World trade grew slowly again in 2016, affected by the weakness of investment in both advanced and emerging economies, but in the fourth quarter the cyclical recovery in economic activity on a global scale sparked a marked acceleration in trade, a trend which may continue into 2017.
The excess of supply that has characterized the oil market over the past two years has gradually been brought down, helping to lift prices from the lows recorded at the start of last year. The production cut announced in November by OPEC has accelerated the reduction of overhang of crude oil on the world market; however, while supporting prices, it has also reactivated the supply of unconventional crude oil from producers in the United States.
The decline in the prices of non-energy commodities came to a halt, chiefly as a consequence of the recovery in international demand and of the expansionary budgetary policy pursued in China, which spurred investment, particularly in infrastructure and construction (see Chapter 1, ‘Macroeconomic developments and policies and the international financial markets’).
Current account imbalances remained generally unchanged. Among the emerging economies, balances continued to worsen for the countries most dependent on oil exports; among the economies which were structurally in surplus, China’s balance contracted while those of Japan and the euro area expanded.
China’s foreign exchange reserves fell markedly again, following repeated interventions by the authorities to counter expectations of a depreciation of the renminbi. The decline was interrupted at the end of 2016, thanks in part to the introduction of new controls on capital outflows.
World trade
World trade in goods and services slowed in 2016, growing by 2.2 per cent, compared with 2.7 per cent in 2015. The expansion in trade was nearly 1 point lower than that in GDP and equally fell short of the forecasts made at the start of the year by the international organizations, which again overestimated the elasticity of trade to economic activity.1 Notwithstanding the recovery of trade in Asia, driven by the
1 A. Borin, V. Di Nino, M. Mancini and M. Sbracia, ‘The cyclicality of the income elasticity of trade’, Banca d’Italia, Temi di Discussione (Working Papers), forthcoming.

BANCA D’ITALIA Annual Report172016
upturn in Chinese imports, the slowdown of trade in the euro area and its continued stagnation in the United States had noticeable repercussions (Figure 2.1).
Figure 2.1
International trade of goods and services by volume: main geographical areas(per cent changes)
(a) Imports (b) Exports
-1
0
1
2
3
4
5
6
7
-1
0
1
2
3
4
5
6
7
2001-08 2009-11 2012 2013 2014 2015 2016 2001-08 2009-11 2012 2013 2014 2015 2016
US
China
Euro area
Other advanced economies
Other emerging economiesAsian emerging economies
World Source: Based on IMF, World Economic Outlook, April 2017.
In the fourth quarter of 2016, with the strengthening of economic activity in the main advanced economies, world trade picked up sharply, and this acceleration continued into the early part of 2017.
In China, after collapsing in 2015, trade revived, more markedly in the case of imports (up 5.5 per cent in 2016 in terms of volume): the expansionary fiscal policy stance and the robust growth in consumption contributed significantly, while the export-induced component of imports was more sluggish, reflecting the weakness in foreign demand.
Liberalization initiatives. – Last year marked a setback for the main trade liberalization initiatives. Following the inauguration of the new administration in the United States, hopes faded regarding the start-up of the Trans-Pacific Partnership (TPP) among the 12 main countries that border the Pacific Ocean excluding China, and negotiations for the Transatlantic Trade and Investment Partnership (TTIP) between the United States and the European Union were broken off. In addition, the US Congress is currently discussing corporate tax reforms, including the possibility of introducing a border adjustment tax, with potentially significant repercussions on the terms of trade with the United States.
Within the context of multilateral agreements, it is particularly difficult to extend trade liberalization to services, investment, and the protection of intellectual property rights. These extensions, together with the harmonization of regulations and technical production standards and the resolution of disputes among investors and states, are essential to creating new global value chains, but they pose significant challenges. Nevertheless, last February the Comprehensive Economic and Trade Agreement

BANCA D’ITALIAAnnual Report201618
between the European Union and Canada was finalized. It provides for the elimination of nearly all tariff barriers to trade in goods, reciprocal opening up of the service sector, and easier access to the public procurement and investment markets. The agreement must be ratified by each EU member state, a process which may be lengthy and not without difficulty in light of the growing opposition to globalization in Europe (see the box ‘Concerns about trade openness and exposure to the effects of globalization’).
CONCERNS ABOUT TRADE OPENNESS AND EXPOSURE TO THE EFFECTS OF GLOBALIZATION
The process of international economic integration that has brought significant benefits to both advanced and emerging countries in the last seventy years appears to have lost momentum. During most of the 1980s and 1990s the degree of openness of the world economies grew, but this process has slowed since the mid-2000s (see the box ‘The weakness of world trade and the role of global value chains’ in Chapter 2, Annual Report for 2014, 2015). The reduction of tariff barriers to trade virtually came to halt, while non-tariff barriers increased (see panel (a) in Figure A). In the same period, the signing of free trade agreements also became less frequent (see panel (b) in Figure A).
This phenomenon is to some degree normal: the opening to trade of some economies, China above all, was a non-replicable event that led to a strong but temporary acceleration in the globalization process. However, the slowdown also reflects the growing influence of sceptical positions on international integration policies in public opinion in the advanced countries.
According to a large body of economic literature, the demand for protection against the pressures of international competition is concentrated among the categories of workers for which globalization has led to wage stagnation and worse
Figure A
Trade policies: 1990-2015
(a) Tariff (1) and non-tariff barriers (2) (b) Number of trade liberalization agreements signed
0
5
10
15
20
25
30
35
1990 1995 2000 2005 2010 20150
5
10
15
20
25
30
35
40
45
50
0
5
10
15
20
25
30
35
40
45
50
1990 1995 2000 2005 2010 2015
Non-tariff barriers imposed by advanced economies (thousands)
Non-tariff barriers imposed by emerging economies (thousands)
Average tariff imposed by advanced economies (as % of value)
Average tariff imposed by emerging economies (as % of value)
0
5
10
15
20
25
30
35
Sources: Based on data from the World Bank, the WTO and the Design of Trade Agreements Database.(1) 3-month moving average of the tariffs set by the various countries, weighted by level of GDP in dollars in 2010 (data taken from the IMF World Economic Outlook); the emerging countries considered here are Brazil, China, India, Indonesia, Mexico and Russia; the advanced countries are Canada, Japan, the United States and EU member states. – (2) Data available starting from 1995.

BANCA D’ITALIA Annual Report192016
employment prospects.1 Such workers are mostly employed in manufacturing and are low-skilled.2 By exacerbating social hardship, the economic crisis appears to have strengthened the demand for protection.
Sometimes globalization is also held responsible for part of the redistributive effects arising from technological progress;3 this could be due to the fact that the consequences of trade openness are more immediately visible and generally more concentrated in some sectors and geographical areas, while those of technological innovations are more pervasive.
A study published by the Bank of Italy examines the stance on trade openness of a representative sample of European citizens.4 The rise in support for protectionism observed between 2006 and 2014 is in large part ascribable to the population segments more exposed to globalization. These weaker segments already had a more critical view of free trade compared with the average for the whole population at the beginning of the period, and the gap widened in the years under review, especially for those reporting economic hardship at household level (Figure B). The evidence suggests that the worsening in cyclical conditions that occurred during the double-dip recession helps to explain these groups’ increasing aversion to trade openness. The data also show that these groups are among the least favourable to the project underlying the European Union, whose key element is its member states’ acceptance of the four freedoms, i.e. the free movement of persons, goods, services and capital. It is through
1 D. Autor, D. Dorn, G. Hanson and K. Majlesi, ‘Importing political polarization? The electoral consequences of rising trade exposure’, NBER Working Paper, 22637, 2016; I. Colantone and P. Stanig, ‘The trade origins of economic nationalism: import competition and voting behavior in Western Europe’, Baffi Carefin Centre Research Paper, 49, 2017; L. Guiso, H. Herrera, M. Morelli and T. Sonno, ‘Demand and supply of populism’, CEPR Discussion Paper, 11871, 2017.
2 D. Autor, D. Dorn and G. Hanson, ‘The China syndrome: local labor market effects of import competition in the United States’, American Economic Review, 103, 6, 2013, 2121-2168.
3 E. Helpman, ‘Globalization and wage inequality’, NBER Working Paper, 22944, 2016.4 Data taken from the European social survey, an exercise focusing on the socio-economic characteristics and
cultural, political and value attitudes of European citizens. See C. Biancotti, A. Borin and M. Mancini, ‘Euroscepticism: another brick in the wall’, Banca d’Italia, Temi di Discussione (Working Papers), forthcoming.
Figure B
Share of individuals in favour of protectionism, by level of exposure to globalization and economic
conditions of household (1) (2)(per cent)
0
10
20
30
0
5
10
15
More exposed
individuals facing
economic hardship
More exposed
individuals not facing economic hardship
Less exposed
individuals facing
economic hardship
Less exposed
individuals not facing economic hardship
Difference 2014-2006 2014 (3)
Source: C. Biancotti, A. Borin and M. Mancini, ‘Euroscepticism: another brick in the wall’, Temi di Discussione (Working Papers), forthcoming.(1) The more exposed population segment comprises less-skilled workers with a low level of education and whose work involves manual and repetitive tasks, while the less exposed one comprises high-skilled professionals and managers. – (2) The economic conditions of the household are measured through the respondents’ subjective assessment of the adequacy of their income to cover their needs. – (3) Right-hand scale.

BANCA D’ITALIAAnnual Report201620
Commodity prices and markets
Oil prices. – The glut in the global oil market that built up over the previous two year eased in 2016 (Figure 2.2.a). The drastic slump in prices that began in the second half of 2014 came to a halt: after hitting a low of $25 a barrel in January 2015, prices rose to over $50 a barrel at the end of December 2016, buoyed in part by the production cuts announced by OPEC and other producers. Stocks of crude oil, measured by the International Energy Agency only for OECD countries, started to diminish in the last part of the year after having peaked in the third quarter.
Figure 2.2
Oil supply and demand and commodity prices
(a) Brent prices and mismatch between world oil supply and demand(millions of barrels per day)
(b) Commodity prices(indices, January 2010=100)
2010 2011 2012 2013 2014 2015 2016 '1725
50
75
100
125
150
175
25
50
75
100
125
150
175
Agricultural goods
Metals
Energy
'07 '08 '09 '10 '11 '12 '13 '14 '15 '16'17-3
-2
-1
0
1
2
3
20
40
60
80
100
120
140
Supply < Demand (1)
Supply > Demand (1)
Brent
Sources: Thomson Reuters and based on IMF and IEA data.(1) Right-hand scale.
Benefitting from prices that remain low and stronger global activity, world demand for oil remained robust, increasing by 1.6 million barrels per day compared with the previous year. Supply expanded at a much slower pace, by 0.3 million barrels per day: the increase in production on the part of Middle Eastern countries, intended to limit the fall in energy revenues due to low oil prices, was offset by the decrease in production by non-OPEC countries, which slashed their output by 0.8 million barrels per day. In the United States, the supply decline under way since 2015 continued until the middle of the year; beginning in the summer, in response to the gradual recovery in prices, the supply of crude returned to growth, reflecting, among other things, the sharp productivity gains achieved in the meantime by unconventional producers in the United States.2
2 IMF, World Economic Outlook, April 2017.
these freedoms that the international integration processes become a reality. As with trade liberalization, the increasing aversion to the EU appears directly correlated to the worsening in economic conditions observed during the recession.

BANCA D’ITALIA Annual Report212016
Last November, OPEC agreed to reduce the supply of crude oil in 2017, a decision to which other oil-producing countries such as Russia later adhered. The announcement of this agreement, which calls for an overall reduction of 1.8 million barrels per day, triggered a rise in oil prices. It has also brought about a sizeable increase in forward sales by US producers who, having thus hedged their exposure to price fluctuations in 2017, could possibly offset part of the reduction in supply from OPEC.
Since the start of 2017 oil prices have hovered around $50 per barrel, displaying greater volatility upon the release of US production and inventory data with news of the possible extension of the OPEC agreement.
Other commodity prices. – The five-year decline in non-oil commodity prices ended (Figure 2.2.b). Industrial metals prices benefited from increased demand from China and, at the end of the year, from the expectations of expanded infrastructure spending announced by the new US administration. The production cuts by a number of mining companies over the previous two years gave additional support to prices. The prices of agricultural commodities recorded a moderate rise of 3 per cent on average for the year. Their pace was slowed by a succession of upward revisions to harvest estimates in many parts of the world.
Global imbalances
In 2016 global current account imbalances were substantially stable overall: the expansion in the current account balances of the advanced economies corresponded to a contraction in those of the emerging economies (Figure 2.3.a).
Figure 2.3
Current account balances and foreign exchange reserves
(a) Current account balances(per cent of global GDP)
(b) Official reserves(billions of dollars)
0
2,000
4,000
6,000
8,000
10,000
12,000
14,000
'06 '07 '08 '09 '10 '11 '12 '13 '14 '15 '16
Advanced economies
Emerging oil-exporting countries
China
Other emerging economies
-2.0
-1.0
0.0
1.0
2.0
3.0
-2.0
-1.0
0.0
1.0
2.0
3.0
2006 2007-2009
2010-2012
2013 2014 2015 2016
United States
Japan
Euro area
Other advanced economies
0
2,000
4,000
6,000
8,000
10,000
12,000
14,000
Emerging oil-exporting countries
China
Other emerging economies
Source: Based on IMF, World Economic Outlook, April 2017.
China’s current account surplus fell to 1.8 per cent of GDP, one percentage point lower than 2015. The worsening of the merchandise trade balance was coupled with

BANCA D’ITALIAAnnual Report201622
an increase in the deficit on services, within which the growth in spending on tourism abroad may at least partially hide a capital outflow.
The oil-exporting countries, historically in surplus, recorded a current account deficit for the second consecutive year (1.7 per cent of GDP in 2016), financed by both an additional sale of official reserves and recourse to foreign borrowing via new issuances on the international markets. The other emerging economies reduced their deficits, mainly as a result of the fall in the price of imported crude oil.
Japan’s surplus, boosted by the improvement in the terms of trade, rose further, returning to levels recorded before the global financial crisis (3.9 per cent of GDP). The euro-area surplus also continued to grow, reaching 3.4 per cent of GDP, mostly thanks to Germany’s surplus (see Chapter 3, ‘Macroeconomic developments and fiscal policies in the euro area’). The United States’ deficit remained stable at 2.6 per cent of GDP: the merchandise trade balance improved further thanks to the energy sector, whose position is now nearly in balance, and thus more than compensated for the deterioration in the balances on services and income.
Foreign exchange reserves.- In 2016 the reserves held by the emerging economies as a whole decreased, although to a lesser extent than in 2015 (Figure 2.3.b): oil-importing emerging countries, benefitting from improved terms of trade, again began accumulating reserves ($171 billion more than 2015) while oil-exporting countries continued to sell them ($146 billion) to counter the downward pressures on their currencies. China’s reserves continued to decline ($315 billion), with an acceleration towards the end of the year, in connection with greater capital outflows largely attributable to residents. In the first quarter of 2017 the reduction in Chinese reserves came to a halt following interventions by the authorities on the domestic and offshore foreign exchange markets and stricter capital controls.
The composition of China’s foreign exchange assets, amounting to more than $6,400 billion at the end of 2016, continued to change: over the last two years, the large reduction in the stock of official reserves (of more than $800 billion) was met with an increase in assets held by the private sector. This increase accounted for nearly half of the growth in foreign direct investment, which exceeded 20 per cent of total foreign assets at the end of 2016 (up from 14 per cent at the end of 2014).
IMF Resources. – In September 2016 the G20, under China’s presidency, confirmed its support of the International Monetary Fund so that the Fund can continue to perform a key role in the global financial safety net (see the box, ‘Adequacy and effectiveness of the global financial safety net’, Chapter 2, Annual Report for 2015, 2016). To this end, the IMF member countries are working on keeping the IMF’s aggregate resources (permanent and temporary) unchanged over the medium term. The IMF, with sufficient resources to combat financial shocks, can contribute to containing the cost for emerging economies of borrowing on the international bond markets.3
3 C. Maurini, ‘The IMF Safety Net and emerging markets’ sovereign spreads’, Banca d’Italia, Questioni di Economia e Finanza (Occasional Papers), 370, 2017.

BANCA D’ITALIA Annual Report232016
The IMF’s Executive Board decided to renew the New Arrangement to Borrow (NAB) – a multilateral borrowing programme through which 40 countries make available temporary resources totalling 182 billion special drawing rights (SDRs) – and pushed back its expiration date to 2022. However, recourse to this instrument may be more difficult following the decision taken last year by the US Congress to trigger the activation of the NAB only once the forward commitment capacity (FCC) has fallen below SDR 100 billion. Last April the FCC was SDR 209 billion, while the amount committed to assisting member countries was SDR 112 billion (about half of which in the precautionary flexible credit line arrangement for Mexico).
Over the course of 2016 numerous bilateral borrowing arrangements were renewed between the IMF and member countries, with a governance model that provides for greater control on the part of creditors: at the end of April 2017, 35 countries had already pledged to sign new arrangements, for a total of SDR 300 billion; among these, the Bank of Italy signed a borrowing arrangement in the amount of €23.48 billion (authorized by Law 19/2017).

BANCA D’ITALIAAnnual Report201624
3. MACROECONOMIC DEVELOPMENTS AND FISCAL POLICIES IN THE EURO AREA
The moderate recovery in economic activity in the euro area under way since 2014 continued last year. It was buoyed by the acceleration of investment and consumption, while the contribution of net exports was negative. In the first quarter of 2017 GDP gained 0.5 per cent over the previous quarter.
Consumer price inflation was practically nil in 2016, at a yearly average of 0.2 per cent, far below the level consistent with the ECB’s definition of price stability, which calls for an inflation rate below but close to 2 per cent over the medium term. Price dynamics picked up gradually in the second half of 2016 and the early months of 2017, slightly exceeding 1 per cent in December and reaching 1.8 per cent in the first quarter of this year. The increase was due above all to the upturn in oil prices; net of food and energy products, inflation remained low, a bit below 1 per cent.
According to the estimates of the European Commission, the overall stance of fiscal policy in the euro area was practically neutral in 2016 and is expected to stay neutral in 2017 as well. The debate on the role of fiscal policy for purposes of macroeconomic stabilization within the area continued.
Little progress has been made in response to the publication of the Five Presidents’ Report in 2015, aimed at strengthening the European monetary union both economically and politically. The process of completing the banking union has stalled, owing to differences of opinion between the countries that favour greater sharing of macroeconomic risks and those that consider the top priority to be additional prudential measures, such as the containment of banks’ sovereign exposures. On the occasion of the sixtieth anniversary of the Treaty of Rome, the Commission published a white paper setting forth several alternative scenarios for the future of the European Union.
Cyclical developments
Euro-area GDP grew by 1.8 per cent in 2016. As in the previous two years, growth was sustained by the domestic components of demand, which more than offset the negative impact of foreign trade (Table 3.1).
Activity continued to expand in all the main euro-area economies: at a rapid pace of 3.2 per cent in Spain, and by 1.9 per cent in Germany, 1.2 per cent in France and 0.9 per cent in Italy (Figure 3.1.a). Only in Spain did net exports contribute positively to GDP growth.

BANCA D’ITALIA Annual Report252016
Table 3.1
GDP in the main euro-area countries (1)(volumes at chain-linked prices; percentage changes on previous period)
2014 2015 2016 2016 2017
Q1 Q2 Q3 Q4 Q1
France (2) 0.9 1.1 1.2 0.6 -0.1 0.2 0.5 0.3
Germany 1.6 1.7 1.9 0.7 0.5 0.2 0.4 0.6
Italy 0.1 0.8 0.9 0.4 0.1 0.3 0.2 0.2
Spain (3) 1.4 3.2 3.2 0.8 0.8 0.7 0.7 0.8
Euro area (4) 1.2 2.0 1.8 0.6 0.3 0.4 0.5 0.5
Sources: Based on national statistics and Eurostat data.(1) Adjusted for seasonal and calendar effects. – (2) The quarterly data do not include the revised annual data released on 16 May. – (3) The annual percentage change is based on raw quarterly data. – (4) Reference is to the current euro area, with 19 members.
Household spending growth accelerated slightly to 2.0 per cent, benefiting from strengthening confidence and an increase in disposable income (1.9 per cent in real terms), due in turn to improving labour market conditions.
Figure 3.1
Euro-area GDP and €-coin
(a) GDP of the euro area and the main countries(indices, 2005=100)
(b) €-coin indicator and euro-area GDP(3-month percentage changes)
'05 '06 '07 '08 '09 '10 '11 '12 '13 '14 '15 '16 '17-3.5
-3.0
-2.5
-2.0
-1.5
-1.0
-0.5
0.0
0.5
1.0
1.5
-3.5
-3.0
-2.5
-2.0
-1.5
-1.0
-0.5
0.0
0.5
1.0
1.5
€-coin (1) GDP
'05 '06 '07 '08 '09 '10 '11 '12 '13 '14 '15 '16 '1792
96
100
104
108
112
116
120
92
96
100
104
108
112
116
120
Euro area Italy Germany
France Spain
Sources: Bank of Italy, Eurostat and Istat. (1) See the section dedicated to the €-coin indicator on the Bank of Italy’s website http://eurocoin.bancaditalia.it/media/notizia/coin-registra-un-ulteriore-incremento-in-aprile. The €-coin estimate for April 2017 was completed before GDP data for the first quarter of 2017 became available.
Gross fixed investment gained 3.7 per cent, thanks to an increase of 5.1 per cent in expenditure on capital goods and a pick-up in construction spending, which increased by 2.4 per cent. Capital accumulation was driven by continuing highly favourable credit conditions, a recovery in profit margins, strengthening business confidence and, in France and Italy, the incentives aimed at accelerating the amortization of capital goods for tax purposes. For the first time in a decade construction investment made a positive contribution to GDP growth in all four major euro-area economies. Despite this progress, total investment remained nearly 9 percentage points below the pre-crisis peak.
Exports, which in the national accounts include intra-area trade, recorded an increase of 2.9 per cent, less than half as much as in 2015. Estimates based on

BANCA D’ITALIAAnnual Report201626
foreign trade statistics indicate that the slowdown in exports to non-area countries was significantly sharper. Sales to those countries were affected by still limited growth in the potential demand for euro-area goods against the backdrop of weakening world trade (see Chapter 2, ‘World trade, commodity prices and payments balances’). The cumulative gain in competitiveness over the last three years (the effective nominal exchange rate of the euro was down 7 percentage points in 2016 by comparison with 2014) offset these developments only in part. Imports, while also decelerating, increased by 4.0 per cent by comparison with 2015.
The current account surplus increased marginally, to 3.3 per cent of GDP, owing in part to an improvement in the terms of trade as a result of the fall in average commodity prices over the last two years.
In the first quarter of 2017 the GDP of the euro area increased by 0.5 per cent over the previous quarter, consistent with the ECB’s March projections, which indicate a growth of 1.8 per cent this year.
After a slight decline in the early part of last year, the Bank of Italy’s €-coin indicator, which estimates euro-area GDP growth net of the most volatile components (seasonal variations, measurement errors and short-run volatility), strengthened steadily from May onwards and accelerated markedly in the fourth quarter thanks above all to improving household and business confidence. On average in the first quarter of 2017 it was at its highest level since 2010 (0.72 per cent; Figure 3.1.b), sustained by rising share prices.1
Area-wide employment expanded by 1.3 per cent in 2016. The growth was sharpest in Spain (2.7 per cent) but was significant also in Italy, Germany and France at 1.3, 1.2 and 0.7 per cent respectively. The unemployment rate came down from 10.9 to 10.0 per cent, and to 9.6 per cent in the first quarter of 2017 (1 percentage point higher than the average in the decade before the recession of 2008-09).
Prices and costs
On average for 2016 euro-area consumer inflation, as measured by the harmonized index of consumer prices, was just barely positive (0.2 per cent), after being nil in 2015. The 12-month rise in prices increased progressively starting towards the end of summer, reaching 1.1 per cent in December, and it strengthened further in the early months of 2017 to 1.9 per cent in April (Figure 3.2).
The pick-up in consumer inflation in the second half of 2016 was due almost entirely to energy prices, which declined at a slower pace in the third quarter and stagnated in the fourth. The acceleration in the harmonized index of consumer prices (HICP) in the first quarter of 2017 was due above all to the energy component and, to a lesser extent, to
1 The indicator was developed based on the methodology described in F. Altissimo, R. Cristadoro, M. Forni, M. Lippi and G. Veronese, ‘New eurocoin: tracking economic growth in real time’, The Review of Economics and Statistics, 92 (2010), 1024-1034, also published in Banca d’Italia, Temi di Discussione (Working Papers), 631, 2007. The monthly updates of the indicator have been published since May 2009 on the websites of the Bank of Italy and the Centre for Economic Policy Research (CEPR).

BANCA D’ITALIA Annual Report272016
food. Core inflation, net of energy and food products, was practically unchanged throughout 2016 at the very low levels recorded the previous year (0.9 per cent in 2016, 0.8 per cent in 2015), and remained weak in the early months of 2017 as well. Unit labour costs rose modestly, by 0.9 per cent in 2016, while hourly earnings gained 1.5 per cent.
The slackness of prices in 2016 was common to all the main euro-area economies: the dispersion of harmonized inflation rates among countries diminished, nearing the minimum registered since the introduction of the single currency. Prices rose by 0.4 per cent in Germany and 0.3 per cent in France, while declining marginally in Italy and Spain, by 0.1 and 0.3 per cent respectively.
The risk of deflation was practically eliminated (see Chapter 4, ‘Monetary policy in the euro area’), but there is still a high probability that inflation will remain very low. The market’s evaluation of the probability of deflation over a five-year horizon, estimated on the basis of inflation options, is near zero, compared with around 20 per cent on average in the first quarter of 2016 (see the box ‘The risk of low inflation in the euro area’, Economic Bulletin, 2, 2017); the implicit probability of inflation being at or below 1 per cent is about 40 per cent; that of inflation higher than 2.5 per cent is negligible.
According to the ECB projections released in March, inflation will come to 1.7 per cent in 2017, dip to 1.6 per cent in 2018 and come back up to 1.7 per cent in 2019. According to the professional forecasters polled by Consensus Economics in May, prices will rise by 1.6 per cent this year and 1.4 per cent next. The inflation expectations inferred from the financial markets are more moderate (see the box ‘The pass-through of oil prices to inflation expectations in the euro area’): in April the implied expectations on horizons of two and five years were near 1 per cent.
Figure 3.2
Inflation in the euro area and contributions of its components (1)(monthly data; 12-month percentage changes
and percentage points)
2016 2017-1.5
-1.0
-0.5
0.0
0.5
1.0
1.5
2.0
2.5
-1.5
-1.0
-0.5
0.0
0.5
1.0
1.5
2.0
2.5
2015
Energy products
Services
Non-food and non-energy products
Processed food products
Fresh food products
Total
Sources: Based on Eurostat data.(1) HICP.
THE PASS-THROUGH OF OIL PRICES TO INFLATION EXPECTATIONS IN THE EURO AREA
A number of studies have documented the significant impact of the decline in crude oil prices in recent years on the market’s inflation expectations, as inferred from the yields of inflation swaps over a variety of investment horizons (see panel (a) of the figure).1
The observed performance of inflation swap yields does not depend exclusively on investors’ inflation expectations. A comparison of yields with the projections
1 D. Elliott, C. Jackson, M. Raczko and M. Roberts-Sklar, ‘Does oil drive financial market measures of inflation expectations?’ Bank Underground, 20 October 2015 (blog post).

BANCA D’ITALIAAnnual Report201628
of professional forecasters, which are more stable over longer horizons (panel (b) of the figure), suggests that the compensation demanded by the market to trade a fixed interest rate for an inflation-indexed rate has probably been affected not only by changes in inflation expectations but by other factors as well, such as changes in liquidity conditions and risk premiums. This hypothesis has been confirmed by analyses that explain part of the fall of swap yields over the longer term as the effect of the reduction in risk premiums.2
Inflation expectations in the euro area and oil prices
(a) Inflation expectations and the price of oil (1) (daily data)
(b) Inflation projections of professional forecasters (3) (quarterly data)
0.5
1.0
1.5
2.0
2.5
0.5
1.0
1.5
2.0
2.5
Q1
Q2
Q3
Q4
Q1
Q2
Q3
Q4
Q1
Q2
Q3
Q4
Q1
Q2
Q3
Q4
Q1
Q2
Q3
Q4
Q1
Q2
Q3
Q4
Q1
Q2
Q3
Q4
Q1
2010 2011 2012 2013 2014 2015 2016 '17
1 year 5 years
2014 2015 2016 '170.0
0.5
1.0
1.5
2.0
2.5
3.0
0
20
40
60
80
100
120
Price of oil
5 years (2)
5-10 years (2)
Sources: Based on Bloomberg and ECB data.(1) Expected inflation rates implied by inflation-linked swap contracts for 5 years and 5-year, 5-year forward. – (2) Right-hand scale. – (3) Inflation projections of respondents to the ECB’s quarterly Survey of Professional Forecasters.
A good part of the fall, however, does reflect an actual revision of inflation expectations. Empirical estimates confirm that oil prices have had an impact not only on short-term euro-area inflation expectations but also, starting in 2014, on those farther ahead.3 This runs counter to the opinion that a one-off drop in oil prices has a direct impact on inflation only in the short term, but it can be explained by the spread of fears that the global economy was on the verge of secular stagnation (see the box ‘The secular stagnation hypothesis,’ Chapter 1, Annual Report for 2014, 2015). These fears, given the very limited room for conventional monetary policy action, presumably fueled doubts over policy-makers’ capacity to attain their inflation objectives and induced the markets to judge the signals of weakening demand and the consequent deflationary pressures to be persistent.
Corroboration of this reading comes from the significant strengthening, in the same period, of the correlation between short-term and long-term inflation expectations, and from the fact that the estimated effect of the price of oil on long-term inflation expectations is not significant when the determinants of the latter are
2 M. Pericoli, ‘A decomposition of inflation compensation in the euro area’, Banca d’Italia, Temi di Discussione (Working Papers), forthcoming.
3 C. Conflitti and R. Cristadoro, ‘Oil price and inflation expectations’, Banca d’Italia, Questioni di Economia e Finanza (Occasional Papers), forthcoming.

BANCA D’ITALIA Annual Report292016
The financial markets
Conditions in euro-area financial markets have improved despite bouts of volatility in connection with the increasing uncertainty over economic policies at European and global level. The main factors in the improvement have been the strengthening growth in the euro area and the highly expansive stance of monetary policy.
The average yield on euro-area government securities remained very low last year (about 1.2 per cent for ten-year bonds; Figure 3.3.a). The upward pressure deriving from the rise in US yields was partly offset by the Eurosystem’s expansive monetary policy stance (see Chapter 4, ‘Monetary policy in the euro area’).
Figure 3.3
Government securities yields and spreads(weekly data; percentage points)
(a) Yields (b) Yield spread over German government securities
'172011 2012 2013 2014 2015 20160
5
10
15
20
25
30
35
40
0
2
4
6
8
10
12
14
16
Ireland Italy
Portugal Spain
2011 2012 2013 20140
5
10
15
20
25
30
35
40
0
2
4
6
8
10
12
14
16
Belgium
Germany
2015 2016 '17
France
Euro area (2)
Greece (1)
Sources: For the euro area, ECB; for individual countries, based on Bloomberg data.(1) Right-hand scale. – (2) Average yield on 10-year government securities of members of the euro area, weighted by volume of 10-year-maturity paper outstanding.
The Eurosystem Corporate Sector Purchase Programme launched by the ECB in March 2016 helped to hold down the yields of the euro-denominated bonds of non-financial corporations, whose spreads over government securities narrowed, and fostered a substantial volume of issues (see the box ‘The impact of Eurosystem purchases of private sector bonds’ in Chapter 14).
In the first half of 2016 share prices in the euro area fell sharply in connection with strains in the European banking sector and the British referendum on leaving the EU. The ground lost was gradually recouped in the second half, owing to the strengthening
broadened to include economic surprise indices and stock market index variations. From this perspective, the correlation between the price of oil and medium-term inflation expectations does not indicate a direct causal nexus but rather the effect of common factors, among which in particular the protracted weakness of cyclical conditions, current and prospective, in Europe and globally.

BANCA D’ITALIAAnnual Report201630
economic recovery in the euro area and the persistence of highly accommodative monetary conditions. By the end of the year general euro-area stock indices were above the levels recorded at the beginning of 2016, if only slightly.
In the early months of 2017 the area’s financial markets benefited from the further improvement in cyclical conditions. Around 20 May prices were 11 per cent higher than at the start of the year, and corporate bond spreads had narrowed further. The spreads on euro-area government securities, after widening until mid-April, narrowed in response to the outcome of the two rounds of the French presidential election.
Fiscal policies
The fiscal policy stance. – Based on the European Commission’s latest estimates,2 last year the fiscal policy stance in the euro area – defined as the variation in the cyclically adjusted primary balance – was neutral, as in the previous two years (see the box ‘Fiscal policy in the euro area during the crisis years’).
The overall stance is derived by aggregating national fiscal policies, which are determined also in the light of cyclical conditions and the state of the public finances in each country. In November 2015 the Commission, which at that time estimated the area’s fiscal policy for 2016 as practically neutral, judged that this stance was appropriate in the light of both the function of macroeconomic stabilization and the need to ensure sustainable public finances.3
For the main economies, fiscal policy was estimated to have been neutral in 2016 in France and Germany and expansive in Italy and Spain. In the latter two countries, the cyclically adjusted primary balance worsened by 0.6 and 1.1 percentage points of GDP, respectively.
2 Unless otherwise indicated, the data are drawn from the European Commission’s ‘Spring 2017 Economic Forecast’.3 European Commission, ‘2016 Draft Budgetary Plans: Overall Assessment’, COM(2015) 800 final, 2015.
FISCAL POLICY IN THE EURO AREA DURING THE CRISIS YEARS
The impulse imparted to the economy by fiscal policy is traditionally gauged by the changes in the primary budget balance. These are produced both by automatic stabilizers (the cyclical component of the primary budget balance) and by discretionary government decisions (which determine the changes in the cyclically adjusted primary balance, which is to say the fiscal policy stance).1
The automatic stabilizers reduce the amplitude of cyclical economic fluctuations by acting promptly and symmetrically both in favourable and in unfavourable phases of the cycle. When economic growth is below its potential, the automatic stabilizers result in a reduction in the primary balance, imparting an expansive impulse to
1 In International Monetary Fund documents, the change in the cyclically adjusted primary balance is the ‘fiscal impulse’. Adjusting the primary balance also for the effect of temporary measures gives the structural primary balance. The change in this balance defines ‘fiscal stance’ as used in European Commission documents.

BANCA D’ITALIA Annual Report312016
economic activity, insofar as they reduce tax revenues and increase spending, for instance on unemployment benefits. In the contrary case, when the economy overheats, the stabilizers increase the primary balance, reducing output growth.
During the two decades preceding the crisis (dubbed the ‘great moderation’), the dominant idea was that the operation of the automatic stabilizers – together with countercyclical monetary policy – was sufficient to attenuate the effects of macroeconomic shocks. The depth and duration of the economic and financial crisis and the emergence of the risk that the lengthy recession could have permanent repercussions on the potential of the economy have sparked renewed debate on the possibility of using discretionary countercyclical fiscal policy measures as well, in particular by providing an expansive impulse as long as the actual level of activity remains below its potential, in order to speed the closing of the output gap.
According to the European Commission’s estimates of the output gap2 and the cyclical component of the public budget, the change in the cyclically adjusted primary balance in the euro area was near zero, on average, in the years of crisis (2008-2016). However, this aggregate result conceals ample differences both over time and between countries (see the figure).
In the three years from 2008 to 2010, as output slumped severely, fiscal policies acted countercyclically, providing an expansive impulse to the economy. For the aggregate of area countries, in fact, the primary balance worsened by nearly 2 percentage points per year, on average, more than half of this owing to discretionary measures agreed on as part of the European Economic Recovery Plan as early as the end of 2008. Differences between countries reflected national specificities in the impact of the crisis, the size of automatic stabilizers and the previous state of the public finances. In France and Germany the primary balance worsened by an average of 1.5 points a year in the three years, about half of this due to discretionary measures. In Italy the budget deterioration was less pronounced (1 point a year), with the discretionary component accounting for about a quarter, owing to the limits on fiscal space set by the high public debt.
In the three years 2011-13, despite a further decline in GDP (after a transitory improvement in the output gap in 2011), fiscal policies were restrictive overall, with an impact amplified by higher-than-normal values of the fiscal multiplier. On average for the area, the cyclically adjusted primary balance improved by more than 3.5 percentage points of GDP, more than offsetting the effects of the automatic stabilizers (which worsened the balance by about half a point). The fiscal adjustment carried out in Italy, Germany and France was less pronounced than the average, amounting to about half a point in the former and nearly a full point in the latter two countries. This was accompanied by very considerable divergences in output gap, which was more than half a point larger than the area average in Italy, about half the average in France, and marginally positive on average for the three years in Germany.
2 The measure of the output gap used in this box is derived from the estimates of the European Commission; it does not necessarily coincide with that for Italy given in other parts of this Annual Report.
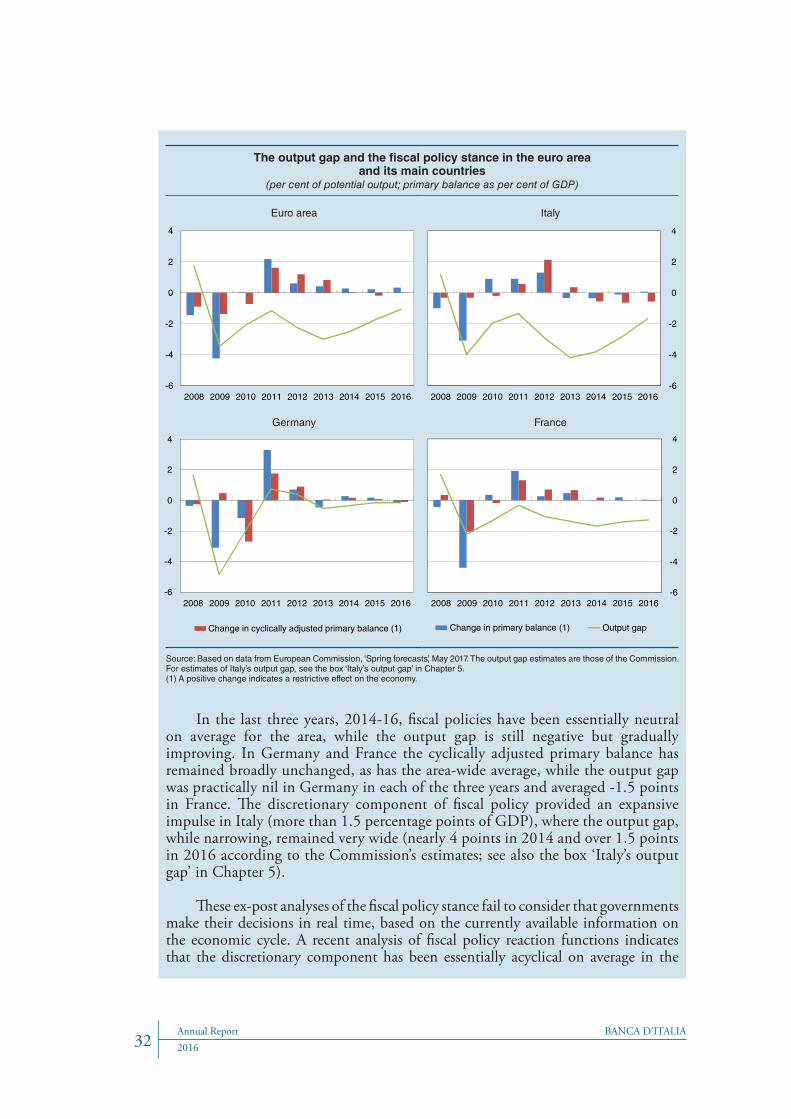
BANCA D’ITALIAAnnual Report201632
The output gap and the fiscal policy stance in the euro area and its main countries
(per cent of potential output; primary balance as per cent of GDP)
Euro area Italy
-6
-4
-2
0
2
4
2008 2009 2010 2011 2012 2013 2014 2015 2016-6
-4
-2
0
2
4
2008 2009 2010 2011 2012 2013 2014 2015 2016
Germany France
Change in primary balance (1) Output gapChange in cyclically adjusted primary balance (1)
-6
-4
-2
0
2
4
-6
-4
-2
0
2
4
2008 2009 2010 2011 2012 2013 2014 2015 2016 2008 2009 2010 2011 2012 2013 2014 2015 2016
Source: Based on data from European Commission, ‘Spring forecasts’, May 2017. The output gap estimates are those of the Commission. For estimates of Italy’s output gap, see the box ‘Italy’s output gap’ in Chapter 5.(1) A positive change indicates a restrictive effect on the economy.
In the last three years, 2014-16, fiscal policies have been essentially neutral on average for the area, while the output gap is still negative but gradually improving. In Germany and France the cyclically adjusted primary balance has remained broadly unchanged, as has the area-wide average, while the output gap was practically nil in Germany in each of the three years and averaged -1.5 points in France. The discretionary component of fiscal policy provided an expansive impulse in Italy (more than 1.5 percentage points of GDP), where the output gap, while narrowing, remained very wide (nearly 4 points in 2014 and over 1.5 points in 2016 according to the Commission’s estimates; see also the box ‘Italy’s output gap’ in Chapter 5).
These ex-post analyses of the fiscal policy stance fail to consider that governments make their decisions in real time, based on the currently available information on the economic cycle. A recent analysis of fiscal policy reaction functions indicates that the discretionary component has been essentially acyclical on average in the

BANCA D’ITALIA Annual Report332016
countries and years considered.3 This result is obtained either using the output gap data available when budget decisions were made (real time estimates) or referring to data revised subsequently in the light of updated statistics. The analysis further suggests that national differences in the response to the economic cycle are closely correlated with the level of the public debt and the yield on government securities. Specifically, the countries with weaker public finances were more frequently obliged than others to adopt a pro-cyclical stance during the crisis.
In a monetary union, the determination of the optimal fiscal policy response to cyclical fluctuations should also take cross-country spillovers into account. There is evidence that they can be significant in size, especially in a context of protracted recession and accommodative monetary policy.4 For the euro area as a whole it is necessary to develop analytical tools for determining the most appropriate fiscal policy stance and identifying the possible forms of coordination to guarantee its effective implementation, so as to keep the choices of individual governments from generating sub-optimal allocations.5
3 R. Golinelli, I. Mammi and P. Rizza, ‘The cyclicality of fiscal policy in the euro area over the crisis,’ Banca d’Italia, Temi di Discussione (Working Papers), forthcoming.
4 F. Caprioli, M. Romanelli and P. Tommasino, ‘Discretionary fiscal policy in the euro area: past, present and future’, Banca d’Italia, Questioni di Economia e Finanza (Occasional Papers), forthcoming.
5 For a reflection on these issues, see among others European Commission, ‘Draft budgetary plans 2016: overall assessment’, COM(2015) 800 final; and F. Caprioli, M. Romanelli and P. Tommasino, ‘Discretionary fiscal policy in the euro area: past, present and future’, Banca d’Italia, Questioni di Economia e Finanza (Occasional Papers), forthcoming.
The Commission’s assessments for 2017 indicate that the overall stance for the area will continue to be essentially neutral. The cyclically adjusted primary balance should remain practically unchanged in France and Spain, while it should diminish by 0.3 percentage points in Italy and 0.4 points in Germany. In this way Germany, which has the medium-term objective of a structural deficit4 of 0.5 per cent, would continue to run a very large cyclically adjusted surplus.
In November the Commission forwarded to the Council a draft recommendation calling for an expansive fiscal policy stance in the euro area as a whole in 2017 (reducing the structural primary surplus by an amount up to 0.5 percentage points of GDP).5 In particular the Commission called on countries that are over-achieving their medium-term fiscal objectives to use their fiscal space to support the economy and re-launch investment, while the other countries should move closer to their medium-term objectives. The Council endorsed these proposals,6 in particular urging member states with ample fiscal leeway to increase investment, although it offered no quantitative indications concerning the overall fiscal policy stance of the area (see the box ‘Public investment in the euro area: forms of funding and effects on the economy’).
4 The ‘structural balance’ is defined as the budget balance net of the effects of the economic cycle and of temporary measures.
5 European Commission, ‘Recommendation for a Council Recommendation on the economic policy of the euro area’, COM(2016) 726 final, 2016.
6 European Council, ‘European Semester 2017: Council Recommendation on the economic policy of the euro area,’ 6703, 2017.

BANCA D’ITALIAAnnual Report201634
PUBLIC INVESTMENT IN THE EURO AREA: FORMS OF FUNDING AND EFFECTS ON THE ECONOMY
In many euro-area countries the ratio of public investment to GDP plunged during the crisis, and in some economies has yet to regain its pre-crisis level. The fall in public investment comes on top of that in private investment due to the lengthy recession. The growth of potential output has been affected.
Studies by leading international organizations suggest the desirability of stimulating the euro-area economy by shifting the composition of public spending towards infrastructural investment.1 Thanks to the extremely accommodative conditions of monetary policy and the potential benefits for output growth in the medium and long term, to a significant extent such interventions could pay for themselves.
However, various circumstances must be considered: (a) some countries lack the necessary fiscal leeway; (b) regulatory and administrative complexity entails considerable lags in the realization of public works; (c) waste and inefficiency can result in a possibly very substantial disparity between the amount spent and the actual value of the works realized; and (d) the net social benefit of individual investment projects is not necessarily positive, a circumstance which should be corroborated by objective cost-benefit analyses.2
A recent quantitative study of the impact of an increase in infrastructure spending (tangible and intangible) on the main macroeconomic variables in the euro area over a five-year horizon confirms both the possible benefit of increased public investment and the importance of making sure investment projects are properly planned and executed.3 The study is based on a model for the euro area in which public investment spending has beneficial effects on GDP not only in the short term, by stimulating aggregate demand, but also in the long term through the accumulation of public capital, which increases aggregate supply capacity by boosting the productivity of both labour and private capital.
Thanks in part to this latter effect, the multiplier for infrastructure spending would be greater than 1 in the long term. Given a strongly expansive monetary policy stance, the multiplier could be higher still, considerably greater than 1 in the first few years; as a consequence the increase in public investment expenditure, especially if realized in a number of euro-area countries simultaneously, would not have adverse effects on the ratio of public debt to GDP. Lastly, the medium- and long-term impact on economic activity would be greater if the projects were financed by deficit spending rather than tax increases.
However, the actual mechanisms by which investment is carried out are crucial. Slowness and sub-optimal allocation of funds, owing to the inefficiency of the
1 For instance, OECD, OECD Economic Outlook, 99, June 2016; European Commission, ‘Completing Europe’s Economic and Monetary Union,’ 2015; IMF, World Economic Outlook, October 2014.
2 ‘L’efficienza della spesa per infrastrutture’, Banca d’Italia, Seminari e convegni (Workshops and Conferences), 10, 2012.
3 L. Burlon, A. Locarno, A. Notarpietro and M. Pisani, ‘Public investment under debt, tax and money financing’, Banca d’Italia, Temi di Discussione (Working Papers), forthcoming.

BANCA D’ITALIA Annual Report352016
administrative apparatus or to relatively non-transparent conduct or corruption, would considerably undermine the long-term effects on economic activity, slowing down the accumulation of public capital.4
4 IMF, ‘Making public investment more efficient’, IMF Policy Papers, June 2015.
Budgetary outturns in 2016. – The reduction in the average general government net borrowing of the euro-area member states that began in 2010 continued last year. The deficit came to 1.5 per cent of GDP, 0.5 percentage points less than in 2015 and 4.7 points less than in 2009. The improvement by comparison with 2015 reflected both an increase in the primary surplus (by 0.3 percentage points of GDP) and a decline in interest expenditure (by 0.2 points), itself due to a 0.2-point decline in the average cost of the debt. A further modest decline in the deficit, to 1.4 per cent of GDP, is forecast for 2017.
The ratio of public debt to GDP in the area as a whole declined for the second straight year, after the significant increase registered following the onset of the economic and financial crisis, to 89.2 per cent in 2016. The decline, equal to 1.1 percentage points, resulted from the primary surplus (0.7 points), the fact that nominal GDP growth was higher than the average cost of the debt (0.2 points), and factors that reduce the debt but not net borrowing (0.3 points). Among the main countries of the area, the debt ratio declined by 2.9 points in Germany and 0.5 points in Spain and rose by 0.4 points in France and 0.6 points in Italy. For the area as a whole the ratio is projected to decline further this year by about 1 percentage point.
The area-wide structural deficit, adjusted for cyclical effects and temporary measures, was unchanged at 1 per cent of GDP in 2016 and should hold stable in 2017 as well.
The excessive deficit procedure. – During 2016 the excessive deficit procedures opened against Cyprus, Ireland and Slovenia were closed. Those against France, Spain, Greece and Portugal, all of which achieved the budgetary objectives set for 2016 under the procedure, remain open. For France and Spain, net borrowing was essentially in line with the requirement (i.e. 3.4 and 4.5 per cent of GDP respectively); Greece, whose objectives were set in terms of the primary balance, ran a surplus far larger than requested (3.9 as against 0.5 per cent of GDP); and in Portugal net borrowing was reduced from 4.4 in 2015 to 2.0 per cent of GDP, lower than had been recommended by the EU Council in July (2.5 per cent). On the basis of these results, in May 2017 the Commission proposed closing the procedure against Portugal.
On 12 July 2016 the Council had determined that Portugal and Spain had not taken effective action to reduce their excessive deficits in 2015. Under the procedure, this would have implied a sanction of up to 0.2 per cent of GDP, but in August, at the proposal of the Commission, the Council decided not to impose sanctions and to trace a new path for the correction of the public finances, setting the deadline for ending the excessive deficit in 2016 for Portugal and 2018 for Spain.

BANCA D’ITALIAAnnual Report201636
In November, on the basis of the draft budgetary plans for 2017, the Commission found risk of a violation of the European fiscal rules – for 2016 and 2017 – in eight member states: Belgium, Cyprus, Finland, Italy, Lithuania, Slovenia (for the preventive arm of the Stability and Growth Pact), Portugal, and Spain (for the corrective arm).
Financial assistance to countries in difficulty. – As part of the third programme of financial assistance to Greece, the second examination of the country’s progress was begun at the end of 2016. In December the Eurogroup gave a positive assessment of the budget for 2017 agreed upon with the Commission for attaining the objective of a primary surplus of 1.75 per cent of GDP. However, Greece and the European authorities did not reach an agreement on the measures to take in order to increase the primary surplus to 3.5 per cent in 2018. In addition, at the Eurogroup meeting in April 2017, Greece agreed to enact a package of reforms in 2019 and 2020 (with a positive impact on the public accounts of 2 percentage points of GDP), which would create additional fiscal leeway in the future to be used to support economic activity, also in the light of the expected improvement in economic conditions. The disbursement of the third tranche of assistance is contingent on a positive assessment of the achievements to date.
At the start of May 2017 the Commission, the European Stability Mechanism (ESM), the ECB and the IMF reached a preliminary agreement with the Greek government on a set of measures to promote economic growth; negotiations towards a strategy to guarantee the sustainability of the public debt are still under way.
In 2016 the ESM disbursed €10.3 billion to Greece, corresponding to the second tranche of the third financial assistance programme initiated in the summer of 2015. The payments were conditional on the favourable outcome of the first examination undertaken as part of the programme,7 which took account on the one hand of the approval of pension, banking and energy market reforms and on the other of the creation of a fund dedicated to privatizations and investment and the institution of a tax revenue agency. Overall, under the three assistance programmes, Greece has received aid worth about €250 billion (around 134 per cent of the country’s real GDP in 2016).
As regards the public accounts outturns, Greece swung from a deficit of 5.9 per cent of GDP in 2015 to a surplus of 0.7 per cent in 2016. This enormous improvement was due in part to the end of the support provided to the financial system in 2015 (worth 2.8 points of GDP). The Commission projects that in 2017 net borrowing will amount to 1.2 per cent of GDP.
The assistance programme for Cyprus was terminated in 2016. The resources made available as part of the assistance programme were not fully utilized; specifically, €2.7 billion out of the total of €9 billion allocated by the ESM was not drawn. The total amount lent was equal to 40 per cent of the country’s real GDP in 2016.
7 European Commission, ‘Compliance note on mid-September milestones for the second disbursement for debt servicing needs of the second tranche under the Greek ESM programme,’ 8 October 2016.

BANCA D’ITALIA Annual Report372016
The volume of new loan disbursements last year to countries in difficulty was limited (€10.4 billion), continuing the trend of the previous two years and reflecting the further reduction in the number of member states still subject to the programmes.8 No new disbursements were made in the first few months of this year. Disbursements since 2010 amount to some €440 billion (Table 3.2).
Table 3.2
Financial assistance to euro-area countries in difficulty (1)(billions of euros)
2010 2011 2012 2013 2014 2015 2016 Total to May 2017
(2)
Total support
programme
Ireland 0.0 34.7 21.1 10.9 0.8 – – 67.6 67.5
Portugal – 34.0 27.5 10.0 5.2 – – 76.6 78.0
Greece 31.5 41.5 109.9 32.0 11.7 10.5 (3) 10.3 247.4 (3) 330.6
Spain – – 39.5 1.9 – – – 41.3 41.3
Cyprus – – – 4.9 1.3 1.0 0.1 7.3 10.0
Total 31.5 110.2 197.9 59.7 18.9 11.5 10.4 440.1 527.4
Sources: For bilateral loans to Ireland, National Treasury Management Agency; for loans from the EFSF, EFSM and ESM, those institutions’ websites; for the first support programme for Greece, European Commission, ‘The second economic adjustment programme for Greece’, European Economy, Occasional Papers, 94, 2012; for the IMF loans not part of that programme, press releases on the occasion of each disbursement.(1) There may be discrepancies due to rounding or to variations in the exchange rate between the currency in which loans are denominated and the euro. – (2) Data updated to 18 May 2017. – (3) Takes into account the restitution to the EFSF in February 2015 of funds appropriated but not used (€10.9 billion).
European governance
Following the financial and sovereign debt crises, a number of measures have been taken to reform European and euro-area economic governance. A plan for advancing Economic and Monetary Union in the political, economic and financial spheres was traced out in the ‘Five Presidents’ Report’ in 2015.9
Recent debate has witnessed a sharpening contrast between those who consider that the chief priority is the adoption of instruments to share and deal, at euro-area level, with the potential risks deriving from future economic shocks and those who believe instead that the main necessity is for individual countries to reduce existing national risks, namely those in connection with high public debt and the linkage between banks and sovereign debt.
8 The programme for Spain was closed in 2013, those for Ireland and Portugal in 2014, and, as noted, that for Cyprus in 2016. The Commission, in accord with the ECB, is responsible for post-programme surveillance until at least 75 per cent of the amount received has been repaid. Furthermore, the ESM monitors any non-compliance risks until full reimbursement of the loans made by the EFSF or the ESM.
9 The report, by the President of the Commission, was drafted in close cooperation with the Presidents of the European Council, the Eurogroup, the ECB and the European Parliament (see European Commission, ‘Completing Europe’s Economic and Monetary Union,’ 2015).

BANCA D’ITALIAAnnual Report201638
The difficulty in reaching consensus has slowed the completion of the project for banking union. The Single Resolution Mechanism for banks began operation in January 2016, with participating countries paying their contributions to the Single Resolution Fund (SRF), whose resources are to be completely mutualized in 2023. However, the system lacks a backstop for the SRF in the event that its resources prove insufficient to handle a banking crisis. And work on the Commission’s proposal for a deposit guarantee scheme, the third pillar of banking union, is stalled as well. The Council has made it clear that talks at the political level will resume only once sufficient progress had been made on risk reduction measures, with express reference among other things to rules that enhance banks’ loss-absorbing capacity and the completion of the reforms envisaged by the Basel agreements.
The Commission has presented legislative proposals to align European rules with international standards by introducing new leverage and liquidity requirements along with the total loss-absorbing capacity requirement (TLAC), designed to create liabilities that can be used in case of resolution to absorb losses and recapitalize global systemically important banks. At the same time, it has been proposed to amend the rules governing the minimum requirement for own funds and eligible liabilities subject to bail-in (MREL), to which all European banks must have recourse in resolution, among other things in order to guarantee consistency with TLAC. On this latter proposal the Bank of Italy has called for balanced, gradual calibration of the requirement and the introduction of an additional requirement for subordination of liabilities that the market can absorb gradually. The Bank has expounded its positions in the relevant European institutions, with a favourable judgment on recent proposals for the introduction of debt instruments with seniority between senior bonds and subordinated debt (see the box ‘Minimum requirement for own funds and eligible liabilities,’ Financial Stability Report, 2, 2016).
Work is proceeding on the action plan for the capital markets union; a number of measures have already been implemented or are at an advanced stage of discussion. The proposal for revision of the prospectus directive has been adopted, and a series of further proposals are in the home stretch: (a) for simple, transparent securitizations; (b) on venture capital business; (c) on the reduction of capital requirements for banks and insurance companies that invest in infrastructure; and (d) on the preventive restructuring of firms in crisis, as part of bankruptcy law.
The considerable number of measures envisaged for the capital markets to date could prove insufficient to transform these, as intended, into a single pan-European financial market according to the planning calendar, given the substantial national differences in company law, bankruptcy law and taxation.
The Commission’s assessments under the euro-area macroeconomic imbalance procedure, made public in February, found excessive imbalances in Cyprus, France, Italy and Portugal. For France, the problems consist essentially in persistently weak competitiveness and the large deficit, while for Italy they involve slow productivity and the high public debt. The Commission found that among the other large area countries, Germany and Spain also have imbalances, albeit not excessive. For Germany the imbalances consist in the large current account surplus and the low level of investment, while for Spain they stem from the high level of debt – public and private alike – and the unemployment rate.

BANCA D’ITALIA Annual Report392016
On 1 March 2017, the Commission published its white paper on the future of the EU.10 The document sets out five alternative scenarios for future integration among EU member states and the functioning of the Union from now through 2025: carrying on with the reforms already scheduled; stepping up reforms solely on some aspects of the single market; reinforcing integration, enabling groups of countries that want to do more to advance faster in certain spheres, on the pattern of reinforced cooperation; focusing on selected sectors within which to deliver greater results, decreasing the EU’s areas of competence; and providing for all member states to proceed with stronger integration in all areas. The publication coincided with the sixtieth anniversary of the signature of the Treaty of Rome.
10 European Commission, ‘White paper on the future of Europe: Reflections and scenarios for the EU27 by 2025’ COM(2017) 2025 final, 2017.

BANCA D’ITALIAAnnual Report201640
4. MONETARY POLICY IN THE EURO AREA
At a time of stable but moderate growth in economic activity, prolonged weakness in inflationary pressures and a high degree of uncertainty about global economic growth, the expansionary measures adopted by the ECB Governing Council considerably reduced the risk of deflation. They are still aimed at ensuring a gradual return of inflation to levels consistent with the definition of price stability.
Given the heightened concerns about world growth and high volatility in financial markets, in March 2016 the Governing Council strengthened monetary stimulus: it lowered official rates, increased the scale and composition of the expanded asset purchase programme (APP), and acted further to support bank lending by introducing a second series of targeted longer-term refinancing operations (TLTRO2) with highly attractive conditions.
In order to preserve the very substantial degree of monetary accommodation necessary to secure a sustained convergence of inflation rates towards levels below, but close to, 2 per cent, at its December meeting the Governing Council extended the duration of the asset purchase programme until at least the end of 2017, or beyond, if necessary.
In recent months the economic recovery in the euro area has gained traction and the downside risks for growth have declined. Inflation has gradually risen, largely owing to the increase in energy prices; core inflation has remained very weak, however, with no sign of a stable upward trend. To consolidate the medium-term recovery of inflation, the Council confirmed the need to keep the stance of monetary policy strongly expansionary and reiterated that it expects official rates to remain at or below current levels for a long time, well beyond the horizon for net asset purchases.
Monetary policy action
At the start of 2016, as domestic demand strengthened, the risks arising from the weakening global economy and deteriorating financial conditions sharpened (see Chapter 1 ‘Macroeconomic developments and policies and the international financial markets’). Despite a moderate recovery in economic activity, euro-area consumer price inflation remained almost nil (see Chapter 3 ‘Macroeconomic developments and fiscal policies in the euro area’). Inflation expectations declined, shifting further away from levels consistent with the definition of price stability even over longer horizons (see the section ‘Interest rates and the exchange rate of the euro’).
In March the ECB Governing Council adopted a comprehensive package of expansionary measures. It reduced the interest rates on the main refinancing operations

BANCA D’ITALIA Annual Report412016
and on the marginal lending facility by 5 basis points (respectively to 0.0 per cent and 0.25 per cent) and that on the deposit facility, which was already negative, by 10 basis points (to -0.40 per cent; see Figure 4.1).
Figure 4.1
Official interest rates in the euro area and the Eurosystem’s consolidated balance sheet
(a) Official and money market interest rates(daily data; per cent)
(b) Eurosystem consolidated balance sheet: assets(weekly data; billions of euros)
'09 '10 '11 '12 '13 '14 '15 '16 '170
500
1,000
1,500
2,000
2,500
3,000
3,500
4,000
4,500
Other assets (3)
Longer-term refinancing operationsExpanded Asset Purchase Programme (2)
Monetary policy operations: terminated programmes (1)
Main refinancing operations
'09 '10 '11 '12 '13 '14 '15 '16 '17-0.5
0.0
0.5
1.0
1.5
2.0
2.5
3.0
3.5
-0.5
0.0
0.5
1.0
1.5
2.0
2.5
3.0
3.5
Main refinancing operations: fixed rate
Overnight deposits with the Eurosystem
Marginal lending facility
Eonia
0
500
1,000
1,500
2,000
2,500
3,000
3,500
4,000
4,500
Sources: ECB and Thomson Reuters Datastream.(1) Covered bond purchase programme (CBPP, CBPP2) and securities markets programme (SMP). – (2) Covered bond purchase programme 3 (CBPP3), asset-backed securities purchase programme (ABSPP), public sector purchase programme (PSPP) and corporate sector purchase programme (CSPP). – (3) Marginal lending facility, gold and other assets denominated in euros and in foreign currency.
It reinforced measures to support bank lending with the introduction of a second series of four targeted longer-term refinancing operations (TLTRO2), each with a maturity of four years, to be carried out quarterly between June 2016 and March 2017; the interest rate, initially set equal to the rate on the main refinancing operations, can be reduced to equal that on the deposit facility prevailing at the time of the allotment, based on the volume of loans granted by banks to households and firms.
The financial asset purchase programme was bolstered by raising the amount of monthly purchases from €60 billion to €80 billion as of April 2016 and by including in the list of eligible assets bonds issued by non-bank corporations established in the euro area (corporate sector purchase programme, CSPP).
There was an increase in volatility in all financial markets during the summer, following the outcome of the UK referendum on EU membership (Brexit). The ECB and the other major central banks promptly reaffirmed their commitment to ensuring macroeconomic and financial stability including by providing liquidity, if needed; these announcements fostered a rapid return to more stable conditions on the markets.
In the final part of the year the expansion in economic activity continued at a moderate pace but gradually gained momentum; the risks to the growth outlook were still mostly on the downside, owing in part to the high degree of uncertainty surrounding economic policies at global level. The risk of deflation has largely died down (see Chapter 3 ‘Macroeconomic developments and fiscal policies in the euro area’); inflation has risen, buoyed by the acceleration in its most volatile components,

BANCA D’ITALIAAnnual Report201642
particularly oil prices. Underlying pressures on consumer prices, however, remained subdued, in part owing to very weak wage growth.
At its 8 December meeting the Governing Council extended the asset purchase programme (APP) to the end of December 2017, or beyond and in any case until it sees a sustained adjustment in the path of inflation consistent with its inflation aim. Starting in April 2017 purchases are continued at a monthly pace of €60 billion.
At the beginning of 2017 inflation continued to rise, although core inflation remained very moderate. Inflation expectations remained historically low across all time horizons.
The Governing Council, while noting a reduction in the downside risk for growth, has indicated that a reassessment of current monetary policy is not justified. To consolidate the medium-term recovery of inflation the Council confirmed the need to keep the stance of monetary policy strongly expansionary and reiterated that it expects official rates to remain at or below current levels for a long time, well beyond the horizon for net asset purchases (see the box ‘The determinants of low interest rates’).
THE DETERMINANTS OF LOW INTEREST RATES
Nominal and real short- and long-term interest rates are extremely low by historical standards in all the main advanced economies (see the figure).
Nominal short- and long-term interest rates in the main advanced economies(per cent)
(a) Long-term interest rates (1) (b) Short-term interest rates (2)
'80 '85 '90 '95 '00 '05 '10 '15
Italy United Kingdom United States
'80 '85 '90 '95 '00 '05 '10 '15-4
0
4
8
12
16
20
24
France Germany Japan
-4
0
4
8
12
16
20
24
Source: Based on European Commission data.(1) Interest rates on 10-year government bonds. Germany: until 1992, yields on government bonds issued with a residual maturity of over 3 years. France: until 1992, interest rates on central government bonds with a residual life of 7-10 years. Italy: until 1984, bonds issued by Crediop on behalf of the Treasury; from 1985 to 1991, interest rates on bonds issued by special credit institutions. United Kingdom: interest rates on central government bonds with a residual life of 20 years. United States: until 1988, interest rates on federal government bonds with a residual life of over 10 years; from 1989 to1992, interest rates on federal government bonds with a residual life of over 30 years. – (2) 3-month interbank interest rates. France: from 1980 to 1981, 1-month repo rates on private sector securities. Japan: 3-month repo rates; since1989, interest rates on 3-month certificates of deposit. Italy: from 1980 to 1984, interest rates on sight interbank deposits.
This does not only depend on expansionary monetary policy. The fall in interest rates began at global level in the second half of the 1980s, at the same time as a prolonged decline in inflation and during a period of low macroeconomic volatility; it became more pronounced after the outbreak of the global financial crisis.

BANCA D’ITALIA Annual Report432016
Many of the theories proposed to explain long-term interest rate trends emphasize the role of structural, economic and demographic changes, which have given rise to a persistent imbalance between investment demand and savings supply and to a phase of secular economic stagnation.1
For the euro area there is evidence that the ageing population and the slowdown in total factor productivity growth and in human capital formation have put persistent downward pressure on interest rates. Empirical models suggest, for example, that the increase in the dependency ratio (the ratio between people not of working age and those of working age) in euro-area countries can explain part of the reduction in potential growth and in the real interest rate, and may contribute to putting significant downward pressure on interest rates over the next few years as well.2
A second group of hypotheses underlines the role of financial factors: the deregulation of financial markets, expansionary monetary policies and investors’ optimistic expectations supposedly encouraged, in the period of relative macroeconomic stability prior to the global financial crisis (the Great Moderation), an excessive increase in credit supply and a squeeze on risk premiums and interest rates.3 Subsequently, the onset of the financial crisis put further downward pressure on yields. Analyses based on general equilibrium models or on no-arbitrage term structure models indicate that, in the euro area and the United States, the abrupt correction in the financial cycle, followed by the sharp contraction in aggregate demand and the shift in investors’ preferences to less risky assets, have contributed to the fall in interest rates observed over the last decade.4
One explanation does not rule out the other and they may partially complement each other.5 Simulations from an overlapping generations model, in which economic agents’ consumption, saving and borrowing choices depend partially on the generation to which they belong and affect the next generation’s choices, display a link between structural variables (sizes of different age groups) and financial variables. A demographic boom may over time lead to an increase in demand for real estate, a rise in property prices and thus an expansion in credit supply and private debt. Even a temporary increase in the dependency ratio is therefore reflected in protracted price rises for real and financial assets and in a consequent fall in interest rates.6
1 L.H. Summers, ‘Reflections on the new secular stagnation hypothesis’, in Secular stagnation: facts, causes and cures edited by C. Teulings and R. Baldwin, (London: CEPR Press, 2014), 27-38. See the box ‘The secular stagnation hypothesis’ in Chapter 1, Annual Report for 2014, 2015.
2 G. Ferrero, M. Gross and S. Neri, ‘Secular stagnation, demographic developments and interest rates: an empirical investigation’, Banca d’Italia, Temi di Discussione (Working Papers), forthcoming; F. Busetti and M. Caivano, ‘Low frequency drivers of the real interest rate: a band-spectrum regression approach’, Banca d’Italia, Temi di Discussione (Working Papers), forthcoming.
3 On the role of financial factors, see C. Borio, ‘The financial cycle and macroeconomics: what have we learnt?’, Journal of Banking & Finance, 45, 2014, 182-198.
4 A. Gerali and S. Neri, ‘Natural rates across the Atlantic’, Banca d’Italia, Temi di Discussione (Working Papers), forthcoming; M. Pericoli and M. Taboga, ‘A nearly exact Bayesian estimation of non-linear, no-arbitrage term structure models’, Banca d’Italia, Temi di Discussione (Working Papers), forthcoming.
5 G. Ferrero and S. Neri, ‘Monetary policy in a low interest rate environment’, Banca d’Italia, Questioni di Economia e Finanza (Occasional Papers), forthcoming.
6 A. Ferrari, ‘From financial cycle to secular stagnation: the role of demographic structure’, Banca d’Italia, Temi di Discussione (Working Papers), forthcoming.

BANCA D’ITALIAAnnual Report201644
Monetary policy operations
In 2016 and in the first part of 2017 the Eurosystem continued to supply liquidity to the banking system through fixed-rate tenders with full allotment both for main refinancing operations and for longer-term operations. The liquidity provided through three-month refinancing operations fell by €120 billion (to €20 billion at the end of April 2017), while that injected through targeted longer-term refinancing operations rose by €344 billion (to €762 billion).
Under the APP, the Euro- system purchased financial assets amounting to €1,834 billion at the end of April 2017, of which €24 billion worth of asset-backed securities, €216 billion of covered bank bonds, €82 billion of non-bank corporate bonds and €1,512 billion of public sector securities (including €255 billion of Italian government bonds, of which about €227 billion purchased by the Bank of Italy; see Figure 4.1 and Table 4.1). At the same date, the average residual maturity of the public sector purchase programme portfolio was eight years and that of the segment consisting of Italian government securities was around eight years and eight months. The purchasing procedures were such as not to compromise the normal functioning of the markets (see Chapter 14 ‘The money and financial markets’).
The liquidity held by the banking system with the Eurosystem in excess of the reserve requirement increased to around €1,600 billion at the start of May 2017, mainly owing to purchases of public sector securities under the APP and to the liquidity provided through TLTRO2. The size of the Eurosystem’s balance sheet grew by 50 per cent, close to its all-time high (around €4,150 billion at the end of April 2017, equal to about 40 per cent of the euro-area GDP).
Interest rates and the exchange rate of the euro
Monetary easing resulted in a further reduction in short-term interest rates. Since March 2016, following the Governing Council’s decision to lower the interest rate on the deposit facility, the overnight rate (Eonia) has fallen to -0.35 per cent (Figure 4.1) and the three-month interbank deposit rate (Euribor) has fallen progressively to -0.33 per cent on average in April 2017.
Nominal long-term interest rates remained at historically low levels in 2016 (see the box ‘The monetary policy implications of low interest rates’). The yield on ten-year government securities, which progressively fell until the summer, began to rise in the second half of the year; at the end of April 2017 the average yield for the main euro-area countries was 1.0 per cent (0.3 per cent in Germany, 0.8 per cent in France and 2.3 per
Table 4.1
Securities held for monetary policy purposes under the APP
(millions of euros; April 2017)
PROGRAMME Eurosystem Bank of Italy
CBPP3 (1) 216,374 34,836ABSPP (2) 23,731 0PSPP (3) 1,511,963 226,987CSPP (4) 82,262 9,499
Sources: ECB and Bank of Italy.(1) Covered Bond Purchase Programme 3. – (2) Asset-Backed Securities Purchase Programme. – (3) Public Sector Purchase Programme. – (4) Corporate Sector Purchase Programme.

BANCA D’ITALIA Annual Report452016
cent in Italy; Figure 4.2). Long-term real interest rates gradually declined in the first half of 2016, stabilizing close to -0.7 per cent.
Figure 4.2
Long-term interest rates and inflation expectations in the euro area(daily data; per cent)
(a) Long-term interest rates and inflation expectations
(b) Inflation expectations implied by inflation swap contracts (5)
2013 2014 2015 2016 '17-0.5
0.0
0.5
1.0
1.5
2.0
2.5
-0.5
0.0
0.5
1.0
1.5
2.0
2.5
2 years ahead
5 years ahead
5-10 years ahead
2013 2014 2015 2016 '17-2
-1
0
1
2
3
4
-2
-1
0
1
2
3
4
10-year government bonds of euro-area countries, average (1)
10-year interest rate swaps (2)
10-year inflation swaps (3)
10-year real interest rate (4)
Sources: Based on Bloomberg and Thomson Reuters Datastream data.(1) Average yields on the benchmark 10-year government bonds of Austria, Belgium, Finland, France, Ireland, Italy, the Netherlands, Portugal, Spain and Germany, weighted by GDP at constant 2016 prices. – (2) Fixed rate on 10-year interest rate swaps in euros. – (3) Fixed rate on 10-year euro-area inflation swaps. – (4) Fixed rate on 10-year interest rate swaps deflated by the fixed rate on 10-year inflation swaps. – (5) Fixed rate implied by inflation swap contracts, 2 years ahead, 5 years ahead and 5-year forward inflation swaps 5 years ahead.
Inflation expectations, which had moved upwards in the second half of 2016, fell slightly across all time horizons in the early months of 2017. In April 2017 on average, two- and five-year expectations implied by inflation swaps were 1.0 and 1.1 per cent respectively; five-year expectations five years ahead rose to around 1.6 per cent, after falling to a historic low of 1.3 per cent last summer (Figure 4.2).
Figure 4.3
Exchange rates of the euro(daily data)
(a) Dollar/euro exchange rate and nominal effective exchange rate of the euro
(b) Spread between euro and dollar interest rates and dollar/euro exchange rate
2013 2014 2015 2016 '171.0
1.1
1.2
1.3
1.4
1.5
-2.0
-1.5
-1.0
-0.5
0.0
0.5
Spread between euro and dollar interest rates (3)
Dollar/euro (2)
2013 2014 2015 2016 '17100
104
108
112
116
120
Dollar/euro
Nominal effective (1) (2)
1.0
1.1
1.2
1.3
1.4
1.5
Sources: ECB and Thomson Reuters Datastream.(1) Index, 1999 Q1=100. A rise in the index corresponds to an appreciation. – (2) Right-hand scale. – (3) Spread between fixed rate on 2-year interest rate swaps in euros and dollars; per cent.

BANCA D’ITALIAAnnual Report201646
At the end of 2016 the exchange rate of the euro against the dollar hit its lowest level in the last 14 years. Between January 2016 and April 2017 the euro depreciated by 1.9 per cent; in nominal effective terms, the single currency appreciated by 0.8 per cent, mainly owing to the strengthening against the pound sterling. In the last quarter of 2016, the depreciation against the dollar stemmed in part from the divergence in monetary policy expectations in the United States and in the euro area, reflected in the widening of the spread between dollar and euro interest rates (Figure 4.3).
THE MONETARY POLICY IMPLICATIONS OF LOW INTEREST RATES
The debate on the underlying causes of low interest rates in the main advanced economies (see the box ‘The determinants of low interest rates’) has implications for the measurement of the ‘natural’ rate of interest – defined as the real interest rate at which GDP is in line with its potential level and inflation is consistent with the central bank’s objective – and thus for the conduct of monetary policy.1
According to the interpretation based on structural factors (such as demographic or technological ones), there has been a persistent decrease in the natural rate of interest.2 This would explain why, in the decade prior to the global financial crisis, inflation remained in line with the definition of price stability, although the official and market interest rates were at historically low levels. During the financial crisis, the low natural rate of interest restricted monetary policy’s room for manoeuvre: once official rates were reduced to close to zero or made slightly negative, non-standard measures were then required to support the economy, starting with financial asset purchase programmes and an increase in liquidity.
According to this approach, which empirical evidence appears to support, in order to counter the effects of the structural changes occurring in Europe’s economies, including those caused by ageing populations and the slowdown in technological progress, reforms are needed to increase potential growth and consequently the natural rate.3 Since it takes time for the effects of these reforms to materialize, official rates would need to be kept low. Changes to how monetary policy operates could be included in the new ‘normal’ setup, such as a more systematic use of asset purchases or an increase in the size of the central bank’s balance sheet.
By contrast, the interpretations that link the low level of interest rates to cyclical and financial factors could imply that the fall in the natural rate of interest is temporary, though persistent, and linked to the speed at which financial imbalances are reabsorbed. In this case, a very high and prolonged degree of monetary accommodation would remain necessary to support the deleveraging process, which makes the transmission mechanism less effective.4 From this angle, deleveraging is essential to assist the gradual reversion
1 G. Ferrero and S. Neri, ‘Monetary policy in a low interest rate environment’, Banca d’Italia, Questioni di Economia e Finanza (Occasional Papers), forthcoming.
2 K. Holston, T. Laubach and J.C. Williams, ‘Measuring the natural rate of interest: international trends and determinants’, Federal Reserve Bank of San Francisco, Working Paper Series, 11, 2016.
3 P. Cova, A. Notarpietro, P. Pagano and M. Pisani, ‘Secular stagnation, R&D, public investment and monetary policy: a global-model perspective’, Banca d’Italia, Temi di Discussione (Working Papers), forthcoming.
4 F.M. Signoretti and M. Pietrunti, ‘Monetary policy in times of debt’, Banca d’Italia, Temi di Discussione (Working Papers), forthcoming.

BANCA D’ITALIA Annual Report472016
of nominal and real interest rates to normal values. At the same time, strengthening financial regulation would make new systemic crises less likely and reduce their effects on the real economy.
Money and credit
In 2016 and in the first quarter of this year, the growth rate of M3 remained practically stable (5.3 per cent over the twelve months to March 2017; Figure 4.4). The twelve-month rate of expansion of the more liquid M1, while slowing, remained high (9.1 per cent in March, compared with 10.5 per cent at the end of 2015), continuing to benefit from low interest rates on alternative assets and a very flat yield curve.
Figure 4.4
Monetary and credit aggregates in the euro area(monthly data; 12-month percentage changes) (1)
(a) Monetary aggregates growth rate (b) Credit aggregates growth rate
2010 2011 2012 2013 2014 2015 2016 '17-4
-3
-2
-1
0
1
2
3
Private sector (2) (3)
Households (4)
Non-financial corporations (4)
2010 2011 2012 2013 2014 2015 2016 '17-2
0
2
4
6
8
10
12
M1 M2 M3 (2)
-2
0
2
4
6
8
10
12
-4
-3
-2
-1
0
1
2
3
Source: ECB.(1) Changes calculated on end-of-month data adjusted for calendar effects. – (2) From June 2010 onwards the data do not include repos with central counterparties. – (3) Loans in euros and other currencies granted by monetary financial institutions, adjusted for the accounting effects of securitizations. The private sector consists of households, non-profit institutions serving households, non-financial corporations, insurance companies and pension funds, non-money-market investment funds and other financial institutions. – (4) Loans in euros and other currencies granted by monetary financial institutions, adjusted for the accounting effects of securitizations.
Bank lending to the private sector continued to recover (2.7 per cent on a twelve-month basis in March 2017, from 0.7 per cent at the end of 2015), benefiting from expansionary monetary policy measures and strengthening economic growth. Lending to households accelerated to a rate of growth of 2.4 per cent from 1.4 per cent, as did loans to non-financial corporations, but even more markedly (2.3 per cent from 0.5 per cent).
Since the end of 2015 the average cost of new loans to firms and to households fell further to reach an all-time low of 1.8 per cent in December 2016, remaining at similar levels in the early months of this year. In 2016 and in the first quarter of 2017, lending conditions improved in all the main euro-area countries; the heterogeneity in borrowing costs across countries for non-financial corporations continued to diminish (Figure 4.5).

BANCA D’ITALIAAnnual Report201648
Figure 4.5
Loans to non-financial corporations in euro-area countries(monthly data)
(a) 12-month percentage change (1) (b) Interest rates (2)
France Germany Italy Netherlands SpainDispersion (3)
2013 20142010 2011 2012 2015 2016 '170.0
0.2
0.4
0.6
0.8
1
2
3
4
5
2010 2011 2012 2013 2014 2016 '1720150
1
2
3
4
5
6
-12
-9
-6
-3
0
3
6
Source: ECB.(1) Loans in euros and other currencies granted by monetary financial institutions, adjusted for the accounting effects of securitizations. – (2) Weighted average of interest rates on new short- and medium/long-term loans, with weights equal to the 24-month moving average of new disbursements; includes current account overdrafts. – (3) Unweighted standard deviation of growth and interest rates; right-hand scale.
According to the banks that took part in the ECB’s quarterly bank lending survey, in 2016 non-standard monetary measures contributed to less tight credit supply conditions, supporting lending to the economy. Overall, banks’ policies on loans to firms and households stabilized; demand grew mainly as a result of low interest rates.

THE ITALIAN ECONOMY


BANCA D’ITALIA Annual Report512016
THE DETERMINANTS OF ECONOMIC ACTIVITY IN 2016 ACCORDING TO THE BANK OF ITALY’S MODEL
In 2016 GDP growth was supported mainly by domestic demand, which benefited from particularly accommodative monetary policy conditions, the moderately expansionary stance of fiscal policy and low oil prices.
5. OVERVIEW
The Italian economy continued to grow in 2016, at a slightly higher rate than in 2015 (0.9 per cent; Table 5.1), mainly thanks to strong monetary policy stimulus, mildly expansionary fiscal policy, and persistently low oil prices (see the box ‘The determinants of economic activity in 2016 according to the Bank of Italy’s model’).
Table 5.1
Sources and uses of income in Italy
Per cent of GDP in 2016
(volumes at pre-vious -year
prices)
2015 2016
Percentage changes
Contribu tion to GDP
growth (volumes at chain-
linked prices)
Percentage changes
Contribu tion to GDP
growth (volumes at chain-
linked prices)
Volumes at chain-
linked prices
Deflators Volumes at chain-
linked prices
Deflators
Sources
GDP – 0.8 0.7 – 0.9 0.8 –Imports of goods FOB and services (1) 27.7 6.8 -2.7 -1.8 2.9 -3.4 -0.8
of which: goods 22.0 8.5 -4.5 -1.8 2.9 -4.2 -0.6
UsesNational demand 97.2 1.4 0.0 1.3 1.0 0.1 0.9
Consumption of resident households (2) 61.1 1.6 0.0 1.0 1.4 0.0 0.8Consumption of general government 18.9 -0.7 0.2 -0.1 0.6 0.7 0.1Gross fixed investment 17.1 1.6 0.2 0.3 2.9 -0.1 0.5
plant, machinery, armaments and cultivated biological resources 6.3 4.9 0.3 0.3 7.4 -0.6 0.4products of intellectual property 2.7 0.7 1.2 0.0 -1.3 0.8 0.0construction 8.1 -0.4 -0.1 0.0 1.1 0.0 0.1
Change in stocks (3) – – – 0.2 – – -0.5Exports of goods FOB and services (4) 30.5 4.4 -0.4 1.3 2.4 -0.9 0.7
of which: goods 25.0 4.6 -0.5 1.1 2.3 -1.1 0.6Net exports – – – -0.5 – – -0.1
Source: Istat, national accounts.(1) Includes residents’ expenditure abroad. – (2) Includes non-profit institutions serving households. – (3) Includes valuables. – (4) Includes non-residents’ expenditure in Italy.

BANCA D’ITALIAAnnual Report201652
Growth for the year was not affected by result of the Brexit referendum of 23 June. Nevertheless it fell short of the projections made at the beginning of 2016, chiefly owing to the weaker performance of the world economy in the first half of the year. Inflation was also lower than projected. Signs that the world economy was strengthening and prices were recovering emerged in the final part of the year.
The table shows the contribution of several factors (foreign demand, international prices of manufactures and energy commodities, and exchange rates) to the deviation of the growth in GDP, exports and consumer prices from the projections formulated at the beginning of 2016 with the quarterly model of the Italian economy (see Economic Bulletin, 1, 2016).1
Compared with the January estimates, the increases in output and exports in 2016 were curbed, especially in the first half of the year, by the slowdown in world trade, negatively affected by the problems of the emerging countries, and by the impact of the decline in international prices on the competitiveness of Italian products. The lower-than-projected inflation rate observed during the year also can be largely ascribed to the more moderate international price dynamics.
Economic policies continued to support output growth. Monetary policy measures introduced in 2016 (see Chapter 4, ‘Monetary policy in the euro area’) resulted in a larger-than-projected fall in the cost of credit, helping to maintain relaxed conditions in financial markets; the additional support to economic activity (estimated at 0.2 percentage points) will come through mainly in 2017, however.
Contributions to growth and to inflation:observed performance with respect to the projections made in January 2016 (1)
(differences in annual growth rates; per cent)
GDP Exports Inflation
Outturn for 2016 1.0 2.6 -0.1January 2016 projections 1.5 3.9 0.3Difference (2) -0.5 -1.3 -0.3
of which: foreign demand -0.2 -0.7 0.0international prices of manufactures -0.2 -0.5 -0.1prices of energy commodities 0.0 -0.1 -0.1exchange rates -0.1 -0.2 0.0other 0.0 0.2 -0.1
(1) Contributions to the revisions of GDP, exports and inflation deriving from the changes in the observed performance of each of the factors shown with respect to that hypothesized in the projections presented in Economic Bulletin, 1, 2016. – (2) Rounding may cause discrepancies in totals.
Practically all of the effects of the monetary and fiscal policy measures had already been incorporated in the projections made in January 2016 and are therefore omitted in the table. With regard to the set of monetary policy measures taken from 2014 onwards
1 A description of the general characteristics and main equations of the quarterly model of the Italian economy is contained in G. Bulligan, F. Busetti, M. Caivano, D. Fantino, A. Locarno and M.L. Rodano, ‘The Bank of Italy econometric model: an update of the main equations and model elasticities’, Banca d’Italia, Temi di Discussione (Working Papers), forthcoming.

BANCA D’ITALIA Annual Report532016
Output remained well below the potential level, even though the gap narrowed with respect to the peak recorded in 2013 (see the box ‘Italy’s output gap’). In the first quarter of this year GDP continued to grow, by 0.2 per cent, but it is still 7 percentage points below the pre-crisis level, while in Germany and France output exceeds it by 8 and 5 percentage points, respectively.
and included in the January 2016 projections (the Eurosystem’s asset purchase programme, the negative interest rate on overnight deposits with the central bank, the first series of longer-term targeted refinancing operations), our estimates indicate a cumulative impact of about 2 percentage points on the level of GDP in the two years 2016-17.2
For budgetary policy, the simulations include the fiscal incentives for expenditure on capital goods (super depreciation) and the other measures, approved earlier, to support household and business spending (including the tax credit for medium-low incomes from salaried employment, the social contribution relief on new hires, the exclusion of labour costs from the IRAP3 tax base, the abolition – except for luxury homes – of the levy on first homes, and the reduction of the corporate tax rate); the effects on GDP growth (net of the associated financing measures) are estimated to total about 0.4 percentage points over the two years 2016-17.
2 Estimate based on an update of those contained in Economic Bulletin, 3, 2014, and Economic Bulletin, 1, 2016; further details on the ex-ante evaluation of the effects of the Eurosystem’s asset purchase programme are presented in P. Cova and G. Ferrero, ‘The Eurosystem’s asset purchase programmes for momentary policy purposes’, Banca d’Italia, Questioni di Economia e Finanza (Occasional Papers), 270, 2015.
3 Regional tax on productive activities.
ITALY’S OUTPUT GAP
Despite the recovery now under way, the share of unutilized resources in the Italian economy measured by the output gap – the difference between the actual and the potential level of output – remains substantial. Potential output is, however, an unobservable variable whose estimation entails a good deal of uncertainty, particularly when there are very large cyclical fluctuations. The economic literature proposes multiple methods, with different properties, for estimating potential output and the output gap; on the basis of these indications, it is realistically possible to obtain estimation intervals rather than point values.
For analytical purposes the Bank of Italy uses an approach based on a combination of four methods: an aggregate production function, a latent variable model, an autoregressive model with time-varying parameters, and a structural vector autoregressive model.1 The evaluations made on the basis of these methods,
1 The methodology used by the Bank of Italy to estimate the output gap is described in Bassanetti, M. Caivano and A. Locarno, ‘Modelling Italian potential output and the output gap’, Banca d’Italia, Temi di Discussione (Working Papers), 771, 2010. In addition, a recent study looks at the behaviour of the output gap in relation to the fluctuations of the financial cycle, measured on the basis of lending to the private sector (see G. Bulligan, L. Burlon, D. Delle Monache and A. Silvestrini, ‘Real and financial cycles: estimates with unobserved component models for the Italian economy’, Banca d’Italia, Questioni di Economia e Finanza (Occasional Papers), forthcoming.

BANCA D’ITALIAAnnual Report201654
associated with confidence intervals that capture the uncertainty surrounding the estimates, indicate that Italy’s output gap was between -5 and -2 per cent on average in 2016 (with a central value of about -3.5 per cent) and will be between -4.5 and -1.5 per cent (with a central value of -3 per cent) this year (see the figure). The very subdued dynamic of labour costs and core inflation observed in the last three years is largely ascribable to the persistence of these ample margins of unutilized production capacity.
Output gap (1)(per cent)
-7.5
-5.0
-2.5
0.0
2.5
5.0
'17'85 '86 '87 '88 '89 '90 '91 '92 '93 '94 '95 '96 '97 '98 '99 '00 '01 '02 '03 '04 '05 '06 '07 '08 '09 '10 '11 '12 '13 '14 '15 '16-7.5
-5.0
-2.5
0.0
2.5
5.0
Sources: Based on Istat data through 2016 and our projections for 2017.(1) The output gap is measured as a per cent of potential output. The area in blue represents the 90 per cent confidence interval, the grey areas indicate the recessions dated by Istat, and the broken line shows the estimate based on our projections of GDP.
Our central estimates are basically in line with those of the OECD. By contrast, according to the IMF and the European Commission the output gap was less negative in 2016 (they put it at -2.4 and -1.7 per cent, respectively). In particular, the value estimated by the Commission is outside the confidence interval of our estimates.2
2 To estimate the output gap, the European Commission uses a methodology based on the production function, which also takes account of the qualitative indicators of production capacity obtained from business surveys. See K. Havik, K. Mc Morrow, F. Orlandi, C. Planas, R. Raciborski, W. Röger, A. Rossi, Thum-Thysen and V. Vandermeulen, ‘The production function methodology for calculating potential growth rates & output gaps’, European Commission, European Economy. Economic Papers, 535, 2014).
The contribution to GDP growth of national demand, net of the change in inventories, was greater than in 2015. Household spending, though slowing in all the main components except for purchases of non-durable goods, supported economic activity for the third consecutive year. Real disposable income increased at twice the rate of the previous year, thanks in part to self-employment income, whose contribution became positive for the first time since 2012. Consumption of general government rose after five years of decline.
Investment has been growing and gradually gaining pace since the end of 2014, propelled primarily by purchases of capital goods that benefited both from favourable financing conditions and from the incentives introduced by the Government in the last two budget laws (super and hyper depreciation), which the firms interviewed in our surveys considered to be effective. Last year, for the first time since 2007, the recovery also extended to construction investment, especially in the residential sector.

BANCA D’ITALIA Annual Report552016
Both exports and imports slowed. Consistent with the average pattern of the six previous years, the growth of exports (2.4 per cent) was almost in line with that of demand in Italian goods’ main outlet markets (2.6 per cent); exports were adversely affected by a loss of competitiveness stemming from the appreciation of the euro, sharper than that recorded by Italy’s non-euro-area trading partners. Imports slowed more markedly than exports, to growth of 2.9 per cent. As a result, the negative contribution of foreign trade to GDP growth was basically reduced to nil.
The formation of saving revived in the economy as a whole, after faltering in 2015: gross national saving rose to 19.7 per cent of gross national disposable income, barely below the average of the first decade of the century (Table 5.2). The propensity to save increased in the private sector, slightly for households and more markedly for firms, whose dividend distributions returned to decline; the trend was of the opposite sign for general government. By contrast, gross investment expenditure turned downwards, falling to 17.2 per cent of national income owing entirely to the braking effect exerted by inventories. These developments were reflected in the fourth successive annual surplus on the external current account, which rose to 2.6 per cent of national income.
Table 5.2
Saving and gross investment in Italy(per cent of gross national disposable income)
Average1981-1990
Average1991-2000
Average2001-2010
2012 2013 2014 2015 2016
General government saving -6.6 -3.3 0.7 0.7 0.1 0.3 1.1 0.6Private sector saving 28.8 24.6 19.4 17.1 18.0 18.8 17.9 19.2
of which: consumer households (1) 20.0 14.0 8.0 4.7 5.9 6.0 5.5 5.7Gross national saving 22.3 21.3 20.1 17.7 18.2 19.1 19.0 19.7Gross investment 23.2 20.5 21.3 18.1 17.2 17.2 17.6 17.2
Memorandum item:Balance on current transactions
with with the rest of the world -0.9 0.9 -1.3 -0.4 1.0 1.9 1.5 2.6
Source: Based on Istat data.(1) Includes non-profit institutions serving households.
On the supply side, the recovery in productive activity spread to more sectors than in 2015, although there are still significant differences across sectors and firms. Value added grew in manufacturing, driven by production of transport equipment and machinery and equipment; it also increased in services, notably in retail and wholesale trade, while it basically stagnated in construction after contracting sharply in the preceding years.
Labour productivity has declined, reflecting the temporary effect of a recovery in labour demand (favoured in part by social security contribution relief ), outstripping that in value added in both industry excluding construction and in services. Over a longer term, the growth in productivity is modest, even by international standards. Productivity performance differs markedly across sectors and firms; productivity has been improving in manufacturing since the early 2000s, while it has stagnated in private non-financial services (see Chapter 15, ‘Productivity in Italy: performance and determinants’).
Employment continued to expand, with payroll employment returning to pre-recession levels. However, the intensity of labour input remains low: the number of hours worked per employee, though up slightly in the last two years, is still around 5

BANCA D’ITALIAAnnual Report201656
per cent lower than in 2007. The unemployment rate fell to 11.7 per cent; the growth in employment was partly offset by the increase in the labour market participation rate (0.9 percentage points), also driven by the gradual improvement in employment prospects. Although still historically high, the unemployment rate among young people up to age 24 continued to shrink in the first few months of 2017.
The growth in economic activity in 2016 involved all parts of Italy. According to preliminary data from Svimez and Prometeia, GDP expanded again in the South, where employment rose by 1.7 per cent (compared with 1.2 per cent in the rest of the country). Nevertheless, there are still broad regional gaps (see the box ‘Southern Italy’s economy after the recession’).
SOUTHERN ITALY’S ECONOMY AFTER THE RECESSION
In 2015, the latest year for which geographically disaggregated Istat data are available, real GDP was about 12 percentage points lower than in 2007 in the South of Italy and about 7 points lower in the Centre and North. The southern regions did not benefit from the mild recovery of 2009-10 and were hit harder in 2011-12 by the slump in domestic demand, but starting in 2015 they reached a rate of economic growth similar to that of the Centre and North.
Demographic developments attenuated the divergence in per capita terms because the population of the Centre and North grew much more than that of the South as a result of migration within Italy and from abroad (see ‘Economic Developments in the Italian Regions. Short-term Dynamics and Structural Features’, Banca d’Italia, Regional Economies, 43, 2016). Between 2007 and 2015 real GDP per capita fell by about 13 per cent in the South compared with 11 per cent in the Centre and North (see panel (a) of Figure A). In 2015 per capita output in the South was equal to about 66 per cent of the national figure.
The growth in the dispersion across regions starting with the global financial crisis is a development common to Europe. Considering the founding members of the European Union in 1993, a more homogeneous set of countries, the coefficient of variation of regional GDP per capita at current prices grew larger (see panel (b) of Figure A). This reflected the increase in the differences between countries, but also that in regional differences within countries, which grew in the United Kingdom and Spain as well as in Italy, while in Germany they declined, continuing the path of convergence begun with the 1990 reunification.
Southern Italy’s gap in terms of per capita output is ascribable in virtually equal measure to differences in the employment rate and in productivity. In the future, output per worker, now more than 20 per cent lower in the South than in the rest of the country, could be affected by the accentuation of the disparity of human capital endowment between the two areas, stemming from the heightened selectivity of migratory flows within Italy: the share of more highly educated workers among persons moving from the South to the Centre and North has increased (see panel (a) of Figure B), as has the propensity of young southerners to attend universities located elsewhere in Italy (see panel (b) of Figure B).

BANCA D’ITALIA Annual Report572016
Figure A
GDP per capita(indices: 2007=100)
(a) GDP per capita at chain-linked values (b) Coefficient of variation of regional GDP at current prices (1)
88
92
96
100
104
108
112
116
120
88
92
96
100
104
108
112
116
120
2007 2008 2009 2010 2011 2012 2013 2014 2015
Germany Spain France
Italy United Kingdom EU12 (2)
86
88
90
92
94
96
98
100
102
86
88
90
92
94
96
98
100
102
2007 2008 2009 2010 2011 2012 2013 2014 2015
Centre and North South
Sources: For panel (a), based on data from Istat, territorial accounts (December 2016 update); for panel (b), based on Eurostat data (March 2017 update).(1) Ratio of the standard deviation to average GDP per capita adjusted for purchasing power parity; the European regions are those classified at the NUTS 2 level. – (2) Twelve-country European Union (excluding Ireland for lack of its 2015 regional data).
The recession drove up the percentage of the population living in absolute poverty in the South, which rose from under 4 per cent in 2007 to about 10 per cent in 2015 (in the rest of Italy the absolute poverty rate rose from under 3 to about 6 per cent).1
Figure B
Transfers from the South for reasons of work or study(per cent)
(a) Share of university graduates among migrants by area of origin (1)
(b) Share of students enrolled at a university outside their area of residence (2)
0
5
10
15
20
25
0
5
10
15
20
25
Centre and North South
2007/08 2015/16
0
10
20
30
40
0
10
20
30
40
Centre and North South
2007 2015
Sources: For panel (a), based on Istat, Iscrizioni e cancellazioni all’anagrafe per trasferimento di residenza; for panel (b), Ministry for Universities and Research, national registry of students (administrative archive).(1) Percentage of university graduates among total transfers of residence of Italians to other areas of the country. – (2) University students enrolled in a university outside their area of residence as a percentage of total enrolled university students.
1 Absolute poverty refers to the situation of persons living in households whose expenditure is less than that needed to buy a certain basket of goods and services. The basket’s composition varies depending on household size and type; its monetary value follows the changes in prices over time and differs by geographical area and size of the municipality of residence.

BANCA D’ITALIAAnnual Report201658
In 2016 average annual consumer price inflation turned negative (-0.1 per cent) for the first time since the time series’ inception in 1987, while core inflation, i.e. excluding food and energy products, fell to 0.5 per cent. Inflation has been on the rise since last autumn, in April reaching the highest levels since the start of 2013; it has been sustained chiefly by the trend of the most volatile components, such as unprocessed food and energy products. Core inflation, though increasing since January of this year, is still low by historical standards, reflecting still ample margins of both labour supply and spare capacity and wage moderation.
Contributing to the persistently low rate of increase in prices was the modest increase in labour costs related to the slow pace of growth in contractual wages and the reduction in social security contributions. The latest contract renewals, which incorporate small adjustments for expected inflation and provide for indexation mechanisms tied to ex-post inflation, point to even smaller wage increases for 2017. The linking of earnings to past inflation rather than to forecast or planned inflation results in a greater inertia in inflation itself: in the current cyclical phase, this could
Evolution of the indicators of socioeconomic disparities between 2007 and 2015 (1)(percentage shares)
THEMES (2)
Per cent of indicators recording an improvement
Convergence of socioeconomic
conditions (3)Centre and Nord South
1 - Human resources 66.7 56.7 33.3
2 - Research and innovation 83.3 83.3 50.0
3 - Energy and environment 71.4 64.3 57.1
4 - Social inclusion and territorial attractiveness 50.0 50.0 71.4
5 - Natural and cultural resources 76.9 30.8 30.8
6 - Networks and links for mobility 72.7 45.5 27.3
7 - Competitiveness of productive systems and employment 41.4 27.6 13.8
8 - Cities and urban systems 75.0 33.3 16.7
9 - International openness 75.0 100.0 50.0
Source: Based on Istat, Indicatori territoriali per le politiche di sviluppo.(1) For some indicators, the first and last year available may be different. – (2) Classification based on the priorities set in Quadro strategico nazionale per la politica regionale di sviluppo 2007-2013, Ministero dello Sviluppo Economico (June 2007). – (3) Percentage of cases in which the indicator for the South shows a greater improvement or less pronounced worsening than the corresponding indicator for the Centre and North.
Additional information on the trend of socioeconomic disparities can be found in Istat’s database of territorial indicators for development policies, which embraces a large number of indicators divided into nine themes not limited merely to the economic welfare of the population. For most of the themes, the percentage of cases in which an indicator recorded an improvement in the period 2007-15 was higher in the Centre and North than in the South (see the table). The sectors in which the indicators for the South show a greater improvement or less pronounced worsening than the corresponding indicators for the Centre and North (third column of the table) fall under the heading of energy and environment or that of social inclusion and territorial attractiveness. The widening of the disparities primarily concerned, in addition to the strictly economic sphere, the use and enhancement of natural and cultural resources, networks and links for mobility, and urban development.

BANCA D’ITALIA Annual Report592016
make the return to values consistent with price stability more difficult (see the box ‘Current trends in industrial relations’ in Chapter 8).
For the third consecutive year, fiscal policy maintained a moderately expansionary stance (measured with the change in the cyclically adjusted primary balance). Reflecting the improvement in cyclical conditions, however, net borrowing fell to 2.4 per cent of GDP from 2.7 per cent in 2015, both by reducing interest payments and by increasing the primary surplus. The ratio of public debt to GDP rose by about half a percentage point to 132.6 per cent; net of the increase in the Treasury’s available liquidity, it was practically unchanged.
The reform effort to improve the quality of the public sector’s action continued. The overhaul of the legislation on public contracts was completed. So, too, was the process of implementing the reform of general government, although its effectiveness is undermined by the failure to adopt measures regarding public managers. There are still obstacles to competition in some regulated markets and to the efficient functioning of civil justice, fields in which the reform process has made little headway.
Credit to the private sector continued to expand in 2016 and the early months of this year. The growth in lending to firms remains uneven across sectors of activity and size classes of firms, reflecting in part differences in creditworthiness; lending to service firms and large companies is increasing, that to construction firms and small businesses declining. Credit-supply conditions remain accommodating: the average cost of new loans to firms is at historically minimum levels. The credit quality of Italian banks shows gradual improvement as economic growth gains traction. The seasonally adjusted, annualized flow of new non-performing loans diminished during 2016 as a percentage of total lending for both households and firms, falling to around the lowest levels since the start of the global crisis.
The latest cyclical data are consistent with the continuation of output and employment growth in the first half of 2017. Activity is likely to benefit from the strengthening of domestic demand and the greater stimulus coming from international commerce. Favourable signals emerge from the qualitative indicators, particularly as regards firms’ investment plans and outlook for orders from abroad. In April, the Bank of Italy’s Ita-coin indicator,1 which tracks the underlying trend of the Italian economy, signalled moderate growth in activity also in the second quarter.
1 For the methodology used to construct the indicator, see the box ‘Ita-coin: a coincident indicator of the Italian economic cycle’, Economic Bulletin, 2, 2015.

BANCA D’ITALIAAnnual Report201660
6. FIRMS
In 2016 the recovery in production became more uniform across the various sectors: economic activity continued to pick up in industry, accelerated slightly in services, and interrupted a prolonged recessionary phase in construction.
Fixed investment expenditure strengthened, on instrumental goods especially, driven by the expansionary monetary and financial conditions and the effects of new tax incentives introduced by the government. Improved business confidence spurred capital accumulation. The indicators measuring uncertainty about economic policies, both at European and national level, nonetheless remain at high levels.
Firms’ profitability rose. The decrease in interest rates helped to reduce financial vulnerability and contain borrowing needs. The ratio of self-financing to investment reached its highest level in more than 15 years.
Credit supply conditions improved but business lending is struggling to expand, mainly owing to limited borrowing needs. Lending patterns remain highly uneven between the different types of firms.
Economic developments
Firm demographics. – After rising for two consecutive years the net birth rate of firms, which excludes companies struck off the register, stabilized at 0.8 per cent, about half a percentage point more than the minimum recorded in 2013 but still below pre-crisis levels; the slight decline in births was offset by a decrease in firm mortality. In the first quarter of 2017 the net birth rate of firms returned to annualized growth of 1.0 per cent net of seasonal effects, owing to an increase in births and a further decline in the number of firms shutting down.
In line with the cyclical recovery, the net birth rate increased in industry excluding construction (where it regained the average levels recorded before the crisis), and in construction itself. Conversely, in the private service sector the recovery that got underway in 2014-15 came to a halt. The population of active firms is continuing to shift towards more complex legal forms, a trend under way since the 1990s. Limited companies are growing in number and now account for over 20 per cent of total firms, while the number of partnerships and sole proprietorships is decreasing.
Firm mortality diminished for the third consecutive year, returning to the levels observed before the financial crisis. This reflected the fact that fewer mature firms shut down during the last three years. For newly established firms (those set up after 2013), a slightly higher mortality rate was coupled with faster growth in the size of survivor firms.

BANCA D’ITALIA Annual Report61 2016
Value added and production. – In 2016 value added in the Italian economy as a whole grew at the same rate as in the previous year, 0.7 per cent, slightly less than GDP. The recovery spread more uniformly across the main sectors; economic activity continued to recover in industry excluding construction, strengthened in services, and halted its protracted decline in construction. Last year the share of profit in value added for non-financial corporations, which reached a record low in 2012, recouped about half of the decline accumulated during the sovereign debt crisis; it nevertheless remains low compared with the levels observed before the double-dip recession.
Activity in industry excluding construction grew by 1.3 per cent (compared with 2.4 per cent one year earlier). The manufacture of transport equipment, which had increased sharply in 2015, slowed in connection with weakening foreign demand. Conversely, the value added for the chemical products sector rose as the trade balance improved. Among the sectors producing traditional Italian goods, textiles and wood manufacturing continued the downward trend under way for more than 15 years, while the metals and metal products sector returned to growth. The provision of energy increased, in part owing to the temporary reduction in supply from France in the second half of the year.
Industrial output in Italy grew in line with that of the euro area and Germany, but less than in Spain and more than in France. Continuing a trend under way since 2013, the share of economic sectors posting growth increased (Figure 6.1), thereby confirming the gradual firming up of the recovery. In the first quarter of 2017 industrial output temporarily weakened (-0.3 per cent compared with the previous quarter), mainly owing to the contraction in the energy sector that followed the strong expansion recorded in the autumn.
Activity in the construction sector stabilized after experiencing its longest contraction in the post-war period since 2008; trends differed, however, in residential construction versus other construction activity. The former was mainly driven by refurbishment and renovation of the existing stock of buildings, for which tax incentives are in place; the recovery in the housing market also played a part and its effects are beginning to be transmitted to prices (see Chapter 7, ‘Households’). Non-residential construction, though buoyed by the private sector, was affected by the difficulties of adapting to the new regulations on public procurement. According to surveys conducted by the Bank of Italy, the entry into effect of the new rules led to delays in the issuance of calls for tender, with short-lived repercussions on construction activity; however, firms report that in the long run the impact of the new regulatory framework should be positive overall (see Chapter 12, ‘Business activity regulation and the institutional environment’).
Figure 6.1
Industrial production: sectoral diffusion of growth
(percentage shares; percentage changes)
-25
-20
-15
-10
-5
0
5
10
15
0
10
20
30
40
50
60
70
80
'00 '01 '02 '03 '04 '05 '06 '07 '08 '09 '10 '11 '12 '13 '14 '15 '16
Share of sectors posting growth (1)
General index of industrial production (right-hand scale)
Source: Based on Istat data. (1) As a proportion of the total (based on the ATECO 2007 classification). Sectors posting growth relative to the previous year are considered to be in expansion.
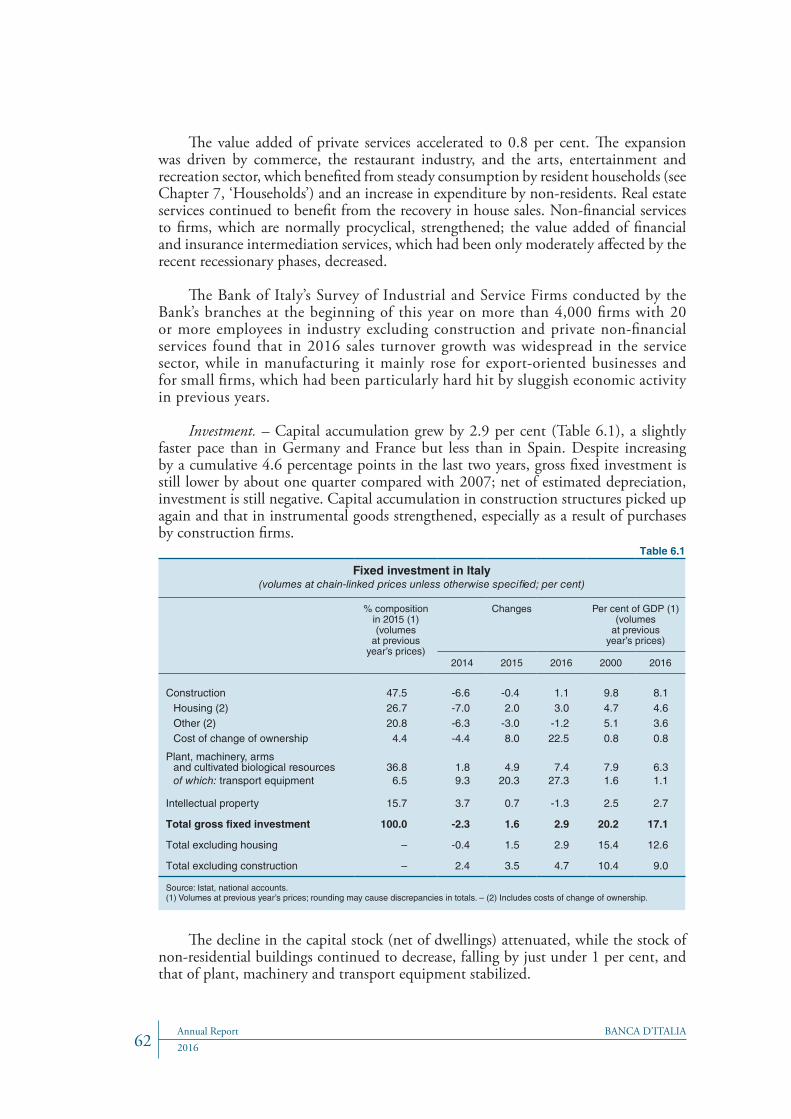
BANCA D’ITALIAAnnual Report201662
The value added of private services accelerated to 0.8 per cent. The expansion was driven by commerce, the restaurant industry, and the arts, entertainment and recreation sector, which benefited from steady consumption by resident households (see Chapter 7, ‘Households’) and an increase in expenditure by non-residents. Real estate services continued to benefit from the recovery in house sales. Non-financial services to firms, which are normally procyclical, strengthened; the value added of financial and insurance intermediation services, which had been only moderately affected by the recent recessionary phases, decreased.
The Bank of Italy’s Survey of Industrial and Service Firms conducted by the Bank’s branches at the beginning of this year on more than 4,000 firms with 20 or more employees in industry excluding construction and private non-financial services found that in 2016 sales turnover growth was widespread in the service sector, while in manufacturing it mainly rose for export-oriented businesses and for small firms, which had been particularly hard hit by sluggish economic activity in previous years.
Investment. – Capital accumulation grew by 2.9 per cent (Table 6.1), a slightly faster pace than in Germany and France but less than in Spain. Despite increasing by a cumulative 4.6 percentage points in the last two years, gross fixed investment is still lower by about one quarter compared with 2007; net of estimated depreciation, investment is still negative. Capital accumulation in construction structures picked up again and that in instrumental goods strengthened, especially as a result of purchases by construction firms.
Table 6.1
Fixed investment in Italy(volumes at chain-linked prices unless otherwise specified; per cent)
% composition in 2015 (1) (volumes
at previous year’s prices)
Changes Per cent of GDP (1)(volumes
at previous year’s prices)
2014 2015 2016 2000 2016
Construction 47.5 -6.6 -0.4 1.1 9.8 8.1Housing (2) 26.7 -7.0 2.0 3.0 4.7 4.6Other (2) 20.8 -6.3 -3.0 -1.2 5.1 3.6Cost of change of ownership 4.4 -4.4 8.0 22.5 0.8 0.8
Plant, machinery, arms and cultivated biological resources 36.8 1.8 4.9 7.4 7.9 6.3of which: transport equipment 6.5 9.3 20.3 27.3 1.6 1.1
Intellectual property 15.7 3.7 0.7 -1.3 2.5 2.7
Total gross fixed investment 100.0 -2.3 1.6 2.9 20.2 17.1
Total excluding housing – -0.4 1.5 2.9 15.4 12.6
Total excluding construction – 2.4 3.5 4.7 10.4 9.0
Source: Istat, national accounts.(1) Volumes at previous year’s prices; rounding may cause discrepancies in totals. – (2) Includes costs of change of ownership.
The decline in the capital stock (net of dwellings) attenuated, while the stock of non-residential buildings continued to decrease, falling by just under 1 per cent, and that of plant, machinery and transport equipment stabilized.

BANCA D’ITALIA Annual Report63 2016
Investment in instrumental goods benefited above all from the decrease in borrowing costs prompted by the expansionary stance of monetary policy (see Chapter 4, ‘Monetary policy in the euro area’) and the new tax incentives on instrumental goods (the super-amortization scheme), subsequently confirmed and extended to innovation activities (the hyper-amortization scheme). While improving, aggregate demand still constitutes a modest stimulus to investment, given the persistently ample margins of slack (see the box ‘The trend in investment and the cyclical recovery’).
After falling by almost 30 per cent during the double-dip recession, investment in Italy began to expand again at the end of 2014. In the last two years it has contributed about half of the growth in GDP.
Trends differ across sectors, however. Investment in capital goods (equipment, machinery, transport equipment and intellectual property) has risen fairly steadily in the last three years (by almost 11 per cent) and as a percentage of GDP is now close to the average value recorded in the decade leading up to the global financial crisis (see panel (a) of the figure). On the other hand, it was not until last year that investment in construction, which had been declining since 2008, began to inch back up.
The factors behind the trend outside the construction sector can be analysed using a macro-econometric model that takes account of demand, business confidence, uncertainty, the user cost of capital (which depends on real interest rates, depreciation, and corporate income tax rates) and credit supply conditions.1 According to this analysis,
1 F. Busetti, C. Giordano and G. Zevi, ‘The drivers of Italy’s investment slump during the double recession’, Italian Economic Journal, 2, 2, 2016, 143-165.
THE TREND IN INVESTMENT AND THE CYCLICAL RECOVERY
Trend and determinants of investment(quarterly data; per cent)
(a) Investment as a percentage of GDP (b) Determinants of the trend in investment in the private sector excluding construction
(change on corresponding period and contribution)
-20
-15
-10
-5
0
5
10
15
'07 '08 '09 '10 '11 '12 '13 '14 '15 '16
Other factorsUser cost of capital and credit supply constraintsBusiness confidence and uncertaintyValue addedInvestment excluding construction
Total investment
Average 1998-2007
Investment excluding construction (1)
Average 1998-2007 (1)
-20
-15
-10
-5
0
5
10
15
7
8
9
10
11
16
18
20
22
24
'98 '00 '02 '04 '06 '08 '10 '12 '14 '16
Sources: Based on Bank of Italy and Istat data.(1) Right-hand scale.

BANCA D’ITALIAAnnual Report201664
all of the factors have begun to contribute positively again to investment growth in the last three years (see panel (b) of the figure).
Investment was buoyed above all by the reduction in the user cost of capital, the outcome of a generalized reduction in interest rates and a progressive easing of credit supply conditions, apparent from the qualitative findings of surveys conducted among banks and firms. At the height of the sovereign debt crisis in 2011-12, these determinants caused over a third of the contraction in investment.2 The major role of credit supply in explaining investment dynamics during the double-dip recession is also borne out by the results of further studies based on data from the Survey of Industrial and Service Firms.3
Credit conditions became less tight even though the levels of NPLs were still high. As evidenced by a recent empirical study of the Bank of Italy, the large volume of NPLs had only a limited impact on flows of business lending from 2008 to 2015 (see the box ‘The quality of banks’ portfolios and the quality of credit to firms’, Financial Stability Report, 1, 2017).4 The importance of financial leverage and long-term loans is confirmed in a study of investment by Italian firms and households in the period 1995-2016.5
The contribution to capital accumulation induced by business cycle fluctuations, mainly owing to the accelerator mechanism, began to improve steadily. However, it remains moderate, partly because of the still limited contribution of international trade, which has expanded at a much slower pace compared with the average for the past.
The improvement in business confidence indicated by Istat’s opinion surveys of industrial companies and the easing of uncertainty among entrepreneurs as measured by the dispersion of their expectations regarding orders, production and the economic situation, have also fostered the recovery in investment. However, the values of other uncertainty indicators are still high. In particular, the economic policy uncertainty (EPU) index is extremely high worldwide and in the euro area (see the box ‘The evolution of uncertainty regarding economic policy and the financial markets in the advanced countries’, Economic Bulletin, 2, 2017). This could impact negatively on households’ spending decisions and firms’ investment decisions.
2 F. Busetti and P. Cova, ‘L’impatto macroeconomico della crisi del debito sovrano: un’analisi controfattuale per l’economia italiana’, Banca d’Italia, Questioni di Economia e Finanza (Occasional Papers), 201, 2013. See also M. Caivano, L. Rodano and S. Siviero, ‘La trasmissione della crisi finanziaria globale all’economia italiana. Un’indagine controfattuale, 2008-2010’, Banca d’Italia, Questioni di Economia e Finanza (Occasional Papers), 64, 2010; E. Gaiotti, ‘Credit availability and investment: lessons from the “great recession”’, European Economic Review, 59, 2013, 212-227; S. Bond, G. Rodano and N. Serrano-Velarde, ‘Investment dynamics in Italy: financing constraints, demand and uncertainty’, Banca d’Italia, Questioni di Economia e Finanza (Occasional Papers), 283, 2015, and other papers included in the first session of the workshop on ‘Investment financing’, Banca d’Italia, Workshop and Conference series, forthcoming; I. Buono and S. Formai, ‘Bank credit, liquidity and firm-level investment: are recessions different?’, Banca d’Italia, Temi di Discussione (Working Papers), forthcoming.
3 A. De Socio and E. Sette, ‘Firm investments during two crises’, Banca d’Italia, Questioni di Economia e Finanza (Occasional Papers), forthcoming.
4 M. Accornero, P. Alessandri, L. Carpinelli and A. M. Sorrentino, ‘Non-performing loans and the supply of bank credit: Evidence from Italy’, Banca d’Italia, Questioni di Economia e Finanza (Occasional Papers), 374, 2017.
5 C. Giordano, M. Marinucci and A. Silvestrini, ‘A macro assessment of external finance and other factors in explaining Italy’s firm and household investment’, Banca d’Italia, Temi di Discussione (Working Papers), forthcoming.
BANCA D’ITALIA Annual Report65 2016
In April business confidence in the manufacturing sector reached its highest level since 2007, with the biggest improvement coming from firms’ assessments of both domestic and foreign orders. Coordinated by the European Commission, the survey shows that in 2016 a number of obstacles to capital accumulation in Italy decreased in importance.1 Businesses continue to perceive a high degree of uncertainty attributable to economic and political factors.
According to the Bank of Italy’s Survey of Industrial and Service Firms, the pace of capital accumulation was faster for small and medium-sized manufacturers (Table 6.2), which had been hit hard by the recession in previous years. Tax incentives (super-amortization) contributed significantly to the increase; about one out of five firms stated that without them their investment expenditure would have been lower. According to the survey, the incentives also helped to increase the rate of realization of the expenditure plans made at the beginning of the year, especially for small firms.
In 2017 the respondent firms plan to expand their total investment by just under 3 per cent, with large non-construction industrial firms contributing to most of the growth. The investment plans are more favourable for those expecting demand to rise, especially in foreign markets.
Firms reported that the incentives to invest in advanced digital technologies (hyper-amortization) introduced by the Budget Law for 2017 and part of the ‘Industry 4.0’ plan would support their investment expenditure, especially on intangible goods and more markedly in the case of small and medium-sized innovative firms.
Investment in construction, which had been falling since 2008, returned to growth of 1.1 per cent but remains more than one third below pre-crisis levels. The residential housing component, which had declined somewhat during the recession, grew for the second consecutive year (3.0 per cent). The strong revival in house sales (see Chapter 7, ‘Households’) led to a significant boost in commissions on property transactions; tax credits encouraged extraordinary maintenance works. Investment in ‘other construction’ instead
1 European Commission, Business and Consumer Survey Results, April 2017.
The incentives introduced by the Government in the budget laws for 2016 and 2017 to encourage investment in capital goods (the super-amortization scheme) and advanced technology (the hyper-amortization scheme) – which are included among the ‘other factors’ in the breakdown shown in the figure – have helped to buoy investment dynamics. We estimate (see Economic Bulletin, 1, 2017)6 that these incentives will increase investment in production facilities by 3.5 percentage points in the three years 2016-18, mainly as firms bring forward their spending plans. This assessment is corroborated by the positive opinions expressed in the Survey of Industrial and Service Firms and business outlook surveys (see the boxes ‘The investment outlook according to business surveys’, Economic Bulletin, 4, 2016, and ‘Italian firms’ investment according to the survey on inflation and growth expectations’, Economic Bulletin, 1, 2017).
6 G. Bulligan, F. Busetti, M. Caivano, D. Fantino, A. Locarno and L. Rodano, ‘ The Bank of Italy econometric model: an update of the main equations and model elasticities’, Banca d’Italia, Temi di Discussione (Working Papers), forthcoming.

BANCA D’ITALIAAnnual Report201666
continued to diminish (-1.2 per cent), mainly owing to the public works component (see Chapter 11, ‘Public Finance’), which in the short term was presumably affected by the process of adapting to the new regulations on public procurement.
According to the survey conducted by the Bank of Italy’s branches in the early months of 2017 on a sample of over 400 construction firms, in 2016 there was a pronounced decrease in the realization of public works, likely affected by reduced public sector investment. For 2017 firms expect a further, though less marked, reduction.
Innovation. – In 2016 investment in intangible goods decreased by 1.3 per cent owing to lower expenditure on software and databases. Since 2014, investment in intangible assets has recouped the slight decline recorded during the crisis though it remains modest by European standards; compared with the low recorded in 2011 it rose by 7.6 per cent, while Germany and France posted increases of 10.6 and 15.5 per cent respectively.
Expenditure on research and development (measured at chain-linked prices) grew by 0.9 per cent, compared with 1.2 per cent in 2015, and as a proportion of GDP it was virtually unchanged at 1.3 per cent, about half that observed for Germany and France. Italy lags behind mostly because of its highly fragmented business structure and lower propensity on the part of medium-sized firms to carry out research. The contribution of large firms has increased significantly since 2007; in 2015 the top ten firms for expenditure on research and development accounted for over 60 per cent of the private sector’s total expenditure. These firms’ R&D intensity is on average comparable with that of equivalent firms in Germany and France.
Table 6.2
Gross fixed investment of firms according to Bank of Italy surveys by size class, capacity utilization and change in turnover (1)
(percentage changes at 2016 prices unless otherwise specified)
Total Number of employees Capacity utilization (2) (3)
Change in turnover (2)
20 to 49
50 to 199
200 to 499
500 & over
Low High Low High
Industry excluding constructionOutturn for 2016 3.7 21.1 4.7 -0.8 -0.7 0.9 7.1 -1.3 10.4Realization rate (4) 98.1 115.4 102.6 94.1 91.6 95.1 101.6 96.5 99.8Planned investment for 2017 5.6 -1.4 6.6 6.9 7.8 6.9 3.8 7.1 4.0
of which: manufacturing2016 outturn 6.9 25.3 6.2 -1.6 2.5 7.3 6.6 3.0 11.1realization rate (4) 100.8 116.9 104.8 95.3 92.6 98.8 102.5 101.8 100.02017 planned 4.7 -2.3 7.1 5.2 7.1 6.5 2.9 6.2 3.6
Service sector (5)Outturn for 2016 4.0 12.2 8.7 -2.6 0.1 …. …. -0.5 8.5Realization rate (4) 101.9 105.4 106.6 107.8 97.7 …. …. 96.9 107.1Planned investment for 2017 0.2 -3.3 -2.4 11.3 0.8 …. …. -0.7 1.1
TotalOutturn for 2016 3.9 15.6 6.9 -1.6 -0.3 …. …. -0.9 9.3Planned investment for 2017 2.8 -2.5 1.9 8.6 3.9 …. …. 3.1 2.4
Source: Bank of Italy, Survey of Industrial and Service Firms.(1) Robust means (Winsorized) of the distribution of annual changes in investment. Investment is deflated using the individual deflators provided by the firms. – (2) Firms are divided according to whether they fall below (low) or above (high) the median, calculated separately for industry and services, relating to 2016 for the outturn and realization rate and relating to projections for 2017 for planned investment. – (3) Industrial firms only. – (4) Percentage ratio, at current prices, of realized investment to planned investment (recorded in last year’s survey) for 2016. – (5) Private non-financial services.

BANCA D’ITALIA Annual Report67 2016
In 2016 the number of patents filed with the European Patent Office (EPO) rose for the second consecutive year, exceeding 4,000. The largest increase was recorded in the transport sector and in the chemical and pharmaceutical industries. The share of Italian patents out of the total number filed by euro-area countries rose to 8.2 per cent, but remains low considering Italy’s value added and resident population.
Since 2013 a number of incentives for innovation have been introduced and the proportion of firms that reported using them has increased.2 In 2015 these incentives accounted for 0.7 per cent of GDP, rising above the European average for the first time in ten years. The increase mainly reflected the use of tax credits, recently strengthened as part of the ‘Industry 4.0’ plan.
Labour demand. – In 2016 firms increased their labour utilization significantly: total hours worked by payroll employees in the non-farm private sector rose by 3.0 per cent, exceeding the rate of increase of people in employment (2.3 per cent). Although it expanded in the last two years, the average number of hours worked by individual employees remains almost 5 per cent lower than pre-2008 levels. Labour input increased in most sectors: it strengthened in manufacturing and private services and halted its fall in construction.
According to the Bank of Italy’s Survey of Industrial and Service Firms, the increase in total hours worked was common to all size groups but especially marked for SMEs, for which the increase in the number of people employed went hand in hand with a faster rate of capital accumulation.
Productivity. – In 2016 hourly productivity declined by 1.0 per cent; the cyclical increase in labour utilization, partly encouraged by social security contribution relief for new permanent hires (see Chapter 8, ‘The labour market’), was more intense than that in value added, both in industry excluding construction and in services.
Long-term productivity growth remains unsatisfactory by international standards, reflecting Italian firms’ limited innovation, a business structure skewed towards small and very small firms, and a large share of family-managed companies (see Chapter 15, ‘Productivity in Italy: performance and determinants’).
Profitability and financial balance. – In 2016 firms’ profitability accelerated: gross operating profit (EBITDA) increased by more than 6 per cent, surpassing the level recorded in 2008 (Figure 6.2). The fall in interest rates
2 Istat, ‘L’innovazione nelle imprese: anni 2012-2014’, Statistiche − Report, 2016.
Figure 6.2
Profitability and coverage of investment(per cent; indices)
30
50
70
90
110
10
15
20
25
30
'99 '00 '01 '02 '03 '04 '05 '06 '07 '08 '09 '10 '11 '12 '13 '14 '15 '16
Self-financing/investment (1) (2)
Investment (1) (3)
Net interest expense/EBITDA (2)
EBITDA (1) (3)
Source: Based on nominal Istat data, national accounts for the non-financial corporations sector.(1) Right-hand scale. – (2) Net interest expense and self-financing are estimated on the basis of Istat data. – (3) Indices, 2008=100.

BANCA D’ITALIAAnnual Report201668
helped to reduce the ratio of net interest expense to EBITDA to 10.7 per cent, very low compared with previous years. The Bank of Italy’s Survey of Industrial and Service Firms confirms the improvement in profitability: in 2016 the proportion of firms posting a profit grew from 69 per cent to 73 per cent. The increase was greater for firms with more than 50 workers.
Internal resources were high compared with capital accumulation. The ratio of self-financing to investment reached its highest level in more than fifteen years (94 per cent). The financial balance, which became positive in 2012, expanded further, reaching 1.8 per cent of GDP. Liquid assets grew to 20 per cent of GDP (Table 6.3). The Bank of Italy’s Survey of Industrial and Service Firms shows that the increase was more significant for larger firms, reflecting higher profits.
Table 6.3
Financial assets and liabilities of firms (1)(millions of euros and per cent)
End-of-period stocks Flows
2016 Percentage composition 2015 2016
2015 2016
ASSETSCash and deposits 337,041 18.8 19.5 29,664 20,490Securities 60,919 3.6 3.5 1,663 4,220
of which: Italian public sector 50,395 3.0 2.9 -1,042 3,445Shares and other equity 590,687 35.3 34.1 13,902 47,265Trade receivables 585,725 33.3 33.9 -23,408 34,191Other assets (2) 155,744 9.0 9.0 -775 6,659Total assets 1,730,116 100.0 100.0 21,045 112,826
of which: external 467,002 26.9 27.0 -711 23,837
LIABILITIESFinancial debt 1,260,451 34.2 34.0 -24,993 5,079
Bank loans 775,808 21.5 21.0 -10,870 -11,284Other loans (3) 340,078 8.7 9.2 -12,332 18,748Securities 144,565 4.0 3.9 -1,791 -2,385
Shares and other equity 1,716,604 47.2 46.4 55,036 35,960Trade payables 521,567 13.2 14.1 -24,919 36,230Other liabilities (4) 203,774 5.3 5.5 4,311 6,986Total liabilities 3,702,396 100.0 100.0 9,436 84,256
of which: external 601,955 16.0 16.3 18,595 35,462
BALANCE -1,972,280 11,610 28,570
Source: Bank of Italy, financial accounts.(1) The data refer to the non-financial corporations sector. Rounding may cause discrepancies in totals. – (2) Short-term foreign claims, intra-group claims, insurance technical provisions, domestic derivatives and other minor items. – (3) Includes financing provided by leasing and factoring companies, intra-group loans and securitized loans. – (4) Postal current accounts, severance pay and pension provisions, domestic derivatives and other minor items.
Sources of funding
Financial structure. – In 2016 corporate financial debt as a proportion of GDP decreased slightly, to 75 per cent (Figure 6.3.a). The rebalancing of firms’ financial structure that began in the early 2010s continued; compared with 2011, leverage fell by over 7 percentage points to 42.3 per cent. Some 5.7 percentage points of the improvement are ascribable to the growth in net equity, of which 2.6 points stemming from the inflow of new resources and 3.1 percentage points from the increase in share prices.

BANCA D’ITALIA Annual Report69 2016
Between 2011 and 2015 the contribution of equity increases to the reduction in leverage was most significant for large firms (Figure 6.3.b); among the smaller ones, instead, the exit from the market of the more highly indebted firms had the greatest effect.
Figure 6.3
Corporate indebtedness (1)(per cent)
(a) By year (2) (b) By business size class (4)
-8
-7
-6
-5
-4
-3
-2
-1
0
Micro Small Medium Large
Contribution of change in financial debt
Contribution of change in net equity
Contribution of firm demographics (5)
Leverage 2015 - leverage 2011
0
20
40
60
80
100
0
10
20
30
40
50
2011 2012 2013 2014 2015 2016
Leverage - securities (2)
Leverage - other loans (2)
Leverage - bank loans (2)
Financial debt/GDP (3)
-8
-7
-6
-5
-4
-3
-2
-1
0
Sources: Bank of Italy (financial accounts), Istat and Cerved.(1) The data refer to the non-financial corporations sector. – (2) Calculated as the ratio of financial debt to the sum of financial debt and shareholders’ equity, at market prices. – (3) Right-hand scale. – (4) Based on balance sheet data of firms included in the Cerved databases in the period 2011-15. Calculated as the ratio of financial debt to the sum of financial debt and shareholders’ equity, at book value. – (5) Net contribution of firms entering and exiting the market in the reference period.
Credit. – Lending by banks and financial companies has held practically stable since the end of 2015 (in March it grew by 0.3 per cent year-on-year), mainly owing to limited demand for borrowing. According to the Bank of Italy’s Survey of Industrial and Service Firms, in the second half of 2016 the balance of firms reporting an increase in their demand for loans and those reporting a decrease was at one of the lowest levels recorded since the outbreak of the financial crisis; the average share of firms stating that they had not received the requested amount of credit returned close to 2007 levels (4 per cent, that is, one third of the peak recorded in 2012).
Lending continues to be highly uneven across firms (Table 6.4). For financially sound companies, whose applications for new loans are rarely turned down by banks (Figure 6.4.a), the net change in loans was positive in the sectors benefiting from more favourable cyclical conditions. For more fragile firms, instead, credit dried up further, partly as an effect of more selective lending policies.
Bank lending to small firms continues to diminish at a rapid pace. Most of the difference with respect to larger companies is ascribable to their more vulnerable financial situations and greater presence in sectors which have yet to reap the full benefits of the recovery. There are, however, other factors at play, such as banks’ lower propensity to lend to small firms owing to their greater information asymmetries and the higher fixed management costs for small loans.
Banks’ lending terms improved; in March 2017 the interest rate on new loans was 1.7 per cent, close to the historical lows recorded in the previous months. The difference with respect to the euro-area average, which had reached 1 percentage point during the sovereign debt crisis, was all but wiped out.

BANCA D’ITALIAAnnual Report201670
In 2016 the decrease in interest rates mainly reflected a decline in the risk premiums applied by banks: the difference between the rates applied to riskier firms and those paid by the more financially sound ones narrowed (Figure 6.4.b). The average cost of credit is particularly low for large and financially sound firms, also owing to the high degree of competition between banks in this customer segment: for one quarter of these firms such cost is below 0.7 per cent.
Table 6.4
Lending to firms (1)(end-of-period data; per cent)
12-month percentage changes Percentage composition
2014 2015 2016 March 2017 March 2017
BanksBranch of economic activity
Manufacturing -0.1 1.9 -0.7 -0.3 22.0Construction -3.1 -3.0 -5.2 -5.3 14.2Services -2.1 0.5 3.3 3.0 34.6Real estate -3.1 -1.9 0.9 1.9 11.9Other -2.1 -4.2 -1.4 -1.8 9.0
Size of firm Small (2) -2.3 -2.3 -2.1 -1.5 16.9Medium-sized and large -1.9 -0.2 0.7 0.6 74.8
Total -2.0 -0.6 0.2 0.2 91.6Financial companies
Leasing -2.8 -3.8 -2.6 -1.8 5.7Factoring -4.1 4.0 10.8 9.3 2.0Other financing -0.4 -8.9 -2.0 -0.7 0.7
Total -3.1 -2.7 0.6 0.8 8.4Banks and financial companies
Total -2.2 -0.8 0.2 0.3 100.0
Source: Supervisory reports.(1) The data refer to non-financial corporations and producer households. The data for March 2017 are provisional. Rounding may cause discrepancies in totals. – (2) Limited partnerships, general partnerships, informal partnerships, de facto companies and sole proprie-torships with fewer than 20 workers.
Figure 6.4
Firms’ access to credit(per cent)
(a) Access to credit by riskiness class (1) (b) Short-term interest rates by size class (2)
1
2
3
4
5
6
7
8
9
1213141516121314151612131415161213141516
Micro Small Medium Large
Risky firms Sound firms
0
5
10
15
20
25
30
35
2012 2014 20160
5
10
15
20
25
30
35
1
2
3
4
5
6
7
8
9
Sound Vulnerable Risky
Sources: Based on Bank of Italy and Cerved data.(1) Share of firms reporting that they had not obtained some or all of the credit requested. – (2) Average interest rates on outstanding bank loans.

BANCA D’ITALIA Annual Report71 2016
During an economic and financial crisis banks’ balance sheets weaken: the drop in profits and the rise in losses on loans and other investments affect banks’ equity and reduce their capital ratios. This impoverishment can lead to a reduction in the supply of credit to households and firms, making it much more selective. However, it can also lead to instances of adverse selection against firms, creating an incentive to continue extending credit to existing borrowers with poor financial prospects in order to prevent their default, as this would uncover losses on earlier loans and further erode the bank’s capital.
This phenomenon, referred to in the literature as ‘zombie lending’, is believed to be one of the factors that amplified the depth and duration of the crisis in Japan in the 1990s.1 Zombie lending can have repercussions on economic growth because it makes less credit available for the more productive firms or because, by ensuring the survival of those otherwise destined to leave the market, it distorts competition to the detriment of the soundest enterprises. According to some experts, this is what may have happened in Europe during the recent recession, helping to aggravate its consequences.2
Measuring the effects of zombie lending on economic growth is a complex exercise, requiring the use of micro data on a large number of relationships between individual banks and firms.
An analysis of the balance-sheet data of the respondents to the Survey of Industrial and Service Firms between September 2008 and March 2009 – that is, immediately after the collapse of Lehman Brothers but before the recession deepened owing to the sovereign debt crisis – showed little evidence of zombie lending: the largest banks, though poorly capitalized, appear to have redirected credit towards the soundest firms, defined as those with the highest total factor productivity.3
The results of a more recent study, which carries the analysis over to the period 2004-13 (covering, therefore, the recession that followed the sovereign debt crisis) and broadens the sample to include the universe of joint stock companies, suggest that zombie lending did occur,4 but not enough to contribute significantly to the gravity of the recession. From 2008 to 2013, compared with other banks, the less capitalized ones granted more business loans that qualify as zombie lending based on profitability and financial fragility indicators and were less likely to break off existing credit relationships with the firms. However, the results indicate that this phenomenon was not accompanied by a reduction in the supply of credit to sounder
1 R. J. Caballero, T. Hoshi and A.K. Kashyap, ‘Zombie lending and depressed restructuring in Japan’, American Economic Review, 98, 5, 2008, 1943-1977.
2 V.V. Acharya, T. Eisert, C. Eufinger and C. Hirsch, ‘Whatever it takes: the real effects of unconventional monetary policy’, mimeo, 2016.
3 U. Albertazzi and D.J. Marchetti, ‘Credit supply, flight to quality and evergreening: an analysis of bank-firm relationships after Lehman’, Banca d’Italia, Temi di Discussione (Working Papers), 756, 2010.
4 F. Schivardi, E. Sette and G. Tabellini, ‘Credit misallocation during the European financial crisis’, Banca d’Italia, Temi di Discussione (Working Papers), forthcoming.
CREDIT ALLOCATION AND FIRMS’ CHARACTERISTICS

BANCA D’ITALIAAnnual Report201672
firms. Using an innovative methodology,5 the study also estimates that zombie lending increased the likelihood of non-zombie firms leaving the market; for the survivors, there was no impact on investment, employment or sales turnover. The overall aggregate effect can be estimated at one tenth of the average decrease in output during the crisis years.
Analysing the performance of lending to individual firms compared with 2015, it emerges that, numerous characteristics being equal (profitability, liquidity, sales turnover growth, investment spending, sector of activity and geographical area), lending increased in the case of sound firms but diminished for the riskier and more vulnerable ones.6 Although these dynamics are also affected by the heterogeneous nature of credit demand, they confirm that where outstanding loans to fragile firms were maintained, this did not prevent an increase in lending to financially sounder businesses.
5 The paper shows that the empirical specifications usually used in the literature are unable to take into account the fact that demand shocks have a heterogeneous effect on the growth of sound firms and zombie firms, leading to an overestimation of the negative effects of zombie lending on sound firms.
6 E. Bonaccorsi di Patti and P. Finaldi Russo, ‘Fragilità finanziaria delle imprese e allocazione del credito’, Banca d’Italia, Questioni di Economia e Finanza (Occasional Papers), 371, 2017.
The improvement in credit access has been confirmed by the reduction in loans backed by collateral or personal guarantees; in 2016 their value as a proportion of total loans decreased by more than 1 percentage point, to 59 per cent. The reduction only affected larger companies, while for firms with fewer than 20 workers the share held stable at 72 per cent. A growing proportion of the collateral and guarantees issued for SMEs was ascribable to Italy’s Central Guarantee Fund, whose activity has grown steadily since the inception of the crisis, peaking in 2016 at around €17 billion in new collateral-backed loans (compared with €2 billion in 2008).
Even though credit allocation can have significant consequences on firms’ productivity during a recession by amplifying the intensity and duration of the economic downturn and holding back the recovery, recent analyses suggest that poor allocation of credit did not have a significant impact on the depth of the recession (see the box ‘Credit allocation and firm characteristics’).
Bonds. – In 2016 the value of gross bond issues by Italian companies, including their foreign subsidiaries, amounted to €30 billion (compared with €31 billion in 2015). The average cost of the securities outstanding (4.0 per cent) decreased by more than 20 basis points, benefiting from the effect of the Eurosystem’s purchases of corporate securities (see the box ‘The impact of Eurosystem purchases of private sector bonds’ in Chapter 14). Favourable conditions in market access led to an increase in the number of issuing firms, from 134 in 2015 to 163 in 2016; the number of those placing bonds for the first time rose even more significantly, from 77 in 2015 to 95 in 2016. Issues of minibonds on the ExtraMOT PRO market by non-listed companies totalled €2.4 billion, more than the combined amounts of the placements made in the previous two years.
Equity. – In 2016 net capital flows reached €36 billion (see Table 6.3). Recourse to the share market declined: there were ten new listings, half of those recorded the previous year.

BANCA D’ITALIA Annual Report73 2016
Increased profitability and the tax incentives provided under the allowance for corporate equity (ACE) contributed to capital strengthening. According to the Bank of Italy’s Survey of Industrial and Service Firms, the share of companies reporting an increase in their equity since 2012 rose compared with previous years, to 56 per cent, as did the proportion of firms (13 per cent) for which the increase was influenced by the ACE.
According to data from the Italian Association of Private Equity, Venture Capital and Private Debt (AIFI), companies in the sector carried out 322 transactions amounting to €8.2 billion, more than double the average for the previous five-year period. Investment was concentrated in leveraged buy-outs involving large amounts. There was also an increase in the funds invested in ‘early-stage’ firms; at €104 million, however, the volume remains low by international standards.
The capitalization of innovative and high-growth-potential firms is supported by public measures. In 2012 incentives were introduced for investing in the capital of innovative start-ups included in a special register; in April 2017 the potential beneficiaries numbered over 7,000 (up from 5,500 in the previous year, see the box ‘Public sector support for innovative start-ups: a preliminary evaluation’, Chapter 6, Annual Report for 2015, 2016). Between 2012 and 2016, thanks to a public-private partnership, Fondo Italiano di Investimento and Invitalia Ventures established some Italian venture-capital investment funds whose investments, mainly in other funds, exceeded €100 million. The Italian funds involved in these transactions raised over €400 million, also thanks to the large-scale participation of private operators.

BANCA D’ITALIAAnnual Report201674
7. HOUSEHOLDS
The growth in households’ disposable income gained momentum in 2016, mostly thanks to the ongoing recovery in employment. The inequality indices, which had fallen slightly between 2014 and 2015, remained unchanged, but many people are still suffering economic hardship; the share of individuals in absolute poverty, which more than doubled during the crisis, continued to be at high levels.
Consumption expanded further, supported by the improved outlook for income and favourable credit conditions, as well as the increase in household wealth, which in the preceding years was affected by the decline in real estate prices. Household confidence indices fell gradually in 2016, though they remain relatively high. Households’ propensity to save stabilized, but it was still significantly below the average levels recorded in the past ten years.
The increase in household wealth, equal to 9.4 times disposable income in 2016, reflected the greater flow of savings. In the housing market sales are recovering and prices are showing the first signs of picking up.
Households continued to invest in deposits and asset management products that facilitate portfolio diversification, leading also to an increase in the share of the total portfolio comprised of foreign securities. Households stepped up their borrowing, driven by the recovery in disposable income, the improved housing market outlook, and better lending conditions.
Income and income distribution
Last year real household disposable income rose by 1.6 per cent (Table 7.1), boosting the recovery under way since the spring of 2013 (for a cumulative improvement of around 3 per cent), but nonetheless remaining 8.1 per cent below the 2007 level. As in 2015 the biggest boost came from employee compensation, thanks above all to employment growth. Self-employment income also rose, despite the drop in the number of these job positions, as did property income, notwithstanding the decline in net interest and in the dividends distributed. Action by general government, which in 2015 contributed almost 0.5 percentage points to the curtailment of growth in household disposable income, did not have a significant impact in 2016 as both transfers and taxation eased (see Chapter 11, ‘The public finances’).
Based on recent estimates by the Ministry of Economy and Finance, after falling by 0.4 points in 2015, the inequality of equivalized disposable income1 remained
1 The inequality index considered is the ratio between the equivalized disposable income of the richest 20 per cent of the population and that of the poorest 20 per cent.

BANCA D’ITALIA Annual Report752016
unchanged from the previous year. The rebound in employment, which began in mid-2014, presumably contributed to reducing inequality (see Chapter 8, ‘The labour market’). The labour force survey data also confirm that the decline in inequality in employment income for non-pensioners aged between 15 and 64 years is mainly due to the expansion in employment and only to a very limited extent to the lower dispersion of per capita income.
Table 7.1
Household gross disposable income and the propensity to save (1)(at current prices, unless otherwise indicated)
% of households’
gross disposable income in
2016
2014 2015 2016
Percentage change
Employment income 61.3 0.4 2.1 2.4
Income per full-time equivalent dependent worker – 0.1 0.3 0.3
Self-employment income (2) 25.9 0.1 -0.4 0.9
Income per full-time equivalent self-employed worker – 0.2 0.2 1.1
Net property income (3) 22.4 -0.9 0.6 0.4
Social benefits and other net transfers 32.4 1.9 2.2 1.4of which: net social benefits 33.5 1.8 2.0 1.4
Net social security contributions (-) 23.1 -0.1 2.2 1.3of which: paid by employers 15.2 -0.3 1.6 1.4
Current taxes on income and wealth (-) 18.9 0.3 3.6 1.7
Gross disposable income 100.0 0.6 0.8 1.6
In real terms (4) – 0.4 0.8 1.6
In real terms, adjusted for expected inflation (4) (5) – 1.8 1.2 1.4
In real terms, adjusted for past inflation (4) (6) – 1.2 0.8 1.5
Percentage share
Average propensity to save (7) – 8.7 8.0 8.3
Calculated on income adjusted for expected inflation – 8.3 8.0 8.1
Calculated on income adjusted for past inflation – 8.6 7.9 8.1
Sources: Calculations and estimates based on Istat and Bank of Italy data.(1) Data for consumer households. – (2) Mixed income and income withdrawn by members of quasi-corporations. – (3) Gross operating profit (mainly rental income), net rents from land and intangible assets, actual net interest, dividends and other profits distributed by companies. – (4) Deflated using the consumer household consumption deflator. – (5) Gross disposable income net of expected losses on net financial assets due to inflation (estimated on the basis of the Consensus Economics survey). – (6) Gross disposable income net of losses on net financial assets due to inflation calculated ex-post. – (7) Ratio of saving (gross of depreciation and net of changes in pension fund reserves) to gross disposable income.
In 2015, the last year for which data are available, the number of persons suffering economic hardship remained at the highest levels reached since the crisis. The percentage of individuals at risk of poverty or social exclusion2 (according to
2 The indicator is given by the percentage of persons that live in households at risk of poverty (whose equivalized household income is less than 60 per cent of the median income), or in conditions of severe material deprivation or low work intensity (households with members between 18 and 59 years of age who work less than one fifth of the time that is theoretically available to work). The data on income and months worked refer to 2014.

BANCA D’ITALIAAnnual Report201676
Eurostat data) stood at 28.7 per cent, around 3 percentage points more than in 2007 and 5 points higher than the EU average. The number of individuals in absolute poverty3 was equal to 7.6 per cent of the population (4.6 million persons, based on Istat estimates), the highest figure reported since 2005. Most of these are households comprised entirely of non-Italian citizens, with a poverty rate seven times that of wholly Italian households, which between 2014 and 2015 recorded an increase, especially in the North. Poverty rose among large households and couples with two or more children. This has led to a further increase in child poverty, which is also high by European standards. The percentage of minors living in absolute poverty exceeded one tenth of the reference population in 2015. Among the elderly the poverty rate was lower and was stable during the crisis (at around 4 per cent of the population in 2015) owing to the fact that pension income was more stable than employment income, in line with the trend in the main euro-area countries (see the box ‘Inequality during the double-dip recession’).
3 Defined as those who live in households with outlays below those needed to purchase a basket of essential goods and services; the basket’s composition varies by household size and type; its monetary value tracks changes in prices over time and may differ according to location and the size of the municipality of residence.
INEQUALITY DURING RECESSIONS
The link between income inequality and the economic cycle is not straightforward. During the two main Italian postwar economic recessions, the 1992-93 currency crisis and the prolonged recession of the last few years, the consequences for inequality differed: the Gini index grew significantly during the former but remained relatively stable during the latter (see Chapter 15, ‘Italian households’ income and wealth: a long-term view’, Annual Report for 2015, 2016).
A comparison between the economic changes recorded over the last few years in the main euro-area countries confirms that there is no systematic relationship between trends in inequality and average income. From 2007 to 2014, average equivalized disposable income at constant prices shrank in those countries that bore the brunt of the sovereign debt crisis following the global financial crisis (panel (a) of Figure A). The degree of inequality, measured by the ratio between average equivalized income in the last distribution quintile and in the first, rose above all in Spain, where the fall in average equivalized income was much lower than in Greece. In general, also taking into account the countries where average equivalized income increased, there is no stable relationship between inequality and average income (panel (b) of Figure A).
Not even the poverty risk index, which helps to define one of the objectives of the EU’s growth strategy, Europe 2020, has a clear relationship with the average equivalized income (panel (c) of Figure A).
However, the poverty risk index and inequality measures do not capture the shifts in the entire distribution of equivalized incomes. To take account of this, Eurostat also publishes measurements for the poverty risk index with a fixed threshold, given by the share of those with an equivalized income at constant prices that is less than 60 per cent of the median equivalized income in a specific reference year. Taking 2007 as the reference year, a clearer relationship emerges between average

BANCA D’ITALIA Annual Report772016
equivalized income and the extent of this condition (panel (d) of Figure A). The share of people at risk of poverty with a fixed threshold grew by nearly 30 percentage points in Greece between 2007 and 2014; in the other countries the increase in this share became progressively slower, in contrast to higher growth rates for average equivalized income.
Figure A
Average equivalized income at constant prices, inequality and risk of poverty (1)(accumulated changes between 2007 and 2014)
(a) Average equivalized disposable income (2) (b) Inequality (3)
-1.0
-0.5
0.0
0.5
1.0
1.5
-1.0
-0.5
0.0
0.5
1.0
1.5
EL ES IT PT IE NL LU FI DE FR AT BE-40
-30
-20
-10
0
10
-40
-30
-20
-10
0
10
EL ES IT PT IE NL LU FI DE FR AT BE
(c) Risk of poverty (4) (d) Risk of poverty with a fixed threshold (5)
-5
0
5
10
15
20
25
30
-5
0
5
10
15
20
25
30
EL ES IT PT IE NL LU FI DE FR AT BE-1.5
-1.0
-0.5
0.0
0.5
1.0
1.5
2.0
2.5
-1.5
-1.0
-0.5
0.0
0.5
1.0
1.5
2.0
2.5
EL ES IT PT IE NL LU FI DE FR AT BE
Source: Based on Eurostat data (Income and Living Conditions database). (1) The countries are in ascending order based on the overall change in average equivalized income at constant prices in the period 2007-14. International country codes: EL=Greece; ES=Spain; IT=Italy; PT=Portugal; IE=Ireland; NL=Netherlands; LU=Luxembourg; FI=Finland; DE=Germany; FR=France; AT=Austria; and BE=Belgium. – (2) Percentage change in average equivalized income at constant prices (national consumption deflator for households’ consumption). – (3) Change in the ratio between average equivalized income in the last and first distribution quintiles. – (4) Change in the percentage of the population with an equivalized income of less than 60 per cent of the national median equivalized income. – (5) Change in the percentage of the population with an equivalized income at constant prices lower than 60 per cent of the national median equivalized income for 2007.
The growth in the share of people at risk of poverty with a fixed threshold was not uniform among age groups (Figure B). In countries where the incidence of this condition rose significantly, the increase mostly affected those aged 18 and under and those of working age, whose equivalized incomes principally reflect their employment or that of family members. Among the older age groups, whose overall income mainly consists of retirement and pension benefits, poverty remained stable or even declined (with the significant exception of Greece, where the measures adopted in response to the prolonged sovereign debt sustainability crisis had a marked effect). In countries where the risk of poverty decreased, the fall was greater among the older age groups.

BANCA D’ITALIAAnnual Report201678
Persistently high poverty levels reflect the fact that the recovery in employment has so far largely bypassed those most at risk of social marginalization, i.e. workers with low education levels, foreigners or those under 35 years of age. In 2016 employment growth was more even (see Chapter 8, ‘The labour market’) and included categories of households that are most exposed to the risk of poverty. Labour force survey data indicate a slight drop in the percentage of individuals between 18 and 59 years of age and of minors living in jobless households4 (from 13.1 per cent to 12.8 per cent and from 10.5 per cent to 10.2 per cent, respectively).
The rise in the number of persons in difficulty during the crisis hastened the introduction of a new instrument for combating poverty. The enabling law approved on 9 March 2017 (Law 33/2017) provides for ‘inclusion income’, a universal welfare measure with eligibility determined using means testing. It targets all households in difficulty but, considering the amount of resources available (around €2 billion for 2017 and for 2018), priority will be given to households with minors or jobless adults over the age of 55. To be effective, receipt of the benefit must be conditional on accurate means testing; households must be offered adequate services to ensure greater social inclusion (in addition to cash transfers); and any incentive to remain in the programme indefinitely must be limited.5
Consumption
Spending by Italian resident households rose by 1.3 per cent in 2016 (Table 7.2), continuing the recovery under way since 2013. At the end of the year, however, it
4 Eurostat defines this as a household in which no working-age adult, excluding full-time students aged under 25 living with parents, is employed.
5 ‘Audizione preliminare sulla delega recante norme relative al contrasto della povertà, al riordino delle prestazioni e al sistema degli interventi e dei servizi sociali (collegato alla legge di stabilità 2016)’, testimony of P. Sestito, Head of the Structural Economic Analysis Directorate of the Bank of Italy, before the Chamber of Deputies, Rome, 4 April 2016.
Figure B
Risk of poverty with a fixed threshold by age group (1) (2)(per cent; accumulated changes between 2007 and 2014)
-15
-10
-5
0
5
10
15
20
25
30
35
17 and under 18-64 65 and over
-15
-10
-5
0
5
10
15
20
25
30
35
Greece Spain Italy Portugal Ireland Netherlands Luxembourg Finland Germany France Austria Belgium
Source: Based on Eurostat data (Income and Living Conditions database). (1) The countries are in ascending order based on the overall change in average equivalized income at constant prices in the period 2007-2014. – (2) The threshold used to measure poverty risk is equal to 60 per cent of the national median equivalized income for 2007.

BANCA D’ITALIA Annual Report792016
was still 4.7 per cent below the levels recorded in the spring of 2007. Durable goods purchases continued to be among the most dynamic components of expenditure: between the summer of 2013 and the end of 2016 it rose by a total of 20.1 per cent, recouping almost half of the contraction accumulated since 2007. One contribution came from the further increase in new car registrations, which rose by around 15.0 per cent on average in 2016, and continued to rise in the early months of 2017. Spending on non-durable goods is also staging a steady, though gradual, recovery. In the services sector, the pace of expenditure on hotels and restaurants is accelerating sharply, but that on other services is weaker.
Table 7.2
Households’ expenditure(volumes at chain-linked prices, unless otherwise indicated; percentage changes)
% in 2016 (volumes at
previous year prices)
2013 2014 2015 2016
Goods 47.4 -3.6 -0.3 2.1 1.8Non-durable goods 31.1 -3.0 -1.5 0.9 1.4
of which: food and non-alcoholic beverages 14.3 -2.4 0.0 0.5 1.1Semi-durable goods 8.9 -4.5 0.9 1.8 0.5
of which: clothing and footwear 6.2 -2.5 1.6 1.4 0.4Durable goods 7.5 -5.3 4.0 7.9 5.1
Services 52.6 -1.2 0.8 1.4 1.0of which: hotels and restaurants 10.1 -1.4 1.1 1.2 2.9
education 1.0 -4.3 -1.1 3.6 0.3
Total domestic expenditure 100.0 -2.4 0.3 1.7 1.4
Spending abroad by Italian residents (1) -1.6 5.4 -4.4 3.5
Spending in Italy by non-residents (1) 1.8 3.3 3.8 3.8
Total national expenditure – -2.5 0.3 1.5 1.3Memorandum item:
National consumption deflator – 1.2 0.2 0.0 0.0
Source: Istat, national accounts. (1) In 2016 spending abroad by Italian residents and that in Italy by non-residents came to 1.7 per cent and 3.6 per cent of national expenditure respectively.
According to Istat’s household budget survey for the two years 2014-15, average spending by households with at least one elderly member rose by 3.0 per cent, while that by households with at least one minor virtually stagnated, remaining more than 9 per cent below the levels of 2011; the difference probably reflects the better trends in pension income. The share of households purchasing durable goods rose in 2015 (to 57 per cent, from 55 per cent in 2014), although the nominal expenditure per household remained essentially unchanged. Socio-demographic factors being equal, the propensity to purchase durable goods reflected the availability of consumer credit repayable in instalments and improved sentiment about household balance sheets.
Consumption was driven by the rise in disposable income, favourable credit supply conditions, and the first signs of a recovery in real asset wealth. There was, however, a gradual decline in confidence indicators, which during the year were affected by the less optimistic expectations for the Italian economy and labour market (Figure 7.1), especially among the elderly. By contrast, households’ assessments of their financial situation improved across all age categories.

BANCA D’ITALIAAnnual Report201680
Figure 7.1
Consumption, real income and consumer confidence(growth rates and indices)
2010 2011 2012 2013 2014 2015 2016 2017
80
85
90
95
100
105
110
115
120
80
85
90
95
100
105
110
115
120
General index (4)
Personal confidence (5)
Consumer confidence (3)
-6
-5
-4
-3
-2
-1
0
1
2
-6
-5
-4
-3
-2
-1
0
1
2
Households’ consumption expenditure (1)
Households’ real disposable income (2)
Source: Based on Istat data.(1) Consumption expenditure of households and non-profit institutions serving households; volumes at chain-linked prices; percentage changes on the previous year. – (2) Real disposable income of households and non-profit institutions serving households, deflated using the consumption expenditure deflator for resident households. – (3) Indices, 2010=100; seasonally adjusted data; moving averages for the 3 months ending in the reference month. – (4) Obtained by calculating the balances between the percentages of replies indicating a situation that is improving or worsening in response to questions on: the general economic situation in (a) the past 12 months and (b) over the next 12 months; the respondents’ personal economic situation in (c) the past 12 months and (d) over the next 12 months; the advisability of durable goods purchases (e); expected unemployment (f); the possibility (g) and advisability (h) of saving; (i) households’ financial situation. – (5) Average of the balances between the percentages of replies to (c), (d), (e), (g), (h) and (i).
Net of the change in pension fund reserves, the household saving rate rose slightly (to 8.3 per cent from 8.0 per cent in 2015) but is still very low by historical standards; when expected losses on net financial assets due to inflation are taken into account, the level remains at around 8.0 per cent (see Table 7.1). The stabilization of the saving rate, well below even the euro-area average (Figure 7.2), could signal a normalization of Italian household consumption plans and a stronger outlook for income.
Figure 7.2
Households’ saving ratio(annual data; per cent)
6
8
10
12
14
16
6
8
10
12
14
16
'99 '00 '01 '02 '03 '04 '05 '06 '07 '08 '09 '10 '11 '12 '13 '14 '15 '16
Euro area (1) Italy (1) Italy – consumer households (2)
Sources: Eurostat and Istat.(1) Includes consumer and producer households and non-profit institutions serving households. – (2) Savings are calculated gross of amortization and depreciation and net of changes in pension fund reserves.

BANCA D’ITALIA Annual Report812016
Household wealth, the housing market and borrowing
According to our estimates, in 2016 gross household wealth rose by 0.8 per cent and was around 9.4 times disposable income (8.6 times net of liabilities). The increase reflected a greater flow of savings; real asset prices stabilized during the year, while those of financial assets declined.
Household investment and wealth in real assets and the housing market. – Based on national accounts data, in 2016 gross fixed investment at current prices by consumer households, which includes spending on house purchases and extraordinary maintenance, increased for the second year in a row (by 3.7 per cent, from 1.6 per cent in 2015).
The increase is attributable to both the rise in restructuring costs (see Chapter 6, ‘Firms’) and the sharp acceleration in the number of house sales, which were also affected by the more favourable conditions for home purchase loans. According to the Revenue Agency’s property market observatory (OMI) house sales increased by 18.9 per cent (6.5 per cent in 2015), returning to their highest levels since 2012, though they were still well below where they were prior to the 2008-09 global crisis (Figure 7.3.a). While there was an almost generalized decline in sales between 2007 and 2013, for the time being the recovery is selective and has proven stronger overall in the North and for larger homes (Figure 7.3.b). Purchases of smaller houses showed a clear increase only last year.
Figure 7.3
House prices and sales in Italy
(a) Price and number of transactions (1)(indices: 2010=100)
(b) Number of houses sold by size (2) (indices: 2010=100)
'04 '05 '06 '07 '08 '09 '10 '11 '12 '13 '14 '15 '1660
70
80
90
100
110
120
130
140
150
60
70
80
90
100
110
120
130
140
150
Small Medium-small
Medium Large
'00 '01 '02'03'04'05'06'07'08'09 '10 '11 '12 '13 '14 '15 '1660
70
80
90
100
110
120
130
140
60
70
80
90
100
110
120
130
140
Number of transactions (3)
Prices
Prices in real terms (4)
Sources: Based on data from Agenzia delle Entrate, the Bank of Italy, Istat, Consulente immobiliare.(1) Quarterly data. – (2) Annual data. Houses are categorized by size based on the number of rooms recorded in the land register. Small: up to 4 rooms; medium-small: 4 to 5.5 rooms; medium; 5.5 to 7 rooms; large: more than 7 rooms. – (3) Adjusted for seasonal and calendar effects. – (4) House prices deflated using the consumer price index.
According to Istat data, between 2012 and 2015 consumer household wealth held in real assets, consisting almost exclusively of residential property, fell by almost 6 per cent in nominal terms. Our estimates suggest that in 2016 it turned upward again slightly, thanks to the increase in the stock of homes and the first signs of a recovery in house prices.

BANCA D’ITALIAAnnual Report201682
The protracted decline in house prices came to a halt in the first half of the year and was followed by a slight increase in the second half (at an annualized rate of 0.5 per cent), the first since the end of 2011.
According to the Housing Market Survey conducted in April by the Bank of Italy with Tecnoborsa and OMI, there was a reduction in sale times and in the average discount on the initial asking price last year (Figure 7.4.a). Demand conditions, measured based on estate agents’ assessment of the flow of potential buyers, continued to be favourable. On the supply side, the difference between the number of reports by estate agents of an increase and those of a decrease in their stock of listing agreements has progressively shrunk to zero, most likely reflecting the sharp upswing in the number of house sales (Figure 7.4.b).
Figure 7.4
Residential property market
(a) Time to sale and average discount(months; percentage points)
(b) Demand, supply and number of transactions (balances; indices: Q1 2014=100)
94
100
106
112
118
124
130
136
-30
-20
-10
0
10
20
30
40
Q1 Q2 Q3 Q4 Q1 Q2 Q3 Q4 Q1 Q2 Q3 Q4 Q1
2014 2015 2016 '17
Number of potential purchasers (2)
Number di sale listings outstanding (2)
Number of sales (3)
2009 2010 2011 2012 2013 2014 2015 2016 '1710
12
14
16
18
6
7
8
9
10
Time to sale
Average discount on asking price (1)
Sources: Agenzia delle Entrate and the quarterly Italian Housing Market Survey, conducted jointly by the Bank of Italy, Tecnoborsa and Agenzia delle Entrate.(1) Right-hand scale. – (2) Balances between the percentage of responses indicating an increase and those a decrease. – (3) Adjusted for seasonal and calendar effects. Right-hand scale.
Financial wealth and investment. – Consumer and producer households’ gross financial wealth was stable compared with 2015. New investment in financial assets amounted to €33 billion, against liabilities of €13 billion (Table 7.3). The increase in purchases was mainly offset by the decline in the value of equity securities.
Over the last ten years the low growth in financial wealth has reflected moderate investment due to the reduction in flows of savings and the marked decline in securities prices during the recession. Financial wealth on a per capita basis and relative to gross disposable income fell to the average euro-area levels (respectively €69,000 and 3.7 per cent). During the same period, the decline in financial wealth was stronger for less well-off households, which were forced to draw upon their savings to compensate for the drop in income. The Survey on Household Income and Wealth shows that from 2004 to 2014, the last year in which it was conducted, the median value of the financial assets held by the poorest 20 per cent of households fell by over 40 per cent, while that of the richest 20 per cent increased by about one third. This has led to a greater concentration

BANCA D’ITALIA Annual Report832016
of financial assets in the hands of the richest families: in 2014 they held 65 per cent of all financial assets, 6 percentage points more than ten years earlier.6 The increase was recorded for households whose head is over 64 years of age; 15 per cent of the wealth was held by households with heads under 45 years of age, half that of 2004.
Table 7.3
Households’ financial assets and liabilities (1)(millions of euros and per cent)
End-of-period stocks Flows
2016 Percentage composition 2015 2016
2015 2016
ASSETS (2)
Bank deposits (3) 1,143,739 26.4 27.4 13,228 11,700Italian 1,112,452 25.7 26.7 19,786 11,858
Sight deposits 649,143 14.1 15.6 40,169 30,520Other deposits 463,309 11.6 11.1 -20,383 -18,662
Foreign 31,287 0.8 0.8 -6,558 -159
Debt securities 362,340 9.9 8.7 -111,334 -62,031Italian 273,107 7.8 6.6 -104,940 -60,043of which: issued by the public sector 131,156 3.2 3.1 -32,028 -6,208
issued by banks 136,407 4.5 3.3 -71,393 -47,154Foreign 89,233 2.2 2.1 -6,394 -1,988
Investment fund units 479,980 11.0 11.5 41,790 14,596Italian 245,675 5.7 5.9 22,503 -364Foreign 234,305 5.3 5.6 19,287 14,960
Shares and other equity 916,765 23.8 22.0 23,531 -24,698Italian 846,014 22.1 20.3 20,819 -24,370Foreign 70,751 1.7 1.7 2,713 -328
Insurance, pension fund reserves and severance pay entitlements 953,033 21.7 22.9 48,538 44,634
of which: life insurance reserves 620,892 13.8 14.9 43,859 39,357
Other assets (4) 312,144 7.1 7.5 13,592 49,005
Total assets 4,168,002 100.0 100.0 29,344 33,206
LIABILITIESShort-term debt 54,188 6.3 5.8 -109 -2,049
of which: to banks 53,104 6.2 5.7 -135 -2,153
Medium- and long-term debt 643,668 69.1 69.3 -233 10,793of which: to banks 571,173 61.4 61.5 10,195 9,755
Other liabilities (5) 230,373 24.6 24.8 875 4,433
Total liabilities 928,230 100.0 100.0 533 13,177
BALANCE 3,239,772 28,811 20,029
Source: Bank of Italy, financial accounts.(1) Consumer households, producer households and non-profit institutions serving households. Rounding may cause discrepancies in totals. – (2) Individually managed portfolios are not shown; their assets are included under the individual types of investment. – (3) Includes those of Cassa Depositi e Prestiti. – (4) Accounts receivable, BancoPosta current accounts, banknotes, coins and some minor items. – (5) Accounts payable, severance pay and pension provisions, and some minor items.
6 The analysis is confined to households with financial assets, divided into deciles of total net wealth. The results remain basically unchanged even when households with no financial assets are considered. From 2004 to 2014 the concentration of total net wealth did not change significantly from that observed for financial assets, since the distribution of real assets remained virtually the same (see ‘Survey on Household Income and Wealth - 2014’, in Supplements to the Statistical Bulletin, 64, 2015).

BANCA D’ITALIAAnnual Report201684
In 2016 households continued to invest in liquid instruments and asset management products in the face of sustained disposals of equity securities and bank bonds. The ratio of the latter to total financial assets, equal to 3.3 per cent, declined sharply owing in part to the reduction in products offered by banks. Divestment of government securities slowed; their share of total financial assets remains basically stable at 3.1 per cent, after falling by almost 1 percentage point in 2015 following the launch of the Eurosystem purchase programme. Cash and deposits accounted for 31.9 per cent of total assets, while the proportion of investment and pension funds and insurance policies rose to 34.4 per cent, a relatively high level by past standards (in 2004 they came to 24.7 and 27.8 per cent respectively), but lower than the euro-area average (33.4 and 43.0 per cent). Portfolio diversification has been apparent in the increase in foreign investments, both in units of foreign investment funds and as a result of the investment policies of Italian asset managers (see the box ‘The trend in the Bank of Italy’s balance in TARGET2’ in Chapter 10). It is estimated that foreign assets rose to 22 per cent of the total, up from 17 per cent in 2013.
Low financial wealth could constrain the diversification of investments. The most recent euro-area Household Finance and Consumption Survey for 2014 indicates that a higher level of financial wealth is associated with a larger number of instruments utilized and a higher share invested in asset management products (Figure 7.5). Italian households in the top quartile invest 27 per cent of their assets in investment funds, insurance policies and asset management products, while the assets of households in the two lowest quartiles are almost entirely held in deposits.
The decision to invest and save in complex financial instruments and services requires that investors be capable of assessing opportunities and risks and be aware of how markets work and regulatory developments; the available surveys suggest that this is not always the case (see the box ‘The survey on adults’ financial literacy’).
Figure 7.5
Composition of the financial portfolio of Italian households by financial wealth quartiles
(per cent)
0
10
20
30
40
50
60
70
80
90
100
0
10
20
30
40
50
60
70
80
90
100
1 2 3 4
Financial wealth quartile
Pension funds
Insurance policies
Shares
Individually managed portfolios
Investment funds
Bonds and government securities
Deposits
Source: Household Finance and Consumption Survey; data for 2014.
THE SURVEY ON ADULTS’ FINANCIAL LITERACY
Financial competencies are a combination of knowledge, attitudes and behaviour that enable people to make sound economic and financial decisions. As part of an initiative promoted at G20 level, at the beginning of 2017 the Bank of Italy conducted a survey on adults’ financial skills. The data collected have enriched the limited information available and helped to implement the National Strategy for

BANCA D’ITALIA Annual Report852016
Financial Education that Italy recently decided to adopt.1 The survey was conducted using the methodology developed by the OECD International Network on Financial Education (INFE), which measures financial competency along three dimensions: knowledge of basic financial concepts, the adoption of adequate financial behaviour (such as covering living expenses without incurring debts) and the attitude toward long-term financial decisions.
Compared with OECD countries for which comparable data are available,2 the level of knowledge of financial concepts and of appropriate behaviour in Italy is low; long-term attitudes seem instead to be in line with other developed economies. The indicator combining these three dimensions puts Italy among the least financially literate countries (Figure A). The survey finds that, as in other countries, the level of financial literacy is lower among the elderly and those with a low level of education. Part of the gap shown by international comparison is attributable to the higher number of people in Italy with a low level of education.3 There are also significant gender gaps, above all for the knowledge indicator.
Figure A
Adults’ financial competency according to OECD methodology(average scores)
4.9 5.2 5.2 4.9 5.0 5.4 4.9 4.9 4.8 4.9 4.9 5.3 5.14.2 4.4 4.6 4.7 4.4
3.5
6.7 6.3 5.8 6.2 5.75.7 6.2 6.0 5.9 5.4 5.2 4.9 5.3
5.6 5.0 4.8 4.3 4.44.4
3.2 3.33.6 3.5
3.7 3.2 3.2 3.3 3.43.4 3.3 3.2 3.0
3.33.1 3.1 3.5
2.83.1
0
5
10
15
0
5
10
15
France Finland Norway Canada NewZealand
South Belgium Austria Portugal OECD Korea average
Netherlands Estonia Latvia UnitedKingdom
Czech Republic
Turkey Hungary Poland Italy
Long-term orientation Behaviour Knowledge
Source: For Italy, based on data from the Survey on Italians’ financial literacy and competency. For other countries and the OECD average (which does not include Italy), the data are from OECD, OECD/INFE International Survey of Adult Financial Literacy Competencies, 2016. The results refer to the adult population aged 18-79.
According to the survey’s results, about two thirds of Italians do not achieve a sufficiently high score on knowledge, compared with an average of about one third in other OECD countries. In Italy there is less awareness of the advantages of a diversified portfolio and of the concepts of simple and compound interest. The low level of the financial behaviour indicator reflects above all the lack of financial
1 Article 24-bis of Legislative Decree 237/2016, converted by Law 15/2017.2 The comparison with OECD countries is made based on OECD, OECD/INFE International Survey of Adult
Financial Literacy Competencies, 2016. The OECD countries considered are, in descending order of financial competency: France, Finland, Norway, Canada, New Zealand, South Korea, Belgium, Austria, Portugal, the Netherlands, Estonia, Latvia, the United Kingdom, the Czech Republic, Turkey, Hungary and Poland.
3 A. di Salvatore, F. Franceschi, A. Neri and F. Zanichelli, ‘Financial literacy and inclusion of the Italian adult population’, Banca d’Italia, Questioni di Economia e Finanza (Occasional Papers), forthcoming.

BANCA D’ITALIAAnnual Report201686
assets in Italian households’ portfolios and a lesser ability to manage resources by means of a family budget. The indicator is, however, positively affected by their lower indebtedness and greater capacity to use revenues to cover expenses.
Italians seem to be aware of the limits to their knowledge: more than half rate their level of financial education as below average, compared with an average of about 20 per cent in OECD countries. Women are particularly careful when self-assessing their level of financial education. All other things being equal, those who give their level of competency a low rating are less likely to hold investment products, resort to borrowing or subscribe to supplementary pension schemes (panel (a) of Figure B).
Figure B
Financial competency self-assessment(per cent)
(a) Financial behaviour (b) Probability of having problems
0
2
4
6
8
10
12
14
16
0
2
4
6
8
10
12
14
16
Bad investment (4)
Phishing
(5)
Identity theft(6)
Overestimation Correct self-assessment
0
5
10
15
20
25
30
35
40
0
5
10
15
20
25
30
35
40
Shares,bonds, mutual
funds (1)
Borrowing (2)
Pension schemes(3)
Self-assess. below average Self-assess. average
Self-assess. above average
Source: Based on data from the Survey on Italians’ financial literacy and competency. (1) Respondents that have purchased shares, bonds or mutual funds in the last two years. – (2) Respondents that have subscribed to some form of debt, such as mortgages or loans secured by pledge of one-fifth of salary. – (3) Respondents that have subscribed to individual pension schemes. – (4) Respondents declaring they accepted suggestions to invest in something that proved to be worthless. – (5) Respondents declaring they gave out financial and banking details in response to an email or a phone call that proved to be dishonest. – (6) Respondents declaring unauthorized use of their debit or credit cards.
However, the survey shows that 22 per cent of those interviewed believe their financial literacy to be equal to or above the average, even though, based on the answers given, they are below the knowledge indicator’s sample average. In Canada and the United Kingdom, countries for which individual data are available, the share of respondents that overestimate their financial education is 29 and 43 per cent respectively.
The tendency to overestimate personal knowledge is prevalent in men, the self-employed, those resident in Southern Italy, and those with a medium-high level of education. Those who overestimate their knowledge are also at risk of accepting bad advice on investments, of imprudently supplying banking details in response to an email or during telephone calls and of unauthorized use of their payment cards (panel (b) of Figure B).
The Bank of Italy has long been committed to increasing the level of Italians’ financial literacy, with a programme for schools that is now in its ninth edition, and

BANCA D’ITALIA Annual Report872016
with educational and awareness-raising schemes for adults. The National Strategy will promote a comprehensive and coordinated plan to reach a wider audience, also involving the mass media.
Borrowing. – The expansion in bank lending to consumer and producer households, which began in the second half of 2015, continued in 2016 and the early months of this year (2.4 per cent year-on-year in March). The increase was similar to the average for the euro area. Household debt as a percentage of disposable income remains low by international standards (see Financial Stability Report, 1, 2017).
Mortgage lending to consumer households rose by 2.5 per cent in the twelve months ending in March (0.4 per cent in 2015; Table 7.4) thanks to the very positive trend in new mortgage lending (16.1 per cent in the first three months of 2017). In 2016 the increase extended to customers under 35 years of age, a cohort that had seen their income and wealth drop considerably during the crisis and had suffered from the stricter lending criteria applied by banks.
The growth in lending for home purchases was buoyed by the recovery of disposable income, low interest rates and the favourable outlook for the residential real estate market. Supply conditions gradually became more relaxed, especially as a result of the reduction in the interest spreads on loans, in part favoured by lower customer risk (see Financial Stability Report, 1, 2017).
The annual percentage rate of charge (APRC), including ancillary costs, on average new mortgage lending hit a low at the end of 2016 and then rose by 0.2 percentage points to 2.5 per cent in March of this year. One of the main contributory factors was the drop in the cost of fixed-rate mortgages, equal to around 0.5 percentage points, for
Table 7.4
Lending to consumer households (1)(end-of-period data; millions of euros and per cent)
12-month percentage changes Stocks at March 2017
(2)December 2014
December 2015
June 2016 December 2016
March 2017
Loans for house purchase
Banks -0.6 0.4 1.3 2.0 2.5 353,515
Consumer credit
Banks -0.7 5.2 7.8 8.6 9.2 90,330
Financial companies 0.3 -2.0 0.2 1.1 1.6 32,671
Total banks and financial companies -0.2 2.1 5.2 6.4 7.0 123,001
Other loans (3)
Banks 1.5 1.4 0.4 -0.7 -0.6 106,570
Total loans
Total banks and financial companies -0.1 1.0 1.9 2.4 2.8 583,086
Source: Supervisory reports.(1) Loans include repos and bad debts. For March 2017, provisional data. – (2) Including securitized loans. – (3) Mainly current account overdrafts and loans other than those for the purchase, construction or restructuring of residential properties.

BANCA D’ITALIAAnnual Report201688
which the reduction in spreads was greatest. This benefited both new borrowers and households that already held a mortgage and could renegotiate more favourable terms and conditions on existing loans: in the first three months of 2017 the ratio of fixed-rate loans to the total reached the highest level reported since the survey began in 2003 (66.0 per cent).
The improvement in supply conditions for home mortgage loans has also been reflected in a modest increase in the loan-to-value ratio; according to the findings of the regional bank lending survey conducted by the Bank of Italy’s branches, the average loan-to-value ratio rose to 61.7 per cent in 2016, from a low of 58.3 per cent during the 2013 crisis. The percentage of mortgage loans with a loan-to-value ratio above 80 per cent rose to 7.8 per cent. The estate agents interviewed for the survey reported that it had become easier to obtain mortgage loans and that there was an increase in the percentage of new home purchases financed by mortgages (see ‘Italian Housing Market Survey’, Banca d’Italia, Statistics series, 22 May 2017, available on the Bank of Italy’s website).
In the twelve months ending in March, consumer credit rose by 7.0 per cent (Table 7.4), driven mainly by the increase in spending on durable goods. The increase in lending was also spurred by the reduction in the APRC on new loans, which in March had fallen to 8.1 per cent; the gap with respect to average interest rates applied in the euro area remained large (almost 2 percentage points). Relative to disposable income, the size of the consumer credit market is still comparable to that of the other main euro-area countries (10.4 per cent as against the 9.8 per cent euro-area average).
In recent years banks have more carefully selected their customers, whose risk has diminished considerably. This was most pronounced for households whose head is under 35 years of age: from 2008 to 2014 the share of these households with consumer debt fell by 10 percentage points, to 14.0 per cent, double the average decline observed.
Consumer loans secured by a pledge of one fifth of a salary or pension (‘cessione del quinto’ loans), which account for around 16 per cent of total consumer loans, fell sharply. The granting of these loans is characterized by a lack of transparency of contract terms and conditions and by a lack of regard on the part of lenders for their customers’ actual financial needs: 15,297 complaints regarding this category of loans, around 70 per cent of the total complaints, were filed with the Banking and Financial Ombudsman in 2016 (see Report on Operations and Activities of the Bank of Italy for 2016).

BANCA D’ITALIA Annual Report892016
8. THE LABOUR MARKET
In 2016 the rise in employment that began in the second half of 2014 continued. Labour demand expanded to include the categories that had been worst hit by the preceding long recession, i.e. the young, the less-educated, and workers from southern Italy. In the private sector the number of payroll employees returned to pre-crisis levels, benefiting from the considerable social security contribution relief for new permanent hirings. The number of permanent positions increased further, although at a slower pace, following the phasing out of the incentives. In the first quarter of 2017, the overall trend in employment remained positive mainly thanks to the fixed-term payroll component.
There are still ample margins of spare labour capacity however. Despite the growth of the last two years, the average number of hours worked per employee is still about 5 percentage points lower than before the crisis. Partly due to a large increase in labour supply, the unemployment rate fell by only 0.2 percentage points to 11.7 per cent, almost twice the 2007 figure.
The new increase in the participation rate reflects both the raising of the population’s average level of education and the increased participation of women - already under way in the period prior to the crisis. Other contributory factors were the recent pension reform and, in the last year, thanks to the stronger employment outlook, the considerable reduction in the number of those who report they are discouraged and no longer looking for work. The participation rate is still, nevertheless, more than 8 points below that of the euro area.
The growth in hourly contractual earnings weakened again, in line with the slowdown in prices under way since the end of 2013. Some important labour agreements renewed in 2016 brought significant changes to the contractual arrangements used previously.
Employment and number of hours worked
In 2016 the number of the employed increased by an average of 1.3 per cent (300,000 people; Table 8.1), the highest rate of growth in the last ten years. While self-employment declined for the sixth year running, employment growth was driven by payroll employment, which returned to the levels recorded before the start of the crisis in 2008.
The growth in the number of persons employed was more marked at the start of 2016 as a result of the sharp increase in permanent hirings at the end of 2015, which benefited from a 3-year exemption from almost all social contributions (Figure 8.1).

Annual Report201690
BANCA D’ITALIA
Despite the reduction of social contribution relief to 40 per cent for a period of two years, the balance between new permanent job positions and temporary positions remained positive throughout 2016, as a result of firms’ choosing to make their fixed-term workers permanent (Figure 8.2). In the first quarter of 2017, with the phasing out of the incentives (renewed in full only for the youngest workers and those working in the South), payroll employment continued to expand, especially as regards fixed-term positions.
In 2016 apprenticeship contracts only accounted for just over 10 per cent of hirings in the under-30 age group, although the government’s intention had been to make this type of contract the main route for young people to enter the working world (see Chapter 10, ‘The labour market’, Annual Report for 2013, 2014). Since 2004 the number of apprenticeships has halved, reflecting legal uncertainties, difficulties in creating individual plans for training outside the workplace and, in 2015-16, firms chose permanent rather than apprenticeship contracts in order to take advantage of the tax incentives.
In March 2017 the government abolished voucher payments for workers, postponing the review of the rules for ancillary employment to a future comprehensive reform that should preserve the scope for flexibility while preventing any improper use.
Table 8.1
Labour input in the Italian economy by sector (1)(annual percentage changes)
Persons in employment Hours worked
2007-14 2014-15 2015-16 2007-14 2014-15 2015-16
Total -0.5 0.7 1.3 -1.4 1.0 1.7
Agriculture, forestry, fisheries -1.4 1.8 1.3 -2.0 1.8 1.6
Industry excl. construction -2.3 -0.7 0.7 -3.3 0.5 2.1of which: manufacturing -2.4 -0.8 0.8 -3.5 0.5 2.1
Construction -3.1 -1.5 -3.2 -4.3 0.5 -2.5
Services 0.2 1.1 1.8 -0.4 1.1 2.0of which: primarily public (1) -0.2 0.5 1.2 -0.3 0.4 1.4
Employees -0.4 1.1 1.9 -1.2 1.8 2.4
Self-employed -0.9 -0.4 -0.5 -1.7 -0.8 0.2
Source: Based on Istat, national accounts.(1) Defence, compulsory social insurance, education, health and welfare.
Figure 8.1
Net change in job positions (1)(balance of quarterly cumulative values)
-400,000
-200,000
0
200,000
400,000
600,000
800,000
1,000,000
-400,000
-200,000
0
200,000
400,000
600,000
800,000
1,000,000
2014 2015 2016 '17
Permanent positions (2)
Fixed-term positions (3)
Source: Based on data from INPS’ Osservatorio sul precariato.(1) In the non-farm private sector. – (2) The net change in permanent contracts, calculated as the difference between new contracts (including conversions of pre-existing ones) and separations. – (3) Net change in fixed-term contracts, calculated and the difference between new contracts and separations, the latter also include temporary job contracts upgraded to permanent ones.

BANCA D’ITALIA Annual Report912016
Despite the expansion of recent years, already curtailed last October by a number of legislative measures specifying how the vouchers could be used, in 2016 only 0.3 per cent of hours worked was paid by voucher.
The decline in quasi-employee positions, whose use was further restricted by Legislative Decrees 22/2015 and 23/2015 (implementing the Jobs Act); the number of collaboration contracts starting in 2016 diminished by more than 14 per cent compared with 2015. Draft Law 2233-B (referred to as the Jobs Act for self-employment), recently approved by parliament, gives more protection to the self-employed in terms of disability, health and maternity rights, while reducing the tax burden at the same time.
Employment recovered in both manufacturing and private services but not in the construction sector. Growth was recorded for all age groups and educational levels; for workers whose highest qualification was a secondary school diploma, the last two years saw a turnaround from the sharp deterioration of job prospects since 2008. Compared with the pre-crisis period, the rate of growth of the employment of foreign workers fell sharply, in conjunction with the slowing of migration flows as a result of the weak cyclical situation.
In the South the number of persons employed, after falling by more than 9 percentage points between 2007 and 2014, returned to growth, rising more quickly than in the rest of the country (Figure 8.3). Compared with 2007, employment has fully recovered in the North and Centre, but is still almost 6 percentage points lower in the South (see the box ‘Southern Italy’s economy after the recession’ in Chapter 5).
The number of hours worked per employee also started to increase again, more noticeably in the manufacturing sector than in private services, thanks to reduced recourse to wage supplementation.
Labour intensity, measured in terms of hours per capita, was
Figure 8.2
Changes in permanent job positions (1)(quarterly data)
2014
New job contracts Conversions Separations
2015 2016 '170
200,000
400,000
600,000
800,000
1,000,000
0
200,000
400,000
600,000
800,000
1,000,000
Source: Based on data from INPS’ Osservatorio sul precariato.(1) In the private sector, excluding agricultural workers and domestic workers.
Figure 8.3
Persons employed(Q1 2007=100; seasonally adjusted data)
90
92
94
96
98
100
102
104
90
92
94
96
98
100
102
104
'07 '08 '09 '10 '11 '12 '13 '14 '15 '16
Italy Centre and North South
Source: Based on data from Istat’s labour force survey

Annual Report201692
BANCA D’ITALIA
however still 5 percentage points lower than in 2007 (Figure 8.4). This decline, observed in the other major euro-area countries as well – but to a lesser extent – was coupled with an increased reliance on part-time positions. The ratio of part-time to total employment rose by almost 5 percentage points to 18.8 per cent between 2007 and 2016, compared with growth of slightly more than 1 percentage point in the previous ten years. This acceleration was mainly due to weak demand for labour: in 2016 almost two thirds of part-time workers would have preferred a full-time job, while before the crisis less than half expressed this preference. The reduction in working hours held down total wages and contributed to the higher share of low-paid employees.1 The trend was more marked among the smallest firms, in sectors with lower productivity, and among workers employed in less qualified professions.
Unemployment and labour supply
Despite the sustained growth in the number of persons employed, the number of jobseekers fell by just 20,000 in 2016 as a result of the simultaneous increase in participation in the labour market. The unemployment rate fell by just 0.2 percentage points to 11.7 per cent (Table 8.2), remaining at historically high levels. This is also the case for youth unemployment which, although it has fallen significantly in the last two years (to 37.8 per cent), is still about double that prior to the crisis.
In 2016, the participation rate rose by nearly 1 percentage point to 64.9 per cent, the highest since the start of the 1977 time series. Confirming a long-term trend, increased participation reflected changes in demographics, but also, as a result of the cyclical recovery of 2016, a reduction in the number of those who report they are not looking for a job because they do not expect to find one (referred to as discouraged workers).
In the last decade the participation rate has increased by more than 2 percentage points, almost entirely due to the greater relative share of some socio-demographic groups with higher labour market participation rates. In all the age groups, including the largest (45-54 years), the share of those with higher education qualifications has risen. A smaller but not insignificant contribution comes from the higher level of female
1 F. D’Amuri, ‘I lavoratori a bassa retribuzione in Italia: evidenze descrittive e indicazioni di policy’, in C. Dell’Aringa, C. Lucifora and T. Treu (eds.), Salari, produttività, disuguaglianze. Verso un nuovo modello contrattuale?, AREL-il Mulino, forthcoming.
Figure 8.4
Hours worked per person(Q1 2007=100; seasonally adjusted data)
'13 '14 '16'07 '09'08 '11'10 '12 '1590
92
94
96
98
100
102
90
92
94
96
98
100
102
Italy: IndustryEuro area: non-farm private sector Italy: non-farm private sector Italy: private services
Sources: Based on Eurostat, national accounts and, for Italy, Istat, national accounts.

BANCA D’ITALIA Annual Report932016
participation in the labour market and from the growth in the number of immigrants, particularly marked in the years leading up to the 2008 crisis.2
In recent years, the pension reforms have supported labour supply: the higher participation rate amongst 55-64 year-olds (from 39.3 per cent in 2011 to 53.4 per cent in 2016, but still more than 6 points lower than the euro-area average) is largely due to the lengthening of working life, especially for women3 (see the box ‘The lengthening of working life and the labour market’).
2 M. De Philippis, ‘The dynamics of the Italian labour force participation rate: determinants and implications for the employment and unemployment rate’, Banca d’Italia, Questioni di Economia e Finanza (Occasional Papers), forthcoming.
3 F. Carta and M. De Philippis, ‘The life-cycle labour supply responses to longer working lives’, Banca d’Italia, Temi di Discussione (Working Papers), forthcoming.
The Italian population has aged rapidly in recent decades as a result of greater life expectancy and the low birth rate. The ratio of those aged 65-plus to those of working age (15-64 years) increased from 22 to 34 per cent between 1990 and 2016. Istat’s most recent projections suggest that it will exceed 60 per cent in 2050. Faced with these developments, various measures have been taken over time to ensure the sustainability of pension expenditure by tightening the age and contribution requirements. The most important of the recent reforms was the overhaul of the social security system under Law 214/2011 – the Fornero Reform (see Chapter 8, ‘The labour market’, Annual Report for 2015, 2016) which, according to the projections of the State General Accounting Department, will reduce the weight of pension expenditure as a proportion of GDP by an average of 1 per cent over the twenty years following its introduction.
In the long term, raising pension requirements by extending labour market participation tends to expand GDP. In the short term, increasing the retirement age
THE LENGTHENING OF WORKING LIFE AND THE LABOUR MARKET
Table 8.2
Participation, employment and unemployment rates in 2016(per cent)
Ages 15-24 Ages 25-54 Ages 55-64 Total (1)
Rate (2)
Change 2015-16
(3)
Rate (2)
Change 2015-16
(3)
Rate (2)
Change 2015-16
(3)
Rate (2)
Change 2015-16
(3)
Participation rate 26.6 0.4 77.5 0.7 53.4 2.3 64.9 0.9Men 30.2 -0.2 88.2 0.5 65.9 2.6 74.8 0.7Women 22.8 1.1 66.8 0.9 41.7 2.1 55.2 1.1
Employment rate 16.6 0.9 68.8 0.7 50.3 2.1 57.2 0.9Men 19.2 0.6 79.3 0.7 61.7 2.4 66.5 0.9Women 13.7 1.3 58.5 0.6 39.7 1.8 48.1 0.9
Unemployment rate 37.8 -2.6 11.2 -0.1 5.7 0.2 11.7 -0.2Men 36.5 -2.3 10.1 -0.3 6.4 0.0 10.9 -0.4Women 39.6 -3.0 12.5 0.3 4.8 0.5 12.8 0.1
Source: Based on data from Istat’s Rilevazione sulle forze di lavoro; The total refers to the all age groups between 15 and 64 years for participation and employment rates, and to the group 15 and over for unemployment rates. – (2) Per cent. – (3) Percentage points difference.

Annual Report201694
BANCA D’ITALIA
could adversely affect the employment prospects of younger workers if they carry out tasks similar to those of older workers; the effect can, however, be positive if they perform different and complementary duties.
Our analyses show1 that there is no evidence of a negative correlation, even in the short term, between older people working longer and younger people being employed - rather the two phenomena appear to be complementary. Using data from Istat’s labour force surveys covering the period 2004-16, empirical analysis shows that by controlling for the cyclical conditions at macro-area level and for the average characteristics of each province over the period, the changes in the provincial employment rates of the older workers (55-69 years) and of the younger workers (15-34 years) do not in fact show a negative correlation, but rather a slightly positive one (see panel (a) of the figure).2
Although associated with an increase in aggregate youth employment, the lengthening of older people’s working lives may have redirected some young people to different sectors or firms within the same province. This hypothesis was tested using data on a representative sample of firms with at least 20 employees taken from the INPS database for the period 2008-15 in order to assess whether the longer period at work for workers aged 55-plus within their firm, as a result of the new
1 F. Carta, F. D’Amuri and T. M. von Wachter, ‘Ageing, pension reform and firm’s dynamics’, Banca d’Italia, Questioni di Economia e Finanza (Occasional Papers), forthcoming.
2 The results are in line with those of previous analyses for the euro area (see P. Tommasino and R. Zizza, The lump of labour fallacy: a reassessment for the euro area, in ‘Comparisons and contrasts of the impact of the crisis on euro area labour markets’, European Central Bank, Occasional Paper Series, 159, 2015).
Correlations between the employment dynamics of the different age groups
(a) Changes in employment rates by age at provincial level (1)
(percentage points)
(b) Balance between new hires and terminations by age at firm level (2)
(percentage points)
-0.3
-0.2
-0.1
0.0
0.1
0.2
0.3
0.4
-0.3
-0.2
-0.1
0.0
0.1
0.2
0.3
0.4
-0.3 -0.2 -0.1 0.0 0.1 0.255 and over
Interpolation
-0.15
-0.10
-0.05
0.00
0.05
0.10
0.15
-0.15
-0.10
-0.05
0.00
0.05
0.10
0.15
-0.10 -0.05 0.00 0.05 0.10 0.15
15
-34
yea
rs
55-69 years
Single observations
15
-34
yea
rsSources: For panel (a) - Bank of Italy calculations based on Istat’s labour force survey; for panel (b) - Bank of Italy calculations based on INPS data and the Bank’s ‘Survey of Industrial and Service Firms’.(1) 2004-2016. Annual change in employment rates for workers aged 55-69 years (x-axis) and 15-34 years (y-axis) in 103 Italian provinces. The linear interpolation is estimated by a linear regression with fixed effects by province and macro-area/year. - (2) 2008-2015. Annual difference between hirings and separations of workers aged 55 and over (x-axis) and 15-34 years (y-axis) expressed as a percentage of the firm’s total employment in the previous year. Linear interpolation estimated using the share of workers who meet the retirement requirements as a means of calculating the net employment variation of workers aged 55 and over. It includes controls for sector/year and size of the firm in the previous year.

BANCA D’ITALIA Annual Report952016
retirement rules, had changed these firms’ policies on hiring, separations and salaries of workers belonging to other age groups.
The increase in older workers was matched by an increase in the number of younger ones, supporting the assumption of complementarity between the two age groups (see panel (b) of the figure). This is the case when taking into account all the different retirement policy changes over the period and also when limiting the analysis to the effects of only the Fornero reform which, for the sample of firms analysed, in the short term led to an increase in employment of 0.4 percentage points for those aged 55-plus and of about 0.1 percentage points for younger people. Lastly there is evidence that the increase in the labour supply of older people has led to a slight reduction in their wages.
Despite this acceleration, Italy’s participation rate is still well below those recorded in the leading European economies (78.0 per cent in Germany, 71.4 per cent in France and 74.2 per cent in Spain).
The supply of labour from the youngest age group was concentrated among those who are not following a course of study, although participation in education continued to rise. This trend, together with the rise in employment, helped to reduce by 1.3 percentage points the share of 15 to 29 year-olds who are not in education, employment or training (NEETs), which stood at 24.3 per cent in 2016.
Collective bargaining and industrial relations
Last year growth of contractual wages in the private sector weakened further, standing at 0.8 per cent, 0.3 percentage points above total wage growth (see Chapter 9, ‘Prices, costs and competitiveness’). In 2016 a wage freeze affected more than 40 per cent of non-agricultural private sector employees. It also influenced both the considerable delay in the conclusion of many important contracts (by the end of the year, about 30 per cent of workers were still waiting for their contracts to be renewed), and the lack of pay rises at the start of some of the renewed contracts.
Against this background of increased uncertainty about the outlook for prices, many of the agreements signed between the last quarter of 2015 and the first quarter of 2016 changed some aspects of the previous contractual arrangements, weakening the links to inflation expectations, which in contracts signed between 2012 and 2013 were higher than was actually the case later on (see Chapter 8, ‘The labour market’ Annual Report for 2015, 2016). Instead of this link, some agreements include explicit automatic indexing mechanisms, which adjust for actual inflation; others have postponed the determination of these increases to future negotiations between the parties (see the box ‘Current trends in labour relations’).
The current arrangements for bargaining are, as far as the basic elements are concerned, those established under the 1993 Protocol and the 2009 Interconfederal Agreement. A predominant role is played by the national collective labour agreement
CURRENT TRENDS IN INDUSTRIAL RELATIONS

Annual Report201696
BANCA D’ITALIA
(CCNL) which, as a rule, is valid for three years and sets the minimum wages in relation to the rate of inflation expected at the time of renewal.1 Decentralized bargaining (at company or territorial level) is subordinated to agreements made at national level. In general, it can only make changes to labour organization as delegated by the CCNL and add pay clauses that do not waive from any of the provisions of the national agreement. Given the limited use of company agreements (by only 20 per cent of companies with at least 20 employees in 2016),2 pay levels and increases are largely dictated by national bargaining.3
In recent years some problems have emerged with this type of setting. Large discrepancies between realized inflation and that calculated for CCNL renewals had unforeseen consequences for real wage growth: initially real wages fell by 2.3 per cent in 2011-12 when inflation was higher than expected, then pay rose by over 2 per cent in 2013-15, when price growth was very weak (0.5 per cent per year on average) and below the level written into the agreements (see Chapter 9, ‘Prices, costs and competitiveness’, Annual Report for 2015, 2016). Because decentralized bargaining is subordinated to the national agreement, there has been less space to negotiate forms of pay and organizational flexibility in the companies and geographical areas worst hit by the recession.
Given the deadlock in the negotiations between the leading trade unions and employers’ federations concerning the comprehensive revision of the structure of labour relations, some recently renewed agreements introduced provisions that are significantly different from those contained in the agreement of 2009. In many cases agreements had been renewed for a period of over three years, envisaging a wage freeze in 2016 and very low nominal growth until the end of 2019. At the same time, in the chemical and textile sectors, more restrictive clauses were introduced to recover, annually, any discrepancies between expected and realized inflation rates; in the metal and engineering sector and in the wood industry, automatic indexing of pay increments to the previous year’s inflation rate was introduced (see the box ‘Private sector contract renewals in 2016’, Economic Bulletin, 1, 2017). In some sectors (trade and crafts), new framework agreements anticipated abandoning any pegging of pay increases to the forecast HICP, leaving greater freedom to adjust them according to the sector’s development prospects.
Besides the changes introduced in the agreements signed by the leading organizations, it has become increasingly common in many sectors for national labour agreements to be stipulated between more recently formed trade unions and employers’ federations. This has further fragmented the process of national bargaining, leading to a noticeable increase in the number of national agreements which, according to the database of Italy’s National Council of Economy and Labour (CNEL), has risen from 398 in 2008 to 809 in 2017. Recent analyses4 based on
1 Harmonized index of consumer prices (HICP) not including imported energy goods.2 Calculations based on the Bank of Italy’s ‘Survey of industrial and service firms’.3 In 2016 the proportion of minimum wages set by the national agreements out of total wages, as reported in national
accounts data, was 88 per cent in the private non-farm sector. 4 F. D’Amuri and R. Nizzi, ‘I recenti sviluppi delle relazioni industriali in Italia’, Banca d’Italia, Questioni di
Economia e Finanza (Occasional Papers), forthcoming.

BANCA D’ITALIA Annual Report972016
administrative data show that in 2015 two per cent of employees in the non-farm private sector were covered by an agreement signed by smaller organizations, often with pay rates lower - by up to 20 per cent - than those provided by the corresponding collective agreement contracted by the most representative organizations. The downward pressure exerted by these agreements has led the larger unions to subdue wage growth in order to discourage firms from adopting the lesser agreements. As regards trade, which is the sector most affected by the phenomenon, in 2016 the leading organizations agreed to suspend the previously planned wage increases.
The role of decentralized bargaining remained secondary and subordinate to the provisions decided at national level, although several measures taken over the years, while gradually becoming more generous, sought to encourage local agreements by cutting the tax wedge on wage components contracted at the local level. Giving decentralized bargaining a greater role in setting wages and in labour organization would allow for a better alignment of wage growth and increases in productivity, relaxing some of the rigidity in national bargaining, especially in terms of the duration of agreements and of the automatic indexing mechanisms, which risk making inflation more persistent.
The 2017 Budget Law renewed the tax relief and productivity bonuses paid under company or national contracts, with greater generosity and scope of application. In the absence of any measures allowing company-level agreements to prevail over the provisions of the national contract, the use of decentralized negotiations is still limited. In 2016 only about 20 per cent of firms with more than 20 employees had signed a supplementary company agreement; this is the same percentage as in 2015, when the tax incentives did not apply.

BANCA D’ITALIAAnnual Report201698
9. PRICES, COSTS AND COMPETITIVENESS
Average annual inflation was slightly negative in Italy in 2016. Deflationary pressures coming from abroad were accompanied by persistently moderate domestic inflation, which was due in part to sluggish wage growth. Wage developments felt the curbing effects of the still high level of unemployment and of low inflation expectations, which were progressively incorporated into the new national collective bargaining agreements.
Although core inflation remains weak, prices began to rise again in the autumn, and in the early months of 2017 inflation reached its highest levels in four years, chiefly reflecting the rise in oil prices.
Italian firms’ price competitiveness, measured on the basis of several price and cost indicators, has improved appreciably in recent years. In 2016 it remained stable with respect to the other euro-area countries but diminished slightly vis-à-vis non-euro-area countries, owing to the appreciation of the euro observed at the beginning of the year.
Consumer prices
In 2016 average inflation, measured by the change in the harmonized index of consumer prices (HICP), was slightly negative (-0.1 per cent, down from 0.1 per cent in 2015; see Table 9.1) for the first time since the time series’ inception in 1987. Core inflation, measured on the basis of the HICP excluding food and energy products, also diminished on average for
Table 9.1
Prices indices
Percentage changes on previous year
Percentage weights
2015 2016 2016
Harmonized index of consumer prices (HICP) 0.1 -0.1 100.0
Unprocessed food 1.9 0.5 9.2
Processed food 0.9 0.4 11.9
Energy products -6.8 -5.5 9.6
Non-food and non-energy products 0.7 0.5 25.8
Services 0.6 0.6 43.5
Regulated goods and services -0.3 -1.4 11.1
Overall index excluding food and energy 0.7 0.5 69.4
GDP deflator 0.7 0.8 100.0
Index of producer prices of industrial goods sold on the domestic market -3.4 -2.2 100.0
Source: Based on Istat data.

BANCA D’ITALIA Annual Report992016
the year, from 0.7 per cent in 2015 to 0.5 per cent in 2016.
The decline in prices, steepest in the spring, subsequently eased; twelve-month inflation turned positive in the final months of the year, rising to 0.5 per cent in December. In 2017 the HICP accelerated, reflecting the rise in oil prices that followed the production cutbacks decided by the main producer countries. In April consumer price inflation was equal to 2.0 per cent year on year; core inflation also rose, to 1.3 per cent, but this was largely the result of calendar effects connected with the Easter holidays (Figure 9.1).
The behaviour of inflation mainly reflected the most volatile components. The drop in international crude oil prices in 2016 passed through to the prices of fuels (down by 6.3 per cent) and electricity and gas rates (down 5.0 per cent in the aggregate, with only a slight decline in electricity rates). The prices of food products slowed, partly owing to temporary weather conditions.
Domestic inflation remained weak, not least because of the still ample margins of spare capacity and slow wage growth. The GDP deflator rose by 0.8 per cent (0.7 per cent in 2015); the stagnation of hourly earnings buffered the acceleration in unit labour costs stemming from the fall in productivity. The private consumption deflator recorded an even more modest change, remaining practically stable on average for the year. The gain in the terms of trade contributed to this: the ratio of the export deflator to the import deflator increased by about 2.5 per cent in 2016, thanks notably to the fall in the prices of crude oil imports.
The weakness of prices during the year affected inflation expectations. The forecasts for 2017 surveyed by Consensus Economics were steadily revised downwards in the first part of the year, from 1.3 per cent in January to 0.8 per cent in August; they began to swing upwards only in December, rising to 1.4 per cent in May 2017. In their most recent assessments, analysts forecast that inflation will be low next year as well (1.3 per cent). The firms interviewed in March in the quarterly survey conducted by the Bank of Italy together with Il Sole 24 Ore expect the consumer price index between three and five years ahead to rise by 1.6 per cent, compared with 0.9 per cent in the survey carried out at the end of 2016 (‘Survey on Inflation and Growth Expectations’, Banca d’Italia, Statistics series, 10 April 2017).
The downward shift in inflation expectations was accompanied by wider agreement among observers, signalling the risk of entrenchment of inflation expectations below the objective of price stability: in 2014-16 the dispersion of firms’ expectations
Figure 9.1
Inflation in Italy and contributions of the main components (1)
(monthly data; 12-month percentage changesand percentage points)
20172015 2016-1.0
-0.5
0.0
0.5
1.0
1.5
2.0
2.5
-1.0
-0.5
0.0
0.5
1.0
1.5
2.0
2.5
Overall index excluding food and energy products
Food and energy products
Total
Source: Based on Eurostat data.(1) HICP.

BANCA D’ITALIAAnnual Report2016100
diminished, returning to pre-crisis levels (see the box ‘Inflation expectations of Italian firms according to the Bank of Italy-Il Sole 24 Ore survey’).
INFLATION EXPECTATIONS OF ITALIAN FIRMS ACCORDING TO THE BANK OF ITALY-IL SOLE 24 ORE SURVEY
Since the end of 1999 the Bank of Italy has gathered quarterly quantitative data on the expectations of consumer price inflation in Italy of firms with 50 or more workers in industry excluding construction and in private non-financial services. Data of this kind, which are collected as part of a broader sample survey conducted together with Il Sole 24 Ore, are uncommon in the international arena; they make it possible to obtain useful indications on the distribution of inflation expectations.
In the period 1999-2007, which was characterized by broadly stable macroeconomic conditions, the median value of expected inflation twelve months ahead in Italy gradually approached the level compatible with price stability established by the ECB Governing Council (i.e. below but close to 2 per cent for the entire euro area). Beginning in 2008, instead, median expectations diverged from it, following the wide fluctuations in observed inflation, and since 2014 they have stabilized around values of not more than 0.5 per cent (Figure A).
The dispersion of expectations around the median is significant, and it too is subject to fluctuations. In the period before the crisis, the difference between the 20th and 80th percentiles averaged 0.5 percentage points. Subsequently it increased, only sporadically dipping to the previous levels; since the second half of 2015 it has returned to the levels recorded in the first period, when expected inflation was close to the objective of price stability.
This diversity of opinion among firms depends only to a minor extent on firms’ observable characteristics, such as size, sector of activity and geographical location; it is greater the more the observed inflation rate deviates, in either direction, from
Figure A
12-month inflation expectations of Italian firms (per cent; median and distribution)
Q4
Q1
Q2
Q3
Q4
Q1
Q2
Q3
Q4
Q1
Q2
Q3
Q4
Q1
Q2
Q3
Q4
Q1
Q2
Q3
Q4
Q1
Q2
Q3
Q4
Q1
Q2
Q3
Q4
Q1
Q2
Q3
Q4
Q1
Q2
Q3
Q4
Q1
Q2
Q3
Q4
Q1
Q2
Q3
Q4
Q1
Q2
Q3
Q4
Q1
Q2
Q3
Q4
Q1
Q2
Q3
Q4
Q1
Q2
Q3
Q4
Q1
Q2
Q3
Q4
Q1
Q2
Q3
Q4
'99 '00 '01 '02 '03 '04 '05 '06 '07 '08 '09 '10 '11 '12 '13 '14 '15 '16
-1
0
1
2
3
4
5
6
-1
0
1
2
3
4
5
6
95th - 5th percentile 80th - 20th percentile Median
Source: Banca d’Italia, ‘Survey on Inflation and Growth Expectations’.

BANCA D’ITALIA Annual Report1012016
Producer and import prices
Producer prices of industrial goods sold in the domestic market continued to diminish and fell by 2.2 per cent, less steeply than in 2015. The annual rate of decline in the energy component, though remaining high, also eased, from 9.6 per cent in 2015 to 5.6 per cent in 2016. Against the backdrop of strong downward pressures from abroad, the prices of non-food consumer goods edged down by 0.1 per cent, after rising by 0.2 per cent in 2015, while those of intermediate goods fell by 1.1 per cent, outstripping the
the ECB’s objective of price stability (Figure B). This suggests that the disagreement among firms in this regard may partly reflect their differing views as to the scale and speed of the monetary policy measures necessary to approach the objective again.1
The relation between the dispersion of expectations and the simultaneous deviation of actual inflation from the objective has ceased to obtain since the end of 2013, when, as expectations settled to very low median values, their dispersion also stabilized at a modest level, which in the past was observed mainly when inflation was close to the price stability objective.
This evidence is corroborated by econometric analyses that take account of the cyclical phase and of other determinants of the degree of dispersion of expectations. In accordance with the indications that can be inferred from the financial markets (see the box ‘Anchoring of inflation expectations and macroeconomic effects’ in Chapter 4, Annual Report for 2015, 2016), it signals the possible gradual entrenchment of inflation expectations well below those compatible with the ECB’s objective of price stability.
1 L. Bartiloro, M. Bottone and A. Rosolia, ‘What does the heterogeneity of inflation expectations of Italian firms tell us?’, Banca d’Italia, Questioni di Economia e Finanza (Occasional Papers), forthcoming.
Figure B
Dispersions of expectations and observed inflation in Italy (1)(per cent)
0.0
0.2
0.4
0.6
0.8
1.0
1.2
1.4
0.0
0.2
0.4
0.6
0.8
1.0
1.2
1.4
-0.5 0.0 0.5 1.0 1.5 2.0 2.5 3.0 3.5 4.0 4.5
Dis
pers
ion
of 1
-yea
r in
flatio
n ex
pect
atio
ns
(sta
ndar
d de
viat
ion)
Harmonized annual rate of consumer price inflation
Q4 1999 - Q4 2013 Q4 2014 - Q4 2016
Source: Banca d’Italia, ‘Survey on Inflation and Growth Expectations’.(1) The broken line represents the estimated values of a bivariate regression of the dispersion of inflation expectations in a given quarter on the absolute value of the difference between the inflation rate observed in the survey quarter and 2 per cent; the estimation interval comprises the period between the fourth quarter of 1999 and the fourth quarter of 2013.

BANCA D’ITALIAAnnual Report2016102
0.5 per cent decrease of the previous year. Commodity prices revived in the second part of the year, leading to a gradual acceleration in producer prices, whose twelve-month rate of increase was 3.4 per cent in March 2017.
Deflationary pressures from abroad strengthened: the import deflator was down by 3.4 per cent on average in 2016, compared with declines of 2.7 per cent in both 2015 and 2014. In addition to energy goods, other imported intermediate inputs compressed firms’ costs. The producer prices of these goods fell by 2.7 per cent, more than in 2015 (0.5 per cent); the effects of the nominal appreciation of the euro played a part in this.
Labour costs
Gross hourly earnings in the private sector rose by 0.5 per cent last year. The weakness of wage growth, whose pace has been decreasing since 2014, reflected above all the widespread delays in signing contract renewals, which were concentrated in the final part of the year and in any case did not cover all branches of economic activity: in December 2016 one third of payroll employees were still waiting for an expired contract to be renewed. Furthermore, in a situation of high unemployment, firms’ request to recover part of the increments agreed in the previous round of collective bargaining on the basis of inflation forecasts that turned out to be significantly higher than actual inflation resulted in renewals characterized by modest increases in employee compensation (see Chapter 9 of last year’s Annual Report).
In several important cases wage increments were indexed to the inflation rate observed in the previous year (see the box ‘Current trends in industrial relations’ in Chapter 8). Moreover, the reduction for the third consecutive year of the wage components in excess of the contractual components (wage drift), compounded by still ample spare capacity, reduced the overall growth in earnings by 0.3 points.
Labour costs were basically unchanged from the previous year: on top of the weakness in earnings, there was the reduction in social contributions on new permanent jobs (see Chapter 8, ‘The labour market’). The gradual phasing out of hiring incentives will cause an acceleration in labour costs starting in 2018.
The robust expansion of employment fostered by social contribution relief, in conjunction with persistently weak growth in value added, led to a decline in productivity, that, combined with flat labour costs, pushed up unit labour costs, which rose by 0.9 per cent in 2016 (0.7 per cent in 2015) for the private sector as a whole; in industry excluding construction they remained stable, after declining by 1 per cent the previous year (see the box ‘Competitiveness indicators in the euro area: prices, costs and margins’).
COMPETITIVENESS INDICATORS IN THE EURO AREA: PRICES, COSTS AND MARGINS
Since the introduction of the euro, producer prices and unit labour costs (the ratio of labour costs to hourly labour productivity) have performed unevenly across the euro-area countries, raising concern among some analysts about the possible accumulation of imbalances in foreign trade.1
1 ECB, ‘Real convergence in the euro area: evidence, theory and policy implications’, Economic Bulletin, 5, 2015, 30-45.

BANCA D’ITALIA Annual Report1032016
However, a good number of empirical studies have led to doubts about the ability of relative costs and prices to adequately capture the evolution of international competitiveness, especially in advanced countries, where non-cost factors related to the quality of the products supplied appear to have become more important.2 When there is an improvement in quality, an increase in exports may be accompanied by a rise in costs and prices together with an increase in margins. By contrast, cost increases associated with a rise in prices and a decline in margins may signal that firms are encountering difficulty in preserving their market shares. It follows that analogous trends in costs and sale prices can provide different indications depending on whether they are accompanied by a decrease or an increase in margins.
Starting out from the above line of reasoning, a recent study examines the evolution of profit margins for euro-area countries.3 A differentiated picture emerges. Between 1999 and 2016 the profit share in manufacturing, the sector most exposed to foreign competition, fell in Italy and France by 2 and 3 percentage points respectively, while it rose by 9 and 13 points in Germany and Spain (see panel (a) of Figure A). Similar developments, though with less pronounced differences, were recorded for the
2 T. Bayoumi, R. Harmsen and J. Turunen, ‘Euro area export performance and competitiveness’, IMF Working Paper, 140, 2011; J.C. Bricongne, L. Fontagne, G. Gaulier, D. Taglioni and V. Vicard, ‘Firms and the global crisis: French exports in the turmoil’, Journal of International Economics, 87, 1, 2012, 134-146; F. Di Mauro and K. Forster, Globalisation and the competitiveness of the euro area, European Central Bank, Occasional Paper Series, 97, 2008. In addition, Giordano and Zollino stress that the increase in the incidence of imported intermediate goods in the structure of firms’ production costs has reduced the impact of unit labour costs on price inflation in some countries; see C. Giordano and F. Zollino, ‘Shedding light on price- and non-price-competitiveness determinants of foreign trade in the four largest euro-area countries’, Review of International Economics, 24, 3, 2016, 604-634.
3 M. Amici, E. Bobbio and R. Torrini, ‘Patterns of convergence (divergence) in the euro-area. Profitability versus cost and price indicators’, Banca d’Italia, Questioni di Economia e Finanza (Occasional Papers), forthcoming.
Figure A
Changes in the profit share in euro-area countries (1) (2)(annual data; differences with respect to 1999; percentage points)
(a) Manufacturing (b) Private sector (3)
1999-2016
-10
-5
0
5
10
15
1999-2007
-10
-5
0
5
10
15
EL FI FR IT EA10 AT ES DE NL BE PTFI FR IT NL AT EA10 BE PT DE ES EL
Source: Based on Eurostat data.(1) Profit share: complement to 1 of the labour share defined as the sum of labour income divided by value added. Total labour income is adjusted by imputing, for self-employment income, the hourly compensation of employees. Value added is at factor cost for Italy and at basic prices for the other countries. International country codes: FI=Finland; FR=France; IT=Italy; NL=Netherlands; AT=Austria; BE=Belgium; PT=Portugal; DE=Germany; ES=Spain; EL=Greece. EA10 indicates the average for these countries. – (2) Refers to the 10 countries that introduced the single currency between 1999 and 2001, save Luxembourg, for lack of data, and Ireland, owing to measurement problems connected with the activities of multinational corporations; for Belgium, Greece and EA10, the changes refer to 2015, owing to lack of data. (3) Private sector excluding agriculture, forestry and fishing, and real estate activities.

BANCA D’ITALIAAnnual Report2016104
private sector as a whole, excluding agriculture and the rental of buildings (see panel (b) of Figure A).
Joint examination of the development in costs, margins and prices can help to analyse the determinants of export performance. In the manufacturing sector, unit labour costs declined slightly in France and Germany in the period 1999-2016, while they increased in Italy and Spain, where producer prices also rose more steeply (Figure B). Thus, over the entire period, both costs and, to a lesser extent, prices would appear to signal an improvement in competitiveness for the first two countries with respect to the latter two. Nevertheless, the performance of exports was better in Germany and Spain, in line with that of margins.
Estimations of a regression model on data for the euro-area countries and for the individual branches of manufacturing confirm the findings of previous research on the importance of prices in explaining export performance,4 but they also signal
4 C. Giordano and F. Zollino, 2016, op. cit.
Figure B
Changes in unit labour costs, the profit share and producer prices in the manufacturing sectors of the main euro-area economies (1)
(annual data; differences with respect to 1999; per cent and percentage points)
(a) Germany (b) France
-0.2
-0.1
0.0
0.1
0.2
0.3
0.4
0.5
-0.10
-0.05
0.00
0.05
0.10
0.15
0.20
0.25
'99 '00 '01 '02 '03 '04 '05 '06 '07 '08 '09 '10 '11 '12 '13 '14 '15 '16-0.2
-0.1
0.0
0.1
0.2
0.3
0.4
0.5
-0.10
-0.05
0.00
0.05
0.10
0.15
0.20
0.25
'99 '00 '01 '02 '03 '04 '05 '06 '07 '08 '09 '10 '11 '12 '13 '14 '15 '16
(c) Spain (d) Italy
Unit labour costs (2) Producer prices (2)Profit share (3)
-0.2
-0.1
0.0
0.1
0.2
0.3
0.4
0.5
-0.10
-0.05
0.00
0.05
0.10
0.15
0.20
0.25
'99 '00 '01 '02 '03 '04 '05 '06 '07 '08 '09 '10 '11 '12 '13 '14 '15 '16-0.10
-0.05
0.00
0.05
0.10
0.15
0.20
0.25
'99 '00 '01 '02 '03 '04 '05 '06 '07 '08 '09 '10 '11 '12 '13 '14 '15 '16-0.2
-0.1
0.0
0.1
0.2
0.3
0.4
0.5
Source: Based on Eurostat data.(1) See Figure A, note 1. – (2) Right-hand scale; percentage change. – (3) Changes in percentage points.

BANCA D’ITALIA Annual Report1052016
the existence of a positive relation between exports and margins, at constant costs or prices and controlling for demand and for country-, sector- and year-specific effects.
In the case of Italy, in the last few years the increase in non-cost competitiveness, also seen in a recovery in margins, and the improvement in the real effective exchange rate have had a positive impact on exports (see the box ‘The improvement in Italy’s goods exports since 2010’ in Chapter 10).
Price competitiveness
After an appreciable gain of nearly 3 percentage points in 2015, the indicator of the price competitiveness of Italian firms, measured on the basis of the producer prices of manufactures, worsened by about 1 percentage point. Competitiveness remained stable with respect to the other euro-area countries, but decreased by 2 percentage points vis-à-vis non-euro-area competitors. The favourable change in relative prices for Italy was more than offset by the nominal appreciation of the euro in the first part of the year (Figure 9.2).
Figure 9.2
Competitiveness indicators for the main euro-area countries and real effective exchange rate of the euro (1)
(indices: Q4 2010=100; 4-quarter moving average)
(a) Competitiveness indicators for the main euro-area countries
(b) Competitiveness indicators for Italy
'10 2011 2012 2013 2014 2015 2016 '1790
95
100
105
Global
With respect to euro-area competitors
With respect to non-euro-area competitors
'10 2011 2012 2013 2014 2015 2016 '1790
95
100
105
FranceGermanyItalySpainReal effective exchange rate of the euro
Sources: Bank of Italy and, for the real effective exchange rate of the euro, ECB.(1) Based on producer prices of manufactures. An increase indicates a loss of competitiveness. The competitiveness indicators are calculated with respect to 61 competitor countries (including the members of the euro area). The figure for the last quarter is partly estimated. The real effective exchange rate of the euro is calculated by the ECB with respect to 20 competitor countries outside the euro area.
Between 2010 and 2016 – a period marked by a broad improvement in export performance (see the box ‘The improvement in Italy’s goods exports since 2010’ in Chapter 10) – Italy achieved a competitiveness gain of about 2 percentage points, concentrated vis-à-vis non-euro-countries and aided by the depreciation of the euro. The gain in competitiveness exceeded that of Germany, thanks to more moderated

BANCA D’ITALIAAnnual Report2016106
prices in Italy; the indicator based on unit labour costs, published by the European Central Bank, likewise shows a sharper recovery for Italy.
At the end of 2016 and in the first few months of 2017 Italian firms’ price competitiveness began to improve again, thanks to the favourable trend of both the euro exchange rate and relative prices.

BANCA D’ITALIA Annual Report107 2016
10. FOREIGN DEMAND AND THE BALANCE OF PAYMENTS
The current account surplus increased in 2016 following an improvement in net investment income and a contraction in the energy deficit. Goods exports kept pace with demand from outlet markets and Italy’s share of world trade held stable. Imports continued to grow, though less rapidly than in 2015.
The current account continued to improve steadily; the surplus, which increased to 2.6 per cent of GDP in 2016, is expected to remain strong, even adjusted for the effects on imports of the unfavourable business cycle, thanks to the sound performance of exports and the drop in energy prices.
The Bank of Italy’s negative balance in the TARGET2 payment system widened, reflecting, as in other countries, the redistribution through various channels of the excess liquidity injected by the Eurosystem. Italian investors continued to rebalance their portfolios towards foreign securities, mainly investment fund units; resident banks cut back their funding on the international interbank market; and foreign investors reduced their stock of Italian portfolio securities, especially medium- and long-term bonds.
Italy’s net foreign debtor position diminished significantly, falling below 15 per cent of GDP. Almost two thirds of the reduction, which was an improvement of 10.4 percentage points of GDP on the low recorded at the end of 2013, can be attributed to the strong current account surplus.
Exports and imports
Exports. – Exports of goods and services grew by 2.4 per cent in volume in 2016. The slowdown compared with 2015 was tied to the weakening of world trade, which only began to recover in the final part of the year and has continued into more recent months.
In 2016 the volume of goods exported rose by 2.3 per cent, basically in line with the growth in potential demand from outlet markets. This was due largely to sales to euro-area countries (Figure 10.1), since the increase in exports to markets outside the area, albeit continuing, was modest; exports were also affected by a loss of competitiveness as a result of a slight appreciation in the effective exchange rate (see Chapter 9, ‘Prices, costs and competitiveness’). Italy’s share of the global goods imports rose to 3.0 per cent at current prices (see the box ‘The improvement in Italy’s goods exports since 2010’).

BANCA D’ITALIAAnnual Report2016108
Figure 10.1
Goods export volumes, potential foreign demand and world goods imports(annual averages, indices: 2010=100)
(a) Total (1) (b) By geographic area (2)
90
100
110
120
130
2010 2011 2012 2013 2014 2015 2016
Intra-area exports
Potential demand, intra-area component
Extra-area exports
Potential demand, extra-area component
90
100
110
120
130
2010 2011 2012 2013 2014 2015 2016
Goods exports
Potential demand
World imports
Sources: Based on IMF and Istat data.(1) Goods exports, national accounts. Potential demand is calculated as the weighted average of the imports by volume of Italy’s trading partners, weighted by their shares of Italian exports by value. – (2) The breakdown of goods exports into intra- and extra-euro-area is estimated, beginning with the aggregate national accounts figure, on the basis of foreign trade data and the prices of industrial products sold abroad.
THE IMPROVEMENT IN ITALY’S GOODS EXPORTS SINCE 2010
Since 2010 Italian exporters have strengthened their ability to compete in global markets.1 In the previous decade Italy’s goods exports expanded less than world trade through 2007 and were hard-hit by the contraction of 2008-09. Over the past six years, by contrast, foreign sales have increased by nearly half a percentage point per year more than the potential demand in Italy’s outlet markets. And the negative growth gap with respect to German exports has been considerably reduced though not eliminated (see the table).
Exports and potential demand for goods, by volume (1)(average yearly growth rates, per cent)
Italy France Germany Spain
Exports Potential demand
Exports Potential demand
Exports Potential demand
Exports Potential demand
1999-2016 3.2 6.0 3.5 5.5 7.8 5.7 5.4 5.1
1999-2007 5.3 9.3 4.9 8.3 10.9 8.7 6.3 7.5
2007-2010 -3.4 -0.4 -1.3 -0.2 -0.6 -0.4 -0.5 -0.4
2010-2016 3.4 3.0 3.3 2.9 4.4 3.0 4.9 3.0
Sources: Based on Eurostat, IMF and national data.(1) The average yearly growth rate is defined as the cumulative growth over the period specified divided by the number of years.
1 See M. Bugamelli, S. Fabiani, S. Federico, A. Felettigh, C. Giordano and A. Linarello, ‘Back on track? A macro-micro narrative of Italian exports’, Banca d’Italia, Questioni di Economia e Finanza (Occasional Papers), forthcoming.

BANCA D’ITALIA Annual Report109 2016
Italy’s share of world trade has also improved, remaining virtually stable since 2010 both in terms of price and volume after falling by nearly 30 per cent from its 1999 level. Italian firms have succeeded in defending their shares in all the main markets, including those of the euro area, where the losses were steepest up to 2007 (see the figure). Penetration in the US market has been especially significant, favoured among other factors by the depreciation of the euro against the dollar. In many sectors exports have grown faster than the demand of Italy’s trading partners (pharmaceuticals, motor vehicles, leather products) or at practically the same rate (engineering and food products). Italian exporters have been able to expand foreign sales faster than their German competitors in many sectors, whereas between 1999 and 2007 they had accumulated a negative gap on nearly all products.
Market share of Italian exports by geographical area (1)
EU Euroarea
Germany France Spain Othereuro-areacountries
EU,non-euro
area
Non-EU United States
China World0
2
4
6
8
10
12 2010 2016
0
2
4
6
8
10
12 1999 2007
0
2
4
6
8
10
12
0
2
4
6
8
10
12
Sources: Based on Istat, Eurostat and IMF data.(1) Italian goods exports as a percentage of the total goods imports of each geographical area (excluding Italy for EU, euro area, and world); data at current prices.
Italy’s export performance has been influenced by the improvement in price competitiveness, which recouped about 2 percentage points between 2010 and 2016, as measured by the real effective exchange rate based on producer prices of manufacturing products. The gain came especially vis-à-vis trading partners outside the euro area, thanks to the depreciation of the euro, and overall it was greater than that of Germany. Foreign demand trends, which have been favourable to Italy’s product specialization, have also helped to sustain export growth.
At the same time, the adverse impact of competitive pressure from the emerging economies, China in particular, may have been attenuated. In 1999 nearly a third of Italian exports consisted in products for which China held a significant share of the world market. By 2015, the incidence of such products, while remaining greater than in the other main euro-area countries, had fallen below 25 per cent.

BANCA D’ITALIAAnnual Report2016110
Non-price competitiveness has also improved. Our analysis of the data disaggregated by product and market (source: CEPII-BACI) found that the quality of Italian exports, measured by an indicator that reflects product characteristics that translate into higher prices, sales volumes being equal,2 increased about as much as those of Spain between 2010 and 2015 and slightly more than those of Germany. However, the level of quality is still lower than that of German exports in many sectors, with the exception of clothing, leather products and non-metallic mineral products.
Lastly, the recovery since 2010 may also have benefited from the progressive shift in the composition of Italian exports towards medium-sized and large firms, which are characterized by greater resilience vis-à-vis potential demand, lower elasticity of exports to the real exchange rate, and less exposure to competitive pressures from the emerging economies.
Italy’s sales abroad have thus been favoured in the last six years by several temporary factors, such as the depreciation of the effective exchange rate and the strong performance of world trade in some of the main specialization sectors. But there have also been more structural improvements in connection with the shift in the composition of exports towards products less vulnerable to competition from emerging economies and towards medium-sized and large firms, which are better able to compete in foreign markets and cope with exchange rate fluctuations.
2 A.K. Khandelwal, P.K. Schott and S.J. Wei, ‘Trade liberalization and embedded institutional reform: evidence from Chinese exporters’, American Economic Review, 103, 6, 2013, 2169-2195.
As in the previous two years, the growth in exports came chiefly from transport equipment (especially motor vehicles), followed by food, chemical, pharmaceutical and metal products (Figure 10.2). Exports of textiles, apparel and leather goods rose more modestly, while machinery and equipment was stagnant after two years of expansion.
Figure 10.2
Sectoral contributions to the growth of goods exports in volumes(percentage points)
-0.4 -0.2 0.0 0.2 0.4 0.6 0.8 1.0 1.2 1.4 1.6
Food products, beverages and tobacco
Textiles and apparel, leather products
Petrochemicals
Chemicals
Pharmaceuticals, medical chemical and botanical products
Rubber and plastic products and non-metallic mineral products
Basic metals and metal products
Computers, electronic and optical products
Electrical equipment
Machinery and equipment n.e.c.
Transport equipment
Wood and paper products, furniture and other products
2014 2015 2016
Total growth:
2015: 4.6%2016: 2.3%
2014: 3.0%
Source: Based on Istat data.

BANCA D’ITALIA Annual Report111 2016
The volume of exports to EU countries continued to expand (3.9 per cent), especially to the main euro-area partners. The increase in exports to non-EU markets was much less robust (0.5 per cent). Although exports to China, Japan and the United States rose, the appreciation in the euro, the problems encountered by some emerging economies, such as Brazil and Turkey, and the sharp drop in demand from oil producing countries all took a toll.
Imports. – The volume of imports of goods and services rose for the third year in a row, but at a rate that was less than half that recorded in 2015 (2.9 per cent in 2016). The slowdown in the goods segment mainly reflected the sharp decline in purchases of raw materials, including energy products following the upswing in 2015, and the stagnation in imports of electronic products and the slowdown in imported transport equipment. Nonetheless, as in the previous year, transport equipment was still the sector posting the highest growth (increasing by more than 14 per cent), partly thanks to the recovery in gross fixed investment in this component.
The current and capital accounts
The current account surplus increased again in 2016 to 2.6 per cent of GDP (€42.8 billion; Table 10.1). The improvement on the previous year was due mainly to the balance on primary income turning to surplus and, to a lesser extent, to a further contraction in the energy deficit (see panel (a) in Figure 10.3), which increased the surplus on goods to around €60 billion (3.6 per cent of GDP).
The gradual improvement in the goods balance almost entirely explains the adjustment (equal to 6 points of GDP) of the current account in Italy from its lowest point in 2010. According to our estimates, based on a model that takes account of the size of the output gap in Italy and its partner countries and of the elasticity of exports and imports to the various components of demand, this rebalancing was considerable even on a cyclically adjusted basis, in large part due to the favourable performance of exports and the reduction in the prices of energy products. If cyclical effects are excluded, the current account surplus in 2016 would have been around 1.4 per cent of GDP (Figure 10.3.b).
The total deficit in services deteriorated slightly to €3.2 billion due to the increase in the value of imports just outpacing that of exports (3.2 per cent, compared with 2.8 per cent). The deficit in transport services fell marginally; in the merchandise trade sector, the decline in sea freight rates was accompanied by a slight decrease in the market share of resident shippers. The surplus in travel again rose modestly, thanks, on the revenue side, to spending by foreign tourists coming to Italy.
For the first time since 2007 primary income registered a surplus (€2.8 billion, from a deficit of €9.2 billion in 2015), thanks to the significant reduction in the deficit on net investment income, which represents more than 80 per cent of primary income. The improvement was due mainly to a decline in the yields on Italian debt securities (mainly government) held by non-residents and, to a lesser extent, to the rebalancing of residents’ portfolios in favour of more profitable foreign assets (see the box ‘The balance on net investment income since 1999’).
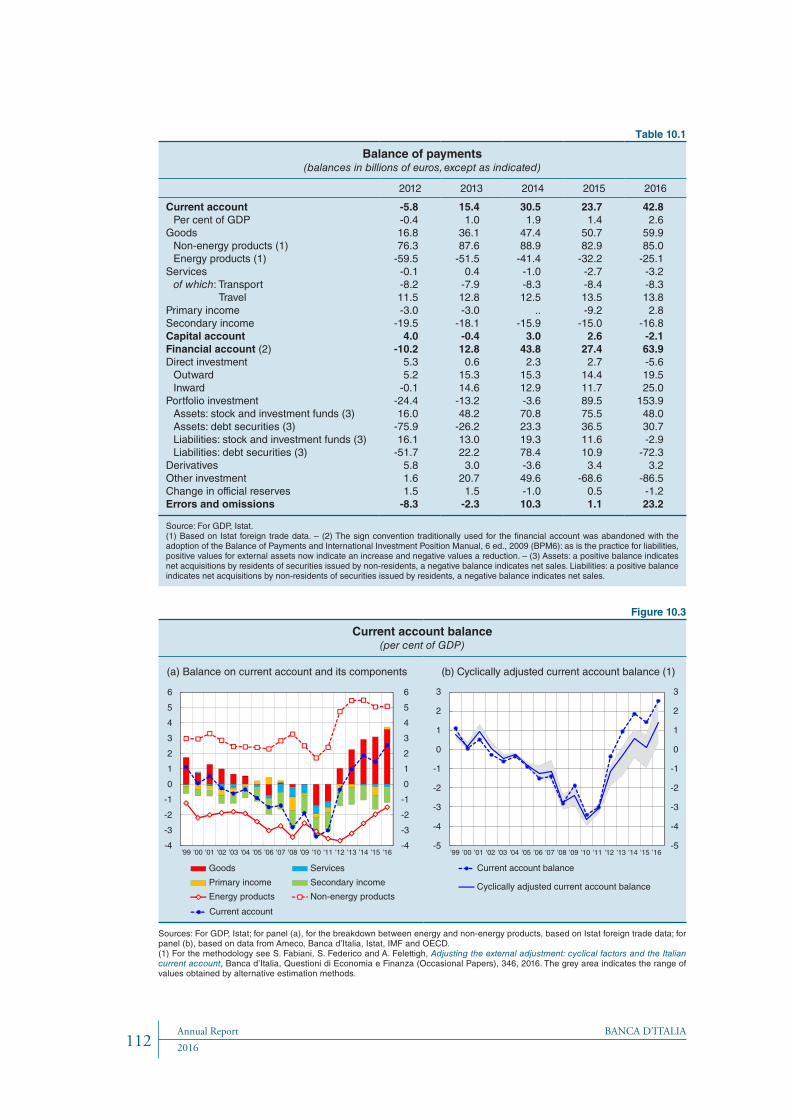
BANCA D’ITALIAAnnual Report2016112
Table 10.1
Balance of payments(balances in billions of euros, except as indicated)
2012 2013 2014 2015 2016
Current account -5.8 15.4 30.5 23.7 42.8Per cent of GDP -0.4 1.0 1.9 1.4 2.6
Goods 16.8 36.1 47.4 50.7 59.9Non-energy products (1) 76.3 87.6 88.9 82.9 85.0Energy products (1) -59.5 -51.5 -41.4 -32.2 -25.1
Services -0.1 0.4 -1.0 -2.7 -3.2of which: Transport -8.2 -7.9 -8.3 -8.4 -8.3
Travel 11.5 12.8 12.5 13.5 13.8Primary income -3.0 -3.0 .. -9.2 2.8Secondary income -19.5 -18.1 -15.9 -15.0 -16.8Capital account 4.0 -0.4 3.0 2.6 -2.1Financial account (2) -10.2 12.8 43.8 27.4 63.9Direct investment 5.3 0.6 2.3 2.7 -5.6
Outward 5.2 15.3 15.3 14.4 19.5Inward -0.1 14.6 12.9 11.7 25.0
Portfolio investment -24.4 -13.2 -3.6 89.5 153.9Assets: stock and investment funds (3) 16.0 48.2 70.8 75.5 48.0Assets: debt securities (3) -75.9 -26.2 23.3 36.5 30.7Liabilities: stock and investment funds (3) 16.1 13.0 19.3 11.6 -2.9Liabilities: debt securities (3) -51.7 22.2 78.4 10.9 -72.3
Derivatives 5.8 3.0 -3.6 3.4 3.2Other investment 1.6 20.7 49.6 -68.6 -86.5Change in official reserves 1.5 1.5 -1.0 0.5 -1.2Errors and omissions -8.3 -2.3 10.3 1.1 23.2
Source: For GDP, Istat.(1) Based on Istat foreign trade data. – (2) The sign convention traditionally used for the financial account was abandoned with the adoption of the Balance of Payments and International Investment Position Manual, 6 ed., 2009 (BPM6): as is the practice for liabilities, positive values for external assets now indicate an increase and negative values a reduction. – (3) Assets: a positive balance indicates net acquisitions by residents of securities issued by non-residents, a negative balance indicates net sales. Liabilities: a positive balance indicates net acquisitions by non-residents of securities issued by residents, a negative balance indicates net sales.
Figure 10.3
Current account balance(per cent of GDP)
(a) Balance on current account and its components (b) Cyclically adjusted current account balance (1)
-5
-4
-3
-2
-1
0
1
2
3
-5
-4
-3
-2
-1
0
1
2
3
'99 '00 '01 '02 '03 '04 '05 '06 '07 '08 '09 '10 '11 '12 '13 '14 '15 '16
Current account balance
Cyclically adjusted current account balance
-4
-3
-2
-1
0
1
2
3
4
5
6
-4
-3
-2
-1
0
1
2
3
4
5
6
'99 '00 '01 '02 '03 '04 '05 '06 '07 '08 '09 '10 '11 '12 '13 '14 '15 '16
Secondary incomePrimary income
ServicesGoods
Non-energy productsEnergy products
Current account
Sources: For GDP, Istat; for panel (a), for the breakdown between energy and non-energy products, based on Istat foreign trade data; for panel (b), based on data from Ameco, Banca d’Italia, Istat, IMF and OECD.(1) For the methodology see S. Fabiani, S. Federico and A. Felettigh, Adjusting the external adjustment: cyclical factors and the Italian current account, Banca d’Italia, Questioni di Economia e Finanza (Occasional Papers), 346, 2016. The grey area indicates the range of values obtained by alternative estimation methods.

BANCA D’ITALIA Annual Report113 2016
THE BALANCE ON NET INVESTMENT INCOME SINCE 1999
In the last two decades the worldwide stock of cross-border assets and liabilities has grown enormously. This has amplified the effect of variations in market yields on investment income balances of the various countries and heightened this item’s importance to developments in the current account. For Italy, the improvement in the investment income balance in 2016, equal to 0.7 percentage points of GDP, accounted for nearly two thirds of the increase in the current account surplus, which grew from 1.4 per cent of GDP in 2015 to 2.6 per cent last year.
Every year from 1999 through 2016, with the sole exception of 2006, Italy has recorded a deficit on investment income (see panel (a) of the figure), as a consequence of its overall net foreign debtor position. However, the size of the deficit has fluctuated in response to changes in the amount of underlying assets and liabilities (the stock effect), in their yields (yield effect), and in their make-up according to type of instrument (composition effect).1
Balance on investment income
(a) Balance by category of investment(per cent of GDP)
(b) Decomposition of change in balance(billions of euros)
-25
-20
-15
-10
-5
0
5
10
15
'99'00'01'02'03'04'05'06'07'08'09'10'11'12'13'14'15'16
Stock effect
Yield effect
Composition effect
Change in balance
Balance (absolute value)
-2.0
-1.5
-1.0
-0.5
0.0
0.5
1.0
-2.0
-1.5
-1.0
-0.5
0.0
0.5
1.0
'99'00'01'02'03'04'05'06'07'08'09'10'11'12'13'14'15'16
Direct investmentPortfolio: shares and investment fundsPortfolio: debt securitiesOther investmentsOfficial reservesTotal investment income
-25
-20
-15
-10
-5
0
5
10
15
Sources: Based on Bank of Italy and Istat data.(1) Annual change unless otherwise indicated.
The stock effect played a significant role in the years following the inception of the monetary union, reflecting the increase in the country’s net debtor position. After 2007, however, its importance diminished (see panel (b) of the figure). From that year on, the yield effect was decisive, especially during the international financial crisis of 2008-09. The sign and size of the effect were erratic, owing both to the volatility of yields on portfolio assets and to the variability of income from foreign direct investment. The worsening in
1 G. Oddo and E. Tosti, ‘The evolution of Italy’s investment income balance’, Banca d’Italia, Questioni di Economia e Finanza (Occasional Papers), forthcoming.

BANCA D’ITALIAAnnual Report2016114
The deficit on secondary income worsened (€16.8 billion) mainly owing to an increase in public transfers to EU institutions (which had been relatively low, in historic terms, the previous year). Immigrant workers’ remittances continued to decline, falling to €5.1 billion (€7.4 billion in 2011), in large part owing to the sharp reduction in outflows to China, which in past years were likely to have included transfers other than those to family members.1
The financial account
In 2016, the rebalancing of the portfolio of resident households towards asset management and insurance products continued, with more international diversification (see Chapter 7, ‘Households’). Italian residents’ portfolio investment in foreign assets came to €78.7 billion, with an increase in the exposure to medium- and long-term debt instruments (mainly government and corporate securities issued in the United States) and, to a greater extent, to investment funds.
Direct investment abroad amounted to €19.5 billion (provisional data), with a significant increase in shares and reinvested profits, which reflected operations to recapitalize foreign subsidiaries and a number of important acquisitions in the insurance and food products sectors.
As to liabilities, non-residents divested €75.2 billion of Italian portfolio securities in 2016. This divestment largely involved medium- and long-term debt securities mostly issued by the private sector, particularly banks (€28.7 billion); contributory factors were the failure to roll over maturing bonds and the ample recourse by banks to Eurosystem financing. The amount of Italian public sector securities held by foreign investors fell by €24.6 billion (see the box ‘Holders of Italian public sector securities’ in Chapter 14). Net investments in the short-term segment were more than offset by the sale of securities with a maturity beyond one year.
1 G. Oddo, M. Magnani, R. Settimo and S. Zappa, ‘Le rimesse dei lavoratori stranieri in Italia: una stima dei flussi invisibili del “canale informale”’, Banca d’Italia, Questioni di Economia e Finanza (Occasional Papers), 332, 2016.
the balance recorded in 2015 can be ascribed to the latter, owing to the decline in energy commodity prices and the corresponding fall in the profitability of some of the leading energy corporations. Since 2008 the composition effect has also acquired significance, with a net positive contribution deriving from the rebalancing of residents’ investment portfolios with a view to sustaining their net yields. In 2016 the pronounced improvement in the investment income balance was due in particular to the yield effect.
In recent years the fall of interest rates to historically low levels has had a significant impact on developments in the investment income balance, given Italy’s net foreign debtor position. If the yields on foreign assets and liabilities (excluding foreign direct investment) had been equal in 2016 to their 2000-07 average, then other things being equal the deficit would have been larger by about 0.7 percentage points of GDP.

BANCA D’ITALIA Annual Report115 2016
THE TREND IN THE BANK OF ITALY’S BALANCE IN TARGET2
The balance of each Eurosystem national central bank1 vis-à-vis the ECB in the TARGET2 payment system mirrors the net flow of liquidity into its country as a result of cross-border transactions through the system conducted by NCBs or commercial banks on own or customers’ behalf.
The TARGET2 balances are affected by the distribution of liquidity creation and demand among euro-area countries. In the last two years the balances have reflected the redistribution of the excess liquidity created by the Eurosystem’s expanded asset purchase programme since its inception in March 2015 and, to a lesser extent, by the targeted longer-term refinancing operations (for Italy, see panel (a) in Figure A). The Bank of Italy’s net TARGET2 liabilities rose to €412 billion at the end of April 2017, an increase of €247 billion since the end of February 2015. Those of Spain and Portugal increased by €182 billion and €31 billion respectively (through March 2017, the latest data available), while the net asset balances of Germany, Luxembourg and the Netherlands have increased. In the leading countries with liabilities, the increase in the imbalance proceeded in parallel with the injection of liquidity (Figure B).
Purchases of securities by the Eurosystem affect the TARGET2 balances both directly and indirectly. If the counterparty to the transaction is a foreign resident in the euro area, settlement entails an immediate cross-border flow of liquidity with a reduction in the balance of the NCB making the purchase and a corresponding improvement in that of the counterparty’s country of residence. In the case of non-euro-area counterparties, which participate in TARGET2 through area intermediaries, the purchase increases the balance of the NCBs of the intermediaries’
1 The national central banks of non-euro-area EU member states can also participate in TARGET2 on a voluntary basis, however, their balance with the system cannot be negative.
According to provisional data, inward direct investment by non-residents was equal to €25.0 billion (€11.7 billion in 2015). Inflows for shares and reinvested profits (€11.2 billion) relating to mergers and acquisitions declined compared with the previous year, while intra-group loans increased significantly, with a positive balance of €13.8 billion, which could have been viewed by Italian affiliates as an alternative source of financing. Inflows in 2016 as a percentage of GDP appear to be consistent with those observed in Germany and France, but less than those in Spain. At the end of the year the stock of inward direct investment equalled 26.8 per cent of GDP, a relatively low level by European standards.
Italian banks’ net funding on the international interbank market, including funding intermediated by resident central counterparties, fell by €17 billion in 2016 after rising the previous year. A significant part of the deficit on ‘other investment’ was due to the increase of about €108 billion in the Bank of Italy’s debtor position in TARGET2, the European payment system, which continued to widen in the early months of this year, rising to an average of €420 billion in April from €364 billion in December (see the box ‘The trend in the Bank of Italy’s balance in TARGET2’).

BANCA D’ITALIAAnnual Report2016116
countries of residence, typically Germany and the Netherlands.2 The indirect effects follow from the subsequent use of the liquidity injected, depending on the counterparties’ portfolio choices.
Figure A
Main factors determining the TARGET2 balance(billions of euros)
(a) Bank of Italy’s balance sheet (1) (b) Balance of payments (2)
2011 2012 2013 2014 2015 2016 '17
Inflows
Outflows
2011 2012 2013 2014 2015 2016 '17-600
-500
-400
-300
-200
-100
0
100
200
General gov. deposits
Liabilities vis-à-vis EMU credit instits. for mon. pol. purposes
Securities held for mon. pol. purposes (opposite sign)
Loans to EMU credit institutions for mon. pol. purposes (opposite sign)
Other net assets (opposite sign)
TARGET2 (end of month)
TARGET2 (monthly average)
-600
-500
-400
-300
-200
-100
0
100
200
Foreign investment in Italian private sector securities (3)Foreign investment in Italian public sector securitiesItalian investment in foreign securities (opposite sign)Banks’ net foreign funding (4)Balance on current account and capital accountResidual items (5)TARGET2 (end of month)TARGET2 (monthly average)
(1) Breakdown based on the Bank of Italy’s balance sheet accounting identity. Monthly stocks. For April 2017, provisional data. – (2) Breakdown based on the balance of payments accounting identity. Cumulative monthly flows from July 2011 (data available up to March 2017). – (3) Shares and securities issued by banks, financial companies and non-financial firms. – (4) Net bank funding in the form of loans, deposits and other investments, including that intermediated by resident central counterparties. Excludes bank bonds. – (5) Direct investment, derivatives, other investment, errors and omissions.
Figure B
TARGET2 balances and securities portfolios of the NCBs of Italy, Spain and Portugal(billions of euros)
(a) Banca d’Italia (b) Banco de España (c) Banco de Portugal
2015
TARGET2 (end of month) Securities holdings (opposite sign) (1)
'172015 2016-65
-50
-35
-20
-85
-70
-55
-40
'172016-275
-200
-125
-50
-400
-325
-250
-175
'172015 2016-450
-350
-250
-150
-450
-350
-250
-150
Source: ECB.(1) End-of-month stocks of debt securities issued by euro-area residents and held by the NCB; right-hand scale.
2 ECB, Economic Bulletin, 3, 2017.

BANCA D’ITALIA Annual Report117 2016
Using balance-of-payments data one can evaluate changes in the TARGET2 balances taking account of both direct and indirect effects. For Italy (panel (b) of Figure A), the chief counter-items to the increase in the negative balance between March 2015 and March 2017 consisted in outward portfolio investment by Italian residents (€190 billion) and the decrease in funding abroad by Italian banks (€91 billion). A smaller part (€54 billion) reflected sales of Italian government securities by non-residents (see the box ‘Holders of Italian public sector securities’ in Chapter 14).
Foreign investment by Italian residents reflected the adjustment of households’ portfolios, under way since 2014, away from government securities and bank bonds and towards insurance and managed asset products (see Economic Bulletin, 1, 2017). The funding of the intermediaries that offer such products has been directed mainly to foreign assets, by reason of the greater international diversification of their portfolio choices and the limited development of the Italian capital market.
The composition of foreign investment by instrument indicates a propensity to seek better-balanced portfolios and fundamentally higher yields than those offered by government securities. Some two thirds of the purchases consisted in foreign investment funds, in particular flexible and bond funds. The remainder consisted almost entirely in debt securities, just over half in private sector bonds, mainly non-financial corporate issues, and the rest in government paper (mostly Spanish and US).
The decline in foreign funding by Italian resident banks affected both the interbank market and the bond market (foreign disinvestment in private sector portfolio securities was concentrated on bank bonds). A factor in the decline was the shift in bank funding towards Eurosystem financing, thanks above all to targeted longer-term refinancing operations. At the same time, inflows of liquidity in connection with Italy’s substantial current and capital account surpluses (€71 billion) curbed the increase in the debtor balance.
Overall, then, the gradual increase in the Bank of Italy’s TARGET2 debtor balance since March 2015 reflects the reduction in Italian banks’ external debt and the shift in the composition of residents’ portfolios towards assets other than Italian government securities and bank bonds, in parallel with the Eurosystem’s securities purchases and liquidity injections. This adjustment does not seem to be due to a preference for financial assets deemed safer (in fact, during this period Italian residents have made net disposals of German public securities). Rather it reflects the trouble investors are having in diversifying their portfolios in a domestic financial market with relatively limited supplies of assets alternative to government and bank bonds.
The net international investment position
At the end of 2016 Italy’s net foreign debtor position amounted to €249.2 billion, equal to 14.9 per cent of GDP (Figure 10.4).
The large reduction, 8.6 percentage points of GDP, in Italy’s net debt compared with the previous year, was due to the current account surplus and, to a greater extent,

BANCA D’ITALIAAnnual Report2016118
value adjustments. On the asset side, these adjustments arose mainly from the increase in the market prices of foreign bonds held by Italian residents and, on the liabilities side, from the reduction in the market value of Italian portfolio securities held by non-residents (largely bank shares; see Chapter 14, ‘The money and financial markets’).
Figure 10.4
Net external debtor position(per cent of GDP)
-30
-20
-10
0
10
1999 2000 2001 2002 2003 2004 2005 2006 2007 2008 2009 2010 2011 2012 2013 2014 2015 2016
Valuation adjustments for year
Net position at end of previous year
Net position at end of year
Flow for the year (financial account)
-30
-20
-10
0
10
Source: For GDP, Istat.
From the low point recorded at the end of 2013, the improvement in Italy’s net international investment position equalled 10.4 percentage points of GDP, two thirds of which attributable to the current account and capital account surplus. The value adjustments made a negative contribution in the two years 2014-15, in part undermining the positive development of the following year.
The regularization of capital illegally held abroad through the first voluntary disclosure programme, which ended in September 2014, did not play a part in the improvement over the last three years since it had already been factored in to last year’s revision of the official statistics since 1999. The amount declared totalled almost €62 billion, of which around €44 billion held abroad, thus increasing the value of financial assets held abroad by resident households. Portfolio securities (stock and investment fund shares, debt securities) accounted for over 70 per cent, with the remainder consisting mostly of bank deposits and other financial assets (such as insurance policies). Compared with data previously published, foreign assets were higher by an amount that varies between 0.4 per cent of GDP in 1999 and 3.1 per cent at the end of 2013, with reductions of a similar size in Italy’s net debtor position.2
2 For more information see Revision of Italy’s external statistics - September 2016. Methodological Note on the Bank of Italy’s website.

BANCA D’ITALIA Annual Report119 2016
11. THE PUBLIC FINANCES
General government net borrowing fell from 2.7 to 2.4 per cent of GDP in 2016, the combined result of a reduction in interest expense and an increase in the primary surplus. The debt-to-GDP ratio rose from 132.1 to 132.6 per cent; however, net of the change in the Treasury’s liquid balance with the Bank of Italy it was virtually stable. The primary aim of fiscal policy was to avoid hindering the strengthening economic recovery while keeping within the margins of flexibility allowed by European rules.
It is estimated that the fiscal stance will be expansionary again in 2017 as in 2016. In both years budgetary policy was constrained by the decision to prevent the application of the safeguard clauses.
The Government outlined its public finance programmes for 2018-20 in April’s 2017 Economic and Financial Document. Net borrowing is forecast to fall from the projected 2.1 per cent of GDP this year to 1.2 per cent in 2018 and virtual balance in 2019 in both nominal and structural terms. The debt ratio should begin to decline this year, if only slightly, and continue to fall more rapidly in the following three years. The substantial contraction in the deficit programmed for 2018 is connected in large part with the safeguard clauses; their activation had previously been postponed, but the Government proposes to substitute them with alternative measures to be set out in detail in the budget law.
The public finances in 2016
Budget outturn. – General government net borrowing declined to 2.4 per cent of GDP, compared with 2.7 per cent in 2015 (Figure 11.1.a and Table 11.1). The improvement stemmed from a reduction of 0.2 percentage points in interest expense, to 4.0 per cent of GDP, and an increase of 0.1 point in the primary surplus.
Both total revenue and primary expenditure declined in relation to GDP, by 0.6 and 0.7 points respectively to 47.1 and 45.6 per cent of GDP (see the sections ‘Revenue’ and ‘Expenditure’ below).
According to the European Commission’s estimates, Italy’s fiscal policy stance was expansionary in 2016 for the third consecutive year: the cyclically adjusted primary surplus narrowed by 0.6 percentage points of GDP. The structural deficit – net of temporary measures as well as adjusted for cyclical effects – worsened by 0.7 points.
The debt-to-GDP ratio rose further, from 132.1 to 132.6 per cent (Figure 11.1.b; see the section ‘General government debt’ below). Net of the change in the Treasury’s liquid balance with the Bank of Italy, however, it increased by just 0.1 point.

BANCA D’ITALIAAnnual Report2016120
Budget policy. – The current-programmes framework of the Economic and Financial Document (EFD) published in April 2015 projected a structural improvement in the public finances equal to 0.5 percentage points of GDP in 2016 (Table 11.2), thanks to measures passed in previous years, notably the safeguard clauses, which trigger an increase in indirect taxes unless alternative measures to reduce the deficit by the same amount are enacted (spending cuts and revenue increases).
Figure 11.1
Public finance indicators(per cent of GDP)
(a) General government balances (1) (b) General government debt
95
100
105
110
115
120
125
130
135
95
100
105
110
115
120
125
130
135
'00 '02 '04 '06 '08 '10 '12 '14 '16 Debt
Debt net of financial assistance to EMU countries
Debt net of financial assistance to EMU countries and
Treasury’s liquid balance
'00 '02 '04 '06 '08 '10 '12 '14 '16-6
-4
-2
0
2
4
6
-6
-4
-2
0
2
4
6
Overall balance
Primary balance
Source: For net borrowing and primary surplus, Istat.(1) A negative balance indicates a deficit; a positive balance indicates a surplus.
Table 11.1
Consolidated accounts of general government (1)(billions of euros and per cent of GDP)
2011 2012 2013 2014 2015 2016
Current revenue 737.1 765.7 763.3 769.8 780.5 781.9of which: social contributions 216.3 215.8 215.3 214.3 219.1 221.4
direct taxes 226.8 239.8 240.9 237.8 243.0 248.5indirect taxes 231.1 246.7 239.8 248.8 249.9 242.2
Capital revenue 10.7 5.9 8.8 6.7 5.4 6.6
Total revenue 747.8 771.7 772.1 776.5 785.9 788.5per cent of GDP 45.7 47.8 48.1 47.9 47.8 47.1
Current primary expenditure 666.4 671.4 683.7 691.0 693.8 705.7
Interest payments 76.4 83.6 77.6 74.4 68.1 66.3
Capital account expenditure (2) 65.7 63.9 57.7 60.1 68.2 57.3of which: gross fixed investment 45.3 41.4 38.5 36.8 36.7 35.0
Total expenditure 808.6 818.9 819.0 825.5 830.1 829.3per cent of GDP 49.4 50.8 51.0 50.9 50.5 49.6
Primary balance 15.6 36.4 30.7 25.4 23.9 25.5per cent of GDP 1.0 2.3 1.9 1.6 1.5 1.5
Net borrowing 60.8 47.2 46.9 49.0 44.2 40.8per cent of GDP 3.7 2.9 2.9 3.0 2.7 2.4
Source: Istat.(1) Rounding may cause discrepancies in totals. – (2) This item includes (with a negative sign) the proceeds deriving from property disposals.

BANCA D’ITALIA Annual Report121 2016
Table 11.2
Public finance objectives, estimates and outturns for the year 2016(per cent of GDP)
General government Memorandum items:
Net borrowing
Primary surplus
Change in structural
deficit
Debt Real GDP growth rate
2016
Privatiz- ation
receipts 2016
Net borrowing
2015
Structural deficit 2015
Current-programmes projectionApril 2015 (1) 1.4 2.8 -0.5 130.3 1.3 0.5 2.5 0.5
ObjectivesApril 2015 (1) 1.8 2.4 -0.1 130.9 1.4 0.5 2.6 0.5
September 2015 (2) 2.2 2.0 0.4 131.4 1.6 0.5 2.6 0.3
October 2015 (3) 2.2 2.0 0.4 131.4 1.6 0.5 2.6 0.3
EstimatesApril 2016 (4) 2.3 1.7 0.7 132.4 1.2 0.5 2.6 0.6
September 2016 (5) 2.4 1.5 0.5 132.8 0.8 0.1 2.6 0.8
Outturns (6) 2.4 1.5 0.7 132.6 0.9 0.1 2.7 1.0
(1) Economic and Financial Document (EFD) 2015. – (2) EFD update 2015. – (3) Italy’s Draft Budgetary Plan 2016. – (4) EFD 2016. – (5) EFD update 2016. – (6) Net borrowing, primary surplus and GDP growth based on Istat data; the change in the structural deficit in 2016 and the structural deficit in 2015 are from European Commission, Spring Economic Forecast, May 2017.
During 2015, in order to avoid hindering the economic recovery, the Government revised budget policy for 2016 in progressively more expansionary terms, ultimately planning a worsening of the structural deficit. The revision of the targets exploited the margins of flexibility allowed by European rules.
The April 2015 EFD set the net borrowing target for 2016 at 1.8 per cent of GDP, 0.4 per cent higher than in the current-programmes projections. The reduction in the primary surplus by comparison with 2015 consequently came to 0.1 points; the plan for a smaller adjustment than the 0.5 points required by the Stability and Growth Pact was justified on the basis of the margins of flexibility allowed by the European rules in the presence of structural reforms. In July, at the conclusion of the European Semester, the EU Council recognized that Italy was qualified to take advantage of this flexibility.
In the EFD update in September the deficit planned for 2016 was increased to 2.2 per cent of GDP, with a projected structural worsening of 0.4 points. At the same time the Government asked for authorization to use broader margins of flexibility (on the grounds both of implementation of further reforms and of public investment). The Commission, noting that the request could not be considered outside the European Semester, reserved it for subsequent examination together with the evaluation of the Stability Programme update.
In December the Stability Law enacted by Parliament projected an increase in the deficit of 1.1 per cent of GDP (€17.6 billion), 0.2 points more than projected in the EFD update owing to additional expenditures, largely temporary, for security and culture. Apart from the practical abolition of property taxes on primary residences

BANCA D’ITALIAAnnual Report2016122
(see the section ‘Revenue’ below), the main expansionary measure (officially valued at €12.8 billion) was to deactivate, for 2016 only, the VAT increase mandated by the safeguard clauses. The Stability Law nevertheless left in force the clause calling for a significant rise in VAT rates both in 2017 (the reduced rate from 10 to 13 per cent and the ordinary rate from 22 to 24 per cent) and in 2018 (by 1 point for the ordinary rate only).
Both the original EFD and the update planned a reduction in the debt-to-GDP ratio of about 1.5 points in 2016, reflecting, among other things, overly optimistic estimates of growth and privatization receipts. The two documents projected real economic growth of 1.4 and 1.6 per cent, but the actual outturn was 0.9 per cent; privatization receipts were forecast to be 0.5 per cent of GDP, against effective receipts of 0.1 per cent.
Revenue
General government revenue increased by 0.3 per cent in 2016 to nearly €789 billion, or 47.1 per cent of GDP (Table 11.1). If both the tax credit for middle- and lower-income employees and that for firms against deferred tax assets (whose amount was halved in 2016) are classified as decreases in revenue, the revenue gain can be estimated at 0.7 per cent.1 Relief granted in previous years curbed the growth of social contribution and tax revenues, which rose less than GDP overall, consequently reducing the fiscal burden.
Social contribution revenue rose by 1.1 per cent to €221.4 billion, outpaced by gross earnings for the entire economy, which increased by 2.8 per cent, as a consequence of the temporary contribution relief in favour of new permanent hires in the private sector legislated by the 2015 and 2016 Stability Laws (see Chapter 8, ‘The labour market’).2
Tax revenue grew by 0.4 per cent overall to €495.8 billion; the rise was driven by direct and capital taxes, while the proceeds of indirect taxes diminished significantly.
Direct tax proceeds increased by 2.3 per cent to €248.5 billion owing to the rise in personal income tax receipts (up by 0.7 per cent to €167.5 billion) and above all company tax receipts (up by 5.9 per cent to €33.8 billion). Another factor in the overall increase was the rise in households’ TV licences (equal to €2 billion), which are counted as tax revenue starting in 2016 (when the public broadcaster RAI was included within the perimeter of general government). A downward effect was exerted by the substitute tax on investment income, which fell by 14.6 per cent to €13.7 billion in connection with the generalized decline in yields on financial assets.
1 Under European accounting rules both these tax credits are classified as increases in expenditure. The official documents value the tax credit for lower-income employees at €9.2 billion in 2015 (the year from which the rule was fully phased in), and a comparable amount can be hypothesized for 2016. The credit for early tax payments is officially put at €4.9 billion in 2015 and €2.4 billion in 2016.
2 The decrease in contribution income owing to these measures is officially valued at €1.7 billion in 2015 and €5.2 billion in 2016.

BANCA D’ITALIA Annual Report123 2016
Capital tax revenue more than quadrupled by comparison with 2015 to €5.2 billion, almost exclusively owing to proceeds from the voluntary asset disclosure procedure.
Indirect tax revenue declined by 3.1 per cent to €242.2 billion, owing to the significant contraction in the proceeds from both IRAP, the regional tax on productive activities (down by 27.1 per cent to €20.5 billion) and local property taxes (down by 17.5 per cent to €20.3 billion). The fall in IRAP was due to the exclusion of labour costs from the tax base, while that in local property taxes stemmed from the substantial abolition of the municipal services tax on primary residences and the municipal property tax on some types of agricultural land. By contrast, VAT receipts increased by 2.3 per cent to €103.3 billion, owing in part to anti-evasion measures altering the payment procedures in relation to certain types of transaction.3 Finally, there was a sharp rise in taxes on gaming and lotteries (up by 27.8 per cent to €9.5 billion), owing in part to higher tax rates under the 2016 Stability Law.
Italy’s fiscal burden in the international context. – In 2016 Italy’s fiscal burden came to 42.9 per cent of GDP, about half a percentage point less than in 2015. Counting the tax credit for middle- and lower-income employees and that against deferred tax assets as revenue decreases, the burden is estimated at 42.2 per cent, down by 0.3 points from the previous year.
This ratio is 1.9 percentage points higher than the euro-area average, although over the past three years the gap has narrowed by 0.9 points (reclassifying the tax credits as above, the gap was 1.2 points in 2016, with a decrease of 1.5 points since 2013).4 Focusing on the other large countries, the fiscal burden is 2.6 percentage points lower in Germany and 8.5 points lower in Spain, but 4.6 points higher in France.
According to OECD estimates, in 2016 the tax wedge on labour was still significantly greater in Italy than in the other euro-area countries, by about 7 percentage points.5 In the three years from 2014 to 2016 the wedge was practically unchanged in Italy, while it was reduced by nearly 1 percentage point in the other area countries as a group. These data refer to an employee with average gross earnings, cover employment relationships already in being, and do not include IRAP. Accordingly, they do not reflect the impact of some tax wedge reduction measures enacted in Italy during these years.
More specifically, to gauge the impact of the tax credit for middle- and lower-income employees one should consider earnings up to 90 per cent of the average, near the threshold at which the full benefit of the measure is accorded; by this measure
3 In particular, this refers to the mechanism of split payments and reverse charges.4 Based on data from European Commission, Spring Economic Forecast, May 2017.5 The average for the two types of worker mentioned in Figure 11.2.

BANCA D’ITALIAAnnual Report2016124
the tax wedge has been reduced appreciably since 2013, by about 3 percentage points (Figure 11.2).6 Above this threshold the tax wedge widens rapidly.
Figure 11.2
Tax wedge on labour in Italy (1)(per cent)
(a) Single worker with no children (b) One-earner married couple with two children
10
20
30
40
50
50 60 70 80 90 100 110 120 130 140 15010
20
30
40
50
Per cent of average gross earnings
35
40
45
50
55
50 60 70 80 90 100 110 120 130 140 15035
40
45
50
55
2013 2016
Per cent of average gross earnings
Source: Based on OECD data, Taxing Wages, 2014 and 2017 editions.(1) Average gross earnings amounted to €29,704 in 2013 and €30,642 in 2016.
In addition, the taxation of labour was reduced in 2015 by the contraction of the IRAP tax base.
As to overall taxation of business income, the top tax bracket remained unchanged last year in Italy and Germany at 31.4 and 30.2 per cent respectively, while being lowered in France by 3.6 points to 34.4 per cent and in Spain by 3.0 points to 25.0 per cent.7
Expenditure
General government expenditure declined by 0.1 per cent in 2016 to €829.3 billion or 49.6 per cent of GDP.
Primary expenditure increased by 0.1 per cent to €763 billion, or 45.6 per cent of GDP; counting as revenue the tax credits discussed above (in the ‘Revenue’ section above), primary outlays are estimated to have risen by 0.5 per cent, broadly in line with the average for the previous five years.
Social benefits in cash increased by 1.4 per cent to €337.5 billion, reflecting in practically equal amounts the 0.9 per cent increase in pensions and the 3.4 per cent rise
6 OECD, Taxing wages 2017, 2017. The OECD does not calculate these data for Cyprus, Lithuania and Malta and does not estimate the tax wedge for workers whose earnings are less than half the average in each country. Further, in estimating the local tax component for Italy, the OECD uses the regional and municipal surtax rates applied in Rome (which are higher than the national average).
7 European Commission, Taxation Trends in the European Union. Data for the EU Member States, Iceland and Norway, 2016.

BANCA D’ITALIA Annual Report125 2016
in other social benefits.8 Pension outlays were affected by the increase in the number and the average size of new pensions by comparison with old pensions terminated; indexation to the cost of living was nil.
Staff expenses increased by 1.3 per cent to €164.1 billion, following a reduction of about the same amount on average over the previous five years. The rise was due mainly to an increase in the number of public employees (by 1.2 per cent), after 13 years of practically uninterrupted contraction, owing to the school reform and the inclusion in 2016 of the public broadcasting corporation RAI within the general government perimeter. Expenditure was also increased by the disbursement of an extraordinary contribution to the armed forces, police and fire service under the 2016 Stability Law.
Intermediate consumption and social benefits in kind increased by 1.3 per cent overall to €135.6 billion. The increase was driven mainly by purchases of innovative medicines.
Capital spending diminished significantly, falling by 16.0 per cent to €57.3 billion. The reduction is more modest, however, if one excludes the extraordinary expenditures sustained in 2015 for back pension payments and coverage of previous losses of four banks placed in resolution (see Chapter 11, ‘Public finances in 2015’ and Chapter 13, ‘Capital and profitability’, Annual Report for 2015, 2016) and reclassifies the tax credits for deferred tax assets as revenue, as above.
Fixed investment net of property disposals declined for the seventh year running, by 4.8 per cent to €36.1 billion. The official valuation ascribes this trend in part to the component financed by European funds, which is subject to wide fluctuations between different phases of the planning cycle (in 2016 this component diminished by about €2.8 billion). Investment may also have been affected by the changeover to the new rules on public procurements (see Chapter 6, ‘Economic developments’ and Chapter 12, ‘Institutional context’ ).
Interest expense diminished for the fourth consecutive year, coming down 2.6 per cent to €66.3 billion, after falling by an annual average of 6.6 per cent over the previous three years. The impact of the increase in liabilities was more than offset by the fall in the average cost of the debt, from 3.2 to 3.1 per cent, related to the reduction in the yields on new issues induced by monetary policy measures (see Chapter 14, ‘The money and financial markets’). Interest expenditure also decreased slightly in proportion to GDP, from 4.1 to 4.0 per cent; over the three previous years it had declined by a total of 1 percentage point.
General government debt
The ratio of general government debt to GDP rose by about half a percentage point in 2016 to 132.6 per cent; over the past five years it has increased by some 16 points. The primary surplus reduced the ratio by 1.5 points, while the spread between the average cost of the debt and the nominal growth of GDP increased it by 1.8 points.
8 Net of the tax credit for lower-income employees it can be estimated that total social benefits in cash increased overall by 1.5 per cent and non-pension benefits by 3.9 per cent.

BANCA D’ITALIAAnnual Report2016126
Residual factors, which affect the debt but not net borrowing, increased the ratio by 0.3 percentage points (Figure 11.3).
Figure 11.3
General government debt(per cent of GDP)
(a) Changes and contributions of determinants (b) Changes by sub-sector
2010 2011 2012 2013 2014 2015 2016-6
-3
0
3
6
9
12
2010 2011 2012 2013 2014 2015 2016
GDP growth
Residual factors
Interest payments
Primary surplus
Change in debt/GDP ratio
-6
-3
0
3
6
9
12
Central government
Social security institutions
Local government
Change in debt/GDP ratio
Among the residual factors, the most significant was the increase in the Treasury’s liquid balance (by 0.4 percentage points of GDP), net of which the debt ratio would have been practically unchanged for the year. The debt was also increased by the flows generated by financial derivatives (0.3 points) and the reclassification as loans of some liabilities in derivative instruments, according to European statistical rules (0.2 points). Factors operating instead to reduce the debt ratio were differences between cash- and accrual-basis accounting, mostly tied to financial relationships with the European Union, which lowered the ratio by 0.4 points, and issue and redemption discounts and premiums (0.3 points).
The average residual maturity of the debt continued to lengthen, increasing from 7.1 to 7.3 years. In connection with securities purchases under the Eurosystem’s Expanded Asset Purchase Programme, the share of the debt held by the Bank of Italy increased from 7.8 to 12.3 per cent; correspondingly, the share held by other residents diminished from 58.1 to 54.9 per cent and that of non-residents from 34.1 to 32.8 per cent. For an analysis of public securities only, at market values, see the box ‘Holders of Italian public sector securities’ in Chapter 14.
Other liabilities and guarantees. – The Italian public debt as calculated by European rules does not take account of certain types of liability. The most important of these are commercial debts (except for claims transferred to financial intermediaries without recourse), those in derivatives and guarantees of general government entities in favour of third parties. Based on the data available to the Bank of Italy, commercial debts are estimated to have decreased in 2016 for the fourth consecutive year, thanks in part to stricter rules on payment deadlines (see the box ‘General government commercial debts’).

BANCA D’ITALIA Annual Report127 2016
By comparison with those of the other countries of the European Union, the Italian general government sector has longer average payment times and a higher level of commercial debts.1 After peaking in 2012, the level of these debts has been steadily reduced, thanks above all to the measures taken in 2013-14.
In the absence of full official data on the amount of commercial debts and payment times, reported below are the estimates made by the Bank of Italy based on its own business surveys and on supervisory reports.2 Due to the survey nature of some data, the estimates are marked by a fair degree of uncertainty.
Estimate of commercial debts. – The commercial debts of Italian general government sector continued to diminish in 2016, from 4.2 to 3.8 per cent of GDP (or about €68 billion to €64 billion; see the figure). This amount remains considerably greater than the level consistent with contractual payment schedules (the physiological component of this debt), which have been shortened among other things as a consequence of the transposition of the Europ-ean Late Payment Direc-tive (Directive 2011/7/EU, which sets payment deadlines at between 30 and 60 days, as a rule).
Estimated average payment times. – Based on the above mentioned business surveys, general government payment times have been shortened to less than 100 days on average in 2016. According to the data published in Intrum Justitia’s European Payment Report 2017, the average payment times for the Italian general government sector continue to be significantly longer than the average of the other European countries.
1 According to Eurostat data provided as part of the excessive deficit procedure, the ratio of the stock of commercial debts to GDP is higher in Italy than in any other EU country. Note that the data do not include claims transferred to financial intermediaries without recourse and, for Italy, practically the entire amount of debts on capital account. For further details, see Eurostat: ‘Note on stock of liabilities of trade credits and advances’, April 2017.
2 The estimates represent the sum of two components: (a) credits still on firms’ balance sheets, valued on the basis of sample surveys conducted by the Bank of Italy; and (b) commercial debts transferred by firms to financial intermediaries without recourse, drawn from supervisory reports (€10.1 billion at the end of 2015 and €8.4 billion at the end of 2016). For details on the methodology, see L. D’Aurizio, D. Depalo, S. Momigliano and E. Vadalà, ‘I debiti commerciali delle amministrazioni pubbliche italiane: un problema ancora irrisolto,’ Politica economica, 3, 2015, 421-458. The figures for the years 2008-2015 were published last year (see the box ‘General government commercial debts’, Chapter 11, Annual Report for 2015, 2016).
Estimate of general government commercial debts (1)
(per cent of GDP)
0
1
2
3
4
5
6
0
1
2
3
4
5
6
2008 2009 2010 2011 2012 2013 2014 2015 2016
Non-physiological paymentsPhysiological payments
(1) Physiological payments are those made within the times fixed by contract between the parties.
GENERAL GOVERNMENT COMMERCIAL DEBTS

BANCA D’ITALIAAnnual Report2016128
Net liabilities in derivative instruments, at market values, diminished from 1.9 to 1.8 per cent of GDP; the contraction was due to the reclassification of certain derivative transactions in the public debt. In 2016 the guarantees issued by general government bodies in favour of third parties increased from 2.2 to 2.4 per cent of GDP, reflecting guarantees to agents in non-financial sectors.
The outlook
The planning framework of the April 2016 EFD set the net borrowing objective for 2017 at 1.8 per cent of GDP (more than the 1.4 per cent envisaged by the current-programmes projection, which assumed the activation of the safeguard clauses); structural net borrowing was expected to edge downwards (0.1 per cent).
Resumption of progress towards structural budget improvement in 2017 was a condition laid down by the EU Council for according the flexibility requested by the Government as regards the accounts for 2016 (see the section ‘The public finances in 2016’ above). To avert the risk of significant deviation of the accounts from the objectives set by European rules in 2017, the Council recommended, in any case, a larger structural correction that than projected by the EFD in April.
In the course of 2016, however, the need to sustain the economic recovery and the decision to avert the increase in indirect taxes under the safeguard clauses were pre-eminent in the setting of budgetary policy.
In the EFD update in September the net borrowing objective for 2017 was increased to 2.0 per cent of GDP, reflecting a worsening in the outlook for growth; the projected change in the structural balance was set equal to zero notwithstanding the recommendations of the European institutions. In addition, the Government obtained Parliament’s authorization to increase the deficit by up to 0.4 more points of GDP in 2017, in consideration of possible extra expenditure in connection with earthquakes and migration.
The budget enacted in December implemented the Government’s programmes, raising the deficit to 2.3 per cent of GDP in 2017 and increasing structural net borrowing by about 0.4 points. The main expansionary measure in the budget – which increased borrowing overall by €12.3 billion in 2017 – was the one-year postponement
On 15 February 2017 the European Commission called on Italy to notify it of the measures taken to ensure correct application of the Late Payment Directive to avoid being referred to the EU Court of Justice.3 Compliance with the payment deadlines should be facilitated by the gradual phasing in, beginning in July 2017, of the requirement to transmit data on individual payments via General Government Transactions Information System (SIOPE). When fully in effect, the system should permit quantification of the amount of commercial debts and continuous monitoring of the payment times of the debtor entities.
3 European Commission, ‘Late payment: Commission urges 4 Member States to comply with the Late Payment Directive to protect SMEs in their commercial relations,’ Press release, 15 February 2017.

BANCA D’ITALIA Annual Report129 2016
of the indirect tax increase called for by the safeguard clauses (involving a revenue loss of over €15 billion). The rest consists principally in spending increases (worth nearly €10 billion) to spur investment and support incomes for some population groups (see the box ‘Applying the BIMic microsimulation model to the changes in pensioners’ fourteenth month payment’).
The Bank of Italy Microsimulation model (BIMic)1 has been developed in order to analyse the effects of the main components of the Italian tax and benefit system on the distribution of income between households and on the public finances.2
Based on data from the Bank’s Survey of Household Income and Wealth, the model assumes the socio-demographic characteristics of the population to be constant and that individual choices (on labour supply, for instance) do not change when public policies are modified. Accordingly, BIMic is suitable chiefly for examining the short-term effects of tax and social transfer measures.
One of the model’s possible applications is the evaluation of the distributive impact of changes to the so-called ‘fourteenth month payment’ made to pensioners3 under the 2017 budget law (which entails additional expenditure officially estimated at €0.8 billion). The changes modified both the group of beneficiaries eligible for the transfer payment, which was extended to include pensioners with a total income of between 1.5 times and 2 times the minimum pension benefit,4 and the size of the payment, which was increased by about 30 per cent for pensioners with an income of less than 1.5 times the minimum pension benefit.
Thanks to BIMic, the difference between households’ equivalent disposable income with and without these changes can be analysed.
It is estimated that some 16 per cent of Italian households include at least one pensioner affected by the measure. The benefits are mostly concentrated on households with low equivalent income. For example, the bottom four deciles of the distribution get over 60 per cent of the resources disbursed (see panel (a) of the figure). Nevertheless, even households with relatively high incomes benefit from the rule change: the share of resources going to households with higher-than-median equivalent income is nearly 30 per cent, because eligibility for the benefit is determined by individual and not household income, in contrast to
1 N. Curci, M. Savegnago and M. Cioffi, ‘BIMic: the Bank of Italy microsimulation model for the Italian tax and benefit system,’ Banca d’Italia, Questioni di Economia e Finanza (Occasional Papers), forthcoming.
2 The main components simulated are social contributions, personal income tax (including special regimes for small businesses), property taxes, substitute taxes on financial assets, family allowances and other cash benefits.
3 Instituted by Decree Law 81/2007, converted with amendments by Law 127/2007, the fourteenth month is a transfer payment made in July each year from INPS to the recipients of a retirement pension who meet certain income and contribution requirements. Until 2016 those eligible were pensioners with a total income of less than 1.5 times the minimum pension. The amount of the benefit depends on the number of years of contributions.
4 Raising the ceiling from annual income of about €9,800 to €13,000.
APPLYING THE BIMIC MICROSIMULATION MODEL TO THE CHANGES IN PENSIONERS’ FOURTEENTH MONTH PAYMENT

BANCA D’ITALIAAnnual Report2016130
In its assessment of the draft budget in November 2016, the Commission pointed to the risk that Italian budgetary policy might not be compliant with the Stability and Growth Pact; it reiterated this opinion in its report on compliance with the debt rules at the start of 2017, and in a letter to the Italian Government it cited the need for structural corrective measures worth at least 0.2 per cent of GDP in 2017.
Following these objections, in April the Government approved a package including structural adjustments for a total of 0.2 points of GDP and reducing net borrowing for the year to 2.1 per cent. The most important measures were action against tax evasion (in particular an extension of the scope of the rules on split payments), taxation of gaming and tobacco products, and the amendment of the allowance for corporate equity, which no longer applies to all equity increases from 2010 on, but only to those in the five years before the current one. Starting in 2018 the savings produced by the adjustment package are to be used chiefly to remodulate the safeguard clauses, reducing the projected revenue by nearly a fifth (Figure 11.4).
other benefits, such as the family allowances (whose concentration curve is also shown in the panel, for purposes of comparison).
As a result of the change, the annual disposable income of the beneficiary households increases by an average of 1.65 per cent, or €250. The increase is slightly greater for those with low equivalent income, at between 1.8 and 2.6 per cent in the bottom four deciles of the distribution (see panel (b) in the figure).
Changes to rules on 14th month payment to pensioners: distributional effects (1)
(a) Concentration curve: comparisonbetween changes to 14th month payment to
pensioners and family allowances (2)(per cent)
(b) Share of beneficiary households and average increase in disposable income, by deciles of
equivalent income(per cent and percentage changes)
0.0
0.5
1.0
1.5
2.0
2.5
3.0
0
10
20
30
40
50
60
1 2 3 4 5 6 7 8 9 10
Deciles of equivalent income
Beneficiary households
Increase in disposable income (3)
0
10
20
30
40
50
60
70
80
90
100
0
10
20
30
40
50
60
70
80
90
100
0 10 20 30 40 50 60 70 80 90 100
Changes to 14th month payment
Family allowances
Share of households, ranked by equivalent income
Source: Based on the BIMic microsimulation model(1) The effects are evaluated by comparing equivalent disposable income before and after the change in the rules governing 14th month payments to pensioners. – (2) Concentration curves measure the cumulative share of a given variable (in this graph, the resources allocated to changing the 14th month payment or those going to family allowances) that flows into a given cumulative share of the total population, ranked on the basis of another variable (in this graph, equivalent income). – (3) Right-hand scale.

BANCA D’ITALIA Annual Report131 2016
Figure 11.4
Planned profile of VAT rates(per cent)
0
5
10
15
20
25
30
0
5
10
15
20
25
30
2016 Stability Law
2018
2017 Budget Law Decree Law 50/2017 (legislation in force)
13.0%
10.0%
22.0%24.9%
2016 2017 2019 2020
11.5% 12.0%
13.0%
25.4%
25.9%24.0% 25.0%
In April 2017’s EFD the Government presented the public finance programmes for 2018-2020. Net borrowing is projected to come down to 1.2 per cent of GDP in 2018, and the budget should be practically in balance in 2019, in both nominal and structural terms. The debt ratio should begin to diminish already this year, if only marginally, and then fall more rapidly in the three following years. In 2020 it is projected to be 125.7 per cent.
The significant deficit reduction planned for 2018 is largely in connection with the activation of the safeguard clauses that are still in force, which the Government, however, intends to annul and replace with alternative measures to be defined in the budget.
In May the Commission did not propose to initiate the excessive deficit procedure against Italy for non-compliance with the debt rules, partly in the light of the adjustment package adopted in April. The Commission also gave its assessment of the budget strategy for the years from 2016 to 2018. For 2016 it judged that the deviation from the path towards balance was not significant.9 For 2017 the assessment was essentially similar, although provisional.10 For 2018, however, based on estimates that do not consider the effects of the safeguard clauses, it noted risks of significant deviation from the adjustment path, emphasizing that to avert them a substantial adjustment effort would be required. Finally, the Commission recommended reducing the number and size of tax expenditures and reinstating the property tax on the primary residences of high-income households, accompanied by reform of the cadastral register.
9 The Commission took account of the margins of flexibility in connection with the clause on structural reforms (0.5 percentage points of GDP) and that on investment (0.21 points) and of the extraordinary expenses in connection with the inflow of refugees and for security (0.12 points).
10 This assessment is based in particular on a preliminary estimate of the costs for refugees and earthquake relief equal to 0.34 percentage points of GDP. The Commission reserves definitive assessment to the spring of 2018, when outturn data will be available.

BANCA D’ITALIAAnnual Report2016132
12. BUSINESS ACTIVITY REGULATION AND THE INSTITUTIONAL ENVIRONMENT
Excessive regulation of some markets and inefficiencies in the civil justice system and public administration weigh on the production system.
The first annual bill on competition is still before Parliament. It has been envisaged by Italian legislation since 2009 as an instrument to guarantee the continuity of liberalization measures and was first presented two years ago.
Several measures have been introduced in the last two years to regulate bankruptcy and property foreclosure with some initial positive outcomes. Business crisis management tools have remained largely ineffective though, partly because of the inefficiency of the court system.
In the civil justice system the measures introduced in recent years have helped to keep the number of new cases down and reduce the backlog of pending proceedings, but they have had little impact as yet on the actual working of the system. Marked differences in productivity between the various courts persist, with a generally lower output in the South owing, among other things, to lingering organizational deficiencies.
The reform programme to improve the quality of government action went ahead. The regulations on public contracts were revised and the reform of public administration was accomplished, although its success could be undermined by the lack of measures relating to public sector executives.
Competition and market regulation
The first annual bill on competition is awaiting final approval after more than two years of parliamentary debate. It contains provisions aimed at increasing transparency and consumer protection, especially in the insurance, banking, communication and energy sectors; in the energy sector, full transition to the free-market framework has been postponed to 1 July 2019. Certain restrictions regarding ownership interests in pharmacies and law practices have been lifted, but the recommendations of the Italian Competition Authority on the reduction of exclusive rights have not been incorporated. The new rules on transportation have been postponed pending the adoption of further legislative decrees.
The reform of local public services has not been completed. After a long parliamentary process, following Ruling 251/2016 of the Constitutional Court the time had expired for the enactment of the legislative decree implementing the Madia reform (Law 124/2015) in this area.

BANCA D’ITALIA Annual Report133 2016
The consolidated law on state-owned enterprises (Legislative Decree 175/2016) was approved; about a third of such enterprises manage local public services. The decree completely overhauls the body of legislation and resolves some regulatory uncertainties pertaining to the bankruptcy of public companies, their private nature and the responsibilities of their directors. The law also contains provisions relating to governance, including professionalism and independence requirements for directors. However, this regulatory framework does little to improve managerial efficiency and remains far from international best practices: for example, it does not require public enterprises to set performance objectives or offer performance-based incentives.
Nonetheless, the consolidated law has started the process of reorganizing the sector, setting parameters in terms of revenue and number of employees, and establishing the lower limit for operating results below which holdings must be divested. Based on these parameters, it is estimated that at least 50 per cent of the roughly 9,000 state-owned enterprises in the MEF database should be divested (of these, 15 per cent operate in the local public services sector). Cutting the revenue threshold in half, as provided by the corrective decree that is pending final approval, the number would be reduced by about a fifth.
In order to limit the obstacles to competition deriving from the red tape involved in starting a business, the reform of the public administration has simplified authorization procedures, streamlined administrative procedures that involve different bodies (conferenza di servizi), increased recourse to the silent-assent mechanism, and standardized models and procedures, utilizing the internet to spread awareness. In addition, the bureaucratic requirements for users were reduced and a mapping was made of the administrative procedures in the construction, commerce and environmental sectors, specifying the applicable regime for each. The reduction in red tape may have positive effects on entrepreneurial selection and on the economy in the long term (see the box ‘Limiting red tape for start-ups’).
LIMITING RED TAPE FOR START-UPS
Anyone wanting to start a business faces two types of red tape: the formali-ties involved in actually establishing the company and the authorizations required to begin operating. In both cases the cost may be purely financial or may relate to the length of the process.
The nature of that cost has different implications for firms seeking to enter the market. While the financial cost discourages less productive firms, the length of the process is the greatest impediment to more productive firms. For them, the opportunity cost of lost profits is higher because of the forced period of inactivity waiting for the process to be completed.
According to the World Bank’s Doing Business report, in 2016 it took six days to register a company in Italy (against ten in 2010). Instead, there is no ac-curate assessment of the time it takes to obtain all the authorizations needed to begin operating, which varies among sectors and geographical areas.
The average length of time before a business can be up and running and the consequences of this for the economy can be evaluated indirectly, using a general equilibrium model with heterogeneous agents (e.g. companies of different size

BANCA D’ITALIAAnnual Report2016134
The regulation of business activity
Bankruptcy law. – In Italy, bankruptcy law has traditionally been geared towards liquidation rather than reorganization. According to data from the Cerved Group, between 2014 and 2016 more than 14,600 bankruptcies, 1,300 in-court arrangements with creditors (concordato preventivo) and about 150 restructuring agreements were filed each year. Many arrangements with creditors resulted in liquidation instead of restructuring, in part to avoid the lengthy standard bankruptcy proceedings (see the box ‘Arrangement with creditors according to microdata on proceedings’). The introduction in 2015 of strict limits on the formulation of bankruptcy plans, in particular the ban on recovery rates below 20 per cent for unsecured credit during liquidation arrangements, may have contributed considerably to reducing the use of this instrument (down 42 per cent between 2015 and 2016).
The duration of bankruptcy proceedings is very long: those concluded in 2015 (before that year’s reform) lasted on average 2,700 days, with significant differences between and within the main geographical areas (Figure 12.1.a).
Foreclosure and credit recovery procedures. – The duration of real estate foreclosure proceedings completed in 2015 averaged more than 1,500 days, again with significant differences between and within the main geographical areas (Figure 12.1.b).
and productivity). The model parameters are calibrated to replicate, alongside other cha-racteristics of the Italian eco-nomy, several variables that are affected by start-up costs, such as entry and exit rates and the size distribution of firms.1
The findings reveal that bu-siness start-up times can be esti-mated at around four months, in line with other estimates and anecdotal evidence. According to the model, reducing this time by 40 per cent (which is the change observed in Italy betwe-en 2010 and 2016 for the time of formally registering a business) would increase productivity by about 4 per cent, the rate of entrepreneurship by 4 percentage points, and the average size of new firms by some 9 per cent. This could raise GDP by almost 2 per cent (see the figure).
1 G. González-Torres, ‘Measuring the aggregate effects of simplifying firm creation in Italy’, Banca d’Italia, Questioni di Economia e Finanza (Occasional Papers), 365, 2016.
Effects of reducing start-up times (1)(percentage changes and percentage points)
0
1
2
3
4
5
6
7
8
9
0
1
2
3
4
5
6
7
8
9
GDP Productivity Size ofnew firms
Percentage ofentrepreneurs (2)
(1) Simulation of the effects of a 40 per cent reduction in start-up times. – (2) Percentage points.

BANCA D’ITALIA Annual Report135 2016
ARRANGEMENTS WITH CREDITORS ACCORDING TO MICRODATA ON PROCEEDINGS
Information obtained from a sample of around 3,000 proceedings involving arrangements with creditors undertaken in the period 2009-15 – that is, about a third of the total – provides evidence on the use of this instrument and the way it operates.1
An arrangement with creditors can be used either to liquidate or to restructure an ailing firm. Its chief use is in liquidations (69 per cent); in 22 per cent of cases the whole firm or a branch is sold (indirect continuity), while restructuring measures account for only 9 per cent (direct continuity). After 2012, and a series of measures to encourage the use of these proceedings, arrangements aimed at ensuring business continuity became more widespread (see the figure).
Arrangements with creditors are negotiated, but they are nonetheless subject to the approval of a judge. The judicial process takes on average just under ten months and in 70 per cent of cases concludes with the approval of a plan (ratification).
The average time to execution of the arrangements, where this is established in the plan, is 33 months; however, the deadline is only observed in 13 per cent of cases. Collateralized credit is almost fully recovered at the conclusion of the arrangements; on the other hand, the average recovery rate of uncollateralized credit (weighted according to the sum involved) is 14 per cent for liquidations and 28 per cent for restructuring measures.
In 2010, to assist crisis management by encouraging new lending, priority was given to the repayment of loans granted as part of an arrangement with creditors plan. Estimates based on data from the Central Credit Register indicate that the measure has improved lending conditions, both the amount granted and the price, for firms that began proceedings after the introduction of the reform.2
1 A. Danovi, S. Giacomelli, P. Riva and G. Rodano, ‘Strumenti negoziali per la soluzione delle crisi di impresa: il concordato preventivo’, Banca d’Italia, Questioni di Economia e Finanza (Occasional Papers), forthcoming.
2 E. Brodi and L. Casolaro, ‘Finanziamenti alle imprese in crisi e priorità nel rimborso: gli effetti della prededucibilità nel concordato preventivo’, Banca d’Italia, Questioni di Economia e Finanza (Occasional Papers), forthcoming.
In 2015-16 many measures were introduced to reduce credit recovery times, both by reforming the foreclosure framework and by allowing recourse to out-of-court
Breakdown of arrangements with creditors by type before and after 2012
(share of total; per cent)
0
10
20
30
40
50
60
70
80
0
10
20
30
40
50
60
70
80
Liquidation Restructuring Sale
2009-2011 2013-2015

BANCA D’ITALIAAnnual Report2016136
mechanisms like the Marcian Pact (see Chapter 12, ‘Business activity regulation and the institutional environment’, Annual Report for 2015, 2016).
According to data collected by the Roundtable on Italian Foreclosures (Tavolo di Studio sulle Esecuzioni Italiane, T6) from the Ministry of Justice’s online portal on a sample of real estate foreclosures, the initial phase (the registration of the foreclosure and the appointment of the independent technical consultant) is now concluded within six months in 48 per cent of foreclosures (30 per cent before the 2015 reform).
However, there are delays in developing the infrastructure necessary for the proper functioning of the procedures. The registry of foreclosures and bankruptcy proceedings has not yet been created and the sales portal is still being tested.
Recourse to the Marcian Pact, a clause (Decree Law 59/2016, Article 2) in business loan agreements which provides that creditors may obtain ownership of real property serving as guarantee through an out-of-court procedure, has thus far been limited. According to data from a survey carried out by the Bank of Italy in April 2017 on 14 banking groups representing about 70 per cent of loans to firms in Italy, none had yet made use of the clause. The majority of these groups indicated that the application of the new contractual clause is currently being reviewed. The publication of guidelines to overcome uncertainties of interpretation and to clarify how the tool operates could encourage its use.
The institutional environment
Civil justice. – The number of pending court proceedings fell further, in both the first and second instance courts. At the end of 2016 the number was just over 4 million, about a quarter less than at the start of the decade (Figure 12.2); the reduction was somewhat smaller in the courts of first instance, which account for about two-thirds of pending cases. This reduction was entirely due to the decrease in the number of new cases; however, even the number of resolved cases has gone down, albeit it to a lesser extent.
Figure 12.1
Length of procedures by geographical area (1)(days)
(a) Bankruptcies (b) Foreclosures
0
500
1,000
1,500
2,000
2,500
3,000
3,500
North Centre0
1,000
2,000
3,000
4,000
5,000
6,000
0
1,000
2,000
3,000
4,000
5,000
6,000
North Centre0
500
1,000
1,500
2,000
2,500
3,000
3,500
South and Islands
South and Islands
Source: Based on data from the Ministry of Justice.(1) The figures represent the distribution of the length of bankruptcies (left) and foreclosures (right) concluded in 2015; the upper and lower extremes represent the 90th and 10th percentiles, the rectangle represents the interquartile range, and the central line the median.

BANCA D’ITALIA Annual Report137 2016
In the courts of first instance, the fall in the number of new cases is a result of the measures adopted in recent years to discourage recourse to the judicial system. More than a quarter of the reduction is attributable to social security litigation, which was particularly affected by the measures passed in 2012 to remove certain types of proceedings from the jurisdiction of judges. In the areas touched by court closures resultant from the judicial map reform, there was a fall in the number of standard civil cases but no significant change in the number of commercial, labour, social security, and matrimonial disputes. Litigation was also influenced by the economic cycle: provinces with higher value added growth recorded greater reductions in the number of new disputes, especially social security, bankruptcy and property foreclosure cases.1
However, the number of resolved cases also fell, in line with the trend in new case filings. This decrease was only partly attributable to the reorganization of caseloads in favour of more complex disputes. Over the last three years, for which homogenous data are available, this reduction extended to nearly every type of case and to more than 80 per cent of courts; it was more pronounced for courts with a greater decrease in the number of new cases.
The average length of judicial proceedings remained high: in 2016, standard civil disputes lasted about 1,100 days while commercial litigation lasted 1,250 days. The invariability of the disposition time is partly due to the strategies employed by some courts to first address proceedings pending for more than three years, the number of which has declined over the last three years.
Significant differences remain among courts in terms of both disposition times and productivity, in part owing to organizational issues (see the box ‘Court productivity and the length of proceedings’).
Public administration. – The process of implementing the enabling law reforming the public administration has been completed with the approval of five legislative decrees. The enabling law on public sector executives was not implemented while that on the organizational structure was only partially implemented.
1 S. Giacomelli, S. Mocetti, G. Palumbo and G. Roma, ‘La giustizia civile in Italia: le recenti evoluzioni’, Banca d’Italia, Questioni di Economia e Finanza (Working Papers), forthcoming.
Figure 12.2
Court cases: demand and supply (1)(thousands of cases)
0
1,000
2,000
3,000
4,000
5,000
6,000
0
1,000
2,000
3,000
4,000
5,000
6,000
2010 2011 2012 2013 2014 2015 2016
Pending Newly filed Concluded
Source: Based on data from the MInistry of Justice.(1) The total number of cases before justices of the peace, courts of first instance (except preliminary technical findings relating to social security claims) and appellate courts.

BANCA D’ITALIAAnnual Report2016138
In Italy, the laws that regulate recruitment and career advancement limit the public administration’s ability to attract, select and make full use of the more qualified candidates (see Chapter 12, ‘Business activity regulation and the institutional environment’ in last year’s Annual Report). This problem is amplified in the areas where corruption is more widespread (see the box ‘Composition of employment in the general government sector and corruption indices’).
COURT PRODUCTIVITY AND THE LENGTH OF PROCEEDINGS
The differences in the efficiency of the various courts may be due to the demand for justice (e.g. degree of litigiousness or complexity of cases) or to supply-side factors (including the number of personnel or the organization of the court).1
From 2014 to 2016 court productivity, measured by the number of proceedings resolved in the year in relation to the number of judges assigned to civil cases, diminished throughout the country. Divergences persist both between the main geographical areas of the country, with a gap to the detriment of the South and Islands (which has widened slightly in recent years), and within them (see panel (a) of the figure).
There are also differences between the various courts regarding the effective duration of proceedings (the disposition time), which in the South and Islands is more than 50 per cent longer than in the Centre and North (see panel (b) of the figure). In the last three years the disposition time has increased in the
1 S. Giacomelli, S. Mocetti, G. Palumbo and G. Roma, ‘La giustizia civile in Italia: le recenti evoluzioni’, Banca d’Italia, Questioni di Economia e Finanza (Occasional Papers), forthcoming.
Court efficiency (1)
(a) Judges’ productivity (2) (number)
(b) Disposition time (3)(days)
0
200
400
600
800
1,000
1,200
1,400
1,600
2014 2016 2014 2016
Centre & North South & Islands
0
200
400
600
800
1,000
1,200
1,400
1,600
2014 2016 2014 2016
Centre & North South & Islands
0
200
400
600
800
1,000
1,200
1,400
1,600
0
200
400
600
800
1,000
1,200
1,400
1,600
Source: Based on Ministry of Justice data.(1) The charts show the distribution of the variables described: the upper and lower bounds indicate the 90th and 10th percentiles; the rectangle, the interquartile range; and the central line, the mean. – (2) Productivity is measured by the number of proceedings resolved in the year in relation to the number of civil court judges. – (3) The average disposition time refers to the following proceedings: standard civil cases, commercial disputes, employment cases, social security cases, divorces and separations.

BANCA D’ITALIA Annual Report139 2016
South and Islands, while it has diminished, though only slightly, in the Centre and North.
There is evidence that the geographical differences are due only partly to a discrepancy in workloads (the number of new and pending proceedings per judge) and in the complexity of cases (proxied by their distribution by subject matter with different average duration). It emerges instead that they are not attributable to a shortage of judges and administrative staff. Even when all these factors are taken into account, court productivity in the South and Islands is 15 per cent lower than in the Centre and North and proceedings are almost 40 per cent longer. This residual variation could be due to organizational factors.
The objective of the decrees on public sector employment is to improve both the selection process and the allocation of personnel, combating the use of precarious employment contracts and increasing the efficiency of the evaluation system. Although the measures are wide-ranging, the changes envisioned are relatively limited and, once finalized, will not alter the system as a whole. Current precarious employees are expected to be offered stable employment; however, this would delay the implementation of the changes to the recruitment process as precarious workers are slated to fill the job vacancies that arise over the coming years. The measures’ overall effectiveness is further weakened by the failure to implement the law on public sector executives.
COMPOSITION OF EMPLOYMENT IN THE GENERAL GOVERNMENT SECTOR AND CORRUPTION INDICES
The extent of corruption can be estimated using indices that combine measures of the frequency of offences against the public administration and of the perception of corruption and confidence in local institutions. A recent study1 shows that high values of these indices are associated with less ability to attract and select highly educated workers on the part of general government and less suitable assignment of personnel to different duties.
Public sector employees generally have higher educational qualifications than those in the private sector, even when performing equivalent jobs. However, the qualification gap in favour of public sector employees narrows in the areas where the corruption indices are highest; this effect is especially pronounced in the case of managerial positions (see panel (a) of the figure).
Moreover, in such areas, underqualification (i.e. the assignment of employees to tasks usually performed by more qualified personnel) occurs relatively more often in the public sector; again, the phenomenon is more marked in managerial posts (see panel (b) of the figure).
1 S. Mocetti and T. Orlando, ‘Corruption and personnel selection and allocation in the public sector’, Banca d’Italia, Questioni di Economia e Finanza (Occasional Papers), forthcoming.

BANCA D’ITALIAAnnual Report2016140
Composition and allocation of the public sector labour force (1)
(a) Differences between public and private sectors (2)(years of schooling)
(b) Differences between public and private sectors (3)(underqualification rate)
-0.03
-0.02
-0.01
0.00
0.01
0.02
0.03
-0.03
-0.02
-0.01
0.00
0.01
0.02
0.03
All Managers and highly qualified professions
High corruption index values
0.0
0.5
1.0
1.5
2.0
2.5
0.0
0.5
1.0
1.5
2.0
2.5
All Managers and highlyqualified professions
Low corruption index values
Sources: Based on data from the Ministry of the Interior, Ministry of Justice and Istat labour force survey.(1) Includes all employees with non-manual duties and the subset of managers and highly qualified professionals (ISCO groups 1-5 and 1-2); the fields with low (high) corruption index values are those where the frequency (in relation to the number of employees) of offences against general government committed by public officials is below (above) the median. – (2) The columns indicate the difference in years of education between public sector and private sector employees. – (3) The columns indicate the difference in the underqualification rate between public sector and private sector employees; a worker is underqualified when his or her level of education is below the 25th percentile of the nation-wide distribution of educational levels in his/her profession (in ISCO’s 3-digit classification).
Public contracts. – The public procurement code (Decree Law 50/2016) that entered into effect in 2016 completely overhauled the sector’s regulatory framework. In addition, a corrective decree (Decree Law 56/2017) was recently approved to remove certain problems that emerged in the application of the new laws. Under the corrective decree, contracting authorities may use firm ratings to evaluate tenders, a factor which may improve the execution of contracts.
Construction firms reported short-term negative consequences in adapting to the changes ushered in by the new code (see Chapter 6, ‘Firms’). With regard to the long-term effects, positive assessments prevailed: based on the quarterly survey carried out by the Bank of Italy in 2016, the share of firms that expressed a favourable opinion was more than 3 percentage points higher than those that expressed a negative opinion.
Organized crime. – According to Istat estimates the value added generated by illegal activities (drugs, prostitution and contraband cigarettes) amounted to nearly €17 billion in 2014, or roughly 1 per cent of GDP. These figures only reflect those activities that generate added value and that are based on the mutual consent of the parties involved, therefore excluding activities that are redistributive in nature, such as theft, and those that are coercive, like extortion. It also excludes other illegal activities like counterfeiting, usury and arms trafficking.
The wide reach of illegal activity, in large part managed by organized crime, generates significant indirect costs for the legal economy. The laundering of illicit proceeds creates

BANCA D’ITALIA Annual Report141 2016
a competitive disadvantage for honest firms. The use of Mafia-like methods discourages competition and entrepreneurial spirit, thus lowering investment; corruption within the public administration influences public spending decisions, diverting funds towards vested interests.
The lack of confidence in contractual relations and the inadequate sense of security and safety extending to goods and individuals have significantly impeded economic development in southern Italy, where organized crime is historically deeply rooted.2 While maintaining their centres of power in the South, these organizations have expanded their activities to the Centre and North in search of more lucrative markets to invest their proceeds. The infiltration of organized crime in legitimate firms reduces their competitors’ business activity and increases the probability that they will exit the market (see the box ‘The economic effects of the spread of organized crime in the Centre and North of Italy’).
2 P. Pinotti, ‘The economic costs of organized crime: evidence from southern Italy’, The Economic Journal, 125, 586, 2015, F203-F232.
THE ECONOMIC EFFECTS OF THE SPREAD OF ORGANIZED CRIME IN THE CENTRE AND NORTH OF ITALY
Objective indications regarding the infiltration of organized crime at the single firm level are only available following a court order. However, by cross-referencing information from the Ministry of the Interior’s report on the penetration of some criminal organizations (notably the ’ndrangheta) in the Centre and North of the country1 with data on changes in firms’ ownership structure and governance, it is possible to build an indicator – albeit only a statistical one – that is useful in conducting an empirical analysis of the geographical and sectoral distribution of the economic effects of the phenomenon.2
The resulting organized crime infiltration index reveals
1 Osservatorio sulla criminalità organizzata (ed.), Primo rapporto trimestrale sulle aree settentrionali, per la Presidenza della Commissione parlamentare di inchiesta sul fenomeno mafioso, Università degli Studi di Milano, 2014 [Milan University, Observatory on Organized Crime, First Quarterly Report on the North for the Parliamentary Inquiry on the Mafia].
2 L. Mirenda, S. Mocetti and L. Rizzica, ‘The real effects of ’ndrangheta: firm-level evidence’, Banca d’Italia, Temi di Discussione (Working Papers), forthcoming.
Distribution of firms by sector of activity (1) (per cent)
0.00 0.05 0.10 0.15 0.20 0.25 0.30
Others
P+Q
M+N
J+K
I
G+H
F+L
D+E
Share of infiltrated firms (estimate) Total share of firms
Sources: Based on data from Cerved Group, Infocamere and Ministry of the Interior.(1) The infiltration index was built with information in the Ministry of the Interior’s report on the penetration of the ’ndrangheta in the Centre and North and data from Infocamere on firms’ ownership structure and governance. The sectors correspond to the Isic classification: D+E=public utilities; F+L=construction and real estate activities; G+H= wholesale and retail trade, transportation and storage; I=accommodation and food service activities; J+K=information and communication, financial and insurance activities; M+N=professional, scientific, technical, administrative and support service activities; P+Q=education, human health and social work activities; other=remaining sectors.

BANCA D’ITALIAAnnual Report2016142
that the phenomenon is more frequent in the North West. Moreover, it is estimated that firms in the real estate and construction sectors are the ones most affected (see the figure). In public utilities and financial intermediation (chiefly money transfers) the share of firms that have been infiltrated is especially large compared with their sector’s weight in the economy as a whole. Finally, the firms most at risk of infiltration are those with a drop in sales volume and profitability, an increase in their financial burden, and a deterioration in creditworthiness.
An increase in the infiltration index is associated in the short term with an increase in the sales volume of the firm concerned, along with a negative effect on the output of other firms in the same market. For the single firm the result could be due simply to over-invoicing for money laundering purposes; again, it might point to a real improvement in performance due to the injection of new capital at a time of financial difficulty or to the criminal organization’s ability to extort money by intimidation. As the proportion of firms with a strong likelihood of infiltration increases, competitors experience a sharp drop in sales volume and are at greater risk of leaving the market.

BANCA D’ITALIA Annual Report143 2016
13. BANKS AND INSTITUTIONAL INVESTORS
The economic recovery and the expansionary monetary conditions had a positive impact on credit quality for Italian banks in 2016. The flow of new non-performing loans over total loans has fallen back to pre-crisis levels and the stock of NPLs left by the long recession is gradually being reduced.
There was a renewed, though slow, expansion in lending to the private non-financial sector. Loans to households and large firms increased, while those to smaller firms continued to diminish.
Funding rose slightly; Eurosystem refinancing and customers’ deposits increased, offsetting the decline in funding through bond issuance.
Operating profits were squeezed by the sharp drop in revenues and by the higher outlays associated with restructuring plans. Some banks decided to substantially raise their NPL coverage ratio, which led to an increase in write-downs and losses for the entire banking system amounting to 5.7 per cent of equity. The capital adequacy of significant banks, which is still more than 2 percentage points below the average for the leading European banking groups despite having almost doubled in the last ten years, remained broadly stable when taking into account the capital increase finalized by the UniCredit Group in the first quarter of this year.
Under the public support measures for the banking system passed by the Government at the end of 2016, Banca Monte dei Paschi di Siena, Banca Popolare di Vicenza and Veneto Banca were able to take advantage of the State guarantee on bond issues and to apply for precautionary recapitalization with public funds.
This year saw the completion of the sale to Unione di Banche Italiane (UBI Banca) of three of the four bridge banks set up following the resolution in November 2015 of four banks under special administration. A contract was also signed for the sale of the remaining bridge bank to Banca Popolare dell’Emilia Romagna (BPER Banca).
The mutual banking system is currently undergoing a sweeping reform designed to strengthen its capital adequacy. Eight of the ten cooperative banks affected by the 2015 reform have completed their transformation into joint stock companies.
With the rise in interest rates, net inflows towards institutional investors decreased after the sharp increase of the previous two years. Asset management companies saw a small drop in profits, but the earning capacity of insurance companies remained in line with 2015 levels.

BANCA D’ITALIAAnnual Report2016144
The structure of Italy’s banking industry
There are 70 banking groups operating in Italy (comprising 129 banks), 393 stand-alone banks and 82 branches of foreign banks. The Single Supervisory Mechanism (SSM) classifies 14 of these banking groups as significant, whose assets represent 74 per cent of the system total. The largest category of stand-alone banks is that of mutual banks (banche di credito cooperativo, BCC), which number 325, followed by 53 banks set up as joint stock companies and 15 cooperative banks (popolari). At the end of 2016 there were 39 fewer banks in operation than a year earlier.
A reform of mutual banking was enacted in 2016.1 Under the new rules, banks must be a member of a cooperative banking group to obtain or keep their authorization to operate as a BCC. Applications to set up a cooperative banking group must be submitted by 3 May 2018.2 Existing BCCs with net assets in excess of €200 million were given the option of not joining a group and being transformed into a joint stock company on condition that they pay the State a sum equal to 20 per cent of their net assets. The deadline for exercising this option was 14 June 2016; only one BCC was authorized to transfer its business to a joint stock company.
Eight of the ten popolari banks with over €8 billion in assets, which were affected by the 2015 reform, converted into joint stock companies.3 For the remaining two (Banca Popolare di Sondrio and Banca Popolare di Bari) the deadline was suspended pending a ruling by the Constitutional Court.4 Two of the largest of the former popolari banks (Banco Popolare and Banca Popolare di Milano) decided to merge at the same time as transforming into joint stock companies, creating the third largest Italian banking group (Banco BPM), which became operational on 1 January this year.
On 10 May this year, the sale of Nuova Banca delle Marche, Nuova Banca dell’Etruria e del Lazio and Nuova Cassa di Risparmio di Chieti to UBI Banca was completed. In March, a contract was drawn up for the sale of Nuova Carife to BPER Banca.5 The four bridge banks had been set up as part of the crisis resolution of four banks in special administration (Banca delle Marche, Banca Popolare dell’Etruria e del Lazio, Cassa di Risparmio della Provincia di Chieti and Cassa di Risparmio di Ferrara; see Chapter 13, ‘Banks and institutional investors’, Annual Report for 2015, 2016).
1 Legislative Decree 18/2016, amended and converted by Law 49/2016.2 To date, ICCREA, Cassa Centrale Banca, and Cassa Centrale Raiffeisen dell’Alto Adige have applied to become
the parent company of a cooperative banking group.3 Legislative Decree 3/2015, amended and converted by Law 33/2015, and the Bank of Italy’s related implementing
measures.4 In December 2016 the Council of State asked the Constitutional Court to rule on some aspects of the
constitutionality of the reform. As a precautionary measure it also suspended the deadline (fixed by law on 27 December 2016) for the conversion into joint stock companies, as well some of the enactment measures for which it had itself issued instructions. Pending appeals do not call into question any conversions that have already been approved and completed.
5 The bridge bank is to be sold for a symbolic price of €1 following recapitalization by the National Resolution Fund and the spin-off of part of its bad debts and unlikely-to-pay loans. The buyer will also be given certain guarantees (see National Resolution Fund, Annual Report 2016, 2017).

BANCA D’ITALIA Annual Report145 2016
The four banks were resolved under the regulations introduced in Italy to transpose Directive 2014/59/EU, the Bank Recovery and Resolution Directive (see the box ‘The banking resolution regime in the European Union and the United States’).
THE BANKING RESOLUTION REGIME IN THE EUROPEAN UNION AND THE UNITED STATES
In the wake of the financial crisis, both Europe and the United States introduced measures to reform the regulatory framework for banking crisis management.1 In both countries they are in line with the Financial Stability Board’s (FSB) ‘Key Attributes of Effective Resolution Regimes’, although they differ in some important respects.
Overall, the United States allows more flexible use of resolution tools and broader access to public funds, albeit on a temporary basis. This means that crises can be managed in such a way as to minimize the destruction of value and limit the impact on financial stability.
Sources of funding and resolution tools. In Europe, resolution is financed almost exclusively by means of a bail-in. The use of public funds is strictly limited, and the European Commission’s guidelines on State aid narrow the scope even further. The use of government financial stabilization tools (temporary public ownership and public equity support) and of the resolution fund itself are tightly governed: one of the conditions is the bail-in of at least 8 per cent of total liabilities. Every public intervention, including by the deposit guarantee scheme – which the Commission interprets as a form of State aid – automatically triggers the resolution process, with a few exceptions: these include precautionary recapitalizations, which are anyway subject to very stringent conditions and to the principle of burden sharing among shareholders and subordinated creditors. Resolution tools, such as bridge banks, bad banks,2 and sales of assets and liabilities, must be used in compliance with the rules on State aid, which are designed to prevent the distortion of competition. For example, a bridge bank, which operates in competition with other banks, is subject to limitations on its activity; it is also required to comply with minimum capital requirements and the other prudential rules applying to banks.
The US also sets limits on public intervention: the law expressly forbids any bail-out, i.e. the rescue of banks using public funds; the Federal Deposit Insurance Corporation (FDIC) is not allowed to provide financial assistance outside resolution; and recapitalization with public funds is prohibited. However, the US Treasury can finance resolution by granting loans to the Orderly Liquidation Fund (in the case of systemically important banks) or to the Deposit Insurance Fund (for other banks), which will be recovered by selling off the assets of the bank under resolution and, if necessary, by levying
1 In Europe, Directive 2014/59/EU, the Bank Recovery and Resolution Directive (BRRD), and the European Commission’s Banking Communication on State aid set out the regulatory regime for bank resolution. In the United States, the 2010 Dodd-Frank Act introduced a resolution regime for bank holding companies and large and complex financial institutions. The new rules are added to those already in force for other banks.
2 A bridge bank, to which all assets and liabilities are temporarily transferred, is set up and managed by the authorities to ensure the continuity of essential financial services with a view to a later sale on the market; a bad bank is a vehicle to which impaired assets are transferred in order to manage their liquidation.

BANCA D’ITALIAAnnual Report2016146
sums ex post from some creditors and the banking system.3 Unlike the European system, no minimum loss threshold is imposed on creditors in order to access the funds. The use of resolution tools is more flexible; for example, a bridge bank can operate without any capital, or with the amount of capital that the FDIC, at its discretion, deems sufficient, or again with the funds that the FDIC itself can make available.
Banks that are not systemically important. In Europe, resolution tools can only be used when it is in the public interest, that is when it is necessary to safeguard financial stability or to protect depositors and taxpayers; it is as yet unclear how the European Resolution Authority will put this principle into practice. In all other cases, banks are put into liquidation in accordance with national legislation. In the US, banks, including those not systemically important, are not subject to standard insolvency procedures but to a special procedure managed by the FDIC, which has similar powers to those for the resolution of systemically important financial intermediaries.4
In Europe, deposit guarantee schemes can use means other than refunding depositors (e.g. providing financial support for the sale of assets and liabilities) only if such measures are less costly than the refund. Since, under the BRRD, deposit guarantee schemes have preferential status in the distribution of liquidation proceeds (depositor preference), refunding depositors is almost always less costly than other solutions and will therefore be the preferred option even when other measures would minimize the overall cost of the crisis.5
In the US, instead, the FDIC is expected not only to keep its own costs to a minimum, but also to maximize the recovery for creditors. Regardless of depositor preference and of the ‘least cost’ principle, being able to access the Deposit Insurance Fund to finance bank resolution allows the FDIC to choose the solution that best preserves value for creditors. The least cost principle can also be set aside in the systemic risk exception, that is, if it would have serious adverse effects on economic conditions or financial stability and if bypassing the least cost method would avoid or mitigate such adverse effects.6 In general, in the US the rules on competition must be applied taking account of the particular nature of the banking industry and the potential implications for systemic risk and financial stability.7
3 IMF, ‘United States: Financial Sector Assessment Program Review of the Key Attributes of Effective Resolution Regimes for the Banking and Insurance Sectors. Technical Note’, IMF Country Report, 15/171, July 2015.
4 Systemically important financial institutions, which are subject to the Dodd-Frank Act, are put into resolution where liquidation by the standard procedure would seriously jeopardize the financial stability of the United States.
5 The International Monetary Fund is of the opinion that the interpretation of the least cost principle adopted in Europe may leave DGSs unable to fund resolutions in many circumstances and it has called on the European authorities to re-examine this aspect of the regulatory framework (see IMF, ‘Ireland: Financial Sector Assessment Program Technical Note. Financial Safety Net, Bank Resolution, and Crisis Management’, IMF Country Report, 16/313, September 2016).
6 The Treasury Secretary can waive the least cost method on the recommendation of the FDIC and the Board of Governors of the Federal Reserve System.
7 I. Angeloni and N. Lenihan, ‘Competition and state aid rules in the time of the Banking Union’, in E. Faia, Hackethal, M. Haliassos, K. Langenbucher (eds.), Financial Regulation: A Transatlantic Perspective, (Cambridge UK: Cambridge University Press, 2015), 89-123.

BANCA D’ITALIA Annual Report147 2016
Italian banks continued to reorganize their branch networks and distribution channels with a view to improving efficiency. Last year, the number of bank branches was reduced by 4.1 per cent to around 29,000, 15 per cent fewer than in 2008. The largest banks have been downsizing for some years but small banks only started to close branches in 2013. The number of bank branches per 10,000 inhabitants, amounting to 5 in 2015, is higher than the euro-area average of 4.6, but lower than in Spain (6.7) or France (5.6).6
The use of online banking continued to spread in 2016 and by the end of the year 62 per cent of households could access their accounts online and 54 per cent could use home banking services (against 59 and 51 per cent at the end of 2015). Responses to the regional bank lending survey conducted by the Bank of Italy’s branches at the beginning of 2017 indicate that all banks now offer online payment services and almost half also offer savings management services. However, only a very small number grant online consumer credit (17 per cent) or mortgage loans (8 per cent).
At the end of 2016, some 30 per cent of banks had plans to use unstructured data generated within their organization (internal big data) to improve relationships with customers. The data will be used almost exclusively for commercial purposes, e.g. to sift information on customers’ habits in order to offer services and improve combined sales strategies for different products. The 70 per cent of banks that have not yet launched such projects put this down mainly to a lack of IT, human and financial resources.
Assets
Lending. – The section of the euro-area bank lending survey devoted to Italian banks reported that lending stagnated in 2016 and the early months of this year despite generally favourable credit conditions (Figure 13.1). The cause was a decline in lending to general government (down by 3.7 per cent in the twelve months to December) that was only partly offset by an increase (1.0 per cent) in lending to the private non-financial sector.
Low interest rates and rising disposable income bolstered households’ demand for loans. Both mortgage loans (up by 2 per cent) and consumer credit (8.7 per cent) grew at a higher rate than in 2015 (0.4 and 5.2 per cent; see Chapter 7, ‘Households’).
Business lending levelled off in 2016 (up by 0.2 per cent in December) after the prolonged contraction under way since 2012.
Lending dynamics continue to vary across firms: lending to large companies grew by 0.7 per cent, while that to small firms contracted by 2.1 per cent (see Chapter 6, ‘Firms’). The gap persists even when insolvent borrowers, who naturally obtain less credit, are excluded. Considering only borrowers whose loans are not impaired, lending to medium-to-large firms rose by more than 4 per cent, while that to small firms fell slightly (Figure 13.2).
6 Based on ECB data, Report on financial structures, October 2016.

BANCA D’ITALIAAnnual Report2016148
Figure 13.1
Lending by bank size (1)(monthly data; 12-month percentage changes)
2010 2011 2012 2013 20142009 2015 2016 '17-15
-10
-5
0
5
10
15
Five largest groups (2) Small banks (4)
Minor banks (5)
Other large banks (3)
Branches of foreign banks Total
-15
-10
-5
0
5
10
15
Source: Supervisory reports.(1) Data for March 2017 are provisional. Loans include repos and bad debts. Banks are classified according to the composition of banking groups at March 2017 and to unconsolidated total assets at December 2008. Percentage changes are calculated net of the effects of securitizations, reclassifications, write-downs and other changes not due to transactions. – (2) Banks belonging to the groups Banco Popolare, Intesa Sanpaolo, Monte dei Paschi di Siena, Unione di Banche Italiane, and UniCredit. – (3) Groups and stand-alone banks with total assets from €21,532 million to €182,052 million. – (4) Groups and stand-alone banks with total assets from €3,626 million to €21,531 million. – (5) Groups and stand-alone banks with total assets of less than €3,626 million.
Holdings of securities. – Banks’ holdings of non-bank securities decreased by 1.7 per cent in 2016, to just over €500 billion. At the end of the year, €424 billion of this figure consisted of sovereign bonds, including more than €380 billion of Italian government securities.
The share of government securities in total assets diminished. Net purchases of those of other euro-area countries, mainly Spain and Germany, amounted to €8 billion, which did not entirely offset the €12 billion worth of disposals of Italian government securities, including issues by regional and local authorities.
In March this year, Italian public sector securities amounted to 10.3 per cent of banks’ total assets, almost twice the end-2010 value. The share was over 22 per cent for small and minor banks, against 7 per cent for the top five banking groups (respectively 8.8 and 4.2 per cent at the end of 2010).
Figure 13.2
Growth rate of total bank loans and performing loans (1) at December 2016
(12-month percentage changes)
-3
-2
-1
0
1
2
3
4
5
-3
-2
-1
0
1
2
3
4
5
Total loans to households
Total loans to small firms (2)
Total loans to medium-to-large firms
Performing loans to households
Performing loans to small firms (2)
Performing loans to medium-to-large firms
Sources: Supervisory reports and Central Credit Register.(1) Performing exposures at December 2015 that showed no signs of impairment in the 12 months considered. Percentage changes are adjusted to take account of the effects of securitizations, reclassifications, write-downs, and other changes not due to transactions. The sectors are classified according to Ateco 2007. – (2) Limited partnerships and general partnerships with up to 20 workers. Simple partnerships, de facto companies and sole proprietorships with up to 20 workers.

BANCA D’ITALIA Annual Report149 2016
Impaired loans
The large share of non-performing loans in Italian banks’ balance sheets is a legacy of the prolonged and deep recession that severely weakened many firms and triggered a rush of bankruptcies.7 Although the economic situation has since improved, with a decline in new NPLs, the stock of impaired assets remains substantial, partly because of the length of the credit recovery process.
New non-performing loans over total loans decreased by 1 percentage point in 2016, to 2.7 per cent, which is below the 2008 figure of 3.0 per cent. In the first quarter of 2017, the flow of new NPLs for households and firms was broadly stable on an annual and seasonally adjusted basis.
The stock of NPLs, net of write-downs, decreased by €24 billion to €173 billion, and from 10.8 to 9.4 per cent of total outstanding loans (Figure 13.3). Some €81 billion was classified as bad debt, equal to 4.4 per cent of total bank credit.
Figure 13.3
Credit quality of Italian banks and groups: shares and coverage ratios of non-performing loans and bad debts (1)
(per cent)
35
40
45
50
55
60
65
0
2
4
6
8
10
12
2008 2009 2010 2011 2012 2013 2014 2015 2016 (2)
Net share of bad debts
Coverage ratio of bad debts (3)
Net share of other NPLs
Coverage ratio of total NPLs (3)
Sources: Consolidated supervisory reports for banking groups, individual supervisory reports for stand-alone banks.(1) Loans to customers. Unlike previous years’ annual reports, includes non-current assets and asset groups held for sale. Includes banking groups and subsidiaries of foreign banks. Does not include branches of foreign banks. The shares are calculated based on banks’ exposures net of write-downs. The coverage ratio is the ratio of write-downs to the corresponding gross exposures. – (2) Provisional data. – (3) Right-hand scale.
The gross stock of NPLs was reduced through sales of bad debts worth €8 billion, €1 billion more than in 2015; the decrease in the net NPL stock was partly due to much higher coverage ratios. Some banks are finalizing very large value operations, including UniCredit, which plans to sell off €17.7 billion of gross bad debts (see Financial Stability Report, 1, 2017).
7 On the effects of the dynamics of banks’ bad debts during Italy’s double-dip recession under way since 2008, see A. Notarpietro and L. Rodano, ‘The evolution of bad debts in Italy during the global financial crisis and the sovereign debt crisis: a counterfactual analysis’, Banca d’Italia, Questioni di Economia e Finanza (Occasional Papers), 350, 2016; regarding the impact of NPLs on credit supply, see M. Accornero, P. Alessandri, L. Carpinelli and A.M. Sorrentino, ‘Non-performing loans and the supply of bank credit: evidence from Italy’, Banca d’Italia, Questioni di Economia e Finanza (Occasional Papers), 374, 2017.

BANCA D’ITALIAAnnual Report2016150
The NPL coverage ratio, i.e. the ratio of write-downs to total gross impaired exposures, rose by around 5 percentage points, to 50.6 per cent from 45.5 at the end of 2015; the coverage ratio of bad debts increased by almost 4 percentage points, to 62.4 per cent. Most of the write-downs were made by the UniCredit Group with a view to selling off bad debts as part of a plan to strengthen the group.
The bad loan recovery rates of Italian banks in 2006-15 were consistent with the coverage ratios reported in their balance sheets. The number of closed positions recovered by standard workout procedure was much higher than the number of positions sold to specialized investors (see the box ‘Bad loan recovery rates’).
BAD LOAN RECOVERY RATES
The lack of reliable and publicly available data on recovery rates for banks’ bad loans is a source of uncertainty for markets and tends to have a negative effect on the valuation of this type of exposure. The Bank of Italy has attempted to remedy the deficiency, first by conducting a sample survey of recovery procedures for corporate loans,1 and more recently by publishing a study of bad loan recovery rates recorded by the Central Credit Register.2 Studies spanning the decade 2006-15 find that banks had an average recovery rate of 43 per cent (see the figure), which corresponds to 57 per cent of losses, a value in line with the average bad loan coverage rate recorded in banks’ balance sheets at the end of the period (59 per cent in December 2015). The recovery rate for positions closed by standard workout procedure is significantly higher than the rate for exposures sold on the market.
Recovery rates dropped to 35 per cent in 2014-15, partly owing to the increase in positions closed by selling the exposures en bloc to specialized investors, which have an average recovery rate of 23 per cent, against 47 for positions closed by standard procedure. Selling
1 L. Carpinelli, G. Cascarino, S. Giacomelli and V. Vacca, ‘La gestione dei crediti deteriorati: un’indagine presso le maggiori banche italiane’, Banca d’Italia, Questioni di Economia e Finanza (Occasional Papers), 311, 2016.
2 F. Ciocchetta, F.M. Conti, R. De Luca, I. Guida, A. Rendina and G. Santini, ‘Bad loan recovery rates’, Banca d’Italia, Notes on Financial Stability and Supervision, 7, 2017; in this study, recovery rates are calculated as the ratio between the discounted amount recovered (amounts collected up to the time of closure of the position) and the debtor’s exposure when it was classified as a bad loan.
Bad loan recovery rate by year of position closure
(per cent)
0
10
20
30
40
50
60
0
10
20
30
40
50
60
2006 2007 2008 2009 2010 2011 2012 2013 2014 2015
Total recovery rate
Recovery rate of positions not sold
Recovery rate of positions sold to third parties
Source: Based on Central Credit Register data.

BANCA D’ITALIA Annual Report151 2016
Funding
Italian banks increased their funding by 1.2 per cent in 2016 (Figure 13.4), the reduction in wholesale funding being more than offset by the rise in retail deposits and Eurosystem refinancing. The cost of funding continued to diminish thanks to the expansionary monetary policy and drop in bond issuance.
Eurosystem refinancing increased by 29 per cent and at the end of the year accounted for 8.7 per cent of total funding, against 6.8 per cent at the end of 2015. This was largely due to extensive use of targeted longer-term refinancing operations (TLTRO2) in the second half of the year.
Italian banks cut back on wholesale funding, which has a higher cost than central bank refinancing; both non-residents’ deposits and bonds placed with banks and institutional investors were affected. Specifically, the non-renewal of unsecured bonds led to a drop of €20 billion in net issues. The share of wholesale bonds in total funding was down by 1 percentage point in 2016, to 7.4 per cent.
The 1.2 per cent increase in retail funding came from deposits (up 5.1 per cent). Households continued to reduce their bond holdings, which fell to 6.8 per cent of total
prices reflect the extremely high yields demanded by investors,3 as well as the length of the recovery process.
The recovery rate for secured positions was 55 per cent on average in 2006-15, almost 20 percentage points higher than for other positions. The share of secured bad loans has almost doubled since 2006, rising from 25 per cent to 46 in 2015 owing to the increasingly cautious attitude of banks during the economic crisis.
Recovery rates improve when banks are able to speed up the recovery process. However, the rates vary widely across the industry.
The results show that there is ample scope for banks to improve their internal NPL management and recovery processes by deciding which is the best strategy to maximize value: internal management, outsourcing, or market sale. Above all, there appears to be a shortage of adequate databases. Beginning last year, the Bank of Italy has asked banks to fill in a statistical report on single defaulted exposures in order to build up better databases, essential for efficient bad loan management. Ideally, NPLs should be actively managed, but the sweeping adoption of a policy of selling them off would transfer value from the banks to the investors operating on this market. This is the direction taken in the guidelines on NPLs recently published by the Single Supervisory Mechanism (SSM), which encourage banks to adopt a policy of active management of these positions and indicate the best practices in this regard.4
3 L.G. Ciavoliello, F. Ciocchetta, F.M. Conti, I. Guida, A. Rendina and G. Santini, ‘What’s the value of NPLs?’, Banca d’Italia, Notes on Financial Stability and Supervision, 3, 2016.
4 ECB, Draft guidance to banks on non-performing loans, March 2017.

BANCA D’ITALIAAnnual Report2016152
funding (compared with 15.6 per cent in 2011); at the end of 2016 around 15 per cent of these holdings consisted of subordinated bonds.
Figure 13.4
The growth of funding in Italy: contributions of the main components (1)(percentage points; 12-month changes)
-9
-6
-3
0
3
6
9
12
15
Residents’ deposits
Retail bonds
Net liabilities with central counterparties
Wholesale bonds
Non-residents’ deposits
Eurosystem refinancing
Total funding
-9
-6
-3
0
3
6
9
12
15
2011 2013 201420122010 20172015 2016
Source: Supervisory reports.(1) The sum of the contributions is equal to the 12-month change in total funding. The percentage changes in the individual components are calculated net of the effects of reclassifications, changes in exchange rates, write-downs, and other changes not due to transactions. Does not include liabilities with resident Monetary Financial Institutions. Net liabilities with central counterparties represent repo funding with non-residents carried out through central counterparties. The 12-month change in residents’ deposits to November 2015 could reflect the impact of the new deadline for filing self-assessment tax returns, which was 30 November in 2015 and 1 December in 2014.
The funding gap, i.e. the share of loans not covered by retail funding, continued to narrow, reaching 6.1 per cent in December 2016, 2.6 percentage points lower than twelve months earlier and 13 points lower than in 2008. The decrease can be put down to the persistent weakness of credit.
The average cost of funding reached an exceptionally low 0.39 per cent in December 2016, 0.21 percentage points below the year-earlier level. The average rate of interest on deposits was cut from 0.37 to 0.25 per cent, while the average cost of interbank financing, which at end-2016 gave rise to €117 billion of net external liabilities, has been negative since mid-2015.
In March 2017 total funding recorded a twelve-month increase of 2.8 per cent, driven by a further rise in Eurosystem refinancing with the fourth TLTRO2. Retail funding decreased by 0.5 per cent as the drop in bond issues was not offset by an increase in deposits. Wholesale funding diminished by 5.9 per cent.
Profitability and capital
Profitability. - The gross operating profit of Italian banks and banking groups decreased by about a quarter in 2016, mainly owing to the drop in revenues; both net interest income and other income diminished. The gap between revenue and expenditure narrowed by 0.1 percentage points to 1.1 per cent (against 2.0 per cent in 2008). This was mainly due to a reduction in net interest income from loans to households and firms (unchanged in volume) that was not entirely offset by a shift in the composition of funding

BANCA D’ITALIA Annual Report153 2016
towards less costly sources, such as customer deposits. Fee income from investment and asset management services was down 25 per cent on the previous year’s peak.
Operating expenses increased by 2.5 per cent, rising to 73.6 per cent of gross income from 66.4 per cent at the end of 2015. This was due to the extraordinary outlays associated with incentive schemes undertaken by the leading banking groups in order to reduce staff numbers.
Write-downs on loans rose by 47.4 per cent to 1.5 times gross operating profit, compared with 0.8 times in 2015. The decision by some banks to significantly increase the NPL coverage ratio impacted on ROE, which came to -5.7 percentage points net of goodwill impairments, against +3.1 points the previous year (Figure 13.5).
Figure 13.5
Main profit and loss items of Italian banks and groups (1)(percentage points)
-50
-40
-30
-20
-10
0
10
20
30
40
50
2008 2009 2010 2011 2012 2013 2014 2015 2016 (2)
Goodwill impairments
Operating expenses
Net fee income
ROE net of goodwill impairments
Net write-downs
Other non-fee income
Net interest income
ROA (3)
-50
-40
-30
-20
-10
0
10
20
30
40
50
Source: Consolidated supervisory reports for banking groups, individual supervisory reports for stand-alone banks.(1) Relative to average equity in the year. – (2) Provisional data. – (3) Average equity for the year over end-of-year total asset, which is different from the prudential measure.
All the banking systems in Europe experienced a decline in profitability. However, the main contributory factors differed across countries according to the predominant business model (see the box ‘The profitability of the main Italian and European banks’).
THE PROFITABILITY OF THE MAIN ITALIAN AND EUROPEAN BANKS
The profitability of European banks has diminished dramatically with the financial crisis. The return on equity (ROE) of 61 leading banks1 for which data are available from 2006 to 2016 fell by more than 10 percentage points on average, from 14 per cent in 2006-07 to 3.4 per cent in 2015-16, although with wide variations
1 Banks that the European Banking Authority (EBA) has included in the sample for ‘Risk Dashboard. Data as of Q4 2016’ and for which the SNL Financials database has data from 2006 to 2016. The closed sample includes 61 banking groups, of which 14 are Italian, 5 Spanish, 5 French, 16 German, 9 from the United Kingdom and 12 from the Scandinavian countries (Sweden, Norway, Finland, and Denmark).
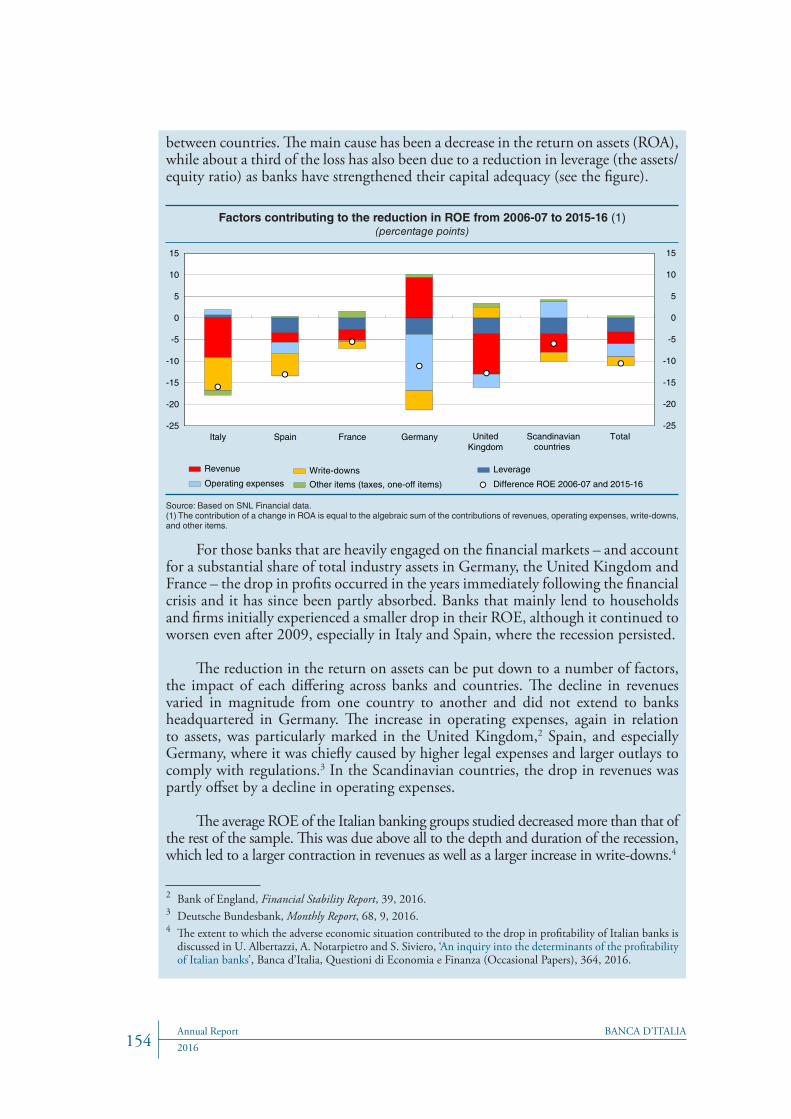
BANCA D’ITALIAAnnual Report2016154
between countries. The main cause has been a decrease in the return on assets (ROA), while about a third of the loss has also been due to a reduction in leverage (the assets/equity ratio) as banks have strengthened their capital adequacy (see the figure).
Factors contributing to the reduction in ROE from 2006-07 to 2015-16 (1)(percentage points)
-25
-20
-15
-10
-5
0
5
10
15
Italy Spain France Germany United Kingdom
Scandinaviancountries
Total-25
-20
-15
-10
-5
0
5
10
15
Write-downs
Other items (taxes, one-off items)
Revenue
Operating expenses
Leverage
Difference ROE 2006-07 and 2015-16
Source: Based on SNL Financial data.(1) The contribution of a change in ROA is equal to the algebraic sum of the contributions of revenues, operating expenses, write-downs, and other items.
For those banks that are heavily engaged on the financial markets – and account for a substantial share of total industry assets in Germany, the United Kingdom and France – the drop in profits occurred in the years immediately following the financial crisis and it has since been partly absorbed. Banks that mainly lend to households and firms initially experienced a smaller drop in their ROE, although it continued to worsen even after 2009, especially in Italy and Spain, where the recession persisted.
The reduction in the return on assets can be put down to a number of factors, the impact of each differing across banks and countries. The decline in revenues varied in magnitude from one country to another and did not extend to banks headquartered in Germany. The increase in operating expenses, again in relation to assets, was particularly marked in the United Kingdom,2 Spain, and especially Germany, where it was chiefly caused by higher legal expenses and larger outlays to comply with regulations.3 In the Scandinavian countries, the drop in revenues was partly offset by a decline in operating expenses.
The average ROE of the Italian banking groups studied decreased more than that of the rest of the sample. This was due above all to the depth and duration of the recession, which led to a larger contraction in revenues as well as a larger increase in write-downs.4
2 Bank of England, Financial Stability Report, 39, 2016.3 Deutsche Bundesbank, Monthly Report, 68, 9, 2016.4 The extent to which the adverse economic situation contributed to the drop in profitability of Italian banks is
discussed in U. Albertazzi, A. Notarpietro and S. Siviero, ‘An inquiry into the determinants of the profitability of Italian banks’, Banca d’Italia, Questioni di Economia e Finanza (Occasional Papers), 364, 2016.

BANCA D’ITALIA Annual Report155 2016
Capital. – The banking system’s capital ratios in 2016 reflected the losses recorded by some of the leading groups. At the end of December, common equity tier 1 (CET1) amounted to 11.5 per cent of risk-weighted assets, some 80 basis points lower than a year earlier. The €13 billion capital increase completed by the UniCredit Group, which was entirely underwritten by private investors in the first quarter of this year, raised capital ratios slightly above 2015 values, bringing the CET1 ratio to 12.4 per cent, the tier 1 ratio to 12.9 per cent, and the total capital ratio to 15.1 per cent.
The CET1 ratio has increased by more than 5 percentage points since the end of 2007 (Figure 13.6); for significant banks it has almost doubled, from 6.1 to 11.6 per cent.
Figure 13.6
Trend of CET1 and risk-weighted assets of Italian banks and banking groups (1)(per cent)
6
7
8
9
10
11
12
13
14
60
70
80
90
100
110
120
130
140
2007 2008 2009 2010 2011 2012 2013 2014 2015 2016 (2)
CET1 (3) Risk-weighted assets (3) Total assets (3) CET1 ratio (4)
Sources: Consolidated supervisory reports for banking groups, individual supervisory reports for stand-alone banks.(1) Up to December 2013, CET1 stood for ‘core tier 1’; from March 2014 it stands for ‘common equity tier 1’. Data for the end of 2016 include the UniCredit group’s capital increase, which was completed at the beginning of 2017. – (2) Provisional data. – (3) Index: 2007=100. – (4) Right-hand scale.
Banks have raised more than €60 billion of eligible capital on the market since 2007. Risk-weighted assets have diminished, reflecting the reduction in the average risk-weighting of assets from 66 to 48 per cent in the period considered. Several factors have been behind this: the main banking groups have adopted internal models for prudential purposes, banks have shifted their portfolios towards less risky assets, and
With the economic recovery, insolvency rates in Italy have come close to pre-crisis averages. If write-downs were also to return to those levels, then, other conditions being equal, the average ROE of the Italian banks in the sample would rise to about 6 per cent,5 which is higher than the -3.9 per cent recorded for the last two years but below the 12 per cent of 2006-07. For profitability to improve further, an increase in revenues needs to go hand in hand with substantial efficiency gains.
5 For the set of Italian banks included in the sample, the ratio of write-downs to total assets in 2006-07 was 0.29 per cent, against 0.8 per cent in 2015-16. To obtain an estimate of net profit based on the net operating result (revenue less expenses and write-downs) we used the ratio of net profit to net operating result for 2006-07.

BANCA D’ITALIAAnnual Report2016156
defaulted exposures have diminished since 2014, partly as a result of increased write-downs. Total assets have remained broadly stable.
The capital adequacy of significant Italian banks is more than 2 percentage points lower than the average for the main European banks (CET1 ratio of 14.2 per cent),8 which had received large injections of public funds in previous years (see the box ‘Public shareholdings in SSM supervised banks’).
8 EBA, Risk Dashboard. Data as of Q4 2016, April 2017.
PUBLIC SHAREHOLDINGS IN SSM SUPERVISED BANKS
In the wake of the public rescues carried out during the financial crisis, the State has acquired a larger role in the capital of European banks.
In September 2016, the public sector held on average 12.1 per cent of the equity of the 125 significant banks supervised by the Single Supervisory Mechanism (SSM) and 11.6 per cent of their assets, though with ample differences across the various countries (see the table).
Public shareholding in the capital of SSM supervised banks (1)(number and average per cent)
(2)Number of banks
per countryNumber of
banks with public shareholdings (2)
Average public shareholding(% of capital)
Average public shareholding(% of assets)
Share of assets (% of total SSM
assets)
France 12 3 6.2 2.6 31.9Germany 21 9 24.9 19.4 20.2Spain 14 1 3.8 6.1 14.7Netherlands 6 4 18.1 27.3 10.3Italy 14 1 0.2 0.3 10.1Belgium 7 2 34.4 37.8 3.3Austria 8 0 0.0 0.0 2.2Finland 4 1 2.8 7.2 2.2Greece 4 4 21.7 21.1 1.3Ireland 4 3 42.7 50.1 1.2Portugal 4 2 54.7 57.3 1.1Luxembourg 6 0 0.0 0.0 0.6Cyprus 4 1 21.4 27.9 0.2Slovakia 3 0 0.0 0.0 0.2Slovenia 3 2 76.1 78.5 0.1Malta 3 1 13.1 14.4 0.1Lithuania 3 0 0.0 0.0 0.1Estonia 2 0 0.0 0.0 0.1Latvia 3 0 0.0 0.0 0.1
Total significant banks 125 34 12.1 11.6 100
Source: ECB for the list of the banks, Bank of Italy for the estimates on data.(1) Data at September 2016. Share of capital held directly by the government (or equivalent) or by regional or municipal public authorities of the home country. – (2) The euro-area countries are listed in decreasing order of size of the national banking systems in terms of total assets.
In some countries there is no public shareholding (Austria, Slovakia, Estonia, Lithuania, Latvia and Luxembourg) or it is very limited, as in Italy, where the total

BANCA D’ITALIA Annual Report157 2016
amount (0.2 per cent) consists of the shareholding in Banca Monte dei Paschi di Siena. In other countries, the State’s shareholding remains substantial following the public intervention of recent years (Portugal, Ireland, Belgium, and the Netherlands). In the case of German banks, the State’s shareholding (on average 25 per cent for the nine banks concerned) is partly to do with the structure of the banking system. The by-laws of almost all the regional banks (Landesbanken) require that public shareholders (federal states and municipalities) should play a significant role, occasionally to the exclusion of any other participant.1 On the other hand, the State’s participation in Commerzbank (15 per cent of its capital) is the result of a rescue bid that took place during the crisis.
In some countries, the size of the public shareholding varies depending on whether it is calculated in relation to capital or to total assets. This reflects the different leverage of the banks. In Germany, for example, the State’s share of capital is far greater than its share of total assets (also high) because the partly State-owned banks have lower leverage (total assets/equity) on average than the rest of the significant banks.
Much of the State intervention that gave rise to the current ownership structure took place before August 2013, when the European Commission’s guidelines on State aid set fewer limits on the provision of public funds to the financial sector.
In practice, the change in the guidelines on State aid created a disparity of treatment between the countries that suffered the effects of the crisis first and the countries in which the need to intervene only became apparent later. The member states that took action to support their banks before the new rules were able to apply much less stringent conditions. A study of the distribution among the member states of the amount of public funds used to support banks since 2008 confirms the wide discrepancy.
1 Germany’s banking system rests on three pillars. The first, which controls about 40 per cent of total assets, consists of private institutions, which include the large universal banks operating worldwide. The second pillar is made up of the regional banks, which control a further 40 per cent of assets. The third and last pillar consists of a large number of independent institutions, the cooperative banks, and the central institutions for the different categories of banks.
Measures to reinforce the banking system’s stability
A package of public support measures for the banking sector was passed in December 2016.9 It provides for State intervention in the form of guarantees on newly issued liabilities and of capital injections; €20 billion has been set aside to finance it. In detail, the decree law sets out the conditions for access to the State guarantee on newly issued liabilities and emergency liquidity assistance (ELA) and the procedures and conditions of State intervention in the form of precautionary public recapitalization. These types of public support are compatible with European rules on State aid and
9 Decree Law 237/2016, amended and converted by Law 15/2017 containing urgent measures for the protection of savings in the banking sector.

BANCA D’ITALIAAnnual Report2016158
on bank recovery and resolution (see the box ‘Government measures to support bank liquidity and capitalization’, Economic Bulletin, 1, 2017).
To date, the banks that have made use of the State guarantee on newly issued liabilities are Banca Monte dei Paschi di Siena (up to a maximum of €15 billion, of which €11 billion have been used), Banca Popolare di Vicenza and Veneto Banca (€3 billion and €1.7 billion respectively).10
At the end of last year, Banca Monte dei Paschi di Siena applied for precautionary State recapitalization, which the SSM has calculated at €8.8 billion.11 Discussions with the relevant authorities focused on the restructuring plan submitted for approval a few months ago to the European Commission, which should issue a decision by the end of June.
Last March, Banca Popolare di Vicenza and Veneto Banca gave notice that they would apply for the precautionary recapitalization measures to put into effect their new business plan, which hinges on a merger between the two banks.
The plan involves selling off some subsidiaries, taking resolute steps to cut costs and to restore a suitable operating expense ratio, in line with the value observed for the Italian banking system in general, and restructuring the NPL portfolio.
NON-BANK FINANCIAL INTERMEDIARIES AND LOAN GUARANTEE CONSORTIUMS
The economic recovery had positive effects on the activity of non-banks. Lending increased by 1 per cent, while the NPL ratio diminished slightly. At the end of 2016, loans by non-banks totalled €116 billion, almost 15 per cent of which were non-performing.
Gross income fell by 1 per cent, mainly owing to a reduction in interest income. Several leasing companies recorded substantial losses on loans with the result that total profitability was negative even though fewer companies closed the year with a loss. The decrease in the total capital ratio from 11.9 per cent in 2015 to 10.5 per cent in 2016 was chiefly due to increased requirements for operating risk provisions.
Guarantees extended by mutual loan guarantee consortiums rose by 2.5 per cent and totalled €8.6 billion at the end of the year. Non-performing exposures amounted to 32.9 per cent of total guarantees, 1 percentage point up on 2015. A little more than half of the consortiums showed a loss, partly because of the high ratio of operating expenses to gross income (90.3 per cent).
10 Against a public financial commitment of €20 billion, the estimated amount required to cover the State guarantee on newly issued liabilities is €770 million, as set out in the technical annex to the decree law.
11 The European Central Bank quantified the requirement on the basis of the 2016 stress test coordinated by the European Banking Authority (EBA) considering the amount of capital needed to restore a CET1 ratio of 8 per cent (the same threshold used in the 2015 comprehensive assessment of Greek banks) – starting from the fully-loaded CET1 ratio of -2.44 per cent recorded by BMPS in an adverse scenario – and a total capital ratio of 11.5 per cent. The latter threshold was necessary to make up for the absence, for the purpose of burden sharing, of the subordinated securities included in total capital. For details of the mechanism used to compute the €8.8 billion requirement see, on the Bank of Italy’s website, ‘L’ammontare della “ricapitalizzazione precauzionale” del Monte dei Paschi di Siena’, published on 29 December 2016.

BANCA D’ITALIA Annual Report159 2016
INSTITUTIONAL INVESTORS
Funding. – Italian institutional investors raised approximately €65 billion in 2016, somewhat less than in the previous year (Table 13.1 and Figure 13.7.a).12 Flows of funds were positive across all sectors of the economy.
Table 13.1
Institutional investors: net flows and assets under management (millions of euros and per cent)
Net flows Assets under management
2015 2016 (1) 2015 2016 (1) Percentage composition
2015 2016 (1)
Investment funds (2) 31.692 16.595 286.402 301.704 15.5 15.5
Insurance companies (3) 55,282 50,861 633,400 680,176 35.0 35.0
Pension funds (4) 3,781 4,425 93,619 104,813 5.2 5.4
Individually managed portfolios 41,831 26,375 801,119 857,563 44.3 44.1
Total 132,586 98,256 1,808,540 1,944,256 100.0 100.0
Consolidated total (5) 98,366 64,562 1,335,342 1,415,007 − −
per cent of GDP 6,0 3,9 81,6 84,6 − −
Memo:Foreign investment funds (6) 68,459 29,067 614,707 659,051 − −
of which: operated by Italian
intermediaries (7) 44,929 20,263 325,151 351,777 − −
Source: Based on Bank of Italy, Ivass, Covip and Assogestioni data.(1) Provisional data. – (2) Italian investment funds. – (3) For assets under management, technical provisions net of reinsurance reserves. Does not include Italian branches of EU insurance companies and includes Italian branches of non-EU insurance companies. – (4) For assets under management, balance sheet assets. – (5) Net of investments in Italian collective investment undertakings by the various categories of financial intermediaries, investments of insurance companies and pension funds in portfolios managed on an individual basis by asset management companies, and the technical reserves of insurance companies associated with the management of open-end pension funds. – (6) Foreign open-end investment funds. Assets under management and net flows are based on the value of the units held and subscribed by Italian investors respectively. – (7) Investment funds operated by management companies established in Luxembourg or Ireland.
The decline in funding concerned principally investment funds and individually managed accounts and can be attributed above all to a decrease in inflows from households, down by €10 billion and €11 billion respectively.
Net subscriptions of pension fund units increased, owing partly to higher contributions and partly to fewer pay-outs for advances and redemptions.
The asset management industry administers an increasingly large share of households’ total financial assets in Italy, though still less than the average for the euro area or for the United Kingdom and the United States (Figure 13.7.b).
12 Funding of the single sectors reported in Table 13.1 includes flows from other institutional investors. Data on consolidated funding are reported in Figure 13.7.a.

BANCA D’ITALIAAnnual Report2016160
The introduction of individual savings plans, i.e. investment tools with tax advantages managed mainly by institutional investors, might help to raise the share of managed products in households’ portfolios.
Figure 13.7
Net flows and assets of institutional investors
Net flows in Italy (1)(billions of euros)
Managed assets as a percentage of households’ total financial assets (2)
(percentage points)
0
10
20
30
40
50
60
70
0
10
20
30
40
50
60
70
Italy Euroarea
UnitedKingdom
UnitedStates
2008 2016
-200
-150
-100
-50
0
50
100
150
2008 2009 2010 2011 2012 2013 2014 2015 2016
Pension funds
Managed portfolios
Insurance companies
Investment funds
Consolidated total
-200
-150
-100
-50
0
50
100
150
Sources: For panel (a), Bank of Italy, Ivass and Covip; for panel (b), Bank of Italy, ECB, OECD, Bureau of Economic Analysis and Federal Reserve.(1) The flows for each sector are gross of funds raised from other institutional investors; only Italian investment funds. For 2016, provisional data. – (2) For the euro area, 19 member countries. For the United States, the pension fund aggregate refers to private, state and local funds and excludes federal retirement plans. Includes foreign funds held by residents.
Investment. – In 2016 institutional investors managed total assets in excess of €1,400 billion, or 85 per cent of GDP, surpassing the all-time highs recorded at the end of the 1990s.
The portfolio share invested in Italian government securities was stable across all the main categories of investors, while there was an increase in investments in corporate bonds, especially those issued by foreign companies. However, the share of securities held by non-residents in Italian institutional investors’ portfolios is still below the average for the euro area (Figure 13.8.b). At the end of 2016 that share was 30 per cent for insurance companies, about 60 per cent for open-end investment funds and individually managed accounts, and 70 per cent for pension funds (Figure 13.8.a).
Going forward, the share of investments in Italian corporate bonds might increase with the development of the closed-end funds sector, to which institutional investors could delegate the task of selection and assessment of investments to be included in their portfolios.
Private debt funds, which have made headway in Italy thanks to the spread of minibonds as a corporate financing tool, raised more than €2 billion in 2016. The assets of private equity funds rose by close to €1.2 billion, reaching a total of €17 billion. Five new Italian credit funds also began operating, with a combined funding target of around €500 million. For the moment, the amount managed by these funds represents only a small portion of the total assets controlled by the industry.

BANCA D’ITALIA Annual Report161 2016
Figure 13.8
Main financial assets of institutional investors (1)
(a) Italian institutional investors (2)(percentage shares)
(b) International comparison (3)(percentage shares)
0
20
40
60
80
100
Italy Euro area
Bonds of residents Bonds of non-residents
0
20
40
60
80
100
Investmentfunds
Pension funds companies
0
20
40
60
80
100
0
20
40
60
80
100
Insurance Asset management
portfolios
Sources: Bank of Italy, ECB, Ivass and Covip.(1) Provisional data. – (2) Assets at book value. For insurance companies, investments to cover technical reserves in the non-life branch and traditional life insurance products (class C); investment funds, individually managed portfolios, and pension funds. Italian UCITS. Among pension funds instituted prior to the 1993 reform, the data include occupational, open-end, and independent funds for which data on asset composition are available. – (3) Does not include individually managed portfolios; data for the euro area do not include Italy.
The growth of new regulated markets for securities issued by small firms could boost demand for such investments. The nominal value of securities listed on ExtraMOT PRO, a branch of Borsa Italiana with simpler listing procedures for bonds and other financial instruments and open to professional investors only, increased by 16 per cent in 2016. At the end of the year, 165 securities issued by 137 firms were listed, for a total value in excess of €6 billion. There was also a 5 per cent increase in the number of firms listed on Borsa Italiana’s Alternative Investment Market (AIM Italia).
Profitability. – The profitability of Italian insurance companies in both the life and non-life sectors remained stable. Low interest rates had a limited effect on profitability owing to the good match of duration between assets and liabilities (see Financial Stability Report, 1, 2017).
The decline in inflows of funds towards investment funds and individually managed accounts contributed to the 1 per cent drop in profits of managers of open-end funds and individual portfolios. Firms specializing in private equity management saw their profitability diminish owing to persistent difficulties in raising new capital, while those specializing in real estate enjoyed better profits thanks to a lower tax burden. The ratio of supervisory capital to the overall capital requirement decreased from 7.0 to 6.3.
European initiatives. – The European Fund for Strategic Investments (EFSI), launched in 2015 as part of the Juncker plan, could produce a larger flow of institutional investors’ capital to the real economy. The European Commission has in fact lowered the capital requirements for insurance companies investing in long-term infrastructure projects that are co-financed by the EFSI. The Fund sponsored 32 projects in Italy in

BANCA D’ITALIAAnnual Report2016162
2016, for a total value of approximately €12.5 billion, more than 70 per cent of which was financed by private capital.
Italian institutional investors can also take advantage of the reform programme undertaken as part of the capital markets union project. The capital requirements were reduced in April 2016 for insurance companies investing in shares of private companies traded on multilateral dealing platforms, in the European Venture Capital Fund, and in the European Fund for Social Entrepreneurship. Moreover, the European Parliament is currently examining a project to create a pan-European framework for credit funds.

BANCA D’ITALIA Annual Report1632016
14. THE MONEY AND FINANCIAL MARKETS
Italy’s financial markets experienced bouts of volatility in 2016, mainly as a result of the growing uncertainty about the economic policy outlook at European and global level. However, the tensions were curtailed by the highly expansionary monetary policy stance in the euro area and by the positive expectations associated with the strengthening economic recovery. Concerns for the soundness of the banking sector emerged at various times during the year, but eased at the beginning of 2017 following the successful completion of some recapitalizations and the launch of other operations.
The yield spreads between Italian and German government securities widened over the year, although on the whole interest rates continued to be low. Lending conditions for Italian firms on bond markets improved further thanks to the sharp drop in yields and credit spreads. One contributory factor was the Eurosystem’s decision to extend its asset purchases to investment grade bonds issued by corporations other than banks. Non-financial corporations raised more capital on equity markets than last year, but slightly less on bond markets.
In 2016 Italy’s stock market index fell by 8 per cent and the banking sector index dropped by more than one third, reflecting the lasting tensions in this sector. However, in the early months of 2017 the general index rose considerably and more than recouped the previous year’s losses; between the beginning of January and mid-May, bank share prices increased by 19 per cent.
The money market
In 2016, the banks’ recourse to the money market continued to decline, thanks to the abundant liquidity in the banking system, which was fuelled above all by the Eurosystem’s asset purchases.
Compared with 2015 the volume of trading in unsecured bank deposits grew on average over the year on the e-MID electronic market, but declined on the over-the-counter market (Figure 14.1.a). Both markets recorded much lower volumes than before the 2008 financial crisis.
Most of the trading in interbank funds continued to be made through repos on the MTS market, with average daily volumes exceeding €100 billion towards the end of the year. The number of such contracts traded on the special repo segment grew considerably from the second half of 2016 (Figure 14.1.b); recourse to this type of instrument is often motivated by a need to make temporary use of specific securities

BANCA D’ITALIAAnnual Report2016164
rather than borrow funds and may have been bolstered by the advancement of the Eurosystem’s purchase programme (see Financial Stability Report, 1, 2017).
Overnight repo interest rates on Italian government bonds were essentially stable and in line with the interest rate on Eurosystem deposits.
Public sector securities
Supply and demand. – In 2016 net issues of Italian public sector securities almost doubled compared with 2015 (up from €27 billion to €53 billion) partly due to the Treasury’s decision to increase its liquid balance. The stock of public sector securities grew from 110.7 to 112.0 per cent of GDP.
The share of Italian general government securities held by the Bank of Italy rose considerably as a result of the purchases made under the Eurosystem’s Expanded Asset Purchase Programme, while the portions held by non-residents, Italian banks and households decreased (see the box ‘Holders of Italian government securities’).
Figure 14.1
Money market trades(monthly averages of daily data; billions of euros)
(a) Uncollaterized (b) Collateralized
2013 2014 2015 '1720160
20
40
60
80
100
MTS-general collateral MTS-special repo
2016 '17 2013 2014 20150
1
2
3
4
0
1
2
3
4
e-MID Over-the-counter (1)
0
20
40
60
80
100
Sources: Based on data from e-MID SIM SpA, MTS SpA and TARGET2-Banca d’Italia data.(1) Uncollateralized money market trades with maturities of up to one week between Italian banks belonging to different groups; estimates based on TARGET2-Banca d’Italia data.
The Eurosystem’s expanded asset purchase programme (APP), which increased its monthly purchase volume in the euro area as a whole from €60 billion to €80 billion between April 2016 and March 2017, continued to affect the allocation of Italian public sector securities among the different categories of Italian and foreign holders (see the figure).
In 2016 the Bank of Italy purchased €119 billion worth of Italian public sector securities under the APP, increasing its share of these assets to 14.5 per cent of the
HOLDERS OF ITALIAN PUBLIC SECTOR SECURITIES

BANCA D’ITALIA Annual Report1652016
total (5.3 percentage points higher than at the end of 2015). Among Italian resident investors, there was a decline in the share held by households (by 0.1 percentage points, to 6.2 per cent), banks (by 0.9 percentage points, to 17.8 per cent), insurance companies (by 0.6 percentage points, to 15.8 per cent) and other holders, mainly other financial intermediaries and financial auxiliaries (by 1.4 percentage points, to 6.8 per cent).
The share of Italian public sector securities held by foreign investors also decreased, by 2.2 percentage points to 36.1 per cent at the end of the year. Net of both Eurosystem holdings (excluding the Bank of Italy) and foreign individually managed portfolios and investment funds attributable to Italian investors, our estimates based on Assogestioni and ECB data put the non-residents’ share at 26.7 per cent (a fall of 2.0 percentage points over 2015),1 well below that held in mid-2011, before the height of the sovereign debt crisis, but above the low of 25.8 per cent held in mid-2012.
According to our estimates based on national sources and securities holdings statistics (SHS) compiled by the Eurosystem, net sales of Italian public sector securities by non-residents (€25 billion in 2016) were mainly attributable to ‘other financial intermediaries’ in the euro area, a sector largely consisting of investment funds, and, to a lesser extent, investors outside the euro area. By contrast, euro-area banks and insurance companies marginally increased their exposure to Italian public sector securities.
Non-resident investors also showed less interest, partly owing to the effects of the APP, in public sector securities issued by the other main euro-area countries, although to different extents. According to national balance of payments statistics, sales of German and French securities by non-residents totalled €110 billion and €11 billion respectively, while stocks of Spanish public sector securities held by non-residents remained substantially unchanged.
1 The share held by the Eurosystem (excluding the Bank of Italy) fell by 0.4 percentage points, while that held by foreign individually managed portfolios and investment funds attributable to Italian investors grew by 0.2 percentage points.
Italian public sector securities by holder (1)(per cent)
2009 2010 2011 2012 2013 2014 2015 2016
Non-residentsNon-residents excluding Eurosystem and round-trip foreign portfolios and funds (2)Italian banksItalian insurance companies Bank of ItalyItalian investment fundsOther Italian investorsItalian households
0
10
20
30
40
50
60
0
10
20
30
40
50
60
Sources: Bank of Italy, Financial Accounts and estimates based on Assogestioni and ECB data.(1) Calculated at market prices, net of securities held by Italian general government entities. Data for a subset of holders. – (2) Securities held by foreign investors net of those held by the Eurosystem (excluding the Bank of Italy) and of foreign individually-managed portfolios and investment funds attributable to Italian investors.

BANCA D’ITALIAAnnual Report2016166
Yields. – In 2016 Italian government securities continued to benefit from the Eurosystem’s expanded APP, as did the other euro-area countries (see the box ‘Long-term yields and term premiums’). The programme was stepped up in March, causing a further marked reduction in yields. The latter were nonetheless hit, though to a limited extent, by some episodes of volatility that affected European and international financial markets over the year, especially in concomitance with the referendums in the United Kingdom and Italy, the US presidential election and in the run-up to elections in the Netherlands and France (see Chapter 3, ‘Macroeconomic developments and fiscal policies in the euro area’).
The level of long-term interest rates on government securities that are considered to be safe, such as the German Bund, is mainly decided by two things: expectations about future developments in short-term rates, which are influenced by the monetary policy stance and by estimates of potential economic growth, and the premiums that investors demand as compensation for the risk of unexpected changes in long-term yields (term premiums).
According to our estimates and those of other institutions,1 the marked decline in long-term euro interest rates recorded during the period of economic and financial crisis, from 2008 to 2016, is attributable in more or less equal measure to the fall in expectations for the ECB’s interest rates and to a gradual reduction in term premiums. The latter are currently at very low or even negative levels. In particular, the term premium on ten-year euro-denominated securities was around 0.5 per cent in 2008 and then decreased to a minimum of about -1.5 per cent in 2016.2
There are several factors that may explain the fall in term premiums. Firstly, the forward guidance provided by the ECB kept the uncertainty over future trends in monetary policy rates low, thereby helping to diminish the risk of unexpected changes in interest rates. Secondly, over the last decade, long-term securities have had a marked tendency to generate capital gains in periods of less favourable economic conditions and during episodes of tension on the financial markets, often offsetting losses on other investments, such as in equity, and thus offering considerable benefits in terms of diversifying financial risk. The extent of these benefits has increased investors’ demand for long-term securities, driving down term premiums.
The purchases made by central banks also contributed greatly to the increase in demand. According to some estimates, the Eurosystem’s and the Federal Reserve’s purchase programmes supposedly reduced term premiums on ten-year euro- and dollar-denominated securities by over 1 percentage point.3
1 P. Hördahl, J. Sobrun and P. Turner, ‘Low long-term interest rates as a global phenomenon’, BIS Working Papers, 574, 2016.
2 M. Pericoli and M. Taboga, ‘A nearly exact Bayesian estimation of non-linear no-arbitrage term structure models’, Banca d’Italia, Temi di Discussione (Working Papers), forthcoming.
3 For an estimation of the effects of the Federal Reserve’s purchases see E.M. Engen, T. Laubach and D. Reifschneider, ‘The macroeconomic effects of the Federal Reserve’s unconventional monetary policies’, Board of Governors of the Federal Reserve System, Finance and Economics Discussion Series, 5, 2015. For an estimation of the effects of the Eurosystem’s purchases, some of the ratios shown by P. Andrade, J. Breckenfelder, De Fiore, P. Karadi and O. Tristani were used. See ‘The ECB’s asset purchase programme: an early assessment’, European Central Bank, Working Paper Series, 1956, 2016.
LONG-TERM YIELDS AND TERM PREMIUMS

BANCA D’ITALIA Annual Report1672016
Overall in 2016 the interest rate on ten-year Italian government bonds rose by about 0.2 percentage points to 1.8 per cent (Figure 14.2.a); the interest rate differential with respect to the corresponding German Bund went up from 97 to 161 basis points (Figure 14.2.b). The widening of sovereign spreads, which continued at the beginning of 2017, also affected other euro-area countries and can be put down above all to growing uncertainty about the economic policy outlook in some countries (see the box ‘Recent developments in Italy’s sovereign spread’). Sovereign spreads began to narrow again between the end of April and mid-May following the outcome of the French presidential elections.
Between the start of 2016 and mid-May 2017, there was a significant increase in the yield spread between Italian and German government bonds; the 10-year spread widened from about 100 to more than 170 basis points.
This increase is not explained by the evolution of economic fundamentals, which are normally the main determinants of sovereign spreads.1 Italy’s macroeconomic outlook has in fact improved, as seen in the gradual strengthening of the economic recovery (see Chapter 5, ‘Overview’), the further increase in the current account surplus of the balance of payments (see Chapter 10, ‘Foreign demand and the balance of payments’), and the overall stability of the debt-to-GDP ratio (see Chapter 11, ‘The public finances’).
1 A. Di Cesare, G. Grande, M. Manna and M. Taboga, ‘Recent estimates of sovereign risk premia for euro-area countries’, Banca d’Italia, Questioni di Economia e Finanza (Occasional Papers), 128, 2012; R. Giordano, M. Pericoli and P. Tommasino, ‘Pure or wake-up-call contagion? Another look at the EMU sovereign debt crisis’, Banca d’Italia, Temi di Discussione (Working Papers), 904, 2013.
RECENT DEVELOPMENTS IN ITALY’S SOVEREIGN SPREAD
Demographic trends and persistent imbalances between the demand for savings and the supply of financial assets are also potentially relevant in explaining the fall in premiums (see the box ‘The determinants of low interest rates’).
Figure 14.2
Yields and yield spreads on BTPs at different maturities(daily data; percentage points)
(a) Yields (b) Yield spreads vis-à-vis the German Bund
2016 '172012 20142013 2015-1
0
1
2
3
4
5
6
7
10 years
2012 20162014 '172013 2015-1
0
1
2
3
4
5
6
7
3 years 5 years
Source: Based on Bloomberg data.

BANCA D’ITALIAAnnual Report2016168
A model that utilizes the information contained in credit default swaps to identify the determinants of the sovereign spreads of the main euro-area countries2 demonstrates that the evolution of sovereign spreads is not explained by an increase in Italy’s default risk, which remains very low, but by an increase in risk premiums possibly demanded for being exposed to the uncertainty related to future economic policies. A substantial part of the increase is due to factors that are common to the euro area but which have a greater impact on more vulnerable issuers. In particular, risk premiums grew markedly following the events that caused a significant increase in political uncertainty at international level, such as Brexit and the presidential elections in France.
There is evidence that the evolution of the Italian spread continues to be closely linked to variables that measure the degree of concern regarding cohesion in the euro area. For example, significant increases in the spread coincided with the peaks recorded in 2015 and 2016 by Google indicators that measure the volume of key word searches relating to the possibility of one or more countries leaving the monetary union.
Looking ahead, the reduction in uncertainty regarding the stability of the monetary union and policies to support growth in Italy may significantly contribute to containing sovereign spreads.
2 J. Li and G. Zinna, ‘How much of bank credit risk is sovereign risk? Evidence from the Eurozone’, Banca d’Italia, Temi di Discussione (Working Papers), 990, 2014.
Trading in the secondary market. – Liquidity conditions on the secondary market in Italian government securities remained relaxed, displaying considerable resilience even in times of high volatility.
Figure 14.3
Trading in the secondary market in government securities
(a) Volume of trading(monthly averages of daily data; billions of euros)
(b) Measures of liquidity(monthly averages of daily data; billions of euros)
2013 2015 2016 '1720140
20
40
60
80
0
3
6
9
12
Market depth (1) Bid-ask spread on BTPs (2)
2016 '172013 2014 20150
2
4
6
8
0
2
4
6
8
BondVision MTS cash
Source: Based on MTS SpA data.(1) Calculated as the daily average of the semi-sum of pending orders on the buy and sell side proposed by market makers in the first 5 best quotes. – (2) Right-hand scale.
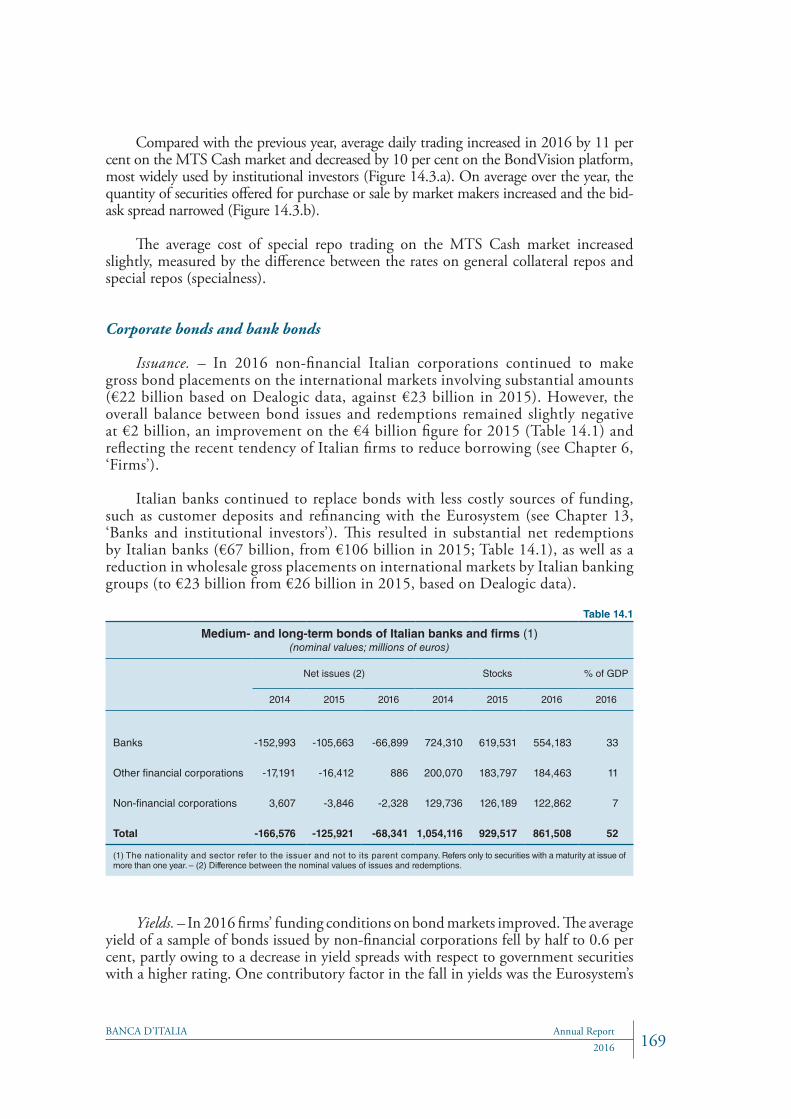
BANCA D’ITALIA Annual Report1692016
Compared with the previous year, average daily trading increased in 2016 by 11 per cent on the MTS Cash market and decreased by 10 per cent on the BondVision platform, most widely used by institutional investors (Figure 14.3.a). On average over the year, the quantity of securities offered for purchase or sale by market makers increased and the bid-ask spread narrowed (Figure 14.3.b).
The average cost of special repo trading on the MTS Cash market increased slightly, measured by the difference between the rates on general collateral repos and special repos (specialness).
Corporate bonds and bank bonds
Issuance. – In 2016 non-financial Italian corporations continued to make gross bond placements on the international markets involving substantial amounts (€22 billion based on Dealogic data, against €23 billion in 2015). However, the overall balance between bond issues and redemptions remained slightly negative at €2 billion, an improvement on the €4 billion figure for 2015 (Table 14.1) and reflecting the recent tendency of Italian firms to reduce borrowing (see Chapter 6, ‘Firms’).
Italian banks continued to replace bonds with less costly sources of funding, such as customer deposits and refinancing with the Eurosystem (see Chapter 13, ‘Banks and institutional investors’). This resulted in substantial net redemptions by Italian banks (€67 billion, from €106 billion in 2015; Table 14.1), as well as a reduction in wholesale gross placements on international markets by Italian banking groups (to €23 billion from €26 billion in 2015, based on Dealogic data).
Yields. – In 2016 firms’ funding conditions on bond markets improved. The average yield of a sample of bonds issued by non-financial corporations fell by half to 0.6 per cent, partly owing to a decrease in yield spreads with respect to government securities with a higher rating. One contributory factor in the fall in yields was the Eurosystem’s
Table 14.1
Medium- and long-term bonds of Italian banks and firms (1)(nominal values; millions of euros)
Net issues (2) Stocks % of GDP
2014 2015 2016 2014 2015 2016 2016
Banks -152,993 -105,663 -66,899 724,310 619,531 554,183 33
Other financial corporations -17,191 -16,412 886 200,070 183,797 184,463 11
Non-financial corporations 3,607 -3,846 -2,328 129,736 126,189 122,862 7
Total -166,576 -125,921 -68,341 1,054,116 929,517 861,508 52
(1) The nationality and sector refer to the issuer and not to its parent company. Refers only to securities with a maturity at issue of more than one year. – (2) Difference between the nominal values of issues and redemptions.

BANCA D’ITALIAAnnual Report2016170
extension of the asset purchase programme to corporate bonds (investment-grade euro-denominated bonds issued by non-bank corporations established in the euro area; see the box ‘The impact of Eurosystem purchases of private sector bonds’).
The drop in yields also extended to bonds issued by Italian banks, not included in the purchase programme, whose yields declined by 0.4 percentage points to 1.0 per cent.
The extension in March 2016 of the Eurosystem’s asset purchase programme to bonds issued by non-bank corporations established in the euro area (corporate sector purchase programme, CSPP), has had a considerable impact on the corporate bond market, with a fall in yield spreads (see panel (a) in the figure) and an increase in gross bond placements (see panel (b) in the figure).
The purchases began on 8 June 2016 and involve investment-grade euro-denominated bonds with a residual maturity of between 6 months and 30 years, issued by non-bank corporations located in the euro area. They can be made on both the primary and the secondary market. Public sector corporate bonds can only be purchased on the secondary market, in compliance with the prohibition of monetary financing. The Eurosystem’s securities purchase policy is designed to preserve liquidity as well as the proper functioning of the market and of the price formation mechanism, respecting the principle of an open market economy with free competition.1
1 For the main characteristics of the eligible securities and further details, see the ECB’s website: ‘ECB announces details of the corporate sector purchase programme (CSPP)’, Press Release, 21 April 2016; ‘More details on the Eurosystem’s corporate sector purchase programme (CSPP): questions & answers’. See also the Bank of Italy’s website: ‘Il programma di acquisto di titoli pubblici e privati dell’Eurosistema’. See Decision No. 2016/868/EU of the ECB of 1 June 2016 on the implementation of the CSPP (ECB/2016/16).
THE IMPACT OF EUROSYSTEM PURCHASES OF PRIVATE SECTOR BONDS
Corporate bonds of euro-area firms
(a) Corporate bond spreads (1) (b) Gross issues (2)
0
200
400
600
800
1,000
0
100
200
300
400
500
'05 '06 '07 '08 '09 '10 '11 '12 '13 '14 '15 '16
Other Firms Banks Total (right-hand scale)
2016 '1760
70
80
90
100
110
120
130
Eligible securities Non-eligible securities
announce-ment of CSPP
start of CSPP
60
70
80
90
100
110
120
130
Sources: Based on Thomson Reuters and Dealogic data.(1) Daily data, in an index number (1 January 2016=100) on option adjusted spreads. The index called ‘eligible securities’ is the BofA Merrill Lynch Euro non-financial index; the index called ‘non-eligible securities’ is the simple average of the BofA Merrill Lynch Euro High Yield and the BofA Merrill Lynch Euro Banking indices. – (2) Annual data, in billions of euros.

BANCA D’ITALIA Annual Report1712016
Based on the monetary policy principle of operational decentralization, CSPP purchases are made by six national central banks, including the Bank of Italy, which act on behalf of the Eurosystem and are coordinated by the ECB. Each central bank is responsible for purchases on market segments identified according to the issuer’s location. The Bank of Italy purchases bonds issued by companies with their registered office in Italy and Dutch bonds issued by companies whose parent company is in Italy. This currently concerns a possible 26 issuers. In making its purchases the Bank of Italy takes account of daily liquidity conditions, thereby contributing to the smooth functioning of the Italian market. Purchases are made with counterparties eligible for Eurosystem monetary policy operations and for the Bank’s financial portfolio investments. The amount of the securities purchased that appeared on the asset side of the Bank’s balance sheet at the end of 2016 came to €5.8 billion.
According to Dealogic data, in the period June-December 2016 euro-area issues increased considerably compared with the early months of the year, both in number and in value. This increase also affected securities not considered eligible for the programme; the share of this type of security in total issuance remained essentially unchanged at about 60 per cent compared with the first five months of 2016 and with the period June-December 2015. In Italy too, new issues of eligible securities rose considerably in the period June-December 2016, both in number and in value, almost doubling compared with the same period of 2015.
Econometric estimations of borrowing conditions for firms at the time of issue2 show that – risk factors relating to individual securities and to issuers being equal – issue yields on securities eligible for the CSPP were lower by around 50 basis points than those on non-eligible securities, both for a basket of euro-area securities and for one of Italian securities, reflecting the impact of the Eurosystem’s demand. The adjustment of investors’ portfolios was driven by purchases, which also had significant effects on non-eligible debt securities on the secondary market, reducing both risk premiums and expected losses.3
Simulations made using a multi-country dynamic general equilibrium model4 suggest that the purchases are helping to drive the economic recovery in the euro area and in Italy. The programme is causing a reduction in bond yields that encourages firms to increase their issues and expand their capital investment. This has positive effects on aggregate demand and therefore on the level of economic activity, on employment and on lending to households and firms to finance consumption and investment.
2 The estimations are based on a sample of 5,300 bonds issued on the international market by non-bank corporations located in 12 euro-area countries in the period 2005-2016 (see A. Zaghini, ‘The CSPP at work: yield heterogeneity in the euro-area corporate bond market’, Banca d’Italia, Temi di Discussione (Working Papers), forthcoming.
3 S. Cecchetti, ‘A quantitative analysis of the risk premia in the corporate bond market’, Banca d’Italia, Temi di Discussione (Working Papers), forthcoming.
4 A. Bartocci, L. Burlon, A. Notarpietro and M. Pisani, ‘Macroeconomic effects of non-standard monetary policy measures in the euro area: the role of corporate bond purchases’, Banca d’Italia, Temi di Discussione (Working Papers), forthcoming.

BANCA D’ITALIAAnnual Report2016172
The equity market
Share prices and trading. – In 2016 the Italian stock exchange index fell by 8 per cent (Figure 14.4.a). Stock prices were buffeted by a fall in expected earnings (3 per cent over a one-year horizon) and affected by the increase in risk premiums demanded by investors (Figure 14.4.b) as a result of the growing political uncertainty in the euro area and lasting tensions in the banking sector. The latter’s index fell by 35 per cent.
In the early months of 2017 equity prices rose significantly and more than recouped the previous year’s losses. The easing of tensions in the banking sector, partly owing to the successful outcome of some recapitalizations, pushed risk premiums down; share prices also benefited from positive figures for economic growth in the euro area and an
Figure 14.4
Equity markets
(a) Share indices(weekly data)
(b) Equity risk premiums(weekly data; percentage points)
2011 2
4
6
8
10
12
14
2
4
6
8
10
12
14
2011 2012 2013 2014 2016 '172015 80
100
120
140
160
180
200
80
100
120
140
160
180
200
Italy Euro area
2012 2013 2014 2015 2016 '17
United States
Sources: Based on Bloomberg and Datastream data.
Figure 14.5
IPOs and gross share issues of non-financial corporations
(a) Number of newly listed corporations in Italy(annual data; number of units)
(b) Gross share issues of non-financial corporations(annual data; number of units)
'06 '07 '08 '09 '10 '11 '12 '13 '14 '15 '16 0
5
10
15
20
25
30
35
France Germany Spain Italy
0
5
10
15
20
25
30
35
'06 '07 '08 '09 '10 '11 '12 '13 '14 '15 '16
Total
Of which: segments for small and medium-sized firms
Sources: Based on Borsa Italiana and ECB data.

BANCA D’ITALIA Annual Report1732016
increase in the expected profits of listed companies. Between the beginning of the year and mid-May the Italian stock exchange index rose by 13 per cent; the bank stocks index increased by 19 per cent.
Supply. – In 2016 the number of initial public offerings declined significantly compared with 2015 (14 IPOs, against 26 in 2015; Figure 14.5.a) and their total value fell by roughly €4 billion to €1.4 billion. Most IPOs involved firms in the equity market segment for small and medium-sized firms (AIM Italia-MAC).
Capital increases by listed companies rose slightly, to roughly €5 billion from €4 billion in 2015, and were mainly made by non-financial corporations. The total value of gross share issues by non-financial corporations rose in Italy and in France, but fell in Germany and Spain (Figure 14.5.b).
Market infrastructure
In 2016 and in the first quarter of 2017 the new European platform for the settlement of securities transactions, TARGET2-Securities (T2S), expanded its activity.1 The central depositaries of the Euroclear group (France, Belgium and the Netherlands) began to operate there, as did the Clearstream Banking depositary (Germany), while Italy’s central depositary, Monte Titoli, had already been active on the platform since August 2015.
In 2016 the volume of transactions settled in T2S through MonteTitoli remained high (€224 billion a day on average; Figure 14.6.a). The incidence of transactions not settled owing to the non-delivery of securities or cash within the allotted time frame (fails) remained low on average until the summer and then increased.
1 See the Bank of Italy’s website TARGET2-Securities (T2S).
Figure 14.6
Market infrastructures
(a) Monte Titoli: value of settled transactions and incidence of fails
(daily data; billions of euros and percentage points
(b) Cassa di Compensazione e Garanzia: value of the initial margins deposited
(monthly averages of daily data; billions of euros)
20142012 2013 2015 2016 '170
2
4
6
8
10
12
0
2
4
6
8
10
12
Bonds sector Equities sector
0
2
4
6
8
10
0
50
100
150
200
250
300
350
400
2016
Value of settled transactions
2017
Percentage of fails (1)
Sources: Monte Titoli SpA and CCG SpA data.(1) Right-hand scale.

BANCA D’ITALIAAnnual Report2016174
The overall amount of guarantees demanded by the central counterparty Cassa di Compensazione e Garanzia (CC&G) fell slightly (Figure 14.6.b). CC&G’s particularly prudent approach enabled the margins applied to remain unchanged even when the markets were at their most volatile.

BANCA D’ITALIA Annual Report1752016
15. PRODUCTIVITY IN ITALY: PERFORMANCE AND DETERMINANTS
In Italy, productivity performance is the main factor holding back long-term economic growth. Since the second half of the 1990s, productivity growth has been feeble both by historical standards and compared with the other main euro-area countries. Developments have differed widely across industries and firms, however, with productivity rising again in manufacturing since the early 2000s but stagnating in private non-financial services; the lag in efficiency can be entirely traced back to small firms.
Signs of a restructuring of the production system have emerged since the beginning of the last decade, and more clearly since 2011, with a reallocation of resources to the best firms. During the recession, market selection became an increasingly important driver: mortality increased among less efficient firms, and new entrants were on average more productive and better able to increase employment and productivity in their first years of life.
Several factors contribute to the efficiency of an economy.1 Some have been addressed by a reform effort that began in 2011; for example, the labour market measures have reduced the gap between fixed-term and permanent employees, increased the incentives for investment in human capital while also fostering the transfer of resources towards more efficient production processes, reducing firms’ costs and offering workers more support than had been available in the past in case of job loss.
Reform action has been less effective to date with regard to other factors. Among these, the obstacles to setting up new businesses, the complexity of crisis management procedures, the length of judicial proceedings, the tax and regulatory disincentives to firms’ growth all have major implications for allocative efficiency and firm demographics. In addition, insufficient human capital, a managerial structure too heavily based on family ownership, and underdeveloped equity capital markets limit firms’ innovative capacity and propensity to adopt advanced technologies. Removing these impediments can create a more business-friendly environment and increase the propensity to invest in order to improve efficiency and expand business.
Productivity and growth
Between 1995 and 2016 Italy’s GDP grew by an average of 0.5 per cent per year, well below the rates recorded in France, Germany and Spain (1.5, 1.3 and 2.1 per cent
1 M. Bugamelli and F. Lotti (eds.), ‘Productivity growth in Italy: a tale of slow-motion change’, Banca d’Italia, Questioni di Economia e Finanza (Occasional Papers), forthcoming.

BANCA D’ITALIAAnnual Report2016176
respectively). The gap with respect to the other euro-area countries was common to all the cyclical phases: the decade before the outbreak of the global financial crisis in 2008 (1.5 per cent in Italy, 2.3 in France, 1.6 in Germany and 3.7 in Spain), the ensuing long recession (-1.5 per cent in Italy, 0.3 in France, 0.6 in Germany and -1.4 in Spain) and the recovery that got under way in 2014 (0.6 per cent in Italy, 1.0 in France, 1.7 in Germany and 2.6 in Spain).
Breaking down GDP growth into its main components shows that in the last twenty years the main driver in Italy was the expansion in employment, buoyed by immigration that more than offset the ageing of the population (Table 15.1). The contribution of hourly labour productivity was instead quite modest (0.3 per cent), far lower than in France, Germany and Spain (1.2, 1.2 and 0.7 per cent respectively). In Italy, capital intensity’s contribution to labour productivity was nil over the period as a whole; it was negative in recent years (2013-16), partly owing to the reduction in
Table 15.1
Breakdown of real GDP growth (1) (2)(average changes in the periods indicated; per cent)
GDP
Contributions to growth
Employ- ment
Popula-tion
Share of pop. of working
age (15-64)
Employ-ment rate
Productivity per
employed person
Hours worked
per employed
person
Hourly productivity
Capital intensity
TFP
A=B+C B=B1+B2+B3 B1 B2 B3 C=C1+C2 C=C3+C4
C1 C2 C3 C4
France
1995-2016 1.5 0.8 0.6 -0.2 0.4 0.8 -0.4 1.2 0.3 0.51995-2007 2.3 1.1 0.6 0.0 0.5 1.2 -0.6 1.7 0.3 0.82007-2013 0.3 0.1 0.5 -0.4 0.0 0.2 -0.3 0.5 0.4 -0.22013-2016 1.0 0.5 0.4 -0.5 0.6 0.5 -0.2 0.7 0.2 0.3
Germany
1995-2016 1.3 0.6 0.1 -0.2 0.7 0.7 -0.5 1.2 0.2 0.51995-2007 1.6 0.5 0.0 -0.2 0.7 1.1 -0.6 1.7 0.4 0.72007-2013 0.6 0.8 -0.1 -0.3 1.2 -0.2 -0.7 0.6 0.0 -0.12013-2016 1.7 1.0 0.8 0.2 0.0 0.8 0.0 0.8 0.0 0.9
Italy
1995-2016 0.5 0.6 0.3 -0.3 0.6 -0.1 -0.4 0.3 0.0 -0.11995-2007 1.5 1.2 0.3 -0.4 1.3 0.3 -0.2 0.5 0.1 0.22007-2013 -1.5 -0.7 0.5 -0.3 -0.9 -0.9 -0.9 0.1 0.1 -0.92013-2016 0.6 0.7 0.1 0.0 0.6 0.0 0.1 -0.1 -0.3 0.2
Spain
1995-2016 2.1 1.4 0.7 -0.2 0.9 0.6 -0.1 0.7 0.4 0.21995-2007 3.7 3.6 1.1 0.1 2.4 0.1 -0.2 0.3 0.1 0.02007-2013 -1.4 -2.9 0.5 -0.5 -2.9 1.6 -0.1 1.7 1.5 0.02013-2016 2.6 2.0 -0.2 -0.4 2.6 0.6 0.2 0.4 -0.4 0.9
Source: Based on the European Commission’s annual macroeconomic database (Ameco). (1) GDP at market prices; chained values, reference year 2010. – (2) The GDP growth rate (A) is broken down into the contributions deriving from the change in employment (B) and from that in labour productivity (C). The contribution per employed person is broken down further into that of the population (B1), the share of the population of working age (B2) and the employment rate (B3). Productivity can be broken down by distinguishing between hours worked per employed person (C1) and hourly productivity (C2) or else between capital intensity (C3) and total factor productivity (C4).

BANCA D’ITALIA Annual Report1772016
investment. The growth rate of total factor productivity (TFP), a measure that proxies for technological and organizational efficiency, was low both compared with the other main countries and by historical standards (see the box ‘Long-term trends in total factor productivity in Italy and other industrialized countries’).
LONG-TERM TRENDS IN TOTAL FACTOR PRODUCTIVITY IN ITALY AND OTHER INDUSTRIALIZED COUNTRIES
A recent paper reconstructed value added as well as the inputs of labour and capital in the Italian economy starting from 1861, making it possible to put Italy’s slow growth in the last twenty years into a historical perspective.1
In terms of economic development, Italy lagged considerably behind the other main industrial countries up to the Second World War, but rapidly closed the gap in the period between 1951 and 1973. This was due to an increase in capital intensity and, especially, to very fast growth in total factor productivity (TFP; see the table). By the end of that process, Italy’s labour productivity had caught up with that of the United Kingdom, although it was still significantly behind that of the United States.
Historical trends in total factor productivity in some industrialized countries (1)(average percentage changes in the periods)
A. Italy GDP TFP B. United Kingdom GDP TFP
1861-1896 1.3 0.3 1871-1891 1.8 0.61896-1913 2.3 0.6 1891-1911 1.7 0.31919-1929 2.7 1.7 1911-1929 1.3 0.61929-1938 1.5 -0.4 1929-1937 2.3 1.11950-1973 6.0 3.5 1950-1973 2.7 1.21973-1995 2.6 1.3 1973-1995 1.2 0.51995-2007 1.5 0.2 1995-2007 2.9 1.42007-2013 -1.5 -0.9 2007-2013 0.4 -0.32013-2016 0.6 0.2 2013-2016 2.3 0.7
C. United States GDP TFP D. Germany GDP TFP
1869-1889 4.3 0.0 1871-1891 2.4 0.71889-1909 4.2 0.8 1891-1911 2.1 0.81909-1929 3.0 1.3 1911-1929 -0.3 0.61929-1937 0.6 0.3 1929-1935 0.1 0.71950-1973 3.6 1.4 1950-1973 5.4 7.01973-1995 1.8 0.3 1973-1995 4.1 2.11995-2007 3.6 1.3 1995-2007 1.6 0.72007-2013 1.0 0.5 2007-2013 0.6 -0.12013-2016 2.3 0.4 2013-2016 1.7 0.9
E. France GDP TFP F. Spain GDP TFP
1995-2007 2.3 0.8 1995-2007 3.7 0.02007-2013 0.3 -0.2 2007-2013 -1.4 0.02013-2016 1.0 0.3 2013-2016 2.6 0.9
Source: C. Giordano, G. Toniolo and F. Zollino, ‘Long-run trends in Italian productivity’, Banca d’Italia, Questioni di Economia e Finanza (Occasional Papers), forthcoming.(1) For Italy GDP is measured as value added net of rental income.
1 C. Giordano, G. Toniolo and F. Zollino, ‘Long-run trends in Italian productivity’, Banca d’Italia, Questioni di Economia e Finanza (Occasional Papers), forthcoming.

BANCA D’ITALIAAnnual Report2016178
However, the gap with the leading countries started to widen again in the 1990s, especially in private services, mainly owing to worsening TFP. Historical data − harmonized between countries − show that between 1995 and 2007 TFP in Italy grew by a mere 0.2 per cent per year, compared with 1.3 per cent in the previous twenty years. In the same period the average annual increase was 0.8 per cent in France, just below that figure in Germany, and close to 1.5 per cent in the United Kingdom and the United States. While in Italy and Germany TFP has been gradually slowing since the mid-1970s, it had instead accelerated in the United Kingdom and the United States, but this was interrupted by the cyclical downturn that began in 2008. TFP declined during the crisis in all the main industrial countries, but the decrease was sharper in Italy; the cyclical upturn over the last three years has led to a widespread recovery in TFP, though more moderately so in Italy.2
2 A new study focusing on trends in Italy in the last twenty years takes into account the composition of productive services of capital and labour and the role of technical progress embodied in capital goods, and finds more favourable indications as to the performance of TFP since the beginning of the crisis, especially in manufacturing (see A. Mistretta and F. Zollino, ‘Recent trends of activity and TFP in Italy with a focus on embodied technical progress’, Banca d’Italia, Temi di Discussione (Working Papers), forthcoming).
In manufacturing, hourly labour productivity rose by 1.6 per cent per year between 2003 and 2007 after stagnating up to the beginning of the last decade and accelerated to 1.9 per cent after 2009. In private non-financial services, instead, it has diminished at an average annual rate of 0.4 per cent over the last 15 years, reflecting declines in business services and stagnation in both retail and wholesale trade and in transport and warehousing services (Figure 15.1).
Figure 15.1
Hourly labour productivity(value added per hour worked at 2010 prices; index: 1995=100)
(a) Manufacturing (b) Private non-financial services (c) Total (1)
80
100
120
140
160
180
200
France Germany Italy Spain
80
100
120
140
160
180
200
'95 '97 '99 '01 '03 '05 '07 '09 '11 '13 '15 '95 '97 '99 '01 '03 '05 '07 '09 '11 '13 '15 '95 '97 '99 '01 '03 '05 '07 '09 '11 '13 '15
Sources: Eurostat, national accounts.(1) Manufacturing and private non-financial services
Italy’s efficiency lag can be traced entirely to the country’s numerous small and micro firms. Those with fewer than 10 workers, which account for more than 95 per cent of the total number of businesses and for respectively 27 and 44 per cent of total value added and employment, display low levels of labour productivity and productivity

BANCA D’ITALIA Annual Report1792016
growth rates that are often worse compared not only with larger firms but also with French and German firms of the same size class (Figure 15.2).
Figure 15.2
Labour productivity by size class: total economy (1)(value added per worker at 2005 prices; thousands of euros)
(a) 1-9 workers (b) 10-49 workers
20
30
40
50
60
70
2005 2006 2007 2008 2009 2010 2011 2012 2013 201420
30
40
50
60
70
2005 2006 2007 2008 2009 2010 2011 2012 2013 2014
(c) 50-249 workers (d) 250 or more workers
20
30
40
50
60
70
2005 2006 2007 2008 2009 2010 2011 2012 2013 2014
Italy Spain
20
30
40
50
60
70
2005 2006 2007 2008 2009 2010 2011 2012 2013 2014
GermanyFrance
Source: Eurostat, Structural Business Statistics.(1) Manufacturing and private non-financial services. The data for 2008 and 2009 are not available for France.
Productivity, allocative efficiency and firm demographics
A country’s aggregate productivity growth rate depends on the efficiency gains achieved by individual businesses and by the ability of the economic and institutional system as a whole to channel resources to the most productive uses (allocative efficiency), partly in connection with firms’ entry and exit from the market.
When there are large productivity gaps between the companies situated on the technological frontier and those that are not,2 the intensity and speed with which resources are reallocated to the best firms can provide an important boost to economic growth. In Italy, the contribution of allocative efficiency – measured by the covariance
2 D. Andrews, C. Criscuolo and P.N. Gal, ‘Frontier firms, technology diffusion and public policy: micro evidence from OECD countries’, OECD, The Future of Productivity: Main Background Papers, 2015.

BANCA D’ITALIAAnnual Report2016180
between size and productivity at firm level3 – to aggregate productivity is less marked than in the other advanced countries.4
According to analyses based on the universe of Italian firms belonging to the non-financial, non-farm private sector,5 there has been evidence of structural change with an increase in allocative efficiency in manufacturing since 2000. After the sovereign debt crisis, this process strengthened, in line with what occurred in other European countries,6 and also extended to private non-financial services, albeit at a milder pace. A comparison among sectors shows that the improvement in allocative efficiency is positively correlated with the intensity of competitive pressures, measured by the degree of market concentration and by the impact of imports from developing countries, where production costs are lower.7
While average company productivity declined, the disparities among firms increased. Before the global crisis, employment had grown at an average annual rate of 1 per cent among the least efficient firms and 3 per cent among the most efficient. Subsequently, and particularly after the sovereign debt crisis, this divergence widened: firm size shrank among all firms except the most productive. These trends stemmed partly from the greater propensity of firms more exposed to competition in international markets to modify their corporate strategies, concentrating their production on more competitive goods and raising their overall efficiency (Figure 15.3).
Firm demographics sustained productivity more strongly during the recession, particularly as a result of market exits, with an increase in mortality rates
3 In an efficient economic system, this covariance should be high because the more productive firms grow more than the others.
4 D. Andrews and F. Cingano, ‘Public policy and resource allocation: evidence from firms in OECD countries’, Economic Policy, 29, 78, 2014, 253-296.
5 A. Linarello and A. Petrella, ‘Productivity and reallocation; evidence from the universe of Italian firms’, International Productivity Monitor, forthcoming, also published in Banca d’Italia, Questioni di Economia e Finanza (Occasional Papers), 353, 2016; A. Linarello. A Petrella and E. Sette, ‘Allocative efficiency and finance’, Banca d’Italia, Questioni di Economia e Finanza (Occasional Papers), 349, 2016, forthcoming.
6 E. Gamberoni, C. Giordano and P. Lopez-Garcia, ‘Capital and labour (mis)allocation in the euro area: some stylized facts and determinants’, Banca d’Italia, Questioni di Economia e Finanza (Occasional Papers), 340, 2016.
7 E. Adamopoulou, E. Bobbio, M. De Philippis and F. Giorgi, ‘Allocative efficiency and aggregate wage dynamics in Italy’, Banca d’Italia, Questioni di Economia e Finanza (Occasional Papers), 340, 2016.
Figure 15.3
Productivity growth of exporting firms by degree of exposure to competition
on international markets, 2000-2014 (1)(average annual changes; per cent)
-1.5
-1.0
-0.5
0.0
0.5
1.0
-1.5
-1.0
-0.5
0.0
0.5
1.0
1 2 3 4 5
Quintiles
Source: Based on Istat data referring to the universe of exporting firms.(1) The horizontal axis indicates the quintiles of the distribution of the rates of change in firms’ potential foreign demand, a measure associated with changes in their degree of exposure to competition on international markets. For each firm, the change in foreign demand was calculated as the average of the growth rates of imports per product and foreign market, weighted by the share of each product and market in the firm’s export sales revenues. The first (last) quintile contains the firms with the lowest (highest) rates of growth in demand on foreign markets For the different quintiles, the bars show the average change in real sales revenues per worker, sector and year being equal.

BANCA D’ITALIA Annual Report1812016
notably among the least efficient firms (Figure 15.4). The support coming from new enterprises intensified somewhat in manufacturing, thanks to the entry of generally more efficient firms than in the past, with higher post entry employment and productivity growth rates. However, the contribution from market entry is limited as a consequence of structural characteristics already in place before the crisis: start-ups in Italy are smaller and grow less and for fewer years than is the case, for example, in the United States.8
Figure 15.4
Firm demographic dynamics and productivity
(a) Productivity by type of firm (value added per worker at 2010 prices;
thousands of euros)
(b) Entry and exit rates(per cent)
0
2
4
6
8
10
12
0
2
4
6
8
10
12
'06 '07 '08 '09 '10 '11 '12 '13 '140
5
10
15
20
25
0
5
10
15
20
25
'06 '07 '08 '09 '10 '11 '12 '13 '14
Entry rate Exit rateEntering Exiting
Source: Based on Istat data referring to the universe of firms.
The determinants of productivity growth
The determinants of productivity are to be sought in the interaction among several company characteristics, the rules governing the functioning of the production factors and output markets, and the legislative and institutional framework. The reforms adopted in Italy since the second half of 2011 have acted on some of these factors, creating the conditions for higher productivity and economic growth in the long term (see the box ‘The assessment of the macroeconomic effects of the reforms’).
8 F. Manaresi, ‘Net employment growth by firm size and age in Italy’, Banca d’Italia, Questioni di Economia e Finanza (Occasional Papers), 298, 2015.
THE ASSESSMENT OF THE MACROECONOMIC EFFECTS OF THE REFORMS
For some time now reforms to strengthen productivity – affecting, for example, the institutional environment, resource allocation, human capital, and the efficiency of the public sector – have been at the heart of the debate on how to spur growth in the European Union and its member states. These reforms have also been the subject of recommendations by the European Commission with respect to the Macroeconomic Imbalance Procedure (MIP).

BANCA D’ITALIAAnnual Report2016182
It is difficult to empirically assess the macroeconomic effect of reforms: the data available are limited by nature and vary little over time, their effects are only seen in the long term and they are not always distinguishable from those of other concurrent factors. For these reasons the recent economic literature has taken two approaches.
The first approach involves estimating, on a sample panel of countries or sectors, the correlations between GDP growth rates (or some other measure of economic performance) and quantitative indicators of certain structural characteristics of the country or the introduction of certain reforms, for example, OECD product market regulation or employment protection legislation indicators. This approach offers useful guidance, but it is often inevitably conducted on a limited number of observations, making it impossible to identify the different channels and causal nexuses.
An alternative approach simulates general equilibrium models, specifying some of the structural characteristics of the economies that may be directly affected by a reform: for example, the degree of market competition for products and services, which is measured by the size of firms’ profit margins, or the trend in total factor productivity. These models have the advantage of serving as a reference for discussion, on a consistent basis, of the mechanisms for transmitting the effects of the reforms. However, they suffer from a certain degree of arbitrariness in the selection of values for the parameters and the effect of the reforms on them. Since these models are usually based on the behaviour of a representative agent, such as a representative firm or a representative household, they are not able to provide information on any distributive impacts of the reforms, which are often broad and influence both economic effects and political feasibility.
Even with these limitations in mind, all the analyses available suggest a positive impact on long-term GDP (table) of the various reforms in Italy in the last ten years. According to the OECD, using the first approach, the reforms undertaken between 2012 and 2015 had a positive effect on GDP equal to 6.3 per cent after ten years.1 Based on the simulations of general equilibrium models, the long-term effects of the liberalization of the service sector undertaken up until 2012 are projected to be between 3 and 6.9 per cent of GDP.2 The European Commission, taking into consideration a broader set of reforms carried out up until 2015, estimates that the long-term effect on GDP is 2.8 per cent.3 The Ministry for Economy and Finance (MEF), referring to all the reforms implemented during the same period, estimates an impact equal to 8.2 per cent.4
1 OECD, Structural Reforms in Italy: Impact on Growth and Employment, 2015.2 A. Gerali, A. Locarno, A. Notarpietro and M. Pisani, ‘Every cloud has a silver lining. The sovereign crisis and
Italian potential output’, Banca d’Italia, Temi di Discussione (Working Papers), 1010, 2015; L. Lusinyan and D. Muir, ‘Assessing the macroeconomic impact of structural reforms: the case of Italy’, IMF Working Paper, 22, 2013.
3 European Commission, ‘The economic impact of selected structural reform measures in Italy, France, Spain and Portugal’, European Commission, European Economy, Institutional Paper, 23, 2016.
4 Ministry for Economy and Finance, Documento di economia e finanza 2016, Sezione III. Programma nazionale di riforma, 2016.

BANCA D’ITALIA Annual Report1832016
Effects of the reforms on GDP in the long term
SOURCE Method Reforms Reform period Horizon Effect on GDP (%)
OECD Reduced-form estimates
(1) (2012-2015) 10 years 6.3
A. Gerali et al. Structural models
Liberalization (2008-2012) Long term (2) 3.0
L. Lusinyan and D. Muir
Structural models
Liberalization (2008-2012) Long term (2) 6.9
European Commission
Structural models
(3) (2012-2015) Long term (2) 2.8
MEF Structural models
(4) (2012-2015) Long term (2) 8.2
(1) The OECD treats all the reforms (liberalization, labour market, tax system, public administration and the justice system) as measurable by using its indicators. – (2) ‘Long term’ refers to the new steady-state equilibrium of the structural model. – (3) Of the reforms carried out in 2012-15 the European Commission only considers those for which there is sound evidence of the effects on the model parameters. – (4) The MEF examines all the reforms during the period 2012-15 that were eligible for the adoption of structural reforms under the Stability and Growth Pact. If the MEF’s assessment is limited to the subset used by the European Commission, the estimated impact declines to 6.1 per cent.
The reforms are not, however, a substitute for policies that stabilize the economic cycle and support demand. An ample body of international literature has shown how the reforms’ short-term effects can be limited or even negative depending on various factors such as the speed and credibility of implementation; economic-cycle conditions; flexibility allowed under monetary policy; financial and real constraints that could delay investment response; and distributive effects.5 Labour market reforms that reduce the costs of dismissing employees could be recessive if enacted during periods of low economic activity. The liberalization of markets, which reduces mark-ups and prices, can be depressive if short-term interest rates are close to zero and economic growth is weak. The distributive consequences of the reforms can lead to resistance by those who do not benefit and can have negative repercussions on aggregate demand in the face of lending constraints.
A growing consensus in the international literature shows that reforms must be designed to mitigate or counter short-term negative effects. An example of this is what occurred with the labour market reform in Italy, with the concurrent introduction of legislation on the termination of employees’ contracts (applying it gradually to new contracts only) and of temporary measures to boost employment in the short term, such as social contribution relief. It is also important that reforms be accompanied by suitable policies to support demand in the short term.
5 IMF, World Economic Outlook, April 2016; OECD, OECD Employment Outlook 2016, 2016; A. Gerali, A. Notarpietro and M. Pisani, ‘Structural reforms, investment and zero lower bound in a monetary union’, The Manchester School, 83, S3, 2015, 102-139.
Innovation and technology. – Innovation and the adoption of new technologies are the chief determinants of increments in firms’ efficiency.
Because of their delayed adoption, information and communication technologies’ contribution to growth was slight between 2000 and 2007; it fell to nil during the crisis but has revived over the last three years. Numerous empirical analyses, based in part

BANCA D’ITALIAAnnual Report2016184
on Italian firms, find a positive link between expenditure on research and development (R&D) and company productivity; this link persists even when an indicator of the propensity to realize innovations is used in place of expenditure, a measure that better captures the innovative effort of small firms, which often introduce changes without making or officially recording R&D investment.9
Taking account of a set of indicators, the European Commission ranks Italy among the ‘moderate innovators’, with a lag vis-à-vis the main euro-area countries. In 2016 investment in intangibles made up 15.8 per cent of total investment in Italy, a smaller share than in France (24 per cent) and Germany (18 per cent). The ratio of R&D expenditure to GDP in Italy, though inching upwards since 2006, is still below the European Union average (1.3 against 1.9 per cent), especially as regards the private sector component. The number of patents filed with the European Patent Office by Italian residents has been rising since 2015, but the overall share is still low by international standards.
Italy’s innovation gap stems from multiple factors: small firm size, the shortage of human capital, the availability of financing and the institutional context (see Chapter 11, ‘Innovation’, in the Annual Report for 2012). The set of policies intended to support innovation has been thoroughly revised since 2013. In accordance with international best practices, they envisage intervention along the whole chain of innovation: financing of start-ups, fiscal incentives for R&D, and a patent box.
Regulation. – Spurs to competition, which also reflect sector-specific regulations, foster innovation and productive and allocative efficiency by encouraging an optimal use of resources within individual firms and across sectors and firms.
Studies based on the product market regulation (PMR) indicators developed by the OECD show that excessively tight regulation in some branches of services impedes resource reallocation, investment in intangibles and changes in firm demographics, acting as a drag on productivity. There are also negative impacts on the growth rates of value added, productivity and exports of the manufacturing firms that need those services.10 Assessments of the measures to liberalize retail trade introduced in Italy at the end of the 1990s find positive effects on employment, productivity and technological innovation; in addition, sale prices fell, to the benefit of consumers.11
According to the PMR indicators, Italy is in an intermediate position in the ranking of countries analysed (see Chapter 9, ‘The productive economy and the reforms’, in the Annual Report for 2013). However, regulation in sectors such as retail and wholesale trade, postal services and professional services remains among the most restrictive.
9 B.H. Hall, F. Lotti and J. Mairesse, ‘Employment, innovation and productivity: Evidence from Italian microdata’, Industrial and Corporate Change, 17, 4, 2008, 813-839; B.H. Hall, F. Lotti and J. Mairesse, ‘Innovation and productivity in SMEs: empirical evidence for Italy, Small Business Economics, 33, 2009, 13-33.
10 G. Barone and F. Cingano, ‘Services regulation and growth: evidence from OECD countries’, The Economic Journal, 121, 555, 2011, 931-957.
11 E. Viviano, ‘Entry regulations and labour market outcomes: evidence from the Italian retail trade sector’, Labour Economics, 15, 6, 2008, 1200-1222; F. Schivardi and E. Viviano, ‘Entry barriers in Italian retail trade’, The Economic Journal, 121, 551, 2011, 145-170.

BANCA D’ITALIA Annual Report1852016
The degree of competition is also affected by the regulatory burdens weighing on start-ups. In addition to sector-specific constraints on market access (for example, restrictions on the number of operators or legal limits on certain activities), the costs of entering the market also depend on the complexity of the procedures for setting up and starting a business. According to the World Bank’s Doing Business indicators, the costs of red tape for starting a business are generally higher in Italy than in other developed economies.
Recent studies indicate that the reduction of administrative barriers to entry has positive effects. The 2010 reform of the one-stop-shop for productive activities raised the birth rate of firms by 0.2 percentage points, an increase concentrated among sole proprietorships and in the private services and construction sectors (see the box ‘Start-up costs and firm dynamics’ in Chapter 11 of the Annual Report for 2014). According to a model simulated on the Italian economy, shortening the time required to start up a business would have a stronger positive effect on GDP and total factor productivity than that linked to a reduction of monetary costs (see the box ‘Limiting red tape for start-ups’ in Chapter 12).
Productivity growth is also influenced by the set of rules governing company crisis procedures. Good bankruptcy law assists the reallocation of resources by shortening the time and reducing the costs of market exit by firms that are no longer profitable and facilitating the restructuring of those in temporary difficulty; reducing the costs associated with a possible bankruptcy improves credit conditions12 and promotes the creation of new businesses. The Doing Business indicators show that crisis management procedures are lengthier and costlier and the recovery percentages lower in Italy than in the other euro-area countries; the degree of efficiency of the civil justice system plays a role in this too.
The judicial system. – The channels through which an efficient justice system exerts a positive influence on productivity and resource allocation are multiple and arise from its crucial role in ensuring the enforcement of contracts and property rights. By lessening the need to resort to informal mechanisms, such as reputation or long-term business relations, in order to guarantee fulfilment of contractual obligations, an effective safeguarding of contracts reduces the competitive advantage of incumbent firms, favouring the entry of new businesses and increasing competition; it also has positive effects on the credit market, helping to improve the terms and conditions offered to new firms and to businesses with opportunities for growth.
According to the Doing Business indicator, the efficiency of Italy’s civil justice system is low by international standards (see Chapter 12, ‘Business activity regulation and the institutional environment’). Studies comparing courts’ respective areas of jurisdiction show that where the functioning of the justice system is more efficient, manufacturing firms are on average larger and more likely to participate in global value chains as suppliers of intermediate inputs.13
12 G. Rodano, N. Serrano-Velarde and E. Tarantino, ‘Bankruptcy law and bank financing’, Journal of Financial Economics, 120, 2, 2016, 363-382.
13 S. Giacomelli and C. Menon, ‘Does weak contract enforcement affect firm size? Evidence from the neighbour’s court’, Journal of Economic Geography, 2016, 1-32; A. Accetturo, A. Linarello and A. Petrella, ‘Judiciary efficiency and trade in tasks’, Banca d’Italia, Questioni di Economia e Finanza (Occasional Papers), forthcoming.

BANCA D’ITALIAAnnual Report2016186
Legal enforcement. – The presence on the market of firms that do not play by the rules, evading taxes, bribing public officials or operating in tandem with criminal organizations, limits the ability of the economy to grow through different channels. (see Chapter 12, ‘Business activity regulation and the institutional environment’)
Tax evasion, which is extensive in Italy by international standards, together with the high tax burden and the complexity and instability of tax law, fuels unfair competition that reduces the returns to innovation and dampens business dynamism, with negative effects on productivity growth. It is estimated that, in the absence of evasion, average annual GDP growth would have been at least 0.2 percentage points higher in the period 1995-2006 (see the box ‘Taxation and corporate dynamics’ in Chapter 6 of the Annual Report for 2015).
According to international indicators that measure the spread of corruption,14 Italy has one of the highest levels in the EU. There is evidence that corruption reduces the growth of output in the Italian regions and the efficiency of their public investment expenditure;15 organized crime erodes economic growth, partly by diverting public resources for its own benefit16 (see the box ‘The economic effects of the spread of organized crime in the Centre and North of Italy’ in Chapter 12); a higher crime rate is associated with a smaller supply of bank credit, to the detriment of investment.17
Human capital. – The differences in human capital resources between Italy and other countries go a long way toward explaining those in per capita GDP growth.
The use of skilled workers is crucial in producing innovation. Studies conducted on Italian firms confirm that greater human capital resources are associated with a higher return on R&D spending18 and a greater propensity to undertake the organizational innovations that go together with the adoption of new technologies.
Italy lags significantly behind other industrial countries in terms of the levels of formal education and competencies actually possessed by the population with the same levels of educational attainment. In 2015, 60 per cent of the population aged 25 to 64 had a high school qualification and 18 per cent a university degree, against an average of 79 and 32 per cent respectively in the European Union. The gap is only
14 Transparency International, Corruption Perception Index 2016, 2017.15 N.Fiorino, E. Galli and I. Petrarca, ‘Corruption and growth: evidence from the Italian regions’, European Journal
of Government and Economics, 1, 2, 2012, 126-144; A. Del Monte and E. Papagni, ‘Public expenditure, corruption and economic growth: the case of Italy’, European Journal of Political Economy, 17, 1, 2001, 1-16.
16 P. Pinotti, ‘The economic costs of organized crime: evidence from southern Italy’, The Economic Journal,125, 586, 2015, F203-F232; G. Barone and G. Narciso, ‘Organized crime and business subsidies: where does the money go?’, Journal of Urban Economics, 86, 2015, 98-110; G. Barone and S. Mocetti, ‘Natural disasters, growth and institutions: a tale of two earthquakes’, Journal of Urban Economics, 84, 2014, 52-66; L. Mirenda, S. Mocetti and L. Rizzica, ‘The real effects of ‘ndrangheta: firm-level evidence’, Banca d’Italia, Temi di Discussione (Working Papers), forthcoming.
17 E. Bonaccorsi di Patti, ‘Weak institutions and credit availability; the impact of crime on bank loans’, Banca d’Italia, Questioni di Economia e Finanza (Occasional Papers), 52, 2009.
18 B.H. Hall, F. Lotti and J. Mairesse, ‘Evidence on the impact of R&D and ICT investments on innovation and productivity in Italian firms’, Economics of Innovation and New Technology, 22, 3, 2013, 300-328.

BANCA D’ITALIA Annual Report1872016
partly due to the paths chosen by past generations: the share of university graduates in the population aged 25 to 34 (25 per cent) is also lower than the EU average (32 per cent). The low rate of participation in formal schooling directly affects people’s logical, analytical and cognitive abilities: in the survey conducted as part of the Programme for the International Assessment of Competencies (PIAAC)19 with reference to 2012, Italy ranked lowest among the OECD countries in language skills and near the bottom in numeracy; the higher the education level, the bigger the gap, suggesting critical weaknesses in the functioning of the education system.
Despite the low percentage of workers with a diploma beyond compulsory schooling, the returns to education in Italy are low by international standards. This reflects a production structure that continues to rely mainly on less skilled workers and a significant difficulty in matching labour demand and supply, which provides little incentive for investment in human capital.20
Ownership and management structure. – Firms’ ownership and management structure determines their strategic choices and the quality of their managerial practices, affecting their propensity to grow and to innovate.
Concentrated ownership, as in family businesses, can help reduce information asymmetries and possible conflicts between ownership and control, fostering corporate strategies that look to the long term. However, the prevalence of one family in a company’s ownership may make it less open to new equity investors and overly cautious in its management, with adverse effects on innovation, the adoption of new technologies and the propensity for internationalization; the presence of too many family firms can curb the ability of the production system as a whole to shift towards sectors and projects offering higher returns.21
Compared with other countries, Italy has a high percentage of family-owned businesses. According to the data of the research project ‘European Firms in a Global Economy’ on a sample of manufacturing firms with 10 or more workers, the share of firms under family ownership is nearly 90 per cent in Germany and Italy, slightly lower in France and the United Kingdom. Our calculations based on Chamber of Commerce data for the universe of corporations and partnerships indicate that the share of family firms – defined as those in which more than two-thirds of the members belong to the two main families – rose by 10 percentage points, from 55.5 to 65.6 per cent, between 2008 and 2015. The share is higher in agriculture, traditional manufacturing industries, hospitality, retail trade and in the South of Italy.
Family firms, particularly those in Italy, tend to prefer an executive selection process based on closeness and loyalty to the owners rather than on specific expertise with regard
19 The PIAAC survey, conducted by the OECD in more than 40 countries throughout the world, evaluates a population’s cognitive skills (literacy, numeracy and problem-solving in complex environments).
20 F. Colonna, ‘Chicken or the egg? Human capital demand and supply’, Politica economica, 33, 1, 2017, 97-124.21 C. Michelacci and F. Schivardi, ‘Does idiosyncratic business risk matter for growth?’, Journal of the European
Economic Association 11, 2, 2013, 343-368.

BANCA D’ITALIAAnnual Report2016188
to the company’s business sector and strategies.22 This negatively affects the quality of management and managerial practices and, consequently, production efficiency.23
In Italian and German family firms, the managing director or entrepreneur is often a member of the owner family, but only in Italy is there a large proportion of firms in which all the managerial roles are filled by members of the owner family.24 In these businesses, the propensity to innovate is lower (see Chapter 11, ‘Innovation’, in the Annual Report for 2012).
The financing of firms. – The financial system promotes company growth and efficiency gains by supplying the resources needed to undertake innovative investment and projects, and it helps to decide the allocation of resources among existing firms and the intensity of firm demography by selecting the business initiatives that deserve financing.
Bank loans are the main source of external financing in Italy. A severe tightening of credit can have significant effects on the real economy: in the four years 2007-10, the decline in credit supply caused by the crisis accounted for about a quarter of the total fall in investment.25 On the other hand, restrictions on credit supply during the recent crisis fostered the downsizing of the least efficient firms and their exit from the market, thereby positively influencing the growth of aggregate productivity.26
Unlike the other advanced countries, in Italy bank debt is the chief source of financing for innovation after internal resources. This reflects firms’ undercapitalization and the underdevelopment of the venture capital sector, shortcomings that were recently addressed with fiscal policy measures (see Chapter 6, ‘Firms’). An analysis of firm-level data for the period 1998-2014 confirms that an expansion in bank lending has a positive impact on productivity growth, spurring an increase in R&D spending.27
However, bank debt is less suitable for financing initiatives marked by high risk and pronounced information asymmetries, and its widespread use could therefore reduce the total amount of funds available for innovation and direct them towards projects that are less innovative in scope. This effect is more marked among younger firms with more growth potential but less collateral available.
The banking system is also decisive in shaping firm dynamics. An increase in competition in the credit market is associated with higher firm entry and survival rates
22 O. Bandiera, L. Guiso, A. Prat and R. Sadun, ‘Matching firms, managers, and incentives’, Journal of Labor Economics, 33, 3, 2015, 623-681; F. Lippi and F. Schivardi, ‘Corporate control and executive selection’, Quantitative Economics, 5, 2, 2014, 417-456.
23 N. Bloom, R. Sadun and J. Van Reenen, ‘The organization of firms across countries’, The Quarterly Journal of Economics, 127, 4, 2012, 1663-1705.
24 M. Bugamelli, L. Cannari. F. Lotti and S. Magri, ‘Il gap innovativo del sistema produttivo italiano: radici e possibili rimedi’, Banca d’Italia, Questioni di Economia e Finanza (Occasional Papers), 121, 2012.
25 F. Cingano, F. Manaresi and E. Sette. ‘Does credit crunch investment down? New evidence on the real effects of the bank-lending channel’, The Review of Financial Studies, 29, 10, 2016, 2737-2773.
26 A. Linarello, A. Petrella and E. Sette, ‘Allocative efficiency and finance’, Banca d’Italia, Questioni di Economia e Finanza (Occasional Papers), forthcoming.
27 F. Manaresi and N. Pierri, ‘Credit constraints and firm productivity: evidence from Italy’, Mo. Fi. R. Working Paper, 137, 2017.

BANCA D’ITALIA Annual Report1892016
and in allocative efficiency.28 The pronounced credit frictions observed during the crisis slowed the growth of start-ups in their early years of life.29
The labour market and industrial relations. – Regulation that entails significant labour adjustment costs harms productivity growth,30 impairing the ability of firms to respond to external shocks and reducing allocative efficiency and the propensity to start new businesses in more dynamic but riskier sectors. On the other hand, an excessive instability in employment relations can weaken a firm’s incentive to invest in employee training; the interest in training is lessened from the workers’ point of view as well, if the skills acquired are too specific to the firm’s requirements and thus are not easily marketable.31 Effective, active policies, which favour the matching of labour demand and supply and human capital accumulation during periods of unemployment, increase the likelihood of re-employment32 and help to boost allocative efficiency.
In recent years the labour market has been affected by far-reaching reform measures.33 A shift in the composition of new hiring towards more stable jobs has been encouraged;34 firms have been given more certainty as to the costs of individual dismissals; the employment shock absorber system has been extended and rationalized, so that it now offers universal unemployment insurance comparable to that of the other main European countries; a redesigning of active policies is currently under way (see the box ‘The Jobs Act: a preliminary evaluation’ in Chapter 8 of the Annual Report for 2015).
Another factor that can impinge on a firm’s productivity is the system of industrial relations, particularly the importance and scope of company-level bargaining. The latter can be conducive to agreements that provide greater organizational flexibility and more extensive worker participation in decision-making, resulting in proposals for changes in the way production is organized and assisting their implementation. In addition, company pay policies based on the attainment of individual and firm-level objectives favour an alignment between wages and productivity and make it possible to better motivate workers. In Italy, the subordination of company-level contracts to national labour agreements limits their importance and prevalence (see the box ‘Current trends in labour relations’ in Chapter 8).
28 F. Lotti and F. Manaresi, ‘Finance and creative destruction: evidence for Italy’, Banca d’Italia, Questioni di Economia e Finanza (Occasional Papers), 299, 2015.
29 F. Manaresi and F. Scoccianti, ‘Battle Scars. New firms’ capital, labour and revenue growth during the double-dip recession’, Banca d’Italia, Questioni di Economia e di Finanza (Occasional Papers), forthcoming.
30 D.H. Autor, W.R. Kerr and A.D. Kugler, ‘Does employment protection reduce productivity? Evidence from US states’, The Economic Journal, 117, 521, 2007, F189-F217; A. Bassanini, L. Nunziata and D. Venn, ‘Job protection legislation and productivity growth in OECD countries’, Economic Policy, 24, 58, 2009, 349-402.
31 M. Belot, J. Boone and J. Van Ours, ‘Welfare-improving employment protection’, Economica, 74, 295, 2007, 381-396; L. Cappellari, C. Dell’Aringa and M. Leonardi, ‘Temporary employment, job flows and productivity: a tale of two reforms’, The Economic Journal, 122, 562, 2012, F188-F215.
32 D. Card, J. Kluve and A. Weber, ‘What works? A meta analysis of recent active labor market program evaluation’, Journal of the European Economic Association, forthcoming.
33 Law 92/2012 (the Fornero reform) and the rules introduced in 2015 on the basis of Enabling Law 183/2014 (the Jobs Act).
34 P. Sestito and E.Viviano, ‘Hiring incentives and/or firing cost reduction? Evaluating the impact of the 2015 policies on the Italian labour market’, Banca d’Italia, Questioni di Economia e Finanza (Occasional Papers), 325, 2016.


BANCA D’ITALIA Annual Report191 2016
ADMINISTRATION OF THE BANK OF ITALYAT 31 MAY 2017
G O V E R N I N G B O A R D - D I R E C T O R A T E
Ignazio VISCO GovernorSalvatore ROSSI Senior Deputy GovernorFabio PANETTA Deputy GovernorLuigi Federico SIGNORINI Deputy GovernorValeria SANNUCCI Deputy Governor
B O A R D O F D I R E C T O R SFranca Maria ALACEVICH Gaetano MACCAFERRIFrancesco ARGIOLAS Cesare MIRABELLINicola CACUCCI Ignazio MUSUCarlo CASTELLANO Lodovico PASSERIN D’ENTREVESPaolo DE FEO Donatella SCIUTOGiovanni FINAZZO Orietta Maria VARNELLIAndrea ILLY
B O A R D O F A U D I T O R SDario VELO - ChairmanLorenzo DE ANGELIS Angelo RICCABONIGian Domenico MOSCO Sandro SANDRI
A L T E R N A T E A U D I T O R SGiuliana BIRINDELLI Anna Lucia MUSERRA
HEAD OFFICEM A N A G I N G D I R E C T O R S
Augusto APONTE - managing director for internal auditCorrado BALDINELLI - director general for human resources and organizationCarmelo BARBAGALLO - director general for financial supervision and regulationEbe BULTRINI - director general for information technologyLuigi DONATO - director general for property and tendersEugenio GAIOTTI - director general for economics, statistics and researchPaolo MARULLO REEDTZ - director general for markets and payment systemsMarino Ottavio PERASSI - general counselRoberto RINALDI - accountant general and interim director general
for currency circulationGiuseppe SOPRANZETTI - managing director with special duties
and manager of the milan branch
* * *Claudio CLEMENTE - director of the financial intelligence unitDaniele FRANCO - state accountant general