ANNUAL REPORT - avation · annual report 2010 4 contents page chairman’s statement 5 company...
52
ANNUAL REPORT 2010
-
Upload
nguyenngoc -
Category
Documents
-
view
213 -
download
0
Transcript of ANNUAL REPORT - avation · annual report 2010 4 contents page chairman’s statement 5 company...

ANNUAL REPORT
2010

ANNUAL REPORT 2010
2
OUR FLEET
Model Airbus A321-200 Airbus A321-200Details MSN 1921 MSN 1881Date of Acquisition 30 June 2008 30 June 2008
Lessee Thomas Cook (OY-VKB) Thomas Cook (OY-VKA)Operational Area Europe, Scandinavia Europe, Scandinavia
Model Airbus A320-200 Airbus A320-200Details MSN 429 MSN 052Date of Acquisition 2 April 2010 25 March 2008Lessee Skywest Airlines (VH-FNP) US Airways Inc (N620AW)Operational Area Australia North America
Model Fokker 100 Fokker 100Details MSN 11461 MSN 11391Date of Acquisition 25 September 2007 31 July 2008Lessee Skywest Airlines (VH-FNT) Skywest Airlines (VH-FSW)Operational Area Western Australia Western Australia
(AS AT OCTOBER 2010)
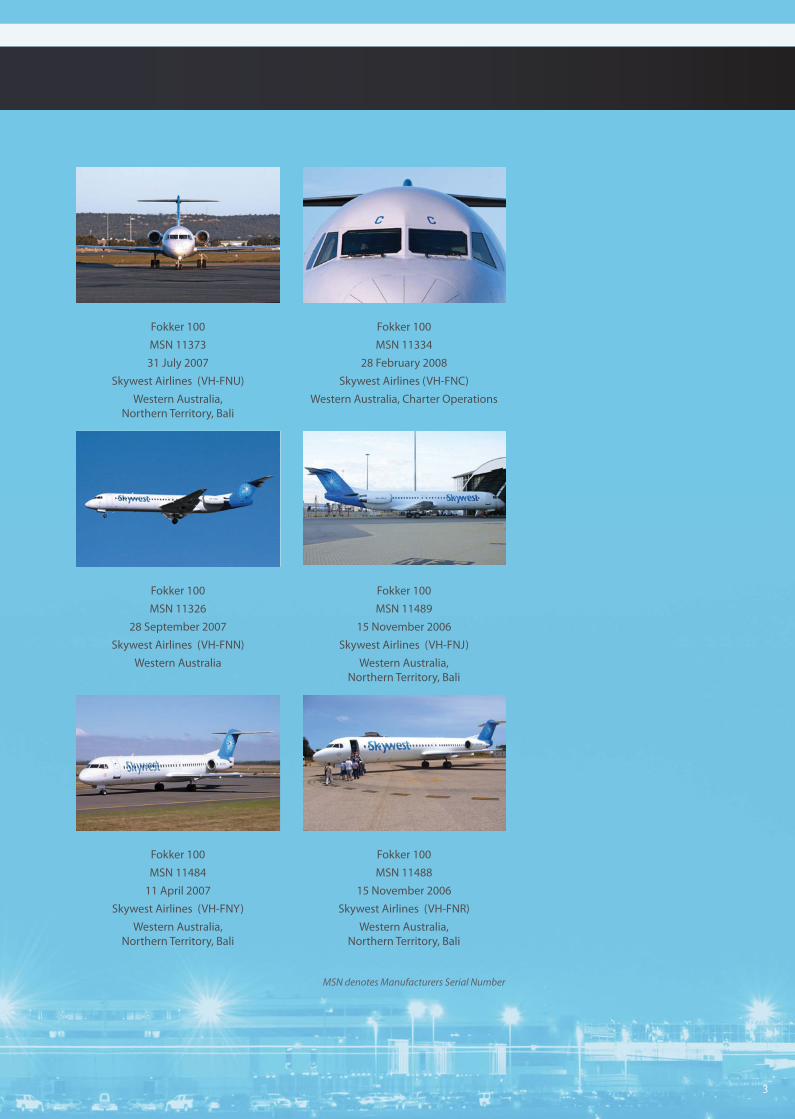
3
MSN denotes Manufacturers Serial Number
Fokker 100 Fokker 100
MSN 11373 MSN 11334
31 July 2007 28 February 2008
Skywest Airlines (VH-FNU) Skywest Airlines (VH-FNC)
Western Australia,Northern Territory, Bali
Western Australia, Charter Operations
Fokker 100 Fokker 100
MSN 11326 MSN 11489
28 September 2007 15 November 2006
Skywest Airlines (VH-FNN) Skywest Airlines (VH-FNJ)
Western Australia Western Australia,Northern Territory, Bali
Fokker 100 Fokker 100
MSN 11484 MSN 11488
11 April 2007 15 November 2006
Skywest Airlines (VH-FNY) Skywest Airlines (VH-FNR)
Western Australia,Northern Territory, Bali
Western Australia,Northern Territory, Bali
ANNUAL REPORT 2010ANNUAL REPORT 2010
4
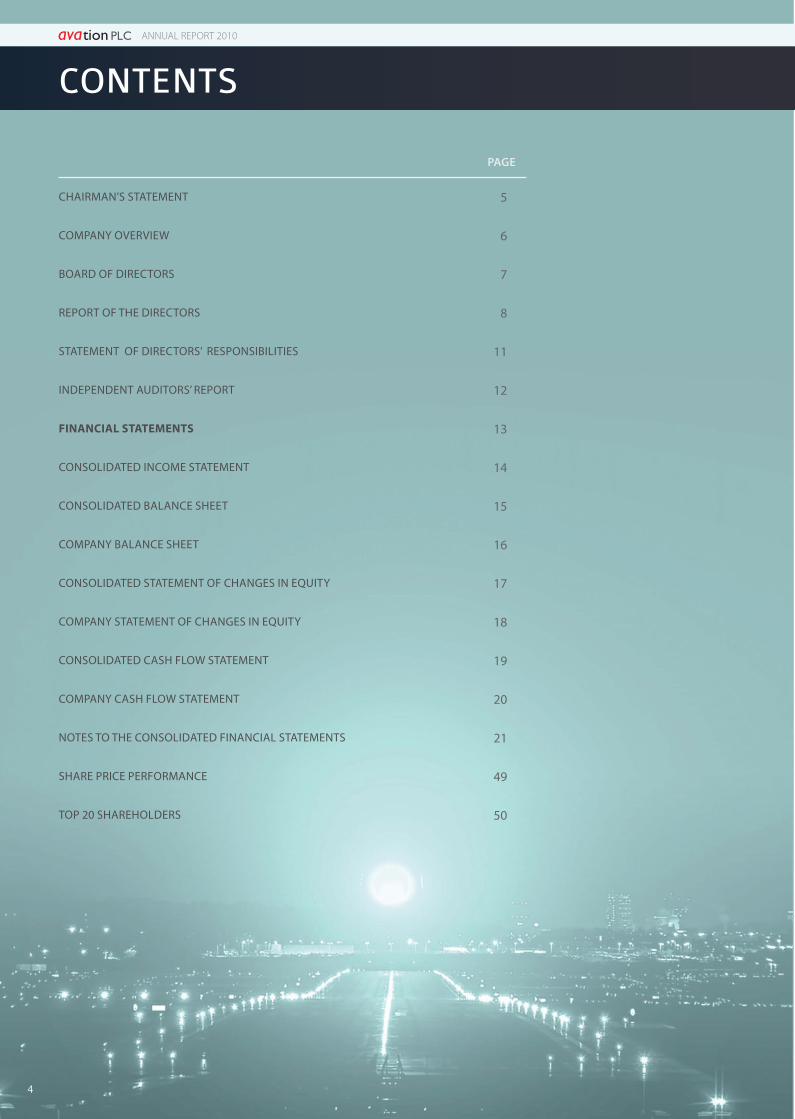
CONTENTS
PAGE
CHAIRMAN’S STATEMENT 5
COMPANY OVERVIEW 6
BOARD OF DIRECTORS 7
REPORT OF THE DIRECTORS 8
STATEMENT OF DIRECTORS’ RESPONSIBILITIES 11
INDEPENDENT AUDITORS’ REPORT 12
FINANCIAL STATEMENTS 13
CONSOLIDATED INCOME STATEMENT 14
CONSOLIDATED BALANCE SHEET 15
COMPANY BALANCE SHEET 16
CONSOLIDATED STATEMENT OF CHANGES IN EQUITY 17
COMPANY STATEMENT OF CHANGES IN EQUITY 18
CONSOLIDATED CASH FLOW STATEMENT 19
COMPANY CASH FLOW STATEMENT 20
NOTES TO THE CONSOLIDATED FINANCIAL STATEMENTS 21
SHARE PRICE PERFORMANCE 49
TOP 20 SHAREHOLDERS 50

5
CHAIRMAN’S STATEMENT
Dear Fellow Shareholder,
On behalf of your Board of Directors, I present to you the audited fi nancial statements for Avation PLC and its subsidiaries for the year ended 30th June 2010 and to inform you of the progress that the Avation Group has made. A key milestone achieved, subsequent to
year end, is the successful admission to a standard listing on the Main Market of the London Stock Exchange on the 6th of October 2010. As a consequence we now present our fi rst set of annual results as a Main Board company.
The highlights are:
• Consolidated net profi t after tax: GBP 1,653,027
• Revenues of GBP 17,552,513
• Earnings per share of 6.39 pence
• Increased dividends to 0.6 pence per share.
Your Board is pleased to report that in respect of the year ending 30th June 2010, the consolidated net profi t after tax was GBP 1,653,027 on revenues of GBP 17,552,513 with earnings per share of 6.39 pence.
The operating businesses had a good year with excellent cash fl ows being recorded across the Group. In the prior fi nancial year the Group enjoyed a one-off foreign exchange gain of GBP 1.4m; the profi ts reported this year are from recurring business with no extraordinary gains. Therefore, the earnings presented at 6.39 pence per share are the underlying earnings based on the current asset base of aircraft.
The business has continued to grow and we have increased the revenue base for the Group by 7.8%. As of June 30th the asset base of the Group had increased to GBP 96,269,565. The Board of Directors now believe that they have demonstrated that the Group has a sustainable business model, which demonstrates consistent performance.
The Avation Group currently owns a fl eet of 12 modern jet aircraft. The Group continues to seek further aircraft acquisitions. Your Company is now growing both in profi ts and recurring revenues. Customers now include large international airlines. The aircraft owned by the Group are Airbus A320 series and Fokker 100 jet aircraft.
Your Board recognises the importance of rewarding shareholders - the owners of the Company. Avation PLC has previously paid dividends and conducted a capital management program by buying in shares for cancellation.
Despite the current economic conditions, the Company continues to prosper, and therefore your Board is recommending to shareholders a fi nal dividend payment of 0.6 pence per share. The Company hopes to maintain a progressive dividend policy going forward. The Company’s Annual General Meeting is scheduled to be held on the 2nd of December 2010. Subject to shareholder approval at that meeting, a 2010 fi nal dividend of 0.6 pence per ordinary share will be paid on the 15th of December 2010. The Ex-Dividend Date is the 8th of December 2010 and the Associated Record Date is the 10th of December 2010.
The Company and its subsidiaries have secured the bulk of its debt funding at a cost of around 6% per annum. Whilst the Company believes that it can obtain access to further funds for the purchase of aircraft, access to funding nevertheless remains a risk; this risk is common to all businesses that are capital intensive, such as your business. Specifi c aviation based industry risks are also present and include the creditworthiness of client airlines.
My colleagues and I are committed to continue to work tirelessly to build your Company into a respected, profi table, diversifi ed and cash generative aircraft leasing business. The Board would like to thank you – the shareholders - for your continued support and goodwill and look forward to the future with confi dence in the successful development of Avation PLC.
Jeff Chatfi eldChairman

ANNUAL REPORT 2010
GROUP ST RUCTURE
REGISTERED OFFICE: “Barringtons House” 283 Rokeby RoadSubiaco WA 6008
DATE OF INCORPORATION: Victoria, Australia, 11 September 2007
REGISTERED OFFICE: Suite 2, Tower Business Centre Tower StreetSwatar, Birkirkara BK 4013 Malta
DATE OF INCORPORATION: Malta, 20 June 2008
REGISTERED OFFICE: 510 Thomson Road#12-04 SLF BuildingSingapore 298135
DATE OF INCORPORATION: Singapore, 2 October 2007
CAPITAL LEASE AUSTRALIAN PORTFOLIO ONE PTY LTD
CAPITAL LEASE MALTA LIMITED
AVATION.NET INC SINGAPORE BRANCH
REGISTERED OFFICE: Georgian House, 63 Coleman Street, London EC2R 5BB
DATE OF INCORPORATION: England & Wales, 11July 2006, admitted on LSE, UK on 6 October 2010
AVATION PLC UK Co. No. 5872328
REGISTERED OFFICE: “Barringtons House”283 Rokeby RoadSubiaco WA 6008
DATE OF INCORPORATION:Australia, 15 November 2006
REGISTERED OFFICE: Georgian House63 Coleman StreetLondon EC2R 5BB
DATE OF INCORPORATION:England & Wales, 6 June 2007
REGISTERED OFFICE: Corporation Trust Center1209 Orange StreetWilmington USA
DATE OF INCORPORATION:Delaware, USA, 18 January 2000
REGISTERED OFFICE: Georgian House63 Coleman StreetLondon EC2R 5BB
DATE OF INCORPORATION:England & Wales, 24 March 2010
MSN 429 LIMITED
100% 51.18% 99.96% 100%
6
COMPANY OVERVIEW

7
BOARD OF DIRECTORS
JEFF CHATFIELDChairmanMr Chatfi eld is the Chairman of Avation PLC and has been instrumental in establishing and growing the Company. He is also the Group Executive Chairman of Skywest Airlines Ltd and Chairman of Skywest Airlines (Australia) Pty Ltd. Mr Chatfi eld has managed
and been a director of a number of companies involved in the airline industry, data distribution, electronics, investment, broadcasting and manufacturing sectors. He has worked in a number of successful start-up companies and is the author and registered holder of a variety of patents. He has a Bachelor of Engineering and a Master of Engineering Science from the University of Western Australia. He is a member of the Australian Institute of Company Directors and the Singapore Institute of Directors.
He was born in Perth, Australia and is a Permanent Resident of Singapore.
BRYANT MCLARTY Non-Executive DirectorAppointed as a Director of the Company in 2007, Mr McLarty has extensive experience in corporate strategy and management with a practical working knowledge of securities and equity markets. He currently is Executive Chairman of the Australian pharmaceutical
company PharmAust Limited and has been the Managing Director of several ASX listed companies and is currently a director of a number of listed and unlisted companies. He is also a member of the Australian Institute of Company Directors.
ANDREW BAUDINETTE Non-Executive DirectorMr Baudinette has been a director of the Company since incorporation on 11 July 2006. He is an Australian citizen and a resident of the Republic of Singapore. A skilled marketer and manager, he has a 25 year history in media, having held management positions in the
Australian radio and newspaper industries.
Prior to this, he was a broadcaster and radio programmer in regional Australian radio. He was appointed as CEO of the Company’s subsidiary Avation.net Inc in 2003 and became its Managing Director in 2005.
As well as having signifi cant management level experience in all facets of commercial media and emerging technology, Mr Baudinette has had practical exposure to corporate re-structuring. He has been involved with and driven start-up businesses in the advertising, travel, technology and entertainment industries.

ANNUAL REPORT 2010
The directors have pleasure in presenting their report and fi nancial statements for the fi nancial year ended 30 June 2010.
Principal activities and business review
The principal activities of the Group are the holding of investments, involved in the owning and leasing of aircraft.
The principal risks and uncertainties aff ecting the Group’s turnover are described in note 6.
The full business review can be found in the Chairman’s statement on page 5.
The Company was admitted to a Standard Listing on the Main Market of the London Stock Exchange on the 6th October 2010.
Results and dividends
The consolidated statement of comprehensive income for the period is set out on page 14. The directors have proposed to pay a 0.6p fi nal dividend.
Directors and their interests
The directors who served the Company during the period together with their interests (including family interests) in the shares of the Company and other Group companies at the beginning (or subsequent date of appointment) and end of the period, were as follows:
The Company - Avation PLC Ordinary shares of 1p each
30 June 2010 1 July 2009
Robert Jeff ries Chatfi eld 1 1
Robert Jeff ries Chatfi eld (deemed interest)
4,400,000 3,800,000
Andrew Baudinette - 606,501
Andrew Baudinette(deemed interest)
620,001 -
Bryant James McLarty 57,300 7,300
8
REPORT OF THE DIRECTORS

The following share warrants issued to directors existed at the year end:
Director’s nameDate
grantedWarrant
price
Balance atbeginning
of year
Grantedduring
the year
Exercised/expired during
the year
Balance atend
of year
Robert Jeff ries Chatfi eld 30 Oct 2006 4 p 2,889,490 - (600,000) 2,289,490
Robert Jeff ries Chatfi eld * 5 Dec 2008 24.5 p 200,000 - (200,000) -
Robert Jeff ries Chatfi eld * 21 Dec 2009 35.5 p - 200,000 - 200,000
Andrew Baudinette ** 5 Dec 2008 24.5 p 75,000 - (75,000) -
Andrew Baudinette ** 21 Dec 2009 35.5 p - 75,000 - 75,000
Bryant James McLarty 5 Dec 2008 24.5 p 50,000 - (50,000) -
Bryant James McLarty 21 Dec 2009 35.5 p - 50,000 - 50,000
* Robert Jeff ries Chatfi eld was granted the share warrants via Epsom Assets Limited.
** Andrew Baudinette was granted the share warrants via Giant Mix Investments Limited.
The following share warrants of the Company’s subsidiary, Capital Lease Aviation PLC, issued to directors of the Company existed at the year end:
Director’s nameDate
grantedWarrant
price
Balance atbeginning
of year
Grantedduring
the year
Exercised/expired during
the year
Balance atend
of year
Robert Jeff ries Chatfi eld * 20 Jul 2007 24 p 1,370,833 - (1,370,833) -
Robert Jeff ries Chatfi eld ** 7 Nov 2008 67.5p - 1,000,000 (1,000,000) -
* Robert Jeff ries Chatfi eld was granted the share warrants via Epsom Assets Limited.
** Robert Jeff ries Chatfi eld was granted the share warrants via Takeoff Services Pte Ltd.
Directors’ remuneration
Year ended 30 June 2010Fees and salaries
Year ended 30 June 2009Fees and salaries
£ £Excecutive
Robert Jeff ries Chatfi eld 12,000 12,000
Non-excecutive
Andrew Baudinette 12,000 12,000
Bryant James McLarty 10,831 10,000
34,831 34,000
9
REPORT OF THE DIRECTORS (CONT’D)
Skywest FokkerF100 VH-FSW - Zach Liepa

ANNUAL REPORT 2009
Signifi cant Shareholdings Ordinary
Shares of 1p each
Percentage
Fitel Nominees Limited 14,994,702 57%
Hanover Nominees Ltd 2,036,756 8%
Credit Suisse Securities (Europe) Limited
1,583,244 6%
Lynchwood Nominees Ltd 1,085,084 4%
Loeb Aron & Company Ltd 920,000 4%
Equal Opportunities Policy
It is the Group’s policy to employ individuals with the necessary qualifi cations without regard to sex, marital status, race, creed, colour, nationality or religion. Full and fair consideration is given to applications for employment made by disabled persons having regard to their particular aptitudes and abilities.
The Group recognises the great importance of the contribution made by all employees and aims to keep them informed of matters aff ecting them as employees and developments within the Group. Communication and consultation is achieved by a variety of means both within individual companies or branches and on a Group-wide basis.
Directors’ Insurance
The Group maintains insurance policies on behalf of all the directors against liability arising from negligence, breach of duty and breach of trust in relation to the Group.
Creditors Payment Policy
The Group’s current policy concerning the payment of trade creditors is to:
- settle the terms of payment with suppliers when agreeing the terms of each transaction;
- ensure that suppliers are made aware of the terms of payment by inclusion of the relevant terms in contracts; and
- pay in accordance with the Group’s contractual and other legal obligations.
On average, trade creditors at the year end represented 60 days’ purchases.
Statement as to disclosure of information to auditors
(a) so far as the directors are aware, there is no relevant audit information of which the Company’s auditors are unaware, and
(b) they have taken all the steps that they ought to have taken as directors in order to make themselves aware of any relevant audit information and to establish that the Company’s auditors are aware of that information.
Auditors
Kingston Smith LLP have indicated their willingness to continue in offi ce and in accordance with s489 of the Companies Act 2006, a resolution proposing that they be reappointed as auditors of the Company will be put to the Annual General Meeting.
On behalf of the board
Robert Jeff ries Chatfi eldDirector
22 October 2010
10
REPORT OF THE DIRECTORS (CONT’D)

Statement of Directors’ responsibilities
The Directors are responsible for preparing the Directors’ Report and the fi nancial statements in accordance with applicable law and regulations and International Financial Reporting Standards (“IFRS”) as adopted by the European Union.
Company law requires the Directors to prepare fi nancial statements for each fi nancial year. Under company law, the Directors must not approve the fi nancial statements unless they are satisfi ed that they give a true and fair view of the state of aff airs of the Company and of the Group and the fi nancial performance and cash fl ows of the Group for that year. In preparing these fi nancial statements, the Directors are required to:
• select suitable accounting policies and then apply them consistently;
• make judgments and accounting estimates that are reasonable and prudent;
• state whether in preparation of the Company and the Group fi nancial statements, the Company and the Group have complied with IFRS, subject to any material departures disclosed and explained in the Group fi nancial statements;
• prepare the accounts on the going concern basis unless it is inappropriate to presume that the Company will continue in business.
The Directors are responsible for keeping adequate accounting records that are suffi cient to show and explain the Company and the Group’s transactions and disclose with reasonable accuracy at any time the fi nancial position of the Company and the Group and enable them to ensure that the fi nancial statements comply with the Companies Act 2006. They are also responsible for safeguarding the assets of the Company and the Group and hence for taking reasonable steps for the prevention and detection of fraud and other irregularities.
The Directors are responsible for the maintenance and integrity of the corporate and fi nancial information included on the Company’s website. Legislation in the United Kingdom governing the preparation and dissemination of the fi nancial statements may diff er from legislation in other jurisdictions.
11
DIRECTORS’ RESPONSIBILITIES

ANNUAL REPORT 2010
Independent Auditors’ Report to the Shareholders of Avation PLC
We have audited the fi nancial statements of Avation PLC for the year ended 30 June 2010 which comprise the Consolidated Statement of Comprehensive Income, the Company Statement of Comprehensive Income, the Consolidated Balance Sheet, the Company Balance Sheet, the Consolidated Statement of Changes in Equity, the Company Statement of Changes in Equity, the Consolidated Statement of Cash Flows, the Company Statement of Cash Flows and the related notes. The fi nancial reporting framework that has been applied in their preparation is applicable law and International Financial Reporting Standards (IFRSs) as adopted by the European Union.
This report is made solely to the Company’s members, as a body, in accordance with Chapter 3 of Part 16 of the Companies Act 2006. Our audit work has been undertaken for no purpose other than to draw to the attention of the Company’s members those matters which we are required to include in an auditors’ report addressed to them. To the fullest extent permitted by law, we do not accept or assume responsibility to any party other than the Company and Company’s members as a body, for our work, for this report, or for the opinions we have formed.
Respective responsibilities of directors and auditors
As explained more fully in the Directors’ Responsibilities Statement set out on page 11 the Directors are responsible for the preparation of the fi nancial statements and for being satisfi ed that they give a true and fair view. Our responsibility is to audit the fi nancial statements in accordance with applicable law and International Standards on Auditing (UK and Ireland). Those standards require us to comply with the Auditing Practices Board’s (APB’s) Ethical Standards for Auditors.
Scope of the audit of the fi nancial statements
An audit involves obtaining evidence about the amounts and disclosures in the fi nancial statements suffi cient to give reasonable assurance that the fi nancial statements are free from material misstatement, whether caused by fraud or error. This includes an assessment of: whether the accounting policies are appropriate to the Group’s circumstances and have been consistently applied and adequately disclosed; the reasonableness of signifi cant accounting estimates made by the Directors; and the overall presentation of the fi nancial statements.
Opinion on the fi nancial statements
In our opinion the Group fi nancial statements:• the fi nancial statements give a true and fair view of the
state of the Group’s and of the Company’s aff airs as at 30 June 2010 and of the Group’s profi t for the year then ended;
• the Group’s fi nancial statements have been properly prepared in accordance with IFRSs as adopted by the European Union;
• the Company fi nancial statements have been prepared properly in accordance with IFRS as adopted by the European Union and as applied in accordance with the provisions of the Companies Act 2006, and
• have been prepared in accordance with the requirements of the Companies Act 2006.
Opinion on other matter prescribed by the Companies Act 2006In our opinion the information given in the Directors’ Report for the fi nancial year for which the fi nancial statements are prepared is consistent with the fi nancial statements.
Matters on which we are required to report by exception
We have nothing to report in respect of the following matters where the Companies Act 2006 requires us to report to you if, in our opinion:
• adequate accounting records have not been kept by the parent company, or returns adequate for our audit have not been received from branches not visited by us; or
• the Company fi nancial statements are not in agreement with the accounting records and returns; or
• certain disclosures of Directors’ remuneration specifi ed by law are not made; or
• we have not received all the information and explanations we require for our audit.we require for our audit.
Matthew Meadows (Senior Statutory Auditor)for and on behalf of Kingston Smith LLP, Statutory Auditor
Devonshire House60 Goswell RoadLondonEC1M 7AD
22 October 2010
12
REPORT OF THE AUDITORS

13
FOR THE FINANCIAL YEAR ENDED 30 JUNE 2010REGISTERED NUMBER: 5872328 (ENGLAND & WALES)
Financial Statements

ANNUAL REPORT 2010
Note 2010 2009Continuing operations £ £
Revenue 8 17,552,513 16,278,212
Cost of sales (983,879) (871,494)
Gross profi t 16,568,634 15,406,718
Other income 9 5,948 1,477,929
Other operating expenses 10 (8,864,955) (7,167,655)
Expenses
- Administrative expenses 10 (841,892) (953,657)
- Finance expenses 11 (3,319,635) (3,777,014)
Profi t before taxation 3,548,100 4,986,321
Taxation 13 (729,517) (754,408)
Profi t from continuing operations for the year 2,818,583 4,231,913
Other comprehensive income
Gain on dilution of interest in subsidiary 1,733 -
Currency translation diff erences arising on consolidation 4,076,569 1,587,207
Revaluation gains on property, plant and equipment, net of tax 2,305,841
Other comprehensive income for the year, (net of tax) 4,078,302 3,893,048
Total comprehensive income 6,896,885 8,124,961
Profi t attributable to:
Equity holders of the parent 1,653,027 2,645,976
Non-controlling interest 1,165,556 1,585,937
2,818,583 4,231,913
Total comprehensive income attributable to:
Equity holders of the parent 4,069,879 6,107,187
Non-controlling interest 2,827,006 2,017,774
6,896,885 8,124,961
Earnings per share 14
- Basic – continuing and total operations 6.39 pence 10.40 pence
- Fully Diluted – continuing and total operations 6.30 pence 9.22 pence
COMPANY STATEMENT OF COMPREHENSIVE INCOME
2010 2009£ £
Profi t for the year 262,668 212,424
Other comprehensive income - -
Total comprehensive income for the year 262,668 212,424
14
CONSOLIDATED STATEMENT OF COMPREHENSIVE INCOME
FOR THE FINANCIAL YEAR ENDED 30 JUNE 2010

Note 2010 2009£ £
ASSETS
Current assets:
Cash and cash equivalents 1,227,881 1,039,321
Trade and other receivables 15 1,195,859 1,575,778
Inventories 16 707 493
Total current assets 2,424,447 2,615,592
Non-current assets
Property, plant and equipment 18 92,520,577 83,053,926
Goodwill 19 1,324,541 1,324,541
Total non-current assets 93,845,118 84,378,467
Total assets 96,269,565 86,994,059
LIABILITIES AND EQUITY
Current liabilities:
Trade and other payables 20 3,818,692 3,851,566
Provision for taxation 18,368 292,823
Loans and borrowings 21 9,602,462 8,521,911
Short-term provisions 22 2,047,185 1,088,555
Total current liabilities 15,486,707 13,754,855
Non-current liabilities:
Trade and other payables 20 1,379,641 550,400
Loans and borrowings 21 39,123,267 40,253,227
Deferred tax liabilities 23 4,248,024 3,208,998
Total non-current liabilities 44,750,932 44,012,625
Equity attributable to shareholders:
Share capital 24 262,190 255,555
Share premium 1,249,258 1,216,336
Asset revaluation reserve 6,760,372 6,760,372
Capital redemption reserve 7,000 7,000
Foreign currency translation reserve 3,563,359 1,148,240
Share option reserve - 12,788
Retained earnings 11,434,226 9,897,773
23,276,405 19,298,064
Non-controlling interest 12,755,521 9,928,515
36,031,926 29,226,579
Total liabilities and equity 96,269,565 86,994,059
Approved by the board and authorised for issue on 22 October 2010
Robert Jeff ries Chatfi eldDirector
15
CONSOLIDATED BALANCE SHEET
AS AT 30 JUNE 2010
ANNUAL REPORT 2010
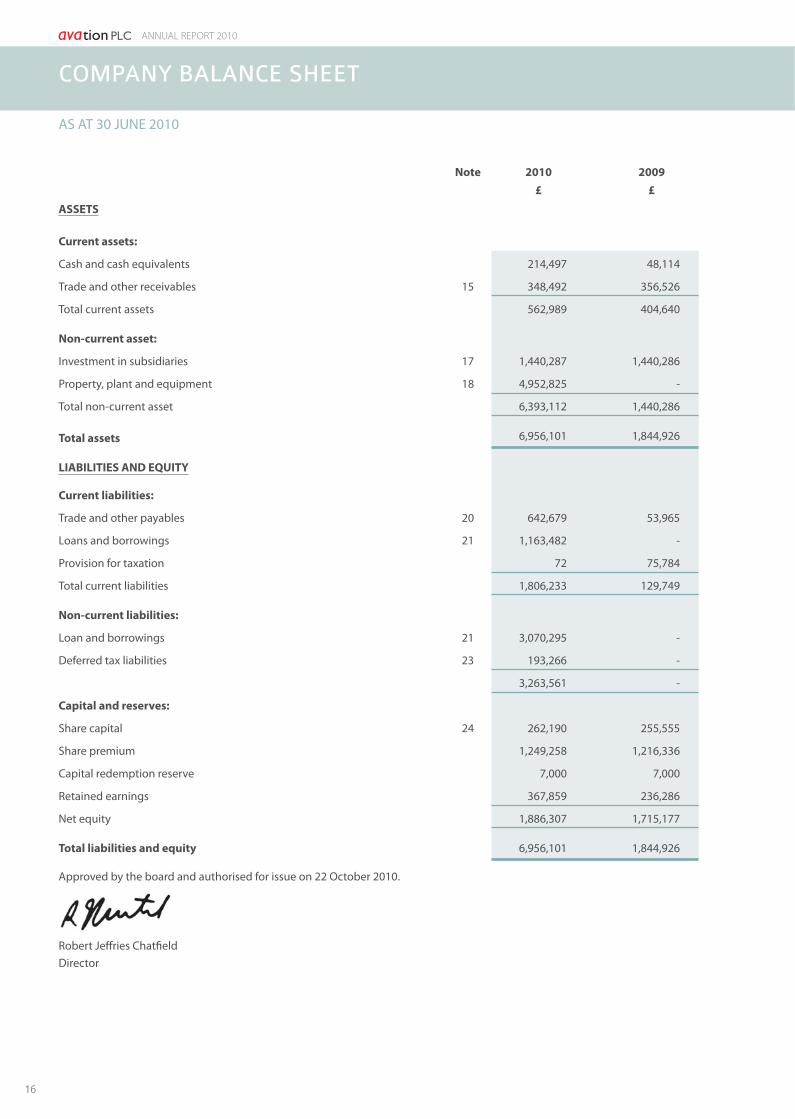
Note 2010 2009£ £
ASSETS
Current assets:
Cash and cash equivalents 214,497 48,114
Trade and other receivables 15 348,492 356,526
Total current assets 562,989 404,640
Non-current asset:
Investment in subsidiaries 17 1,440,287 1,440,286
Property, plant and equipment 18 4,952,825 -
Total non-current asset 6,393,112 1,440,286
Total assets 6,956,101 1,844,926
LIABILITIES AND EQUITY
Current liabilities:
Trade and other payables 20 642,679 53,965
Loans and borrowings 21 1,163,482 -
Provision for taxation 72 75,784
Total current liabilities 1,806,233 129,749
Non-current liabilities:
Loan and borrowings 21 3,070,295 -
Deferred tax liabilities 23 193,266 -
3,263,561 -
Capital and reserves:
Share capital 24 262,190 255,555
Share premium 1,249,258 1,216,336
Capital redemption reserve 7,000 7,000
Retained earnings 367,859 236,286
Net equity 1,886,307 1,715,177
Total liabilities and equity 6,956,101 1,844,926
Approved by the board and authorised for issue on 22 October 2010.
Robert Jeff ries Chatfi eldDirector
16
COMPANY BALANCE SHEET
AS AT 30 JUNE 2010

ForeignAsset Capital currency Share Non-
Share Share revaluation Redemption translation option Retained Controlling Total
capital premium reserve reserve reserve reserve earnings Total Interest Equity
£ £ £ £ £ £ £ £ £ £Group
Balance at 1 July 2009 255,555 1,216,336 6,760,372 7,000 1,148,240 12,788 9,897,773 19,298,064 9,928,515 29,226,579
Profi t for the year - - - - - - 1,653,027 1,653,027 1,165,556 2,818,583
Other comprehensive income - - - - 2,415,119 - 1,733 2,416,852 1,661,450 4,078,302
Total comprehensive income - - - - 2,415,119 - 1,654,760 4,069,879 2,827,006 6,896,885
Transfer between reserve - - - - - (12,788) 12,788 - - -
Dividend related to 2009 paid - - - - - - (131,095) (131,095) - (131,095)
Increase in issued share capital 6,635 32,922 - - - - - 39,557 - 39,557
Balance at 30 June 2010 262,190 1,249,258 6,760,372 7,000 3,563,359 - 11,434,226 23,276,405 12,755,521 36,031,926
Balance at 1 July 2008 252,700 1,213,770 4,454,006 - (6,605) 12,788 7,386,700 13,313,359 7,910,741 21,224,100
Profi t for the year - - - - - - 2,645,976 2,645,976 1,585,937 4,231,913
Other comprehensive income - - 2,306,366 - 1,154,845 - - 3,461,211 431,837 3,893,048
Total comprehensive income - - 2,306,366 - 1,154,845 - 2,645,976 6,107,187 2,017,774 8,124,961
Dividend related to 2008 paid - - - - - - (127,903) (127,903) - (127,903)
Increase in issued share capital 3,105 9,316 - - - - - 12,421 - 12,421
Share buyback (250) (6,750) - 7,000 - - (7,000) (7,000) - (7,000)
Balance at 30 June 2009 255,555 1,216,336 6,760,372 7,000 1,148,240 12,788 9,897,773 19,298,064 9,928,515 29,226,579
During the fi nancial year, the Company diluted the interest in its subsidiary, Capital Lease Aviation PLC from 51.22% to 51.18% shareholding through the issue of 663,500 new ordinary shares of £0.001 each at £0.24 per ordinary share.
The 2009 dividend paid during the year was for 0.5p per share.
17
STATEMENT OF CHANGES IN EQUITY
FOR THE FINANCIAL YEAR ENDED 30 JUNE 2010

ANNUAL REPORT 2010
Capital
Share Share redemption Retained
capital premium Reserve earnings Total
£ £ £ £ £
Company
Balance at 1 July 2009 255,555 1,216,336 7,000 236,286 1,715,177
Profi t for the year - - - 262,668 262,668
Other comprehensive income - - - - -
Total comprehensive income - - - 262,668 262,668
Dividend relating to 2009 paid - - - (131,095) (131,095)
Increase of issued share capital 6,635 32,922 - - 39,557
Balance at 30 June 2010 262,190 1,249,258 7,000 367,859 1,886,307
Balance at 1 July 2008 252,700 1,213,770 - 158,766 1,625,236
Profi t for the year - - - 212,424 212,424
Other comprehensive income - - - - -
Total comprehensive income - - - 212,424 212,424
Dividend relating to 2008 paid - - - (127,904) (127,904)
Increase of issued share capital 3,105 9,316 - - 12,421
Share buyback (250) (6,750) 7,000 (7,000) (7,000)
Balance at 30 June 2009 255,555 1,216,336 7,000 236,286 1,715,177
The Company is exempt from publishing its income statement pursuant to Section 480 of the Companies Act 2006.
The 2009 dividend paid during the year was for 0.5p per share.
18
STATEMENT OF CHANGES IN EQUITY
FOR THE FINANCIAL YEAR ENDED 30 JUNE 2010

2010 2009 £ £
Cash fl ows from operating activities:
Profi t before taxation 3,548,100 4,986,321
Adjustments for:Depreciation expense 4,704,804 4,455,650Claim on maintenance reserve 4,102,127 2,712,005Foreign currency exchange adjustment gain - (1,420,401)Interest expense 3,156,229 3,548,968Interest income (5,948) (13,254)
Operating profi t before working capital changes 15,505,312 14,269,289
Movement in working capital:
Trade and other receivables 379,919 (1,212,912)Inventories (214) 242Trade and other payables 796,367 1,652,747Short-term provisions (3,143,497) (453,809)Cash from operations 13,537,887 14,255,557
Interest paid (3,156,229) (3,366,505)Interest received 5,948 13,254Corporation tax paid (204,574) (1,066,989)
Net cash from operating activities 10,183,032 9,835,317
Cash fl ows from investing activities:Purchase of property, plant and equipment (1,237) (3,967,069)
Net cash used in investing activities (1,237) (3,967,069)
Cash fl ows from fi nancing activities:Net proceeds from issuance of ordinary shares 39,557 12,421Share buyback - (7,000)Net proceeds from issuance of subsidiary’s shares to minority 22,972 - Dividends paid (131,095) (127,903)Proceeds from borrowings - 3,210,035Repayment of borrowings (4,283,186) (8,974,547)Capital element of fi nance lease repayments (781,036) -
Net cash used in fi nancing activities (5,132,788) (5,886,994)
Eff ects of exchange rates on cash & cash equivalents (4,860,447) (199,458)
Net increase/(decrease) in cash and cash equivalents 188,560 (218,204)Cash and cash equivalents at beginning of fi nancial year 1,039,321 1,257,525
Cash and cash equivalents at end of fi nancial year 1,227,881 1,039,321
Cash and cash equivalents in the consolidated cash fl ow statement are not restricted in use and are denominated in the following currencies:
2010 2009£ £
Pounds Sterling 120,956 70,199
United States Dollars 1,011,459 930,898
Australian Dollars 49,119 6,625
Euro 441 1,664
Singapore Dollars 45,906 29,935
1,227,881 1,039,321
Interest earning balances 1,181,975 1,009,386
The rate of interest for the cash on interest earning accounts is at 1.0% to 4.5% (2009:1.0% to 6.5%) per annum. These approximate the weighted eff ective interest rate.
19
CONSOLIDATED STATEMENT OF CASH FLOWS
FOR THE FINANCIAL YEAR ENDED 30 JUNE 2010

ANNUAL REPORT 2010
2010 2009£ £
Cash fl ows from operating activities:
Profi t before taxation 474,695 212,424
Adjustments for:
Depreciation 61,989 -
Interest expense 88,413 -
Operating profi t before working capital changes 625,097 212,424
Movement in working capital:
Trade and other receivables 8,034 (125,098)
Trade and other payables 588,714 34,065
Cash from operations 1,221,845 121,391
Interest paid (88,413) -
Corporation tax paid (94,474) (15,142)
Net cash from operating activities 1,038,958 106,249
Cash fl ows from investing activities:
Investment in subsidiary (1) -
Net cash used in investing activities (1) -
Cash fl ows used in fi nancing activities:
Net proceeds from issuance of ordinary shares 39,557 12,421
Share buyback - (7,000)
Dividends paid (131,095) (127,904)
Capital element of fi nance lease repayments (781,036) -
Net cash used in fi nancing activities (872,574) (122,483)
Net increase/(decrease) in cash and cash equivalents 166,383 (16,234)
Cash and cash equivalents at beginning of fi nancial year 48,114 64,348
Cash and cash equivalents at end of fi nancial year 214,497 48,114
Cash and cash equivalents are not restricted in use and are denominated in the following currencies:
2010 2009£ £
Pounds Sterling 60,390 48,114
United States Dollars 154,107 -
214,497 48,114
20
COMPANY STATEMENT OF CASH FLOWS
FOR THE FINANCIAL YEAR ENDED 30 JUNE 2010

1 GENERAL
Avation PLC is a public limited company incorporated in England and Wales under the Companies Act 2006 (Registration Number 05872328). The address of the registered offi ce is given on page 51.
As disclosed in the Report of the Directors, the principal activities of the Company and its subsidiaries are the holding of investments involved in owning and leasing of aircraft.
2 STATEMENT OF COMPLIANCE
These fi nancial statements have been prepared in accordance with International Financial Reporting Standards, International Accounting Standards and their interpretations issued or adopted by the International Accounting Standards Board as adopted by use in the European Union (“IFRS”).
3 SUMMARY OF SIGNIFICANT ACCOUNTING POLICIES
a) BASIS OF PREPARATION – The fi nancial statements have been prepared in accordance with IFRS including standards and interpretations issued by the International Accounting Standards Board (“IASB”), and have been prepared in accordance with the historical cost convention, as modifi ed by the revaluation of aircraft.
The fi nancial statements are presented in Pounds Sterling, rounded to the nearest Pound.
The preparation of fi nancial statements in conformity with IFRS requires the use of estimates and assumptions that aff ect the reported amounts of assets and liabilities and disclosure of contingent assets and liabilities at the date of the fi nancial statements and the reported amounts of revenues and expenses during the fi nancial period. Although these estimates are based on management’s best knowledge of current events and actions, actual results may ultimately diff er from those estimates.
The accounting policies set out below have been applied consistently throughout the fi nancial period presented in these fi nancial statements and the accounting policies have been applied consistently by the Company and its subsidiaries.
b) BASIS OF CONSOLIDATION - The consolidated fi nancial statements incorporate the fi nancial statements of the Company and entities controlled by the Company (its subsidiaries). Control is achieved where the Company has the power to govern the fi nancial and operating policies of an investee entity so as to obtain benefi ts from its activities.
The results of subsidiaries acquired or disposed of during the year are included in the consolidated profi t or loss from the eff ective date of acquisition or up to the eff ective date of disposal, as appropriate.
Where necessary, adjustments are made to the fi nancial statements of subsidiaries to bring their accounting policies into line with those used by other members of the Group.
All signifi cant intercompany transactions and balances between Group enterprises are eliminated on consolidation.
Non-controlling interest in the net assets of consolidated subsidiaries are identifi ed separately from those of the Group entities. Non-controlling interests consist of the amount of those interests at the date of the original business combination (see below) and the non-controlling interest’s share of changes in equity since the date of the combination. Losses applicable to the minority in excess of the non-controlling interest in the subsidiary’s equity are allocated against the interests of the Group except to the extent that the minority has a binding obligation and is able to make an additional investment to cover the losses.
In the Company’s fi nancial statements, investments in subsidiaries are carried at cost less any impairment that has been recognised in the profi t or loss.
c) BUSINESS COMBINATIONS - The acquisition of subsidiaries is accounted for using the purchase method. The cost of the acquisition is measured at the aggregate of the fair values, at the date of exchange, of assets given, liabilities incurred or assumed, and equity instruments issued by the Group in exchange for control of the acquiree, plus any costs directly attributable to the business combination. The acquiree’s identifi able assets, liabilities and contingent liabilities that meet the conditions for recognition under IFRS 3 are recognised at their fair values at the acquisition date.
21
NOTES TO FINANCIAL STATEMENTSFOR THE YEAR ENDED 30 JUNE 2010

ANNUAL REPORT 2010
d) GOODWILL - Goodwill arising on the acquisition of a subsidiary represents the excess of the cost of acquisition over the Group’s interest in the net fair value of the identifi able assets, liabilities and contingent liabilities of the subsidiary recognised at the date of acquisition. Goodwill is initially recognised as an asset at cost and is subsequently measured at cost less any accumulated impairment losses.
Goodwill arising on acquisition is recognised as an asset and initially measured at cost, being the excess of the cost of the business combination over the Group’s interest in the net fair value of the identifi able assets, liabilities and contingent liabilities recognised. If, after reassessment, the Group’s interest in the net fair value of the acquiree’s identifi able assets, liabilities and contingent liabilities exceeds the cost of the business combination, the excess is recognised immediately in the profi t or loss.
The interest of signifi cant minority shareholders in the acquiree is initially measured at the non-controlling interest’s proportion of the net fair value of the assets, liabilities and contingent liabilities recognised.
For the purpose of impairment testing, goodwill is allocated to each of the Group’s cash-generating units expected to benefi t from the synergies of the combination. Cash-generating units to which goodwill has been allocated are tested for impairment annually, or more frequently when there is an indication that the unit may be impaired. If the recoverable amount of the cash-generating unit is less than the carrying amount of the unit, the impairment loss is allocated fi rst to reduce the carrying amount of any goodwill allocated to the unit and then to the other assets of the unit pro-rata on the basis of the carrying amount of each asset in the unit. An impairment loss recognised for goodwill is not reversed in a subsequent period.
On disposal of a subsidiary, the attributable amount of goodwill is included in the determination of the profi t or loss on disposal.
e) INVENTORIES – Inventories of consumable spare parts are stated at the lower of cost or market value determined on a portfolio basis.
f ) PROPERTY, PLANT AND EQUIPMENT – Aircraft held for use in the supply of rental service, are stated in the balance sheet at their revalued amounts, being the fair value at the date of revaluation, less any accumulated depreciation and accumulated impairment losses. Revaluations are performed with suffi cient regularity such that the carrying amount does not diff er materially from that which would be determined using fair values at the balance sheet date.
Any revaluation increase arising on the revaluation of such aircraft is credited to the assets revaluation reserve, except to the extent that it reverses a revaluation decrease for the same asset previously recognised in profi t or loss, in which case the increase is credited to profi t or loss to the extent of the decrease previously charged. A decrease in carrying amount arising on the revaluation of such aircraft is charged to profi t or loss to the extent that it exceeds the balance, if any, held in the assets revaluation reserve relating to a previous revaluation of that asset.
Depreciation on revalued aircraft is charged to profi t or loss. On the subsequent sale or retirement of a revalued aircraft, the attributable revaluation surplus remaining in the asset revaluation reserve is transferred directly to retained earnings.
Property, plant and equipment are stated at cost less accumulated depreciation and any accumulated impairment losses.
Depreciation is charged so as to write off the cost or valuation of assets less residual values, over their estimated useful lives, using the straight-line method, on the following basis:
Aircraft - 20 to 25 years
Furniture and equipment - 3 years
Fully depreciated assets still in use are retained in the fi nancial statements.
The gain or loss arising on the disposal or retirement of an item of property, plant and equipment is determined as the diff erence between the sales proceeds and the carrying amount of the asset and is recognised in profi t or loss.
22
NOTES TO FINANCIAL STATEMENTSFOR THE YEAR ENDED 30 JUNE 2010
22

g) IMPAIRMENT OF ASSETS - At each balance sheet date, the Group reviews the carrying amounts of its tangible assets to determine whether there is any indication that those assets have suff ered an impairment loss. If any such indication exists, the recoverable amount of the asset is estimated in order to determine the extent of the impairment loss (if any). When it is not possible to estimate the recoverable amount of an individual asset, the Group estimates the recoverable amount of the cash-generating unit to which the asset belongs. If the recoverable amount of an asset (or cash-generating unit) is estimated to be less than its carrying amount, the carrying amount of the asset (or cash-generating unit) is reduced to its recoverable amount. Impairment losses are recognised as an expense immediately.
When an impairment loss subsequently reverses, the carrying amount of the asset (or cash-generating unit) is increased to the revised estimate of its recoverable amount, but only to the extent that the increased carrying amount does not exceed the carrying amount that would have been determined had no impairment loss been recognised for the asset (or cash-generating unit) in prior years. A reversal of an impairment loss is recognised as income immediately.
h) PROVISIONS - Provisions are recognised when the Group has a present obligation as a result of a past event, and it is probable that the Group will be required to settle that obligation. Provisions are measured at the directors’ best estimate of the expenditure required to settle the obligation at the balance sheet date, and are discounted to present value where the eff ect is material. In respect of maintenance rent, a corresponding provision is made in accordance with the expected maintenance costs that will be drawn in accordance with the lease conditions and lease term.
i) SHARE-BASED PAYMENTS – The cost of share based payment arrangement whereby employees receive remuneration in the form of warrants, is recognised as an employee benefi t expense in the profi t or loss. The total expense to be apportioned over the vesting period of the benefi t is determined by reference to the fair value at date of grant. The assumption underlying the number of warrants expected to vest are subsequently adjusted for the eff ects of non market-based vesting conditions prevailing at the balance sheet date. Fair value is measured by the use of the Binomial option pricing model and is based on a reasonable expectation of the extent to which performance criteria will be met.
j) LEASES – The Group leases aircraft to airlines under operating leases. Leases of aircraft where the Group retains substantially all risks and rewards incidental to ownership are classifi ed as operating leases. Rental income from operating leases (net of any incentives given to the lessees) is recognised in the profi t or loss on a straight-line basis over the lease term.
The Group leases aircraft for use in the business. Where the Group bears substantially all the risk and rewards of ownership of the item, the lease is classifi ed as a fi nance lease and the item is capitalised within the appropriate class of property, plant and equipment at the lower of the fair value of the leased item and the minimum lease payments. Each lease payment is allocated between the liability and fi nance charges so as to obtain a constant rate on the fi nance balance outstanding. The outstanding capital element of the lease payments are included within current and long-term payables as appropriate; the interest element of the lease payments is charged to profi t or loss over the period of the lease so as to produce a constant periodic rate of interest on the remaining balance of the liability for each period.
k) REVENUE RECOGNITION – Revenue is measured at the fair value of the consideration received or receivable and represents amounts receivable for goods and services provided in the normal course of business, net of discounts and sales related taxes.
(i) Aircraft rental income is recognised in the profi t or loss on a straight line basis over the terms of the lease. Lease incentives granted are recognised as an integral part of the total rental income.
(ii) Interest income is accrued on a time basis, by reference to the principal outstanding and at the eff ective interest rate applicable, which is the rate that exactly discounts estimated future cash receipts through the expected life of the fi nancial asset to that asset’s net carrying amount.
(iii) Sales of goods are recognised when goods are delivered and title has passed.
(iv) Dividend income from investments is recognised when the shareholders’ right to receive payment have been established.
(v) Licence fees received are recognised over the life of the licence agreement. Ongoing royalties/commissions pursuant to the licence agreement are recognised as earned.
23
NOTES TO FINANCIAL STATEMENTSFOR THE YEAR ENDED 30 JUNE 2010

ANNUAL REPORT 2010
l) BORROWING COSTS - Borrowing costs directly attributable to the acquisition of property, plant and equipment are added to the cost of the assets and amortised over the life of the assets.
The loan facility fees added to the cost of the assets are amortised between 5 years to 25 years, which is the life of the assets.
All other borrowing costs are recognised in profi t or loss in the period in which they are incurred.
m) TAXATION - Taxation expense represents the sum of the tax currently payable and deferred tax.
The tax currently payable is based on taxable profi t for the fi nancial period. Taxable profi t diff ers from profi t as reported in profi t or loss because it excludes items of income or expense that are taxable or deductible in other years and it further excludes items that are never taxable or deductible. The Group’s liability for current tax is calculated using tax rates that have been enacted or substantively enacted by the balance sheet date.
Deferred tax is recognised on diff erences between the carrying amounts of assets and liabilities in the fi nancial statements and the corresponding tax bases used in the computation of taxable profi t, and is accounted for using the balance sheet liability method. Deferred tax liabilities are generally recognised for all taxable temporary diff erences and deferred tax assets are recognised to the extent that it is probable that taxable profi ts will be available against which deductible temporary diff erences can be utilised. Such assets and liabilities are not recognised if the temporary diff erence arises from goodwill or from the initial recognition (other than in a business combination) of other assets and liabilities in a transaction that aff ects neither the taxable profi t nor the accounting profi t.
Deferred tax liabilities are recognised for taxable temporary diff erences arising on investments in subsidiaries, except where the Group is able to control the reversal of the temporary diff erence and it is probable that the temporary diff erence will not reverse in the foreseeable future.
The carrying amount of deferred tax assets is reviewed at each balance sheet date and reduced to the extent that it is no longer probable that suffi cient taxable profi ts will be available to allow all or part of the asset to be recovered.
Deferred tax is calculated at the tax rates that are expected to apply in the period when the liability is settled or the asset realised. Deferred tax is charged or credited to profi t or loss, except when it relates to items charged or credited directly to equity, in which case the deferred tax is also dealt with in equity.
Deferred tax assets and liabilities are off set when there is a legally enforceable right to set off current tax assets against current tax liabilities and when they relate to income taxes levied by the same taxation authority and the Group intends to settle its current tax assets and liabilities on a net basis.
n) FOREIGN CURRENCIES - The Group’s consolidated fi nancial statements and Company fi nancial statements are presented in Pound Sterling, which is the presentational currency. The individual fi nancial statements of each Group entity are presented in the currency of the primary economic environment in which the entity operates (its functional currency) and United States Dollars is the functional currency of the each of the Group entity, including the parent company.
In preparing the fi nancial statements of the individual entities, transactions in currencies other than the entity’s functional currency (foreign currencies) are recorded at the rates of exchange prevailing on the dates of the transactions. At each balance sheet date, monetary items denominated in foreign currencies are retranslated at the rates prevailing on the balance sheet date. Non-monetary items carried at fair value that are denominated in foreign currencies are retranslated at the rates prevailing on the date when the fair value was determined. Non-monetary items that are measured in terms of historical cost in a foreign currency are not retranslated.
Exchange diff erences arising on the settlement of monetary items, and on the retranslation of monetary items, are included in the profi t or loss for the period. Exchange diff erences arising on the retranslation of non-monetary items carried at fair value are included in the profi t or loss for the period except for diff erences arising on the retranslation of non-monetary items in respect of which gains and losses are recognised directly in equity. For such non-monetary items, any exchange component of that gain or loss is also recognised directly in equity.
For the purpose of presenting consolidated fi nancial statements, the assets and liabilities of the Group’s foreign operations are expressed in Pound Sterling using exchange rates prevailing on the balance sheet date. Income and expense items are translated at the average exchange rates for the period, unless exchange rates fl uctuated signifi cantly during that period, in which case the exchange rates at the dates of the transactions are used. Exchange diff erences
24
NOTES TO FINANCIAL STATEMENTSFOR THE YEAR ENDED 30 JUNE 2010

arising, if any, are classifi ed as equity and transferred to the Group’s translation reserve. Such translation diff erences are recognised in profi t or loss in the period in which the foreign operation is disposed of.
Goodwill and fair value adjustments arising on the acquisition of a foreign operation are treated as assets and liabilities of the foreign operation and translated at the closing rate.
o) FINANCIAL INSTRUMENTS - Financial assets and fi nancial liabilities are recognised on the Group’s balance sheet when the Group becomes a party to the contractual provisions of the instrument.
i) Trade and other receivables – Trade and other receivables are measured at initial recognition at fair value, and are subsequently measured at amortised cost using the eff ective interest rate method. Appropriate allowances for estimated irrecoverable amounts are recognised in profi t or loss when there is objective evidence that the asset is impaired. The allowance recognised is measured as the diff erence between the asset’s carrying amount and the present value of estimated future cash fl ows discounted at the eff ective interest rate computed at initial recognition.
ii) Cash and cash equivalents - Cash and cash equivalents comprise cash on hand and call deposits which are subject to an insignifi cant risk of changes in value.
iii) Financial liabilities and equity - Financial liabilities and equity instruments issued by the Group are classifi ed according to the substance of the contractual arrangements entered into and the defi nitions of a fi nancial liability and an equity instrument. An equity instrument is any contract that evidences a residual interest in the assets of the Group after deducting all of its liabilities. The accounting policies adopted for specifi c fi nancial liabilities and equity instruments are set out below.
iv) Borrowings - Interest-bearing loans from banks and fi nancial institutions are initially measured at fair value, and are subsequently measured at amortised cost, using the eff ective interest rate method. Any diff erence between the proceeds (net of transaction costs) and the settlement or redemption of borrowings is recognised over the term of the borrowings in accordance with the Group’s accounting policy for borrowing costs (see above).
v) Trade and other payables - Trade payables are stated at their original invoiced value, as the interest that would be recognised from discounting future cash payments over the short payment period is not considered to be material.
vi) Trade receivables - Trade receivables are stated at their original value, as the interest that would be recognised from discounting future cash receipts over the short credit period is not considered to be material. Trade receivables are reduced by appropriate allowances for estimated irrecoverable amounts. Interest on overdue trade receivables is recognised as it accrues.
vii) Equity instruments - Equity instruments issued by the Company are recorded at the proceeds received, net of direct issue costs.
4 CRITICAL ACCOUNTING ESTIMATES AND JUDGEMENTS
Estimates and assumptions concerning the future are made in the preparation of the fi nancial statements. They aff ect the application of the Group’s accounting policies, reported amounts of assets, liabilities, income and expenses and disclosures made. They are assessed on an ongoing basis and are based on experience and relevant factors, including expectations of future events that are believed to be reasonable under the circumstances.
The key assumptions concerning the future estimation uncertainty at the balance sheet date, that have a signifi cant risk of causing a material adjustment to the carrying amounts of assets and liabilities within the next fi nancial year are discussed below.
(i) Impairment of property, plant and equipment – aircraft
The Group periodically evaluates its aircraft for impairment. Factors that would indicate potential impairment would include, but not be limited to, signifi cant decreases in the market value of aircraft, a signifi cant change in an aircraft’s physical condition or cash-fl ow associated with the use of the aircraft. The Group continues to record positive cash fl ows from its aircraft. The Group has not identifi ed any impairment related to its existing aircraft fl eet during the fi nancial year.
25
NOTES TO FINANCIAL STATEMENTSFOR THE YEAR ENDED 30 JUNE 2010
ANNUAL REPORT 2010
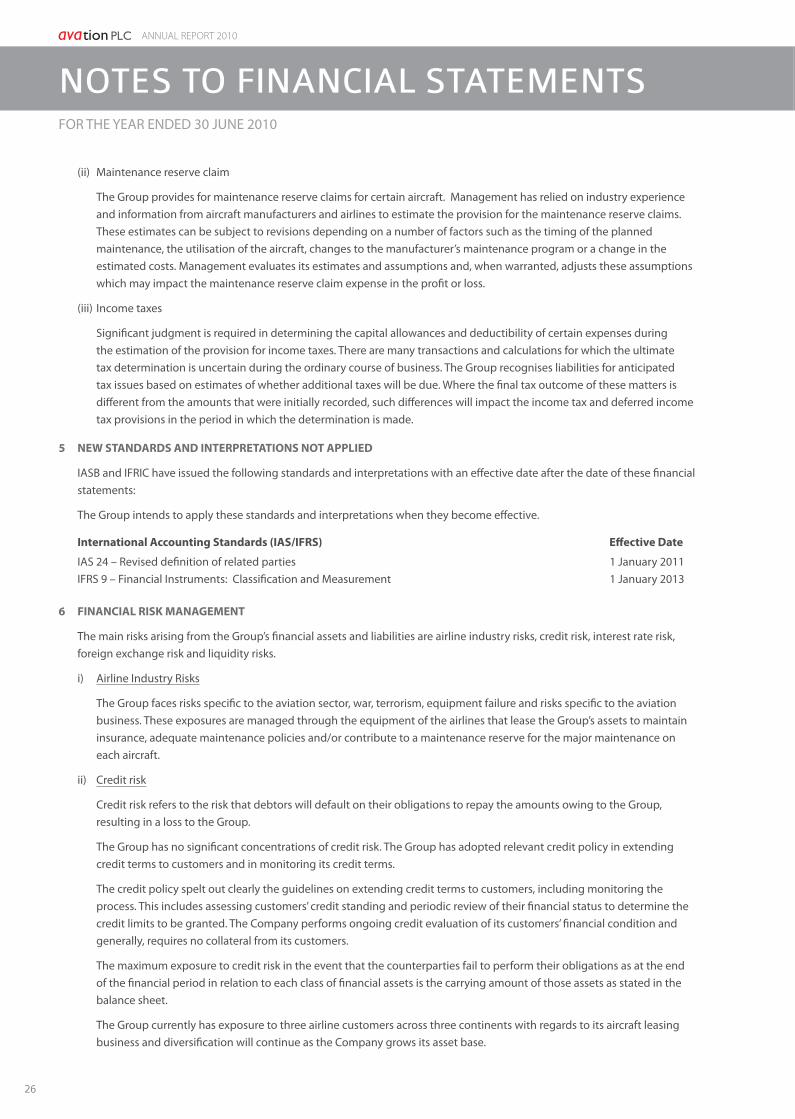
(ii) Maintenance reserve claim
The Group provides for maintenance reserve claims for certain aircraft. Management has relied on industry experience and information from aircraft manufacturers and airlines to estimate the provision for the maintenance reserve claims. These estimates can be subject to revisions depending on a number of factors such as the timing of the planned maintenance, the utilisation of the aircraft, changes to the manufacturer’s maintenance program or a change in the estimated costs. Management evaluates its estimates and assumptions and, when warranted, adjusts these assumptions which may impact the maintenance reserve claim expense in the profi t or loss.
(iii) Income taxes
Signifi cant judgment is required in determining the capital allowances and deductibility of certain expenses during the estimation of the provision for income taxes. There are many transactions and calculations for which the ultimate tax determination is uncertain during the ordinary course of business. The Group recognises liabilities for anticipated tax issues based on estimates of whether additional taxes will be due. Where the fi nal tax outcome of these matters is diff erent from the amounts that were initially recorded, such diff erences will impact the income tax and deferred income tax provisions in the period in which the determination is made.
5 NEW STANDARDS AND INTERPRETATIONS NOT APPLIED
IASB and IFRIC have issued the following standards and interpretations with an eff ective date after the date of these fi nancial statements:
The Group intends to apply these standards and interpretations when they become eff ective.
International Accounting Standards (IAS/IFRS) Eff ective Date
IAS 24 – Revised defi nition of related partiesIFRS 9 – Financial Instruments: Classifi cation and Measurement
1 January 20111 January 2013
6 FINANCIAL RISK MANAGEMENT
The main risks arising from the Group’s fi nancial assets and liabilities are airline industry risks, credit risk, interest rate risk, foreign exchange risk and liquidity risks.
i) Airline Industry Risks
The Group faces risks specifi c to the aviation sector, war, terrorism, equipment failure and risks specifi c to the aviation business. These exposures are managed through the equipment of the airlines that lease the Group’s assets to maintain insurance, adequate maintenance policies and/or contribute to a maintenance reserve for the major maintenance on each aircraft.
ii) Credit risk
Credit risk refers to the risk that debtors will default on their obligations to repay the amounts owing to the Group, resulting in a loss to the Group.
The Group has no signifi cant concentrations of credit risk. The Group has adopted relevant credit policy in extending credit terms to customers and in monitoring its credit terms.
The credit policy spelt out clearly the guidelines on extending credit terms to customers, including monitoring the process. This includes assessing customers’ credit standing and periodic review of their fi nancial status to determine the credit limits to be granted. The Company performs ongoing credit evaluation of its customers’ fi nancial condition and generally, requires no collateral from its customers.
The maximum exposure to credit risk in the event that the counterparties fail to perform their obligations as at the end of the fi nancial period in relation to each class of fi nancial assets is the carrying amount of those assets as stated in the balance sheet.
The Group currently has exposure to three airline customers across three continents with regards to its aircraft leasing business and diversifi cation will continue as the Company grows its asset base.
26
NOTES TO FINANCIAL STATEMENTSFOR THE YEAR ENDED 30 JUNE 2010

The maximum exposure to credit risk for trade receivables at the reporting date by geographical area is:
Group2010 2009
£ £
Australia 723,582 726,445
Singapore - 15
Nigeria 2,103 -
Libya - 1,919
725,685 728,379
1) Financial assets that are neither past due nor impaired
Bank deposits that are neither past due or impaired are mainly deposits with banks with high credit–ratings assigned by international credit-rating agencies. Trade receivables that are neither past due nor impaired are substantially companies with a good collection track record with the Group.
The Group’s trade receivable not past due include receivables amounting to £560,150 (2009 : £330,000).
2) Financial assets that are past due and/or impaired
There is no class of fi nancial assets that are past due and /or impaired except for trade receivables.
The age analysis of trade receivables past due but not impaired is as follows:
Group2010 2009
£ £
Past due < 3 months 163,415 156,522
Past due 3 to 6 months 2,120 234,376
Past due over 6 months - 7,481
165,535 398,379
iii) Interest rate risk
The Group is exposed to interest rate risk through the impact of rate changes on interest bearing liabilities and assets.
The Group further seeks to reduce this risk by fi xing interest rates on loans to match the term of the underlying lease term of the asset.
The interest rate and terms of repayment of fi nancial assets and fi nancial liabilities are disclosed in the respective notes to the fi nancial statements.
iv) Foreign currency risk
Foreign currency risk occurs as a result of the Group’s transactions that are not denominated in its functional currencies. The Group’s foreign currency exposures arose mainly from the exchange rate movements of the Pound Sterling and United States Dollar. These exposures are managed primarily by using natural hedges that arise from off setting assets and liabilities that are denominated in foreign currencies.
The Group does not utilise forward foreign currency contracts to hedge its exposure to specifi c currency risks.
27
NOTES TO FINANCIAL STATEMENTSFOR THE YEAR ENDED 30 JUNE 2010

ANNUAL REPORT 2010
The Group’s currency exposure based on the information provided to key management is as follows:
Group Pound United StatesSterling Dollar Total
2010 £ £ £Cash and cash equivalents 120,956 1,011,459 1,132,415Trade and other receivables 44,122 921,866 965,988Loans and borrowings - (48,725,729) (48,725,729)Other fi nancial liabilities (68,591) (5,013,464) (5,082,055)
Currency exposure 96,487 (51,805,868) (51,709,381)
2009
Cash and cash equivalents 70,199 930,898 1,001,097Trade and other receivables 10,597 1,564,574 1,575,171Loans and borrowings - (48,775,138) (48,775,138)Other fi nancial liabilities (293,844) (3,809,456) (4,103,300)
Currency exposure (213,048) (50,089,122) (50,302,170)
Company Pound United StatesSterling Dollar Total
2010 £ £ £
Cash and cash equivalents 60,390 154,107 214,497Trade and other receivables 49,638 298,664 348,302Loans and borrowings - (4,233,777) (4,233,777)Other fi nancial liabilities (34,778) (576,046) (610,824)
Currency exposure 75,250 (4,357,052) (4,281,802)
2009
Cash and cash equivalents 48,114 - 48,114Trade and other receivables 5,640 235,903 241,543Other fi nancial liabilities (37,350) (8,374) (45,724)
Currency exposure 16,404 227,529 243,933
If the United States Dollar (USD) changes against the Pound Sterling by 10% (2008: 10%) with all other variables including tax rate being held constant, the eff ects arising from the net fi nancial liability/asset position will be as follows:
Increase/(Decrease) Increase/(Decrease)2010 2010 2009 2009
Group Profi t after tax Equity Profi t after tax Equity£ £ £ £
USD against £
- strengthen (5,180,587) (5,180,587) (5,008,912) (5,008,912)
- weakened 5,180,587 5,180,587 5,008,912 5,008,912
2010 2010 2009 2009Company Profi t after tax Equity Profi t after tax Equity
£ £ £ £USD against £
- strengthen (435,705) (435,705) 23,590 23,590
- weakened 435,705 435,705 (23,590) (23,590)
v) Liquidity risk
In the management of liquidity risk, the Group monitors and maintains a level of cash and cash equivalents deemed adequate by management to fi nance the Group’s operations and mitigate the eff ects of fl uctuations in cash fl ows. Short-term funding is obtained from bank loan facilities.
28
NOTES TO FINANCIAL STATEMENTSFOR THE YEAR ENDED 30 JUNE 2010

The table below analyses the maturity profi le of the fi nancial liabilities of the Group and the Company based on contractual undiscounted cash fl ows.
Less than 1 yearBetween 1and 2
yearsBetween 2 and 5
years Over 5 yearsGroup2010 £ £ £ £
Trade and other payables 3,818,692 2,274 1,377,367 -
Loans and borrowings 7,897,818 7,638,925 28,165,653 -
11,716,510 7,641,199 29,543,020 -
2009
Trade and other payables 3,851,566 - 550,400 -
Loans and borrowings 11,067,603 10,062,657 22,686,675 14,454,123
14,919,169 10,062,657 23,237,075 14,454,123
Company
2010
Trade and other payables 642,679 - - -
Loans and borrowings 1,460,137 3,351,680 - -
2,102,816 3,351,680 - -
2009
Trade and other payables 53,965 - - -
Loans and borrowings - - - -
53,965 - - -
vi) Capital risk
The Group’s objectives when managing capital are to safeguard the Group’s ability to continue as a going concern and to maintain an optimal capital structure so as to maximise shareholder value. In order to maintain or achieve an optimal capital structure, the Group may adjust the amount of dividend payment, return capital to shareholders, issue new shares, buy back issued shares, obtain new borrowings or sell assets to reduce borrowings.
Management monitors capital based on a gearing ratio. The gearing ratio is calculated as net debt divided by total capital. Net debt is calculated as borrowings plus trade and other payables less cash and cash equivalents.
Group Company2010 2009 2010 2009
£ £ £ £
Net debt 52,696,181 52,137,783 4,661,959 5,851
Total equity 36,031,926 29,226,579 1,886,307 1,715,177
Total capital 88,728,107 81,364,362 6,548,266 1,721,028
Gearing ratio 59% 64% 71% 0%
The Group and the Company are in compliance with all externally imposed capital requirements for the fi nancial years ended 30 June 2010 and 30 June 2009.
vii) Fair value of fi nancial assets and fi nancial liabilities
The fair values of fi nancial assets and fi nancial liabilities reported in the balance sheet approximate the carrying amount of those assets and liabilities.
29
NOTES TO FINANCIAL STATEMENTSFOR THE YEAR ENDED 30 JUNE 2010

ANNUAL REPORT 2010
7 RELATED PARTY TRANSACTIONS
Related parties are entities with common direct or indirect shareholders and/or directors. Parties are considered to be related if one party has the ability to control the other party or exercise signifi cant infl uence over the other party in making fi nancial and operating decisions.
Some of the Company and Group’s transactions and arrangements are with related parties and the eff ect of these on the basis determined between the parties is refl ected in these fi nancial statements. The balances are unsecured, interest-free and without fi xed repayment terms.
(a) Compensation of directors and key management personnel
The remuneration of directors and key management’s remuneration includes fees, salary, bonus, commission and other emoluments (including benefi ts-in-kind) based on the cost incurred by the Company and the Group, and where the Company or Group did not incur any costs, the value of the benefi ts. The key management’s remuneration is as follows:
Group Company2010 2009 2010 2009
£ £ £ £Key management of the Group
- Directors’ fee paid to directors of the Company 34,831 34,000 34,831 34,000
- Directors’ fee paid to directors of subsidiaries 304,127 295,585 - -
- Superannuation paid for a director of subsidiaries 20,780 7,964 - -
- Salary paid to a director of the Company 70,022 72,458 - -
The amount above includes remuneration in respect of the highest paid director as follows:
Group2010 2009
£ £
Aggregate emoluments 131,725 132,000
No contributions were made on behalf of any directors to money purchase pension schemes.
(b) Signifi cant related party transactions:
Group Company2010 2009 2010 2009
£ £ £ £
Sales of goods to a related party 1 303,137 158,542 - -
Service rendered to a related party 2 661,103 - - -
Service fee paid to Loeb Aron & Company Ltd 3 5,000 16,239 - 6,239
Guarantee and commitment fee paid to a related party 4 163,406 228,046 - -
Maintenance rent received from a related party 5 3,320,157 2,712,006 - -
Rental income received from a related party 6 5,975,334 5,466,054 - -
Interest expense paid to a related party 7 498 - - -
1 - Sales of goods to Skywest Airlines (Australia) Pty Ltd in which a director of the Company is also a director of Skywest Airlines (Australia) Pty Ltd.
2 - Services rendered to Skywest Airlines (Australia) Pty Ltd in which a director of the Company is also a director of Skywest Airlines (Australia) Pty Ltd.
3 - Paid to Loeb Aron & Company Ltd in which a director of a subsidiary is a director of Loeb Aron & Company Ltd.4.- Paid to CaptiveVision Capital Ltd in which a director of the Company is a director of CaptiveVision Capital Ltd.5 - Received from Skywest Airlines (Australia) Pty Ltd in which a director of the Company is also a director of Skywest Airlines (Australia) Pty
Ltd.6 - Received from Skywest Airlines (Australia) Pty Ltd in which a director of the Company is also a director of Skywest Airlines (Australia) Pty
Ltd.7 - Interest expense paid to Australian Historical Investments Pty Ltd in which a director of the Company is also a director of Australian
Historical Investments Pty Ltd.
30
NOTES TO FINANCIAL STATEMENTSFOR THE YEAR ENDED 30 JUNE 2010

8 REVENUEGroup
2010 2009£ £
Rental income 13,082,643 12,516,170
Maintenance rent revenue 3,320,157 2,712,006
Management and service income 483,343 290,951
Sales of fi nished goods 666,370 759,085
17,552,513 16,278,212
9 OTHER INCOMEGroup
2010 2009£ £
Maintenance reimbursement - 44,274
Interest income 5,948 13,254
Foreign currency exchange adjustment gain - 1,420,401
5,948 1,477,929
10 ADMINISTRATIVE AND OTHER OPERATING EXPENSES
Group
2010 2009£ £
Claim on maintenance reserve expense charged directly to profi t or loss 1,241,148 764,948
Claim on maintenance reserve expense 2,860,979 1,947,057
Depreciation of property, plant and equipment 4,704,804 4,455,650
Foreign currency exchange adjustment loss 58,024 -
Auditors’ remuneration for audit services 37,500 32,000
Auditors’ remuneration for non-audit services
- Corporate taxation 4,250 24,378
11 FINANCE EXPENSESGroup
2010 2009£ £
Interest expense on secured borrowings 3,156,229 3,548,968
Guarantee and commitment fee 163,406 228,046
3,319,635 3,777,014
12 STAFF COSTS
There were no staff costs during the fi nancial year ended 30 June 2010 and 30 June 2009 except for fees and salaries paid to directors. See Note 7 for details.
31
NOTES TO FINANCIAL STATEMENTSFOR THE YEAR ENDED 30 JUNE 2010

ANNUAL REPORT 2010
13 TAXATIONGroup
2010 2009£ £
Current tax expense
- United Kingdom (in relation to prior years) 18,761 -
- Overseas 19,722 659,089
Deferred tax expense – United Kingdom 308,870 126,533
Deferred tax expense - overseas 324,560 (31,214)
Other tax- overseas - current 19,779 -
Other tax- overseas – prior years 37,825 -
729,517 754,408
The standard rate of current tax for the period based on the UK standard rate of corporation tax is 28% (2009: 28%). The current tax expense for the period is less than 28% (2009: 28%) for the reasons set out in the following reconciliation:
Group2010 2009
£ £
Profi t before income tax 3,548,100 4,986,321
Tax calculated at tax rate of 28% 993,468 1,396,169
Eff ects of:
Non-taxable items (411,016) (743,908)
Capital allowances and other temporary diff erences (553,908) (119,897)
Diff erent tax rates of other countries 9,378 126,207
Adjustment to tax charge in respect of previous periods 561 (19)
Total income tax expense 38,483 659,089
14 EARNINGS PER SHAREa) Basic earnings per share (“EPS”)
EPS is calculated by dividing the net profi t attributable to members of the Company by the weighted average number of ordinary shares in issue during the fi nancial year.
Group2010 2009
£ £
Net profi t attributable to equity holders of the Company 1,653,027 2,645,976
Weighted average number of ordinary shares 25,878,072 25,431,815
Basic earnings per share 6.39 pence 10.40 pence
b) Diluted earnings per share
For the purpose of calculating diluted earnings per share, profi t attributable to equity holders of the Company and the weighted average number of ordinary shares outstanding are adjusted for the eff ects of all dilutive potential ordinary shares. The Company has one category of dilutive potential ordinary shares; warrants.
For warrants, the weighted average number of shares on issue has been adjusted as if all dilutive share options were exercised. The number of shares that could have been issued upon the exercise of all dilutive share option less the number of shares that could have been issued at fair value (determined as the Company’s average share price for the fi nancial year) for the same total proceeds is added to the denominator as the number of shares issued for no consideration. No adjustment is made to the net profi t.
32
NOTES TO FINANCIAL STATEMENTSFOR THE YEAR ENDED 30 JUNE 2010

Diluted earnings per share attributable to equity holders of the Company is calculated as follows:
Group2010 2009
£ £
Net profi t attributable to equity holders of the Company 1,653,027 2,645,976
Weighted average number of ordinary shares 25,878,072 25,431,815
Adjustment for:
- Warrants 346,452 3,270,034
26,224,524 28,701,849
Diluted earnings per share 6.30 pence 9.22 pence
15 TRADE AND OTHER RECEIVABLESGroup Company
2010 2009 2010 2009£ £ £ £
Subsidiaries (a, b, c) - - 322,854 350,268
Non-trade receivables – related parties (d, g, h) 8,327 - 8,225 -
Trade receivables – related party (e) 716,988 725,924 - -
Trade receivables 8,697 2,455 - -
Other receivables 23,237 58,925 7,250 4,776
Prepayments 27,780 1,482 10,163 1,482
Tax recoverable 218,952 - - -
Advances 5,099 - - -
Accrued income – related party (f ) 186,779 786,992 - -
1,195,859 1,575,778 348,492 356,526
In respect of the Company, the current amount due from subsidiaries/ related parties include the following:
a) £297,160 (2009: £350,268) from F100 Pty Ltd. Management and service income of £312,232 (2009: £54,747) and dividend income of £76,900 (2009: £147,342) were from F100 Pty Ltd.
b) £25,504 (2009: Nil) from MSN 429 Limited. Management and service income of £24,000 (2009: Nil) and rental income of £372,654 (2009: Nil) were from MSN 429 Limited.
c) £190 (2009: Nil) from Capital Lease Australian Portfolio One Pty Ltd.
d) £8,225 (2009: Nil) from Skywest Airlines (Australia) Pty Ltd in which a director of the Company is a director of Skywest Airlines (Australia) Pty Ltd. Expenses of £8,225 (2009: Nil) were paid by the Company on behalf of Skywest Airlines (Australia) Pty Ltd.
The amounts due from subsidiaries are unsecured, interest-free, without fi xed repayment terms and payable on demand.
In respect of the Group, the current amount due from related parties include the following:
e) Trade receivables of £716,988 (2009: £725,924) from Skywest Airlines (Australia) Pty Ltd, in which a director of the Company is a director. Rental income of £5,975,334 (£5,466,054), maintenance rent revenue of £3,320,157 (£2,712,006), sales of fi nished goods of £303,137 (2009: £158,542) and management and service income of 661,103 (2009: Nil) were from Skywest Airlines (Australia) Pty Ltd.
f ) Accrued income of £186,779 (2009: £786,992) from Skywest Airlines (Australia) Pty Ltd in which a director of the Company is a director.
g) £8,225 (2009: Nil) from Skywest Airlines (Australia) Pty Ltd in which a director of the Company is a director.
h) £102 (2009: Nil) from CaptiveVision Capital Ltd in which a director is a director of the Company is a director.
33
NOTES TO FINANCIAL STATEMENTSFOR THE YEAR ENDED 30 JUNE 2010

ANNUAL REPORT 2010
The average credit period generally granted to non-related trade receivables customers is 30 to 60 days. In respect to leased aircraft, rent is due in advance in accordance with the leases.
The trade and other receivables are denominated in the following currencies:
Group Company2010 2009 2010 2009
£ £ £ £
Euro 299 - - -
Pounds Sterling 44,122 10,597 49,638 5,640
United States Dollars 921,865 1,564,574 298,664 235,903
Australian Dollars 218,952 592 - 114,983
Singapore Dollars 10,621 15 190 -
1,195,859 1,575,778 348,492 356,526
16 INVENTORIES
Group Company2010 2009 2010 2009
£ £ £ £
Finished goods, at cost 707 493 - -
The cost of inventories recognised as an expense and included in the cost of sales amounts to £983,879 (2009: £870,121).
17 INVESTMENT IN SUBSIDIARIES
Company2010 2009
£ £
Unquoted equity shares, at cost 1,390,187 1,390,186
Quoted equity shares, at cost 50,100 50,100
1,440,287 1,440,286
Quoted equity shares, at market value 7,765,500 24,480,000
In the opinion of management, no impairment in the value of the investment in subsidiaries is necessary.
34
NOTES TO FINANCIAL STATEMENTSFOR THE YEAR ENDED 30 JUNE 2010

Details of the subsidiaries are as follows:
Name of CompanyPrincipal activities
Country of incorporation/
operationsCompany’s
cost of investmentGroup’s eff ective
equity interest2010 2009 2010 2009
£ £ % %The subsidiaries held directly by the Company:
Avation.net Inc (a) Procurement United States 1,390,181 1,390,181 99.96 99.96
of America
Capital Lease Aviation PLC (b)
Leasing of aircraft
United Kingdom 50,100 50,100 51.18 51.22
F100 Pty Ltd (c) Leasing of aircraft
Australia 5 5 100.00 100.00
MSN 429 Ltd (b) Leasing of aircraft
United Kingdom 1 - 100.00 100.00
The subsidiaries held by Capital Lease Aviation PLC :
Capital Lease Australian Portfolio One Pty Ltd (c)
Leasing of aircraft
Australia - - 51.18 51.22
Capital Lease Malta Ltd (d) Leasing of aircraft
Malta - - 51.18 51.22
(a) Audited by Jasmine Chua and Associates, Singapore
(b) Audited by Kingston Smith LLP, London, UK
(c) Audited by Moore Stephens, Perth, Australia
(d) Audited by Nexia BT, Malta
Signifi cant transactions with subsidiaries are as follows:
Company2010 2009
£ £
Rental income 372,654 -
Management and service fee income 360,232 102,448
Dividend income 76,900 211,817
Service fee expense 66,820 -
35
NOTES TO FINANCIAL STATEMENTSFOR THE YEAR ENDED 30 JUNE 2010

ANNUAL REPORT 2010
18 PROPERTY, PLANT AND EQUIPMENTGroup Furniture and
equipment Aircraft Total2010 £ £ £
Cost or valuation:
At beginning of year 4,367 88,883,092 88,887,459
Additions - 5,016,050 5,016,050
Disposal/written off (3,620) - (3,620)
Currency realignment 248 10,042,862 10,043,110
At end of year 995 103,942,004 103,942,999
Representing:
Cost 995 5,014,813 5,015,808
Valuation - 98,927,191 98,927,191
995 103,942,004 103,942,999
Accumulated depreciation:
At beginning of year 4,140 5,829,393 5,833,533
Depreciation for the year 238 4,704,566 4,704,804
Disposal/written off (3,620) - (3,620)
Currency realignment 237 887,468 887,705
At end of year 995 11,421,427 11,422,422
Net book value:
At beginning of year 227 83,053,699 83,053,926
At end of year - 92,520,577 92,520,577
Furniture andequipment Aircraft Total
2009 £ £ £
Cost or valuation:
At beginning of year 3,600 68,696,476 68,700,076
Additions - 3,967,069 3,967,069
Revaluation surplus on acquisition - 3,296,823 3,296,823
Currency realignment 767 12,922,724 12,923,491
At end of year 4,367 88,883,092 88,887,459
Representing:
Cost 4,367 - 4,367
Valuation - 88,883,092 88,883,092
4,367 88,883,092 88,887,459
Accumulated depreciation:
At beginning of year 2,911 1,277,439 1,280,350
Depreciation for the year 628 4,455,022 4,455,650
Currency realignment 601 96,932 97,533
At end of year 4,140 5,829,393 5,833,533
Net book value:
At beginning of year 689 67,419,037 67,419,726
At end of year 227 83,053,699 83,053,926
36
NOTES TO FINANCIAL STATEMENTSFOR THE YEAR ENDED 30 JUNE 2010

Company Aircraft Total2010 £ £
Cost or valuation:
At beginning of year - -
Additions 5,014,814 5,014,814
At end of year 5,014,814 5,014,814
Representing:
Cost 5,014,814 5,014,814
Accumulated depreciation:
At beginning of year - -
Depreciation for the year 61,989 61,989
At end of year 61,989 61,989
Net book value:
At beginning of year - -
At end of year 4,952,825 4,952,825
On 25 March 2008, the subsidiary, Capital Lease Aviation PLC acquired the right, title and interest in the aircraft held on trust by Wilmington Trust Company (“Wilmington”), a US trust company. As the aircraft is registered in the US, legal title to the aircraft is held by Wilmington and Capital Lease Aviation PLC is the benefi cial owner. The aircraft is leased by Wilmington to a US airline.
The Group’s property, plant and equipment include borrowing costs from bank loans specifi cally used for purchase of aircraft. During the fi nancial year, the borrowing costs capitalised as cost of property, plant and equipment amount to £ Nil (2009 : £15,138).
The carrying value of the Group and Company’s property, plant and equipment held under fi nance lease at 30 June 2010 was £4,952,825 (2009 : Nil). The lease asset is pledged as security for the related fi nance lease.
Depreciation relating to property plant and equipment held under fi nance lease at 30 June 2010 was £61,989 (2009: £nil).
The Group’s aircraft were revalued in September 2009 by independent valuers, on the basis of open market value as of 30 June 2009. The revaluation surplus net of applicable deferred income taxes was credited to an asset revaluation reserve in shareholders equity.
If the aircraft were measured using the cost model, the carrying amounts would be as follows:Group
2010 2009£ £
Cost 84,360,409 75,677,685
Accumulated depreciation (8,080,345) (4,214,500)
Net carrying value 76,280,064 71,463,185
19 GOODWILL ON CONSOLIDATIONGroup
2010 2009£ £
Cost:
Balance at beginning and at end of year 1,324,541 1,324,541
In the opinion of the management, the carrying amount approximates its fair value.
37
NOTES TO FINANCIAL STATEMENTSFOR THE YEAR ENDED 30 JUNE 2010

ANNUAL REPORT 2010
20 TRADE AND OTHER PAYABLES
Group CompanyCurrent 2010
£2009
£2010
£2009
£
Subsidiaries (a, b, c, g) - - 448,979 7,230
Related parties (d, e) 390,818 159,929 25,290 8,869
Trade payables 1,826,774 2,478,775 9,112 12,955
Deferred income (f ) 1,059,199 851,265 127,067 -
Other payables - 49,597 - -
Accrued expenses 541,901 312,000 32,231 24,911
3,818,692 3,851,566 642,679 53,965
Group Company
Non-current 2010 2009 2010 2009£ £ £ £
Related parties 1,379,641 550,400 - -
In respect of the Company, the current amount due from subsidiaries/ related parties include the following:
a) £54,266 (2009: £7,230) due to F100 Pty Ltd.
b) £730 (2009: Nil) due to Capital Lease Aviation PLC.
c) £15,674 (2009: Nil) due to Avation.net Inc.
d) £7,853 (2009: £6,152) due to Skywest Airlines Ltd in which a director of the Company is also a director.
e) £17,437 (2009: £2,717) due to Skywest Airlines (S) Pte Ltd in which a director of the Company is also a director.
f ) Deferred income of £127,067 (2009: Nil) from MSN 429 Limited.
g) £378,309 (2009: Nil) due to MSN 429 Limited.
The amount due to subsidiaries and related parties are unsecured, interest free and without fi xed repayment terms.
The average credit period taken to settle non-related party trade payables is approximately 60 days.
The trade and other payables are denominated in the following currencies:
Group CompanyCurrent 2010 2009 2010 2009
£ £ £ £
Pound Sterling 68,591 293,844 34,778 37,350
United States Dollar 3,636,096 3,259,056 576,046 8,374
Australian Dollar 4,028 276,949 - -
Euro 5,022 3,853 - -
Singapore Dollar 104,955 17,864 31,855 8,241
3,818,692 3,851,566 642,679 53,965
Group CompanyNon-current 2010 2009 2010 2009
£ £ £ £
United States Dollar 1,377,367 550,400 - -
Australian Dollar 2,274 - - -
1,379,641 550,400 - -
38
NOTES TO FINANCIAL STATEMENTSFOR THE YEAR ENDED 30 JUNE 2010
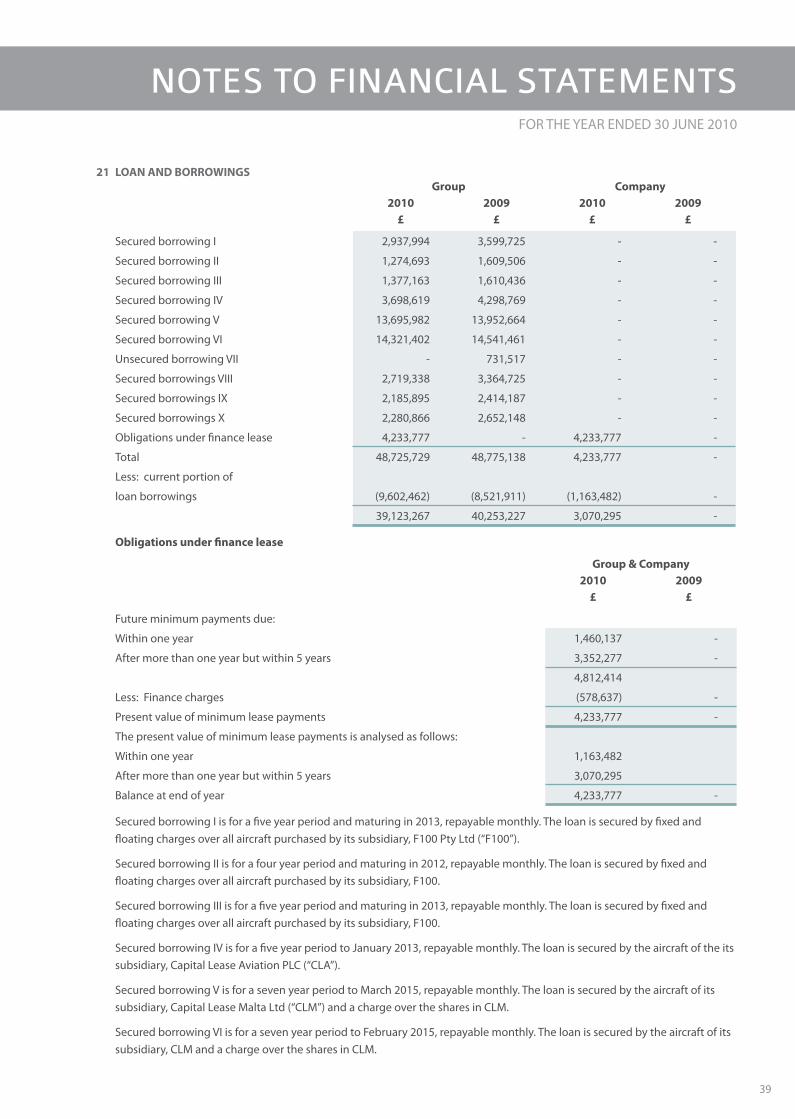
21 LOAN AND BORROWINGSGroup Company
2010 2009 2010 2009£ £ £ £
Secured borrowing I 2,937,994 3,599,725 - -
Secured borrowing II 1,274,693 1,609,506 - -
Secured borrowing III 1,377,163 1,610,436 - -
Secured borrowing IV 3,698,619 4,298,769 - -
Secured borrowing V 13,695,982 13,952,664 - -
Secured borrowing VI 14,321,402 14,541,461 - -
Unsecured borrowing VII - 731,517 - -
Secured borrowings VIII 2,719,338 3,364,725 - -
Secured borrowings IX 2,185,895 2,414,187 - -
Secured borrowings X 2,280,866 2,652,148 - -
Obligations under fi nance lease 4,233,777 - 4,233,777 -
Total 48,725,729 48,775,138 4,233,777 -
Less: current portion of
loan borrowings (9,602,462) (8,521,911) (1,163,482) -
39,123,267 40,253,227 3,070,295 -
Obligations under fi nance lease
Group & Company2010 2009
£ £
Future minimum payments due:
Within one year 1,460,137 -
After more than one year but within 5 years 3,352,277 -
4,812,414
Less: Finance charges (578,637) -
Present value of minimum lease payments 4,233,777 -
The present value of minimum lease payments is analysed as follows:
Within one year 1,163,482
After more than one year but within 5 years 3,070,295
Balance at end of year 4,233,777 -
Secured borrowing I is for a fi ve year period and maturing in 2013, repayable monthly. The loan is secured by fi xed and fl oating charges over all aircraft purchased by its subsidiary, F100 Pty Ltd (“F100”).
Secured borrowing II is for a four year period and maturing in 2012, repayable monthly. The loan is secured by fi xed and fl oating charges over all aircraft purchased by its subsidiary, F100.
Secured borrowing III is for a fi ve year period and maturing in 2013, repayable monthly. The loan is secured by fi xed and fl oating charges over all aircraft purchased by its subsidiary, F100.
Secured borrowing IV is for a fi ve year period to January 2013, repayable monthly. The loan is secured by the aircraft of the its subsidiary, Capital Lease Aviation PLC (“CLA”).
Secured borrowing V is for a seven year period to March 2015, repayable monthly. The loan is secured by the aircraft of its subsidiary, Capital Lease Malta Ltd (“CLM”) and a charge over the shares in CLM.
Secured borrowing VI is for a seven year period to February 2015, repayable monthly. The loan is secured by the aircraft of its subsidiary, CLM and a charge over the shares in CLM.
39
NOTES TO FINANCIAL STATEMENTSFOR THE YEAR ENDED 30 JUNE 2010

ANNUAL REPORT 2010
Unsecured borrowing VII is for a 2 year period to July 2010, repayable monthly. The loan is unsecured and it was taken by its subsidiary and the Group has issued a corporate guarantee in favour for the amount.
Secured borrowing VIII is for a four year period and maturing 2012 repayable monthly. The loan is secured by the aircraft of its subsidiary, Capital Lease Australian Portfolio One Pty Ltd.
Secured borrowing IX is for a fi ve year period and maturing 2013 repayable monthly. The loan is secured by the aircraft of its subsidiary, Capital Lease Australian Portfolio One Pty Ltd.
Secured borrowing X is for a four year period and maturing in 2013, repayable monthly. The loan is secured by fi xed and fl oating charges over all aircraft purchased by its subsidiary, F100.
The Group has a mezzanine fi nance facility of US$2,000,000 from a related party, CaptiveVision Capital Ltd which expired on 30 June 2010 and has been extended on a month to month basis. CaptiveVision Capital Ltd granted a lender of the secured borrowings of the Group a charge over its assets for US$2,000,000. CaptiveVision Capital Ltd charged the Group interest at 14% per annum based on the committed asset amount of A$2,089,967.
The average interest rates for the outside party borrowings range from 6% to 11% per annum (2009 : 6% to 11% per annum).
All the loans are denominated in United States Dollars. The carrying amounts of the borrowings approximate their fair values.
22 SHORT-TERM PROVISIONSGroup
2010 2009£ £
Maintenance reserve claim 2,047,185 1,088,555
Group2010 2009
£ £
Movement in provision for maintenance provisions claim is as follows:
Balance at beginning of year 1,088,555 299,336
Provisions made during the period 2,860,979 1,947,057
Provisions used during the period (2,045,903) (1,194,217)
Currency realignment 143,554 36,379
Balance at end of year 2,047,185 1,088,555
A provision of £2,860,979 (2009: £1,947,076) was made during the year ended 30 June 2010. This provision is based on maintaining a suffi cient balance to match expected drawdowns of reserves over the lease period of the aircraft.
There were drawdowns totalling £2,045,903 (2009: £1,194,217) on the reserves for the year ended 30 June 2010.
23 DEFERRED TAX LIABILITIESRecognised deferred tax assets and liabilities are attributable to the following:
Assets Liabilities NetGroup 2010 2010 2010
£ £ £
Property, plant and equipment - 4,112,643 4,112,643
Other items (614,415) 940,652 326,237
Taxes losses carried forward (190,856) - (190,856)
Tax (assets) / liabilities (805,271) 5,053,295 4,248,024
Set off tax 805,271 (805,271) -
Net tax assets - 4,248,024 4,248,024
40
NOTES TO FINANCIAL STATEMENTSFOR THE YEAR ENDED 30 JUNE 2010
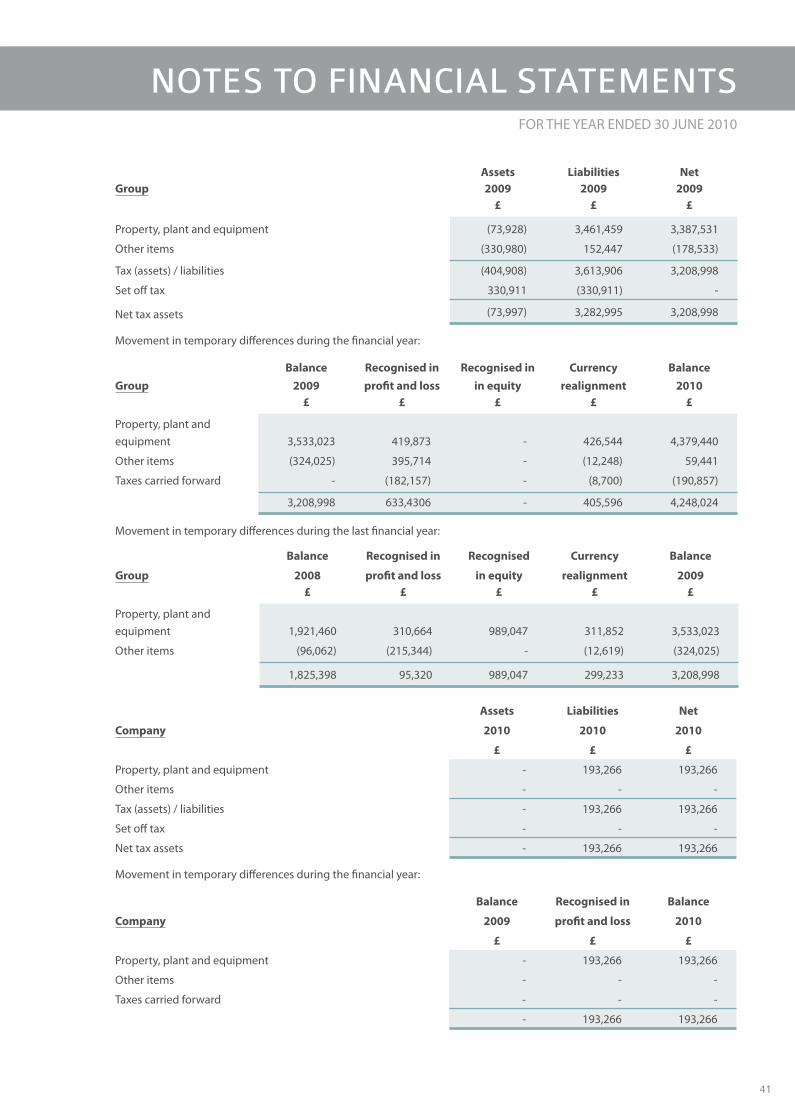
Assets Liabilities NetGroup 2009 2009 2009
£ £ £
Property, plant and equipment (73,928) 3,461,459 3,387,531
Other items (330,980) 152,447 (178,533)
Tax (assets) / liabilities (404,908) 3,613,906 3,208,998
Set off tax 330,911 (330,911) -
Net tax assets (73,997) 3,282,995 3,208,998
Movement in temporary diff erences during the fi nancial year:
Balance Recognised in Recognised in Currency BalanceGroup 2009 profi t and loss in equity realignment 2010
£ £ £ £ £
Property, plant and equipment 3,533,023 419,873 - 426,544 4,379,440
Other items (324,025) 395,714 - (12,248) 59,441
Taxes carried forward - (182,157) - (8,700) (190,857)
3,208,998 633,4306 - 405,596 4,248,024
Movement in temporary diff erences during the last fi nancial year:
Balance Recognised in Recognised Currency Balance
Group 2008 profi t and loss in equity realignment 2009£ £ £ £ £
Property, plant and equipment 1,921,460 310,664 989,047 311,852 3,533,023
Other items (96,062) (215,344) - (12,619) (324,025)
1,825,398 95,320 989,047 299,233 3,208,998
Assets Liabilities Net
Company 2010 2010 2010
£ £ £
Property, plant and equipment - 193,266 193,266
Other items - - -
Tax (assets) / liabilities - 193,266 193,266
Set off tax - - -
Net tax assets - 193,266 193,266
Movement in temporary diff erences during the fi nancial year:
Balance Recognised in Balance
Company 2009 profi t and loss 2010
£ £ £
Property, plant and equipment - 193,266 193,266
Other items - - -
Taxes carried forward - - -
- 193,266 193,266
41
NOTES TO FINANCIAL STATEMENTSFOR THE YEAR ENDED 30 JUNE 2010

ANNUAL REPORT 2010
24 SHARE CAPITAL
Company2010 2009
£ £
Authorised:
100,000,000 ordinary shares of 1 penny each 1,000,000 1,000,000
Allotted, called up and fully paid:
26,219,010 (2009: 25,555,510) ordinary shares of 1 penny each 262,190 255,555
a) On 3 December 2009, the Company issued 63,500 ordinary shares of 1 penny each following the exercise of warrants by the warrant holders for £15,558.
b) On 8 January 2010, the Company issued 600,000 ordinary shares of 1 penny each following the exercise of the warrant holder for £24,000.
25 SHARE-BASED PAYMENTS
a) Share options and warrants
The Group has an ownership-based compensation scheme for directors and senior management of the Group.
Each share warrant converts into one ordinary share of Avation PLC on exercise. No amounts are paid or are payable by the recipient on receipt of the warrant. The warrants carry neither rights to dividends nor voting rights. Warrants may be exercised at any time from the date of vesting to the date of their expiry.
Warrants are granted to the directors and senior management of the Group to gain:
• Improvement in share price• Improvement in net profi t• Improvement in return to shareholders
The following share-based payment arrangements were in existence during the current reporting period:
Balance at Granted Exercised Balance at Fair valueWarrant series beginning during during Expired/ end of Expiry Exercise at grantsigned on of year the year the year Cancelled year date price date
(1) 30 Oct 2006 2,889,490 - (600,000) - 2,289,490 29 Oct 2010 4.0 p 0.3 p
(2) 5 Dec 2008 425,000 - (63,500) (361,500) - 4 Dec 2009 24.5 p 24.5 p
(3) 21 Dec 2009 - 425,000 - - 425,000 21 Dec 2011 35.5 p 3.88 p
The weighted average fair value of the warrants granted during the fi nancial year is 3.88 pence. The value of the warrants granted during the year is £16,490 which has not been expensed in these accounts as it is not material.
The warrants were priced using the Binomial option pricing model. Where relevant, the expected life used in the model has been adjusted based on the management’s best estimate for the eff ects of non-transferability, exercise restrictions (including the probability of meeting market conditions attached to the option), and behavioural considerations. Expected volatility is based on the historical share price volatility over the past four months.
Warrant series signed on 21 December 2009
Inputs into the model
Grant date share price 35.5 pence
Exercise price 35.5 pence
Expected volatility 30%
Warrant life 2 years
Dividend yield 1.42%
Risk free interest rate 0.50%
42
NOTES TO FINANCIAL STATEMENTSFOR THE YEAR ENDED 30 JUNE 2010

The Company issued a total of 425,000 warrants during the fi nancial year at 35.5 pence when the then market price was 35.5 pence.
b) Share options and warrants issued by Capital Lease Aviation PLC
A subsidiary of the Company, Capital Lease Aviation PLC, has an ownership-based compensation scheme for directors and senior management of the Group.
Each share warrant converts into one ordinary share of Capital Lease Aviation PLC on exercise. No amounts are paid or are payable by the recipient on receipt of the warrant. The warrants carry neither rights to dividends nor voting rights. Warrants may be exercised at any time from the date of vesting to the date of their expiry.
Warrants are granted to the directors and senior management of the Group to gain:
• Improvement in share price• Improvement in net profi t• Improvement in return to shareholders
The following share-based payment arrangements were in existence during the current reporting period:
Balance at Granted Exercised Balance at Fair valueWarrant series beginning during during Expired/ end of Expiry Exercise at grantsigned on of year the year the year Cancelled year date price date
(1) 20 Jul 2007 3,150,000 - (70,000) (3,080,000) - 13 Dec 2009 24 p 24p
(3) 27 Nov 2007 97,916 - (20,833) (77,083) - 13 Dec 2009 24 p 25.5p
(4) 7 Nov 2008 2,200,000 - - (2,200,000) - 6 Nov 2009 67.5p 67.5p
The value of the warrants granted during last year was £9,460 which was not been expensed in these accounts as it is not material.
The weighted average fair value of the warrants granted during the last year was 0.43 pence. Warrants were priced using the Binomial option pricing model. Where relevant, the expected life used in the model has been adjusted based on the management’s best estimate for the eff ects of non-transferability, exercise restrictions (including the probability of meeting market conditions attached to the option), and behavioural considerations. Expected volatility is based on the historical share price volatility over the past four months.
Warrant Series
Inputs into the model Series 1 Series 3 Series 4
Grant date share price 24 pence 75 pence 67.5 pence
Exercise price 24 pence 24 pence 67.5 pence
Expected volatility 15% 15% 5%
Warrant life 2.4 years 2 years 1 year
Dividend yield 0% 0% 3%
At the end of the fi nancial year, there are no warrants outstanding and hence the value of warrants in warrant reserve of £12,788 has been transferred to retained earnings.
26 OPERATING LEASES
a) Leases as LessorThe Group and the Company lease out their aircraft held under operating leases. The future minimum lease payments under non-cancellable leases are as follows:
Group2010 2009
£ £
Within one year 14,742,768 12,069,432
In the second to fi fth years inclusive 38,841,715 45,204,209
More than fi ve years - -
43
NOTES TO FINANCIAL STATEMENTSFOR THE YEAR ENDED 30 JUNE 2010

ANNUAL REPORT 2010
b) Contingencies
The Company’s subsidiaries, Capital Lease Australian Portfolio One Pty Ltd and F100 Pty Ltd receive maintenance rent from the lease of its aircraft in addition to the base rent. Lessees may be entitled to be reimbursed for specifi c long term maintenance items (“maintenance rent activities”) that they may incur during the term of the lease. The lessees must not be in default of the lease and must satisfy certain conditions before they can claim. Furthermore, the lessees must provide invoices and supporting documentation as satisfactory evidence to Capital Lease Australian Portfolio One Pty Ltd and F100 Pty Ltd that the maintenance rent activity has been carried out necessarily.
The amount of the claim for any one maintenance rent activity is limited to the total amount of the maintenance rent received for that specifi c maintenance rent activity to date under the lease for that aircraft.
The carrying out of each specifi c maintenance activity is dependant on the number of cycles and fl ying hours conducted by the aircraft.
Consequently, Capital Lease Australian Portfolio One Pty Ltd and F100 Pty Ltd have a contingent liability which is conditional on the volume of cycles and fl ying hours of the aircraft, upon the actual cost of maintenance rent activity, the lessee making a valid claim with the required documents in the required time frame, and there being an unclaimed balance against the specifi c maintenance rent activity for that aircraft.
Any unclaimed balance that Capital Lease Australian Portfolio One Pty Ltd and F100 Pty Ltd hold at the end of the lease is not refundable to the lessees.
As at 30 June 2010, Capital Lease Australian Portfolio One Pty Ltd and F100 Pty Ltd had received £3,320,157 (2009: £2,712,006) in maintenance rent.
The future claims against the maintenance reserves funds can be estimated according to manufacturers’ recommendations and typical aircraft usage. Unforeseen events may occur however, which creates some uncertainty for the Company in calculating the fi nal future claimable amount and the timing of such claims from the maintenance reserve funds.
27 SEGMENT INFORMATION
a) Segment reporting policy
A segment is a distinguishable component of the Group within a particular economic environment (geographical segment) and to a particular industry (business segment) which is subject to risks and rewards that are diff erent from those of other segments.
The primary format, business segments, is based on the Group’s management and internal reporting structure. In presenting information on the basis of business segments, segment revenue and segment assets are based on the nature of the products or services provided by the Group, information for geographical segments is based on the geographical areas where the customers are located.
Inter-segment pricing is determined on an arm’s length basis. Segment results, assets and liabilities include items directly attributable to a segment as well as those that can be allocated on a reasonable basis. Unallocated items comprise mainly of corporate assets and liabilities or profi t or losses items that are not directly attributable to a segment or those that cannot be allocated on a reasonable basis. Common expenses were allocated based on revenue from the Group.
Segment capital expenditure is the total cost incurred during the period to acquire segment assets that are expected to be used for more than one year.
44
NOTES TO FINANCIAL STATEMENTSFOR THE YEAR ENDED 30 JUNE 2010

b) Primary reporting segment – business segments
During the year ended 30 June 2010, the Group was organised into two main business segments which are aircraft leasing and business procurement.
Other operations of the Group mainly comprise investment holding which does not constitute a separate reportable segment. There are no inter-segment transactions recorded during the fi nancial period.
Aircraft BusinessGroup leasing procurement TotalFinancial year ended 30 June 2010 £ £ £
Revenue & other operating income
- External sales 17,275,930 1,149,713 18,425,643
- Other income 63,649
Total of all segments 18,489,292
Less: elimination (929,098)
Consolidated revenue 17,560,194
Aircraft BusinessGroup leasing procurement TotalFinancial year ended 30 June 2010 £ £ £
Results
Segment results 6,854,574 7,213 6,861,787
Finance income 5,948
Finance expense (3,319,635)
Unallocated corporate expenses -
Profi t before taxation 3,548,100
Taxation (729,517)
Profi t after taxation 2,818,583
Other segment items
Capital expenditure & valuation movement
- property, plant and equipment 5,016,050 - 5,016,050
Depreciation 4,704,566 238 4,704,804
Group Aircraft BusinessFinancial year ended 30 June 2010 leasing procurement Total
£ £ £
Segment assets 96,009,739 259,826 96,269,565
Unallocated assets -
Consolidated total assets 96,269,565
Segment liabilities
Trade and other payables 4,902,278 296,055 5,198,333
Provisions of taxation 14,532 3,836 18,368
Short term provisions 2,047,185 - 2,047,185
Loans and borrowings 48,725,729 - 48,725,729
Deferred tax liabilities 4,248,024 - 4,248,024
Unallocated liabilities -
Consolidated total liabilities 60,237,639
45
NOTES TO FINANCIAL STATEMENTSFOR THE YEAR ENDED 30 JUNE 2010

ANNUAL REPORT 2010
Aircraft BusinessGroup leasing procurement TotalFinancial year ended 30 June 2009 £ £ £
Revenue & other operating income
- External sales 15,228,176 759,085 15,987,261
- Other income 2,125,663
Total of all segments 18,112,924
Less: elimination (356,783)
Consolidated revenue 17,756,141
Aircraft Business
Group leasing procurement Total
Financial year ended 30 June 2009 £ £ £
Results
Segment results 8,609,267 14,609 8,623,876
Finance income 13,254
Finance expense (3,548,968)
Unallocated corporate expenses (101,841)
Profi t before taxation 4,986,321
Taxation (754,408)
Profi t after taxation 4,231,913
Other segment items
Capital expenditure & valuation movement
- property, plant and equipment 7,263,892 - 7,263,892
Depreciation 4,455,022 628 4,455,650
Group Aircraft Business
Financial year ended 30 June 2009 leasing procurement Total
£ £ £
Segment assets 84,836,980 35,004 84,871,984
Unallocated assets 48,114
Consolidated total assets 84,920,098
Segment liabilities
Provisions of taxation 217,040 - 217,040
Short term provisions 1,088,555 - 1,088,555
Loans and borrowings 48,775,138 - 48,775,138
Deferred tax liabilities 3,208,998 - 3,208,998
Unallocated liabilities 4,477,749
Consolidated total liabilities 57,767,480
46
NOTES TO FINANCIAL STATEMENTSFOR THE YEAR ENDED 30 JUNE 2010

c) Second reporting segment – geographical segments
The following table provides an analysis of the revenues by geographical market, irrespective of the origin of the goods:
Capital
expenditure
and valuation Total
Group Revenue movements assets
Financial year ended 30 June 2010 £ £ £
Australia 9,418,881 5,016,050 40,119,752
United States 2,200,000 - 7,649,047
Denmark 5,764,395 - 47,368,403
Nigeria 89,294 - -
Malta - - 534,235
United Kingdom - - 338,302
Other 79,943 - 259,826
17,552,513 5,016,050 96,269,565
Capital
expenditure
and valuation Total
Group Revenue movements assets
Financial year ended 30 June 2009 £ £ £
Australia 8,338,653 7,263,892 34,994,938
United States 1,386,594 6,093,330
Denmark 5,663,523 45,093,718
Nigeria 888,903 - 155,099
United Kingdom - - 630,578
Other 539 - 26,396
16,278,212 7,263,892 86,994,059
Net Book Value
Group Aircraft
Financial year ended 30 June 2010 £
Australia 37,503,127
United States 7,649,047
Denmark 47,368,403
92,520,577
Net Book Value
Group Aircraft
Financial year ended 30 June 2009 £
Australia 31,866,651
United States 6,093,330
Denmark 45,093,718
83,053,699
47
NOTES TO FINANCIAL STATEMENTSFOR THE YEAR ENDED 30 JUNE 2010

ANNUAL REPORT 2010
28 CONTINGENT LIABILITIES
Group2010 2009
£ £
Guarantees 48,725,729 41,955,471
The maximum estimated amount the Group could become liable is as shown above.
The Group has guaranteed the loan of its subsidiaries, Capital Lease Portfolio Australian One Pty Ltd, Capital Lease Malta Ltd and F100 Pty Ltd.
29 ULTIMATE HOLDING COMPANY
No party controls the Company.
30 APPROVAL OF FINANCIAL STATEMENTS
The fi nancial statements of the Company and the consolidated fi nancial statements of the Group for the fi nancial period ended 30 June 2010 were authorised for issue by the Board of Directors on 22 October 2010.
48
NOTES TO FINANCIAL STATEMENTSFOR THE YEAR ENDED 30 JUNE 2010

49
SHARE PRICE PERFORMANCEAS AT 6 OCTOBER 2010
62.75
50.50
38.25
Nov Dec Jan Feb Mar Apr May Jun Jul Aug Sep
2010 Pence
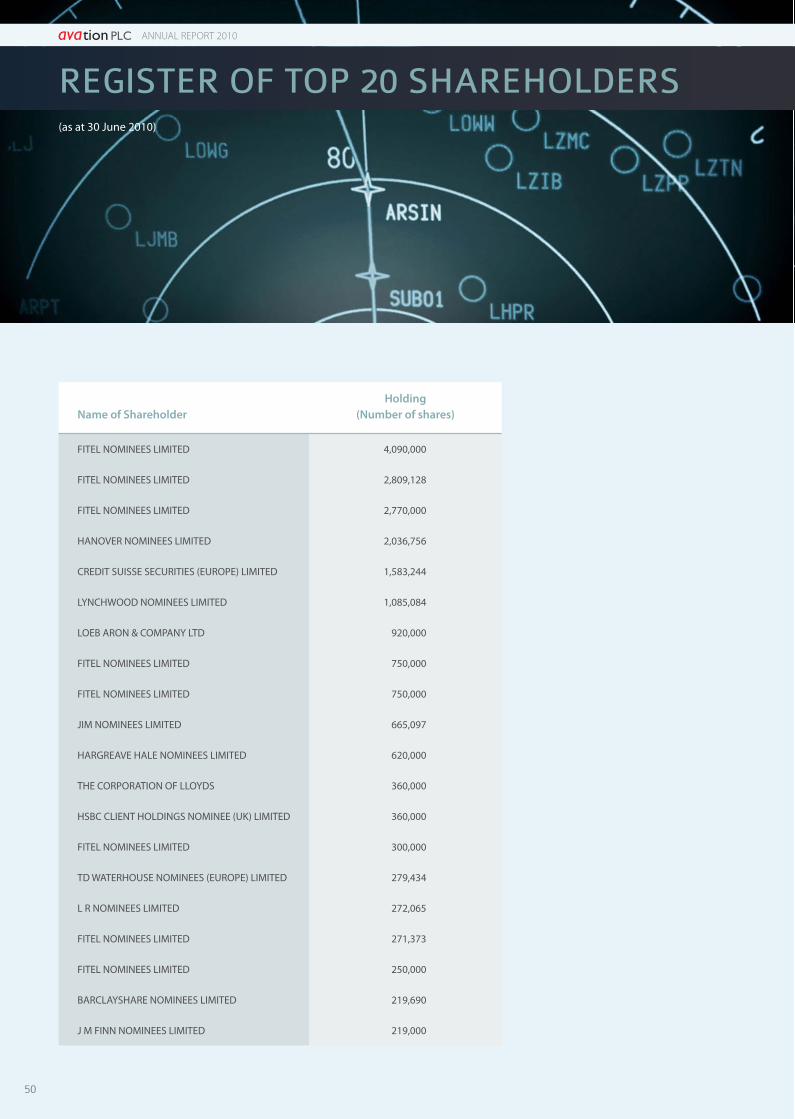
ANNUAL REPORT 2010
50
REGISTER OF TOP 20 SHAREHOLDERS
Name of ShareholderHolding
(Number of shares)
FITEL NOMINEES LIMITED 4,090,000
FITEL NOMINEES LIMITED 2,809,128
FITEL NOMINEES LIMITED 2,770,000
HANOVER NOMINEES LIMITED 2,036,756
CREDIT SUISSE SECURITIES (EUROPE) LIMITED 1,583,244
LYNCHWOOD NOMINEES LIMITED 1,085,084
LOEB ARON & COMPANY LTD 920,000
FITEL NOMINEES LIMITED 750,000
FITEL NOMINEES LIMITED 750,000
JIM NOMINEES LIMITED 665,097
HARGREAVE HALE NOMINEES LIMITED 620,000
THE CORPORATION OF LLOYDS 360,000
HSBC CLIENT HOLDINGS NOMINEE (UK) LIMITED 360,000
FITEL NOMINEES LIMITED 300,000
TD WATERHOUSE NOMINEES (EUROPE) LIMITED 279,434
L R NOMINEES LIMITED 272,065
FITEL NOMINEES LIMITED 271,373
FITEL NOMINEES LIMITED 250,000
BARCLAYSHARE NOMINEES LIMITED 219,690
J M FINN NOMINEES LIMITED 219,000
(as at 30 June 2010)

CORPORATE DIRECTORY
DIRECTORS:
Robert Jeff ries Chatfi eld
Andrew Baudinette
Bryant James McLarty
COMPANY SECRETARIES:
Siobhan Mary Macgroarty Cool
Carissa Gina Tan Mui Hia (Appointed on 30 June 2010)
REGISTERED OFFICE:
Georgian House
63 Coleman Street
London
EC2R 5BB
AUDITORS:
Kingston Smith LLP
Devonshire House
60 Goswell Road
London
EC1M 7AD
SOLICITORS:
Speechly Bircham LLP
6 New Street Square
London
EC4A 3LX
CORPORATE ADVISER:
Loeb Aron & Company Ltd
Georgian House
63 Coleman Street
London
EC2R 5BB
REGISTRARS:
Computershare Investor Services PLC
The Pavilions
Bridgwater Road
Bristol
BS99 6ZZ
BANKERS:
Citibank NA
3 Temasek Avenue
#12-00 Centennial Tower
Singapore 039190
Lloyds TSB Bank PLC
25 Gresham Street
London
EC2V 7HN

Reuters/BBG AVAP.PZ
Index: LSE AVAP
FTSE Sector: Industrial Transportation
FTSE Sub Sector: Transportation Services