ANNUAL REPORT AND FINANCIAL STATEMENTS FOR · PDF fileANNUAL REPORT AND FINANCIAL STATEMENTS...
68
BMCE BANK INTERNATIONAL plc ANNUAL REPORT AND FINANCIAL STATEMENTS FOR THE YEAR ENDED 31 DECEMBER 2015 Company Registration N°5321714 (England and Wales)
Transcript of ANNUAL REPORT AND FINANCIAL STATEMENTS FOR · PDF fileANNUAL REPORT AND FINANCIAL STATEMENTS...

BMCE BANK INTERNATIONAL plc
ANNUAL REPORT AND
FINANCIAL STATEMENTS
FOR THE YEAR ENDED 31 DECEMBER 2015
Company Registration N°5321714 (England and Wales)

Page 2 - Company Registration N°5321714 (England and Wales)
Contents
Part I Board of directors and secretary
Strategic report
Directors’report
Statement of directors’ responsibilities
Independent auditor’s report
Part II Statement of profit or loss
Statement of other comprehensive income
Statement of financial position
Statement of changes in equity
Statement of cash flows
Notes to the financial statements
Part III
Pillar III disclosures (unaudited information)

Page 3 - Company Registration N°5321714 (England and Wales)
Part I
Board of directors and secretary - 04
Strategic report - 05
Directors’report - 10
Statement of directors’ responsibilities - 11
Independent auditor’s report - 12
Page 4 - Company Registration N°5321714 (England and Wales)
Chairman
• David Suratgar
Executive director
• Mohammed Afrine – Chief Executive Officer
Non-executive directors
• Colin Fisher
• Ian Plenderleith, CBE (resigned 31 January 2016)
• Brahim Benjelloun-Touimi
• Mohammed Agoumi
Secretary
TMF Corporate Administration Services Limited
Auditor
Mazars LLP
Chartered accountants and statutory auditor
Tower Bridge House
St. Katharine’s Way
London
E1W 1DD
Registered office
26 Upper Brook Street
London
W1K 7QE
Bankers
Barclays Bank Plc
1st Floor
99 Hatton Gardens
London
EC1N 8DN
BMCE Bank International Plc
Registered in England No. 5321714
Bo
ard
of
dir
ecto
rs a
nd
sec
reta
ry

Page 5 - Company Registration N°5321714 (England and Wales)
Strategic Report
The Directors present their Strategic Report for BMCE Bank International plc (“the Bank”) for the year ended 31 December 2015.
Our Strategic priorities and progress
❶ Completion of the investment bank
The Bank still continues in its efforts to transition towards becoming investment bank with a particular focus on developing African business.
The business advisory, fund manager and brokerage of asset business streams are not yet fully established. We still aim to be the benchmark for investment in Africa with a complete portfolio of Banking products.
Like 2014, new staff members joined the Bank in 2015 to strengthen current business lines but also to generate new opportunities.
In 2016 the Bank plans to continue with its plans to extend its services, including asset management and equity sales.
❷ Upgrading of information technology system
A project to upgrade the information technology systems started in 2013. There are important implications in the development of the new system that will allow a significant reduction of human intervention and thus operational risk.
The Bank dedicated 2015 to develop its system and to reinforce its IT infrastructure. Key contracts were signed in early 2016. The Bank also strengthened both business and IT team for speeding up the project.
❸ Organisation of governing bodies
The goal is to ensure an effective decision making process throughout the business. Governance within the Bank is achieved by the following bodies:
• The Board of Directors consisting of five Non-Executive Directors of which three were independent Non-Executive and the Chief Executive Officer, and others regularly invited including the ‘Managing Director & Head of Risk’, the Chief Financial Officer and the Head of Internal Audit. The Board approves the overall strategy and the broad guidelines of the Bank.
• The Risk Committee consists of two non-executive Directors and the ‘Managing Director & Head of Risk’; other members of the Board, the Chief Financial Officer and the Head of Internal Audit are invited. The Risk Committee monitors and assesses
the adequacy and effectiveness of risk management policies and processes. It monitors the full range of risks, financial and non-financial, including credit, market, liquidity, funding, capital, operational and regulatory risks.
• The Audit Committee consists of two Non-Executive Directors and the Head of Internal Audit. The Chairman of the Board, the Chief Executive Officer, other members of the Board, and Departmental Heads, example, the Chief Financial Officer, the Head of Risk are regularly invited. The committee monitors the adequacy and effectiveness of controls, processes, governance, integrity of financial statements and objectivity of internal and external auditors.
• The Remuneration Committee is headed by a non-executive Director. In addition, another member of the Board of Directors, the Chief Executive Officer and Human Resources department also attend.
• Other committees involved in the decision making processes of the Bank are:
_ Executive Committee
– Treasury Asset and Liability Management Committee; and
– Credit Committee.
❹ Achievement of business objectives
• Achieving our goals will undoubtedly be as a result of continuing our marketing efforts with on-going cost control and further optimisation of the risk return.
• Commercial effort and synergies: we expect strong benefits from Group synergies for both of the components "Buy Side" and "Sell Side".
• Commercial success: Capitalising on the "BMCE Bank of Africa" brand for the acquisition of new customers while emphasising the geographic and sectoral diversification of our "Target Market" and maintaining the level of "Risk Appetite" as approved by the Board.
• Orientation towards fee earning business: It is important for our Bank to complete the product range and move progressively towards the fee earning business.
• Control over overheads: Rationalisation of costs and outsourcing IT.
Stra
tegi
c re
po
rt
Page 6 - Company Registration N°5321714 (England and Wales)
Strategic report (continued)
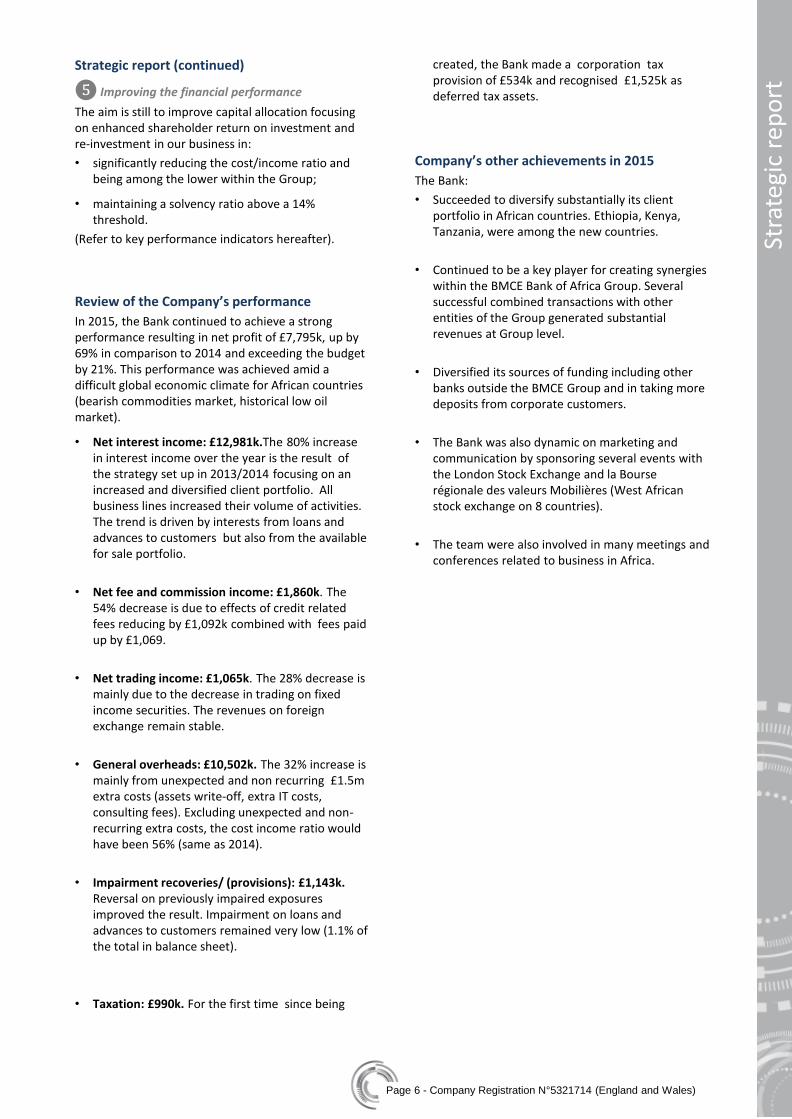
❺ Improving the financial performance
The aim is still to improve capital allocation focusing on enhanced shareholder return on investment and re-investment in our business in:
• significantly reducing the cost/income ratio and being among the lower within the Group;
• maintaining a solvency ratio above a 14% threshold.
(Refer to key performance indicators hereafter).
Review of the Company’s performance
In 2015, the Bank continued to achieve a strong performance resulting in net profit of £7,795k, up by 69% in comparison to 2014 and exceeding the budget by 21%. This performance was achieved amid a difficult global economic climate for African countries (bearish commodities market, historical low oil market).
• Net interest income: £12,981k.The 80% increase in interest income over the year is the result of the strategy set up in 2013/2014 focusing on an increased and diversified client portfolio. All business lines increased their volume of activities. The trend is driven by interests from loans and advances to customers but also from the available for sale portfolio.
• Net fee and commission income: £1,860k. The 54% decrease is due to effects of credit related fees reducing by £1,092k combined with fees paid up by £1,069.
• Net trading income: £1,065k. The 28% decrease is mainly due to the decrease in trading on fixed income securities. The revenues on foreign exchange remain stable.
• General overheads: £10,502k. The 32% increase is mainly from unexpected and non recurring £1.5m extra costs (assets write-off, extra IT costs, consulting fees). Excluding unexpected and non-recurring extra costs, the cost income ratio would have been 56% (same as 2014).
• Impairment recoveries/ (provisions): £1,143k. Reversal on previously impaired exposures improved the result. Impairment on loans and advances to customers remained very low (1.1% of the total in balance sheet).
• Taxation: £990k. For the first time since being
created, the Bank made a corporation tax provision of £534k and recognised £1,525k as deferred tax assets.
Company’s other achievements in 2015
The Bank:
• Succeeded to diversify substantially its client portfolio in African countries. Ethiopia, Kenya, Tanzania, were among the new countries.
• Continued to be a key player for creating synergies within the BMCE Bank of Africa Group. Several successful combined transactions with other entities of the Group generated substantial revenues at Group level.
• Diversified its sources of funding including other banks outside the BMCE Group and in taking more deposits from corporate customers.
• The Bank was also dynamic on marketing and communication by sponsoring several events with the London Stock Exchange and la Bourse régionale des valeurs Mobilières (West African stock exchange on 8 countries).
• The team were also involved in many meetings and conferences related to business in Africa.
Stra
tegi
c re
po
rt

Page 7 - Company Registration N°5321714 (England and Wales)
Strategic report (continued)
Key performance indicators (KPI)
• Solvency ratio
• Impairment ratio
note 1: figures in millions GBP.
note 2: impaired exposures = Gross amount of loans, individually determined to be impaired, before deducting any individually assessed impairment allowance.
note 3: ratio = impaired exposures / balance sheet exposure on cash and loans to banks and customers.
• Solvency ratio
• Cost / income ratio
Stra
tegi
c re
po
rt
40% target
14% target
6,709
9,929
1,829
4.5%
3.6%
0.6%
0.0%
0.5%
1.0%
1.5%
2.0%
2.5%
3.0%
3.5%
4.0%
4.5%
5.0%
-
2,000
4,000
6,000
8,000
10,000
12,000
2013 2014 2015
Impaired exposure Ratio
25.1%
17.9% 16.2%
0%
5%
10%
15%
20%
25%
30%
2013 2014 2015
10.4
7.9
10.5
12.8 13.1
16.2 81%
61% 65%
0
2
4
6
8
10
12
14
16
18
0%
10%
20%
30%
40%
50%
60%
70%
80%
90%
2013 2014 2015
£m
Oper. costs Net oper. Inc. Ratio

Page 8 - Company Registration N°5321714 (England and Wales)
Treasury – Capital Market (TCM)
Similarly to 2014, the 2015 trend remained upwards.
The TCM business closed the year end 2015 with a £4,334k net operating income. This represented a 5.5% increase compared to 2014.TCM represented more than 26% of the net banking income. TCM continued to be a key contributor for the business of the Bank adding a significant values in relationship with stakeholders.
Amid difficult conditions on African financial markets due to bearish commodities and oil markets and the Fed interest rate hike.
The total of transactions done by TCM over 2015 exceeded £122bn (+19% compare to 2014). Within BMCE Group, synergies are real with a 55% increase up to £2bn transactions.
TCM was also successful in sponsoring events with LSE and BRVM which were portrayed in the media.
Corporate Banking
• Project Structured Finance (PSF) – The performance has increased compared to 2014 amid a difficult economic climate for some African countries. The management remains optimitisc for 2016.
• Commodities and Trade Finance (CTF) – The 2015 performance was excellent by £1,000k compared to 2014. The CTF was among the best desk in 2015 from income, return and total of transactions perspectives. This was the result of a dynamic commercial strategy that lead CTF to enhance its business portfolio.
.
• Loans syndications and synergies (LSS) – The LSS achieved again in 2015 a strong performance in generating revenues which increased by £1,343k. The desk successfully generate deals involving group entities (e.g. Tangier Off-Shore, BMCE in Spain). The business lines continued to successfully diversify its portfolio both geographical and sectoral diversification with expansion into banking, mining, infrastructure and telecommunication sectors.
• Paris branch – The Paris branch continued for three years in a row to contribute significantly to the Bank’s revenues. In line with the global commercial strategy of the Bank, the Paris Branch generated more business on Trade Finance and Correspondent banking. Business targets in African countries were also defined to create additional synergies with group entities.
Stra
tegi
c re
po
rt
£’000 2015 2014-
Restated*
Profit on FX 1,035 1,100
Profit on bonds 2,883 2,200
Money Market 416 808
Treasury – Capital Market 4,334 4,108
Structured Finance 3,409 2,575
Commodities Trade Finance 3,302 2,302
Loans syndications and synergies 2,763 1,420
Paris branch 3,402 2,967
Corporate Banking 12,876 9,264
Other (expenses) / income not allocated (557) 270
Subordinated debt not allocated (489) (583)
Net operating income 16,164 13,059
Development and performance by business lines for the year 2015
*See Note 32.
Strategic report (continued)
Page 9 - Company Registration N°5321714 (England and Wales)
Stra
tegi
c re
po
rt
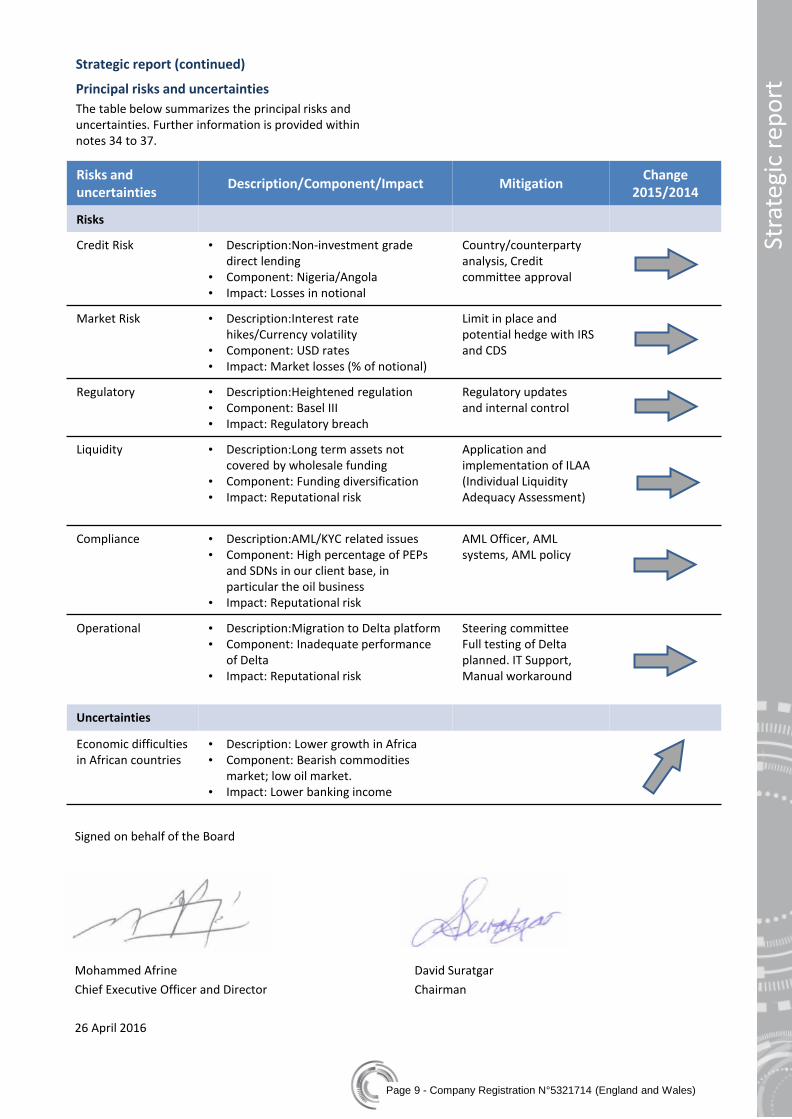
Signed on behalf of the Board
Mohammed Afrine
Chief Executive Officer and Director
26 April 2016
David Suratgar
Chairman
Principal risks and uncertainties
The table below summarizes the principal risks and uncertainties. Further information is provided within notes 34 to 37.
Risks and uncertainties
Description/Component/Impact Mitigation Change
2015/2014
Risks
Credit Risk
• Description:Non-investment grade direct lending
• Component: Nigeria/Angola • Impact: Losses in notional
Country/counterparty analysis, Credit committee approval
Market Risk • Description:Interest rate hikes/Currency volatility
• Component: USD rates • Impact: Market losses (% of notional)
Limit in place and potential hedge with IRS and CDS
Regulatory • Description:Heightened regulation • Component: Basel III • Impact: Regulatory breach
Regulatory updates and internal control
Liquidity • Description:Long term assets not covered by wholesale funding
• Component: Funding diversification • Impact: Reputational risk
Application and implementation of ILAA (Individual Liquidity Adequacy Assessment)
Compliance • Description:AML/KYC related issues • Component: High percentage of PEPs
and SDNs in our client base, in particular the oil business
• Impact: Reputational risk
AML Officer, AML systems, AML policy
Operational • Description:Migration to Delta platform • Component: Inadequate performance
of Delta • Impact: Reputational risk
Steering committee Full testing of Delta planned. IT Support, Manual workaround
Uncertainties
Economic difficulties in African countries
• Description: Lower growth in Africa • Component: Bearish commodities
market; low oil market. • Impact: Lower banking income
Strategic report (continued)

Page 10 - Company Registration N°5321714 (England and Wales)
The Directors of BMCE Bank International plc present their directors report and financial statements for the year ended 31 December 2015.
Principal activities
The Bank is authorised and regulated by the Prudential Regulation Authority (PRA) and Financial Conduct Authority (FCA).
The Bank’s principal activities are Corporate and Investment Banking, focusing on trade, structured and project finance and corporate lending for target customers based in Africa or with an interest in the region and Treasury and Capital Markets, focusing on currency and interest rate markets of the region.
Branch
The Bank also maintains a branch in Paris.
Dividend
No dividend was paid during the year (2014: £Nil). The Directors do not recommend the payment of a final dividend for this financial year (2014: £Nil ).
Future plans
• Banque Marocaine du Commerce Exterieur S.A. (BMCE Bank of Africa) intends to continue to develop synergies between BMCE Bank International and its fellow subsidiary BMCE International Spain and with other group companies in Africa.
• Further details about the Bank’s strategy for the forthcoming financial year are provided in the Strategic Report.
Financial risk management and exposure to financial risks
The Bank’s financial risk management objectives and policies and its exposure to credit risk, market risk ,operational risk and liquidity risk are disclosed in
notes 33 to 37.
Directors
The following Directors have held office since 1 January 2015:
D. Suratgar (Chairman)
C. Fisher
I. Plenderleith, CBE (resigned in 31 January 2016)
B. Benjelloun-Touimi
M. Agoumi
M. Afrine (Chief Executive Officer)
Directors’ interests
None of the Directors has, or had during the year under review, any beneficial interest in the shares of the Company.
Going concern
As set out in the Review of the Business section, the Bank still took significant actions during 2015 to strengthen its financial and liquidity positions combining strong performance on net operating income and on its ability to recover impairment losses, this resulted in 2015 being the fourth profitable year in a row for the Bank. No profit will be distributed to the shareholder. During the Board held in December 2015, the shareholder committed to waive dividend until 2020, so the additional resources will allow the Bank to reinvest in its business (see note 21).
The directors have a reasonable expectation that the company has adequate resources to continue in operational existence for the foreseeable future.
Thus they continue to adopt the going concern basis of accounting in preparing the annual financial statements.
Dir
ecto
rs’ r
epo
rt
Signed on behalf of the Board
Mohammed Afrine
Chief Executive Officer and Director
26 April 2016
David Suratgar
Chairman
Directors’ report

Page 11 - Company Registration N°5321714 (England and Wales)
Statement of directors’ responsibilities
This statement should be read in conjunction with the responsibilities of the auditor set out in their report on page 12.
The Directors are responsible for preparing the Strategic Report, the Directors’ Report and the financial statements in accordance with applicable law and regulations.
Company law requires the Directors to prepare financial statements for each financial year. Under that law the Directors have elected to prepare the financial statements in accordance with International Financial Reporting Standards (IFRSs) as adopted by the European Union. Under Company law the Directors must not approve the financial statements unless they are satisfied that they give a true and fair view of the state of affairs of the Company and the profit or loss of the Company for that period.
In preparing these financial statements, the Directors are required to:
• select suitable accounting policies and then apply them consistently;
• make judgments and accounting estimates that are reasonable and prudent;
• state whether applicable International Financial Reporting Standards (IFRSs) have been followed, subject to any material departures disclosed and explained in the financial statements;
• provide additional disclosures when compliance with specific requirements in IFRS is insufficient to enable users to understand the impact of particular transactions, other events and conditions on the entity’s financial position and financial performance; and
• prepare the financial statements on a going concern basis unless it is inappropriate to presume
that the Company will continue in business.
The Directors are responsible for keeping adequate accounting records that are sufficient to show and explain the Company’s transactions and disclose with reasonable accuracy at any time the financial position of the Company and enable them to ensure that the financial statements comply with the Companies Act 2006. They are also responsible for safeguarding the assets of the Company and hence for taking reasonable steps for the prevention and detection of fraud and other irregularities.
Directors’ statement of disclosure to auditors
Each of the Directors confirms that:
• to the best of each Director’s knowledge and belief, there is no information relevant to the preparation of their report of which the Bank’s auditor is unaware; and
• each Director has taken all the steps a Director might reasonably be expected to have taken to be aware of relevant audit information and to establish that the Bank’s auditor is aware of that information.
This confirmation is given and should be interpreted in accordance with the provisions of section 418 of the Companies Act 2006.
Stat
emen
t o
f d
irec
tors
’ res
po
nsi
bili
ties
Signed on behalf of the Board
Mohammed Afrine
Chief Executive Officer and Director
26 April 2016
David Suratgar
Chairman

Page 12 - Company Registration N°5321714 (England and Wales)
Ind
epen
den
t au
dit
or’
s re
po
rt
Independent auditor’s report to the members of
BMCE Bank International Plc
We have audited the financial statements of BMCE Bank International plc for the year ended 31 December 2015 which comprise the statement of profit or loss, statement of other comprehensive income, statement of financial position, statement of cash flow, statement of changes in equity and the related notes 1 to 39. The financial reporting framework that has been applied in their preparation is applicable law and International Financial Reporting Standards (IFRSs) as adopted by the European Union.
Respective responsibilities of Directors and auditor
As explained more fully on page 11 in the Directors’ Responsibilities Statement, the Directors are responsible for the preparation of the financial statements and for being satisfied that they give a true and fair view.
Our responsibility is to audit and express an opinion on the financial statements in accordance with applicable law and International Standards on Auditing (UK and Ireland). Those standards require us to comply with the Auditing Practices Board’s Ethical Standards for Auditors. This report is made solely to the Company’s members as a body in accordance with Chapter 3 of Part 16 of the Companies Act 2006. Our audit work has been undertaken so that we might state to the Company’s members those matters we are required to state to them in an auditor’s report and for no other purpose. To the fullest extent permitted by law, we do not accept or assume responsibility to anyone other than the Company and the Company’s members as a body for our audit work, for this report, or for the opinions we have formed.
Scope of the audit of the financial statements
A description of the scope of an audit of financial statements is provided on the Financial Reporting Council’s web-site at www.frc.org.uk/auditscopeukprivate.
Opinion on the financial statements
In our opinion the financial statements:
• give a true and fair view of the Company’s affairs as at 31 December 2015 and of its profit for the year then ended;
• have been properly prepared in accordance with IFRSs as adopted by the European Union;
• have been prepared in accordance with the requirements of the Companies Act 2006.
Opinion on other matter prescribed by the Companies Act 2006
In our opinion the information given in the Strategic Report and Directors’ Report for the financial year for which the financial statements are prepared is consistent with the financial statements.
Matters on which we are required to report by exception
We have nothing to report in respect of the following matters where the Companies Act 2006 requires us to report to you if, in our opinion:
• adequate accounting records have not been kept, or returns adequate for our audit have not been received from branches not visited by us; or
• the financial statements are not in agreement with the accounting records and returns; or
• certain disclosures of Directors’ remuneration specified by law are not made; or
• we have not received all the information and explanations we require for our audit.
Greg Simpson (Senior Statutory Auditor)
for and on behalf of Mazars LLP
Chartered Accountants and Statutory Auditor
Mazars LLP
Tower Bridge House
St. Katharine’s Way
London
E1W 1DD

Page 13 - Company Registration N°5321714 (England and Wales)
Part II
Statement of profit or loss - 14
Statement of other comprehensive income - 15
Statement of financial position - 16
Statement of changes in equity - 17
Statement of cash flows - 18
Notes to the financial statements - 19

Page 14 - Company Registration N°5321714 (England and Wales)
Stat
emen
t o
f p
rofi
t o
r lo
ss
£’000 Note 2015 2014-
Restated*
Interest and similar income 14,664 8,221
Interest expense and similar charges (1,683) (1,022)
Net interest income 6 12,981 7,199
Fee and commission income 3,170 4,262
Fee and commission expense (1,310) (241)
Net fee and commission income 7 1,860 4,021
Net trading income 8 1,065 1,487
Other operating income 9 258 352
Net operating income 16,164 13,059
Personnel expenses 10 (4,945) (4,268)
Depreciation of property and equipment 19 (119) (249)
Amortisation of intangible assets 20 (30) -
Other operating expenses 11 (5,408) (3,442)
Total operating expenses before impairment losses (10,502) (7,959)
Net impairment recoveries/ (losses) 12 1,143 (1,361)
Profit before taxation 6,805 3,739
Taxation 13 990 880
Profit for the year 7,795 4,619
Statement of profit or loss for the year ended 31 December 2015
*See Note 32. The notes on pages 19 - 64 form part of these financial statements.

Page 15 - Company Registration N°5321714 (England and Wales)
Stat
emen
t o
f o
ther
co
mp
reh
ensi
ve in
com
e
*See Note 32. The notes on pages 19 - 64 form part of these financial statements.
£’000 Note 2015 2014-
Restated*
Profit for the year 7,795 4,619
Items that do not qualify for reclassification
Foreign currency translation differences for foreign operations (88) (7)
Net fair value loss on available for sale financial assets (280) (1,874)
Net gain on disposal of available for sale investments 14 94
Tax - -
Other comprehensive income for the year 14 (354) (1,787)
Total comprehensive income for the year 7,441 2,832
Statement of other comprehensive income for the year ended 31 December 2015

Page 16 - Company Registration N°5321714 (England and Wales)
Stat
emen
t o
f fi
nan
cial
po
siti
on
£’000 Note 2015 2014-
Restated*
Assets
Cash and balances with central banks 15 4,369 1,887
Due from banks 15 136,700 123,940
Derivative financial instruments 38 222 15
Loans and advances to customers 16 167,713 149,257
Financial investments - available for sale 17 102,378 66,109
Financial investments – held to maturity 18 7,337 -
Property and equipment 19 226 987
Goodwill and other intangible assets 20 - 21 8,031 7,791
Deferred tax assets 13 6,418 4,893
Other assets 22 8,288 10,473
Total assets 441,682 365,352
Liabilities and equity
Due to banks 23 264,777 189,419
Derivative financial instruments 38 859 4,267
Due to customers 24 98,537 101,419
Other liabilities 25 3,517 2,874
Subordinated debt 26 13,316 14,138
Total liabilities 381,006 312,117
Equity attributable to equity holders of parent
Share capital 27 102,173 102,173
Other reserves 27 (2,989) (2,635)
Accumulated losses 27 (38,508) (46,303)
Total equity 60,676 53,235
Total liabilities and equity 441,682 365,352
Statement of financial position as at 31 December 2015
Mohammed Afrine
Chief Executive Officer and Director
David Suratgar
Chairman
*See Note 32.
The notes on pages 19 - 64 form part of these financial statements
Approved by the Board and authorised for issue on 26 April 2016.

Page 17 - Company Registration N°5321714 (England and Wales)
Stat
emen
t o
f ch
ange
s in
eq
uit
y
£’000 Note Share capital
Other reserves
Accumula-ted losses
Total
Balance as at 1 January 2014 as previously stated 102,173 (848) (50,922) 50,403
Profit for the year as previously stated - - 5,708 5,708
Impact of correction of errors 32 (1,089) (1,089)
Other comprehensive income - (1,787) - (1,787)
Total comprehensive income - (1,787) 4,619 2,832
Restated balance as at 31 December 2014 27 102,173 (2,635) (46,303) 53,235
Balance as at 1 January 2015 102,173 (2,635) (46,303) 53,235
Profit for the year - - 7,795 7,795
Other comprehensive income - (354) - (354)
Total comprehensive income (354) 7,795 7,441
Balance as at 31 December 2015 27 102,173 (2,989) (38,508) 60,676
Statement of changes in equity for the year ended 31 December 2015
Other reserves category in the table above relates to changes in the fair value of financial instruments classified as available for sale and the effects of foreign currency retranslation on a foreign operation. The notes on pages 19 - 64 form part of these financial statements.

Page 18 - Company Registration N°5321714 (England and Wales)
Stat
emen
t o
f ca
sh f
low
s
£’000 note 2015 2014-
Restated*
Cash flows from continuing operating activities
Profit before tax 6,805 3,739
Adjustments for:
Net interest income 12,981 7,199
Interest received (7,870) (4,620)
Interest paid 1,719 1,059
Change in operating assets 28 (25,324) (106,599)
Change in operating liabilities 28 69,456 148,518
Other items included in profit before tax 28 1,712 1,250
Net cash flows generated by continuing operating activities 59,479 50,546
Cash flows from investing activities
Purchase of financial investments (48,498) (73,137)
Proceeds from sales of financial investments 4,892 47,315
Purchase of property and equipment (72) (125)
Purchase of intangible assets (724) -
Net cash flows generated by investing activities (44,402) (25,947)
Net increase in cash and cash equivalents 15,077 24,599
Cash and cash equivalents as at 1 January 100,949 76,350
Cash and cash equivalents as at 31 December 15 116,026 100,949
Statement of cash flow for the year ended 31 December 2015
*See Note 32. Net foreign exchange difference on cash is immaterial because foreign currency cash positions are settled and matured on a daily basis, hence foreign currency cash would only be revalued from the previous day. The notes on pages 19 - 64 form part of these financial statements.
Page 19 - Company Registration N°5321714 (England and Wales)
no
tes
to t
he
fin
anci
al s
tate
men
ts
1. Corporate Information
In these financial statements, BMCE Bank International plc is referred to as the “Bank”. The statements comprise the financial statements of BMCE Bank International plc as an individual entity. The bank also maintains a foreign branch that is located in Paris.
The Bank provides Corporate and Investment Banking and Treasury services in Europe as well as North, East, West and Central Africa. The principal activities of the Bank are described in the strategic and directors’ reports and note 5.
BMCE Bank International plc is incorporated and domiciled in England and Wales and is authorised and regulated by the Prudential Regulation Authority (PRA) and the Financial Conduct Authority (FCA). Its registered office is at 26 Upper Brook Street, London, W1K 7QE, United Kingdom.
The ultimate parent undertaking and ultimate controlling party is Banque Marocaine du Commerce Exterieur S.A. (BMCE Bank of Africa Group), a Company incorporated in Morocco. BMCE International (Holdings) plc, a Company incorporated in the United Kingdom and registered in England and Wales, is the immediate holding Company for the Bank.
Copies of the consolidated financial statements prepared in respect of Banque Marocaine du Commerce Exterieur S.A. may be obtained by request on the following address: 140 Avenue Hassan II 2100 Casablanca or on the website: http://www.bmcebank.ma/.
2. Presentation of accounts
A. Basis of preparation
The accounts are prepared on a going concern basis (see the Directors’ report on page 10) and in accordance with International Financial Reporting Standards issued by the International Accounting Standards Board (IASB) and interpretations issued by the IFRS Interpretations Committee of the IASB as adopted by the European Union (EU) (together IFRS).
The financial statements have been prepared on a historical cost basis, except for derivative financial instruments, financial assets and financial liabilities held at fair value through profit or loss and available for sale investments that have been measured at fair value.
The Bank presents its statement of financial position broadly in order of liquidity. An analysis regarding recovery or settlement within 12 months after the statement of financial position date (current) and more than 12 months after the statement of financial position date (non-current) is presented in note 35.
B. Significant accounting judgements and estimates
Information about judgements made in applying accounting policies that have the most significant effects on the amounts recognized in the financial statements is set out below.
Information about assumptions and estimation uncertainties that have a significant risk resulting in a material adjustment in the year ended 31 December 2015 is set out below in relation to the impairment of financial instruments and in relation to other areas such as:
- determination of the fair value of financial instruments with significant unobservable inputs;
- recognition of deferred tax assets: availability of future taxable profit against which carry forward tax losses can be used;
- impairment of financial assets;
- impairment testing for CGU containing goodwill: key assumptions underlying recoverable amounts; and
- impairment of other intangible assets
The most significant use of judgements and estimates are as follows:
• Fair value – The fair values of financial investments are determined based upon a combination of values derived from an external model and broker prices. The valuation of financial instruments is described in more detail in note 38. Management consider that, with the exception of held for trading financial instruments, derivatives and available for sale investments that are held at fair value, all other financial assets and financial liabilities are held on an amortised cost basis which approximates to fair value. Each of the financial assets and financial liabilities are assessed individually.

Page 20 - Company Registration N°5321714 (England and Wales)
no
tes
to t
he
fin
anci
al s
tate
men
ts
• Deferred tax assets – Deferred tax assets are recognised for all unused tax losses to the extent that it is probable that taxable profits will be available against which the losses can be utilised in the future. Significant management judgement is required to determine the amount of deferred tax assets that can be recognised, based upon the likely timing and level of future taxable profits together with future tax planning strategies. Detailed plans are produced for the following 6 financial years. Deferred tax assets and liabilities are measured at the tax rates that are expected to apply in the year when the asset is realised or the liability is settled, based on tax rates (and tax laws) that have been enacted or substantively enacted at the reporting date.
• Impairment of financial assets – Problem loans and advances, including financial investments which are held to maturity and debt securities classified as available for sale investments, are reviewed at each reporting date to assess whether an allowance for impairment should be recorded in the income statement. In particular, judgement by management is required in the estimation of the amount and timing of future cash flows when determining the level of allowance required. Such estimates are based on assumptions about a number of factors and actual results may differ, resulting in future changes to the allowance. The method used to calculate impairment provisions is to estimate future cash flows and then discount these at the original rate of return for the loans and advances and financial instruments being considered. The impairment provision is calculated as the difference between the net present value and the carrying value.
The amounts of impairment provisions can be seen in note 16.
• Impairment of goodwill – Goodwill is tested at each reporting date for impairment and the evaluation requires significant management judgement in estimating the present value of future estimated cash flows expected to be derived from the cash generating units (CGU) to which goodwill has been allocated. Goodwill arising from business combination is allocated to CGU or group of CGU’s that are expected to benefit from the synergies of the combination.
Assets are grouped together into the smallest group of assets that generates cash inflows from continuing use that is largely independent of the cash inflows of other assets or CGUs. Refer to note 21.
Discount rate is within the range of rates used by
the financial services industry and the growth rate is based on the growth rate of our main business geographical area (Africa).
• Impairment of other intangible assets – They are reviewed for any indication of impairment at each reporting date. Where there is such an indication, judgement is required in the estimation of the present value of the future cash flows expected to be derived from the asset or the cash generating unit to which it is allocated.
C. Foreign currency translation
The financial statements are presented in Pound Sterling, which is the Bank’s functional and presentational currency. The functional currency of the foreign branch in Paris is Euro.
Foreign currency transactions are translated into the functional currency using the exchange rate prevailing at the dates of the transactions. The foreign exchange gains and losses resulting from the settlement of such transactions are recognised in the income statement. Unrealised gains and losses on unsettled transactions are also taken to the income statement.
Non-monetary items measured in terms of historical cost in a foreign currency are translated using the exchange rates at the dates of the initial transactions. The results of the foreign branch are translated into the Bank’s presentational currency on a monthly basis at the month end market exchange rate. All balances at the end of the period are converted at the period end rate. Any foreign exchange differences arising are accounted through other comprehensive income and accumulated in ‘other reserves’ in equity.
Page 21 - Company Registration N°5321714 (England and Wales)
no
tes
to t
he
fin
anci
al s
tate
men
ts
D. Financial assets and liabilities – initial recognition and subsequent measurement
• Financial asset – The Bank classifies its financial assets into one of the following categories:
‒ loans and receivables;
‒ available for sale; and
‒ at fair value through profit and loss (held for trading or fair value through profit and loss).
• Financial liabilities – The Bank classifies its financial liabilities, other than financial guarantees and loan commitments, as measured at amortised cost or fair value through profit and loss.
• Date of recognition – Purchases or sales of financial assets that require delivery of assets within the time frame generally established by regulation or convention in the marketplace are recognised on the trade date. Derivatives are also recognised on a trade date basis.
• Initial recognition of financial instruments – The classification of financial instruments at initial recognition depends on the purpose for which the financial instruments were acquired and their characteristics. All financial instruments are measured initially at their fair value plus, in the case of financial assets and financial liabilities not at fair value through profit and loss, any directly attributable incremental cost of acquisition or issue.
• Derivatives recorded at fair value through profit or loss – Derivatives which include foreign exchange contracts are recorded at fair value and carried as assets when their fair value is positive and as liabilities when their fair value is negative. Changes in the fair value of derivatives held for trading are included in ‘Net trading income’.
• Financial assets or financial liabilities held for trading and trading securities – Financial assets or financial liabilities held for trading, comprising financial instruments held for trading other than derivatives, are recorded in the statement of financial position at fair value. Changes in fair value are recognised in ‘Net trading income’. Interest and expenses are recorded in ‘Net trading income’ according to the terms of the contract, or when the right to the payment has been established.
Included in this classification are equities other than available for sale, which have been acquired principally for the purpose of selling in the near term.
• Available for sale financial investments – Available for sale financial investments which consist of equity and bond instruments are those which are designated as available for sale or do not qualify to be classified as designated at fair value through profit or loss, held-to-maturity or loans and receivables.
After initial measurement, available for sale investments are subsequently measured at fair value. Unrealised gains and losses are recognised in other comprehensive income and are accumulated in ‘other reserves’ in equity. When the security is disposed of, the cumulative gain or loss previously recognised in equity is recognised in the income statement in ‘Other operating income’ or ‘Other operating expenses’. Where the Bank holds more than one investment in the same security they are deemed to be disposed of on a first-in-first-out basis. Interest earned whilst holding available for sale financial investments is reported as interest income using the effective interest rate. Dividends earned whilst holding available for sale financial investments are recognised in the income statement as ‘Other operating income’ when the right of the payment has been established. The losses arising from impairment of such investments are recognised in the income statement in ‘Impairment losses on financial investments’ and removed from the
available for sale reserve.
• Held-to-maturity financial investments – Held to maturity investments are those which carry fixed or determinable payments and have fixed maturities and which the group has the intention and ability to hold to maturity. After initial measurement, held to maturity financial investments are subsequently measured at amortised cost using the effective interest rate method, less allowance for impairment. Amortised cost is calculated by taking into account any discount or premium on acquisition and fees that are an integral part of the effective interest rate. The amortisation is included in ‘Interest and similar income’ in the consolidated income statement. The losses arising from impairment of such investments are recognised in the consolidated income statement line ‘Impairment losses on financial investments’.

Page 22 - Company Registration N°5321714 (England and Wales)
no
tes
to t
he
fin
anci
al s
tate
men
ts
• Loans and advances to Banks and customers – These are financial assets with fixed or determinable payments and fixed maturities that are not quoted in an active market. They are not entered into with the intention of immediate or short-term resale and are not classified as ‘Financial assets held for trading’, designated as ‘Financial investment – available for sale’ or ‘Financial assets designated at fair value through profit or loss’. After initial measurement, loans and advances to Banks and customers are subsequently measured at amortised cost using the effective interest rate method, less allowance for impairment. Amortised cost is calculated by taking into account any discount or premium on acquisition and fees and costs that are an integral part of the effective interest rate. The amortisation is included in ‘Interest and similar income’ in the income statement.
• Subordinated debt – Subordinated debt is carried at amortised cost.
• ‘Day 1’ profit – Where the transaction price in a non-active market is different to the fair value from other observable current market transactions in the same instrument or based on a valuation technique whose variables include only data from observable markets, the Bank immediately recognises the difference between the transaction price and fair value (a Day 1 profit) in the income statement in ‘Net trading income’.
In cases where use is made of data which is not observable, the difference between the transaction price and model value is only recognised in the income statement when the inputs become observable, or when the instrument is derecognised.
• Financial guarantees – The Bank gives financial guarantees, consisting of letters of credit, guarantees and acceptances. Financial guarantees are initially recognised in the financial statements at fair value, in ‘Other liabilities’ being the premium received. Subsequent to initial recognition, the Bank’s liability under each guarantee is measured at the higher of the amortised premium and the best estimate of expenditure required settling any financial obligation arising as a result of the guarantee.
Any increase in liability relating to financial guarantees would be taken to the income statement in ‘Credit loss expense’. The premium received is recognised in the income statement in ‘Net fees and commission income’ on a straight line basis over the life of the guarantee.
E. Derecognition of financial assets and financial liabilities
• Financial assets - A financial asset is derecognised where:
- The rights to receive cash flows from the asset have expired; or
- The Bank has transferred its rights to receive cash flows from the asset or has assumed an obligation to pay the received cash flows in full without material delay to a third party under a ‘pass-through’ arrangement; and
- Either (a) the Bank has transferred substantially all the risks and rewards of the asset, or (b) the Bank has neither transferred nor retained substantially all the risks and rewards of the asset, but has transferred control of the asset.
- When the Bank has transferred its rights to receive cash flows from an asset or has entered into a pass-through arrangement, and has neither transferred nor retained substantially all the risks and rewards of the asset nor transferred control of the asset, the asset is recognised to the extent of the Bank’s continuing involvement in the assets. Continuing involvement that takes the form of a guarantee over the transferred asset is measured at the lower of the original carrying amount of the asset and the maximum amount of consideration that the Bank could be required to repay.
• Financial liabilities – A financial liability is derecognised when the obligation under the liability is discharged or cancelled or expires. Where an existing financial liability is replaced by another from the same counterparty on substantially different terms or the terms of an existing liability are substantially modified, such an exchange or modification is treated as a derecognition of the original liability and the recognition of a new liability and the difference in the respective carrying amounts is recognised in profit or loss.
F. Determination of fair value
The fair value for financial instruments traded in active markets at the reporting date is based on their quoted market price or dealer price quotations (bid price for long positions and offer price for short positions), without any deduction for transaction costs.
For all other financial instruments not listed in an active market, the fair value is determined by using appropriate valuation techniques. Valuation techniques include net present value, comparison to similar instruments for which market observable prices exist and other relevant valuation models.
Page 23 - Company Registration N°5321714 (England and Wales)
no
tes
to t
he
fin
anci
al s
tate
men
ts
G. Impairment of financial assets
The Bank assesses at each reporting date whether there is any objective evidence that a financial asset or a group of financial assets is impaired. A financial asset or a group of financial assets is deemed to be impaired if, and only if, there is objective evidence of impairment as a result of one or more events that has occurred after the initial recognition of the asset (an incurred ‘loss event’) and that loss event (or events) has an impact on the estimated future cash flows of the financial asset or the group of financial assets that can be reliably estimated.
Evidence of impairment may include indications that the borrower or a group of borrowers is experiencing significant financial difficulty, default or delinquency in interest or principal payments, the probability that they will enter Bankruptcy or other financial reorganisation and where observable data indicates that there is a measurable decrease in the estimated future cash flows, such as changes in arrears or economic conditions that correlate with defaults.
• Due from Banks and loans and advances to customers – For amounts that are carried at amortised cost, the Bank assesses whether objective evidence of impairment exists individually for financial assets that are individually significant, or collectively for financial assets that are not individually significant.
If there is objective evidence that an impairment loss has been incurred, the amount of the loss is measured as the difference between the asset carrying amount and the present value of estimated future cash flows (excluding future expected credit losses that have not yet been incurred). The carrying amount of the asset is reduced through the use of an allowance account and the amount of the loss is recognised in the income statement. Interest income continues to be accrued on the reduced carrying amount based on the original effective interest rate of the asset. Loans together with the associated allowance are written off when there is no realistic prospect of future recovery and all collateral has been realised or has been transferred to the Bank. If, in a subsequent year, the amount of the estimated impairment loss increases or decreases because of an event occurring after the impairment was recognised, the previously recognised impairment loss is increased or reduced by adjusting the allowance account. If a future write-off is later recovered, the recovery is credited to the ‘Credit loss expense’.
The present value of the estimated future cash flows is discounted at the financial asset’s original
effective interest rate. If a loan has a variable interest rate, the discount rate for measuring any impairment loss is the effective interest rate at the relevant reporting date. The calculation of the present value of the estimated future cash flows of a collateralised financial asset reflects the cash flows that may result from foreclosure less costs for obtaining and selling the collateral, whether or not foreclosure is probable.
The Bank assesses all loans on an individual basis. Collective impairment provision is not applied.

Page 24 - Company Registration N°5321714 (England and Wales)
no
tes
to t
he
fin
anci
al s
tate
men
ts
• Available for sale financial instruments – For available for sale financial instruments, the Bank assesses at each reporting date whether there is objective evidence that an investment or a group of investments is impaired. Objective evidence would include a significant or prolonged decline in the fair value of the investment below its cost. Where there is evidence of impairment, the cumulative loss that had been recognised in other comprehensive income is removed from equity and recognised in the income statement.
• Renegotiated loans – Where possible the Bank seeks to restructure loans rather than to take possession of collateral. This may involve extending the payment arrangements and the agreement of new loan conditions. Once the terms have been renegotiated, any impairment is measured using the original effective interest rate (EIR) as calculated before the modification of the terms and the loan is no longer considered past due. Management continually reviews renegotiated loans to ensure that all criteria are met and that future payments are likely to occur. The loans continue to be subject to an individual impairment assessment, calculated using the loan’s original EIR.
H. Offsetting financial instruments
Financial assets and financial liabilities are offset and the net amount reported in the statement of financial position only if there is a currently enforceable legal right to offset the recognised amounts and there is an intention to settle on a net basis, or to realise the asset and settle the liability simultaneously. This is not generally the case with master netting agreements, and the related assets and liabilities are presented gross in the statement of financial position.
I. Leasing
• Bank as a lessee – The leases entered into by the Bank as lessee are operating leases. Any rentals payable are charged to the income statement on a straight line basis over the lease term and included in ‘Operating expenses’.
• Bank as a lessor – Leases where the Bank does not transfer substantially all the risks and benefits incidental to ownership of the leased items are operating leases. Operating lease receipts are recognised as income in the income statement on a straight line basis over the leased term. All leases where the Bank is a lessor are sub-leases of operating leases where the Bank is the lessee.
J. Recognition of income and expenses
Revenue is recognised to the extent that it is probable that the economic benefits will flow to the Bank and the revenue can be reliably measured. The following specific recognition criteria must also be met before revenue is recognised:
• Interest and similar income and expense – For all financial instruments measured at amortised cost, and interest bearing financial instruments classified as available for sale financial investments, interest income or expense is recorded at the effective interest rate. This is the rate that exactly discounts estimated future cash payments or receipts through the expected life of the financial instrument or a shorter period, where appropriate, to the net carrying amount of the financial asset or financial liability.
The calculation takes into account all contractual terms of the financial instrument (for example, prepayment options) and includes any fees or incremental costs that are directly attributable to the instrument and are an integral part of the effective interest rate, but not future credit losses. The carrying amount of the financial asset or financial liability is adjusted if the Bank revises its estimates of payment or receipts. The adjusted carrying amount is calculated based on the original effective interest rate and the change in carrying amount is recorded as an impairment loss.
Once the recorded value of a financial asset (or a group of similar financial assets) has been reduced due to an impairment loss, interest income continues to be recognised using the original effective interest rate applied to the new carrying amount.
• Fee and commission income – The Bank earns fee and commission income from a diverse range of services it provides to its customers in connection with its principal activities, and providing corporate advisory services.
Fees and commission are recognised at point in time. However, some fees earned for the provision of services over a period of time are accrued over that period. These fees include commission income and advisory fees. Loan commitment fees for loans that are likely to be drawn down and other credit related fees are deferred (together with any incremental costs) and recognised as an adjustment to the effective interest rate on the loan.

Page 25 - Company Registration N°5321714 (England and Wales)
no
tes
to t
he
fin
anci
al s
tate
men
ts
• Fee income from providing transaction services – Fees arising from negotiating or participating in the negotiation of a transaction for a third party, such as the arrangement of the acquisition of shares or other securities or the purchase or sale of businesses, are recognised on completion of the underlying transaction. Fees or components of fees that are linked to a certain performance are recognised after fulfilling the corresponding criteria.
• Net trading income – All gains and losses from changes in fair value and related interest income or expense and dividends for financial assets and financial liabilities held for trading are included in net trading income.
K. Cash and cash equivalents
Cash and cash equivalents as referred to in the cash flow statement comprise cash on hand, balances with central Banks and amounts due from Banks on demand or with an original maturity of three months or less. Cash and cash equivalent are carried at amortised cost in the statement of financial position.
L. Tangible assets
Tangible assets, which consist of computer hardware and furniture and equipment are stated at cost less accumulated depreciation. Depreciation is calculated using the straight-line method to write down the cost of tangible assets to their residual values over their estimated useful lives. The residual estimated useful lives from 1 January 2015 are as follows:
- Computer hardware - 3 to 5 years; and
- Furniture and equipment - 5 years to 9 years.
M. Other intangible assets
Intangible assets include the value of development costs and computer software. Expenditure on internally developed intangible assets, excluding development expenditure, is taken to the income statement in the year in which it is incurred. Development expenditure is recognised as an intangible asset only after its technical feasibility and commercial viability can be demonstrated. Intangible assets acquired separately are measured on initial recognition at cost. Following the initial recognition, intangible assets are carried at cost less any accumulated amortisation and any accumulated impairment losses.
Amortisation is calculated using the straight-line method to write down the cost of intangible assets to their residual values over their estimated useful lives. The residual estimated useful lives from 1 January 2015 are as follows:
- Licences: 10 years
- Computer software and license - 3 to 10 years; and
- Development costs - 3 to 5 years.
N. Business combinations and goodwill
Business combinations are accounted for using the purchase method of accounting. This involves recognising identifiable assets (including previously unrecognised intangible assets) and liabilities (including contingent liabilities and excluding future restructuring) of the acquired business at fair value. Any excess of the cost of acquisition over the fair values of the identifiable net assets acquired is recognised as goodwill.
Goodwill acquired in a business combination is initially measured at cost, being the excess of the cost of the business combination over the Bank’s interest in the net fair value of the identifiable assets, liabilities and contingent liabilities acquired. Following initial recognition, goodwill is measured at cost less any accumulated impairment losses. Goodwill is reviewed for impairment, annually or more frequently if events or changes in circumstances indicate that the carrying value may be impaired.
For the purpose of impairment testing, goodwill acquired in a business combination is, from the acquisition date, allocated to each of the Bank’s cash-generating units that are expected to benefit from the synergies of the combination, irrespective of whether other assets or liabilities acquired are assigned to those units. Each unit or group of units to which the goodwill is allocated:
• represents the lowest level within the Bank at which the goodwill is monitored for internal management purposes; and
• is not larger than an operating segment as defined under IFRS 8 Operating Segments.
Page 26 - Company Registration N°5321714 (England and Wales)
no
tes
to t
he
fin
anci
al s
tate
men
ts
O. Impairment of non-financial assets
The Bank assesses at each reporting date, or more frequently if events or changes in circumstances indicate that the carrying value may be impaired, whether there is an indication that a non-financial asset may be impaired. If any such indication exists, or when annual impairment testing for an asset is required, the Bank makes an estimate of the asset’s recoverable amount. Where the carrying amount of an asset exceeds its recoverable amount, the asset is considered impaired and is written down to its recoverable amount.
P. Pension benefits
The Bank operates a defined contribution pension plan. The contribution payable to a defined contribution plan is in proportion to the services rendered to the Bank by the employees and is recorded as an expense under ‘Personnel expenses’.
Q. Provisions
Provisions are recognised when the Bank has a present obligation (legal or constructive) as a result of a past event and it is probable that an outflow of resources embodying economic benefits will be required to settle the obligation and a reliable estimate can be made of the amount of the obligation.
R. Taxes
• Current tax – Current tax and liabilities for the current and prior years are measured at the amount expected to be recovered from or paid to the taxation authorities. The tax rates and tax laws used to compute the amount are those that are enacted ,or substantively enacted ,by the reporting date.
• Deferred tax – Deferred tax is provided on temporary differences at the reporting date between the tax base of assets and liabilities and their carrying amounts for financial reporting purposes. Deferred tax liabilities are recognised for all taxable temporary differences.
Deferred tax assets are recognised for all deductible temporary differences, carry forward of unused tax credits and unused tax losses, to the extent that it is probable that taxable profit will be available against which the deductible temporary differences, and the carry forward of unused tax credits and unused tax losses can be utilised.
The carrying amount of deferred tax assets is reviewed at each reporting date and is reduced to the extent that it is no longer probable that sufficient taxable profit will be available to allow all or part of the deferred tax asset to be utilised. Unrecognised deferred tax assets are reassessed at
each reporting date and are recognised to the extent that it has become probable that future taxable profit will allow the deferred tax asset to be recovered.
Detailed plans are produced for the next financial year, and using this as a basis, forecasts are produced for the following years.
Deferred tax assets and liabilities are measured at the tax rates that are expected to apply in the year when the asset is realised or the liability is settled, based on tax rates (and tax laws) that have been enacted or substantively enacted at the reporting date.
Current tax and deferred tax relating to items recognised directly in equity are also recognised in equity and not in the income statement.
3. Application of new and revised International Financial Reporting Standards (IFRSs)
In the current year, the Bank has applied a number of amendments to IFRSs and new interpretations issued by the International Accounting Standards Board (IASB) as endorsed by European Union that are mandatorily effective for an accounting period that begins on or after 1 January 2015.
A. Defined Benefit Plans: Employee Contributions (Amendments to IAS 19)
The amendments to IAS 19 clarify the accounting treatment for contributions for employees or third parties to a defined benefit plan. According to the amendments, discretionary contributions made by employees or third parties reduce service cost upon payment of these contributions to the plan. These amendments have no impact on the Bank, since none of employees or third parties have defined benefit plans.
B. Annual Improvements 2010-2012 Cycle
The annual improvements include amendments to a number of IFRSs, which have been summarised below:
• IFRS 2 share-based payment: definition of vesting condition. The amendment is to clarify the definition of the vesting condition and market condition to ensure the consistent classification of conditions attached to a share-base payment. This amendment has no impact on the Bank as there is no share payment.

Page 27 - Company Registration N°5321714 (England and Wales)
no
tes
to t
he
fin
anci
al s
tate
men
ts
B. Annual Improvements 2010-2012 Cycle (continued)
• IFRS 3 business combinations: Accounting for contingent consideration in a business combination. The amendment clarifies that contingent consideration should be measured at fair value at each reporting date, irrespective of whether or not the contingent consideration falls within the scope of IFRS 9 or IAS 39. This amendment has no impact on the Bank as there is no business combinations.
• IFRS 8 operating segments: Disclosure about judgments involved in deciding whether or not to aggregate operating segments and reconciliation of the total of the reporting segments’ assets to the entity’s assets. The amendment (i) requires an entity to disclose the judgements made by management in applying the aggregation criteria to operating segments, including a brief description of the operating segments aggregated and the economic indicators assessed in determining whether the operating segments shared similar economic characteristics; and (ii) clarifies that a reconciliation of the total of the reportable segments assets to the entity’s assets should only be provided information about the amount of the segment assets are regularly provided to the chief operating decision-maker. This amendment has no impact.
• IFRS 13 Fair Value Measurement: Short-term receivables and payables. The amendment to the basis for conclusions of IFRS clarifies that the issuance of the IFRS 13 and consequential amendments to IAS 39 and IFRS 9 did not remove the ability to measure short-term receivables and payables with no stated interest rate at their invoice amounts without discounting, if the effect of discounting is immaterial. This amendment has no impact.
• IAS 16 Property, Plant and Equipment: IAS 38 Intangible Assets: Revaluation methods – Proportionate restatement of accumulated depreciation (amortisation). The amendments of IAS16 and IAS 38 remove perceived inconsistencies in the accounting for accumulated depreciation or an intangible asset is revalued. This amendment has no impact.
• IAS 24: Related Party Disclosures: Key management personnel. The amendment clarifies that a management entity providing key management personnel services to the reporting entity or to the parent of the reporting entity. This amendment has no impact.
C. Annual Improvements 2011-2013 Cycle
• IFRS 3 Business Combinations: Scope exception for the joint ventures. The amendment clarifies that IFRS 3 does not apply to the financial statement of the joint arrangement itself. This amendment has no impact.
• IFRS 13 Fair value Measurement: Scope of paragraph 52 (portfolio exception). The amendment clarifies that the scope of the portfolio exception for measuring the fair value of a group of financial assets and financial liabilities on a net basis includes all contracts that are within the scope of, and accounted for in accordance with, IAS39 or IFRS 9, even if those contracts do not meet the definitions of financial assets or financial within IAS 32. This amendment has no impact.
• IAS 40 Investment Property: Clarifying the interrelationship between IFRS 3 and IAS 40 when classifying property as investment property or owner-occupied property. The amendment clarifies that IAS 40 and IFRS 3 are not mutually exclusive and application of both standards may be required. This amendment has no impact
4. New and revised IFRSs in issue but not yet effective
The standards, amendments, and interpretations, which are relevant to the Company, and may have a material effect on the Company's forthcoming financial statements are as follows. The adoption of all other standards, amendments, and interpretations are not expected to have a material impact (IFRS 9 excluded see dedicated paragraph hereafter).
Below is a list of new and revised IFRSs that are not yet mandatorily effective (but allow early application) for the year ending 31 December 2015:
• IFRS 9 Financial Instruments;
• IFRS 14 Regulatory Deferral Accounts;
• IFRS 15 Revenue from Contracts with Customers;
• IFRS 16 Leases
• Amendments to IFRS 10, IFRS 12 and IAS 28 Investment Entities: Applying the consolidation Exception; and
• Amendments to IFRS 10 and IAS 28 Sale or Contribution of Assets between an investor and its Associate or Joint Venture;
• Amendments to IFRS 12 Recognition of deferred tax asset for unrealised losses;
• Amendments to IAS 7 Disclosure initiative;
• Clarification to IFRS 15 Revenue from contract with customers.
Page 28 - Company Registration N°5321714 (England and Wales)
no
tes
to t
he
fin
anci
al s
tate
men
ts
4. New and revised IFRSs in issue but not yet effective (continued)
• IFRS 9 Financial Instruments: Classification and Measurement, published in July 2014, replaces the existing guidance in IAS 39 Financial instruments. IFRS 9 includes revised guidance on the classification and measurement of financial instruments including a new expected loss model for calculating impairment on financial assets, and the new general hedge accounting requirements. It also carries forward guidance on recognition of and derecognition of financial instruments from IAS39.
IFRS 9 project as this has now been completed, although it is subject to EU endorsement.
The Bank is currently assessing the impact of adopting IFRS 9, however, the impact of adoption depends on the assets held by the Bank at the date of adoption, and it is not practical to quantify the effect.
5. Segment reporting
The primary segment reporting format is determined to be business segments as the Bank’s risks and rates of return are affected predominantly by differences in the products and services provided. The operating businesses are organised and managed according to the nature of the products and services, with each segment representing a strategic business unit that offers different products and serves different markets.
For management purposes, the Bank is organised into three business segments:
• Treasury and Capital Markets (TCM) – Principally engaged in sales and market making activities in the treasury sector. Provides market and product access for a range of corporate and institutional customers and trading on our own account. Provides internal cash funding at market rates for Corporate and Investment Banking activities.
• Corporate and Investment Banking (CIB) – Principally providing Investment Banking services including structured and project finance, corporate finance, loan advisory and structuring services and other credit facilities for corporate and institutional customers.
• Other – Other central functions which are not directly attributable to Corporate and Investment Banking nor Treasury and Capital Markets and which are managed and controlled centrally are presented as ‘other’.
The Bank’s geographical segments are based on the location of the clients with whom business has been conducted for Corporate and Investment Banking and for the individual markets accessed for Treasury and Capital Markets activities.

Page 29 - Company Registration N°5321714 (England and Wales)
no
tes
to t
he
fin
anci
al s
tate
men
ts
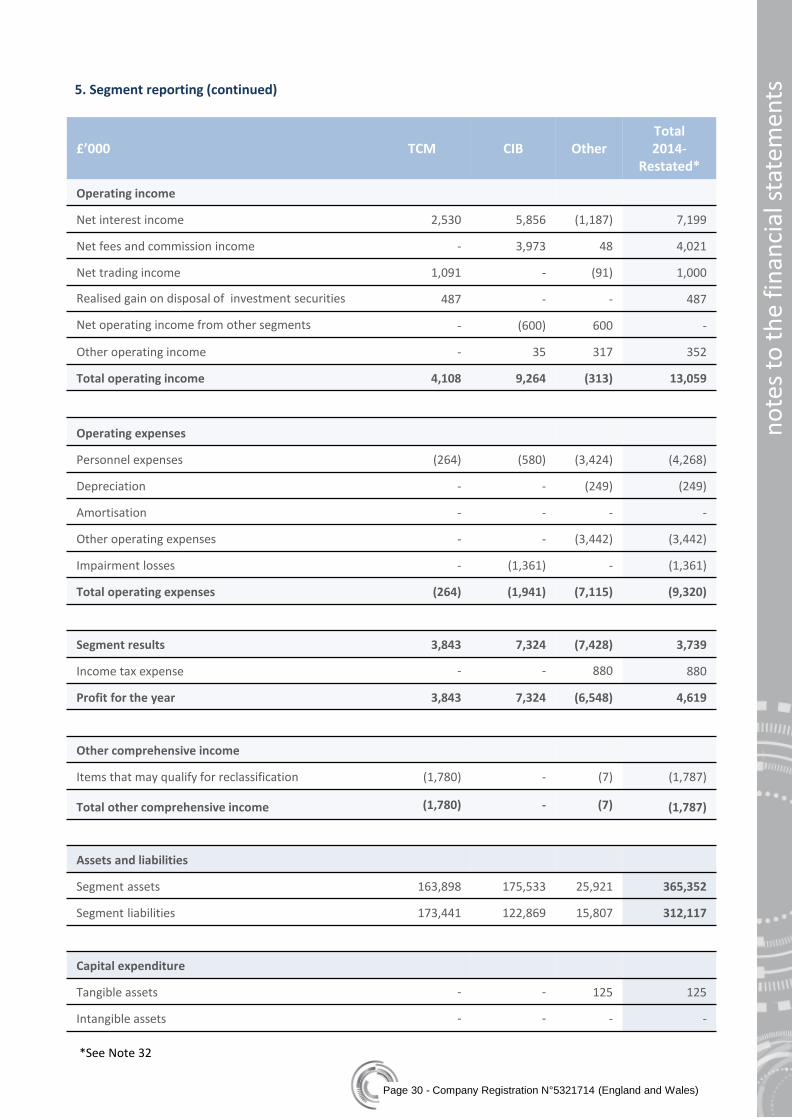
5. Segment reporting (continued)
The following tables present income and certain asset and liability information regarding the Bank’s
operating segments for the years ended 31 December 2015 and 31 December 2014.
£’000 TCM CIB Other Total 2015
Operating income
Net interest income 3,253 10,694 (966) 12,981
Net fees and commission income - 2,681 (821) 1,860
Net trading income 955 - (16) 939
Realised gain on disposal of investment securities 126 - - 126
Net operating income from other segments - (583) 583 -
Other operating income - 84 174 258
Total operating income 4,334 12,876 (1,046) 16,164
Operating expenses
Personnel expenses (385) (495) (4,065) (4,945)
Depreciation - - (119) (119)
Amortisation - - (30) (30)
Other operating expenses - - (5,408) (5,408)
Net impairment recoveries - 1,143 - 1,143
Total operating expenses (385) 648 (9,622) (9,359)
Segment results 3,949 13,524 (10,668) 6,805
Income tax expense - - 990 990
Profit for the year 3,949 13,524 (9,678) 7,795
Other comprehensive income
Items that may qualify for reclassification (266) - (88) (354)
Total other comprehensive income (266) - (88) (354)
Assets and liabilities
Segment assets 228,071 183,836 29,775 441,682
Segment liabilities 142,071 221,289 17,646 381,006
Capital expenditure
Tangible assets - - 72 72
Intangible assets - - 724 724
Page 30 - Company Registration N°5321714 (England and Wales)
no
tes
to t
he
fin
anci
al s
tate
men
ts
5. Segment reporting (continued)
£’000 TCM CIB Other Total 2014-
Restated*
Operating income
Net interest income 2,530 5,856 (1,187) 7,199
Net fees and commission income - 3,973 48 4,021
Net trading income 1,091 - (91) 1,000
Realised gain on disposal of investment securities 487 - - 487
Net operating income from other segments - (600) 600 -
Other operating income - 35 317 352
Total operating income 4,108 9,264 (313) 13,059
Operating expenses
Personnel expenses (264) (580) (3,424) (4,268)
Depreciation - - (249) (249)
Amortisation - - - -
Other operating expenses - - (3,442) (3,442)
Impairment losses - (1,361) - (1,361)
Total operating expenses (264) (1,941) (7,115) (9,320)
Segment results 3,843 7,324 (7,428) 3,739
Income tax expense - - 880 880
Profit for the year 3,843 7,324 (6,548) 4,619
Other comprehensive income
Items that may qualify for reclassification (1,780) - (7) (1,787)
Total other comprehensive income (1,780) - (7) (1,787)
Assets and liabilities
Segment assets 163,898 175,533 25,921 365,352
Segment liabilities 173,441 122,869 15,807 312,117
Capital expenditure
Tangible assets - - 125 125
Intangible assets - - - -
*See Note 32

Page 31 - Company Registration N°5321714 (England and Wales)
no
tes
to t
he
fin
anci
al s
tate
men
ts
5. Segment reporting (continued)
The following graphs compare values between 2014 and 2015 (figures in thousand GBP).
• Operating income
• Net results
• Assets
• Operating expenses
• Other comprehensive income
• Liabilities
(2,000)
0
2,000
4,000
6,000
8,000
10,000
12,000
14,000
TCM CIB Other
2015 2014
(12,000)
(10,000)
(8,000)
(6,000)
(4,000)
(2,000)
0
2,000
TCM CIB Other
2015 2014
(15,000)
(10,000)
(5,000)
0
5,000
10,000
15,000
TCM CIB Other
2015 2014
(2,000)
(1,500)
(1,000)
(500)
0
TCM CIB Other
2015 2014
-
50,000
100,000
150,000
200,000
250,000
TCM CIB Other
2015 2014
-
50,000
100,000
150,000
200,000
250,000
TCM CIB Other2015 2014

Page 32 - Company Registration N°5321714 (England and Wales)
no
tes
to t
he
fin
anci
al s
tate
men
ts 5. Segment reporting (continued)
Information about geographical areas
The bank operates in four geographical locations: UK, Africa, Europe and the rest of the world. The Bank's external net operating income is allocated based on the location of the transaction counterparty.
* See Note 32.
• External net operating income
• Total of assets
£’000 - 2015 United
Kingdom Africa Europe
Rest of the World
External net operating income 1,713 12,496 426 1,529
Total of assets 62,966 199,663 135,644 43,409
£’000 – 2014-restated United
Kingdom Africa Europe
Rest of the World
External net operating income 1,904 7,589 2,169 1,397
Total of assets 10,122 232,213 99,648 23,369
United Kingdom
11%
Africa 77%
Europe 3%
Rest of the World
9%
2015 United Kingdom
14%
Africa 58%
Europe 17%
Rest of the World
11%
2014
United Kingdom
14%
Africa 45%
Europe 31%
Rest of the World
10%
2015 United Kingdom
3%
Africa 64%
Europe 27%
Rest of the World
6%
2014

Page 33 - Company Registration N°5321714 (England and Wales)
no
tes
to t
he
fin
anci
al s
tate
men
ts
£’000 2015 2014
Due from banks 1,437 1,842
Loans and advances to customers 9,437 4,380
Financial investments - available for sale 3,790 1,999
Interest and similar income 14,664 8,221
Due to banks (1,683) (967)
Due to customers - (55)
Interest and similar charges (1,683) (1,022)
Net interest income 12,981 7,199
6. Net interest income
£’000 2015 2014-
Restated*
Credit related fees and commissions 730 2,510
Corporate banking fees 2,440 1,752
Corporate finance advisory fees - -
Fee and commission income 3,170 4,262
Fees and commission expense (439) (8)
Other fees paid (871) (233)
Fees and commission expense (1,310) (241)
Net fee and commission income 1,860 4,021
7. Net fee and commission income
Included within various line items under interest income for the year ended 31st December 2015 is a total of £Nil (2014: £414k) relating to impaired financial assets.
*See Note 32.

Page 34 - Company Registration N°5321714 (England and Wales)
no
tes
to t
he
fin
anci
al s
tate
men
ts
£’000 2015 2014
Foreign exchange 939 1,000
Gain on disposal of available for sale securities 126 487
Net trading income 1,065 1,487
8. Net trading income
£’000 2015 2014
Rent received from subletting of premises 353 137
Other income (95) 215
Other operating income 258 352
9. Other operating income
£’000 2015 2014
Wages and salaries (3,689) (3,106)
Social security costs (720) (618)
Pension costs - defined contribution plans (282) (216)
Other benefits (254) (328)
Personnel expenses (4,945) (4,268)
Directors' remuneration and disclosure of highest paid director are disclosed in note 30.
Number of employees 56 53
The average monthly number of employees (including directors) during the year was:
Board 4 4
Corporate and Investment Banking 16 10
Treasury and Capital Markets 3 5
Operations and support 33 34
10. Personnel expenses
No income derived from other financial instruments are recognised at fair value through profit and loss.

Page 35 - Company Registration N°5321714 (England and Wales)
no
tes
to t
he
fin
anci
al s
tate
men
ts
£’000 2015 2014
Marketing expense (106) (19)
Operating leases expenses (premises) (1,180) (1,119)
Administrative (2,975) (1,249)
Professional fees (562) (703)
Statutory audit fees (137) (125)
Other expenses (448) (227)
Other operating expenses (5,408) (3,442)
Other fees paid to the auditors
Taxation services (15) (55)
Other services & advice (41) -
11. Other operating expenses
£’000 Note 2015 2014
Loans and advances to customers 17 1,143 (1,361)
Impairment losses 1,143 (1,361)
12. Net impairment recoveries/ (losses)

Page 36 - Company Registration N°5321714 (England and Wales)
no
tes
to t
he
fin
anci
al s
tate
men
ts
£’000 2015 2014
Current Income tax (534) (135)
Current tax (534) (135)
Relating to origination and reversal of temporary differences (213) 132
Change in tax rate (67) (241)
Recognition of deferred tax assets 1,804 1,124
Deferred tax 1,525 1,015
Taxation 990 880
Reconciliation of the total tax charge
Profit before tax 6,805 3,739*
Income tax calculated at a tax rate of 20.25% (2014: 21.50%) (1,379) (804)
Other Non-deductible items (10) -
Depreciation in excess of capital allowances (30) (53)
Effect of change in tax rate (427) (76)
Recognition of tax effect of previously unrecognised tax losses 2,836 1,813
Income tax benefit reported in the income statement 990 880
The deferred tax asset is due to temporary differences on the following:
Tax losses available 6,224 4,481
Property and equipment 140 358
Financial investments – available for sale 54 54
Total 6,418 4,893
13. Taxation
*See Note 32. Deferred tax has been provided at the rates being in force when the temporary differences reverse, in accordance with the accounting policy. This has been calculated using the tax rate of 20% (2014:21%) When assessing the deferred tax asset recognised, the Bank has taken a reasonably estimated view of future profits. The forecasts used for this purpose are based primarily on cost savings already achieved and require very limited growth in revenues. The Bank has extended the time period for considering taxable profits from 3 years to 6 years and this represents an appropriate period to forecast future taxable profits.
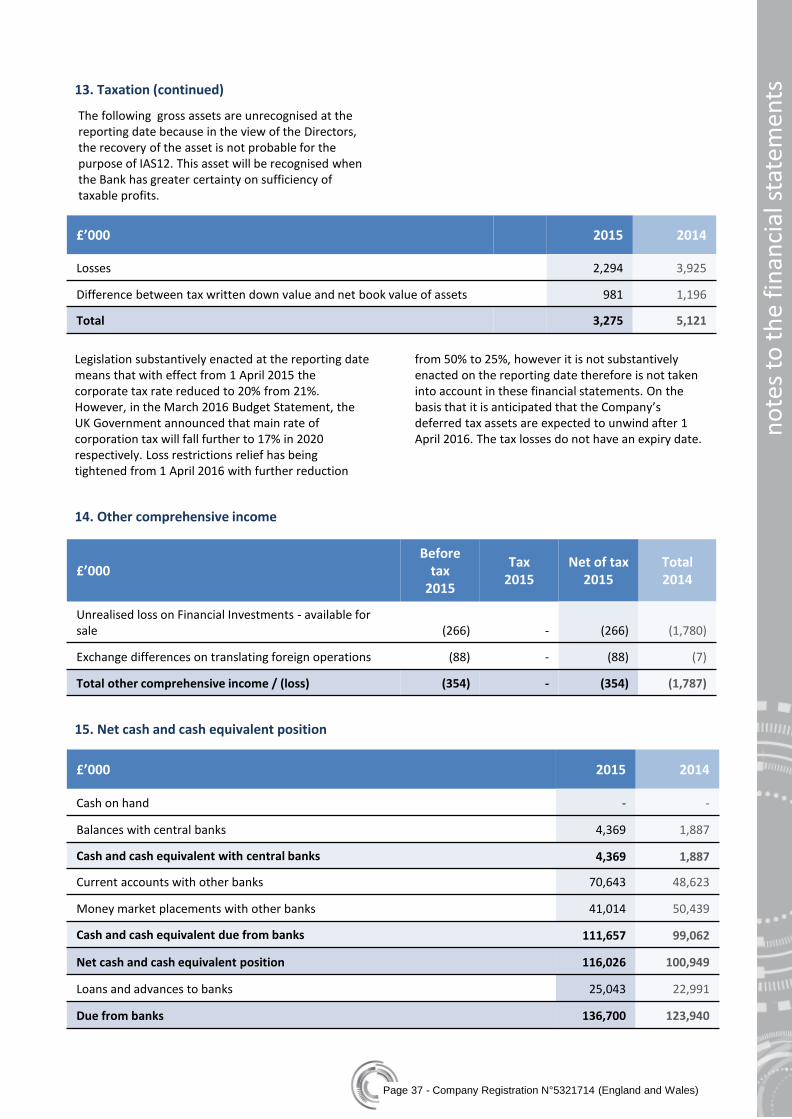
Page 37 - Company Registration N°5321714 (England and Wales)
no
tes
to t
he
fin
anci
al s
tate
men
ts
The following gross assets are unrecognised at the reporting date because in the view of the Directors, the recovery of the asset is not probable for the purpose of IAS12. This asset will be recognised when the Bank has greater certainty on sufficiency of taxable profits.
£’000 2015 2014
Losses 2,294 3,925
Difference between tax written down value and net book value of assets 981 1,196
Total 3,275 5,121
13. Taxation (continued)
Legislation substantively enacted at the reporting date means that with effect from 1 April 2015 the corporate tax rate reduced to 20% from 21%. However, in the March 2016 Budget Statement, the UK Government announced that main rate of corporation tax will fall further to 17% in 2020 respectively. Loss restrictions relief has being tightened from 1 April 2016 with further reduction
from 50% to 25%, however it is not substantively enacted on the reporting date therefore is not taken into account in these financial statements. On the basis that it is anticipated that the Company’s deferred tax assets are expected to unwind after 1 April 2016. The tax losses do not have an expiry date.
£’000
Before tax
2015
Tax 2015
Net of tax 2015
Total 2014
Unrealised loss on Financial Investments - available for sale (266) - (266) (1,780)
Exchange differences on translating foreign operations (88) - (88) (7)
Total other comprehensive income / (loss) (354) - (354) (1,787)
14. Other comprehensive income
£’000 2015 2014
Cash on hand - -
Balances with central banks 4,369 1,887
Cash and cash equivalent with central banks 4,369 1,887
Current accounts with other banks 70,643 48,623
Money market placements with other banks 41,014 50,439
Cash and cash equivalent due from banks 111,657 99,062
Net cash and cash equivalent position 116,026 100,949
Loans and advances to banks 25,043 22,991
Due from banks 136,700 123,940
15. Net cash and cash equivalent position

Page 38 - Company Registration N°5321714 (England and Wales)
no
tes
to t
he
fin
anci
al s
tate
men
ts
£’000 2015 2014
Corporate lending 167,713 149,257
Loans and advances to customers 167,713 149,257
16. Loans and advances to customers
Loans and advances to customers as presented in the statement of financial position include loans and advances carried at amortised cost. No loans and advances have been designated on initial recognition as at fair value through profit and loss.
A. Impairment allowance for loans and advances to customers A reconciliation of the allowance for impairment losses for loans and advances is as follows:
The Bank carries out a risk assessment of all impaired loans and estimates the recoverable amounts using all available data on the customer e.g. its performance in repaying other creditors, the country and market conditions. The Bank assesses all loans on an individual basis and therefore a collective impairment provision is not required.
£’000 Note 2015 2014
As at 1 January 1,785 598
Provision charge 12 191 1,361
Loan Recovery 12 (1,334) -
Released through interest income - (161)
Written off (16) 16
Exchange rate movement (29) (29)
As at 31 December 597 1,785
Individual impairment provision 597 1,785
Gross amount of loans, individually determined to be impaired, before deducting any individually assessed impairment allowance 1,829 9,929

Page 39 - Company Registration N°5321714 (England and Wales)
no
tes
to t
he
fin
anci
al s
tate
men
ts
17. Financial investments at available for sale
£’000 2015 2014
Government debt securities 11,342 21,005
Other debt securities 91,036 45,104
Financial investments at available for sale 102,378 66,109
Financial instruments available for sale 104,920 68,386
Available-for-sale-valuation (2,542) (2,277)
less impairment provision - -
Available-for-sale financial assets carried at fair value 102,378 66,109
Maturity
less than three months - -
one year or less but over three months 17,063
between one year and five years 85,315 66,109
more than five years - -
18. Financial investments held to maturity
£’000 2015 2014
Government debt securities 7,337 -
Other debt securities - -
Financial investments held to maturity 7,337 -
Maturity
less than three months - -
one year or less but over three months - -
between one year and five years - -
more than five years 7,337

Page 40 - Company Registration N°5321714 (England and Wales)
no
tes
to t
he
fin
anci
al s
tate
men
ts
£’000 2015 2014
Cost as at 1 January 2,557 2,538
Additions 72 125
Disposals (2,040) -
Exchange adjustments (90) (106)
Cost as at 31 December 499 2,557
Depreciation as at 1 January 1,570 1,372
Charge for the year 119 249
Disposals (1,379) -
Exchange adjustments (37) (51)
Depreciation as at 31 December 273 1,570
Net book value 226 987
19. Property and equipment - furniture & equipment
£’000 2015 2014
Cost as at 1 January - -
Additions 724 -
Cost as at 31 December 724 -
Amortisation as at 1 January - -
Charge for the year 30 -
Amortisation as at 31 December 30 -
Net book value 694 -
20. Intangible assets – computer software

Page 41 - Company Registration N°5321714 (England and Wales)
21. Goodwill (continued)
A. Information about geographical areas
Goodwill acquired through business combinations with indefinite lives has been allocated to two individual cash-generating units (CGUs) for impairment testing as follows:
• Corporate and Investment Banking; and
• Treasury and Capital Markets.
£’000 2015 2014
Corporate and Investment Banking 4,705 3,810
Treasury and Capital Markets 2,632 3,981
Net book value 7,337 7,791
Key assumptions used in value in use calculations The recoverable amounts of the above CGUs have been determined based on a value in use calculation, using cash flow projections in perpetuity based on business plans approved by senior management for 2 years with an assumption of steady 2% growth in future years and then discounted at a rate of 11%. These assumptions are considered by management to be prudent. For example current average gross domestic product growth rates in the African market are about 4%. These business plans, which also form the basis of the assessment of the deferred tax recognition (see note 13), assume: • No significant impairments over a provision rate of
0.5% per annum of the loan book; • An ongoing cost reduction programme including
premises savings and eliminating resource duplication; and
• Adequate capital to cover asset growth. The calculation of value in use for both of the CGUs does not lead to any indicators of impairment.
The sensitivity to the key assumptions before a write down is required ( assuming other factors remain constant), are as follows: • The discount rate would need to exceed 20%, or • Projected growth rates during the budget period
would need to contract to less than 2%. Interest margins: Interest margins are based on management assessments and are in line with average values achieved in 2015. These are maintained over the budget period for anticipated market conditions. Discount rates: Discount rates reflect management’s estimated return on capital employed (ROCE) bench-marked against external sources. Projected growth rates: Projected growth rates are based on the Bank’s ability to fully utilise its capital, together with its assessment of market conditions in Africa.
£’000 2015 2014
As at 1 January 12,645 13,216
Additions - -
Disposals - -
Exchange adjustments (454) (571)
As at 31 December 12,191 12,645
Impairment 4,854 4,854
Net book value 7,337 7,791
no
tes
to t
he
fin
anci
al s
tate
men
ts

Page 42 - Company Registration N°5321714 (England and Wales)
no
tes
to t
he
fin
anci
al s
tate
men
ts
22. Other assets
£’000 2015 2014
Current accounts 21,895 24,627
Term deposits due to banks 284 18,179
Due to fellow group undertakings less than 1 year 27,797 11,047
Due to ultimate parent undertaking 214,801 135,566
Due to banks 264,777 189,419
23. Due to banks
£’000 2015 2014
Current accounts 91,283 79,749
Term deposits 7,254 21,670
Due to customers 98,537 101,419
24. Due to customers
£’000 2015 2014-
Restated*
Accounts payable 159 225
Accruals 707 1,200
Other taxes and social security costs 795 244
Deferred income 1,849 1,089
Other creditors 7 116
Other liabilities 3,517 2,874
25. Other liabilities
£’000 2015 2014
VAT recoverable 193 168
Prepayments 290 347
Rent deposit 111 128
Due from ultimate parent undertaking 6,317 5,828
Other sundry debtors 1,377 4,002
Other assets 8,288 10,473
Due to fellow subsidiaries are money market deposits from members of the Bank of Africa Group. These deposits are at commercial arms length rates.
*See Note 32.

Page 43 - Company Registration N°5321714 (England and Wales)
no
tes
to t
he
fin
anci
al s
tate
men
ts
£’000 2015 2014
Principal 13,001 13,775
Accrued Interest 315 363
Subordinated debt 13,316 14,138
26. Subordinated debt
£’000 Note 2015 2014-
Restated*
Share capital as at 1 January
Authorised 150,000,000 ordinary shares of £1 each
Issued, called up and fully paid 102,173,000 shares ordinary shares of £1 each 102,173 102,173
Share capital as at 31 December 102,173 102,173
All shares rank equally with one vote per share. There is no entitlement to fixed income
Reserves as at 1 January
Available for sale investment reserve (2,543) (2,277)
Foreign currency translation (446) (358)
Accumulated losses (38,508) (46,303)
Reserves as at 31 December (41,497) (48,938)
Share capital and reserves 60,676 53,235
27. Share capital and reserves
Subordinated debt represent subordinated loans of €17m 4% fixed rate notes granted by the parent company on 31st May 2010 with redemption date of 31st May 2020.
*See Note 32.

Page 44 - Company Registration N°5321714 (England and Wales)
no
tes
to t
he
fin
anci
al s
tate
men
ts
28. Additional cash flow information
£’000 2015 2014
Cash and balances with central banks 4,369 1,887
Current accounts with other banks 70,643 48,623
Money market placements with other banks 41,014 50,439
Cash and cash equivalent (note 15) 116,026 100,949
Net decrease / (increase) in:
Due from banks (2,052) (9,471)
Derivative Financial Instruments (207) 459
Loans and advances to customers (18,456) (93,111)
Other assets 2,185 (875)
Interest (6,794) (3,601)
Change in operating assets (25,324) (106,599)
Net (decrease) / increase in:
Due to banks 75,358 92,371
Derivative financial instruments (3,408) 4,253
Due to customers (2,882) 52,963
Other liabilities 424 (1,106)
Interest (36) 37
Change in operating liabilities 69,456 148,518
Depreciation and amortisation 149 249
Impairment provisions 191 1,361
Gain on disposal of AFS - (7)
Net foreign exchange gain 563 (353)
Loss on disposal of property equipment 809 -
Other items included in profit before tax 1,712 1,250
The above analysis shows the Bank has treated all demand customer deposits as repayable immediately, however long term business relationships means that this is not the case in practice. The Bank has adequate arrangements to meet its liquidity requirements.
The majority of the inter bank funding is comprised of a series of term deposits from the ultimate parent Company with staggered maturities.
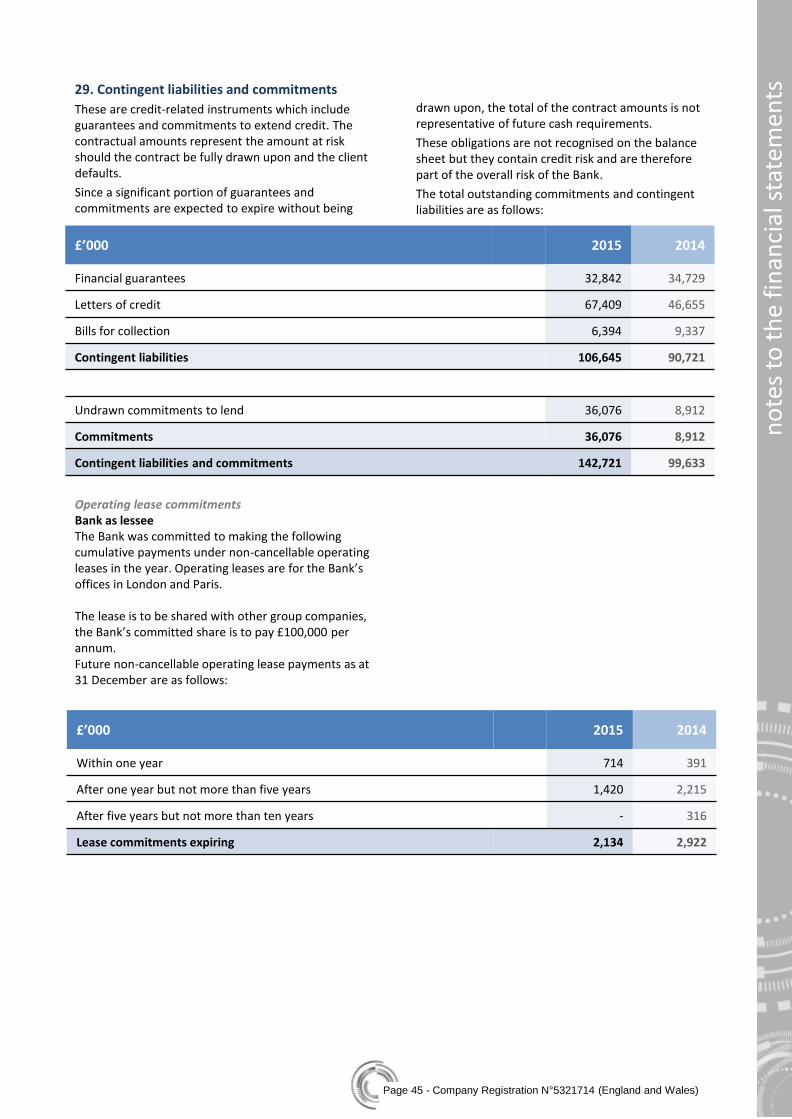
Page 45 - Company Registration N°5321714 (England and Wales)
no
tes
to t
he
fin
anci
al s
tate
men
ts
£’000 2015 2014
Financial guarantees 32,842 34,729
Letters of credit 67,409 46,655
Bills for collection 6,394 9,337
Contingent liabilities 106,645 90,721
Undrawn commitments to lend 36,076 8,912
Commitments 36,076 8,912
Contingent liabilities and commitments 142,721 99,633
29. Contingent liabilities and commitments
These are credit-related instruments which include guarantees and commitments to extend credit. The contractual amounts represent the amount at risk should the contract be fully drawn upon and the client defaults.
Since a significant portion of guarantees and commitments are expected to expire without being
drawn upon, the total of the contract amounts is not representative of future cash requirements.
These obligations are not recognised on the balance sheet but they contain credit risk and are therefore part of the overall risk of the Bank.
The total outstanding commitments and contingent liabilities are as follows:
Operating lease commitments Bank as lessee The Bank was committed to making the following cumulative payments under non-cancellable operating leases in the year. Operating leases are for the Bank’s offices in London and Paris. The lease is to be shared with other group companies, the Bank’s committed share is to pay £100,000 per annum. Future non-cancellable operating lease payments as at 31 December are as follows:
£’000 2015 2014
Within one year 714 391
After one year but not more than five years 1,420 2,215
After five years but not more than ten years - 316
Lease commitments expiring 2,134 2,922

Page 46 - Company Registration N°5321714 (England and Wales)
no
tes
to t
he
fin
anci
al s
tate
men
ts
£’000 2015 2014
Within one year 328 311
Lease commitments receivable 328 311
29. Contingent liabilities and commitments (continued)
Bank as lessor
The Bank subleased a portion of its Paris premises. Future minimum rentals receivable under the non-cancellable operating leases as at 31 December are as follows:
30. Compensations
The non-executive Directors do not receive pension entitlements from the Bank.
Key management personnel include senior management of the Bank.
One director was a member of the defined contribution scheme in 2015.
Information provided below for the highest paid director in 2015 and 2014 relates to two different directors.
£’000 2015 2014
Short-term employee benefits 863 834
Post-employment pension (defined contribution) 12 50
Compensation of key management personnel 875 884
Short-term employee benefits 549 500
Post-employment pension (defined contribution) - -
Compensation of directors 549 500
Aggregate emoluments and benefits 309 282
Defined benefit schemes - -
Highest paid director 309 282
31. Related party transactions
The Bank is a wholly owned subsidiary of BMCE International (Holdings) plc. The ultimate parent undertaking and ultimate parent company of the Bank is Banque Marocaine du Commerce Exterieur S.A. (BMCE).
During the year there have been transactions between the Bank, its parent company, the ultimate parent company and other related parties. The Bank receives and provides a range of services from the parent and related parties, including loans and guarantees and various administrative services.

Page 47 - Company Registration N°5321714 (England and Wales)
no
tes
to t
he
fin
anci
al s
tate
men
ts
£’000 - 2015 BMCE BOA ITIS ES Total
Interest charged 2,107 163 - - 2,270
Interest received 346 65 - - 411
Fees and commission paid 66 - - - 66
Fees and commission received 164 167 - - 330
Other operating expenses paid - - 1,322 - 1,322
Amounts owed to 221,912 17,785 - 2,914 242,611
Amounts owed by 18,575 1,484 3,638 - 23,687
Financial guarantees and commitments given 14,928 6,615 - - 21,543
Financial guarantees received 29,162 2,230 - - 31,392
£’000 - 2014 BMCE BOA ITIS ES Total
Interest charged 908 62 - - 970
Interest received 228 80 - - 308
Fees and commission paid 3 - - - 3
Fees and commission received 17 367 - - 384
Other operating expenses paid - - 950 - 950
Amounts owed to 150,802 12,589 1,150 - 164,541
Amounts owed by 42,154 978 4,180 5 47,317
Financial guarantees and commitments given 7,716 - - - 7,716
Financial guarantees received 10,441 474 - - 10,915
BMCE = Banque Marocaine du Commerce Exterieur S.A BOA = Bank of Africa Group
IT IS = IT Information Services ES = Euroservices SA
32. Correction of errors
During the current year, the Bank discovered that certain fees had been recognised in full upon contract initiation which should have been deferred. The errors have been corrected by restating each of the affected
financial statements line items for 2014. This results in a decrease of £1,089k in fee and commission income; profit for the year; total comprehensive income and retained earnings and a corresponding increase in deferred income within other liabilities.
31. Related party transactions (continued)
The outstanding balances at the year end arose from the ordinary course of business and are unsecured. The interest, fees and commissions paid to or received from related parties are at normal commercial rates.
In addition to entities within the scope of BMCE Group, key management personnel are also considered as related parties. Compensations are disclosed in note 30.

Page 48 - Company Registration N°5321714 (England and Wales)
no
tes
to t
he
fin
anci
al s
tate
men
ts
33. Risk management
A. Introduction
Effective risk management is an ongoing fundamental strategy for the Bank. Whilst it is in general a key capability for a successful financial services provider, risk management also plays a significant role in the Bank’s current stage of development and is critical to the Bank’s target of reaching profitability. The key components of the Bank’s risk management infrastructure are:
• Governance; and
• Risk management processes.
The main risks facing the Bank are:
• Credit risk;
• Liquidity risk;
• Market risk; and
• Operational risk.
B. Governance
The board of Directors is responsible for the overall risk management approach and for approving the risk strategies. It is supported by a number of committees as follows:
• Risk Management Department (RMD) and Risk Committee:
‒ The RMD is organised along traditional risk functions: Market/Liquidity, Credit, and Operational risks. The RMD is responsible for implementing, measuring and maintaining risk related procedures to ensure that an independent control process is present.
‒ The Risk Committee assists the Board in monitoring the adequacy and effectiveness of the Bank’s risk management policies and processes. The Credit Risk Committee approves all credit applications.
• Treasury Asset and Liability Committee (TALCO) - TALCO is responsible for assisting the board and senior management in the oversight of risk policies, strategies and processes. The role of TALCO is to assist the Bank in fulfilling its responsibilities relating to the oversight of the Bank’s market risk management policies, strategies and processes that have the potential to impact significantly on the Bank’s earnings performance and capital. TALCO’s responsibilities include management and review of:
‒ the Bank’s exposure to market risk and its hedging strategy;
‒ the Bank’s liquidity;
‒ the usage of capital including ensuring external regulatory requirements are met;
‒ risk management processes;
‒ other categories of risk linked to market risk (country risk, counterparty risk);
‒ regulatory developments and their impact on the prices of marketable assets;
‒ the valuation of market assets and the measurement of market risk; and
‒ market risk limits.
• Audit Committee:
The Audit Committee consists of independent non-executive directors (including the Chairman of the Audit Committee). The Audit Committee meets quarterly, or as frequently as is required to carry out properly its functions. The Audit Committee’s responsibility is one of oversight and review. It does not provide expert advice nor exercise any executive role. The Audit Committee’s role is to assist the Board in monitoring:
‒ the integrity of the financial statements of the Bank;
‒ the adequacy and effectiveness of the systems of internal controls of the Bank;
‒ the qualifications and independence of the Bank's external auditors and the performance of the Bank's internal and external auditors; and
‒ any other relevant issue.
C. Measuring and reporting systems
The monitoring and controlling of risk is primarily performed against limits established by the Bank. These limits are established using an approved ‘Credit Policies and Procedures Manual’, ‘Market Risk Policies and Procedures Manual’ and ‘Operational Risk Policies and Procedures Manual’. Additionally, a qualitative and quantitative approach within this framework is used.
The Bank’s policy is to generate report on a daily basis from information compiled from all business systems, then analysed to identify control risks appropriately and promptly. These reports include (but are not limited to) exposure reports (counterparty exposure, country exposure, sector exposure), excess reports and concentration risks across all counterparties, countries and industries.

Page 49 - Company Registration N°5321714 (England and Wales)
£’000 - 2015 CIB TCM Total
Europe 6,291 68,221 74,512
United Kingdom 52,452 58,053 110,505
Africa 97,231 101,352 198,583
Others 43,408 - 43,408
Total 199,382 227,625 427,007
33. Risk management (continued)
D. Mitigation
As part of its overall risk management strategy the Bank may use derivatives and other financial instruments to manage exposures to interest rates, foreign currencies, equity price risks, credit risks and to pre-hedge those expected from future transactions.
34. Credit risk
Credit risk is one of the major risk areas for the Bank and is defined as the risk of loss from default by debtors (including bond issuers) or trading counterparties.
All such risks taken by the Bank must have been approved at the appropriate levels, and must adhere to the policies and procedures contained within the Credit Risk Policy Manual. Monitoring credit risks on a day-to-day basis, and making sure that exposures are within approved limits, is key responsibility of the Risk Management Department.
The Bank has an established credit review process to provide a periodic assessment of the creditworthiness of counterparties. An internal credit risk classification system is used to assess and allocate a credit risk grade notwithstanding the external rating assigned.
A. Risk concentrations of the maximum exposure to credit risk
Risk concentrations arise when a number of counterparties are engaged in similar business activities or activities in the same geographic region or have similar economic features that would cause their ability to meet contractual obligations to be similarly affected by changes in economic, political or other conditions.
Concentrations indicate the relative sensitivity of the Bank’s performance to developments affecting a particular industry or geographical location.
In order to avoid excessive concentrations of risk the Bank’s policies and procedures include specific guidelines regarding the importance of portfolio diversification. Identified concentrations of credit risks
are controlled and managed accordingly. Selective hedging may be used within the Bank to manage risk concentrations at both the relationship and industry levels.
The Bank has country limits and sector limits set in place and monitored accordingly in order that the Bank’s portfolio is maintained at a level that is appropriately diversified.
Concentrations of risks are managed by client/counterparty, by geographical region and by industry sector.
The maximum gross credit exposure, other than to related parties disclosed in note 31, by risk concentration as of 31 December 2015 was £48,166,000 (31 December 2014:£33,168,000).
B. Geographical analysis
The Bank's concentration of maximum exposure to credit risk, before taking into account any collateral held or other credit enhancements can be analysed by the following geographical regions:
no
tes
to t
he
fin
anci
al s
tate
men
ts
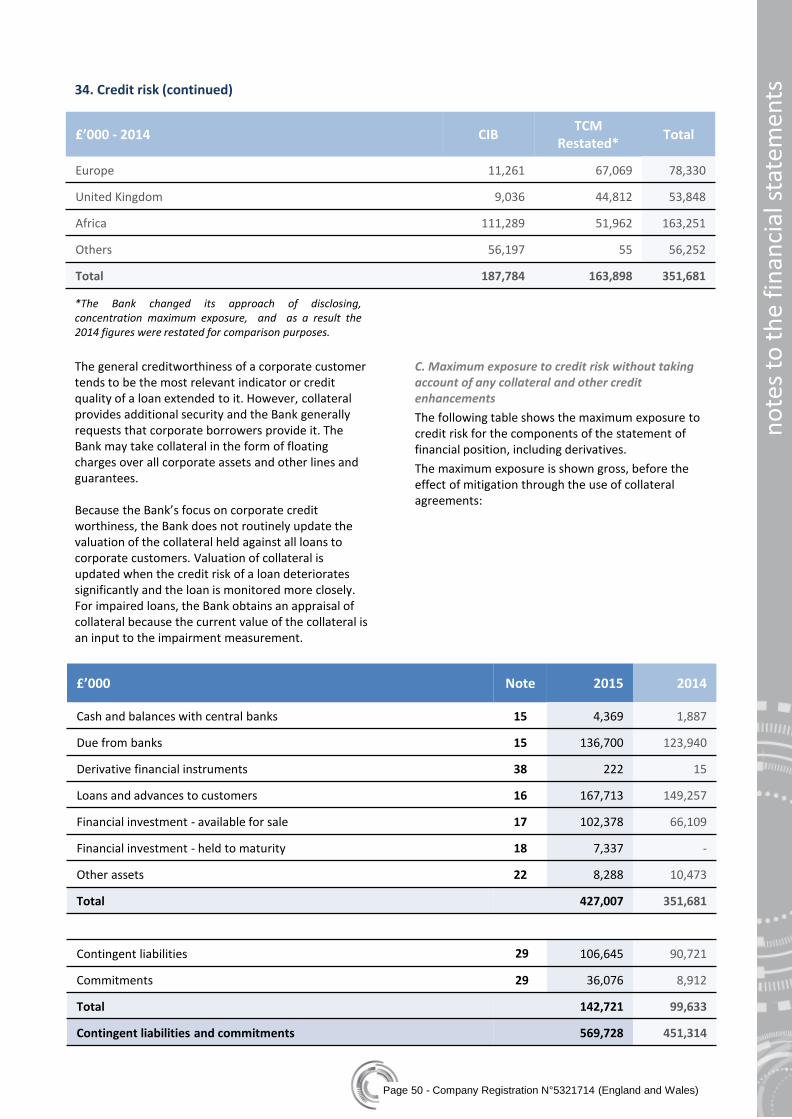
Page 50 - Company Registration N°5321714 (England and Wales)
no
tes
to t
he
fin
anci
al s
tate
men
ts
34. Credit risk (continued)
£’000 - 2014 CIB TCM
Restated* Total
Europe 11,261 67,069 78,330
United Kingdom 9,036 44,812 53,848
Africa 111,289 51,962 163,251
Others 56,197 55 56,252
Total 187,784 163,898 351,681
The general creditworthiness of a corporate customer tends to be the most relevant indicator or credit quality of a loan extended to it. However, collateral provides additional security and the Bank generally requests that corporate borrowers provide it. The Bank may take collateral in the form of floating charges over all corporate assets and other lines and guarantees. Because the Bank’s focus on corporate credit worthiness, the Bank does not routinely update the valuation of the collateral held against all loans to corporate customers. Valuation of collateral is updated when the credit risk of a loan deteriorates significantly and the loan is monitored more closely. For impaired loans, the Bank obtains an appraisal of collateral because the current value of the collateral is an input to the impairment measurement.
C. Maximum exposure to credit risk without taking account of any collateral and other credit enhancements
The following table shows the maximum exposure to credit risk for the components of the statement of financial position, including derivatives.
The maximum exposure is shown gross, before the effect of mitigation through the use of collateral agreements:
£’000 Note 2015 2014
Cash and balances with central banks 15 4,369 1,887
Due from banks 15 136,700 123,940
Derivative financial instruments 38 222 15
Loans and advances to customers 16 167,713 149,257
Financial investment - available for sale 17 102,378 66,109
Financial investment - held to maturity 18 7,337 -
Other assets 22 8,288 10,473
Total 427,007 351,681
Contingent liabilities 29 106,645 90,721
Commitments 29 36,076 8,912
Total 142,721 99,633
Contingent liabilities and commitments 569,728 451,314
*The Bank changed its approach of disclosing, concentration maximum exposure, and as a result the 2014 figures were restated for comparison purposes.
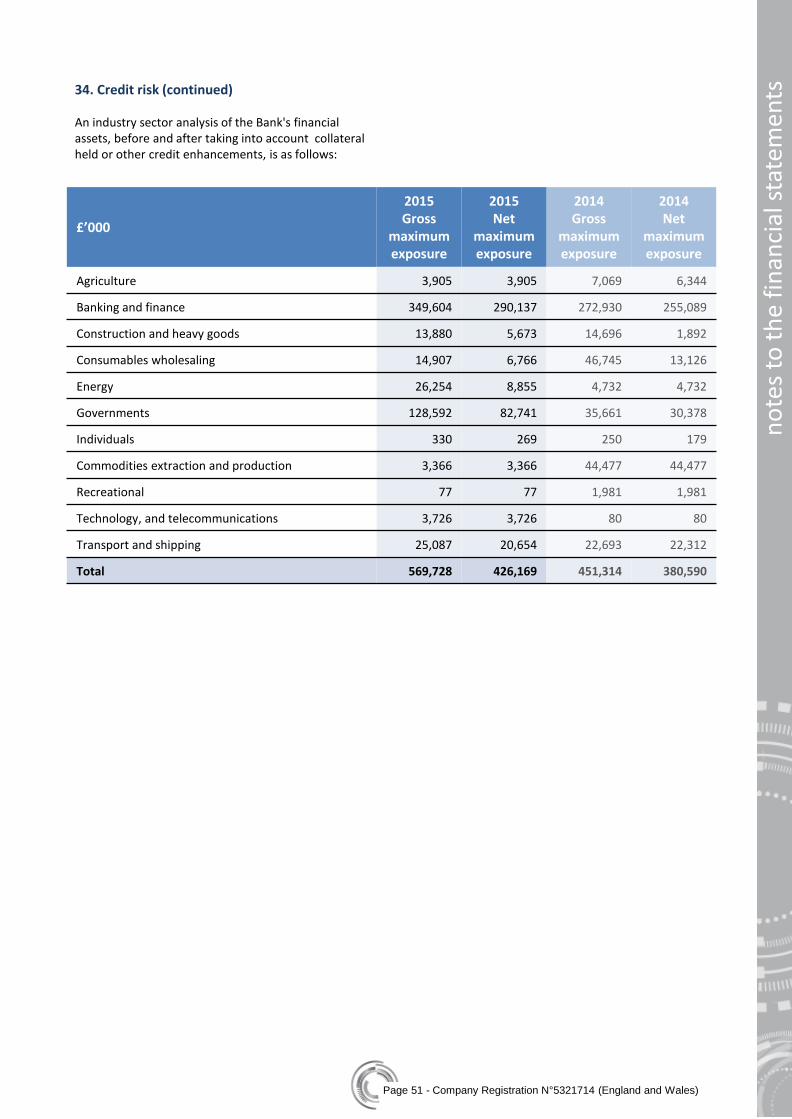
Page 51 - Company Registration N°5321714 (England and Wales)
no
tes
to t
he
fin
anci
al s
tate
men
ts
£’000
2015 Gross
maximum exposure
2015 Net
maximum exposure
2014 Gross
maximum exposure
2014 Net
maximum exposure
Agriculture 3,905 3,905 7,069 6,344
Banking and finance 349,604 290,137 272,930 255,089
Construction and heavy goods 13,880 5,673 14,696 1,892
Consumables wholesaling 14,907 6,766 46,745 13,126
Energy 26,254 8,855 4,732 4,732
Governments 128,592 82,741 35,661 30,378
Individuals 330 269 250 179
Commodities extraction and production 3,366 3,366 44,477 44,477
Recreational 77 77 1,981 1,981
Technology, and telecommunications 3,726 3,726 80 80
Transport and shipping 25,087 20,654 22,693 22,312
Total 569,728 426,169 451,314 380,590
34. Credit risk (continued) An industry sector analysis of the Bank's financial assets, before and after taking into account collateral held or other credit enhancements, is as follows:

Page 52 - Company Registration N°5321714 (England and Wales)
no
tes
to t
he
fin
anci
al s
tate
men
ts
34. Credit risk (continued)
D. Carrying amount per class of financial assets whose terms have been renegotiated
The below table shows the carrying amount of renegotiated financial assets, net of credit mitigation by class.
£’000 2015 2014
Corporate lending 6,900 3,754
Total 6,900 3,754
E. Credit quality per class of financial assets
The credit quality of financial assets is managed by the Bank using internal credit ratings. Credit Risk Grades (CRG) generally apply to clients, but can also be applied to specific transactions where considered appropriate. All facilities are considered to have the CRG of the client unless specifically stated otherwise. The latter will occur only where the transactions are considered to have a credit risk different to the legal entity concerned, an example being where some facilities or transactions are guaranteed by a stronger entity, or where the source of repayment is from a
stronger entity in a ring-fenced structured finance transaction.
The following table shows the credit quality by class of asset for loan-related balance sheet lines, based on the Bank's credit rating system, using the industry standard credit rating agency definition of investment grade, e.g. Moody’s Investors Service Baa3 or better, Fitch Ratings BBB- or better:
£’000 - 2015 Investment
grade Non investment
grade impaired Total
Due from banks 104,397 32,303 - 136,700
Derivative financial instruments 32 190 - 222
Loans and advances to customers - 165,884 1,829 167,713
Financial instruments – available for sale 52,114 50,264 - 102,378
Financial instruments – held to maturity 7,337 - - 7,337
Total 163,880 248,641 1,829 414,350
£’000 - 2014 Investment
grade Non investment
grade impaired Total
Due to banks 78,815 45,125 - 123,940
Derivative financial instruments 5 10 - 15
Loans and advances to customers 66,710 74,412 8,135 149,257
Financial instruments – available for sale 22,540 43,569 - 66,109
Total 168,070 163,116 8,135 339,321
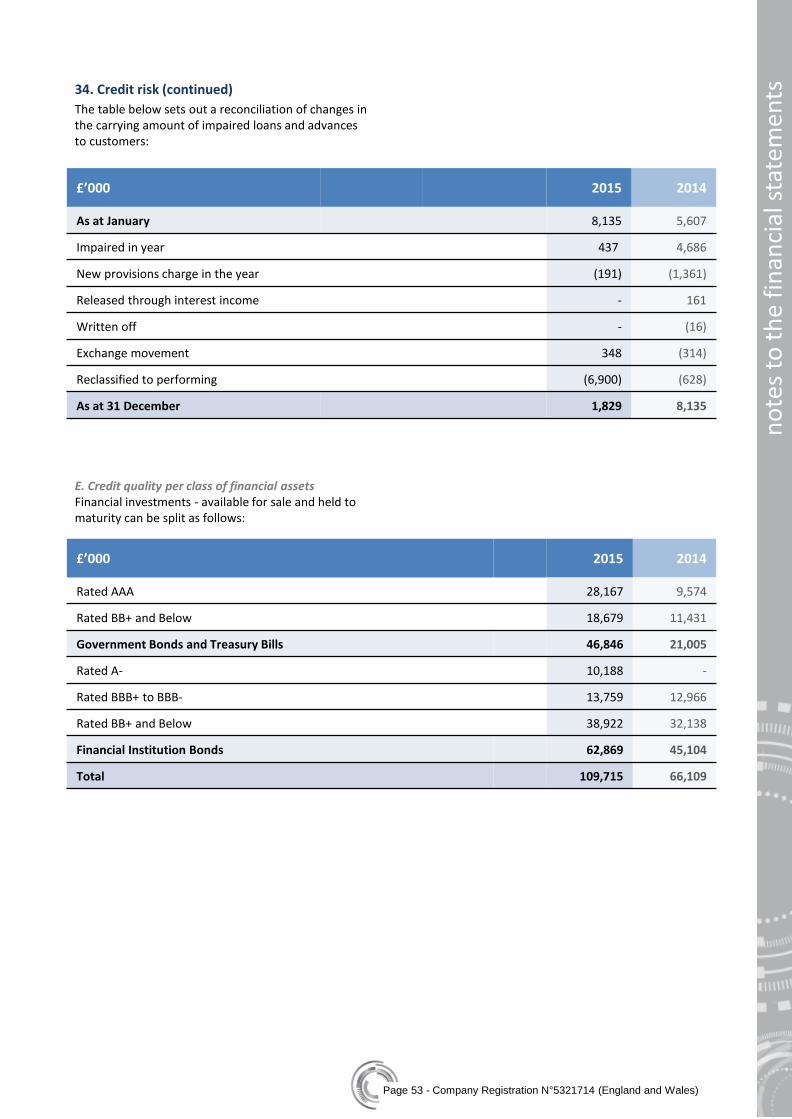
Page 53 - Company Registration N°5321714 (England and Wales)
no
tes
to t
he
fin
anci
al s
tate
men
ts
34. Credit risk (continued)
The table below sets out a reconciliation of changes in the carrying amount of impaired loans and advances to customers:
E. Credit quality per class of financial assets Financial investments - available for sale and held to maturity can be split as follows:
£’000 2015 2014
Rated AAA 28,167 9,574
Rated BB+ and Below 18,679 11,431
Government Bonds and Treasury Bills 46,846 21,005
Rated A- 10,188 -
Rated BBB+ to BBB- 13,759 12,966
Rated BB+ and Below 38,922 32,138
Financial Institution Bonds 62,869 45,104
Total 109,715 66,109
£’000 2015 2014
As at January 8,135 5,607
Impaired in year 437 4,686
New provisions charge in the year (191) (1,361)
Released through interest income - 161
Written off - (16)
Exchange movement 348 (314)
Reclassified to performing (6,900) (628)
As at 31 December 1,829 8,135

Page 54 - Company Registration N°5321714 (England and Wales)
no
tes
to t
he
fin
anci
al s
tate
men
ts
£’000 2015
Carrying amount
2014 Carrying amount
Balances with central banks 4,369 1,872
Cash and balances with other banks 74,120 73,501
Unencumbered debt securities issued by sovereigns 28,094 9,571
Total 106,583 84,944
35. Liquidity risk
Liquidity risk is the risk that the Bank may encounter difficulty in meeting obligations associated with financial liabilities when they fall due under normal and stressed conditions.
The Bank has obtained funding, with appropriate maturities, from its ultimate parent in order to meet its liquidity needs.
In stressed situations, the Bank will utilise funding arrangements under market repurchase agreements and deposits from the parent Company. This funding will be provided on an arms-length basis. The liquidity position is assessed and managed under a variety of scenarios. The most important of these is to maintain limits on the ratio of net liquid assets to customer liabilities, set to reflect market conditions.
Net liquid assets consist of cash, short term Bank deposits and high quality liquid assets securities available for immediate sale, less deposits from Banks and other borrowings. The Bank focuses on net liquid assets due to mature within the next eight days and also those due to mature within the next month. However the Bank also monitors all assets and liabilities over their contractual maturities.
The ultimate parent Company Banque Marocaine du Commerce Exterieur S.A has committed to provide interBank funding deposits to a maximum of £250 million, or equivalent in foreign currency, at an arms length interest rate to be agreed between the two parties until 31 December 2016.
A. Liquidity reserves
The table below shows the liquidity reserves:
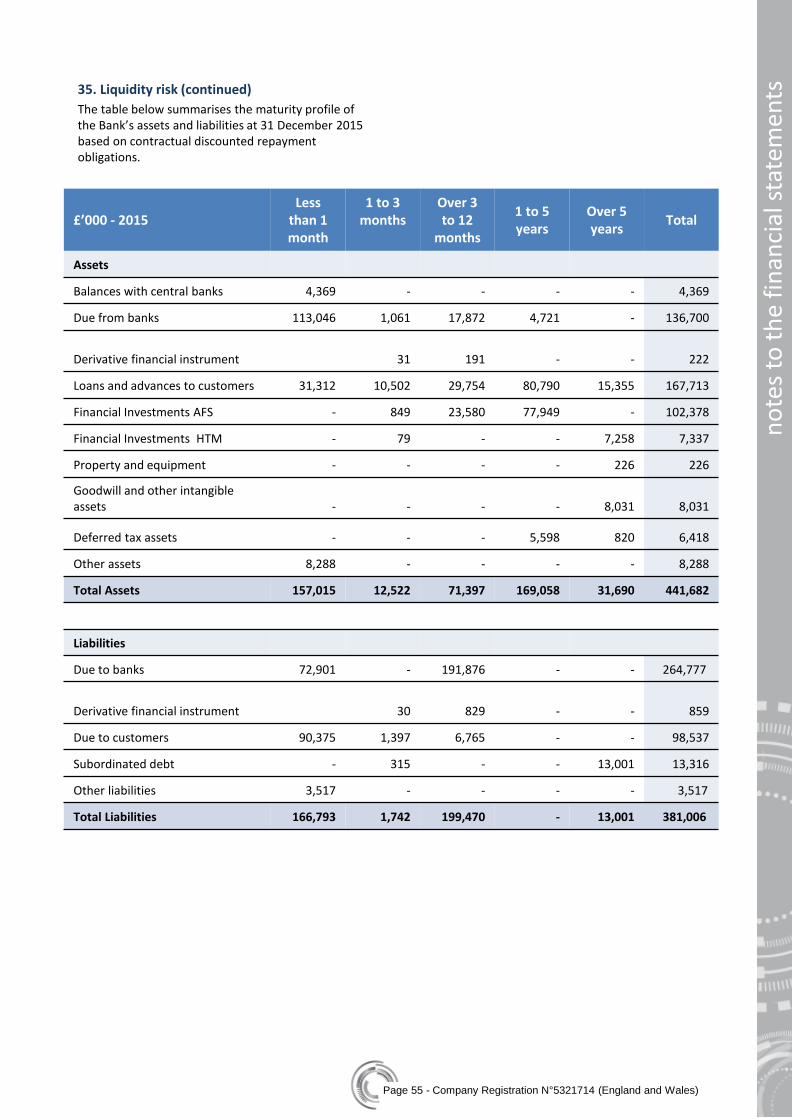
Page 55 - Company Registration N°5321714 (England and Wales)
no
tes
to t
he
fin
anci
al s
tate
men
ts
35. Liquidity risk (continued)
The table below summarises the maturity profile of the Bank’s assets and liabilities at 31 December 2015 based on contractual discounted repayment obligations.
£’000 - 2015 Less
than 1 month
1 to 3 months
Over 3 to 12
months
1 to 5 years
Over 5 years
Total
Assets
Balances with central banks 4,369 - - - - 4,369
Due from banks 113,046 1,061 17,872 4,721 - 136,700
Derivative financial instrument 31
191 - - 222
Loans and advances to customers 31,312 10,502 29,754 80,790 15,355 167,713
Financial Investments AFS - 849 23,580 77,949 - 102,378
Financial Investments HTM - 79 - - 7,258 7,337
Property and equipment - - - - 226 226
Goodwill and other intangible assets - - - - 8,031 8,031
Deferred tax assets - - - 5,598 820 6,418
Other assets 8,288 - - - - 8,288
Total Assets 157,015 12,522 71,397 169,058 31,690 441,682
Liabilities
Due to banks 72,901 - 191,876 - - 264,777
Derivative financial instrument
30 829 - - 859
Due to customers 90,375 1,397 6,765 - - 98,537
Subordinated debt - 315 - - 13,001 13,316
Other liabilities 3,517 - - - - 3,517
Total Liabilities 166,793 1,742 199,470 - 13,001 381,006

Page 56 - Company Registration N°5321714 (England and Wales)
no
tes
to t
he
fin
anci
al s
tate
men
ts
35. Liquidity risk (continued)
The table below summarises the maturity profile of the Bank’s assets and liabilities at 31 December 2014 based on contractual undiscounted repayment financial obligations.
£’000 - 2014 Less
than 1 month
1 to 3 months
Over 3 to 12
months
1 to 5 years
Over 5 years
Total
Assets
Balances with central banks 1,887 - - - - 1,887
Due from banks 99,362 4,250 20,328 - - 123,940
Derivative financial instruments 15 - - - - 15
Loans and advances to customers 87,176 - 42,872 15,850 3,359 149,257
Financial Investments AFS - 627 - 65,482 - 66,109
Property and equipment - - - - 987 987
Goodwill and other intangible assets - - - - 7,791 7,791
Deferred tax assets - - - 4,893 - 4,893
Other assets 2,074 - 8,399 - - 10,473
Total Assets 190,514 4,877 71,599 86,225 12,137 365,352
Liabilities
Due to banks 33,567 3,939 151,913 - - 189,419
Derivative financial instruments 92 2,348 1,827 - - 4,267
Due to customers 91,355 3,573 6,395 96 - 101,419
Subordinated debt 363 - - - 13,775 14,138
Other liabilities
2,058 - 816 - - 2,874
Total Liabilities 127,435 9,860 160,951 96 13,775 312,117
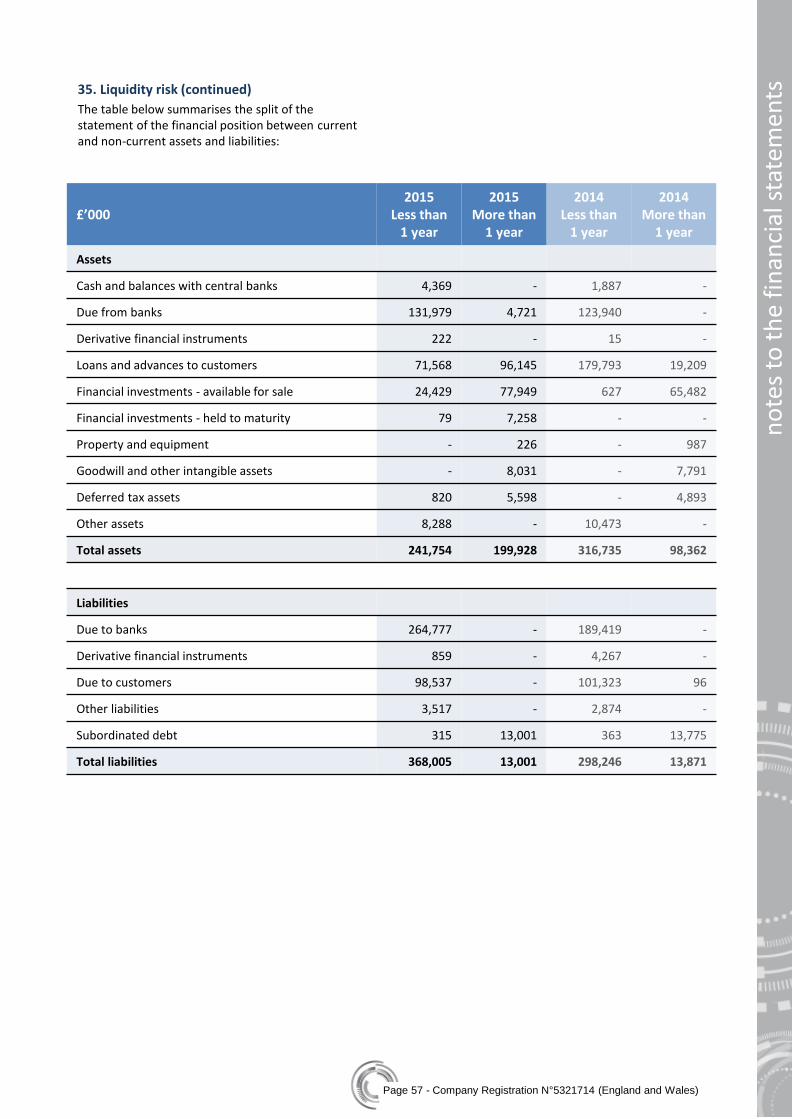
Page 57 - Company Registration N°5321714 (England and Wales)
no
tes
to t
he
fin
anci
al s
tate
men
ts
35. Liquidity risk (continued)
The table below summarises the split of the statement of the financial position between current and non-current assets and liabilities:
£’000
2015 Less than
1 year
2015 More than
1 year
2014 Less than
1 year
2014 More than
1 year
Assets
Cash and balances with central banks 4,369 - 1,887 -
Due from banks 131,979 4,721 123,940 -
Derivative financial instruments 222 - 15 -
Loans and advances to customers 71,568 96,145 179,793 19,209
Financial investments - available for sale 24,429 77,949 627 65,482
Financial investments - held to maturity 79 7,258 - -
Property and equipment - 226 - 987
Goodwill and other intangible assets - 8,031 - 7,791
Deferred tax assets 820 5,598 - 4,893
Other assets 8,288 - 10,473 -
Total assets 241,754 199,928 316,735 98,362
Liabilities
Due to banks 264,777 - 189,419 -
Derivative financial instruments 859 - 4,267 -
Due to customers 98,537 - 101,323 96
Other liabilities 3,517 - 2,874 -
Subordinated debt 315 13,001 363 13,775
Total liabilities 368,005 13,001 298,246 13,871

Page 58 - Company Registration N°5321714 (England and Wales)
no
tes
to t
he
fin
anci
al s
tate
men
ts
36. Market risk
Market risk is defined as the risk of losses on financial instruments arising from changes in market factors. The Bank is currently exposed to changes in risk interest rate risk and foreign exchange rate risk.
Market risk may be propagated by other forms of financial risk such as credit and market liquidity risks, prices potentially moving adversely for a number of reasons, including credit downgrading of securities held, general negative economic factors, and reduced liquidity. The key specific types of market risk relevant to the Bank are:
• Interest rate risk
• Foreign exchange risk
• Price risk on available for sale assets
The Bank’s control framework has been designed using a risk-based approach i.e. to address the business risks which have been identified as being the most relevant to the Bank as a result of the type of business undertaken and according to the way its operations have been organised.
The other specific market type risks are managed and have the following potential financial impacts as follows:
A. Interest rate risk
• Banking book: Interest rate risk is the risk to earnings or capital arising from movement of interest rates. It arises from differences between the timing of rate changes and the timing of cash flows (re-pricing risk); from changing rate relationships among yield curves that affect Bank activities (basis risk); from changing rate relationships across the spectrum of maturities (yield curve risk); and, from interest-rate-related options embedded in Bank products (option risk). The evaluation of interest rate risk must consider the impact of complex, illiquid, hedging strategies or products, and also the potential impact on fee income that is sensitive to changes in interest rates.
• Trading book: The current low level of the trading book means there is no significant interest rate risk at this time.
The total sensitivity of all assets and liabilities held has been calculated as follows:
£’000 - Gain / (Loss) in profit or loss 2015 2014
Parallel shift in interest rates -2% (4,393) (382)
Parallel shift in interest rates +2% 4,831 309
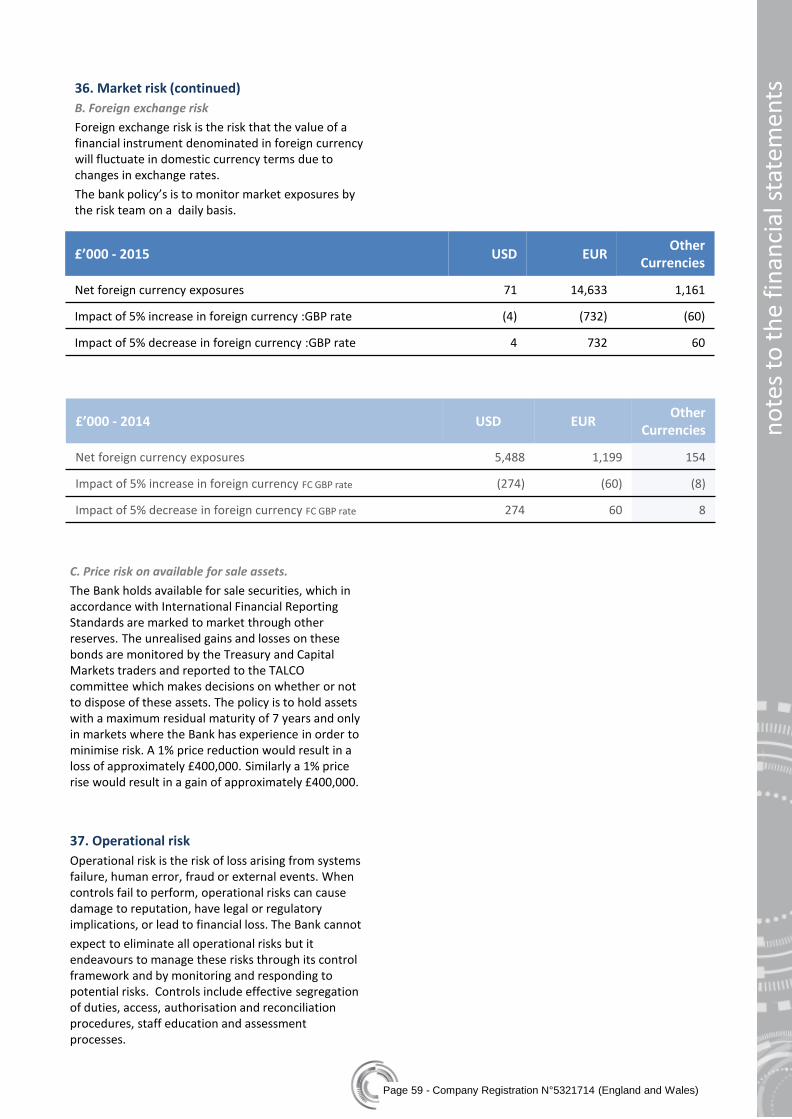
Page 59 - Company Registration N°5321714 (England and Wales)
no
tes
to t
he
fin
anci
al s
tate
men
ts
36. Market risk (continued)
B. Foreign exchange risk
Foreign exchange risk is the risk that the value of a financial instrument denominated in foreign currency will fluctuate in domestic currency terms due to changes in exchange rates.
The bank policy’s is to monitor market exposures by the risk team on a daily basis.
£’000 - 2014 USD EUR Other
Currencies
Net foreign currency exposures 5,488 1,199 154
Impact of 5% increase in foreign currency FC GBP rate (274) (60) (8)
Impact of 5% decrease in foreign currency FC GBP rate 274 60 8
£’000 - 2015 USD EUR Other
Currencies
Net foreign currency exposures 71 14,633 1,161
Impact of 5% increase in foreign currency :GBP rate (4) (732) (60)
Impact of 5% decrease in foreign currency :GBP rate 4 732 60
C. Price risk on available for sale assets.
The Bank holds available for sale securities, which in accordance with International Financial Reporting Standards are marked to market through other reserves. The unrealised gains and losses on these bonds are monitored by the Treasury and Capital Markets traders and reported to the TALCO committee which makes decisions on whether or not to dispose of these assets. The policy is to hold assets with a maximum residual maturity of 7 years and only in markets where the Bank has experience in order to minimise risk. A 1% price reduction would result in a loss of approximately £400,000. Similarly a 1% price rise would result in a gain of approximately £400,000.
37. Operational risk
Operational risk is the risk of loss arising from systems failure, human error, fraud or external events. When controls fail to perform, operational risks can cause damage to reputation, have legal or regulatory implications, or lead to financial loss. The Bank cannot
expect to eliminate all operational risks but it endeavours to manage these risks through its control framework and by monitoring and responding to potential risks. Controls include effective segregation of duties, access, authorisation and reconciliation procedures, staff education and assessment processes.

Page 60 - Company Registration N°5321714 (England and Wales)
no
tes
to t
he
fin
anci
al s
tate
men
ts
£’000 - 2015 Level 1 Level 2 Level 3 Total fair
values
Total carrying amount
Assets
Cash and cash equivalents - 4,369 - 4,369 4,369
Amortised cost
Loans and advances to banks - 111,308 25,392 136,700 136,700
Loans and advances to customers - - 167,713 167,713 167,713
Fair value through profit & Loss
Derivative financial instrument - 222 - 222 222
Available-for-sale
Available for sale investment securities 102,378 - - 102,378 102,378
Held-to-maturity
Held to maturity investment securities 7,337 - - 7,337 7,337
Liabilities
Amortised cost
Deposits from banks - 169,836 94,941 264,777 264,777
Deposits from customers - - 98,537 98,537 98,537
Subordinated liabilities - - 13,316 13,316 13,316
Fair value through profit & Loss
Derivative financial instrument - 859 - 859 859
38. Fair Value
A. Fair Value Hierarchy
Basis of determination of fair values are detailed on page 19 under fair value. Derivatives are measured at Level 2 , where the fair value is determined by applicable market forward rates.
The Bank uses the following hierarchy for determining and disclosing the fair value of financial instruments by valuation technique:
• Level 1: inputs that are quoted market prices (unadjusted) in active markets for identical instruments.
• Level 2: inputs other than quoted prices included within Level 1 that are observable directly (i.e. as prices) or indirectly (i.e. derived from prices). This
category includes instruments valued using: quoted market prices in active markets for similar instruments; quoted prices for identical or similar instruments in markets considered less than active; or other valuation techniques in which all significant inputs are directly or indirectly observable from market data.
• Level 3: inputs that are unobservable. This category includes all instruments for which valuation technique includes inputs not based on observable data and the unobservable inputs have significant effect on the instruments valuation.
No transfer of financial instruments between categories ocurred during the year 2015.

Page 61 - Company Registration N°5321714 (England and Wales)
£’000 - 2014 Level 1 Level 2 Level 3 Total fair
values
Total carrying amount
Assets
Cash and cash equivalents - 1,887 - 1,887 1,887
Amortised cost
Loans and advances to banks - 97,767 26,173 123,940 123,940
Loans and advances to customers - - 149,257 149,257 149,257
Fair value through profit & Loss
Derivative financial instrument - 15 - 15 15
Available-for-sale
Available for sale investment securities 66,109 - - 66,109 66,109
Liabilities
Amortised cost
Deposits from banks - 168,813 20,606 189,419 189,419
Deposits from customers - - 101,419 101,419 101,419
Subordinated liabilities - - 14,138 14,138 14,138
Fair value through profit & Loss
Derivative financial instrument - 4,267 - 4,267 4,267
no
tes
to t
he
fin
anci
al s
tate
men
ts
38. Fair Value (continued)
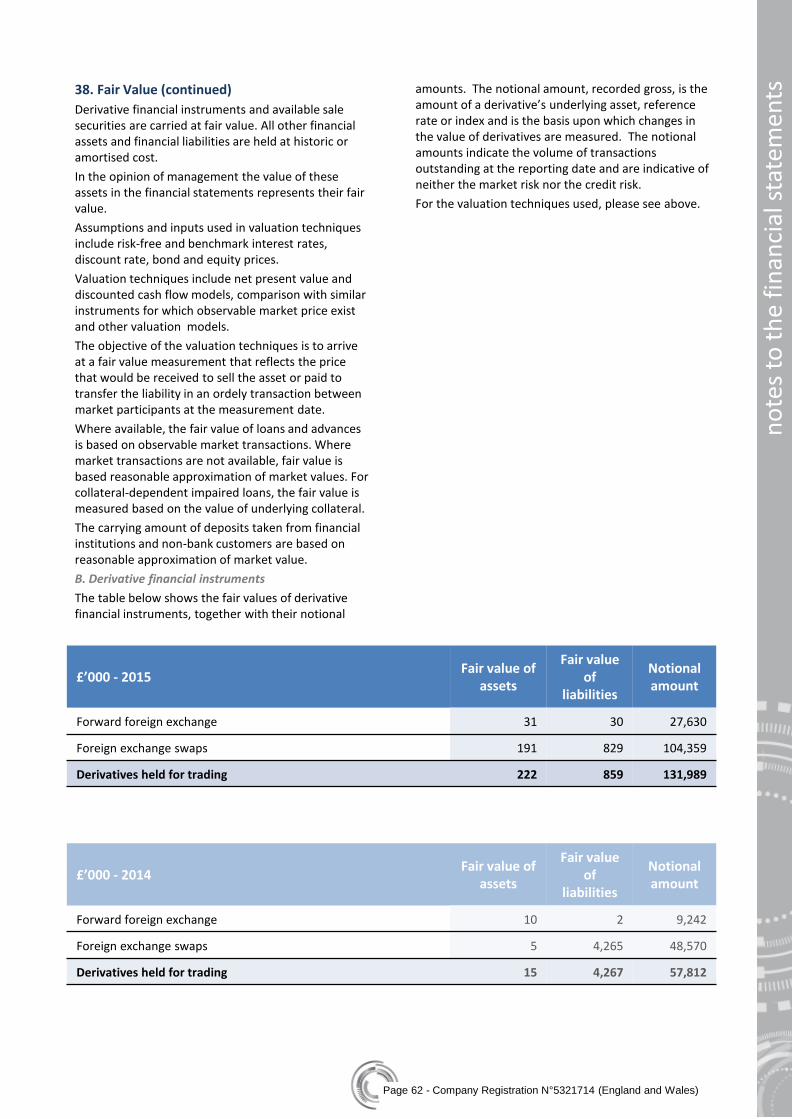
Page 62 - Company Registration N°5321714 (England and Wales)
no
tes
to t
he
fin
anci
al s
tate
men
ts
£’000 - 2015 Fair value of
assets
Fair value of
liabilities
Notional amount
Forward foreign exchange 31 30 27,630
Foreign exchange swaps 191 829 104,359
Derivatives held for trading 222 859 131,989
£’000 - 2014 Fair value of
assets
Fair value of
liabilities
Notional amount
Forward foreign exchange 10 2 9,242
Foreign exchange swaps 5 4,265 48,570
Derivatives held for trading 15 4,267 57,812
38. Fair Value (continued)
Derivative financial instruments and available sale securities are carried at fair value. All other financial assets and financial liabilities are held at historic or amortised cost.
In the opinion of management the value of these assets in the financial statements represents their fair value.
Assumptions and inputs used in valuation techniques include risk-free and benchmark interest rates, discount rate, bond and equity prices.
Valuation techniques include net present value and discounted cash flow models, comparison with similar instruments for which observable market price exist and other valuation models.
The objective of the valuation techniques is to arrive at a fair value measurement that reflects the price that would be received to sell the asset or paid to transfer the liability in an ordely transaction between market participants at the measurement date.
Where available, the fair value of loans and advances is based on observable market transactions. Where market transactions are not available, fair value is based reasonable approximation of market values. For collateral-dependent impaired loans, the fair value is measured based on the value of underlying collateral.
The carrying amount of deposits taken from financial institutions and non-bank customers are based on reasonable approximation of market value.
B. Derivative financial instruments
The table below shows the fair values of derivative financial instruments, together with their notional
amounts. The notional amount, recorded gross, is the amount of a derivative’s underlying asset, reference rate or index and is the basis upon which changes in the value of derivatives are measured. The notional amounts indicate the volume of transactions outstanding at the reporting date and are indicative of neither the market risk nor the credit risk.
For the valuation techniques used, please see above.

Page 63 - Company Registration N°5321714 (England and Wales)
no
tes
to t
he
fin
anci
al s
tate
men
ts
39. Capital management
A. Definition
The Bank’s regulatory capital consists of the sum of the following elements:
• Tier 1 capital (all qualifies as Common Equity Tier 1 (CET1) capital) - it includes ordinary share capital, retained earnings, reserves and other comprehensive income (OCI) after adjustment for deductions for goodwill and other regulatory adjustments relating to items that are included in equity but are treated differently for capital adequacy purposes
• Tier 2 capital - it includes qualifying subordinated liabilities.
B. Approach
The Bank’s policy is to maintain a sufficient capital base to maintain stakeholders’ confidence and to sustain the future development of the business. The impact of the level of the capital on shareholders’ return is also considered and the Bank recognises the need to maintain a balance between the higher returns that might be possible with greater gearing and the advantages and security afforded by a sound capital position.
C. Regulatory capital
The Bank and its individually regulated operations have not reported any breaches on externally imposed regulatory capital requirements during the year. D. Monitoring
Management uses regulatory capital ratios to monitor its capital base. The allocation of capital between specific operation and activities is, to a large extent, driven by optimisation of the return achieved and the capital allocated. The amount of capital allocated to each operation or activity is based primarily on
egulatory capital requirements, but in some cases the
regulatory requirements do not fully reflect the
varying degree of risk associated with different activities. In such cases, the capital requirements may be flexed to reflect differing risk profiles, subject to the overall level of capital to support a particular operation or activity not falling below the minimum required for regulatory purposes. The process of allocating capital to specific operations and activities is undertaken independently of those responsible for the operation by the Credit and Risk Committees and is subject to review by the TALCO.
Although maximisation of the return on risk-adjusted capital is the principal basis used in determining how capital is allocated within the Bank to particular operations or activities, it is not the sole basis used for decision making. Account is also taken of synergies with other operations and activities, the availability of management and other resources, and the fit of the activity with the Bank’s long-term strategic objectives. The Bank’s policies in respect of capital management and allocation are reviewed regularly by the Board of Directors.

Page 64 - Company Registration N°5321714 (England and Wales)
Part III
Pillar III disclosures (unaudited) - 65

Page 65 - Company Registration N°5321714 (England and Wales)
Pill
ar II
I dis
clo
sure
s (u
nau
dit
ed) Additional information required by the Capital
Requirements Directive (CRD)
Pillar 3 Disclosures
This is unaudited information
A. Ratios
The following disclosures are in accordance with the requirements of the Capital Requirements Directive. The numbers in this appendix are as submitted to the
Prudential Regulation Authority and do not reflect late adjustments to the financial statements which are not considered to be material.
Further information on capital management is available in note 39.
The Bank has no Tier 3 capital.
Deductions from pillar 1 capital are goodwill and AFS reserve. Figures are available on table in note 39.
£’000 2015 2014
Tier 1 capital 45,544 40,825
Subordinated debt (principal) 13,001 13,775
Tier 2 capital 58,545 54,600
Required capital pre capital planning buffer 43,840 37,091
Capital planning buffer 8,200 8,200
Required capital including buffer 52,040 45,291
Surplus Capital 6,505 9,309
Risk weighted assets 360,523 305,024
Tier 1 capital ratio 12.6% 13.3%
Solvency ratio 16.2% 17.9%
B. Regulatory exposure values
The regulatory net exposure values and pillar 1 capital requirements by class are as follows:
£’000 2015 2014-
Restated*
Central governments or central banks 43,541 36,550
Institutions 137,934 72,086
Corporate 84,922 79,742
Retail 180 185
Short term claims on institutions 107,245 94,933
Other items 9,033 11,853
Total 382,855 295,349
*The Bank changed its approach of disclosing, regulatory net exposure, and as a result the 2014 figures were restated.

Page 66 - Company Registration N°5321714 (England and Wales)
Pill
ar II
I dis
clo
sure
s (u
nau
dit
ed) Additional information required by the Capital
Requirements Directive (CRD)
Pillar 3 Disclosures (continued) B. Regulatory exposure values (continued) Pillar 1 capital requirement:
£’000 2015 2014
Central governments or central banks 4,668 2,773
Institutions 8,316 5,682
Corporate 4,881 6,587
Retail 16 16
Short term claims on institutions 1,797 1,941
Other items 678 143
Total 20,356 17,142
C. Risk management
Risk Management is described in note 33.
D. Credit risk
Credit Risk is described in note 34.
The average net exposures by class during the year were as follows:
*The Bank changed its approach of disclosing, average net exposure, and as a result the 2014 figures were restated.
The bank monitors the performance of all credit exposures. It classifies an exposure as past due whenever a due payment of interest or principal is overdue. The risk department is responsible for monitoring exposures. If it has a concern as to whether an exposure may be at risk of default this is referred to the credit committee. Exposures are classified as impaired if there is a reasonable probability of default.
£’000 2015 2014-
Restated*
Central governments or central banks 37,706 35,222
Institutions 88,860 132,998
Corporate 75,299 61,081
Retail 161 172
Short term claims on institutions and corporate 91,798 37,628
Other items 13,098 12,927
Total 306,922 280,028

Page 67 - Company Registration N°5321714 (England and Wales)
Pill
ar II
I dis
clo
sure
s (u
nau
dit
ed) Additional information required by the Capital
Requirements Directive (CRD)
Pillar 3 Disclosures (continued) D. Credit risk (continued)
The table below shows loans impaired and provisions applied:
The Bank uses the following External Credit Assessment Institutions:
- Fitch Ratings;
- Moody’s Investors Service.
These ratings are applied to the exposures to Institutions and central governments.
The ratings are mapped as follows:
£’000 2015
Principal 2015
Provision 2014
Principal 2014
Provision
By type
Loans to customers 1,829 597 9,929 1,785
By sector
Construction & heavy goods 1,242 387 4,925 1,359
Commodities extraction and production - - 4,276 187
Individuals 6 - - -
Recreational 581 210 615 222
Transport and shipping - - 113 17
Total 1,829 597 9,929 1,785
Expected Recovery
0 to 3 months - 187
3 - 6 months - 1,359
6 months to 1 year - 239
1 to 2 years 387 -
Greater than 2 years 210 -
Total 597 1,785
Credit quality Moodys Fitch
1 Aaa AAA
2 Aa1 to Aa3 AA+ to AA-
3 A1 to A3 A+ to A-
4 Baa1+ to Baa3 BBB+ to BBB-
5 Ba1 to Ba3 BB+ to BB-
6 B1 to B3 B+ to B-
7 Caa1 and below CCC+ and below
NR Not rated
SN Supranational

Page 68 - Company Registration N°5321714 (England and Wales)
Pill
ar II
I dis
clo
sure
s (u
nau
dit
ed)
Additional information required by the Capital Requirements Directive (CRD)
Pillar 3 Disclosures (continued) E. Market risk
The exposures that are subject to market risk are:
- Interest rate swaps
- Foreign exchange open positions
- Available for sale instruments
Equity risk is measured using the standardised approach. The trading book equities are quoted but are not part of any qualifying equity index. There are no short positions and hence no netting.
The Bank calculates the general market risk on its interest rate swaps by using the maturity method. The swaps are standard fixed / floating swaps. The risk is calculated by the standardised method of placing the cash flows into time bands.
The Bank applies the ordinary credit default swap PRR (Position Risk Requirement) method. A valuation change capital charge is added to a default capital charge. The aggregate charge is limited to the maximum loss possible under the swaps.
Further information is available in note 36.
£’000 2015 2014
Interest rate risk 6,954 5,046
Foreign exchange risk 197 7
Total 7,151 5,053
F. Liquidity risk
Liquidity Risk is described in note 35.
G. Operational risk
The Bank calculates its operational risk capital requirement by using the basic indicator approach.
Further information is available on note 37.
H. Remuneration policy
The Remuneration Committee meets at least annually or as frequently as is required to:
- establish the compensation policy;
- review individual performances, salary adjustments and position upgrades; and
- review any other relevant compensation issues.
The Remuneration committee consist of two non-executive Directors, with Chief Executive Officer and Human Resource, and others by invitation as considered appropriate.
The committee is chaired by a non-executive Director.
In addition to the Chair of the committee, another member of the Board of Directors, the Chief Executive Officer and Human Resources department also attend.
No employee receives shares or other variable remuneration.
Non-cash benefits are those that are standard within the industry; the most significant being private medical insurance and season ticket loans.
Total remuneration is disclosed in note 10. Remuneration of key personnel is disclosed in note 30. The number of employees is such that further analysis is not material and would be confidential.