
Annual Report and Accounts at 31 December 2012 - Trevi Fin · Annual Report and Consolidated Annual...
174
Annual Report and Accounts at 31 December 2012
Transcript of Annual Report and Accounts at 31 December 2012 - Trevi Fin · Annual Report and Consolidated Annual...

Annual Report and Accounts at 31 December 2012

TREVI – Finanziaria Industriale S.p.A.
Annual Report and Consolidated Annual Report
31 December 2012
TREVI – Finanziaria Industriale S.p.A.Registered O�ce Cesena (FC) – Via Larga 201 – ItalyShare capital Euro 35,097,150 fully paid-upForlì – Cesena Chamber of Commerce Business Register no. 201,271Tax code, VAT no. and Forlì – Cesena Business Registry: 01547370401Website: www.trevi�n.com

On the cover: HH202 Drillmec rigs winterized, in activity on behalf of Petreven Chile
Photo: Qatar- - Development job site in Das Island

8
35
108
120
123
169
170
CONTENTS
KEY FINANCIAL FIGURES OF THE GROUP
Board of Directors’ Report on Operations accompanying the Consolidated and Parent Company Financial Statements.
CONSOLIDATED FINANCIAL STATEMENTS AT 31 DECEMBER 2012
Consolidated Statement of Financial Position, Consolidated Income Statement, Consolidated Statement of
Comprehensive Income, Consolidated Statement of Changes in Net Equity, Consolidated Statement of Cash Flows
Explanatory Notes to the Consolidated Financial Statements
Attachments to the Notes to the Consolidated Financial Statements
Independent Auditors’ Report pursuant to Articles 14 and 16 of Legislative Decree 27.1.2010, no.39
Report of the Board of Statutory Auditors pursuant to Article 153 of Legislative Decree
no. 58/1998 and of Article 2429 paragraph 3 of the Italian Civil Code.
FINANCIAL STATEMENTS AT 31 DECEMBER 2012
Statement of Financial Position, Income Statement, Statement of Comprehensive
Income, Statement of Changes in Net Equity, Statement of Cash Flows
Explanatory Notes to the Financial Statements
Independent Auditors’ Report pursuant to Articles 14 and 16 of Legislative Decree 27.1.2010, no.39
Resolutions of the Ordinary Shareholders’ Meeting 29 April 2013
BOARD OF DIRECTORS
Chairman
Davide Trevisani
Managing Directors
Gianluigi Trevisani
Cesare Trevisani
Stefano Trevisani
Directors
Enrico Bocchini
Guglielmo Antonio Claudio Moscato
Monica Mondardini
Riccardo Pinza
Pio Teodorani Fabbri
Board of Statutory Auditors:
Standing Statutory Auditors
Adolfo Leonardi (Chairman)
Giacinto Alessandri
Giancarlo Poletti
Supplementary Statutory Auditors
Silvia Caporali
Giancarlo Daltri

Internal Audit, Remuneration and Related-party Transaction Committee
Enrico Bocchini – Independent Director (Chairman)
Guglielmo Antonio Claudio Moscato – Independent Director
Riccardo Pinza – Independent Director
Group Chief Financial O�cer
Daniele Forti
Appointed Manager responsible for the preparation of company
accounts by the Board of Directors on 14 May 2007
Lead Independent Director
Enrico Bocchini
Audit Company
Reconta Ernst & Young S.p.A.
Appointed on 29 April 2008 and until the Shareholders’ Meeting
to approve the Financial Statements at 31 December 2016

KEY FIGURES
Gianluigi TrevisaniTREVI Fin. & Ind. S.p.A.
Vice President & CEO
Davide TrevisaniTREVI Fin. & Ind. S.p.A.
Chairman & CEO
Stefano TrevisaniTREVI Fin. & Ind. S.p.A.
CEO & Director
Cesare TrevisaniTREVI Fin. & Ind. S.p.A.
CEO & Director

CEO & Key PeopleTREVI Group
Simone TrevisaniSOILMEC DRILLMEC
CEO & Director
Leonardo BisernaTREVI
International Dpt.
Fabio MarcelliniPETREVEN
General Manager
Claudio CicognaniDRILLMEC
President & CEO
Antonio ArientiTREVI
Domestic Dpt.
Federico PagliacciSOILMEC
Marketing & R&D
Daniele FortiGroup CFO
Marco CasadeiSOILMEC
International Dpt.
Daniele VanniTREVI
Design R&D
Pio FranchiniHuman Resources
842 1.069 1.036 953367 366 498 642
2007 2008 2009 2010 20122003 2004 2005 2006 2011
1.061 1.115
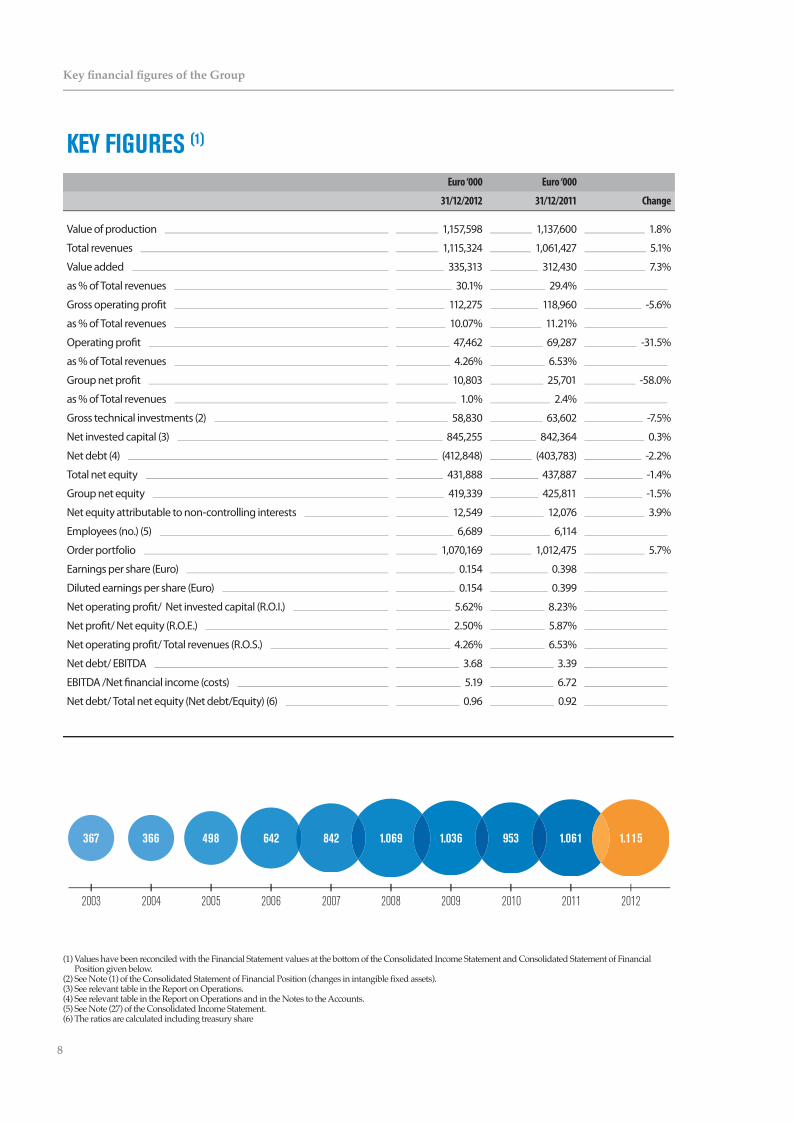
KEY FIGURES (1)
Euro ‘000 Euro ‘000
31/12/2012 31/12/2011 Change
Value of production 1,157,598 1,137,600 1.8%
Total revenues 1,115,324 1,061,427 5.1%
Value added 335,313 312,430 7.3%
as % of Total revenues 30.1% 29.4%
Gross operating pro�t 112,275 118,960 -5.6%
as % of Total revenues 10.07% 11.21%
Operating pro�t 47,462 69,287 -31.5%
as % of Total revenues 4.26% 6.53%
Group net pro�t 10,803 25,701 -58.0%
as % of Total revenues 1.0% 2.4%
Gross technical investments (2) 58,830 63,602 -7.5%
Net invested capital (3) 845,255 842,364 0.3%
Net debt (4) (412,848) (403,783) -2.2%
Total net equity 431,888 437,887 -1.4%
Group net equity 419,339 425,811 -1.5%
Net equity attributable to non-controlling interests 12,549 12,076 3.9%
Employees (no.) (5) 6,689 6,114
Order portfolio 1,070,169 1,012,475 5.7%
Earnings per share (Euro) 0.154 0.398
Diluted earnings per share (Euro) 0.154 0.399
Net operating pro�t/ Net invested capital (R.O.I.) 5.62% 8.23%
Net pro�t/ Net equity (R.O.E.) 2.50% 5.87%
Net operating pro�t/ Total revenues (R.O.S.) 4.26% 6.53%
Net debt/ EBITDA 3.68 3.39
EBITDA /Net �nancial income (costs) 5.19 6.72
Net debt/ Total net equity (Net debt/Equity) (6) 0.96 0.92
(1) Values have been reconciled with the Financial Statement values at the bottom of the Consolidated Income Statement and Consolidated Statement of Financial Position given below.(2) See Note (1) of the Consolidated Statement of Financial Position (changes in intangible fixed assets).(3) See relevant table in the Report on Operations. (4) See relevant table in the Report on Operations and in the Notes to the Accounts.(5) See Note (27) of the Consolidated Income Statement.(6) The ratios are calculated including treasury share
Key financial figures of the Group
8

BOARD OF DIRECTORS’ REPORT ON OPERATIONS FOR THE CONSOLIDATED AND PARENT COMPANY FINANCIAL STATEMENTS AT 31 DECEMBER 2012
Dear shareholders,The TREVI Group had signi�cant growth in revenues (+5.1%) and acquired a substantial number of strategic contracts in the �nancial year under review: in 2012, the order portfolio rose almost 6% to well over Euro 1 billion thereby con�rming the ability of the Group to win new and important orders also in a highly competitive and challenging market place.Following a weak third quarter, since October 2012 the Group Oil & Gas sector has again started to show a highly positive trend: new orders acquired in Oil & Gas in the fourth quarter totalled Euro 370 million and it is well positioned to take advantage of market opportunities. Whilts highlighting the recent signs of a gradual improvement in the global construction sector, we consider it best to be prudent regarding the outlook for 2013 given the weakness of the European markets. However, we recognise that there are interesting opportunities in the second half of this year and also in the following year.We present the Consolidated Financial Statements of TREVI – Finanziaria Industriale S.p.A. (hereinafter also the “Company”) and its subsidiaries at 31 December 2012 (“TREVI Group”) which have been prepared in accordance with IAS/IFRS accounting standards. They show total revenues of approximately Euro 1,115.3 million and Group net pro�t of Euro 10.8 million. The strong Group presence in international markets is evident from the percentage of sales made abroad, which were
approximately 90.6% of total sales; the weight of Italy on total Group revenues fell once again and was 9.4%.Net debt was Euro 412.8 million, a slight increase on the previous �nancial year (Euro 403.8 million).The Group order portfolio rose to over Euro 1,070 million, a signi�cant increased compared to the �gure at 31 December 2011. Value Added was Euro 335.3 million (+7.3%), a margin on total revenues of 30.1% (29.4% at the end of the preceding �nancial year). The value of production increased from Euro 1,137.6 million to Euro 1,157.6 million (+1.8%). The increase of Euro 28 million in �xed assets for internal use (Euro 31.4 million in the previous �nancial year) was mainly due to machinery produced by the Mechanical Engineering Division for use by the Special Foundations and Drilling Services companies. Inventories of �nished and semi-�nished products increased by Euro 14.2 million.
9
Key financial figures of the Group

TREVI GROUP
Consolidated Income Statement(Euro ‘000)
31/12/2012 31/12/2011 change %TOTAL REVENUES (7) 1,115,324 1,061,427 53,897 5.1%
Changes in inventories of �nished and semi-�nished products 14,232 44,744 (30,511)
Increase in �xed assets for internal use 28,042 31,429 (3,387)
VALUE OF PRODUCTION (8) 1,157,598 1,137,600 19,999 1.8%
Raw materials and external services (9) 805,988 809,820 (3,832)
Other operating costs (10) 16,298 15,350 948
VALUE ADDED (11) 335,313 312,430 22,882 7.3%
Personnel expenses 223,038 193,471 29,567
GROSS OPERATING PROFIT (12) 112,275 118,960 (6,685) -5.6%
Depreciation 49,199 46,333 2,866
Provisions and impairments 15,614 3,340 12,274
OPERATING PROFIT (13) 47,462 69,287 (21,825) -31.5%
Financial revenue/ (expenses) (14) (21,615) (17,714) (3,901)
Gains/ (losses) on exchange rates (4,865) (283) (4,582)
Pro�t / (loss) from associates 0 0 0
PRE-TAX PROFIT 20,982 51,290 (30,308) -59.1%
Tax 9,484 24,185 (14,700)
Result attributable to non-controlling interests 695 1,405 (710)
GROUP NET PROFIT 10,803 25,701 (14,898) -58.0%
The Income Statement above, and the related notes, is a reclassified summary of the Consolidated Income Statement.
(7) Total revenues include the following items: revenues from sales and services and other operating revenues, excluding those of a non-recurring nature.(8) Value of production includes the following items: revenues from sales and services, increases in fixed assets for internal use, other operating revenues, changes in inventories of finished products and of semi-finished products.(9) The entry, Consumption of raw materials and external services, includes the following items: raw materials and consumables, changes in inventory of raw materials, ancillary products, consumables and goods, and other miscellaneous operating costs not including other operating costs (Note 28).(10) For further details on the entry Other operating costs, see Note 28 of the Consolidated Income Statement(11) Value added is the sum of the value of production, raw material costs and external services, and other operating costs.(12) EBITDA (gross operating profit) is an economic indicator not defined by IFRS, adopted by TREVI Group beginning with the Consolidated Financial Statements at 31 December 2005. EBITDA is a measure used by Trevi’s management to monitor and evaluate the operating performance of the Group. Management believes that EBITDA is an important parameter for the measurement of Group performance insofar as it is not influenced by the volatility generated by the various factors used in determining taxable income, by the amount and nature of capital employed and by depreciation policies. At the current date (in the absence of more detail concerning the evolution of alternative corporate performance measurement criteria), EBITDA (earnings before interest, taxes, depreciation and amortisation) is defined by TREVI Group as profit/loss for the period gross of depreciation and amortisation of tangible and intangible fixed assets, provisions and impairment, financial revenue and expenses, and taxes.(13) EBIT (operating profit) is an economic indicator not defined by IFRS, adopted by TREVI Group beginning with the Consolidated Financial Statements at 31 December 2005. EBIT is one of the measures used by the TREVI management to monitor and evaluate the operating performance of the Group. Management believes that EBIT is an important parameter for the measurement of Group performance insofar as it not influenced by the volatility generated by the impact of various factors used in determining taxable income, the amount and nature of capital employed and by depreciation policies. EBIT (earnings before interest and taxes) is defined by TREVI Group as profit/losses for the period gross of financial revenue and expenses and taxes.(14)The entry, financial revenue/ (expenses), is the sum of the following items: financial revenue (Note 30) and (financial expenses) (Note 31).
The gross operating pro�t was Euro 112.3 million (-5.6%), a margin of 10.1% of revenues; in the preceding �nancial year it was Euro 118.9 million, a margin of 11.2%. After depreciation of Euro 49.2 million and provisions of Euro 15.6 million, the operating pro�t fell 31.5% to Euro 47.5 million (4.3% of total revenues); in 2011 the operating pro�t was Euro 69.3 million (6.5% of total revenues).
Traditional Drillmec Rig - India
Key financial figures of the Group
10


Net �nancial costs were Euro 21.6 million, an increase of approximately Euro 3.9 million compared to the previous �nancial year. Net exchange rate losses were Euro 4.865 million. The pre-tax pro�t was Euro 20.9 million (Euro 51.3 million in the previous �nancial year).The net pro�t (net of current, deferred and pre-paid taxes) after deduction of non-controlling interests gave a net pro�t attributable to the Group of Euro 10.8 million (Euro 25.7 million in the previous �nancial year).
The breakdown of total revenues by geographic region showed that revenues generated in Italy were approximately 9.4%, down 14.5% compared to 2011. The percentage of revenues generated in the Middle East and Asia increased 16.5%, going from Euro 167 million in 2011 to Euro 194.6 million in the �nancial year under review, and accounted for approximately 17.4% of total revenues. There was also an increase of 63.9% year-on-year in revenues from Africa, which accounted for approximately 9.9% of total revenues. In South America there was a decrease in revenues of Euro 43.4 million from Euro 328.1 million in 2011 to Euro 284.million in the �nancial year under review (25.5% of total revenues). There was also an increase in North American
Ricavi Euro mln
3662005
2006
2007
2008
2009
2010
2011
2012
0 100 200 300 400 500 600 700 800 900 1000 1100
498
642
842
1069
1036
953
1061
1115
EBIT %EBIT EBITDA %EBITDA
5.8%
9.0%
12.4%
11.9%
11.3%
8.8%
6.5%
4.3%
11.1%
13.3%
15.9%
15.6%
17.6%
14.4%
11.2%
10.1%
0 5% 10% 15% 20% 25% 30%
55
86
134
166
182
137
119
112
29
58
104
128
117
84
69
47
Key financial figures of the Group
12
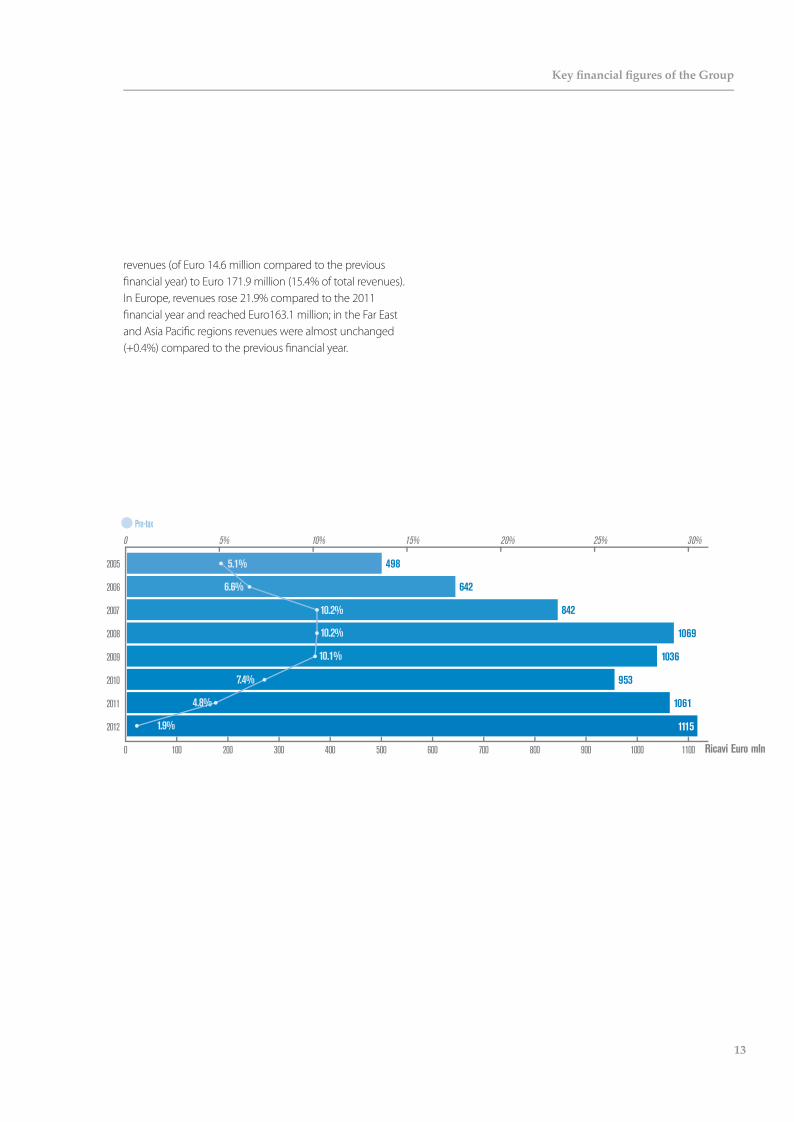
revenues (of Euro 14.6 million compared to the previous �nancial year) to Euro 171.9 million (15.4% of total revenues). In Europe, revenues rose 21.9% compared to the 2011 �nancial year and reached Euro163.1 million; in the Far East and Asia Paci�c regions revenues were almost unchanged (+0.4%) compared to the previous �nancial year.
Ricavi Euro mln0 100 200 300 400 500 600 700 800 900 1000 1100
2005
2006
2007
2008
2009
2010
2011
2012
0 5% 10% 15% 20% 25% 30%
1.9%
5.1%
6.6%
10.2%
10.2%
10.1%
7.4%
4.8%
Pre-tax
498
642
842
1069
1036
953
1061
1115
13
Key financial figures of the Group

9%
15%
15%
26%
17%
8%
Italy
Europe (ex. Italy)U.S.A. and Canada
Latin AmericaAfrica
Middle East and Asia
Far East and Rest of the World10%
TREVI GROUPREVENUES BY GEOGRAPHICAL AREA AND BY PRODUCTION SEGMENT
(Euro ‘000)
Geographical area 31/12/2012 % 31/12/2011 % Change Italy 104,606 9.4% 122,282 11.5% (17,676) -14.5%Europe (ex-Italy) 163,083 14.6% 133,749 12.6% 29,334 21.9%USA and Canada 171,933 15.4% 157,341 14.8% 14,592 9.3%Latin America 284,719 25.5% 328,146 30.9% (43,427) -13.2%Africa 110,733 9.9% 67,557 6.4% 43,177 63.9%Middle East & Asia 194,592 17.4% 167,015 15.7% 27,577 16.5%Far East and Rest of the World 85,657 7.7% 85,337 8.0% 320 0.4%TOTAL REVENUES 1,115,324 100% 1,061,427 100% 53,897 5.1%
Key financial figures of the Group
14

MR rigs in assembly at Drillmec Inc. USA
The breakdown of total revenues by production segment was as follows:Production segment 31/12/2012 % 31/12/2011 % Change Change %Special foundations services 453,416 41% 404,335 38% 49,081 12.1%Drilling services 109,090 10% 98,608 9% 10,482 10.6%Interdivisional eliminations and adjustments (4,370) (7,496) 3,126 Sub-total of Special Foundations and Drilling Services Division 558,136 50% 495,448 47% 62,689 12.7%Manufacture of machinery for special foundations work 236,264 21% 221,969 21% 14,295 6.4%Manufacture of machinery for oil, gas and water drilling 348,932 31% 378,825 36% (29,893) -7.9%Interdivisional eliminations and adjustments (2,001) (4,112) 2,111 Sub-total of Mechanical Engineering Division 583,195 52% 596,683 56% (13,487) -2.3% Parent Company 13,455 13,136 318 2.4%Interdivisional and Parent Company eliminations (39,463) (43,840) 4,377
TREVI GROUP 1,115,324 100% 1,061,427 100% 53,897 5.1%
15
Key financial figures of the Group

Consolidation of tunnels for the new railway line of Palermo - Italy
Key financial figures of the Group
16

TREVI GROUPConsolidated Statement of Financial Position
(Euro ‘000)
31/12/2012 31/12/2011 change %
A) Fixed Assets
- Tangible �xed assets (15) 339,471 339,635 (164)
- Intangible �xed assets 28,025 20,553 7,472
- Financial �xed assets (16) 8,479 8,224 255
375,975 368,412 7,563 2.1%
B) Net working capital
- Inventories 493,317 480,629 12,688
- Trade receivables (17) 345,839 427,431 (81,592)
- Trade payables (-) (18) (209,702) (338,821) 129,119
- Pre-payments (-) (19) (153,221) (85,333) (67,888)
- Other assets/ (liabilities) (20) 12,382 7,973 4,409
488,615 491,878 (3,263) -1%
C) Invested capital less liabilities for the period (A+B) 864,590 860,290 4,300 0.5%
D) Post-employment bene�ts (-) (19,335) (17,926) (1,408) 8%
E) NET INVESTED CAPITAL (C+D) 845,255 842,365 2,890 0.3%
Financed by:
F) Group net shareholders’ funds 419,339 425,811 (6,472) -2%
G) Share of net shareholders’ funds attributable to non-controlling interests 12,549 12,076 473
H) Net debt (21) 413,367 404,477 8,889 2%
I) TOTAL SOURCES OF FINANCING (F+G+H) 845,255 842,365 2,890 0.3%
The Statement of Financial Position above, referred to in the Notes, is a reclassified summary of the Consolidated Statement of Financial Position.
(15) The entry for tangible fixed assets also includes investment property (Note 3).(16) The entry for financial fixed assets includes investments (Note 4) and other non-current financial assets (Note 7).(17) Trade receivables includes: non-current (Note 9) and current (Note 11) trade receivables and current receivables from subsidiaries (Note 11).(18) Trade payables includes: current payables to suppliers (Note 20), current payables to associates (Note 20).(19) Pre-payments include both non-current pre-payments (Note 20) and current pre-payments (Note 20).Other assets/ (liabilities) includes: other payables/ (receivables), accruals/ (prepayments), tax credits/ (payables), both non-current and current risk provisions (Notes 5-9-11-11.a-16-19-21-25).(21) The net financial position, used as an indicator of financial indebtedness, is the sum of the following positive and negative entries in the Statement of Financial Position:
− current and non-current positive items: cash and cash equivalents (cash, bank accounts and bank assets); readily realizable investments in working capital, financial receivables;− current and non-current negative items: bank debt, payables to other financial entities (leasing and factoring companies) and payables to shareholders for financing. Further details on this item are given in the relevant table in the Notes to the Accounts.
17
Key financial figures of the Group

Foundation works for Kempinski Hotel - Saudi Arabia
Reconciliation of the Reclassi�ed Statement of Financial Position with the Consolidated Statement of Financial Position in accordance with IAS 11:
(Euro ‘000)
Net working capital 31/12/2011 IAS 11 31/12/2011 31/12/2012 IAS 11 31/12/2012 - Inventories 480,629 (90,482) 390,147 493,317 (140,993) 352,324
- Trade receivables 427,431 69,099 496,530 345,839 65,807 411,646
- Trade payables (-) (338,821) (338,821) (209,702) (209,702)
- Pre-payments (-) (85,333) 2,718 (82,615) (153,221) 71,845 (81,376)
- Other assets/ (liabilities) 7,973 18,665 26,637 12,382 3,340 15,722
Total 491,878 0 491,878 488,615 0 488,615
Net invested capital was approximately Euro 845 million, an increase of Euro 2.9 million compared to the �gure at 31 December 2011 with net working capital (-1%) and �xed assets (+2.1%) almost unchanged year-on-year. Group net equity decreased approximately Euro 6.5 million (-2%). The Group net pro�t impacted this �gure for Euro 10.8 million and there was also a negative impact from the translation reserve (of approximately Euro 6.9 million) mainly due to the depreciation of the US dollar (and of currencies linked to the US dollar, in particular the United Arab Emirates dirham) against the Euro.
Key financial figures of the Group
18

2005 2006 2007 2008 2009 2011 201220100x
1,0x
2,0x
3,0x
4,0x
100
0
200
300
400
500
Euro
mln
413
126
176143
316
444
396 404
2.05x2.28x
1.90x
2.44x2.88x
3.39x
1.06x
3.70x
PFN PFN/EBITDA
TREVI GROUPConsolidated Net Financial Position
(Euro ‘000)
31/12/2012 31/12/2011 change
Current debt (332,854) (258,127) (74,728)
Payables for other current �nancing (28,477) (18,292) (10,184)
Current �nancial derivatives 30 (2,482) 2,512
Cash and cash equivalents 189,925 162,615 27,310
Total current �nancing (171,376) (116,286) (55,090)
Non-current debt (188,888) (231,217) 42,329
Payables for other non-current �nancing (50,684) (55,878) 5,194
Non-current �nancial derivatives (2,418) (1,096) (1,323)
0
Total non-current �nancing (241,991) (288,191) 46,200
Net debt (413,367) (404,477) (8,890)
Treasury shares 519 694 (175)
Net Financial Position (412,848) (403,783) (9,065)
Compared to 31 December 2011, there was an increase in current debt of approximately Euro 55.1 million, taking the �gure from Euro 116.3 million to Euro 171.4 million.In the same period, non-current debt fell by Euro 46.2 million, moving from Euro 288.2 million to Euro 241.9 million. The total net �nancial position, which includes treasury shares held, deteriorated by Euro 9.1 million in 2012. The net debt/equity ratio was 0.96x.
Free cash �ow (22) was Euro 26.7 million (compared to negative free cash �ow of Euro 27.5 million in 2011) and was impacted by investments in tangible and intangible �xed assets, net of exchange rate translation e�ects, of approximately Euro 59.7 million (Euro 62.5 million in 2011) and a Euro 3.3 million decrease in working capital; the Net debt/Ebitda ratio was 3.68x (3.39x at 31 December 2011).
(22) “Free Cash Flow” is not defined by the IFRS but has been used by the TREVI Group from the Consolidated Financial Statements at 31 December 2005; it is a financial and Statement of Financial Position indicator calculated by subtracting the taxes paid in the period, provisions made, depreciation, the changes in net working capital and the gross investments for the period from the EBIT for the financial period.
19
Key financial figures of the Group
InvestmentsGross investments in tangible �xed assets by the TREVI Group were approximately Euro 58.8 million in 2012 due to acquisition of plant and machinery mainly for the engineering and oil drilling services division.The largest investments were those made in Latin America, the United States, Europe and Africa.The investments for the new hydromill models destined for the Middle East were included in semi-�nished tangible �xed assets for internal use.Divestments were Euro 22 million at historical cost for assets almost entirely depreciated. Depreciation of tangible and intangible �xed assets totalled Euro 49.2 million. There was a negative impact of Euro 3 million on the �gure of Euro 339.5 million for net tangible �xed assets at 31 December 2012; this derived from translation losses on the di�erence between historic exchange rates and those prevailing at 31 December 2012.
Research and DevelopmentIn 2012 Soilmec reaped the bene�ts of the investments made in the previous three years in the sector of hydromills: trials reached a depth of 250 metres. These tests, certi�ed by several universities, opened up new areas in the drilling sector: for example, securing old dams, which to date had been unthinkable with existing technology, could now be considered.The substitution of motorizations continued with the addition of new product lines to the TIER IV motorization range. Research was also carried out that will lead in 2013 and in future years to the development of new models to substitute those currently in use. These new products are not only dictated by the need to bring motors in line with TIER IV requirements but also by a desire to incorporate the new technologies in the sector. In 2013, the SR-45 and the new SR-30 will both be introduced. In 2014 the new SR-90, SR-100, SR-40, SR-60 and SR-80 models will all be launched. This means that Soilmec is always present on the market with innovative products that o�er better performance and can combat the competition, which is often price based.Despite having entered the crane sector relatively recently, the Soilmec products are now capable of facing the numerous
and aggressive competitors in the sector. The pro�tability of the cranes can be enhanced by being combined with hydromills, providing a product that o�ers greater pro�tability. The Group’s cranes are also evolving and, following the recent launch of the SC-90 on the market, the SC-135 will be launched followed by the SC-70 and SC-80. The market is expected to grow particularly for high tonnage cranes as these can be combined with hydromills.
Key financial figures of the Group
20
SECTOR REVIEWParent Company performanceThe 2012 Financial Statements, prepared by the Parent Company in accordance with IAS/IFRS accounting principles, showed revenues from sales and services of Euro 10.941 million (a decrease of Euro 0.245 million compared to the �gure of Euro 11.186 million in the previous �nancial year), �nancial income of Euro 21.200 million (a decrease of Euro 0.901 million compared to the �gure of Euro 22.101 million the preceding year) and pro�t for the year of Euro 9.023 million (a decrease of Euro 4.383 million compared to the Euro 13.406 million of 2011).Activities carried out by the Parent Company, in addition to plant and equipment hire, include planning, research and development, operational and administrative management support, human resources and personnel services, IT and integrated business software services, management of Group communications, and all services connected to its main activity as the industrial parent company of the TREVI Group (management of investments and �nancing agreements with subsidiaries).There was decrease in income from investments (Euro 6.878 million in 2012 compared to Euro 11.790 million in the 2011 �nancial year, a decrease of Euro 4.912 million, due to the dividend pay-out from Drillmec S.p.A.) but an increase in interest received from �nancing agreements between the Company and its subsidiaries (Euro 14.313 million in 2012 compared to Euro 10.303 million in 2011, an increase of Euro 4.010 million), mainly due to both an increase in the number of �nancing agreements between the Company and its subsidiaries and in the relative interest rates in line with market conditions.Tax payable by the Company increased. Gross investments in tangible �xed assets under construction and pre-payments were Euro 1.229 million in the period under review: these were pre-payments to acquire land and industrial buildings in Via Larga in Pievesestina (Forlì-Cesena) adjacent to the manufacturing facilities of Soilmec S.p.A. and Trevi S.p.A., to extend the registered o�ces of these subsidiaries. The land was acquired in February 2013. As regards directly-held investments, there was an increase in the investment in the subsidiary TREVI Energy S.p.A., which is active in the research, development and generation of energy
from renewable sources, mainly wind energy, for a payment of Euro 0.645 million on account of a future share capital increase to support the important development plan of the company. In 2012, the Company subscribed to a Euro 20 million share capital increase in its subsidiary Soilmec S.p.A. (the share of the Company was Euro 19,979,004) to support the latter’s development plan; the equity subscription was made from payments for future share capital increases made in the previous �nancial year and resulted in no change in the carrying value of the investment. The Shareholders’ Meeting of 27 April 2012, in accordance with the approval given at prior Shareholders’ Meetings, renewed the authority given to the Board of Directors to purchase and sell up to a maximum of 2,000,000 treasury shares. In the �nancial year under review, 14,000 treasury shares were acquired for a total of Euro 0.057 million. At 31 December 2012, the Company held 128,400 treasury shares for a total investment of Euro 0.751 million.Guarantees given to credit institutions totalled Euro 311.498 million at 31 December 2012 compared to Euro 301.239 million in the previous �nancial year, an increase of Euro 10.259 million mainly due to the increase in business in various countries, to the signing of medium/long-term �nancing by subsidiaries and to the use of credit lines, mainly for trade guarantees, concentrated in the Parent Company.Guarantees given to insurance companies totalled Euro 68.514 million at 31 December 2012 compared to Euro 75.087 million in the previous �nancial year, a decrease of Euro 6.573 million, mainly for guarantees given to subsidiaries for existing contracts; these guarantees decrease in direct relation to the remaining work to be carried out at the end of each �nancial year.The Explanatory Notes to the Financial Statements provide detailed information on individual entries in the Financial Statements.The table below is a reconciliation of the results for the period and the net equity of the Group with the �gures of the Parent Company (DEM/6064293 of 28 July 2006).
21
Key financial figures of the Group

During the �nancial period under review, the independent Director, Mr Franco Mosconi, resigned due to the increase in his academic and professional commitments; his resignation was e�ective from 1 June 2012. At its meeting of 14 November 2012, the Board of Directors under Article 2386 of the Italian Civil Code co-opted Ms Monica Mondardini to the Board; she will remain in o�ce until the next ordinary shareholders’ meeting. The new Director accepted the position on this date and is an independent, non-executive Director.
Special Foundations and Drilling Services DivisionThe Special Foundations and Drilling Services Division had total revenues of Euro 558.1 million (+12.7% year-on-year).
Reconciliation of the Parent Company Net equity and Results with the Consolidated Financial Statements (Euro ‘000)
Description Net equity at al 31/12/12
Net result
TREVI-Finanziaria Industriale S.p.A. 148.266 9,023
Di�erence in net equity of consolidated investments and their carrying value in the Parent Company accounts and the application of uniform accounting standards 336,857 52,818
Elimination of revaluations/(impairment) of consolidated investments and dividends 0 (49,329)
Adjustment for intragroup margins and gains (40,156) (3,831)
Tax adjustment on consolidation and other adjustments (2,790) 2,818
Translation di�erence (10,289) 0
Net equity and result for the period 431,888 11,499
Net equity and result for the period attributable to non-controlling interests 12,549 696
Net equity and result for the period attributable to the Group 419,339 10,803As regards the Company activities, we would highlight that:On 12 August 2012 the Law of 12 July 2011, no. 120 was enacted; this amended Articles 147 ter, 147 quater and 148 of Legislative Decree of 24 February 1998, no. 58, regarding gender balance in the administrative and control bodies of listed companies. At its meeting on 2 August 2012, the Board of Directors amended the Company’s Articles of Association to conform to the law on gender balance and to adhere to the binding criteria regarding gender balance.
Value added was 42.4% of revenues. The gross operating pro�t was Euro 80.6 million. After depreciation of Euro 35.5 million and provisions of Euro 13.9 million, the operating pro�t was Euro 31.1 million, approximately 5.6% of revenues.
The AmericasIn 2012, the revenues of the Special Foundations and Drilling Services Division in North America were Euro 82.1 million and accounted for approximately 14.7% of total segment revenues (Euro 89.4 million the previous �nancial year).The outlook for the US market remains positive in 2013 and �nancing for some large federal projects is expected to be forthcoming. The American business unit is almost exclusively involved in infrastructure projects: the extraordinary repair contract for the Wolf Creek Dam in Kentucky has been
Key financial figures of the Group
22

completed successfully and almost one year ahead of schedule. There are also some civil construction contracts underway in the state of New England.
In Latin America, the special foundations division of TREVI Group executed contracts in Argentina, Venezuela, Colombia, and Panama for a total of approximately Euro 76 million. In Argentina the business continues to grow and the main contracts include the maritime works for the Profertil docks and the port of Exolgan in Buenos Aires (Bocas 4). Several mineral prospecting contracts in the Andes were also acquired. In Central America, the Trevi division is involved in special foundations work mainly for the Panama Canal. The trend in contracts is also positive in Colombia with numerous projects underway that include the Centro Bacatà project, pilings for the Sogamoso (Group 3) viaduct project on the Ruta del Sol. In Lima (Peru) pilings were installed for the Metro; in Venezuela the most important contracts include the extension of the re�nery at Puerto La Cruz, line 2 of the Los Teques Metro and the Valencia Metro. The oil drilling activities in Venezuela, Peru, Argentina, Brazil and Colombia on behalf of Petrobras, RepsolYPF, Chevron Texaco and PDVSA generated revenues of Euro 109 million in the 2012 �nancial year, an increase compared to the �gure of Euro 91 million in 2011. Since the start of 2012, the Petreven division has been operating fourteen drill rigs on long-term contracts on behalf of the aforementioned clients; this generated signi�cant revenues of Euro 109.1 million (+10.6% year-on-year) and a strong increase in pro�tability.
Europe This area generated revenues of Euro 113.4 million (+22% compared to 2011). The order portfolio increased due to the special foundations and consolidation contracts for the CITYRINGEN METRO PROJECT of Copenhagen for the Copenhagen Metro Team, which is building one of the most modern and advanced urban transport infrastructures in the world. The contract is for special foundations for the seventeen stations on the new stretch of the underground system. In the domestic market, the 2012 performance of this sector was conditioned by uncertainties, the lack of con�dence and a lack of cash �ow in all sectors of the economy and, in particular, the construction sector. Given this environment, the choice of commercial counterparts becomes a fundamental aspect of the business. It is necessary to choose solid and trustworthy partners capable of coping with the current
di�culties in order to avoid any diseconomies of scale that would a�ect the pro�tability of any contract undertaken. Due to its international and domestic importance and prestige, the company has made an impact in the management of contracts and clients. However, the deterioration in the circumstances of various companies cannot be denied and this has led management to focus its e�orts on acquiring contracts directly from the Public Administration rather than acting as a sub-contractor. There is considerable satisfaction with the signi�cant order portfolio, which has registered a di�erent trend from the decline in macroeconomic �gures. This is primarily due to the directly acquired Public Administration contracts: these include the new docks for the Port Authority of Naples and the contracts for the 106 Jonica state highway at Gioiosa for ANAS. These contracts, which were acquired through temporary consortia, were started towards the end of the year under review and will generate revenues in 2013 thereby ensuring that the 2013 budget is achieved. To these must be added important contracts acquired as a sub-contractor, which are already in progress: these include the Palermo railroad link and the automatic underground system in Turin. Several signi�cant contracts were completed in 2011 that included the Cavallo tunnel at Senigallia, part of the widening of the A14 Bologna-Taranto motorway. There was also the contract to secure the cruise ship Costa Concordia lying o� the Isola del Giglio; this contract was awarded by an international consortium to Trevi because of its know-how and the international recognition of its technological prowess and is achieving the desired operational and industrial aims to the great satisfaction of the client.
AfricaThe Special Foundations and Drilling Services Division generated revenues of approximately Euro 84 million. In West Africa it is involved in the construction of foundations for new railway lines and for new maritime ports.In Algeria the Group continued to work with long-standing clients on the Algiers underground, the East-West motorway and was awarded new projects in deep piling (the Trans Rhumel - Constantine viaduct) and in consolidation work. The outlook remains positive given the leadership position the Company has acquired in almost �fteen year of continuous presence in the country.
Middle EastIn 2012, the Special Foundations and Drilling Services Division had revenues of almost Euro 71 million (Euro 69 million in
23
Key financial figures of the Group

2011) in the Middle East. Once again there was a negative performance in the UAE, which is likely to continue in the next few years. In Qatar there are important opportunities coming from investments in manufacturing and transport. Despite the ferment in the Saudi Arabian market, contracts are slow to be awarded although this market is still expected to o�set in part the medium-term fall in contracts from neighbouring markets. There has also been intense commercial activity in other Middle Eastern countries which is expected to give results in the short-term.In Kuwait, the Group is involved in a contract to construct a raised ring road around Kuwait City.
Mechanical Engineering Division: construction of special foundations and drilling equipment
In 2012 the Mechanical Engineering Division had total revenues of Euro 583.2 million, almost unchanged compare to the previous �nancial year (-2.3%). The gross operating pro�t was Euro 31.7 million, a margin of 5.4% of total segment sales. The operating result was Euro 16.5 million, 2.8% of total segment revenues (-53.1% compared to the previous �nancial year). The fourth quarter of 2012 proved to be a turning point as total segment revenues rose from Euro 104.6 million in the third quarter to Euro 154.5 million in the fourth quarter. The gross operating margin went from a negative �gure of 1.2% to a positive �gure of 12.4%. Net debt fell Euro 70 million.
Soilmec Despite the international environment, Soilmec managed to exceed the revenues of the previous year (+6.4%). The breakdown of revenues shows signi�cant revenues from North America and the Middle East. Revenues stagnated in Europe, including Italy, except for those from East Europe.Most revenues continue to be generated by medium-sized equipment and there was also stability in sales of the Micropile.
Equipment availability remains a problem as the clients of Soilmec have increasing di�culties scheduling their work and therefore require equipment to be immediately available. In addition, many strategic components of Soilmec equipment require long lead times. In this di�cult context, management is focused on containing and reducing inventories and, in general, all aspects of working capital.
Drillmec In 2012, Drillmec had total revenues of approximately Euro 348.9 million (-7.9%). The performance of the Drillmec division was impacted by �nancial and economic problems that were primarily linked to the cancellation of an important contract in Turkey. In the second semester 2012, there was a substantial recovery in the market and a new impetus to investments in the oil sector, which contributed to the improvement in the �nancial situation and has provided a much more positive outlook for 2013. However, it was still a di�cult year and this has led the Company to evaluate conservatively every contract and to give greater emphasis to �nancial cover rather than delivery times and inventories. The projects in Belarus and South America having generated important commercial results and have led to an expansion of the company’s commercial horizons eastwards to countries like Russia, Belarus and Ukraine and, in South America, particularly to Mexico, Colombia and Brazil. The water sector has also been a�ected by the international �nancial squeeze which, in an already poor sector, has had an even greater impact but there is the prospect of some interesting returns in 2013 given some important negotiations that are underway. The 2013 portfolio promises a very good year as some important contracts with leading counterparts were signed in the �nal two months of 2012 that should cover production for almost nine months. The 2013 outlook for the division is for a strong recovery in oil & gas investments following the important orders acquired in the �nal months of 2012. The di�cult economic situation of countries, particularly those in the Eurozone, should start to stabilise in the second semester of
Key financial figures of the Group
24

2013, leading to a recovery in credit support for exports. The Company expects that Eastern countries and South America will provide important commercial markets and that it will introduce its advanced technological equipment in countries where its presence is already consolidated.
TREVI Energy S.p.A. The establishment and growth of this company, active in the sector of renewable energy, re�ects TREVI Group’s desire to adapt some of the technologies that have already been developed and tested in its special foundations and drilling businesses to this sector and to develop new speci�c and innovative technological systems for a sector that is expected to have strong future growth.As part of the development of the wind energy sector, research and innovation has focused not just on the o�-shore segment but, since 2010, also on the on-shore segment. Feasibility studies have been done for on-shore farms mainly located in Puglia. In addition to the development of possible concessions, the design and construction of a prototype large dimension wind turbine for areas with medium or low strength winds has continued.
Group related-party transactions with non-consolidated subsidiaries, associates and controlling companies, companies controlled by the latter and with other related partiesTREVI – Finanziaria Industriale S.p.A. has limited relations with So�tre S.r.l., a company controlled 100% by the Trevisani family, and with the companies it controls, which are mainly involved in the construction and management of car parks. In the accounting period under review, this relationship gave rise to revenues of Euro 2.394 million, costs of Euro 0.095 million and, at 31 December 2012, receivables of Euro 3.888 million and payables of Euro 0.102 million. Transactions with related companies are done at normal market conditions.There are no �nancial or capital relations with the Italian parent company, Trevi Holding SE, and any relations with non-consolidated subsidiaries and associate companies, described in Note 35 to the Consolidated Financial Statements, are not material.
Risks and uncertaintiesExchange rate and interest rate riskDue to its international structure, the Group is subject to market risks from exchange rate and interest rate �uctuations. It has a policy for covering �nancial risks, which includes �xed term currency contracts and �nancing and hedging in foreign currencies to cover expected cash �ows at pre-established rates. Detailed information on the transactions to hedge exchange rates and the valuation criteria adopted for these are given in the Notes to the Financial Statements.
Credit risksThe sector and geographical diversi�cation of the Group means that it has no signi�cant concentration of credit risk. Where possible, the Group demands suitable guarantees and also sets up ad hoc procedures to monitor constantly trade receivables. Liquidity risksThe Group aims to maintain a balance between liquidity demand and supply using suitable bank �nancing. In particular, the Group has signed long-term �nancing agreements aimed at covering its investment programme and business development.
Risks pertaining to business activities abroadThe Group is exposed to the typical risks of doing business internationally; these include risks pertaining to local political and economic instability and risks related to changes in the macro-economic, �scal and legislative environments. Identifying new initiatives for the Group in foreign countries is always preceded by a careful appraisal of such risks, which are then constantly monitored. It should be stressed that the activities of the Group are concentrated mainly in countries covered by international insurance or where bilateral agreements exist between the Italian government and the local government.
25
Key financial figures of the Group
Use of estimates The special foundations segment operates with contracts where payment is determined at the time the contract is awarded. Any higher costs that the Group incurs or su�ers in executing these contracts must be met by the Group but may be recouped from the client according to the laws and/or conditions contractually agreed. Consequently, the margins made on such contracts may vary from the original estimates.
Risks pertaining to �uctuations in the cost of raw materials The �uctuations, in some cases signi�cant, in the costs of some raw materials can lead to an increase in production costs, which, however, the Group tends to o�set by a diversi�ed supply policy, framework agreements with strategic suppliers, and contractual clauses for revising prices. It should also be mentioned that sales of drill rigs are subject to the investment policies of leading oil nationals or companies, which are themselves in�uenced by the trend in the oil price.
PersonnelThe Group has always focused on personnel management; employee loyalty is encouraged by a high degree of involvement, by the remuneration system, continuous and speci�c training, the attention paid to the work environment and, for expatriate employees, a focus on the living environment not only of the employee but wherever possible of the entire family. Given the business of the Group, personnel training is done through a dedicated structure called the TREVI Academy, and also through “on the job” training and through speci�c training courses; the work environment is free of con�ict. Further details are given in the Report on Remuneration, prepared in accordance with Article 123-ter of Legislative Decree of 24 February 1998 no. 58 and available as required by enacted law at the registered o�ce of the Company, at Borsa Italiana SPA and on the Company website www.trevi�n.com.
Environmental awareness and the health and safety of personnelEnvironmental awareness and the health and safety of personnel have always been among the top priorities of the Group. The Group constantly strives to maintain a work environment that is safety conscious and to provide personnel, according to their roles, with all the equipment necessary to avoid any risk or danger to their persons. The Group maintains its production facilities, o�ces and operating systems in accordance with required safety standards. The Group also acts in a way that preserves and protects the environment, respecting all environmental legislation, as well as the rules and procedures that the Group itself has drawn up. Lastly, security systems are used to guard Company property and, in particular, all forms of inventory.
Corporate Social ResponsibilityThe TREVI Group considers sustainability to be an integral part of its business as it represents a guarantee of long-term growth and value creation through the e�ective involvement of all stakeholders.In order to adhere to the Principles of Sustainability, the TREVI Group has chosen to adopt a Corporate Social Responsibility programme that is continually updated, monitored and agreed on by persons of all levels of responsibility.The nature, type and complexity of the Group businesses have always necessitated a particular focus on the environmental and social aspects of executing a project. Furthermore, the countries and regions in which the Group operates means it has always had a distinctive approach to sustainability in order to contribute to the socio-economic development of the regions in which it is present through an e�ective strategy of local content that mainly aims at local employment.There are numerous examples of collaborations and joint ventures in which the Group is involved that demonstrate its exceptional ability to adapt to the various local cultures and its considerable skill in project managing important contracts. Another strong point of the Group regarding local content
Key financial figures of the Group
26
is the ever-increasing diversity of its employees – a pool of young talent from a multitude of countries whose professionalism grows with that of TREVI on the various projects in which they are involved, either in their own countries or abroad, and where there are support structures like engineering and logistics centres for warehousing construction and worksite equipment.The call to behave responsibly and with integrity, contained in the Code of Ethics, and the reference to value creation is embedded in the corporate mission statement: “The mission of the TREVI Group is to design, manufacture and o�er innovative technologies and services for all types of foundations engineering projects”.
The Social Responsibility model adopted, which guides the Company strategies, re�ects these principles and may be articulated as follows:• Provide accurate and transparent reports to stakeholders
not only on the �nancial performance but also on the social, cultural and environmental results of the Company’s activities.
• Contribute to the development of reference communities through investments in cultural, sporting, educational and social initiatives.
• Show increasing attention to the environment through a programme that monitors and helps reduce the environmental impact of the businesses.
• Contribute to the wellbeing of employees not only in the workplace but also, in the case of expatriates, focus attention on their living environment, logistic arrangements for their families and the education of their children.
The socially useful projects supported by TREVI Group include:• Italy – Donations to the earthquake fund of the Emilia
region and for local sporting, cultural and artistic initiatives• USA (Boston) – Donation to the Italian Home for Children• South America - Venezuela (Carupano) – Donation to the
Casa de la Caridad• South America - Argentina – Donation to the Comunidad
Educativa Nuestra Sra. Del Valle• South America – Argentina – Donation to RSE - T.A.C.A
(horse therapy)• South America – Argentina – Donation to the Nuestra
Señora de la Vida school• South America – Colombia – Donation to the Guillermo F
Morán College• Central America - Haiti – Donation for the management of
the new Haiti Nutritional Centre• Africa (Algeria) – Donation to Tlemcen Algerian National
Theatre and Palace of Culture• Africa (Cameroon) – Donation of water research and
drilling plant to the non-pro�t organisation of Treviso “l’Acqua è vita”
• Africa (Uganda and South Sudan) – Donation to Cooperazione e Sviluppo di Piacenza for the “Water for life” project
• Africa (Ethiopia) – Donation to St. Joseph Catholic School Jijiga, Somali Region
• UAE – Dubai – Donation to Rashid paediatric centre for children with special needs
• Asia – India – Donation to Vayalur orphanage• Asia – Philippines (Palawan) – Donation to Bahay Ni Nanay
Maddalena Starace, Inc. (abandoned, neglected and sexually abused children)
• Asia – Philippines – Camarines Sur – Donation to Missionaries of the Poor
• Asia – Philippines – Cavite – Donation to Sisters of Mary of Banneux (student scholarship programme)
• Asia – Philippines – Palawan – Donation to Sisters of St. Paul of Chartres (student scholarship programme)
• Asia – Philippines – Donation to ABS-CBN Foundation• Asia – Philippines – Donation to GMA Kapuso FoundationThese donations are aimed at demonstrating the focus and involvement of the Group in daily life and its ability to integrate the social dimension into its business activities.
27
Key financial figures of the Group

Outlook for 2013In the �nal quarter of 2012, the order portfolio rose 23% quarter-on-quarter mainly due to the acquisition of almost USD 500 million of new orders in the oil & gas sector. This will ensure full production capacity utilisation in the �rst nine months of 2013.The order portfolio in the core business also remains strong. However, it is necessary to highlight the execution problems for project schedules due to the reduced availability of credit in some markets and, in particular, in some European countries.
Internal DealingDuring 2012, there were three noti�cations of internal dealing which were for share purchases made by the Managing Director Gianluigi Trevisani.Details of each transaction are available on the Borsa Italiana S.p.A. website and on the Company website www.trevi�n.com.
Other informationIn accordance with Consob communication of 28 July 2006 no. DEM/6064293, it is stated that, in 2012, the TREVI Group did not carry out any atypical and/or unusual transactions, as de�ned in the Communication.
Signi�cant events after the end of the reporting periodThere were no signi�cant events after the end of the reporting period.
Report on Corporate Governance and on the Company’s Ownership StructureAt its meeting on 14 November 2012, the Board of Directors approved the adherence to the Self-regulatory Code of Conduct for Listed Companies drawn up by the Committee for Corporate Governance – Borsa Italiana S.p.A. in December 2011; prior to this date, the Company adhered to the Self-regulatory Code of Conduct of March 2006 (amended in March 2010).To ful�l the requirements of Article 123-bis of the Consolidated Finance Act, the Company has prepared a
“Report on Corporate Governance and on the Company’s Ownership Structure” , which has been made publicly available at the same time as the present Financial Statements at the registered o�ce of the Company, at Borsa Italiana and on the Company website www.trevi�n.com in the Investor Relations – Corporate Governance section, which also contains all documentation relating to the corporate governance of the Company; this communication is also deposited with Borsa Italiana pursuant to the rules.The Report for the 2012 �nancial year was approved by the Board of Directors at its meeting on 22 March 2013 and adheres to the indications given by Borsa Italiana S.p.A. in the Format per la Relazione sul Governo Societario e gli Assetti Proprietari, 4th edition – January 2013.
Report on RemunerationTo ful�l the regulatory requirements and to give shareholders further information for an understanding of the Company, a Report on Remuneration has been prepared, in accordance with Article 123-ter of the Consolidated Finance Act, which has been made publicly available at the same time as the present Financial Statements at the registered o�ce of the Company, at Borsa Italiana and on the Company website www.trevi�n.com in the Investor Relations – Corporate Governance section; this communication is also deposited with Borsa Italiana pursuant to the rules.The Report on Remuneration was approved by the Board of Directors at its meeting on 22 March 2013 and adheres to the indications of Consob Resolution no. 18049 of 23 December 2011, published in the Gazzetta U�ciale no. 303 on 30 December 2011.
Key financial figures of the Group
28
ADDITIONAL INFORMATIONSHARE CAPITALThe issued share capital of TREVI – Finanziaria Industriale S.p.A. at 31 December 2012 was Euro 35,097,150, fully paid-up comprising 70,194,300 ordinary shares each of nominal value Euro 0.50.
The company is controlled by Trevi Holding SE, which holds 34,000,000 ordinary shares, equal to 48.68% of the share capital.At 31 December 2012 (according to Consob data) shareholders, other than the majority shareholder, that were registered as having a shareholding in excess of 2% of the share capital were Oppenheimer Funds Inc. (USA) with 12.173%, Polaris Capital Management LLC (4.7066%), Henderson Global Investors Limited (2.105%), and Citigroup Inc. (2.092%).
Treasury shares or shares and investments in controlling shareholdersAt 31 December 2012 and at the date of these Financial Statements, the Company held 128,400 treasury shares, equal to 0.183% of the share capital; the Company does not own, directly or indirectly through any subsidiaries, shares and/or shareholdings in the controlling shareholder, Trevi Holding SE.
BranchesSince March 2004, the Company has had a branch in Venezuela for the activities of the consortium of Trevi S.p.A. (50%) - TREVI – Finanziaria Industriale S.p.A. (45%) - SC Sembenelli S.r.l. (5%), which won the contract from CADAFE in Venezuela for the repair of the Borde Seco Dam.
Procedures for related-party transactionsThe Company has approved the procedures for related-party transactions, prepared in accordance with Consob Rule no. 17221/2010 and subsequent amendments and additions.The Internal Audit Committee, entirely made up of independent Directors, was unanimous in their favourable
opinion on the procedures for related-party transactions.As required under the Rule, the Board of Directors set up a Committee for Related-Party Transactions from among its members; at the end of the reporting period and at the date of these Financial Statements, the committee is made of three independent Directors:Mr Enrico Bocchini - ChairmanMr Guglielmo Antonio Claudio MoscatoMr Riccardo Pinza
29
Key financial figures of the Group

The procedures for related-party transactions were implemented from 1 January 2011 and since 1 December 2010 have been available on the Company website www.trevi�n.com in the Corporate Governance section.In accordance with Consob Rule 11971 of 14 May 1999, information on shares in the Company and its subsidiaries owned by Directors and Standing and Supplementary Statutory Auditors is given below:
1. Nella TREVI – Finanziaria Industriale S.p.A.Name and surname Ownership No of shares held No. of shares No. of shares No. of shares held
at 31/12/11 acquired sold at 31/12/2012Trevisani Davide Directly held 1,220,575 1,220,575
Trevisani Gianluigi Directly held 180,640 50,000 230,640
Trevisani Cesare Directly held 90,452 90,452
Trevisani Stefano - -
Moscato Antonio Claudio - -
Monica Mondardini - -
Teodorani Fabbri Pio - -
Bocchini Enrico Directly held 1,000 1,000
Leonardi Adolfo - -
Alessandri Giacinto - -
Poletti Giancarlo - -
Daltri Giancarlo - -
Caporali Silvia - -
2. In the subsidiary Soilmec S.p.A., with a registered o�ce in Cesena (Forlì-Cesena), Via Dismano, 5819; Forlì – Cesena Business Register no. 00139200406, share capital of Euro 25.155 million fully paid-up and comprised of 4,875,000 ordinary shares each of nominal value Euro 5.16.
Name and surname Ownership No of shares held No. of shares No. of shares No. of shares heldat 31/12/2011 acquired sold at 31/12/2012
Trevisani Davide Proprietà 800 3.100 - 3.900
The 3,100 shares acquired were subscribed at the Extraordinary General Meeting of Soilmec S.p.A. as part of the share capital increase already mentioned in this Report.
Key financial figures of the Group
30

ACTIVITIES OF DIRECTION AND COORDINATIONIn accordance with Article 93 of the Consolidation Act, it is declared that, at 31 December 2012 and at the date the current Report was prepared, TREVI – Finanziaria Industriale S.p.A. is indirectly controlled by I.F.I.T. S.r.l. (a company with its registered o�ce in Cesena) and directly controlled by the Italian company Trevi Holding SE, a company controlled by I.F.I.T. S.r.l.With regard to Company data, pursuant to Article 2497 of the Italian Civil Code governing direction and coordination exercised by controlling companies, it is stated that at 31 December 2012 and at the date the current Report was prepared, no declaration had been made regarding direction and coordination exercised by controlling companies as the Board of Directors of TREVI – Finanziaria Industriale S.p.A. maintains that, while the corporate strategies and policies of the TREVI Group are indirectly controlled by IFIT S.r.l., the Company is both operationally and �nancially completely independent of the controlling company and has not carried out any corporate transaction in the interests of the controlling company either in 2012 or in any prior �nancial periods.
The Company, at the date the current Report was prepared, is the Parent Company of TREVI Group (and as such prepares the Consolidated Financial Statements of the Group), and exercises, in accordance with Article 2497 of the Italian Civil Code, direction and coordination of the activities of the companies it directly controls:• Trevi S.p.A., 99.78% directly held; • Soilmec S.p.A., 99.92% directly held;• Drillmec S.p.A., 98.25% directly held; (1.75% held by Soilmec S.p.A.);• Trevi Energy S.p.A., 100 % directly held;• Petreven S.p.A., 78.38% directly held (21.62% held by Trevi S.p.A.);
Proposed allocation of pro�t for the periodThe Board of Directors proposes that you:• approve each and every part and in its entirety the Preliminary Financial Statements
at 31 December 2012 as proposed and illustrated above;• that the pro�t for the year in the Financial Statements of TREVI – Finanziaria Industriale S.p.A., for the
�nancial year ended 31 December 2012, which was Euro 9,022,558, be allocated as follows:• 5%, Euro 451,128, to the legal reserve;• Euro 8,571,430 and the use of the reserve for retained pro�ts for Euro 553,829 for a total of
Euro 9,125,259 as a dividend distribution of Euro 0.13 per share to the shares ranking for dividend, with an ex-dividend date of 8 July and payment from 11 July 2013.
31
Key financial figures of the Group

Key financial figures of the Group
32

Dear shareholders,
We would like to thank all our employees, many of whom have worked with us for many years and who we know personally. Our main assets are their sense of responsibility, their initiative and organisational capabilities, their �exible responses to the new entrepreneurial challenges that the market continuously makes in the almost �fty countries in which TREVI Group has a long-term presence.
Cesena, 22 March 2013
For the Board of DirectorsThe Chairman
Mr Davide Trevisani
33
Key financial figures of the Group

Foundation works for the new Metro of Copenhagen – Denmark

CONSOLIDATED FINANCIAL STATEMENTSAT 31 DECEMBER 2012


37
Consolidated Financial Statements at 31 December 2012Consolidated Financial Statements at 31 December 2012
CONSOLIDATED FINANCIAL STATEMENTS CONSOLIDATED STATEMENT OF FINANCIAL POSITION(Euro ‘000)
ASSETS Note 31/12/2012 31/12/2011
Non-current Assets
Tangible Fixed Assets
Land and buildings 87,370 84,108
Plant and equipment 202,356 205,951
Industrial and commercial equipment 24,407 21,179
Other assets 21,993 21,016
Fixed assets under construction and pre-payments 3,345 7,381
Total Tangible Fixed Assets (1) 339,471 339,635
Intangible Fixed Assets
Development costs 10,066 6,846
Industrial patents 824 910
Concessions, licences, brands 799 803
Goodwill 6,001 6,001
Fixed assets under construction and pre-payments 7,338 4,645
Other intangible �xed assets 2,996 1,347
Total Intangible Fixed Assets (2) 28,025 20,553
Investment property (3) 0 0
Investments (4) 4,123 4,096
- investments in associates and joint-ventures valued at equity 1,388 813
- other investments 2,734 3,283
Tax assets for pre-paid taxes (5) 22,475 20,850
Non-current �nancial derivative instruments (6) 0 0
Held to maturity �nancial assets (7) 200 200
Other non-current �nancial receivables (8) 4,356 4,128
- of which with related parties (35) 2,545 2,405
Trade receivables and other non-current assets (9) 15,806 8,759
Total Financial Fixed Assets 46,959 38,033
Total Non-current Assets 414,455 398,221
Current Assets
Inventories (10) 352,322 390,147
Trade receivables and other current assets (11) 461,743 571,274
- of which with related parties (35) 17,496 14,585
Tax assets for current taxes (11a) 43,580 30,538
Current �nancial derivative instruments and trading instruments at fair value (12) 76 511
Cash and cash equivalents (13) 189,925 162,615
Total Current Assets 1,047,645 1,155,086
TOTAL ASSETS 1,462,100 1,553,307

Annual Report at 31 December 2012
38
CONSOLIDATED FINANCIAL STATEMENTSCONSOLIDATED STATEMENT OF FINANCIAL POSITION(Euro ‘000)
Shareholders’ Funds Note 31/12/2012 31/12/2011
Share capital and reserves
Share capital 35,033 35,040
Other reserves 105,868 109,465
Retained pro�ts including pro�t for the period 278,439 281,306
Group Net Shareholders’ Funds (14) 419,339 425,811
Net shareholders’ funds attributable to non-controlling interests 12,549 12,076
Total Net Shareholders’ Funds 431,888 437,887
LIABILITIES
Non-current Liabilities
Non-current debt (15) 188,888 231,217
Payables for other non-current �nancing (15) 50,684 55,878
Non-current �nancial derivative instruments (15) 2,418 1,096
Tax liabilities for deferred taxes (16) 30,362 34,088
Post-employment bene�ts (18) 19,335 17,926
Non-current provisions for risks and charges (16) 11,494 4,938
Other non-current liabilities (19) 22 44
Total Non-current Liabilities 303,202 345,187
Current Liabilities
Trade payables and other current liabilities (20) 335,615 463,948
- of which with related parties (35) 6,644 2,039
Tax liabilities for current taxes (21) 29,979 24,979
Current debt (22) 332,854 258,127
Payables for other current �nancing (23) 28,477 18,292
Current �nancial derivative instruments (24) 45 2,993
Current provisions (25) 38 1,893
Total Current Liabilities 727,009 770,233
TOTAL LIABILITIES 1,030,211 1,115,420
TOTAL NET SHAREHOLDERS’ FUNDS AND LIABILITIES 1,462,100 1,553,307
39
Consolidated Financial Statements at 31 December 2012Consolidated Financial Statements at 31 December 2012
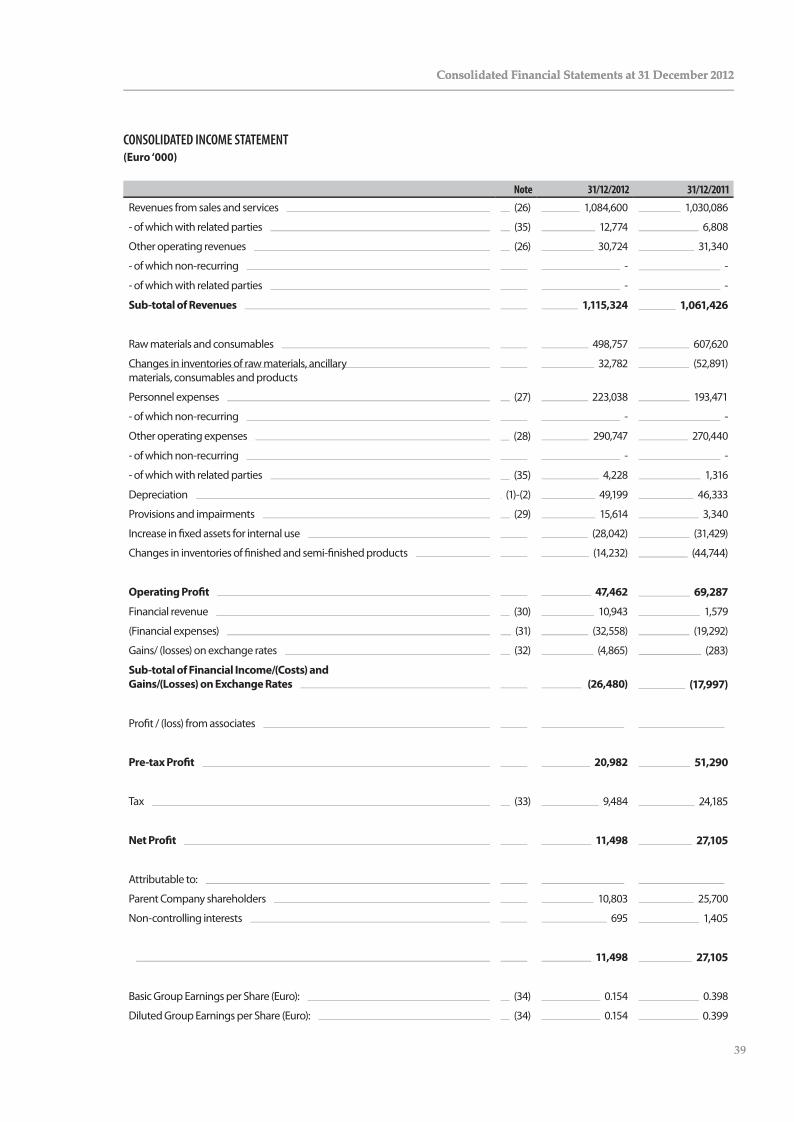
CONSOLIDATED INCOME STATEMENT(Euro ‘000)
Note 31/12/2012 31/12/2011Revenues from sales and services (26) 1,084,600 1,030,086
- of which with related parties (35) 12,774 6,808
Other operating revenues (26) 30,724 31,340
- of which non-recurring - -
- of which with related parties - -
Sub-total of Revenues 1,115,324 1,061,426
Raw materials and consumables 498,757 607,620
Changes in inventories of raw materials, ancillary materials, consumables and products
32,782 (52,891)
Personnel expenses (27) 223,038 193,471
- of which non-recurring - -
Other operating expenses (28) 290,747 270,440
- of which non-recurring - -
- of which with related parties (35) 4,228 1,316
Depreciation (1)-(2) 49,199 46,333
Provisions and impairments (29) 15,614 3,340
Increase in �xed assets for internal use (28,042) (31,429)
Changes in inventories of �nished and semi-�nished products (14,232) (44,744)
Operating Pro�t 47,462 69,287
Financial revenue (30) 10,943 1,579
(Financial expenses) (31) (32,558) (19,292)
Gains/ (losses) on exchange rates (32) (4,865) (283)
Sub-total of Financial Income/(Costs) and Gains/(Losses) on Exchange Rates
(26,480) (17,997)
Pro�t / (loss) from associates
Pre-tax Pro�t 20,982 51,290
Tax (33) 9,484 24,185
Net Pro�t 11,498 27,105
Attributable to:
Parent Company shareholders 10,803 25,700
Non-controlling interests 695 1,405
11,498 27,105
Basic Group Earnings per Share (Euro): (34) 0.154 0.398
Diluted Group Earnings per Share (Euro): (34) 0.154 0.399

Annual Report at 31 December 2012
40
CONSOLIDATED STATEMENT OF COMPREHENSIVE INCOME(Euro ‘000)
31/12/2012 31/12/2011
Pro�t/ (loss) for the period 11,498 27,106
Cash �ow hedge reserve (1,324) (903)
Tax 442 362
Change in cash �ow hedge reserve (882) (541)
Translation reserve (7,013) 11,253
Comprehensive income net of tax 3,602 37,818
Parent Company shareholders 2,973 36,109
Non-controlling interests 629 1,709
CONSOLIDATED STATEMENT OF CHANGES IN NET EQUITY(Euro ‘000)
DESCRIPTION Sharecapital
Otherreserves
Retainedpro�ts
Group shareof capital
and reserves
Non-controlling Interests’
share ofcapital and
reserves
Total shareholders’ funds
Balance at 01/01/2012 35,040 109,466 281,306 425,812 12,076 437,888
Pro�t for the period 10,803 10,803 695 11,498
Other comprehensive pro�ts/ (losses) (7,829) (7,829) (66) (7,896)
Total comprehensive pro�ts/ (losses) 0 (7,829) 10,803 2,974 629 3,603
Allocation of pro�t for 2011 and dividend distribution 4,280 (13,405) (9,125) (365) (9,490)
Change in area of consolidation (265) (265) 209 (56)
Acquisition of non-controlling interests 0
Sale/(Purchase) of own shares (7) (50) (57) (57)
Balance at 31/12/2012 35,033 105,868 278,439 419,339 12,549 431,888
Balance at 01/01/2011 32,000 57,069 265,088 354,157 12,351 366,508
Pro�t for the period 25,700 25,700 1,405 27,105
Other comprehensive pro�t/ (loss) 10,407 10,407 305 10,712
Total comprehensive pro�t/ (loss) 0 10,407 25,700 36,107 1,710 37,817
Allocation of pro�t for 2010 and dividend distribution 718 (9,038) (8,320) (396) (8,716)
Change in area of consolidation 0
Conversion of indirect convertible loan 3,097 41,908 45,005 45,005
Acquisition of non-controlling interests (444) (445) (1,587) (2,032)
Sale/(purchase) of own shares (57) (637) (694) (694)
Balance at 31/12/2011 35,040 109,465 281,306 425,811 12,076 437,887

41
Consolidated Financial Statements at 31 December 2012Consolidated Financial Statements at 31 December 2012
CONSOLIDATED STATEMENT OF CASH FLOWS(Euro’000)
Note 31/12/2012 31/12/2011Net income for the year 11,498 27,105
Income taxes for the year (33) 9,484 24,185
Pre-tax pro�t 20,982 51,290Depreciation (1)-(2) 49,199 46,333
Financial (income)/ expenses (30)-(31) 21,615 17,714
Changes in reserves for risks and costs, and for post-employment bene�ts (16)-(18) 3,954 (160)
Provisions for risks and costs, and for post-employment bene�ts (16)-(18) 10,857 9,650
Write-back of provisions for risks, and for post-employment bene�ts (16)-(18) (8,702) (6,720)
(Pro�t) / losses from associates 0 0
(Gains) / losses from sale or impairment of �xed assets (26)-(28) 1,471 2,289
(A) Cash Flow from Operations before Changes in Working Capital 99,377 120,397(Increase)/Decrease trade receivables (9)-(11) 84,884 (131,437)
- of which with related parties (35) (2,912) 8,651
(Increase)/Decrease inventories (10) 37,823 (97,219)
(Increase)/Decrease other assets 2,706 (32,473)
Increase/(Decrease) trade payables (20) (129,119) 147,714
- of which with related parties (35) 4,604 617
Increase/(Decrease) other liabilities 8,669 41,490
(B) Changes in Working Capital 4,962 (71,925)
(C) Cash out for interest and other expenses (30)-(31) (21,615) (16,410)
(D) Cash out for taxes (13) (16,113) (14,988)
(E) Cash Flow generated (absorbed) by operations (A+B+C+D) 66,611 17,074Investments Operating (investments) (1)-(2) (73,160) (72,370)
Operating divestments (1)-(2) 12,197 10,591
Exchange rate di�erences (1)-(2)
Net change in �nancial assets (4) (27) (1,905)
(F) Cash Flow generated (absorbed) by investments (60,991) (63,683)Financing activities Increase/(Decrease) in share capital for purchase of treasury shares and conversion of indirect convertible bond (14) (7) 44,311
Other changes including those in non-controlling interests (14) (5,014) 3,854
Increase/(Decrease) in debt, �nancing and derivative instruments (15)-(22) 25,471 47,101
Increase/(Decrease) in leasing liabilities (15)-(23) 4,990 (10,789)
Dividend distribution (13) (9,490) (8,716)
(G) Cash Flow generated (absorbed) from �nancing activities 15,949 75,760(H) Net Change in Cash Flows (E+F+G) 21,570 29,151
Opening Balance of Net Liquid Funds 161,648 132,499Net Changes in Liquid Funds 21,570 29,151Closing Balance of Net Liquid Funds 183,219 161,648
The Notes to the Financial Statements are an integral part of the Financial Statements.

Annual Report at 31 December 2012
42
Description Note 31/12/2012 31/12/2011Cash and cash equivalents (13) 189,925 162,615
Bank overdrafts (22) (6,706) (967)
Cash and cash equivalents net of bank overdrafts 183,219 161,648
The Notes to the Financial Statements are an integral part of the Financial Statements.
HH201 Cyber Drillmec Rig

NOTES TO THE 2012 CONSOLIDATED FINANCIAL STATEMENTS
(Tables in Euro ‘000)
Annual Report at 31 December 2012
44
Pro�le and Business of the GroupTREVI - Finanziaria Industriale S.p.A. (henceforth “the Company”) and the companies it controls (henceforth “TREVI Group” or “the Group”) is active in the following two sectors:• Foundation engineering services for civil works and infrastructure projects and oil drilling services (henceforth “Special
Foundations and Drilling Services Division”); • Manufacture of equipment for special foundations and drilling rigs for the extraction of hydrocarbons and water exploration
(henceforth the “Mechanical Engineering Division”). • These business sectors are organised within the four main companies of the Group: • Trevi S.p.A., which heads the sector of foundation engineering;• Petreven S.p.A., active in the drilling sector providing oil drilling services;• Soilmec S.p.A., which heads the relative Division manufacturing and marketing plant and equipment for foundation
engineering;• Drillmec S.p.A., which manufactures and sells drilling equipment for the extraction of hydrocarbons and water exploration. TREVI – Finanziaria Industriale S.p.A is controlled by Trevi Holding SE which, in turn, is controlled by I.F.I.T. S.r.l.. TREVI – Finanziaria Industriale S.p.A. has been listed on the Milan stock exchange since July 1999.
General presentation criteriaThese Financial Statements were approved and authorised to be made public by the Board of Directors on 22 March 2013. The Shareholders’ Meeting has the power to alter the Financial Statements as proposed by the Board of Directors.The 2012 Consolidated Financial Statements have been prepared and presented in accordance with the International Accounting Standards (“IFRS”) issued by the International Accounting Standards Board (IASB) and adopted by the European Commission and by the provisions of Article 9 of Legislative Decree no. 38/2005. By IFRS it is intended to include also all the International Accounting Standards (IAS) that have been reviewed and all the interpretations of the International Financial Reporting Interpretations Committee (IFRIC), previously known as the Standing Interpretations Committee (SIC). The Financial Statements are prepared using historic cost except for �nancial derivatives which are recognised at fair value.
Financial Statement accounts and tablesCompanies are considered subsidiaries when the Parent Company has the right directly or indirectly to exercise control over the management of the company and to obtain the bene�ts of its activities. Control is presumed to exist when the Group holds the majority of the voting rights; the de�nition of control also assumes any potential voting rights which at the date of the Financial Statements can be exercised.The �nancial statements of all the subsidiaries have the same year-end accounting date as the Parent Company, TREVI - Finanziaria Industriale S.p.A.The accounts of subsidiaries are consolidated using the line by line method from the time that control is acquired until such time as this control is relinquished. Line by line consolidation requires that the assets and liabilities, as well as the costs and revenues of the entities to be consolidated, are fully consolidated, attributing the share of the investments in net equity and the result for the period to the relevant entries of the Statement of Financial Position, Income Statement and Statement of Comprehensive Income.Under IAS27, the total loss (including the pro�t/loss for the period) is attributed to the shareholders of the controlling entity and non-controlling interests also when the net equity attributable to non-controlling interests is negative.The reciprocal debit/credit and cost/revenue relationships for companies within the area of consolidation and the e�ects of all signi�cant transactions among these companies are eliminated. Unrealised pro�ts with third parties deriving from intergroup transactions, including those from a valuation of inventories at the end of the reporting period, are eliminated.The carrying value of the investments in each subsidiary is eliminated for the corresponding amount of net equity of each of the subsidiaries including any eventual fair value adjustments for impairment at the date control was acquired. Goodwill at the acquisition date is calculated as described below and is recognised in intangible assets whilst any “pro�t from a bargain purchase (or negative goodwill)” is recognised in pro�t or loss.
Under IAS27, from 1 January 2010, the partial disposal of an investment in a subsidiary while control is retained is accounted for as an equity transaction with owners. In these circumstances, the carrying value of the increased or decreased investment is adjusted to re�ect the change of the investment in the subsidiary. Any di�erence between the value adjusted for non-controlling interests
45
Consolidated Financial Statements at 31 December 2012Consolidated Financial Statements at 31 December 2012
and the fair value of the acquisition price paid or received is recognised directly in equity and attributed to the shareholders of the parent company. On the loss of control of a business it:• derecognises the assets (including any goodwill) and liabilities of the subsidiary• derecognises the carrying amount of any non-controlling interests in the former subsidiary • derecognises the accumulated exchange rate di�erences in net equity• recognises the fair value of the consideration received • recognises any investment retained in the former subsidiary at its fair value• reclassi�es the gain or loss from equity to pro�t or loss • reclassi�es the share of the parent previously recognised in other comprehensive income to pro�t or loss or directly to retained
earnings, as appropriate.
Associate companies:Associate companies are those in which the Group exercises signi�cant in�uence but where it does not have operating control. It is deemed to have signi�cant in�uence when it holds an important share (between 20% and 50%) of the voting rights in the Shareholders’ Meeting of a company.Investments in associates are consolidated using the equity method in accordance with IAS28.The investment is initially recognised at cost and subsequently at cost adjusted for the changes in the share of net equity of the investor in the investment. The Group’s share of the pro�ts or losses of associated companies, following acquisition of the shareholdings in these companies, is recognized in pro�t or loss for the period.Pro�t or loss from transactions with associates is eliminated to the extent of the Group’s interest in the associate.Having applied the equity method of accounting, the Group evaluates if it is necessary to recognise an impairment of its investment in the associate company. At the end of every reporting period, the Group measures if there is any objective evidence that an investment in an associate company is impaired. The Group calculates the impairment as the di�erence between the recoverable amount of an investment in an associate and its carrying value and recognises any di�erence in pro�t or loss under the entry, pro�t/loss from associates. Use of the equity method ceases from the date that signi�cant in�uence ceases and the residual amount of the investment is recognised at fair value. The di�erence between the sum of the proceeds received and any retained interest and the carrying amount of the associate at the date signi�cant in�uence is lost is recognised in pro�t or loss.
Joint Ventures:IAS 31 (Financial Reporting of Interests in Joint Ventures) de�nes a Joint Venture as a contractual arrangement whereby two or more parties undertake an economic activity that is subject to joint control.Under proportional consolidation, adopted by the Group, the statement of �nancial position of the venture includes its share of the assets, liabilities, revenues and costs of the jointly controlled entity. Investments acquired or divested in the course of a �nancial year are consolidated for the period of joint control.Pro�t or loss from transactions with joint ventures is eliminated to the extent of the Group’s interest in the joint venture.
Translation into Euro of the �nancial statements of foreign companies:The Consolidated Financial Statements are in Euro, which is the functional and presentation currency of the Parent Company.The �nancial statements of foreign companies that are consolidated are converted into Euro applying the current exchange rate method, which requires the use of exchange rates prevailing at the year-end for assets and liabilities and the average exchange rates for the �nancial period for the income statements. Exchange rate di�erences deriving from the translation of the opening net equity at the exchange rate prevailing at the end of the reporting period and that prevailing at the start of the reporting period and those deriving from the translation of the income statement using average exchange rates for the reporting period are recognised in a translation reserve in the Statement of Comprehensive Income. Exchange rate di�erences from translation are an entry in the Statement of Comprehensive Income until the investment is divested when these di�erences are recognised in pro�t or loss.

Annual Report at 31 December 2012
46
The exchange rates used in the 2012 Financial Statements are as follows (foreign exchange: Euro 1.00):
Currency Average exchange rate for the reporting period
31/12/2012
Exchange rate at the end of the reporting
period31/12/2012
Average exchange rate for the reporting period
31/12/2011
Exchange rate at the end of the reporting
period31/12/2011
Sterling GBP 0,811 0,816 0,868 0,835
Japanese Yen JPY 102,492 113,610 110,96 100,20
US Dollar USD 1,285 1,319 1,392 1,294
Turkish Lira TRL 2,314 2,355 2,338 2,443
Argentine Peso ARS 5,840 6,486 5,745 5,568
Venezuelan Bolivar VEF 5,518 5,666 5,977 5,557
Nigerian Naira NGN 204,05 206,10 216,90 208,17
Singaporean Dollar SGD 1,605 1,611 1,749 1,682
Philippine Peso PHP 54,25 54,11 60,26 56,75
Chinese Renminbi CNY 8,105 8,221 8,996 8,159
Malay Ringgit MYR 3,967 4,035 4,256 4,106
UAE Dirham AED 4,719 4,846 5,113 4,752
Algerian Dinar DZD 99,81 103,38 101,52 97,47
Hong Kong Dollar HKD 9,966 10,226 10,836 10,051
Indian Rupee INR 68,60 72,56 64,89 68,71
Australian Dollar AUD 1,241 1,271 1,348 1,272
Libyan Dinar LYD 1,614 1,665 1,713 1,628
Saudi Arabian Riyal SAR 4,818 4,948 5,220 4,852
Brazilian Real BRL 2,508 2,704 2,327 2,416
Danish Kroner DKK 7,444 7,461 7,451 7,434
Kuwaiti Dinar KWD 0,360 0,371 0,385 0,361
Thai Baht THB 39,928 40,347 42,428 40,991
Colombian Peso COP 2.309,6 2.331,2 2.569,9 2.510,6
Mozambique Metical MZN 36,21 38,99 40,46 35,10
Area of consolidationThe 2012 area of consolidation varied compared to 31 December 2011 as follows:• Trevi-ITT JV, with registered o�ce in Thailand and 95% controlled by Trevi Construction Company Ltd (Hong Kong) was
established. This company is equity accounted;• Soilmec Colombia S.A.S., with registered o�ce in Colombia and 100% controlled by Soilmec B.V. was established;• Petreven do Brasil Ltda was established and is 85% controlled by Petreven S.p.A. and 15% by Perforazioni Trevi Energie B.V.;• HYPER Serviços de Perfuração S.A. was established and is 51% controlled by Petreven do Brasil Ltda and is fully consolidated; • Galante Cimentaciones SA was established with a registered o�ce in Peru; it is 99.96% controlled by Galante SA and 0.04% by
Trevi Panamericana SA.
During the period under review, the companies above generated total revenues of approximately Euro 23.3 million. At 31 December 2012, the following companies, accounted at cost in previous reporting periods, were also fully consolidated: Profuro Intern. L.d.a. and Trevi SpezialTiefBau GmbH. Management believes that these acquisitions did not signi�cantly in�uence the comparability of the Consolidated Financial Statements at 31 December 2012 with those at 31 December 2011.
The Attachments to the Notes to the Financial Statements include a table showing the Group structure and lists the companies consolidated at 31 December 2012.

47
Consolidated Financial Statements at 31 December 2012Consolidated Financial Statements at 31 December 2012
Associate companies in which the Parent Company has a direct or indirect holding which does not constitute control, as well as non-operative Joint Ventures, where the work for which they were set up is almost complete or is about to be completed, are equity accounted. Attachment 1a shows the holdings valued using the equity accounting method. The values under the equity accounting method use the �gures of the most recent �nancial statements approved by these companies. Non-controlling interests and non-controlling stakes in consortia or non-operating companies for which no fair value exists are valued using the cost accounting method and adjusted for impairment losses. In particular, limited liability consortia and consortia speci�cally set up as operating entities for projects or works acquired by a consortium including other companies and in existence for a limited period, which have �nancial statements with no operating result because they o�-set any direct costs by a corresponding debit to the combined businesses of the consortium, are cost accounted.
Trevi Park Plc and Hercules and Trevi Foundation A.B. have been accounted for at cost since they are considered of insigni�cant size. These companies were set up in prior years for speci�c projects in their relative countries. The percentage held in these companies is as follows:
Company % held
Trevi Park Plc 29,7%
Hercules Trevi Foundation A.B. 49,50%
Further details are given in the table showing the Group structure (Attachment 1c).
Valuation criteriaThe most signi�cant criteria adopted in the preparation of the Financial Statements at 31 December 2012 are the following:
NON-CURRENT ASSETS:
Tangible �xed assets The operating tangible �xed assets are valued using the cost method as required by IAS 16. Under this standard, tangible assets are stated at their acquisition or construction cost, including contingent costs and costs incurred, and subsequently adjusted for depreciation, impairment losses and reversals.Depreciation is calculated and charged to pro�t or loss on a straight line basis over the useful life of the asset on the depreciable amount, equal to the cost of the asset at the recognition date less its residual value.Financial costs contingent on the acquisition, construction or manufacture of a tangible �xed asset are charged to pro�t or loss.The capitalization of costs contingent on adding to, updating or improving assets for the Group’s own use or in use from third parties is only e�ected when these costs meet the requirement for them to be classi�ed as a separate asset or part of an asset. The depreciable amount of each signi�cant element of a tangible �xed asset with a di�erent useful life is apportioned on a straight line basis over its estimated useful life.
Description Years %Land Inde�nite useful life -
Industrial buildings 33 3%
Lightweight buildings 10 10%
Generic equipment and accessories 20 5%
Drilling equipment 13 7.5%
Various and smaller equipment 5 20%
Motor vehicles 5-4 18.75%-25%
Transport vehicles 10 10%
Excavators and piles 10 10%
O�ce furniture and �ttings 8.3 12%
Electromechanical o�ce machinery 5 20%
Motorised tenders 20 5%
Note: The estimated useful life of the industrial building at Gariga di Podenzano (Piacenza), the headquarters of Drillmec S.p.A., is 20 years.

Annual Report at 31 December 2012
48
The criteria for the depreciation rate used, the useful life and the residual value, are calculated at least as often as the end of each reporting period in order to take account of any signi�cant changes.The capitalized costs for improvements to third-party assets are recognized in the relevant �xed asset category and depreciated for the shorter of either the residual length of the leasing contract or the residual useful life.The carrying value of tangible �xed assets remains in the Statement of Financial Position as long as that value can be recouped from their use. An asset is derecognised at the moment of its sale or when any future economic bene�ts will cease to derive from its use or sale. Any gains or losses (calculated as the di�erence between the net consideration received and the carrying value) are recognised in pro�t or loss on derecognition.Ordinary maintenance costs are entirely recognised in pro�t or loss. Those increasing the value of the asset, by extending its useful life, are capitalized.
LeasesFinancial leases are accounted for in accordance with IAS 17. The de�nition of an agreement as a lease (or containing a lease) depends on the substance of the transaction and requires a judgement on whether it depends on the use of one or more speci�c assets or if the agreement transfers the right to use these assets. An assessment as to whether an agreement is a lease is made at the inception of the lease. This requires that:• the cost of leased assets is recognized in �xed assets and is depreciated on a straight line basis for the estimated useful life of
the asset; there is a corresponding entry for �nancial payables towards the lessor for an amount equal to the fair value of the leased asset;
• lease payments are recognized in such a way as to separate the �nancial element from the capital element, considered as repayment of the outstanding liability to the lessor, so as to produce a constant periodic rate of interest on the remaining balance of the liability. Financial costs are recognised in pro�t or loss.
Leased assets are depreciated over the useful life of the asset. However, if there is no reasonable certainty that the Group will obtain ownership of the asset at the end of the lease, the asset is depreciated over the shorter of the lease term or the life of the asset.Leasing contracts where the lessor retains almost all the risks and rewards of the asset are classed as operating leases and the lease payments are recognised as an expense in pro�t or loss over the lease term on a straight-line basis.Leasing contracts where the lessor retains almost all the risks and rewards of the asset are classed as operating leases.
Business combinations Business combinations are recognised using the acquisition method whereby the transaction cost of a business combination is valued at fair value, (calculated as the fair value of the assets transferred and liabilities assumed by the Group at the date of acquisition and of any equity instruments issued in exchange for control of the acquired entity and the value of non-controlling interests in the entity acquired). All other costs directly associated with the transaction are immediately expensed in pro�t or lossThe fair value of the identi�able assets acquired and the liabilities assumed are measured at fair value at the acquisition date; the following entries are excluded and are measured in accordance with the relevant accounting standard:• deferred tax liabilities and deferred tax assets; • assets and liabilities for employee bene�ts;• share-based payment for the acquired entity or payment with Group shares issued in exchange for contracts of the acquired
entity;• held for sale assets and discontinued operations. Goodwill is the di�erence between the cost of the acquisition, the net equity attributable to non-controlling interests and the fair value of any previously held equity interest in the entity and the acquiring enterprise’s fair value of the identi�able assets acquired less the liabilities assumed. If the di�erence between the net of the acquisition-date amounts of the identi�able assets acquired and the liabilities assumed exceeds the consideration transferred for the business combination, the amount of any non-controlling

49
Consolidated Financial Statements at 31 December 2012Consolidated Financial Statements at 31 December 2012
interest and the acquisition-date fair value of any previously held equity interest in the acquiree, the excess sum is immediately recognised in pro�t or loss as income from the transaction.Non-controlling interests are measured at the transaction date using either the fair value of the non-controlling interests or the proportionate interest of the fair value of net identi�able assets of the entity acquired. The method used is decided on a transaction by transaction basis.Any contingent considerations in the business combination contract are valued at fair value on the acquisition date and included in the consideration transferred for the business combination in order to measure goodwill. Subsequent adjustments to this fair value that are considered a measurement period adjustment are made against goodwill. Adjustments to fair value that are measurement period adjustments are those arising from additional information that a�ects the facts and circumstances as they existed at the acquisition date obtained during the measurement period (which cannot exceed twelve months from the date of the business combination).When a business acquisition is achieved in stages (step acquisition) any previously held equity interest is measured at fair value at the date of obtaining control and any resulting adjustments are recognised in pro�t or loss. A previously held interest recognised in other pro�t or loss is treated as if the acquirer had disposed of its previously held interest. If the initial accounting for a business combination can be determined only provisionally by the end of the �rst reporting period, the Group uses provisional values in the Consolidated Financial Statements for those entries where determination is impossible. There is a measurement period adjustment in the fair value if additional information is obtained after the acquisition date that a�ects the facts or circumstances as they existed at the acquisition date which, if known would have had an e�ect on the values of the liabilities and assets recognised at that date.Business combinations from before 1 January 2010 are recognised according to the previous version of IFRS 3.
GoodwillGoodwill arising on a business combination is recognised at cost on the date of acquisition as described in the preceding section. Goodwill is not amortised but is subject to impairment testing at least annually and more frequently if there are any indications of impairment. In order to test for impairment, goodwill acquired in a business combination is allocated at the acquisition date to the Group cash generating units that will bene�t from the synergies of the combination irrespective of whether other assets or liabilities of the acquiree are assigned to those cash generating units. After initial recognition, goodwill is measured at cost less any impairment stemming from the impairment tests.At the disposal date of part or of an entire investment for which there was goodwill at the acquisition date, the capital gain or loss on disposal takes account of the residual value of the goodwill.
Intangible �xed assets Intangible assets acquired or produced internally are recognized at the cost of acquisition or production when it is probable that use of the asset will produce future economic bene�ts and when the cost of acquiring or producing the asset can be reliably determined. These assets are valued at acquisition or production cost.Those intangible assets having a �nite useful life are depreciated on a straight line basis over the estimated useful life of the assets as follows:
Description Years %
Development costs 5 20%
Industrial patents and use of intellectual property and software 5 20%
Concessions, licences and brands 5 20%
Other intangible �xed assets 5 20%
50
Annual Report at 31 December 2012
Development costs:Research costs are recognized in pro�t or loss at the time they are incurred. Development costs that are required by IAS 38 to be classi�ed as an asset (when there is the technical capacity, the intention and capability, the availability of necessary resources to complete the asset for use or sale, or the ability exists to make a reliable assessment of the attributable development costs) are usually depreciated over �ve years on the basis of their estimated future useful life from the moment such assets are available for economic use. The useful life is assessed and modi�ed if there is any estimated change in its future usefulness.
Industrial patents, use of intellectual property, concessions, licences and brands:These are valued at cost net of accumulated depreciation, calculated on a straight line basis for the duration of the useful life barring any signi�cant impairment. The criteria for depreciation, useful life and residual value are examined and measured at least as often as the end of each �nancial year in order to take account of any signi�cant changes.Intangible assets with an inde�nite useful life are not amortised but are subject, at least annually to an impairment test, both as an individual asset and as part of a cash generating unit. The useful life of an intangible asset that is not being amortised is reviewed at the end of each reporting period to determine whether events and circumstances continue to support an inde�nite useful life assessment for the asset. If they do not, the change in the useful life assessment from inde�nite to �nite is accounted for as a change in an accounting estimate.Any gains or losses on derecognition of an intangible asset are calculated as the di�erence between the net consideration received and the carrying value and are recognised in pro�t or loss in the reporting period in which the intangible asset is derecognized.
Impairment:The Group tests goodwill and other intangible assets (including capitalised development costs) for impairment at least annually at the end of the reporting period, or more often if there are any indications that an asset has been impaired. The recoverable value of tangible assets (land and buildings, plant and machinery, industrial and commercial equipment, other �xed assets under construction) are tested for impairment any time there is an indication that an asset has been impaired and at least annually.If there is evidence of impairment, the carrying value of the asset is reduced to the recoverable value. Intangible assets with an inde�nite life are tested for impairment at least annually at the end of the reporting period, or more often if there are any indications that an asset has been impaired.When the recoverable value of a single asset cannot be measured, the Group estimates the recoverable value of the cash-generating unit to which it belongs.The recoverable amount of the asset is assessed by comparing the carrying value with the higher of the net selling price of the asset and its value in use. The value in use is the discounted present value of future cash �ows, pre-tax, using a pre-tax discount rate that re�ects the time value of money represented by the current market risk-free rate of interest and the uncertainty inherent in the asset. Impairment is recognised when carrying value exceeds the recoverable value.With the exception of goodwill, when the impairment of an asset no longer exists or decreases, the carrying value of the asset or cash-generating unit is reinstated only up to the new estimate of recoverable value. The reinstated value cannot exceed the value that would have been measured if there had been no impairment.Reversal of an impairment loss is recognised immediately in pro�t or loss.
Investment propertyThis item in the Statement of Financial Position includes �xed assets which under IAS 40 (Investment Property) are not considered essential to the business activities of the company.Such assets include property held to earn rentals or for capital appreciation when the cost of the property can be reliably measured and the future economic bene�ts associated with it will �ow to the business; the cost is depreciated on the basis of the estimated future economic life of the asset.

51
Consolidated Financial Statements at 31 December 2012Consolidated Financial Statements at 31 December 2012
Financial assets Financial assets are designated under the following categories:• Held-to-maturity investments: investments in �nancial assets with �xed maturities and determinable or �xed payments which
the Group has the intention and capacity to hold to maturity;• Available-for-sale �nancial assets: �nancial assets other than those in the preceding paragraph or those designated as such
from the start.• Loans and receivables: these are non-derivative �nancial assets with �xed or determinable payments that are not quoted in an
active market.• Financial assets at fair value through pro�t or loss: this category includes both held for trading assets and designated assets. The
latter are any �nancial asset that is designated on initial recognition as one to be measured at fair value with fair value changes in pro�t or loss. Held for trading assets are �nancial assets acquired or held for the purpose of selling in the short-term or for which there is a recent pattern of short-term pro�t taking. All derivatives, except those designated as hedging instruments under IAS 39, are held for trading �nancial assets.
The Group decides the designation of the �nancial assets at the moment of acquisition; the initial recognition is the fair value at the acquisition date, including transaction costs; for purchase or sale date, the settlement date of the transaction is intended.After initial recognition, the �nancial assets at fair value through pro�t and loss and the available-for-sale �nancial assets are measured at fair value. Gains or losses deriving from variations in the fair values of the �nancial assets at fair value through pro�t and loss are recognized in pro�t or loss in the �nancial year they occur. The unrealised gains or losses deriving from variations in the fair value of assets designated as �nancial assets available for sale are recognized in equity.Held-to-maturity investments, as well as loans and �nancial receivables are measured at amortised cost using the e�ective interest method net of any persistent impairment loss. The e�ective interest rate is the rate that exactly discounts estimated future cash payments or receipts through the expected life of the �nancial instrument to the net carrying amount of the �nancial asset or liability and is recognised as �nancial income in pro�t or loss. Impairment losses are recognised in pro�t or loss as �nancial costs. The fair value of �nancial assets is measured on the basis of listed o�er prices or �nancial models. The fair value of unlisted �nancial assets is estimated using valuation techniques appropriate to the characteristics of the issuer. Financial assets for which the current value cannot be reliably determined are accounted for at cost less impairment.At the end of each reporting period, the presence of any indications that assets may be impaired is assessed and any losses are charged to pro�t or loss. Previously recognized impairment losses are reversed if the reason for the original recognition of the impairment no longer exists.
Treasury sharesIn accordance with IAS 32, when the Group’s own equity instruments are reacquired, these treasury shares are deducted from equity under the entry treasury shares. Gains or losses are not recognized in the Income Statement on the purchase, sale or cancellation of treasury shares. Any consideration paid or received, including any transaction costs directly attributable to the capital transaction, net of any associated tax bene�t, is recognized directly as a change in net equity.The voting rights of treasury shares are cancelled as is their right to dividends. Treasury shares are used to meet the obligations of any options on shares that are exercised.
Trade receivables, �nancial receivables and other non-current �nancial assetsNon-current receivables and other non-current �nancial assets are initially recognised at fair value and subsequently valued at amortised cost.Financial assets either singly or as part of a cash-generating unit are regularly tested for impairment. Any impairment loss is immediately recognised as an expense in pro�t or loss.

52
Annual Report at 31 December 2012
Investments in other entitiesInvestments in entities that are not subsidiaries, associates or joint ventures are recognised at the acquisition date in investments, and valued at cost when the fair value cannot be measured reliably; in this case the cost is adjusted for any impairment in accordance with IAS39.
GrantsIn accordance with IAS 20 (Accounting for Government Grants and Disclosure of Government Assistance), grants are recognized, even without a formal con�rmation, when there is a reasonable assurance that the company will adhere to the conditions attached to the grant and that the grant will be received. The grant is recognized in pro�t or loss on the basis of the useful life of the bene�t for which it is given, by means of the deferral method in order to deduct the calculated depreciation.A grant relating to expenses and costs already incurred or for immediate �nancial support to a company, with no future related costs, is recognized as income in the period in which it is received.
CURRENT ASSETS
Inventories Inventories are carried at the lower of purchase cost and net realizable value; any impairment losses accounted for are reversed if in future �nancial periods the causes of the impairment no longer exist.The cost is calculated using the average weighted cost method for raw materials, ancillary materials, consumables and semi-�nished materials and the speci�c cost for the other categories of inventories.The net realisable value is the estimated selling price in the ordinary course of business, less the estimated cost of depreciation and the estimated costs necessary to make the sale.
Contract work in progress A construction contract is de�ned by IAS 11 (Accounting for Construction Contracts) as a contract speci�cally negotiated for the construction of an asset or a group of interrelated assets or interdependent as far as regards their planning, technology and function or their �nal use. Contract costs are expensed in the �nancial year they are incurred. Contract revenues are recognized in proportion to the stage of completion of contract activity at the end of the reporting period when the outcome of the contract can be estimated reliably. When the outcome of a contract cannot be estimated reliably, the revenues are recognized only to the extent that contract costs incurred are expected to be recoverable.When it is likely that the total costs of a contract exceed the total revenues of the contract, the total estimated losses are immediately recognized as a cost.Contract revenues are recognized in proportion to the stage of completion of contract activity:• for contracts in the Mechanical Engineering Division and for the longer-term contracts in the Special Foundations and Drilling
Services Division on a cost-to-cost basis whereby the proportion of contract costs incurred for work completed by the end of the reporting period to the estimated total contract costs is calculated;
• for shorter-term contracts in the Special Foundations and Drilling Services Division the percentage of completion is calculated applying the criteria of “physical measurement” as this approximates to cost-to-cost.
Contract work in progress is shown in the Statement of Financial Position as follows:• the amounts due from contractors is included in assets, under trade receivables and other current assets, when the costs
incurred, plus the related pro�ts (less the related losses) exceed any advances received;• the amounts due to contractors is included in liabilities, under trade payables and other current liabilities, when the advances
received exceed the costs incurred plus the related pro�ts (less the related losses).

53
Consolidated Financial Statements at 31 December 2012Consolidated Financial Statements at 31 December 2012
Trade receivables and other current assetsReceivables due within the credit terms or which carry interest at market rates are not discounted but are recognized at nominal value net of an allowance for doubtful receivables so that their value is in line with the estimated realizable value. Receivables are recognized at their estimated realisable value; this value approximates the amortised cost. If this is expressed in foreign currency, it is translated using the exchange rate at the year-end accounting date.This item of the Statement of Financial Position also includes the share of costs and revenues spread over two or more years to re�ect the time proportion principle correctly.
Sales of receivablesThe Group sells some of its trade and tax receivables using factoring transactions.Transfers of receivables may be with recourse or without recourse; some without recourse transactions include deferred payment clauses (for example, payment of a minority part of the acquisition price by the factor is dependent on total recovery of the receivables), require a guarantee on the part of the seller or imply continued material exposure to the cash �ows from the transferred receivables. This type of transaction does not meet the derecognition requirements under IAS 39 as substantially all the risks and rewards have not been transferred.Consequently all receivables sold through factoring agreements which do not meet the requirements for derecognition under IAS 39 remain in the Statement of Financial Position even if they have been legally transferred; a �nancial liability of an equal amount is recognised in the Consolidated Statement of Financial Position in the entry, liabilities for other �nancing. All receivables transferred through factoring agreements that meet the requirements for derecognition under IAS 39, when substantially all the risks and rewards are transferred, are derecognised from the Statement of Financial Position.Gains or losses resulting from the sale of receivables are recognised when the assets are derecognised from the Consolidated Statement of Financial Position.
Impairment of �nancial assetsAt the end of each reporting period, the Group assesses whether a �nancial asset or group of �nancial assets is impaired. A �nancial asset or group of assets is impaired, and impairment losses are recognised, only if there is objective evidence as a result of one or more events that occurred after initial recognition and this impairment event has an impact that may be reliably measured on the estimated future cash �ows deriving from the �nancial assets or group of assets. Evidence of impairment can come from signi�cant �nancial di�culties of the debtor, the inability of a debtor to meet obligations, failure or delays in interest payments or payment when due, a probability of being subject to bankruptcy procedures or other forms of �nancial reorganisation, and from observable data that indicates a measurable decrease in estimated future cash �ows such as changes in the economic environment or conditions linked to �nancial crises.Financial assets at amortised costIf there is any objective evidence that a loan or a receivable carried at amortised cost is impaired, the amount of the loss is measured as the di�erence between the carrying value of the asset and the present value of estimated future cash �ows discounted at the e�ective interest rate of the instrument at initial recognition.The carrying amount of the asset is reduced by establishing an allowance for impairment losses. The amount of the loss is recognized in pro�t or loss. Interest receivable continues to be measured on the lower carrying value and is calculated by applying the rate used to discount estimated future cash �ows when measuring impairment. Interest receivable is recognised in pro�t or loss in �nancial income.The Group assesses at each end of the reporting period whether there is any objective evidence of impairment; if, in a subsequent period, the amount of the impairment loss decreases due to an event occurring after the impairment was originally recognised, the previously recognised impairment loss is reversed through pro�t or loss to the extent that the carrying amount of the asset does not exceed the amortised cost at the date the impairment loss is reversed.For trade receivables, an impairment allowance is made when there is objective evidence (for example, evidence that the debtor is insolvent or in signi�cant �nancial di�culty) that the Group will not receive in full the amount due under the original agreement. The carrying amount of the receivable is reduced by establishing a related allowance account. Impaired receivables are written o� if considered irrecoverable.

54
Annual Report at 31 December 2012
Available for sale �nancial assetsAt the end of the reporting period, the Group ascertains if there is any objective evidence of impairment of an available for sale �nancial asset or group of �nancial assets. For equity instruments classi�ed as available for sale, objective evidence includes a signi�cant or prolonged reduction in fair value to below cost. The term “signi�cant” is measured with respect to the acquisition cost and the term “prolonged” is based on the period for which fair value has been lower than acquisition cost. When a decline in the fair value of the asset has been recognised directly in other comprehensive income and there is objective evidence that the asset is impaired, the cumulative loss – measured as the di�erence between the initial cost and the current fair value – recognised directly in other comprehensive income is removed from other comprehensive income and recognised in pro�t or loss. Subsequent reversals of impairment losses recognised in pro�t or loss on equity instruments are recognised in other comprehensive income, not in pro�t or loss. Amortised cost is calculated by also measuring the discount or premium on acquisition and fees and costs as these are an integral part of the e�ective interest rate. Amortisation using the e�ective interest method is recognised in pro�t or loss in �nancial expenses.
Cash and cash equivalentsCash and cash equivalents are highly liquid short-term investments (with an original maturity of no more than three months), easily convertible into considerable sums of cash and subject to no relevant variation from fair value.In the Statement of Cash Flows, cash and cash equivalents include cash and bank accounts, net of bank overdrafts. In the Statement of Financial Position, bank overdrafts are included in �nancial debt as part of current liabilities.
EQUITY AND LIABILITIES:
Issued share capitalThis item is the subscribed and fully paid-up share capital; it is shown at nominal value. The acquisition of treasury shares, valued at the consideration paid, including any related costs, is recognized as a change in equity and the nominal value of the treasury stock is deducted from shareholders funds whilst the di�erence between the purchase cost and the nominal value of the treasury stock is deducted from reserves.
Share price premiumThis item is the excess of the issue price of the shares compared to their nominal value and this reserve also includes the di�erence of the conversion price of the bonds to shares.
Other reservesThese include capital reserves with a speci�c destination within the Parent Company and the adjustments made on the �rst-time adoption of IAS/IFRS.
Retained pro�ts (losses)This item includes the economic results of prior �nancial years which have not been distributed or taken to reserves (in the case of pro�ts) or covered (in the case of losses), and movements from other equity reserves when the need for which the latter were set up no longer exists. This entry also includes the pro�t or loss for the year.

55
Consolidated Financial Statements at 31 December 2012Consolidated Financial Statements at 31 December 2012
Financial liabilitiesFinancial liabilities that are subject to IAS 39 are recognised in �nancial liabilities at fair value through pro�t or loss, mortgages or loans or derivatives designated as hedging instruments. The Group decides the designation of �nancial liabilities at the moment of purchase.All �nancial liabilities are measured at fair value including for mortgages and loans any directly attributable transaction costs.The Group �nancial liabilities include trade payables and other payables, overdrafts, mortgages and loans, guarantees and �nancial derivative instruments.The Group has not recognised any �nancial liability at fair value through pro�t or loss.LoansThese are initially recognized at cost on the acquisition date, which is equal to the fair value of the sum received net of related costs. Subsequently, �nancing transactions are valued with the amortised cost method using the e�ective interest method. Gains and losses are recognised in pro�t or loss when the liability is extinguished, as well as through the amortisation process.Amortised cost is calculated by also measuring the discount or premium on acquisition and fees and costs as these are an integral part of the e�ective interest rate. Amortisation using the e�ective interest method is recognised in pro�t or loss in �nancial expenses.
DerecognitionA �nancial liability is derecognised when the obligation speci�ed in the contract has been discharged, cancelled or has expired. Where there has been an exchange between an existing borrower and lender of debt instruments with substantially di�erent terms, or there has been a substantial modi�cation of the terms of an existing �nancial liability, this transaction is accounted for as an extinguishment of the original �nancial liability and the recognition of a new �nancial liability. A gain or loss from extinguishment of the original �nancial liability is recognised in pro�t or loss.
Derivative instrumentsTREVI Group has adopted a Group policy approved by the Board of Directors on 1 February 2008. All �nancial instruments are initially measured at fair value on the date the contract is signed and subsequently are measured at fair value. Derivatives are accounted as �nancial assets when the fair value is positive and as �nancial liabilities when the fair value is negative. The fair value of �nancial instruments exchanged on an active market is measured at the end of every reporting period using quoted market prices or broker quotes (bid prices for non-current positions and ask prices for current positions), with no deduction of transaction costs. If a market for a �nancial instrument is not active, fair value is established by using a valuation technique, which can include:• the use of recent transactions done at market conditions ;• reference to the current fair value of another instrument that is substantially the same;• discounted cash �ow analysis or other valuation models.The fair value analysis of derivative instruments and other information on their valuation are given in the paragraph, supplementary information on �nancial instruments, in this document.Under IAS 39 the measurement of variations in the fair value alters according to the designation of the derivative instrument (trading or hedge) and the nature of the risk covered (Fair Value Hedge or Cash Flow Hedge).For those contracts designated as held for trading, changes in fair value are recognized directly in pro�t or loss. For those contracts like a Fair Value Hedge, changes in fair value of the hedging instrument and of the hedged item are recognized in pro�t or loss, independent of the valuation criteria adopted for the latter. For Cash Flow Hedges, changes in fair value are recognized directly in equity if the hedging instrument is determined to be an e�ective hedge whilst the portion determined as ine�ective is recognized in pro�t or loss. The changes recognized in comprehensive income are recycled to the income statement in the same �nancial period or periods in which the hedged asset or liability a�ects pro�t or loss.Purchase or sale of derivative instruments (for trading or hedge) is recognised at the transaction date
Debts Debts are recognized at their presumed settlement value, approximately the amortised cost. If expressed in foreign currency, the values are determined using the exchange rate at the end of the reporting period.

56
Annual Report at 31 December 2012
Employee bene�tsShort-term bene�tsShort-term employee bene�ts are charged to pro�t or loss in the period of service rendered by the employee.Post-employment bene�tsThe Group recognizes certain bene�ts to its employees post-employment (TFR [Sta� Termination Fund] for the Italian companies of the Group and pension bene�ts for the foreign companies). These bene�ts fall into the category of de�ned bene�ts, veri�able as to their existence and quanti�able as regards the amount payable but uncertain as to when payment will be required. Under IAS 19, the liability is valued using the Projected Unit Credit Method and calculated by independent actuaries. This method calculates the present value of the de�ned bene�t obligation that an employee will receive at the estimated date when the service rendered by the employee ceases using actuarial assumptions (for example, the mortality rate, the turnover rate of personnel) and �nancial assumptions (for example, the discount rate). The present value of the de�ned bene�t obligation is calculated annually by an external, independent actuary. Actuarial gains and losses are recognised in full in pro�t or loss in the year in which they are realized. The Group has not used the so-called “corridor” method for recognising actuarial gains and losses.
The Italian Accounting Commission (OIC), with the document approved by the Executive Committee on 26 September 2007, referring to Appendix 1 of the Operating Guide of 2005 for the transition to International Accounting Standards (IAS/IFRS), has given further indications, in addition to those in the original document, concerning the calculation and disclosure of the sta� termination fund (TFR) of employees of Italian companies within the Group, following the new provisions of Law 296 of 27 December 2006 (the Finance Law 2007) and of the relative enactment decree of the Ministry for Employment and Social Security No. 70 of 3 April 2007.The OIC document does not alter the previous opinion on sta�-leaving indemnities matured to 31 December 2006, which remain within the Company and are considered de�ned bene�t plans. However, the new document asserts that, to comply with IAS 19 for the accounting treatment of settlement or curtailment changes to the post-employment plan, the sta� leaving indemnity matured must be subject to a di�erent calculation, which results in a signi�cant change due to the absence of the previous actuarial assumptions concerning salary increases. In other words, the liability for sta�-leaving indemnities which remain within the Company may no longer be modi�ed by subsequent events.
De�ned bene�ts plansThe Group participates in State de�ned contribution plans. The contributions paid ful�l the obligations of the Group towards its employees. The contributions are costs recognized in the period in which the bene�t is earned.
Provisions for potential risks and costs, assets and liabilities Risk and costs provisions are probable liabilities where the amount and/or timing of the obligation derive from a past event and where the ful�lment of that obligation will result in an out�ow of �nancial resources. Provisions are made exclusively for existing obligations, either legal or implicit, deriving from a past event where at the date of the Statement of Financial Position a reliable estimate of the amount of the obligation can be made. The amount provided represents the best estimate of the amount necessary to ful�l that obligation made at the end of the reporting period. Provisions made are re-assessed at the end of each accounting period in the year and adjusted to re�ect the best current estimate. Where settlement of the obligation is likely to be beyond the normal credit terms, the amount of the provision represents the estimated value of the future obligation discounted to its present value.Potential assets and liabilities are not entered in the Statement of Financial Position; however information is provided for those of a material amount.
Income tax for the periodCurrent income taxes are determined on the basis of estimated taxable income for the �nancial year according to the enacted legislation and at the tax rates payable at the end of the reporting period.The tax rates and the tax rules used to calculate the tax charge are those enacted or substantively enacted at the end of the reporting period in the countries where the Group operates and where it generates taxable income.Current taxes for transactions or events outside pro�t or loss are recognised outside pro�t or loss in other comprehensive income

57
Consolidated Financial Statements at 31 December 2012Consolidated Financial Statements at 31 December 2012
consistent with the transaction or event to which they refer. Deferred taxes are calculated for all temporary di�erences between the carrying values of assets and liabilities and the �scal valuation of assets and liabilities (the liability method). Deferred taxes are calculated using the tax rates expected to apply when the temporary di�erences will be realized or settled.Current and deferred taxes are shown in the Income Statement except where they refer to entries directly debited or credited to the statement of comprehensive income.Prepaid income tax assets are recognised for taxable temporary di�erences and for carried forward tax losses and credits if it is considered probable that there will be su�cient taxable pro�t against which the loss or credit carryforwards can be utilised.The carrying value of deferred tax assets is reviewed at the end of each reporting period and reduced to the extent that it is no longer probable that su�cient taxable pro�t will be available to allow the bene�t of part or all of the deferred tax asset to be utilised. Deferred tax assets are recognised for deductible timing di�erences and for tax assets and liabilities carried forward to the extent that there is likely to be su�cient future taxable income against which the deductible timing di�erences and tax assets and liabilities carried forward can be used.
Guarantees and potential liabilitiesThese include guarantees and sureties given, as well as goods received on deposit for various reasons. They are recognized at nominal value.
INCOME STATEMENT:
Revenues and expenses Revenues are recognized and accounted for to the extent that the economic bene�ts are probable and the relative amounts can be reliably estimated. Revenues deriving from the sale of an asset are recognized upon transfer of the risks of ownership, usually under Incoterms rules.Revenues for contract work are recognized according to the stage of completion of the contract, as illustrated above.Expenses are recognized on a similar basis to revenues and always recognized on a time-proportion basis.
Financial revenues and expensesFinancial revenues and expenses are recognized in pro�t or loss on a time-proportion basis and using the e�ective interest method.The interest on all �nancial instruments valued at amortised cost and interest-bearing �nancial assets classi�ed as available for sale is calculated using the e�ective interest method, which discounts the expected future cash in�ows expected over the life of a �nancial instrument or a shorter period if required, compared to the net carrying value of the �nancial asset or liability. Interest received is recognised in �nancial income in pro�t or loss.
DividendsThese are recognized in the �nancial year when the shareholders have the right to receive the payment, usually the year in which the Shareholders’ Meeting decides on the dividend distribution.Dividends distributed to shareholders are recognized as a liability in the Financial Statements of the year in which the distribution is approved by the Shareholders’ Meeting.
Earnings per shareBasic earnings per share is calculated by dividing the share of the Group’s economic result attributable to the ordinary shareholders by the average weighted number of outstanding ordinary shares, excluding any treasury shares.Diluted earnings per share is calculated by taking the share of the pro�t or loss attributable to the shareholders of the Parent Company and dividing it by the average weighted number of shares in circulation, taking into account all potential dilutive securities.
58
Annual Report at 31 December 2012
Criteria for translation of foreign currency items Receivables and payables in currencies other than Euro are originally translated into Euro at the historical rates prevailing at the date of the relative transactions.Exchange rate di�erences realized on the payment of receivables or the settlement of payables in foreign currencies are recognized immediately in pro�t or loss.Assets and liabilities in currencies other than Euro, excluding tangible and intangible �xed assets and investments, are determined using the exchange rate prevailing at the end of the reporting period and any related exchange rate gains or losses are recognised in pro�t or loss. Fixed-term currency contracts are used to cover the �uctuation risk of foreign currencies. The foreign subsidiaries of Trevi S.p.A. draw up accounts in the currency of the main economic area in which they operate (the functional currency). At the end of the reporting period, the amounts of the �nancial statements expressed in local currencies are translated using the exchange rates of 31 December published on the website of the U�cio Italiano Cambi and any di�erences arising are recognized in pro�t or loss.
Comment on accounting estimatesThe preparation of the Consolidated Financial Statements requires Management to apply accounting principles and methodologies that, in some cases, employ complex and subjective valuations and estimates. These are based on past experience and assumptions, which are always considered reasonable and realistic given the information available at the time. Given the joint document from the Bank of Italy/Consob/Isvap No. 2 of 6 February 2009, it is speci�ed that estimates are based on the most recent information available to Management at the time the Financial Statements were prepared without undermining their reliability.The application of these estimates and assumptions a�ects the �gures in the Financial Statements - the Statement of Financial Position, the Income Statement and the Statement of Cash Flows, as well as those given as additional information. Real results may di�er from these estimates given the uncertainty surrounding the assumptions and conditions on which the estimates are based. Listed below are the items of the Financial Statements requiring the greatest degree of subjectivity on the part of Management in establishing estimates and, for which any change in the conditions underlying the assumptions used, would have a signi�cant impact on the Consolidated Financial Statements of the Group:• Impairment of �xed assets;• Contract work in progress;• Development costs;• Deferred tax assets;• Provisions for credit risks;• Employee bene�ts;• Provisions for risks and costs.Estimates and assumptions are reviewed periodically and the e�ects of any changes are recognised in pro�t or loss for the period in which the change occurred.
Accounting standards, amendments and interpretations e�ective from 1 January 2012The criteria used to prepare the Consolidated Financial Statements are consistent with those used to prepare the Consolidated Financial Statements of the previous �nancial year, except for standards and interpretations e�ective for �nancial periods beginning on or after 1 January 2012 as speci�ed below:• IAS 12 Deferred Tax: Recovery of Underlying Assets• IFRS 1 Severe Hyperin�ation and Removal of Fixed Dates for First-time Adopters • IFRS 7 Financial Instruments: Disclosures – Transfers of Financial Assets The adoption of the standards and interpretations is described below:
IAS 12 – Deferred tax: Recovery of Underlying AssetsThis amendment clari�es the measurement of deferred tax on investment property measured using the fair value model. It introduces a rebuttable presumption that recovery of the carrying amount of investment property measuring using the fair value model in IAS 40 will be recovered through sale and, accordingly, that any related deferred tax should be measured on a sale basis. The assumption is rebutted if the investment property is depreciable and it is held within a business model whose objective is to
59
Consolidated Financial Statements at 31 December 2012Consolidated Financial Statements at 31 December 2012
consume substantially all of the economic bene�ts in the investment property over time rather than through sale. The amendments are mandatory for annual periods beginning on or after 1 January 2012. The amendment has had no impact on the �nancial position, �nancial performance or data provided by the Group.
IFRS 1 – Severe Hyperin�ation and Removal of Fixed Dates for First-time AdoptersThe IASB has provided �rst-time adopters with relief from retrospective restatement of derecognition included in IFRS when it ceases to have a functional currency with the characteristics of severe hyperin�ation. The amendments must be applied for annual periods beginning on or after 1 July 2011. This amendment has had no impact on the Group.
IFRS 7 – Financial Instruments: Disclosures – Transfers of Financial Assets The amendment requires entities to provide disclosures on transferred assets that are not derecognised in their entirety: the entity shall disclose information that enables users of its �nancial statements to understand the relationship between transferred �nancial assets that are not derecognised in their entirety and the associated liabilities. For transferred �nancial assets that are derecognised in their entirety but in which the entity maintains a residual interest, information must be disclosed that enables users of the �nancial statements to evaluate the maximum exposure to loss from continuing involvement in the derecognised �nancial assets. The amendment must be applied for annual periods beginning on or after 1 July 2011.
Accounting standards, amendments and interpretations not yet e�ective and which have not been applied early by the CompanyThe following international accounting standards and interpretations will be e�ective from annual periods beginning on or after 1 January 2013 and their e�ect on the Group Financial Statements is being analysed. The Group has not opted for early application of any other standard, interpretation or improvement issued but not yet mandatory.
IAS 1 Presentation of Financial Statements – Presenting Comprehensive IncomeThe amendments to IAS 1 require entities to change the presentation of items of other comprehensive income. Items of other comprehensive income should be grouped on the basis of whether they will eventually be reclassi�ed (or “recycled) to pro�t or loss (for example, net income from hedging of net investments, foreign currency translation, net income on cash �ow hedges, and net gains/ losses on available-for-sale �nancial assets) and shown separately from items that will never be recycled (for example, actuarial gains/losses on de�ned bene�t plans and the revaluation of land and buildings). The amendment a�ects the presentation of requirements and has no impact on the �nancial position and �nancial performance of the Group. The amendments are e�ective for annual periods beginning on or after 1 July 2012.
IAS 19 (2011) Employee Bene�ts The IASB has published several amendments to IAS 19. These vary from signi�cant changes such as the option for deferred recognition of actuarial gains or losses through pro�t or loss (the corridor approach) and the recognition of expected returns on plan assets to clari�cation of more minor issues and re-wording of the standard. The amendments are e�ective for annual periods beginning on or after 1 January 2013.
IAS 28 (2011) Investments in Associates and Joint Ventures (amended in 2011)Following publication of IFRS 11 Joint arrangements and IFRS 12 Disclosure of Interests in Other Entities, IAS 28 was renamed Investments in Associates and Joint Ventures; it sets out the requirements for the application of the equity method when accounting for investments in associates and joint ventures. The amendments are e�ective for annual periods beginning on or after 1 January 2014.
IAS 32 O�setting Financial Assets and Financial Liabilities – Amendments to IAS 32The amendment clari�es the criterion that an entity “currently has a legal enforceable right to set o� the recognised amounts”. The amendment also clari�es the application of o�setting criteria under IAS 32 when an entity intends either to settle on a net basis or

60
Annual Report at 31 December 2012
to realise the asset and settle the liability simultaneously. These amendments should have no impact on the �nancial position and �nancial performance of the Group. They are e�ective for annual periods beginning on or after 1 January 2014.
IFRS 7 Disclosures – O�setting �nancial assets and Financial Liabilities – Amendments to IFRS 7These amendments require an entity to disclose information about rights of set-o� and related arrangements (such as collateral agreements). The amendments will provide users of �nancial statements with information about the e�ect of such rights and arrangements on the entity’s �nancial position. The new disclosures are required for all recognised �nancial instruments that are set o� in accordance with IAS 32 Financial Instruments - Presentation. These disclosures also apply to recognised �nancial instruments that are subject to an enforceable master netting arrangement or similar agreement, irrespective of whether they are set o� in accordance with IAS 32. These amendments are e�ective for annual and interim reporting periods beginning on or after 1 January 2013.
IFRS 10 Consolidated Financial Statements, IAS 27 (2011) Separate Financial StatementsIFRS 10 replaces part of IAS 27 Consolidated and Separate Financial Statements which governs the preparation of consolidated �nancial statements. It also resolves the problems arising from SIC-12 Consolidation – Special Purpose Entities. IFRS 10 establishes a single control model that is applicable to all companies, including special purpose entities. Compared to the requirements of IAS 27, the changes introduced with IFRS 10 require management to consider all relevant facts and circumstances to determine whether it controls another company and must, therefore, consolidate this company. These amendments are e�ective for annual periods beginning on or after 1 January 2014.
IFRS 11 Joint ArrangementsIFRS 11 replaces IAS 31 Interests in Joint Ventures and SIC-13 Jointly Controlled Entities – Non-monetary Contributions by Venturers.IFRS 11 eliminates the possibility of accounting for joint arrangements using the proportionate consolidation method. If a joint arrangement is a joint venture, it must be accounted for using the equity method. The Group is currently evaluating the impact that this standard will have on its �nancial position and �nancial performance. This standard is applicable to annual reporting periods beginning on or after 1 January 2014 and must be applied retrospectively to joint arrangements.
IFRS 12 Disclosure of Interests in Other EntitiesIFRS12 is a consolidated disclosure standard covering the disclosure requirements previously included in IAS 27 for the consolidated �nancial statements as well as the disclosure requirements under IAS 31 and IAS 28. The disclosure requirements relate to an entity’s interests in subsidiaries, joint arrangements, associates and unconsolidated structured entities. Additional information is likely to be required to meet the required level of disclosure of information. The standard will have no impact on the �nancial position or �nancial performance of the Group. This standard applies to annual periods beginning on or after 1 January 2014.
IFRS 13 Fair Value Measurement L’IFRS 13 sets out in a single IFRS a framework for measuring fair value. IFRS applies when another IFRS requires or permits fair value measurements or disclosures about fair value measurements. The Group is currently evaluating the impact of this accounting standard on its �nancial position and �nancial performance. This standard applies to annual periods beginning on or after 1 January 2013.
Annual Improvements May 2012The following improvements will have no impact on the Group:
IAS 1 Presentation of Financial StatementsThis improvement clari�es the di�erence between voluntary additional comparative information and the minimum required comparative information. Normally the minimum comparative information required is that for the previous �nancial period for all amounts reported in the �nancial statements.

61
Consolidated Financial Statements at 31 December 2012Consolidated Financial Statements at 31 December 2012
IAS 16 Property, Plant and EquipmentThis improvement clari�es that material replacement parts and servicing equipment for maintenance that are classi�ed as property, plant and equipment are not part of inventories.
IAS 32 Financial Instruments: Presentation This improvement clari�es that the tax e�ect of a distribution to holders of equity instruments should be accounted for in accordance with IAS 12: Income Taxes.
IAS 34 Interim Financial ReportingThis amendment aligns the information requirements of segment information for total assets and total liabilities in interim reporting in order to enhance consistency with the requirements of the annual reports.
These improvements will be e�ective for annual periods starting on or after 1 January 2013.
Risk management
Aims, management strategies and identi�cation of �nancial risksThe Finance Department of the Parent Company and the Financial Directors of each subsidiary manage the �nancial risks to which the Group is exposed by following the guidelines of the Treasury Risks Policy of the Group.The �nancial assets of the Group are mainly cash and short-term deposits linked directly to the operating activities. The �nancial liabilities include bank �nancing and �nancial leases, which are primarily to �nance the operating activities and international development of the Group, as well as trade and other payables.The general risks associated with these �nancial instruments are interest rate, exchange rate, liquidity and credit risk.The TREVI Group constantly monitors the aforementioned �nancial risks, intervening, if necessary, also through the use of derivative instruments, to reduce the risks to a minimum. Derivative instruments are used to manage exchange rate risk on instruments denominated in currencies other than the Euro and to manage interest rate risk on loans with �oating rate interest.The decision on the optimum debt structure between �xed-rate and �oating-rate debt is taken at the consolidated level by the Parent Company.Risk management of interest rate and exchange rate risks is mainly carried out by the Parent Company and the sub-holding companies.
Market riskMarket risk is the risk that the fair value of the future cash �ows of a �nancial instrument changes due to changes in the market price. The market price comprises four types of risk: interest rate risk, exchange rate risk, commodity price risk and other price risks, such as equity risk. Financial instruments a�ected by market risk include loans and �nancing, deposits, available for sale assets and �nancial derivatives.The sensitivity analyses shown below refer to the positions at 31 December 2012 and 31 December 2011.
Interest rate riskExposure to �uctuations in interest rates is linked to current and non-current �oating rate loans. It is Group policy to make funding transactions at �oating rates and then to decide whether to hedge the interest rate risk by exchanging the �oating rate exposure to a �xed rate exposure through derivative contracts. The Group has Interest Rate Swaps whereby it agrees to exchange, at pre-determined intervals, the di�erence between a �xed interest rate and a �oating rate based on a pre-agreed notional principal amount. At 31 December 2012, taking into account swap contracts, approximately 10% of Group debt was �xed rate.
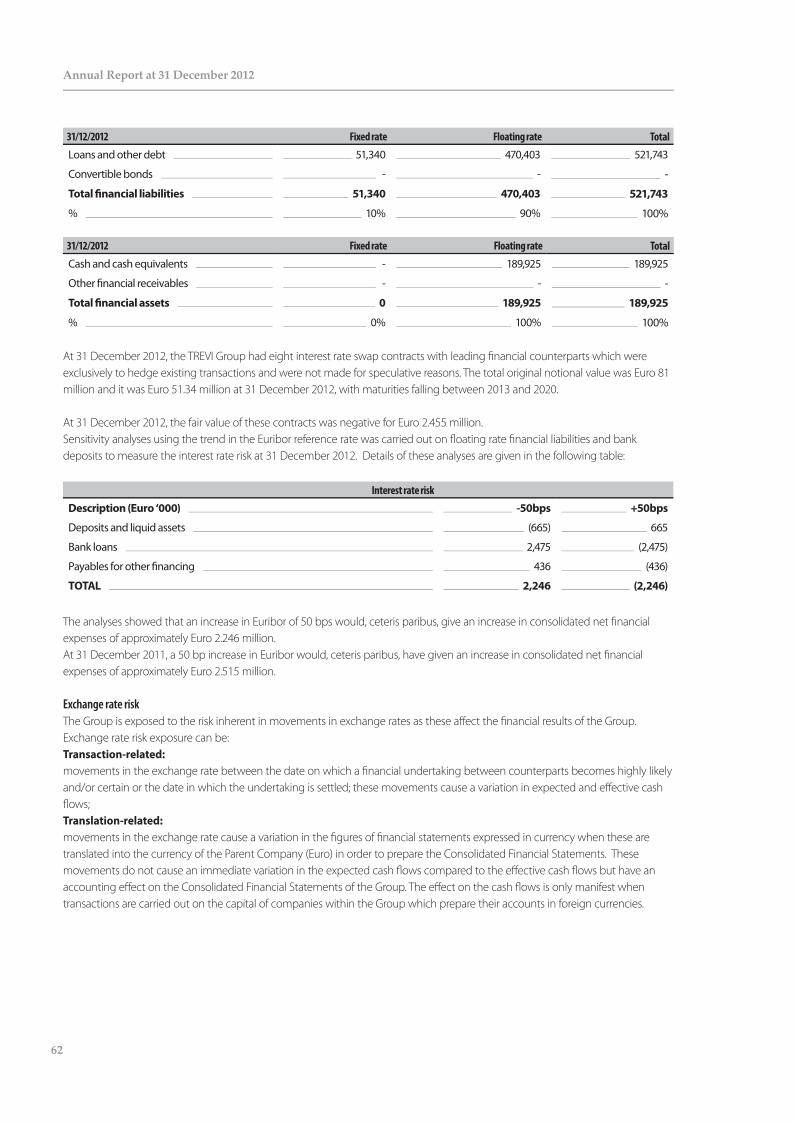
62
Annual Report at 31 December 2012
31/12/2012 Fixed rate Floating rate TotalLoans and other debt 51,340 470,403 521,743
Convertible bonds - - -
Total �nancial liabilities 51,340 470,403 521,743
% 10% 90% 100%
31/12/2012 Fixed rate Floating rate TotalCash and cash equivalents - 189,925 189,925
Other �nancial receivables - - -
Total �nancial assets 0 189,925 189,925
% 0% 100% 100%
At 31 December 2012, the TREVI Group had eight interest rate swap contracts with leading �nancial counterparts which were exclusively to hedge existing transactions and were not made for speculative reasons. The total original notional value was Euro 81 million and it was Euro 51.34 million at 31 December 2012, with maturities falling between 2013 and 2020.
At 31 December 2012, the fair value of these contracts was negative for Euro 2.455 million.Sensitivity analyses using the trend in the Euribor reference rate was carried out on �oating rate �nancial liabilities and bank deposits to measure the interest rate risk at 31 December 2012. Details of these analyses are given in the following table:
Interest rate risk
Description (Euro ‘000) -50bps +50bps
Deposits and liquid assets (665) 665
Bank loans 2,475 (2,475)
Payables for other �nancing 436 (436)
TOTAL 2,246 (2,246)
The analyses showed that an increase in Euribor of 50 bps would, ceteris paribus, give an increase in consolidated net �nancial expenses of approximately Euro 2.246 million.At 31 December 2011, a 50 bp increase in Euribor would, ceteris paribus, have given an increase in consolidated net �nancial expenses of approximately Euro 2.515 million.
Exchange rate riskThe Group is exposed to the risk inherent in movements in exchange rates as these a�ect the �nancial results of the Group. Exchange rate risk exposure can be:Transaction-related: movements in the exchange rate between the date on which a �nancial undertaking between counterparts becomes highly likely and/or certain or the date in which the undertaking is settled; these movements cause a variation in expected and e�ective cash �ows;Translation-related: movements in the exchange rate cause a variation in the �gures of �nancial statements expressed in currency when these are translated into the currency of the Parent Company (Euro) in order to prepare the Consolidated Financial Statements. These movements do not cause an immediate variation in the expected cash �ows compared to the e�ective cash �ows but have an accounting e�ect on the Consolidated Financial Statements of the Group. The e�ect on the cash �ows is only manifest when transactions are carried out on the capital of companies within the Group which prepare their accounts in foreign currencies.
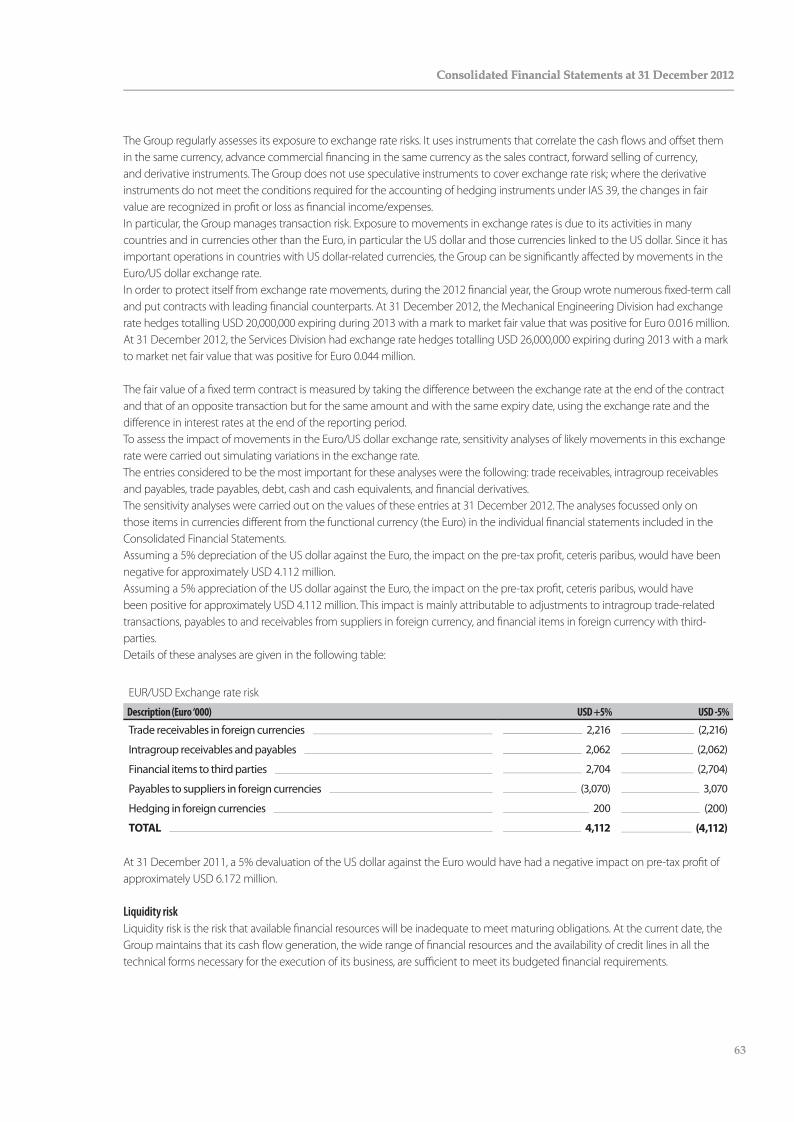
63
Consolidated Financial Statements at 31 December 2012Consolidated Financial Statements at 31 December 2012
The Group regularly assesses its exposure to exchange rate risks. It uses instruments that correlate the cash �ows and o�set them in the same currency, advance commercial �nancing in the same currency as the sales contract, forward selling of currency, and derivative instruments. The Group does not use speculative instruments to cover exchange rate risk; where the derivative instruments do not meet the conditions required for the accounting of hedging instruments under IAS 39, the changes in fair value are recognized in pro�t or loss as �nancial income/expenses. In particular, the Group manages transaction risk. Exposure to movements in exchange rates is due to its activities in many countries and in currencies other than the Euro, in particular the US dollar and those currencies linked to the US dollar. Since it has important operations in countries with US dollar-related currencies, the Group can be signi�cantly a�ected by movements in the Euro/US dollar exchange rate. In order to protect itself from exchange rate movements, during the 2012 �nancial year, the Group wrote numerous �xed-term call and put contracts with leading �nancial counterparts. At 31 December 2012, the Mechanical Engineering Division had exchange rate hedges totalling USD 20,000,000 expiring during 2013 with a mark to market fair value that was positive for Euro 0.016 million. At 31 December 2012, the Services Division had exchange rate hedges totalling USD 26,000,000 expiring during 2013 with a mark to market net fair value that was positive for Euro 0.044 million.
The fair value of a �xed term contract is measured by taking the di�erence between the exchange rate at the end of the contract and that of an opposite transaction but for the same amount and with the same expiry date, using the exchange rate and the di�erence in interest rates at the end of the reporting period.To assess the impact of movements in the Euro/US dollar exchange rate, sensitivity analyses of likely movements in this exchange rate were carried out simulating variations in the exchange rate.The entries considered to be the most important for these analyses were the following: trade receivables, intragroup receivables and payables, trade payables, debt, cash and cash equivalents, and �nancial derivatives.The sensitivity analyses were carried out on the values of these entries at 31 December 2012. The analyses focussed only on those items in currencies di�erent from the functional currency (the Euro) in the individual �nancial statements included in the Consolidated Financial Statements.Assuming a 5% depreciation of the US dollar against the Euro, the impact on the pre-tax pro�t, ceteris paribus, would have been negative for approximately USD 4.112 million. Assuming a 5% appreciation of the US dollar against the Euro, the impact on the pre-tax pro�t, ceteris paribus, would have been positive for approximately USD 4.112 million. This impact is mainly attributable to adjustments to intragroup trade-related transactions, payables to and receivables from suppliers in foreign currency, and �nancial items in foreign currency with third-parties.Details of these analyses are given in the following table:
EUR/USD Exchange rate risk
Description (Euro ‘000) USD +5% USD -5%
Trade receivables in foreign currencies 2,216 (2,216)
Intragroup receivables and payables 2,062 (2,062)
Financial items to third parties 2,704 (2,704)
Payables to suppliers in foreign currencies (3,070) 3,070
Hedging in foreign currencies 200 (200)
TOTAL 4,112 (4,112)
At 31 December 2011, a 5% devaluation of the US dollar against the Euro would have had a negative impact on pre-tax pro�t of approximately USD 6.172 million.
Liquidity riskLiquidity risk is the risk that available �nancial resources will be inadequate to meet maturing obligations. At the current date, the Group maintains that its cash �ow generation, the wide range of �nancial resources and the availability of credit lines in all the technical forms necessary for the execution of its business, are su�cient to meet its budgeted �nancial requirements.
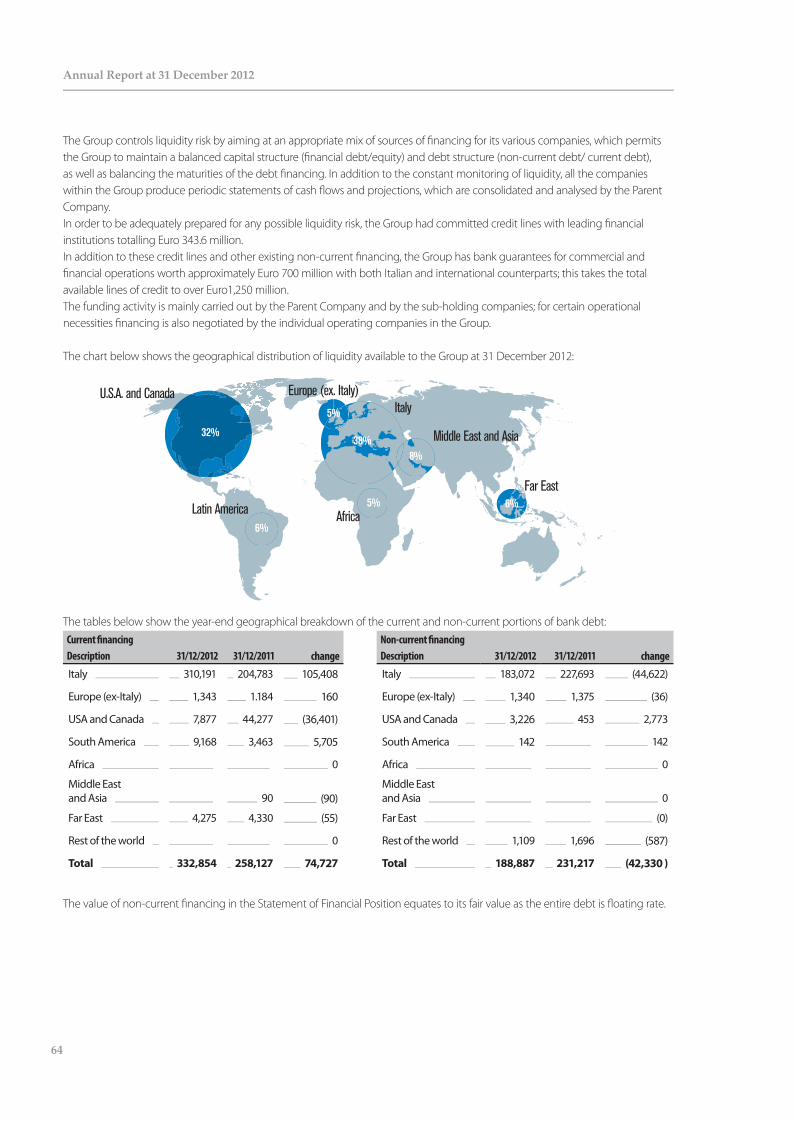
64
Annual Report at 31 December 2012
The Group controls liquidity risk by aiming at an appropriate mix of sources of �nancing for its various companies, which permits the Group to maintain a balanced capital structure (�nancial debt/equity) and debt structure (non-current debt/ current debt), as well as balancing the maturities of the debt �nancing. In addition to the constant monitoring of liquidity, all the companies within the Group produce periodic statements of cash �ows and projections, which are consolidated and analysed by the Parent Company.In order to be adequately prepared for any possible liquidity risk, the Group had committed credit lines with leading �nancial institutions totalling Euro 343.6 million.In addition to these credit lines and other existing non-current �nancing, the Group has bank guarantees for commercial and �nancial operations worth approximately Euro 700 million with both Italian and international counterparts; this takes the total available lines of credit to over Euro1,250 million.The funding activity is mainly carried out by the Parent Company and by the sub-holding companies; for certain operational necessities �nancing is also negotiated by the individual operating companies in the Group.
The chart below shows the geographical distribution of liquidity available to the Group at 31 December 2012:
The tables below show the year-end geographical breakdown of the current and non-current portions of bank debt:Current �nancing Non-current �nancingDescription 31/12/2012 31/12/2011 change Description 31/12/2012 31/12/2011 changeItaly 310,191 204,783 105,408 Italy 183,072 227,693 (44,622)
Europe (ex-Italy) 1,343 1.184 160 Europe (ex-Italy) 1,340 1,375 (36)
USA and Canada 7,877 44,277 (36,401) USA and Canada 3,226 453 2,773
South America 9,168 3,463 5,705 South America 142 142
Africa 0 Africa 0
Middle East and Asia
90 (90)
Middle East and Asia 0
Far East 4,275 4,330 (55) Far East (0)
Rest of the world 0 Rest of the world 1,109 1,696 (587)
Total 332,854 258,127 74,727 Total 188,887 231,217 (42,330 )
The value of non-current �nancing in the Statement of Financial Position equates to its fair value as the entire debt is �oating rate.
38%
5%
32%
6%
8%
6%
ItalyEurope (ex. Italy)U.S.A. and Canada
Latin America Africa
Middle East and Asia
Far East5%

65
Consolidated Financial Statements at 31 December 2012Consolidated Financial Statements at 31 December 2012
The geographical breakdown of all the �nancial liabilities, including not only bank debt but also �nancial derivative liabilities, �nancial leases, and payables for other �nancing, is given in the following tables:
Current �nancing Non-current �nancingDescription 31/12/2012 31/12/2011 change Description 31/12/2012 31/12/2011 changeItaly 327,245 220,984 106,261 Italy 223,784 267,667 (43,883)
Europe (ex-Italy) 8,062 1,484 6,578 Europe (ex-Italy) 2,622 1,375 1,247
USA and Canada 8,070 44,517 (36,447) USA and Canada 3,157 382 2,775
South America 11,090 5,383 5,707 South America 10,133 12,250 (2,117)
Africa 67 0 67 Africa 6 0 6
Middle East and Asia 2,553 2,703 (150) Middle East and Asia 1,180 3,530 (2,350)
Far East 4,275 4,330 (55) Far East (0) 1,290 (1,290)
Rest of the world 16 11 5 Rest of the world 1,109 1,696 (587)
Total 361,378 279,412 81,966 Total 241,991 288,191 (46,200)

66
Annual Report at 31 December 2012
Credit riskThe Group is exposed to credit risk should a �nancial or commercial counterpart become insolvent. The nature of the Group’s business, which covers several sectors, with a marked geographical spread of its production units and the number of countries in which it sells its plant and equipment (approximately 80), means it has no concentrated client or country risk. In fact, the credit risk is spread over a large number of counterparts and clients. The credit risk associated with normal commercial operations is monitored both by the company involved and by the Group �nance division. The aim is to minimise the counterpart risk by maintaining exposure within limits consistent with the credit rating given each counterpart by the various Credit Managers of the Group, based on the past history of the insolvency rates of the clients.
The Mechanical Engineering Division is mainly active in foreign markets and uses market �nancial instruments to cover credit risk, in particular letters of credit. For large engineering projects, the Special Foundations and Services Division uses advance payment instruments, letters of credit and SACE S.p.A. (the Italian Export Credit Agency) insurance policies and buyers’ credits. The Group also uses without recourse sales of trade receivables. A more in-depth analysis and statement of exposure to credit risk of the commercial activities is given in Note 11 to the Financial Statements.Credit risk on cash assets is inexistent since these are made up of cash and cash equivalents, bank current accounts and post-o�ce accounts.
INFORMATION ON DERIVATIVE INSTRUMENTSFor derivative instruments recognised in the Statement of Financial Position at fair value, IFRS 7 requires that these values are classi�ed according to a fair value hierarchy which re�ects the signi�cance of the inputs used to determine the fair value. The fair value hierarchy is composed of three levels:
- Level 1: quoted prices for similar instruments;- Level 2: directly observable market inputs other than Level 1 inputs;- Level 3: inputs not based on observable market data.The tables below show the assets and liabilities at 31 December 2012 and 31 December 2011 classi�ed according to IAS 39.IAS 39 classesLoans and Receivables L&R
Held-to-Maturity �nancial assets HtM
Available-for-Sale �nancial assets AfS
Held for Trading assets and liabilities at fair value in pro�t or loss FAHfT and FLHfT
Financial Liabilities at Amortised Cost FLAC
Hedge Derivatives HD
Not applicable n.a.

67
Consolidated Financial Statements at 31 December 2012Consolidated Financial Statements at 31 December 2012
The following table gives additional information on derivative instruments under IFRS 7.Carrying amounts under IAS 39
IAS 39classes
Note 31/12/2012 Amortised cost Cost Fair value to equity
Fair Value in pro�t
or loss
E�ect on pro�t
or loss
ASSETS
Non-current �nancial assets
Investments HTM 4 4,123 4,123
Financial assets held to maturity HTM 7 200 200
Other non-current �nancial receivables L&R 8 4,356 4,356
Total non-current �nancial assets 8,679 4,556 4,123 - - -
Current �nancial assets
Current �nancial derivatives HD 12 76 76 - -
Cash and cash equivalents L&R 13 189,925 478
Total current �nancial assets 190,001 - - 76 - 478
Total �nancial assets 198,680 4,556 4,123 76 - 478
LIABILITIES
Non-current �nancial liabilities
Non-current �nancing L&R 15 188,888 188,888 (9,407)
Payables for other non-current �nancing L&R 15 50,684 50,684 (2,889)
Non-current �nancial derivative instruments HD 15 2,418 2,418 - -
Total non-current �nancial liabilities 241,990 239,572 - 2,418 - (12,296)
Current �nancial liabilities
Current �nancing L&R 22 332,854 332,854 13,014)
Payables for other current �nancing L&R 23 28,478 28,478 (1,948)
Current �nancial derivative instruments FLHfT 24 45 45 - 4
Total current �nancial liabilities 361,377 361,332 - 45 - (14,958)
Total �nancial liabilities 603,367 600,904 - 2,463 - (27,254)

68
Annual Report at 31 December 2012
Carrying amounts under IAS 39IAS 39
classesNote 31/12/2011 Amortised cost Cost Fair value
to equityFair Value in pro�t or loss
E�ect on pro�t or loss
ASSETS
Non-current �nancial assets
Investments HTM 4 4,096 4,096
Financial assets held to maturity HTM 7 200 200
Other non-current �nancial receivables L&R 8 4,128 4,128
Total non-current �nancial assets 8,424 4,328 4,096 - -
Current �nancial assets
Current �nancial derivatives HD 12 511 511 - -
Cash and cash equivalents L&R 13 162,615 563
Total current �nancial assets 163,126 - - 511 - 563
Total �nancial assets 171,550 4,328 4,096 511 - 563
LIABILITIES
Non-current �nancial liabilities
Non-current �nancing L&R 15 231,217 231,217 (6,550)
Payables for other non-current �nancing L&R 15 55,878 55,878 (1,976)
Non-current �nancial derivative instruments HD 15 1,096 1,090 - 6
Total non-current �nancial liabilities 288,191 287,095 - 1,090 - (8,520)
Current �nancial liabilities
Current �nancing L&R 22 258,127 258,127 (9,572)
Payables for other current �nancing L&R 23 18,292 18,292 (785)
Current �nancial derivative instruments FLHfT 24 2,993 2,993 7
Total current �nancial liabilities 279,412 276,419 - 2,993 (10,355)
Total �nancial liabilities 567,603 563,514 - 4,083 - (18,875)

69
Consolidated Financial Statements at 31 December 2012Consolidated Financial Statements at 31 December 2012
Assets and liabilities shown at fair value are shown in the following table according to the fair value hierarchy. Fair Value Hierarchy
IAS 39 class Note 31/12/2012 Level 1 Level 2 Level 3
ASSETS Current �nancial assets
Current �nancial derivative instruments HD 12 76 76
Total current �nancial assets 76 76
Total �nancial assets 76 76
LIABILITIES
Non-current �nancial liabilities
Non-current �nancial derivative instruments HD 15 2,418 2,418
Total non-current �nancial liabilities 2,418 2,418
Current �nancial liabilities
Current �nancial derivative instruments FLHfT 24 45 45
Total current �nancial liabilities 45 45
Total �nancial liabilities 2,463 2,463
Capital ManagementThe main objective of the Group in managing its own resources is to maintain a high credit rating and a correct equity structure to support the core business and maximize shareholder value.The resources available to the Group are managed according to the reference economic environment. The main measurement used to monitor the �nancial structure is the debt/equity ratio. Net debt is calculated as the total exposure to �nancial institutions less cash and cash equivalents and current �nancial receivables.Net equity is all the components of capital and reserves.At 31 December 2012 the carrying value of Group net equity was lower than its net present value. However, this should not be considered an indication of impairment or of the existence of impairment that could lead to a reduction in the carrying value of the Group’s invested capital as:• this di�erence has fallen substantially in the �rst quarter of 2013;• the Group order portfolio at 31 December 2012 was particularly strong and higher than the level at the end of previous
reporting periods;• the order portfolio at the end of the reporting period under review o�ered better margin prospects compared to the margins
achieved in the �nancial period under review;• the geographical diversi�cation of the business reduces to a minimum the risk of revenues concentrated in speci�c markets. It
should be noted that over 90% of revenues are generated outside Italy.

70
Annual Report at 31 December 2012
NOTES TO THE CONSOLIDATED STATEMENT OF FINANCIAL POSITIONNON-CURRENT ASSETS
(1) Tangible Fixed Assets:Tangible �xed assets at 31 December 2012 were Euro 339.471 million and were almost unchanged compared to the previous �nancial year.
Movements relating to the 2011 �nancial year are summarized in the table below:Description Historical
cost at31/12/10
Acc.depr. at
31/12/10
Net value at
31/12/10
Incr. Decr. Deprec-iation
Use of reserve
Other changes
Ex-ratedi�.
CHistoricalcost at
31/12/11
Acc.depr. at
31/12/11
Net value at
31/12/11
Land 19,208 0 19,208 2,378 0 0 0 0 (14) 21,572 0 21,572
Buildings 80,785 (17,378) 63,407 2,487 (16) (3,453) 0 (516) 627 83,367 (20,831) 62,536
Plant and machinery 340,364 (143,497) 196,867 36,004 (9,945) (26,141) 4,956 270 3,940 370,633 (164,682) 205,951
Industrial and commercial 56,232 (36,928) 19,304 8,976 (2,287) (5,878) 1,211 (127) (20) 62,774 (41,595) 21,179
equipment 62,299 (37,811) 24,488 5,566 (3,706) (6,603) 1,413 (427) 285 64,017 (43,001) 21,016
Other assets 488 0 488 8,190 (2,055) 0 0 750 8 7,381 0 7,381
Fixed assets under construction 559,376 (235,614) 323,762 63,601 (18,009) (42,075) 7,580 (50) 4,826 609,744 (270,109) 339,635
Movements relating to the 2012 �nancial year are summarized in the table below:Description Historical
cost at31/12/11
Acc.depr. at
31/12/11
Net value at
31/12/11
Incr. Decr. Deprec-iation
Use of reserve
Other changes
Ex-ratedi�.
CHistoricalcost at
31/12/12
Acc.depr. at
31/12/12
Net value at
31/12/12
Land 21,572 0 21,572 10 0 0 0 240 1 21,822 0 21,822
Buildings 83,367 (20,831) 62,536 3,376 (735) (4,299) 784 4,180 (295) 89,894 (24,346) 65,548
Plant and machinery 370,633 (164,682) 205,951 30,429 (7,911) (25,504) 5,448 (3,623) (2,434) 387,093 (184,737) 202,356
Industrial and commercial equipment 62,774 (41,595) 21,179 11,397 (5,859) (7,476) 2,684 2,556 (75) 70,793 (46,387) 24,407
Other assets 64,019 (43,001) 21,016 8,648 (3,608) (6,613) 973 1,713 (137) 70,635 (48,642) 21,993
Fixed assets under construction and pre-payments 7,381 0 7,381 4,970 (3,973) 0 0 (4,988) (45) 3,345 0 3,345
TOTAL 609,744 (270,109) 339,635 58,830 (22,085) (43,891) 9,889 78 (2,985) 643,582 (304,112) 339,471

71
Consolidated Financial Statements at 31 December 2012Consolidated Financial Statements at 31 December 2012
The gross increase in the period was Euro 58.830 million while decreases were Euro 22.085 million; the movements re�ect the normal replacement of plant and machinery. The exchange rate e�ect in 2012 was negative for Euro 2.985 million. Some �xed assets are mortgaged as part of �nancing agreements, as described under the entry for debt.At 31 December 2012, the net carrying value of �xed assets held on lease and hire contracts was Euro 77.424 million (in 2011 it was Euro 73.828 million).
Description 31/12/2012 31/12/2011 VariazioniLand and buildings 29,161 27,665 1,496
Plant and machinery 45,958 44,038 1,920
Industrial and commercial equipment 0 0 0
Other assets 2,305 2,124 180
Fixed assets under construction and pre-payments 0
TOTAL 77,424 73,828 3,597
Leased assets are used as guarantees for the related liabilities assumed.
(2) Intangible Fixed assets:At 31 December 2012, intangible �xed assets totalled Euro 28.025 million, an increase of Euro 7.472 million compared to 31 December 2011.
Movements relating to the 2011 �nancial year are summarized in the table below:Description Historical
cost at31/12/2010
Acc. depr. at
31/12/2010
Net valueat
31/12/2010
Increase Decrease Depr. Historical cost at
31/12/2011
Acc. depr. at
31/12/2011
Net valueat
31/12/2011
Goodwill 6,001 0 6,001 6,001 0 6,001
Development costs 18,991 (11,759) 7,232 2,691 (3,077) 21,682 (14,836) 6,846
Industrial patents & use of intellectual property 4,780 (3,973) 807 535 (432) 5,315 (4,405) 910
Concessions, licences, brands & other similar rights 2,338 (1,324) 1,014 326 (164) (373) 2,500 (1,697) 803
Fixed assets under construction and pre-payments 2,473 0 2,473 2,172 4,645 0 4,645
Other intangible �xed assets 5,467 (4,551) 916 807 (375) 6,274 (4,926) 1,348
TOTAL 40,050 (21,607) 18,443 6,531 -164 (4,257) 46,417 (25,864) 20,553
Movements relating to the 2012 �nancial year are summarized in the table below:Description Historical
cost at31/12/2011
Acc. depr. at
31/12/2011
Net valueat
31/12/2011
Increase Decrease Depr. Historical cost at
31/12/2012
Acc. depr. at
31/12/2012
Net valueat
31/12/2012
Goodwill 6,001 0 6,001 6,001 0 6,001
Development costs 21,682 (14,836) 6,846 7,183 (3,962) 28,538 (18,472) 10,066
Industrial patents & use of intellectual property 5,315 (4,405) 910 445 (530) 5,760 (4,936) 824
Concessions, licences, brands & other similar rights 2,500 (1,697) 803 219 (223) 2,720 (1,920) 800
Fixed assets under construction and pre-payments 4,645 0 4,645 2,693 7,338 0 7,338
Other intangible �xed assets 6,274 (4,926) 1,348 2,242 (593) 8,838 (5,842) 2,996
TOTAL 46,417 (25,864) 20,553 12,782 (5,308) 59,195 (31,170) 28,025

72
Annual Report at 31 December 2012
The net value of development costs at 31 December 2012 was Euro 10.066 million (Euro 6.846 million at 31 December 2011), with an increase in the period of Euro 7.183 million for capitalised costs for the development of special foundations technologies and equipment by the subsidiaries of the Mechanical Engineering Division and by Trevi S.p.A. in the special foundations and drilling sector; the costs, which meet the requirements of IAS 38, were capitalised and subsequently amortised from the start of production and over the average economic life, estimated at �ve years, of the relevant equipment.
Recurring research and development costs in 2012, charged to pro�t or loss were Euro 10.482 million, compared to Euro 12.796 million in 2011.The gross increase of Euro 0.445 million in licence costs mainly re�ects the capitalisation of costs for the use of computer programmes.The gross increase in the cost of concessions, licences and brands was Euro 0.219 million (Euro 0.326 million in the preceding �nancial year).The entry for intangible �xed assets under construction and pre-payments refers to the costs sustained by Trevi Energy S.p.A. for the development of an innovative wind energy turbine.In the period under review there were no indications of impairment necessitating adjustments to the research and development costs in the Statement of Financial Position.Other intangible �xed assets were Euro 2.996 million at 31 December 2012, a gross increase of Euro 2.242 million compared to the previous �nancial year.
Impairment test on the carrying value of goodwillEuro 6.001 million of goodwill was recognised for the acquisition of the subsidiary Watson Inc., which took place in the 2008 �nancial year. Under IAS 36, goodwill is not subject to amortisation but is subject to impairment testing at least once a year or more frequently if there are any indications of impairment. The goodwill is allocated to a cash-generating unit or group of cash-generating units which is not larger than the operating segment determined in accordance with IFRS 8. The criteria followed in allocating goodwill represent the lowest level within the entity at which the goodwill is monitored for internal management purposes. The impairment test compares the recoverable value of the cash-generating unit to which the goodwill is allocated with the carrying amount of its operating assets. The recoverable value is the greater between the value in use (net present value of the expected cash �ows) and the fair value less cost to sell (net selling price). In the case in point, the recoverable value was considered to be the value in use. The value in use was determined by discounting the operating cash �ows, which are the cash �ows available before repayment of debt and remuneration of the shareholders (the Unlevered Discounted Cash Flow method).
The cash �ows used for 2013 were taken from the Budget approved by the Board of Directors, which forecasts an increase in revenues and sales compared to 2012.To calculate the cash �ows for subsequent years a CAGR in revenues of 6.5% for 2013-2017 was used.
The net present value of the operating cash �ows was prudently calculated using a weighted average cost of capital (WACC) of 6.21%, and a Beta of 1.2 was used to calculate the company cost of capital. The growth rate, g, used for the terminal value was 1%.
From the impairment test carried out using the above parameters, the goodwill value of Euro 6.001 million resulted completely recoverable.Management considers that, given the size of the positive di�erence between the value in use and the carrying value of the CGU (cash-generating unit), changing the key assumptions used to estimate the cash �ows would not result in the recoverable amount of the CGU being lower than the carrying value.

73
Consolidated Financial Statements at 31 December 2012Consolidated Financial Statements at 31 December 2012
(3) Investment property:There were no non-operating property investments in 2012.
(4) Investments:Investments were Euro 4.123 million at 31 December 2012, in line with the 2011 �gure of Euro 4.096 million.
A summary of changes in investments in 2012 is given in the table below:Description Balance at
31/12/2011Increase Decrease Revaluation Impairment Balance at
31/12/2012Associates 813 576 1,389
Other investments 3,283 (549) 2,734
TOTAL 4,096 576 (549) 0 0 4,123
Attachment 1a is a list of associate companies and Attachment 1c is a list of shareholdings in other companies; the decrease in other companies is attributable to the full consolidation of Profuro Lda and Trevi Spezialtiefbau Gmbh.
(5) Tax assets for pre-paid taxes:This entry was for the timing di�erences deriving mainly from intragroup eliminations and to the related tax bene�t; at 31 December 2012 these were Euro 22.475 million, an increase of Euro 1.625 million compared to the previous �nancial year.The net change in tax assets for pre-paid taxes and the deferred tax provision are shown in the following table:
31/12/2012 31/12/2011 VariazioniTax assets for pre-paid taxes 22,475 20,850 1,625
Total 22,475 20,850 1,625
Deferred tax liability (30,362) (34,088) 3,726
Total (30,362) (34,088) 3,726
Net position at year-end (7,887) (13,238) 5,351
The main components of tax assets for pre-paid taxes and tax liabilities for deferred taxes and the changes to both in the 2012 and 2011 �nancial years are shown in the following table:
Elimination of intragroup
pro�ts
Lease Fair value Costi sviluppo Ammortamenti Altre Totale
Balance at 01/01/2011 12,631 (10,207) (5,858) (1,259) (3,586) (2,506) (10,786)E�ect on pro�t or loss 782 237 452 (359) (4,266) (3,153)
E�ect on net equity 362 362
Translation di�erences (168) (168)
Other changes 507 507
Balance at 31/12/2011 13,413 (9,970) (5,858) (807) (3,945) (6,071) (13,238)
E�ect on pro�t or loss 264 (281) 308 (80) 1,429 1,640
E�ect on net equity 442 442
Translation di�erences 237 237
Other changes 3,032 3,032
Balance at 31/12/2012 13,677 (10,251) (5,858) (499) (4,026) (931) (7,887)

74
Annual Report at 31 December 2012
(6) Non-current �nancial derivative instruments:At 31 December 2012 there were no non-current �nancial derivatives.
(7) Held to maturity �nancial investments:Financial assets:
Description 31/12/2012 31/12/2011 change
Financial assets 200 200 -
TOTAL 200 200 -
These referred entirely to the subsidiary Trevi S.p.A. and re�ect the entirety of its investment in a liquidity fund of Banca San Paolo di Torino.
(8) Other non-current receivables:
Other non-current �nancial receivables were Euro 4.356 million at 31 December 2012 and were mainly �nancial receivables from associates and guarantee deposits.
Description 31/12/2012 31/12/2011 changeReceivables from associates 2,545 2,405 140
Guarantee deposits 901 1,047 (146)
Other 910 676 234
TOTAL 4,356 4,128 228
The entry for other includes non-current pre-payments made during the �nancial year for transactions that will not be completed in the next twelve months.
(9) Trade receivables and other non-current assets:
Trade receivables and other non-current assets totalled Euro 15.806 million at 31 December 2012.Description 31/12/2012 31/12/2011 changeReceivables from clients 15,538 8,550 6,988
Accrued income and pre-paid expenses 268 209 59
TOTAL 15,806 8,759 7,047
Receivables from clients were exclusively trade receivables due beyond one year. Euro 2.462 million were attributable to the subsidiary Swissboring Overseas Piling Corporation and Euro 13.076 million to the subsidiary Soilmec S.p.A..Trade receivables were discounted to give the net present value of the future cash-in and payments. The discount rate used was 3.5%.

75
Consolidated Financial Statements at 31 December 2012Consolidated Financial Statements at 31 December 2012
CURRENT ASSETS
(10) InventoriesInventories were Euro 352.322 million at 31 December 2012 and the breakdown was as follows:
Description 31/12/2012 31/12/2011 changeRaw materials, ancillary materials and consumables 167,091 196,995 (29,904)
Work in progress and semi-�nished goods 48,766 42,436 6,330
Finished goods and products 132,832 147,320 (14,488)
Pre-payments 3,633 3,397 236
TOTAL INVENTORIES 352,322 390,147 (37,825)
The Group closing inventories were mainly due to the Mechanical Engineering Division for the development of special foundation and oil drilling and extraction machinery; the remaining inventories were for materials and spare parts for special foundations machinery. Inventories are shown net of provisions of Euro 5.927 million (at 31 December 2011 provisions were Euro 5.935 million), mainly attributable to the Mechanical Engineering Division to cover the risk of obsolescence and the slow disposal of some inventory units at the end of the reporting period. (11) Trade receivables and other current receivablesAt 31 December 2012 these totalled Euro 505.323 million and the breakdown was as follows:
Description 31/12/2012 31/12/2011 changeTrade receivables 312,805 404,293 (91,488)
Receivables due from clients 65,807 69,100 (3,293)
Sub-total of trade receivables 378,612 473,393 (94,781)
Receivables from associates 17,496 14,585 2,911
Receivables from the Tax Authority for VAT 25,632 39,062 (13,430)
Other receivables 28,629 37,182 (8,553)
Accrued income and pre-paid expenses 11,374 7,052 4,322
Sub-total of trade receivables and other receivables
461,743 571,274 (109,531)
Tax assets 43,580 30,538 13,042
TOTAL 505,323 601,812 (96,489)
The entry, trade receivables, is net of non-recourse transfers of receivables through factoring transactions. At 31 December 2012, the Group had made non-recourse transfers of trade receivables to factoring companies for a total of Euro 145.790 million (Euro 36.198 million at 31 December 2011).Details of the entries Receivables due from clients and Payables due to clients are shown in the table below:
(Euro ‘000)Description 31/12/2012 31/12/2011 changeCurrent assets:
Contract work in progress 121,233 81,525 39,708
Provisions for losses to completion (3,000) (3,600) 600
Total contract work in progress 118,233 77,925 40,308
Pre-payments from clients (52,426) (8,825) (43,601)
Total receivables from clients 65,807 69,100 (3,293)
Current liabilities:
Contract work in progress 270,745 194,103 76,642
Pre-payments from clients (287,529) (228,626) (58,903)
Total payables due to clients (16,783) (34,523) 17,740

76
Annual Report at 31 December 2012
The entry of Euro 65.807 million for total receivables from clients at 31 December 2012 is contract work in progress net of related pre-payments and is the result of a contract by contract analysis. When the di�erence is positive (contract work in progress is greater than the pre-payments received), it is recognised in current assets under trade receivables from clients as sums due from the purchasers. When the di�erence is negative, it is recognised in current liabilities under the entry, other payables, as the sum owed to purchasers.The Euro 13.430 million decrease in VAT receivables was Euro 10.746 million due to the subsidiary Drillmec S.p.A., Euro1.432 million to Gomec S.p.A. and Euro 0.707 million to Soilmec S.p.A.Trade receivables are also shown net of any related provisions and include the positive di�erence deriving from the netting o� of the pre-payments for each single contract. The provision for doubtful receivables was Euro 16.850 million. Changes in this provision are shown in the table below:
Description Balance at 31/12/2011
Provisions Uses Releases Other changes Balance at 31/12/2012
Provision for doubtful receivables 12,090 7,338 (2,026) (601) (34) 16,768
Provision for interest on arrears 82 0 0 0 82
TOTAL 12,172 7,338 (2,026) (601) (34) 16,850
Provisions totalled Euro 7.338 million (Euro 1.066 million in the previous �nancial year) and refer to individual valuations of receivables based on a speci�c analysis of each situation where there may be a payment risk. The �gure was attributable to various companies in the Group.
Accrued income and pre-paid expensesThese were mainly accruals and may be broken down as follows:
Description 31/12/2012 31/12/2011 changePre-payment of insurance premiums 4,126 2,295 1,831
Pre-paid rental liabilities 1,142 1,040 102
Interest (under the Sabatini Law) 125 148 (23)
Commissions on bank guarantees 389 222 167
Other 5,591 3,347 2,244
TOTAL 11,374 7,052 4,322
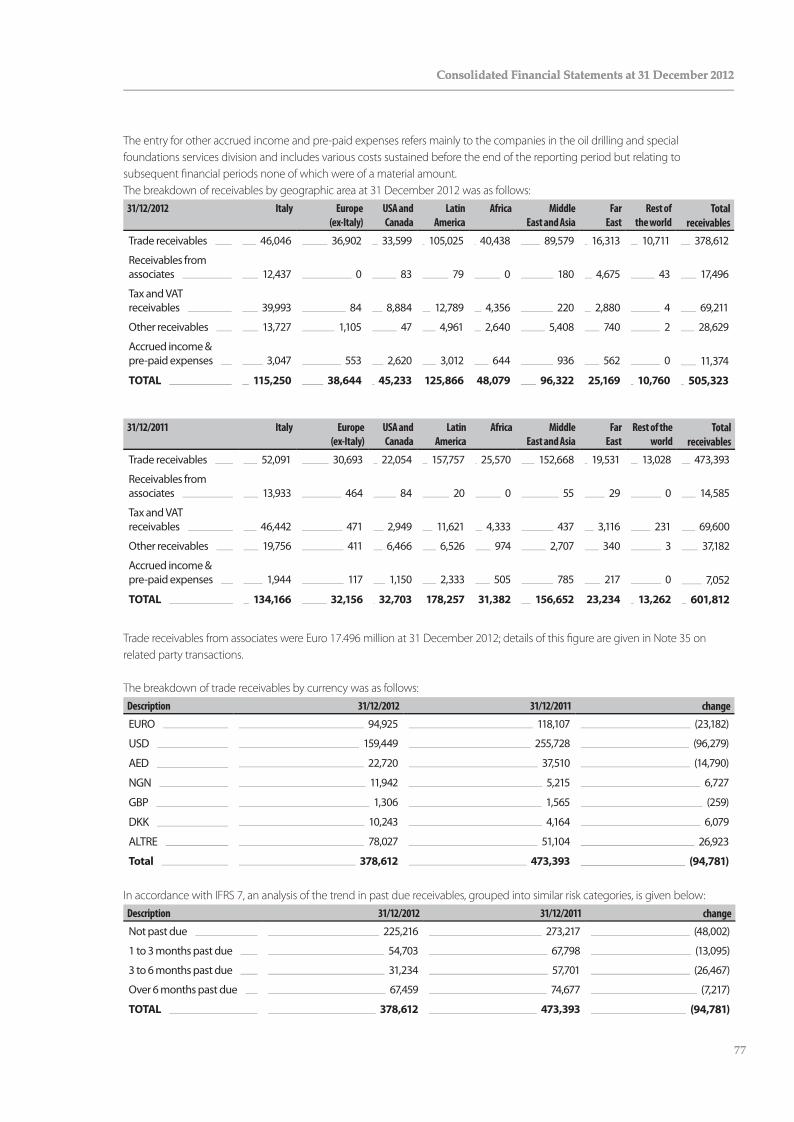
77
Consolidated Financial Statements at 31 December 2012Consolidated Financial Statements at 31 December 2012
The entry for other accrued income and pre-paid expenses refers mainly to the companies in the oil drilling and special foundations services division and includes various costs sustained before the end of the reporting period but relating to subsequent �nancial periods none of which were of a material amount.The breakdown of receivables by geographic area at 31 December 2012 was as follows:
31/12/2012 Italy Europe (ex-Italy)
USA and Canada
LatinAmerica
Africa MiddleEast and Asia
FarEast
Rest of the world
Total receivables
Trade receivables 46,046 36,902 33,599 105,025 40,438 89,579 16,313 10,711 378,612
Receivables from associates 12,437 0 83 79 0 180 4,675 43 17,496
Tax and VAT receivables 39,993 84 8,884 12,789 4,356 220 2,880 4 69,211
Other receivables 13,727 1,105 47 4,961 2,640 5,408 740 2 28,629
Accrued income & pre-paid expenses 3,047 553 2,620 3,012 644 936 562 0 11,374
TOTAL 115,250 38,644 45,233 125,866 48,079 96,322 25,169 10,760 505,323
31/12/2011 Italy Europe (ex-Italy)
USA and Canada
LatinAmerica
Africa MiddleEast and Asia
FarEast
Rest of the world
Total receivables
Trade receivables 52,091 30,693 22,054 157,757 25,570 152,668 19,531 13,028 473,393
Receivables from associates 13,933 464 84 20 0 55 29 0 14,585
Tax and VAT receivables 46,442 471 2,949 11,621 4,333 437 3,116 231 69,600
Other receivables 19,756 411 6,466 6,526 974 2,707 340 3 37,182
Accrued income & pre-paid expenses 1,944 117 1,150 2,333 505 785 217 0 7,052
TOTAL 134,166 32,156 32,703 178,257 31,382 156,652 23,234 13,262 601,812
Trade receivables from associates were Euro 17.496 million at 31 December 2012; details of this �gure are given in Note 35 on related party transactions.
The breakdown of trade receivables by currency was as follows:Description 31/12/2012 31/12/2011 changeEURO 94,925 118,107 (23,182)
USD 159,449 255,728 (96,279)
AED 22,720 37,510 (14,790)
NGN 11,942 5,215 6,727
GBP 1,306 1,565 (259)
DKK 10,243 4,164 6,079
ALTRE 78,027 51,104 26,923
Total 378,612 473,393 (94,781)
In accordance with IFRS 7, an analysis of the trend in past due receivables, grouped into similar risk categories, is given below:Description 31/12/2012 31/12/2011 changeNot past due 225,216 273,217 (48,002)
1 to 3 months past due 54,703 67,798 (13,095)
3 to 6 months past due 31,234 57,701 (26,467)
Over 6 months past due 67,459 74,677 (7,217)
TOTAL 378,612 473,393 (94,781)

78
Annual Report at 31 December 2012
The constant monitoring by each company in the Group has led to the development of categories for trade receivables. These are given in the table below:
Description 31/12/2012 31/12/2011 changeStandard monitoring 336,047 421,913 (85,867)
Special monitoring 36,521 45,993 (9,472)
Monitoring for possible legal action 1,753 666 1,087
Extra-judicial monitoring in progress 182 1 181
Monitoring of legal action in progress 4,110 4,820 (710)
TOTAL 378,612 473,393 (94,781)
Il dettaglio dei “Crediti verso altri” è il seguente:Description 31/12/2012 31/12/2011 changeDue from employees 2,191 2,147 44
Pre-payments to suppliers 10,334 14,190 (3,856)
Due from factoring companies 8,495 13,602 (5,107)
Other 7,609 7,242 367
TOTAL 28,629 37,182 (8,553)
(11a) Tax assets for current taxesTax receivables from the Tax Authority are primarily direct tax receivables and pre-paid taxes.
Description 31/12/2012 31/12/2011 changeDirect tax receivables 43,580 30,538 13,042
TOTAL 43,580 30,538 13,042
The more material amounts are for tax credits from abroad and pre-payments made by the Italian subsidiaries.The �gure at the end of the reporting period also includes a Euro 3.4 million tax reimbursement requested under Article 2 of Legislative Decree 201/2011 (known as the “Salva Italia” Decree) which introduced the possibility of deducting an amount equivalent to the amount of IRAP tax paid for personnel and similar expenses from the tax charge. Under the aforementioned law it is possible to request reimbursement of the excess taxes paid for the �nancial years of 2007 to 2012.
(12) Current �nancial derivatives and available-for-sale securities at fair valueAt 31 December 2012, this entry was Euro 0.076 million compared to Euro 0.511 million at the end of the preceding �nancial year.
(13) Cash and cash equivalentsThe breakdown of this entry was as follows:
Description 31/12/2012 31/12/2011 change
Bank and postal deposits 188,462 161,323 27,139
Cash and cash equivalents 1,463 1,292 171
TOTAL 189,925 162,615 27,310
An analysis of the net �nancial position and the cash and cash equivalents of TREVI Group may be found in the Directors’ Report on Operations and the Statement of Cash Flows.

79
Consolidated Financial Statements at 31 December 2012Consolidated Financial Statements at 31 December 2012
SHAREHOLDERS’ FUNDS AND LIABILITIES
(14) SHAREHOLDERS’ FUNDSConsolidated statement of changes in net equity:
Description Share capital
Share premium
reserve
Legalreserve
Other reserves
Translation reserve
Retained pro�ts
Group net pro�t for the year
Total Net Equity
Balance at 31/12/2010 32,000 34,355 5,569 31,435 (14,290) 218,727 46,360 354,158
Allocation of 2010 net pro�t 451 266 37,323 (38,040) 0
Dividend distribution (8,320) (8,320)
Translation di�erences 10,948 10,948
Acquisition of non-controlling interests (444) (445)
Cash Flow hedge reserve 3,097 41,908 45,005
Sale/ (purchase) of treasury shares (541) (541)
Group share of net pro�t for the year (57) (637) (694)
Dividend distribution 25,700 25,700
Balance at 31/12/2011 35,040 76,263 6,021 30,524 (3,342) 255,606 25,700 425,811
Allocation of 2011 net pro�t 670 3,610 0 12,295 (16,575) -
Dividend distribution (9,125) (9,125)
Translation di�erences (6,947) 0 0 (6,947)
Acquisition of non-controlling interests (265) (265)
Cash Flow hedge reserve (882) (882)
Sale/ (purchase) of treasury shares (7) (50) (57)
Group share of net pro�t for the year 10,803 10,803
Balance at 31/12/2012 35,033 76,263 6,691 33,201 (10,289) 267,636 10,803 419,339

80
Annual Report at 31 December 2012
Share capital:At 31 December 2012 the fully paid-up and issued share capital of the Company was Euro 35,097,150 comprised of 70,194,300 ordinary shares each of nominal value Euro 0.50. Following the purchase of 128,400 treasury shares during the period under review, the share capital shown in the Financial Statements is Euro 35,032,950, made up of 70,065,900 ordinary shares each of nominal value Euro 0.50.
During 2012, using the authority granted by the Shareholders’ Meeting, the Company acquired 14,000 treasury shares; the transactions were recognised directly in equity as required by IAS 32.
Number of shares Share capital Treasury shares
Balance at 31/12/2006 64,000,000 32,000,000 -
Purchase and sale of treasury shares (366,500) (183,250) (4,398,796)
Balance at 31/12/2007 63,633,500 31,816,750 (4,398,796)
Purchase and sale of treasury shares (406,889) (203,445) (4,061,100)
Balance at 31/12/2008 63,226,611 31,613,306 (8,459,896)
Purchase and sale of treasury shares 773,389 386,694 8,697,727
Balance at 31/12/2009 64,000,000 32,000,000 237,830
Purchase and sale of treasury shares - - (227,503)
Balance at 31/12/2010 64,000,000 32,000,000 10,327
Transfer to extraordinary reserve -10,327
Balance at 29/04/2011 64,000,000 32,000,000 -
Conversion of indirect convertible bond 6,194,300 3,097,150 -
Balance at 30/11/2011 70,194,300 35,097,150 -
Purchase and sale of treasury shares (114,400) (57,200) (636,967)
Balance at 31/12/2011 70,079,900 35,039,950 (636,967)
Purchase and sale of treasury shares (14,000) (7,000) (50,304)
Balance at 31/12/2012 70,065,900 35,032,950 (687,271)
Share premium reserve: This was Euro 76.263 million at 31 December 2012.
Legal reserve: The legal reserve is the share of the net pro�t that pursuant to Article 2430 of the Italian Civil Code may not be distributed as dividends. Compared to the �gure at 31 December 2011, the legal reserve increased Euro 0.670 million following the allocation to this reserve of 5% of the pro�t for the year for 2011. At 31 December 2012, this reserve was Euro 6.691 million.
Other reserves:This entry was made up of the following reserves:
Fair value reserveThis reserve includes the changes in fair value of �nancial derivative instruments valued as cash �ow hedges under IAS 39.

81
Consolidated Financial Statements at 31 December 2012Consolidated Financial Statements at 31 December 2012
Reserve for the conversion of bonds:Following expiry of the indirect convertible bond loan, the Shareholders’ Meeting of 27 April 2012 approved the transfer to the extraordinary reserve of the convertible bond reserve totalling Euro 4.650 million; this reserve was the result of the accounting of the option component implicit in the Indirect Convertible Bond Loan issued by the Company on 30 November 2006.
Extraordinary reserve:At 31 December 2012, the extraordinary reserve was Euro 22.719 million, an increase of Euro 8.277 million compared to the previous �nancial year. The increase re�ected the retained net pro�t of the Company for 2011 of approximately Euro 3.610 million and the transfer to this reserve of the value of the reserve for the conversion of bonds for approximately Euro 4.650 million.
IFRS reserve:The �gure of Euro 13.789 million at 31 December 2012 comprised all the adjustments made for the transition to IAS/IFRS accounting, which was adopted from 1 January 2004.
Reserve for treasury shares:The reserve for treasury shares was Euro 0.687 million at 31 December 2012, an increase of Euro 0.050 million compared to 31 December 2011, which re�ected the purchase of treasury shares.
The amount of this reserve was the result of sales and purchase transactions in the Company’s own shares in 2012 as authorised by the Shareholders’ Meeting.
Currency translation reserveThis was negative for Euro 10.289 million at 31 December 2012; it re�ected the exchange rate di�erences deriving from the translation of �nancial statements prepared in currencies other than the Euro. The revaluation of the US dollar against the Euro during 2012 compared to 2011 had a negative impact on this reserve of Euro 6.947 million.
Retained pro�ts: This entry includes the pro�t generated in previous �nancial years which has not been distributed as dividends to shareholders and includes the pro�t for the year.
Dividends distributed in 2012:The Shareholders’ Meeting of 27 April 2012 approved a dividend distribution of Euro 0.13 per share, with an ex-dividend date of 9 July 2012 and payment from 12 July 2012, for a total of Euro 9.125 million. At 31 December 2012, all dividends approved by the company had been paid.

82
Annual Report at 31 December 2012
NON-CURRENT LIABILITIES
(15) Non-current debt, other non-current �nancing and derivative instrumentsDescription 31/12/2012 31/12/2011 changeBank debt 188,888 231,218 (42,330)
Debt to leasing companies 32,990 41,741 (8,751)
Payables for other non-current �nancing 17,694 14,137 3,557
Financial derivative instruments 2,418 1,095 1,323
TOTAL 241,990 288,191 (46,201)
La suddivisione dei debiti verso banche per scadenza si può così riassumere:Description From 1-5 years Beyond 5 years TotalBank debt 167,555 21,333 188,888
TOTAL 167,555 21,333 188,888
Si evidenzia, inoltre, la suddivisione dei debiti verso società di leasing per scadenza:
Description From 1-5 years Beyond 5 years TotalDebt to leasing companies 22,668 10,322 32,990
TOTAL 22,668 10,322 32,990
Material Group �nancing was as follows: • the non-current part of the eight-year �oating rate loan, originally for Euro 10,000,000, was Euro 833,337; this �nancing is
repayable in twelve six-monthly instalments with �nal payment on 05/04/2014. Interest payable is Euribor plus a spread.• the non-current part of the �oating rate loan, originally for Euro 50,000,000 was Euro 48,000,000; this loan is repayable in twenty
quarterly instalments with �nal payment on 03/11/2020. Interest payable is Euribor plus a spread.• The non-current part of the �oating rate loan, originally for Euro 10,000,000, was Euro 2,587,671; this mortgage is repayable in
sixteen quarterly instalments with �nal payment on 29/12/2014. Interest payable is Euribor plus a spread.• The non-current part of the �oating rate loan, originally for Euro 10,000,000, was Euro 1,747,498; this mortgage is repayable in
twelve quarterly instalments with �nal payment on 30/06/2014. Interest payable is Euribor plus a spread.• The non-current part of the �oating rate loan, originally for Euro 9,000,000, was Euro 5,400,000; this mortgage is repayable in ten
six-monthly instalments with �nal payment on 31/07/2016. Interest payable is Euribor plus a spread.• The non-current part of the �oating rate loan, originally for Euro 17,000,000, was Euro 5,666,667; this mortgage is repayable in six
six-monthly instalments with �nal payment on 11/12/2014. Interest payable is Euribor plus a spread.• The non-current part of the �oating rate loan, originally for Euro 50,000,000, was Euro 30,000,000; this mortgage is repayable in
ten six-monthly instalments with �nal payment on 28/11/2016. Interest payable is Euribor plus a spread.• The non-current part of the �oating rate loan, originally for Euro 30,000,000, was Euro 20,000,000; this �nancing is repayable in
�ve annual instalments with �nal payment on 30/12/2015. Interest payable is Euribor plus a spread. • The non-current part of the �oating rate loan, originally for Euro 10,000,000 was Euro 6,000,000; this �nancing is repayable in �ve
six-monthly instalments with �nal payment on 06/02/2015. Interest payable is Euribor plus a spread.
During the 2012 �nancial year, the Group set up total �nancing of Euro 100 million. Interest payable is �oating rate and linked to Euribor plus a spread.
Some of these �nancing agreements contain covenants which require the maintenance of certain �nancial ratios calculated on

83
Consolidated Financial Statements at 31 December 2012Consolidated Financial Statements at 31 December 2012
the Consolidated Financial Statements as follows:• Net Financial Position / EBITDA: an indicator of indebtedness, calculated as the ratio of net �nancial debt to EBITDA;• Net Financial Position/ Net Equity: an indicator of indebtedness, calculated as the ratio of net debt to net equity;• EBITDA/ Net Financial Charges: an indicator of the weight of interest charges calculated as the ratio of EBITDA to interest
charges;
The covenants allow for a cure period should the covenants not be respected; after the cure period has elapsed, the �nancial institutions that have granted the �nancing may demand that the conditions of the loan be renegotiated or request early repayment of the loan.At 31 December 2012 all the �nancial covenants listed above had been respected.
The total amount of payables to leasing companies was Euro 45.228 million, which corresponded to their fair value since all the payables carried �oating rate interest.
Payables for other non-current �nancing were Euro 17.694 million and were mainly for the residual payables for the acquisition of non-controlling interests in some subsidiaries in South America and the Far East.
Non-current �nancial derivatives totalled Euro 2.418 million, an increase of Euro 1.324 million compared to the �gure for the 2011 �nancial year. The entire �gure at 31 December 2012 was the fair value of the interest rate swap agreed by the Group and accounted as a cash �ow hedge.
(16) Tax liabilities for deferred taxes and other non-current provisionsTax liabilities for deferred taxes and provisions for risks and expenses totalled Euro 41.856 million, an increase of Euro 2.830 million compared to 31 December 2011.
The movements in the deferred tax provision are shown in the following table: Balance at 31/12/2011 Provisions Uses Other Balance at 31/12/2012
Deferred tax provision 34,088 2,392 (5,826) (292) 30,362
TOTAL 34,088 2,392 (5,826) (292) 30,362
The deferred tax provision re�ects the di�erence in the value of assets and liabilities in the Consolidated Financial Statements and the corresponding values �scally recognised by the countries in which the Group operates. Details of the deferred tax provision are given in Note 5 to the Financial Statements.The balance of other provisions was Euro 11.494 million, an increase of Euro 6.556 million compared to 31 December 2011. This balance was the result of the changes in 2012 shown below:
Description Balance at 31/12/2011 Provisions Uses Other Balance at 31/12/2012Other risk provisions 4,938 8,275 (893) (826) 11,494
TOTAL 4,938 8,275 (893) (826) 11,494
The breakdown of other provisions was as follows:Description 31/12/2012 31/12/2011 changeProvisions for contractual risks 0 0 0
Warranty reserve 2,292 2,290 2
Provision for losses from associates 742 742 0
Legal disputes 236 575 (339)
Other 8,223 1,331 6,892
TOTAL 11,494 4,938 6,555

84
Annual Report at 31 December 2012
The provision for contractual risks of Euro 2.292 million was provisions made for interventions under technical guarantees given on products of the Mechanical Engineering Division.The Euro 0.742 million provision for losses from associates refers mainly to the Joint Venture Rodio-Trevi-Arab Contractor.The provision for legal disputes totalled Euro 0.236 million and was Euro 0.171 million due to the subsidiary Pilotes Trevi Sacims in Argentina and for Euro 0.065 million to Soilmec France.This provision represents the best estimates of management for the liabilities required to be accounted for and due to:• Legal procedures arising from normal operations;• Legal procedures involving the tax authorities.The item, other risk provisions, includes provisions made by the management for various probable liabilities attributable to various Group companies and linked to the current di�cult macroeconomic scenario.
(17) Potential liabilitiesThe nature of the Group business reduces the risks to which it is exposed since sales of equipment and services are spread over hundreds of contracts each year. Expenses relating to existing or future legal procedures cannot be estimated with certainty. It is possible that the outcome of such procedures entails expenses for which provisions have not been made or which are not covered by insurance guarantees and, therefore, may have an impact on the �nancial position and results of the Group. However, at 31 December 2012, the Group believes that it does not have potential liabilities in excess of the amounts included in the entry, other funds, as it does not believe that it will have to make any payments.
(18) Post-employment bene�tsAt 31 December 2012, the employee termination fund (TFR) and pension liabilities totalled Euro 19.337 million and comprised the indemnities accrued at year-end by employees of Italian companies, as required by law, and provisions made by foreign companies to cover accrued liabilities towards employees. These were calculated as the present value of the de�ned bene�t obligation adjusted for the actuarial gains and losses and were determined by an independent external actuary using the projected unit credit actuarial costs method.Changes in the �nancial year are shown in the following table:
Description Balance at 31/12/2011
Provisions Curtailment e�ect
Indemnities and advances paid
Other changes
Balance at 31/12/2012
Employee termination indemnities 9,793 1,057 0 (535) (188) 10,127
Pension funds and similar liabilities 8,133 9,800 0 (8,167) (557) 9,209
TOTAL 17,926 10,857 0 (8,702) (745) 19,337
Other changes in the pension funds were due to exchange rate translation e�ects deriving from foreign subsidiaries. 31/12/2012 31/12/2011
Opening balance 9,793 9,900
Operating expenses for services 261 252
Liabilities for new employees 13 23
Interest expenses 368 445
Actuarial pro�t/ (loss) 700 241
Indemnities paid (1,133) (1,068)
Transfer to pension funds and tax deductions 125 0
Curtailment e�ect (0) 0
Closing balance 10,127 9,793

85
Consolidated Financial Statements at 31 December 2012Consolidated Financial Statements at 31 December 2012
The main actuarial assumptions were: 31/12/2012 31/12/2011 31/12/2010
Actualisation technical yearly rate 3.25% 4.5% 4.5%
Annual in�ation rate 2.0% 2.0% 2.0%
Annual rate of total salary increases 2.5% 2.5% 2.5%
Annual rate of increase in TFR 3.0% 3.0% 3.0%
For the actuarial calculations at 31 December 2012 a discount rate calculated on a basket of A-rated corporate bonds (iBoxx Eurozone Corporates A 10+ index) was used as recommended by the Association of Actuaries. At 31 December 2011, the calculation used the iBoxx Eurozone Corporates AA 7 – 10 index. The di�erence derived from a recalculation made using bonds with ratings similar to those used in the previous �nancial year was not signi�cant in the context of the total value of liabilities in the Statement of Financial Position.
(19) Other non-current liabilitiesThese were Euro 0.022 million, a Euro 0.044 million decline compared to the �gure for the previous �nancial year.
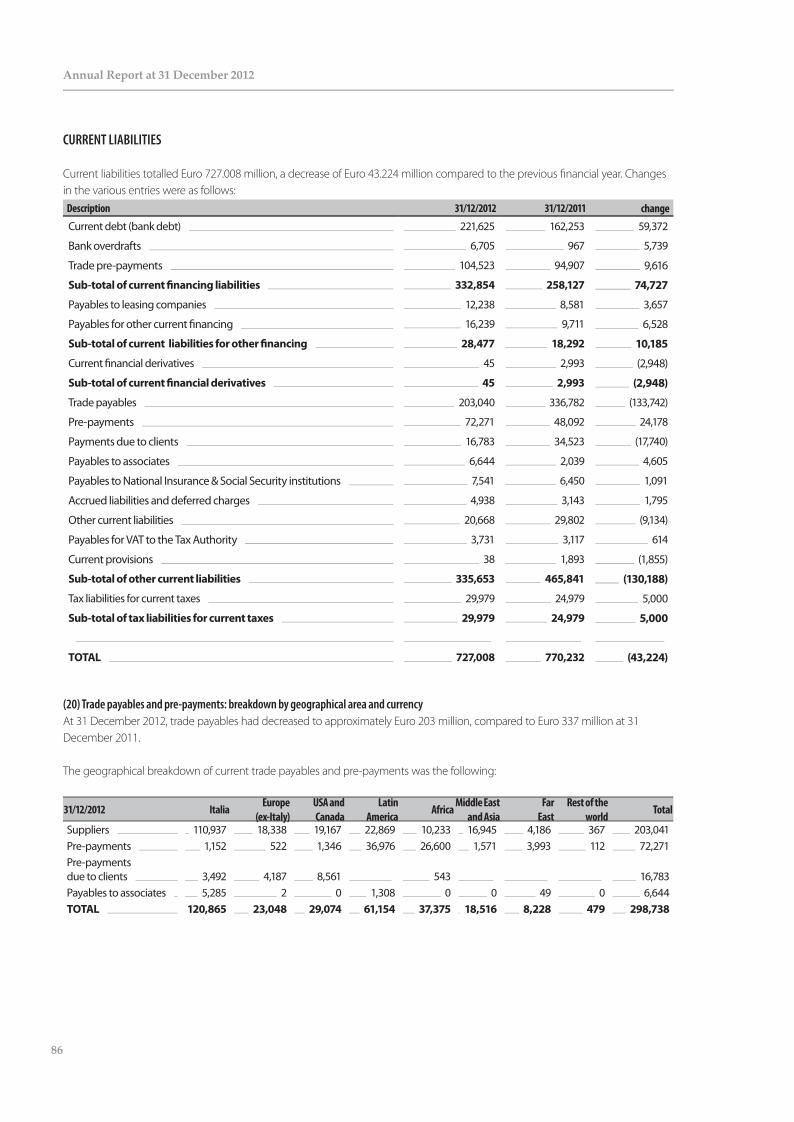
86
Annual Report at 31 December 2012
CURRENT LIABILITIES
Current liabilities totalled Euro 727.008 million, a decrease of Euro 43.224 million compared to the previous �nancial year. Changes in the various entries were as follows:
Description 31/12/2012 31/12/2011 changeCurrent debt (bank debt) 221,625 162,253 59,372
Bank overdrafts 6,705 967 5,739
Trade pre-payments 104,523 94,907 9,616
Sub-total of current �nancing liabilities 332,854 258,127 74,727
Payables to leasing companies 12,238 8,581 3,657
Payables for other current �nancing 16,239 9,711 6,528
Sub-total of current liabilities for other �nancing 28,477 18,292 10,185
Current �nancial derivatives 45 2,993 (2,948)
Sub-total of current �nancial derivatives 45 2,993 (2,948)
Trade payables 203,040 336,782 (133,742)
Pre-payments 72,271 48,092 24,178
Payments due to clients 16,783 34,523 (17,740)
Payables to associates 6,644 2,039 4,605
Payables to National Insurance & Social Security institutions 7,541 6,450 1,091
Accrued liabilities and deferred charges 4,938 3,143 1,795
Other current liabilities 20,668 29,802 (9,134)
Payables for VAT to the Tax Authority 3,731 3,117 614
Current provisions 38 1,893 (1,855)
Sub-total of other current liabilities 335,653 465,841 (130,188)
Tax liabilities for current taxes 29,979 24,979 5,000
Sub-total of tax liabilities for current taxes 29,979 24,979 5,000
TOTAL 727,008 770,232 (43,224)
(20) Trade payables and pre-payments: breakdown by geographical area and currencyAt 31 December 2012, trade payables had decreased to approximately Euro 203 million, compared to Euro 337 million at 31 December 2011. The geographical breakdown of current trade payables and pre-payments was the following:
31/12/2012 ItaliaEurope
(ex-Italy)USA and Canada
Latin America Africa Middle East
and AsiaFar
EastRest of the
world Total
Suppliers 110,937 18,338 19,167 22,869 10,233 16,945 4,186 367 203,041Pre-payments 1,152 522 1,346 36,976 26,600 1,571 3,993 112 72,271Pre-payments due to clients 3,492 4,187 8,561 543 16,783Payables to associates 5,285 2 0 1,308 0 0 49 0 6,644TOTAL 120,865 23,048 29,074 61,154 37,375 18,516 8,228 479 298,738

87
Consolidated Financial Statements at 31 December 2012Consolidated Financial Statements at 31 December 2012
31/12/2011Italia
Europe (ex-Italy)
USA and Canada Latin America Africa
Middle East and
Asia
Far East
Rest of the world Total
Suppliers 212,895 25,252 27,775 35,720 5,351 25,149 3,730 910 336,783
Pre-payments 2,602 5,194 4,828 11,496 12,973 8,319 1,806 875 48,092
Pre-payments due to clients 2,846 6,883 24,794 - - - - - 34,523
Payables to associates 1,620 17 - 352 - - 50 - 2,039
TOTAL 219,963 37,346 57,397 47,568 18,324 33,468 5,586 1,785 421,436
The breakdown of trade payables by currency was as follows:Currency 31/12/2012 31/12/2011 changeEuro 127,435 239,704 (112,269)
US dollar 29,060 55,923 (26,863)
UAE dirham 13,026 11,861 1,165
Nigerian Naira 3,270 1,146 2,125
Other 30,250 28,149 2,102
TOTAL 203,041 336,782 (133,741)
Description 31/12/2012 31/12/2011 change
Pre-payments 72,271 48,092 24,178
Pre-payments due to clients 16,783 34,523 (17,740)
TOTAL 89,054 82,615 6,439
Trade payables and other current liabilities:Payments due to clients:The entry of Euro 16.783 million for payments due to clients was for contract work in progress net of pre-payments received; an analysis of every contract was carried out and, if there was a positive result (because the contract work in progress was greater than the pre-payments received), it was recognised under current assets in the entry, trade receivables; if the result was negative, the �gure was recognised in current liabilities in the entry, other payables, as being due to the client.
Payables to associates:Trade payables to associates were Euro 6.644 million and were almost entirely trade payables of the subsidiary Trevi S.p.A. to various consortia. Further details on this �gure are given in Note 35 on related party transactions.
Payables for VAT to the Tax AuthorityVAT payables to the Tax Authority increased by approximately Euro 0.615 million (from Euro 3.117 million at 31 December 2011) and were Euro 3.732 million at 31 December 2012.They were due to the subsidiary Trevi Foundations Nigeria Ltd for Euro 0.119 million, to Trevi Algeria E.u.r.l. for Euro 0.473 million, to Soilmec UK Ltd for Euro 0.479 million, to Petreven Venezuela and Colombia for a total of Euro 0.346 million and to Trevi Danimarca for Euro 0.755 million.

88
Annual Report at 31 December 2012
Other liabilities:These were mainly the following:
Description 31/12/2012 31/12/2011 changePayables to employees 16,183 15,442 741
Other 4,485 14,360 (9,876)
TOTAL 20,668 29,802 (9,135)
Payables to employees were for salaries and wages in December 2012 and provisions for holidays owed but not taken.
Accrued liabilities and deferred charges:Total accrued liabilities and deferred charges were Euro 4.938 million at 31 December 2012. The breakdown was as follows:
Accrued liabilitiesDescription 31/12/2012 31/12/2011 change
Accrued liabilities on insurance premiums 308 245 63
Other accrued liabilities 3,274 2,172 1,102
TOTAL 3,582 2,417 1,165
Deferred chargesDescription 31/12/2012 31/12/2011 change
Deferred interest charges under the Sabatini and Ossola Laws 144 153 (9)
Other deferred charges 1,212 573 639
TOTAL 1,356 726 630
(21) Tax liabilities for current taxes:At 31 December 2012, the tax liability was Euro 29.979 million and the breakdown was as follows:
Description 31/12/2012 31/12/2011 changeLiability to the Tax Authority for direct taxes 24,911 17,652 7,259
Other 5,068 7,327 (2,259)
TOTAL 29,979 24,979 5,000
(22) Current �nancing:Description 31/12/2012 31/12/2011 changeBank overdrafts 6,705 967 5,739
Trade pre-payments 104,523 94,907 9,616
Bank debt 81,033 84,086 (3,053)
Portion of mortgages and �nancing due within 12 months 140,593 78,168 62,425
TOTAL 332,854 258,127 74,727
Total �nancing to the subsidiary Drillmec Inc. was approximately Euro 3.004 million at 31 December 2012 and was guaranteed by a �rst ranking mortgage.

89
Consolidated Financial Statements at 31 December 2012Consolidated Financial Statements at 31 December 2012
(23) Payables to leasing companies and for other �nancing:Description 31/12/2012 31/12/2011 changePayables to leasing companies 12,238 8,581 3,657
Payables for other current �nancing 16,239 9,711 6,528
TOTAL 28,477 18,292 10,185
Payables to leasing companies were the capital element of instalments payable within twelve months. Payables for other �nancing included Euro 4.252 million for Trevi S.p.A, Euro 1.865 million for Galante SA, Euro 3.694 million for Soilmec S.p.A. and Euro 6.411 million for Drillmec SpA.
(24) Current �nancial derivative instruments:At 31 December 2012, this entry was Euro 0.045 million (Euro 2.993 million at 31 December 2011).The entry was mainly composed of the positive fair value of currency derivative contracts taken out by the Mechanical Engineering Division and by the Services Division for a total notional amount of USD 46 million.Since it was impossible to calculate the fully hedged value of the expected cash �ows from contracts in foreign currencies and the underlying hedged values, the changes in fair value in the �nancial year were recognised in pro�t or loss.
(25) Current provisions:Current provisions were Euro 0.038 million at 31 December 2012.
Net �nancial positionDetails of the net �nancial position are given in the following table:
Note 31/12/2012 31/12/2011 change
A Cash (13) 1,463 1,292 171
B Cash equivalents (13) 188,462 161,323 27,139
C Held for trading securities (12) 0 0 0
D Liquidity (A+B+C) 189,925 162,615 27,310
E Current �nancial receivables (12) (24) 30 (2,482) 2,512
F Current bank debt (22) 192,261 179,959 12,302
G Current portion of non-current debt (22) 140,593 78,168 62,425
H Other current �nancial liabilities (22) 28,477 18,292 10,184
I Current �nancial debt (F+G+H) 361,331 276,419 84,912
J Current net debt (I-E-D) 171,376 116,286 55,090
K Non-current bank debt (15) 188,888 231,217 (42,329)
L Other non-current �nancial liabilities (15) 53,102 56,974 (3,872)
M Non-current �nancial debt (K+L) 241,991 288,191 (46,201)
N Net debt (J+M) 413,367 404,477 8,889
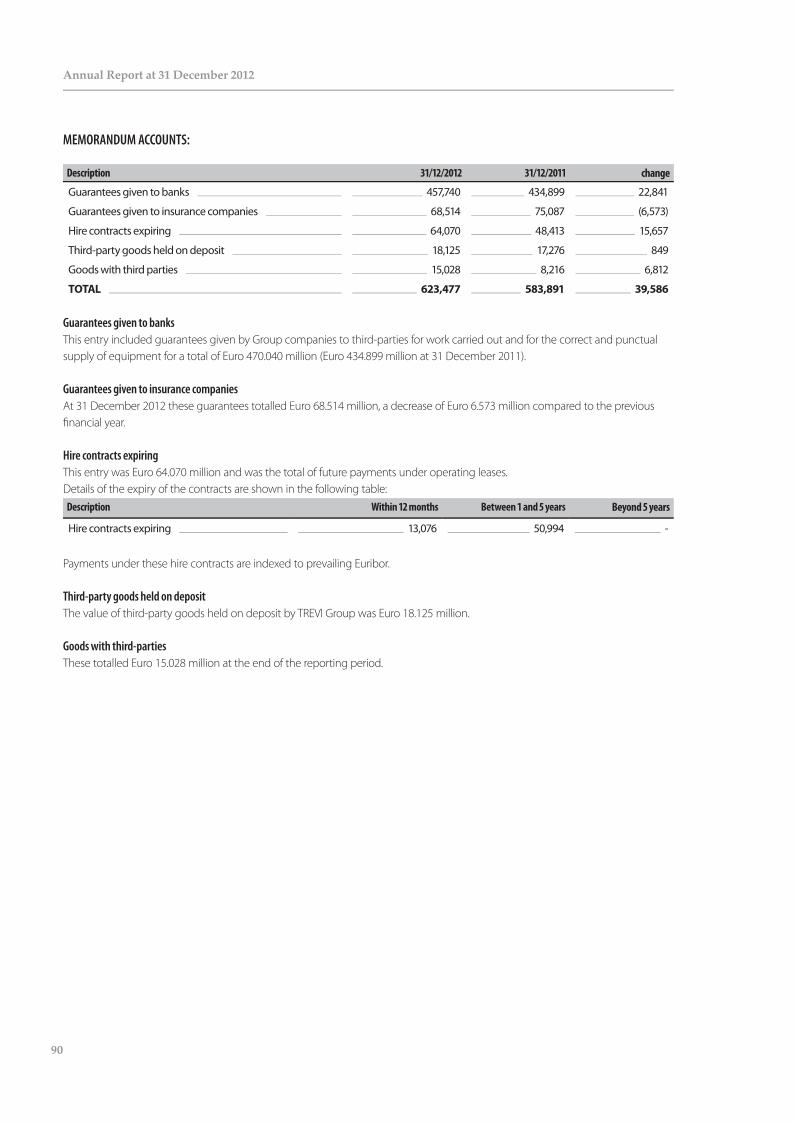
90
Annual Report at 31 December 2012
MEMORANDUM ACCOUNTS:
Description 31/12/2012 31/12/2011 change
Guarantees given to banks 457,740 434,899 22,841
Guarantees given to insurance companies 68,514 75,087 (6,573)
Hire contracts expiring 64,070 48,413 15,657
Third-party goods held on deposit 18,125 17,276 849
Goods with third parties 15,028 8,216 6,812
TOTAL 623,477 583,891 39,586
Guarantees given to banksThis entry included guarantees given by Group companies to third-parties for work carried out and for the correct and punctual supply of equipment for a total of Euro 470.040 million (Euro 434.899 million at 31 December 2011).
Guarantees given to insurance companiesAt 31 December 2012 these guarantees totalled Euro 68.514 million, a decrease of Euro 6.573 million compared to the previous �nancial year.
Hire contracts expiringThis entry was Euro 64.070 million and was the total of future payments under operating leases.Details of the expiry of the contracts are shown in the following table:
Description Within 12 months Between 1 and 5 years Beyond 5 years
Hire contracts expiring 13,076 50,994 -
Payments under these hire contracts are indexed to prevailing Euribor.
Third-party goods held on depositThe value of third-party goods held on deposit by TREVI Group was Euro 18.125 million.
Goods with third-partiesThese totalled Euro 15.028 million at the end of the reporting period.

91
Consolidated Financial Statements at 31 December 2012Consolidated Financial Statements at 31 December 2012
NOTES TO THE CONSOLIDATED INCOME STATEMENTSome details and information on the Consolidated Income Statement for the 2012 �nancial year are given below. A more detailed account of the Group performance is given in the Directors’ Report on Operations.
OPERATING REVENUES
(26) Revenues from sales and services and other revenuesThese totalled Euro 1,115.324 million compared to Euro 1,061.427 million in 2011, an increase of Euro 53.897 million (+5.1%). The Group operates in various business sectors and geographical regions.The geographic breakdown of revenues from sales and services and other revenues is shown in the following table:
Geographic area 31/12/2012 % 31/12/2011 % changeItaly 104,606 9.4% 122,282 11.5% (17,676)
Europe (ex-Italy) 163,083 14.6% 133,749 12.6% 29,334
USA and Canada 171,933 15.4% 157,341 14.8% 14,592
Latin America 284,719 25.5% 328,146 30.9% (43,427)
Africa 110,733 9.9% 67,557 6.4% 43,177
Middle East and Asia 194,592 17.4% 167,015 15.7% 27,577
Far East and Rest of the World 85,657 7.7% 85,337 8.0% 320
TOTAL REVENUES 1,115,324 100% 1,061,427 100% 53,897
The improvement in the revenues from North America was mainly due to the Mechanical Engineering Division and, in particular, the subsidiaries Watson Inc. and Soilmec North America. The revenues of the Special Foundations Division in this area were more or less stable due to the strong trend in contracts won by the North American subsidiaries.
The increase in revenues from Africa is due to those generated by the Special Foundations Division from contracts in West Africa, the Maghreb region and also from revenues from the Mechanical Engineering Division.
Revenues declined in Latin America due to the subsidiaries of the Mechanical Engineering Division. The revenues generated by special foundations and drilling grew compared to those of the previous �nancial year. The revenues also included economic bene�ts generated in Venezuela from the translation of �gures originally in currencies other than the Euro which were used by clients to settle contractual obligations.
The improvement in revenues generated in the Middle East and Asia was due to contracts in the Mechanical Engineering Division for drilling plant and equipment and also to the subsidiaries of the Special Foundations Division active in this area.
The increase in revenues in Europe re�ects the consolidation of Trevi Foundations Denmark, which is carrying out special foundation and consolidation work for the Cityringen Metro Project in Copenhagen. In the Mechanical Engineering Division, Drillmec SpA won interesting sales contracts in Eastern Europe and Belarus.
Revenues were stable year-on-year in the Far East and in the Rest of the World and were mainly due to sales generated by the subsidiaries of the Mechanical Engineering Division.

92
Annual Report at 31 December 2012
The breakdown of Group revenues by business sector is given in the following table: 31/12/2012 % 31/12/2011 % change % change
Special foundation services 453,416 41% 404,335 38% 49,081 12.1%
Drilling services 109,090 10% 98,608 9% 10,482 10.6%
Interdivision eliminations and adjustments (4,370) (7,496) 3,126
Sub-total of the Special Foundations and Drilling Services Division
558,136 50% 495,448 47% 62,689 12.7%
Manufacture of special foundation machinery 236,264 21% 221,969 21% 14,295 6.4%
Oil, gas and water drilling equipment 348,932 31% 378,825 36% (29,893) -7.9%
Interdivision eliminations and adjustments (2,001) (4,112) 2,111
Sub-total of the Mechanical Engineering Division 583,195 52% 596,683 56% (13,487) -2.3%
Parent Company 13,455 13,136 318 2.4%
Interdivision and Parent Company eliminations (39,463) (43,840) 4,377
TREVI Group 1,115,324 100% 1,061,427 100% 53,897 5.1%
Other operating revenues
Other revenues and income were Euro 30.724 million and decreased Euro 0.616 million compared to the preceding �nancial year. The breakdown was as follows:
Description 31/12/2012 31/12/2011 change
Grants for current expenses 964 254 710
Expense recoveries and reallocations to consortia 15,313 11,791 3,522
Release of provisions 1,377 6,390 (5,013)
Sales of spare-parts 2,271 2,360 (89)
Gains on disposal of �xed assets 1,129 824 305
Reimbursement for damages 617 115 502
Rents received 1,082 1,790 (708)
Out-of-period income 2,672 1,724 948
Other 5,299 6,092 (793)
TOTAL 30,724 31,340 (616)
Expense recoveries and reallocations to consortia were Euro 15.313 million, a Euro 3.522 million increase compared to the 2011 �nancial year; sales of spare parts were Euro 2.271 million; gains on disposal of �xed assets were Euro 1.129 million compared to Euro 0.824 million in the preceding �nancial year; out of period income was Euro 2.672 million with Euro 1.196 million from Soilmec S.p.A., Euro 0.381 million from Trevi S.p.A., Euro 0.276 million from Trevi Icos Corp., and Euro 0.303 million from Swissboring Overseas Piling Co.; release of funds totalled Euro 1.377 million and was attributable for Euro 0.777 million to Trevi S.p.A and for Euro 0.600 million to Drillmec S.p.A.
Increase in �xed assets for internal useFixed assets for internal use were Euro 28.042 million compared at 31 December 2012, a decrease of Euro 3.387 million compared to the �gure at 31 December 2011.

93
Consolidated Financial Statements at 31 December 2012Consolidated Financial Statements at 31 December 2012
OPERATING EXPENSESOperating expenses totalled Euro 1,110.137 million compared to Euro 1,068.313 million in the previous �nancial year, an increase of Euro 41.824 million. The breakdown was as follows.
(27) Personnel expenses:These increased Euro 29.567 million year-on-year to Euro 223.038 million at 31 December 2012.
Description 31/12/2012 31/12/2011 changeSalaries and wages 169,253 148,127 21,126
Social Security expenses 35,462 31,424 4,038
Sta�-leaving indemnity fund 1,057 1,043 14
Curtailment e�ect 9,800 6,445 3,355
Other expenses 7,466 6,432 1,034
TOTAL 223,038 193,471 29,567
L’organico dei dipendenti e la variazione rispetto all’esercizio precedente risulta così determinato:Description 31/12/2012 31/12/2011 change MediaManagers 93 88 5 93
Quali�ed sta� 1,887 1,747 140 1,816
Blue collar workers 4,709 4,279 430 4,341
TOTAL PERSONNEL 6,689 6,114 575 6,250
(28) Altri costi operativiDescription 31/12/2012 31/12/2011 changeCosts for services 228,960 215,006 13,954
Expenses for use of third-party assets 45,489 40,084 5,405
Other operating expenses 16,298 15,350 948
TOTAL 290,747 270,440 20,307
Other operating expenses were Euro 290.747 million, an increase of Euro 20.307 million compared to the previous �nancial year; greater detail on this entry is given below.
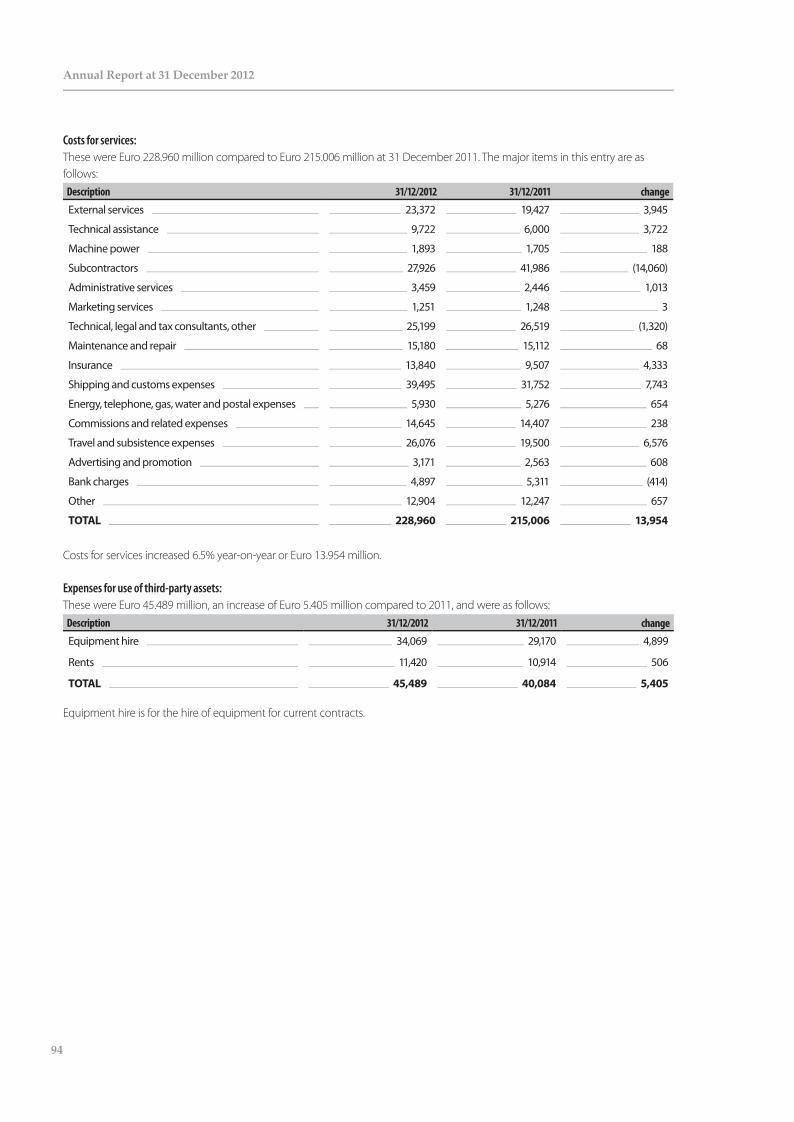
94
Annual Report at 31 December 2012
Costs for services:These were Euro 228.960 million compared to Euro 215.006 million at 31 December 2011. The major items in this entry are as follows:
Description 31/12/2012 31/12/2011 changeExternal services 23,372 19,427 3,945
Technical assistance 9,722 6,000 3,722
Machine power 1,893 1,705 188
Subcontractors 27,926 41,986 (14,060)
Administrative services 3,459 2,446 1,013
Marketing services 1,251 1,248 3
Technical, legal and tax consultants, other 25,199 26,519 (1,320)
Maintenance and repair 15,180 15,112 68
Insurance 13,840 9,507 4,333
Shipping and customs expenses 39,495 31,752 7,743
Energy, telephone, gas, water and postal expenses 5,930 5,276 654
Commissions and related expenses 14,645 14,407 238
Travel and subsistence expenses 26,076 19,500 6,576
Advertising and promotion 3,171 2,563 608
Bank charges 4,897 5,311 (414)
Other 12,904 12,247 657
TOTAL 228,960 215,006 13,954
Costs for services increased 6.5% year-on-year or Euro 13.954 million.
Expenses for use of third-party assets:These were Euro 45.489 million, an increase of Euro 5.405 million compared to 2011, and were as follows:
Description 31/12/2012 31/12/2011 changeEquipment hire 34,069 29,170 4,899
Rents 11,420 10,914 506
TOTAL 45,489 40,084 5,405
Equipment hire is for the hire of equipment for current contracts.

95
Consolidated Financial Statements at 31 December 2012Consolidated Financial Statements at 31 December 2012
Other operating expenses:These totalled Euro 16.298 million and were substantially unchanged compared to the previous �nancial year. They were as follows:
Description 31/12/2012 31/12/2011 changeTaxes other than income taxes 10,452 9,353 1,099
Losses on disposal of assets 2,601 3,114 (513)
Non-recurring expenses 0 0 0
Out of period expenses 1,262 2,125 (863)
Other 1,983 758 1,225
TOTAL 16,298 15,350 948
Le imposte e tasse non sul reddito sono dovute principalmente alle società operanti in America Latina.
(29) Accantonamenti e svalutazioni:Description 31/12/2012 31/12/2011 changeRisk provisions 8,275 2,274 6,001
Provision for doubtful receivables 7,314 1,048 6,266
Losses on receivables 25 18 7
TOTAL 15,614 3,340 12,274
Risk provisions:These were Euro 8.275 million and were mainly provisions for product guarantees, legal disputes and contractual risks in the in the subsidiaries of the Special Foundations and Drilling Division.
Provision for doubtful receivables included in working capital:The amount of Euro 7.339 million was almost entirely for provisions for doubtful trade receivables in subsidiaries and speci�cally Euro 3.550 million for those operating in special foundations and drilling in the Middle East, Euro 2.748 million for Trevi S.p.A. and Euro 0.819 million to subsidiaries of the Mechanical Engineering Division.
(30) Financial revenues:Financial revenues were as follows:
Description 31/12/2012 31/12/2011 changeBank interest 478 563 (85)
Interest charged to clients 266 442 (176)
Other �nancial revenues 10,199 574 9,625
TOTAL 10,943 1,579 9,364
The increase in other �nancial revenues should be read together with the change in the item of bank discounting charges, included in �nancial expenses, and in the item for insurance, included in costs for services; it re�ects the transfer without recourse of non-current trade receivables in the Mechanical Engineering Division.
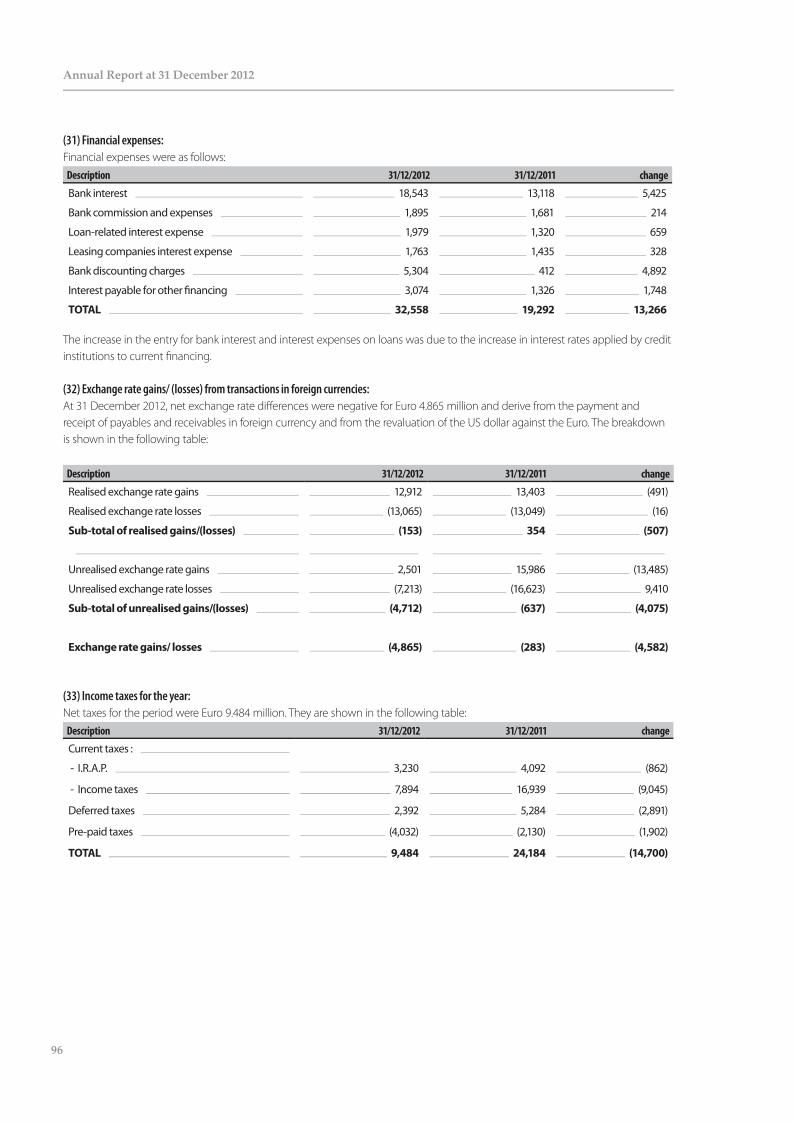
96
Annual Report at 31 December 2012
(31) Financial expenses:Financial expenses were as follows:
Description 31/12/2012 31/12/2011 changeBank interest 18,543 13,118 5,425
Bank commission and expenses 1,895 1,681 214
Loan-related interest expense 1,979 1,320 659
Leasing companies interest expense 1,763 1,435 328
Bank discounting charges 5,304 412 4,892
Interest payable for other �nancing 3,074 1,326 1,748
TOTAL 32,558 19,292 13,266
The increase in the entry for bank interest and interest expenses on loans was due to the increase in interest rates applied by credit institutions to current �nancing.
(32) Exchange rate gains/ (losses) from transactions in foreign currencies:At 31 December 2012, net exchange rate di�erences were negative for Euro 4.865 million and derive from the payment and receipt of payables and receivables in foreign currency and from the revaluation of the US dollar against the Euro. The breakdown is shown in the following table:
Description 31/12/2012 31/12/2011 changeRealised exchange rate gains 12,912 13,403 (491)
Realised exchange rate losses (13,065) (13,049) (16)
Sub-total of realised gains/(losses) (153) 354 (507)
Unrealised exchange rate gains 2,501 15,986 (13,485)
Unrealised exchange rate losses (7,213) (16,623) 9,410
Sub-total of unrealised gains/(losses) (4,712) (637) (4,075)
Exchange rate gains/ losses (4,865) (283) (4,582)
(33) Income taxes for the year:Net taxes for the period were Euro 9.484 million. They are shown in the following table:
Description 31/12/2012 31/12/2011 change
Current taxes :
- I.R.A.P. 3,230 4,092 (862)
- Income taxes 7,894 16,939 (9,045)
Deferred taxes 2,392 5,284 (2,891)
Pre-paid taxes (4,032) (2,130) (1,902)
TOTAL 9,484 24,184 (14,700)

97
Consolidated Financial Statements at 31 December 2012Consolidated Financial Statements at 31 December 2012
Current income taxes are an estimate of the direct taxes payable for the �nancial year derived from the taxable income of each company consolidated in the Group.Income tax payable by foreign companies was calculated using the tax rates in force in the respective countries.
Description 31/12/2012 31/12/2011 change
Pro�t for the period before tax and non-controlling interests 20,982 51,290 (30,308)
I.R.E.S. charge on Italian companies (4,057) 2,981 (7,038)
Deferred taxes of Italian companies and consolidation e�ect (3,729) (1,282) (2,447)
Current and deferred taxes on the income of foreign companies 17,515 17,812 (297)
I.R.A.P. 3,230 4,092 (863)
Taxes paid abroad 378 166 212
Changes to I.R.E.S. tax charge for previous �nancial periods (3,853) 416 (4,269)
Tax charge shown in the Consolidated Income Statement 9,484 24,184 (14,700)
(34) Group earnings per share: The calculation of basic and fully diluted earnings per share is as follows:
Description 31/12/2012 31/12/2011
A Net pro�t for the �nancial year (Euro ‘000) 10,803 25,701
B Weighted average number of ordinary shares used to calculate basic earnings per share 70,069,752 64,502,365
C Basic earnings per share: (A*1000)/B (Euro) 0.154 0.398
D Net pro�t adjusted for dilution analysis (Euro ‘000) 10,803 27,985
E Weighted average number of ordinary shares used to calculate diluted earnings per share 70,069,752 70,170,573
F Diluted earnings per share (D*1000)/E (Euro) 0.154 0.399

98
Annual Report at 31 December 2012
(35) Related party transactions:The related party transactions of TREVI Group were mainly commercial transactions between Trevi S.p.A. and consortia of which it is a member done at market conditions. The most signi�cant items of non-current receivables, recognised in trade receivables and other non-current assets at 31 December 2012 and at 31 December 2011 are shown in the following table:
Description 31/12/2012 31/12/2011 change
Porto Messina S.c.a.r.l. 720 720 0
Filippella S.c.a.r.l. 605 605 0
Pescara Park S.r.L. 938 500 437
Other 282 579 (297)
TOTAL 2,545 2,405 140
The most signi�cant items of current receivables, recognised in trade receivables and other current assets at 31 December 2012 and at 31 December 2011 are shown in the following table:
Description 31/12/2012 31/12/2011 change
Parcheggi S.p.A. 992 1,784 (792)
Roma Park Srl 2,029 1,445 584
IFIT S.r.l. 100 100 0
IFC Ltd 78 0 78
Parma Park Srl 601 511 90
So�tre S.r.l. 0 0 0
T-Power 86 36 50
Sub-total 3,888 3,877 11
Porto di Messina S.c.a.r.l. 1,005 1,005 0
Bologna Park S.c.a.r.l. 0 0 0
Consorzio Principe Amedeo 314 314 0
Consorzio Trevi Adanti 5 4 1
Filippella S.c.a.r.l 195 195 0
Nuova Darsena S.c.a.r.l. 2,396 0 2,396
Trevi S.G.F. Inc. S.c.a.r.l. 3,771 6,138 (2,367)
Soilmec Far East Pte Ltd. 4,728 110 4,618
Edra S.r.l. 82 339 (257)
Profuro Lda 0 1,256 (1,256)
Drillmec Engineering & Co. Ltd. 63 71 (7)
Arge Baugrube Q110 331 331 0
Trevi Park PLC 165 330 (165)
Other 553 615 (62)
Sub-total 13,609 10,708 2,901
TOTAL 17,496 14,585 2,912
% of total consolidated trade receivables 4.4% 3.0% 1.4%

99
Consolidated Financial Statements at 31 December 2012Consolidated Financial Statements at 31 December 2012
Group revenues generated with these companies are shown in the following table:Description 31/12/2012 31/12/2011 change
IFC 78 0 78
Roma Park Srl 1,843 953 891
Parcheggi S.p.A. 257 1,125 (868)
Parma Park Srl 74 353 (279)
So�tre Srl 0 0 0
T-Power 140 95 45
Sub-total 2,394 2,526 (131)
Hercules Foundation AB 186 901 (715)
Nuova Darsena S.c.a.r.l. 2,027 0 2,027
Soilmec Far East Pte Ltd 6,814 847 5,967
Drillmec Eng. & Co. 31 772 (741)
Trevi S.G.F. Inc. S.c.a.r.l 880 1,397 (517)
Other 441 366 75
Sub-total 10,379 4,282 6,097
TOTAL 12,774 6,808 5,966
% of total consolidated revenues from sales and services 1.1% 0.6% 0.5%
The most signi�cant amounts under payables to related parties and included under trade payables and other current liabilities at 31 December 2012 and 31 December 2011 are shown in the following table:
Description 31/12/2012 31/12/2011 change
Parcheggi S.p.A. 14 1 13
Roma Park Srl 33 30 3
IFC Ltd 55 48 6
So�tre S.r.l. 1 1 (0)
Sub-total 102 80 22
Principe Amedeo 122 22 100
Filippella S.c.a.r.l. 195 194 1
Trevi Adanti 3 2 0
So.Co.Via S.c.r.l. 1,077 0 1,077
Nuova Darsena S.c.a.r.l. 2,672 0 2,672
Porto di Messina S.c.a.rl. 305 281 24
Trevi S.G.F. Inc. S.c.a.r.l. 27 60 (33)
Dach-Arghe Markt Leipzig 489 489 0
Trevi Park PLC 100 100 0
Drillmec Eng. & Co. 33 34 (1)
Other 1,518 776 743
Sub-total 6,541 1,959 4,582
TOTAL 6,644 2,039 4,604
% of consolidated trade payables 2.3% 0.5% 1.8%

100
Annual Report at 31 December 2012
Expenses incurred by the Group with related parties were as follows:Description 31/12/2012 31/12/2011 change
Roma Park Srl 4 13 (9)
So�tre Srl 79 78 1
Parcheggi S.pA. 12 1 11
Sub-total 95 92 3
Porto di Messina S.c.a.rl. 24 32 (8)
Trevi Spezialtiefbau Germania 0 270 (270)
Trevi S.G.F. Inc. S.c.a.r.l 0 571 (571)
Drillmec Eng. & Co. 63 14 49
Filippella S.c.a.r.l. 1 1 0
Nuova Darsena S.c.a.r.l. 2,672 0 2,672
So.co.Via. S.c.a.r.l. 1,077 0 1,077
Soilmec Far East Pte Ltd 154 29 125
Soilmec Arabia L.L.C. 1 0 1
Other 140 306 (165)
Sub-total 4,132 1,224 2,909
TOTAL 4,228 1,316 2,912
% of consolidated consumption of raw materials and external services 0.5% 0.2% 0.4%
As the tables above show, TREVI Group did some small transactions with the companies headed by So�tre S.r.l., a company 100% owned by the Trevisani family. The 2012 transactions with the companies that are part of the So�tre group (which qualify for recognition because the shareholders controlling both it and TREVI Group are the Trevisani family) were done at normal market conditions. They are summarised in the table above, which shows how immaterial they are to the consolidated �gures of the Group.
There were no economic transactions between TREVI Group and Trevi Holding SE, the Italian company that controls TREVI – Finanziaria Industriale S.p.A.

101
Consolidated Financial Statements at 31 December 2012Consolidated Financial Statements at 31 December 2012
(36) Segment reportingThe Group has identi�ed that �nancial data by business sector is the primary segment for disclosure of further economic and �nancial information about the Group (segment reporting). This shows the organisation of the business of the Group and the internal reporting structure since the risks and returns accruing to the Group are a�ected by the sectors in which it operates. The Management monitors the operating results of the business segments separately in order to take decisions on the allocation of resources and to evaluate their performances. Segment performance is valued on operating pro�t or loss which, as shown in the tables below, is calculated di�erently from the operating pro�t or loss of the Consolidated Financial Statements.The Notes to the Financial Statements give secondary segment information on business by geographical area, which is also closely monitored by Management.Segment income statement and statement of �nancial position �gures at 31 December 2012 are given in the following tables and further information on the performance of the two divisions is given in the Directors’ Report on Operations:
Special Foundations and Drilling Services DivisionSummary statement of �nancial position(Euro ‘000)
31/12/2012 31/12/2011 change
A) Fixed assets 265,199 257,210 7,989
B) Net invested capital
- Inventories 107,454 86,373 21,081
- Trade receivables 206,106 195,964 10,142
- Trade payables (-) (119,343) (115,975) (3,368)
- Pre-payments (-) (54,286) (30,923) (23,364)
- Other assets (liabilities) (10,593) (28,749) 18,157
129,338 106,691 22,648
C) Invested capital less liabilities for the year (A+B) 394,537 363,901 30,636
D) Post-employment bene�ts (-) (13,240) (12,056) (1,185)
E) NET INVESTED CAPITAL (C+D) 381,297 351,845 29,452
Financed by:
F) Group net equity 247,328 245,255 2,073
G) Share of non-controlling interests 7,127 6,718 409
H) Net �nancial position 126,841 99,872 26,970
I) TOTAL SOURCES OF FINANCING (F+G+H) 381,297 351,845 29,452
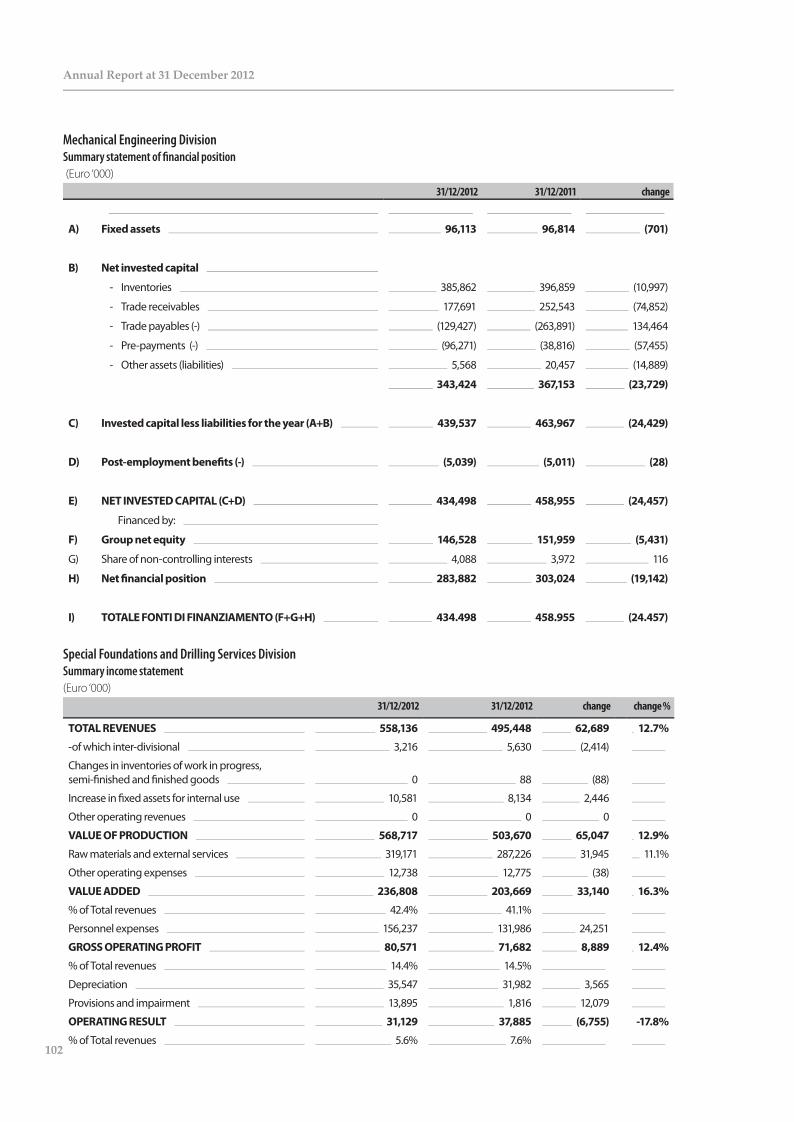
102
Annual Report at 31 December 2012
Mechanical Engineering DivisionSummary statement of �nancial position (Euro ‘000)
31/12/2012 31/12/2011 change
A) Fixed assets 96,113 96,814 (701)
B) Net invested capital
- Inventories 385,862 396,859 (10,997)
- Trade receivables 177,691 252,543 (74,852)
- Trade payables (-) (129,427) (263,891) 134,464
- Pre-payments (-) (96,271) (38,816) (57,455)
- Other assets (liabilities) 5,568 20,457 (14,889)
343,424 367,153 (23,729)
C) Invested capital less liabilities for the year (A+B) 439,537 463,967 (24,429)
D) Post-employment bene�ts (-) (5,039) (5,011) (28)
E) NET INVESTED CAPITAL (C+D) 434,498 458,955 (24,457)
Financed by:
F) Group net equity 146,528 151,959 (5,431)
G) Share of non-controlling interests 4,088 3,972 116
H) Net �nancial position 283,882 303,024 (19,142)
I) TOTALE FONTI DI FINANZIAMENTO (F+G+H) 434.498 458.955 (24.457)
Special Foundations and Drilling Services DivisionSummary income statement(Euro ‘000)
31/12/2012 31/12/2012 change change %
TOTAL REVENUES 558,136 495,448 62,689 12.7%
-of which inter-divisional 3,216 5,630 (2,414)
Changes in inventories of work in progress, semi-�nished and �nished goods 0 88 (88)
Increase in �xed assets for internal use 10,581 8,134 2,446
Other operating revenues 0 0 0
VALUE OF PRODUCTION 568,717 503,670 65,047 12.9%
Raw materials and external services 319,171 287,226 31,945 11.1%
Other operating expenses 12,738 12,775 (38)
VALUE ADDED 236,808 203,669 33,140 16.3%
% of Total revenues 42.4% 41.1%
Personnel expenses 156,237 131,986 24,251
GROSS OPERATING PROFIT 80,571 71,682 8,889 12.4%
% of Total revenues 14.4% 14.5%
Depreciation 35,547 31,982 3,565
Provisions and impairment 13,895 1,816 12,079
OPERATING RESULT 31,129 37,885 (6,755) -17.8%
% of Total revenues 5.6% 7.6%
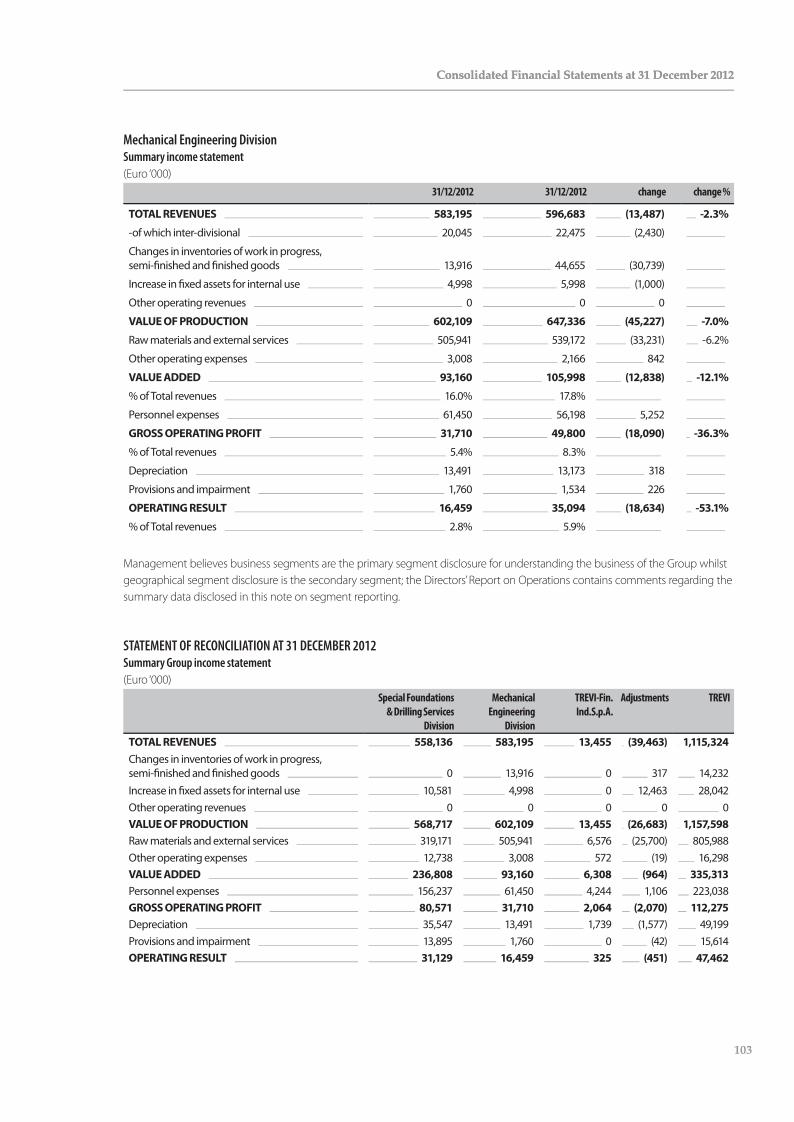
103
Consolidated Financial Statements at 31 December 2012Consolidated Financial Statements at 31 December 2012
Mechanical Engineering DivisionSummary income statement(Euro ‘000)
31/12/2012 31/12/2012 change change %
TOTAL REVENUES 583,195 596,683 (13,487) -2.3%
-of which inter-divisional 20,045 22,475 (2,430)
Changes in inventories of work in progress, semi-�nished and �nished goods 13,916 44,655 (30,739)
Increase in �xed assets for internal use 4,998 5,998 (1,000)
Other operating revenues 0 0 0
VALUE OF PRODUCTION 602,109 647,336 (45,227) -7.0%
Raw materials and external services 505,941 539,172 (33,231) -6.2%
Other operating expenses 3,008 2,166 842
VALUE ADDED 93,160 105,998 (12,838) -12.1%
% of Total revenues 16.0% 17.8%
Personnel expenses 61,450 56,198 5,252
GROSS OPERATING PROFIT 31,710 49,800 (18,090) -36.3%
% of Total revenues 5.4% 8.3%
Depreciation 13,491 13,173 318
Provisions and impairment 1,760 1,534 226
OPERATING RESULT 16,459 35,094 (18,634) -53.1%
% of Total revenues 2.8% 5.9%
Management believes business segments are the primary segment disclosure for understanding the business of the Group whilst geographical segment disclosure is the secondary segment; the Directors’ Report on Operations contains comments regarding the summary data disclosed in this note on segment reporting.
STATEMENT OF RECONCILIATION AT 31 DECEMBER 2012Summary Group income statement(Euro ‘000)
Special Foundations & Drilling Services
Division
Mechanical Engineering
Division
TREVI-Fin.Ind.S.p.A.
Adjustments TREVI
TOTAL REVENUES 558,136 583,195 13,455 (39,463) 1,115,324Changes in inventories of work in progress, semi-�nished and �nished goods 0 13,916 0 317 14,232Increase in �xed assets for internal use 10,581 4,998 0 12,463 28,042Other operating revenues 0 0 0 0 0VALUE OF PRODUCTION 568,717 602,109 13,455 (26,683) 1,157,598Raw materials and external services 319,171 505,941 6,576 (25,700) 805,988Other operating expenses 12,738 3,008 572 (19) 16,298VALUE ADDED 236,808 93,160 6,308 (964) 335,313Personnel expenses 156,237 61,450 4,244 1,106 223,038GROSS OPERATING PROFIT 80,571 31,710 2,064 (2,070) 112,275Depreciation 35,547 13,491 1,739 (1,577) 49,199Provisions and impairment 13,895 1,760 0 (42) 15,614OPERATING RESULT 31,129 16,459 325 (451) 47,462

104
Annual Report at 31 December 2012
Summary statement of �nancial position(Euro ‘000)
Special Foundations &
Drilling Services Division
Mechanical Engineering
Division
TREVI-Fin.Ind.S.p.A
Adjustments TREVIGroup
A) Fixed assets 265,199 96,113 139,883 (125,221) 375,974
B) Net working capital - Inventories 107,454 385,862 0 1 493,317 - Trade receivables 206,106 177,691 11,728 (49,686) 345,839 - Trade payables (-) (119,343) (129,427) (10,191) 49,259 (209,702) - Pre-payments (-) (54,286) (96,271) 0 (2,664) (153,221) - Other assets (liabilities) (10,593) 5,568 5,091 12,315 12,382 129,338 343,424 6,628 9,225 488,615
C) Invested capital less liabilities for the year (A+B) 394,537 439,537 146,511 (115,996) 864,590
D) Post-employment bene�ts (-) (13,240) (5,039) (956) (99) (19,335)
E) NET INVESTED CAPITAL (C+D) 381,297 434,498 145,555 (116,095) 845,255
Financed by: F) Group net equity 247,328 146,528 148,266 (122,783) 419,339G) Share of non-controlling interests 7,127 4,088 0 1,334 12,549H) Net �nancial position 126,841 283,882 (2,711) 5,354 413,367
I) TOTAL SOURCES OF FINANCING (F+G+H) 381,297 434,498 145,555 (116,095) 845,255
The adjustments to net equity include the elimination of investments and non-current intercompany �nancial receivables for �xed assets; for trade receivables and payables it includes the remaining intercompany eliminations; for Group net equity it includes the balancing item for the elimination of investments.
(38) Signi�cant events after the end of the reporting periodThere have been no signi�cant events after the end of the reporting period.

105
Consolidated Financial Statements at 31 December 2012Consolidated Financial Statements at 31 December 2012
Remuneration of Directors and Statutory AuditorsDetails of the remuneration of the Parent Company Directors and Statutory Auditors for performing their duties, also in other consolidated companies in the Group, are given below:
Name Company Position Remuneration (Euro ‘000)
Other remuneration(Euro‘000)
Trevisani DavideTREVI - Fin. Ind. S.p.A.
Chairman of the Board and Managing Director 200
Trevi S.p.A.Deputy Chairman of the
Board and Managing Director 180
Drillmec S.p.A. Director 50
Trevi Energy S.p.A. Chairman of the Board 20
Soilmec S.p.A.Chairman of the Board
and Managing Director 160 Petreven S.p.A. Managing Director 18
Trevisani Gianluigi TREVI - Fin Ind. S.p.A.
Deputy Chairman of the Board and
Managing Director 185
Trevi S.p.A.Chairman of the Board
and Managing Director 200 Drillmec S.p.A. Director 50
Trevi Energy S.p.A. Managing Director 20
Soilmec S.p.A.Deputy Chairman of the
Board and Managing Director 150
Petreven S.p.A.Deputy Chairman of the
Board and Managing Director 18 Trevisani Cesare TREVI - Fin Ind. S.p.A. Managing Director 145 94
Trevi S.p.A. Managing Director 100
Soilmec S.p.A.Deputy Chairman of the
Board and Managing Director 75
Drillmec S.p.A.Deputy Chairman of the
Board and Managing Director 50 Trevi Energy S.p.A. Managing Director 20
RCT S.r.l. Sole Director 0
Petreven S.p.A.Chairman of the Board
and Managing Director 60 Trevisani Stefano TREVI - Fin Ind. S.p.A. Managing Director 100 182
Drillmec S.p.A. Managing Director 50 Soilmec S.p.A. Managing Director 50
Trevi Energy S.p.A. Managing Director 20 Trevi S.p.A. Managing Director 100
Petreven S.p.A. Managing Director 12 Pinza Riccardo TREVI - Fin Ind. S.p.A. Director 42 Moscato Guglielmo Antonio Claudio TREVI - FinInd. S.p.A. Director 40 Teodorani Fabbri Pio TREVI - Fin Ind. S.p.A. Director 40 Bocchini Enrico TREVI - Fin Ind. S.p.A. Director 40 Mosconi Franco TREVI - Fin Ind. S.p.A. Director 17 Mondardini Monica TREVI - Fin Ind. S.p.A. Director 5
Leonardi Adolfo TREVI - Fin Ind. S.p.A.Chairman of the Board
of Statutory Auditors 31
Trevi S.p.A. Chairman of the Board of Statutory Auditors 10
Soilmec S.p.A. Standing Statutory Auditor 7
RCT S.r.l. Chairman of the Board of Statutory Auditors 6
Alessandri Giacinto TREVI - Fin Ind. S.p.A. Standing Statutory Auditor 21 Poletti Giancarlo TREVI - Fin Ind. S.p.A. Standing Statutory Auditor 21
Soilmec S.p.A. Chairman of the Board of Statutory Auditors 10
Drillmec S.p.A. Standing Statutory Auditor 5 TOTAL 2,328 276
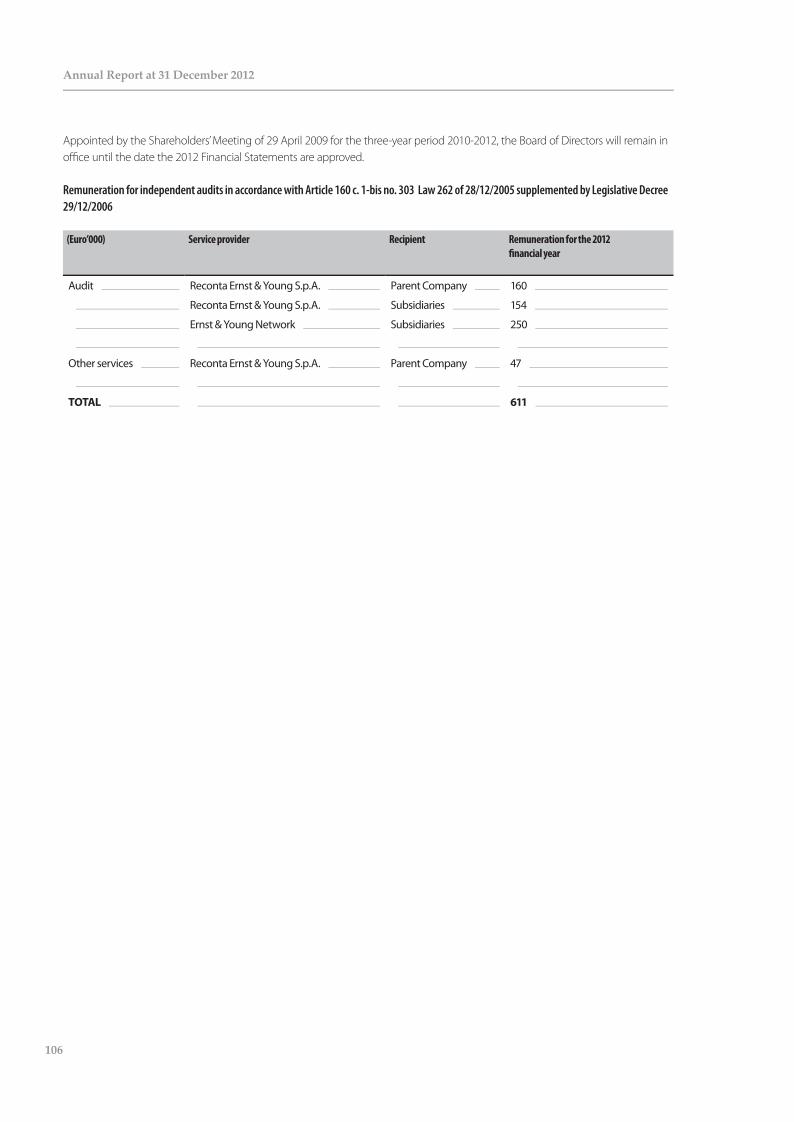
106
Annual Report at 31 December 2012
Appointed by the Shareholders’ Meeting of 29 April 2009 for the three-year period 2010-2012, the Board of Directors will remain in o�ce until the date the 2012 Financial Statements are approved.
Remuneration for independent audits in accordance with Article 160 c. 1-bis no. 303 Law 262 of 28/12/2005 supplemented by Legislative Decree 29/12/2006
(Euro’000) Service provider Recipient Remuneration for the 2012�nancial year
Audit Reconta Ernst & Young S.p.A. Parent Company 160
Reconta Ernst & Young S.p.A. Subsidiaries 154
Ernst & Young Network Subsidiaries 250
Other services Reconta Ernst & Young S.p.A. Parent Company 47
TOTAL 611

107
Consolidated Financial Statements at 31 December 2012Consolidated Financial Statements at 31 December 2012
ATTACHMENTS TO THE NOTES TO THE CONSOLIDATED FINANCIAL STATEMENTS
The following attachments supplement the information contained in the Notes to the Financial Statements, of which they form an integral part.
1 Companies consolidated in the Financial Statements at 31 December 2012 on a line-by-line basis.
1a Companies consolidated in the Financial Statements at 31 December 2012 using the equity method.
1b Companies consolidated in the Financial Statements at 31 December 2012 using the proportional consolidation method.
1c Companies and consortia consolidated in the Financial Statements at 31 December 2012 and carried at cost.
2 Group organizational chart.
Attachment 1COMPANIES CONSOLIDATED IN THE FINANCIAL STATEMENTS AT 31 DECEMBER 2012 ON A LINE-BY-LINE BASIS
COMPANY NAME REGISTERED OFFICE CURRENCY SHARE CAPITAL % HELD BY THE GROUP
1 TREVI – Finanziaria Industriale S.p.A. Italy Euro 35,097,150 Parent Company
2 Soilmec S.p.A. Italy Euro 25,155,000 99.9%
3 Soilmec U.K. Ltd UK Sterling 150,000 79.9%
4 Soilmec Japan Co. Ltd Japan Yen 45,000,000 92.9%
5 Soilmec France S.a.S. France Euro 1,100,000 97.9%
6 Soilmec International B.V. Holland Euro 18,151 99.9%
7 Drillmec S.p.A. Italy Euro 5,000,000 99.9%
8 Soilmec H.K. Ltd. Hong Kong H.K. Dollar 44,743 99.9%
9 Drillmec Inc. USA U.S.A. U.S. Dollar. 6,846,776 99.9%
10 I.D.T. S.r.L.Republic of San Marino Euro 25,500 99.9%
11 Pilotes Trevi S.a.c.i.m.s. Argentina Peso 1,650,000 98.9%
12 Cifuven C.A. Venezuela Bolivar 300,000,000 99.8%
13 Petreven C.A. Venezuela Bolivar 16,044,700,000 84.03%
14 Trevi S.p.A. Italy Euro 32,300,000 99.8%
15 R.C.T. S.r.L. Italy Euro 500,000 99.8%
16 Treviicos Corporation U.S.A. U.S. Dollar 23,500 99.8%
17 Trevi Foundations Canada Inc. Canada Canadian Dollar 10 99.8%
18 Trevi Cimentaciones C.A. Venezuela Bolivar 14,676,000,000 99.8%
19 Trevi Construction Co. Ltd. Hong Kong U.S. Dollar 2,051,668 99.8%
20 Trevi Foundations Nigeria Ltd. Nigeria Naira 335,462,400 59.9%
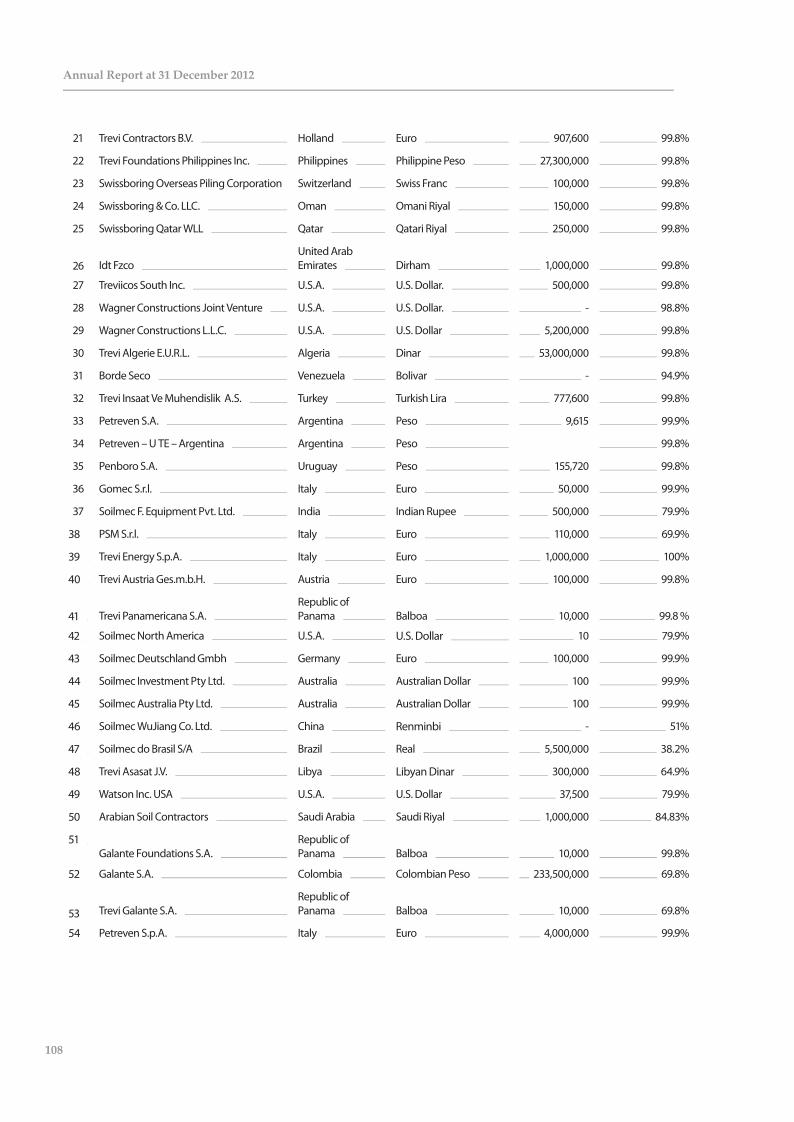
108
Annual Report at 31 December 2012
21 Trevi Contractors B.V. Holland Euro 907,600 99.8%
22 Trevi Foundations Philippines Inc. Philippines Philippine Peso 27,300,000 99.8%
23 Swissboring Overseas Piling Corporation Switzerland Swiss Franc 100,000 99.8%
24 Swissboring & Co. LLC. Oman Omani Riyal 150,000 99.8%
25 Swissboring Qatar WLL Qatar Qatari Riyal 250,000 99.8%
26 Idt FzcoUnited Arab Emirates Dirham 1,000,000 99.8%
27 Treviicos South Inc. U.S.A. U.S. Dollar. 500,000 99.8%
28 Wagner Constructions Joint Venture U.S.A. U.S. Dollar. - 98.8%
29 Wagner Constructions L.L.C. U.S.A. U.S. Dollar 5,200,000 99.8%
30 Trevi Algerie E.U.R.L. Algeria Dinar 53,000,000 99.8%
31 Borde Seco Venezuela Bolivar - 94.9%
32 Trevi Insaat Ve Muhendislik A.S. Turkey Turkish Lira 777,600 99.8%
33 Petreven S.A. Argentina Peso 9,615 99.9%
34 Petreven – U TE – Argentina Argentina Peso 99.8%
35 Penboro S.A. Uruguay Peso 155,720 99.8%
36 Gomec S.r.l. Italy Euro 50,000 99.9%
37 Soilmec F. Equipment Pvt. Ltd. India Indian Rupee 500,000 79.9%
38 PSM S.r.l. Italy Euro 110,000 69.9%
39 Trevi Energy S.p.A. Italy Euro 1,000,000 100%
40 Trevi Austria Ges.m.b.H. Austria Euro 100,000 99.8%
41 Trevi Panamericana S.A.Republic of Panama Balboa 10,000 99.8 %
42 Soilmec North America U.S.A. U.S. Dollar 10 79.9%
43 Soilmec Deutschland Gmbh Germany Euro 100,000 99.9%
44 Soilmec Investment Pty Ltd. Australia Australian Dollar 100 99.9%
45 Soilmec Australia Pty Ltd. Australia Australian Dollar 100 99.9%
46 Soilmec WuJiang Co. Ltd. China Renminbi - 51%
47 Soilmec do Brasil S/A Brazil Real 5,500,000 38.2%
48 Trevi Asasat J.V. Libya Libyan Dinar 300,000 64.9%
49 Watson Inc. USA U.S.A. U.S. Dollar 37,500 79.9%
50 Arabian Soil Contractors Saudi Arabia Saudi Riyal 1,000,000 84.83%
51Galante Foundations S.A.
Republic of Panama Balboa 10,000 99.8%
52 Galante S.A. Colombia Colombian Peso 233,500,000 69.8%
53 Trevi Galante S.A.Republic of Panama Balboa 10,000 69.8%
54 Petreven S.p.A. Italy Euro 4,000,000 99.9%

109
Consolidated Financial Statements at 31 December 2012Consolidated Financial Statements at 31 December 2012
55 Idt LlcUnited Arab Emirates Dirham 1,000,000 99.8%
56 Idt Llc FzcUnited Arab Emirates Dirham 6,000,000 99.8%
57 Soilmec Algeria Algeria Algerian Dinar 1,000,000 68.55%
58 Drillmec OOC Russia Russian Rouble 153,062 99.9%
59 Drillmec International Sales Inc. U.S.A. U.S. Dollar 2,500 99.9%
60 Watson International Sales Inc. U.S.A. U.S. Dollar 2,500 79.9%
61 Perforazioni Trevi Energie B.V. Holland Euro 90,000 99.9%
62 Trevi Drilling Services Saudi Arabia Saudi Riyal 7,500,000 51%
63 Trevi Foundations Saudi Arabia Co. Ltd. Saudi Arabia Saudi Riyal 500,000 99.78%
64 Treviicos BV Holland Euro 20,000 99.78%
65 Petreven Perù SA Peru Peruvian Nuevo Sol 1,499,265 99.95%
66 Petreven Chile S.p.A. Chile Chilean Peso 300,000 99.95%
67 Trevi Foundations Kuwait Kuwait Kuwait Dinar 100,000 99.78%
68 Trevi Foundations Denmark Denmark Danish Kroner 1,000,000 99.78%
69 Trevi Fundacoes Angola Lda Angola Kwanza 800,000 99.78%
70 Trevi ITT JV Thailand Baht - 94.9%
72 Soilmec Colombia Sas Colombia Colombian Peso 180,000,000 99.92
73 Petreven do Brasil Ltd Brazil Brazilian Real 1,000,000 99.953%
74 Galante Cimentaciones Sa Peru Peruvian Nuevo Sol 3,000 99.78
75 Trevi SpezialTiefBau GmbH Germany Euro 50,000 99.78
76 Profuro Intern. L.d.a. Mozambique Metical 19,800,000 99.3%
77 Hyper Servicos de Perfuracao AS Brazil Brazilian Real 25,000 50.98%
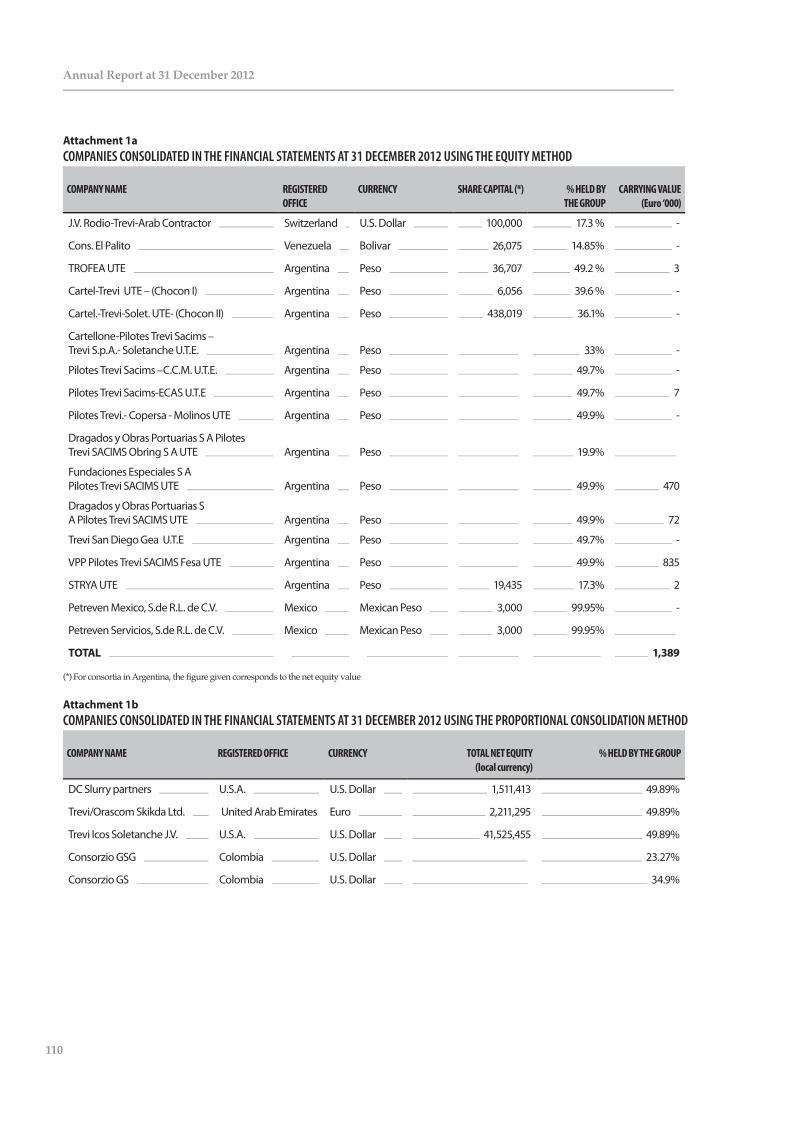
110
Annual Report at 31 December 2012
Attachment 1aCOMPANIES CONSOLIDATED IN THE FINANCIAL STATEMENTS AT 31 DECEMBER 2012 USING THE EQUITY METHOD
COMPANY NAME REGISTERED OFFICE
CURRENCY SHARE CAPITAL (*) % HELD BY THE GROUP
CARRYING VALUE (Euro ‘000)
J.V. Rodio-Trevi-Arab Contractor Switzerland U.S. Dollar 100,000 17.3 % -
Cons. El Palito Venezuela Bolivar 26,075 14.85% -
TROFEA UTE Argentina Peso 36,707 49.2 % 3
Cartel-Trevi UTE – (Chocon I) Argentina Peso 6,056 39.6 % -
Cartel.-Trevi-Solet. UTE- (Chocon II) Argentina Peso 438,019 36.1% -
Cartellone-Pilotes Trevi Sacims –Trevi S.p.A.- Soletanche U.T.E. Argentina Peso 33% -
Pilotes Trevi Sacims –C.C.M. U.T.E. Argentina Peso 49.7% -
Pilotes Trevi Sacims-ECAS U.T.E Argentina Peso 49.7% 7
Pilotes Trevi.- Copersa - Molinos UTE Argentina Peso 49.9% -
Dragados y Obras Portuarias S A Pilotes Trevi SACIMS Obring S A UTE Argentina Peso 19.9%
Fundaciones Especiales S A Pilotes Trevi SACIMS UTE Argentina Peso 49.9% 470
Dragados y Obras Portuarias S A Pilotes Trevi SACIMS UTE Argentina Peso 49.9% 72
Trevi San Diego Gea U.T.E Argentina Peso 49.7% -
VPP Pilotes Trevi SACIMS Fesa UTE Argentina Peso 49.9% 835
STRYA UTE Argentina Peso 19,435 17.3% 2
Petreven Mexico, S.de R.L. de C.V. Mexico Mexican Peso 3,000 99.95% -
Petreven Servicios, S.de R.L. de C.V. Mexico Mexican Peso 3,000 99.95%
TOTAL 1,389
(*) For consortia in Argentina, the figure given corresponds to the net equity value
Attachment 1bCOMPANIES CONSOLIDATED IN THE FINANCIAL STATEMENTS AT 31 DECEMBER 2012 USING THE PROPORTIONAL CONSOLIDATION METHOD
COMPANY NAME REGISTERED OFFICE CURRENCY TOTAL NET EQUITY(local currency)
% HELD BY THE GROUP
DC Slurry partners U.S.A. U.S. Dollar 1,511,413 49.89%
Trevi/Orascom Skikda Ltd. United Arab Emirates Euro 2,211,295 49.89%
Trevi Icos Soletanche J.V. U.S.A. U.S. Dollar 41,525,455 49.89%
Consorzio GSG Colombia U.S. Dollar 23.27%
Consorzio GS Colombia U.S. Dollar 34.9%

Attachment 1cCOMPANIES AND CONSORTIA CONSOLIDATED IN THE FINANCIAL STATEMENTS AT 31 DECEMBER 2012 AND CARRIED AT COST
COMPANY NAME REGISTERED OFFICE CURRENCY SHARE CAPITAL % HELD BY THE GROUP
CARRYING VALUE(Euro ‘000)
AFFILIATE COMPANIES AND CONSORTIA
Consorzio Progetto Torre di Pisa Italy Euro 30,987 24.7% 8
Consorzio Romagna Iniziative Italy Euro 41,317 12% 5
Consorzio Trevi Adanti Italy Euro 10,329 48.6% 5
Trevi S.G.F Inc. S.c.a.r.l. Italy Euro 54.4% 5
Pescara Park S.r.l. Italy Euro 24.7% 11
Consorzio Fondav Italy Euro 25,823 25.7% 10
Consorzio Fondav II Italy Euro 25,000 36.92% 10
Principe Amedeo S.c.a.r.l. Italy Euro 10,329 49.50% 0
Filippella S.c.a.r.l. Italy Euro 10,000 59.9% 8
Porto di Messina S.c.a.r.l. Italy Euro 10,329 79.2% 8
Consorzio Water Alliance Italy Euro 60,000 64.86% 39
Parma Park SrL Italy Euro 29.9% 60
Compagnia del Sacro Cuore S.r.l. Italy Euro 150
SO.CO.VIA S.c.a.r.l. Italy Euro 4
Consorzio NIM-A Italy Euro 60,000 65.6% 40
Cermet Italy Euro 420,396 0.46% 2
Centuria S.c.a.r.l. Italy Euro 308,000 1.58% 5
Idroenergia S.c.a.r.l. Italy Euro -
Soilmec Arabia Saudi Arabia Saudi Riyal 24.25% 44
OTHER COMPANIES
Comex S.p.A. Italy Euro 2,606,427 0.82% 24
Banca di Cesena S.p.A. Italy Euro 1
Bologna Park S.r.l. Italy Euro 23
Trevi Park P.l.c. United Kingdom U.K. Sterling 4,236,98 29.7% -
Italthai Trevi Thailand Baht 80,000,000 2.19% 134
Edra S.r.l. Piacenza (Italy) Euro 10,000 50% 111
Edra S.r.l.Republic of San Marino Euro 26,100 49% 41
Drillmec Eng.Sudan Ltd. SudanSudanese Sterling 19.99% 46
OJSC Seismotekhnika Belorussia 19% 1,596
Hercules Trevi Foundation A.B. Sweden Kroner 100,000 49.5% 103
Japan Foundations Japan Yen 5,907,978,000 0.001% 106
Soilmec Far East Pte Ltd. SingaporeSingapore Dollar 4,500,000 10% 135
I.F.C. Hong Kong U.S. Dollar 18,933 0,10% -
TOTAL 2,734
111

Company Name(Nation)
Ownership
Third Parties
Company Name(Nation)
x%
x%
Trevi SpA Drillmec SpATrevi Energy Soilmec SpAPetreven SpA
TREVI-Finanziaria Industriale
S.p.A.
SoilmecINT BV
(The Nederlands)
Soilmec doBrasil SA
(Brasil)
PilotesTrevi S.A.(Argentina)
Petreven U.T.E.(Argentina)
Petreven CA(Venezuela)
Petreven S.A.(Argentina)
Perforazioni Trevi Energie B.V.
(The Nederlands)
Petreven do Brasil(Brazil)
Petreven Chile SpA(Chile)
Petreven Perù SA
(Perù)
SoilmecWuJiang Co Ltd
(China)
PSM S.r.L.(Italy)
Drillmec INC(U.S.A.)
Gomec S.r.L.(Italy)
Drillmec OOC(Russia)
IDT FZCO(U.A.E.)
SoilmecHong Kong LTD
(Hong Kong)
SoilmecFoundation
Equipment LTD(India)
SoilmecInvestments
Pty Ltd(Australia)
SoilmecAustraliaPty Ltd(Australia)
SoilmecJapan(Japan)
SoilmecUK LTD
(U.K.)
SoilmecDeutschland
Gmbh(Germany)
SoilmecNorth America
(U.S.A.)
SoilmecFrance SAS
(France)
Watson INC(U.S.A.)
TreviSpezialtiefbau
Gmbh(Germany)
Trevi Algeria(Algeria)
Trevi Contractors BV
(The Nederlands)
RCT S.r.L.(Italy)
Trevi OrascomSkikda(U.A.E.)
TreviCimentaciones CA
(Venezuela)
TreviGalante SA
(República de Panamá)
GalanteCimentaciones SA
(Perù)
TreviInsaat Ve M.
(Turckey)
Trevi Foundations Denmark AS
(Denmark)
SwissboringOverseasPiling CO(Switzerland)
Swissboring& CO LLC
(Oman)
SwissboringLLC Qatar
(Qatar)
Hercules TreviFound. AB
(Sweden)
TreviAsasat(Libya)
Trevi AustriaGesMbh(Austria)
Arabian SoilContractor(Saudi Arabia)
Trevi Drilling Services(Saudi Arabia)
TreviPanamericana SA(República de Panamá)
Trevi Foundations Kuwait(Kuwait)
GalanteFound. S.A.
(República de Panamá)
Galante S.A.(Colombia)
TreviConstruction Co LTD
(Hong Kong)
TreviPhilippines INC
(Philippines)
SwissboringOverseas COLTD Branch
(U.A.E.)
Trevi ICOS Corp(U.S.A.)
TreviFoundation
INC.(Canada)
Trevi ICOS South(U.S.A.)
Trevi ICOSSoletanche J.V.
(U.S.A.)
Profuro LDA(Mozambique)
TreviFoundationNigeria LTD
(Nigeria)
2%30%
10%
1,75%
5%
21,62%
78,38%
50% 90%
99,78% 99,92% 98,25%
70%
93%
SoilmecColombia SAS
(Colombia)
80% 98%
80%
65%
50%
51%
80% 80%
98%
51% 38,25% 95%90% 84,07%
94%
57%
60%
70%
99,95%
93%
85%69%
50%
99,93%
85%
15%
0,07%
10%
42%
5%1%
7%
1%
Trevi-ITT J.V.(Thailand )
95%

Company Name(Nation)
Ownership
Third Parties
Company Name(Nation)
x%
x%
Trevi SpA Drillmec SpATrevi Energy Soilmec SpAPetreven SpA
TREVI-Finanziaria Industriale
S.p.A.
SoilmecINT BV
(The Nederlands)
Soilmec doBrasil SA
(Brasil)
PilotesTrevi S.A.(Argentina)
Petreven U.T.E.(Argentina)
Petreven CA(Venezuela)
Petreven S.A.(Argentina)
Perforazioni Trevi Energie B.V.
(The Nederlands)
Petreven do Brasil(Brazil)
Petreven Chile SpA(Chile)
Petreven Perù SA
(Perù)
SoilmecWuJiang Co Ltd
(China)
PSM S.r.L.(Italy)
Drillmec INC(U.S.A.)
Gomec S.r.L.(Italy)
Drillmec OOC(Russia)
IDT FZCO(U.A.E.)
SoilmecHong Kong LTD
(Hong Kong)
SoilmecFoundation
Equipment LTD(India)
SoilmecInvestments
Pty Ltd(Australia)
SoilmecAustraliaPty Ltd(Australia)
SoilmecJapan(Japan)
SoilmecUK LTD
(U.K.)
SoilmecDeutschland
Gmbh(Germany)
SoilmecNorth America
(U.S.A.)
SoilmecFrance SAS
(France)
Watson INC(U.S.A.)
TreviSpezialtiefbau
Gmbh(Germany)
Trevi Algeria(Algeria)
Trevi Contractors BV
(The Nederlands)
RCT S.r.L.(Italy)
Trevi OrascomSkikda(U.A.E.)
TreviCimentaciones CA
(Venezuela)
TreviGalante SA
(República de Panamá)
GalanteCimentaciones SA
(Perù)
TreviInsaat Ve M.
(Turckey)
Trevi Foundations Denmark AS
(Denmark)
SwissboringOverseasPiling CO(Switzerland)
Swissboring& CO LLC
(Oman)
SwissboringLLC Qatar
(Qatar)
Hercules TreviFound. AB
(Sweden)
TreviAsasat(Libya)
Trevi AustriaGesMbh(Austria)
Arabian SoilContractor(Saudi Arabia)
Trevi Drilling Services(Saudi Arabia)
TreviPanamericana SA(República de Panamá)
Trevi Foundations Kuwait(Kuwait)
GalanteFound. S.A.
(República de Panamá)
Galante S.A.(Colombia)
TreviConstruction Co LTD
(Hong Kong)
TreviPhilippines INC
(Philippines)
SwissboringOverseas COLTD Branch
(U.A.E.)
Trevi ICOS Corp(U.S.A.)
TreviFoundation
INC.(Canada)
Trevi ICOS South(U.S.A.)
Trevi ICOSSoletanche J.V.
(U.S.A.)
Profuro LDA(Mozambique)
TreviFoundationNigeria LTD
(Nigeria)
2%30%
10%
1,75%
5%
21,62%
78,38%
50% 90%
99,78% 99,92% 98,25%
70%
93%
SoilmecColombia SAS
(Colombia)
80% 98%
80%
65%
50%
51%
80% 80%
98%
51% 38,25% 95%90% 84,07%
94%
57%
60%
70%
99,95%
93%
85%69%
50%
99,93%
85%
15%
0,07%
10%
42%
5%1%
7%
1%
Trevi-ITT J.V.(Thailand )
95%

Declaration relating to the Consolidated Financial Statements in accordance with Article 154-bis of Legislative Decree 58/98
1. The undersigned Davide Trevisani, Chairman and Managing Director, Gianluigi Trevisani, Managing Director, Cesare Trevisani, Managing Director, Stefano Trevisani, Managing Director, and Daniele Forti, Group Chief Financial Officer and in his capacity as Manager responsible for drawing up the financial statements of Gruppo Trevi, declare, taking note of the provisions of Article 154-bis, paragraphs 3 and 4 of Legislative Decree of 24 February 1998, no. 58:
• the appropriateness in relation to the characteristics of the business; and • the effective application
of the administrative and accounting procedures for the preparation of the Financial Statements in the 2012 financial year.
2. It is also declared that: 2.1 The Consolidated Financial Statements at 31 December 2012:
a) have been prepared in accordance with the applicable International Accounting Standards recognised by the European Community in accordance with EC Regulation no. 1606/2002 of the European Parliament and of the European Council of 19 July 2002;
b) correspond to the results contained in the accounting records and documents; c) provide a true and fair view of the capital, economic and financial position of the issuer and of
the businesses included in the area of consolidation. 2.2 The review of operations includes information on significant events that occurred in the course of the financial year and of their impact on the Consolidated Financial Statements, together with a description of the main risks and uncertainties, and information concerning related party transactions.
Cesena, 22 March 2013


118
Annual Report at 31 December 2012
REPORT OF THE BOARD OF STATUTORY AUDITORS TO THE SHAREHOLDERS’ MEETING PURSUANT TO ARTICLE 153 OF LEGISLATIVE DECREE No. 58/1998 AND OF ARTICLE 2429 PARAGRAPH 3 OF THE ITALIAN CIVIL CODE
Dear shareholders,During the year ended 31 December 2012, the Board of Statutory Auditors of TREVI – Finanziaria Industriale S.p.A. has carried out the supervisory activities required by law, complying with the recommendations and regulations of Consob and the Standards of Conduct of Boards of Statutory Auditors of Companies Listed on Regulated Markets as de�ned by the Italian National Council of Accountants and Tax Advisors.The Board of Statutory Auditors was represented at the meetings of the Board of Directors in which the Directors reported with the frequency required under paragraph 1 of Article 150 of Legislative Decree 58/98 (the Consolidated Finance Act) on the activities of the Company and its subsidiaries and the most signi�cant economic, �nancial and equity transactions.It was able to verify that the operations carried out complied with the law and with the Company’s Articles of Association, did not create con�icts of interest and were not obviously imprudent or risky or compromised the integrity of the Company assets.The Board considers the organisational structure of the Company to be adequate for the size of the Company and the Group and capable of providing a timely response to operating demands while respecting the principles of correct and diligent management; the Board of Statutory Auditors veri�ed this through direct observation and by meetings with Company executives and with the representatives of the audit company, by reviewing the results of the work carried out by the audit company, through an exchange of information with the internal audit committees of the subsidiaries and regular meetings with the Manager responsible for preparing the Company accounts, who is also the TREVI Group Director of General Administration, Finance and Control. The Board of Statutory Auditors has no comments to make on this matter.Furthermore, the Board of Statutory Auditors, in its role as the Internal Control and Audit Committee under Article 19 of Legislative Decree 27 January 2010 no. 39, veri�ed the correct preparation of �nancial information, the adequacy and e�ectiveness of the internal control system and its capacity to verify compliance with internal administrative and operational procedures for the preparation of the consolidated accounts, and those used to identify, prevent or manage risks of a �nancial and operational nature and to detect any eventual fraud.It veri�ed the adequacy of the instructions given to subsidiaries under Article 114, paragraph 2 of Legislative Decree 58/98. These veri�cations gave rise to no data or signi�cant matters that need to be included in the present Report.During 2012, the independent director, Mr Franco Mosconi, resigned and, at its meeting of 14 November, the Board of Directors co-opted Ms Monica Mondardini as the new independent director. The Board of Directors appointed the director, Gianluigi Trevisani, to take charge of the internal audit and risk management system and appointed Baker Tilly Revisa S.p.A in the person of Mr Francesco Lo Cascio to manage the internal audit. On 14 November 2012, the Board of Directors, having received the favourable opinion of the Committee for Control and Risk and having heard the opinion of the Board of Statutory Auditors, approved the setting up of the internal audit function, as required under Article 7.C.5 of the Self-Regulatory Code, so as to implement the control and risk management system. On 14 November 2012, the Board of Directors approved a decision to adhere to the December 2011 edition of the Self-Regulatory Code of Borsa Italiana and, from that date, the Internal Audit Committee, comprised of three non-executive and independent directors, was renamed the Committee for Control and Risks and assumed the new responsibilities under Article 7 of the new version of the Self-Regulatory Code.The Board of Statutory Auditors, in its role as the Internal Control and Audit Committee (in accordance with Article 19 of Legislative Decree 39/2010), worked closely and had a continuous exchange of information with the Committee for Control and Risks. The Chairman of the Board of Statutory Auditors attended all the meetings of the Committee for Control and Risks.The Board of Statutory Auditors exchanged information with the legal audit company in compliance with paragraph 3 of Article 150 of Legislative Decree 58/98; no matters requiring comment in the present report emerged from this exchange of information.The Board of Statutory Auditors found no atypical or unusual transactions with Group companies, with third-parties or with related-
119
Consolidated Financial Statements at 31 December 2012Consolidated Financial Statements at 31 December 2012
parties in the 2012 �nancial year.The Directors have reported on transactions with other Group companies and on related-party transactions in the Directors’ Report on Operations; those of a �nancial and commercial nature were all carried out at market conditions on the basis of contractual agreements.The Board of Directors set up an internal committee, the Committee for Related-party Transactions, made up of three independent Directors. The Board of Statutory Auditors oversaw the related-party procedures adopted by the Board of Directors in accordance with Consob Rule no, 17,221 of 12 March 2010.Details of the remuneration of Directors and Statutory Auditors and their shareholdings in TREVI - Finanziaria Industriale S.p.A. and its subsidiaries are included in the Explanatory Notes to the Consolidated Financial Statements.The information provided by the Directors in their Report on Operations is considered full and exhaustive and accords with the Financial Statements and the Consolidated Financial Statements.The Directors’ Report on Operations lists the main risks to which the Company and the Group are exposed and the Board of Statutory Auditors considers these to be adequately classi�ed and described.Pursuant to Article 123 bis of the Consolidated Finance Act and the Self-Regulatory Code of Conduct of listed companies published by Borsa Italiana to which the Company adheres, the Directors have prepared a separate Report on Corporate Governance and on the Company’s Ownership Structure that gives a detailed description of the corporate governance system, which the Board of Statutory Auditors maintains has been adequately and properly prepared; the Report, together with the present Report , approved by the Board of Directors on 22 March 2013 are publicly available at the registered o�ce of the Company, at Borsa Italiana and have been posted on the Company website www.trevi�n.com in the section on Corporate Governance.The Board of Directors’ meeting of 22 March 2013, with the approval of the Remuneration Committee, made available the Report on Remuneration under Article 123-ter of the Consolidated Finance Act; this Report, together with the present Report, are publicly available at the registered o�ce of the Company, at Borsa Italiana and have been posted on the Company website www.trevi�n.com in the section on Corporate Governance.For the 2012 �nancial year, the Group, together with some of its subsidiaries, adopted the National Tax Consolidation Regime, and has described the conditions of participation and the related contract.The 2012 Financial Statements have been prepared according to IAS/IFRS accounting standards published by the International Accounting Standards Board (IASB), approved by the European Union and in accordance with the provisions of Article 9 of Legislative Degree no. 38/2005.The declarations of the Manager responsible for preparing the Company accounts and of the Managing Director have been attached to both the Parent Company Financial Statements and the Consolidated Financial Statements pursuant to Article 154-bis of the Consolidated Finance Act.The accounts of the Company were subject to a legal audit by the audit company Reconta Ernst & Young S.p.A., which, on 6 April 2013, issued reports in accordance with Articles 14 and 16 of Legislative Decree 27 January 2010 no. 39 stating that the Financial Statements and the Consolidated Financial Statements at 31 December 2012 give a true and fair representation of the capital and �nancial situation, the �nancial performance and cash �ows of the Company and of the Group and are transparent and conform to the regulations that govern their preparation; that the report on operations accords with the Financial Statements and the Consolidated Financial Statements. The audit reports make no disclosures or mention of any irregularities. In the course of meetings with the audit company nothing emerged regarding the checks carried out.In the 2012 �nancial year and to the present date, the Board of Statutory Auditors has received no noti�cation under Article 2408 of the Italian Civil Code and is not aware of any other revelations that should be included in the present Report.The Board of Statutory Auditors oversaw implementation of the Self-Regulatory Code adopted by the Company as required by the Code issued by the Corporate Governance Committee of Borsa Italiana S.p.A. in March 2006 and amended in March 2010 and again in December 2011. As mentioned above, this most recent version of the Self-Regulatory Code was adopted by the Board of Directors at its meeting on 14 November 2012.The Board of Statutory Auditors ascertained the independence of its own members and supervised the procedure for self-appraisal carried out by the Board of Directors, with particular regard to the requisites of independent directors and non-executive members.The Board of Directors appointed the independent and non-executive director, Mr Enrico Bocchini, as Lead Independent Director; during 2012, no meetings of just the independent Directors were held; they held a meeting in February 2013.

120
Annual Report at 31 December 2012
The Code of Conduct for Internal Dealing, adopted in compliance with the enactment in Italy of the directive on market abuse, resulted in three noti�cations in 2012, which have been deposited and are available on the website of Borsa Italiana S.p.A. and on the Company website. The Company has adopted a Code of Ethics, most recently updated by the Board of Directors at its meeting on 24 March 2011, which is available on the Company website.On 16 February 2009, the Board of Directors approved an update to the procedure for maintaining the Register of persons with access to privileged information, which was originally implemented from 1 April 2006 in accordance with the provisions of Article 115 bis of Legislative Decree 58/98. On 14 November, the Board of Directors approved a new version of the Company Organisational Model, prepared in accordance with Legislative Decree no. 231; the new version was updated to include environmental crimes and crimes linked to the employment of illegal immigrants. The Board of Directors made further revisions to the Model on 19 February 2013 to include crimes of bribery and corruption of private individuals. The Board of Statutory Auditors has received no noti�cations of any infringements. The fully paid-up share capital of the Company is Euro 35,097,150, made up of 70,194,300 ordinary shares each with a nominal value of Euro 0.50; the share capital in the Financial Statements at 31 December 2012 is Euro 35,032,950, made up of 70,065,900 ordinary shares following acquisition by the Company of 128,400 of its own ordinary shares.In accordance with Legislative Decree 39/2010, the Board of Statutory Auditors veri�ed the independence of the audit company.During 2012, Ernst & Young Advisory S.p.A., which belongs to the same group as the audit company, Reconta Ernst & Young S.p.A., signed a consultancy contract with the Company for a control model project pursuant to Law 262/05, which will be implemented during the 2013 �nancial year as indicated in the Explanatory Notes to the Financial Statements. The Board of Statutory Auditors has examined the Financial Statements for the �nancial year to 31 December 2012, the Consolidated Financial Statements and the Directors’ Report on Operations, and reports that:1. not having been requested to provide an analysis of the contents of the Financial Statements, we have examined the general preparation of the Parent Company and Consolidated Financial Statements and their general compliance with the laws governing their preparation and structure.2. we have veri�ed compliance with the legal regulations governing the preparation of the Directors’ Report on Operations to ensure that it adequately describes the economic, capital and �nancial situation and the performance in 2012, as well as the performance after the end of the reporting period, of the Company and of its subsidiaries, and in this regard we have no speci�c comment to make.3. As far as we are aware, in preparing the Financial Statements the Directors have adhered to the provisions of Article 2423, paragraph 4 of the Italian Civil Code.4. We have veri�ed that the Financial Statements correspond to the facts and to the information which came to our knowledge in the execution of our duties and we have no observations to make in this regard.Given also the results of the work of the legal audit company for the accounts, which are given in the relevant reports accompanying the Financial Statements, we propose that the Shareholders’ Meeting approves the Financial Statements for the year to 31 December 2012, the allocation of the pro�t for the year, with the partial use of retained pro�ts from previous �nancial periods, as proposed by the directors.The supervisory activities described above were conducted in the course of the twelve meetings of the Board of Statutory Auditors, the seven meetings of the Board of Directors at which the Chairman of the Board of Statutory Auditors was also present, and the seven meetings of the Committee for Control and Risks (previously the Internal Audit Committee).In the course of these supervisory activities and on the basis of information obtained from the audit company, there have been no omissions, censurable acts or irregularities or facts of any signi�cance that need to be reported to the regulatory bodies.
The registered o�ce of the Company, 6 April 2013
The Board Of Statutory AuditorsMr. Adolfo Leonardi
Prof. Giacinto AlessandriMr. Giancarlo Poletti
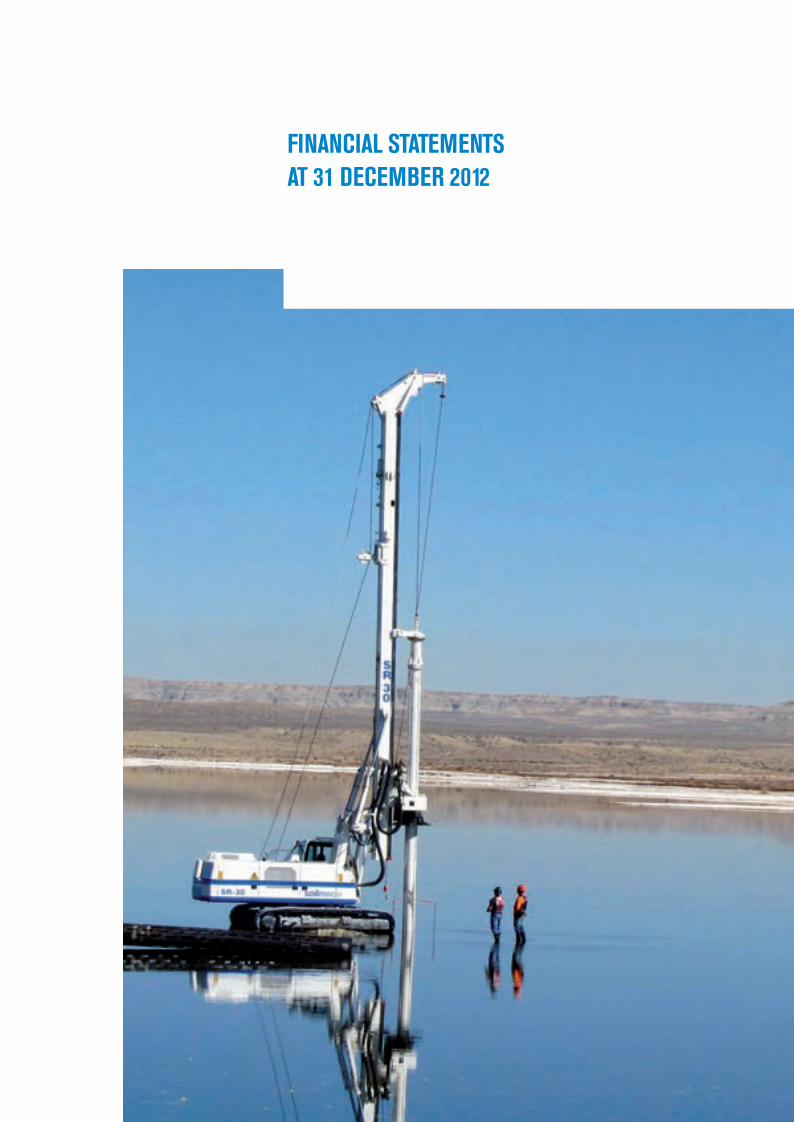
FINANCIAL STATEMENTS AT 31 DECEMBER 2012

FINANCIAL STATEMENTSSTATEMENT OF FINANCIAL POSITION
ASSETS Note 31/12/2012 31/12/2011
Non-current Assets
Tangible Fixed Assets
Land and buildings 21,409,310 21,895,463
Plant and equipment 3,927,070 6,700,853
Other assets 151,140 212,337
Fixed assets under construction and pre-payments 1,229,004 0
Total Tangible Fixed Assets (1) 26,716,524 28,808,653
Intangible Fixed Assets
Concessions, licences, brands 194,409 304,441
Total Intangible Fixed Assets (2) 194,409 304,441
Investments (3) 23,632 23,632
Investments in consolidated entities (3) 112,948,606 112,308,976
Tax assets for deferred taxes (4) 1,108,882 395,409
Other non-current �nancial receivables from subsidiaries (5) 238,287,282 212,913,147
- of which with related parties 238,287,282 212,913,147
Total Financial Fixed Assets 352,368,402 325,641,163
Total Non-current Assets 379,279,335 354,754,258
Current Assets
Trade receivables and other current assets (6) 922,909 1,123,236
- of which with related parties 46,841 25,743
Trade receivables and other current assets from subsidiaries (7) 11,650,671 14,096,096
- of which with related parties 11,650,671 14,096,096
Tax assets for current taxes (8) 7,817,808 1,963,226
Cash and cash equivalents (9) 1,089,537 1,775,957
Total Current Assets 21,480,925 18,958,515
TOTAL ASSETS 400,760,260 373,712,773
Annual Report at 31 December 2012
122
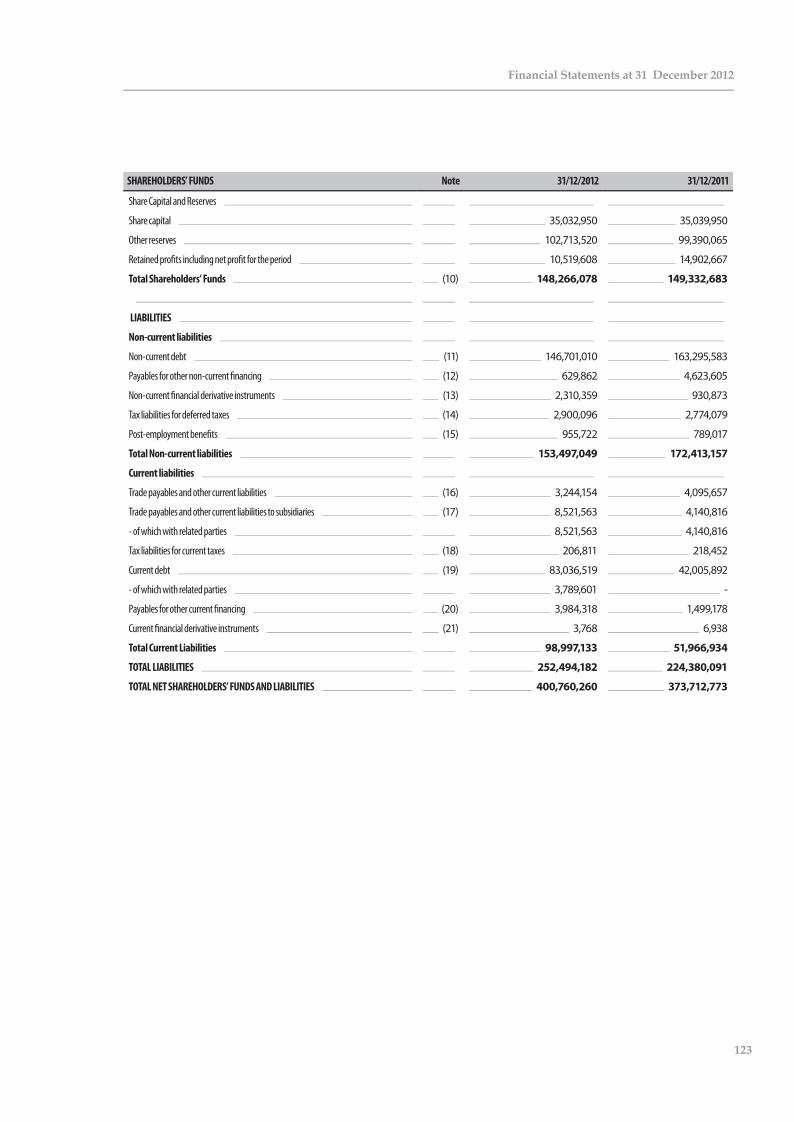
SHAREHOLDERS’ FUNDS Note 31/12/2012 31/12/2011
Share Capital and Reserves
Share capital 35,032,950 35,039,950
Other reserves 102,713,520 99,390,065
Retained pro�ts including net pro�t for the period 10,519,608 14,902,667
Total Shareholders’ Funds (10) 148,266,078 149,332,683
LIABILITIES
Non-current liabilities
Non-current debt (11) 146,701,010 163,295,583
Payables for other non-current �nancing (12) 629,862 4,623,605
Non-current �nancial derivative instruments (13) 2,310,359 930,873
Tax liabilities for deferred taxes (14) 2,900,096 2,774,079
Post-employment bene�ts (15) 955,722 789,017
Total Non-current liabilities 153,497,049 172,413,157
Current liabilities
Trade payables and other current liabilities (16) 3,244,154 4,095,657
Trade payables and other current liabilities to subsidiaries (17) 8,521,563 4,140,816
- of which with related parties 8,521,563 4,140,816
Tax liabilities for current taxes (18) 206,811 218,452
Current debt (19) 83,036,519 42,005,892
- of which with related parties 3,789,601 -
Payables for other current �nancing (20) 3,984,318 1,499,178
Current �nancial derivative instruments (21) 3,768 6,938
Total Current Liabilities 98,997,133 51,966,934
TOTAL LIABILITIES 252,494,182 224,380,091
TOTAL NET SHAREHOLDERS’ FUNDS AND LIABILITIES 400,760,260 373,712,773
123
Financial Statements at 31 December 2012

FINANCIAL STATEMENTSINCOME STATEMENT
Note 31/12/2012 31/12/2011
Revenues from sales and services (22) 10,941,607 11,186,308
- of which with related parties 10,926,141 11,121,521
Other operating revenues (23) 2,511,927 1,803,162
- of which with related parties 2,504,191 1,764,690
Raw materials and consumables (24) 32,171 41,678
- of which with related parties 252 454
Personnel expenses (25) 4,243,571 4,247,238
Other operating expenses (26) 7,113,707 6,858,144
- of which with related parties 242,136 172,578
Depreciation (27) 1,739,258 2,142,112
Operating pro�t 324,827 -299,702
Financial revenues (28) 21,200,184 22,100,973
- of which with related parties 21,190,782 22,093,229
Financial expenses (29) 10,116,842 8,191,921
- of which with related parties 463,184 2,984
Gains/ (losses) on exchange rates (30) -456,984 1,467,073
Sub-total of Financial Income/ (Expenses) and Gains/(Losses) on Exchange Rates 10,626,358 15,376,125
Pre-tax pro�t 10,951,185 15,076,423
Tax (31) 1,928,627 1,670,806
Net pro�t (32) 9,022,558 13,405,617
Annual Report at 31 December 2012
124

STATEMENT OF COMPREHENSIVE INCOME 31/12/2012 31/12/2011
Pro�t (loss) for the period 9,022,558 13,405,617
Pro�t (loss) from cash �ow hedges
Tax -1,687,327 -925,099
E�ect of net gains (losses) from cash �ow hedges 764,036 307,841
-923,291 -617,258
Total comprehensive pro�t (loss) net of tax
Pro�t (loss) for the period 8,099,267 12,788,359
STATEMENT OF CHANGES IN NET EQUITYDescription Share capital Other reserves Retained
pro�ts/(losses)Net pro�t for
the periodTotal
net equity
Balance at 31/12/2009 32,000,000 54,773,299 1,497,050 10,855,509 99,125,858
Allocation of pro�t - 3,175,509 - -3,175,509 0
Dividend distribution - - - -7,680,000 -7,680,000
Purchase and (sale) of treasury shares - 10,327 - - 10,327
Comprehensive Pro�t \ (Loss) - 70,230 - 9,026,704 9,096,934
Balance at 31/12/2010 32,000,000 58,029,366 1,497,050 9,026,704 100,553,121
Allocation of pro�t - 706,704 - -706,704 -
Dividend distribution - - -8,320,000 -8,320,000
Purchase and (sale) of treasury shares -57,200 -636,967 - - -694,167
Conversion of convertible bond loan 3,097,150 41,908,219 - - 45,005,369
Comprehensive Pro�t \ (Loss) - -617,258 - 13,405,617 12,788,359
Balance at 31/12/2011 35,039,950 99,390,065 1,497,050 13,405,617 149,332,682
Allocation of pro�t - 4,280,358 - -4,280,358 -
Dividend distribution - 16,692 - -9,125,259 -9,108,567
Purchase and (sale) of treasury shares -7,000 -50,304 - - -57,304
Comprehensive Pro�t \ (Loss) - -923,291 - 9,022,558 8,099,267
Balance at 31/12/2012 35,032,950 102,713,520 1,497,050 9,022,558 148,266,078
125
Financial Statements at 31 December 2012

STATEMENT OF CASH FLOWS Note 31/12/2012 31/12/2011
Net pro�t for the period 0 9,022,558 13,405,617
Tax (32) 1,928,627 1,670,806
Pre-tax Pro�t 10,951,185 15,076,423
Depreciation (27) 1,739,258 2,142,112
Financial (income)/expenses (28) - (29) - (30) (10,626,358) (15,376,125)
Movements to reserve for risks and reserve for post-employment bene�ts (15) 263,228 234,850
Decrease in the reserve for post-employment bene�ts (15) (96,523) (422,610)
(A) Cash Flow from Operations before Working Capital 2.230.790 1,654,651
(Increase)/decrease in trade receivables (6) 200,327 (430,733)
(Increase)/decrease in other assets (7) (8) (4) (4,122,630) 35,889,194
Increase/ (decrease) in trade payables (16) (851,503) 611,548
Increase/ (decrease) in other liabilities (14) - (17) - (18) 3,052,068 (9,512,428)
(B) Changes in Working Capital (1,721,737) 26,557,581
(C) Financial income/ (expenses) (28) - (29) - (30) 3,748,858 4,890,267
(D) Cash out for taxes (18) (485,573) (2,856,400)
(E) Cash �ow / (absorption) from Operating Activities (A+B+C+D) 3,772,338 30,246,098
Net (investments) in tangible �xed assets (1) - (27) 479,487 (3,390,576)
Net (investments) in intangible �xed assets (2) - (27) (16,583) (44,947)
Net change in �nancial �xed assets (3) - (5) (26,013,766) (61,820,240)
(F) Cash �ow/ (absorption) from investment activities (25,550,862) (65,255,763)
Increase/ (decrease) in share capital and reserves for purchase of treasury shares and conversion of indirect convertible bond loan (10) (40,612) 44,311,203
Other changes (10) (923,291) (617,258)
Increase/ (decrease) in bank liabilities (11) - (13) - (19)- (21) 25,812,371 (9,779,064)
Increase/ (decrease) in liabilities for other �nancing (12) - (20) (1,508,603) (905,198)
Dividends received (28) 6,877,500 11,790,000
Dividends distributed (10) (9,125,259) (8,320,000)
(G) Cash Flow from Financing Activities 21,092,105 36,479,683
(H) Increase (Decrease) in cash �ows (E+F+G) (686,420) 1,470,018
Opening Balance 1,775,957 305,938
Net Change in Cash Flows (686,420) 1,470,018
Closing balance 1,089,537 1,775,957
Annual Report at 31 December 2012
126

Net cash and cash equivalents 31/12/2012 31/12/2011
Cash and cash equivalents 1,089,537 1,775,957
Overdrafts repayable on demand -28,375 -38,769
Available cash 1,061,162 1,737,188
127
Financial Statements at 31 December 2012

128

NOTES TO THE FINANCIAL STATEMENTS AT 31 DECEMBER 2012

Company pro�le and businessTREVI – Finanziaria Industriale S.p.A. (henceforward also the “Company” or the “Parent Company”) is the holding company for the industrial shareholdings of a Group that operates in the following two sectors:• Foundation engineering services for civil works and
infrastructure projects and oil drilling services (henceforth the “Special Foundations and Drilling Services Division”);
• Manufacture of equipment for special foundations and drill rigs for the extraction of hydrocarbons and water exploration (henceforth the “Mechanical Engineering Division”).
• These business sectors are organised within the four main companies of the Group:
• Trevi S.p.A., which heads the sector of foundation engineering;
• Petreven S.p.A., active in the drilling sector providing oil drilling services;
• Soilmec S.p.A., which heads the relative Division and manufactures and markets plant and equipment for foundation engineering;
• Drillmec S.p.A., which produces and sells drilling equipment for the extraction of hydrocarbons and water exploration.
The Group is also active in the sector of renewable energy, mainly wind energy, through the subsidiary Trevi Energy S.p.A.TREVI – Finanziaria Industriale S.p.A., controlled by Trevi Holding SE which, in turn, is controlled by I.F.I.T. S.r.l., has been listed on the Milan stock exchange since July 1999.These Financial Statements were approved and their publication authorised by the meeting of the Board of Directors on 22 March 2013. However, the Shareholders’ Meeting has the power to alter the Financial Statements as proposed by the Board of Directors.Information on the business areas in which the Group operates, on related party transactions and on events after the end of the reporting period is given in the Directors’ Report on Operations.
Structure and contents of the Financial Statements The Parent Company Financial Statements have been prepared in accordance with the International Financial Reporting Standard (IFRS) issued by the International Accounting Standards Board (IASB) and rati�ed by the European Commission with Article 6 of Ruling (EC) no.1606/2002 of the European Parliament and by the Council on 19 July 2002 in Legislative Decree of 28 February 2005 no.38 and subsequent modi�cations, amendments and relevant Consob resolutions and according to the relative IFRIC interpretive standards issued by the International Financial
Reporting Interpretation Committee and the earlier SIC issued by the Standing Interpretations Committee.The section on valuation criteria gives the main international accounting standards used in preparing the Parent Company Financial Statements at 31 December 2012.The Parent Company Financial Statements at 31 December 2012 also give the �gures for the �nancial year at 31 December 2011 for comparative purposes. The following classi�cations have been used:• “Statement of �nancial position” for current/non-current
entries;• “Income Statement” by nature;• “Statement of comprehensive income”, which, in addition
to the pro�t for the year, includes all changes in equity other than transactions with shareholders;
• “Statement of Cash Flows” prepared using the indirect method.
This classi�cation gives information that best re�ects the �nancial performance and the �nancial position of the Company.The functional currency of the Company is the Euro.The tables in the present Financial Statements and the Notes to the Financial Statements, unless otherwise indicated, are in Euro units.
Accounting standardsHistorical cost accounting has been used for all the assets and liabilities except for available for sale �nancial assets, held for trading �nancial assets, and �nancial derivative instruments where fair value principles and the assumption of business continuity have been applied.
Valuation criteriaThe preparation of the Financial Statements requires the Directors to make subjective valuations, estimates and assumptions which a�ect the values of revenues, costs, assets and liabilities and indications of potential liabilities at the date of the Financial Statements. The main entries in the Financial Statements that have required the use of estimates are:• pre-paid tax assets, in particular as regards the likelihood of
them being o�-set in the future;• provisions for doubtful receivables and provisions for risks
and costs;• the main assumptions in the actuarial calculation of the
sta�-leaving indemnity fund (TFR) are the future employee turnover rate and the discount rate.
The valuation criteria used for the Income Statement and the Statement of Financial Position entries are described below.
Annual Report at 31 December 2012
130

Tangible �xed assetsTangible �xed assets are stated at their acquisition or production cost. The cost of acquisition or production re�ects the fair value of the price paid to purchase or produce the asset and all other direct costs sustained to bring the asset to working condition. The capitalization of costs contingent on adding to, updating or improving assets for own use or in use from third parties is only e�ected when these costs meet the requirement for them to be classi�ed as a separate asset or part of an asset.
Tangible �xed assets are carried at cost, net of accumulated depreciation and any impairment losses. The depreciable value of each signi�cant component of a �xed asset with a di�erent useful life is divided on a straight line basis over the expected useful life. The useful life by category of �xed assets is as follows:
CATEGORY OF FIXED ASSET RATE
Land Inde�nite useful life
Industrial buildings 5%
Fixtures and Fittings 12%
Electronic machinery 20%
Drilling and foundation equipment 7.50%
Generic equipment 10%
Vehicles 18.75%
Various and smaller equipment 20%
The criteria for the depreciation rate used, the useful life and the residual value are calculated at least as often as the end of each reporting period in order to take account of any signi�cant changes. The capitalized costs for improvements to third-party assets are recognised in the relevant �xed asset category and depreciated for the shorter of either the residual length of the leasing contract or the residual useful life.The carrying value of tangible �xed assets remains in the Statement of Financial Position as long as that value can be recouped from their use. At any indication that the net carrying value may not be recoverable, an impairment test is carried out. Reversal of the impairment loss is only done if the reason for the original recognition of the impairment no longer exists.
Leasing contractsFinancial leasing contracts are accounted for in accordance with IAS 17. This requires that:• the cost of leased assets is recognised in �xed assets and is
depreciated on a straight line basis for the estimated useful life of the asset; there is a corresponding entry for �nancial payables towards the lessor for an amount equal to the fair value of the leased asset;
• lease payments are recognised in such a way as to separate the �nancial element from the capital element, considered as repayment of the outstanding liability to the lessor.
Leasing contracts where the lessor retains almost all the risks and rewards of the asset are classed as operating leases and the lease payments are recognised as an expense in pro�t or loss over the lease term on a straight line basis.
Intangible �xed assetsIntangible �xed assets are recognized at the cost of acquisition or production. The cost of acquisition is the fair value of the cost paid for the asset and all other direct costs sustained to bring the asset to working condition. Other intangible �xed assets, represented by industrial patents, intellectual property rights, concessions, licenses, similar rights, and software are valued at cost net of accumulated depreciation, calculated on a straight line basis, for the estimated length of their useful life, �ve years, barring any signi�cant impairment. The criteria for depreciation, useful life and residual value are examined and measured at least as often as the end of each reporting period in order to take account of any signi�cant changes, as required by IAS 38.
Investments in subsidiaries and associates Subsidiaries are those companies in which TREVI – Finanziaria Industriale S.p.A. has the independent right to exercise control over the management of the company and to obtain the bene�ts of its activities. Control is presumed to exist when the Company holds, directly and indirectly, the majority of the voting rights exercisable in an ordinary shareholders’ meeting, including any potential voting rights deriving from convertible instruments.Associate companies are those in which TREVI – Finanziaria Industriale S.p.A. exercises signi�cant in�uence over the management of the company but where it does not have operating control, including any potential voting rights deriving from convertible instruments; it is deemed to have signi�cant in�uence when TREVI – Finanziaria Industriale S.p.A. holds, directly and indirectly, more than 20% of the voting rights exercisable in an ordinary shareholders’ meeting.Investments in subsidiaries and associates are valued at acquisition cost reduced by capital distribution or capital reserves or for impairment following impairment tests. The �gures are reversed in subsequent �nancial years if the reasons for the impairment no longer exist.
131
Financial Statements at 31 December 2012

All the companies listed in the relevant note to the accounts have been valued using the cost method in the Financial Statements of TREVI – Finanziaria Industriale S.p.A.The accounting value of these investments is subject to impairments tests when there is any indication that the accounting value may not be recoverable.
Investments in other entitiesInvestments in other smaller entities for which no market values are available are recognised at cost less any eventual impairment.
Impairment of assetsAn asset is impaired when its carrying value is greater than its recoverable amount. At the end of each reporting period the presence of any indications that assets may be impaired is assessed. If there is any such indication, the recoverable amounts are calculated and any eventual impairment losses recognized in the accounts. For assets not yet available for use and assets recognized during the current �nancial year, the impairment test is carried out at least annually independent of the presence of any indications of impairment.
Financial assets and liabilitiesFinancial assets are classi�ed as follows:• Financial assets at fair value through pro�t or loss: �nancial
assets acquired primarily with the intention of generating a pro�t from short-term (not more than three months) price �uctuations or assets designated as such on initial recognition;
• Held-to-maturity investments: investments in �nancial assets with �xed maturities and determinable or �xed payments which the Company has the intention and capacity to hold to maturity;
• Loans and receivables: �nancial assets with �xed maturities and determinable or �xed payments, not listed on active markets and di�erent from those designated from initial recognition as �nancial assets at fair value through pro�t and loss or as available for sale �nancial assets;
• Available-for-sale �nancial assets: �nancial assets other than those in the preceding paragraphs or those designated as such on initial recognition.
The Company decides the designation of the �nancial assets at the moment of purchase; the initial recognition is the fair value at the purchase date, including transaction costs; for purchase or sale date, the settlement date of the transaction is intended.After initial recognition, the �nancial assets at fair value through pro�t and loss and the available-for-sale �nancial assets are
measured at fair value; the held-to-maturity investments, as well as loans receivable and other �nancial receivables, are measured at amortised cost using the e�ective interest method as required by IAS 39. The gains and losses deriving from changes in fair value of the �nancial assets at fair value through pro�t and loss are recognised in pro�t or loss. The unrealized gains and losses deriving from changes in the fair value of available for sale �nancial assets are recognized in equity.The fair value of �nancial assets is measured on the basis of listed o�er prices or �nancial models. The fair value of unlisted �nancial assets is estimated using valuation techniques appropriate to the characteristics of the issuer. Financial assets for which the current value cannot be reliably determined are accounted for at cost less impairmentAt the end of each reporting period the presence of any indications that assets may be impaired is assessed and any losses are recognised in pro�t or loss. Financial liabilities are initially recognized at the fair value of the sums raised, net of transaction costs, and subsequently valued at amortised cost.
Trade receivables �nancial receivables and other non-current �nancial assetsReceivables and other non-current �nancial assets are initially recognised at fair value and subsequently at amortised cost.Single �nancial assets or groups of �nancial assets are regularly subject to impairment test to ascertain if there is any objective evidence of impairment. If there is any indication of impairment it is recognised in pro�t or loss for the period.
Trade receivables and other current assets Receivables due within the credit terms or which carry interest at market rates are not discounted but are recognised at nominal value net of a provision for doubtful receivables so that their value is in line with their estimated realisable value. Receivables are recognised at their estimated realisable value: this value approximates to amortised cost. If this is expressed in foreign currency, it is translated at the exchange rate prevailing at the end of the reporting period.This entry also includes the share of costs and revenues spread over two or more �nancial years to re�ect the time proportion principle correctly.Receivable sales with recourse and those without recourse, which under IAS 39 do not qualify to be excluded from assets because the relative risks and bene�ts have not substantially been transferred, remain in the Statement of Financial Position of the Company even if they have been legally transferred
Annual Report at 31 December 2012
132
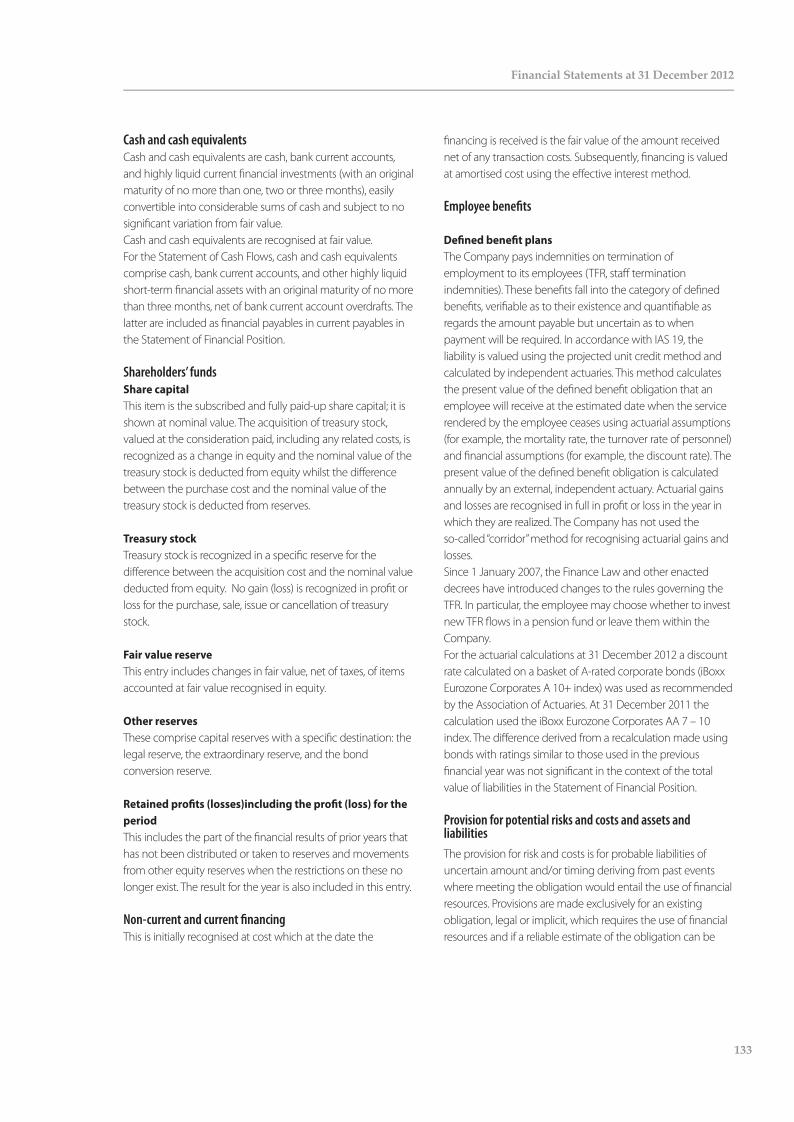
Cash and cash equivalentsCash and cash equivalents are cash, bank current accounts, and highly liquid current �nancial investments (with an original maturity of no more than one, two or three months), easily convertible into considerable sums of cash and subject to no signi�cant variation from fair value.Cash and cash equivalents are recognised at fair value. For the Statement of Cash Flows, cash and cash equivalents comprise cash, bank current accounts, and other highly liquid short-term �nancial assets with an original maturity of no more than three months, net of bank current account overdrafts. The latter are included as �nancial payables in current payables in the Statement of Financial Position.
Shareholders’ fundsShare capitalThis item is the subscribed and fully paid-up share capital; it is shown at nominal value. The acquisition of treasury stock, valued at the consideration paid, including any related costs, is recognized as a change in equity and the nominal value of the treasury stock is deducted from equity whilst the di�erence between the purchase cost and the nominal value of the treasury stock is deducted from reserves.
Treasury stockTreasury stock is recognized in a speci�c reserve for the di�erence between the acquisition cost and the nominal value deducted from equity. No gain (loss) is recognized in pro�t or loss for the purchase, sale, issue or cancellation of treasury stock.
Fair value reserveThis entry includes changes in fair value, net of taxes, of items accounted at fair value recognised in equity.
Other reservesThese comprise capital reserves with a speci�c destination: the legal reserve, the extraordinary reserve, and the bond conversion reserve.
Retained pro�ts (losses)including the pro�t (loss) for the periodThis includes the part of the �nancial results of prior years that has not been distributed or taken to reserves and movements from other equity reserves when the restrictions on these no longer exist. The result for the year is also included in this entry.
Non-current and current �nancingThis is initially recognised at cost which at the date the
�nancing is received is the fair value of the amount received net of any transaction costs. Subsequently, �nancing is valued at amortised cost using the e�ective interest method.
Employee bene�ts
De�ned bene�t plansThe Company pays indemnities on termination of employment to its employees (TFR, sta� termination indemnities). These bene�ts fall into the category of de�ned bene�ts, veri�able as to their existence and quanti�able as regards the amount payable but uncertain as to when payment will be required. In accordance with IAS 19, the liability is valued using the projected unit credit method and calculated by independent actuaries. This method calculates the present value of the de�ned bene�t obligation that an employee will receive at the estimated date when the service rendered by the employee ceases using actuarial assumptions (for example, the mortality rate, the turnover rate of personnel) and �nancial assumptions (for example, the discount rate). The present value of the de�ned bene�t obligation is calculated annually by an external, independent actuary. Actuarial gains and losses are recognised in full in pro�t or loss in the year in which they are realized. The Company has not used the so-called “corridor” method for recognising actuarial gains and losses.Since 1 January 2007, the Finance Law and other enacted decrees have introduced changes to the rules governing the TFR. In particular, the employee may choose whether to invest new TFR �ows in a pension fund or leave them within the Company.For the actuarial calculations at 31 December 2012 a discount rate calculated on a basket of A-rated corporate bonds (iBoxx Eurozone Corporates A 10+ index) was used as recommended by the Association of Actuaries. At 31 December 2011 the calculation used the iBoxx Eurozone Corporates AA 7 – 10 index. The di�erence derived from a recalculation made using bonds with ratings similar to those used in the previous �nancial year was not signi�cant in the context of the total value of liabilities in the Statement of Financial Position.
Provision for potential risks and costs and assets and liabilitiesThe provision for risk and costs is for probable liabilities of uncertain amount and/or timing deriving from past events where meeting the obligation would entail the use of �nancial resources. Provisions are made exclusively for an existing obligation, legal or implicit, which requires the use of �nancial resources and if a reliable estimate of the obligation can be
133
Financial Statements at 31 December 2012

made. The amount taken as a provision is the best estimate of the necessary cost to meet the obligation at the end of the reporting period. The provisions made are reassessed at each end of the reporting period and adjusted to the best current estimate. Where the �nancial cost related to the obligation is deferred beyond the normal payment date and the e�ect of calculating the net present value is signi�cant, the amount of the provision is the current value of the future expected payments required to meet the obligation.Potential assets and liabilities are not recognised in the Statement of Financial Position; however, information is given on those of a material amount.
Derivative instrumentsThe Company has adopted a Group Risk Policy. Recognition of changes in fair value di�ers according to the designation of the derivative instrument (held for trading or hedge) and the nature of the risk covered (Fair Value Hedge or Cash Flow Hedge).For those contracts designated as held for trading, changes in fair value are recognized directly in pro�t or loss. For those contracts like a Fair Value Hedge, changes in fair value of the hedging instrument and of the hedged item are recognized in pro�t or loss, irrespective of the valuation criteria adopted for the latter. For Cash Flow Hedges, changes in fair value are recognized directly in equity if the hedging instrument is held to be an e�ective hedge whilst the portion held to be ine�ective is recognized in pro�t or loss. The changes recognized in equity are recycled to pro�t or loss in the same �nancial period or periods in which the hedged asset or liability a�ects pro�t or loss.Purchase or sale of derivative instruments is recognised at the trade date.
Revenues and expensesRevenues are recognized at fair value for the amounts received or expected. Revenues are accounted for to the extent that the economic bene�ts are probable and the relative amount, including any related expenses or future expenses, can be reliably estimated.Revenues deriving from the sale of an asset are recognized upon transfer of the risks of ownership, normally at the time of shipping, at the fair value of the amounts received or expected, including any eventual discounts. Revenues from services are recognised according to the percentage of completion, based on the work carried out. Expenses are recognized on a similar basis to revenues and always recognized on a time-proportion basis.
Financial income and expenses are recognized in pro�t or loss on a time-proportion basis and using the e�ective interest method. Dividends are recognized in the �nancial year when the shareholders have the right to receive the payment.
TaxesTaxes on pro�t for the year are calculated as the amount expected to be paid under the enacted tax laws. Deferred and pre-paid taxes are calculated for the temporary di�erences between the carrying amounts in the Statement of Financial Position and the corresponding tax base values and for the amount carried forward of unused tax losses or tax credits, as long as it is probable that repayment (payment) reduces (increases) the future tax payments compared to the amount which would have been attested if that repayment (payment) had had no �scal implications. The �scal e�ects of operations or transactions are recognized either in pro�t or loss or directly in equity in the same way as the operations or transactions that gave rise to the tax charge are recognized. Taxes not linked to pro�t are recognised in other operating expenses.From the 2006 �nancial year to the date of the present Report and renewable every three years, TREVI - Finanziaria Industriale S.p.A. and almost all its directly and indirectly controlled Italian subsidiaries have chosen to opt for the National Group Tax Regime under the provisions of Articles 117/129 of the Income Tax Consolidation Act (T.U.I.R.).TREVI - Finanziaria Industriale S.p.A. acts as the consolidating company and calculates the taxable amount for the group of companies that opted for the Group Tax Regime; these companies bene�t from the possibility of o�setting taxable income with tax losses carried forward in a single declaration. Each company under the National Group Tax Regime transfers to the consolidating company the taxable amount (taxable income or tax losses). TREVI - Finanziaria Industriale S.p.A. recognises a receivable for those companies that have taxable income, which is equal to the amount of IRES to be paid. For those companies with tax losses, TREVI – Finanziaria Industriale S.p.A. recognises a payable equal to the IRES amount for the loss, which is o�set at the Group level.
CurrencyThe Financial Statements are prepared in Euro, which is the functional currency of the Parent Company. Transactions in foreign currency are translated into the functional currency at the exchange rate of the day of the transaction. Exchange rate gains or losses, deriving from the settlement of these transactions and from the conversion at the end of the reporting period of �nancial receivables and payables
Annual Report at 31 December 2012
134

expressed in foreign currencies, are recognized in pro�t or loss.
Use of estimatesThe preparation of the Consolidated Financial Statements requires Management to apply accounting principles and methodologies that, in some cases, employ complex and subjective valuations and estimates. These are based on past experience and assumptions, which are always considered reasonable and realistic given the information available at the time. Given the joint document of the Bank of Italy/Consob/Isvap No. 2 of 6 February 2009, it is speci�ed that estimates are based on the most recent information available to Management at the time the Financial Statements were prepared and are not detrimental to the reliability of the Financial Statements.The application of these estimates and assumptions a�ects the �gures in the Financial Statements - the Statement of Financial Position, the Income Statement and the Statement of Cash Flows, as well as those given as additional information. Real results may di�er from these estimates given the uncertainty surrounding the assumptions and conditions on which the estimates are based. Listed below are the items of the Financial Statements requiring the greatest degree of subjectivity on the part of Management in establishing estimates and, for which any change in the conditions underlying the assumptions made, would have a signi�cant impact on the Consolidated Financial Statements of the Group:• Impairment of �xed assets;• Contract work in progress;• Development costs;• Deferred tax assets;• Provisions for doubtful receivables;• Employee bene�ts;• Provisions for risks and costs.Estimates and assumptions are reviewed periodically and the e�ects of any changes are recognised in pro�t or loss in the period in which the change occurred.
Consolidated Financial StatementsThe present Financial Statements, the Consolidated Financial Statements, the Directors’ Report on Operations, the Report on Corporate Governance and on the Company’s Ownership Structure, the Report on Remuneration and the reports of the audit bodies will be deposited at the registered o�ce of the Company and will be publicly available on the Company website www.trevi�n.com, at Borsa Italiana S.p.A. and at the Business Registry under the terms prescribed by law.
Accounting standards, amendments and interpretations e�ective from 1 January 2012The criteria used to prepare the Consolidated Financial Statements are consistent with those used to prepare the Consolidated Financial Statements of the previous �nancial year, except for standards and interpretations e�ective for �nancial periods beginning on or after 1 January 2012 as speci�ed below:• IAS 12 Deferred Tax: Recovery of Underlying Assets• IFRS 1 Severe Hyperin�ation and Removal of Fixed Dates for
First-time Adopters• IFRS 7 Financial Instrument: Disclosures – Transfers of
Financial Assets The adoption of the standards and interpretations is described below:
IAS 12 - Deferred tax: Recovery of Underlying AssetsThis amendment clari�es the measurement of deferred tax on investment property measured using the fair value model. It introduces a rebuttable presumption that recovery of the carrying amount of investment property measuring using the fair value model in IAS 40 will be recovered through sale and, accordingly, that any related deferred tax should be measured on a sale basis. The assumption is rebutted if the investment property is depreciable and it is held within a business model whose objective is to consume substantially all of the economic bene�ts in the investment property over time rather than through sale. The amendments are mandatory for annual periods beginning on or after 1 January 2012. The amendment has had no impact on the �nancial position, �nancial performance or data given by the Company.
IFRS 1 – Severe Hyperin�ation and Removal of Fixed Dates for First-time AdoptersThe IASB has provided �rst-time adopters with relief from retrospective restatement of derecognition included in IFRS when it ceases to have a functional currency with the characteristics of severe hyperin�ation. The amendments must be applied for annual periods beginning on or after 1 July 2011. This amendment has had no impact on the Company.
IFRS 7 – Financial Instruments: Disclosures – Transfers of Financial Assets The amendment requires entities to provide disclosures on transferred assets that are not derecognised in their entirety: the entity shall disclose information that enables users of its �nancial statements to understand the relationship between
135
Financial Statements at 31 December 2012
transferred �nancial assets that are not derecognised in their entirety and the associated liabilities. For transferred �nancial assets that are derecognised in their entirety but in which the entity maintains a residual interest, information must be disclosed that enables users of the �nancial statements to evaluate the maximum exposure to loss from continuing involvement in the derecognised �nancial assets. The amendment must be applied for annual periods beginning on or after 1 July 2011.
Accounting standards, amendments and interpretations not yet e�ective and which have not been applied early by the CompanyThe following international accounting standards and interpretations will be e�ective from annual periods beginning on or after 1 January 2013 and their e�ect on the Company Financial Statements is being analysed. The Company has not opted for early application of any other standard, interpretation or improvement issued but not yet mandatory.
IAS 1 Presentation of Financial Statements – Presenting Comprehensive IncomeThe amendments to IAS 1 require entities to change the presentation of items of other comprehensive income. Items of other comprehensive income should be grouped on the basis of whether they will eventually be reclassi�ed (or “recycled) to pro�t or loss (for example, net income from hedging of net investments, foreign currency translation, net income on cash �ow hedges, and net gains/ losses on available-for-sale �nancial assets) and shown separately from items that will never be recycled (for example, actuarial gains/losses on de�ned bene�t plans and the revaluation of land and buildings). The amendment a�ects the presentation of requirements and has no impact on the �nancial position and �nancial performance of the Company. The amendments are e�ective for annual periods beginning on or after 1 July 2012.
IAS 19 (2011) Employee Bene�ts The IASB has published several amendments to IAS 19. These vary from signi�cant changes such as the option for deferred recognition of actuarial gains or losses through pro�t or loss (the corridor approach) and the recognition of expected returns on plan assets to clari�cation of more minor issues and re-wording of the standard. The amendments are e�ective for annual periods beginning on or after 1 January 2013.
IAS 28 (2011) Investments in Associates and Joint Ventures (amended in 2011)Following publication of IFRS 11 Joint arrangements and IFRS 12
Disclosure of Interests in Other Entities, IAS 28 was renamed Investments in Associates and Joint Ventures; it sets out the requirements for the application of the equity method when accounting for investments in associates and joint ventures. The amendments are e�ective for annual periods beginning on or after 1 January 2014.
IAS 32 O�setting Financial Assets and Financial Liabilities – Amendments to IAS 32The amendment clari�es the criterion that an entity “currently has a legal enforceable right to set o� the recognised amounts”. The amendments also clarify the application of o�setting criteria under IAS 32 when an entity intends either to settle on a net basis or to realise the asset and settle the liability simultaneously. These amendments should have no impact on the �nancial position and �nancial performance of the Company. They are e�ective for annual periods beginning on or after 1 January 2014.
IFRS 7 Disclosures – O�setting �nancial assets and Financial Liabilities – Amendments to IFRS 7These amendments require an entity to disclose information about rights of set-o� and related arrangements (such as collateral agreements). The amendments will provide users of �nancial statements with information about the e�ect of such rights and arrangements on the entity’s �nancial position. The new disclosures are required for all recognised �nancial instruments that are set o� in accordance with IAS 32 Financial Instruments - Presentation. These disclosures also apply to recognised �nancial instruments that are subject to an enforceable master netting arrangement or similar agreement, irrespective of whether they are set o� in accordance with IAS 32. These amendments are e�ective for annual and interim reporting periods beginning on or after 1 January 2013.
IFRS 10 Consolidated Financial Statements, IAS 27 (2011) Separate Financial StatementsIFRS 10 replaces part of IAS 27 Consolidated and Separate Financial Statements which accounting of consolidated �nancial statements. It also resolves the problems arising from SIC-12 Consolidation – Special Purpose Entities. IFRS 10 establishes a single control model that is applicable to all companies, including special purpose entities. Compared to the requirements of IAS 27, the changes introduced with IFRS 10 require management to consider all relevant facts and circumstances to determine whether it controls another company and must, therefore, consolidate this company. These amendments are e�ective for annual periods beginning on or after 1 January 2014.
Annual Report at 31 December 2012
136

IFRS 11 Joint ArrangementsIFRS 11 replaces IAS 31 Interests in Joint Ventures and SIC-13 Jointly Controlled Entities – Non-monetary Contributions by Venturers.IFRS 11 eliminates the possibility of accounting for joint arrangements using the proportionate consolidation method. If a joint arrangement is a joint venture, it must be accounted for using the equity method. The Company is currently evaluating the impact that this standard will have on its �nancial position and �nancial performance. This standard is applicable to annual reporting periods beginning on or after 1 January 2014 and must be applied retrospectively to joint arrangements.
IFRS 12 Disclosure of Interests in Other EntitiesIFRS12 is a consolidated disclosure standard covering the disclosure requirements previously included in IAS 27 for the consolidated �nancial statements as well as the disclosure requirements under IAS 31 and IAS 28. The disclosure requirements relate to an entity’s interests in subsidiaries, joint arrangements, associates and unconsolidated structured entities. Additional information is likely to be required to meet the required level of disclosure of information. The standard will have no impact on the �nancial position or �nancial performance of the Company. This standard applies to annual periods beginning on or after 1 January 2014.
IFRS 13 Fair Value Measurement IFRS 13 sets out in a single IFRS a framework for measuring fair value. IFRS applies when another IFRS requires or permits fair value measurements or disclosures about fair value measurements. The Company is currently evaluating the impact of this accounting standard on its �nancial position and �nancial performance. This standard applies to annual periods beginning on or after 1 January 2013.
Annual Improvements May 2012These improvements will have no impact on the Company:
IAS 1 Presentation of Financial StatementsThis improvement clari�es the di�erence between voluntary additional comparative information and the minimum required comparative information. Normally the minimum comparative information required is that for the previous �nancial period for all amounts reported in the �nancial statements.
IAS 16 Property, Plant and EquipmentThis improvement clari�es that material replacement parts and servicing equipment for maintenance that are classi�ed as property, plant and equipment are not part of inventories.
IAS 32 Financial Instruments: Presentation This improvement clari�es that the tax e�ect of a distribution to holders of equity instruments should be accounted for in accordance with IAS 12: Income Taxes.
IAS 34 Interim Financial ReportingThis amendment aligns the information requirements of segment information for total assets and total liabilities in interim reporting in order to enhance consistency with the requirements of the annual reports.
These improvements will be e�ective for annual periods starting on or after 1 January 2013.
Direction and CoordinationIn accordance with Article 93 of the Consolidated Law it is declared that at 31 December 2012 and at the date of these Financial Statements, TREVI – Finanziaria Industriale S.p.A. is indirectly controlled by I.F.I.T. S.r.l. (a company with its registered o�ce in Cesena) and directly controlled by the Italian company Trevi Holding SE, a company controlled by I.F.I.T. S.r.l.In accordance with the corporate information required by Article 2497 of the Italian Civil Code, regarding direction and coordination exercised by controlling companies, it is stated that, at 31 December 2012 and at the date of these Financial Statements, the Company has made no declaration regarding any eventual direction or coordination by controlling companies as the Board of Directors of TREVI – Finanziaria Industriale S.p.A. maintains that, whilst IFIT S.r.l. indirectly has control of the policies and strategies of TREVI Group, the Company is completely independent of its controlling company as regards its �nancial and operating activities and did not carry out any corporate transaction in the interests of the controlling company in 2012 or in prior �nancial years.
At the date of these Financial Statements, the Company is the Parent Company of TREVI Group (and as such prepares the Consolidated Financial Statements of the Group), and exercises, pursuant to Article 2497 of the Italian Civil Code, direction and coordination of the companies it directly controls:• TreviS.p.A.,withadirectshareholdingof99.78%;
• SoilmecS.p.A.,withadirectshareholdingof99.92%;
• DrillmecS.p.A.,withadirectshareholdingof98.25%(1.75%heldbySoilmecS.p.A.);
• R.C.T.S.r.l.,withanindirectshareholdingof99.78%(100%heldbyTreviS.p.A.);
• TreviEnergyS.p.Awithadirectshareholdingof100%;
• PSMS.r.l.withanindirectshareholdingof
137
Financial Statements at 31 December 2012

69.9%(70%heldbySoilmecS.p.A.)• GOMECS.r.l.withanindirectshareholdingof99.9%(100%heldbyDrillmecS.p.A.)
Risk managementAims, management and identi�cation of �nancial risks The Finance Department of the Parent Company manages the �nancial risks to which the Company is exposed following the guidelines laid down in the Treasury Risks Policy, approved by the Board of Directors. The �nancial assets of the Company are mainly cash and current deposits and are linked directly to the operating activities.The �nancial liabilities include �nancing from banks and leasing agreements that are primarily to �nance operating activities and international growth.The risks associated with these �nancial instruments are interest rate, exchange rate, liquidity and credit risk.
Interest rate risk
Euro -50 bps +50 bps
Cash and cash equivalents -1,065,683 1,065,683
Bank loans 860,276 -860,276
Payables for other �nancing 26,412 -26,412
TOTAL -178,995 178,995
The Company constantly monitors the aforementioned �nancial risks, intervening, if necessary, also through the use of derivative instruments, to reduce the risks to a minimum. The aim of the hedging activity of the Company is to manage exchange rate risk on instruments in currencies other than the Euro and to manage interest rate risk on �nancing with �oating rate interest.Decisions regarding the optimum structure of debt and the division between �xed rate and �oating rate debt are taken by the Company at the consolidated level.The paragraphs below give sensitivity analyses that measure the impact of potential scenarios on some of the risks to which the Company is exposed.
Interest rate riskInterest rate risk is linked to �oating rate current and non-current �nancing. It is Group policy to conclude �oating rate �nancing agreements and then evaluate the need to cover the interest rate risk by exchanging the exposure to a �oating rate to one with a �xed rate. To do this it has taken out Interest Rate Swap contracts whereby the Group agrees to exchange, at pre-�xed intervals, the di�erence between the �xed rate and a �oating rate calculated on a pre-determined notional capital. At 31 December 2012, taking into account the e�ect of these contracts, approximately 18% of the Company �nancing was �xed rate.
31/12/2012Fixed rate Floating rate Total
Loans and other debt 43,207 191,145 234,352
Total �nancial liabilities 43,207 191,145 234,352
% 18% 82% 100%
31/12/2012Fixed rate Floating rate Total
Cash and cash equivalents - 1,089,537 1,089,537
Other �nancial receivables - 238,287,282 238,287,282
Total �nancial assets - 239,376,819 239,376,819
% 0% 100% 100%
Annual Report at 31 December 2012
138
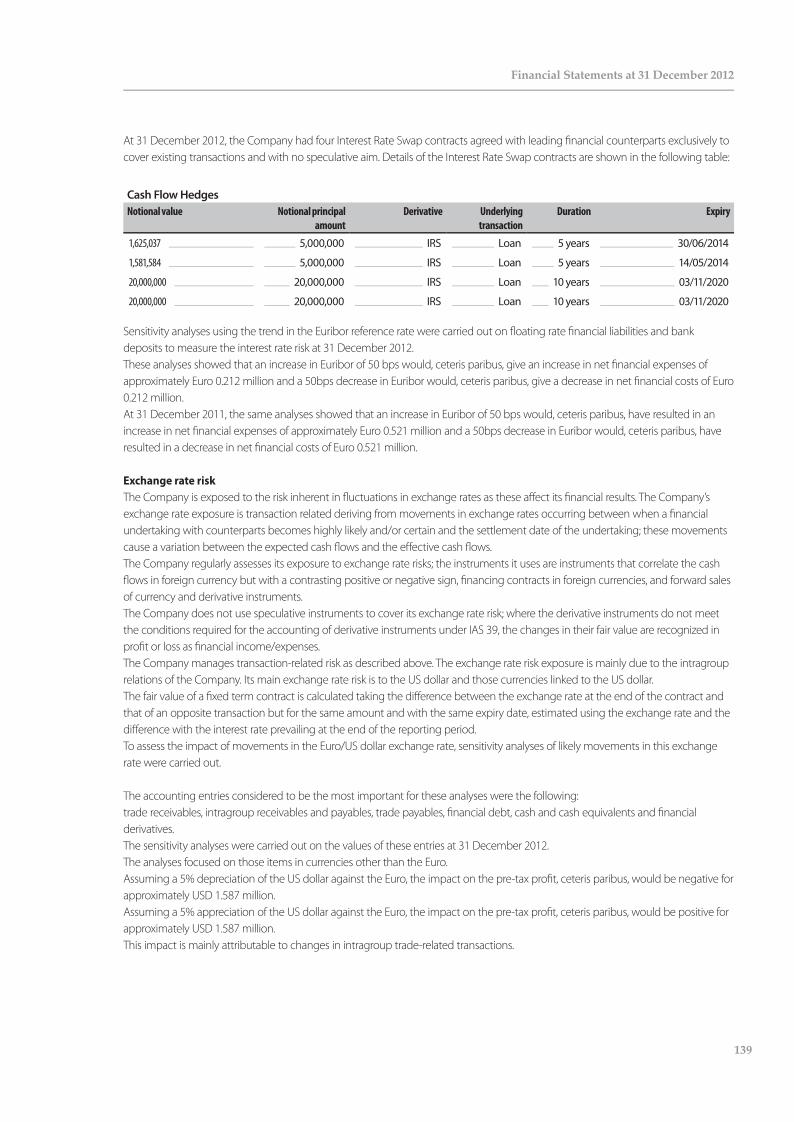
At 31 December 2012, the Company had four Interest Rate Swap contracts agreed with leading �nancial counterparts exclusively to cover existing transactions and with no speculative aim. Details of the Interest Rate Swap contracts are shown in the following table:
Cash Flow Hedges Notional value Notional principal
amountDerivative Underlying
transactionDuration Expiry
1,625,037 5,000,000 IRS Loan 5 years 30/06/2014
1,581,584 5,000,000 IRS Loan 5 years 14/05/2014
20,000,000 20,000,000 IRS Loan 10 years 03/11/2020
20,000,000 20,000,000 IRS Loan 10 years 03/11/2020
Sensitivity analyses using the trend in the Euribor reference rate were carried out on �oating rate �nancial liabilities and bank deposits to measure the interest rate risk at 31 December 2012. These analyses showed that an increase in Euribor of 50 bps would, ceteris paribus, give an increase in net �nancial expenses of approximately Euro 0.212 million and a 50bps decrease in Euribor would, ceteris paribus, give a decrease in net �nancial costs of Euro 0.212 million.At 31 December 2011, the same analyses showed that an increase in Euribor of 50 bps would, ceteris paribus, have resulted in an increase in net �nancial expenses of approximately Euro 0.521 million and a 50bps decrease in Euribor would, ceteris paribus, have resulted in a decrease in net �nancial costs of Euro 0.521 million.
Exchange rate riskThe Company is exposed to the risk inherent in �uctuations in exchange rates as these a�ect its �nancial results. The Company’s exchange rate exposure is transaction related deriving from movements in exchange rates occurring between when a �nancial undertaking with counterparts becomes highly likely and/or certain and the settlement date of the undertaking; these movements cause a variation between the expected cash �ows and the e�ective cash �ows.The Company regularly assesses its exposure to exchange rate risks; the instruments it uses are instruments that correlate the cash �ows in foreign currency but with a contrasting positive or negative sign, �nancing contracts in foreign currencies, and forward sales of currency and derivative instruments. The Company does not use speculative instruments to cover its exchange rate risk; where the derivative instruments do not meet the conditions required for the accounting of derivative instruments under IAS 39, the changes in their fair value are recognized in pro�t or loss as �nancial income/expenses. The Company manages transaction-related risk as described above. The exchange rate risk exposure is mainly due to the intragroup relations of the Company. Its main exchange rate risk is to the US dollar and those currencies linked to the US dollar. The fair value of a �xed term contract is calculated taking the di�erence between the exchange rate at the end of the contract and that of an opposite transaction but for the same amount and with the same expiry date, estimated using the exchange rate and the di�erence with the interest rate prevailing at the end of the reporting period.To assess the impact of movements in the Euro/US dollar exchange rate, sensitivity analyses of likely movements in this exchange rate were carried out.
The accounting entries considered to be the most important for these analyses were the following: trade receivables, intragroup receivables and payables, trade payables, �nancial debt, cash and cash equivalents and �nancial derivatives.The sensitivity analyses were carried out on the values of these entries at 31 December 2012.The analyses focused on those items in currencies other than the Euro.Assuming a 5% depreciation of the US dollar against the Euro, the impact on the pre-tax pro�t, ceteris paribus, would be negative for approximately USD 1.587 million.Assuming a 5% appreciation of the US dollar against the Euro, the impact on the pre-tax pro�t, ceteris paribus, would be positive for approximately USD 1.587 million.This impact is mainly attributable to changes in intragroup trade-related transactions.
139
Financial Statements at 31 December 2012
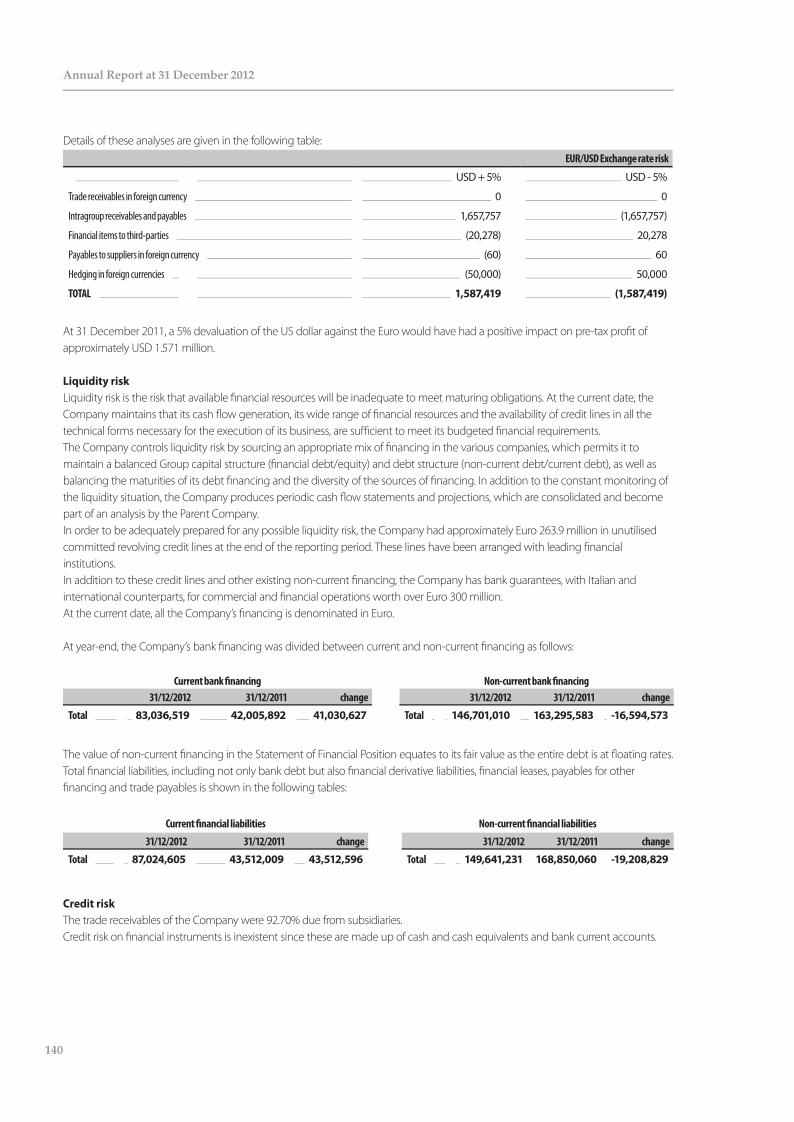
Details of these analyses are given in the following table: EUR/USD Exchange rate risk
USD + 5% USD - 5%
Trade receivables in foreign currency 0 0
Intragroup receivables and payables 1,657,757 (1,657,757)
Financial items to third-parties (20,278) 20,278
Payables to suppliers in foreign currency (60) 60
Hedging in foreign currencies (50,000) 50,000
TOTAL 1,587,419 (1,587,419)
At 31 December 2011, a 5% devaluation of the US dollar against the Euro would have had a positive impact on pre-tax pro�t of approximately USD 1.571 million.
Liquidity riskLiquidity risk is the risk that available �nancial resources will be inadequate to meet maturing obligations. At the current date, the Company maintains that its cash �ow generation, its wide range of �nancial resources and the availability of credit lines in all the technical forms necessary for the execution of its business, are su�cient to meet its budgeted �nancial requirements. The Company controls liquidity risk by sourcing an appropriate mix of �nancing in the various companies, which permits it to maintain a balanced Group capital structure (�nancial debt/equity) and debt structure (non-current debt/current debt), as well as balancing the maturities of its debt �nancing and the diversity of the sources of �nancing. In addition to the constant monitoring of the liquidity situation, the Company produces periodic cash �ow statements and projections, which are consolidated and become part of an analysis by the Parent Company.In order to be adequately prepared for any possible liquidity risk, the Company had approximately Euro 263.9 million in unutilised committed revolving credit lines at the end of the reporting period. These lines have been arranged with leading �nancial institutions.In addition to these credit lines and other existing non-current �nancing, the Company has bank guarantees, with Italian and international counterparts, for commercial and �nancial operations worth over Euro 300 million.At the current date, all the Company’s �nancing is denominated in Euro.
At year-end, the Company’s bank �nancing was divided between current and non-current �nancing as follows:
Current bank �nancing Non-current bank �nancing 31/12/2012 31/12/2011 change 31/12/2012 31/12/2011 change
Total 83,036,519 42,005,892 41,030,627 Total 146,701,010 163,295,583 -16,594,573
The value of non-current �nancing in the Statement of Financial Position equates to its fair value as the entire debt is at �oating rates.Total �nancial liabilities, including not only bank debt but also �nancial derivative liabilities, �nancial leases, payables for other �nancing and trade payables is shown in the following tables:
Current �nancial liabilities Non-current �nancial liabilities
31/12/2012 31/12/2011 change 31/12/2012 31/12/2011 change
Total 87,024,605 43,512,009 43,512,596 Total 149,641,231 168,850,060 -19,208,829
Credit riskThe trade receivables of the Company were 92.70% due from subsidiaries.Credit risk on �nancial instruments is inexistent since these are made up of cash and cash equivalents and bank current accounts.
Annual Report at 31 December 2012
140
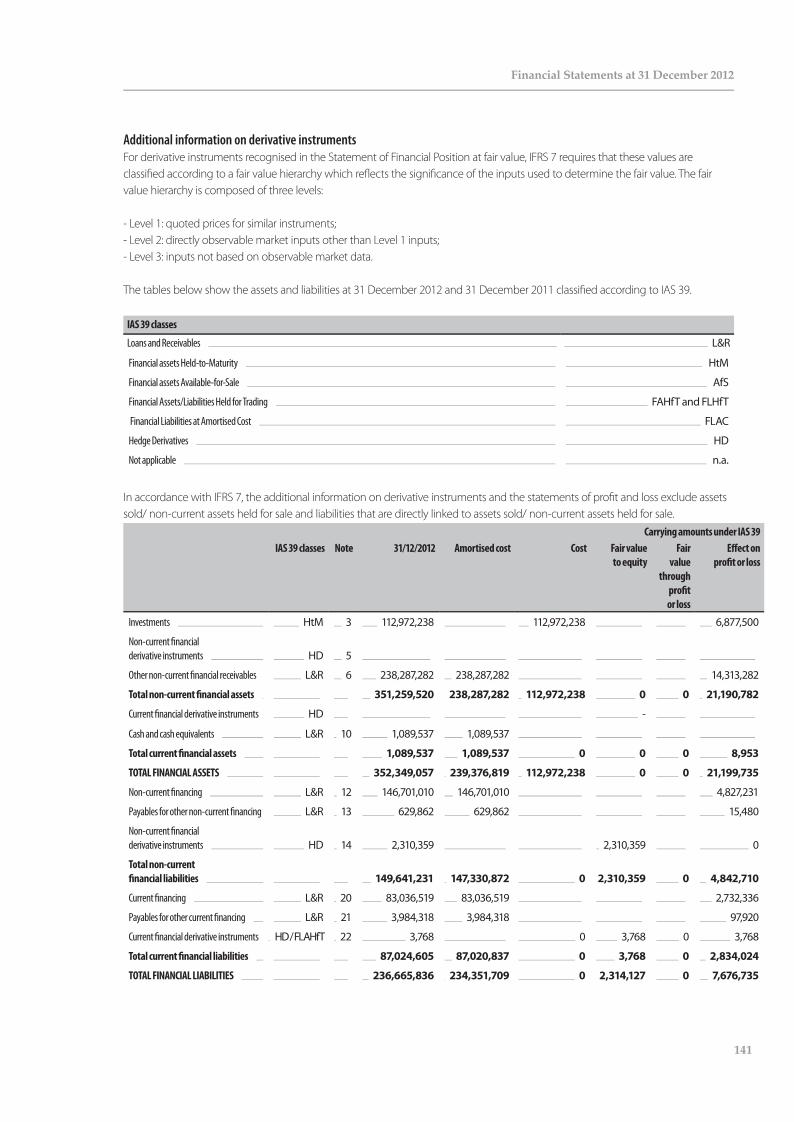
Additional information on derivative instruments For derivative instruments recognised in the Statement of Financial Position at fair value, IFRS 7 requires that these values are classi�ed according to a fair value hierarchy which re�ects the signi�cance of the inputs used to determine the fair value. The fair value hierarchy is composed of three levels:
- Level 1: quoted prices for similar instruments;- Level 2: directly observable market inputs other than Level 1 inputs;- Level 3: inputs not based on observable market data.
The tables below show the assets and liabilities at 31 December 2012 and 31 December 2011 classi�ed according to IAS 39.
IAS 39 classes
Loans and Receivables L&R
Financial assets Held-to-Maturity HtM
Financial assets Available-for-Sale AfS
Financial Assets/Liabilities Held for Trading FAHfT and FLHfT
Financial Liabilities at Amortised Cost FLAC
Hedge Derivatives HD
Not applicable n.a.
In accordance with IFRS 7, the additional information on derivative instruments and the statements of pro�t and loss exclude assets sold/ non-current assets held for sale and liabilities that are directly linked to assets sold/ non-current assets held for sale.
Carrying amounts under IAS 39IAS 39 classes Note 31/12/2012 Amortised cost Cost Fair value
to equityFair
value through
pro�t or loss
E�ect on pro�t or loss
Investments HtM 3 112,972,238 112,972,238 6,877,500
Non-current �nancial derivative instruments HD 5
Other non-current �nancial receivables L&R 6 238,287,282 238,287,282 14,313,282
Total non-current �nancial assets 351,259,520 238,287,282 112,972,238 0 0 21,190,782
Current �nancial derivative instruments HD -
Cash and cash equivalents L&R 10 1,089,537 1,089,537
Total current �nancial assets 1,089,537 1,089,537 0 0 0 8,953
TOTAL FINANCIAL ASSETS 352,349,057 239,376,819 112,972,238 0 0 21,199,735
Non-current �nancing L&R 12 146,701,010 146,701,010 4,827,231
Payables for other non-current �nancing L&R 13 629,862 629,862 15,480
Non-current �nancial derivative instruments HD 14 2,310,359 2,310,359 0
Total non-current �nancial liabilities 149,641,231 147,330,872 0 2,310,359 0 4,842,710
Current �nancing L&R 20 83,036,519 83,036,519 2,732,336
Payables for other current �nancing L&R 21 3,984,318 3,984,318 97,920
Current �nancial derivative instruments HD / FLAHfT 22 3,768 0 3,768 0 3,768
Total current �nancial liabilities 87,024,605 87,020,837 0 3,768 0 2,834,024
TOTAL FINANCIAL LIABILITIES 236,665,836 234,351,709 0 2,314,127 0 7,676,735
141
Financial Statements at 31 December 2012

Carrying amounts under IAS 39IAS 39 classes Note 31/12/2011 Amortised cost Cost Fair value
to equityFair value
through pro�t or loss
E�ect on pro�t or loss
Investments HtM 3 112,332,608 112,332,607 11,790,000
Non-current �nancial derivative instruments HD 5 -
Other non-current �nancial receivables L&R 6 212,913,147 212,913,147 10,303,229
Total non-current �nancial assets 325,245,754 212,913,147 112,332,607 0 0 22,093,229
Current �nancial derivative instruments HD - -
Cash and cash equivalents L&R 10 1,775,957 1,775,957
Total current �nancial assets 1,775,957 1,775,957 0 0 0 9,808
TOTAL FINANCIAL ASSETS 327,021,711 214,689,103 112,332,607 0 0 22,103,037
Non-current �nancing L&R 12 163,295,583 163,295,583 (5,232,101)
Payables for other non-current �nancing L&R 13 4,623,605 4,623,605 (134,881)
Non-current �nancial derivative instruments HD 14 930,873 925,099 5774
Total non-current �nancial liabilities 168,850,060 167,919,188 0 925,099 0 (5,361,208)
Current �nancing L&R 20 42,005,892 42,005,892 (1,345,897)
Payables for other current �nancing L&R 21 1,499,178 1,499,178 (43,734)
Current �nancial derivative instruments HD / FLAHfT 22 6,938 0 6,938 0 6,938
Total current �nancial liabilities 43,512,008 43,505,071 0 6,938 0 (1,382,694)
TOTAL FINANCIAL LIABILITIES 212,362,068 211,424,258 0 932,037 0 (6,743,902)
The following table gives assets and liabilities at fair value at 31 December 2012, classi�ed according to the fair value hierarchy.
Fair Value HierarchyIAS 39 classes Note 31/12/2012 Level 1 Level 2 Level 3
ASSETS
Non-current �nancial derivative instruments HD -
Total non-current �nancial assets
LIABILITIES
Non-current �nancial derivative instruments HD 13 2,310,359 2,310,359
Total non-current �nancial liabilities 2,310,359 2,310,359
Current �nancial derivative instruments FLHfT 21 3,768 3,768
Total current �nancial liabilities 3,768 3,768
Total �nancial liabilities 2,314,127 2,314,127
Capital ManagementThe main objective of the Company in managing its own �nancial resources is to maintain a high credit rating and a correct equity structure to support the core business and maximize shareholder value.The resources available to the Company are managed according to the reference economic environment. The main measurement used to monitor the �nancial structure is the debt/equity ratio. Net debt is calculated as the total exposure to �nancial institutions less cash and cash equivalents and current �nancial receivables.Net equity is all the components of capital and reserves.
Annual Report at 31 December 2012
142

ReceivablesIn accordance with IFRS 7, an analysis of the trend in past due receivables, grouped into similar risk categories, is given below:
Description 31/12/2012 31/12/2011 change
Not past due 9,123,955 8,985,093 138,862
1 to 3 months past due 1,558,919 587,057 971,862
3 to 6 months past due 483,160 197,433 285,728
Over 6 months past due 196,486 1,172,407 - 975,920
TOTAL 11,362,521 10,941,989 420,532
Receivables of Euro 10.658 million were almost entirely trade receivables from subsidiary companies for �nancial transactions and services rendered; receivables from clients were Euro 0.030 million, related-party receivables were Euro 0.047 million, VAT receivables were Euro 0.601 million and other receivables were Euro 0.027 million. This entry does not include receivables arising from the consolidated tax regime, which were Euro 0.993 million or accruals of Euro 0.218 million. To classify receivables as past due, the conditions in the terms of payment were used and amended for any subsequent agreements between the parties; those receivables shown as past due were also regulated by agreements between the parties.All the receivables were found to be in the standard monitoring category with none falling into the other monitoring categories.
Description 31/12/2012 31/12/2011 change
Standard monitoring 11,362,521 10,941,989 420,532
Special monitoring - - -
Monitoring for possible legal action - - -
Extra-judicial monitoring in progress - - -
Monitoring of legal action in progress - - -
TOTAL 11,362,521 10,941,989 420,532
NOTES TO THE STATEMENT OF FINANCIAL POSITIONNON-CURRENT ASSETS
(1) Tangible �xed assetsTangible �xed assets were Euro 26.717 million at 31 December 2012, a decrease of Euro 2.092 million compared to the previous �nancial year.The changes in the 2012 �nancial year are summarised in the table below:
Description HISTORICAL COST DEPRECIATION NET FIXED ASSETS
31/12/2011
NET FIXED ASSETS
31/12/2012Balance at
31/12/2011Increase Decrease Balance at
31/12/2012Balance at
31/12/2011Increase Decrease Balance at
31/12/2012
Land and buildings 27,282,844 228,564 27,511,408 5,387,381 714,717 6,102,098 21,895,463 21,409,310
Plant and machinery 15,559,783 500,608 9,530,070 6,530,321 8,858,930 836,729 7,092,408 2,603,251 6,700,854 3,927,070
Other assets 418,749 0 0 418,749 206,412 61,197 267,609 212,337 151,140
Fixed assets under construction and pre-payments 0 1,229,004 0 1,229,004 0 0 0 0 0 1,229,004
TOTAL 43,261,376 1,958,176 9,530,070 35,689,482 14,452,723 1,612,643 7,092,408 8,972,958 28,808,653 26,716,524
The entry, land and buildings, refers to the value of the industrial site at Gariga di Podenzano (Piacenza), the location of the manufacturing activities of the subsidiary, Drillmec S.p.A, held under a lease agreement as de�ned by IAS 17, and to the value of land and buildings in Via Larga in the locality of Pievesestina (Forlì-Cesena), adjacent to the manufacturing facility of Soilmec S.p.A. and Trevi S.p.A..The gross increase in land and buildings is due to the property in Cesena, for which an indemnity was paid to the Municipality of Cesena for alterations to the Urban Implementation Plan in order to keep the entire property.
143
Financial Statements at 31 December 2012

The gross increase in plant and machinery of Euro 0.501 million was due to the purchase of drilling machinery, personal computers and company servers.The decrease of Euro 9.530 million in the item plant and machinery was due to the sale of a R622-HD drill to the subsidiary Swissboring Overseas Corporation LTD and of an HH300 drill and a G102 drill to the subsidiary Petreven S.p.A.Fixed assets under construction and pre-payments are pre-payments made to acquire land and buildings suitable for expansion in Via Larga in Pievesestina (Forlì-Cesena) as the land is adjacent to the manufacturing facility of Soilmec S.p.A. and Trevi S.p.A.The net carrying value of leased �xed tangible assets at 31 December 2012 was Euro 11.192 million (in 2011 it was Euro 12.135 million), of which Euro 3.000 million was the share of the land where the activities of the subsidiary Drillmec S.p.A. are located. Leased assets and those acquired with hire contracts are used as guarantees for the related liabilities assumed.
(2) Intangible �xed assetsAt 31 December 2012, intangible �xed assets had decreased Euro 0.110 million to Euro 0.194 million compared to 31 December 2011.Movements relating to the 2012 �nancial year are summarized in the following table:
Description HISTORICAL COST DEPRECIATION NET INTANG-IBLES
31/12/2011
NET INTANG-IBLES
31/12/2012Balance at
31/12/2011Increase Decrease Balance at
31/12/2012Balance at
31/12/2011Depr. for the year
Use of provisions
Balance at 31/12/2012
Licences and brands 1,187,782 16,583 0 1,204,365 883,341 126,615 1,009,956 304,441 194,409
TOTAL 1,187,782 16,583 0 1,204,365 883,341 126,615 0 1,009,956 304,441 194,409
The increase in licences and brands was primarily due to the purchase of software licences, applied software and for the consultancy provided in implementing the software in the Italian and foreign subsidiaries of the Company.
(3) InvestmentsInvestments increased Euro 0.640 million year-on-year to Euro 112.972 million at 31 December 2012.Investments, divided between subsidiaries and other companies, are shown in the following table:
Description Balance at 31/12/2011
Increase Decrease Revaluation Impairment Other changes Balance at 31/12/2012
Subsidiaries 112,308,976 645,000 -5,369,42 112,948,606
Other 23,632 23,632
TOTAL 112,332,608 645,000 0 0 0 -5,369 112,972,238
Details of investments in subsidiaries are shown in the following table:SUBSIDIARIES Balance at
31/12/2010Increase Decrease Revaluations Impairments Other
changesBalance at
31/12/2011
TREVI S.p.A. 46,689,157 - - - - - 46,689,157
SOILMEC S.p.A. 33,129,987 - - - - -4,996 33,124,991
DRILLMEC S.p.A. 9,915,985 - - - - - 9,915,985
PILOTES TREVI S.a.c.i.m.s. 283,845 - - - - - 283,845
PETREVEN S.p.A. 14,931,932 - - - - - 14,931,932
INTERNATIONAL DRILLING TECHNOLOGIES FZCO 21,877 - - - - - 21,877
TREVI ENERGY S.p.A. 6,550,000 645,000 - - - - 7,195,000
PETREVEN S.A. 629 - - - - - 629
TREVI FUNDACOES ANGOLA LDA 19,322 - - - - -373 18,949
TREVI DRILLING SERVICES SAUDI ARABIA CO. 766,241 - - - - - 766,241
TOTAL SUBSIDIARIES 112,308,975 645,000 - - - -5,369 112,948,606
Annual Report at 31 December 2012
144
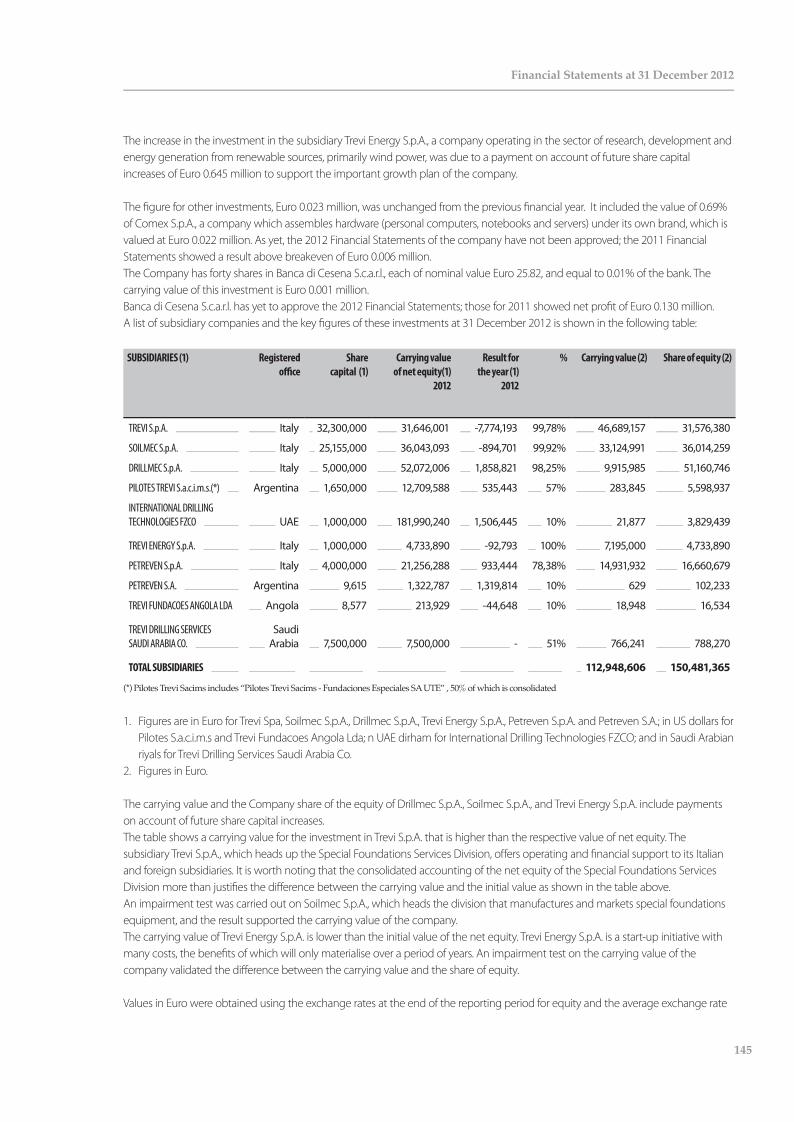
The increase in the investment in the subsidiary Trevi Energy S.p.A., a company operating in the sector of research, development and energy generation from renewable sources, primarily wind power, was due to a payment on account of future share capital increases of Euro 0.645 million to support the important growth plan of the company.
The �gure for other investments, Euro 0.023 million, was unchanged from the previous �nancial year. It included the value of 0.69% of Comex S.p.A., a company which assembles hardware (personal computers, notebooks and servers) under its own brand, which is valued at Euro 0.022 million. As yet, the 2012 Financial Statements of the company have not been approved; the 2011 Financial Statements showed a result above breakeven of Euro 0.006 million. The Company has forty shares in Banca di Cesena S.c.a.r.l., each of nominal value Euro 25.82, and equal to 0.01% of the bank. The carrying value of this investment is Euro 0.001 million.Banca di Cesena S.c.a.r.l. has yet to approve the 2012 Financial Statements; those for 2011 showed net pro�t of Euro 0.130 million. A list of subsidiary companies and the key �gures of these investments at 31 December 2012 is shown in the following table:
SUBSIDIARIES (1) Registered o�ce
Share capital (1)
Carrying value of net equity(1)
2012
Result for the year (1)
2012
% Carrying value (2) Share of equity (2)
TREVI S.p.A. Italy 32,300,000 31,646,001 -7,774,193 99,78% 46,689,157 31,576,380
SOILMEC S.p.A. Italy 25,155,000 36,043,093 -894,701 99,92% 33,124,991 36,014,259
DRILLMEC S.p.A. Italy 5,000,000 52,072,006 1,858,821 98,25% 9,915,985 51,160,746
PILOTES TREVI S.a.c.i.m.s.(*) Argentina 1,650,000 12,709,588 535,443 57% 283,845 5,598,937
INTERNATIONAL DRILLING TECHNOLOGIES FZCO UAE 1,000,000 181,990,240 1,506,445 10% 21,877 3,829,439
TREVI ENERGY S.p.A. Italy 1,000,000 4,733,890 -92,793 100% 7,195,000 4,733,890
PETREVEN S.p.A. Italy 4,000,000 21,256,288 933,444 78,38% 14,931,932 16,660,679
PETREVEN S.A. Argentina 9,615 1,322,787 1,319,814 10% 629 102,233
TREVI FUNDACOES ANGOLA LDA Angola 8,577 213,929 -44,648 10% 18,948 16,534
TREVI DRILLING SERVICES SAUDI ARABIA CO.
Saudi Arabia 7,500,000 7,500,000 - 51% 766,241 788,270
TOTAL SUBSIDIARIES 112,948,606 150,481,365
(*) Pilotes Trevi Sacims includes “Pilotes Trevi Sacims - Fundaciones Especiales SA UTE” , 50% of which is consolidated
1. Figures are in Euro for Trevi Spa, Soilmec S.p.A., Drillmec S.p.A., Trevi Energy S.p.A., Petreven S.p.A. and Petreven S.A.; in US dollars for Pilotes S.a.c.i.m.s and Trevi Fundacoes Angola Lda; n UAE dirham for International Drilling Technologies FZCO; and in Saudi Arabian riyals for Trevi Drilling Services Saudi Arabia Co.
2. Figures in Euro.
The carrying value and the Company share of the equity of Drillmec S.p.A., Soilmec S.p.A., and Trevi Energy S.p.A. include payments on account of future share capital increases.The table shows a carrying value for the investment in Trevi S.p.A. that is higher than the respective value of net equity. The subsidiary Trevi S.p.A., which heads up the Special Foundations Services Division, o�ers operating and �nancial support to its Italian and foreign subsidiaries. It is worth noting that the consolidated accounting of the net equity of the Special Foundations Services Division more than justi�es the di�erence between the carrying value and the initial value as shown in the table above.An impairment test was carried out on Soilmec S.p.A., which heads the division that manufactures and markets special foundations equipment, and the result supported the carrying value of the company. The carrying value of Trevi Energy S.p.A. is lower than the initial value of the net equity. Trevi Energy S.p.A. is a start-up initiative with many costs, the bene�ts of which will only materialise over a period of years. An impairment test on the carrying value of the company validated the di�erence between the carrying value and the share of equity.
Values in Euro were obtained using the exchange rates at the end of the reporting period for equity and the average exchange rate
145
Financial Statements at 31 December 2012
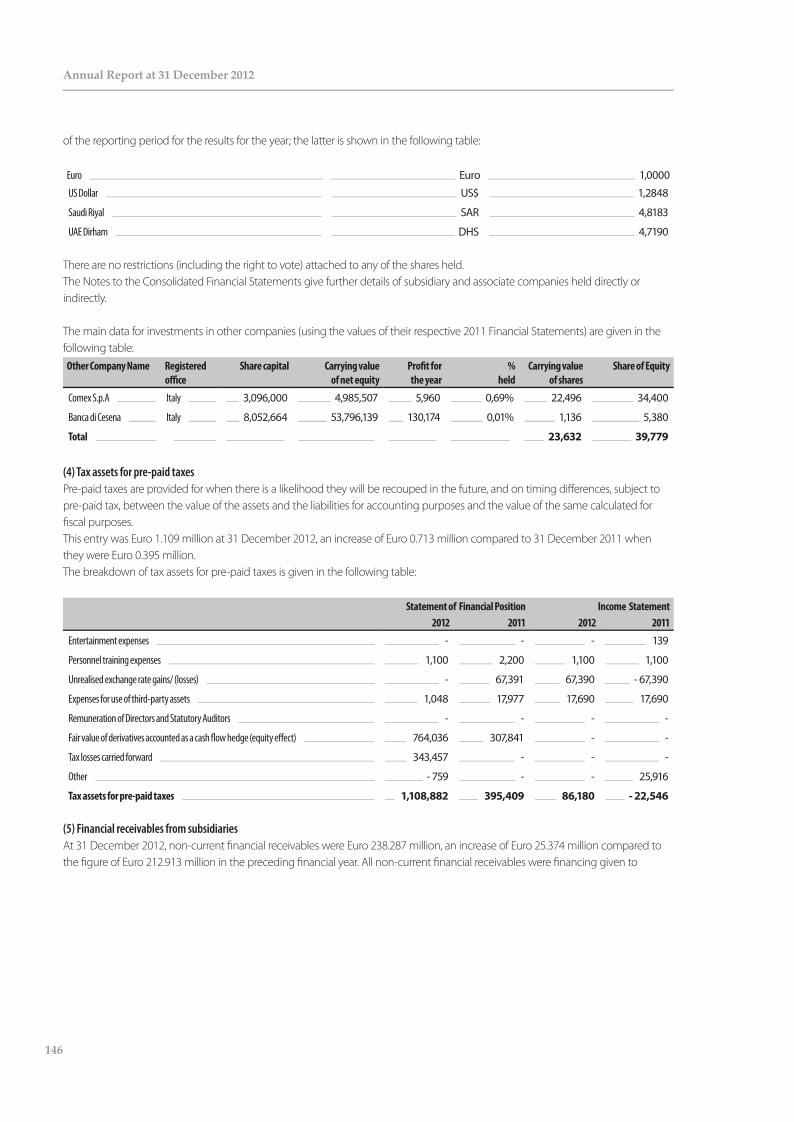
of the reporting period for the results for the year; the latter is shown in the following table:
Euro Euro 1,0000
US Dollar US$ 1,2848
Saudi Riyal SAR 4,8183
UAE Dirham DHS 4,7190
There are no restrictions (including the right to vote) attached to any of the shares held.The Notes to the Consolidated Financial Statements give further details of subsidiary and associate companies held directly or indirectly.
The main data for investments in other companies (using the values of their respective 2011 Financial Statements) are given in the following table:
Other Company Name Registeredo�ce
Share capital Carrying value of net equity
Pro�t for the year
%held
Carrying value of shares
Share of Equity
Comex S.p.A Italy 3,096,000 4,985,507 5,960 0,69% 22,496 34,400
Banca di Cesena Italy 8,052,664 53,796,139 130,174 0,01% 1,136 5,380
Total 23,632 39,779
(4) Tax assets for pre-paid taxesPre-paid taxes are provided for when there is a likelihood they will be recouped in the future, and on timing di�erences, subject to pre-paid tax, between the value of the assets and the liabilities for accounting purposes and the value of the same calculated for �scal purposes.This entry was Euro 1.109 million at 31 December 2012, an increase of Euro 0.713 million compared to 31 December 2011 when they were Euro 0.395 million.The breakdown of tax assets for pre-paid taxes is given in the following table:
Statement of Financial Position Income Statement 2012 2011 2012 2011
Entertainment expenses - - - 139
Personnel training expenses 1,100 2,200 1,100 1,100
Unrealised exchange rate gains/ (losses) - 67,391 67,390 - 67,390
Expenses for use of third-party assets 1,048 17,977 17,690 17,690
Remuneration of Directors and Statutory Auditors - - - -
Fair value of derivatives accounted as a cash �ow hedge (equity e�ect) 764,036 307,841 - -
Tax losses carried forward 343,457 - - -
Other - 759 - - 25,916
Tax assets for pre-paid taxes 1,108,882 395,409 86,180 - 22,546
(5) Financial receivables from subsidiariesAt 31 December 2012, non-current �nancial receivables were Euro 238.287 million, an increase of Euro 25.374 million compared to the �gure of Euro 212.913 million in the preceding �nancial year. All non-current �nancial receivables were �nancing given to
Annual Report at 31 December 2012
146
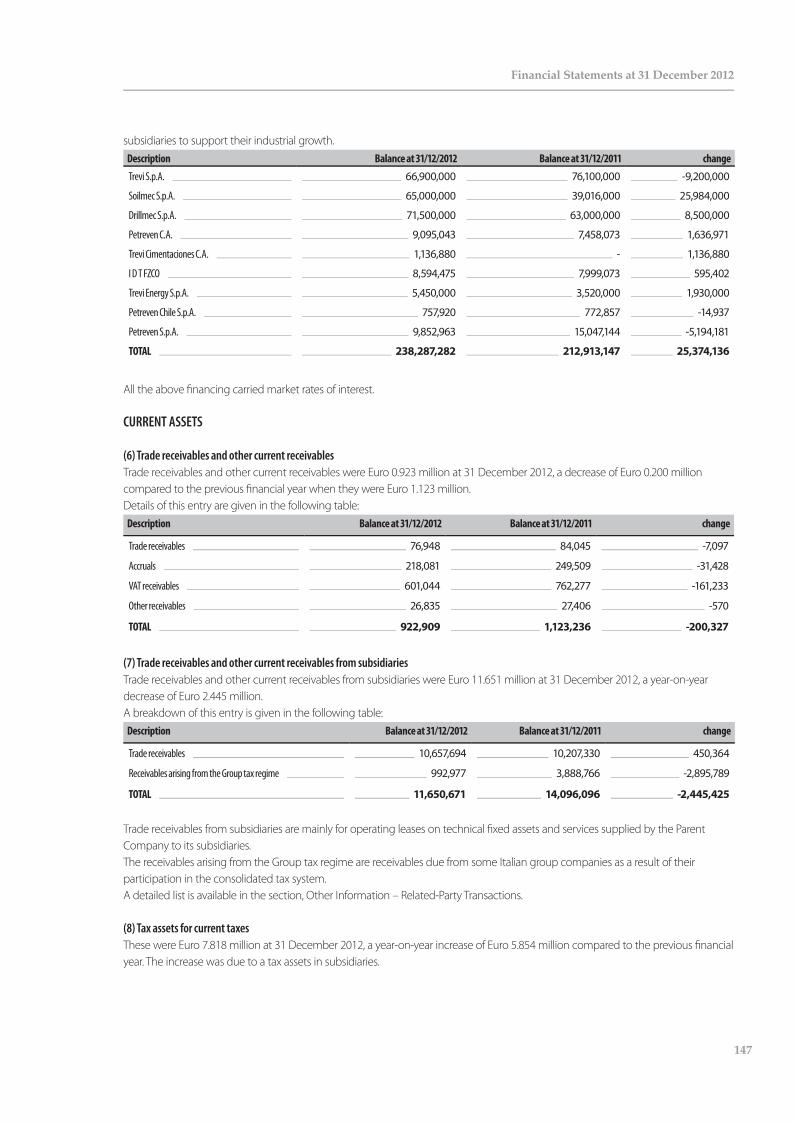
subsidiaries to support their industrial growth.Description Balance at 31/12/2012 Balance at 31/12/2011 change
Trevi S.p.A. 66,900,000 76,100,000 -9,200,000
Soilmec S.p.A. 65,000,000 39,016,000 25,984,000
Drillmec S.p.A. 71,500,000 63,000,000 8,500,000
Petreven C.A. 9,095,043 7,458,073 1,636,971
Trevi Cimentaciones C.A. 1,136,880 - 1,136,880
I D T FZCO 8,594,475 7,999,073 595,402
Trevi Energy S.p.A. 5,450,000 3,520,000 1,930,000
Petreven Chile S.p.A. 757,920 772,857 -14,937
Petreven S.p.A. 9,852,963 15,047,144 -5,194,181
TOTAL 238,287,282 212,913,147 25,374,136
All the above �nancing carried market rates of interest.
CURRENT ASSETS
(6) Trade receivables and other current receivablesTrade receivables and other current receivables were Euro 0.923 million at 31 December 2012, a decrease of Euro 0.200 million compared to the previous �nancial year when they were Euro 1.123 million.Details of this entry are given in the following table:
Description Balance at 31/12/2012 Balance at 31/12/2011 change
Trade receivables 76,948 84,045 -7,097
Accruals 218,081 249,509 -31,428
VAT receivables 601,044 762,277 -161,233
Other receivables 26,835 27,406 -570
TOTAL 922,909 1,123,236 -200,327
(7) Trade receivables and other current receivables from subsidiariesTrade receivables and other current receivables from subsidiaries were Euro 11.651 million at 31 December 2012, a year-on-year decrease of Euro 2.445 million.A breakdown of this entry is given in the following table:
Description Balance at 31/12/2012 Balance at 31/12/2011 change
Trade receivables 10,657,694 10,207,330 450,364
Receivables arising from the Group tax regime 992,977 3,888,766 -2,895,789
TOTAL 11,650,671 14,096,096 -2,445,425
Trade receivables from subsidiaries are mainly for operating leases on technical �xed assets and services supplied by the Parent Company to its subsidiaries.The receivables arising from the Group tax regime are receivables due from some Italian group companies as a result of their participation in the consolidated tax system.A detailed list is available in the section, Other Information – Related-Party Transactions.
(8) Tax assets for current taxes These were Euro 7.818 million at 31 December 2012, a year-on-year increase of Euro 5.854 million compared to the previous �nancial year. The increase was due to a tax assets in subsidiaries.
147
Financial Statements at 31 December 2012

A breakdown of this entry is given in the following table:Description Balance at 31/12/2012 Balance at 31/12/2011 change
Interest on IRES withheld at source 1,603 2,648 -1,045
Prepayments of IRAP 540,226 409,641 130,585
Tax refunds from Tax Authority on request 261,809 84,865 176,944
Tax assets from IRES for withholding tax 10,337 2,778,72 7,559
Consolidated IRES tax credit 7,003,833 1,463,293 5,540,540
TOTAL 7,817,808 1,963,226 5,854,582
(9) Cash and cash equivalentsAt 31 December 2012, cash and cash equivalents totalled Euro 1.090 million, a year-on-year decrease of Euro 0.686 million.Details of this entry are given in the following table:
Description Balance at 31/12/2012 Balance at 31/12/2011 change
Bank deposits 1,066,254 1,763,251 -696,998
Cash and cash equivalents 23,283 12,705 10,578
TOTAL 1,089,537 1,775,957 -686,420
(10) SHAREHOLDERS’ FUNDSChanges in the net equity of the Company are shown in the relative accounting statement and in the following table:
Description Share capital Share premium
reserve
Legal reserve
Reserve for
treasury stock
Extraordinary reserve
Other reserves
Retained pro�t/
(losses)
Result for the period
Total net equity
Balance at 31/12/2009 32,000,000 34,355,654 5,026,792 237,830 11,305,702 3,847,321 1,497,050 10,855,509 99,125,858
Allocation of pro�t - - 542,775 - 2,632,735 - -3,175,509 -
Dividend distribution - - - - - -7,680,000 -7,680,000
(Purchase)/ sale of treasury stock - - -227,503 237,830 - - 10,327
Fair value reserve - - - - - - -
Other reserves - - - - 70,230 9,026,704 9,096,934
Balance at 31/12/2010 32,000,000 34,355,654 5,569,567 10,327 14,176,267 3,917,551 1,497,050 9,026,704 100,553,121
Allocation of pro�t - 451,336 255,369 - -706,705 0
Dividend distribution - - - -8,320,000 -8,320,000
(Purchase)/ sale of treasury stock -57,200 - - -647,294 10,327 - -694,167
Indirect Convertible Loan 3,097,150 41,908,220 - 0 0 - 45,005,370
Fair value reserve - - 0 -617,258 - -617,258
Comprehensive pro�t \ (loss) - - - 13,405,617 13,405,617
Balance at 31/12/2011 35,039,950 76,263,874 6,020,903 -636,967 14,441,963 3,300,293 1,497,050 13,405,616 149,332,685
Allocation of pro�t 0 - 670,281 3,610,077 - -4,280,358 0
Dividend distribution 0 - - 16,692 - -9,125,259 -9,108,567
(Purchase)/ sale of treasury stock -7,000 - - -50,304 - -57,304
Indirect Convertible Loan 0 0 - 0 4,650,274 -4,650,274 - 0
Fair value reserve 0 - - 0 -923,291 - -923,291
Comprehensive pro�t \ (loss) 0 - - - 9,022,558 9,022,558
Balance at 31/12/2012 35,032,950 76,263,874 6,691,184 -687,271 22,719,006 -2,273,272 1,497,050 9,022,558 148,266,081
Annual Report at 31 December 2012
148

Share capitalAt 31 December 2012, the fully paid-up share capital of the Company was Euro 35,032,950 made up of 70,065,900 ordinary shares each of nominal value Euro 0.50.During 2012, as authorized by the Shareholders’ Meeting, the Company purchased 14,000 treasury shares; the transactions were taken directly to equity as required by IAS 32.
No. of shares Share capital Treasury stock
Balance at 31/12/2006 64,000,000 32,000,000 -
Purchase and sale of treasury stock -366,500 -183,250 -4,398,796
Balance at 31/12/2007 63,633,500 31,816,750 -4,398,796
Purchase and sale of treasury stock -406,889 -203,445 -4,061,100
Balance at 31/12/2008 63,226,611 31,613,306 -8,459,896
Purchase and sale of treasury stock 773,389 386,694 8,697,727
Balance at 31/12/2009 64,000,000 32,000,000 237,830
Purchase and sale of treasury stock - - -227,503
Balance at 31/12/2010 64,000,000 32,000,000 10,327
Transfer to extraordinary reserve - - -10,327
Balance at 29/04/2011 64,000,000 32,000,000 -
Conversion of indirect convertible bond 6,194,300 3,097,150 -
Balance at 30/11/2011 70,194,300 35,097,150 -
Purchase and sale of treasury stock - 114,400 - 57,200 - 636,967
Balance at 31/12/2011 70,079,900 35,039,950 -636,967
Purchase and sale of treasury stock - 14,000 - 7,000 - 50,304
Balance at 31/12/2012 70,065,900 35,032,950 -687,271
Other reservesShare premium reserve: At 31 December 2012, this was Euro 76.264 million and was unchanged compared to the �gure for the previous �nancial year
Legal reserve:The legal reserve represents the part of pro�ts which, pursuant to Article 2430 of the Italian Civil Code, may not be distributed as dividends. In 2012, the legal reserve increased by Euro 0.670 million, following the movement to this reserve of 5% of the Parent Company pro�ts for 2011. At 31 December 2012, this reserve was Euro 6.691 million.
Reserve for treasury stock:The reserve for treasury stock was negative for Euro 0.687 million at 31 December 2012, a decrease of Euro 0.050 million compared to 31 December 2011 due to the purchase of treasury shares.The value of the reserve is the result of purchases and sales of treasury stock made during 2012, as authorised by the Shareholders’ Meeting.
Extraordinary reserve:The extraordinary reserve was Euro 22.719 million at 31 December 2012, an increase of Euro 8.277 million compared to the end of the 2011 �nancial year. The increase was due to the allocation of the undistributed part of the pro�t generated by the Company in 2011 and the transfer to this reserve of the Euro 4.650 million of the convertible bond reserve as approved by the Shareholders’ Meeting.
149
Financial Statements at 31 December 2012

Other reserves:These were negative for Euro 2.273 million at 31 December 2012, a decrease of Euro 5.574 million due to the adjustments to the fair value of derivative instruments valued as cash �ow hedges and the related �scal e�ect, as well as the transfer from the convertible bond reserve authorised by the Shareholders’ Meeting.
Dividends paid in 2012The Shareholders’ Meeting of 27 April 2012 approved a dividend distribution of Euro 0.13 per share, with an ex-dividend date of 9 July 2012 and payment from 12 July 2012, for a total consideration of Euro 9.125 million. At 31 December 2012, all dividends approved by the Company had been paid.
Retained pro�ts (losses) Retained pro�ts (losses) were Euro 1.497 million at 31 December 2012 and were unchanged compared to the �gure at year-end 2011. This reserve includes changes generated by the application of IAS/IFRS accounting standards after the transition date.
Pursuant to Article 2427 paragraph 1 no. 7–bis, a breakdown of equity, its availability for use and distribution is given in the following table:
Description Balance at 31/12/2012 Potential use Available for distribution Summary of use in the last three years
To cover losses
Share capital 35,032,950
Share premium reserve 76,263,874 A B
Legal reserve 6,691,184 B
Extraordinary reserve 22,719,006 A B C 22,719,006
Other reserves -2,273,272 B
Reserve for treasury shares -687,271 A B C
Retained pro�ts (losses) 1,497,050 A B C 1,497,050
TOTAL 139,243,521 24,216,056
Available for use: A) For share capital increases B) To cover losses C) For distribution to shareholders
Net pro�t for the periodThe net pro�t for the 2012 �nancial year was Euro 9.023 million, a decrease of Euro 4.383 million compared to the 2011 �gure of Euro 13.406 million. There was an operating pro�t of Euro 0.325 million in the 2012 �nancial year (compared to an operating loss in the previous �nancial year of Euro 0.300 million); �nancial management was strong despite the decrease of Euro 4.750 million and an increase in the tax charge.
LIABILITIESNON-CURRENT LIABILITIES (11) Non-current �nancingNon-current �nancing totalled Euro 146.701 million at 31 December 2012, a decrease of Euro 16.595 million compared to the Euro 163.296 million of the previous �nancial year. The breakdown of non-current �nancing is given in the following table:
Balance at 31/12/2012 Balance at 31/12/2011 change
Non-current portion of non-current �nancing 146,701,010 163,295,583 -16,594,573
TOTAL 146,701,010 163,295,583 -16,594,573
Annual Report at 31 December 2012
150

Group �nancing for material amounts was as follows:
• The non-current part of the �oating rate loan, originally for Euro 50,000,000, was Euro 48,000,000; this loan is repayable in twenty quarterly instalments with �nal payment on 03/11/2020. Interest payable is Euribor plus a spread.
• The non-current part of the �oating rate loan, originally for Euro 10,000,000, was Euro 2,589,699; this mortgage is repayable in sixteen quarterly instalments with �nal payment on 29/12/2014. Interest payable is Euribor plus a spread.
• The non-current part of the �oating rate loan, originally for Euro 17,000,000, was Euro 5,666,667; this mortgage is repayable in six six-monthly instalments with �nal payment on 11/12/2014. Interest payable is Euribor plus a spread.
• The non-current part of the �oating rate loan, originally for Euro 50,000,000, was Euro 30,000,000; this mortgage is repayable in ten six-monthly instalments with �nal payment on 28/11/2016. Interest payable is Euribor plus a spread.
• The non-current part of the �oating rate loan, originally for Euro 30,000,000 was Euro 20,000,000; this loan is repayable in �ve annual instalments with �nal payment on 30/12/2015. Interest payable is Euribor plus a spread.
Some of these non-current �nancing agreements contain covenants, which require the maintenance of certain �nancial ratios calculated on the Consolidated Financial Statements, as follows:• Net Financial Position/ EBITDA: an indicator of indebtedness, calculated as the ratio of net �nancial debt to EBITDA;• Net Financial Position/ Net Equity: an indicator of indebtedness, calculated as the ratio of net debt to net equity;• EBITDA/ Net Financial Charges: an indicator of the weight of interest charges calculated as the ratio of EBITDA to interest charges.Failure to respect these covenants would allow the banks that have granted the �nancing to call in the �nancing or to renegotiate the conditions attached to the �nancing.At 31 December 2012 all the �nancial covenants listed above had been respected.
(12) Payables for other non-current �nancingAt 31 December 2012, payables for other non-current �nancing were Euro 0.630 million, a decrease of Euro 3.994 million compared to 31 December 2011 when they were Euro 4.624 million.Details of these payables are shown in the following table:
Description Balance at 31/12/2012 Balance at 31/12/2011 change
Payable to Unicredit Leasing S.p.A. 285,981 2,309,445 -2,023,464
Payable to Albaleasing S.p.A. 0 1,766,320 -1,766,320
Payable to Leasint S.p.A. 147,190 251,565 -104,375
Payable to Sardaleasing S.p.A. 196,692 296,275 -99,583
TOTAL 629,862 4,623,605 -3,993,742
The decrease in other non-current �nancing was due to the expiry of two property leases in 2013 with �nal payment included under current �nancing (see Note 20).
(13) Non-current �nancial derivative instrumentsNon-current �nancial derivative instruments totalled Euro 2.310 million at 31 December 2012, a year-on-year increase of Euro 1.379 million.Details are given in the following table:
Description Balance at 31/12/2012 Balance at 31/12/2011 change
Non-current �nancial derivatives 2,310,359 930,873 1,379,486
TOTAL 2,310,359 930,873 1,379,486
The �gure at 31 December 2012 refers to the fair value hedge against �uctuations in interest rates which was exclusively to cover existing transactions and was not for speculative reasons.
151
Financial Statements at 31 December 2012

(14) Tax liabilities for deferred taxesTax liabilities for deferred taxes were Euro 2.900 million at 31 December 2012, an increase of Euro 0.126 million compared to the previous �nancial year when they were Euro 2.774 million.A breakdown of this entry is given in the following table:
Statement of Financial Position Income Statement
2012 2011 2012 2011
Amortised cost of the Indirect Convertible Bond - - - -468,633
Carrying value of Gariga di Podenzano property 1,496,418 1,420,850 75,568 -
O�ce premises in Piacenza 168,040 164,229 3,811 -5,316
Tax depreciation adjustments 343,916 225,000 118,916 -52,683
Capital gains in instalments 247,114 124,302 122,813 110,733
Unrealised exchange rate gains (losses) 644,608 839,698 -195,091 539,872
Other - - -24,328
Tax liabilities for deferred taxes 2,900,096 2,774,079 126,017 99,645
(15) Post-employment bene�tsThis entry is an estimate of the liabilities, calculated using actuarial methods, for sta�-leaving indemnities.At 31 December 2012, post-employment bene�ts were Euro 0.956 million, an increase of Euro 0.167 million compared to the previous �nancial year.Changes in this entry during the 2012 �nancial year are shown in the following table:
Description Balance at 31/12/2011
Portion matured and recognised in pro�t or loss
Portion transferred from other companies
Portion transferred to other companies
and paid out
Balance at 31/12/2012
Post-employment bene�ts 789,017 263,228 -13,952 -82,571 955,722
From 1 January 2007, the Finance Law and other enacted laws introduced modi�cations relating to the treatment of the TFR, including giving employees the choice to decide the allocation of the maturing portion of their TFR. Employees may now choose whether to transfer new TFR �ows to a pension fund or leave them within the Company. The main assumptions used to calculate post-employment bene�ts were as follows:
31/12/2012 31/12/2011
% %
Discount rate 3.25% 4.00%
In�ation rate 2.00% 2.00%
Annual increase in sta�-leaving indemnities (TFR) 3.00% 3.00%
Turnover 5.00% 5.00%
CURRENT LIABILITIES
(16) Trade payables and other current liabilitiesTrade payables and other current liabilities were Euro 3.244 million at 31 December 2012, a decrease of Euro 0.852 million compared to the previous �nancial year. Details of this entry are shown in the following table:
Description Balance at 31/12/2012 Balance at 31/12/2011 change
Payables to suppliers 1,669,110 1,793,434 -124,324
Payables to National Insurance and Social Security entities 190,536 129,884 60,652
Other payables 1,375,801 2,116,499 -740,698
Deferrals for leasing contracts 8,707 55,840 -47,134
TOTAL 3,244,154 4,095,657 -851,503
Annual Report at 31 December 2012
152

Details of payables to National Insurance and Social Security entities are shown in the following table:PAYABLES FOR NATIONAL INSURANCE AND TO SOCIAL SECURITY ENTITIES
Balance at 31/12/2012 Balance at 31/12/2011 change
Payables to INPS – INAIL 186,242 125,694 60,548
Payables to pension funds 4,294 4,190 104
TOTAL 190,536 129,884 60,652
Details of other payables are given in the following table:OTHER PAYABLES Balance at 31/12/2012 Balance at 31/12/2011 change
Payables to employees for holidays due but not taken 292,585 334,494 -41,909
Payables to employees for additional month’s payment 67,380 59,714 7,666
Other 1,015,836 1,722,291 -706,455
TOTAL 1,375,801 2,116,499 -740,698
The entry, other, is primarily for the payable to the Commune of Podenzano for the acquisition of a building plot in the industrial area of Gariga di Podenzano (Piacenza) in the locality known as “I Casoni”.
(17) Trade payables and other current liabilities to subsidiariesTrade payables and other current liabilities to subsidiaries were Euro 8.522 million at 31 December 2012, an increase of Euro 4.381 million compared to the previous �nancial year when they were Euro 4.141 million.Details of this entry are given in the following table:
Description Balance at 31/12/2012 Balance at 31/12/2011 change
Trade payables to subsidiaries 288,855 192,415 96,440
Payables for the share of results for the period of UTE TREVI S.p.A., TREVI - Finanziaria Industriale S.p.A., Sembenelli S.r.l. for the "Borde Seco" contract 1,748,590 1,753,435 -4,845
Payables for the Group Taxation Regime 6,484,118 2,194,966 4,289,152
TOTAL 8,521,563 4,140,816 4,380,747
Trade payables to subsidiaries were mainly the current portion of payables to Trevi S.p.A. and Soilmec S.p.A. An analytical table is given in the section Other Information – Related-Party Transactions.
(18) Tax liabilities for current taxesTax liabilities for current taxes were Euro 0.207 million at 31 December 2012, all payable in the next �nancial period, and decreased Euro 0.012 million compared to the preceding �nancial year.Details of tax liabilities for current taxes are given in the following table:
Description Balance at 31/12/2012 Balance at 31/12/2011 change
Payable to the Tax Authority for retentions 206,811 218,452 -11,641
TOTAL 206,811 218,452 -11,641
153
Financial Statements at 31 December 2012

(19) Current debtCurrent debt was Euro 83.037 million at 31 December 2012, an increase of Euro 41.031 million compared to the previous �nancial year when it was Euro 42.006 million.Details of current debt are given in the following table:
Description Balance at 31/12/2012 Balance at 31/12/2011 change
Current portion of non-current debt 79,218,541 41,967,124 37,251,418
Bank overdrafts 28,375 38,769 -10,393
Financing from subsidiaries 3,789,601 0 3,789,601
TOTAL 83,036,518 42,005,892 41,030,625
The current portion of non-current debt included the interest expense payable in the �nancial period on �nancing with periodic repayments deferred until after 31 December 2012 for a total of Euro 0.838 million.
(20) Payables for other current �nancingAt 31 December 2012, payables for other current �nancing were Euro 3.984 million, an increase of Euro 2.485 million compared to the previous �nancial year.Details of this entry are given in the following table:
Description Balance at 31/12/2012 Balance at 31/12/2011 change
Payable to Unicredit Leasing S.p.A. 2,014,041 681,764 1,332,277
Payable to Albaleasing S.p.A. ex Italease 1,766,319 477,233 1,289,086
Payable to Leasint S.p.A. 104,375 245,070 -140,695
Payable to Sardaleasing S.p.A. 99,583 95,112 4,471
TOTAL 3,984,318 1,499,178 2,485,140
The increase in this entry was mainly due to the expiry of two property leases in 2013 and their inclusion in payables for other current �nancing as described in Note 12.
(21) Current �nancial derivative instrumentsAt 31 December 2012, liabilities for current �nancial derivatives totalled Euro 0.004 million, a decrease of Euro 0.003 million compared to the �gure of Euro 0.007 million at 31 December 2011.
Description Balance at 31/12/2012 Balance at 31/12/2011 change
Current �nancial derivative instruments 3,768 6,938 -3,170
TOTAL 3,768 6,938 -3,170
Annual Report at 31 December 2012
154
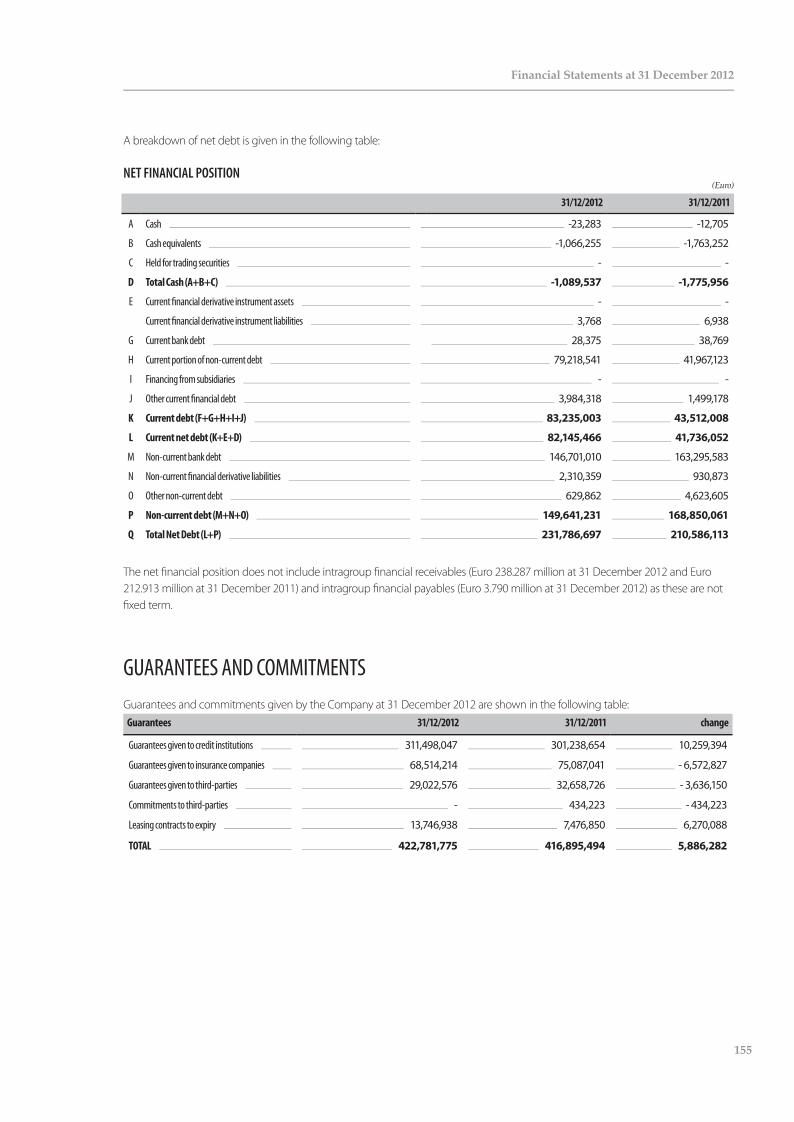
A breakdown of net debt is given in the following table:
NET FINANCIAL POSITION(Euro)
31/12/2012 31/12/2011
A Cash -23,283 -12,705
B Cash equivalents -1,066,255 -1,763,252
C Held for trading securities - -
D Total Cash (A+B+C) -1,089,537 -1,775,956
E Current �nancial derivative instrument assets - -
Current �nancial derivative instrument liabilities 3,768 6,938
G Current bank debt 28,375 38,769
H Current portion of non-current debt 79,218,541 41,967,123
I Financing from subsidiaries - -
J Other current �nancial debt 3,984,318 1,499,178
K Current debt (F+G+H+I+J) 83,235,003 43,512,008
L Current net debt (K+E+D) 82,145,466 41,736,052
M Non-current bank debt 146,701,010 163,295,583
N Non-current �nancial derivative liabilities 2,310,359 930,873
O Other non-current debt 629,862 4,623,605
P Non-current debt (M+N+O) 149,641,231 168,850,061
Q Total Net Debt (L+P) 231,786,697 210,586,113
The net �nancial position does not include intragroup �nancial receivables (Euro 238.287 million at 31 December 2012 and Euro 212.913 million at 31 December 2011) and intragroup �nancial payables (Euro 3.790 million at 31 December 2012) as these are not �xed term.
GUARANTEES AND COMMITMENTSGuarantees and commitments given by the Company at 31 December 2012 are shown in the following table:
Guarantees 31/12/2012 31/12/2011 change
Guarantees given to credit institutions 311,498,047 301,238,654 10,259,394
Guarantees given to insurance companies 68,514,214 75,087,041 - 6,572,827
Guarantees given to third-parties 29,022,576 32,658,726 - 3,636,150
Commitments to third-parties - 434,223 - 434,223
Leasing contracts to expiry 13,746,938 7,476,850 6,270,088
TOTAL 422,781,775 416,895,494 5,886,282
155
Financial Statements at 31 December 2012
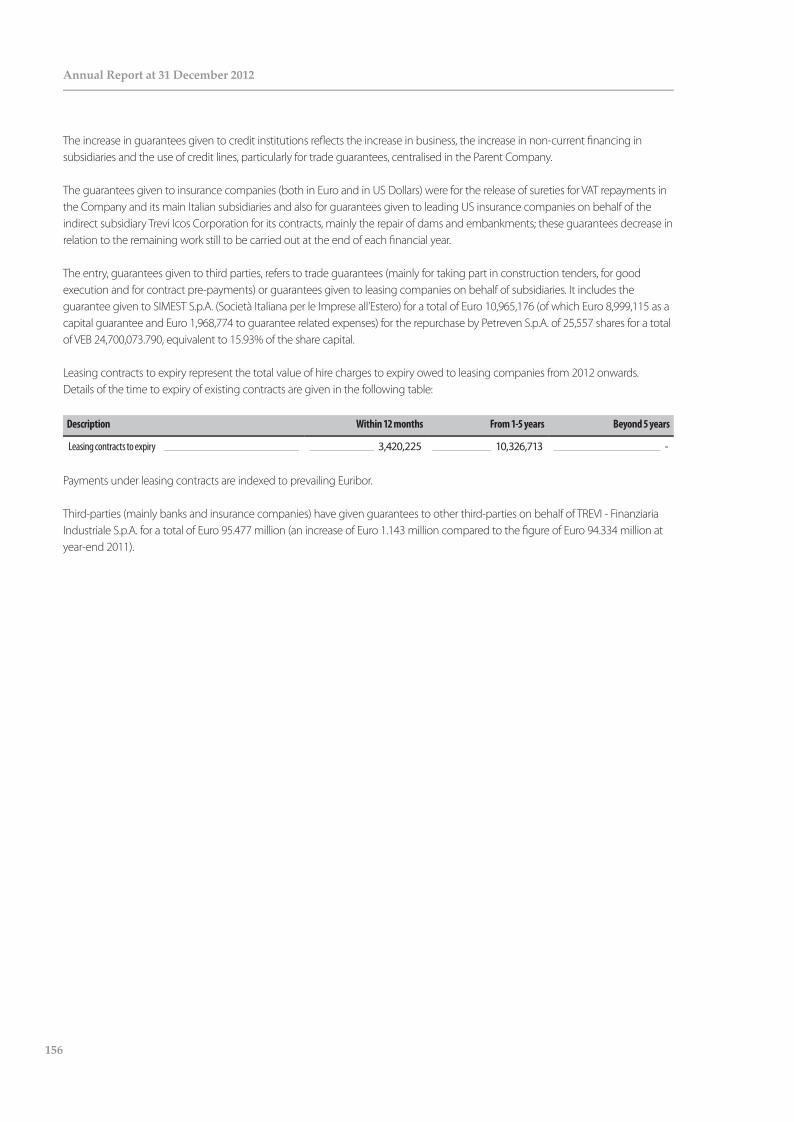
The increase in guarantees given to credit institutions re�ects the increase in business, the increase in non-current �nancing in subsidiaries and the use of credit lines, particularly for trade guarantees, centralised in the Parent Company.
The guarantees given to insurance companies (both in Euro and in US Dollars) were for the release of sureties for VAT repayments in the Company and its main Italian subsidiaries and also for guarantees given to leading US insurance companies on behalf of the indirect subsidiary Trevi Icos Corporation for its contracts, mainly the repair of dams and embankments; these guarantees decrease in relation to the remaining work still to be carried out at the end of each �nancial year.
The entry, guarantees given to third parties, refers to trade guarantees (mainly for taking part in construction tenders, for good execution and for contract pre-payments) or guarantees given to leasing companies on behalf of subsidiaries. It includes the guarantee given to SIMEST S.p.A. (Società Italiana per le Imprese all’Estero) for a total of Euro 10,965,176 (of which Euro 8,999,115 as a capital guarantee and Euro 1,968,774 to guarantee related expenses) for the repurchase by Petreven S.p.A. of 25,557 shares for a total of VEB 24,700,073.790, equivalent to 15.93% of the share capital.
Leasing contracts to expiry represent the total value of hire charges to expiry owed to leasing companies from 2012 onwards.Details of the time to expiry of existing contracts are given in the following table:
Description Within 12 months From 1-5 years Beyond 5 years
Leasing contracts to expiry 3,420,225 10,326,713 -
Payments under leasing contracts are indexed to prevailing Euribor.
Third-parties (mainly banks and insurance companies) have given guarantees to other third-parties on behalf of TREVI - Finanziaria Industriale S.p.A. for a total of Euro 95.477 million (an increase of Euro 1.143 million compared to the �gure of Euro 94.334 million at year-end 2011).
Annual Report at 31 December 2012
156
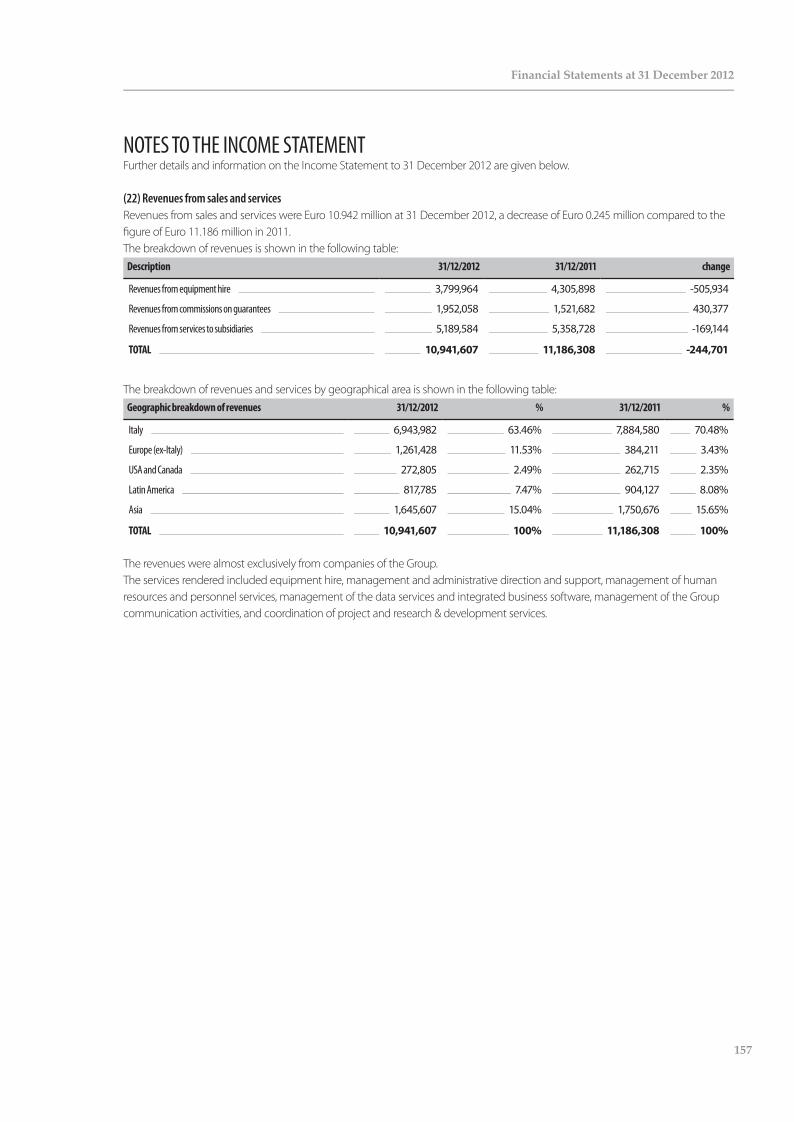
NOTES TO THE INCOME STATEMENTFurther details and information on the Income Statement to 31 December 2012 are given below.
(22) Revenues from sales and servicesRevenues from sales and services were Euro 10.942 million at 31 December 2012, a decrease of Euro 0.245 million compared to the �gure of Euro 11.186 million in 2011. The breakdown of revenues is shown in the following table:
Description 31/12/2012 31/12/2011 change
Revenues from equipment hire 3,799,964 4,305,898 -505,934
Revenues from commissions on guarantees 1,952,058 1,521,682 430,377
Revenues from services to subsidiaries 5,189,584 5,358,728 -169,144
TOTAL 10,941,607 11,186,308 -244,701
The breakdown of revenues and services by geographical area is shown in the following table:Geographic breakdown of revenues 31/12/2012 % 31/12/2011 %
Italy 6,943,982 63.46% 7,884,580 70.48%
Europe (ex-Italy) 1,261,428 11.53% 384,211 3.43%
USA and Canada 272,805 2.49% 262,715 2.35%
Latin America 817,785 7.47% 904,127 8.08%
Asia 1,645,607 15.04% 1,750,676 15.65%
TOTAL 10,941,607 100% 11,186,308 100%
The revenues were almost exclusively from companies of the Group.The services rendered included equipment hire, management and administrative direction and support, management of human resources and personnel services, management of the data services and integrated business software, management of the Group communication activities, and coordination of project and research & development services.
157
Financial Statements at 31 December 2012

(23) Other operating revenuesOther operating revenues were Euro 2.512 million at year-end 2012, compared to Euro 1.803 million in 2011, an increase of Euro 0.709 million.A breakdown of this entry is given in the following table:
Description 31/12/2012 31/12/2011 change
Rental revenues 1,660,941 1,621,669 39,272
Recovery of costs 817,584 105,560 712,024
Capital gains on sales of assets 25,661 476 25,186
Contingent assets -619 12,894 -13,513
Result of U.T.E. TREVI S.p.A.- TREVI - Fin.-Sembenelli- Venezuela - 36,985 -36,985
Other 8,360 25,578 -17,218
TOTAL 2,511,927 1,803,162 708,766
The entry, rental revenues, is mainly rent charged to the subsidiary Drillmec S.p.A. for the production facility and o�ces in Gariga di Podenzano (Piacenza) and those charged to Soilmec S.p.A. for its o�ces in Cesena (Forlì-Cesena). The entry, recovery of costs, is mainly for the recovery of costs for and on behalf of Group companies; the increase re�ects the recovery of telephone charges which, as part of the cost optimisation strategy, have been managed centrally by the Parent Company from 2012. The entry, capital gains on sales of assets, is for the sale of a HH300 drill and a G102 drill to the subsidiary Petreven S.p.A.Other operating revenues in the table above comprised mainly costs repaid by employees for sta� canteen services.
(24) Raw materials and consumablesCosts for raw materials and consumables were Euro 0.032 million in 2012 compared to Euro 0.042 million in 2011, a decrease of Euro 0.010 million.
(25) Personnel expensesPersonnel expenses totalled Euro 4.244 million, compared to Euro 4.247 million in 2011, a decrease of Euro 0.004 million.The details of personnel expenses are summarised in the following table:
Description 31/12/2012 31/12/2011 change
Salaries 3,070,876 3,074,295 -3,419
Social security costs 909,467 938,092 -28,625
Sta� termination indemnity fund (TFR) 263,228 234,850 28,377
TOTAL 4,243,571 4,247,238 -3,667
The average number of employees in the 2012 �nancial year was forty-two of which ten were managers, �ve were quali�ed personnel and twenty-seven were support sta�.Changes in these �gures during the year under review are shown in the following table:
Description 31/12/2012 Increase Decrease 31/12/2011
Managers 10 0 0 10
Quali�ed sta� 5 0 1 6
Support sta� 26 2 3 27
TOTAL 41 2 4 43
Annual Report at 31 December 2012
158

The breakdown of net costs incurred for employee bene�ts is given in the following table:Sta� termination indemnity fund (TFR) 2012 2011
Social security costs for current service costs 165,085 172,655
Financial expenses for obligations undertaken 31,277 43,955
Past Service Liability of new employees 3,258 2,678
Net actuarial losses (gains) for the year 63,608 15,562
Net expenses of sta� termination indemnity fund (TFR) 263,228 234,850
(26) Other operating expensesOther operating expenses were Euro 7.114 million compared to Euro 6.858 million in 2011, an increase of Euro 0.256 million.A breakdown of other operating expenses is shown in the following table:
Description 31/12/2012 31/12/2011 change
Expenses for third-party services 4,266,760 4,251,617 15,143
Expenses for use of third-party assets 2,275,413 2,234,523 40,890
Other operating expenses 571,535 372,003 199,532
TOTAL 7,113,707 6,858,144 255,564
A breakdown of expenses for third-party services is shown in the following table:EXPENSES FOR THIRD-PARTY SERVICES 31/12/2012 31/12/2011 change
Directors’ remuneration 816,127 831,600 -15,473
Statutory Auditors’ remuneration 72,800 72,800 0
Telephone and postal services 661,271 392,469 268,802
Legal, administrative and technical consultancy 1,149,503 1,244,484 -94,981
Computerised data control maintenance 989,950 965,390 24,560
Travel and accommodation 156,244 194,868 -38,623
Insurance 118,295 112,350 5,945
Transport 5,155 6,403 -1,247
Advertising and communication 31,339 73,210 -41,871
Social Security contributions for independent workers 26,985 27,401 -416
Bank expenses 96,330 50,541 45,788
Other 142,762 280,102 -137,340
TOTAL 4,266,760 4,251,617 15,143
The remuneration of the Directors and Statutory Auditors was approved by the Shareholders’ Meeting of 29 April 2010 for the �nancial years 2010 – 2011 – 2012. Costs for computerised data control maintenance were for work carried out for the development and maintenance of the Group Information System, which is centralised within TREVI – Finanziaria Industriale S.p.A.The breakdown of expenses for use of third-party assets is shown in the following table:
EXPENSES FOR USE OF THIRD-PARTY ASSETS 31/12/2012 31/12/2011 change
Equipment hire 2,000,620 2,091,767 -91,147
Rents 274,793 142,756 132,036
TOTAL 2,275,413 2,234,523 40,890
159
Financial Statements at 31 December 2012
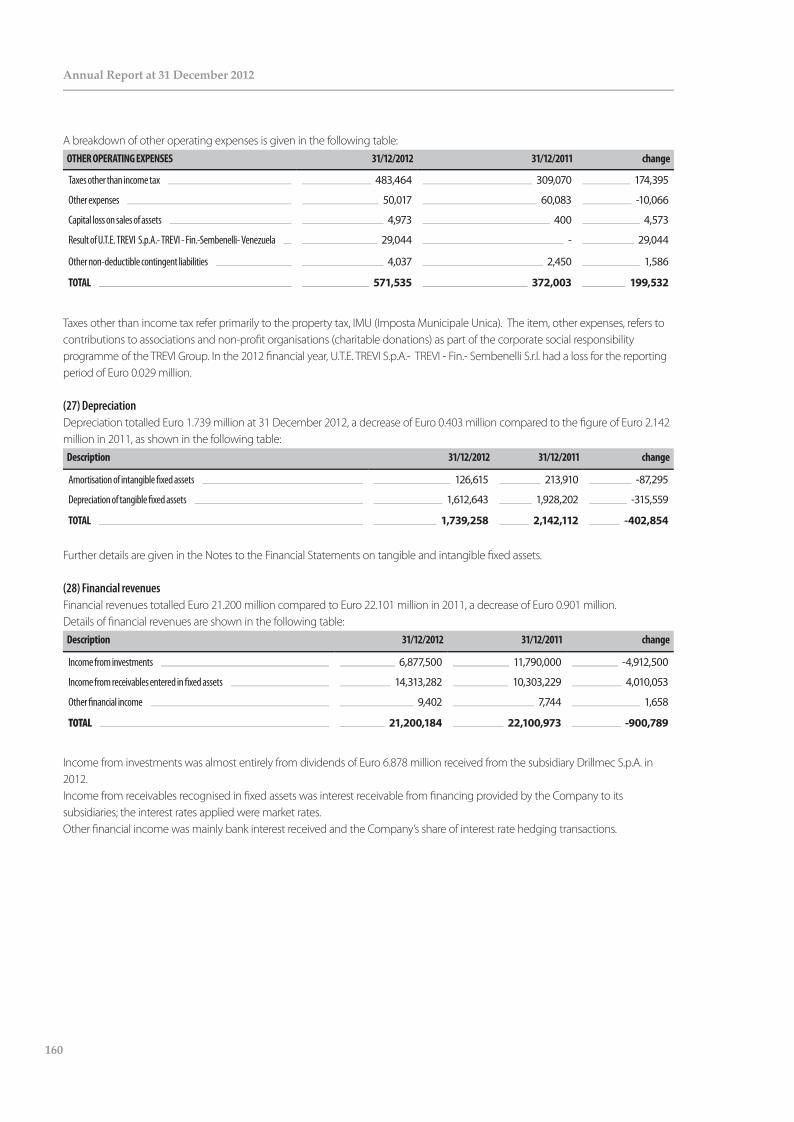
A breakdown of other operating expenses is given in the following table:OTHER OPERATING EXPENSES 31/12/2012 31/12/2011 change
Taxes other than income tax 483,464 309,070 174,395
Other expenses 50,017 60,083 -10,066
Capital loss on sales of assets 4,973 400 4,573
Result of U.T.E. TREVI S.p.A.- TREVI - Fin.-Sembenelli- Venezuela 29,044 - 29,044
Other non-deductible contingent liabilities 4,037 2,450 1,586
TOTAL 571,535 372,003 199,532
Taxes other than income tax refer primarily to the property tax, IMU (Imposta Municipale Unica). The item, other expenses, refers to contributions to associations and non-pro�t organisations (charitable donations) as part of the corporate social responsibility programme of the TREVI Group. In the 2012 �nancial year, U.T.E. TREVI S.p.A.- TREVI - Fin.- Sembenelli S.r.l. had a loss for the reporting period of Euro 0.029 million.
(27) DepreciationDepreciation totalled Euro 1.739 million at 31 December 2012, a decrease of Euro 0.403 million compared to the �gure of Euro 2.142 million in 2011, as shown in the following table:
Description 31/12/2012 31/12/2011 change
Amortisation of intangible �xed assets 126,615 213,910 -87,295
Depreciation of tangible �xed assets 1,612,643 1,928,202 -315,559
TOTAL 1,739,258 2,142,112 -402,854
Further details are given in the Notes to the Financial Statements on tangible and intangible �xed assets.
(28) Financial revenuesFinancial revenues totalled Euro 21.200 million compared to Euro 22.101 million in 2011, a decrease of Euro 0.901 million.Details of �nancial revenues are shown in the following table:
Description 31/12/2012 31/12/2011 change
Income from investments 6,877,500 11,790,000 -4,912,500
Income from receivables entered in �xed assets 14,313,282 10,303,229 4,010,053
Other �nancial income 9,402 7,744 1,658
TOTAL 21,200,184 22,100,973 -900,789
Income from investments was almost entirely from dividends of Euro 6.878 million received from the subsidiary Drillmec S.p.A. in 2012.Income from receivables recognised in �xed assets was interest receivable from �nancing provided by the Company to its subsidiaries; the interest rates applied were market rates. Other �nancial income was mainly bank interest received and the Company’s share of interest rate hedging transactions.
Annual Report at 31 December 2012
160

(29) Financial expensesFinancial expenses were Euro 10.117 million compared to Euro 8.192 million in 2011, an increase of Euro 1.925 million.The breakdown of �nancial expenses is shown in the following table:
Description 31/12/2012 31/12/2011 change
Bank interest 7,559,567 6,577,999 981,568
Expenses and commissions for guarantees 786,236 687,204 99,032
Commissions payable on �nancing 716,669 480,732 235,937
Interest payable to leasing companies 113,400 178,616 -65,215
Interest on loans from subsidiaries 463,184 2,984 460,201
Interest payable on other �nancing 477,786 264,387 213,398
TOTAL 10,116,842 8,191,921 1,924,921
The increase in bank interest in 2012 re�ected the increase in �nancing from new credit lines and the increase in existing credit lines and also the deterioration in market conditions in the Italian market, which was due to the general macroeconomic environment.Interest payable on other �nancing was linked to the instalment payments of IRES and IRAP taxes and the negative di�erence for the period; it also re�ected interest payable to credit institutions for interest rate hedges.
(30) Gains (losses) on exchange ratesNet losses on transactions in foreign currencies were Euro 0.457 million compared to gains of Euro 1.467 million in 2011, a decrease of Euro1.924 million.
Description 31/12/2012 31/12/2011 change
Gains (losses) on exchange rates -456,984 1,467,073 -1,924,057
TOTAL -456,984 1,467,073 -1,924,057
(31) Income taxesThe provision for income taxes was determined on the basis of the likely tax burden. Taxes totalled Euro 1.929 million, compared to Euro 1.671 million in 2011, an increase of Euro 0.258 million.A breakdown of this entry is shown in the following table:
Description 31/12/2012 31/12/2011 change
IRES tax for the period 1,259,590 989,454 270,136
IRAP tax for the period 499,877 511,948 -12,071
Taxes due for prior �nancial years -43,036 92,306 -135,342
Pre-paid taxes 86,179 -22,546 108,725
Deferred taxes 126,017 99,644 26,373
TOTAL 1,928,627 1,670,806 257,821
161
Financial Statements at 31 December 2012

Current taxes were calculated using a tax rate of 27.50% for IRES and 5.57% for IRAP.Deferred and pre-paid taxes were calculated on the basis of an IRES rate of 27.50% and a total combined IRES and IRAP rate of 33.07%. A reconciliation of the theoretical and e�ective tax charge is given in the following table:
Reconciliation of theoretical/ e�ective tax expense
31/12/2012 % 31/12/2011 %
Pre-tax pro�t 10,951,185 15,076,423
Taxes calculated using the e�ective tax rate 3,011,576 27.50% 4,146,016 27.50%
Permanent di�erences -1,795,023 -16.39% -3,064,256 -20.32%
Temporary di�erences 212,197 1.94% 77,098 0.51%
IRAP 499,877 4.56% 511,948 3.40%
Total of e�ective taxes recognised in pro�t or loss 1,928,627 17.61% 1,670,806 11.08%
(32) Net pro�tResult for the periodThe net pro�t for 2012 was Euro 9.023 million, a decrease of Euro 4.383 million compared to the previous �nancial year when net pro�t was Euro 13.406 million. In the 2012 �nancial period, there was an operating pro�t of Euro 0.325 million (in 2011, there was an operating loss of Euro 0.300 million), a good performance from �nancial management despite the decrease of Euro 4.750 million and increases in some of the components of the tax charge.The Company has chosen to show information on earnings per share exclusively in the Consolidated Financial Statements of the Group as permitted under IAS 33.
OTHER INFORMATIONNo �nancial expenses were capitalised in the 2012 �nancial period or in the preceding year.The Company had three Interest Rate Swap contracts with leading �nancial counterparts exclusively to hedge existing operations and not held for trading:(*) Euro 1,625,037 (originally Euro 5,000,000) Interest Rate Swap on the depreciation plan of a �ve-year leasing contract expiring on 30/06/2014;(*) Euro 1,581,584 (originally Euro 5,000,000) Interest Rate Swap on the depreciation plan of a �ve-year leasing contract expiring on 14/05/2014.Euro 40,000,000 (increased by Euro 20,000,000 in the �nancial period under review) Interest Rate Swap on the depreciation plan of a ten-year �nancing contract expiring on 03/11/2020.These transactions have been accounted as cash �ow hedges as they are e�ective hedges under IAS 39.
Annual Report at 31 December 2012
162
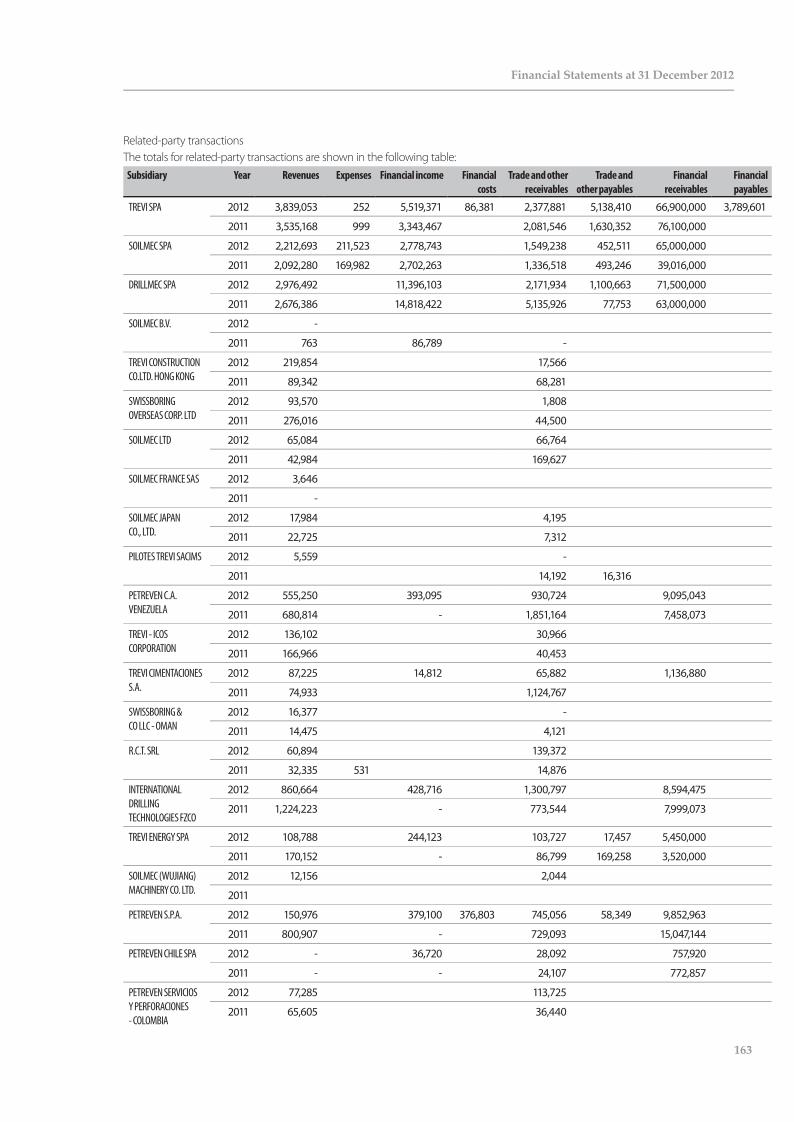
Related-party transactionsThe totals for related-party transactions are shown in the following table:
Subsidiary Year Revenues Expenses Financial income Financial costs
Trade and other receivables
Trade and other payables
Financial receivables
Financial payables
TREVI SPA 2012 3,839,053 252 5,519,371 86,381 2,377,881 5,138,410 66,900,000 3,789,601
2011 3,535,168 999 3,343,467 2,081,546 1,630,352 76,100,000
SOILMEC SPA 2012 2,212,693 211,523 2,778,743 1,549,238 452,511 65,000,000
2011 2,092,280 169,982 2,702,263 1,336,518 493,246 39,016,000
DRILLMEC SPA 2012 2,976,492 11,396,103 2,171,934 1,100,663 71,500,000
2011 2,676,386 14,818,422 5,135,926 77,753 63,000,000
SOILMEC B.V. 2012 -
2011 763 86,789 -
TREVI CONSTRUCTION CO.LTD. HONG KONG
2012 219,854 17,566
2011 89,342 68,281
SWISSBORING OVERSEAS CORP. LTD
2012 93,570 1,808
2011 276,016 44,500
SOILMEC LTD 2012 65,084 66,764
2011 42,984 169,627
SOILMEC FRANCE SAS 2012 3,646
2011 -
SOILMEC JAPAN CO., LTD.
2012 17,984 4,195
2011 22,725 7,312
PILOTES TREVI SACIMS 2012 5,559 -
2011 14,192 16,316
PETREVEN C.A. VENEZUELA
2012 555,250 393,095 930,724 9,095,043
2011 680,814 - 1,851,164 7,458,073
TREVI - ICOS CORPORATION
2012 136,102 30,966
2011 166,966 40,453
TREVI CIMENTACIONES S.A.
2012 87,225 14,812 65,882 1,136,880
2011 74,933 1,124,767
SWISSBORING & CO LLC - OMAN
2012 16,377 -
2011 14,475 4,121
R.C.T. SRL 2012 60,894 139,372
2011 32,335 531 14,876
INTERNATIONAL DRILLING TECHNOLOGIES FZCO
2012 860,664 428,716 1,300,797 8,594,475
2011 1,224,223 - 773,544 7,999,073
TREVI ENERGY SPA 2012 108,788 244,123 103,727 17,457 5,450,000
2011 170,152 - 86,799 169,258 3,520,000
SOILMEC (WUJIANG) MACHINERY CO. LTD.
2012 12,156 2,044
2011
PETREVEN S.P.A. 2012 150,976 379,100 376,803 745,056 58,349 9,852,963
2011 800,907 - 729,093 15,047,144
PETREVEN CHILE SPA 2012 - 36,720 28,092 757,920
2011 - - 24,107 772,857
PETREVEN SERVICIOS Y PERFORACIONES - COLOMBIA
2012 77,285 113,725
2011 65,605 36,440
163
Financial Statements at 31 December 2012

Subsidiary Year Revenues Expenses Financial income Financial costs
Trade and other receivables
Trade and other payables
Financial receivables
Financial payables
SWISSBORING QATAR 2012 18,343 -
2011 14,089 4,327
PSM S.R.L. 2012 39,149 10,583
2011 61,318 11,676
PETREVEN U.T.E. - ARGENTINA
2012 45,584 110,116
2011 31,852 64,532
PETREVEN SERVICIOS Y PERFORACIONES - PERU
2012 36,342 -
2011 43,651
DRILLMEC INC USA 2012 116,967 69,974
2011 93,128 2,984 22,928
SOILMEC DEUTSCHLAND GMBH
2012 8,197 1,276
2011 6,675 2,564
UTE TREVI- CONSORZIO SEMBENELLI
2012 29,044 1,748,590
2011 36,985 - 1,753,435
SOILMEC AUSTALIA PTY LTD
2012
2011
SOILMEC NORTH AMERICA
2012 77,236 82,508
2011 5,272 5,272
GALANTE S.A. 2012 16,400
2011 16,400
ASASAT TREVI GENERAL CONSTRUCTION J.V.
2012 1,355
2011 1,355 1,355
TREVI FOUNDATION KUWAIT CO. WLL
2012 311,204 13 408,090 5,112
2011 94,439 101,322
TREVI FOUNDATIONS DENMARK A/S
2012 1,143,762 1,143,762
2011 341,789 271,155
PETREVEN PERU’ S.A. 2012 55,641
2011 19,299
ARABIAN SOIL CONTRACTORS LTD.
2012 35,242 35,242
2011 16,261 3,393
TREVI GALANTE S.A. 2012 10,540 10,540
2011 3,530 2,000
PERFORAZIONI TREVI ENERGIE B.V.
2012 47,178 47,178
2011
CONSORZIO WATER ALLIANCE
2012
2011 11,920 19,631
GOMEC SRL 2012 13,016 8,234
2011 136,139 6,976
TOTAL SUBSIDIARIES 2012 13,402,413 240,831 21,190,782 463,184 11,650,671 8,521,092 238,287,282 3,789,601
2011 12,864,477 171,511 22,093,228 2,984 14,096,096 4,140,359 212,913,147 -
Annual Report at 31 December 2012
164

Associates Year Revenues Expenses Financial income Financial costs
Trade and other receivables
Trade and other payables
Financial receivables
Financial payables
PARCHEGGI S.P.A. 2012 27,919 46,841
2011 21,734 25,473
ROMA PARK S.R.L. 2012 1,557 471
2011 1,520 457
TOTAL ASSOCIATES 2012 27,919 1,557 - - 46,841 471 - -
2011 21,734 1,520 - - 25,473 457 - -
(*)The amount includes the dividend of Euro 6,877,500 distributed during the 2012 �nancial period(**)The amount includes the dividend of Euro 11,790,000 distributed during the 2011 �nancial period
All related party transactions were carried out at normal market conditions; there were no transactions between the Company and the controlling company, Trevi Holding SE, which has its registered o�ce in Cesena (Forlì-Cesena).
At 31 December 2012, the Board of Directors was composed of nine members. They were appointed by the Shareholders’ Meeting of 29 April 2010 for three �nancial years and until the approval of the Financial Statements at 31 December 2012.The independent director, Mr Franco Mosconi, resigned e�ective from 1 June 2012 and, at its meeting on 14 November 2012, the Board of Directors co-opted Ms Monica Mondardini as the new independent director.The Directors received compensation and remuneration totalling Euro 1,088,403.
Name Position Length of appointment
(months)
Remuneration from the
Company
Remuneration from subsidiaries
Total
Trevisani DavideChairman of the Board of Directors & Managing Director 12 200,000 428,000 628,000
Trevisani Gianluigi Deputy Chairman of the Board of Directors & Managing Director 12 185,000 438,000 623,000
Trevisani Cesare Managing Director 12 238,640 263,000 501,640
Trevisani Stefano Managing Director 12 281,236 232,000 513,236
Pinza Riccardo Director 12 41,600 - 41,600
Moscato Guglielmo Director 12 40,000 - 40,000
Mondardini Monica Director 12 5,260 - 5,260
Teodorani Fabbri Pio Director 12 40,000 - 40,000
Bocchini Enrico Director 12 40,000 - 40,000
Mosconi Franco Director 12 16,667 - 16,667
TOTAL 1,088,403 1,361,000 2,449,403
The remuneration paid by subsidiaries to the Company Directors and Statutory Auditors is also shown, in accordance with Consob Rules.The amounts indicated for the Directors, Cesare Trevisani and Stefano Trevisani, include the remuneration they were paid as employees of the Parent Company.The Directors did not receive any non-monetary bene�ts, stock options, bonuses or other incentives. The Company Articles of Association give the Board of Directors the right to appoint an Executive Committee. This right has not been exercised by the current Board of Directors.The remuneration of the Statutory Auditors totalled Euro 72,800.
165
Financial Statements at 31 December 2012

Name Position Length of appointment
(months)
Remuneration from the
Company
Remuneration from subsidiaries
Total
Adolfo Leonardi Chairman of the Board of Statutory Auditors 12 31,200 23,000 54,200
Giacinto Alessandri Standing Statutory Auditor 12 20,800 12,000 32,800
Giancarlo Poletti Standing Statutory Auditor 12 20,800 15,000 35,800
TOTAL 72,800 50,000 122,800
The Board of Statutory Auditors was appointed by the Shareholders’ Meeting on 29 April 2010 for three �nancial years. Its mandate expires with the approval of the Financial Statements at 31 December 2012.
The following table gives the remuneration paid by the Company to Reconta Ernst & Young S.p.A. and companies belonging to the same group in accordance with Article 160 c. 1-bis no. 303 Law 262 of 28/12/2005 and supplemented by Legislative Decree 29/12/2006.During the �nancial period under review, a consultancy contract was signed with Ernst & Young Advisory S.p.A., for a control model project under law 262/05 which will be implemented during 2013.
31/12/2012Service provider Auditing (Euro) Consultancy (Euro) TOTAL (Euro)
Reconta Ernst & Young SpA 239,700 239,700
TOTAL 239,700 0 239,700
The Shareholders’ Meeting of 27 April 2012, in accordance with the decisions of previous Shareholders’ Meetings, renewed the authority given to the Board of Directors to purchase and sell a maximum of 2,000,000 treasury shares. At 31 December 2012, this authority had been used to purchase a further 14,000 treasury shares for a total consideration of Euro 0.057 million. At 31 December 2012, the Company held 128,400 treasury shares for a total investment of Euro 0.751 million.
The Chairman of the Board of Directors DAVIDE TREVISANI
Declaration relating to the Financial Statements in accordance with Article 154-bis of Legislative Decree 58/98
1. The undersigned Davide Trevisani, Chairman and Managing Director, Gianluigi Trevisani, Managing Director, Cesare Trevisani, Managing Director, Stefano Trevisani, Managing Director, and Daniele Forti, Group Chief Financial Officer and in his capacity as Manager responsible for drawing up the financial statements of TREVI-Finanziaria Industriale S.p.A., declare, taking note of the provisions of Article 154-bis, paragraphs 3 and 4 of Legislative Decree of 24 February 1998, no. 58:
• the appropriateness in relation to the characteristics of the business; and • the effective application
of the administrative and accounting procedures for the preparation of the Financial Statements in the 2012 financial year.
2. It is also declared that: 2.1 The Financial Statements at 31 December 2012:
a) have been prepared in accordance with the applicable International Accounting Standards recognised by the European Community in accordance with EC Regulation no. 1606/2002 of the European Parliament and of the European Council of 19 July 2002;
b) correspond to the results contained in the accounting records and documents; c) provide a true and fair view of the capital, economic and financial position of TREVI –
Finanziaria Industriale S.p.A. 2.2 The review of operations includes information on significant events that occurred in the course of the financial year and of their impact, together with a description of the main risks and uncertainties, and information concerning related party transactions.
Cesena, 22 March 2013
Annual Report at 31 December 2012
166

Declaration relating to the Financial Statements in accordance with Article 154-bis of Legislative Decree 58/98
1. The undersigned Davide Trevisani, Chairman and Managing Director, Gianluigi Trevisani, Managing Director, Cesare Trevisani, Managing Director, Stefano Trevisani, Managing Director, and Daniele Forti, Group Chief Financial Officer and in his capacity as Manager responsible for drawing up the financial statements of TREVI-Finanziaria Industriale S.p.A., declare, taking note of the provisions of Article 154-bis, paragraphs 3 and 4 of Legislative Decree of 24 February 1998, no. 58:
• the appropriateness in relation to the characteristics of the business; and • the effective application
of the administrative and accounting procedures for the preparation of the Financial Statements in the 2012 financial year.
2. It is also declared that: 2.1 The Financial Statements at 31 December 2012:
a) have been prepared in accordance with the applicable International Accounting Standards recognised by the European Community in accordance with EC Regulation no. 1606/2002 of the European Parliament and of the European Council of 19 July 2002;
b) correspond to the results contained in the accounting records and documents; c) provide a true and fair view of the capital, economic and financial position of TREVI –
Finanziaria Industriale S.p.A. 2.2 The review of operations includes information on significant events that occurred in the course of the financial year and of their impact, together with a description of the main risks and uncertainties, and information concerning related party transactions.
Cesena, 22 March 2013
Financial Statements at 31 December 2012
167

168

169

DECISIONS OF THE ORDINARY SHAREHOLDERS’ MEETING OF 29 APRIL 2013
As announced in the Notice for the Shareholders’ Meeting published in the national daily newspaper La Repubblica on 19 March 2013, on the NIS system of Borsa Italiana and on the Company website www.trevi�n.com, at 11.00 hours on 29 April 2013, the �rst convocation of the Ordinary Shareholders’ Meeting of TREVI – Finanziaria Industriale S.p.A. was held at the registered o�ce in Cesena in the presence of shareholders representing 50,240,102 ordinary shares, equivalent to 71.573% of the share capital and 71.704% of the shares with voting rights.
Item 1 on the Agenda:Approval of the Annual Report at 31 December 2012 and presentation of the Consolidated Annual Report at 31 December 2012; Board of Directors’ Report on Operations, Report of the Board of Statutory Auditors; and Report of the independent audit company. Allocation of the pro�t for the year. Resolutions pertaining thereto and resulting therefrom.The Ordinary Shareholders’ Meeting decided as follows:• to approve each and every part of the preliminary Annual Report at 31 December 2012 and the Board of Directors’ Report on
Operations;• to allocate, as proposed by the Board of Directors, the pro�t for the year ended 31 December 2012 of Euro 9,022,558 as follows:
• 5%, equal to Euro 451,128, to the legal reserve;• Euro 8,571,430 for the dividend of Euro 0.13 per share, also through the use of Euro 553,829 of retained pro�ts from previous
�nancial years, for a total of Euro 9,125,259, payable to those shareholders with the relevant right. The ex-dividend date is 8 July 2013 and payment will be from 11 July 2013.
Item 2 on the Agenda:Authorisation to acquire and dispose of treasury shares. Resolutions pertaining thereto and resulting therefrom.The Ordinary Shareholders’ Meeting decided as follows:• to approve the continuation of the buyback/ disposal of treasury shares up to a maximum of no. 2,000,000, shares equal to 2.85%
of the share capital, which is made up of 70,194,300 ordinary shares. The duration of the plan is until 30 April 2014; the maximum amount payable is Euro 20 per share and there is no minimum amount payable.
Item 3 on the Agenda:Approval of Section I of the Report on Remuneration in accordance with Article 123 ter of Legislative Decree of 24 February 1998 no. 58.
The Shareholders’ Meeting decided as follows:• to approve the Report on Remuneration in accordance with Article 123 ter of Legislative Decree of 24 February 1998 no. 58, the
Consolidated Finance Act.
170
Item 4 on the Agenda:Appointment of the Board of Directors for the �nancial periods 2013- 2014- 2015, following decisions on the number of board members and their respective remuneration. Resolutions pertaining thereto and resulting therefrom.On the basis of a list presented by the shareholder, TREVI Holding SE, which met the requirements of enacted law, the Shareholders’ Meeting decided as follows:• that the Board of Directors should comprise nine members and the following should be appointed for the 2013- 2014- 2015 �nancial
periods:1) Monica Mondardini (*)2) Davide Trevisani3) Gianluigi Trevisani4) Cesare Trevisani5) Stefano Trevisani6) Guglielmo Antonio Claudio Moscato (*)7) Cristiano Schena (*)8) Cristina Finocchi Mahne (*)9) Riccardo Pinza (*)
(*) Candidate meeting the requisites of independence under the law• to give the Board of Directors annual remuneration totalling Euro 830,000. The basic remuneration of a Director is Euro 40,000 with
additional remuneration being paid to individual members of the Board according to the positions and duties allocated them at the �rst meeting of the Board of Directors.
Item 5 on the Agenda:Appointment of the Board of Statutory Auditors and the Chairman of the Board of Statutory Auditors for the �nancial periods 2013- 2014- 2015 and their relative remuneration. Resolutions pertaining thereto and resulting therefrom.
On the basis of a list presented by the shareholder, TREVI Holding SE, which met the requirements of enacted law, the Shareholders’ Meeting decided as follows: • to appoint the following to the Board of Statutory Auditors for the �nancial periods 2013- 2014- 2015:
1) Adolfo Leonardi Chairman2) Roberta De Simone Standing Statutory Auditor3) Giancarlo Poletti Standing Statutory Auditor4) Silvia Caporali Supplementary Statutory Auditor 5) Stefano Leardini Supplementary Statutory Auditor
• To give the Board of Statutory Auditors annual remuneration of Euro 30,000 for the Chairman and Euro 20,000 for each Standing Statutory Auditor.
The complete minutes of the Ordinary Shareholders’ Meeting and a summary account of the voting are publicly available at the registered o�ce of the Company and on the Company website www.trevi�n.com in accordance with enacted law.
171

Printed byCentro Stampa DigitalPrint
Rimini
Communication Dept. TREVI Group
201, via Larga47522 Cesena - Italy
Tel. +39.0547.319111Fax +39.0547.319313
www.trevi�n.come-mail:trevi�n@trevi�n.com


![Existence of minimizers for non-quasiconvex integrals · scalar case (for which N = 1) always falls in this category (cf. MARCELLINI [43, 44]). Clearly, this condition is equivalent](https://static.fdocuments.us/doc/165x107/5c73355209d3f2be7e8c429f/existence-of-minimizers-for-non-quasiconvex-integrals-scalar-case-for-which.jpg)