Annual Report & Accounts 2016 - HomeServe plcAnnual Report & Accounts 2016 HomeServe plc | 1...
180
Annual Report & Accounts 2016
Transcript of Annual Report & Accounts 2016 - HomeServe plcAnnual Report & Accounts 2016 HomeServe plc | 1...

Hom
eServe Annual Report &
Accounts 2016
Annual Report & Accounts2016

We provide home emergency, repair and heating installation services to 7m customers. Our established businesses operate in the UK, USA, France and Spain, and we have a developing business in Italy.
HomeServe at a glance
2016 2015
UK £58.0m £56.4mUSA £12.1m £6.4mFrance £23.2m £23.4mSpain £9.9m £7.5mNew Markets (£5.9m) (£5.9m)
2016 2015
UK 24m 24mUSA 32m 29mFrance 15m 15mSpain 15m 15mNew Markets 6m 6m
2016 2015
UK 2.2m 2.1mUSA 2.3m 2.0mFrance 1.0m 0.9mSpain 1.2m 1.1mNew Markets 0.3m 0.2m
2016 2015
UK 82% 83%USA 82% 82%France 89% 89%Spain 77% 79%
Adjusted operating profit1
£97.3m(FY15: £87.8m)
Affinity partner households
92m(FY15: 89m)
Customers
7m(FY15: 6.3m)
Retention
83%(FY15: 83%)
1 All references to adjusted earnings before interest, tax, depreciation and amortisation (EBITDA), adjusted operating profit or loss, adjusted profit before tax and adjusted earnings per share throughout the report, exclude the amortisation of acquisition intangibles and exceptional items, as reconciled to their statutory equivalents in the Financial Review.

Strategic reportAnnual Report & Accounts 2016
HomeServe plc | 1
Highlights
Highlights
For financial information or to view thisreport online, go to homeserveplc.com
Strategic report
2 Our business model6 2016 Summary7 Chairman’s statement8 Chief Executive’s review23 Financial review28 Principal risks and uncertainties
Corporate responsibility
37 Customers37 Community39 Employees41 Environment, Health & Safety
Governance
42 Chairman’s overview44 Directors46 Corporate Governance report55 Audit & Risk Committee report60 Remuneration report91 Directors’ report94 Directors’ responsibilities
Financial statements
96 Independent Auditor’s report104 Group financial statements159 Company financial statements
Revenue (m)
£633.2m(FY15: £584.2m)
Adjusted EBITDA1 (m)
£122.7m(FY15: £109.4m)
Adjusted profit before tax1 (m)
£93.0m(FY15: £85.4m)
Statutory profit before tax (m)
£82.6m(FY15: £76.7m)
Adjusted earnings per share1 (p)
21.8p(FY15: 19.0p)
Basic earnings per share (p)
19.6p(FY15: 17.2p)
Ordinary dividend per share (p)
12.7p(FY15: 11.5p)
Page Title at start:Content Section at start:

Annual Report & Accounts 2016
Strategic report
2 | HomeServe plc
Global scalable model offering innovative home assistance solutions enabled through systems and technology
Our business model
Our visionTo become the world’s favourite plumbers, heating engineers and electricians.
Our missionTo provide home assistance membership, which frees our customers from the worry and inconvenience of emergencies, repairs and installations.
Inputs
Affinity partnerships
Comprehensive products
Marketing expertise
Claims & network capability
Technology & systems
Value added
Strong governance and capital management
We have developed long-term affinity partnerships with partners whose brands are relevant to our home assistance product range. Our partnerships extend beyond utilities to financial services, heating manufacturers and specialist service providers. Our products are underwritten by third party underwriters, independent of HomeServe. We act as an insurance intermediary and do not take any material insurance risk.
We design a range of comprehensive water, heating and electrical related home assistance products. Through relentless innovation, we offer up to date connected home solutions. We use our expertise in data analytics to optimise our direct marketing across a number of channels including direct mail, call centres, and more recently, through digital channels.
Relationships with our partners
Product design and marketing expertise
Customer focus Cust
omer
focu
s
Page Title at start:Content Section at start:Strategic report Our business model

Strategic reportAnnual Report & Accounts 2016
HomeServe plc | 3
Our business model
Global scalable model offering innovative home assistance solutions enabled through systems and technologyValue shared
Marketing expertise
Value added
Strong governance and capital management
Customers pay an annual premium for their home assistance product which funds the
product underwriting, partner commission payments, and other direct and indirect costs
of providing the service. Typically, on completing a customer claim the underwriter funds the job
cost. We invest in business development and marketing to deliver future customer growth.
Our local call centres are available to handle customers’ claims, many offering a 24/7
service. We manage networks of employed, sub-contract and franchise engineers to
provide timely resolutions for our customers ensuring excellent service when they
experience a home emergency. We achieve this by engaging great people in all of our
businesses and providing them with the systems and technology to do a great job.
Financial model
Excellent service at point of need
Customer focus Cust
omer
focu
s
Partners:• Provides solution to
customer’s emergency• Reduces customer churn• Revenue stream
Customers:• Peace of mind in event
of home emergency• Excellent customer service • Innovative Smart Home
solutions
Employees:• Expanding global business• Opportunity, training
and development• Employee engagement
score is 81% across the Group
Investors:• An attractive cash generative
business model• Significant growth
potential internationally• Growth is supported by
a strong balance sheet
Page Title at start:Content Section at start:

Annual Report & Accounts 2016
Strategic report
4 | HomeServe plc
Our business is built on developing long-term relationships with our affinity partners, offering our customers home assistance in respect of plumbing, heating and electrical-related emergencies and repairs.
We have extended our services to include provision of heating installations. We provide our services through the use of directly employed, franchised and subcontract networks of engineers.
With the customer clearly at the heart of the business, we have developed strategies to enable us to fulfil our vision and mission.
Our strategic framework
Strategic priority Progress and future development Key performance indicators
Extend long-term affinity partnerships
• We have over 90 affinity partners across the geographies in which we operate. During the year we renewed six partnerships in the UK business and signed 11 new partnerships in the USA adding a total of 2.8m households.
• On 31 March 2016 we entered an agreement to acquire Utility Service Partners Inc. in the USA, a business with around 300 partners and 0.4m customers across 9.4m partner households.
• Having invested in business development across our businesses we plan to continue to add new affinity relationships during FY17.
Affinity partner householdsDuring FY16 we added 3m affinity partner households, now serving 92m households across our five businesses.
Innovate product range and extend our installation services
• We offer a range of plumbing, heating and electrical home assistance products and continue to innovate to improve our products for today’s customer. We continue to work with Tado and Nest installing smart thermostats and during the year we developed and tested a unique water leak detector with functionality to automatically notify the home owner who can then book a repair with us.
• Heating services is the most established of the home emergency services and during FY16 we acquired a heating business. The business has a solid customer base and 150 directly employed engineers thereby increasing our heating services capacity.
• We have developed a franchised heating installation network which we expect to extend in FY17.
Customers During FY16 we added 0.7m customers now serving 7m customers with home assistance products.
Drive efficiency • We are committed to improving efficiency in all aspects of our business while ensuring we continue to deliver great customer service.
• We have a strong balance sheet and continue to invest in technology solutions to make us more efficient and to improve customer satisfaction.
Group profit margin The Group delivered £97.3m adjusted operating profit, a 15% profit margin.
Deliver digital innovation • We have established a digital hub to develop an end to end, consistent, user friendly digital experience for our customers. A new Chief Digital Officer has been appointed to lead this activity and to enhance self-serve functionality at all stages of the customer journey and enable more effective product sales.
New Markets – including digital innovationIn line with the prior year, we invested £5.9m in our New Markets segment which includes our investment in digital innovation and expansion into new markets.
Expansion into new markets • We have commenced the appraisal of extending our services to other international markets with a view to entering the home services market in partnership with local utilities, similar to the initial successful joint ventures with South Staffordshire Water in the UK and Veolia in France.
• We have identified a number of attractive markets where, we believe, we can partner with local utilities.
Page Title at start:Content Section at start:

Strategic reportAnnual Report & Accounts 2016
HomeServe plc | 5
Our business model
Strategic priority Progress and future development Key performance indicators
Extend long-term affinity partnerships
• We have over 90 affinity partners across the geographies in which we operate. During the year we renewed six partnerships in the UK business and signed 11 new partnerships in the USA adding a total of 2.8m households.
• On 31 March 2016 we entered an agreement to acquire Utility Service Partners Inc. in the USA, a business with around 300 partners and 0.4m customers across 9.4m partner households.
• Having invested in business development across our businesses we plan to continue to add new affinity relationships during FY17.
Affinity partner householdsDuring FY16 we added 3m affinity partner households, now serving 92m households across our five businesses.
Innovate product range and extend our installation services
• We offer a range of plumbing, heating and electrical home assistance products and continue to innovate to improve our products for today’s customer. We continue to work with Tado and Nest installing smart thermostats and during the year we developed and tested a unique water leak detector with functionality to automatically notify the home owner who can then book a repair with us.
• Heating services is the most established of the home emergency services and during FY16 we acquired a heating business. The business has a solid customer base and 150 directly employed engineers thereby increasing our heating services capacity.
• We have developed a franchised heating installation network which we expect to extend in FY17.
Customers During FY16 we added 0.7m customers now serving 7m customers with home assistance products.
Drive efficiency • We are committed to improving efficiency in all aspects of our business while ensuring we continue to deliver great customer service.
• We have a strong balance sheet and continue to invest in technology solutions to make us more efficient and to improve customer satisfaction.
Group profit margin The Group delivered £97.3m adjusted operating profit, a 15% profit margin.
Deliver digital innovation • We have established a digital hub to develop an end to end, consistent, user friendly digital experience for our customers. A new Chief Digital Officer has been appointed to lead this activity and to enhance self-serve functionality at all stages of the customer journey and enable more effective product sales.
New Markets – including digital innovationIn line with the prior year, we invested £5.9m in our New Markets segment which includes our investment in digital innovation and expansion into new markets.
Expansion into new markets • We have commenced the appraisal of extending our services to other international markets with a view to entering the home services market in partnership with local utilities, similar to the initial successful joint ventures with South Staffordshire Water in the UK and Veolia in France.
• We have identified a number of attractive markets where, we believe, we can partner with local utilities.
Page Title at start:Content Section at start:

Annual Report & Accounts 2016
Strategic report
6 | HomeServe plc
2016 Summary
Group profit up 9% to £93.0m with an 11% increase in customer numbers to 7.0m
UK – Customer numbers increase 3% from 2.1m to 2.2m with profits also increasing 3% to £58.0m
• Acquisition of a heating services business brings gas capability and 0.1m customers
• Good marketing performance delivering 0.4m gross new customers (FY15: 0.3m)
• Retention rate of 82% reflecting increased number of first year renewals (FY15: 83%)
USA – Profits up 89% to £12.1m combined with 17% customer growth to 2.3m
• Continued strong marketing performance adding 0.7m gross new customers (FY15: 0.7m)
• Customer loyalty remains strong with 82% retention rate (FY15: 82%)
• Strong partner pipeline, with 2.8m households added in the year, up to 32m households (FY15: 29m)
• Agreement to acquire Utility Service Partners Inc. (USP) for $75m, adding a further 9.4m partner households and 0.4m customers, expected to complete in the first half of FY17
France – Customer numbers up 7% to 1.0m with stable profits of £23.2m
• Renewed sales momentum adding 0.2m gross new customers (FY15: 0.1m)
• High retention rates continue at 89% (FY15: 89%)
Spain – Customer numbers up 11% to 1.2m with profits increasing from £7.5m to £9.9m
• Retention rate of 77%, reflecting the increased number of first year renewals (FY15: 79%)
New Markets – Investment of £5.9m in Italy and digital innovation
• Digital hub established to enhance self-serve customer experience and drive business efficiencies
• Started to make progress on international development
Group – Strong earnings growth, increasing dividend growth, high cash generation and a strong balance sheet
• Adjusted earnings per share up 15% to 21.8p with proposed 10% increase in dividend payment to 12.7p per share
• Year end net debt of £169.5m, 1.4x adjusted EBITDA, reflecting payment of £99.4m special dividend in July 2015 (FY15: £64.1m; 0.6x adjusted EBITDA)
.
Page Title at start:Content Section at start:2016 Summary

Strategic reportAnnual Report & Accounts 2016
HomeServe plc | 7
Chairman’s statement
I am pleased that the Group has had another good year, delivering further customer and profit growth, with continued investment in our customers, people, partners and innovation. The Group reported an increase in revenue to £633.2m (FY15: £584.2m) with adjusted profit before tax of £93.0m (FY15: £85.4m) delivering a 15% increase in adjusted earnings per share to 21.8p.
This has been a good year for our UK business with strong affinity partnerships securing a solid customer base with high levels of customer service and satisfaction. During the year we completed the acquisition of Home Energy Services Limited, a directly employed heating business with 0.1m customers and over 150 directly employed engineers, providing an opportunity to increase our offering in the heating market, the most established of the home emergency services. We have invested in technology and innovation, evolving our smart thermostat offering and developing a unique water leak detector which will be launched in the UK market this year.
Our International businesses are also performing very well. France had an excellent year, with renewed sales momentum following the signing of the Lyonnaise des Eaux partnership last year. Pleasingly we also saw further growth in Spain. Our investment in New Markets continues; a detailed appraisal of opportunities in new territories is underway and we continue to progress with our digital initiatives.
There remains a hugely underpenetrated market in the USA and we have made very good progress this year to take further advantage of what is the largest opportunity for the Group. Our business development pipeline is strong with deals at all stages of discussion and we signed 11 new affinity partners over the course of the year, adding a total of 2.8m affinity partner households. At the end of the year, we signed an agreement to acquire Utility Service Partners Inc., a business with over 300 partnerships across 9.4m households. With the addition of USP, we will have 42m affinity partner households in the USA.
DividendGiven the Group’s very good performance and the Board’s confidence in its future prospects, the Board is proposing an increase in the final dividend to 8.9p per share, bringing the total ordinary dividend for the year to 12.7p (FY15: 11.5p) an increase of 10% which is 1.72x covered by the FY16 adjusted earnings per share compared to 1.65x in FY15.
Board changes I am delighted that we have appointed Chris Havemann to the Board as a Non-Executive Director. Chris has enjoyed a successful and largely entrepreneurial career and brings with him a wealth of experience in the digital space which will be of great benefit as we continue to develop the business.
PeopleOn behalf of the Board, I would like to thank all our people for their contribution to another set of very good results.
JM Barry GibsonChairman 24 May 2016
Chairman’s statement
Page Title at start:Content Section at start:Chairman’s statement

Annual Report & Accounts 2016
Strategic report
8 | HomeServe plc
This has been a very good year for the Group, delivering 9% adjusted profit growth to £93.0m and 11% customer growth to 7.0m, with over two thirds of our customers now outside the UK.
The USA is our most significant opportunity and we are particularly pleased with the recently announced agreement to acquire Utility Service Partners Inc. (USP) which will increase our US utility partner footprint to 42m households.
Our business is built on developing long-term relationships with our affinity partners. Through a membership model we offer our customers heating, plumbing and electrical repairs and services. In the UK and USA we also offer heating installation services. Our extensive repair network comprises directly employed, franchised and sub-contract networks of engineers.
The Group has five operating segments: UK, USA, France, Spain and New Markets. The New Markets division comprises our business in Italy, investment in innovation and digital initiatives and our international development activities. Prior to its disposal on 1 September 2015, New Markets also included our investment in developing a German business.
Focusing on our strategic priorities, we have made good progress across a number of areas of the business. We have added 11 new partnerships in the USA and renewed six long-term agreements in the UK such that we now work with over 90 affinity partners across the Group. We continue to invest in business development in all of our markets to establish relationships and sign new affinity partners.
Customer numbers increased 11% from 6.3m to 7.0m with good growth across all the businesses. In the UK we ended the year with 2.2m customers, up 3% on the prior year (FY15: 2.1m), principally reflecting good marketing performance combined with 0.1m customers added through the acquisition of Home Energy Services Limited. Response rates remain strong in the USA, where we have added 0.7m gross new customers and have increased year end customer numbers by 17% to 2.3m (FY15: 2.0m).
Chief Executive’s review
Richard Harpin Chief Executive
Page Title at start:Content Section at start:Chief Executive’s review

Strategic reportAnnual Report & Accounts 2016
HomeServe plc | 9
Chief Executive’s review
This has been another very good year for HomeServe with all businesses performing well.
We are particularly excited by the prospects for our US business. Profits have increased significantly whilst at the same time delivering strong customer growth. The agreement to acquire Utility Service Partners, whilst providing a significant boost to FY18 profits will increase our US affinity partner households by 9m to 42m and will, as a result, enable us to accelerate our growth.
In the UK we have a strong business, which has grown profit and customers. France had an excellent year, achieving the 1.0m customer milestone, and we saw continued customer and profit growth in Spain.
I am confident we will deliver on our expectation of further good growth in FY17, alongside continued investment in marketing, business development, international expansion and innovation initiatives.
Financial performance for the year ended 31 March
Revenue Adjusted operating profit/(loss) Adjusted operating margin£million 2016 2015 2016 2015 2016 2015
UK 291.8 285.5 58.0 56.4 20% 20%Established International USA 152.6 125.3 12.1 6.4 8% 5%France 77.4 74.9 23.2 23.4 30% 31%Spain 97.5 90.9 9.9 7.5 10% 8%
327.5 291.1 45.2 37.3 14% 13%New Markets 20.1 13.8 (5.9) (5.9) – –Inter-segment (6.2) (6.2) – – – –
Group 633.2 584.2 97.3 87.8 15% 15%
Adjusted operating margin is adjusted operating profit/(loss) divided by revenue.
Performance metrics for the year ended 31 March
Affinity partner households (m) Customer numbers (m) Policy retention rate
2016 2015 2016 2015 2016 2015
UK 24 24 2.2 2.1 82% 83%Established International USA 32 29 2.3 2.0 82% 82%France 15 15 1.0 0.9 89% 89%Spain 15 15 1.2 1.1 77% 79%
62 59 4.5 4.0 83% 84%New Markets 6 6 0.3 0.2 – –
Group 92 89 7.0 6.3 83% 83%
Affinity partner households does not include Utility Service Partners (USP) or AARP households in the USA.
Page Title at start:Content Section at start:

Annual Report & Accounts 2016
Strategic report
10 | HomeServe plc
Very pleasingly we have seen renewed sales momentum in France, following the signing of Lyonnaise des Eaux last year. We have delivered 7% customer growth, achieving the 1.0m customer milestone (FY15: 0.9m). Spain increased customer numbers by 11% to 1.2m following continued success with its largest partner Endesa (FY15: 1.1m).
This year we completed over 2m repairs (FY15: 1.8m) across the Group and once again delivered an improved customer experience, with a reduction in customer complaints and increased levels of customer satisfaction. Customer loyalty also remains strong with a Group retention rate of 83%, consistent with the prior year.
During the year we completed the acquisition of Home Energy Services Limited in the UK which, combined with our existing franchise and sub-contractor network, significantly increases our gas delivery capability in the UK. Focusing on heating services, we now offer heating installations services in the USA with investment planned in the UK to further develop our franchised heating installation network.
In addition to good customer growth, we also achieved good profit growth across the Group with a 9% increase in Group adjusted profit to £93.0m (FY15: £85.4m) and 15% adjusted EPS growth. Underpinning this growth was the USA, with adjusted operating profit up 89% to £12.1m (FY15: £6.4m) together with increases in the UK and Spain. Adjusted operating profit in France increased 7% in local currency although Sterling profit of £23.2m, was £0.2m lower than the prior year, reflecting adverse foreign exchange movements of £1.4m.
On 31 March 2016, we signed an agreement to acquire USP, which is expected to complete in the first half of FY17 following normal course regulatory approvals. USP brings 0.4m customers, 9.4m households, over 300 partnerships and a relationship with the National League of Cities, an organisation dedicated to helping city leaders and an advocate for 19,000 cities, towns and villages across the USA. We expect this acquisition to be earnings neutral in FY17 and then to add $15m of EBITDA in FY18.
We continued to invest in digital innovation, establishing a digital hub to develop an end to end, consistent, digital experience for our customers enhancing the self-serve customer journey and enabling more effective product sales.
While still early days, we have commenced appraisal of extending our services to other international markets with a view to entering the home services market in partnership with local utilities.
Chief Executive’s review continued
Page Title at start:Content Section at start:

Strategic reportAnnual Report & Accounts 2016
HomeServe plc | 11
Chief Executive’s review
Technology investment We have invested in our core customer system and other digital and technology solutions to make us more efficient and to improve our customer service. We are pleased with the progress we are making with the implementation of our new core Pega Customer Management System, which will be operational in the UK business in FY17 with rollout to the USA thereafter. This system provides a single view of the customer and all their interactions with us. This will enable more informed discussions with customers, reduce the customer effort, improve our marketing effectiveness and reduce our cost to serve.
We also now intend to invest in upgrading our claims handing and contractor deployment technology to improve the claims process for our customers giving them better visibility over the progress of their claim and their engineer.
People During the year we continued to invest in strengthening our team, appointing Chris Havemann as a new Non-Executive Director to the Board, Rafaele Petruzzo as our Chief Digital Officer to lead our digital hub investment and Giles Desforges as Chief Executive of Global Partnerships to lead our International expansion. Our total headcount now stands at over 4,800 (FY15: 4,025), a good indicator of our strong performance and growth. Our people continue to deliver great service to our customers and we are therefore delighted employee engagement is now 81%, 3 percentage points higher than last year.
DividendGiven the Group’s good performance and the Board’s confidence in its future prospects, the Board is proposing a 13% increase in the final dividend to 8.9p per share, bringing the total ordinary dividend for the year to 12.7p (FY15: 11.5p) an increase of 10% which is 1.72x covered by the FY16 adjusted earnings per share compared to 1.65x in FY15.
A special dividend of 30p per share (£99.4m) proposed in the prior year was paid to shareholders in July 2015.
OutlookAll of our businesses are performing well and have good prospects. Looking ahead, we expect Group growth to be driven primarily by our international businesses, with the UK continuing to deliver a solid performance. We are particularly excited by the prospects for our US business where profits increased significantly in FY16 whilst at the same time delivering strong customer growth. As previously announced, the acquisition of Utility Service Partners will be earnings neutral in FY17 due to increased marketing investment and integration costs however, we expect adjusted EBITDA in FY18, the first full year of ownership of USP, to be enhanced by around $15m.
The Group anticipates further good growth in FY17, alongside continued investment in marketing, business development, international expansion and innovation initiatives.
Page Title at start:Content Section at start:
Annual Report & Accounts 2016
Strategic report
12 | HomeServe plc
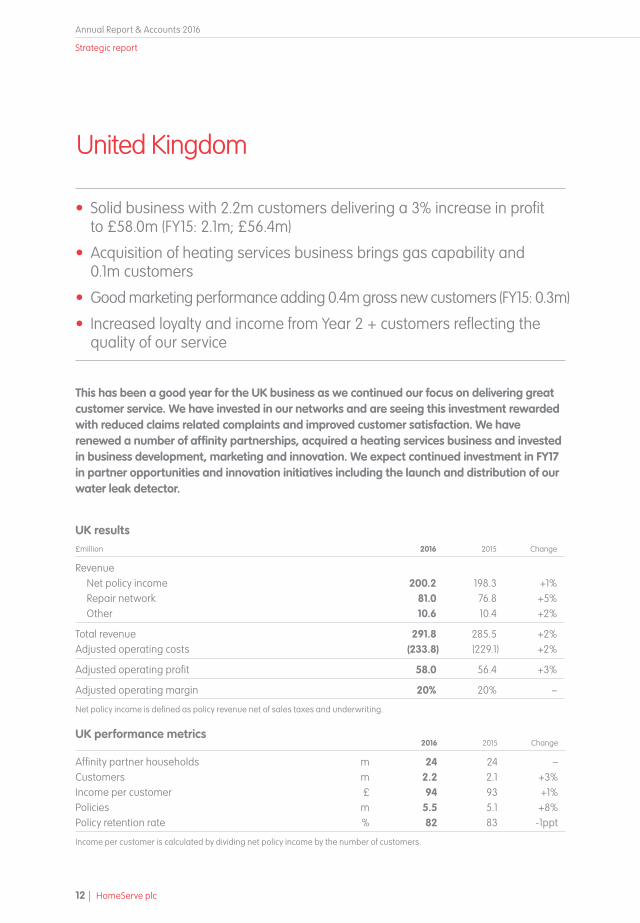
This has been a good year for the UK business as we continued our focus on delivering great customer service. We have invested in our networks and are seeing this investment rewarded with reduced claims related complaints and improved customer satisfaction. We have renewed a number of affinity partnerships, acquired a heating services business and invested in business development, marketing and innovation. We expect continued investment in FY17 in partner opportunities and innovation initiatives including the launch and distribution of our water leak detector.
UK results£million 2016 2015 Change
Revenue Net policy income 200.2 198.3 +1%Repair network 81.0 76.8 +5%Other 10.6 10.4 +2%
Total revenue 291.8 285.5 +2%Adjusted operating costs (233.8) (229.1) +2%
Adjusted operating profit 58.0 56.4 +3%
Adjusted operating margin 20% 20% –
Net policy income is defined as policy revenue net of sales taxes and underwriting.
UK performance metrics2016 2015 Change
Affinity partner households m 24 24 –Customers m 2.2 2.1 +3%Income per customer £ 94 93 +1%Policies m 5.5 5.1 +8%Policy retention rate % 82 83 -1ppt
Income per customer is calculated by dividing net policy income by the number of customers.
United Kingdom
• Solid business with 2.2m customers delivering a 3% increase in profit to £58.0m (FY15: 2.1m; £56.4m)
• Acquisition of heating services business brings gas capability and 0.1m customers
• Good marketing performance adding 0.4m gross new customers (FY15: 0.3m)
• Increased loyalty and income from Year 2 + customers reflecting the quality of our service
Page Title at start:Content Section at start:

Strategic reportAnnual Report & Accounts 2016
HomeServe plc | 13
Chief Executive’s review
Operational performance We continue to have strong relationships with our partners and we are pleased to confirm that during the year we renewed six of our utility partnerships on similar commercial terms. We proactively engage our partners in developing successful marketing campaigns, with an increasing number of new customers referred to us through our partners’ call centres. During October, we signed a five year agreement for Aviva to underwrite our home assistance products and we are also developing a home assistance offering for Aviva’s UK customers.
Customer numbers increased 3% from 2.1m to 2.2m principally reflecting a good marketing performance combined with 0.1m customers added through the acquisition of Home Energy Services Limited.
Leading with our comprehensive water product, we acquired 0.4m gross new customers (FY15: 0.3m), the majority of which were acquired through direct mail as this continues to perform well. We continue to see customers buying multiple policies through our digital channels and have also seen strong momentum in our partner channels, doubling the number of new customers acquired through this channel.
As expected, retention has reduced slightly as the number of year one customers, who typically have lower renewal rates, has increased. Importantly we continue to see strong retention rates for customers who have been with us for more than a year. In this case, the retention rate for customers in years two and beyond was 87% in FY16 (FY15: 85%). In light of the increased number of new customers in FY16, we expect the blended retention rate will reduce slightly in FY17 with year end customer numbers of around 2.2m.
During the year we acquired a gas services business, Home Energy Services Limited, for net cash outflow of £3.2m in the year. This business, based in Nottingham, combined with our existing network, significantly increases our gas delivery capability and serves as a platform for further development.
Page Title at start:Content Section at start:
Annual Report & Accounts 2016
Strategic report
14 | HomeServe plc
Delivering good customer service is central to our business and during the year we enhanced the claims experience, enabling more digital interaction, while also investing in our engineer network. We now have over 700 directly employed engineers, up from 444 last year. Our customers continue to benefit from the comprehensive levels of cover in our products and this year we completed 0.8m repairs, 0.1m more than last year. We see good levels of satisfaction, as indicated informally on Reevoo and Trust Pilot where our scores are currently 93% and 8.3 respectively (FY15: 94% and 8.2 respectively).
We invested in business development and innovation building good momentum and prospects as we enter FY17. We now have a pipeline of partner opportunities with a mix of utilities and non utilities, some with small policy books. Signing new partners along with the opportunity to acquire small policy books will be an important factor in enabling the UK business to grow further in the future. We have developed and tested a water leak detector which can identify water leaks with functionality to automatically notify the homeowner, enabling them to then book a repair with us. The product will be available through certain partnerships during FY17. We continue to evolve our smart home plans and while still small in scale, we have developed a franchised heating installation network which we expect to extend in FY17.
Financial performance Revenue in the year was 2% higher than the prior year at £291.8m (FY15: £285.5m) principally reflecting a small increase in policy income, the acquisition of Home Energy Serves Limited and repair network revenue.
Revenue in the UK business is analysed as policy income of £200.2m (FY15: £198.3m), which included post acquisition income from Home Energy Services Limited (£4.2m), repair network revenue of £81.0m (FY15: £76.8m) and other income of £10.6m (FY15: £10.4m). Other income relates to revenue in respect of pay on use repairs, third party claims handling services and transactions with other Group companies.
The increase in repair network revenue again reflects the increase in the number of repair jobs completed in the year.
Income per customer was £94 (FY15: £93) with a £7 increase in income from our Year 2+ customers to £125 (FY15: £118) reflecting price initiatives and increasing levels of cover taken by customers, which was, in part offset by the higher proportion of new customers who typically join on an introductory offer. Going forward, we expect net income per customer to increase as we see the benefits of more targeted customer engagement following implementation of the new Pega Customer Management System.
Adjusted operating costs were £233.8m (FY15: £229.1m), 2% higher than prior year, with indirect cost savings more than offset by an increase in direct costs due to higher volumes of activity and post acquisition costs from Home Energy Services Limited. Adjusted operating profit was £58.0m, 3% higher than the prior year (FY15: £56.4m) resulting in a sustainable 20% profit margin.
United Kingdom continued
Page Title at start:Content Section at start:
Strategic reportAnnual Report & Accounts 2016
HomeServe plc | 15
Chief Executive’s review
Our business continues to grow strongly, and with a solid foundation of almost 70 partners and 2.3m customers, the business has made a step change in its expansion, with the agreement to acquire USP, a business with over 300 partnerships and 0.4m customers.
Operational performanceThe USA remains our most significant opportunity with 128m households of which we now have affinity partner relationships that provide services to 32m. On 31 March 2016, we entered into an agreement to acquire USP, a leading provider of home assistance policies, which once completed will increase our footprint by a further 9.4m households.
During the year we signed 11 new utility affinity partnerships and extended our relationship with certain current partners, adding a total of 2.8m utility households. Our pipeline of potential partnerships is strong, with negotiations at all stages of the process.
The agreement with USP marks a step change in the expansion of the business in the USA. USP employs a similar business model to us, having partnerships with around 300 water municipals and a small number of utility companies. USP is the exclusive home warranty partner of the National League of Cities, an organisation dedicated to helping city leaders and an advocate for 19,000 cities, towns and villages across the USA. USP has 0.4m customers and 0.6m policies. This acquisition will bring significant opportunity to increase penetration of the existing 9.4m USP partner households and provide customers with a broader range of home assistance products. Combining USP with our business, we will offer our products to 42m households through an affinity brand and serve over 2.7m customers. The acquisition is expected to complete in the first half of FY17, following ordinary course regulatory approvals.
United States of America
• Significant profit growth, up 81% to $17.5m (FY15: $9.7m)
• Customer numbers up 17% to 2.3m reflecting strength of marketing and customer loyalty (FY15: 2.0m)
• Strong partner pipeline with 2.8m households added in the year
• Agreement to acquire Utility Service Partners Inc. (USP) increasing footprint by 9.4m households
Page Title at start:Content Section at start:

Annual Report & Accounts 2016
Strategic report
16 | HomeServe plc
During FY15 we signed an affinity partnership with AARP, a membership organisation providing services to over 22m households in the USA. Having now established our relationship with AARP, we are growing the number of customers and expect that it will become one of our largest partners in the USA.
Customer numbers increased 17% to 2.3m (FY15: 2.0m) with 0.7m gross new customers added in the year (FY15: 0.7m). Direct mail continues to be the most significant channel but we have also seen an increase in new customers acquired through our partner and digital channels. Our response rates and payback periods have continued to be attractive and in line with our expectations.
A focus on customer service combined with a number of operational improvements to our retention processes, has ensured we continue to maintain our high level of retention at 82% (FY15: 82%). Moreover, this is despite the continued increase in new customers, who typically have a lower year one retention rate.
Our network of 152 directly employed technicians and almost 1,000 sub-contractors completed 0.4m jobs with an increasing number of water heater installations (FY15 jobs: 0.3m).
United States of America continued
Page Title at start:Content Section at start:

Strategic reportAnnual Report & Accounts 2016
HomeServe plc | 17
Chief Executive’s review
Financial performance Revenue was up 14% to $228.4m (FY15: $199.8m) due to higher renewal income and marketing activity. Income per customer was $91 (FY15: $94) principally reflecting the number of new customers who join with just one product, the mix of products and an increasing repair cost as we expand product coverage. Excluding the impact of USP, we expect income per customer to be broadly stable in FY17.
Adjusted operating costs in the USA were $210.9m, up 11% on prior year (FY15: $190.1m) principally reflecting the increase in customer numbers, partner commissions and continued investment in business development and marketing. Adjusted operating profit increased 81% to $17.5m (FY15: $9.7m) while the adjusted operating profit margin increased 3 percentage points to 8% from 5% in the prior year. We are confident that, in the longer-term, adjusted operating margin will be around 20%, similar to that achieved in the UK.
USA results$million 2016 2015 Change
Total revenue 228.4 199.8 +14%Adjusted operating costs (210.9) (190.1) +11%
Adjusted operating profit 17.5 9.7 +81%
Adjusted operating margin 8% 5% +3ppts
USA results£million 2016 2015 Change
Total revenue 152.6 125.3 +22%Adjusted operating costs (140.5) (118.9) +18%
Adjusted operating profit 12.1 6.4 +89%
Adjusted operating margin 8% 5% +3ppts
USA performance metrics2016 2015 Change
Affinity partner households m 32 29 +14%Customers m 2.3 2.0 +17%Income per customer $ 91 94 -2%Policies m 3.5 3.0 +17%Policy retention rate % 82 82 –
Affinity partner households does not include Utility Service Partners (USP) or AARP households.
Page Title at start:Content Section at start:

Annual Report & Accounts 2016
Strategic report
18 | HomeServe plc
This has been an excellent year for our French business which has recently rebranded to HomeServe France (formerly Doméo). The partnership with Lyonnaise des Eaux (LDE) has provided fresh sales momentum with resulting strong growth in customer numbers. The business now has a dedicated business development team and is building a pipeline of affinity partner prospects.
Operational performance We continue to have a strong relationship with Veolia, the leading water provider in France, and have introduced call transfers from their call centres to assist with new customer acquisition activity.
Our partnership with LDE, which was signed at the end of FY15, gained momentum in the first full year of working together. LDE offers our products in its call centres and has achieved good results, with around a third of the gross new customers acquired in the current year being under the LDE brand.
With renewed sales momentum across the business, customer numbers were up 7% and we passed the 1.0m milestone, having added 0.2m gross new customers in the year (FY15: 0.1m). Direct mail continues to be an important channel and is performing as we anticipated. However, sales through our partners’ sales channels have developed well and following the launch of the new partnership with LDE, we have seen a particular increase in this channel in the year. Customer loyalty remains high with a retention rate of 89% (FY15: 89%).
All of our repairs in France are managed through our network of around 700 sub-contractors (FY15: 700), who broadly completed the same number of repairs as the prior year.
France
• Renewed sales momentum following Lyonnaise des Eaux partnership
• Strong customer growth, up 7% to 1.0m (FY15: 0.9m)
• Good profit growth, up 7% to €31.4m (FY15: €29.5m)
Page Title at start:Content Section at start:

Strategic reportAnnual Report & Accounts 2016
HomeServe plc | 19
Chief Executive’s review
Financial performance Revenue was up 9% to €105.0m (FY15: €96.1m) due to continued strong renewals and the strength of sales through the LDE affinity partnership. Adjusted operating costs increased by 11% to €73.6m principally reflecting increased investment in marketing, business development, partner commissions and relocation costs associated with the move from two sites to one purpose built facility in Lyon.
Despite this increased investment, adjusted operating profit was €31.4m, 7% higher than the prior year, principally due to the benefit of higher customer numbers and our pricing strategy. Adjusted operating profit margin remained high at 30% (FY15: 31%).
In line with the prior year, income per customer was €101 (FY15: €101) reflecting the current maturity of the customer base, although this may reduce slightly in the future as the proportion of new customers increases, given they typically initially only hold one policy.
In accordance with Group policy, where a partner originates customers on our behalf, the cost of acquisition is capitalised, held as an intangible asset and amortised as an operating expense. During FY16, we paid €4.2m (FY15: €nil) in respect of customers acquired by LDE, the associated amortisation during the year was €0.4m (FY15: €nil).
France results€million 2016 2015 Change
Total revenue 105.0 96.1 +9%Adjusted operating costs (73.6) (66.6) +11%
Adjusted operating profit 31.4 29.5 +7%
Adjusted operating margin 30% 31% -1ppts
France results£million 2016 2015 Change
Total revenue 77.4 74.9 +3%Adjusted operating costs (54.2) (51.5) +5%
Adjusted operating profit 23.2 23.4 -1%
Adjusted operating margin 30% 31% -1ppts
France performance metrics2016 2015 Change
Affinity partner households m 15 15 –Customers m 1.0 0.9 +7%Income per customer € 101 101 –Policies m 2.3 2.3 +3%Policy retention rate % 89 89 –
Page Title at start:Content Section at start:

Annual Report & Accounts 2016
Strategic report
20 | HomeServe plc
The Spanish business has delivered good customer and strong profit progression principally reflecting the growth of the Membership business.
Operational performance Endesa, our largest partner in Spain, has continued to offer our products through its sales channels and we are pleased that we have also agreed terms for our FY17 marketing campaigns. We have an active business development pipeline and are in discussions with other potential partners.
Customer numbers increased 11% to 1.2m at the end of March 2016. The majority of new customers were acquired through Endesa’s sales channels where customers are offered an electrical assistance product on an introductory offer, typically at a discount of 50%, with renewals at the full price of €69 in the second year.
Retention in the year was 77%, marginally lower than the prior year (FY15: 79%), reflecting the high proportion of customers in the first renewal cycle, where retention rates are lower than more mature customers.
Our claims handling business in Spain continues to perform well. In line with the prior year the business completed 0.7m jobs (FY15: 0.7m). Our network comprises around 2,000 sub-contractors and 174 Reparalia franchised engineers.
Financial performanceRevenue increased by 15% to €132.8m (FY15: €115.9m) driven by a 37% increase in Membership revenue to €50.4m (FY15: €36.9m) and a 4% increase in revenue in the Claims business to €82.4m (FY15: €79.0m). The increase in the Membership business reflects a higher number of customers renewing on full price products, while the Claims business benefited from a small increase in job volumes.
Income per customer increased by €7 to €41 (FY15: €34), again reflecting the higher mix of renewing customers in part offset by new customers who joined on the introductory offer.
Spain
• Strong profit growth, up 46% to €13.9m (FY15: €9.5m)
• Customer numbers up 11% from 1.1m to 1.2m
• Continued strong partnership with Endesa
Page Title at start:Content Section at start:

Strategic reportAnnual Report & Accounts 2016
HomeServe plc | 21
Chief Executive’s review
The increase in operating costs principally related to higher customer numbers in the Membership business and slightly higher volumes in the Claims business.
Adjusted operating profit increased €4.4m to €13.9m (FY15: €9.5m), reflecting higher revenue in the Membership business, partially offset by the expected increase in amortisation in the period. Spain reported an adjusted operating margin of 10%, two percentage points higher than the prior year, reflecting the increase in Membership profits.
In accordance with Group policy, where a partner originates customers on our behalf, the cost of acquisition is capitalised, held as an intangible asset and amortised as an operating expense. During FY16, we paid €20.2m (FY15: €20.3m) in respect of customers acquired by Endesa and as at 31 March 2016, the intangible asset amounted to €42.1m (FY15: €35.9m). Amortisation in FY16 was €9.9m, €2.4m higher than the prior year (FY15: €7.5m).
Spain results€million 2016 2015 Change
Revenue Membership 50.4 36.9 +37%Claims handling 82.4 79.0 +4%
Total revenue 132.8 115.9 +15%Adjusted operating costs (118.9) (106.4) +12%
Adjusted operating profit 13.9 9.5 +46%
Adjusted operating margin 10% 8% +2ppts
Spain results£million 2016 2015 Change
Revenue Membership 37.1 28.9 +28%Claims handling 60.4 62.0 -3%
Total revenue 97.5 90.9 +7%Adjusted operating costs (87.6) (83.4) +5%
Adjusted operating profit 9.9 7.5 +33%
Adjusted operating margin 10% 8% +2ppts
Spain performance metrics2016 2015 Change
Affinity partner households m 15 15 –Customers m 1.2 1.1 +11%Income per customer € 41 34 +22%Policies m 1.4 1.3 +10%Policy retention rate % 77 79 -2ppts
Page Title at start:Content Section at start:

Annual Report & Accounts 2016
Strategic report
22 | HomeServe plc
Our New Markets segment consists of our investment in new territories, digital and innovation initiatives. During the year we successfully exited our German business with no material loss on the sale.
In Italy, we have 0.3m customers through our test agreement with Enel (FY15: 0.2m) and we have commenced the testing of alternative products and channels with other potential partners. Key to establishing a sustainable business in Italy is the signing of a long-term agreement with a leading utility.
We have established a digital hub to develop an end to end, consistent, user friendly digital experience for our customers. A new Chief Digital Officer has been appointed to lead this activity and to enhance self-serve functionality at all stages of the customer journey and enable more effective product sales. We have committed to provide £2m seed funding to a digital start-up called DAD. DAD connects consumers to DIY experts to help fix home repairs.
We have also commenced the appraisal of extending our services to other international markets with a view to entering the home services market in partnership with local utilities, similar to the initial successful joint ventures with South Staffordshire Water in the UK and Veolia in France. While still early days, we have identified a number of attractive markets where, through our current affinity partnerships, we believe we can partner with local utilities.
Financial performance Our New Markets businesses reported revenue of £20.1m (FY15: £13.8m) reflecting the higher number of customers in Italy. Our investment in New Markets resulted in a loss of £5.9m (FY15: £5.9m) and we would expect a similar level of investment in FY17.
Richard HarpinChief Executive 24 May 2016
New markets – including digital innovation
• 0.3m customers in Italy
• Investment in digital technology
• Intention to expand to further international territories
Page Title at start:Content Section at start:

Strategic reportAnnual Report & Accounts 2016
HomeServe plc | 23
Financial review
These financial results have been prepared in accordance with International Financial Reporting Standards (IFRS).
Group statutory resultsThe headline statutory financial results for the Group are presented below.£million 2016 2015
Total revenue 633.2 584.2 Operating profit 86.9 79.1 Net finance costs (4.3) (2.4)
Adjusted profit before tax 93.0 85.4 Exceptional items – 1.7 Amortisation of acquisition intangibles (10.4) (10.4)
Statutory profit before tax 82.6 76.7 Tax (21.0) (20.6)
Profit for the year, being attributable to equity holders of the parent 61.6 56.1
Statutory profit before tax was £82.6m, £5.9m higher than FY15 (FY15: £76.7m). Statutory profit before tax is reported after the amortisation of acquisition intangibles and exceptional items as detailed below.
Amortisation of acquisition intangiblesThe amortisation of acquisition intangibles of £10.4m (FY15: £10.4m) principally relates to customer and other contracts, held by businesses, which were acquired as part of business combinations.
Exceptional itemsIn the prior year, exceptional items amounted to a net income of £1.7m, of which £2.9m related to the reimbursement of certain costs by our insurers associated with historical UK matters and £1.7m related to the release of surplus provisions. These were partially offset by the cost of a transaction the Group decided not to pursue.
Financial review
Johnathan Ford Chief Financial Officer
Page Title at start:Content Section at start:Financial review
Annual Report & Accounts 2016
Strategic report
24 | HomeServe plc
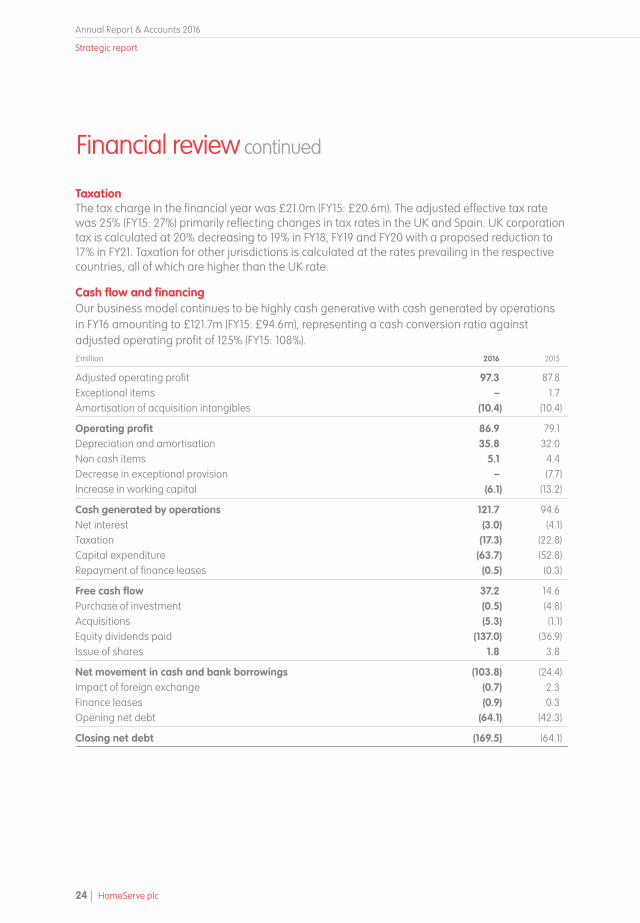
Taxation The tax charge in the financial year was £21.0m (FY15: £20.6m). The adjusted effective tax rate was 25% (FY15: 27%) primarily reflecting changes in tax rates in the UK and Spain. UK corporation tax is calculated at 20% decreasing to 19% in FY18, FY19 and FY20 with a proposed reduction to 17% in FY21. Taxation for other jurisdictions is calculated at the rates prevailing in the respective countries, all of which are higher than the UK rate.
Cash flow and financingOur business model continues to be highly cash generative with cash generated by operations in FY16 amounting to £121.7m (FY15: £94.6m), representing a cash conversion ratio against adjusted operating profit of 125% (FY15: 108%).£million 2016 2015
Adjusted operating profit 97.3 87.8 Exceptional items – 1.7 Amortisation of acquisition intangibles (10.4) (10.4)
Operating profit 86.9 79.1 Depreciation and amortisation 35.8 32.0 Non cash items 5.1 4.4 Decrease in exceptional provision – (7.7)Increase in working capital (6.1) (13.2)
Cash generated by operations 121.7 94.6 Net interest (3.0) (4.1)Taxation (17.3) (22.8)Capital expenditure (63.7) (52.8)Repayment of finance leases (0.5) (0.3)
Free cash flow 37.2 14.6 Purchase of investment (0.5) (4.8)Acquisitions (5.3) (1.1)Equity dividends paid (137.0) (36.9)Issue of shares 1.8 3.8
Net movement in cash and bank borrowings (103.8) (24.4)Impact of foreign exchange (0.7) 2.3 Finance leases (0.9) 0.3 Opening net debt (64.1) (42.3)
Closing net debt (169.5) (64.1)
Financial review continued
Page Title at start:Content Section at start:

Strategic reportAnnual Report & Accounts 2016
HomeServe plc | 25
Financial review
Working capital increased by £6.1m in FY16 reflecting continued growth, particularly in the USA and Spain. As the business grows, we expect further working capital absorption, though we do anticipate the cash conversion ratio to continue to be in excess of 100%. In the prior year, the exceptional provision related to historical UK matters.
During the year we invested capital expenditure of £63.7m (FY15: £52.8m) which was £6.3m lower than planned due to the timing of certain technology investment, which we now expect to incur in FY17. Expenditure during FY16 included payments of £17.9m (FY15: £16.1m) in respect of the acquisition of customers that Endesa and LDE originated, payments to US partners and investment in the replacement of our core customer system, together with normal investment, principally technology related, across the businesses.
We expect to maintain a higher than usual level of capital expenditure for the next two years, as we continue to invest in our core customer system and invest further in digital and technology solutions to make us more efficient and improve our customer service. We also now plan to upgrade our claims handling and contractor deployment technology to improve the claims process for our customers giving them better visibility over the progress of their claim and their engineer. As a result in FY17 we expect total capital expenditure to be around £55m made up of £35m in systems and technology and £20m in respect of partner payments in Spain, France and the USA. Total capital expenditure is expected to decrease to around £30m in FY18 before normalising at £25m from FY19.
AcquisitionsThe acquisition investment of £5.3m principally related to the purchase of Home Energy Services Limited, a heating services business in the UK (£3.2m), £1.1m deferred consideration in respect of acquisitions completed in prior periods (FY15: £1.1m) and £1.0m paid in relation to the acquisition of a small policy book in the USA.
On 31 March 2016 we agreed to acquire Utility Service Partners Inc. (USP) for a consideration of $75m which will be funded from existing facilities on completion of the transaction, which is anticipated in the first half of FY17, following ordinary course regulatory approvals.
Earnings per shareAdjusted earnings per share for the year increased 15% from 19.0p to 21.8p. The weighted average number of shares decreased from 326.7m to 313.9m due to the impact of the share consolidation. On a statutory basis, earnings per share increased from 17.2p to 19.6p.
Page Title at start:Content Section at start:

Annual Report & Accounts 2016
Strategic report
26 | HomeServe plc
DividendGiven the Group’s good performance and the Board’s confidence in its future prospects, the Board is proposing to increase the final dividend to 8.9p per share (FY15: 7.87p) to be paid on 1 August 2016 to shareholders on the register on 8 July 2016.
Together with the interim dividend declared in November 2015 of 3.8p (November 2014: 3.63p), this represents a 10% increase in the dividend payment of 12.7p (FY15: 11.5p) which is 1.72x covered by the FY16 adjusted earnings per share compared to 1.65x cover in FY15. As previously indicated, the Board intends to adopt a progressive dividend policy and expects to target a dividend cover in the range 1.75x - 2x over the medium term.
In July 2015, a special dividend of £99.4m was paid to shareholders, which was followed by a share consolidation.
Net debt and finance costsThe Group targets net debt in the range of 1.0-1.5x adjusted EBITDA, measured at 31 March each year. With net debt of £169.5m and adjusted EBITDA of £122.7m the Group was within this range at 1.4x. As previously stated, we will be prepared to see leverage outside that range for reasonable periods of time if circumstances warrant that, and the range itself will be subject to periodic review.
During October 2015 the Group secured £50m medium-term funding in the form of a Private Placement due for repayment in 2022.
The Group’s net interest paid was £3.0m with an interest accrual of £0.9m as at 31 March 2016, which was subsequently paid in April 2016. Cash finance costs in the prior year were £4.1m and included the arrangement fees payable in respect of the Group’s £300m revolving credit facility that was signed in July 2014.
Foreign exchange impact The impact of changes in the € and $ exchange rates between FY15 and FY16 has resulted in the reported revenue of our international businesses decreasing by £2.9m and adjusted operating profit decreasing by £2.2m.
The impact of foreign exchange rate movements on the individual businesses is summarised in the table below.
Effect on (£m)
Average exchange rate
ChangeRevenue
2016
Adjusted operating
profit20162016 2015
USA $ 1.51 1.61 -7% 9.5 0.6France € 1.37 1.27 +7% (4.5) (1.4)Spain € 1.37 1.27 +7% (6.7) (1.2)New Markets € 1.37 1.27 +7% (1.2) (0.2)
Total International (2.9) (2.2)
Financial review continued
Page Title at start:Content Section at start:

Strategic reportAnnual Report & Accounts 2016
HomeServe plc | 27
Financial review
Statutory and pro-forma reconciliationsThe Group believes that adjusted EBITDA, adjusted operating profit, adjusted profit before tax and adjusted earnings per share, all of which excludes the amortisation of acquisition intangibles and exceptional items are important performance indicators for monitoring the business.
This report uses a number of adjusted measures to highlight the Group’s results excluding the above amounts. The table below provides a reconciliation between the statutory and adjusted items.£million 2016 2015
Operating profit (statutory) 86.9 79.1 Depreciation 5.4 4.6 Amortisation 20.0 17.0 Amortisation of acquisition intangibles 10.4 10.4 Exceptional items – (1.7)
Adjusted EBITDA 122.7 109.4
Operating profit (statutory) 86.9 79.1 Amortisation of acquisition intangibles 10.4 10.4 Exceptional items – (1.7)
Adjusted operating profit 97.3 87.8
Profit before tax (statutory) 82.6 76.7 Amortisation of acquisition intangibles 10.4 10.4 Exceptional items – (1.7)
Adjusted profit before tax 93.0 85.4
Pence per share 2016 2015
Earnings per share (statutory) 19.6 17.2 Amortisation of acquisition intangibles 2.2 2.1 Exceptional items – (0.3)
Adjusted earnings per share 21.8 19.0
Page Title at start:Content Section at start:

Annual Report & Accounts 2016
Strategic report
28 | HomeServe plc
HomeServe has a risk management framework which provides a structured and consistent process for identifying, assessing and responding to risks. These risks are assessed in relation to the Group’s strategy, business performance and financial condition and a formal risk mitigation plan is agreed with clear ownership and accountability. Risk management operates at all levels throughout the Group, across geographies and business lines.
Risks to HomeServe’s business are either specific to HomeServe’s business model, such as affinity partner relationships and underwriting, or more general, such as the impact of competition and regulatory compliance.
The table below sets out what the Board believes to be the principal risks and uncertainties facing the Group, the mitigating actions for each, and an update on any change in the profile of each risk during the past year. These should be read in conjunction with the Strategic Report. Additional risks and uncertainties of which we are not currently aware or which we currently believe are not significant may also adversely affect our strategy, business performance or financial condition in the future.
The Board believes that all identified risks carry equal importance and weighting as in the prior year with updates to the nature of those risks detailed below.
Risk Description / Impact Mitigation Change since 2015 Annual Report
Commercial relationshipsUnderpinning the success in our chosen markets are close commercial relationships (affinity partner relationships) principally with utility companies and financial institutions. The loss of one of these relationships could impact our future customer and policy growth plans and retention rates.
While the majority of these partnerships are secured under long-term contracts, which increase the security of these relationships over the medium-term, they can be terminated in certain circumstances.
We have regular contact and reviews with the senior management of our affinity partners to ensure that we respond to their needs and deliver the service that they expect.
Across the Group, we are not dependent on any one single partnership which mitigates, in part, the impact of losing any single relationship.
While remaining a principal risk, we have continued to sign and renew affinity partnerships with utilities across the businesses.
In the UK, we have renewed the six utility partner agreements that were due to renew during the year and this has been achieved on substantially similar terms.
In France, we now work with the two largest water utilities under long-term marketing agreements and continue to discuss further opportunities with additional partners across a number of channels.
In the USA, we signed new agreements with 11 utilities during the year and also signed an agreement to acquire Utility Service Partners Inc, which brings with it around 300 partners and a proven track record of signing multiple partners every year.
In Spain, we continue to work closely with Endesa and our water partners and in Italy we continue to work with Enel as well as signing additional test agreements with other utilities.
Principal risks and uncertainties
Page Title at start:Content Section at start:Principal risks and uncertainties

Strategic reportAnnual Report & Accounts 2016
HomeServe plc | 29
Principal risks and uncertainties
Risk Description / Impact Mitigation Change since 2015 Annual Report
CompetitionThere are a number of businesses that provide services that are similar to those of the Group and could therefore compete in one or more of our chosen markets. Increased competition could affect our ability to meet our expectations and objectives for the business in terms of the number of customers, policies or the financial returns achieved.
The market and the activities of other participants are regularly reviewed to ensure that the strategies and offerings of current and potential competitors are fully understood. Both qualitative and quantitative research is undertaken to ensure that our products and services continue to meet the needs of our customers whilst retaining a competitive position in the market.
We believe we have a compelling proposition for customers, providing them with real value thereby helping reduce the impact of increased competition.
There has been no significant change in the competitive landscape in any of the countries in which we operate.
In the USA we participate in RFP’s (“requests for proposal”) that are issued by utilities when they seek to start a programme. While we see some other parties participating in these tenders, we win the majority and we believe that, overall, the RFP process is positive for our business as it demonstrates an increased awareness of our products and services in the US market.
Customer loyalty / retentionA key element of our business model is customer loyalty. Any reduction in the proportion of customers renewing their policies could significantly impact our revenues.
Policy retention rate is one of our Key Performance Indicators. Any significant movement is therefore carefully investigated to assess the change in customer behaviour and to implement corrective action where possible.
We have a wide range of tools available to manage retention rates, including specific retention propositions.
There are dedicated retention teams, trained and experienced in talking to those customers who are considering not renewing their policy.
We regularly review our products ensuring they provide the coverage that our customers demand and need. We also regularly review the methods by which we interact with our customers ensuring their needs are met and providing them with updated tools to purchase, renew and review their policy holdings for example through our latest digital initiatives.
Retention remains high in all our countries.
In the UK, the rate has decreased by 1 percentage point to 82% compared to the prior year, principally due to the higher number of customers in their first renewal cycle. Looking at those in their second and subsequent cycle, this has increased to 87%, reflecting the quality of the products, sales channels, service delivery and pricing strategies adopted.
In the USA, the retention rate has been maintained at 82%, the same as the prior year.
In France, we have maintained a retention rate of 89%.
In Spain, retention decreased by 2 percentage points to 77%, driven in large part by the number of customers in their first renewal cycle.
Page Title at start:Content Section at start:

Annual Report & Accounts 2016
Strategic report
30 | HomeServe plc
Risk Description / Impact Mitigation Change since 2015 Annual Report
Marketing effectiveness A significant reduction in the response rates on our marketing could have a significant impact on customer and policy numbers.
The performance of each marketing campaign and channel is regularly reviewed, with any significant deviation to the expected response rate quickly identified and remedial action taken for subsequent campaigns. We record and review a number of telephone calls across all of our businesses.
During the year our marketing channels performed as we expected with direct mail response rates continuing to perform well.
We continue to develop our digital channels and work with our partners to offer our products in their call centres. Development of these two channels is serving to reduce our reliance on direct mail activity.
Exposure to legislation or regulatory requirementsWe are subject to a broad spectrum of regulatory requirements in each of the markets in which we operate, particularly relating to product design, marketing materials, sales processes and data protection.
Failure to comply with the regulatory requirements in any of our countries could result in us having to suspend, either temporarily or permanently, certain activities.
In addition, legislative changes related to our partners may change their obligations with regard to the infrastructure they currently manage and hence the products and services we can offer to customers.
It is possible such legislative changes could reduce, or even remove, the need for some of our products and services.
We have regulatory specialists, compliance teams and Non-Executive Directors in each of our businesses to help ensure that all aspects of the legislative regime in each territory are fully understood and adopted as required.
Specifically in the UK, we maintain regular dialogue with the FCA, while in the USA we have regular dialogue with the Attorneys General. In our other businesses we maintain a dialogue with local regulators.
We keep up to date with changes in government and regulatory policy, which ensures that our products and services are designed, marketed and sold in accordance with all relevant legal and regulatory requirements and that their terms and conditions remain appropriate and meet the needs of customers.
All of our businesses have dedicated experienced compliance specialists and during the year we have appointed independent Non-Executive Directors to chair the compliance committees in each of our businesses, with regular reporting back to the local company Board of Directors.
We have maintained appropriate dialogue with all relevant regulatory bodies that govern or influence our businesses and have sought to engage, where possible, in regulatory and compliance discussions around the development of the markets in which we operate.
Quality of customer serviceOur reputation is heavily dependent on the quality of our customer service.
Any failure to meet our service standards or negative media coverage of poor service could have a detrimental impact on customer and policy numbers.
We monitor customer service standards at a number of different customer contact points in each of our operations using both internal data and an independent third party.
The results of these are reviewed on a regular basis and action plans produced to address the key issues.
Processes have been established to ensure that all directly employed engineers and sub-contractors meet minimum standards. These include criminal record checks and minimum qualification requirements.
In FY16 we have continued to monitor customer satisfaction across all our operations at a number of different customer contact points, with improvements seen in all of the businesses, the details of which have been reported in the Strategic Report.
Reflecting the importance of customer service to our business, all senior managers have customer service performance as a significant component of their annual bonus opportunity.
Principal risks and uncertainties continued
Page Title at start:Content Section at start:

Strategic reportAnnual Report & Accounts 2016
HomeServe plc | 31
Principal risks and uncertainties
Risk Description / Impact Mitigation Change since 2015 Annual Report
Availability of underwritersThe policies that we market and administer with customers are each individually underwritten by third party underwriters, independent of HomeServe.
We act as an insurance intermediary and do not take on any material insurance risk.
If these underwriters were unable or unwilling to underwrite these risks and we were unable to find alternative underwriters it would require us to insure these risks directly, thereby exposing the business to material insurance risk, which is contrary to our preferred operating model. In addition, it would take time to obtain the relevant regulatory approvals.
We use a number of underwriters, with the main provider in the UK being separate to those in the rest of Europe and the USA.
We have regular contact and reviews with the senior management of the underwriters to ensure that claims frequencies, repair costs and service standards are in line with their expectations.
The principal underwriters are subject to medium-term agreements, with the rates subject to regular review.
In addition, we maintain relationships with a number of underwriters who are willing and able to underwrite our business and regularly review the market to ensure we understand current market conditions, how these apply to our policies and how we can mitigate the loss of an existing underwriter.
We continue to review our underwriting relationships on a regular basis to ensure they provide the best returns for customers and shareholders.
During FY16, we reached agreement with Aviva to become our principal underwriter in the UK, and they commenced underwriting new business in November 2015.
We have continued to develop our relationships with other providers with the aim of having at least two underwriters willing and able to underwrite policies for each of our businesses.
Dependence on recruitment and retention of skilled personnel Our ability to meet growth expectations and compete effectively is, in part, dependent on the skills, experience and performance of our personnel. The inability to attract, motivate or retain key talent could impact on our overall business performance.
Our employment policies, remuneration and benefits packages, and long-term incentives are regularly reviewed and designed to be competitive with other companies.
Employee surveys, performance reviews and regular communication of business activities are just some of the methods used to understand and respond to employees’ views and needs.
Processes are in place to identify high performing individuals and to ensure that they have fulfilling careers, and we are managing succession planning effectively.
We have continued to strengthen our management teams across all our operations – particularly in the areas of IT, digital, compliance and commercial.
During the year, we have embedded a People Charter in the UK and USA and the values of these charters are now an integral part of our recruitment, selection and development procedures.
People Charter have also now been launched in France and Spain to follow in FY17.
Page Title at start:Content Section at start:

Annual Report & Accounts 2016
Strategic report
32 | HomeServe plc
Risk Description / Impact Mitigation Change since 2015 Annual Report
Exposure to country and regional riskIn line with other businesses we are subject to economic, political and other risks associated with operating in overseas territories.
A variety of factors, including changes in a specific country’s political, economic or regulatory requirements, as well as the potential for geographical turmoil including terrorism and war, could result in the loss of service.
The criteria for entering a new country include a full assessment of the stability of its economic and political situation, together with a review of the manner and way in which business is conducted.
When entering a new country, we generally do so on a small scale test basis. This low risk entry strategy minimises the likelihood of any significant loss.
We have recently recommenced reviewing potential new territories and have appointed a dedicated person with significant experience of working in an international environment to lead this activity.
We continue to monitor the economic, political and regulatory environments where we operate.
During the year we ceased our activity in Germany.
Our IT systems become a constraint to growth and drive inefficiency instead of efficiency improvementsThe Group’s core IT system is used in each of our businesses. The system is now around 20 years old and has had a number of ‘in house’ developments. The system is dependent on internal development resource and knowledge.
The Group reviews its systems and processes on a regular basis. As part of these reviews it looks at the future plans of each of the businesses in terms of customer and policy growth, product and process design and development requirements and the potential impact on IT systems.
All system developments and enhancements undergo a rigorous financial review and the proposed benefits are monitored and subject to post implementation reviews.
Our IT developments are subject to a prioritisation process which takes into account the availability of both internal and external resource and the proposed benefits of the project.
We are replacing our core customer IT system, the development of which has progressed well and is expected to ‘go-live’ in the UK during FY17, at which point we intend to commence the roll out to our business in the USA.
We have continued to invest in other new technologies that will allow us to improve the products and service we offer our customers. These have included an innovative leak detection device, further investment in a connected smart thermostat and initial funding of an ‘app’ based home assistance service.
Information security In line with other businesses, we are subject to the increased prevalence and sophistication of cyber attacks, which could result in unauthorised access to customer and other data that we hold, or cause business disruption to our services. This could result in a loss of customers, legal liability, regulatory action or harm to our reputation.
We have a number of defensive and proactive practices across the Group to mitigate the risk.
We have a detailed information security policy which is communicated across the Group and training provided as required.
We continue to invest in IT security ensuring a secure configuration, access controls and data centre security.
During the year we have undertaken a detailed review of our information policy, practices and procedures, engaging a third party specialist to lead a Group review. We have dedicated internal resource undertaking regular reviews at all of our businesses and specific cyber assurance capability at Group with cyber forming part of our annual assurance plan. We continue to invest in IT security and have layers of protection across our technology infrastructure.
Principal risks and uncertainties continued
Page Title at start:Content Section at start:

Strategic reportAnnual Report & Accounts 2016
HomeServe plc | 33
Principal risks and uncertainties
Risk Description / Impact Mitigation Change since 2015 Annual Report
Financial strategy and treasury riskThe main financial risks are the availability of short-term and long-term funding to meet business needs, the risk of policyholders not paying monies owed, and fluctuations in interest rates and exchange rates.
Interest rate riskOur policy is to manage our interest cost using a mix of fixed and variable rate debts. Where necessary, this is achieved by entering into interest rate swaps for certain periods, in which we agree to exchange, at specified intervals, the difference between fixed and variable rate interest amounts calculated by reference to an agreed notional principal amount. These swaps are designated to hedge underlying debt obligations.
During the year we have secured £50m of fixed rate medium term funding, repayable in 2022, and have continued to build relationships with a number of financial institutions that wish to provide debt finance to the Group.
Following the special dividend in the year and the increase in the Group’s leverage we have continued to monitor the need to fix the interest rate on some element of our borrowings. However, given the relatively stable interest rate environment, combined with the fixed rate debt secured during the year, we have not entered into any interest rate swaps during FY16.
Credit riskThe risk associated with cash and cash equivalents is managed by only depositing funds with reputable and creditworthy banking institutions.
The risk of a policyholder defaulting is mitigated as any policy cover will cease as and when any premium fails to be paid.
Cash and cash equivalents continue to be deposited with reputable and creditworthy banking institutions.
There has been no significant change in the level of mid-term policy cancellations.
Liquidity riskWe manage liquidity risk by maintaining adequate reserves and banking facilities and continuously monitoring forecast and actual cash flows.
Our banking facility was renewed in July 2014. Our net debt at 31 March 2015 was £169.5m, significantly within the facility limit of £300m and the additional funding of £50m secured during the year.
Foreign exchange risk A clear treasury policy exists to address short term risk and this works with the natural hedging provided by the geographical spread of the businesses. While this will protect against some of the transaction exposure our reported results would still be impacted by the translation of our non-UK operations.
During the year our adjusted Euro profits have been impacted by £2.8m due to the weakening Euro when compared to the prior year. However, this trend reversed during the second half of the year.
The movement in the US Dollar rate was less significant in FY16 and generated an adjusted profit benefit of £0.6m.
Page Title at start:Content Section at start:

Annual Report & Accounts 2016
Strategic report
34 | HomeServe plc
Viability statementIn accordance with provision C.2.2 of the UK Corporate Governance Code 2014, the Directors have assessed the viability of the Group over a three year period to 31 March 2019. The Directors believe that a three year forward looking period is appropriate as it is aligned to the timeframe that management focus upon, the performance period in respect of long-term incentive schemes for senior management and it is the period of assessment for recoverable values of cash generating units.
The Group has a formalised process of budgeting, reporting and review along with procedures to forecast its profitability, capital position, funding requirement and cash flows. These plans provide information to the Directors which are used to ensure the adequacy of resources available for the Group to meet its business objectives, both on a short-term and strategic basis. The plans for the period commencing on 1 April 2016 were reviewed by the Executive Committee in February and then approved by the Board in March 2016.
In making this statement, the Board carried out a robust assessment of the principal risks facing the Group, including those that would threaten its business model, future performance, solvency or liquidity as set out in the Principal Risks and Uncertainties. The Group has an embedded risk management framework and all major risks are scored based on their significance and likelihood and these are reviewed regularly by the Audit & Risk Committee.
Various stress tests have also been performed on scenarios such as the impact of losing an affinity partnership or a lowering of retention in a given country.
The Directors’ assessment has been made with reference to geographical spread of the Group operations and its strong financial position resulting from a combination of commercial partnerships and high customer retention.
The business is geographically spread across the UK, Continental Europe and North America; in each established territory the business has long-term contractual relationships with utility businesses providing access to in excess of 92m households under affinity partner brands. Retention rates are high across all established businesses, resulting in stable and recurring cashflows from a large diverse customer base.
Considering the Group’s current position, the principal risks and the Board’s assessment of the Group’s future, the Directors have a reasonable expectation that the Group will be able to continue in operation and meet its liabilities as they fall due over a period of at least three years to 31 March 2019.
Principal risks and uncertainties continued
Page Title at start:Content Section at start:

Strategic reportAnnual Report & Accounts 2016
HomeServe plc | 35
Principal risks and uncertainties
Going concernThe Group’s business activities, together with the factors likely to affect its future development, performance and position are set out in the Strategic report.
The Directors have reviewed the Group’s Budget and medium-term plans, including related cash flows for the period to March 2019 and concluded that they are in line with expectations. In addition the Directors have reviewed the Group’s position in respect of material uncertainties and have concluded that there are no items that would affect going concern or that should be separately disclosed.
The Directors have concluded that they have a reasonable expectation that the Group has adequate resources to continue in operational existence for the foreseeable future. For this reason, they continue to adopt the going concern basis in preparing the financial statements.
This statement was approved by the Board of Directors on 24 May 2016 and is signed on its behalf by:
Johnathan FordChief Financial Officer 24 May 2016
Page Title at start:Content Section at start:

Annual Report & Accounts 2016
Corporate responsibility
36 | HomeServe plc
We are committed to developing and implementing a successful corporate responsibility programme that benefits key stakeholders and utilises our core skills to make a sustainable difference to the communities we operate in. We believe that a successful business must also be a responsible business.
We aim to:
• Achieve sustainable profits for our shareholders
• Build enduring relationships with key stakeholders, including our customers, partners and the community
• Value our employees
• Respect the environment
• Use our core skills to give something back to our local communities.
Our corporate responsibility objectives support our vision and values, with our key focus being on the following four areas:
1. Customers
• Implement and maintain ethical, sustainable and responsible principles throughout the supply chain
• Ensure that the customer remains at the heart of everything we do
• Treat customers fairly throughout the customer experience.
2. Community
• Use our core skills to give something back to the community
• Support more vulnerable members of the community by helping them in their homes
• Develop partnerships with charitable and community organisations which are closely aligned to our business activities and therefore maximise our contribution
• Support and encourage employee involvement in charitable giving and volunteering, using relevant employee skills to support the local community around our major sites and the communities our customers are in.
3. Employees
• Embed customer focused values and behaviours
• Hire, develop and retain talented people to ensure that our customers enjoy a consistently good experience
• Provide a safe, healthy and inclusive environment for our people.
Corporate responsibility
Page Title at start:Content Section at start:Corporate responsibility Introduction

Corporate responsibilityAnnual Report & Accounts 2016
HomeServe plc | 37
Corporate responsibility
4. Environment
• Reduce our carbon emissions per employee
• Use resources efficiently
• Support and educate customers and employees to reduce emissions, specifically in their homes.
These corporate social responsibility principles are part of the way we operate on a daily basis and reflect in the way we deal with customers, employees, partners and the community.
CustomersWe continue to promote a customer focused culture in all of our businesses. Customer Charters, or Promises, which are now in place in each territory outline our commitment to our customers; we’ll make things easy for customers and treat them fairly, every step of the way. Our charters have been committed to by all of our colleagues, from the management teams to those on the front line and are now fully embedded in all of our businesses.
We undertake ongoing customer satisfaction surveys and actively monitor customer satisfaction, net promoter scores and customer effort.
Community The UK business has continued its long-term support for Marie Curie through schemes such as ‘Pennies for Patients’, charity holiday, clothes collections for local shops and site specific fundraising events.
On a local level we supported over 100 community groups through our partnership with Midlands newspaper, the Express & Star in respect of its ‘Cash For Your Community’ initiative. Groups supported ranged from a disability charity to a youth drama club.
We have continued our support for Midland Langar Seva Society which helps the homeless in the West Midlands. Our People volunteered 700 hours, served 8,300 meals and supplied 6,900 food bags this year, with different teams volunteering each week.
At Christmas we supported local causes near to our operations, such as the Salvation Army in Banbury and the Manchester Children’s Hospital with donations of presents and food.
Over 300 volunteers across the UK business gave over 1,750 hours of volunteer time for the 2016 Sport Relief campaign. We answered a phenomenal 2,369 donation calls and raised over £70,000. Both Walsall and Preston took part this year, a first for Preston and the twelfth year for Walsall.
We are also proud to have been recognised for our community initiatives by winning the prestigious ‘Community Champions’ award at the 2015 Express & Star Business Awards.
Page Title at start:Content Section at start:CustomersCommunity

Annual Report & Accounts 2016
Corporate responsibility
38 | HomeServe plc
Our US business has established a ‘Helping Hands’ programme to support charities nominated by employees and also to provide assistance to employees who are going through difficulties. More than 17 charitable organisations have been supported during the year with over $82,000 being donated by employees and the business.
In France and Spain, the focus has been on supporting local charities both by fundraising and volunteering. Activities have included decorating, electrical repairs and toy and food collections.
Our programme to help disadvantaged homeowners who are faced with a home emergency has continued during FY16. The programme was inspired by an initiative introduced in the USA and has now been established in the UK, France, Spain and Italy.
The programme leverages our existing service infrastructure and financial resources to help homeowners in need. It is managed locally and is used in a number of different ways to help homeowners in need. Examples include low income households facing an emergency situation but who do not have a policy and existing policyholders whose policy might not cover the work required.
Corporate responsibility continued
Page Title at start:Content Section at start:
Corporate responsibilityAnnual Report & Accounts 2016
HomeServe plc | 39
Corporate responsibility
EmployeesOur employee values and successful characteristics initiative continue to underpin our strategy to deliver consistently good customer service and are embedded in our recruitment, selection, development and reward arrangements across the Group. Our effective use of our successful characteristics ensure that individuals hired or promoted possess the right attitude and behaviours, as well as the necessary commercial and technical skills. We continue to review both performance and potential against these characteristics as a key part of our annual performance management, career development and succession planning processes.
The values espoused in our People Charters, now embedded in our UK and US businesses, form an integral part of our recruitment, selection and development programmes. They also complement our Customer Charters, or Promises, and seek to further align our employees’ interests to the delivery of excellent customer service.
We continue to enhance our talent assessment and succession planning processes, adopting the ‘nine-box’ matrix model, which helps us to identify leadership development opportunities for our employees. Using this information, we have been able to develop co-ordinated talent and leadership programmes across the business, from front-line developing leaders to senior executives.
We attach considerable importance to ensuring that all our employees benefit from effective communications and engagement, using regular business updates, senior management briefing sessions and “surgeries”, question and answer opportunities and constructive relationships with employee representatives across the Group. We also encourage our management teams to hold regular informal update meetings and social events to keep our employees informed and engaged.
A Group-wide employee engagement survey is run each year, with results reported to the Board and action plans devised, implemented and tracked locally. We also make use of interim ‘Pulse’ surveys in our businesses in order to better track the progress of our employee engagement initiatives during the course of the year. Results from the most recent survey show that engagement levels in each of our businesses are higher than the country average but we aim for continuous improvement. Employees are actively involved in the creation and delivery of plans and best practice for the promotion of employee engagement, which are shared across the Group.
Page Title at start:Content Section at start:Employees

Annual Report & Accounts 2016
Corporate responsibility
40 | HomeServe plc
It is our policy that all people be considered for employment, training, career development and promotion on the basis of their abilities and aptitudes, regardless of physical ability, age, gender, sexual orientation, religion or ethnic origin.
We apply employment policies that are fair and equitable for all employees and these ensure that entry into, and progression within, the Group are determined solely by the fair application of relevant job criteria and by personal ability and competence. We actively promote the international transfer of our employees within and across each of our businesses where this is likely to assist the development of both employee and business, and our senior HR community meets regularly to share best practice and identify opportunities to develop our employees’ careers.
Full and fair consideration (having regard to the person’s particular aptitudes and abilities) is given to applications for employment and the career development of disabled persons. Our training and development policies also make it clear that we will take all practicable steps to ensure that if an employee becomes disabled during the time they are employed, their employment can continue.
Corporate responsibility continued
Page Title at start:Content Section at start:

Corporate responsibilityAnnual Report & Accounts 2016
HomeServe plc | 41
Corporate responsibility
Environment, Health & SafetyHealth, safety, wellbeing and environmental guardianship remains central to everything we do across all of our businesses. All of our businesses are required to comply with ten guiding principles for occupational health and safety and another ten for environmental management. The Group has a proactive assurance programme of H&S performance and facilitates cross-business learning and programme sharing. We continue to strive for zero work related illness and injury.
LeadershipCorporate leadership of health and safety is strong, with Johnathan Ford, Group Chief Financial Officer, as Board Champion for environmental, health and safety matters. HR Directors continue to lead safety matters in each business, except in the UK where responsibility has transferred to the Chief Risk Officer. The Group Safety Director continues as an independent member on the UK Health and Safety Executive’s Challenge (adjudication) Panel.
Continuous improvementIntra-company safety benchmarking is strong and accident frequency rates are used to compare both injury rate, safety culture and levels of engagement; and in preparation for the new ISO45001 specification, gives a leading indicator of safety leadership. Our US and UK businesses have started an exchange programme for their specialist Health & Safety advisers. Carbon emission continues to be measured across all Group companies, and the UK business left the UK Government’s monitoring scheme as its carbon emissions had fallen below the scheme’s threshold.
National highlightsThe UK business has again received a Royal Society for the Prevention of Accidents Occupational Safety Award at the Gold Medal Award level, testimony to the continued success in driving down safety risk.
The US business has a strong health and safety relationship with the union and together they are continuing to see incident reduction.
In France, the focus has been on psychological intervention for stress risk reduction in the call centres, with the UK piloting the French approach in two business areas during the year.
An innovative learning and development programme has been launched in Spain to enhance wellbeing and reduce perceptions of stress risk. Risotherapy is at the cutting edge of alternative coping strategies to enhance the perception of happiness and boost performance.
LegalThere have been no prosecutions or other enforcement actions taken in respect of our businesses by any of the national health, safety or environmental regulators.
Content Section at start:
Environment, Health & SafetyLeadershipContinuous improvementNational highlightsLegal

Annual Report & Accounts 2016
Governance
42 | HomeServe plc
The Board continues to believe that good corporate governance underpins good business performance. As a Board we are accountable to our shareholders for ensuring that governance processes are in place and are effective and we are fully committed to meeting the required standards of corporate governance. The reports that follow are intended to give shareholders an understanding of our corporate governance arrangements and how they operated in FY16.
Board focusOver the last year we have continued to build on the improvements made in respect of service, culture, governance and controls. In addition, we have continued to seek out new opportunities to grow our business and have invested in technology and innovative home services solutions alongside continued investment in the core business. The agreement to acquire Utility Service Partners Inc. in the USA was particularly significant in terms of our expansion plans in that territory.
As a Board we regularly discuss and review:
• Our business performance and our progress towards our strategic goals
• Our customers and how we can ensure that they are at the heart of everything we do
• Our people and how we can develop and support them to provide the service our customers expect
• Our shareholders and how we communicate with them
• Our governance and controls.
Chairman’s overview
JM Barry Gibson Chairman
Page Title at start:Content Section at start:Governance Chairman’s overview
Annual Report & Accounts 2016
HomeServe plc | 43
Governance
Chairman’s overview
Board changesChris Havemann was appointed as a Non-Executive Director on 1 December 2015 and he also joined the Audit & Risk Committee. Chris has followed a largely entrepreneurial career and brings a wealth of experience in the digital space which will be of great benefit to the business.
Board effectivenessDuring the year, a review of the Board and its committees was undertaken by Lintstock Limited, an external facilitator. Based on this review and my experience as Chairman, I am satisfied that the Board and its Committees are performing efficiently and that there is an appropriate balance of skills, experience, knowledge and independence to enable the Board to discharge its duties effectively.
JM Barry GibsonChairman 24 May 2016
Page Title at start:Content Section at start:

Annual Report & Accounts 2016
Governance
44 | HomeServe plc
Directors
Page Title at start:Content Section at start:Directors

Annual Report & Accounts 2016
HomeServe plc | 45
Governance
Directors
JM Barry Gibson (64) 1 3 4
Appointed to the Board in April 2004 and appointed as Chairman on 1 April 2010 following a year as Senior Non-Executive Director. Previously Group Retailing Director at BAA plc, Group Chief Executive of Littlewoods plc and Non-Executive Director of Somerfield plc, National Express plc, William Hill plc, SSP Group Ltd, bwin.party digital entertainment plc and Non-Executive Chairman of Harding Brothers Holdings Ltd.
Richard Harpin (51)Founder and Chief Executive Officer of HomeServe which was set up in 1993 as a joint venture with South Staffordshire Group. Appointed to the Board in May 2001. Also founder and Non-Executive Director of Growth Partner LLP, investing in and helping small consumer businesses to step change their growth. Previously a brand manager with Procter & Gamble, followed by management consultancy with Deloitte and his own company.
Mark Morris (56) 1 2 3 4
Appointed to the Board in February 2009 and as Senior Independent Director on 1 April 2015. Previously in audit, business advisory and corporate finance with Price Waterhouse before joining Sytner Group plc as Finance Director, later becoming Managing Director. Currently Chairman of Motorpoint Ltd and Niche Finance Group Ltd. Previously a Non-Executive Director of LSL Property Services plc.
Martin Bennett (47) Appointed as Chief Executive Officer of the UK business in January 2014, following two years as Group Chief Operating Officer and three years as Group Chief Financial Officer. Previously Finance Director of the UK business, having been Finance Director of the Warranties business and Commercial Director. Prior to joining HomeServe in 2003, he spent three years as Group Finance Director of Clarity Group and ten years at Arthur Andersen where he qualified as a Chartered Accountant.
Johnathan Ford (46)Appointed as Chief Financial Officer in September 2012. Also a Non-Executive Director of Lakehouse plc where he chairs the Audit Committee. Previously Group Finance Director of NWF Group plc. Prior to joining NWF in March 2009, he spent four years at HomeServe, firstly as Group Commercial Director and later as Finance Director of the Emergency Services Division. Before joining HomeServe he was Head of Corporate Finance at Kidde plc.
Stella David (53) 1 3 4
Appointed to the Board in November 2010. Previously Chief Executive Officer of William Grant & Sons following more than fifteen years with Bacardi Ltd where she undertook a number of roles culminating in four years as Global Chief Marketing Officer. Currently a Non-Executive Director of C&J Clark Limited, she also spent seven years as a Non-Executive Director at Nationwide Building Society.
Chris Havemann (48) 1 2Appointed to the Board in December 2015. He has followed a largely entrepreneurial career. He took Research Now onto AIM in 2005 and oversaw its takeover by a US business becoming CEO of the combined group, a global leader in online research data collection. He was subsequently CEO of online marketplace, Rated People. He is also a Non-Executive Director of RM222 Ltd, parent company of Reality Mine Ltd and a governor of London Business School.
Ben Mingay (51) 1 2 3 4
Appointed to the Board in January 2012. Managing Partner of Smith Square Partners, an independent corporate finance advisory firm. He has more than twenty five years’ experience as a corporate finance adviser. Prior to co-founding Smith Square Partners, he was a Managing Director of Hawkpoint Partners Ltd and Credit Suisse First Boston (Europe). He is also a Non-Executive Director of AIM-listed Alternative Networks plc.
Guillaume Huser (49) 5Appointed as Chief Executive Officer, HomeServe France in April 2015. Previously at Affinion Group where he undertook a number of roles culminating in four years as President of Affinion Group’s International Division. Before joining Affinion in December 2002, he spent thirteen years at American Express firstly in finance, sales and business development roles and later in the Corporate Services Division where he was VP Commercial Card, Western Europe.
H Stephen Phillips (49) 5Appointed as Chief Executive Officer of Reparalia in March 2010 having joined HomeServe in 2005 as Country Manager in Spain. He is a licensed insurance broker and is a Non-Executive Director of Assured Enterprises Inc. Prior to joining HomeServe, he spent 12 years in senior business development, sales, and marketing roles in Diversified Business Communications S.A. and E.J. Krause de México, working across the US and Latin America.
Tom Rusin (47) 5Appointed as Chief Executive Officer, HomeServe USA in July 2011. Previously at Affinion Group where he undertook a number of roles culminating in three years as President and Chief Executive Officer of Affinion Group’s North American Division from 2007 to 2010. Before joining Affinion, he owned Just for Travel Inc. He was previously a Non-Executive Director of The Ambassador’s Group.
Anna Maughan (46) Appointed Company Secretary in July 2008 following twelve years as Assistant Company Secretary. Also a Trustee of, and Secretary to, the industry wide Water Companies Pension Scheme.
Key:1 Non-Executive2 Audit & Risk Committee (Chairman: Mark Morris) 3 Nomination Committee (Chairman: Barry Gibson)4 Remuneration Committee (Chairman: Stella David)5 Member of Executive Committee only
Page Title at start:Content Section at start:

Annual Report & Accounts 2016
Governance
46 | HomeServe plc
The Company is committed to the principles of corporate governance contained in the UK Corporate Governance Code 2014 (‘the Code’). The Company has applied the principles set out in the Code and has complied with the provisions set out in the Code throughout the year. An explanation of how the Code has been applied is set out here, in the Audit & Risk Committee report and in the Remuneration report.
The BoardThe powers of the Directors are set out in the Company’s Articles of Association which are available on request. The Articles of Association may be changed by special resolution. The Directors also have responsibilities and duties under other legislation and in particular, the Companies Act 2006.
The Board has a Schedule of Matters specifically reserved to it for decision and has approved the written terms of reference of the various committees to which it has delegated its authority in certain matters. Matters reserved to the Board include:
• the recommendation or approval of dividends
• the approval of preliminary and interim financial statements
• the approval of major financial commitments
• the acquisition of significant companies or businesses
• appointments to the Board and its Audit & Risk, Remuneration and Nomination Committees
• the Company’s future strategy
• the Company’s internal controls.
The full schedule is available on our website.
Board compositionThe Board is made up of a balance of Executive Directors and independent Non-Executive Directors.
The Directors who held office during the year were:
John Michael Barry GibsonRichard David HarpinMartin John Bennett Johnathan Richard Ford Stella Julie David Christopher Havemann (appointed 1 December 2015)Benjamin Edward Mingay Mark Christopher Morris
Corporate Governance report
Page Title at start:Content Section at start:Corporate Governance report

Annual Report & Accounts 2016
HomeServe plc | 47
Governance
Corporate Governance report
The Board is led by the Chairman, Barry Gibson. The Chairman’s responsibilities are clearly defined in a written specification agreed by the Board and which makes clear the division of responsibilities between the Chairman and the Chief Executive. They include the smooth running of the Board, effective communication between Executive and Non-Executive Directors and the general progress and long-term development of the Group.
During the year, in addition to the Chairman, four independent Non-Executive Directors (Messrs Havemann, Mingay and Morris and Mrs David) with extensive business, finance and marketing backgrounds, provided the Board with a breadth of experience and independent judgement. Mark Morris served as the Company’s independent Senior Non-Executive Director.
In accordance with the provisions of the Code, each Director is subject to election by the Company’s shareholders at the Annual General Meeting immediately following their appointment, and is subject to re-election every year thereafter.
Short biographies of each of the Directors including their membership of committees may be found on the previous page.
The beneficial interests of the Directors in the shares of the Company and the options held as at 31 March 2016 and 24 May 2016 are set out in the Remuneration report. None of the Directors serving at the year-end had a beneficial interest in the share capital of any subsidiary company.
Succession planningThere is a clear need to ensure that there is an appropriate pool of talented and capable individuals to fill senior roles and a succession planning process has been established across the Group to facilitate this. Each business and corporate function prepares and maintains succession plans with the support of local and Group HR and with input from the Group Chief Executive. The Executive Committee reviews the plans in detail twice a year and the Board reviews the high level plan at least annually.
The identification and development of our people remains a key focus across the Group.
DiversityThe Board is committed to ensuring that it is appropriately diverse. It is supportive of the aspiration of the Davies Report to promote greater female representation on corporate boards. Although no target has been set in respect of the percentage of women on the Board, when seeking to recruit for Board positions we ensure that ‘long lists’ include women candidates.
The Board also believes that a diversity of experience and psychological profile is important around the board table. We seek to ensure that there is a balance of skills and experience and in respect of non-executive positions we ensure that candidates from a wider pool are considered, including those with little or no listed company board experience.
Page Title at start:Content Section at start:
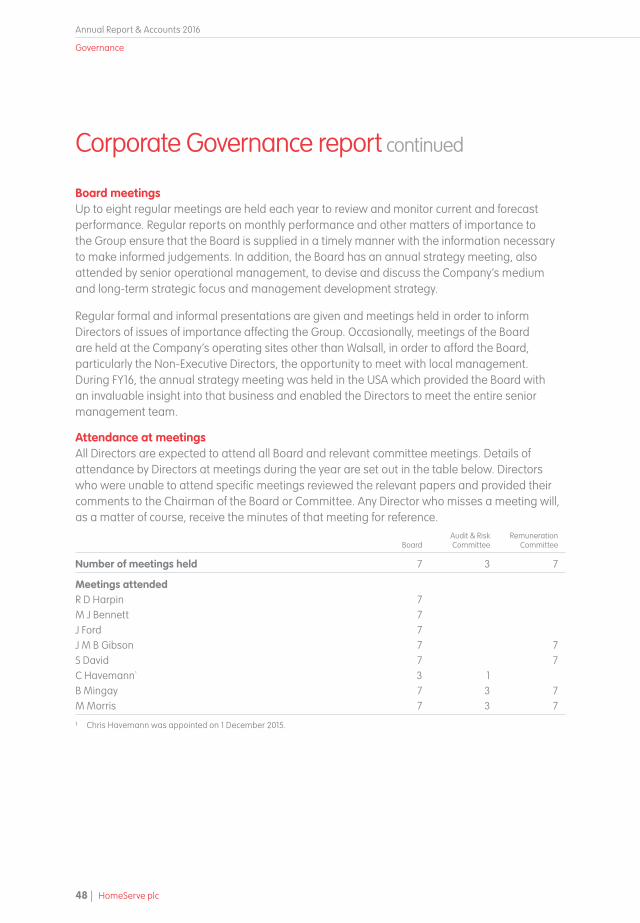
Annual Report & Accounts 2016
Governance
48 | HomeServe plc
Board meetingsUp to eight regular meetings are held each year to review and monitor current and forecast performance. Regular reports on monthly performance and other matters of importance to the Group ensure that the Board is supplied in a timely manner with the information necessary to make informed judgements. In addition, the Board has an annual strategy meeting, also attended by senior operational management, to devise and discuss the Company’s medium and long-term strategic focus and management development strategy.
Regular formal and informal presentations are given and meetings held in order to inform Directors of issues of importance affecting the Group. Occasionally, meetings of the Board are held at the Company’s operating sites other than Walsall, in order to afford the Board, particularly the Non-Executive Directors, the opportunity to meet with local management. During FY16, the annual strategy meeting was held in the USA which provided the Board with an invaluable insight into that business and enabled the Directors to meet the entire senior management team.
Attendance at meetingsAll Directors are expected to attend all Board and relevant committee meetings. Details of attendance by Directors at meetings during the year are set out in the table below. Directors who were unable to attend specific meetings reviewed the relevant papers and provided their comments to the Chairman of the Board or Committee. Any Director who misses a meeting will, as a matter of course, receive the minutes of that meeting for reference.
BoardAudit & Risk Committee
Remuneration Committee
Number of meetings held 7 3 7
Meetings attendedR D Harpin 7M J Bennett 7J Ford 7J M B Gibson 7 7S David 7 7C Havemann¹ 3 1B Mingay 7 3 7M Morris 7 3 7
¹ Chris Havemann was appointed on 1 December 2015.
Corporate Governance report continued
Page Title at start:Content Section at start:

Annual Report & Accounts 2016
HomeServe plc | 49
Governance
Corporate Governance report
Board developmentThe Board actively encourages all Directors to deepen their knowledge of their roles and responsibilities and to gain a clear understanding of the Group and the environment in which it operates and has adopted a formal policy on the induction and training of Directors. Newly appointed Board members are required to undergo an induction programme, which includes obtaining a thorough understanding of the Group’s various operations and to this end, Chris Havemann has commenced a programme of activity. Board members also have the opportunity to receive formal training from external providers if they wish.
During the year, the Non-Executive Directors have met with various members of the Group’s management teams and external advisers.
Board evaluationThe Board has implemented a formal process for reviewing its own effectiveness, that of its Remuneration and Audit & Risk committees and its individual members. In addition, it continued to ensure that regular meetings of the Non-Executive Directors were held without the Executive Directors, and at least once a year, without the Chairman present, in order to evaluate his performance.
An external Board evaluation process was completed during FY15 by Lintstock Limited. Directors completed evaluation questionnaires and these were followed up by individual interviews with Lintstock who then compiled a formal written report summarising the Directors’ views and containing recommendations to improve the effectiveness of the Board further. This report was followed up in FY16 by an evaluation questionnaire, also facilitated by Lintstock Limited, which was discussed by the Board in February 2016.
The Board concluded that it was operating effectively with the relationships between the Board members being particularly highly rated. The atmosphere in the boardroom in terms of encouraging equal contribution, candid discussion and critical thinking was also positively rated. It was agreed that following the successful visit to the USA in FY16, it would be beneficial to visit the other key countries and as a result, it has been agreed that the annual strategy meeting in FY17 should be held in France.
Page Title at start:Content Section at start:

Annual Report & Accounts 2016
Governance
50 | HomeServe plc
CommitteesThe Board operates a number of committees to which it has delegated certain specific responsibilities, each of which has formally adopted terms of reference. These comprise the Nomination, Audit & Risk and Remuneration Committees. The terms of reference of each of the Board’s committees are available on request from the Company Secretary and are on the Company’s website. The membership and activities of the Audit & Risk Committee and Remuneration Committee are detailed in the reports of those committees.
Nomination CommitteeMembersJ M Barry Gibson (Chairman)Stella DavidBen MingayMark Morris
ResponsibilitiesThe primary responsibilities of the Committee are to:
• make recommendations to the Board on the appointment of Directors
• review the size, structure and composition of the Board
• consider succession planning arrangements for Directors and other senior managers.
Key issues considered during the yearThe Committee met informally on a number of occasions during the year to consider the appointment of a new Non-Executive Director. The Executive Directors were also given the opportunity to meet with the shortlisted candidates. Following this, a recommendation was made to the Board and the final decision to appoint Chris Havemann was taken by the Board as a whole.
The Committee draws on the advice of such professional advisers as it considers necessary and did so during the year in respect of the appointment made.
Corporate Governance report continued
Page Title at start:Content Section at start:

Annual Report & Accounts 2016
HomeServe plc | 51
Governance
Corporate Governance report
Executive CommitteeThe day to day running of the business rests with the Group Chief Executive, Richard Harpin. The Executive Committee assists the Chief Executive in the performance of his duties including:
• the development and implementation of strategy, operational plans, policies, procedure and budgets
• the monitoring of operating and financial performance
• the prioritisation and allocation of resources and
• the oversight of group wide initiatives and investments.
Other members of the Executive Committee are Martin Bennett, Johnathan Ford, Tom Rusin, Chief Executive Officer of HomeServe USA, Stephen Phillips, Chief Executive Officer of Reparalia in Spain and Guillaume Huser, Chief Executive Officer of HomeServe France.
The Committee has adopted formal terms of reference.
Risk CommitteeA Group Risk Committee, comprising the Executive Directors and other representatives of each business, operates across the Group and is chaired by Johnathan Ford. Its terms of reference have been approved by the Board and its purpose is to advise the Audit & Risk Committee in respect of the Group’s risk appetite, to evaluate the risk registers compiled by each of its businesses, to monitor the effectiveness of action plans for the mitigation of those risks, and to report thereon to the Audit & Risk Committee and thereafter to the Board, which retains responsibility for the overall evaluation of the Group’s risk management processes.
Directors’ indemnities and insuranceThe Company has made qualifying third party indemnity provisions for the benefit of its Directors which were in place during the year and remain in force at the date of this report. The Company maintains directors’ and officers’ liability insurance for its Directors and officers.
Page Title at start:Content Section at start:
Annual Report & Accounts 2016
Governance
52 | HomeServe plc
Advice for DirectorsThe Board has established a formal procedure for Directors wishing to seek independent legal and other professional advice and all members of the Board have access to the advice, and services of the Company Secretary.
Relationships with shareholdersThe Board, on the Company’s behalf, recognises the need to maintain an active dialogue with its shareholders. The Chief Executive and Chief Financial Officer meet regularly with institutional investors and analysts to discuss the Company’s performance and all shareholders have access to the Chairman and independent Senior Non-Executive Director, who are available to discuss any questions which they may have in relation to the running of the Company.
The Board encourages shareholders to attend the Annual General Meeting and is always willing to answer questions, either in the meeting itself or, more informally, afterwards. In addition, shareholders may contact HomeServe direct, either through the website or by telephone.
The Board recognises the need to ensure that all Directors are fully aware of the views of major shareholders. Copies of all analysts’ research relating to the Company are circulated to Directors upon publication. The Board receives a monthly Investor Relations report which includes an analysis of the Company’s shareholder register as well as any feedback received from shareholders and analysts.
Viability statement and going concernThe viability statement and going concern are contained within the Strategic report.
Internal controlsThe Board has overall responsibility for the Group’s system of internal control and for reviewing its effectiveness. The Audit & Risk Committee has a key role to play in overseeing internal controls and advising the Board thereon. More detail in respect of the role of the Audit & Risk Committee is provided in the report of that committee.
The Board has delegated the day-to-day management of the Company to the Group Chief Executive and the other Executive Directors. The system of internal control is designed to manage and mitigate rather than eliminate the risk of failure to achieve business objectives, and can only provide reasonable and not absolute assurance against material misstatement or loss.
Corporate Governance report continued
Page Title at start:Content Section at start:

Annual Report & Accounts 2016
HomeServe plc | 53
Governance
Corporate Governance report
The Board confirms that there is an ongoing process for identifying, evaluating and managing the risks faced by the Company. This has been in place for the year under review and up to the date of approval of this Annual Report and Accounts. The process is regularly reviewed by the Board and accords with the Turnbull Guidance. The key elements of the control framework and review processes in place across the Group are as follows:
• The Group’s strategy is set by the Board and three year business plans, annual budgets and investment proposals for each business are formally prepared, reviewed and approved by the Board.
• The Group’s management operates a formal process for identifying, managing and reporting on operational and financial risks faced by each of the Group’s businesses. Risks are reviewed in detail at local risk committees and, on an overall basis, by the Group Risk Committee and the Audit & Risk Committee.
• The Group Risk Committee meets three times a year and reviews a register summarising the significant risks faced by the businesses or the Group as a whole, the likelihood of those risks occurring and the steps being taken to minimise or otherwise manage those risks. Regular updates are provided to the Audit & Risk Committee and the Board.
• The Audit & Risk Committee meets three times a year and reviews the risk registers in order to advise the Board on current risk exposures and future risk strategy. More detail is provided in the report of the Audit & Risk Committee.
• A clearly defined organisation structure is in place with clear lines of accountability and appropriate division of duties. The Group’s financial regulations specify authorisation limits for individual managers and for local Boards of management, with all material transactions being approved by the Board.
• Regular telephone meetings of the Executive Committee monitor day to day performance, and full Executive Committee meetings are held at least eight times a year at which the Directors report on the progress of the companies or discipline for which they are responsible and share best practice.
• Consolidated financial results, including a comparison with budgets and forecasts, are reported to the Board on a monthly basis, with variances being identified and understood so that mitigating actions can be implemented, where appropriate.
• The consolidated accounts are reviewed by the Executive Directors and verified by the finance team. The accounts are then considered by the Audit & Risk Committee which makes a recommendation in respect of their approval to the Board. The Board then reviews and approves the accounts prior to the announcement of the half year and annual results.
Page Title at start:Content Section at start:

Annual Report & Accounts 2016
Governance
54 | HomeServe plc
• At the end of the year, the Executive Directors compile a report identifying the key risks faced by the Group. This report is considered by the Audit & Risk Committee and by the Board before the Annual Report and Accounts is approved.
• The Group has a dedicated Internal Audit function and a formal audit plan is in place to address the key risks across the Group.
• Appropriate treasury policies are in place.
• A whistle blowing policy allows employees, franchisees and sub-contractors who wish to raise any issues of concern relating to the Group’s activities to do so on a confidential basis by contacting an external hotline.
• A mechanism exists to extend the Group’s formal risk management processes to any significant new business acquired or established immediately upon acquisition or start-up. In this way, the Board is able to confirm that the necessary process has been operated by the Group for the whole of the year.
As required by the Turnbull Guidance, the Board, supported by the Audit & Risk Committee, carries out an annual assessment of the effectiveness of the system of internal controls.
By Order of the Board
JM Barry GibsonChairman 24 May 2016
Corporate Governance report continued
Page Title at start:Content Section at start:

Annual Report & Accounts 2016
HomeServe plc | 55
Governance
Audit & Risk Committee report
MembersMark Morris (Chairman)Chris Havemann (appointed 1 December 2015)Ben Mingay
The Audit & Risk Committee is chaired by Mark Morris who has recent and relevant financial experience. He worked in audit, business advisory and corporate finance before becoming a plc Finance Director and previously chaired the Audit Committee of LSL Property Services plc.
The internal and external auditors, the Chief Financial Officer, the Chief Executive Officer and the Chairman are invited, but are not entitled, to attend all meetings. Where appropriate, other Executive Directors and managers also attend meetings at the Chairman’s invitation. The external and internal auditors are provided with the opportunity to raise any matters or concerns that they may have, in the absence of the Executive Directors, whether at Committee meetings or, more informally, outside of them.
ResponsibilitiesThe primary responsibilities of the Committee are to:
• monitor, on behalf of the Board, compliance with and the effectiveness of, the Company’s accounting and internal control systems
• agree audit strategy
• monitor the scope and results of the Company’s annual external audit
• review the independence and objectivity of its auditors
• review the preliminary and interim results and financial statements before they are presented to the Board
Audit & Risk Committee report
Mark Morris Chairman of the Audit & Risk Committee
Page Title at start:Content Section at start:Audit & Risk Committee report

Annual Report & Accounts 2016
Governance
56 | HomeServe plc
Audit & Risk Committee report continued
• approve and monitor the internal audit plan
• review the appropriateness of the internal audit function
• receive reports from the Company’s internal and external auditors
• make recommendations to the Board on accounting policies
• make recommendations to the Board for a resolution to be put to the shareholders for their approval in general meeting for the appointment of the external auditor, the approval of their remuneration and their terms of engagement
• receive reports from the Group Risk Committee
• advise the Board on the Group’s overall risk appetite, tolerance and strategy
• advise the Board on current risk exposures and future risk strategy
• review and approve the means by which the Group and its regulated subsidiary undertakings seek to comply with their respective regulatory obligations
• review the adequacy and security of the Company’s arrangements for its employees to raise concerns, in confidence, about possible wrongdoing in financial reporting or other matters.
Summary of meetings in the yearThe Committee usually meets three times in the year and did so in FY16. During the year the agenda has included the following items:
• Half year results
• Full year results
• Principal judgemental accounting matters
• External audit plans and reports
• Internal audit plans and reports
• Risk assessments and reports
• Updates on regulatory compliance activity
• Updates on certain key risks, in particular, information security
• Whistleblower reports
• Internal audit effectiveness and independence
• External audit effectiveness and independence.
The Committee meets privately, without any of the Executive Directors or management present, with the external and internal auditors after each Committee meeting.
The Chairman of the Committee provides an update in respect of the matters discussed to the Board after each Committee meeting and the minutes of meetings are circulated to the whole Board.
Page Title at start:Content Section at start:

Annual Report & Accounts 2016
HomeServe plc | 57
Governance
Audit & Risk Committee report
Significant issues related to the financial statementsThe Committee assesses whether suitable accounting policies have been adopted and whether management has made appropriate estimates and judgements. Management prepares papers providing details on the key judgements and these are reviewed by the Committee.
The Committee also reviews reports from the external auditor on the half year and full year results, which provide an overview of the audit work undertaken and highlight any issues for discussion.
The significant issues were:
• revenue recognition, specifically the timing of when to recognise revenue so that sufficient revenue is deferred to cover future obligations
• the carrying value of intangible assets (specifically acquisition intangible assets) and goodwill arising on the purchase of businesses and books of policies and customers
• accounting in respect of new customers acquired through the Endesa and Lyonnaise des Eaux ‘Sales Through Service’ channels.
The Committee addressed these matters using reports presented by management which set out the basis for the assumptions used. All of the issues were also discussed with the external auditor and its views were taken into account. The Committee is satisfied that the judgements made are reasonable and appropriate disclosures have been included in the accounts.
External auditorThe Committee is responsible for assessing the effectiveness of the external audit process, for monitoring the independence and objectivity of the external auditor and for making recommendations to the Board in relation to the appointment of the external auditor. The Committee is also responsible for developing and implementing the Group’s policy on the provision of non-audit services by the external auditor.
The Committee has agreed and implemented a procedure for reviewing and assessing its own effectiveness and that of the internal and external audit process. The Committee reviews the performance of the external auditor annually.
Deloitte LLP has been the Group’s auditor since 2002, although the lead audit partner rotates every five years.
Page Title at start:Content Section at start:
Annual Report & Accounts 2016
Governance
58 | HomeServe plc
Audit & Risk Committee report continued
During the year the external auditor presented its transparency report to the Committee, which is intended to demonstrate the steps it takes to ensure audit quality with reference to the Audit Quality Framework issued by the Professional Oversight Board of the Financial Reporting Council. The Committee also considered whether the auditor’s understanding of the Group’s business and its understanding of the sectors in which the Group operates, including the regulatory landscape, was appropriate to the Group’s needs. It also assessed the performance of the audit, the auditor’s conduct of its relationship with the Group and the requirements of the Group’s financial control process. On this basis, the Committee concluded that the needs of the Group would not be best served by putting the external audit out to tender at this time. The Committee has therefore recommended to the Board that the re-appointment of Deloitte LLP should be proposed at the forthcoming Annual General Meeting.
The Committee has noted the recent changes to EU audit legislation and the UK adoption of this legislation, which will require mandatory rotation for auditors of public interest entities at least every 20 years with a mandatory tender process being undertaken at the 10 year point. The transitional rules for this new legislation mean that the Group would be required to change its auditor after 2024. A recommended course of action will be proposed to the Board in due course. The Committee has not identified any factors which might restrict its choice of external auditor.
The Committee has implemented a policy relating to the use of the external auditors for non-audit services and monitors fees paid in respect of such services. This policy currently provides that the total fees payable to the auditor for non-audit related work in any financial year should not normally be more than 100% of the total fees payable in respect of audit and compliance services. In addition, any proposed spend over a predetermined limit must be approved by the Committee.
The fees payable to the auditor for non-audit related work (excluding audit-related assurance services) totalled £353,000 and the fees payable in respect of audit and audit-related assurance services totalled £537,000. Further detail on the fees paid is provided in Note 7.
In accordance with International Standards on Auditing (UK & Ireland) 260 and Ethical Statement 1 issued by the Accounting Practices Board, and as a matter of best practice, the external auditor has confirmed its independence as auditor of the Company in a letter addressed to the Directors.
Page Title at start:Content Section at start:

Annual Report & Accounts 2016
HomeServe plc | 59
Governance
Audit & Risk Committee report
Risk management and internal controlAs stated in the Corporate Governance report, the Board has overall responsibility for the Group’s system of internal control and for reviewing its effectiveness. The Audit & Risk Committee supports the Board by advising on the Group’s overall risk appetite, tolerance and strategy, current risk exposures and future risk strategy. The Committee reviews risk registers produced by the management of each business and the plc function at each of its meetings. On a periodic basis, it also reviews action plans in respect of significant risks.
The Committee also monitors, on behalf of the Board, the effectiveness of the Company’s accounting and internal control systems. In fulfilling this responsibility, the Committee receives reports from management and the internal and external auditors.
Further details in respect of risk management and controls are set out in the Corporate Governance report.
Internal audit The Committee considers and approves the internal audit plan which is based on an assessment of the key risks faced by the Group. Progress in respect of the plan is monitored throughout the year and care is taken to ensure that the internal audit function has sufficient resource to complete the plan. The audit plan may be reviewed during the year as a result of the ongoing assessment of the key risks or in response to the needs of the Group.
The Assurance, Risk and Best Practice Director reports ultimately to the Chairman of the Committee although he reports on a day-to-day basis to the Chief Financial Officer. He attends all meetings of the Committee and reports regularly to the Group Risk Committee. A quarterly report on completed internal audits is presented to the Committee and, where appropriate, action plans are reviewed. In addition, all grade 1 audit reports are circulated to the Committee as soon as they are finalised so any issues can be addressed in a timely manner.
During the year, the effectiveness of the internal audit function was assessed by the Assurance, Risk and Best Practice Director and the Committee.
On behalf of the Audit & Risk Committee
Mark MorrisChairman of the Audit & Risk Committee 24 May 2016
Page Title at start:Content Section at start:

Annual Report & Accounts 2016
Governance
60 | HomeServe plc
Dear ShareholderI am pleased to present the Remuneration report for the year ended 31 March 2016.
Performance and rewardThe Group has delivered good customer and profit growth in FY16. Particularly pleasing has been the step change in the USA where the business has delivered 89% profit growth, added 2.8m new partner households and entered into an agreement to acquire Utility Service Partners Inc. which will extend the household reach in the USA to 42m.
The stretching commercial and customer targets for the Group have been met with improved performance in respect of customer satisfaction and complaints. In the UK, the cash target was not met and the target in respect of core renewable customers was only partially met. The other commercial and customer objectives were met in full.
In respect of longer-term performance, the LTIP awards granted in 2012 vested in full during the year with HomeServe’s TSR at the end of the performance period being 217.9% compared to the FTSE 250 Index TSR of 80.6%. Based on TSR performance to 31 March 2016, which is 70% above the FTSE 250 Total Return Index it is expected that the awards granted in 2013 will also vest in full.
The Committee is satisfied that the remuneration paid to the Executive Directors in the year fairly reflects both corporate and individual performance during the year.
Remuneration policy FY16The remuneration policy was approved at the 2014 AGM and payments made in FY16 were in line with the policy. Some operational changes in respect of how the policy was applied were made during the year. These related primarily to the performance conditions and grant levels in respect of the LTIP and were described in last year’s report. Details are also included in this report.
The Committee’s activities during the year are described in more detail later in this report.
Remuneration report
Stella David Chairman of the Remuneration Committee
Page Title at start:Content Section at start:Remuneration report

Annual Report & Accounts 2016
HomeServe plc | 61
Governance
Remuneration report
Remuneration policy FY17No changes are being made to the policy in FY17. In line with the policy and the award levels granted last year, the FY17 Performance Share award for Executive Directors will be at 200% of salary. We consider that granting an award at the maximum policy level continues to remain appropriate given the stretching performance conditions applied and the desire to maintain the current momentum in the delivery of our strategic plan.
Performance conditions in respect of the initial 150% of salary will be the same as last year but a more stretching EPS target will apply to the additional 50% of salary. The additional 50% of salary will only vest in full if annual EPS growth of 20% per annum is achieved over the three year performance period.
We have consulted with our major shareholders in advance of making this change.
A two year post vesting holding period will apply to the FY17 grants, providing a 5 year perspective to the incentive programme. In addition, the Executive Directors are also subject to a requirement to build and maintain shareholdings in the Company equivalent to 200% of salary.
Recovery and withholding policies are in place and we are comfortable that our approach is robust and workable should these provisions ever need to be operated.
There are no significant changes to the other elements of the remuneration policy. Salaries will increase by 1.25% with effect from 1 July 2016 in line with the average increase for the UK workforce and the maximum bonus opportunity remains unchanged at 100% of salary. The performance measures in respect of the bonus scheme have been reviewed and reduced in order to simplify the scheme but the bonus remains strongly linked to customer measures in line with the business strategy, subject to affordability underpins. Details of the performance targets used and performance against them will be disclosed in next year’s report.
The Remuneration Committee is satisfied that the remuneration policy continues to work effectively and supports our strategy as an entrepreneurial, customer focused business.
Stella DavidChairman of the Remuneration Committee 24 May 2016
Page Title at start:Content Section at start:

Annual Report & Accounts 2016
Governance
62 | HomeServe plc
This report has been prepared in accordance with the new disclosure requirements for directors’ pay – Schedule 8 of the Large and Medium Sized Companies and Groups (Accounts and Reports) (Amendment) Regulations 2013. The report also satisfies the relevant requirements of the Listing Rules and describes how the Board has applied the principles and complied with the provisions relating to directors’ remuneration in the UK Corporate Governance Code.
The Directors’ remuneration policy was approved by shareholders at the 2014 AGM and is not subject to a shareholder vote this year. The policy is set out below for information only. In order to assist shareholders, the remuneration scenario charts later in the report have been updated to reflect the proposed remuneration levels for FY17 and we have added additional commentary, where relevant, to explain how the policy will be operated in FY17.
Remuneration policyThe Committee’s remuneration policy for the remuneration of Executive Directors and other senior Executives is based on the following principles:
• to align rewards with the Group’s financial and operational performance
• to ensure that remuneration, in particular, variable pay, supports the Group’s strategy as a customer focused operation
• to provide a remuneration package that is sufficient, but no more than necessary, to attract, retain and motivate high calibre executives.
To that end, the Committee structures executive remuneration in two distinct parts: fixed remuneration of basic salary, pension and benefits and variable performance-related remuneration in the form of a cash bonus and long-term incentive arrangements. Remuneration for Executive Directors is structured so that the variable pay element forms a significant portion of each Director’s package.
The Committee is satisfied that neither the structure of the remuneration packages, with the high weighting on variable pay, nor the performance measures targeted under the annual bonus and long-term incentive arrangements, encourages inappropriate risk taking. The remuneration arrangements are designed so as to provide a strong alignment of interest between the Executives and shareholders and to support the growth and performance aspirations of the Company. The Committee is satisfied that the current arrangements meet these objectives. Furthermore, a clawback provision to annual bonuses and long-term incentive awards was introduced in 2011 which helps to guard further against excessive risk taking.
Remuneration report continued
Page Title at start:Content Section at start:

Annual Report & Accounts 2016
HomeServe plc | 63
Governance
Remuneration report
Summary of components of Executive Directors’ remunerationThe table below summarises the Committee’s policy for the remuneration of Executive Directors which was approved by shareholders at the 2014 Annual General Meeting.
Element Purpose and link to strategy
Performance Period
Operation (including performance measures and maximum limits)
Basic salary To reflect the particular skills and experience of an individual and to provide a competitive base salary compared with similar roles in similar companies.
Usually reviewed annually, with any changes normally taking effect from 1 July each year.
Individual pay is determined by the Committee taking into account the role, responsibilities, performance and experience of the individual and market data on comparable roles. Consideration is also given to overall business performance and pay and employment conditions elsewhere in the Company when determining any increases to base salary levels for the Executive Directors.
When reviewing salary increases, the Committee also takes into account the impact of any increase to base salaries on the total remuneration package.
Details of the current salaries of the Executive Directors are set out in the Annual Report on Remuneration.
Performance related bonus
The annual bonus is designed to drive and reward the short-term operating performance of the Company and encourage the delivery of consistently good customer outcomes.
Annual (determined after the year end)
Annual bonuses are determined by reference to performance against a mix of customer, commercial and personal objectives. Before any bonus is payable a minimum level of both customer and financial performance must be achieved.
Bonuses are based on Group performance and, if relevant, the specific territory for which an Executive Director is responsible. Individual performance accounts for no more than 20% of the overall bonus opportunity.
The maximum potential quantum is 100% of salary and assuming their personal objectives are met in full, the normal ‘on-target’ bonus is 60% of basic salary.
Bonuses are payable in cash but may be deferred into shares under the matching element of the LTIP.
Page Title at start:Content Section at start:

Annual Report & Accounts 2016
Governance
64 | HomeServe plc
Element Purpose and link to strategy
Performance Period
Operation (including performance measures and maximum limits)
Long-term incentives
To drive long-term delivery of the Group’s objectives, to align Directors’ interests with those of the Company’s shareholders and to encourage exceptional performance.
Three years Awards of performance and matching shares are granted under the Long Term Incentive Plan (which was approved by shareholders in 2008).
The maximum limit is 200% of salary for performance share awards (currently, awards of 150% of salary are made to the Executive Directors) and a maximum 2:1 match on voluntary investment of bonus into shares. The maximum amount of bonus that may be invested is set at 75% of the maximum bonus potential (i.e. 75% of salary). If the bonus earned is less than 25% of salary, then the executive may invest the equivalent of 25% of salary, from their own money, in shares to receive a matching award. In determining the number of matching awards to be granted, the investment is deemed to be made gross of tax.
Both performance and matching awards are subject to the same performance condition which was relative Total Shareholder Return in FY15 (subject to satisfactory underlying earnings performance). Performance is measured over a performance period of at least three years.
Changes to operation in FY16 and FY17An Earnings Per Share performance condition was reintroduced for performance and matching share awards in FY16 and this will also be applied in FY17. Performance awards were granted at the policy maximum of 200% in FY16 and will be again in FY17. Further details are provided later in this report.
Pension To provide benefits comparable with similar roles in similar companies.
N/A Richard Harpin participates in the Water Companies Pension Scheme (a defined benefit scheme which is closed to new members). The other Executive Directors receive a 20% contribution to the HomeServe Money Plan (a defined contribution scheme). The key features of these schemes are set out beneath this policy table.
Retirement benefits under both schemes are restricted by a notional earnings cap (£133,324 for FY16). An unapproved pension contribution equal to 20% of the amount by which basic salary exceeds the notional cap is paid annually. Executives may choose to have this amount paid directly into their pension or may receive it as cash.
As an alternative to the above arrangements, the Committee may also permit the pension allowance (up to 20% of salary) to be taken solely as a cash allowance.
Remuneration report continued
Page Title at start:Content Section at start:
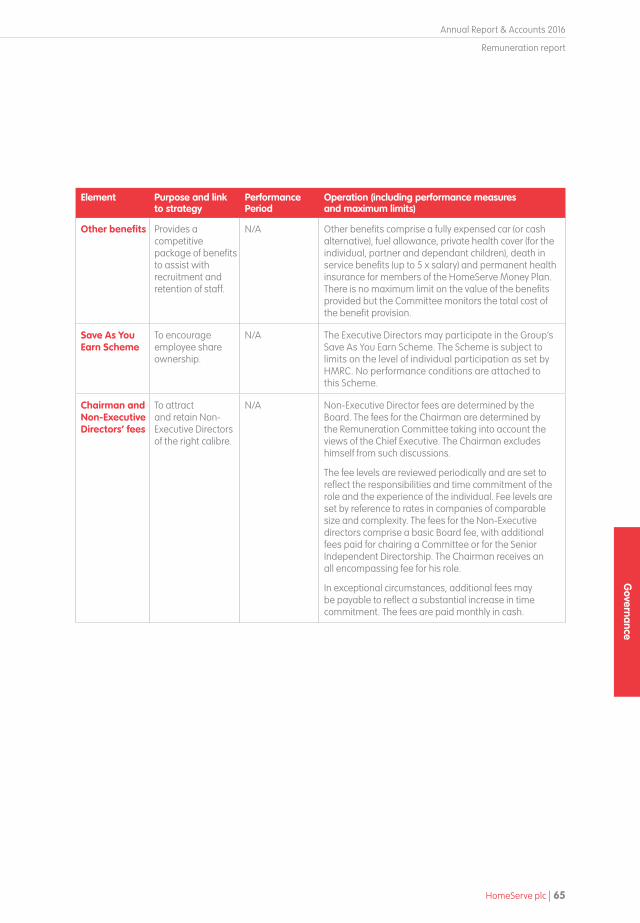
Annual Report & Accounts 2016
HomeServe plc | 65
Governance
Remuneration report
Element Purpose and link to strategy
Performance Period
Operation (including performance measures and maximum limits)
Other benefits Provides a competitive package of benefits to assist with recruitment and retention of staff.
N/A Other benefits comprise a fully expensed car (or cash alternative), fuel allowance, private health cover (for the individual, partner and dependant children), death in service benefits (up to 5 x salary) and permanent health insurance for members of the HomeServe Money Plan. There is no maximum limit on the value of the benefits provided but the Committee monitors the total cost of the benefit provision.
Save As You Earn Scheme
To encourage employee share ownership.
N/A The Executive Directors may participate in the Group’s Save As You Earn Scheme. The Scheme is subject to limits on the level of individual participation as set by HMRC. No performance conditions are attached to this Scheme.
Chairman and Non-Executive Directors’ fees
To attract and retain Non-Executive Directors of the right calibre.
N/A Non-Executive Director fees are determined by the Board. The fees for the Chairman are determined by the Remuneration Committee taking into account the views of the Chief Executive. The Chairman excludes himself from such discussions.
The fee levels are reviewed periodically and are set to reflect the responsibilities and time commitment of the role and the experience of the individual. Fee levels are set by reference to rates in companies of comparable size and complexity. The fees for the Non-Executive directors comprise a basic Board fee, with additional fees paid for chairing a Committee or for the Senior Independent Directorship. The Chairman receives an all encompassing fee for his role.
In exceptional circumstances, additional fees may be payable to reflect a substantial increase in time commitment. The fees are paid monthly in cash.
Page Title at start:Content Section at start:

Annual Report & Accounts 2016
Governance
66 | HomeServe plc
Rationale behind performance metrics and targetsThe Remuneration Committee works hard to ensure that the remuneration policy for the Executive Directors supports the business strategy, and that the level of remuneration received is reflective of the overall business performance and the returns received by shareholders. A significant proportion of the remuneration package comes from variable pay (c.60% at target performance) with careful consideration given to the choice of performance metrics to ensure that the executives are not encouraged to take inappropriate risks.
Annual bonusThe annual bonus is designed to drive and reward excellent short-term operating performance of the Company and encourage real year-on-year growth in profitability. No annual bonus is paid unless a very high level of performance is achieved. The Committee reviews the bonus plan measures annually in order to ensure that they are aligned with the Group’s strategy and so that bonus arrangements are consistent amongst the senior executive team. Performance targets are set at the start of the financial year and are linked to the Group’s strategic and operational objectives. The transition to a more customer focused culture across our business is reflected in the use of customer metrics in the annual bonus scheme. These are based on measures relating to customer complaints and customer satisfaction. This is balanced by the use of commercial and personal objectives to reflect other strategic priorities. The commercial objectives included metrics relating to profit before tax and the number of core renewable customers.
The Committee retains the discretion to alter the choice and weighting of the metrics for future bonus cycles to reflect the changing needs of the business. The payment of any bonus is at the discretion of the Committee and bonuses will only be paid once a minimum level of customer and financial performance is achieved.
Changes to operation in FY16 and FY17Targets relating to net debt and employee engagement were introduced to the bonus for FY16. These operated alongside the customer and commercial measures and the personal performance objectives.
For FY17, the number of measures will be reduced with employee engagement being removed and the customer measure being customer satisfaction only (rather than customer satisfaction and complaints).
Remuneration report continued
Page Title at start:Content Section at start:

Annual Report & Accounts 2016
HomeServe plc | 67
Governance
Remuneration report
LTIPLong-term incentive awards will be granted in accordance with the rules of the shareholder approved HomeServe 2008 Long-Term Incentive Plan (LTIP) and the discretions contained therein. The performance measures for the matching and performance awards are set using a sliding scale of targets and no more than 25% of the award (under each measure) will vest for achieving the threshold performance hurdle.
The current performance measure used for LTIP awards is relative total shareholder return performance (TSR). The performance period runs for three years and requires HomeServe’s TSR to match that of the FTSE 250 Index for 25% of the shares to vest, rising on a straight-line basis so that full vesting requires out-performance of the Index by 15% per annum. TSR is deemed to be the most appropriate metric to measure sustained long-term performance, is aligned with shareholder interests and does not encourage inappropriate risk taking. However, the Committee retains the discretion to set different measures for future LTIP awards as set out below.
Some past LTIP awards have been subject to a performance condition requiring growth in earnings per share (EPS) (in excess of inflation) over the performance period (with 50% of the award subject to the EPS condition and 50% to the TSR condition). A split EPS and TSR condition may be reintroduced for future LTIP grant cycles, if a suitably robust earnings growth measure can be determined and the Committee considers it is appropriate to do so. The Committee would inform its major shareholders in advance of such a measure being set but considers that this would not constitute a change in policy, and therefore would not require a revised vote on the policy report.
Under the rules of the plan, the Committee has the discretion to adjust the targets applying to existing awards in exceptional circumstances providing the new targets are no less challenging than originally envisaged. The Committee also has the power to adjust the number of shares subject to an award in the event of a variation in the capital of the Company.
Awards under the LTIP may be granted as conditional allocations or nil (or nominal) cost options with, or as, forfeitable shares. The Committee may also decide to grant cash based awards of an equivalent value to share based awards or to satisfy share based awards in cash, although it does not currently intend to do so. Awards are satisfied through a mixture of either market purchase or new issue shares. To the extent new issue shares are used, the 2008 LTIP will adhere to a 5% in 10 year dilution limit.
Page Title at start:Content Section at start:

Annual Report & Accounts 2016
Governance
68 | HomeServe plc
ClawbackThe Committee has the power to reclaim some, or all, of a cash bonus and vested LTIP awards (performance and matching) in exceptional circumstances, such as misstatement of financial results, an error in assessment of performance, the use of misleading information and/or gross misconduct on the part of the individual.
Legacy arrangementsDetails of the outstanding share awards held by directors are set out in the annual report on remuneration. These include vested but unexercised awards granted to Richard Harpin under the Executive Share Option Plan (ESOP) and Deferred Bonus Plan (DBP) (which may be exercised at any time until the tenth anniversary of grant) and unvested awards granted to the Executive Directors under the LTIP (which for the 2011 awards, include an earnings per share performance condition for 50% of the awards). No further awards may be granted under the ESOP or DBP.
For the avoidance of doubt, these outstanding share awards will be allowed to be paid out under the approved policy providing that the terms on which the awards have been granted are satisfied.
Changes to operation in FY16 and FY17To support the strategy of sustainable long-term earnings growth, an Earnings Per Share (EPS) performance condition was re-introduced (alongside TSR) for the FY16 awards. This approach will also be applied in FY17.
In addition, a post vesting holding period was introduced for awards granted in FY16 onwards. There will be a minimum period of five years from the date of grant of an award before shares can be sold. To the extent that nil cost options are exercised after the three year vesting point, but before five years, the net of tax value of the vested shares must continue to be held. The dividend roll up on unexercised nil cost options will continue until five years from grant. This five year view provides a longer-term perspective to the incentive programme than the three year performance period.
FY16 UpdateAny remaining outstanding legacy share awards were exercised during FY16.
Remuneration report continued
Page Title at start:Content Section at start:

Annual Report & Accounts 2016
HomeServe plc | 69
Governance
Remuneration report
PensionsExecutive Directors currently participate in one of two pension schemes (with benefits limited to their notional capped salary). An unapproved pension contribution is paid in respect of basic salary above the cap.
The Water Companies Pension Scheme
A funded, HMRC approved occupational defined benefit scheme
Members Richard Harpin
Main features • pension at normal retirement age of one-half of final pensionable salary and a tax free lump sum of one and a half times final pensionable salary on completion of 40 years’ service at an accrual rate of 80ths plus 3/80ths cash;
• life assurance of five times basic salary;
• pension payable in the event of ill health; and spouse’s pension on death;
• normal retirement at age 60.
Special features Non-contributory
The HomeServe Money Plan
A funded, HMRC approved occupational defined contribution scheme
Members Martin BennettJohnathan Ford
Main features • employer contributions of 20%;
• life assurance of five times basic salary;
• permanent health insurance;
• spouse’s pension on death;
• normal retirement at age 60.
Unapproved pension provision
A notional earnings cap restricts the benefits provided to members of the Water Companies Pension Scheme and the HomeServe Money Plan. An unapproved pension contribution, equal to 20% of the amount by which basic salary exceeds the notional cap is paid annually. Executives may choose to have this amount paid directly into their pension or may receive it as cash.
The notional cap is indexed in line with earnings inflation. For FY16 the notional cap was £133,324.
Page Title at start:Content Section at start:

Annual Report & Accounts 2016
Governance
70 | HomeServe plc
Shareholding guidelinesIt is the Board’s policy that Executive Directors and certain members of the Company’s senior management build up and retain a minimum shareholding in the Company. Each Executive Director is encouraged to hold shares of at least equal value to their annual basic salary.
If the holding guideline has not been fulfilled at the point of exercise of any option or the vesting of any other long-term incentive award, the Director must retain 50% of the net proceeds in the Company’s shares until the holding requirement is achieved. Details of the current shareholdings of the Executive Directors are provided later in this report..
How employees’ pay is taken into accountThe remuneration policy for the Executive Directors is designed with regard to the policy for employees across the Group as a whole. Our ability to meet our growth expectations and compete effectively is dependent on the skills, experience and performance of all of our employees. Our employment policies, remuneration and benefit packages for employees are regularly reviewed.
There are some differences in the structure of the remuneration policy for the Executive Directors and senior management team compared to other employees reflecting their differing responsibilities, with the principal difference being the increased emphasis on performance related pay for the more senior executives within the organisation. However, there are many common themes. For example, the structure of the annual bonus, with the focus on customer, commercial and personal performance is the same for employees at management grade and above (albeit with a higher weighting on personal performance at less senior grades).
Employee share ownership is encouraged and facilitated through extending participation in the LTIP to other senior leaders within the business and all UK based employees are able to participate in the Save as You Earn Scheme (subject to meeting the minimum service requirement).
Although the Committee does not consult directly with employees on directors’ pay, the Committee does take into consideration the pay and employment conditions of all employees when setting the policy for directors’ remuneration. In terms of comparison metrics, the Committee takes into account the average level of salary increase being budgeted for the UK workforce when reviewing the salary levels of the Executive Directors. The Committee is also mindful of any changes to the pay and benefit conditions for employees more generally when considering the policy for directors’ pay.
Changes to operation in FY16 and FY17The shareholding guideline was increased in FY16 to two times annual basic salary.
Remuneration report continued
Page Title at start:Content Section at start:

Annual Report & Accounts 2016
HomeServe plc | 71
Governance
Long-term share grants Annual bonus Total fixed payKey
3,200
3,000
2,800
2,600
2,500
2,200
2,000
1,800
1,600
1,400
1,200
1,000
800
600
400
200
0
£000
’s
£2,186
£1,385
£471
£2,378
£1,509
£515
£3,208
£2,036
£689
100% 34%
16%
50%
22%
17%
61%
34%
16%
50%
22%
17%
61%
34%
16%
50%
22%
17%
61%
100% 100%
Fixed Target R Harpin
Maximum Fixed Target M Bennett
Maximum Fixed Target J Ford
Maximum
Remuneration report
How shareholders’ views are taken into accountThe Committee considers shareholder feedback received regarding the Remuneration report annually and guidance from shareholder representative bodies more generally. These views are key inputs when shaping remuneration policy. The Committee consults with shareholders when considering changes to remuneration arrangements.
Overall balance of measures for variable pay for FY16Remuneration scenarios for Executive DirectorsThe chart below details the composition of each Executive Director’s remuneration package and how it varies at different levels of performance under the policy set out above. It demonstrates the balance between fixed and variable pay at threshold, on-target and maximum performance levels under the normal remuneration policy for the Executive Directors.
AssumptionsFixed fixed pay only (salary plus benefits plus pension). On target target annual bonus of 60% of salary plus target LTIP awards of 120% of salary plus matching awards of 60% of salary. Maximum maximum annual bonus of 100% of salary plus maximum LTIP awards of 200% of salary plus matching awards of 150% of salary.
Salary levels (on which other elements of the packages are calculated) are based on those applying from July 2016. The value of taxable benefits is based on the actual values paid in FY16.
Richard Harpin participates in a defined benefit scheme which has been valued according to BIS regulations. The other Executives participate in a defined contribution scheme, receiving 20% of basic salary as pension provision. The Executive Directors may participate in all-employee share schemes on the same basis as other employees. The value that may be received under these schemes is subject to tax approved limits. For simplicity, the value that may be received from participating in these schemes has been excluded from the above chart. The chart excludes the impact of share price growth.
Page Title at start:Content Section at start:

Annual Report & Accounts 2016
Governance
72 | HomeServe plc
Executive Directors’ service agreements and policy on payments for loss of officeUnder the Executive Directors’ service contracts twelve months’ notice of termination of employment is required by either party (reduced to six months if following a prolonged period of incapacity).
Dates of current contracts are summarised in the table below:
Name Date of contract
R Harpin 18 January 2002M Bennett 1 January 2013J Ford 1 October 2012
Should notice be served, the Executives can continue to receive basic salary, benefits and pension for the duration of their notice period. The Company may require the individual to continue to fulfil their current duties, or may assign a period of garden leave. The Company applies a general principle of mitigation in relation to termination payments and supports the use of phased payments.
Outplacement services may be provided where appropriate, and any statutory entitlements or sums to settle or compromise claims in connection with a termination (including, at the discretion of the Committee, reimbursement for legal advice) would be paid as necessary.
The service contracts also enable the Company to elect to make a payment in lieu of notice equivalent in value to twelve months’ base salary, benefits and pension (and full bonus in the case of Richard Harpin).
In the event of cessation of employment, the executives may still be eligible for a performance related bonus for the period worked. Different performance measures may be set to reflect changes in the director’s responsibilities until the point of departure.
The rules of the LTIP set out what happens to outstanding share awards if a participant leaves employment before the end of the vesting period. Generally, any outstanding share awards will lapse when an Executive leaves employment, except in certain circumstances. If the Executive leaves employment as a result of redundancy, death, ill-health, injury, disability, retirement, transfer of employment or any other reason at the discretion of the Committee, then they will be treated as a ‘good leaver’ under the plan rules.
Remuneration report continued
Page Title at start:Content Section at start:

Annual Report & Accounts 2016
HomeServe plc | 73
Governance
Remuneration report
For a good leaver, any outstanding unvested LTIP awards will vest on the normal vesting date subject to an assessment of performance, with a pro-rata reduction to reflect the proportion of the vesting period served. The Committee may dis-apply the time pro-rating requirement if it considers it appropriate to do so. In the case of cessation due to death, the Committee can determine that the awards vest early. Outstanding vested but not exercised awards can be exercised by a good leaver until the expiry of the normal exercise period (or within 12 months in the case of death).
In determining whether an Executive should be treated as a good leaver and the extent to which their award may vest, the Committee will take into account the circumstances of an individual’s departure.
The treatment of share awards on a change of control is the same as that set out above in relation to a good leaver (albeit with the vesting period automatically ending on the date of the change in control).
Recruitment policyBase salary levels will be set in accordance with HomeServe’s remuneration policy, taking account of the executive’s skills, experience and their current remuneration package. Where it is appropriate to offer a lower salary initially, a series of increases to the desired salary positioning may be given over subsequent years subject to individual performance. Benefits will generally be provided in accordance with the approved policy, with relocation expenses and/or an expatriate allowance paid for if necessary. For an overseas appointment (which may include the relocation of an existing Director), the benefit and pension arrangements may be tailored to reflect local market practice (subject to the overall maximum limits on pension set out in the policy table).
The structure of the variable pay element will be in accordance with HomeServe’s policy as detailed above. The maximum permitted variable pay opportunity under the Plan rules is 450% of salary (100% of salary bonus + 200% of salary LTIP + 150% of salary matching award). However, the normal award limits are a bonus of 100% of salary, a performance share award of 150% of salary and up to a 150% of salary matching award. In the case of the matching awards, a new recruit may invest up to 25% of salary from their own funds in the first year in order to receive a matching award (in determining the number of matching awards to be granted, the investment is deemed to be made gross of tax).
Page Title at start:Content Section at start:
Annual Report & Accounts 2016
Governance
74 | HomeServe plc
The performance and matching awards would be granted on a consistent basis to the other Executive Directors. In the case of the annual bonus, different performance measures may be set for the first year, taking into account the responsibilities of the individual and the point in the financial year at which they joined. If it is necessary to buy-out incentive pay (which would be forfeited on leaving the previous employer) in order to secure the appointment, this would be provided for taking into account the form (cash or shares), timing and expected value (i.e. likelihood of meeting any existing performance criteria) of the remuneration being forfeited. The LTIP permits the grant of restricted share awards to Executive Directors in the case of recruitment to facilitate this, although awards may also be granted outside of this scheme if necessary, and as permitted under the Listing Rules.
The service contract for a new appointment would be in accordance with the policy for the current Executive Directors and in line with the contract for Johnathan Ford (which is the most recent).
In the case of an internal hire, any outstanding variable pay awarded in relation to the previous role will be allowed to pay out according to its terms of grant.
Fees for a new Chairman or Non-Executive Director will be set in line with the approved policy.
Non-Executive Directors’ letters of appointmentNon-Executive Directors serve under letters of appointment for periods of three years. The Non-Executive Directors (including the Chairman) have a notice period of three months but no liquidated damages are payable.
Fees are determined by the Executive Directors within the limits set by the Articles of Association, and are based on information on fees paid in similar companies and the skills and the expected time commitment of the individual concerned. Non-Executive Directors are not entitled to bonus payments or pension arrangements, nor do they participate in the Company’s long-term incentive plans.
Details of their current three year appointments are as follows:
Name Date of contract
J M B Gibson 1 April 2016S David 23 November 2013C Havemann 1 December 2015B Mingay 1 January 2015M Morris 27 February 2015
Outside AppointmentsExecutive Directors may hold one outside appointment and can retain any fees received.
Remuneration report continued
Page Title at start:Content Section at start:

Annual Report & Accounts 2016
HomeServe plc | 75
Governance
Remuneration report
Annual Report on RemunerationThis part of the report has been prepared in accordance with Part 3 of the revised Schedule 8 set out in The Large and Medium-sized Companies and Groups (Accounts and Reports) (Amendment) Regulations 2013, and 9.8.6R of the Listing Rules. The annual report on remuneration will be put to an advisory shareholder vote at the 2016 Annual General Meeting.
Remuneration Committee MembersStella David (Chairman)JM Barry GibsonMark MorrisBen Mingay
All of the members are independent Non-Executive Directors. The Board determined that the Company Chairman, Barry Gibson, should remain a member of the Committee taking account of the fact that he was considered to be independent on appointment and also that, as a former Chairman of the Remuneration Committee, his knowledge of the development of the remuneration policy and practices at HomeServe is invaluable. He takes no part in discussions relating to his own remuneration.
ResponsibilitiesThe primary responsibilities of the Committee are to:
• determine the Group’s overall remuneration strategy
• determine the remuneration packages of the Executive Directors and other members of the Executive Committee
• approve the grant and exercise of executive long-term incentive arrangements and oversee the operation of other share-based plans across the Group.
In determining remuneration policy, the Committee is free to obtain such professional advice as it sees fit, and it periodically monitors both the policies of comparator companies and current market practice in order to ensure that the packages provided are sufficient to attract and retain Executive Directors of the necessary quality.
Page Title at start:Content Section at start:

Annual Report & Accounts 2016
Governance
76 | HomeServe plc
The Committee aims to develop and recommend remuneration strategies that drive performance and reward it appropriately. In determining its policy, the Committee has paid regard to the principles and provisions of good governance contained in the Code and the guidelines issued by institutions such as the Investment Association, ISS and the NAPF. The Committee operates under the delegated authority of the Board and its terms of reference are available on the website.
The remuneration of Non-Executive Directors is a matter for the Board. No Director is involved in determining his or her own remuneration.
The Committee has also agreed and implemented a procedure for reviewing and assessing its own effectiveness.
AdvisersDuring the year New Bridge Street (’NBS‘), a firm of independent remuneration consultants, served as advisers to the Committee. NBS also provided technical implementation and accounting advice in relation to the administration of the Company’s share schemes. Other than in relation to advice on remuneration, NBS has no other connections with the Company. NBS is a trading name of Aon Hewitt Ltd, the ultimate parent company of which is Aon plc. Aon UK Ltd (another Aon company) provides insurance broking services to HomeServe. The Remuneration Committee is comfortable that this does not present a conflict of interest as Aon Benfield and NBS operate entirely independently of one another. The fees paid to NBS during the year for services to the Committee were £57,000.
The Committee has also received assistance from Richard Harpin, Group Chief Executive, Emma Thomas, Group Legal and HR Director and Anna Maughan, Company Secretary, all of whom attended meetings of the Committee as required. No Executive took part in discussions in respect of matters relating directly to their own remuneration.
Remuneration report continued
Page Title at start:Content Section at start:

Annual Report & Accounts 2016
HomeServe plc | 77
Governance
Remuneration report
Remuneration for the year under review (Audited)
Year
Salary and Fees
£000
Taxable Benefits3
£000Pension4
£000Bonus £000
LTIP5
£000Other6
£000
Total 2016
£000
Total 2015
£000
Executives
R Harpin 2016 550 26 113 539 2,127 – 3,355
2015 546 25 101 528 – – 1,200
M Bennett 2016 406 20 81 350 1,240 – 2,097
2015 400 20 80 384 – – 884
J Ford 2016 363 17 73 368 – 10 831
2015 314 18 63 312 – – 707
Non-Executives
J M B Gibson 2016 230 – – – – – 230
2015 230 – – – – – 230
I Chippendale1 2016 – – – – – – –
2015 68 – – – – – 68
S David 2016 63 – – – – – 63
2015 50 – – – – – 50
C Havemann2 2016 18 – – – – – 18
2015 – – – – – – –
B Mingay 2016 53 – – – – – 53
2015 50 – – – – – 50
M Morris 2016 71 – – – – – 71
2015 60 – – – – – 60
Total 2016 1,754 63 267 1,257 3,367 10 6,718
Total 2015 1,718 63 244 1,224 – – 3,2491 Ian Chippendale stepped down on 31 March 2015. 2 Chris Havemann was appointed on 1 December 2015.3 Benefits comprise company car, fuel allowance and medical insurance.4 Details of pension benefits and contributions can be found later on in the report. 5 No LTIPs vested in FY15 as the performance conditions were not met. The 2012 awards vested in full in FY16.6 ‘Other’ represents the value of any sharesave options exercised.
Page Title at start:Content Section at start:

Annual Report & Accounts 2016
Governance
78 | HomeServe plc
Details of variable pay earned in the year (Audited)Annual BonusFor FY16, the annual bonus was based on the following stretching targets:
Bonus targets for Richard Harpin (CEO) and Johnathan Ford (CFO) Weighting
% Payable at
Threshold ThresholdTarget/Stretch Actual % Payable
Commercial objectives
Group adjusted profit before tax 20% 25% £87.97m £92.6m £93.0m 100%
Group net debt1 5% – – £184m £169.5m 100%
Group core renewable customers 15% 0% 6.594m 6.941m 6.944m 100%
Customer objectives
Group customer complaints as a percentage of customers (based on weighted average reduction across UK, US, France, Spain and Italy)²
15% 0% See note 2 below
2.37% 1.94% 100%
Reduction in customer dissatisfaction (measured as a weighted average level of customer dissatisfaction across UK, US, France, Spain and Italy)2
15% 0% See note 2 below
7.8% 7.2% 100%
Increase in Group employee engagement¹
10% – – 80% 81% 100%
Personal objectives
Mr Harpin’s objectives related to strategic development, talent management and innovation (specifically including the acceleration of digital activity).
20% 90%
Mr Ford’s objectives related to efficiency initiatives, driving a cash focused culture, underwriting strategy and the effectiveness of decision making.
20% 90%
1 No bonus was payable for below target performance.
² Payments were calculated on a straight line basis between 80% and 100% achievement of the target.
Remuneration report continued
Page Title at start:Content Section at start:
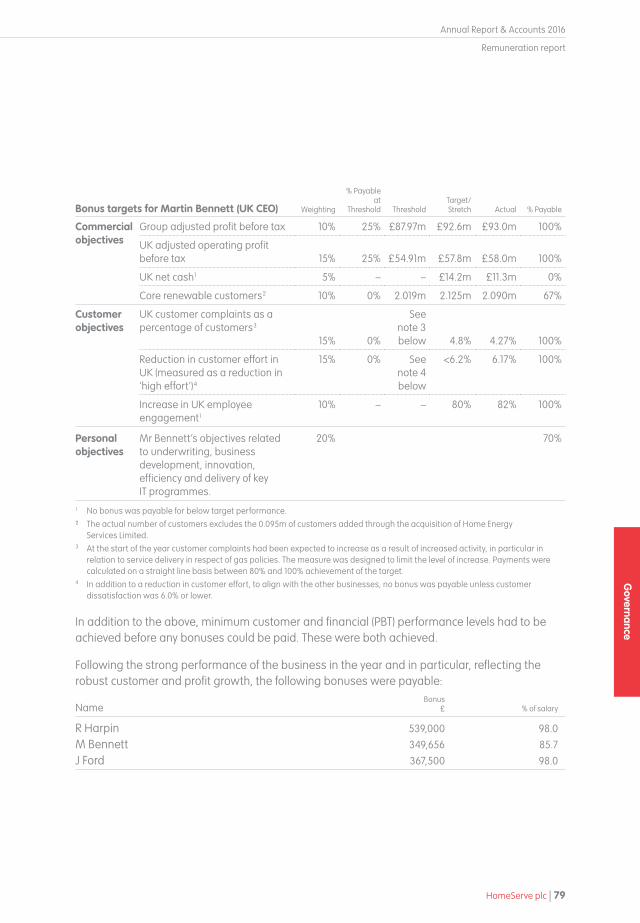
Annual Report & Accounts 2016
HomeServe plc | 79
Governance
Remuneration report
Bonus targets for Martin Bennett (UK CEO) Weighting
% Payable at
Threshold ThresholdTarget/Stretch Actual % Payable
Commercial objectives
Group adjusted profit before tax 10% 25% £87.97m £92.6m £93.0m 100%
UK adjusted operating profit before tax 15% 25% £54.91m £57.8m £58.0m 100%
UK net cash1 5% – – £14.2m £11.3m 0%
Core renewable customers2 10% 0% 2.019m 2.125m 2.090m 67%
Customer objectives
UK customer complaints as a percentage of customers3
15% 0%
See note 3 below 4.8% 4.27% 100%
Reduction in customer effort in UK (measured as a reduction in 'high effort')4
15% 0% See note 4 below
<6.2% 6.17% 100%
Increase in UK employee engagement1
10% – – 80% 82% 100%
Personal objectives
Mr Bennett’s objectives related to underwriting, business development, innovation, efficiency and delivery of key IT programmes.
20% 70%
1 No bonus was payable for below target performance.
² The actual number of customers excludes the 0.095m of customers added through the acquisition of Home Energy Services Limited.
3 At the start of the year customer complaints had been expected to increase as a result of increased activity, in particular in relation to service delivery in respect of gas policies. The measure was designed to limit the level of increase. Payments were calculated on a straight line basis between 80% and 100% achievement of the target.
4 In addition to a reduction in customer effort, to align with the other businesses, no bonus was payable unless customer dissatisfaction was 6.0% or lower.
In addition to the above, minimum customer and financial (PBT) performance levels had to be achieved before any bonuses could be paid. These were both achieved.
Following the strong performance of the business in the year and in particular, reflecting the robust customer and profit growth, the following bonuses were payable:
NameBonus
£ % of salary
R Harpin 539,000 98.0
M Bennett 349,656 85.7
J Ford 367,500 98.0
Page Title at start:Content Section at start:
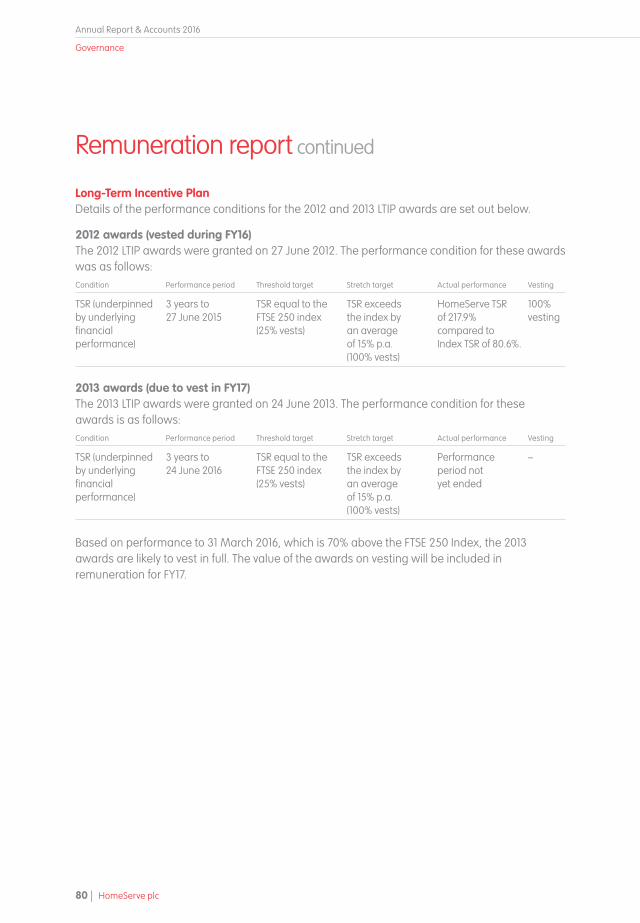
Annual Report & Accounts 2016
Governance
80 | HomeServe plc
Long-Term Incentive Plan Details of the performance conditions for the 2012 and 2013 LTIP awards are set out below.
2012 awards (vested during FY16)The 2012 LTIP awards were granted on 27 June 2012. The performance condition for these awards was as follows:Condition Performance period Threshold target Stretch target Actual performance Vesting
TSR (underpinned by underlying financial performance)
3 years to 27 June 2015
TSR equal to the FTSE 250 index (25% vests)
TSR exceeds the index by an average of 15% p.a. (100% vests)
HomeServe TSR of 217.9% compared to Index TSR of 80.6%.
100% vesting
2013 awards (due to vest in FY17)The 2013 LTIP awards were granted on 24 June 2013. The performance condition for these awards is as follows:Condition Performance period Threshold target Stretch target Actual performance Vesting
TSR (underpinned by underlying financial performance)
3 years to 24 June 2016
TSR equal to the FTSE 250 index (25% vests)
TSR exceeds the index by an average of 15% p.a. (100% vests)
Performance period not yet ended
–
Based on performance to 31 March 2016, which is 70% above the FTSE 250 Index, the 2013 awards are likely to vest in full. The value of the awards on vesting will be included in remuneration for FY17.
Remuneration report continued
Page Title at start:Content Section at start:

Annual Report & Accounts 2016
HomeServe plc | 81
Governance
Remuneration report
Summary of outstanding awards (Audited)LTIPDetails of the maximum number of shares receivable from awards made under the LTIP are as follows:
31 March 2016Awarded
during yearLapsed
during yearVested
during year31 March
2015Date
grantedType of award
R Harpin – – – 344,822 344,822 27.6.12 Performance– – – 163,563 163,563 27.6.12 Matching
289,528 – – – 289,528 24.6.13 Performance282,464 – – – 282,464 24.6.13 Matching247,301 – – – 247,301 23.6.14 Performance247,298 – – – 247,298 23.6.14 Matching251,774 251,774 – – – 25.6.15 Performance188,135 188,135 – – – 25.6.15 Matching
M Bennett – – – 293,448 293,448 27.6.12 Performance202,630 – – – 202,630 24.6.13 Performance192,038 – – – 192,038 24.6.13 Matching184,615 – – – 184,615 23.6.14 Performance175,958 – – – 175,958 23.6.14 Matching186,770 186,770 – – – 25.6.15 Performance136,825 136,825 – – – 25.6.15 Matching
J Ford 152,310 – – – 152,310 24.6.13 Performance75,457 – – – 75,457 24.6.13 Matching
130,096 – – – 130,096 23.6.14 Performance130,094 – – – 130,094 23.6.14 Matching171,664 171,664 – – – 25.6.15 Performance
111,171 111,171 – – – 25.6.15 Matching
The performance conditions are as follows:
• 2012, 2013 and 2014 awards – 100% comparative TSR (FTSE 250 Index + 15% per annum for maximum vesting)
• 2015 awards – 25% comparative TSR (FTSE 250 Index + 15% per annum for maximum vesting) and 75% compound annual EPS growth (15% for maximum vesting)
Page Title at start:Content Section at start:

Annual Report & Accounts 2016
Governance
82 | HomeServe plc
Further details on awards granted in the yearOn 25 June 2015, the following performance and matching share awards were granted to the Executive Directors under the LTIP:
Performance share awards
Date of grant
Number of shares
Share price used to
determine awards
Award size (% salary)
Face value £
% that vests at
threshold
R Harpin 25.6.15 251,774 £4.369 200% 1,100,000 25%M Bennett 25.6.15 186,770 £4.369 200% 815,998 25%J Ford 25.6.15 171,664 £4.369 200% 750,000 25%
Matching share awards
Date of grant
Number of Investment
shares purchased Award Size
Number of shares subject
to Matching Award
Share price used to
determine awards
Face value£
% that vests at
threshold
R Harpin 25.6.15 49,856 2:1 match 188,135 £4.3546 819,252 25%M Bennett 25.6.15 36,259 2:1 match 136,825 £4.3546 595,818 25%J Ford 25.6.15 29,460 2:1 match 111,171 £4.3546 484,105 25%
Both the performance and matching awards are subject to two conditions. 25% of the award is subject to a relative total shareholder return performance condition that requires HomeServe’s TSR to match that of the FTSE 250 Index over a three year performance period for threshold vesting, increasing on a straight-line basis to Index + 15% pa. for full vesting. The other 75% of the award is subject to an earnings per share condition that requires compound annual EPS growth of 6% to 15% per annum. 6% growth would result in threshold vesting, increasing on a straight-line basis to full vesting if growth of 15% is achieved.
Vesting in respect of both conditions is subject to underlying financial performance.
Further details on awards vested in the yearPerformance and matching awards granted on 27 June 2012 vested in full during the year. Awards were structured as nil cost options.
Date of grant Type of AwardDate of
exerciseNumber
of sharesShare price at
exerciseFace value at
exercise £
R Harpin 27.6.12 Performance 6.7.15 344,822 £4.184 1,442,73527.6.12 Matching 6.7.15 163,563 £4.184 684,347
M Bennett 27.6.12 Performance 3.7.15 293,448 £4.224 1,239,524
Remuneration report continued
Page Title at start:Content Section at start:

Annual Report & Accounts 2016
HomeServe plc | 83
Governance
Remuneration report
Deferred Bonus Plan (DBP)The DBP was introduced in 2005. Under its terms, Executive Directors were able to invest some, or all, of their annual bonus into shares and defer receipt for three years. Matching shares could be earned if the TSR of the Company exceeded the median of the FTSE 350 Index of companies (excluding investment trusts). Richard Harpin elected to convert his 2005 award into a nil cost option at the end of the performance period. The option (over 256,995 shares) can be exercised at any time up until the tenth anniversary of grant (2 August 2015).
31 March 2016Granted
during yearLapsed
during yearExercised
during year 31 March 2015 Option price Date granted
R Harpin – – – 256,995 256,995 £1.922 2.8.05
The option was exercised on 19 June 2015. The share price on that day was £4.265.
Executive Share Option Plan (ESOP)The ESOP was approved by shareholders in 2001. Options were granted on an annual basis and became exercisable between three and ten years from the date of grant subject to the achievement of stretching performance criteria based on EPS growth. The option price was the market price on the last dealing day prior to the date of grant.
31 March 2016Granted
during yearLapsed
during yearExercised
during year 31 March 2015 Option price Date granted
R Harpin – – – 255,000 255,000 £1.922 28.6.05
The option was exercised on 19 June 2015. The share price on that day was £4.265.
Save as you earn (Sharesave) schemes
31 March 2016
Granted during
year
Lapsed during
yearExercised
during year 31 March 2015Option
priceDate
granted
Date exercisable
from
R Harpin 8,152 – – – 8,152 £1.84 19.12.11 1.3.17M Bennett 8,152 – – – 8,152 £1.84 19.12.11 1.3.17J Ford – – – 4,591 4,591 £1.96 17.12.12 1.3.16
SAYE options are exercisable for a six month period from the date shown. Mr Ford exercised his option on 1 March 2016. The share price on that day was £4.102.
Page Title at start:Content Section at start:

Annual Report & Accounts 2016
Governance
84 | HomeServe plc
Shareholding Guidelines (Audited)It is the Board’s policy that Executive Directors and certain members of the Company’s senior management build up and retain a minimum shareholding in the Company. With effect from FY16, each Executive Director has been encouraged to hold shares of at least equal value to 200% of his annual basic salary and a guideline holding of 200% of fees was introduced for Non-Executive Directors.
If the holding guideline has not been fulfilled at the point of exercise of any option or the vesting of any other long-term incentive award, the Director must retain 50% of the net proceeds in the Company’s shares until the holding requirement is achieved. Details of the current shareholdings of the Executive Directors are in the table below.
The beneficial interests of Directors who served at the end of the year, together with those of their families, in the shares of the Company are as follows:
Number of shares owned Other interests in shares
Total31 March 2016
Value of shares
counting towards
guideline holding (as a %
of salary)2Guideline
met?31 March 2016
Holding post consolidation
on 20 July 20151 31 March 2015
Outstanding LTIP
awards
Outstanding Share
Options
R Harpin3 38,519,655 38,519,655 40,412,474 1,506,500 8,152 40,034,307 30,157% YesM J Bennett 352,094 352,094 187,740 1,078,836 8,152 1,440,082 372% YesJ Ford 82,525 77,934 54,471 487,957 570,482 95% NoJ M B Gibson 126,070 116,070 75,000 – – 126,070 236% YesS David 26,128 26,128 17,688 – – 26,128 188% NoC Havemann4 – – – – – – – NoB Mingay 37,142 37,142 20,000 – – 37,142 320% YesM C Morris 30,468 30,468 17,500 – – 30,468 194% No
¹ HomeServe plc shares were consolidated on a 13 for 14 basis on 20 July 2015.
² Calculated using the share price on 31 March 2016 of £4.306 divided by the Executive’s salary or Non-Executive’s fee on that date.
³ Includes an indirect interest of 28,500.4 Chris Havemann was appointed on 1 December 2015.
There were no changes in the Directors’ interests in shares between 31 March and 24 May 2016.
Remuneration report continued
Page Title at start:Content Section at start:

Annual Report & Accounts 2016
HomeServe plc | 85
Governance
Remuneration report
Directors’ pensions (Audited)Members of the Water Companies Pension SchemeDetails of the calculation of the single figures relating to Richard Harpin’s individual pension entitlements in the HomeServe plc Section of the Water Companies Pension Scheme, as required under Schedule 8 of the Large Companies Regulations and the Listing Rules, are shown below:
2016£000
2015£000
Accrued pension per annum at end of period 1 55 52Accrued lump sum at end of period 1 165 157Director’s contributions in the period – –Single figure of pension remuneration attributable to the Scheme 2 30 18Unapproved pension contributions paid as cash 83 83
¹ The accrued pension and lump sum figures are the leaving service benefits to which the Director would have been entitled had they left the Section at the relevant date.
² This is calculated as 20 times the increase in the accrued pension over the period after allowing for CPI inflation plus the increase in accrued lump sum (also after allowing for CPI inflation), less the contributions made by the Director over the period.
Members of the HomeServe Money PlanMartin Bennett and Johnathan Ford were members of the Company’s money purchase pension scheme. Contributions paid by the Company into the Plan were as follows:
2016£000
2015£000
M Bennett 27 26J Ford 27 26
In addition, the following unapproved pension contributions were paid in respect of earnings in excess of the notional earnings cap:
2016£000
2015£000
M Bennett ¹ 55 54J Ford ² 46 37
¹ Mr Bennett chose to have his unapproved contributions paid partly into the Plan and partly as cash in FY15 and as cash only in FY16.
² Mr Ford chose to take his unapproved contributions as cash in both years.
Page Title at start:Content Section at start:
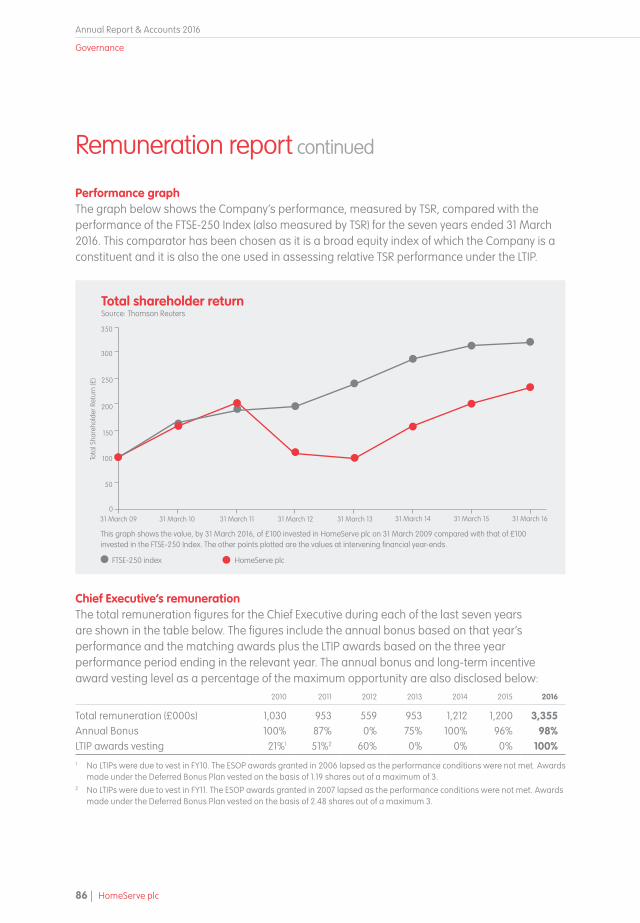
Annual Report & Accounts 2016
Governance
86 | HomeServe plc
Total shareholder returnSource: Thomson Reuters
This graph shows the value, by 31 March 2016, of £100 invested in HomeServe plc on 31 March 2009 compared with that of £100 invested in the FTSE-250 Index. The other points plotted are the values at intervening financial year-ends.
FTSE-250 index HomeServe plc
Tota
l Sha
reho
lder
Ret
urn
(£)
300
250
200
100
150
50
350
031 March 09 31 March 10 31 March 11 31 March 12 31 March 13 31 March 14 31 March 15 31 March 16
Performance graphThe graph below shows the Company’s performance, measured by TSR, compared with the performance of the FTSE-250 Index (also measured by TSR) for the seven years ended 31 March 2016. This comparator has been chosen as it is a broad equity index of which the Company is a constituent and it is also the one used in assessing relative TSR performance under the LTIP.
Chief Executive’s remunerationThe total remuneration figures for the Chief Executive during each of the last seven years are shown in the table below. The figures include the annual bonus based on that year’s performance and the matching awards plus the LTIP awards based on the three year performance period ending in the relevant year. The annual bonus and long-term incentive award vesting level as a percentage of the maximum opportunity are also disclosed below:
2010 2011 2012 2013 2014 2015 2016
Total remuneration (£000s) 1,030 953 559 953 1,212 1,200 3,355Annual Bonus 100% 87% 0% 75% 100% 96% 98%LTIP awards vesting 21%1 51%2 60% 0% 0% 0% 100%1 No LTIPs were due to vest in FY10. The ESOP awards granted in 2006 lapsed as the performance conditions were not met. Awards
made under the Deferred Bonus Plan vested on the basis of 1.19 shares out of a maximum of 3.2 No LTIPs were due to vest in FY11. The ESOP awards granted in 2007 lapsed as the performance conditions were not met. Awards
made under the Deferred Bonus Plan vested on the basis of 2.48 shares out of a maximum 3.
Remuneration report continued
Page Title at start:Content Section at start:
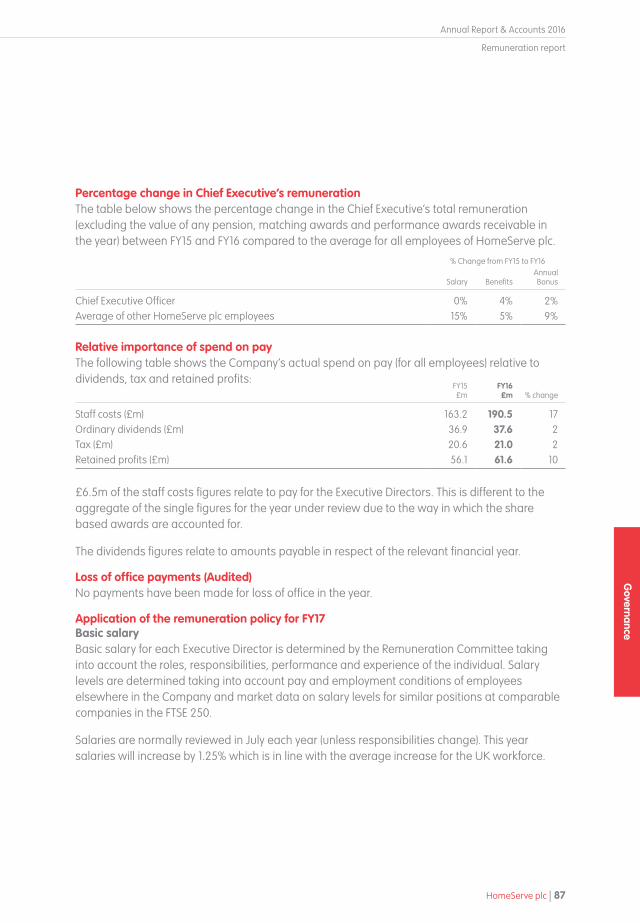
Annual Report & Accounts 2016
HomeServe plc | 87
Governance
Remuneration report
Percentage change in Chief Executive’s remunerationThe table below shows the percentage change in the Chief Executive’s total remuneration (excluding the value of any pension, matching awards and performance awards receivable in the year) between FY15 and FY16 compared to the average for all employees of HomeServe plc.
% Change from FY15 to FY16
Salary BenefitsAnnual Bonus
Chief Executive Officer 0% 4% 2%Average of other HomeServe plc employees 15% 5% 9%
Relative importance of spend on payThe following table shows the Company’s actual spend on pay (for all employees) relative to dividends, tax and retained profits:
FY15£m
FY16£m % change
Staff costs (£m) 163.2 190.5 17Ordinary dividends (£m) 36.9 37.6 2Tax (£m) 20.6 21.0 2Retained profits (£m) 56.1 61.6 10
£6.5m of the staff costs figures relate to pay for the Executive Directors. This is different to the aggregate of the single figures for the year under review due to the way in which the share based awards are accounted for.
The dividends figures relate to amounts payable in respect of the relevant financial year.
Loss of office payments (Audited)No payments have been made for loss of office in the year.
Application of the remuneration policy for FY17Basic salaryBasic salary for each Executive Director is determined by the Remuneration Committee taking into account the roles, responsibilities, performance and experience of the individual. Salary levels are determined taking into account pay and employment conditions of employees elsewhere in the Company and market data on salary levels for similar positions at comparable companies in the FTSE 250.
Salaries are normally reviewed in July each year (unless responsibilities change). This year salaries will increase by 1.25% which is in line with the average increase for the UK workforce.
Page Title at start:Content Section at start:

Annual Report & Accounts 2016
Governance
88 | HomeServe plc
The salaries for the Executive Directors effective from 1 July 2016 will therefore be as follows:
Name of DirectorSalary as at
1 July 2015Salary as at
1 July 2016 Increase
R Harpin £550,000 £556,875 1.25%M Bennett £408,000 £413,100 1.25%J Ford £375,000 £379,688 1.25%
Fees for the Chairman and Non-Executive DirectorsAs detailed in the remuneration policy, the Company aims to set remuneration for Non-Executive Directors at a level which is sufficient to attract and retain Non-Executive Directors of the right calibre. The fees paid to the Chairman and the Non-Executive Directors are reviewed periodically. The fees for the Non-Executive Directors were last reviewed during FY15. The Chairman’s fee was reviewed in FY16 and it was increased from £230,000 to £250,000 with effect from 1 April 2016.
Details of the current fees are detailed in the table below.
Chairman’s fees £250,000Senior Independent Director additional fee £7,500Non-Executive Directors’ base fee £55,000Chair of Remuneration or Audit Committee £10,000
Annual bonus performance targetsThe annual bonus plan for FY17 will operate on a similar basis to FY16 and is consistent with the policy detailed earlier in this report. The Committee was of the view that the bonus plan had become overly complex. Having taken advice, it was agreed that the number of performance measures should be reduced for FY17. A significant part of the bonus will remain subject to non-financial measures reflecting the strong customer focus in the business.
The bonus measures will be as follows:Financial objectives (30% of bonus) Non-financial objectives (50% of bonus) Personal objectives (20% of bonus)
• Profit before tax (25%)
• Net debt (5%)
• Core renewable customers (25%)
• A reduction in customer dissatisfaction (25%)
• Up to five stretching personal objectives
The financial and non-financial objectives for Richard Harpin and Johnathan Ford will be based on Group performance. The financial objectives for Martin Bennett will be based on Group and UK performance and the non-financial objectives will be based on UK performance. The Committee considers the forward looking performance targets to be commercially sensitive but more detailed disclosure will be provided in next year’s remuneration report.
The Committee will have discretion to scale back any bonus payments if it is deemed appropriate.
Remuneration report continued
Page Title at start:Content Section at start:

Annual Report & Accounts 2016
HomeServe plc | 89
Governance
Remuneration report
Long-term incentives Performance criteriaOur long-term incentive plan is a mix of a Performance Share award (up to 200% of salary) and a Matching Share award (2:1 match on up to 75% of salary bonus invested in shares).
In line with the policy and the award levels granted last year, the FY17 Performance Share award for Executive Directors will be at 200% of salary. We consider that granting an award at the maximum policy level continues to remain appropriate given the stretching performance conditions applied and the desire to maintain the current momentum in the delivery of our 5 year strategic plan.
Last year, we reintroduced earnings per share targets as the core performance measure for our LTIP awards. 75% of the Performance and Matching Share awards were based on challenging earnings per share (EPS) targets with 25% of awards based on relative Total Shareholder Return (TSR). This approach will continue for FY17 supporting our growth strategy.
For Performance Share awards up to 150% of salary and all Matching Share awards, the performance targets for FY17 grants will be:FY17 weighting 3 year performance target Change from FY16
75% based on EPS 6% to 15% per annum EPS growth (for 25% to 100% vesting). No change
25% based on relative TSR
25% vesting for TSR equal to that of the FTSE 250 Index increasing on a straight-line basis to full vesting for out-performance of the Index by 15% per year or more
No change
For Performance Share awards between 150% and 200% of salary the performance targets for FY17 grants will be:FY17 weighting 3 year performance target Change from FY16
100% based on EPS
15% to 20% per annum EPS growth (for 0% to 100% vesting).
More challenging performance targets applied to top-slice of the performance share awards, with focus on earnings, reflecting our profit growth ambitions.
When setting the EPS target range for the FY17 grants, the Committee took into account internal projections and external forecasts. Having considered these projections and forecasts, the Committee believes that the EPS targets are appropriately stretching.
Holding period for vested sharesThe net of tax value of any share vesting under the LTIP must be held for a further two years, providing a long-term perspective to the incentive programme.
Page Title at start:Content Section at start:

Annual Report & Accounts 2016
Governance
90 | HomeServe plc
Shareholding guidelinesThe minimum required shareholding for each Executive Director will continue to be two times annual basic salary. Executives will be required to retain no less than 50% of the net of tax value of shares from vested awards until this new threshold is exceeded. Shareholding guidelines at two times their fee will also apply to Non-Executive Directors.
Shareholder voting at the 2015 Annual General MeetingAt last year’s Annual General Meeting held on 17 July 2015, the following votes from shareholders were received:
Remuneration reportTotal number
of votes% of
votes cast
For 242,904,666 98%Against 4,597,545 2%
Total votes cast (for and against excluding withheld votes) 247,502,211 100%Votes withheld 1,251,070
Total votes (including withheld votes) 248,753,281
GeneralThe market price of the Company’s shares at 31 March 2016 was £4.306 (2015: £3.826). During the year the price ranged from £3.632 to £4.432.
The shares required for share options and awards under any of the long-term incentive schemes described above may be fulfilled by the purchase of shares in the market by the Company’s Employee Benefit Trust (EBT). As beneficiaries under the EBT, the Directors are deemed to be interested in the shares held by the EBT which at 31 March 2016 amounted to 19,538 ordinary shares. Shares may also be fulfilled through newly issued shares, subject to the dilution limits within each scheme (which are fully compliant with investor guidelines).
By Order of the Board
Stella DavidChairman of the Remuneration Committee 24 May 2016
Remuneration report continued
Page Title at start:Content Section at start:

Annual Report & Accounts 2016
HomeServe plc | 91
Governance
Directors’ report
The Directors have pleasure in presenting their Annual Report and Accounts for the year ended 31 March 2016. The Corporate Governance report forms part of this report. An indication of likely future developments is included in the strategic report. Information about the use of financial instruments by the Group is given in note 38 to the financial statements.
DividendsThe Directors are recommending the payment on 1 August 2016 of a final dividend of 8.9p per ordinary share to shareholders on the register at the close of business on 8 July 2016 which, together with the net interim dividend of 3.8p per ordinary share paid on 8 January 2016, results in a total net dividend for the year of 12.7p per share (FY15: 11.5p). In addition, a special dividend of 30p per ordinary share was paid on 24 July 2015.
Dividend Tax AllowanceFrom April 2016, dividend tax credits will be replaced by an annual £5,000 tax free allowance. This allowance will apply to all dividend income across an individual’s entire share portfolio. For dividends received in excess of the allowance, individuals will pay tax based on their personal circumstances and income tax bracket.
The Company will continue to provide registered shareholders with a confirmation of the dividends paid.
Greenhouse Gas Emissions ReportingGlobal tonnes
of CO2eFY16
Global tonnes of CO2e
FY15
Combustion of fuel and operation of facilities 7,783 6,815Electricity, heat, steam and cooling purchased for own use 3,468 3,862
Total 11,251 10,677Tonnes of CO2e per thousand customers 1.59 1.68
We have reported on all of the emission sources required under the Large and Medium-Sized Companies and Groups (Accounts and Reports) Regulation 2008 as amended in August 2013. The reporting boundary used for collation of the above data is consistent with that used for consolidation purposes in the financial statement. We have used the GHG Protocol Corporate Accounting and Reporting Standard (revised edition), data gathered to fulfil our requirements under the CRC Energy Efficiency scheme, and emission factors from the UK Government’s GHG Conversion Factors for Company Reporting 2014 to calculate the above disclosures.
Directors’ report
Page Title at start:Content Section at start:Directors’ report
Annual Report & Accounts 2016
Governance
92 | HomeServe plc
Directors’ report continued
Capital StructureDetails of the issued share capital, together with details of shares issued during the year, are set out in note 24. On 20 July 2015 following the payment of a special dividend, the Company’s ordinary shares were consolidated on a 13 for 14 basis. There is one class of ordinary shares which carries no right to fixed income. Each share carries the right to one vote at a general meeting of the Company.
There are no specific restrictions on the size of a holding or on the transfer of shares, which are both governed by the general provisions of the Articles of Association and prevailing legislation. The Directors are not aware of any agreements between holders of the Company’s shares that may result in restrictions on the transfer of securities or on voting rights.
Details of employee share schemes are set out in note 35. No votes are cast in respect of the shares held in the Employee Benefit Trust and dividends are waived.
No person has any special rights of control over the Company’s share capital and all issued shares are fully paid. Subject to the Companies Act 2006 and any relevant authority of the Company in general meeting, the Company has authority to issue new shares.
The AGM held in 2015 authorised the Directors to allot shares in the capital of the Company within certain limited circumstances and as permitted by the Companies Act. A renewal of this authority will be proposed at the 2016 AGM.
Authority to purchase sharesThe Company was authorised at the 2015 AGM to purchase its own shares, within certain limits and as permitted by the Articles of Association. A renewal of this authority will be proposed at the 2016 AGM. No shares were purchased during the year and no shares are held in Treasury.
Significant agreements – change of controlThere are a number of agreements that take effect, alter or terminate upon a change of control of the Company such as commercial contracts, bank loan agreements, property lease arrangements and employees’ share plans. None of these are considered to be significant in terms of their likely impact on the business of the Group as a whole. Furthermore, the Directors are not aware of any agreements between the Company and its Directors and employees that provide for compensation for loss of office or employment that occurs because of a takeover bid.
Annual General MeetingThe 2016 Annual General Meeting of the Company is to be held on 15 July 2016. The notice of the meeting accompanies this report.
Page Title at start:Content Section at start:

Annual Report & Accounts 2016
HomeServe plc | 93
Governance
Directors’ report
Disclosure of Information to AuditorEach of the Directors confirms that:
• so far as the Director is aware, there is no relevant audit information of which the Company’s auditor is unaware; and
• the Director has taken all the steps that he or she ought to have taken as a director in order to make himself or herself aware of any relevant audit information and to establish that the Company’s auditor is aware of that information.
This confirmation is given and should be interpreted in accordance with the provisions of s418 of the Companies Act 2006.
Resolutions proposing the reappointment of Deloitte LLP as auditor and authorising the Board to fix its remuneration will be put to the Annual General Meeting.
Fixed AssetsCapital expenditure on tangible fixed assets amounted to £8.7m (FY15: £5.8m) during the year.
Substantial ShareholdingsAs far as the Directors are aware, no person had a beneficial interest in 3% or more of the voting share capital at 31 March and 24 May 2016, except for the following:
As at 31 March 2016 As at 24 May 2016Name Ordinary shares % Ordinary shares %
Invesco Ltd 64,649,094 21.0 64,643,584 21.0Richard Harpin¹ 38,519,655 12.5 38,519,655 12.5FIL Ltd 30,496,128 9.9 30,496,128 9.9Woodford Investment Management LLP 16,560,085 5.4 16,560,085 5.41 Includes an indirect interest of 28,500 shares
Taxation statusThe Company is not a close company within the meaning of the Income and Corporation Taxes Act 1988.
By Order of the Board
Anna MaughanCompany Secretary 24 May 2016
Page Title at start:Content Section at start:

Annual Report & Accounts 2016
Governance
94 | HomeServe plc
Directors’ responsibilities
The Directors are responsible for preparing the Annual Report, Remuneration report and the financial statements in accordance with applicable law and regulations.
Company law requires the Directors to prepare financial statements for each financial year. Under that law, the Directors are required to prepare the Group financial statements under International Financial Reporting Standards (’IFRSs‘) as adopted by the European Union and Article 4 of the IAS Regulation and have also chosen to prepare the parent Company financial statements under IFRS as adopted by the European Union. Under company law, the Directors must not approve the accounts unless they are satisfied that they give a true and fair view of the state of affairs of the Company and of the profit or loss of the Company for that period. In preparing these financial statements, the Directors are required to:
• properly select and apply accounting policies;
• present information, including accounting policies, in a manner that provides relevant, reliable, comparable and understandable information; and
• provide additional disclosures when compliance with the specific requirements in IFRSs are insufficient to enable users to understand the impact of particular transactions, other events and conditions on the entity’s financial position and financial performance and make an assessment of the Company’s ability to continue as a going concern.
The Directors are responsible for keeping proper accounting records that are sufficient to show and explain the Company’s transactions and that disclose with reasonable accuracy at any time the financial position of the Company and enable them to ensure that the financial statements comply with the Companies Act 2006. They are also responsible for safeguarding the assets of the Company and hence for taking reasonable steps for the prevention and detection of fraud and other irregularities.
The Directors are responsible for the maintenance and integrity of the corporate and financial information included on the Company’s website. Legislation in the United Kingdom governing the preparation and dissemination of financial statements may differ from legislation in other jurisdictions.
Page Title at start:Content Section at start:Directors’ responsibilities

Annual Report & Accounts 2016
HomeServe plc | 95
Governance
Directors’ responsibilities
Directors’ responsibility statementWe confirm to the best of our knowledge:
• the Group financial statements, prepared in accordance with IFRSs as adopted by the EU, give a true and fair view of the assets, liabilities, financial position and profit or loss of the Company and the undertakings included in the consolidation taken as a whole;
• the Strategic report includes a fair review of the development and performance of the business and the position of the Company and the undertakings included in the consolidation taken as a whole, together with a description of the principal risks and uncertainties that they face; and
• the Annual Report and financial statements, taken as a whole, are fair, balanced and understandable and provide the information necessary for shareholders to assess the Group’s performance, business model and strategy.
By Order of the Board
Richard HarpinChief Executive Officer 24 May 2016
Johnathan FordChief Financial Officer 24 May 2016
Page Title at start:Content Section at start:

Annual Report & Accounts 2016
Financial statements
96 | HomeServe plc
Opinion on financial statements of HomeServe plcIn our opinion:
• the financial statements give a true and fair view of the state of the Group’s and of the Parent Company’s affairs as at 31 March 2016 and of the Group’s profit for the year then ended;
• the Group financial statements have been properly prepared in accordance with International Financial Reporting Standards (IFRSs) as adopted by the European Union;
• the Parent Company financial statements have been properly prepared in accordance with IFRSs as adopted by the European Union and as applied in accordance with the provisions of the Companies Act 2006; and
• the financial statements have been prepared in accordance with the requirements of the Companies Act 2006 and, as regards the Group financial statements, Article 4 of the IAS Regulation.
The financial statements comprise the Group income statement, the Group and Company statements of comprehensive income, the Group and Company balance sheets, the Group and Company cash flow statements, the Group and Company statements of changes in equity and the related notes 1 to 52. The financial reporting framework that has been applied in their preparation is applicable law and IFRSs as adopted by the European Union and, as regards the Parent Company financial statements, as applied in accordance with the provisions of the Companies Act 2006.
Going concern and the directors’ assessment of the principal risks that would threaten the solvency or liquidity of the GroupAs required by the Listing Rules we have reviewed the directors’ statement regarding the appropriateness of the going concern basis of accounting contained on page 35 to the financial statements and the directors’ statement on the longer-term viability of the Group contained on page 34.
We have nothing material to add or draw attention to in relation to:
• the directors’ confirmation on page 34 that they have carried out a robust assessment of the principal risks facing the Group, including those that would threaten its business model, future performance, solvency or liquidity;
• the disclosures on pages 28-35 that describe those risks and explain how they are being managed or mitigated;
Independent Auditor’s report to the members of HomeServe plc
Page Title at start:Content Section at start:Financial statements Independent Auditor’s report
Annual Report & Accounts 2016
HomeServe plc | 97
Financial statements
Independent Auditor’s report to the members of HomeServe plc
• the directors’ statement on page 35 to the financial statements about whether they considered it appropriate to adopt the going concern basis of accounting in preparing them and their identification of any material uncertainties to the Group’s ability to continue to do so over a period of at least twelve months from the date of approval of the financial statements;
• the directors’ explanation on pages 34 and 35 as to how they have assessed the prospects of the Group, over what period they have done so and why they consider that period to be appropriate, and their statement as to whether they have a reasonable expectation that the Group will be able to continue in operation and meet its liabilities as they fall due over the period of their assessment, including any related disclosures drawing attention to any necessary qualifications or assumptions.
We agreed with the directors’ adoption of the going concern basis of accounting and we did not identify any such material uncertainties. However, because not all future events or conditions can be predicted, this statement is not a guarantee as to the Group’s ability to continue as a going concern.
IndependenceWe are required to comply with the Financial Reporting Council’s Ethical Standards for Auditors and we confirm that we are independent of the Group and we have fulfilled our other ethical responsibilities in accordance with those standards. We also confirm we have not provided any of the prohibited non-audit services referred to in those standards.
Our assessment of risks of material misstatementThe assessed risks of material misstatement described below are consistent with the prior year and are those that had the greatest effect on our audit strategy, the allocation of resources in the audit and directing the efforts of the engagement team.
Page Title at start:Content Section at start:

Annual Report & Accounts 2016
Financial statements
98 | HomeServe plc
Risk How the scope of our audit responded to the risk
Regulatory risk
As a home emergency and repair services provider, the Group operates within a regulated marketplace. Each component is subject to its own local country regulatory regime, resulting in varying degrees of regulatory complexity and oversight.
The Group is required to ensure that its sales and marketing, controls and governance, and complaints handling processes are structured in a manner which is compliant with the local countries’ regulatory regimes. To the extent this is not the case, the Group may be exposed to customer remediation, fines, reputational damage, or disclosures being made within the financial statements.
Further details of the regulatory risk are discussed in the Principal risks and uncertainties section of the Strategic report.
For each of the Group’s four main components we have assessed the design and implementation of management’s controls in place to monitor and respond to regulatory risks at a local level.
As part of our assessment we have held discussions with senior individuals in the risk, compliance and legal functions of the Group as well as considering the frequency of reporting of regulatory risk to the Group Audit & Risk Committee.
Where available, we have reviewed any regulatory correspondence between the component and local regulator.
In the UK we have spoken directly with the FCA’s supervisory team to obtain an independent view of the relationship with the FCA, as well as any immediate concerns that the FCA may have with the UK business.
Carrying value of goodwill and intangible assets
The carrying value of goodwill and intangible assets is £457.7m (2015: £403.1m).
The Group’s assessment of the carrying value of goodwill is a judgemental process which requires estimates concerning the future cash flows of each cash generating unit and associated discount rates, growth rates, selling prices and direct costs based on management’s view of future business prospects.
The key judgement in relation to other intangible assets relates to the expected future cash flows assigned to each relationship.
There is a risk that the management information used to make these judgements is either incomplete or inaccurate. For goodwill and other intangibles the risk being that the financial budgets and plans do not appropriately predict actual future cash flows.
Further detail on the key judgements involved is set out in the critical accounting judgements and key sources of estimation uncertainty in note 3 to the financial statements.
We challenged management’s assessment of whether there are any impairment indicators by considering the performance of each cash generating unit as well as any notable business developments during the year.
We challenged management’s key assumptions relating to the estimated future cash flows, growth rates, selling prices, direct costs and the discount rates applied to each cash generating unit. Our procedures included reviewing forecast cash flows with reference to historical trading performance, assessing the Group’s ability to accurately forecast business performance, consideration of future prospects of the business and benchmarking assumptions such as the discount rate to external macro-economic and market data using our internal valuations specialists.
We have reviewed the consistency of the key assumptions used in the carrying value of goodwill assessment to the budget used by the Group to assess longer term-viability and going concern.
For other intangible assets we have assessed the key assumptions used within the expected future cash flow assessment including the expected retention rates.
Independent Auditor’s Report to the members of HomeServe plc continued
Page Title at start:Content Section at start:
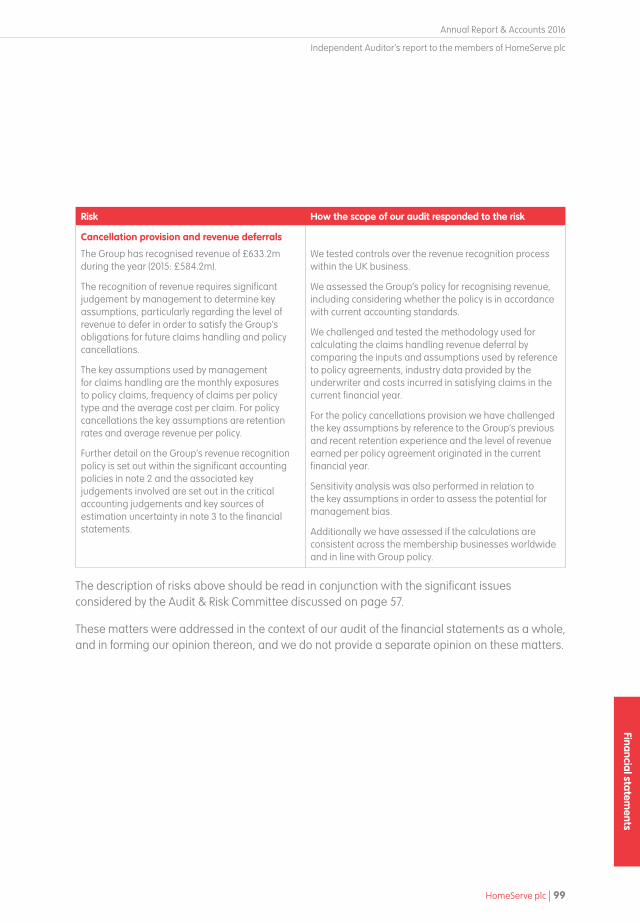
Annual Report & Accounts 2016
HomeServe plc | 99
Financial statements
Risk How the scope of our audit responded to the risk
Cancellation provision and revenue deferrals
The Group has recognised revenue of £633.2m during the year (2015: £584.2m).
The recognition of revenue requires significant judgement by management to determine key assumptions, particularly regarding the level of revenue to defer in order to satisfy the Group’s obligations for future claims handling and policy cancellations.
The key assumptions used by management for claims handling are the monthly exposures to policy claims, frequency of claims per policy type and the average cost per claim. For policy cancellations the key assumptions are retention rates and average revenue per policy.
Further detail on the Group’s revenue recognition policy is set out within the significant accounting policies in note 2 and the associated key judgements involved are set out in the critical accounting judgements and key sources of estimation uncertainty in note 3 to the financial statements.
We tested controls over the revenue recognition process within the UK business.
We assessed the Group’s policy for recognising revenue, including considering whether the policy is in accordance with current accounting standards.
We challenged and tested the methodology used for calculating the claims handling revenue deferral by comparing the inputs and assumptions used by reference to policy agreements, industry data provided by the underwriter and costs incurred in satisfying claims in the current financial year.
For the policy cancellations provision we have challenged the key assumptions by reference to the Group’s previous and recent retention experience and the level of revenue earned per policy agreement originated in the current financial year.
Sensitivity analysis was also performed in relation to the key assumptions in order to assess the potential for management bias.
Additionally we have assessed if the calculations are consistent across the membership businesses worldwide and in line with Group policy.
The description of risks above should be read in conjunction with the significant issues considered by the Audit & Risk Committee discussed on page 57.
These matters were addressed in the context of our audit of the financial statements as a whole, and in forming our opinion thereon, and we do not provide a separate opinion on these matters.
Independent Auditor’s report to the members of HomeServe plc
Page Title at start:Content Section at start:

Annual Report & Accounts 2016
Financial statements
100 | HomeServe plc
Our application of materialityWe define materiality as the magnitude of misstatement in the financial statements that makes it probable that the economic decisions of a reasonably knowledgeable person would be changed or influenced. We use materiality both in planning the scope of our audit work and in evaluating the results of our work.
We determined materiality for the Group to be £6.1m which is 7.5% of profit before tax and exceptional items. In 2015 materiality for the Group was £5.4m and represented 7.5% of profit before tax and exceptional items.
There are no exceptional items in the current year and the exclusion of exceptional items in the previous year was consistent with the Group’s internal and external reporting to facilitate a better understanding of the underlying trading performance.
We agreed with the Audit & Risk Committee that we would report to the Committee all audit differences in excess of £122,000 (2015: £100,000), as well as differences below that threshold that, in our view, warranted reporting on qualitative grounds. We also report to the Audit & Risk Committee on disclosure matters that we identified when assessing the overall presentation of the financial statements.
An overview of the scope of our auditOur Group audit was scoped by obtaining an understanding of the Group and its environment, including Group-wide controls, and assessing the risks of material misstatement at the Group level. Based on that assessment, as in the prior year, we focused our Group audit scope primarily on the audit work at the following components:
• UK;
• USA;
• France; and
• Spain.
All of these were subject to a full audit, whilst the New Markets segment was subject to specific audit procedures where the extent of our testing was based on our assessment of the risks of material misstatement and of the materiality of the Group’s operations at this location.
Independent Auditor’s Report to the members of HomeServe plc continued
Page Title at start:Content Section at start:

Annual Report & Accounts 2016
HomeServe plc | 101
Financial statements
The UK, USA, France and Spain components account for 96.9% (2015: 97.7%) of the Group’s revenue and 100% (2014: 100%) of the Group’s profit before tax from profit-making components (there was a loss for the year in the New Markets segment which is not subject to a full audit). They were also selected to provide an appropriate basis for undertaking audit work to address the risks of material misstatement identified above. Our audit work at the four components was executed at levels of materiality applicable to each individual entity which were lower than Group materiality and ranged from £3.0m to £4.6m (2015: £2.7m to £4.1m).
At the Parent entity level we also tested the consolidation process and carried out analytical procedures to confirm our conclusion that there were no significant risks of material misstatement of the aggregated financial information of the remaining components not subject to audit or audit of specified account balances.
The Group audit team continued to follow a programme of planned visits that has been designed so that a senior member of the Group audit team visits the USA, France, Spain and the UK at least once a year. In years when we do not visit a significant component we include the component audit team in discussions about the risk assessment, participate in their audit close meetings and review documentation of the findings from their work.
Opinion on other matters prescribed by the Companies Act 2006In our opinion:
• the part of the Directors’ Remuneration Report to be audited has been properly prepared in accordance with the Companies Act 2006; and
• the information given in the Strategic Report and the Directors’ Report for the financial year for which the financial statements are prepared is consistent with the financial statements.
Matters on which we are required to report by exceptionAdequacy of explanations received and accounting recordsUnder the Companies Act 2006 we are required to report to you if, in our opinion:
• we have not received all the information and explanations we require for our audit; or
• adequate accounting records have not been kept by the Parent company, or returns adequate for our audit have not been received from branches not visited by us; or
• the Parent company financial statements are not in agreement with the accounting records and returns.
We have nothing to report in respect of these matters.
Independent Auditor’s report to the members of HomeServe plc
Page Title at start:Content Section at start:
Annual Report & Accounts 2016
Financial statements
102 | HomeServe plc
Directors’ remunerationUnder the Companies Act 2006 we are also required to report if in our opinion certain disclosures of directors’ remuneration have not been made or the part of the Directors’ Remuneration Report to be audited is not in agreement with the accounting records and returns. We have nothing to report arising from these matters.
Corporate Governance StatementUnder the Listing Rules we are also required to review part of the Corporate Governance Statement relating to the company’s compliance with certain provisions of the UK Corporate Governance Code. We have nothing to report arising from our review.
Our duty to read other information in the Annual ReportUnder International Standards on Auditing (UK and Ireland), we are required to report to you if, in our opinion, information in the annual report is:
• materially inconsistent with the information in the audited financial statements; or
• apparently materially incorrect based on, or materially inconsistent with, our knowledge of the Group acquired in the course of performing our audit; or
• otherwise misleading.
In particular, we are required to consider whether we have identified any inconsistencies between our knowledge acquired during the audit and the directors’ statement that they consider the annual report is fair, balanced and understandable and whether the annual report appropriately discloses those matters that we communicated to the Audit & Risk Committee which we consider should have been disclosed. We confirm that we have not identified any such inconsistencies or misleading statements.
Respective responsibilities of directors and auditorAs explained more fully in the Directors’ Responsibilities Statement, the directors are responsible for the preparation of the financial statements and for being satisfied that they give a true and fair view. Our responsibility is to audit and express an opinion on the financial statements in accordance with applicable law and International Standards on Auditing (UK and Ireland). We also comply with International Standard on Quality Control 1 (UK and Ireland). Our audit methodology and tools aim to ensure that our quality control procedures are effective, understood and applied. Our quality controls and systems include our dedicated professional standards review team and independent partner reviews.
Independent Auditor’s Report to the members of HomeServe plc continued
Page Title at start:Content Section at start:

Annual Report & Accounts 2016
HomeServe plc | 103
Financial statements
This report is made solely to the company’s members, as a body, in accordance with Chapter 3 of Part 16 of the Companies Act 2006. Our audit work has been undertaken so that we might state to the company’s members those matters we are required to state to them in an auditor’s report and for no other purpose. To the fullest extent permitted by law, we do not accept or assume responsibility to anyone other than the company and the company’s members as a body, for our audit work, for this report, or for the opinions we have formed.
Scope of the audit of the financial statementsAn audit involves obtaining evidence about the amounts and disclosures in the financial statements sufficient to give reasonable assurance that the financial statements are free from material misstatement, whether caused by fraud or error. This includes an assessment of: whether the accounting policies are appropriate to the Group’s and the Parent Company’s circumstances and have been consistently applied and adequately disclosed; the reasonableness of significant accounting estimates made by the directors; and the overall presentation of the financial statements. In addition, we read all the financial and non-financial information in the annual report to identify material inconsistencies with the audited financial statements and to identify any information that is apparently materially incorrect based on, or materially inconsistent with, the knowledge acquired by us in the course of performing the audit. If we become aware of any apparent material misstatements or inconsistencies we consider the implications for our report.
Matthew Perkins (Senior statutory auditor)for and on behalf of Deloitte LLPChartered Accountants and Statutory AuditorBirmingham, UK24 May 2016
Independent Auditor’s report to the members of HomeServe plc
Page Title at start:Content Section at start:
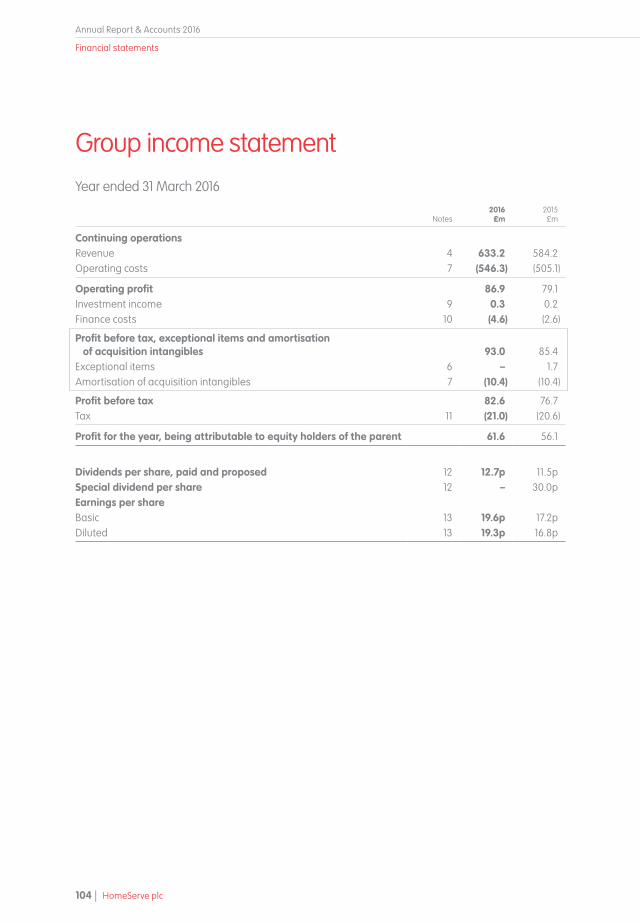
Annual Report & Accounts 2016
Financial statements
104 | HomeServe plc
Notes2016
£m2015£m
Continuing operationsRevenue 4 633.2 584.2 Operating costs 7 (546.3) (505.1)
Operating profit 86.9 79.1 Investment income 9 0.3 0.2 Finance costs 10 (4.6) (2.6)
Profit before tax, exceptional items and amortisation of acquisition intangibles 93.0 85.4
Exceptional items 6 – 1.7 Amortisation of acquisition intangibles 7 (10.4) (10.4)
Profit before tax 82.6 76.7 Tax 11 (21.0) (20.6)
Profit for the year, being attributable to equity holders of the parent 61.6 56.1
Dividends per share, paid and proposed 12 12.7p 11.5pSpecial dividend per share 12 – 30.0pEarnings per shareBasic 13 19.6p 17.2pDiluted 13 19.3p 16.8p
Year ended 31 March 2016
Group income statement
Page Title at start:Content Section at start:Group financial statements

Annual Report & Accounts 2016
HomeServe plc | 105
Financial statements
Notes2016
£m2015£m
Profit for the year 61.6 56.1 Items that will not be classified subsequently to profit and loss:Actuarial gain/(loss) on defined benefit pension scheme 36 0.5 (2.1)Deferred tax (charge)/credit relating to components of other
comprehensive income 21 (0.1) 0.4
0.4 (1.7)Items that may be reclassified subsequently to profit and loss:Exchange movements on translation of foreign operations 30 14.8 (11.6)Gain on revaluation of available for sale investments 17 2.5 –Deferred tax charge relating to revaluation of available for
sale investments 21 (0.7) –
16.6 (11.6)
Total comprehensive income for the year 78.6 42.8
Group statement of comprehensive income
Year ended 31 March 2016
Group statement of comprehensive income
Page Title at start:Content Section at start:

Annual Report & Accounts 2016
Financial statements
106 | HomeServe plc
Notes2016
£m2015£m
Non-current assetsGoodwill 14 247.7 236.6 Other intangible assets 15 210.0 166.5 Property, plant and equipment 16 34.9 31.3 Investments 17 7.8 4.4 Deferred tax assets 21 6.8 9.5 Retirement benefit assets 36 2.1 0.1
509.3 448.4
Current assetsInventories 18 2.9 0.8 Trade and other receivables 19 367.7 318.8 Cash and cash equivalents 19 54.2 74.7
424.8 394.3
Total assets 934.1 842.7
Current liabilitiesTrade and other payables 22 (360.7) (308.2)Current tax liabilities (7.0) (7.1)Obligations under finance leases 34 (0.9) (0.6)Bank and other loans 20 (25.0) –
(393.6) (315.9)
Net current assets 31.2 78.4
Non-current liabilitiesBank and other loans 20 (196.5) (137.6)Other financial liabilities 23 (5.6) (2.1)Deferred tax liabilities 21 (20.5) (18.0)Obligations under finance leases 34 (1.3) (0.6)
(223.9) (158.3)
Total liabilities (617.5) (474.2)
Net assets 316.6 368.5
EquityShare capital 24 8.3 8.3 Share premium account 25 41.1 40.5 Merger reserve 26 71.0 71.0 Own shares reserve 27 (0.1) (11.1)Share incentive reserve 28 16.0 15.7 Capital redemption reserve 29 1.2 1.2 Currency translation reserve 30 5.5 (9.3)Available for sale reserve 17 1.8 –Retained earnings 171.8 252.2
Total equity 316.6 368.5
The financial statements were approved by the Board of Directors and authorised for issue on 24 May 2016. They were signed on its behalf by:
Johnathan FordChief Financial Officer 24 May 2016
31 March 2016
Group balance sheet
Page Title at start:Content Section at start:
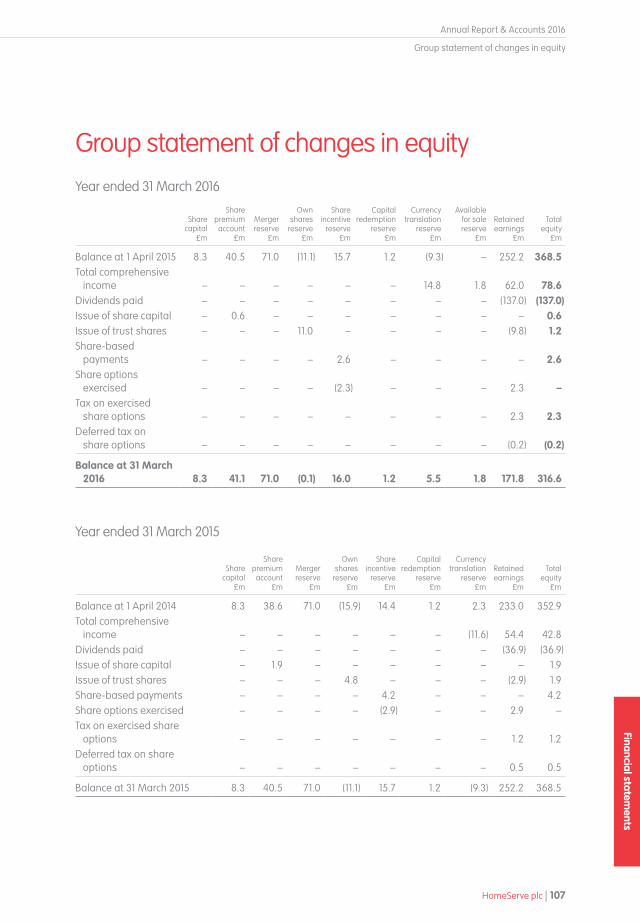
Annual Report & Accounts 2016
HomeServe plc | 107
Financial statements
Group statement of changes in equity
Share capital
£m
Share premium
account £m
Merger reserve
£m
Own shares
reserve£m
Share incentive
reserve£m
Capital redemption
reserve£m
Currency translation
reserve£m
Available for sale reserve
£m
Retained earnings
£m
Total equity
£m
Balance at 1 April 2015 8.3 40.5 71.0 (11.1) 15.7 1.2 (9.3) – 252.2 368.5 Total comprehensive
income – – – – – – 14.8 1.8 62.0 78.6 Dividends paid – – – – – – – – (137.0) (137.0)Issue of share capital – 0.6 – – – – – – – 0.6 Issue of trust shares – – – 11.0 – – – – (9.8) 1.2 Share-based
payments – – – – 2.6 – – – – 2.6 Share options
exercised – – – – (2.3) – – – 2.3 –Tax on exercised
share options – – – – – – – – 2.3 2.3 Deferred tax on
share options – – – – – – – – (0.2) (0.2)
Balance at 31 March 2016 8.3 41.1 71.0 (0.1) 16.0 1.2 5.5 1.8 171.8 316.6
Year ended 31 March 2015
Share capital
£m
Share premium
account £m
Merger reserve
£m
Own shares
reserve£m
Share incentive
reserve£m
Capital redemption
reserve£m
Currency translation
reserve£m
Retained earnings
£m
Total equity
£m
Balance at 1 April 2014 8.3 38.6 71.0 (15.9) 14.4 1.2 2.3 233.0 352.9 Total comprehensive
income – – – – – – (11.6) 54.4 42.8 Dividends paid – – – – – – – (36.9) (36.9)Issue of share capital – 1.9 – – – – – – 1.9 Issue of trust shares – – – 4.8 – – – (2.9) 1.9 Share-based payments – – – – 4.2 – – – 4.2 Share options exercised – – – – (2.9) – – 2.9 –Tax on exercised share
options – – – – – – – 1.2 1.2 Deferred tax on share
options – – – – – – – 0.5 0.5
Balance at 31 March 2015 8.3 40.5 71.0 (11.1) 15.7 1.2 (9.3) 252.2 368.5
Year ended 31 March 2016
Group statement of changes in equity
Page Title at start:Content Section at start:

Annual Report & Accounts 2016
Financial statements
108 | HomeServe plc
Notes2016
£m2015£m
Net cash inflow from operating activities 32 101.1 67.4
Investing activitiesInterest received 0.3 0.3 Proceeds on disposal of property, plant and equipment 0.2 –Purchases of intangible assets (56.8) (46.9)Purchases of property, plant and equipment (7.1) (5.9)Acquisition of available for sale investments 17 (0.5) (4.8)Net cash outflow on acquisitions 31 (5.3) (1.1)
Net cash used in investing activities (69.2) (58.4)
Financing activitiesDividends paid 12 (137.0) (36.9)Repayment of finance leases (0.5) (0.3)Issue of shares from the employee benefit trust 1.2 1.9 Proceeds on issue of share capital 24 0.6 1.9 Increase in bank and other loans 20 82.7 3.4
Net cash used in financing activities (53.0) (30.0)
Net decrease in cash and cash equivalents (21.1) (21.0)
Cash and cash equivalents at beginning of year 74.7 96.2 Effect of foreign exchange rate changes 0.6 (0.5)
Cash and cash equivalents at end of year 54.2 74.7
Year ended 31 March 2016
Group cash flow statement
Page Title at start:Content Section at start:

Annual Report & Accounts 2016
HomeServe plc | 109
Financial statements
Notes to financial statements
1. General informationHomeServe plc is a Company incorporated in the United Kingdom under the Companies Act. The address of the registered office is Cable Drive, Walsall, WS2 7BN.
These financial statements are presented in pounds sterling because that is the currency of the primary economic environment in which the Group operates. Foreign operations are included in accordance with the policies set out in note 2.
2. Significant accounting policiesBasis of accountingThe financial statements have been prepared in accordance with IFRSs, adopted by the European Union and therefore comply with Article 4 of the EU IAS Regulation. The financial statements have been prepared on the historical cost basis, except for certain financial instruments that are measured at fair value at the end of each reporting period as explained in note 38.
Adoption of new or revised standards and accounting policiesThe following accounting standards have been adopted in the year:
Amendments to IAS19 Defined Benefit Plans: Employee ContributionsAmendments to IAS27 Equity method in Separate Financial StatementsIFRIC21 LeviesAmendments to IAS16 & IAS41 Agriculture: Bearer PlantsAmendments to IAS16 & IAS38 Clarification of Acceptable Methods of Depreciation
and AmortisationAmendments to IFRS11 Accounting for Acquisitions of Interest in Joint OperationsAnnual improvements to IFRSs2012-2014 Cycle
All accounting standards listed above have been adopted but their adoption has not had any material impact on the amounts reported in this consolidated set of financial statements.
Year ended 31 March 2016
Notes to financial statements
Page Title at start:Content Section at start:

Annual Report & Accounts 2016
Financial statements
110 | HomeServe plc
2. Significant accounting policies continuedStandards in issue but not yet effectiveAt the date of authorisation of these financial statements the following Standards and Interpretations, which have not been applied in these financial statements, were in issue but not yet effective (not all of which have been endorsed by the EU):
IFRS9 Financial InstrumentsIFRS14 Regulatory Deferral Accounts IFRS15 Revenue from Contracts with CustomersIFRS16 LeasesAmendments to IFRS10, IFRS12 Investment Entities – and IAS28 Applying the Consolidation ExceptionAmendments to IAS12 Recognition of Deferred Tax Assets for Unrealised LossesAmendments to IAS1 Disclosure InitiativeAmendments to IAS7 Disclosure Initiative
The implementation of IFRS9 may impact both the measurement and disclosures of Financial Instruments. The implementation of IFRS15 will have an impact on revenue recognition and related disclosures, IFRS16 will impact both the measurement and disclosures of leases. Beyond the information above, it is not practicable to provide a reasonable estimate of the effect of IFRS9, IFRS15 and IFRS16 until a detailed review has been completed. The Directors do not expect that the adoption of the other Standards and Interpretations listed above will have a material impact on the financial statements of the Group in the future years.
Going concernThe Group’s business activities, together with the factors likely to affect its future development, performance and position are set out in the strategic report.
The Directors have reviewed the Group’s budget, forecast and cash flows for 2017 and concluded that they are in line with expectations. In addition the Directors have reviewed the Group’s position in respect of material uncertainties and have concluded that there are no items that would affect going concern or that should be separately disclosed.
The Directors have concluded that they have a reasonable expectation that the Group has adequate resources to continue in operational existence for the foreseeable future. For this reason, they continue to adopt the going concern basis in preparing the financial statements.
The principal accounting policies adopted are set out on the page opposite:
Year ended 31 March 2016
Notes to financial statements continued
Page Title at start:Content Section at start:

Annual Report & Accounts 2016
HomeServe plc | 111
Financial statements
Basis of consolidationThe consolidated financial statements incorporate the financial statements of the Company and entities controlled by the Company made up to 31 March each year. Control is achieved where the Company has the power to govern the financial and operating policies of an investee entity, is exposed or has rights to variable return from its involvement with the investee, and has the ability to use its power to affect its returns.
On acquisition, the assets and liabilities and contingent liabilities of a subsidiary are measured at their fair values at the date of acquisition. The results of subsidiaries acquired or disposed of during the year are included in the consolidated income statement from the effective date of acquisition or up to the effective date of disposal, as appropriate.
Where necessary, adjustments are made to the financial statements of subsidiaries to bring the accounting policies used into line with those used by the Group. All intra-Group transactions, balances, income and expenses are eliminated on consolidation.
Business combinationsAcquisitions of subsidiaries and businesses are accounted for using the acquisition method. The consideration for each acquisition is measured at the aggregate of the fair values (at the date of exchange) of assets given, liabilities incurred or assumed in exchange for control of the acquiree. Acquisition-related costs are recognised in the income statement as incurred in operating costs.
Where applicable, the consideration for the acquisition includes any asset or liability resulting from a contingent consideration arrangement, measured at its acquisition-date fair value. Subsequent changes in such fair values are adjusted against the cost of acquisition where they qualify as measurement period (see below) adjustments. All other subsequent changes in the fair value of contingent consideration classified as an asset or liability are accounted for in accordance with relevant IFRSs. Changes in the fair value of contingent consideration classified as equity are not recognised.
If the initial accounting for a business combination is incomplete by the end of the reporting period in which the combination occurs, the Group reports provisional amounts for the items for which the accounting is incomplete. Those provisional amounts are adjusted during the measurement period (see below), or additional assets or liabilities are recognised, to reflect new information obtained about facts and circumstances that existed as of the acquisition date that, if known, would have affected the amounts recognised as of that date.
The measurement period is the period from the date of acquisition to the date the Group obtains complete information about facts and circumstances that existed as of the acquisition date, and is subject to a maximum of one year.
Any adjustments to contingent consideration for acquisitions made prior to 31 March 2010 which result in an adjustment to goodwill continue to be accounted for under IFRS3 (2004) and IAS27 (2005).
Notes to financial statements
Page Title at start:Content Section at start:

Annual Report & Accounts 2016
Financial statements
112 | HomeServe plc
2. Significant accounting policies continuedGoodwillGoodwill arising in a business combination is recognised at cost as an asset at the date control is acquired (the acquisition date). Goodwill is measured as the excess of the sum of the consideration transferred over the net of the acquisition date amounts of the identifiable assets acquired and the liabilities assumed.
Goodwill is not amortised but is reviewed for impairment annually or more frequently if there is an indication that it may be impaired.
For the purpose of impairment testing, goodwill is allocated to each of the Group’s cash generating units expected to benefit from the synergies of the combination. If the recoverable amount of the cash generating unit is less than the carrying amount of the unit, the impairment loss is allocated first to reduce the carrying amount of any goodwill allocated to the cash generating unit and then to the other assets of the unit pro-rata on the basis of the carrying amount of each asset in the unit. An impairment loss recognised for goodwill is not reversed in a subsequent period.
On disposal of a subsidiary the attributable amount of goodwill is included in the determination of the profit or loss on disposal.
Goodwill arising on acquisitions before the date of transition to IFRSs has been retained at the previous UK GAAP amounts subject to being tested for impairment at that date. Goodwill written off to reserves under UK GAAP prior to 1998 has not been reinstated and is not included in determining any subsequent profit or loss on disposal.
Revenue recognitionRevenue is measured at the fair value of the consideration received or receivable and represents amounts receivable for goods and services provided in the normal course of business, net of discounts, VAT, Insurance Premium Tax and other sales related taxes.
Revenue recorded by the Group includes commissions receivable in the Group’s role as an intermediary in the policy sale and administration process. Any third-party costs incurred on behalf of the principal that are rechargeable under the contractual arrangement, or where the Group’s role is only as an intermediary in the cash collection process, are not included in revenue. Consequently, on the sale of a policy, gross revenue consists of only a component of the overall policy price, representing the commission receivable for the marketing and sale of the policy, stated net of sales related taxes.
Year ended 31 March 2016
Notes to financial statements continued
Page Title at start:Content Section at start:

Annual Report & Accounts 2016
HomeServe plc | 113
Financial statements
Where a contractual arrangement consists of two or more separate arrangements that can be provided to customers either on a stand-alone basis or as an optional extra, revenue is recognised for each element as if it were an individual contract. Accordingly, revenue is recognised on the sale of a policy except where an obligation exists to provide future services, typically claims handling and policy administration services. In these situations, a proportion of revenue, sufficient to cover future claims handling costs and margin, is deferred over the life of the policy, as deferred income. The assessment of future claims handling takes account of the expected numbers of claims and the estimated cost of handling those claims, which are validated through experience of historical actual costs.
The deferred revenue is released over the expected profile of anticipated claims over the policy period. The deferral also includes a profit element to recognise the performance of these services in the future.
Revenue on sales of franchises is recognised when the obligations to the franchisee are complete. Revenue on the sale of new franchise licences is recognised upon the signing of the related franchise agreement. These franchise fees are non-refundable and primarily relate to initial set-up services.
Repair revenue relates to repairs undertaken on behalf of underwriters subject to separate contractual arrangements. Such revenue is recognised on completion of the repair.
Annual service revenue is recognised on completion of the annual service. Ongoing service revenue is recognised in equal instalments over the life of the policy.
Marketing expensesCosts incurred in respect of marketing activity, including for example, direct mail and inbound/ outbound telephone costs, which is undertaken to acquire or renew a policy, are charged to the income statement in the period in which the related marketing campaign is performed.
Marketing expenses also include payments made to Affinity Partners in recognition of their support for the Group’s selling and policy renewal activities. The terms of their support and related payments are included in contractual agreements with each Affinity Partner. Amounts incurred upon the sale and renewal of an individual policy by the Group, referred to as Affinity Partner Commissions, are recognised as an operating expense when individual policies incept or renew. Commissions are payable to Affinity Partners only when the Group has collected the premium due on behalf of the third party underwriter from the policy holder.
Notes to financial statements
Page Title at start:Content Section at start:

Annual Report & Accounts 2016
Financial statements
114 | HomeServe plc
2. Significant accounting policies continuedLeasingLeases are classified as finance leases whenever the terms of the lease transfer substantially all the risks and rewards of ownership to the lessee. All other leases are classified as operating leases.
Assets held under finance leases are recognised as assets of the Group at their fair value or, if lower, at the present value of the minimum lease payments, each determined at the inception of the lease. The corresponding liability to the lessor is included in the balance sheet as a finance lease obligation. Lease payments are apportioned between finance charges and reduction of the lease obligation so as to achieve a constant rate of interest on the remaining balance of the liability.
Rentals payable under operating leases are charged to income on a straight-line basis over the term of the relevant lease. Benefits received and receivable as an incentive to enter into an operating lease are also spread on a straight-line basis over the lease term.
Foreign currenciesTransactions in currencies other than pounds sterling are recorded at the rates of exchange prevailing on the dates of the transactions. At each balance sheet date, monetary assets and liabilities that are denominated in foreign currencies except for those that are designated as long term equity investments, are retranslated at the rates prevailing on the balance sheet date with changes taken to the income statement. Foreign exchange translation movements on monetary assets that are designated as long-term equity investments are transferred to the Groups translation reserve. Non-monetary items that are measured at historical cost in a foreign currency are not retranslated.
Borrowings in foreign currencies are treated as monetary liabilities and are translated at the rates prevailing on the balance sheet date. Exchange rate movements on foreign currency borrowings are recognised immediately in the income statement. Foreign currency borrowings are not treated as hedges of net investments.
On consolidation, the assets and liabilities of the Group’s overseas operations are translated at exchange rates prevailing on the balance sheet date. Income and expense items are translated at the average exchange rates for the period unless exchange rates fluctuate significantly. Exchange movements, if any, are classified as equity and transferred to the Group’s translation reserve. Such cumulative exchange movements are recognised as income or expense in the period in which the operation is disposed of.
Goodwill and fair value adjustments arising on the acquisition of a foreign entity are treated as assets and liabilities of the foreign entity and translated at the closing rate.
Year ended 31 March 2016
Notes to financial statements continued
Page Title at start:Content Section at start:

Annual Report & Accounts 2016
HomeServe plc | 115
Financial statements
Borrowing costsBorrowing costs are recognised in the income statement in the period in which they are incurred.
Operating profitOperating profit is stated after charging all operating costs, but before investment income and finance costs.
Retirement benefit costsPayments to defined contribution retirement benefit schemes are charged as an expense as they fall due.
For defined benefit retirement schemes, the cost of providing benefits is determined using the projected unit credit method, with actuarial valuations being carried out at each balance sheet date. Actuarial gains and losses and the return on scheme assets (excluding interest) are recognised in full in the period in which they occur. They are recognised outside the income statement and presented in the statement of comprehensive income. Re-measurement recorded in the statement of comprehensive income is not recycled.
Past service cost is recognised immediately to the extent that the benefits are already vested, and is otherwise amortised on a straight-line basis over the average period until the benefits become vested. Net interest is calculated by applying a discount rate to the net defined benefit liability or asset.
Any retirement benefit obligation recognised in the balance sheet represents the present value of the defined benefit obligation as adjusted for unrecognised past service cost, and as reduced by the fair value of scheme assets. Any asset resulting from the calculation is limited to past service cost, plus the present value of available refunds and reductions in future contributions to the plan.
TaxationThe tax expense represents the sum of the tax currently payable and deferred tax.
Any tax currently payable is based on taxable profit for the year. The Group’s liability for current tax is calculated using tax rates that have been enacted or substantively enacted by the balance sheet date.
Deferred tax is the tax expected to be payable or recoverable on differences between the carrying amounts of assets and liabilities in the financial statements and the corresponding tax bases used in the computation of taxable profit and is accounted for using the balance sheet liability method. Deferred tax liabilities are generally recognised for all taxable temporary differences and deferred tax assets are recognised to the extent that it is probable that taxable profits will be available against which deductible temporary differences can be utilised.
Notes to financial statements
Page Title at start:Content Section at start:

Annual Report & Accounts 2016
Financial statements
116 | HomeServe plc
2. Significant accounting policies continuedTaxation continuedDeferred tax liabilities are recognised for taxable temporary differences arising on investments in subsidiaries, except where the Group is able to control the reversal of the temporary difference and it is probable that the temporary difference will not reverse in the foreseeable future.
The carrying amount of deferred tax assets is reviewed at each balance sheet date and reduced to the extent that it is no longer probable that sufficient taxable profits will be available to allow all or part of the asset to be recovered.
Deferred tax is calculated at the tax rates that are expected to apply in the period when the liability is settled or the asset is realised. Deferred tax is charged or credited in the income statement, except when it relates to items charged or credited directly to equity, in which case the deferred tax is also dealt with in equity.
Deferred tax assets and liabilities are offset when there is a legally enforceable right to set off current tax assets against current tax liabilities and when they relate to income taxes levied by the same taxation authority and the Group intends to settle its current tax assets and liabilities on a net basis.
Property, plant and equipmentProperty, plant and equipment is stated at cost less accumulated depreciation.
Depreciation is charged so as to write off the cost of assets, other than land, over their estimated useful lives, using the straight-line method, on the following bases:
Buildings 25 – 50 yearsFurniture, fixtures and equipment 5 – 7 years Computer equipment 3 – 7 yearsMotor vehicles 3 years (with 25% residual value)
Assets held under finance leases are depreciated over their expected useful lives on the same basis as owned assets or, where shorter, over the term of the relevant lease.
Intangible assetsAcquisition intangible assetsAcquired access rights relate to the contractual agreements entered into with the former owners of businesses acquired as part of business combinations. These agreements set out the contractual terms of the Affinity Partnership and provide the contractual framework within which the Group markets, sells and renews policies with the individual customers of the Affinity Partner. Acquired access rights are recorded at fair value by using the estimated and discounted incremental future cash flows resulting from the relationship. Acquired access rights are amortised on a straight line basis over their estimated useful lives, which are in the range of 3 – 15 years.
Year ended 31 March 2016
Notes to financial statements continued
Page Title at start:Content Section at start:

Annual Report & Accounts 2016
HomeServe plc | 117
Financial statements
Acquired customer databases represent the value attributable to the portfolios of renewable customer policies that exist at the date of acquisition and are acquired by the Group as part of a business combination. Acquired customer databases are recorded at fair value using the estimated and discounted incremental future cash flows resulting from the future renewal of the portfolio of acquired policies over their estimated residual life. Acquired customer databases are amortised on a straight line basis over their estimated useful lives, which are in the range of 3 – 15 years.
Other intangible assetsAccess rights arise from the contractual agreements with Affinity Partners which provide the contractual framework within which the Group markets, sells and renews policies with the individual customers of the Affinity Partner. Access rights are valued at the discounted present value of the contractually committed payments, where such payments are not related to the success or otherwise of activity under the contractual agreements and are amortised on a straight-line basis over the length of the contractual agreement, up to a maximum of 20 years.
Trademarks represent costs incurred to legally protect the established brand names of the Group. Trademarks are stated at cost and amortised on a straight line basis over their useful economic lives, up to a maximum of 20 years.
Customer databases represent the value attributable to the portfolios of renewable customer policies that have been created by our Affinity Partners through their own sales and marketing activity and subsequently purchased by the Group. Such customer databases are recorded at their fair value based on the amount paid to the Affinity Partner. These customer databases are amortised on a straight line basis over the remaining term of the Affinity Partner marketing agreement, which are in the range of 3 – 10 years.
Computer software and the related licences are stated at cost and amortised on a straight line basis over their useful lives of 3 – 7 years.
Investments At each balance sheet date the Group conducts a fair value assessment of its investments, the difference between the fair value and carrying value is charged or credited to the Statement of Comprehensive Income accordingly.
Notes to financial statements
Page Title at start:Content Section at start:
Annual Report & Accounts 2016
Financial statements
118 | HomeServe plc
2. Significant accounting policies continuedImpairment of tangible and intangible assets excluding goodwillAt each balance sheet date, the Group reviews the carrying amounts of its tangible and intangible assets to determine whether there is any indication that those assets have suffered an impairment loss. If any such indication exists, the recoverable amount of the asset is estimated in order to determine the extent of the impairment loss, if any. Where the asset does not generate cash flows that are independent from other assets, the Group estimates the recoverable amount of the cash generating unit to which the asset belongs.
Recoverable amount is the higher of fair value less costs to sell and value in use. In assessing value in use, the estimated future cash flows are discounted to their present value using a pre-tax discount rate that reflects current market assessments of the time value of money and the risks specific to the assets for which the estimates of future cash flows have not been adjusted.
If the recoverable amount of an asset or cash generating unit is estimated to be less than its carrying amount, the carrying amount of the asset or cash-generating unit is reduced to its recoverable amount. An impairment loss is recognised as an expense immediately.
Where an impairment loss subsequently reverses, the carrying amount of the asset or cash-generating unit is increased to the revised estimate of its recoverable amount, but so that the increased carrying amount does not exceed the carrying amount that would have been determined had no impairment loss been recognised for the asset or cash-generating unit in prior years. A reversal of an impairment loss is recognised as income immediately.
InventoriesInventories are stated at the lower of cost and net realisable value. Costs comprise direct materials and, where applicable, direct labour costs and those overheads that have been incurred in bringing the inventories to their present location and condition. Cost is measured on a first-in, first-out (FIFO) basis. Net realisable value represents the estimated selling price less all estimated costs of completion and costs to be incurred in marketing, selling and distribution. Provision is made for obsolete, slow moving or defective items where appropriate.
Financial instrumentsFinancial assets and financial liabilities are recognised on the Group’s balance sheet when the Group becomes a party to the contractual provisions of the instrument. Financial assets are classified either ‘at fair value through profit or loss (FVTPL)’ or ‘loans and receivables’. The classification depends on the nature and purpose of the financial assets and is determined at the time of initial recognition. Financial liabilities are classified as either financial liabilities ‘at FVTPL’ or ‘other financial liabilities’.
Year ended 31 March 2016
Notes to financial statements continued
Page Title at start:Content Section at start:

Annual Report & Accounts 2016
HomeServe plc | 119
Financial statements
Trade receivablesTrade receivables do not carry any interest and are stated at amortised cost as reduced by appropriate allowances for estimated irrecoverable amounts.
Cash and cash equivalentsCash and cash equivalents comprise cash in hand and demand deposits, and other short-term highly liquid investments that are readily convertible to a known amount of cash and are subject to an insignificant risk of changes in value.
Financial liabilities and equityFinancial liabilities and equity instruments are classified according to the substance of the contractual arrangements entered into. An equity instrument is any contract that evidences a residual interest in the assets of the Group after deducting all of its liabilities.
BorrowingsInterest-bearing loans and overdrafts are stated at amortised cost and are recorded at the proceeds received, net of direct issue costs. Finance charges, including premiums payable on settlement or redemption and direct issue costs, are accounted for on an accruals basis using the effective interest method and are added to the carrying amount of the instrument to the extent that they are not settled in the period in which they arise.
Trade payablesTrade payables are not interest-bearing and are stated at amortised cost.
Equity instrumentsEquity instruments issued by the Company are recorded at the proceeds received, net of direct issue costs.
Share-based paymentsThe Group issues equity-settled share-based payments to certain employees. Equity-settled share-based payments are measured at fair value at the date of grant. The fair value determined at the grant date of the equity-settled share-based payments is expensed on a straight-line basis over the vesting period, based on the Group’s estimate of shares that will eventually vest. The Group also provides employees with the ability to purchase the Group’s ordinary shares at a discount to the current market value through Save As You Earn schemes.
Fair value is measured by use of the Black-Scholes model or Monte Carlo simulation models depending on the type of scheme.
Notes to financial statements
Page Title at start:Content Section at start:

Annual Report & Accounts 2016
Financial statements
120 | HomeServe plc
2. Significant accounting policies continuedOwn shares reserveShares of the parent Company that are purchased by the HomeServe plc Employee Benefit Trust are held at cost and shown as a deduction in equity. Cost comprises consideration paid, including directly attributable costs. The shares are held to satisfy obligations under the Group’s equity settled share based payment schemes.
Exceptional itemsExceptional items are items that are unusual because of their size, nature or incidence and which the Directors consider should be disclosed separately to enable a full understanding of the Group’s results.
3. Critical accounting judgements and key sources of estimation uncertaintyIn the application of the Group’s accounting policies, which are described in note 2, the Directors are required to make judgements, estimates and assumptions about the carrying amounts of assets and liabilities that are not readily apparent from other sources. The estimates and associated assumptions are based on historical experience and other factors that are considered to be relevant. Actual results may differ from these estimates.
The estimates and underlying assumptions are reviewed on an ongoing basis. Revisions to accounting estimates are recognised in the period in which the estimate is revised if the revision affects only that period, or in the period of the revision and future periods if the revision affects both current and future periods.
Revenue recognitionAn appropriate proportion of revenue, sufficient to cover future costs and margin of handling claims is deferred to future periods when the Group has obligations extending to future periods. As a result, judgement is required in assessing the extent and associated costs of fulfilling those future obligations. The Group uses historical experience of claims volumes and forecast activity levels in determining the appropriate amount of revenue to recognise in the current period and how much to defer to future periods.
An assessment is also made of any factors that are likely to materially affect the economic benefits which will flow to the Group such as policy cancellations. To the extent that economic benefits are not expected to flow to the Group, the value of that revenue is not recognised. The Group uses historical experience in determining the appropriate amount of revenue to recognise.
Year ended 31 March 2016
Notes to financial statements continued
Page Title at start:Content Section at start:

Annual Report & Accounts 2016
HomeServe plc | 121
Financial statements
Valuation of acquisition intangible assetsAcquisitions may result in acquired access rights and acquired customer databases being recognised as intangible assets. These are valued using the excess earnings method, taking into account a number of key assumptions such as retention and net income. In applying this methodology certain key judgements and estimates are required to be made in respect of future cash flows together with an appropriate discount factor for the purpose of determining the present value of those cash flows.
Impairment of goodwill and acquisition intangible assetsThe annual impairment assessment in respect of goodwill and acquisition intangibles requires estimates of the value in use (or fair value less costs to sell) of cash-generating units to which goodwill and acquisition intangibles have been allocated. CGU’s are aligned to the countries in which we operate. As a result, estimates of future cash flows are required, together with an appropriate discount factor for the purpose of determining the present value of those cash flows. The carrying value of goodwill is £247.7m (FY15: £236.6m). The carrying value of acquisition intangibles is £75.3m (FY15: £70.9m). Following the annual impairment review, no impairment charge has been recorded against goodwill or acquisition intangibles.
As set out in note 14, changes in respect of commercial outcomes around sales volumes, prices, margins and discount rates can impact the recoverable value. Management do not believe that any reasonably possible changes to the key assumptions would produce an impairment in the forthcoming year.
4. RevenueAn analysis of the Group’s revenue is as follows:
2016£m
2015£m
Provision of services 633.2 584.2Investment income (note 9) 0.3 0.2
633.5 584.4
Notes to financial statements
Page Title at start:Content Section at start:

Annual Report & Accounts 2016
Financial statements
122 | HomeServe plc
5. Business and geographical segmentsSegment revenues and resultsIFRS8 requires operating segments to be identified on the basis of internal reports about components of the Group that are regularly reviewed by the chief operating decision maker, who is considered to be the Chief Executive, to allocate resources to the segments and to assess their performance.
Segment profit/(loss) represents the result of each segment including allocating costs associated with head office and shared functions, but before allocating investment income, finance costs, and tax. This is the measure reported to the Chief Executive for the purposes of resource allocation and assessment of segment performance.
The accounting policies of the operating segments are the same as those described in Significant Accounting Policies. Group cost allocations are deducted in arriving at segmental operating profit. Inter-segment revenue is charged at prevailing market prices.
2016UK£m
USA£m
France£m
Spain£m
New Markets
£mTotal
£m
RevenueTotal revenue 291.8 152.6 77.4 97.5 20.1 639.4 Inter-segment (5.8) – – – (0.4) (6.2)
External revenue 286.0 152.6 77.4 97.5 19.7 633.2
ResultSegment operating profit/(loss)
pre amortisation of acquisition intangibles 58.0 12.1 23.2 9.9 (5.9) 97.3
Amortisation of acquisition intangibles (0.6) (4.3) (5.2) (0.3) – (10.4)
Operating profit/(loss) 57.4 7.8 18.0 9.6 (5.9) 86.9
Investment income 0.3 Finance costs (4.6)
Profit before tax 82.6 Tax (21.0)
Profit for the year 61.6
Year ended 31 March 2016
Notes to financial statements continued
Page Title at start:Content Section at start:

Annual Report & Accounts 2016
HomeServe plc | 123
Financial statements
2015UK£m
USA£m
France£m
Spain£m
New Markets
£mTotal
£m
RevenueTotal revenue 285.5 125.3 74.9 90.9 13.8 590.4 Inter-segment (5.9) – – – (0.3) (6.2)
External revenue 279.6 125.3 74.9 90.9 13.5 584.2
ResultSegment operating profit/(loss)
pre amortisation of acquisition intangibles and exceptional items 56.4 6.4 23.4 7.5 (5.9) 87.8
Exceptional items 1.7 – – – – 1.7 Amortisation of acquisition
intangibles (0.4) (4.1) (5.6) (0.3) – (10.4)
Operating profit/(loss) 57.7 2.3 17.8 7.2 (5.9) 79.1
Investment income 0.2 Finance costs (2.6)
Profit before tax 76.7 Tax (20.6)
Profit for the year 56.1
Segment information
Assets Liabilities Capital additions
Depreciation, amortisation
and impairment
2016£m
restated 2015£m
2016£m
restated 2015£m
2016£m
2015£m
2016£m
2015£m
UK 719.4 544.7 365.5 302.0 34.1 30.9 12.0 11.1USA 160.6 137.7 256.7 127.5 10.2 3.8 8.5 7.1France 194.3 185.7 130.5 63.2 5.4 0.6 6.3 6.5Spain 110.2 90.4 90.3 77.5 13.8 15.1 8.6 7.1New Markets 17.8 9.5 42.7 29.3 1.7 0.9 0.4 0.2Inter-segment (268.2) (125.3) (268.2) (125.3) – – – –
Total 934.1 842.7 617.5 474.2 65.2 51.3 35.8 32.0
All assets and liabilities including inter-segment loans and trading balances are allocated to reportable segments. In order to aid better presentation, such inter-segment items have been eliminated separately in the table above in the current year. In line with this, prior year amounts have therefore been restated.
Notes to financial statements
Page Title at start:Content Section at start:
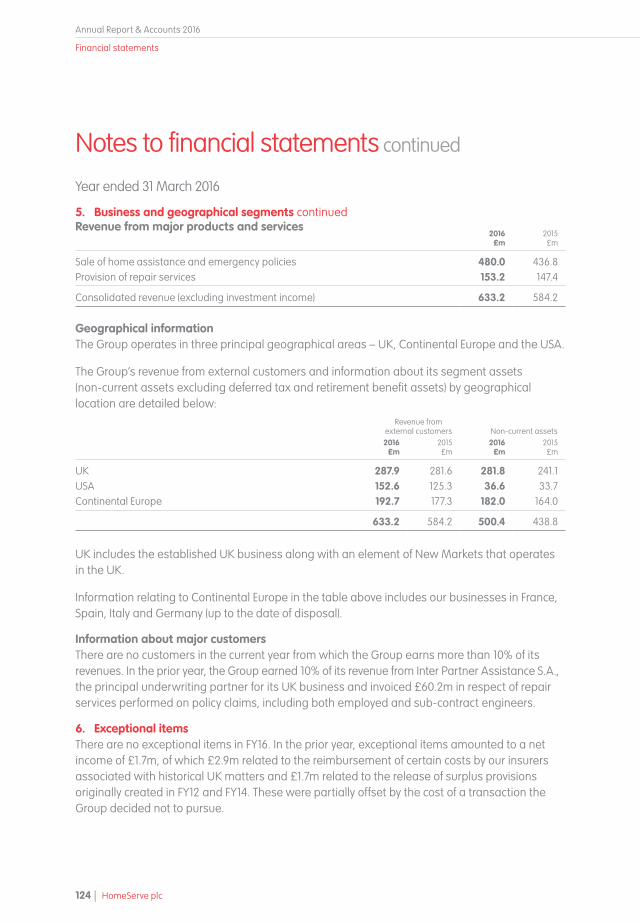
Annual Report & Accounts 2016
Financial statements
124 | HomeServe plc
5. Business and geographical segments continuedRevenue from major products and services
2016£m
2015£m
Sale of home assistance and emergency policies 480.0 436.8Provision of repair services 153.2 147.4
Consolidated revenue (excluding investment income) 633.2 584.2
Geographical informationThe Group operates in three principal geographical areas – UK, Continental Europe and the USA.
The Group’s revenue from external customers and information about its segment assets (non-current assets excluding deferred tax and retirement benefit assets) by geographical location are detailed below:
Revenue from external customers Non-current assets2016
£m2015£m
2016£m
2015£m
UK 287.9 281.6 281.8 241.1USA 152.6 125.3 36.6 33.7Continental Europe 192.7 177.3 182.0 164.0
633.2 584.2 500.4 438.8
UK includes the established UK business along with an element of New Markets that operates in the UK.
Information relating to Continental Europe in the table above includes our businesses in France, Spain, Italy and Germany (up to the date of disposal).
Information about major customersThere are no customers in the current year from which the Group earns more than 10% of its revenues. In the prior year, the Group earned 10% of its revenue from Inter Partner Assistance S.A., the principal underwriting partner for its UK business and invoiced £60.2m in respect of repair services performed on policy claims, including both employed and sub-contract engineers.
6. Exceptional itemsThere are no exceptional items in FY16. In the prior year, exceptional items amounted to a net income of £1.7m, of which £2.9m related to the reimbursement of certain costs by our insurers associated with historical UK matters and £1.7m related to the release of surplus provisions originally created in FY12 and FY14. These were partially offset by the cost of a transaction the Group decided not to pursue.
Year ended 31 March 2016
Notes to financial statements continued
Page Title at start:Content Section at start:

Annual Report & Accounts 2016
HomeServe plc | 125
Financial statements
7. Profit for the yearProfit for the year has been arrived at after charging/(crediting):
2016£m
2015£m
Included in operating costs:Staff costs 190.5 163.2 Cost of inventories recognised as an expense 11.4 8.1 Depreciation of property, plant and equipment 5.4 4.6 Amortisation of acquisition intangible assets 10.4 10.4 Amortisation of other intangibles 20.0 17.0 Impairment loss recognised on trade receivables 0.6 1.9 Exceptional operating items – (1.7)
The analysis of auditor’s remuneration is as follows:2016
£0002015
£000
Fees payable to the Company’s auditor for the audit of the Company’s annual financial statements 65 53The audit of the Company’s subsidiaries pursuant to legislation 432 358
Total audit fees 497 411
Audit-related assurance services 40 39Tax compliance services 110 130Tax advisory services 243 251
Total non-audit fees 393 420
Fees payable to Deloitte LLP and their associates for non-audit services to the Company are not required to be disclosed because the consolidated financial statements are required to disclose such fees on a consolidated basis.
A description of the work of the Audit Committee is set out in the Corporate Governance report and includes an explanation of how auditor objectivity and independence are safeguarded when non-audit services are provided by the auditor.
Audit-related assurance services include fees in respect of the half year review of £40,000 (FY15: £39,000).
Notes to financial statements
Page Title at start:Content Section at start:

Annual Report & Accounts 2016
Financial statements
126 | HomeServe plc
8. Staff costsThe average monthly number of employees (including Executive Directors) was:
2016Number
2015Number
UK 2,489 2,088Continental Europe 1,203 1,088USA 733 654
4,425 3,830
2016£m
2015£m
Their aggregate remuneration comprised: Wages and salaries 163.1 140.0Social security costs 23.8 20.7Other pension costs (note 36) 3.6 2.5
190.5 163.2
9. Investment income2016
£m2015£m
Interest on bank deposits 0.3 0.2
10. Finance costs2016
£m2015£m
Interest on bank and other loans 4.4 2.5Unwinding of discount on deferred and contingent consideration 0.2 0.2Exchange movements – (0.1)
4.6 2.6
Year ended 31 March 2016
Notes to financial statements continued
Page Title at start:Content Section at start:

Annual Report & Accounts 2016
HomeServe plc | 127
Financial statements
11. Tax2016
£m2015£m
Current taxCurrent year 20.1 24.9 Adjustments in respect of prior years (0.4) (1.3)
Total current tax charge 19.7 23.6
Deferred tax (note 21) 1.3 (3.0)
Total tax charge 21.0 20.6
UK corporation tax is calculated at 20% (FY15: 21%) of the estimated assessable profit for the year. Taxation for other jurisdictions is calculated at the rates prevailing in the respective jurisdictions.
The charge for the year can be reconciled to the profit per the income statement as follows:2016
£m2015£m
Profit before tax on continuing operations 82.6 76.7
Tax at the UK corporation tax rate of 20% (FY15: 21%) 16.5 16.1 Tax effect of expenses that are not deductible in determining taxable profit 2.3 1.6 Adjustments in respect of prior years – current tax (0.4) (1.3)Overseas tax rate differences 2.4 3.0 Decrease in estimate of deferred tax asset 0.1 1.4 Effect of overseas losses 0.1 0.5 Utilisation of losses not previously recognised – (0.7)
Tax expense for the year 21.0 20.6
Notes to financial statements
Page Title at start:Content Section at start:

Annual Report & Accounts 2016
Financial statements
128 | HomeServe plc
11. Tax continuedIn addition to the amount charged to the income statement, a deferred tax charge relating to the gain on revaluation of investment available for sale of £0.7m (FY15: £nil) along with retirement benefit obligations amounting to £0.1m (FY15: £0.4m credit) has been recognised directly in other comprehensive income. In addition to the amounts charged/(credited) to the income statement and other comprehensive income, the following amounts relating to tax have been recognised directly in equity:
2016£m
2015£m
Current taxExcess tax deductions related to share-based payments on exercised options 2.3 1.2
Deferred taxChange in estimated excess tax deductions related to share-based payments (0.2) 0.5
Total tax recognised directly in equity 2.1 1.7
The UK corporation tax rate reduced from 21% to 20% with effect from 1 April 2015. The rate of 20% is used for the calculation of the UK deferred tax position as at 31 March 2016.
12. Dividends2016
£m2015£m
Amounts recognised as distributions to equity holders in the year:Special dividend of 30p per share paid in July 2015 99.4 –Final dividend for the year ended 31 March 2015 of 7.87p (2014: 7.67p) per share 25.9 25.1Interim dividend for the year ended 31 March 2016 of 3.8p (2015: 3.63p) per share 11.7 11.8
137.0 36.9
The proposed final dividend for the Year ended 31 March 2016 is 8.9p per share amounting to £27.4m (FY15: 7.87p per share amounting to £25.9m) will be paid on 1 August 2016 to the shareholders on the register at close of business on 8 July 2016. The proposed final dividend is subject to approval by shareholders at the Annual General Meeting and has not been included as a liability in these financial statements.
Year ended 31 March 2016
Notes to financial statements continued
Page Title at start:Content Section at start:

Annual Report & Accounts 2016
HomeServe plc | 129
Financial statements
13. Earnings per share 2016
pence2015
pence
Basic 19.6 17.2Diluted 19.3 16.8
Adjusted basic 21.8 19.0Adjusted diluted 21.4 18.6
The calculation of the basic and diluted earnings per share is based on the following data:
Number of shares2016
m2015
m
Weighted average number of sharesBasic 313.9 326.7 Dilutive impact of share options 6.1 7.1
Diluted 320.0 333.8
Earnings2016
£m2015£m
Profit for the year 61.6 56.1 Exceptional items (note 6) – (1.7)Amortisation of acquisition intangibles 10.4 10.4 Tax impact arising on amortisation of acquisition intangibles and exceptional items (3.6) (2.6)
Adjusted profit for the year 68.4 62.2
Basic and diluted earnings per ordinary share have been calculated in accordance with IAS33 Earnings Per Share. Basic earnings per share is calculated by dividing the profit or loss in the financial year by the weighted average number of ordinary shares in issue during the period. Adjusted earnings per share is calculated excluding exceptional items (note 6) and amortisation of acquisition intangibles. This is considered to be a better indicator of the performance of the Group. Diluted earnings per share includes the impact of dilutive share options in issue throughout the period.
Notes to financial statements
Page Title at start:Content Section at start:

Annual Report & Accounts 2016
Financial statements
130 | HomeServe plc
14. Goodwill£m
CostAt 1 April 2014 276.1 Derecognised on disposal of subsidiary (29.8)Exchange movements (9.7)
At 1 April 2015 236.6 Recognised on acquisition of subsidiary 4.6 Exchange movements 6.5
At 31 March 2016 247.7
Accumulated impairment lossesAt 1 April 2014 29.8 Derecognised on disposal of subsidiary (29.8)
At 1 April 2015 and 31 March 2016 –
Carrying amountAt 31 March 2016 247.7
At 31 March 2015 236.6
Goodwill acquired in a business combination is allocated, at acquisition, to the cash generating units (‘CGUs’) that are expected to benefit from that business combination. CGUs are defined as geographical territories, because they represent the smallest identifiable group of assets that generate cash inflows. The Group tests goodwill annually for impairment or more frequently if there are indications that goodwill might be impaired. The recoverable amounts of the CGUs are determined from value in use calculations.
The key assumptions for the value in use calculations are those regarding the discount rate, growth rates and expected changes to selling prices and direct costs during the period. Management estimates the discount rates using pre-tax rates that reflect current market assessments of the time value of money. The growth rates are based on detailed business plans. Changes in selling prices and direct costs are based on expectations of future changes in the market.
Year ended 31 March 2016
Notes to financial statements continued
Page Title at start:Content Section at start:
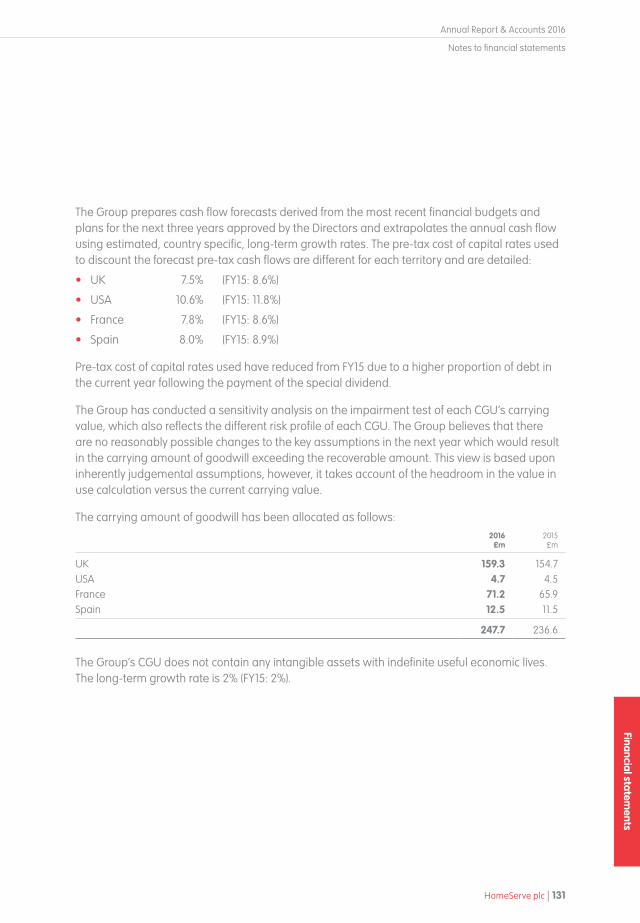
Annual Report & Accounts 2016
HomeServe plc | 131
Financial statements
The Group prepares cash flow forecasts derived from the most recent financial budgets and plans for the next three years approved by the Directors and extrapolates the annual cash flow using estimated, country specific, long-term growth rates. The pre-tax cost of capital rates used to discount the forecast pre-tax cash flows are different for each territory and are detailed:
• UK 7.5% (FY15: 8.6%)
• USA 10.6% (FY15: 11.8%)
• France 7.8% (FY15: 8.6%)
• Spain 8.0% (FY15: 8.9%)
Pre-tax cost of capital rates used have reduced from FY15 due to a higher proportion of debt in the current year following the payment of the special dividend.
The Group has conducted a sensitivity analysis on the impairment test of each CGU’s carrying value, which also reflects the different risk profile of each CGU. The Group believes that there are no reasonably possible changes to the key assumptions in the next year which would result in the carrying amount of goodwill exceeding the recoverable amount. This view is based upon inherently judgemental assumptions, however, it takes account of the headroom in the value in use calculation versus the current carrying value.
The carrying amount of goodwill has been allocated as follows:2016
£m2015£m
UK 159.3 154.7USA 4.7 4.5France 71.2 65.9Spain 12.5 11.5
247.7 236.6
The Group’s CGU does not contain any intangible assets with indefinite useful economic lives. The long-term growth rate is 2% (FY15: 2%).
Notes to financial statements
Page Title at start:Content Section at start:

Annual Report & Accounts 2016
Financial statements
132 | HomeServe plc
15. Other intangible assetsAcquisition intangibles represent non-monetary assets, arising on business combinations, and include acquired access rights and acquired customer databases. Other intangibles include trademarks, access rights, customer databases and software.
Acquired access rights
£m
Acquired customer
databases£m
Total acquisition intangibles
£m
Trademarks & access
rights£m
Customer databases
£mSoftware
£m
Total intangibles
£m
CostAt 1 April 2014 26.7 107.3 134.0 28.3 26.3 59.5 248.1 Additions 0.1 0.1 0.2 1.1 13.4 30.8 45.5 Exchange movements (1.3) (5.4) (6.7) 0.8 (4.1) 0.3 (9.7)
At 1 April 2015 25.5 102.0 127.5 30.2 35.6 90.6 283.9 Additions – 1.0 1.0 1.3 15.3 38.9 56.5 Acquired on acquisition of a subsidiary – 9.2 9.2 – – – 9.2 Disposals – – – (0.3) – (4.9) (5.2)Exchange movements 1.7 6.6 8.3 0.4 4.1 1.1 13.9
At 31 March 2016 27.2 118.8 146.0 31.6 55.0 125.7 358.3
Accumulated amortisation and impairmentAt 1 April 2014 13.3 33.4 46.7 11.1 4.4 29.0 91.2 Charge for the year 2.4 8.0 10.4 3.7 5.9 7.4 27.4 Exchange movements (0.6) 0.1 (0.5) 0.4 (0.9) (0.2) (1.2)
At 1 April 2015 15.1 41.5 56.6 15.2 9.4 36.2 117.4 Charge for the year 2.4 8.0 10.4 4.4 7.6 8.0 30.4 Disposals – – – (0.3) – (4.9) (5.2)Exchange movements 1.1 2.6 3.7 0.2 1.3 0.5 5.7
At 31 March 2016 18.6 52.1 70.7 19.5 18.3 39.8 148.3
Carrying amountAt 31 March 2016 8.6 66.7 75.3 12.1 36.7 85.9 210.0
At 31 March 2015 10.4 60.5 70.9 15.0 26.2 54.4 166.5
Year ended 31 March 2016
Notes to financial statements continued
Page Title at start:Content Section at start:

Annual Report & Accounts 2016
HomeServe plc | 133
Financial statements
16. Property, plant and equipmentLand &
buildings£m
Furniture fixtures &
equipment£m
Computer equipment
£m
Motor vehicles
£mTotal
£m
CostAt 1 April 2014 30.3 6.5 11.6 2.8 51.2 Additions 0.6 1.1 3.5 0.6 5.8 Disposals (0.2) (0.1) (0.5) (0.1) (0.9)Exchange movements – – 0.3 0.3 0.6
At 1 April 2015 30.7 7.5 14.9 3.6 56.7 Additions 1.5 1.5 4.2 1.5 8.7 Disposals (0.9) (0.9) (3.1) (0.5) (5.4)Acquired on acquisition of a subsidiary – 0.1 0.1 – 0.2 Exchange movements 0.2 0.1 0.2 0.2 0.7
At 31 March 2016 31.5 8.3 16.3 4.8 60.9
Accumulated depreciation and impairmentAt 1 April 2014 8.7 3.6 8.0 0.9 21.2 Charge for the year 1.5 0.9 1.7 0.5 4.6 Disposals (0.2) – (0.5) – (0.7)Exchange movements – 0.1 0.1 0.1 0.3
At 1 April 2015 10.0 4.6 9.3 1.5 25.4 Charge for the year 1.6 1.0 2.1 0.7 5.4 Disposals (0.9) (0.9) (3.1) (0.3) (5.2)Exchange movements 0.2 – 0.1 0.1 0.4
At 31 March 2016 10.9 4.7 8.4 2.0 26.0
Carrying amountAt 31 March 2016 20.6 3.6 7.9 2.8 34.9
At 31 March 2015 20.7 2.9 5.6 2.1 31.3
The carrying amount of the Group’s property, plant and equipment includes an amount of £2.5m (FY15: £1.7m) in respect of assets held under finance leases.
At the balance sheet date, there are no contractual commitments for the purchase of property, plant and equipment (FY15: £nil).
Notes to financial statements
Page Title at start:Content Section at start:

Annual Report & Accounts 2016
Financial statements
134 | HomeServe plc
17. Subsidiaries and other investmentsAll companies listed below are owned by the Group and all interests are in the ordinary share capital. All entities, where control is exercised, have been consolidated. Jointly controlled entities are wholly immaterial, with no amount exceeding £0.1m, and have been accounted for using the equity accounting method. All companies operate principally in their country of incorporation.
Name of legal entity Activity
Place of incorporation ownership (or
registration) and operation
Proportion of voting interest
%
Proportion of power held
%
Holding CompaniesHomeServe Assistance Limited Trading England 100 100 HomeServe Enterprises Limited Trading England 100 100 HomeServe International Limited Trading England 100 100 Home Service GB Limited Dormant England 100 100 HomeServe France Holding SAS Trading France 100 100HomeServe USA Holding Corp Trading USA 100 100 Homeserve Beteiligungs GmbH Trading Germany 100 100 UK & IrelandHomeServe Membership Limited Trading England 100 100 HomeServe Servowarm Limited Trading England 100 100 HomeServe At Home Limited Dormant England 100 100 247999 Limited Dormant England 100 100 Home Energy Services Limited Trading England 100 100 HomeServe Manufacturer Warranties Limited Dormant England 100 100 HomeServe Heating Services Limited Trading England 100 100 HomeServe Trustees Limited Trading England 100 100 HomeServe France Limited Trading England 100 100HomeServe USA Limited Trading England 100 100 HomeServe Europe Limited Non-Trading Ireland 100 100 HomeServe America Limited Non-Trading Ireland 100 100 HomeServe Gas Limited Dormant England 100 100 HomeServe (GB) Limited Dormant England 100 100 Fastfix Plumbing and Heating Limited Dormant England 100 100 HomeServe Care Solutions Limited Dormant England 100 100 HomeServe Warranties Limited Dormant England 100 100 Multimaster Limited Dormant England 100 100 HomeServe Labs Limited
(formerly HomeServe Alliance Limited) Trading England 100 100 Continental EuropeDomeo SAS Trading France 100 100 Reparalia Direct S.L. Trading Spain 100 100 Reparalia SA Trading Spain 100 100 Seguragua SA Trading Spain 50 50 Assistenza Casa Srl Trading Italy 100 100
Year ended 31 March 2016
Notes to financial statements continued
Page Title at start:Content Section at start:

Annual Report & Accounts 2016
HomeServe plc | 135
Financial statements
Name of legal entity Activity
Place of incorporation ownership (or
registration) and operation
Proportion of voting interest
%
Proportion of power held
%
United States of AmericaHomeServe USA Corp Trading USA 100 100 HomeServe USA Repair Management Corp Trading USA 100 100 HomeServe USA Repair Management (Florida) Trading USA 100 100 Leakguard Inc Dormant USA 100 100 Leakguard Repair Services Inc Dormant USA 100 100 HomeServe USA Repair Management Corp (Iowa) Dormant USA 100 100 HomeServe USA Repair Management Corp
(California) Dormant USA 100 100 HomeServe USA Repair Management Corp
(Virginia) Dormant USA 100 100 HomeServe USA Repair Management Corp
(Wisconsin) Trading USA 100 100 HomeServe USA Energy Services LLC Trading USA 100 100 HomeServe USA Energy Services (New England ) LLC Trading USA 100 100 LI PH Enterprises LLC Trading USA 49 49NYC PH Enterprises LLC Trading USA 49 49AustraliaHome Service Direct Pty Limited Non-Trading Australia 100 100
Other investments
Available for sale investments carried at fair value £m
At 1 April 2014 – Increase in investment 4.8 Exchange movements (0.4)
At 1 April 2015 4.4 Gain on revaluation 2.5 Increase in investment 0.5 Exchange movements 0.4
At 31 March 2016 7.8
On 4 July 2014, HomeServe entered into an equity partnership investment agreement with a manufacturer of smart meter connected home technology. On 12 August 2015, HomeServe invested a further £0.5m into the equity partnership investment agreement. The fair value of this investment has been assessed at 31 March 2016 by reviewing other recent investments made in the company by third parties. A gain of £2.5m has been recognised in the Group statement of comprehensive income and taken to the available for sale reserve along with the associated deferred taxation charge of £0.7m giving a total available for sale reserve at the year end of £1.8m (FY15: £nil).
Notes to financial statements
Page Title at start:Content Section at start:
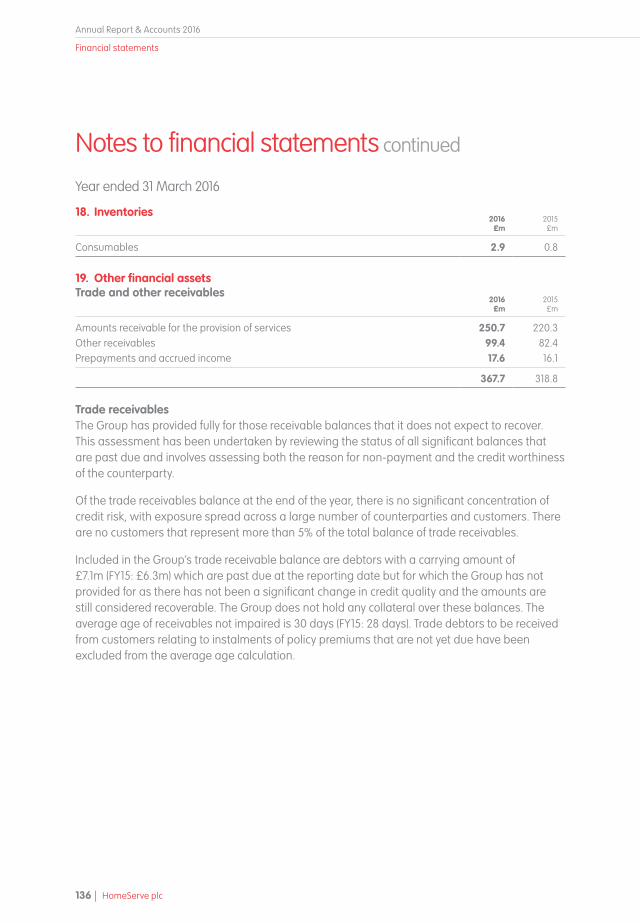
Annual Report & Accounts 2016
Financial statements
136 | HomeServe plc
18. Inventories2016
£m2015£m
Consumables 2.9 0.8
19. Other financial assetsTrade and other receivables
2016£m
2015£m
Amounts receivable for the provision of services 250.7 220.3Other receivables 99.4 82.4Prepayments and accrued income 17.6 16.1
367.7 318.8
Trade receivablesThe Group has provided fully for those receivable balances that it does not expect to recover. This assessment has been undertaken by reviewing the status of all significant balances that are past due and involves assessing both the reason for non-payment and the credit worthiness of the counterparty.
Of the trade receivables balance at the end of the year, there is no significant concentration of credit risk, with exposure spread across a large number of counterparties and customers. There are no customers that represent more than 5% of the total balance of trade receivables.
Included in the Group’s trade receivable balance are debtors with a carrying amount of £7.1m (FY15: £6.3m) which are past due at the reporting date but for which the Group has not provided for as there has not been a significant change in credit quality and the amounts are still considered recoverable. The Group does not hold any collateral over these balances. The average age of receivables not impaired is 30 days (FY15: 28 days). Trade debtors to be received from customers relating to instalments of policy premiums that are not yet due have been excluded from the average age calculation.
Year ended 31 March 2016
Notes to financial statements continued
Page Title at start:Content Section at start:

Annual Report & Accounts 2016
HomeServe plc | 137
Financial statements
Ageing of past due but not impaired receivables:2016
£m2015£m
1 – 30 days 5.1 4.5 31 – 60 days 1.8 1.8 61 – 90 days 0.2 – 91 days + – –
Balance at 31 March past due but not impaired 7.1 6.3 Current/not yet due 243.6 214.0
Balance at 31 March 250.7 220.3
Movement in the allowance for doubtful debts:2016
£m2015£m
At 1 April 1.8 3.5 Impairment losses recognised 2.4 1.9 Amounts written off as uncollectable – (3.6)Amounts recovered during the year (1.8) – Exchange movements 0.1 –
Balance at 31 March 2.5 1.8
In determining the recoverability of a trade receivable, the Group considers any change in the credit quality from the date credit was initially granted up to the reporting date. The concentration of credit risk is limited due to the customer base being large and unrelated. Accordingly, the Directors believe that there is no further credit provision required in excess of the allowance for doubtful debts.
Ageing of impaired trade receivables:2016
£m2015£m
1 – 30 days – –31 – 60 days – –61 – 90 days – –91 days + 2.2 1.5Current/not yet due 0.3 0.3
2.5 1.8
The Directors consider that the carrying amount of trade and other receivables approximates to their fair value.
Notes to financial statements
Page Title at start:Content Section at start:

Annual Report & Accounts 2016
Financial statements
138 | HomeServe plc
19. Other financial assets continuedOther receivablesThe Group serves as an intermediary, whereby it is responsible for the collection of cash on behalf of third parties. Other receivables mainly represent those amounts to be collected from policyholders, and are to be remitted to third parties for obligations such as the cost of underwriting and Insurance Premium Tax. The concentration of credit risk is limited due to individual receivables being small and spread across a diverse policyholder base. In addition, overall balance sheet exposure is mitigated as defaults on these receivables can, in the most part, be offset against the corresponding payable included in ’Other creditors’.
Cash balances and cash equivalentsCash balances and cash equivalents of £54.2m (FY15: £74.7m) comprise cash held by the Group and short-term bank deposits with an original maturity of three months or less. The carrying amount of these assets approximates to their fair value.
20. Bank and other loans2016
£m2015£m
Sterling denominated 25.0 –
Due within one year 25.0 –
US dollar denominated 56.5 49.3Euro denominated – 88.3Sterling denominated 140.0 –
Due after one year 196.5 137.6
Total bank and other loans 221.5 137.6
The US Dollar (current year) and US Dollar and Euro (FY15) denominated borrowings are used to provide debt funding to the USA and Continental European operations respectively. Included in the bank and other amounts due are the revolving credit facility borrowings of £144.4m (FY15: £135.6m). Foreign currency borrowings are drawn in the UK and passed to the overseas subsidiaries of the Group by way of intercompany loans, denominated in the same currencies. These external borrowings and the equivalent intercompany receivable loans are treated as monetary liabilities and assets respectively and, as such, the Group’s foreign currency exposure risk is minimised.
2016%
2015%
The weighted average interest rates paid were as follows: Bank and other loans 2.0 1.7
All the Group’s borrowings are unsecured. The carrying amount of the Group’s borrowings approximates to their fair value, and the currencies in which they are denominated reflect the geographical segments for which they have been used.
Year ended 31 March 2016
Notes to financial statements continued
Page Title at start:Content Section at start:

Annual Report & Accounts 2016
HomeServe plc | 139
Financial statements
The other principal features of the Group’s borrowings are as follows:
• The Group has a £300m revolving credit facility with five banks in the UK. This facility was taken out on 31 July 2014 and has a term of five years. The financial covenants associated with the credit facilities are ‘net debt to EBITDA of less than 3.0 times’ (FY15: 3.0 times) and ‘interest cover greater than 4.0 times EBITDA’ (FY15: 4.0 times). Interest is charged at floating rates at margins of between 0.9% and 1.25% (FY15: 0.9%) above the relevant reference rate, thus exposing the Group to cash flow and interest rate risk. At 31 March 2016, the Group had available £155.6m (FY15: £164.4m) of undrawn committed borrowing facilities in respect of which all conditions precedent had been met.
• In addition, the Group has a $5m facility in the USA, of which $3.1m/£2.1m (FY15: $3.0m/£2.0m) was drawn at 31 March. The weighted average interest was 1.5% (FY15: 1.5%).
• During the year the Group has secured additional funding via a £50m US Private Placement. The Private Placement was taken out on 7 October 2015 and has a term of seven years. The financial covenants associated with this facility are the same as the £300m revolving credit facility and interest is charged at a fixed rate of 3.44%.
• Additionally the Group secured a £25m loan on 31 December 2015 which has a term of seven months. The financial covenants associated with this facility are the same as the £300m revolving credit facility and interest is charged at floating rates at margins of 0.63% above the relevant reference rate, thus exposing the Group to cash flow and interest rate risk.
The Group has complied with all covenant requirements in the current and prior year. Information about liquidity risk is presented in note 38.
21. Deferred taxThe following are the major deferred tax (liabilities) and assets recognised by the Group and movements:
Asset/(liability)
Timing differences
£m
Elected goodwill
deductions£m
Retirement benefit
obligations£m
Share schemes
£m
Acquired intangibles
assets£m
Unutilised losses
£m
Available for sale reserve
£m
Acquired property
£mTotal
£m
At 1 April 2014 5.6 (0.2) (0.2) 2.9 (23.1) 0.5 – (0.5) (15.0)Credit/(charge) to Income 1.5 – (0.2) 0.5 1.6 (0.4) – – 3.0 Credit to equity – – – 0.5 – – – – 0.5 Credit to Comprehensive
Income – – 0.4 – – – – – 0.4 Exchange movements – – – 0.1 2.5 – – – 2.6
At 1 April 2015 7.1 (0.2) – 4.0 (19.0) 0.1 – (0.5) (8.5)(Charge)/credit to Income (3.0) – (0.3) – 2.0 – – – (1.3)Charge to equity – – – (0.2) – – – – (0.2)Charge to Comprehensive
Income – – (0.1) – – – (0.7) – (0.8)Acquisition of Subsidiary – – – – (1.8) – – – (1.8)Exchange movements 0.3 – – 0.1 (1.5) – – – (1.1)
At 31 March 2016 4.4 (0.2) (0.4) 3.9 (20.3) 0.1 (0.7) (0.5) (13.7)
Notes to financial statements
Page Title at start:Content Section at start:

Annual Report & Accounts 2016
Financial statements
140 | HomeServe plc
21. Deferred tax continuedCertain deferred tax assets and liabilities have been offset. The following is the analysis of the deferred tax balances (after offset) for financial reporting purposes:
UK£m
France£m
Spain£m
USA£m
2016£m
2015£m
Deferred tax assets – – 1.8 5.0 6.8 9.5Deferred tax liabilities (2.9) (17.6) – – (20.5) (18.0)
Net deferred tax asset/(liability) (2.9) (17.6) 1.8 5.0 (13.7) (8.5)
At the balance sheet date, the Group recognised a deferred tax asset of £0.1m (FY15: £0.1m) on unused tax losses of £0.3m (FY15: £0.3m) available for offset against future profits, based on estimates of budgeted profits in the forthcoming years. Deferred tax has not been recognised on £18.3m (FY15: £18.4m) of unused losses due to the uncertainty over the timing of future recovery.
There are no expiry dates in respect of the unrecognised tax losses in either year.
22. Current liabilities – trade and other payables2016
£m2015£m
Trade creditors and accruals 121.6 87.8Contingent consideration 0.2 –Deferred consideration 1.0 0.9Deferred income 54.4 47.1Taxes and social security, excluding current tax 9.9 8.3Other creditors 173.6 164.1
360.7 308.2
Trade creditors and accruals principally comprise amounts outstanding for trade purchases and ongoing costs. The average credit period taken for trade purchases is 69 days (FY15: 51 days).
Deferred income represents revenue where an obligation exists to provide future services. An appropriate proportion of monies received in advance is treated as deferred income and recognised over the relevant period.
Other creditors mainly represent those amounts to be collected from policyholders but to be remitted to third parties for obligations such as the cost of underwriting and Insurance Premium Tax.
The Directors consider that the carrying amount of trade and other payables approximates their fair value.
Year ended 31 March 2016
Notes to financial statements continued
Page Title at start:Content Section at start:

Annual Report & Accounts 2016
HomeServe plc | 141
Financial statements
23. Non-current liabilities – other financial liabilitiesContingent
and deferred consideration
£m
At 1 April 2015 2.1 Added on acquisition of a subsidiary 4.3 Other movement in year (0.8)
At 31 March 2016 5.6
Contingent and deferred consideration relates to future amounts payable on acquisitions. The other movement in the year represents the reclassification of an element of the liability to less than one year, unwinding of discount and foreign exchange movements.
24. Share capital2016
£m2015£m
Issued and fully paid 307,892,426 ordinary shares of 2 9/13p each 8.3 –Issued and fully paid 331,249,119 ordinary shares of 2.5p each – 8.3
The Company has one class of ordinary shares which carry no right to fixed income. Share capital represents consideration received for the nominal value of 2 9/13p per share on all issued and fully paid shares (FY15 2.5p).
Following payment of a special dividend on 20 July 2015, the Company completed a consolidation of existing ordinary shares on the basis of 13 new ordinary shares for every 14 existing ordinary shares. Following the consolidation there were 307,672,834 shares in issue with a nominal value of 2 9/13p.
During the period from 1 April 2015 to 20 July 2015 the Company issued 90,856 shares with a nominal value of 2.5p creating share capital of £2,271 and share premium of £166,370.
During the period from 21 July 2015 to 31 March 2016 the Company issued 219,592 shares with a nominal value of 2 9/13p creating share capital of £5,912 and share premium of £436,918.
In the prior period 1,023,662 shares were issued with a nominal value of 2.5p each creating share capital of £25,592 and share premium of £1,873,369.
Notes to financial statements
Page Title at start:Content Section at start:
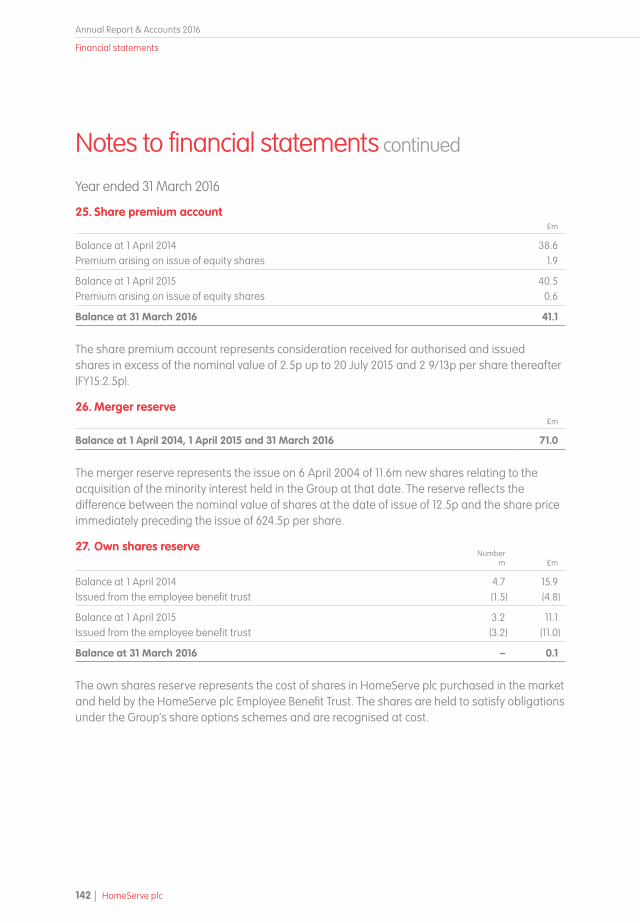
Annual Report & Accounts 2016
Financial statements
142 | HomeServe plc
25. Share premium account£m
Balance at 1 April 2014 38.6Premium arising on issue of equity shares 1.9
Balance at 1 April 2015 40.5Premium arising on issue of equity shares 0.6
Balance at 31 March 2016 41.1
The share premium account represents consideration received for authorised and issued shares in excess of the nominal value of 2.5p up to 20 July 2015 and 2 9/13p per share thereafter (FY15:2.5p).
26. Merger reserve£m
Balance at 1 April 2014, 1 April 2015 and 31 March 2016 71.0
The merger reserve represents the issue on 6 April 2004 of 11.6m new shares relating to the acquisition of the minority interest held in the Group at that date. The reserve reflects the difference between the nominal value of shares at the date of issue of 12.5p and the share price immediately preceding the issue of 624.5p per share.
27. Own shares reserveNumber
m £m
Balance at 1 April 2014 4.7 15.9 Issued from the employee benefit trust (1.5) (4.8)
Balance at 1 April 2015 3.2 11.1 Issued from the employee benefit trust (3.2) (11.0)
Balance at 31 March 2016 – 0.1
The own shares reserve represents the cost of shares in HomeServe plc purchased in the market and held by the HomeServe plc Employee Benefit Trust. The shares are held to satisfy obligations under the Group’s share options schemes and are recognised at cost.
Year ended 31 March 2016
Notes to financial statements continued
Page Title at start:Content Section at start:

Annual Report & Accounts 2016
HomeServe plc | 143
Financial statements
28. Share incentive reserve£m
Balance at 1 April 2014 14.4 Share-based payment charges in the year 4.2 Share options exercised in the year (2.9)
Balance at 1 April 2015 15.7 Share-based payment charges in the year 2.6 Share options exercised in the year (2.3)
Balance at 31 March 2016 16.0
The share incentive reserve represents the cumulative charges to income under IFRS2 ‘Share- Based Payments’ on all share options and schemes granted after 7 November 2002 that had not vested as at 1 January 2005, net of share option exercises.
29. Capital redemption reserve£m
Balance at 1 April 2014, 1 April 2015 and 31 March 2016 1.2
The capital redemption reserve arose on the redemption of 1.2m £1 redeemable preference shares on 1 July 2002.
30. Currency translation reserve£m
Balance at 1 April 2014 2.3 Movement in the year taken to comprehensive income (11.6)
Balance at 1 April 2015 (9.3)Movement in the year taken to comprehensive income 14.8
Balance at 31 March 2016 5.5
The currency translation reserve represents the cumulative foreign currency translation movement on the assets and liabilities of the Group’s international operations at year end exchange rates.
Notes to financial statements
Page Title at start:Content Section at start:
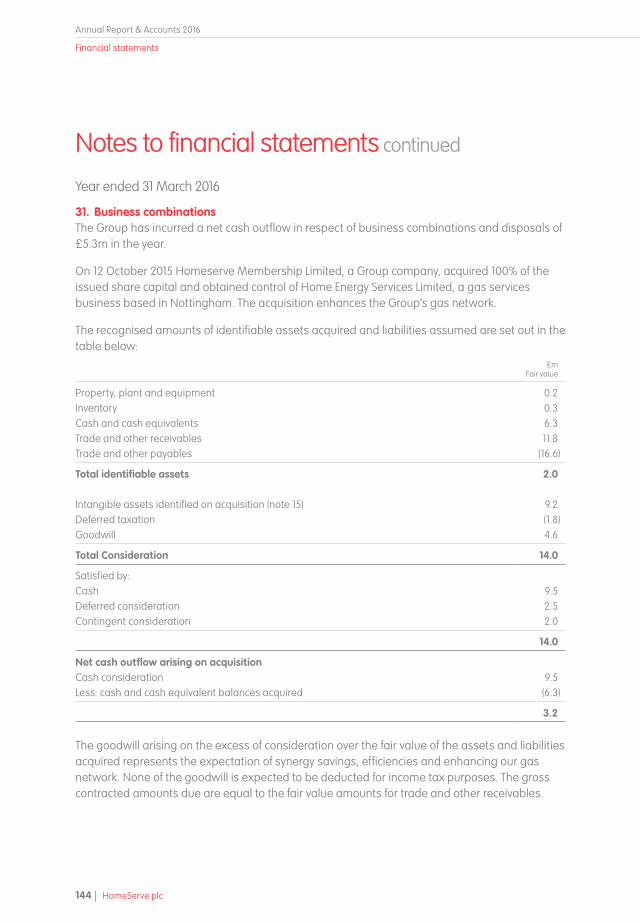
Annual Report & Accounts 2016
Financial statements
144 | HomeServe plc
31. Business combinationsThe Group has incurred a net cash outflow in respect of business combinations and disposals of £5.3m in the year.
On 12 October 2015 Homeserve Membership Limited, a Group company, acquired 100% of the issued share capital and obtained control of Home Energy Services Limited, a gas services business based in Nottingham. The acquisition enhances the Group’s gas network.
The recognised amounts of identifiable assets acquired and liabilities assumed are set out in the table below:
£mFair value
Property, plant and equipment 0.2 Inventory 0.3 Cash and cash equivalents 6.3 Trade and other receivables 11.8 Trade and other payables (16.6)
Total identifiable assets 2.0
Intangible assets identified on acquisition (note 15) 9.2 Deferred taxation (1.8)Goodwill 4.6
Total Consideration 14.0
Satisfied by:Cash 9.5 Deferred consideration 2.5 Contingent consideration 2.0
14.0
Net cash outflow arising on acquisitionCash consideration 9.5 Less: cash and cash equivalent balances acquired (6.3)
3.2
The goodwill arising on the excess of consideration over the fair value of the assets and liabilities acquired represents the expectation of synergy savings, efficiencies and enhancing our gas network. None of the goodwill is expected to be deducted for income tax purposes. The gross contracted amounts due are equal to the fair value amounts for trade and other receivables.
Year ended 31 March 2016
Notes to financial statements continued
Page Title at start:Content Section at start:

Annual Report & Accounts 2016
HomeServe plc | 145
Financial statements
The contingent consideration arrangement requires payments over a two year period based upon progression of the gas and installation business. The maximum undiscounted amount of all future payments that the Group could be required to make under the contingent consideration arrangement is £2.2m.
The fair value of the contingent consideration arrangement of £2.0m was estimated by applying a discount rate of 7.14%.
Home Energy Services Limited contributed £4.2m of revenue and a loss of £1.0m to the Group’s profit for the year ended 31 March 2016.
If the acquisition had been completed on the first day of the financial year, group revenues for the period would have been £643.7m and group profit before taxation would have been £82.5m.
In addition to the net cash outflow on the acquisition above of £3.2m, deferred consideration was paid relating to prior period business combinations of £1.1m (FY15 £1.1m). A further £1.0m was paid in relation to the acquisition of a small policy book in the USA.
Acquisition-related costs (included in operating costs) amounted to £0.4m.
32. Notes to the cash flow statement2016
£m2015£m
Operating profit 86.9 79.1 Adjustments for:Depreciation of property, plant and equipment 5.4 4.6 Amortisation of intangible assets 30.4 27.4 Share-based payments expense 5.1 4.2 Loss on disposal of property, plant and equipment and software – 0.2
Operating cash flows before movements in working capital 127.8 115.5 Increase in inventories (1.7) – Increase in receivables (25.1) (24.2)Increase in payables (excluding exceptional provision) 20.7 11.0 Decrease in exceptional provision – (7.7)
Cash generated by operations 121.7 94.6 Income taxes paid (17.3) (22.8)Interest paid (3.3) (4.4)
Net cash inflow from operating activities 101.1 67.4
Notes to financial statements
Page Title at start:Content Section at start:

Annual Report & Accounts 2016
Financial statements
146 | HomeServe plc
33. Operating lease arrangementsThe Group as lessee
2016£m
2015£m
Minimum lease payments under operating leases recognised in income for the year 8.1 7.4
At the balance sheet date, the Group had outstanding commitments for future minimum lease payments under non-cancellable operating leases, which fall due as follows:
2016£m
2015£m
Within one year 8.5 8.5In the second to fifth years inclusive 16.8 19.7After five years 0.8 4.2
26.1 32.4
Operating lease payments principally represent rentals payable by the Group for certain of its land and buildings, motor vehicles and office equipment. The leases have varying terms and some have renewal options.
34. Obligations under finance leases2016
£m2015£m
Amounts payable under finance leases:Amounts due for settlement within 12 months 0.9 0.6Amounts due for settlement after 12 months: in the second to fifth years inclusive 1.3 0.6
Present value of lease obligations 2.2 1.2
Minimum lease payments
Within one year 0.9 0.6In the second to fifth years inclusive 1.3 0.6
Present value of lease obligations 2.2 1.2
Certain motor vehicles are held under finance leases. The average lease term is 5 years (FY15: 4 years). For the year ended 31 March 2016, the average effective borrowing rate was 2.5% (FY15: 3.0%). Interest rates are fixed at the contract date. All leases are on a fixed repayment basis and no arrangements have been entered into for contingent rental payments.
All lease obligations are denominated in US dollars. The fair value of the Group’s lease obligations is approximately equal to their carrying amount. The Group’s obligations under finance leases are secured by the lessors’ rights over the leased assets.
Year ended 31 March 2016
Notes to financial statements continued
Page Title at start:Content Section at start:

Annual Report & Accounts 2016
HomeServe plc | 147
Financial statements
35. Share-based paymentsDuring the year ended 31 March 2016, the Group had four (FY15: five) share-based payment schemes, which are described below:
i) Long-Term Incentive Plan (‘LTIP’)The LTIP provides for the grant of performance, matching and restricted awards. The vesting period is three years for all awards. For the performance and matching awards granted in FY14 and FY15, vesting is dependent upon the Total Shareholder Return performance of the Group over the relevant performance period. The restricted awards granted in FY14 and FY15 are subject to the continued employment of the participant at the date of vesting. For the performance and matching awards granted in FY16, 75% of the awards are subject to an Earnings Per Share performance condition over the three year vesting period. The remaining 25% of awards are subject to Total Shareholder Return conditions measured over the same three year period. There were no restricted awards in FY16.
ii) Save As You Earn Scheme (‘SAYE’)The SAYE is open to all UK employees and provides for an exercise price equal to the closing quoted market price on the day before the date of grant, less a discretionary discount. The options can be exercised during a six month period following the completion of either a three or five year savings period.
iii) Executive Share Option Plan (‘ESOP’)The ESOP provided for a grant price equal to the closing quoted market price of the Company’s shares on the day before the date of grant. The vesting period was three years and was dependent upon the real increase in Earnings per Share over the vesting period. If the options remain unexercised after a period of 10 years from the date of grant, the options expire. The plan is no longer used and all remaining share options were exercised in the current year.
iv) Deferred Bonus Plan (‘DBP’)The DBP enabled the individual to defer receipt of their annual cash bonus (up to a maximum of 100%) and to invest an equivalent amount in the ordinary share capital of the Company. The deferred bonus may be matched by the Company dependent upon the Company’s relative Total Shareholder Return over a three year period. The shares lapse if not exercised within 10 years from the date of grant. The plan is no longer used and all remaining share options were exercised in the current year.
Notes to financial statements
Page Title at start:Content Section at start:

Annual Report & Accounts 2016
Financial statements
148 | HomeServe plc
35. Share-based payments continuedv) 2005 Key Executive Incentive Plan (‘KEIP’)The KEIP provided for a grant price equal to the closing quoted market price of the Company’s shares on the day before the date of grant. The awards vested in two tranches, the first being between three and four years from the date of grant and the second being on the second anniversary of the vesting of the first tranche. The number of awards vesting was dependent upon the Profit before Tax of the Group for the year ended 31 March 2008 and was subject to a minimum share price criteria during the year ending 31 March 2009. If the options remain unexercised after a period of 10 years from the date of grant, the options expire. The plan is no longer used and all remaining share options were exercised during the prior year.
LTIP SAYE ESOP DBP
2016NumberOutstanding at 1 April 2015 6,985,223 1,818,777 292,705 256,995 Granted 2,053,907 827,601 – – Lapsed – – – – Forfeited (252,564) (235,483) – –Exercised (2,440,613) (310,448) (292,705) (256,995)
Outstanding at 31 March 2016 6,345,953 2,100,447 – –
Exercisable at 31 March 2016 9,189 39,068 – –
Weighted average exercise price (£)Outstanding at 1 April 2015 – 2.25 1.92 – Granted – 3.35 – – Lapsed – – – – Forfeited – 2.48 – – Exercised – 1.97 1.92 –
Outstanding at 31 March 2016 – 2.70 – –
Exercisable at 31 March 2016 – 2.01 – –
Range of exercise price of options outstanding at 31 March 2016£0.01 to £0.99 – – – – £1.00 to £1.99 – 557,741 – – £2.00 to £2.99 – 752,827 – – £3.00 to £3.99 – 789,879 – – Weighted average remaining contractual life 2 3 – –Weighted average fair value of options
awarded in 2016 £3.98 £1.35 – –
Year ended 31 March 2016
Notes to financial statements continued
Page Title at start:Content Section at start:

Annual Report & Accounts 2016
HomeServe plc | 149
Financial statements
LTIP SAYE ESOP KEIP DBP
2015NumberOutstanding at 1 April 2014 7,551,677 2,269,832 992,705 72,295 256,995Granted 2,162,173 888,891 – – –Lapsed (1,417,604) – – – –Forfeited (783,907) (316,314) – – –Exercised (527,116) (1,023,632) (700,000) (72,295) –
Outstanding at 31 March 2015 6,985,223 1,818,777 292,705 – 256,995
Exercisable at 31 March 2015 – 99,779 292,705 – 256,995
Weighted average exercise price (£)Outstanding at 1 April 2014 – 1.87 1.58 1.92 – Granted – 2.60 – – – Lapsed – – – – – Forfeited – 2.18 – – – Exercised – 1.86 1.44 1.92 –
Outstanding at 31 March 2015 – 2.25 1.92 – –
Exercisable at 31 March 2015 – 1.85 1.92 – –
Range of exercise price of options outstanding at 31 March 2015£0.01 to £0.99 – – – – – £1.00 to £1.99 – 939,554 292,705 – – £2.00 to £2.99 – 869,522 – – – £3.00 to £3.99 – 9,701 – – – Weighted average remaining contractual life 2 3 – – – Weighted average fair value of options
awarded in 2015 £2.08 £1.46 – – –
Notes to financial statements
Page Title at start:Content Section at start:

Annual Report & Accounts 2016
Financial statements
150 | HomeServe plc
35. Share-based payments continuedThe weighted average share price at the date of exercise for share options exercised during the year was £4.24 (FY15: £3.30).
The estimated fair values are calculated by applying a Black-Scholes option pricing model for the ESOP and SAYE and Monte Carlo simulations for the LTIP and DBP. The assumptions used in the models (which are comparable to the prior year) are as follows:Input Assumption
Share price Price at date of grantExercise price Per scheme rulesExpected volatility 25% – 55%Option life Per scheme rulesExpected dividends Based on historic dividend yieldRisk free interest rate 0.8% – 1.5%
Levels of early exercises and lapses are estimated using historical averages. Volatility is calculated by looking at the historical share price movements prior to the date of grant over a period of time commensurate with the remaining term for each award.
The Group recognised total expenses of £5.1m (FY15: £4.2m) related to equity-settled share-based payment transactions.
36. Retirement benefit schemesDefined contribution schemesThe Group operates a defined contribution retirement benefit scheme for all UK employees. The assets of the scheme are held separately from those of the Group in funds under the control of trustees. Where there are employees who leave the scheme within two years of joining and they choose to take a refund, the contributions paid by the Group are forfeited by the employee.
In addition to the scheme in the UK, the Group operates a defined contribution retirement benefit scheme for USA employees.
The total cost charged to income of £3.4m (FY15: £2.4m) represents contributions payable to the schemes by the Group at rates specified in the rules of the schemes. At 31 March 2016, contributions of £311,000 (FY15: £202,000) due in respect of the current reporting period had not been paid over to the schemes.
Year ended 31 March 2016
Notes to financial statements continued
Page Title at start:Content Section at start:

Annual Report & Accounts 2016
HomeServe plc | 151
Financial statements
Defined benefit schemeThe Group participates in a defined benefit scheme, the Water Companies Pension Scheme, which is closed to new members. This is a sectionalised scheme and the Group participates in the HomeServe plc Section of the Scheme. The Section is administered by a Trustee and is independent of the Group’s finances. Contributions are paid to the Section in accordance with the recommendations of an independent actuary.
The results of the actuarial valuation as at 31 March 2014 were updated to the accounting date by a qualified independent actuary in accordance with IAS19. Remeasurements are recognised immediately through other comprehensive income.
Valuation at2016 2015
Key assumptions used:Discount rate at 31 March 3.5% 3.3%Consumer price inflation 2.2% 2.3%Retail price inflation 3.2% 3.3%Expected rate of salary increases 2.2% 2.3%Future pension increases 2.2% 2.3%Life expectancy of female aged 60 at balance sheet date 29.7yrs 29.6yrsLife expectancy of male aged 60 at balance sheet date 27.8yrs 27.7yrs
Pensions accounting entries are subject to judgement and volatility, as the assets are largely linked to the equity market, whereas the present value of the obligation is linked to yields on AA-rated corporate bonds.
As an indication, all other things being equal:
• an increase in the discount rate of 0.1% would lead to a reduction in the value placed on the obligations of the Section of approximately £0.5m
• an increase in the inflation assumption rate of 0.1% would lead to an increase in the value placed on the obligations of the Section of approximately £0.5m
• an increase of life expectancy of 1 year would lead to an increase in the value placed on the obligations of the Section of approximately £0.7m.
Amounts recognised in income in respect of the defined benefit scheme are as follows:2016
£m2015£m
Current service cost 0.2 0.1Interest cost – –
Recognised in operating costs 0.2 0.1
The actual return on scheme assets was a loss of £1.5m (FY15: profit of £2.6m).
Notes to financial statements
Page Title at start:Content Section at start:

Annual Report & Accounts 2016
Financial statements
152 | HomeServe plc
36. Retirement benefit schemes continuedDefined benefit scheme continuedThe amount included in the balance sheet arising from the Group’s obligations in respect of its defined benefit retirement scheme is as follows:
2016£m
2015£m
Present value of defined benefit obligations (26.6) (28.0)Fair value of scheme assets 28.7 28.1
Surplus in scheme recognised in the balance sheet in non-current assets 2.1 0.1
Movements in the present value of defined benefit obligations in the current year were as follows:
2016£m
2015£m
At 1 April 28.0 22.3 Employer’s part of the current service cost 0.2 0.1 Interest cost 0.9 1.0 Contributions from scheme members – 0.1 Actuarial (gains)/losses (2.0) 4.7 Benefits paid (0.5) (0.2)
At 31 March 26.6 28.0
Movements in the fair value of scheme assets in the current year were as follows:2016
£m2015£m
At 1 April 28.1 23.5 Interest on Section assets 0.9 1.0 Actual return less interest on Section assets (1.5) 2.6 Contributions from the employer 1.7 1.1 Contributions from scheme members – 0.1 Benefits paid (0.5) (0.2)
At 31 March 28.7 28.1
The amount recognised outside the income statement in the statement of comprehensive income for FY16 is a gain of £0.5m (FY15: loss of £2.1m). The cumulative amount recognised outside profit and loss at 31 March 2016 is a loss of £3.9m (FY15: loss £4.4m).
Year ended 31 March 2016
Notes to financial statements continued
Page Title at start:Content Section at start:
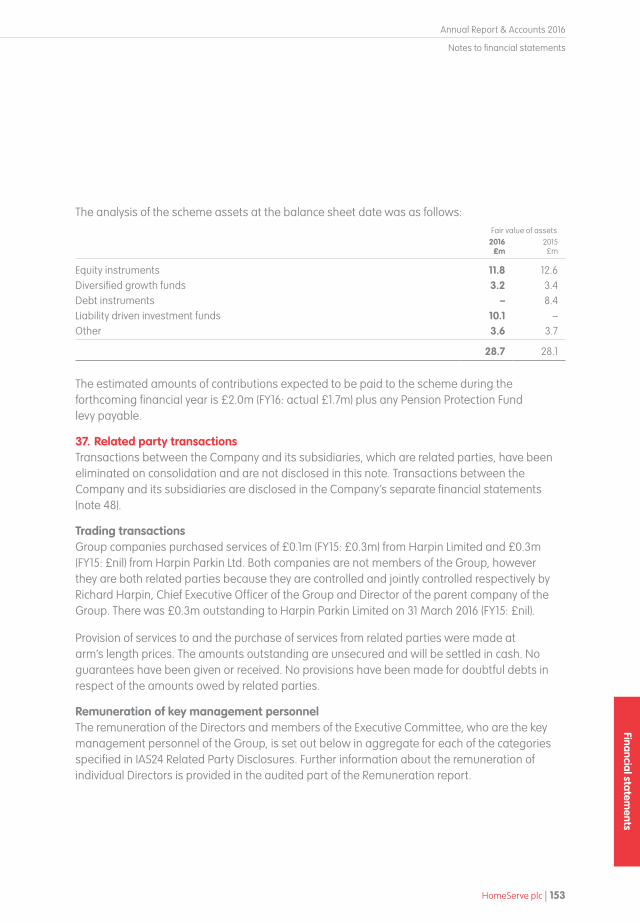
Annual Report & Accounts 2016
HomeServe plc | 153
Financial statements
Notes to financial statements
The analysis of the scheme assets at the balance sheet date was as follows:Fair value of assets
2016£m
2015£m
Equity instruments 11.8 12.6Diversified growth funds 3.2 3.4Debt instruments – 8.4Liability driven investment funds 10.1 –Other 3.6 3.7
28.7 28.1
The estimated amounts of contributions expected to be paid to the scheme during the forthcoming financial year is £2.0m (FY16: actual £1.7m) plus any Pension Protection Fund levy payable.
37. Related party transactionsTransactions between the Company and its subsidiaries, which are related parties, have been eliminated on consolidation and are not disclosed in this note. Transactions between the Company and its subsidiaries are disclosed in the Company’s separate financial statements (note 48).
Trading transactionsGroup companies purchased services of £0.1m (FY15: £0.3m) from Harpin Limited and £0.3m (FY15: £nil) from Harpin Parkin Ltd. Both companies are not members of the Group, however they are both related parties because they are controlled and jointly controlled respectively by Richard Harpin, Chief Executive Officer of the Group and Director of the parent company of the Group. There was £0.3m outstanding to Harpin Parkin Limited on 31 March 2016 (FY15: £nil).
Provision of services to and the purchase of services from related parties were made at arm’s length prices. The amounts outstanding are unsecured and will be settled in cash. No guarantees have been given or received. No provisions have been made for doubtful debts in respect of the amounts owed by related parties.
Remuneration of key management personnelThe remuneration of the Directors and members of the Executive Committee, who are the key management personnel of the Group, is set out below in aggregate for each of the categories specified in IAS24 Related Party Disclosures. Further information about the remuneration of individual Directors is provided in the audited part of the Remuneration report.
Page Title at start:Content Section at start:

Annual Report & Accounts 2016
Financial statements
154 | HomeServe plc
37. Related party transactions continuedRemuneration of key management personnel continued
2016£m
2015£m
Short-term employee benefits 4.9 4.5Post-employment benefits 0.3 0.2Share-based payments expense 3.9 2.5
9.1 7.2
Except as noted above, there were no other transactions with Directors requiring disclosure.
38. Financial instrumentsPrincipal financial instrumentsThe principal financial instruments used by the Group from which financial instrument risk arises are as follows:
• cash and cash equivalents
• bank overdrafts, revolving credit facilities, bank loans and Private Placements
• trade receivables
• other receivables
• trade payables
• contingent and deferred consideration
• other creditors
• investments
All principal financial instruments are stated at amortised cost, with the exception of contingent and deferred consideration and investments which are held at fair value.
Financial instruments that are measured subsequent to initial recognition at fair value are grouped into Levels 1 to 3 based on the degree to which the fair value is observable:
• Level 1 fair value measurements are those derived from quoted prices in active markets for identical assets or liabilities
• Level 2 fair value measurements are those derived from inputs other than quoted prices included within Level 1 that are observable for the asset or liability either directly or indirectly
• Level 3 fair value measurements are those derived from valuation techniques that include inputs for the asset or liability that are not based on observable market data.
The Group has no financial instruments with fair values that are determined by reference to Level 1 or Level 2 and there were no transfers of assets or liabilities between levels during the period. There are no non-recurring fair value measurements. The Group held the following Level 3 financial instruments at fair value.
Year ended 31 March 2016
Notes to financial statements continued
Page Title at start:Content Section at start:
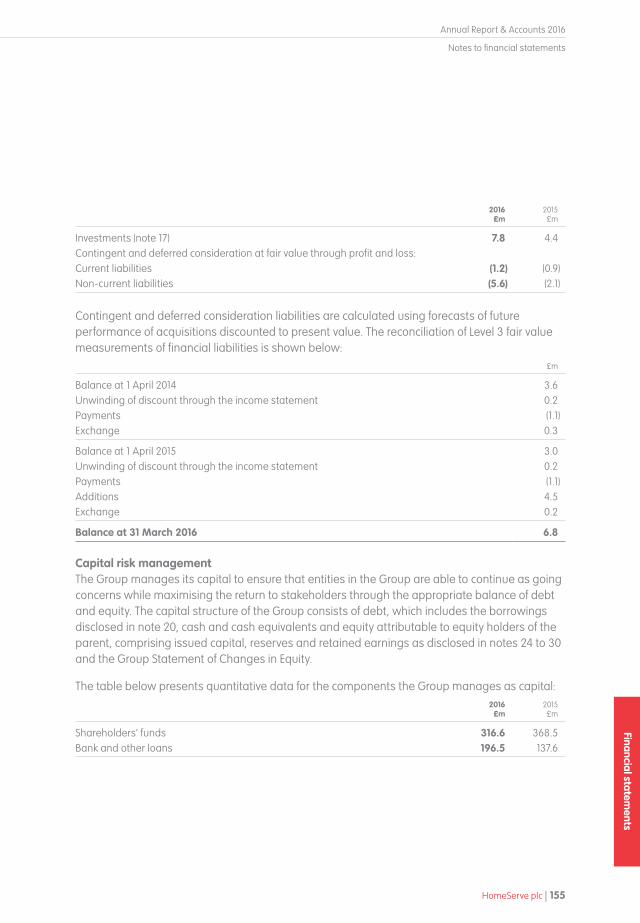
Annual Report & Accounts 2016
HomeServe plc | 155
Financial statements
2016£m
2015£m
Investments (note 17) 7.8 4.4Contingent and deferred consideration at fair value through profit and loss:Current liabilities (1.2) (0.9)Non-current liabilities (5.6) (2.1)
Contingent and deferred consideration liabilities are calculated using forecasts of future performance of acquisitions discounted to present value. The reconciliation of Level 3 fair value measurements of financial liabilities is shown below:
£m
Balance at 1 April 2014 3.6 Unwinding of discount through the income statement 0.2 Payments (1.1)Exchange 0.3
Balance at 1 April 2015 3.0 Unwinding of discount through the income statement 0.2 Payments (1.1)Additions 4.5 Exchange 0.2
Balance at 31 March 2016 6.8
Capital risk managementThe Group manages its capital to ensure that entities in the Group are able to continue as going concerns while maximising the return to stakeholders through the appropriate balance of debt and equity. The capital structure of the Group consists of debt, which includes the borrowings disclosed in note 20, cash and cash equivalents and equity attributable to equity holders of the parent, comprising issued capital, reserves and retained earnings as disclosed in notes 24 to 30 and the Group Statement of Changes in Equity.
The table below presents quantitative data for the components the Group manages as capital:2016
£m2015£m
Shareholders’ funds 316.6 368.5Bank and other loans 196.5 137.6
Notes to financial statements
Page Title at start:Content Section at start:

Annual Report & Accounts 2016
Financial statements
156 | HomeServe plc
38. Financial instruments continuedCapital risk management continuedCertain of the entities in the Group are subject to externally imposed capital requirements from the Financial Conduct Authority. Where such requirements exist, the Group manages the risk through the close monitoring of performance and distributable capital within the entities impacted by the regulations. The Group has complied with all such arrangements throughout the current and preceding year.
Financial risk management objectivesThe Group’s principal financial instruments comprise bank and other loans, overdrafts and cash and cash equivalents. The main purpose of these financial instruments is to raise finance for the Group’s operations. The Group also has various other financial instruments such as trade receivables and trade payables which arise directly from its operations.
Financial risk management is overseen by the Board according to objectives, targets and policies set by the Board. Treasury risk management, including management of currency risk, interest rate risk and liquidity risk is carried out by a central Group Treasury function in accordance with objectives, targets and policies set by the Board. Treasury is not a profit centre and does not enter into speculative transactions.
Classification of financial instrumentsIn addition to the other financial assets and liabilities set out above in ‘Principal financial instruments’, the Group also has financial assets and liabilities disclosed in notes 19, 22 and 23. The main risks arising from the Group’s financial instruments are interest rate risk, credit risk and liquidity risk.
Interest rate riskThe Group’s exposure to the risk of changes in market interest rates primarily relates to the Group’s long-term debt requirements with floating interest rates. The Group’s policy is to manage its interest cost using a mix of fixed and variable rate debts.
The maturity profile of the Group’s financial liabilities based on contractual maturities is provided in the table below. Interest is payable on the bank overdraft and revolving credit facilities. Deferred and contingent consideration payments are stated on the basis of expected cash outflows before discounting.
The actual payment profile of ‘Other creditors’ is principally dependent upon the collection of the corresponding ’Other receivables’ from policyholders. These amounts principally relate to underwriting, which are collected from policyholders and remitted to underwriters following cash collection. Therefore, the actual cash flows may differ from those presented, but will not result in the acceleration of the settlement of the liability.
Year ended 31 March 2016
Notes to financial statements continued
Page Title at start:Content Section at start:

Annual Report & Accounts 2016
HomeServe plc | 157
Financial statements
Bank and other loans
£m
Trade payables
£m
Other creditors
£m
Deferred and contingent
consideration£m
Total£m
2016Under 2 months 1.3 85.9 62.3 0.2 149.7Between 2 and 6 months 25.9 23.4 59.1 0.1 108.5Between 6 and 12 months 2.7 11.2 50.9 0.9 65.7Between 1 and 2 years 4.4 1.1 1.3 2.7 9.5Between 2 and 3 years 4.4 – – 3.2 7.6Between 3 and 4 years 147.1 – – 0.1 147.2Between 4 and 5 years 1.9 – – – 1.9After 5 years 54.1 – – – 54.1
Total 241.8 121.6 173.6 7.2 544.2
Bank and other loans
£m
Trade payables
£m
Other creditors
£m
Deferred and contingent
consideration£m
Total£m
2015Under 2 months 0.3 73.6 48.1 – 122.0Between 2 and 6 months 0.5 6.6 60.6 0.1 67.8Between 6 and 12 months 0.8 7.6 53.5 0.9 62.8Between 1 and 2 years 3.3 – 1.9 0.9 6.1Between 2 and 3 years 1.5 – – 0.9 2.4Between 3 and 4 years 1.5 – – 0.2 1.7Between 4 and 5 years 136.1 – – 0.1 136.2
Total 144.0 87.8 164.1 3.1 399.0
The revolving credit facility is drawn down and associated interest is settled on a monthly basis. The principal is included in the previous table when the facility is due to expire.
It is, and has been throughout the period under review, the Group’s policy that no trading in financial instruments shall be undertaken.
The following table demonstrates the sensitivity to a reasonably possible change of 10% increase in the cost of borrowing, with all other variables held constant, of the Group’s profit before tax (through the impact on floating rate borrowings).
2016 2015
Increase in the cost of borrowing 10% 10%Reduction in profit before tax (£m) 0.1 0.1
Notes to financial statements
Page Title at start:Content Section at start:

Annual Report & Accounts 2016
Financial statements
158 | HomeServe plc
38. Financial instruments continuedCredit riskThe Group trades only with creditworthy third parties. It is the Group’s policy that, with the exception of our policy membership customers, customers who wish to trade on credit terms are reviewed for financial stability.
The majority of the Group’s trade receivables consist of a large number of individual members and hence for these balances the Group does not have any significant credit risk exposure to a single counterparty. As a result, the Group’s exposure to bad debts is not considered to be significant.
With respect to credit risk arising from the other financial assets of the Group, which comprise cash and cash equivalents, the Group’s exposure to credit risk arises from default of the counterparty.
The Group manages the risk associated with cash and cash equivalents through depositing funds only with reputable and creditworthy banking institutions.
The Group has a maximum exposure equal to the carrying amount of the above receivables and instruments.
Liquidity riskUltimate responsibility for liquidity risk management rests with the Group’s Board which sets the framework for the management of the Group’s short, medium and long-term funding and liquidity management requirements. The Group manages liquidity risk by maintaining adequate reserves and banking facilities and continuously monitoring forecast and actual cash flows. Included in note 20 are details of the undrawn facilities that are available to the Group to reduce liquidity risk further.
With the exception of deferred and contingent consideration, the revolving credit facilities, a loan in the USA and the Private Placements, all of the Group’s financial liabilities are due for payment within two years, based on contractual payment terms.
Year ended 31 March 2016
Notes to financial statements continued
Page Title at start:Content Section at start:

Annual Report & Accounts 2016
HomeServe plc | 159
Financial statements
Notes2016
£m2015£m
Profit for the year 111.1 43.3 Items that will not be classified subsequently to the profit and loss:Actuarial gain/(loss) on defined benefit pension scheme 50 0.5 (2.1)Deferred tax (charge)/credit relating to components of other
comprehensive income 47 (0.1) 0.4
Total comprehensive income for the year 111.5 41.6
Year ended 31 March 2016
Company statement of comprehensive income
Company statement of comprehensive income
Page Title at start:Content Section at start:Company financial statements
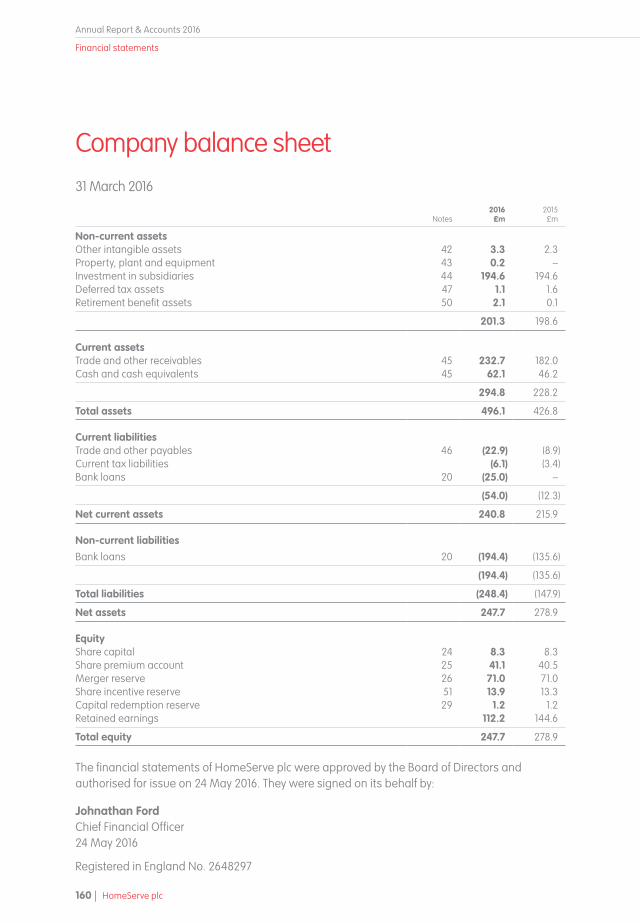
Annual Report & Accounts 2016
Financial statements
160 | HomeServe plc
31 March 2016
Company balance sheet
Notes2016
£m2015£m
Non-current assetsOther intangible assets 42 3.3 2.3 Property, plant and equipment 43 0.2 –Investment in subsidiaries 44 194.6 194.6 Deferred tax assets 47 1.1 1.6 Retirement benefit assets 50 2.1 0.1
201.3 198.6
Current assetsTrade and other receivables 45 232.7 182.0 Cash and cash equivalents 45 62.1 46.2
294.8 228.2
Total assets 496.1 426.8
Current liabilitiesTrade and other payables 46 (22.9) (8.9)Current tax liabilities (6.1) (3.4)Bank loans 20 (25.0) –
(54.0) (12.3)
Net current assets 240.8 215.9
Non-current liabilitiesBank loans 20 (194.4) (135.6)
(194.4) (135.6)
Total liabilities (248.4) (147.9)
Net assets 247.7 278.9
EquityShare capital 24 8.3 8.3 Share premium account 25 41.1 40.5 Merger reserve 26 71.0 71.0 Share incentive reserve 51 13.9 13.3 Capital redemption reserve 29 1.2 1.2 Retained earnings 112.2 144.6
Total equity 247.7 278.9
The financial statements of HomeServe plc were approved by the Board of Directors and authorised for issue on 24 May 2016. They were signed on its behalf by:
Johnathan FordChief Financial Officer 24 May 2016
Registered in England No. 2648297
Page Title at start:Content Section at start:
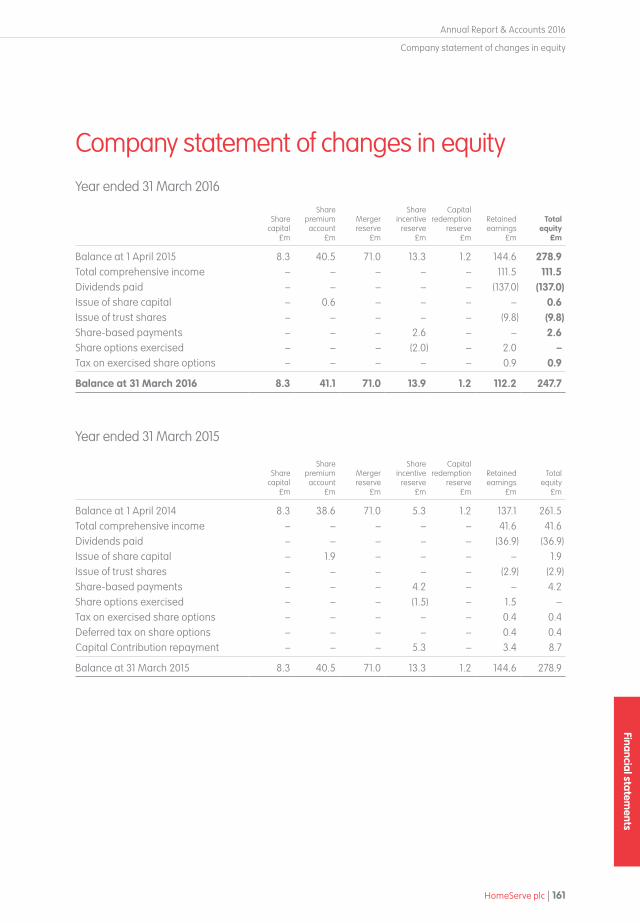
Annual Report & Accounts 2016
HomeServe plc | 161
Financial statements
Year ended 31 March 2016
Company statement of changes in equity
Share capital
£m
Share premium
account£m
Merger reserve
£m
Share incentive
reserve£m
Capital redemption
reserve£m
Retained earnings
£m
Total equity
£m
Balance at 1 April 2015 8.3 40.5 71.0 13.3 1.2 144.6 278.9 Total comprehensive income – – – – – 111.5 111.5Dividends paid – – – – – (137.0) (137.0)Issue of share capital – 0.6 – – – – 0.6 Issue of trust shares – – – – – (9.8) (9.8)Share-based payments – – – 2.6 – – 2.6 Share options exercised – – – (2.0) – 2.0 –Tax on exercised share options – – – – – 0.9 0.9
Balance at 31 March 2016 8.3 41.1 71.0 13.9 1.2 112.2 247.7
Year ended 31 March 2015
Share capital
£m
Share premium
account£m
Merger reserve
£m
Share incentive
reserve£m
Capital redemption
reserve£m
Retained earnings
£m
Total equity
£m
Balance at 1 April 2014 8.3 38.6 71.0 5.3 1.2 137.1 261.5 Total comprehensive income – – – – – 41.6 41.6 Dividends paid – – – – – (36.9) (36.9)Issue of share capital – 1.9 – – – – 1.9 Issue of trust shares – – – – – (2.9) (2.9)Share-based payments – – – 4.2 – – 4.2 Share options exercised – – – (1.5) – 1.5 –Tax on exercised share options – – – – – 0.4 0.4 Deferred tax on share options – – – – – 0.4 0.4 Capital Contribution repayment – – – 5.3 – 3.4 8.7
Balance at 31 March 2015 8.3 40.5 71.0 13.3 1.2 144.6 278.9
Company statement of changes in equity
Page Title at start:Content Section at start:
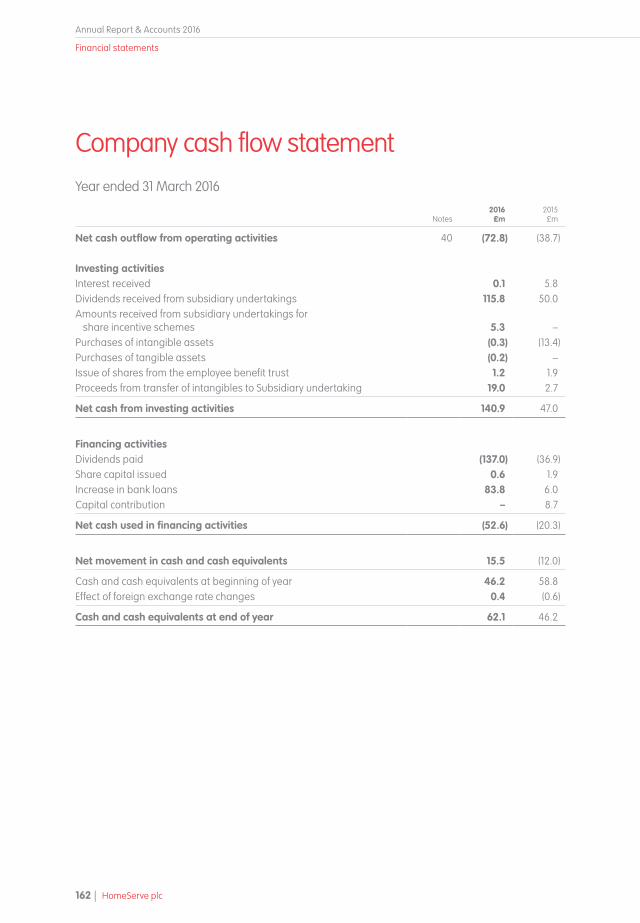
Annual Report & Accounts 2016
Financial statements
162 | HomeServe plc
Notes2016
£m2015£m
Net cash outflow from operating activities 40 (72.8) (38.7)
Investing activitiesInterest received 0.1 5.8 Dividends received from subsidiary undertakings 115.8 50.0 Amounts received from subsidiary undertakings for
share incentive schemes 5.3 –Purchases of intangible assets (0.3) (13.4)Purchases of tangible assets (0.2) –Issue of shares from the employee benefit trust 1.2 1.9 Proceeds from transfer of intangibles to Subsidiary undertaking 19.0 2.7
Net cash from investing activities 140.9 47.0
Financing activitiesDividends paid (137.0) (36.9)Share capital issued 0.6 1.9 Increase in bank loans 83.8 6.0 Capital contribution – 8.7
Net cash used in financing activities (52.6) (20.3)
Net movement in cash and cash equivalents 15.5 (12.0)
Cash and cash equivalents at beginning of year 46.2 58.8 Effect of foreign exchange rate changes 0.4 (0.6)
Cash and cash equivalents at end of year 62.1 46.2
Year ended 31 March 2016
Company cash flow statement
Page Title at start:Content Section at start:

Annual Report & Accounts 2016
HomeServe plc | 163
Financial statements
Company onlyThe following notes 39 to 52 relate to the Company only position for the year ended 31 March 2016.
39. Significant accounting policiesAs provided by s408 of the Companies Act 2006, the Company has not presented its own income statement. The Company’s profit for the year was £111.1m (FY15: £43.3m).
The separate financial statements of the Company are presented as required by the Companies Act 2006. As permitted by that Act, the separate financial statements have been prepared in accordance with International Financial Reporting Standards (IFRSs) adopted by the European Union.
The financial statements have been prepared on the historical cost basis. The principal accounting policies adopted are the same as those set out in note 2 to the consolidated financial statements except that investments in subsidiaries are stated at cost less impairment.
Included within ‘Amounts receivable from Group companies’ are amounts advanced to the HomeServe plc Employee Benefit Trust for the purchase of shares. The shares are held in trust to satisfy obligations under share option schemes and are recognised at cost.
40. Notes to the cash flow statement2016
£m2015£m
Operating loss (13.0) (18.0)Adjustments for:Amortisation of intangible assets 0.2 1.2 Depreciation of property, plant and equipment 0.1 –Share-based payment expense 2.3 1.8
Operating cash flows before movements in working capital (10.4) (15.0)Increase in receivables (64.4) (6.5)Increase/(decrease) in payables (excluding exceptional provision) 3.1 (15.8)Decrease in exceptional provision – (0.2)
Cash used in operations (71.7) (37.5)Income taxes received 2.1 2.9 Interest paid (3.2) (4.1)
Net cash outflow from operating activities (72.8) (38.7)
Notes to Company financial statements
Year ended 31 March 2016
Notes to Company financial statements
Page Title at start:Content Section at start:

Annual Report & Accounts 2016
Financial statements
164 | HomeServe plc
41. Other information2016
£m2015£m
Fees payable to the Company’s auditor for the audit of the Company’s financial statements 65 53
Total audit fees 65 53
42. Other intangible assetsTrademarks
& access rights
£mSoftware
£m
Total intangibles
£m
CostAt 1 April 2014 1.8 10.4 12.2 Additions – 13.7 13.7 Transfer to Subsidiary undertaking – (22.2) (22.2)
At 1 April 2015 1.8 1.9 3.7 Additions – 1.5 1.5 Disposals – (1.1) (1.1)
At 31 March 2016 1.8 2.3 4.1
Accumulated amortisationAt 1 April 2014 0.4 0.7 1.1 Charge for the year 0.1 1.1 1.2 Transfer to Subsidiary undertaking – (0.9) (0.9)
At 1 April 2015 0.5 0.9 1.4 Charge for the year 0.1 0.1 0.2 Disposals – (0.8) (0.8)
At 31 March 2016 0.6 0.2 0.8
Carrying amountAt 31 March 2016 1.2 2.1 3.3
At 31 March 2015 1.3 1.0 2.3
Year ended 31 March 2016
Notes to Company financial statements continued
Page Title at start:Content Section at start:

Annual Report & Accounts 2016
HomeServe plc | 165
Financial statements
43. Property, plant and equipmentLeasehold
Improvements£m
Computer equipment
£m
Total tangible
assets£m
CostAt 1 April 2014, 1 April 2015 – 0.3 0.3 Additions 0.2 0.1 0.3 Disposals – (0.3) (0.3)
At 31 March 2016 0.2 0.1 0.3
Accumulated depreciationAt 1 April 2014 and 1 April 2015 – 0.3 0.3 Charge for the year 0.1 – 0.1 Disposals – (0.3) (0.3)
At 31 March 2016 0.1 – 0.1
Carrying amountAt 31 March 2016 0.1 0.1 0.2
At 31 March 2015 – – –
Notes to Company financial statements
Page Title at start:Content Section at start:
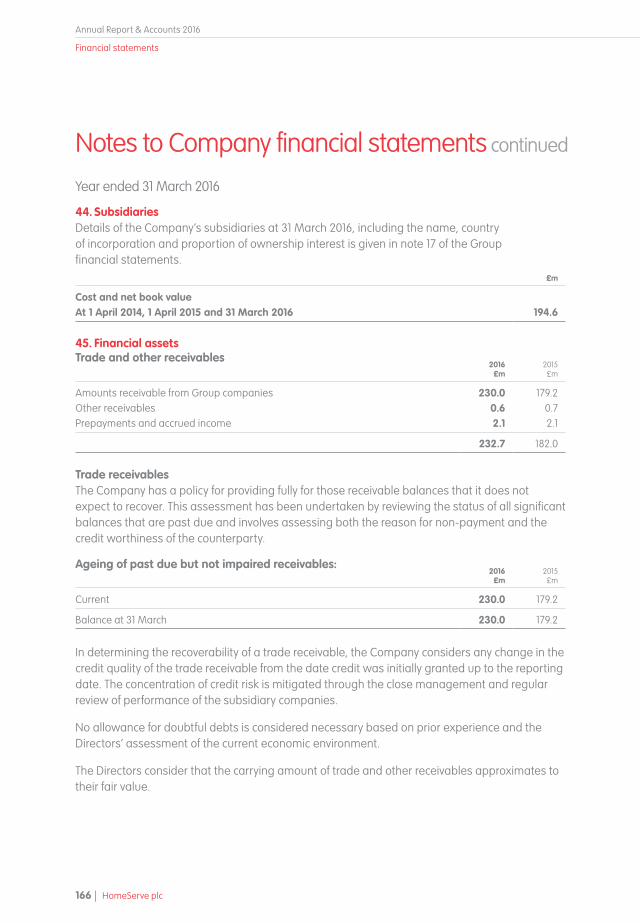
Annual Report & Accounts 2016
Financial statements
166 | HomeServe plc
44. SubsidiariesDetails of the Company’s subsidiaries at 31 March 2016, including the name, country of incorporation and proportion of ownership interest is given in note 17 of the Group financial statements.
£m
Cost and net book valueAt 1 April 2014, 1 April 2015 and 31 March 2016 194.6
45. Financial assetsTrade and other receivables
2016£m
2015£m
Amounts receivable from Group companies 230.0 179.2Other receivables 0.6 0.7Prepayments and accrued income 2.1 2.1
232.7 182.0
Trade receivablesThe Company has a policy for providing fully for those receivable balances that it does not expect to recover. This assessment has been undertaken by reviewing the status of all significant balances that are past due and involves assessing both the reason for non-payment and the credit worthiness of the counterparty.
Ageing of past due but not impaired receivables:2016
£m2015£m
Current 230.0 179.2
Balance at 31 March 230.0 179.2
In determining the recoverability of a trade receivable, the Company considers any change in the credit quality of the trade receivable from the date credit was initially granted up to the reporting date. The concentration of credit risk is mitigated through the close management and regular review of performance of the subsidiary companies.
No allowance for doubtful debts is considered necessary based on prior experience and the Directors’ assessment of the current economic environment.
The Directors consider that the carrying amount of trade and other receivables approximates to their fair value.
Year ended 31 March 2016
Notes to Company financial statements continued
Page Title at start:Content Section at start:

Annual Report & Accounts 2016
HomeServe plc | 167
Financial statements
Cash balances and cash equivalentsCash balances and cash equivalents of £62.1m (FY15: £46.2m) comprise cash held by the Company and short-term bank deposits with an original maturity of three months or less. The carrying amount of these assets approximates to their fair value.
46. Financial liabilitiesTrade and other payables
2016£m
2015£m
Trade creditors and accruals 8.6 5.4Amounts payable to Group companies 11.2 0.1Taxes and social security, excluding corporation tax 1.6 1.5Other creditors 1.5 1.9
22.9 8.9
Trade creditors and accruals principally comprise amounts outstanding for trade purchases and ongoing costs. The average credit period taken for trade purchases is 19 days (FY15: 8 days).
The Directors consider that the carrying amount of trade payables approximates to their fair value.
47. Deferred taxThe following are the major deferred tax assets recognised by the Company and movements thereon:
Retirement Benefit
obligations£m
Share scheme
£m
Timing differences
£mTotal
£m
At 1 April 2014 (0.2) 1.0 (0.4) 0.4 (Charge)/credit to income (0.2) 0.4 0.2 0.4 Credit to equity – 0.4 – 0.4 Credit to comprehensive income 0.4 – – 0.4
At 1 April 2015 – 1.8 (0.2) 1.6 Charge to income (0.3) (0.1) – (0.4)Charge to comprehensive income (0.1) – – (0.1)
At 31 March 2016 (0.4) 1.7 (0.2) 1.1
Notes to Company financial statements
Page Title at start:Content Section at start:

Annual Report & Accounts 2016
Financial statements
168 | HomeServe plc
48. Related party transactionsThe Company purchased services of £0.1m (FY15: £0.3m) from Harpin Limited and £0.3m (FY15: £nil) from Harpin Parkin Ltd. Both companies are not members of the Group, however they are both related parties because they are controlled and jointly controlled respectively by Richard Harpin, Chief Executive Officer of the Group and Director of the parent company of the Group. There was £0.3m outstanding to Harpin Parkin Limited on 31 March 2016 (FY15: £nil).
The Company also provided goods of £0.3m (FY15: £21.3m), provided services of £5.5m (FY15: £5.2m), lent monies to of £106.3m (FY15: £nil) and borrowed monies from of £29.1m (FY15: £nil) with subsidiary companies of the Group. Amounts due to subsidiary companies amount to £11.2m (FY15: £0.1m). Amounts owed by subsidiary companies amount to £230.0m (FY15: £179.2m).
Provision of services to and the purchase of services from related parties were made at arm’s length prices. The amounts outstanding are unsecured and will be settled in cash. No guarantees have been given or received. No provisions have been made for doubtful debts in respect of the amounts owed by related parties.
Remuneration of key management personnelThe remuneration of the Directors, who are the key management personnel of the Company, is set out below in aggregate for each of the categories specified in IAS24 Related Party Disclosures. Further information about the remuneration of individual Directors is provided in the audited part of the Remuneration report.
2016£m
2015£m
Short-term employee benefits 2.6 3.5Post-employment benefits 0.2 0.2Share-based payments expense 2.6 2.1
5.4 5.8
Except as noted above there were no other transactions with Directors requiring disclosure.
Year ended 31 March 2016
Notes to Company financial statements continued
Page Title at start:Content Section at start:

Annual Report & Accounts 2016
HomeServe plc | 169
Financial statements
49. Share-based paymentsDuring the Year ended 31 March 2016, the Company had four (FY15: five) share-based payment arrangements, which are described in note 35.
LTIP SAYE ESOP DBP
2016NumberOutstanding at 1 April 2015 3,618,101 119,011 255,000 256,995 Granted 830,676 21,325 – – Forfeited (197,181) (16,247) – – Exercised (1,146,500) (15,440) (255,000) (256,995)
Outstanding at 31 March 2016 3,105,096 108,649 – –
Exercisable at 31 March 2016 9,189 459 – –
Weighted average exercise price (£)
Outstanding at 1 April 2015 – 2.33 1.92 – Granted – 3.35 – – Forfeited – 2.60 – – Exercised – 2.07 1.92 –
Outstanding at 31 March 2016 – 2.53 – –
Exercisable at 31 March 2016 – 1.96 – –
Range of exercise price of options outstanding at 31 March 2016£0.01 to £0.99 – – – – £1.00 to £1.99 – 31,813 – – £2.00 to £2.99 – 55,511 – – £3.00 to £3.99 – 21,325 – – Weighted average remaining contractual life 2 2 – – Weighted average fair value of options awarded in 2016 £3.98 £1.35 – –
Notes to Company financial statements
Page Title at start:Content Section at start:

Annual Report & Accounts 2016
Financial statements
170 | HomeServe plc
49. Share-based payments continued LTIP SAYE ESOP KEIP DBP
2015NumberOutstanding at 1 April 2014 4,097,532 141,350 955,000 72,295 256,995 Granted 895,383 72,815 – – – Lapsed (778,190) – – – – Forfeited (428,740) (16,846) – – – Exercised (167,884) (78,308) (700,000) (72 295) –
Outstanding at 31 March 2015 3,618,101 119,011 255,000 – 256,995
Exercisable at 31 March 2015 – 2,934 255,000 – 256,995
Weighted average exercise price (£) Outstanding at 1 April 2014 – 1.93 1.57 1.92 – Granted – 2.60 – – – Lapsed – – – – – Forfeited – 2.30 – – – Exercised – 1.86 1.44 1.92 –
Outstanding at 31 March 2015 – 2.33 1.92 – –
Exercisable at 31 March 2015 – 1.84 1.92 – –
Range of exercise price of options outstanding at 31 March 2015£0.01 to £0.99 – – – – – £1.00 to £1.99 – 45,306 255,000 – – £2.00 to £2.99 – 72,815 – – – £3.00 to £3.99 – 890 – – – Weighted average remaining contractual life 2 3 – – – Weighted average fair value of options
awarded in 2015 £1.95 £1.46 – – –
The weighted average share price at the date of exercise for share options exercised during the year was £4.23 (FY15: £3.31).
The estimated fair values are calculated by applying a Black-Scholes option pricing model for the ESOP and SAYE and Monte Carlo simulations for the LTIP and DBP. The assumptions used in the models are set out in note 35.
The Company recognised total expenses of £2.3m (FY15: £1.8m) related to equity-settled share-based payment transactions.
Year ended 31 March 2016
Notes to Company financial statements continued
Page Title at start:Content Section at start:

Annual Report & Accounts 2016
HomeServe plc | 171
Financial statements
Notes to Company financial statements
50. Retirement benefit schemesDetails of the defined contribution and defined benefit schemes are provided in note 36.
51. Share incentive reserve£m
Balance at 1 April 2014 5.3 Share-based payment charges in the year 4.2 Share options exercised in year (1.5)Capital Contribution repayment 5.3
Balance at 1 April 2015 13.3 Share-based payment charges in the year 2.6 Share options exercised in year (2.0)
Balance at 31 March 2016 13.9
The Capital Contribution repayment of £5.3m in FY15 related to cash received by the company from HomeServe Membership Limited, a wholly owned subsidiary, in respect of share options granted to employees of HomeServe Membership Limited.
52. Financial instrumentsPrincipal financial instrumentsThe principal financial instruments used by the Company from which financial instrument risk arises are as follows:
• cash and cash equivalents
• bank overdrafts, revolving credit facilities, bank loans and Private Placements
• trade receivables
• other receivables
• trade payables
• contingent and deferred consideration
• other creditors
All principal financial instruments are stated at amortised cost.
Page Title at start:Content Section at start:

Annual Report & Accounts 2016
Financial statements
172 | HomeServe plc
52. Financial instruments continuedCapital risk managementThe Company manages its capital to ensure that it is able to continue as a going concern while maximising the return to stakeholders through the appropriate balance of debt and equity. The capital structure of the Company consists of debt, which includes the borrowings disclosed in note 20, cash and cash equivalents and equity comprising issued capital, reserves and retained earnings as disclosed in this note and notes 24, 25, 26, 29 and the Company Statement of Changes in Equity.
The table below presents quantitative data for the components the Company manages as capital:
2016£m
2015£m
Shareholders’ funds 247.7 278.9Bank and other loans 194.4 135.6
Financial risk management objectivesThe Company’s principal financial instruments comprise bank and other loans, overdrafts and cash and cash equivalents. The main purpose of these financial instruments is to raise finance for the Company’s operations. The Company also has various other financial instruments such as trade receivables and trade payables which arise directly from its operations.
The main risks arising from the Company’s financial instruments are interest rate risk, foreign currency risk, credit risk and liquidity risk.
Interest rate riskThe Company’s exposure to the risk of changes in market interest rates primarily relates to the Company’s long-term debt requirements with floating interest rates. The Company’s policy is to manage its interest cost using a mix of fixed and variable rate debts.
The maturity profile of the Company’s financial liabilities is provided in the table below. The revolving credit facility is drawn down and associated interest is settled on a monthly basis. The principal is included in the table below when the facility is due to expire.
Year ended 31 March 2016
Notes to Company financial statements continued
Page Title at start:Content Section at start:

Annual Report & Accounts 2016
HomeServe plc | 173
Financial statements
Bank and other loans
£m
Trade, other and group
payables£m
Total£m
2016Under 2 months 1.3 17.7 19.0Between 2 and 6 months 25.9 3.6 29.5Between 6 and 12 months 2.1 – 2.1Between 1 and 2 years 4.2 – 4.2Between 2 and 3 years 4.2 – 4.2Between 3 and 4 years 146.9 – 146.9Between 4 and 5 years 1.7 – 1.7Over 5 years 53.4 – 53.4
Total 239.7 21.3 261.0
Bank and other loans
£m
Trade, other and group
payables£m
Total£m
2015Under 2 months 0.3 5.4 5.7Between 2 and 6 months 0.5 2.0 2.5Between 6 and 12 months 0.8 – 0.8Between 1 and 2 years 1.5 – 1.5Between 2 and 3 years 1.5 – 1.5Between 3 and 4 years 1.5 – 1.5Between 4 and 5 years 136.2 – 136.2
Total 142.3 7.4 149.7
It is, and has been throughout the year under review, the Company’s policy that no trading in financial instruments shall be undertaken.
The following table demonstrates the sensitivity to a reasonably possible change of 10% increase in the cost of borrowing, with all other variables held constant, of the Company’s profit before tax (through the impact on floating rate borrowings).
2016 2015
Increase in the cost of borrowing 10% 10%Reduction in profit before tax (£m) 0.2 0.2
Notes to Company financial statements
Page Title at start:Content Section at start:

Annual Report & Accounts 2016
Financial statements
174 | HomeServe plc
52. Financial instruments continuedForeign currency riskThe Company has exposure to fluctuations in foreign currencies due to borrowings made to fund investments in its overseas subsidiaries which are affected by foreign exchange movements.
The carrying amount of the Company’s foreign currency denominated monetary assets and monetary liabilities at the year end are as follows:
Assets Liabilities2016
£m2015£m
2016£m
2015£m
Euro 14.6 5.9 (42.7) (107.7)
US dollar 119.7 1.0 (63.5) (48.3)
The following table demonstrates the sensitivity to a reasonably possible change of 10% increase in sterling against the relevant foreign currencies, with all other variables held constant, of the Company’s profit before tax and equity.
2016 2015
Increase in £:$ exchange rate: 10% 10% Effect on profit before tax (£m) (5.1) 4.3 Effect on equity (£m) (5.1) 4.3
Increase in £:€ exchange rate: 10% 10% Effect on profit before tax (£m) 2.6 9.3 Effect on equity (£m) 2.6 9.3
Liquidity riskUltimate responsibility for liquidity risk management rests with the Company’s Board which sets the framework for the management of the Company’s short, medium and long-term funding and liquidity management requirements. The Company manages liquidity risk by maintaining adequate reserves and banking facilities and continuously monitoring forecast and actual cash flows. Included in note 20 are details of the undrawn facilities that are available to the Company and the Group to further reduce liquidity risk.
With the exception of the Private Placements and the revolving credit facilities, all of the Company’s financial liabilities are due for payment within six months, based on contractual payment terms.
Year ended 31 March 2016
Notes to Company financial statements continued
Page Title at start:Content Section at start:

Annual Report & Accounts 2016
HomeServe plc | 175
Financial statements
Continuing operations
Unaudited2016
£m 2015£m
2014£m
2013£m
2012£m
External revenueUK 286.0 279.6 283.1 302.0 349.4 USA 152.6 125.3 110.9 100.8 82.3 France 77.4 74.9 77.3 73.8 31.2 Spain 97.5 90.9 82.6 60.5 60.2 New Markets 19.7 13.5 14.4 9.4 11.6
633.2 584.2 568.3 546.5 534.7
Profit/(loss)UK 58.0 56.4 53.4 78.3 103.1 USA 12.1 6.4 12.9 9.5 9.0 France 23.2 23.4 22.3 21.5 15.3 Spain 9.9 7.5 4.0 3.1 2.8 New Markets (5.9) (5.9) (5.7) (4.8) (3.4)
97.3 87.8 86.9 107.6 126.8 Amortisation of acquisition intangibles (10.4) (10.4) (13.0) (13.4) (10.4)Exceptional items – 1.7 (46.7) (25.1) (31.1)
Operating profit 86.9 79.1 27.2 69.1 85.3 Net interest (4.3) (2.4) (2.8) (2.6) (2.2)Gain on re-measurement of joint venture interest
on acquisition of control – – – – 54.9
Profit before tax 82.6 76.7 24.4 66.5 138.0
Five year summary
Five year summary
Page Title at start:Content Section at start:
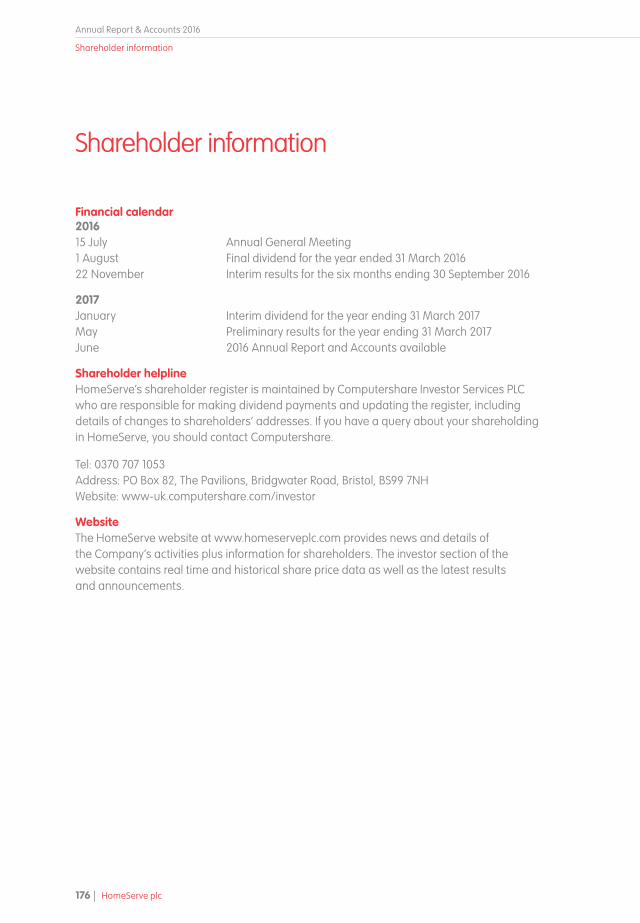
Annual Report & Accounts 2016
176 | HomeServe plc
Shareholder information
Financial calendar201615 July Annual General Meeting1 August Final dividend for the year ended 31 March 201622 November Interim results for the six months ending 30 September 2016
2017January Interim dividend for the year ending 31 March 2017 May Preliminary results for the year ending 31 March 2017 June 2016 Annual Report and Accounts available
Shareholder helplineHomeServe’s shareholder register is maintained by Computershare Investor Services PLC who are responsible for making dividend payments and updating the register, including details of changes to shareholders’ addresses. If you have a query about your shareholding in HomeServe, you should contact Computershare.
Tel: 0370 707 1053Address: PO Box 82, The Pavilions, Bridgwater Road, Bristol, BS99 7NH Website: www-uk.computershare.com/investor
WebsiteThe HomeServe website at www.homeserveplc.com provides news and details of the Company’s activities plus information for shareholders. The investor section of the website contains real time and historical share price data as well as the latest results and announcements.
Shareholder information
Page Title at start:Content Section at start:

FSC Logo

HomeServe plcRegistered Office:Cable Drive, Walsall, WS2 7BNRegistered in England No. 2648297Tel: 01922 426262
www.homeserveplc.com
Hom
eServe Annual Report &
Accounts 2016