Annual Report945bcd44-7f58-4... · 2019-03-13 · CHF 564.6 million and a reduction in net interest...
238
Annual Report 2018
Transcript of Annual Report945bcd44-7f58-4... · 2019-03-13 · CHF 564.6 million and a reduction in net interest...

Annual Report 2018

EFG International is a global private banking group offering private banking and asset management services and is headquartered in Zurich. Its registered shares (EFGN) are listed on the SIX Swiss Exchange. In 2017, EFG International completed the integration of BSI, a Lugano-based bank with a long-standing tradition of Swiss private banking and a broad international network. EFG International’s largest shareholders are EFG Bank European Financial Group (43.5% stake) and BTG Pactual (29.3%).
As a leading Swiss private bank, EFG International has a presence in major financial centres and growth markets. It has strong roots in Switzerland, with Zurich, Geneva and Lugano serving as key hubs for the governance and operation of the bank. EFG International operates in around 40 locations worldwide, with a network spanning Europe, Asia Pacific, the Americas and the Middle East.
EFG International is a financial partner that offers security and solidity. An entrepreneurial spirit has shaped the bank since it was established in 1995, enabling it to develop hands-on solutions and to build long-lasting client relationships.
Annual Report 2018 | 1
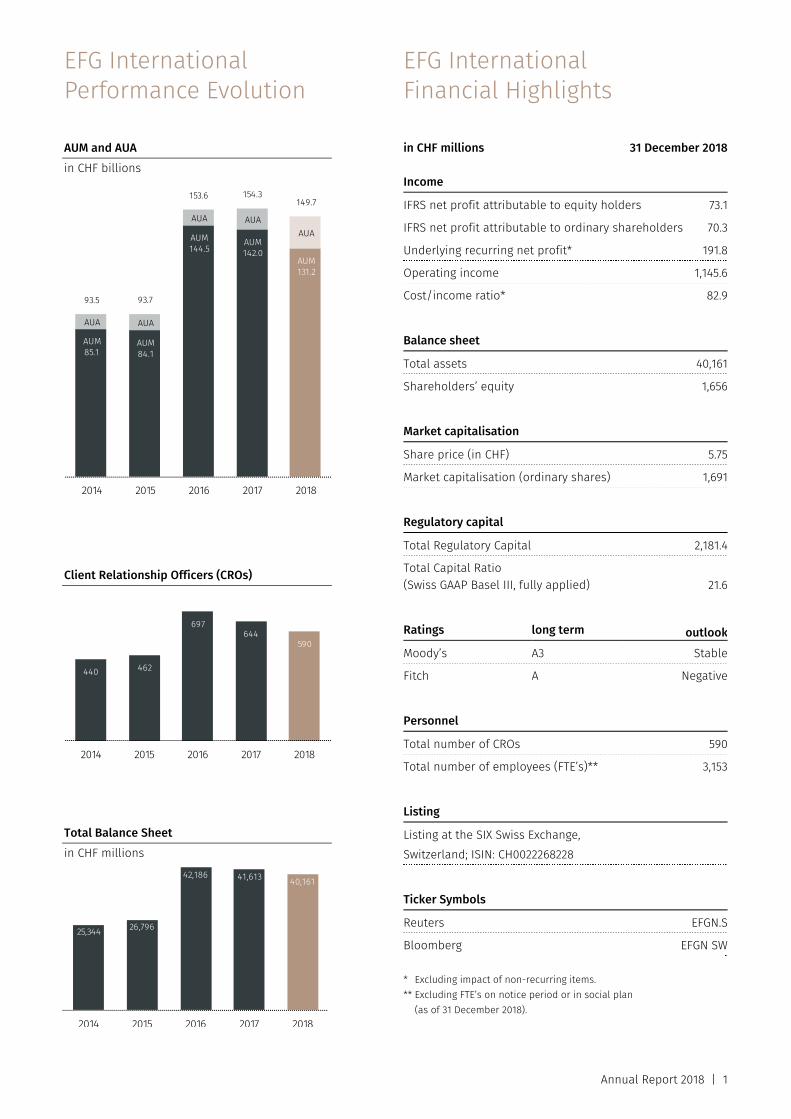
25,344 26,796
42,186 41,613 40,161
2014 2015 2016 2017 2018
EFG International Performance Evolution AUM and AUA in CHF billions Client Relationship Officers (CROs) Total Balance Sheet in CHF millions
EFG International Financial Highlights in CHF millions 31 December 2018
* Excluding impact of non-recurring items. ** Excluding FTE’s on notice period or in social plan
(as of 31 December 2018).
Income
IFRS net profit attributable to equity holders 73.1
IFRS net profit attributable to ordinary shareholders 70.3
Underlying recurring net profit* 191.8
Operating income 1,145.6
Cost/income ratio* 82.9
Balance sheet
Total assets 40,161
Shareholders’ equity 1,656
Market capitalisation
Share price (in CHF) 5.75
Market capitalisation (ordinary shares) 1,691
Regulatory capital
Total Regulatory Capital 2,181.4
Total Capital Ratio (Swiss GAAP Basel III, fully applied) 21.6
Ratings long term outlookMoody’s A3 Stable
Fitch A Negative
Personnel
Total number of CROs 590
Total number of employees (FTE’s)** 3,153
Listing
Listing at the SIX Swiss Exchange, Switzerland; ISIN: CH0022268228
Ticker Symbols
Reuters EFGN.S
Bloomberg EFGN SW
AUM85.1
AUM84.1
AUM144.5
AUM142.0
AUM131.2
AUA AUA
AUA AUAAUA
93.5 93.7
153.6 154.3 149.7
2014 2015 2016 2017 2018
440 462
697644
590
2014 2015 2016 2017 2018

Entrepreneurial thinking. Private banking.
Annual Report 2018 | 3
Editorial Chair and CEO 4
International Presence 9
Financial Review 12
Beyond Banking 17
Corporate Governance 20 Group structure and shareholders 23 Capital structure 25 Board of Directors 28 Executive Committee 39 Global Business Committee (GBC) 43 Compensation, shareholdings and loans of the members of the Board of Directors and the Executive Committee 46 Shareholders’ rights of participation 47 Changes of control and defence measures 48 Auditors 48 Information policy 49
Compensation Report 50 Philosophy 51 Regulations 51 Methodology 51 Responsibilities 52 Principles 53 Specific mechanisms or instruments for variable compensation 57 Implementation of compensation principles 58 Loans and credits 60 External advice 60 Compensation of the Board of Directors and the Executive Committee 61 Loans and credits to the Board of Directors and the Executive Committee (audited) 64 Auditors’ report 65
Consolidated Financial Statements 66 Consolidated income statement 68 Consolidated statement of comprehensive income 69 Consolidated balance sheet 70 Consolidated statement of changes in equity 71 Consolidated cash flow statement 73 Notes 76 Auditors’ report 205
Parent Company Financial Statements 212 Parent company income statement 214 Parent company balance sheet 215 Notes 216 Auditors’ report 226
Contacts and Addresses 230
Contents

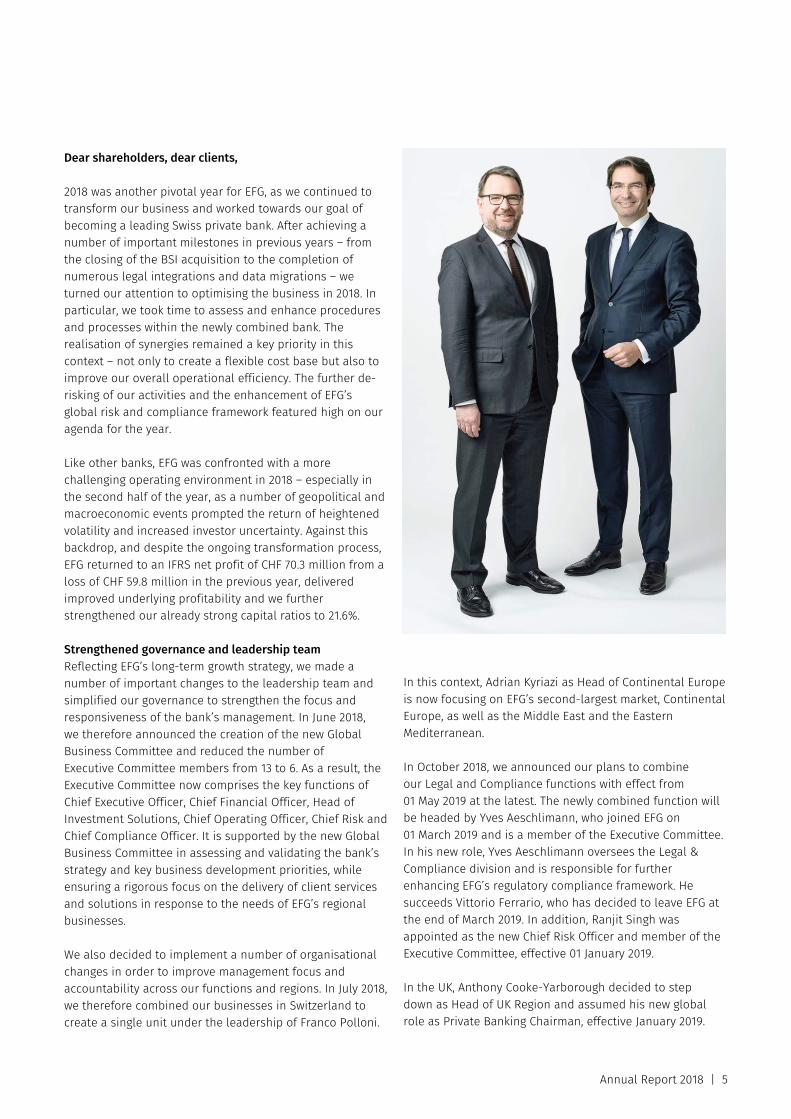
Editorial Chair and CEO John A. Williamson, Giorgio Pradelli
Annual Report 2018 | 5
Dear shareholders, dear clients, 2018 was another pivotal year for EFG, as we continued to transform our business and worked towards our goal of becoming a leading Swiss private bank. After achieving a number of important milestones in previous years – from the closing of the BSI acquisition to the completion of numerous legal integrations and data migrations – we turned our attention to optimising the business in 2018. In particular, we took time to assess and enhance procedures and processes within the newly combined bank. The realisation of synergies remained a key priority in this context – not only to create a flexible cost base but also to improve our overall operational efficiency. The further de-risking of our activities and the enhancement of EFG’s global risk and compliance framework featured high on our agenda for the year.
Like other banks, EFG was confronted with a more challenging operating environment in 2018 – especially in the second half of the year, as a number of geopolitical and macroeconomic events prompted the return of heightened volatility and increased investor uncertainty. Against this backdrop, and despite the ongoing transformation process, EFG returned to an IFRS net profit of CHF 70.3 million from a loss of CHF 59.8 million in the previous year, delivered improved underlying profitability and we further strengthened our already strong capital ratios to 21.6%.
Strengthened governance and leadership team Reflecting EFG’s long-term growth strategy, we made a number of important changes to the leadership team and simplified our governance to strengthen the focus and responsiveness of the bank’s management. In June 2018, we therefore announced the creation of the new Global Business Committee and reduced the number of Executive Committee members from 13 to 6. As a result, the Executive Committee now comprises the key functions of Chief Executive Officer, Chief Financial Officer, Head of Investment Solutions, Chief Operating Officer, Chief Risk and Chief Compliance Officer. It is supported by the new Global Business Committee in assessing and validating the bank’s strategy and key business development priorities, while ensuring a rigorous focus on the delivery of client services and solutions in response to the needs of EFG’s regional businesses.
We also decided to implement a number of organisational changes in order to improve management focus and accountability across our functions and regions. In July 2018, we therefore combined our businesses in Switzerland to create a single unit under the leadership of Franco Polloni.
In this context, Adrian Kyriazi as Head of Continental Europe is now focusing on EFG’s second-largest market, Continental Europe, as well as the Middle East and the Eastern Mediterranean.
In October 2018, we announced our plans to combine our Legal and Compliance functions with effect from 01 May 2019 at the latest. The newly combined function will be headed by Yves Aeschlimann, who joined EFG on 01 March 2019 and is a member of the Executive Committee. In his new role, Yves Aeschlimann oversees the Legal & Compliance division and is responsible for further enhancing EFG’s regulatory compliance framework. He succeeds Vittorio Ferrario, who has decided to leave EFG at the end of March 2019. In addition, Ranjit Singh was appointed as the new Chief Risk Officer and member of the Executive Committee, effective 01 January 2019.
In the UK, Anthony Cooke-Yarborough decided to step down as Head of UK Region and assumed his new global role as Private Banking Chairman, effective January 2019.
Editorial Chair and CEO
6 | Annual Report 2018
Richard Thomas succeeded him as Head of UK Region and CEO of EFG Private Bank Limited, London. Richard Thomas has been appointed to EFG’s Global Business Committee and is in charge of further developing the UK regional business.
Economic and political events that shaped the market The final quarter of 2018 heralded the return of market volatility. Following a prolonged bull market with steady increases in equity prices, we saw a strong stock market correction at the end of the year.
Markets were impacted by several factors including the monetary policy decisions of major central banks and increasing trade tensions between the US and China. Nervousness surrounding the outcome of the US mid-term elections, heightened political uncertainty within Europe over the Brexit question and Italy’s fragile political situation also weighed on investor sentiment.
Assets under Management and net new assets The development of Assets under Management during the year largely mirrored the challenges in the operating environment. While revenue-generating Assets under Management were largely stable at CHF 140 billion until the end of October 2018, they decreased to CHF 131.2 billion by end-2018. This decrease was largely in line with industry trends and reflected negative market performance of CHF 5.9 billion and negative foreign exchange effects of CHF 1.9 billion. This represents a decrease of 8% from Assets under Management of CHF 142.0 billion at the end of 2017.
In 2018, EFG reported underlying net new assets of CHF 2.5 billion, slightly up compared to the previous year, as positive inflows in the first half of 2018 were partly offset by a weaker performance in the remaining year due to investor uncertainty. While underlying net asset growth was not yet within our target range of 3-6% growth per annum, we significantly reduced AuM attrition, which more than halved compared to the previous year. Taking AuM attrition into consideration, net asset outflows slowed significantly to CHF 2.1 billion, compared to CHF 5.8 billion in 2017.
As of end-2018, total AuM attrition since the closing of the BSI acquisition in November 2016 amounted to 10.9% of the total Assets under Management as of the closing date, slightly above the previously given guidance of 5-10% but in line with EFG’s efforts to effectively de-risk its business.
As of end-2018, we are discontinuing the concept of AuM attrition, which was used during the integration to give
investors and shareholders a clearer view of the bank’s underlying performance. Going forward, EFG will only report net new assets as a total figure.
Business performance In spite of challenging market conditions, which negatively impacted client activity and overall Assets under Management, EFG delivered improved profitability in 2018, with underlying net profit of CHF 191.8 million and an IFRS net profit of CHF 70.3 million.
Underlying net profit grew by 16% to CHF 191.8 million in 2018, compared to CHF 165.0 million in 2017. This year-on-year increase was mainly driven by the continued realisation of cost synergies, which more than offset a slight slowdown in revenues, particularly during the second half of the year, in line with the industry as a whole. On a reported basis, EFG returned to profitability with an IFRS net profit of CHF 70.3 million. This compared with a net loss of CHF 59.8 million in 2017, mainly reflecting costs associated with the integration process.
In 2018, underlying operating income was CHF 1,165.1 million, down 3% compared to the previous year. This slight decline was mainly due to lower underlying commission of CHF 564.6 million and a reduction in net interest income to CHF 372.7 million, as increasing volatility in the second half of the year resulted in subdued levels of client activity. EFG’s underlying revenue margin subsequently decreased to 81 basis points in 2018 from 86 basis points for the full-year 2017, not yet in line with EFG’s target of 85 basis points.
Through 2018, we continued to rigorously execute our cost reduction measures and to realise synergies to create a lean and flexible cost base. Underlying operating expenses totalled CHF 966.4 million for the full-year 2018, a decrease of approximately 6% compared to the previous year. Both underlying personnel and other expenses declined compared to 2017, mainly reflecting the continued realisation of synergies in line with the integration plan and the overall reduction in headcount.
Reflecting these positive developments, EFG further improved its underlying cost/income ratio to 82.9% from 85.9% in 2017. However, the cost/income ratio was adversely impacted by lower revenues.
With the integration and optimisation process completed, our underlying performance will in future only include the impact of the life insurance portfolio and intangible amortisation.
Annual Report 2018 | 7
Realising synergy potentials As previously announced, EFG is targeting total pre-tax cost synergies of approximately CHF 240 million, which we aim to realise in full by the end of 2019. Of this total, EFG planned to realise CHF 180 million by the end of 2018. By the end of last year, we had achieved cumulative pre-tax cost synergies of CHF 187 million, exceeding the target figure. Going forward, we will continue to review and streamline our operational processes to improve overall efficiency through increased automation and digitalisation.
As of year-end 2018, EFG reported cumulative integration costs of CHF 268 million since the beginning of the integration process – marginally above the previous guidance.
Strong capital and liquidity position Throughout 2018, we continued to improve EFG’s already strong capital position, despite challenging markets and the ongoing transformation of the business. At the end of 2018, EFG’s Swiss GAAP Common Equity Ratio (CET1) improved to 17.6%, while the Total Capital Ratio increased by 0.6 percentage points to 21.6%. We have a strong and liquid balance sheet, with a Liquidity Coverage Ratio of 163% and a Loan/Deposit Ratio of 53% at the end of 2018.
As announced in April 2018, and in light of our strong capital position, EFG launched a share buyback programme on 27 July 2018. As part of this programme, we repurchased 4,362,873 of a maximum of 6,000,000 ordinary shares from the market for a total amount of CHF 30.1 million. The repurchased shares are used to fund our restricted stock units for employee incentive plans in order to prevent shareholder dilution.
CRO development As a result of the ongoing stabilisation and optimisation process, as well as performance management, our number of client relationship officers (CROs) was reduced from 644 at the end of 2017 to 590 at end-2018. Average Assets under Management per CRO grew to CHF 229 million (excluding CROs newly hired in 2018), reflecting an increase in productivity. During 2018, 39 new CROs were hired in selected markets. Going forward, we will leverage on our new and improved platform – both in terms of geographical footprint and products and services – to make targeted hires of experienced CRO teams in line with EFG’s long-term strategy.
Ordinary dividend In line with its long-term strategy of generating capital to give investors attractive returns, EFG proposes an increased ordinary dividend of CHF 0.30 per share (exempt from Swiss withholding tax) to the Annual General Meeting of 26 April 2019. This reflects a 20% increase compared to the dividend distributed in the previous years.
Outlook and strategic direction We have now turned the page on EFG’s integration and optimisation period and we have entered 2019 with a stronger platform in terms of products, services and capabilities. We are now refocusing our attention on driving growth and providing our clients with a first-class experience, supported by our distinctive client service model and compelling value proposition.
Thanks to the successful integration of BSI, we have not only increased our size and scalability – joining the ranks of the 10 largest Swiss private banks – but have also significantly expanded our service offering and investment expertise. We are today operating from a position of strength and are committed to fully leveraging our new potential.
EFG has a clear strategy and value proposition: We want to be a leading Swiss private bank renowned for its unique client approach. Our CRO model differentiates us in the market and makes us an attractive employer. We need to increase momentum in order to reach our strategic targets. In particular, as part of our 2019-2022 plan, we will focus on further developing our presence and share of wallet in our Swiss domestic market, capturing the potential of this traditional private banking market, while also expanding our presence in key growth markets such as Asia and Continental Europe, which offer significant opportunities for EFG. To realise our ambitious plans, we will not only focus on organic growth but will consider selected acquisitions that represent a good strategic fit for EFG and can help us to deliver on our objectives.
1 This figure excludes the following non-recurring items: CHF 75.3 million of costs relating to the integration of BSI, CHF 26.9 million negative impact from the life insurance portfolio, CHF 6.4 million BSI intangible amortisation charge and CHF 12.9 million of exceptional legal costs and provisions.
2 Attributable to equity holders
Editorial Chair and CEO
8 | Annual Report 2018
Simultaneously, in 2019 we will continue to focus on maintaining a lean and flexible cost base – exercising strict cost discipline in all that we do. We consider this an important building block for our bank’s long-term sustainable success. It will not only help us to address the current challenges in the private banking industry – with continued pressure on revenues and the rising cost of doing business – but will give us greater resilience in the face of adverse market conditions.
Equally, regulatory requirements will continue to impact on the private banking industry both in Switzerland and globally. In recent years, we have successfully implemented a robust risk and compliance framework across all regions and businesses. Going forward, we will continue to anticipate further regulatory requirements and to strengthen our framework as part of our strategy of achieving sustainable long-term growth.
We have identified three main areas of focus to drive our business growth in 2019 and beyond. First, we will implement regional initiatives in selected markets, with a particular focus on our Swiss domestic market. Second, we will drive organic growth by hiring experienced new CRO teams, increasing the efficiency of current teams and developing a stronger performance culture based on our vast Investment Solutions expertise. And finally, we will make selected investments in acquisitions in key markets. We have a very attractive platform – both for clients and employees – and we are convinced that our CRO model continues to provide significant advantages for clients and investors alike, setting us apart in the market and confirming our position as a trusted, independent provider of first-class financial advice.
We would like to thank our clients, shareholders and employees for their continued trust and commitment.
John A. Williamson, Giorgio Pradelli, Chair of the Board Chief Executive Officer

International Presence
10 | Annual Report 2018
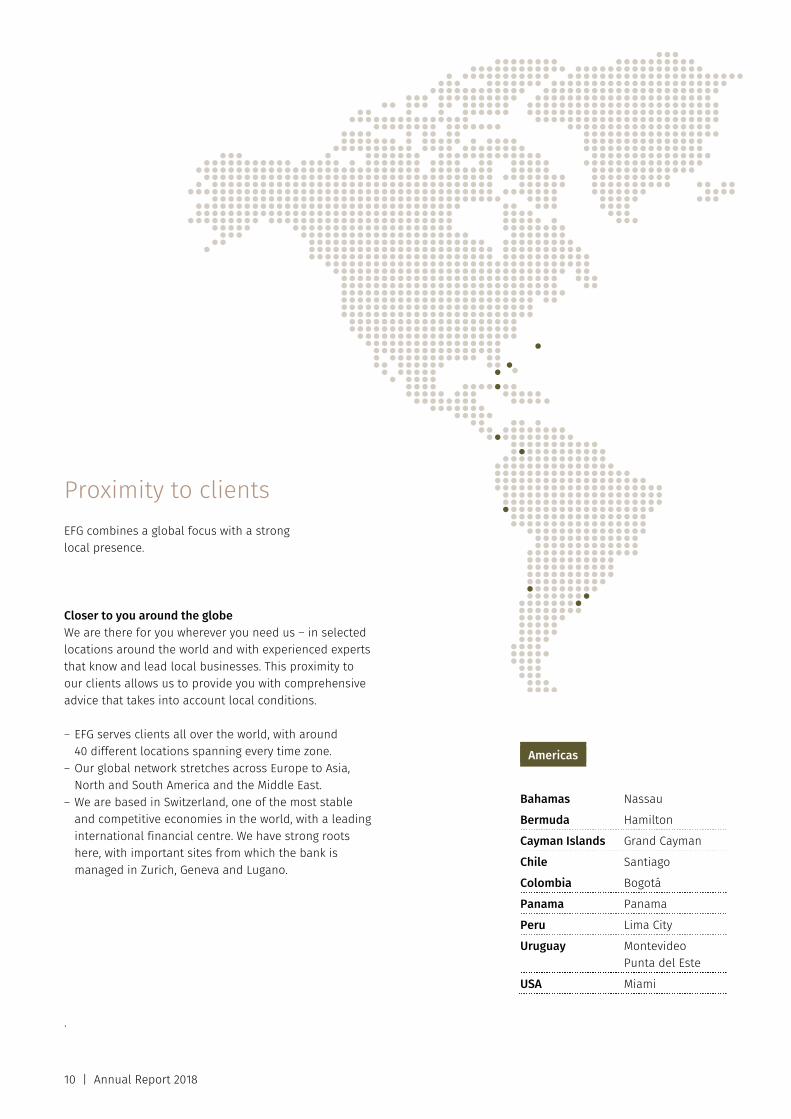
Proximity to clients EFG combines a global focus with a strong local presence. Closer to you around the globe We are there for you wherever you need us – in selected locations around the world and with experienced experts that know and lead local businesses. This proximity to our clients allows us to provide you with comprehensive advice that takes into account local conditions. – EFG serves clients all over the world, with around
40 different locations spanning every time zone. – Our global network stretches across Europe to Asia,
North and South America and the Middle East. – We are based in Switzerland, one of the most stable
and competitive economies in the world, with a leading international financial centre. We have strong roots here, with important sites from which the bank is managed in Zurich, Geneva and Lugano.
.
Americas
Bahamas Nassau
Bermuda Hamilton
Cayman Islands Grand Cayman
Chile Santiago
Colombia Bogotá
Panama Panama
Peru Lima City
Uruguay Montevideo Punta del Este
USA Miami
Annual Report 2018 | 11
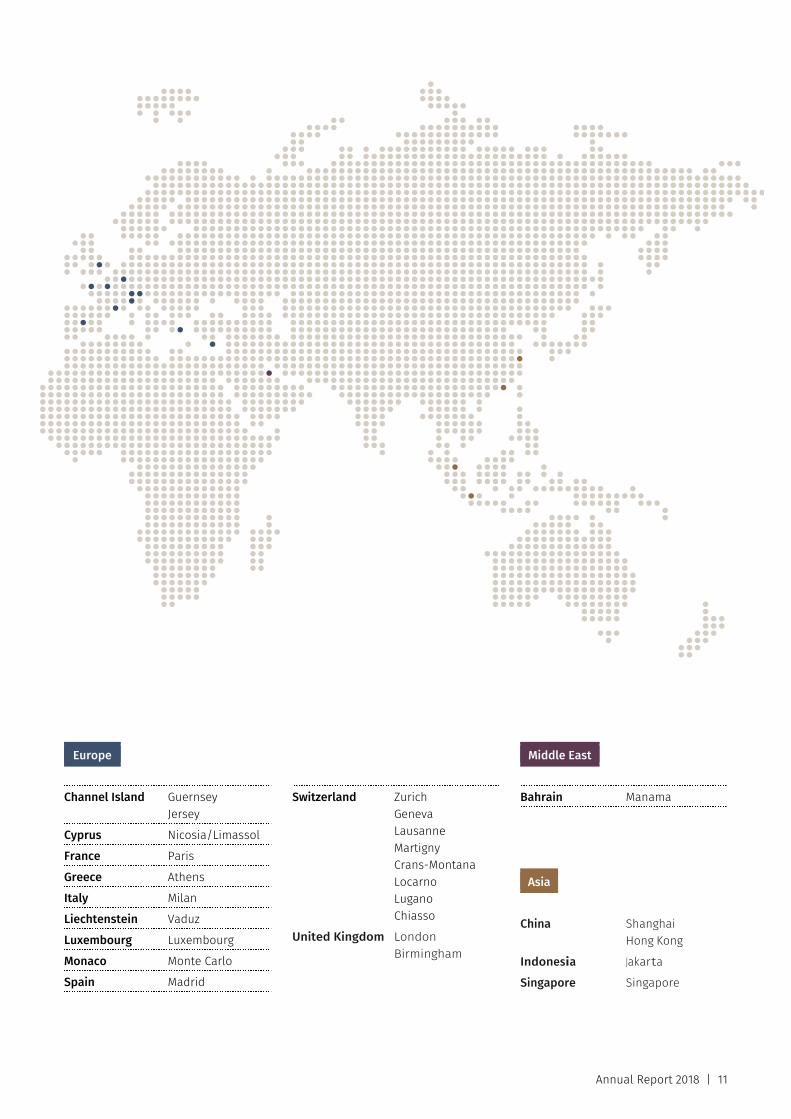
Europe
Channel Island Guernsey Jersey
Cyprus Nicosia/Limassol
France Paris
Greece Athens
Italy Milan
Liechtenstein Vaduz
Luxembourg Luxembourg
Monaco Monte Carlo
Spain Madrid
Switzerland Zurich Geneva Lausanne Martigny Crans-Montana Locarno Lugano Chiasso
United Kingdom London Birmingham
Middle East
Bahrain Manama
Asia
China Shanghai Hong Kong
Indonesia Jakarta
Singapore Singapore

Financial Review
Annual Report 2018 | 13
In 2018, EFG returned to profitable growth and increased the proposed dividend, as it emerges from the BSI integration.
Against the backdrop of a challenging operating environment, which saw the return of market volatility in the fourth quarter and a sharp decline in client activity, EFG returned to profitability as it continued to realise its cost synergies. In particular, EFG reported an IFRS net profit of CHF 70.3 million, rebounding from a loss of CHF 59.8 million in the previous year and increased its underlying profitability by 16% to CHF 191.8 million. By end-2018, EFG realised cumulative cost synergies of CHF 187 million, exceeding its year-end target of CHF 180 million. EFG also further strengthened its already strong capital ratios to 21.6% by end-2018.
Detailed financials While the suboptimal market conditions prompted a challenging operating environment, EFG improved its profitability. Excluding integration costs and some exceptional items in 2018, underlying recurring net profit increased by 16% to CHF 191.8 million, versus CHF 165.0 million for 2017. This year-on-year increase was mainly driven by the continued realisation of cost synergies, which more than offset a slight slowdown in revenue growth, particularly during the second half of the year, in line with the industry as a whole.
On a reported basis, EFG returned to profitability with an IFRS net profit attributable to equity holders of CHF 70.3 million. This compares to a net loss of CHF 59.8 million in 2017, mainly reflecting significantly lower integration costs and lower impact of the life insurance portfolio, as a positive contribution during the second half of the year partly offset the negative impact during the first six months of 2018. In addition, EFG recorded an exceptional pre-tax gain of CHF 18 million in the fourth quarter of the year from a valuation gain in its SIX participation.
Operating income The Group posted underlying operating income of CHF 1,165.1 million for 2018, compared to CHF 1,202.3 million for 2017. This slight decline was mainly due to lower underlying commission of CHF 564.6 million with foreign exchange and securities trading results below historical average levels and a reduction in net other income to CHF 232.5 million, partly offset by an increase in net interest income to CHF 372.7 million.
Reflecting the challenging operating environment, EFG’s underlying revenue margin decreased to 84 basis points for the full-year 2018.
On a reported basis, operating income of CHF 1,145.6 million was slightly up compared to CHF 1,142.7 million in 2017. This reflected the lesser impact of the life insurance portfolio compared to the previous year, as a positive impact during the second half of the year partly offset the negative effect during the first six months.
Operating expenses In 2018 underlying operating expenses were CHF 966.4 million, down 6% compared to CHF 1,033.2 million in 2017 as EFG continued to realise its targeted cost synergies, reducing its underlying cost base. Both underlying personnel and other expenses decreased compared to 2017 to CHF 690.8 million and CHF 275.6 million, respectively, reflecting the ongoing headcount reductions and rigorous cost management. On a year-to-year basis, underlying personnel expenses only decreased by 2%, with the full impact of the executed headcount reductions only to materialise fully in 2019.
On a reported basis, including the integration costs, operating expenses for 2018 were CHF 1,064.3 million, down from CHF 1,190.0 million in 2017.
EFG continued to execute on its headcount reduction programme in line with the combination of the business, targeting between 100-150 reductions per annum. At end-2018, the number of employees was at 3,153 1(full-time equivalents), down 213 compared to the previous year and exceeding the planned reductions, as EFG accelerated the realisation of its synergy targets in line with its optimisation and stabilisation efforts in 2018. This reflects an overall decrease of 420 since 2016, as EFG is ahead in reaching its overall synergy target.
1 Excluding FTE’s on notice period or in social plan as at 31 December 2018
14 | Annual Report 2018
Net new assets & Assets under Management In 2018, EFG saw a positive trend in overall net new asset development, as net asset outflows more than halved from CHF 5.8 billion in 2017 to CHF 2.1 billion in 2018, after a positive first half of the year was more than offset by a weaker performance in the second half, which also included additional forced AuM attrition in line with the continued de-risking efforts.
Overall AuM attrition levels reduced considerably from CHF 8.2 billion in 2017 to CHF 4.6 billion in 2018. As of end-2018, total AuM attrition since the closing of the BSI acquisition in November 2016 amounted to 10.9% of the total Assets under Management as of the closing date, slightly above the previously given guidance of 5-10% but in line with EFG’s efforts to effectively de-risk its business.
Excluding AuM attrition, EFG achieved largely stable underlying net new assets of CHF 2.5 billion compared to 2017, as positive inflows in the first half of 2018 were partly offset by a weaker performance in the remaining year. While underlying net asset growth was not yet within our target range of 3-6% growth per annum, we significantly reduced AuM attrition, which more than halved compared to the previous year.
The development of Assets under Management during the year largely mirrored the challenges in the operating environment. While revenue-generating Assets under Management were largely stable at CHF 140 billion until the end of October 2018, they decreased to CHF 131.2 billion by end-2018, in line with industry trends, reflecting negative market performance of CHF 5.9 billion, negative foreign exchange effects of CHF 1.9 billion and net asset outflows of CHF 2.1 billion.
As of end-2018, we are discontinuing the concept of AuM attrition, which was used during the integration to give investors and shareholders a clearer view of the bank’s underlying performance. Going forward, EFG will only report net new assets as a total figure.
CRO development As of end-2018, EFG reported Client Relationship Officers (CROs) of 590. This compares to 644 at the end of 2017, reflecting continued performance management efforts and subdued hiring activity throughout the year, with 39 CROs hired on a global basis. As per end-2018, average Assets under Management per CRO stood at CHF 229 million (excluding CROs newly hired in 2018), reflecting a further increase in productivity, however still below the industry average.
Non-underlying factors affecting results of operations The financial results for 2018 were impacted by a number of non-underlying factors excluded from the results in order to give investors, media and the public a clearer view of the bank’s underlying performance during the BSI integration.
With the integration and optimisation process completed by end-2018, EFG’s underlying performance will in future only include the impact of the life insurance portfolio, legal costs and provisions relating to previously disclosed legacy matters, and intangible amortisation.
Integration costs Following the completion of the integration process by end-2017, which encompassed a total of six legal integrations and nine IT migrations worldwide, EFG in 2018 continued to optimise its business by further enhancing its processes and systems. In line with this, EFG significantly wound down any integration related costs.
In 2018, pre-tax integration costs were CHF 75.3 million, approximately half of the costs incurred in the previous year. Overall, as of year-end 2018, EFG reported integration costs of CHF 267.5 million since the beginning of the integration process –slightly exceeding previous guidance reflecting additional costs relating to the remediation process. With this completed, EFG will no longer separately report integration costs and will discontinue the concept.
Life insurance portfolio Following the adoption of the IFRS9 reporting standard as of 01 January 2018, volatility effects of the life insurance portfolio on the IFRS net profit have increased, given that the portfolio’s exposures are being recognised at fair value through profit and loss. In the second half of 2018, EFG’s life insurance portfolio positively impacted the Group’s IFRS profitability by CHF 9.5 million, partly offsetting the negative impact of CHF 36.4 million during the first six months of 2018 as maturities were lower than expected. Of the overall negative impact of CHF 26.9 million in 2018, CHF 13.9 million were due to interest effects and CHF 13.0 million due to fair value impact. Compared to 2017, the life insurance portfolio’s impact on EFG’s profitability decreased significantly, taking into account an adverse impact of CHF 30.1 million in 2017 that resulted from the restructuring and exposure reduction of parts of the portfolio.
Annual Report 2018 | 15
Balance sheet At the end of 2018, the balance sheet total stood at CHF 41.6 billion.
Customer deposits decreased by CHF 2.1 billion to CHF 30.1 billion, while loans decreased by CHF 0.1 billion to CHF 18.8 billion. Funding from other financial liabilities increased by CHF 0.7 billion, partially offsetting the decrease in customer deposits but with longer duration. The Group maintains a high level of liquidity, ending the year with over CHF 7.1 billion cash balances with central banks and a liquidity coverage ratio of 163%. The majority of tangible assets remain callable or disposable within 3 months, with the exception of life insurance policies of CHF 0.7 billion and CHF 6.2 billion of mortgages.
Shareholders’ equity totalled CHF 1.66 billion , compared to CHF 1.73 billion as reported at end-2017. This decrease mainly related to CHF 72.4 million paid as ordinary dividend and CHF 30.1 million of treasury shares repurchased during the year. At the end of 2018, EFG’s Swiss GAAP Common Equity Ratio (CET1) stood at 17.3% and the Total Capital Ratio at 21.6% including CHF 86.9 million anticipated ordinary 2018 dividend, to be approved by the Annual General Meeting of shareholders in April 2019, corresponding to a dividend per share of CHF 0.30. EFG has a strong and liquid balance sheet, with a Liquidity Coverage Ratio of 163% and a Loan/Deposit Ratio of 53% at the end of 2018.
Risk-weighted assets decreased to CHF 10.1 billion as of 31 December 2018, down from CHF 10.9 billion at end-2017, as risk-weighted asset optimisation continues.
Ordinary dividend The payment of an ordinary dividend of CHF 0.30 per share (exempt from Swiss withholding tax) will be proposed to the Annual General Meeting of 26 April 2019. This reflects an increase of 20% compared to the previous years and in line with EFG’s long-term strategy of returning excess capital its shareholders.
Financial targets 2019-2022 Since the acquisition of the BSI in 2016, EFG has made considerable progress in the implementation of its long-term strategy, strengthening its competitive market position and joining the ranks of the 10 largest Swiss private banks. EFG delivered on the integration, on cost synergies and profitability, it further bolstered its strong capital position and enhanced its management team and structure. In 2018, four out of five business regions achieved underlying net
new asset growth within the 3-6% target range. However, primarily due to higher AuM attrition than anticipated and the bank’s considerable focus on optimisation and remediation, overall growth rates have been lower than projected. Reflecting its current AuM and revenue base and its renewed focus on growth, EFG is thus partly updating its financial targets for 2019 to 2022:
– Annualised net new asset growth rate of 4-6% – Revenue margin of 85 basis points – Cost/income ratio of 72-75% by end-2022 – Return on tangible equity in excess of 15%
Ratings EFG International and EFG Bank are rated by the Fitch and Moody’s rating agencies.
The current ratings are:
EFG International Fitch: Long-Term issuer default rating of A and Short-Term issuer default rating of F1 (outlook negative)
Moody’s: Long-Term issuer rating of A3 (outlook stable)
EFG Bank Fitch: Long-Term issuer default rating of A and Short-Term issuer default rating of F1 (outlook negative)
Moody’s: Long-Term Bank Deposit rating of A1 and the Short-Term Bank Deposit rating of P1 (outlook stable)

16 | Annual Report 2018

Beyond Banking

18 | Annual Report 2018
Life beyond banking
EFG offers clients comprehensive private banking – and because life is multi-faceted, our commitments also go beyond banking.
Shared interests and values Music, art, sport and social commitments: We consider many facets of life and society to be both fascinating and important. EFG supports a variety of partners who share our values and passion for life. We believe that by aligning our interests and values and identifying what is important to you, our clients, we can foster a more beneficial mutual understanding.
© ROGER THOMAS
EFG London Jazz Festival EFG has been a partner of the EFG London Jazz Festival since 2008 and title sponsor since 2013. The EFG London Jazz Festival is the UK’s largest annual celebration of jazz and features world class artists as well as supporting the next generation of emerging talent. Now in its 27th year, the aims of the Festival remain the same today as when it was founded in 1991: to celebrate the place of jazz in a city with rich cultural diversity, to a wide audience across a variety of venues in London.
© MATHIEU BONNEVIE
Classic Cars Classic car races attract an enthusiastic and committed audience of collectors, drivers and fans. EFG shares this passion and, since 2008, has been a main sponsor of Le Mans Classic, one of the world’s leading classic car events. We also support a selection of classic car events across Europe including Spa Classic, Dix Mille Tours du Castellet and Monza Historic. In the UK, EFG is an official partner of the British Racing Drivers’ Club at Silverstone and supports its Rising Stars Programme.
© IMPROMPTU… BY GIL ROMAN © BBL GREGORY BATARDON
Béjart Ballet Lausanne EFG became the Swiss national partner of the Béjart Ballet Lausanne (BBL) in 2018 as EFG and BBL share the same values and drive to succeed. BBL was founded in 1987 by Maurice Béjart, who wanted to bring the world of ballet to a wider audience. Today, BBL is one of the most famous ballet companies in the world and regarded as a symbol of Swiss excellence. Artistic Director Gil Roman and his 40 dancers continue to embody Béjart’s passion for dance and perform all over the world.

Annual Report 2018 | 19
© PEGGY GUGGENHEIM COLLECTION, VENICE. PH. MATTEO DE FINA
Peggy Guggenheim Collection Featuring contemporary art from the 20th century, the Peggy Guggenheim Collection – located next to the Grand Canal in Venice – is a unique source of fascination for art enthusiasts. We have supported its development and exhibitions for many years and look forward to continuing our collaboration with the Peggy Guggenheim Collection in the future, which includes restoration projects that will conserve artworks for future generations.
© SMASH PIXEL STUDIO
EFG Latin American Art Award and Pinta Miami EFG is the title sponsor of the annual EFG Latin American Art Award,in partnership with Art Nexus, which was created to support emerging Latin American artists. The award aims to both promote Latin American visual art and to raise the profile of regional art fairs. The winner is announced at Pinta Miami, the internationally renowned contemporary art fair in Miami, that attracts galleries from around the world.
© TIFFANY CHAN, EFG GLOBAL SPORT AMBASSADOR
EFG Hong Kong Ladies Open EFG is a long-term supporter of golf in Asia. We are also the first title sponsor of the Hong Kong Ladies Open, which is now firmly established as one of the key highlights in the Hong Kong golfing calendar. As part of our on-going effort to support aspiring and young talents, we are proud to partner with Tiffany Chan, one of Hong Kong’s promising golfing stars.
© SOUTHBANK SINFONIA
Southbank Sinfonia EFG has been the principal partner of the Southbank Sinfonia since 2009. This unique orchestra provides young musicians with a springboard into the orchestral profession. Each year, 33 of the world’s most promising graduate musicians are given a fellowship which allows them to develop their musical talents, gain valuable experience and make lasting professional contacts.
© RIGHT TO PLAY
Right To Play Using corporate and employee donations, EFG provides targeted support for projects run by Right To Play. This international organisation is active in 16 countries and uses play to promote the holistic development of children facing adversity. Right To Play has pioneered a unique play-based approach to learning and development, focusing on quality education, health, gender equality, life skills, child protection and building peaceful communities.

20 | Annual Report 2018
Corporate Governance
Annual Report 2018 | 21
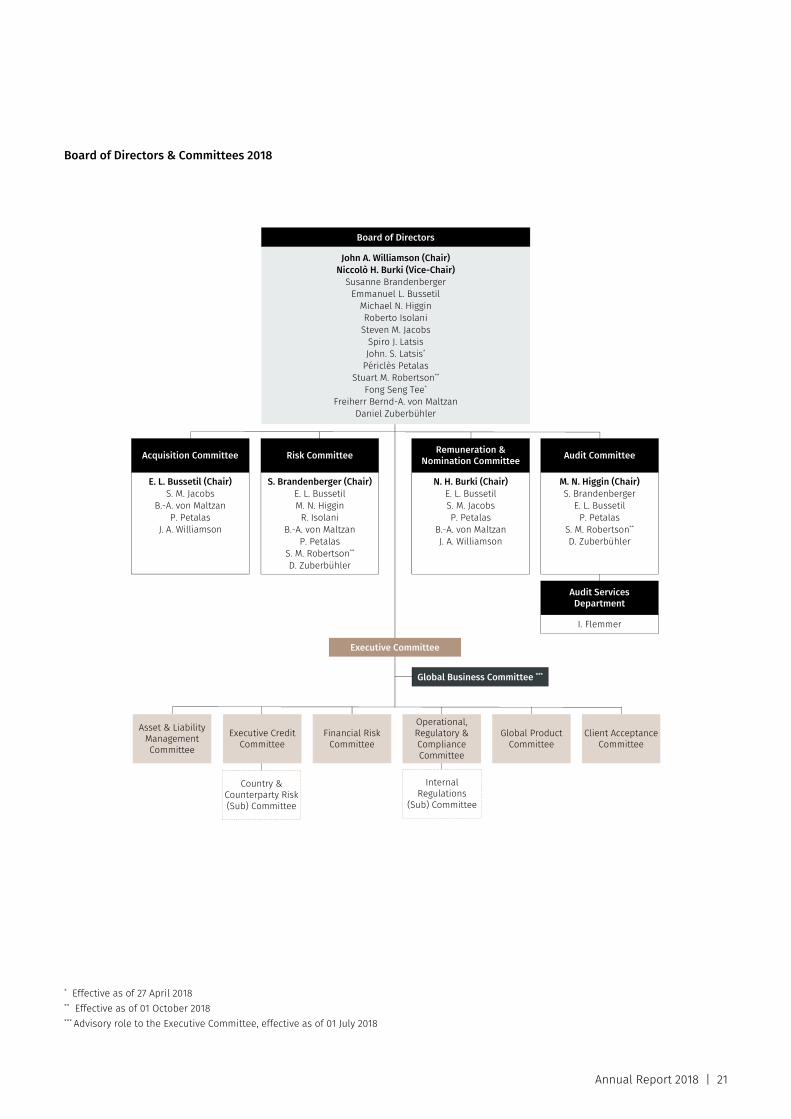
Board of Directors & Committees 2018
* Effective as of 27 April 2018 ** Effective as of 01 October 2018 *** Advisory role to the Executive Committee, effective as of 01 July 2018
Global Business Committee ***
Operational, Regulatory & Compliance Committee
Client Acceptance Committee
E. L. Bussetil (Chair) S. M. Jacobs
B.-A. von Maltzan P. Petalas
J. A. Williamson
Acquisition Committee
John A. Williamson (Chair) Niccolò H. Burki (Vice-Chair)
Susanne Brandenberger Emmanuel L. Bussetil
Michael N. Higgin Roberto Isolani
Steven M. Jacobs Spiro J. Latsis John. S. Latsis*
Périclès Petalas Stuart M. Robertson**
Fong Seng Tee* Freiherr Bernd-A. von Maltzan
Daniel Zuberbühler
Board of Directors
S. Brandenberger (Chair) E. L. Bussetil M. N. Higgin
R. Isolani B.-A. von Maltzan
P. Petalas S. M. Robertson** D. Zuberbühler
Risk Committee
N. H. Burki (Chair) E. L. Bussetil S. M. Jacobs P. Petalas
B.-A. von Maltzan J. A. Williamson
Remuneration & Nomination Committee
M. N. Higgin (Chair) S. Brandenberger
E. L. Bussetil P. Petalas
S. M. Robertson** D. Zuberbühler
Audit Committee
I. Flemmer
Audit Services Department
Asset & Liability Management Committee
Executive Credit Committee
Financial Risk Committee
Global Product Committee
Executive Committee
Country & Counterparty Risk (Sub) Committee
Internal Regulations
(Sub) Committee
Corporate Governance
22 | Annual Report 2018
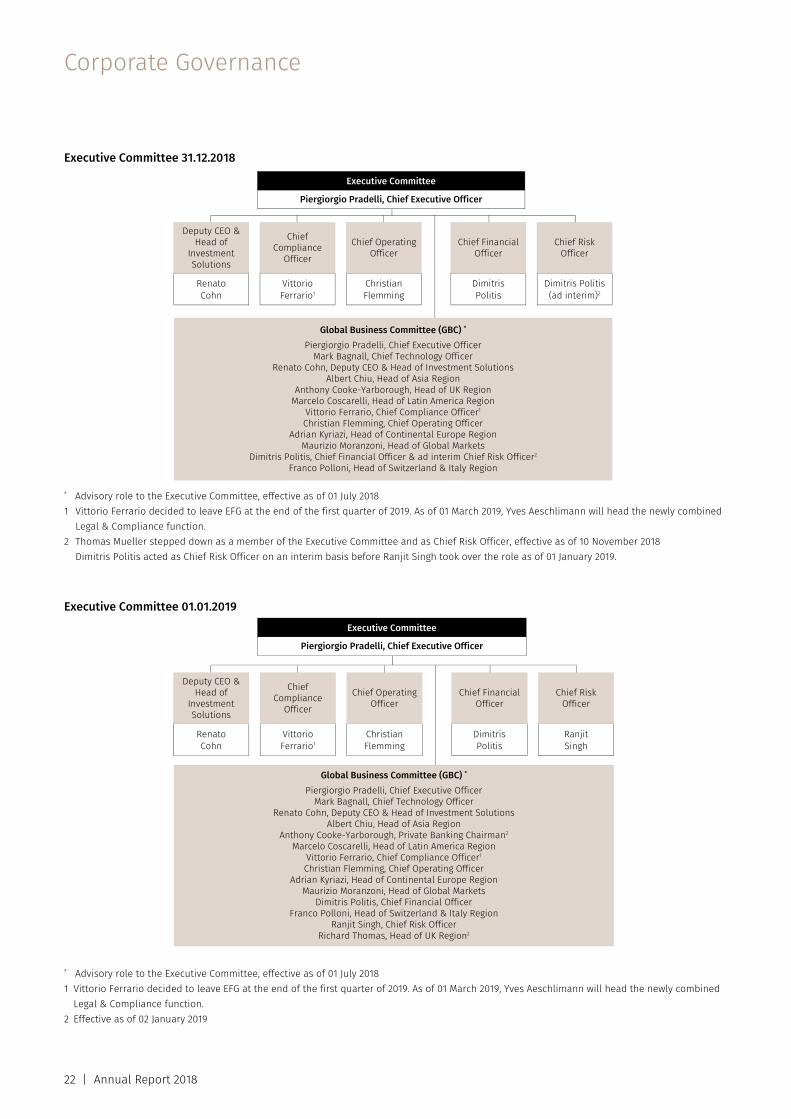
Executive Committee 31.12.2018
* Advisory role to the Executive Committee, effective as of 01 July 2018 1 Vittorio Ferrario decided to leave EFG at the end of the first quarter of 2019. As of 01 March 2019, Yves Aeschlimann will head the newly combined
Legal & Compliance function. 2 Thomas Mueller stepped down as a member of the Executive Committee and as Chief Risk Officer, effective as of 10 November 2018
Dimitris Politis acted as Chief Risk Officer on an interim basis before Ranjit Singh took over the role as of 01 January 2019. Executive Committee 01.01.2019
* Advisory role to the Executive Committee, effective as of 01 July 2018 1 Vittorio Ferrario decided to leave EFG at the end of the first quarter of 2019. As of 01 March 2019, Yves Aeschlimann will head the newly combined
Legal & Compliance function. 2 Effective as of 02 January 2019
Piergiorgio Pradelli, Chief Executive Officer
Executive Committee
Renato Cohn
Deputy CEO & Head of
Investment Solutions
Vittorio Ferrario1
Chief Compliance
Officer
Christian Flemming
Chief Operating Officer
Dimitris Politis
Chief Financial Officer
Dimitris Politis (ad interim)2
Chief Risk Officer
Global Business Committee (GBC) * Piergiorgio Pradelli, Chief Executive Officer
Mark Bagnall, Chief Technology Officer Renato Cohn, Deputy CEO & Head of Investment Solutions
Albert Chiu, Head of Asia Region Anthony Cooke-Yarborough, Head of UK Region
Marcelo Coscarelli, Head of Latin America Region Vittorio Ferrario, Chief Compliance Officer1 Christian Flemming, Chief Operating Officer
Adrian Kyriazi, Head of Continental Europe Region Maurizio Moranzoni, Head of Global Markets
Dimitris Politis, Chief Financial Officer & ad interim Chief Risk Officer2 Franco Polloni, Head of Switzerland & Italy Region
Piergiorgio Pradelli, Chief Executive Officer
Executive Committee
Renato Cohn
Deputy CEO & Head of
Investment Solutions
Vittorio Ferrario1
Chief Compliance
Officer
Christian Flemming
Chief Operating Officer
Dimitris Politis
Chief Financial Officer
Ranjit Singh
Chief Risk Officer
Global Business Committee (GBC) * Piergiorgio Pradelli, Chief Executive Officer
Mark Bagnall, Chief Technology Officer Renato Cohn, Deputy CEO & Head of Investment Solutions
Albert Chiu, Head of Asia Region Anthony Cooke-Yarborough, Private Banking Chairman2
Marcelo Coscarelli, Head of Latin America Region Vittorio Ferrario, Chief Compliance Officer1 Christian Flemming, Chief Operating Officer
Adrian Kyriazi, Head of Continental Europe Region Maurizio Moranzoni, Head of Global Markets
Dimitris Politis, Chief Financial Officer Franco Polloni, Head of Switzerland & Italy Region
Ranjit Singh, Chief Risk Officer Richard Thomas, Head of UK Region2
Annual Report 2018 | 23
Good corporate governance is about ensuring that a company is managed efficiently and effectively in the in-terests of all stakeholders. It pursues a balanced relationship between leadership, control and transparency. EFG International AG (‘EFG International’; ‘Company’) and all its subsidiaries (together ‘EFG International Group’) are always aiming to achieve good corporate governance based on leading national and international standards whilst always respecting the rights of shareholders to the highest degree. EFG International ensures transparency by properly disclosing Company information. This part of the annual report provides key information with regard to corporate governance practices within EFG International Group.
EFG International Group operates under clear separation of responsibilities between the Board of Directors and the Executive Committee in full compliance with Swiss banking law. The responsibilities of both bodies are clearly defined in the Articles of Association and the Organisational and Management Regulations of EFG International (these documents are available on EFG International’s website: www.efginternational.com/articlesofassociation and www.efginternational.com/internalregulations).
Based on recommendations by the Chief Executive Officer of EFG International, the Board of Directors decides on EFG International’s strategy whilst also assuming the responsibility of supervising and monitoring the businesses. The Executive Committee has executive management responsibility for the day-to-day management operations.
Members of the Board of Directors shall not be members of the Executive Committee, in order to ensure a full separation of power. Furthermore, this structure includes checks and balances and safeguards the institutional independence of the Board of Directors from the day-to-day management activities, which are handled by the Executive Committee.
As a publicly listed Swiss company, EFG International is subject to and complies with the Corporate Governance Directive and its annex and commentary, issued by SIX Swiss Exchange AG (SIX). The information provided in this section adheres to the Corporate Governance Directive revised on 20 March 2018, the guidelines revised on 10 April 2017 and recommendations of the ‘Swiss Code of Best Practice for Corporate Governance’ of the Swiss Business Federation, economiesuisse, as amended in 2014 as well as its appendix 1, ‘Recommendations on
compensation for Board of Directors and Executive Board’, which address transparency with respect to the compensa-tion of the members of the Board of Directors and the Executive Committee. Furthermore, EFG International complies with the Swiss Ordinance against Excessive Compensation in Listed Companies (‘Ordinance’) entered into force on 01 January 2014 and has fully implemented the FINMA Circular 2017/1 Corporate Governance – Banks’ by the required deadline of July 2018.
The following information corresponds to the situation as at 31 December 2018, unless indicated otherwise.
If information required by the Corporate Governance Directive is published in the notes to the financial statements or in the Compensation Report, a reference indicating the corresponding section of the notes or page number is given.
1. Group structure and shareholders
1.1 Operational structure of EFG International
EFG International is a holding company domiciled in Zurich, organised under the laws of Switzerland in accordance with Art. 620 et seq. of the Swiss Code of Obligations. It manages a global private banking group offering private banking and asset management services. EFG International’s group of private banking businesses operates in around 40 locations worldwide. EFG International Group is organised in the following business segments: Americas, Asia, United Kingdom, Continental Europe, Switzerland and Italy, Investment Solutions, Global Markets & Treasury. Further information can be found in note 24 ‘Segmental Reporting ‘ to the consolidated financial statements. The functional organisation of EFG International is outlined on pages 21 f.
1.2 Group entities
The main consolidated entities are listed in note 44. Within EFG International Group only EFG International is a listed company.
EFG International’s registered shares are traded on the main standard of SIX in Zurich (security no. 002226822; ISIN CH0022268228, symbol EFGN). The Company’s market capitalisation was CHF 1,690,928,898 on 31 December 2018.
Corporate Governance
24 | Annual Report 2018
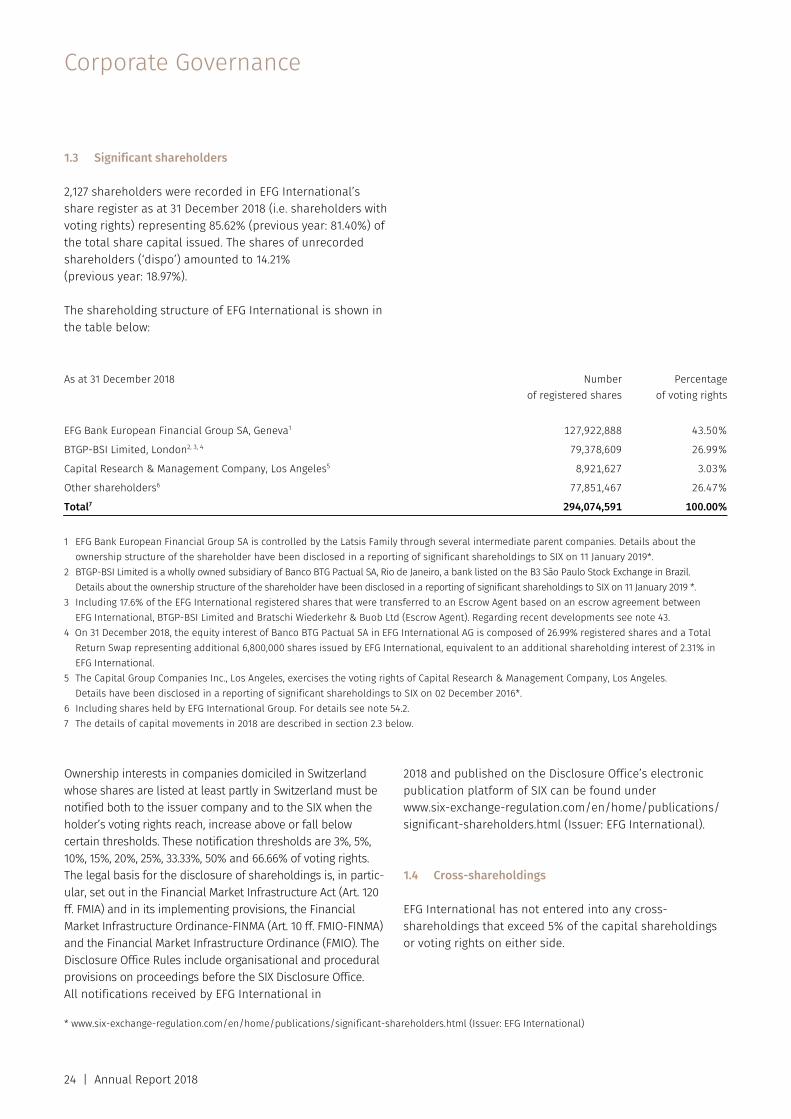
1.3 Significant shareholders
2,127 shareholders were recorded in EFG International’s share register as at 31 December 2018 (i.e. shareholders with voting rights) representing 85.62% (previous year: 81.40%) of the total share capital issued. The shares of unrecorded shareholders (‘dispo’) amounted to 14.21% (previous year: 18.97%).
The shareholding structure of EFG International is shown in the table below: As at 31 December 2018 Number
of registered sharesPercentage
of voting rights
EFG Bank European Financial Group SA, Geneva1 127,922,888 43.50%
BTGP-BSI Limited, London2, 3, 4 79,378,609 26.99%
Capital Research & Management Company, Los Angeles5 8,921,627 3.03%
Other shareholders6 77,851,467 26.47%
Total7 294,074,591 100.00%
1 EFG Bank European Financial Group SA is controlled by the Latsis Family through several intermediate parent companies. Details about the
ownership structure of the shareholder have been disclosed in a reporting of significant shareholdings to SIX on 11 January 2019*. 2 BTGP-BSI Limited is a wholly owned subsidiary of Banco BTG Pactual SA, Rio de Janeiro, a bank listed on the B3 São Paulo Stock Exchange in Brazil.
Details about the ownership structure of the shareholder have been disclosed in a reporting of significant shareholdings to SIX on 11 January 2019 *. 3 Including 17.6% of the EFG International registered shares that were transferred to an Escrow Agent based on an escrow agreement between
EFG International, BTGP-BSI Limited and Bratschi Wiederkehr & Buob Ltd (Escrow Agent). Regarding recent developments see note 43. 4 On 31 December 2018, the equity interest of Banco BTG Pactual SA in EFG International AG is composed of 26.99% registered shares and a Total
Return Swap representing additional 6,800,000 shares issued by EFG International, equivalent to an additional shareholding interest of 2.31% in EFG International.
5 The Capital Group Companies Inc., Los Angeles, exercises the voting rights of Capital Research & Management Company, Los Angeles. Details have been disclosed in a reporting of significant shareholdings to SIX on 02 December 2016*.
6 Including shares held by EFG International Group. For details see note 54.2. 7 The details of capital movements in 2018 are described in section 2.3 below. Ownership interests in companies domiciled in Switzerland whose shares are listed at least partly in Switzerland must be notified both to the issuer company and to the SIX when the holder’s voting rights reach, increase above or fall below certain thresholds. These notification thresholds are 3%, 5%, 10%, 15%, 20%, 25%, 33.33%, 50% and 66.66% of voting rights. The legal basis for the disclosure of shareholdings is, in partic-ular, set out in the Financial Market Infrastructure Act (Art. 120 ff. FMIA) and in its implementing provisions, the Financial Market Infrastructure Ordinance-FINMA (Art. 10 ff. FMIO-FINMA) and the Financial Market Infrastructure Ordinance (FMIO). The Disclosure Office Rules include organisational and procedural provisions on proceedings before the SIX Disclosure Office. All notifications received by EFG International in
2018 and published on the Disclosure Office’s electronic publication platform of SIX can be found under www.six-exchange-regulation.com/en/home/publications/ significant-shareholders.html (Issuer: EFG International).
1.4 Cross-shareholdings
EFG International has not entered into any cross-shareholdings that exceed 5% of the capital shareholdings or voting rights on either side.
* www.six-exchange-regulation.com/en/home/publications/significant-shareholders.html (Issuer: EFG International)
Annual Report 2018 | 25
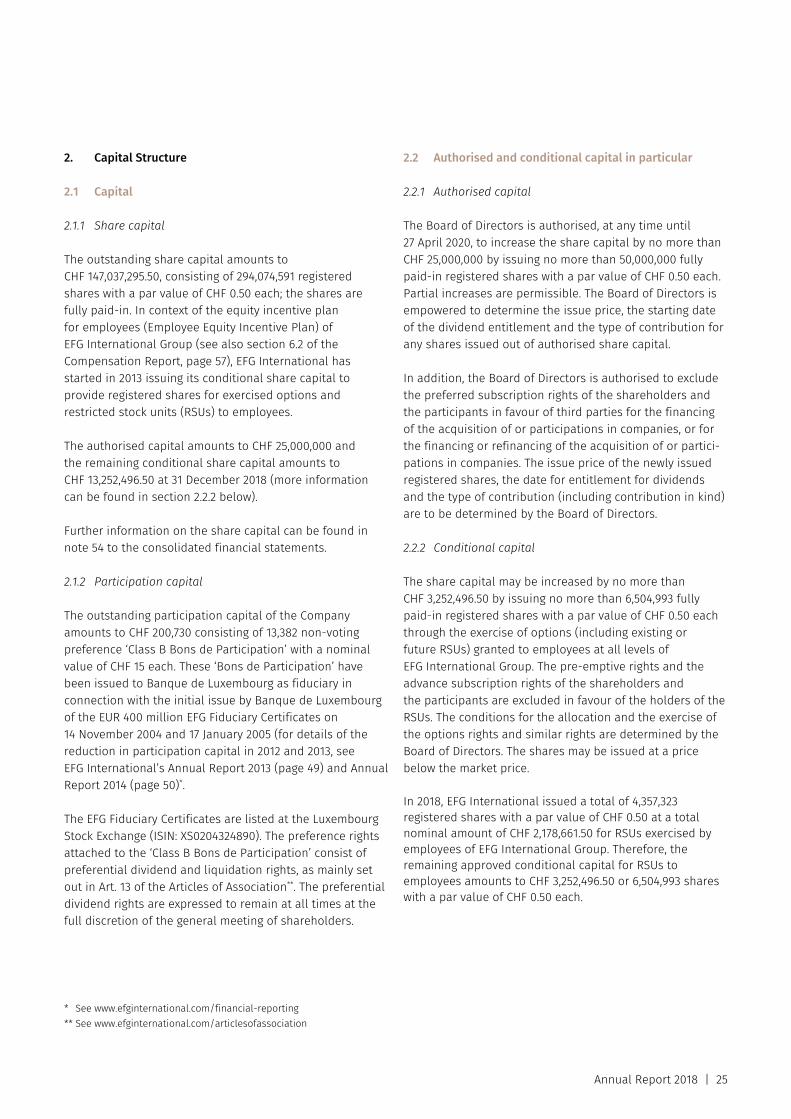
2. Capital Structure
2.1 Capital
2.1.1 Share capital
The outstanding share capital amounts to CHF 147,037,295.50, consisting of 294,074,591 registered shares with a par value of CHF 0.50 each; the shares are fully paid-in. In context of the equity incentive plan for employees (Employee Equity Incentive Plan) of EFG International Group (see also section 6.2 of the Compensation Report, page 57), EFG International has started in 2013 issuing its conditional share capital to provide registered shares for exercised options and restricted stock units (RSUs) to employees.
The authorised capital amounts to CHF 25,000,000 and the remaining conditional share capital amounts to CHF 13,252,496.50 at 31 December 2018 (more information can be found in section 2.2.2 below).
Further information on the share capital can be found in note 54 to the consolidated financial statements.
2.1.2 Participation capital
The outstanding participation capital of the Company amounts to CHF 200,730 consisting of 13,382 non-voting preference ‘Class B Bons de Participation’ with a nominal value of CHF 15 each. These ‘Bons de Participation’ have been issued to Banque de Luxembourg as fiduciary in connection with the initial issue by Banque de Luxembourg of the EUR 400 million EFG Fiduciary Certificates on 14 November 2004 and 17 January 2005 (for details of the reduction in participation capital in 2012 and 2013, see EFG International’s Annual Report 2013 (page 49) and Annual Report 2014 (page 50)*.
The EFG Fiduciary Certificates are listed at the Luxembourg Stock Exchange (ISIN: XS0204324890). The preference rights attached to the ‘Class B Bons de Participation’ consist of preferential dividend and liquidation rights, as mainly set out in Art. 13 of the Articles of Association**. The preferential dividend rights are expressed to remain at all times at the full discretion of the general meeting of shareholders.
2.2 Authorised and conditional capital in particular
2.2.1 Authorised capital
The Board of Directors is authorised, at any time until 27 April 2020, to increase the share capital by no more than CHF 25,000,000 by issuing no more than 50,000,000 fully paid-in registered shares with a par value of CHF 0.50 each. Partial increases are permissible. The Board of Directors is empowered to determine the issue price, the starting date of the dividend entitlement and the type of contribution for any shares issued out of authorised share capital.
In addition, the Board of Directors is authorised to exclude the preferred subscription rights of the shareholders and the participants in favour of third parties for the financing of the acquisition of or participations in companies, or for the financing or refinancing of the acquisition of or partici-pations in companies. The issue price of the newly issued registered shares, the date for entitlement for dividends and the type of contribution (including contribution in kind) are to be determined by the Board of Directors.
2.2.2 Conditional capital
The share capital may be increased by no more than CHF 3,252,496.50 by issuing no more than 6,504,993 fully paid-in registered shares with a par value of CHF 0.50 each through the exercise of options (including existing or future RSUs) granted to employees at all levels of EFG International Group. The pre-emptive rights and the advance subscription rights of the shareholders and the participants are excluded in favour of the holders of the RSUs. The conditions for the allocation and the exercise of the options rights and similar rights are determined by the Board of Directors. The shares may be issued at a price below the market price.
In 2018, EFG International issued a total of 4,357,323 registered shares with a par value of CHF 0.50 at a total nominal amount of CHF 2,178,661.50 for RSUs exercised by employees of EFG International Group. Therefore, the remaining approved conditional capital for RSUs to employees amounts to CHF 3,252,496.50 or 6,504,993 shares with a par value of CHF 0.50 each.
* See www.efginternational.com/financial-reporting ** See www.efginternational.com/articlesofassociation
Corporate Governance
26 | Annual Report 2018
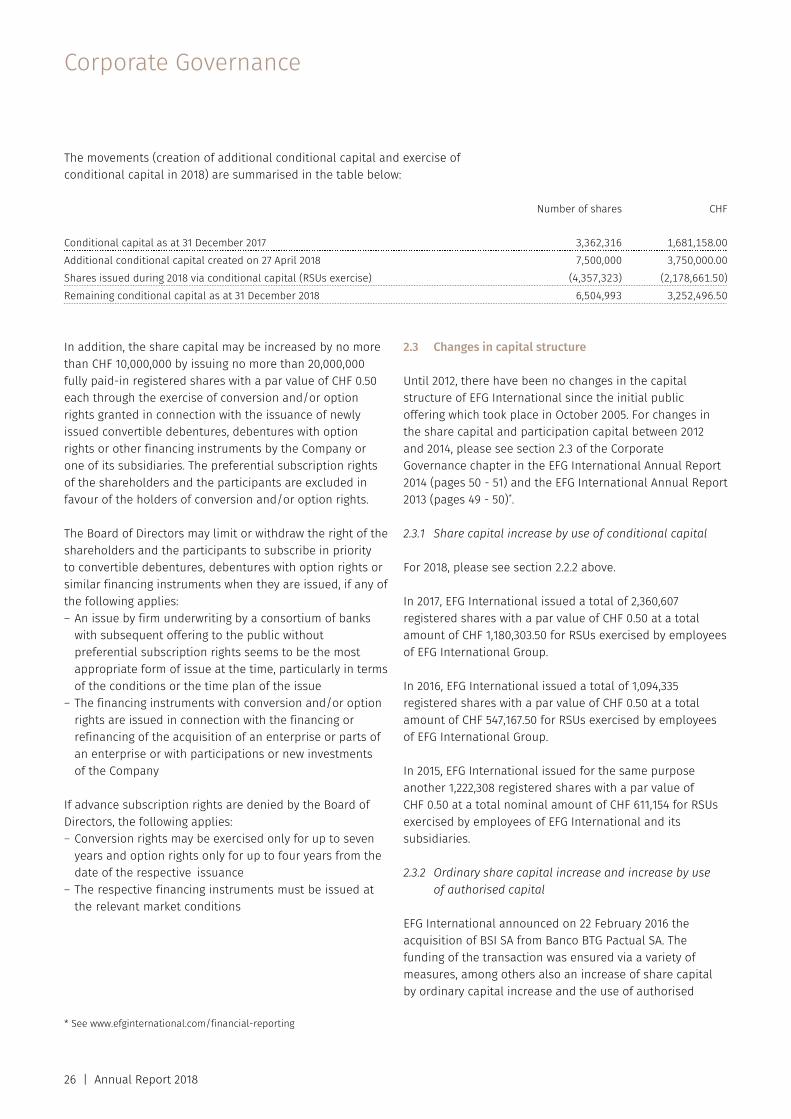
The movements (creation of additional conditional capital and exercise of conditional capital in 2018) are summarised in the table below:
Number of shares CHF
Conditional capital as at 31 December 2017 3,362,316 1,681,158.00Additional conditional capital created on 27 April 2018 7,500,000 3,750,000.00Shares issued during 2018 via conditional capital (RSUs exercise) (4,357,323) (2,178,661.50)Remaining conditional capital as at 31 December 2018 6,504,993 3,252,496.50 In addition, the share capital may be increased by no more than CHF 10,000,000 by issuing no more than 20,000,000 fully paid-in registered shares with a par value of CHF 0.50 each through the exercise of conversion and/or option rights granted in connection with the issuance of newly issued convertible debentures, debentures with option rights or other financing instruments by the Company or one of its subsidiaries. The preferential subscription rights of the shareholders and the participants are excluded in favour of the holders of conversion and/or option rights.
The Board of Directors may limit or withdraw the right of the shareholders and the participants to subscribe in priority to convertible debentures, debentures with option rights or similar financing instruments when they are issued, if any of the following applies: – An issue by firm underwriting by a consortium of banks
with subsequent offering to the public without preferential subscription rights seems to be the most appropriate form of issue at the time, particularly in terms of the conditions or the time plan of the issue
– The financing instruments with conversion and/or option rights are issued in connection with the financing or refinancing of the acquisition of an enterprise or parts of an enterprise or with participations or new investments of the Company
If advance subscription rights are denied by the Board of Directors, the following applies: – Conversion rights may be exercised only for up to seven
years and option rights only for up to four years from the date of the respective issuance
– The respective financing instruments must be issued at the relevant market conditions
2.3 Changes in capital structure
Until 2012, there have been no changes in the capital structure of EFG International since the initial public offering which took place in October 2005. For changes in the share capital and participation capital between 2012 and 2014, please see section 2.3 of the Corporate Governance chapter in the EFG International Annual Report 2014 (pages 50 - 51) and the EFG International Annual Report 2013 (pages 49 - 50)*.
2.3.1 Share capital increase by use of conditional capital
For 2018, please see section 2.2.2 above.
In 2017, EFG International issued a total of 2,360,607 registered shares with a par value of CHF 0.50 at a total amount of CHF 1,180,303.50 for RSUs exercised by employees of EFG International Group.
In 2016, EFG International issued a total of 1,094,335 registered shares with a par value of CHF 0.50 at a total amount of CHF 547,167.50 for RSUs exercised by employees of EFG International Group.
In 2015, EFG International issued for the same purpose another 1,222,308 registered shares with a par value of CHF 0.50 at a total nominal amount of CHF 611,154 for RSUs exercised by employees of EFG International and its subsidiaries.
2.3.2 Ordinary share capital increase and increase by use of authorised capital
EFG International announced on 22 February 2016 the acquisition of BSI SA from Banco BTG Pactual SA. The funding of the transaction was ensured via a variety of measures, among others also an increase of share capital by ordinary capital increase and the use of authorised
* See www.efginternational.com/financial-reporting
Annual Report 2018 | 27
capital that was approved by the shareholders at two general meetings on 29 April and 26 July 2016.
The details of the movements (share capital and authorised capital) during 2017 can be found in the EFG International Annual Report 2017 (page 16)*.
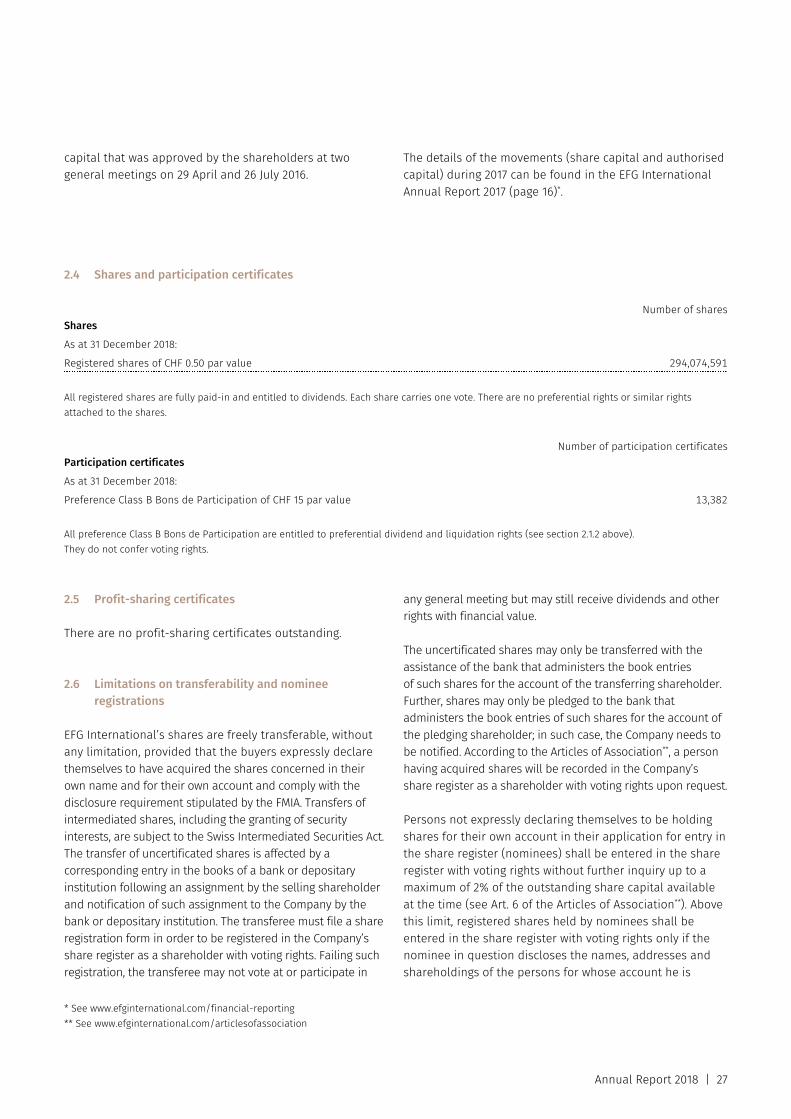
2.4 Shares and participation certificates
Shares
Number of shares
As at 31 December 2018:
Registered shares of CHF 0.50 par value 294,074,591
All registered shares are fully paid-in and entitled to dividends. Each share carries one vote. There are no preferential rights or similar rights attached to the shares. Participation certificates
Number of participation certificates
As at 31 December 2018:
Preference Class B Bons de Participation of CHF 15 par value 13,382
All preference Class B Bons de Participation are entitled to preferential dividend and liquidation rights (see section 2.1.2 above). They do not confer voting rights. 2.5 Profit-sharing certificates
There are no profit-sharing certificates outstanding.
2.6 Limitations on transferability and nominee registrations
EFG International’s shares are freely transferable, without any limitation, provided that the buyers expressly declare themselves to have acquired the shares concerned in their own name and for their own account and comply with the disclosure requirement stipulated by the FMIA. Transfers of intermediated shares, including the granting of security interests, are subject to the Swiss Intermediated Securities Act. The transfer of uncertificated shares is affected by a corresponding entry in the books of a bank or depositary institution following an assignment by the selling shareholder and notification of such assignment to the Company by the bank or depositary institution. The transferee must file a share registration form in order to be registered in the Company’s share register as a shareholder with voting rights. Failing such registration, the transferee may not vote at or participate in
any general meeting but may still receive dividends and other rights with financial value.
The uncertificated shares may only be transferred with the assistance of the bank that administers the book entries of such shares for the account of the transferring shareholder. Further, shares may only be pledged to the bank that administers the book entries of such shares for the account of the pledging shareholder; in such case, the Company needs to be notified. According to the Articles of Association**, a person having acquired shares will be recorded in the Company’s share register as a shareholder with voting rights upon request.
Persons not expressly declaring themselves to be holding shares for their own account in their application for entry in the share register (nominees) shall be entered in the share register with voting rights without further inquiry up to a maximum of 2% of the outstanding share capital available at the time (see Art. 6 of the Articles of Association**). Above this limit, registered shares held by nominees shall be entered in the share register with voting rights only if the nominee in question discloses the names, addresses and shareholdings of the persons for whose account he is
* See www.efginternational.com/financial-reporting ** See www.efginternational.com/articlesofassociation
Corporate Governance
28 | Annual Report 2018
holding 0.5% or more of the outstanding share capital available at the time and provided that the disclosure requirements stipulated by FMIA are respected.
Legal entities or partnerships or other associations or joint ownership arrangements which are linked through capital ownership or voting rights, through common management or in like manner, as well as individuals, legal entities or partnerships (especially syndicates) which act in concert with the intent to evade the entry restriction are considered as one shareholder or nominee. The Board of Directors is authorised to issue regulations to implement the above provisions.
2.7 Convertible bonds and warrants/options
Apart from the amounts disclosed in note 63 to the consolidated financial statements, EFG International has not issued any option rights.
3. Board of Directors
3.1 Members of the Board of Directors
The Board of Directors currently comprises 14 members all of whom are non-executive directors. The Board of Directors of EFG Bank AG (EFG Bank) is composed of the same members as the Board of Directors of EFG International.
With the exception of Mr John A. Williamson (see his biography below), no member of the Board held a management position in EFG International or any of its subsidiaries over the last three years. Mr Roberto Isolani was appointed Group Chief Executive Officer of BSI SA in May 2016, a role he relinquished in October 2016 upon the closing of the BSI SA acquisition by EFG International.
No member of the Board of Directors (neither as individual nor as representative of a third party) has any significant business connection with EFG International or any of its subsidiaries.
John Alexander Williamson is a British citizen and was born in 1962. He was appointed Chair of the Board of Directors of EFG International and EFG Bank effective as of 29 April 2016, after having served as Vice-Chair since 24 April 2015. Formerly, Mr Williamson was the CEO of EFG International, effective as of June 2011, and since April 2013 he was also CEO of EFG Bank. He is a member of the Board of Directors of EFG International’s subsidiaries EFG Bank von Ernst AG,
Vaduz (Liechtenstein), and EFG Investment and Wealth Solutions Holding AG, Zurich, and a member of EFG’s Advisory Board for Latin America. He was formerly the CEO of EFG Private Bank Ltd, London, EFG International’s UK and Channel Islands business, from 2002 to 2011. During this time he transformed the business into one of the most significant contributors to EFG International’s performance, and oversaw the merger of EFG Private Bank Ltd with EFG International, ahead of the latter going public.
John Williamson has spent the whole of his career in private banking. Before EFG Private Bank Ltd, he spent over 16 years with Coutts in a variety of senior roles, ending up as COO for Coutts Group. From 1997 to 1999, he worked in the USA, as director and COO, first in New York then in Miami. In other roles, he was responsible for strategy, performance and planning, and also had experience of marketing and credit. For two years, he was a Client Relationship Officer, serving French and Belgian clients.
Mr Williamson is a member of the Board of Directors of the Association of Swiss Asset and Wealth Management Banks (VAV/ABG) in Zurich, and he is a Trustee of the Serious Trust, a UK registered charity. Mr Williamson is also the President of the Jazzaar Association, a non-profit voluntary association.
Mr Williamson holds a MA in modern languages from St Catharine’s College, Cambridge.
Mr Williamson is a member of the EFG International’s Board-delegated Acquisition and Remuneration & Nomination Committees.
Niccolò Herbert Burki is a Swiss citizen and was born in 1950. He was appointed as a member of the Board of Directors of EFG International, effective as of 26 April 2013, and Vice-Chair, effective as of 29 April 2016, after having served as Chair since April 2015. He is also Vice-Chair of the Board of Directors of EFG Bank. Before establishing Burki Attorneys-at-Law in 1997, Mr Burki was an attorney at Bär & Karrer in Zurich (1985–1997), where he became a partner as of 1989. Previously, he was a tax lawyer with Arthur Andersen in Zurich (1980–1985). He holds various memberships including the Swiss Bar Association, International Bar Association and International Fiscal Association.
Mr Burki is a member of the Board of Directors of Orga Suisse GmbH, Betimex AG and Allegion International AG. He also sits in the Board of Directors of Trane SA, Ingersoll-Rand SA, Ingersoll-Rand Technical and Services Sàrl, Pitney Bowes
Annual Report 2018 | 29
(Switzerland) SA and Tortuga AG. Mr Burki is also a member of the Board of Directors of Alceva Foundation (Liechtenstein).
Mr Burki graduated in economics and business administration from the University of St Gallen (1974) and holds a doctorate in law from the University of Basel (1984). He is a certified Swiss tax expert (1984) and a Trust and Estate Practitioner. He was admitted to the Zurich Bar in 1979.
Mr Burki is currently Chair of EFG International’s Board-delegated Remuneration & Nomination Committee.
Susanne Brandenberger is a Swiss citizen and was born in 1967. She was appointed as a member of the Board of Directors of EFG International at the Extraordinary General Meeting held on 07 October 2015. She is also a member of the Board of Directors of EFG Bank since October 2015.
Mrs Brandenberger was with Vontobel Group between 1999 and 2015 acting in various positions: Managing Director, head Risk Control and a member of the Finance & Risk Management Team (2004–2015), head of Market & Credit Risk (2002–2004) and head of Market Risk Control (1999–2002). She began her career at the Swiss Financial Market Supervisory Authority (FINMA), formerly the Swiss Federal Banking Commission where, from 1994 to 1999, she was responsible for building up and heading the risk management unit as a new unit of the banking supervision department.
Mrs Brandenberger is a member of the Board of Directors and the Chair of the Risk and Audit Committee of Thurgauer Kantonalbank since 2016. She also holds a membership position in the Board of Directors of Stoxx Limited, a global index provider located in Switzerland, effective as of 01 January 2019. In addition, Mrs Brandenberger sits in the Board of Directors of insieme21, a charity organisation.
Mrs Brandenberger holds a PhD from the Swiss Institute for Banking and Finance of the University of St Gallen and a master’s degree in banking and finance from the University of St Gallen.
Mrs Brandenberger is currently the Chair of EFG International’s Board-delegated Risk Committee and a member of the Audit Committee.
Emmanuel Leonard Bussetil is a British citizen and was born in 1951. He was appointed as a member of the Board of Directors of EFG International effective as of 08 September
2005 and is a member of the Board of Directors of EFG Bank since 2001.
Mr Bussetil is a member of the Board of Directors of EFG International’s subsidiary EFG Bank (Monaco). He is a member of the Board of Directors of European Financial Group EFG (Luxembourg) SA. He is also a member of the Board of SETE Holdings Sarl, Hellenikon Global SA, and Gestron Asset Management SA. In addition, he is a non-executive director of Paneuropean Oil and Industrial Holdings SA, Luxembourg, of Consolidated Lamda Holdings SA, Luxembourg and of other principal commercial holding and operating companies controlled by Latsis Family Interests. He joined the Latsis group of companies in 1982 as Chief Internal Auditor. Prior to that, he was an Audit Manager at Pricewaterhouse in the United Kingdon, where he was employed from 1976 to 1982. Mr Bussetil is a member of the Board of John S. Latsis Public Benefit Foundations and of St Catherine’s Foundation. Mr Bussetil received his GCSE A-Levels in mathematics and physics in 1970. He attended the Thames Polytechnic London, UK and obtained his Higher National diploma in mathematics, statistics & computing in 1972. His professional training was undertaken as an Articled Clerk at Dolby Summerskill, Liverpool (1972-1973) and at Morland and Partners, Liverpool (1974-1976). He is a fellow of the Institute of Chartered Accountants of England and Wales. Mr Bussetil is currently a member of EFG International’s Board-delegated Audit, Risk and Remuneration & Nomination Committees and Chair of the Acquisition Committee.
Michael Norland Higgin is a British citizen and was born in 1949. He was appointed as a member of the Board of Directors of EFG International effective as of 27 April 2012. He is a member of the Board of Directors of EFG Bank since 2012 and a member of the Board of Directors of EFG International’s subsidiary EFG Private Bank Ltd, London, effective as of March 2015.
Mr Higgin joined Coopers & Lybrand from university in 1972, qualifying as a Chartered Accountant in 1975. He worked as a partner and head of Business Unit (banking audit/assurance) with Coopers & Lybrand – subsequently PricewaterhouseCoopers – in Switzerland and London until his retirement in December 2009.
Mr Higgin is trustee of the London Youth Support Trust.
Corporate Governance
30 | Annual Report 2018
He obtained a Bachelor of Arts from Cambridge University in England in 1972 and attended the senior executive programme at Stanford University in 1996. He is a fellow of the Institute of Chartered Accountants in England and Wales.
Mr Higgin is currently Chair of EFG International’s Board-delegated Audit Committee and a member of the Risk Committee.
Roberto Isolani is an Italian citizen and was born in 1964. He was appointed as a member of the Board of Directors of EFG International and EFG Bank effective as of 31 October 2016.
Mr Isolani is a Managing Partner of BTG Pactual as well as member of the Global Management Committee and head of International Client Coverage, based in the London office. He is also a member of the Board of Directors of BTG Pactual (UK) Ltd.
Before joining BTG Pactual in April 2010, Mr Isolani worked for seventeen years at UBS where he last held the position of joint head of Global Capital Markets and had joint responsibility for the Client Services Group, the Fixed Income and FX global salesforces at UBS. He jointly headed a marketing team of over 1,000 staff. Mr Isolani was also a member of UBS Investment Bank’s Board.
Mr Isolani joined UBS (formerly SBC) in 1992 and spent ten years in Fixed Income, in Derivatives Marketing and DCM before being promoted to head of European DCM in 2000. He transferred to IBD in 2002, moving to Italy as co-head of Italian investment banking. He moved back to London in 2007 to become global head of DCM before assuming his latest responsibilities at the beginning of 2009.
Mr Isolani held the following executive and Board roles in regulated and unregulated Italian UBS entities. From 2002 to 2009 Board member and CEO (from 2003) of UBS Securities Italia Finanziaria S.p.A.; from 1998 to 2009 Board member and CEO (from 2003) of UBS Corporate Finance Italia S.p.A.; from 2005 to 2009 Board member of UBS Italia SIM S.p.A.
In 2014, Mr Isolani was appointed as a member of the Board of Directors of Banca Monte dei Paschi di Siena S.p.A. (BMPS) and subsequently appointed as Deputy Chair of BMPS in 2015, remaining in office until December 2017.
Mr Isolani graduated from the University of Rome, La Sapienza, cum laude in 1989 and was a lecturer at the university before going on to work at IMI and Cofiri and then joining UBS.
Mr Isolani is currently a member of EFG International’s Board-delegated Risk Committee and a member of EFG’s Advisory Board for Asia.
Steven Michael Jacobs is a British citizen and was born in 1969. He was appointed as a member of the Board of Directors of EFG International and EFG Bank, effective as of 31 October 2016. He is also a member of the Board of Directors of EFG Investment and Wealth Solutions Holding AG.
Mr Jacobs is a Managing Partner of BTG Pactual and Chief Executive Officer of the Asset Management division of BTG Pactual, based in London. He joined BTG Pactual on 01 January 2010. Prior to that, he was a Managing Director at UBS, where over ten years he held various roles including head of Group Strategy for UBS Group, based in Zurich, head of Private Equity & Infrastructure and member of UBS Global Asset Management Executive Committee, based in London. From 1990 to 1999, Mr Jacobs worked for Ernst & Young in London and Sydney, focusing on providing corporate finance services to financial services clients across the world.
Mr Jacobs is Chair of Vesuvium Limited and is a member of the Board of BTGP – BSI Limited, BTG Pactual UK Holdco Ltd and BTG Pactual (UK) Limited, and of The Tick Tock Club, a Great Ormond Street Hospital charity.
Mr Jacobs holds a bachelor’s degree (Hons.) in finance, accounting and law from the University of Brighton, United Kingdom, and a master’s in international strategy and diplomacy from the London School of Economics. He is a fellow of the Institute of Chartered Accountants of England and Wales.
Mr Jacobs is currently a member of EFG International’s Board-delegated Remuneration & Nomination Committee and is a member of the Acquisition Committee.
Spiro John Latsis is a Greek citizen and was born in 1946. He was appointed as a member of the Board of Directors of EFG International, effective as of 08 September 2005. He is a non-executive member of the Board of Directors of EFG Bank since 1997.
Dr Latsis is member of the Board of Directors of EFG International’s subsidiary EFG Bank (Monaco). Dr Latsis has been a non-executive member of the Board of Directors of EFG Bank European Financial Group SA, Geneva, since 1981 and has served as its Chair since 1997. In addition, he is a non-executive director of European Financial Group EFG (Luxembourg) SA (since 2009; as Chair). He is a member
Annual Report 2018 | 31
of the Board of Directors of EFG Consolidated Holdings SA and EFG European Financial Group Ltd. Dr Latsis is Chair of Paneuropean Oil and Industrial Holdings SA, Luxembourg, and of Private Financial Holdings Ltd, and a non-executive Director of Consolidated Lamda Holdings SA, Luxembourg, and SGI Group Holdings SA, Luxembourg.
He is a member of the Supervisory Board of John S. Latsis Public Benefit Foundation. He is an honorary fellow and an emeritus member of the Court of Governors of the London School of Economics. He is also an emeritus member of the Board of Trustees of the Institute for Advanced Study, Princeton.
Dr Latsis obtained his bachelor’s degree in economics in 1968, a master’s degree in logic and scientific method in 1970 and a doctorate in philosophy in 1974, all from the London School of Economics.
John Spiro Latsis is a Greek and British citizen and was born in 1977. He was appointed as a member of the Board of Directors of EFG International and EFG Bank effective as of 27 April 2018.
Dr J. Latsis has in-depth knowledge of the financial industry. Since 2016, he is Managing Director at Gestron Services (Suisse) SA and an active member of a number of committees and Boards of Directors. Amongst others, he is a member of the Board of Directors of EFG European Financial Group SA since 2016 and a member of the Board of La Tour Holding SA since 2018. Furthermore, Dr Latsis has extensive experience in the academic sector. He has held various academic positions and was last active as Associate Professor in social and organisational theory at the Henley Business School of the University of Reading.
Dr J. Latsis is a fellow of the Higher Education Academy of the University of Reading and holds a PhD in history and philosophy of science from the University of Cambridge. In addition, he holds a master’s degree in economics and philosophy from the London School of Economics and a bachelor’s degree from the University of Oxford.
Dr J. Latsis is a member of the Board of Directors of the Fondation Latsis Internationale, Chair of the Board of Directors of the Independent Social Research Foundation, and a member of the Advisory Committee at the University of Oxford Private Equity Institute.
Périclès Petalas is a Swiss citizen and was born in 1943. He was appointed as a member of the Board of Directors of
EFG International, effective as of 08 September 2005. He is a member of the Board of Directors of EFG Bank since 1997.
Since 1997, Dr Petalas is the Chief Executive Officer of EFG Bank European Financial Group SA, Geneva. He is also a non-executive director of European Financial Group EFG (Luxembourg) SA. Prior to his position at EFG Bank European Financial Group SA, Geneva, he was Senior Vice President and General Secretary of Banque de Dépôts, Geneva. Previously, he worked for Union Bank of Switzerland in Zurich (1978–1980) and Petrola International, Athens (1977–1978).
Dr Petalas obtained a diploma (1968) and a doctorate (1971) in theoretical physics at the Swiss Federal Institute of Technology in Zurich. He also received a post-graduate degree in industrial and management engineering from the same institute in 1977.
Dr Petalas is currently a member of EFG International’s Board-delegated Audit, Risk, Acquisition and Remuneration & Nomination Committees.
Stuart Macbean Robertson is a Swiss and British citizen and was born in 1955. He was appointed as a member of the Board of Directors of EFG International and of EFG Bank effective as of 01 October 2018.
Mr Robertson has over 30 years of experience in the Swiss financial services sector in both audit and consulting and has a profound understanding of the Swiss and international regulatory, accounting and tax landscape.
Throughout his career, Mr Robertson has advised and audited many global institutions and managed numerous complex projects in the areas of growth, M&A, strategy and transformation, performance, as well as risk and regulatory topics. Since 1999, Mr Robertson has worked at KPMG, where he has held various leadership positions and managed teams of up to 200 people. Laterally, he was a member of the Board of Directors. In addition, he held the role of Global Lead Partner serving a large financial institution.
Mr Robertson is a member of the Institute of Chartered Accountants of Scotland and of the Swiss Institute of Certified Accountants and Tax Consultants and is a member of the Board of Overseers of Reinet Investments S.C.A., Luxembourg.
He holds a Master of Arts degree from the University of St Andrews and a diploma in accounting from the Heriot-Watt University.
Corporate Governance
32 | Annual Report 2018
Mr Robertson is a member of EFG International’s Board-delegated Risk and Audit Committees.
Fong Seng Tee is a Singaporean citizen and was born in 1954. He was appointed as a member of the Board of Directors of EFG International and of EFG Bank effective as of 27 April 2018.
Mr Tee brings with him almost 40 years of international banking experience and has held several leadership roles during his career. He is currently a non-executive Director and shareholder (100%) at Meritus Property Investments Pte Ltd, Singapore, and at Consul Asset Management Co Ltd, British Virgin Islands. He is also shareholder (100%) in Consul Asset Management Services Co Ltd, Singapore, shareholder (33.33%) in Asian Investments Consultancy Pte Ltd, Singapore, shareholder (7.5%) in KTPT Holdings Investments Pte Ltd, and shareholder (3.75%) in Orient Wealth Investments Pte Ltd.
Moreover, Mr Tee is the Chair of the Advisory Board for Wealth Management for SMU at the Singapore Management University, Singapore, Dean’s Fellow in the Lee Kong Chian School of Business and non-executive Director and shareholder (16.67%) of the Asian Philanthropic Venture, Singapore.
Mr Tee joined EFG from Credit Suisse, where he served in various senior management positions in the bank’s Private Banking division in the Asia Pacific region since 2009. In his most recent role, he was Vice-Chair Private Banking in the Asia Pacific region. From 2013 to 2016, Mr Tee served as Chief Executive of Credit Suisse’s Hong Kong Branch and head of Market Greater China. Prior to that, he was head of Market South East Asia. Before joining Credit Suisse, he held various management positions at UBS, including the role of Deputy Branch Manager in Singapore from 2007 to 2009. From 2007 to 2013, Mr Tee chaired the Wealth Management Steering Committee at the Institute of Banking and Finance Singapore (IBF) and from 2008 to 2013, he served as the Chair of the Private Banking Industry Group Competency and Manpower Committee.
Fong Seng Tee is a Chartered Management Accountant (ACMA, London) and holds a Bachelor of Business Administration from the National University of Singapore.
Mr Tee is the Chair of EFG’s Advisory Board for Asia, effective as of 01 January 2018.
Freiherr Bernd-Albrecht von Maltzan is a German citizen and was born in 1949. He was appointed as a member of the Board
of Directors of EFG International, effective as of 26 April 2013. He is also a member of the Board of Directors of EFG Bank since 2013. Mr von Maltzan is a member of the Board of Directors of EFG International’s subsidiaries EFG Investment (Luxembourg) SA, and EFG Bank (Luxembourg) SA, effective as of December 2015, and Chair effective as of April 2016.
Throughout his career at Deutsche Bank, he held a variety of senior positions, including global head Trading & Sales DB Group in Frankfurt (1993–1995), Divisional Board member and global head Private Banking in Frankfurt (1996–2002), followed by divisional Board member and Vice-Chair Private Wealth Management in Frankfurt, from where he retired in 2012.
Mr von Maltzan is member of the Advisory Board of Mann-Group in Karlsruhe, Germany, and is the Chair of the Board of Trustees of Niagara Stiftung (Foundation) in Munich, Germany.
Mr von Maltzan studied economics at the universities in Munich and Bonn and holds a doctorate in business administration (1978) from the University of Bonn.
Mr von Maltzan is currently a member of EFG International’s Board-delegated Risk, Acquisition and Remuneration & Nomination Committees.
Daniel Zuberbühler is a Swiss citizen and was born in 1948. He was appointed as a member of the Board of Directors of EFG International and EFG Bank effective as of 25 April 2014.
Mr Zuberbühler formerly worked as Senior Financial Consultant, Director, Audit Financial Services, KPMG Zurich (2012–2013). Previously, he was Vice-Chair of the Board of Directors of FINMA, the Swiss Financial Market Supervisory Authority from 2009 to 2011.
Prior to this, he held a variety of senior roles in a long career with the Swiss Federal Banking Commission, including as CEO (1996–2008). He has been a member of numerous international committees, including the Basel Committee on Banking Supervision, the Financial Stability Board, Standing Committee on Supervisory and Regulatory Cooperation, International Organisation of Securities Commissions, Technical Committee, and the Financial Action Task Force on Money Laundering.
Mr Zuberbühler is a member of the Board of Directors of Banca Popolare di Sondrio (Suisse) SA in Lugano, and he is a member of the Advisory Board of Steinmann-Stiftung Schloss Wyl, Switzerland. In addition, he is a member of the
Annual Report 2018 | 33
Board of Directors of Gmür’sche Familienstiftung, Switzerland, and he sits in the Board of Directors of Law and Economics Foundation St Gallen, Switzerland.
Mr Zuberbühler studied law at the University of Berne and business at the City of London Polytechnic. He is a qualified Berne attorney.
Mr Zuberbühler is currently a member of EFG International’s Board-delegated Audit and Risk Committees.
3.2 External mandates and vested interests
Please refer to the information provided in the biographies of each member of the Board of Directors in section 3.1 above, where the significant activities in governing and supervising bodies of important organisations, institutions and foundations are mentioned.
3.3 Provisions on the number of permitted external mandates in the Articles of Association
In accordance with Art. 12 para. 1 point 1 of the Ordinance, the number of permitted external mandates of the members of the Board of Directors is outlined in Art. 37 of the Articles of Association*. The members of the Board of Directors may each have up to 20 mandates, of which a maximum of five may be in listed companies. Additionally, a member of the Board of Directors may perform up to ten mandates in associations, charitable institutions as well as welfare and pension institutions. Each of these mandates is subject to Remuneration & Nomination Committee approval.
3.4 Elections and terms of office
According to Art. 26 of the Articles of Association*, the Board of Directors consists of at least five members, who are individually elected by the general meeting of shareholders for one-year terms with the possibility of being re-elected. Furthermore, there is no limit to the numbers of terms and the term of office ends at the closure of the next Annual General Meeting. Please refer to the biographies of the members of the Board of Directors in section 3.1 above for
each initial date of election. The tenure of all the current members of the Board of Directors will expire at the closure of the Annual General Meeting 2019, at which time the members of the Board of Directors will be subject to re-election by the shareholders.
In application of the Ordinance, the general meeting of shareholders also elects the Chair of the Board of Directors and all members of the Remuneration & Nomination Committee individually and on an annual basis (see Art. 17 of the Articles of Association*).
3.5 Internal organisational structure
The internal organisational structure is laid down in the Organisational and Management Regulations**. The Board of Directors meets as often as business requires, but at least four times a year, normally once every quarter. Members of the Executive Committee, managerial staff and external advisors may be called upon to attend a Board of Directors’ meeting. In order to make a binding decision, at least 50% of the members of the Board of Directors must be present. The Board of Directors takes decisions by a majority of the members present. In the event of a tie, the Chair does not have a casting vote. The composition of the Board of Directors and its committees is disclosed in the organigram on page 21 (Board of Directors and Board-delegated Committees).
* See www.efginternational.com/articlesofassociation ** See www.efginternational.com/internalregulations
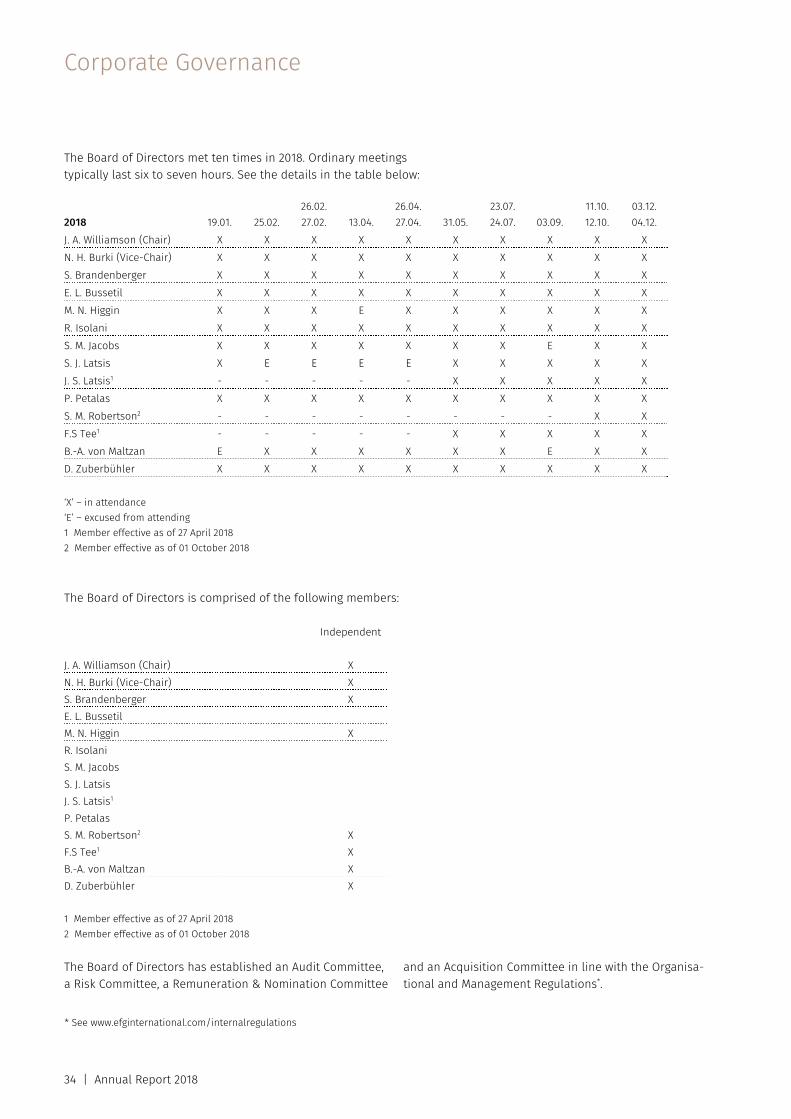
Corporate Governance
34 | Annual Report 2018
The Board of Directors met ten times in 2018. Ordinary meetings typically last six to seven hours. See the details in the table below:
2018
19.01. 25.02. 26.02. 27.02. 13.04.
26.04. 27.04. 31.05.
23.07. 24.07. 03.09.
11.10. 12.10.
03.12. 04.12.
J. A. Williamson (Chair) X X X X X X X X X X N. H. Burki (Vice-Chair) X X X X X X X X X X S. Brandenberger X X X X X X X X X X E. L. Bussetil X X X X X X X X X X M. N. Higgin X X X E X X X X X X R. Isolani X X X X X X X X X X S. M. Jacobs X X X X X X X E X X S. J. Latsis X E E E E X X X X X J. S. Latsis1 - - - - - X X X X X P. Petalas X X X X X X X X X X S. M. Robertson2 - - - - - - - - X X F.S Tee1 - - - - - X X X X X B.-A. von Maltzan E X X X X X X E X X D. Zuberbühler X X X X X X X X X X ‘X’ – in attendance ‘E’ – excused from attending 1 Member effective as of 27 April 2018 2 Member effective as of 01 October 2018 The Board of Directors is comprised of the following members: Independent
J. A. Williamson (Chair) X N. H. Burki (Vice-Chair) X S. Brandenberger X E. L. Bussetil M. N. Higgin X R. Isolani S. M. Jacobs S. J. Latsis J. S. Latsis1 P. Petalas S. M. Robertson2 X F.S Tee1 X B.-A. von Maltzan X D. Zuberbühler X 1 Member effective as of 27 April 2018 2 Member effective as of 01 October 2018 The Board of Directors has established an Audit Committee, a Risk Committee, a Remuneration & Nomination Committee
and an Acquisition Committee in line with the Organisa-tional and Management Regulations*.
* See www.efginternational.com/internalregulations
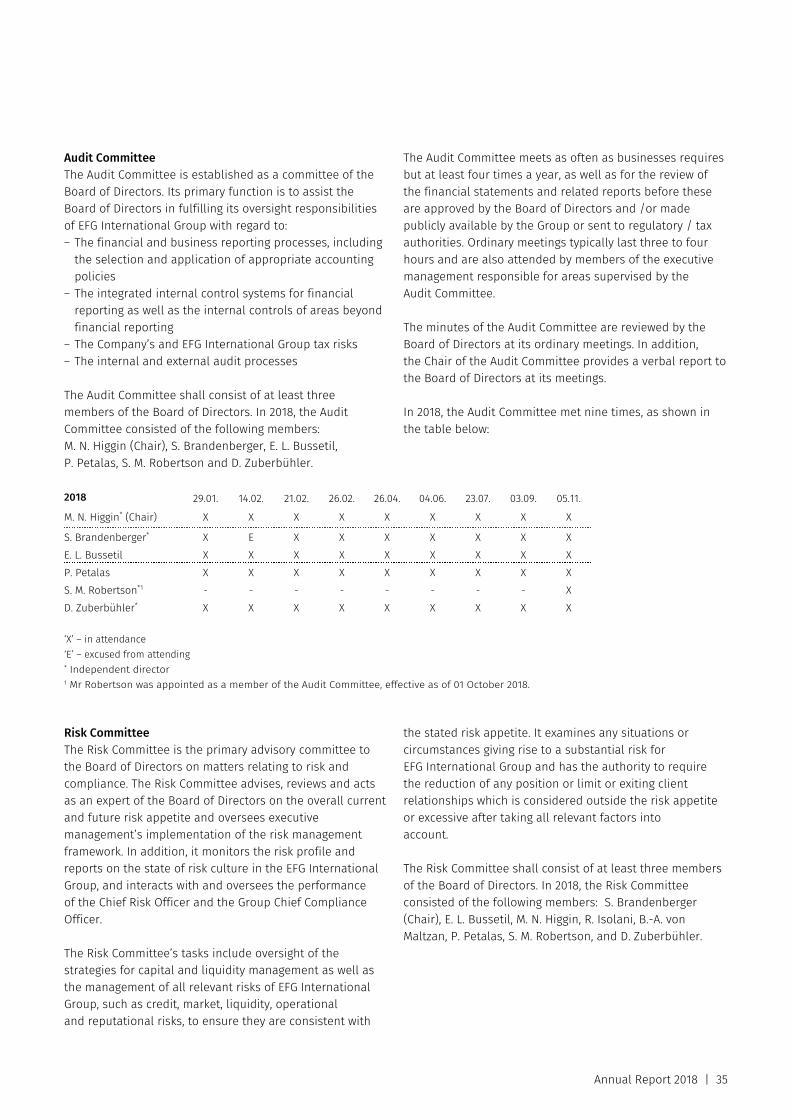
Annual Report 2018 | 35
Audit Committee The Audit Committee is established as a committee of the Board of Directors. Its primary function is to assist the Board of Directors in fulfilling its oversight responsibilities of EFG International Group with regard to: – The financial and business reporting processes, including
the selection and application of appropriate accounting policies
– The integrated internal control systems for financial reporting as well as the internal controls of areas beyond financial reporting
– The Company’s and EFG International Group tax risks – The internal and external audit processes
The Audit Committee shall consist of at least three members of the Board of Directors. In 2018, the Audit Committee consisted of the following members: M. N. Higgin (Chair), S. Brandenberger, E. L. Bussetil, P. Petalas, S. M. Robertson and D. Zuberbühler.
The Audit Committee meets as often as businesses requires but at least four times a year, as well as for the review of the financial statements and related reports before these are approved by the Board of Directors and /or made publicly available by the Group or sent to regulatory / tax authorities. Ordinary meetings typically last three to four hours and are also attended by members of the executive management responsible for areas supervised by the Audit Committee.
The minutes of the Audit Committee are reviewed by the Board of Directors at its ordinary meetings. In addition, the Chair of the Audit Committee provides a verbal report to the Board of Directors at its meetings.
In 2018, the Audit Committee met nine times, as shown in the table below:
2018 29.01. 14.02. 21.02. 26.02. 26.04. 04.06. 23.07. 03.09. 05.11.
M. N. Higgin* (Chair) X X X X X X X X X
S. Brandenberger* X E X X X X X X X E. L. Bussetil X X X X X X X X X P. Petalas X X X X X X X X X S. M. Robertson*1 - - - - - - - - X D. Zuberbühler* X X X X X X X X X ‘X’ – in attendance ‘E’ – excused from attending * Independent director 1 Mr Robertson was appointed as a member of the Audit Committee, effective as of 01 October 2018. Risk Committee The Risk Committee is the primary advisory committee to the Board of Directors on matters relating to risk and compliance. The Risk Committee advises, reviews and acts as an expert of the Board of Directors on the overall current and future risk appetite and oversees executive management’s implementation of the risk management framework. In addition, it monitors the risk profile and reports on the state of risk culture in the EFG International Group, and interacts with and oversees the performance of the Chief Risk Officer and the Group Chief Compliance Officer.
The Risk Committee’s tasks include oversight of the strategies for capital and liquidity management as well as the management of all relevant risks of EFG International Group, such as credit, market, liquidity, operational and reputational risks, to ensure they are consistent with
the stated risk appetite. It examines any situations or circumstances giving rise to a substantial risk for EFG International Group and has the authority to require the reduction of any position or limit or exiting client relationships which is considered outside the risk appetite or excessive after taking all relevant factors into account.
The Risk Committee shall consist of at least three members of the Board of Directors. In 2018, the Risk Committee consisted of the following members: S. Brandenberger (Chair), E. L. Bussetil, M. N. Higgin, R. Isolani, B.-A. von Maltzan, P. Petalas, S. M. Robertson, and D. Zuberbühler.
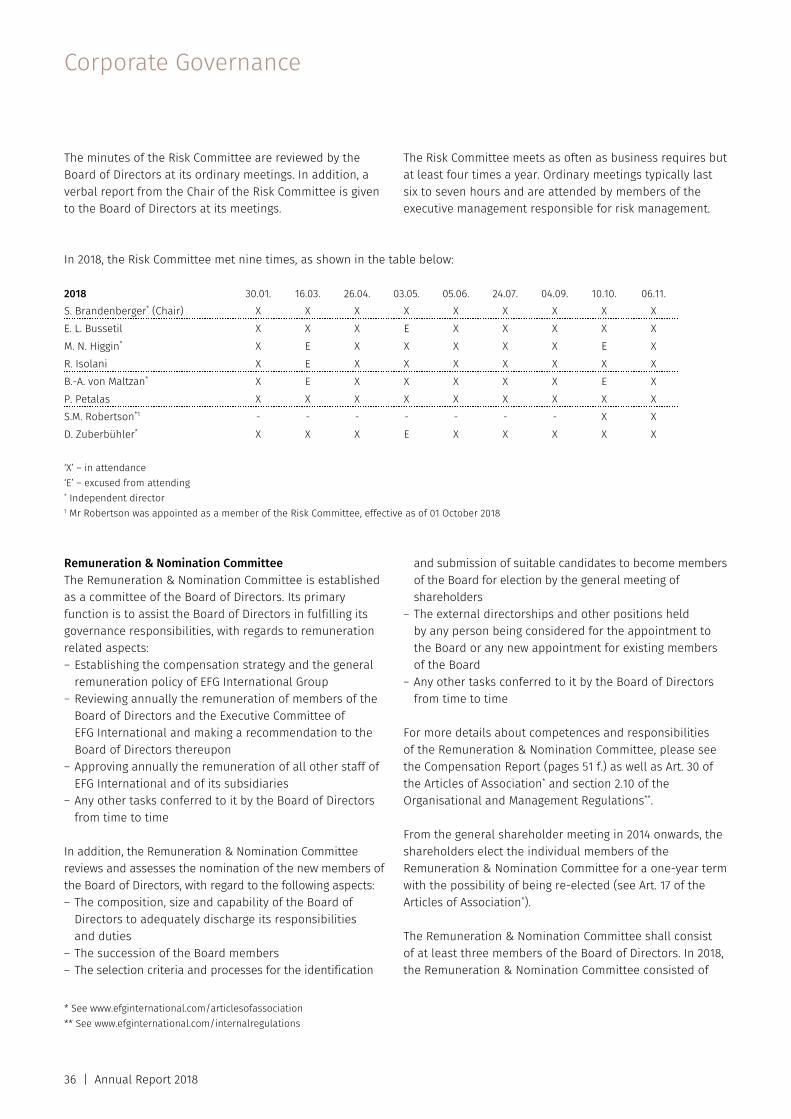
Corporate Governance
36 | Annual Report 2018
The minutes of the Risk Committee are reviewed by the Board of Directors at its ordinary meetings. In addition, a verbal report from the Chair of the Risk Committee is given to the Board of Directors at its meetings.
The Risk Committee meets as often as business requires but at least four times a year. Ordinary meetings typically last six to seven hours and are attended by members of the executive management responsible for risk management.
In 2018, the Risk Committee met nine times, as shown in the table below: 2018 30.01. 16.03. 26.04. 03.05. 05.06. 24.07. 04.09. 10.10. 06.11. S. Brandenberger* (Chair) X X X X X X X X X
E. L. Bussetil X X X E X X X X X
M. N. Higgin* X E X X X X X E X
R. Isolani X E X X X X X X X
B.-A. von Maltzan* X E X X X X X E X
P. Petalas X X X X X X X X X
S.M. Robertson*1 - - - - - - - X X D. Zuberbühler* X X X E X X X X X ‘X’ – in attendance ‘E’ – excused from attending * Independent director 1 Mr Robertson was appointed as a member of the Risk Committee, effective as of 01 October 2018 Remuneration & Nomination Committee The Remuneration & Nomination Committee is established as a committee of the Board of Directors. Its primary function is to assist the Board of Directors in fulfilling its governance responsibilities, with regards to remuneration related aspects: – Establishing the compensation strategy and the general
remuneration policy of EFG International Group – Reviewing annually the remuneration of members of the
Board of Directors and the Executive Committee of EFG International and making a recommendation to the Board of Directors thereupon
– Approving annually the remuneration of all other staff of EFG International and of its subsidiaries
– Any other tasks conferred to it by the Board of Directors from time to time
In addition, the Remuneration & Nomination Committee reviews and assesses the nomination of the new members of the Board of Directors, with regard to the following aspects: – The composition, size and capability of the Board of
Directors to adequately discharge its responsibilities and duties
– The succession of the Board members – The selection criteria and processes for the identification
and submission of suitable candidates to become members of the Board for election by the general meeting of shareholders
– The external directorships and other positions held by any person being considered for the appointment to the Board or any new appointment for existing members of the Board
– Any other tasks conferred to it by the Board of Directors from time to time
For more details about competences and responsibilities of the Remuneration & Nomination Committee, please see the Compensation Report (pages 51 f.) as well as Art. 30 of the Articles of Association* and section 2.10 of the Organisational and Management Regulations**.
From the general shareholder meeting in 2014 onwards, the shareholders elect the individual members of the Remuneration & Nomination Committee for a one-year term with the possibility of being re-elected (see Art. 17 of the Articles of Association*).
The Remuneration & Nomination Committee shall consist of at least three members of the Board of Directors. In 2018, the Remuneration & Nomination Committee consisted of
* See www.efginternational.com/articlesofassociation ** See www.efginternational.com/internalregulations

Annual Report 2018 | 37
the following members: N. H. Burki (Chair), E. L. Bussetil, S. M. Jacobs, B.-A. von Maltzan, P. Petalas and J. A. Williamson.
The Remuneration & Nomination Committee meets annually in the first quarter to review fixed and variable compensation proposals. Additional meetings can be held when necessary. Meetings typically last two hours and are attended by the CEO and the Global Head of Human Resources.
The minutes of the Remuneration & Nomination Committee are reviewed by the entire Board of Directors. In addition, a verbal report by the Chair of the Remuneration & Nomination Committee is given to the Board of Directors at its meetings.
In 2018, the Remuneration & Nomination Committee met ten times, as shown in the table below:
2018 29.01. 30.01.
26.02. 12.04. 27.04. 15.06. 24.07. 09.08. 17.09. 12.10. 03.12.
N. H. Burki (Chair)* X X X X X X X X X X
E. L. Bussetil X X X X X X X X X X S. M. Jacobs X E X X X X X X E X B.-A. von Maltzan*1 X X X X X X X E X X P. Petalas X X X X X X X X X X J. A. Williamson* X X X X X X X X X X ‘X’ – in attendance ‘E’ – excused from attending * Independent director Acquisition Committee The Acquisition Committee is established as a committee of the Board of Directors. Its primary function is to examine and approve or recommend to the Board of Directors all acquisitions of companies or businesses proposed by management in accordance with the acquisition policy approved by the Board of Directors. The Acquisition Committee has the authority to approve all investments with a purchase price below or equal to the threshold set in the acquisition policy (based on the Acquisition Committee’s estimate at the time of acquisition in the case of transactions where the purchase price is defined in earn-out terms). Above this threshold, only the Board of Directors may approve acquisitions, and the Acquisition Committee will submit a recommendation to the Board of Directors.
The Acquisition Committee shall consist of at least three members of the Board of Directors. In 2018, the Acquisition
Committee consisted of the following members: E. L. Bussetil (Chair), S. M. Jacobs, B.-A. von Maltzan, P. Petalas and J. A. Williamson.
The Acquisition Committee meets on an ad hoc basis throughout the year in order to review specific transactions or to receive an update from the CEO and the CFO regarding the status of negotiations with various acquisition targets. It also reviews and approves management proposals for divestments. Meetings vary in length from one to three hours and can be attended by members of the management or external advisors.
The Acquisition Committee met three times in 2018. See the details in the table below.
Additionally, the Acquisition Committee has reviewed several transactions during the year.

Corporate Governance
38 | Annual Report 2018
2018 E. L. Bussetil (Chair)
27.04. X
24.07. X
10.12. X
S. M. Jacobs X X X B.-A. von Maltzan* X X X P. Petalas X X X J. A. Williamson* X X X ‘X’ – in attendance ‘E’ – excused * Independent director The minutes of the Acquisition Committee are reviewed by the entire Board of Directors at its meetings. In addition, a verbal report from the Chair of the Acquisition Committee is given to the Board of Directors at its meetings.
3.6 Definition of areas of responsibility
The Board of Directors of EFG International is ultimately responsible for supervision of the management of EFG International. The Board of Directors sets the strategic direction of EFG International and monitors its implementation.
Details of the powers and responsibilities of the Board of Directors can be found in the Organisational and Management Regulations*.
The Board of Directors has delegated the operational management of EFG International Group to the CEO and the Executive Committee. Members of the Executive Committee are appointed by the Board of Directors upon recommen-dation by the CEO. Members of the Executive Committee, under the responsibility of the CEO and the control of the Board of Directors, manage the operations of EFG International Group, pursuant to applicable internal regulations and report thereon to the Board of Directors on a regular basis.
EFG International Executive Committee The Executive Committee is responsible for the Company’s and EFG International Group’s overall strategy, within the respective parameters established by the Board of Directors, and is accountable for all operational and organisational matters as well as for the operating results. The Executive Committee is responsible for the day-to-day activities of the Company.
Consistent with direction given by the Board of Directors, the Executive Committee is responsible for implementing business strategies, risk management systems, risk culture, processes and controls for managing the risks – both financial and non-financial – to which the Company and EFG International Group is exposed and concerning which it is responsible for complying with laws, regulations and internal policies.
Details of the powers and responsibilities of the Executive Committee can be found in the Organisational and Management Regulations*.
Organisational details of the Executive Committee can be found in section 4.1.
Information and control instruments vis-à-vis the Executive Committee The Board of Directors supervises the management of EFG International through various meetings with management, including meetings of the Board of Directors and its committees. The CEO, deputy-CEO and Chief Financial Officer (and other members of the Executive Committee depending on the topics under review) attend the Board of Directors’ meetings during the year and are available to answer questions from the Board of Directors. The CEO provides a written report to the Board of Directors at each ordinary meeting summarising developments in the business. The CEO is also readily available to answer questions from the Board of Directors.
In addition, the Chief Financial Officer (CFO) reports on the financial results to the Board of Directors at each ordinary meeting. Additional reporting to the Board of Directors includes financial reporting, business reporting, business proposals, approvals, staff matters, credit approvals, reports from the various Board-delegated committees, a
* See www.efginternational.com/internalregulations
Annual Report 2018 | 39
report on claims and litigations and any other business matters. Members of the management responsible for the finance and accounting functions, including the CFO, attend the Audit Committee meetings and are available to answer questions from the committee relating to the financial statements.
The Group Chief Compliance Officer attends the Risk Committee meetings and is available to answer questions relating to compliance issues.
The Chief Risk Officer provides oversight of all major areas of risk within EFG International Group. He also provides an update on the overall key risk aspects of EFG International at each regular meeting of the Risk Committee and provides an annual written risk assessment to the Audit Committee. The members of management responsible for credit, market, bank and country risk management attend the Financial Risk Committee meetings as well. Please also see the information about risk management on pages 89 ff.
Internal audit services are provided to EFG International by the Audit Services Department (ASD) which is governed by an internal audit charter duly approved by the Audit Committee. In accordance with the Organisational and Management Regulations* and the Internal Audit Charter, the mission of internal audit is to support the Board of Directors in their statutory responsibility for ensuring that the operations of EFG International Group are conducted according to the highest standards by providing an independent, objective assurance function and by advising on best practice. ASD provides copies of all internal audit reports to the external auditors, and maintains a dialogue with the external auditors to share risk issues arising from their respective audits. Through a systematic and disciplined approach, internal audit helps EFG International Group accomplish its objectives by evaluating the effectiveness of risk management, control and governance processes and making recommendations for improvement. To ensure independence, internal audit reports directly to the Audit Committee, which reports on its activities to the Board of Directors. The chief internal auditor has, for the purpose of performing his duties, the right of unlimited access to all information, premises, resources and people necessary for the performance of internal audits.
4. Executive Committee
4.1 Organisation and functional responsibilities
EFG International Executive Committee is organised as a single structure, reporting to the CEO and to the Deputy CEO respectively. Please see also the organisational chart of the Executive Committee on page 22.
The Executive Committee comprises at least four members. Various support services or control units report either directly to the CEO or to a member of the Executive Committee.
The titles and brief functional descriptions for members of the Executive Committee are set forth as follows:
Chief Executive Officer The Chief Executive Officer (CEO) of EFG International is responsible to the Board of Directors for the overall management and performance of EFG International Group. He manages the implementation and development of strategic and operational plans as approved by the Board of Directors. He represents EFG International Group towards third parties and regulators and is responsible (together with the Board of Directors and other senior executives) towards the FINMA for the prudent management and regulation-compliant operation of the organisation.
Furthermore, the CEO chairs the Executive Committee and the Global Business Committee and directly oversees the Litigation, Human Resources and Marketing & Communications functions.
Deputy Chief Executive Officer The Deputy CEO has a direct reporting line to the CEO of EFG International. He supports the CEO with the day-to-day management of EFG International Group and can take over his responsibilities in case of absence.
Chief Financial Officer The Chief Financial Officer (CFO) is responsible for all financial, tax and prudential regulation matters of EFG International Group as well as other business or control areas allocated to the position. He ensures transparent and timely financial reporting for internal and regulatory purposes as well as public reporting in line with legal and regulatory requirements and industry best practices.
The CFO has the oversight of liquidity and capital management within the general regulations and guidelines
* See www.efginternational.com/internalregulations
Corporate Governance
40 | Annual Report 2018
set by FINMA and other regulators in jurisdictions where the EFG International Group operates, by the Board of Directors, the Audit Committee and the Risk Committee. The CFO oversees and monitors business performance, strategic acquisitions, and the EFG International Group’s relationship with rating agencies. He also has primary responsibility for the Investor Relations, Legal, Regulatory Affairs, and Group Corporate Office functions. In addition, he supervises the activities of Global Treasury, Financial Reporting and Financial Planning.
Chief Operating Officer The Chief Operating Officer is responsible for the management, coordination, supervision, planning and control of Operations, Central Filing, IT, General Services and Client Tax Reporting of EFG International Group. He is also responsible for the cost management program across the organization. Chief Risk Officer The Chief Risk Officer is accountable for enabling the Group’s efficient and effective risk governance. The CRO is accountable to the Executive Committee, the Board of Directors and the Risk Committee for enabling the business to balance risk and reward. In the same regard, he is responsible for coordinating the Risk Management approach and for assessing and causing mitigating actions to significant competitive, regulatory, and technological threats to a firm's capital and earnings. The responsibilities also include managing, identifying, evaluating, reporting and overseeing the firm's risks externally and internally to ensure a functioning internal control system.
Chief Compliance Officer The Chief Compliance Officer is responsible for the management, coordination and supervision of the consolidated compliance risks of EFG International Group. He supervises the Compliance activities deployed in the entities of EFG International Group. In this function, he also reports to the Risk Committee of EFG International’s Board.
Head of Investment Solutions The head of Investment Solutions is responsible for EFG International Group’s global investment activities covering all discretionary and advisory mandates, research and all funds managed by EFG International Group’s Asset Management. He is also responsible for Credit Solutions and all Wealth Solutions activities covering Private Client Trust and Fund Administration services.
4.2 Members of the Executive Committee
Piergiorgio Pradelli Chief Executive Officer
Piergiorgio Pradelli was appointed Chief Executive Officer of EFG International and EFG Bank, effective as of 01 January 2018. He is also a member of the Board of
Directors of EFG International’s subsidiaries EFG Bank (Monaco), EFG Private Bank Limited (UK), EFG Investment and Wealth Solutions Holding AG and Patrimony 1873 SA.
Prior to his appointment as CEO, Mr Pradelli held the role of Deputy CEO and CFO of EFG International and EFG Bank since January 2014 and June 2012, respectively. Before joining EFG International, Mr Pradelli was head of International Operations at Eurobank Ergasias SA and member of the Executive Committee, from 2006 until 2012. Prior to this, he served as Deputy Finance Director in London for EFG Bank European Financial Group SA, from 2003 to 2006, participating in major EFG Bank European Financial Group SA restructuring and strategic initiatives, notably the initial public offering of EFG International in 2005.
Mr Pradelli started his career at Deutsche Bank, working in a number of senior management positions including head of Private & Business Banking in Italy, and head of Business Development for the Private Clients and Asset Management Group in Frankfurt and London from 1991 until 2003.
Mr Pradelli is an Italian citizen, was born in 1967, and has a degree in economics and business administration from the University of Turin, Italy.
Renato Cohn Deputy CEO and Head of Investment Solutions
Renato Cohn was appointed Deputy CEO of EFG International and EFG Bank, effective as of 01 January 2018. Mr Cohn is also head
of Investment Solutions and a member of the Executive Committee of EFG International and EFG Bank, since 31 October 2016.
From 2009 until 2015, he was co-head of BTG Pactual Wealth Management in São Paulo. Before that, he served in senior positions as head of Product and Services and head of Sales Management at UBS Pactual. He joined Banco Pactual in 1999 and became a partner in 2004. He started his career
Annual Report 2018 | 41
at Banco Primus, and then worked at Banco Matrix as head of the Fixed Income Trading Desk.
Mr Cohn is a Brazilian citizen and was born in 1972. He holds a Bachelor of Science in industrial engineering from the Escola Politécnica of the University of São Paulo.
Vittorio Ferrario Chief Compliance Officer
Vittorio Ferrario is Chief Compliance Officer and a member of the Executive Committee of EFG International and EFG Bank AG since 01 August 2017. After having successfully
completed the BSI integration and substantially strengthened EFG’s regulatory compliance framework, Mr Ferrario has decided to leave EFG at the end of the first quarter of 2019.
Mr Ferrario joined EFG in May 2014 as Chief Compliance Officer. As EFG representative, he acted as a member of the Group Executive Board of BSI Bank from November 2016 until April 2017 during the integration process of EFG with BSI. Before joining EFG, he worked as an independent provider of compliance and operational risk advisory services for wealth and asset management from 2012 to 2014. Previously, from 2004 to 2011, he worked at Unigestion SA in Geneva, where he was head of Compliance and Operational Risk for the Group. From 2001 to 2004, he held the role of Regional Compliance Manager at Goldman Sachs & Co Bank, located in both Zurich and Geneva. From 1989 to 2001, Mr Ferrario worked at PricewaterhouseCoopers, where he held various senior positions in audit and consulting for financial services firms in Europe and Asia.
Mr Ferrario was born in 1967 and is a Swiss citizen. He holds a degree in commercial and industrial science with a focus on finance from the University of Geneva and is a Chartered Certified Accountant.
Christian Flemming Chief Operating Officer
Christian Flemming is the Chief Operating Officer (COO) and a member of the Executive Committee of EFG International and EFG Bank AG since 15 January 2018. In
his role as COO, his responsibilities encompass the overall Operations, Central Filing, IT, General Services and Client Tax Reporting of EFG International Group. Mr Flemming is also responsible for further improving EFG’s efficiency as well as the continuous development of the bank’s servicing
platform. Previous to his position as COO, Mr Flemming was head of Finance at Banco BTG Pactual SA and before that COO at BSI until the acquisition by EFG. He also worked at Banco BTG Pactual SA as COO of the Investment Banking division and, amongst others, was a member of the Board of Directors of Banco BTG Pactual Chile. Before joining BTG Pactual, Christian Flemming worked in Investment Banking for Pátria Banco de Negócios and as a consultant for Stern Stewart & Co in São Paulo.
Mr Flemming is a German citizen and was born in 1975. He holds a Bachelor of Science in Business Administration from EAESP, Fundação Getúlio Vargas as well as a Bachelor of Science in Engineering from the Escola de Engenharia, Universidade Mackenzie in São Paulo, Brazil.
Dimitris Politis Chief Financial Officer
Dimitris Politis is the Chief Financial Officer (CFO) of EFG International and EFG Bank AG and a member of the respective Executive Committees since 01 January 2018. In his
role as CFO, his responsibilities encompass, apart from the Finance and Planning functions, the Global Treasury, Regulatory Affairs, Legal and the Investor Relations functions. From 10 November to 31 December 2018, Mr Politis on an interim basis also held the role of Chief Risk Officer.
Previous to his position as CFO, Dimitris Politis held the role of Chief Financial Officer at SETE SA (Geneva) and was also responsible for the oversight of strategic investments in the organisation’s corporate entities, including EFG International. Mr Politis has been with the EFG Group since 1999, when he first joined EFG Eurobank Ergasias SA, where he was a member of the senior management team and was involved in key strategic decisions and initiatives. Before joining SETE SA in 2013, he last held the role of General Manager, head of Strategy and Investor Relations. Prior to joining the EFG Group, Mr Politis started his career in 1995 at the Charles River Associates management consulting firm.
Mr Politis is a Greek citizen and was born in 1971. He holds a MBA degree from INSEAD in France, as well as a master’s degree in science from the Massachusetts Institute of Technology in Boston (Technology & Policy programme) and a bachelor’s degree in aeronautical engineering from the Imperial College in London.
Corporate Governance
42 | Annual Report 2018
Former members of the Executive Committee who stepped down in 2018 Thomas A. Mueller Chief Risk Officer
Thomas A. Mueller was Chief Risk Officer (CRO) of EFG International and EFG Bank until 10 November 2018. In this role, he was also a member of the respective Executive Committees since 01 January 2018 and was responsible for the Risk functions including credit, market and operational risk.
Prior to his appointment as CRO at EFG International, Mr Mueller was Chief Executive Officer of BSI SA since 01 November 2016. Before that, he held the role of Group Chief Financial Officer at Bank J. Safra Sarasin & Co., where he was also a member of the Executive Committee, from 2010 to 2016. Between 2006 and 2009, he was Group Chief Financial Officer & Chief Risk Officer at Swiss Life, and from 2002 to 2005 Chief Financial & Risk Officer at Banca del Gottardo in Lugano, Switzerland, which was later acquired by BSI.
Mr Mueller’s professional career began in 1991 at Swiss Volksbank where he was responsible for asset and liability management. Up to and after the integration of Swiss Volksbank into Credit Suisse Group, he headed the treasury department from 1994 to 1997. Between 1997 and 2000, he worked at Marc Rich Holding and was responsible for the Group’s trading in interest rates instruments.
Mr Mueller is a Swiss citizen and was born in 1965. He holds a MBA degree from the IMD business school in Lausanne, Switzerland, as well as a master’s degree in economics from the University of Berne, Switzerland.
Peter Fischer Head of Strategy
Peter Fischer was head of Strategy of EFG International until 14 January 2018. He was also a member of the Executive Committee of EFG International and EFG Bank since January 2016. In this capacity, the Human Resources, Marketing & Communications and Special Projects functions reported to him. He also served as a member of the Board of Directors of BSI SA and BSI Holdings AG and EFG Capital Holdings Corp.
Mr Fischer joined EFG International in June 2015 as Manager Special Projects. He has extensive professional experience in project and line management. He worked at Bank Sarasin
& Cie and later Bank J. Safra Sarasin from 2000 until 2015, where he held a number of leadership positions including Chief of Staff & Corporate Development. Prior to that, Mr Fischer headed various front office and staff functions at Credit Suisse and UBS in Switzerland, Europe, Asia and the US.
Mr Fischer is a Swiss citizen and was born in 1958. He is a graduate of the Business School of Zurich (Expert of Business Administration KSZH).
Other changes:
In context of the realignment of the Group’s executive leadership structure, the following members stepped down from EFG International’s Executive Committee and joined the newly formed Global Business Committee effective as of 01 July 2018 (see also section 5 below): Mark Bagnall, Chief Technology Officer; Albert Chiu, Head of Asia Region; Sir Anthony Cooke-Yarborough, Head of UK Region until 02 January 2019 and Private Banking Chairman since that date; Marcello Coscarelli, Head of Latin America Region; Adrian Kyriazi, Head of Continental Europe Region; Maurizio Moranzoni, Head of Global Markets and Franco Polloni, Head of Switzerland & Italy Region.
New members of the Executive Committee in 2019
Ranjit Singh Chief Risk Officer
Ranjit Singh was appointed Chief Risk Officer of EFG International and EFG Bank and member of the Executive Committee, effective as of 01 January 2019. In his role,
he is responsible for overseeing and further enhancing EFG’s global Risk function and reports directly to the CEO.
Prior to joining EFG, Mr Singh served as Group Chief Risk Officer on the Group Executive Board of Standard Life Aberdeen Plc in Edinburgh and London from 2013 to 2018.
Prior to that, he served as Group Chief Risk Officer of Swiss Re AG in Zurich, Switzerland, where he was also a member of the Executive Board and Committee, from 2007 to 2011.
From 2002 to 2007, he held the position of Group Chief Risk Officer at Allianz SE in Munich, Germany, where he was also a member of the Group Management. Before joining Allianz, Mr Singh worked at Citigroup from 1989 to 2001, holding several senior management positions in Germany, Belgium, the United Kingdom and the USA.
Annual Report 2018 | 43
Mr Singh is a US citizen and was born in 1962. He has a Bachelor of Science in Business Administration from Winona State University in Minnesota, USA, and a Master of Business Administration in International Management from the Thunderbird School of Global Management in Arizona, USA.
Yves Aeschlimann Head of Legal & Compliance
Yves Aeschlimann will join EFG as group head of Legal & Compliance of EFG International and EFG Bank and member of the Executive Committee, effective as of 01 March 2019. In this new role, he will oversee the combined Legal & Compliance division and will be responsible for further enhancing EFG’s regulatory compliance framework.
Prior to joining EFG, Mr Aeschlimann served as group head of Legal and Compliance and as a member of the Executive Committee at Edmond de Rothschild (Suisse) SA since 2013. Prior to that, he worked as a Senior Financial Sector Specialist in Financial Market Integrity for the World Bank in Washington DC and spent eight years at the Geneva Criminal Justice Department as Investigating Magistrate from 2001 to 2009. Mr Aeschlimann is a registered barrister and started his career as a practising attorney in Geneva.
Mr Aeschlimann is a Swiss citizen and was born in 1967. He holds a Master of Law from the University of Geneva, where he also worked as a research assistant for three years. Since 2016, he is an Adjunct Professor of Law at the Case Law University in Cleveland, Ohio.
5. Global Business Committee (GBC)
5.1 Organisation and functional responsibilities
In July 2018, the EFG International Executive Committee created the EFG International Global Business Committee (GBC), with an advisory role in assessing and validating business strategies, key business aspects and priorities as well as in debating industry trends and issues. The GBC consists of the members of EFG International Executive Committee, the Regional heads and selected Senior Managers (see the organisational chart on page 22).
The titles and brief functional descriptions for members of the Global Business Committee are set forth as follows:
Head of Global Markets The head of the Global Markets division is responsible for the trading and execution in all the different asset classes
on the financial markets for EFG International Group worldwide. The position requires the participation to various executive delegated committees like the Asset & Liability Committee, the Country & Counterparties Risk Sub-Committee, the Group Product Committee and the Financial Risk Committee.
Head of Continental Europe Region The head of Continental Europe Region assumes regional business responsibility for the private banking business in Continental Europe as well as in EFG Middle Eastern and Eastern Mediterranean target markets.
Head of Switzerland & Italy Region The head of Switzerland & Italy Region is responsible for the development of the Swiss domestic market, the Italian market and for the External Asset Management segment.
Head of UK Region The head of the United Kingdom Region assumes regional business responsibility for the private banking activities of EFG International Group in the United Kingdom and the Channel Islands.
Head of Asia Region The head of Asia Region assumes regional business responsibility for the private banking activities of EFG International Group in the Asia region.
Head of Latin America Region The head of Latin America Region has functional regional business responsibility for the presence and for the wealth management activities of EFG International Group in the Americas, consisting mostly of Latin American clients.
Chief Technology Officer The Chief Technology Officer is responsible for overseeing all aspects of EFG International Group’s IT platform, infrastructure and data security globally, with particular focus on the ongoing investments in digital strategy which is designed to take the existing strategic IT platform to the next level.
Private Banking Chairman The Private Banking Chairman reports directly to the CEO and works with Regional Business heads and their heads of Private Banking to generate profitable and sustainable growth globally. This includes leading key client initiatives and supporting commercial activities, as well as recruitment and development of Client Relationship Officers.

Corporate Governance
44 | Annual Report 2018
5.2 Members of the Global Business Committee
Mark Bagnall Chief Technology Officer
Mark Bagnall was appointed the Chief Technology Officer of EFG International and EFG Bank effective as of 15 January
2018. He is a member of EFG International’s Global Business Committee, effective 01 July 2018, and is part of EFG Bank’s Executive Committee, since 01 January 2011. He was also Member of EFG International’s Executive Committee from 2011 to 30 June 2018. Previous to his role as Chief Technology Officer, Mr Bagnall held the role of Chief Operating Officer since January 2011 after joining EFG International in December 2008.
Prior to joining EFG, Mr Bagnall worked from 2004 to 2008 at Merrill Lynch in London and Geneva, where he was head of International Private Client & Wealth Management Technology, having previously held IT management roles in Capital Markets & Investment Banking in London and New York from 1998 to 2003. He started his career on the IT graduate programme with British Petroleum in 1989, before moving to JP Morgan in 1994.
Mr Bagnall is a British citizen and was born in 1967. He holds a Bachelor of Science in Mathematics and Computer Science from Liverpool University.
Albert Chiu Head of Asia Region
Albert Chiu was appointed head of EFG’s Asia Region in 2009. Since June 2018, he is the Executive Chairman and Regional
Business head of EFG Bank’s Asia Region. Mr Chiu is also a member of EFG Global Business Committee, effective as of 01 July 2018 and was a member of EFG International and EFG Bank’s Executive Committees from June 2016 to 30 June 2018.
Mr Chiu joined EFG Bank in 2000 and established EFG Bank’s private banking operations in Asia (with branches in Hong Kong and Singapore). Prior to joining EFG, Mr Chiu was Treasury Manager at HSBC Bank USA Hong Kong branch (1993–2000), and from 1987 until 1993 he worked for Citibank Hong Kong as Vice President of the Treasury Department.
Mr Chiu is a Hong Kong citizen, born in 1965, and holds a bachelor’s degree in business administration (Hons.) of the Chinese University of Hong Kong and completed the Advanced Management Program of Harvard Business School. He completed a diploma course at the Sophia University in Japan.
Sir Anthony Cooke-Yarborough Head of UK Region (until 02 January 2019)
Sir Anthony Cooke-Yarborough has been the head of EFG International’s UK Region until 02 January 2019. He is a member of
EFG International’s Global Business Committee, effective as of 01 July 2018 and was a member of EFG International’s Executive Committee from June 2016 to 30 June 2018.
He was CEO of EFG Private Bank Ltd, London, EFG International’s wholly owned subsidiary in United Kingdom until 02 January 2019, when he was appointed Private Banking Chairman of EFG International. He is also the Vice-Chair of the Board of Directors of EFG Private Bank Ltd, London.
He has been a member of the Board of Directors of EFG Private Bank Ltd, London, since 2010 (appointed Vice-Chair in January 2019), and until January 2019 he was a member of the Board of EFG International’s subsidiaries EFG Private Bank (Channel Islands) Ltd, Guernsey, and EFG Asset Management (UK) Ltd, London.
Sir Anthony joined EFG Private Bank Ltd in 2009 and served as head of Private Banking until his appointment as CEO in June 2011. From 2005 until 2009, he served as Chief Executive of Mourant Private Wealth, Jersey. Prior to that, he was head of UK Private Banking and CEO of Barclays Private Bank Ltd (2002–2005), and from 1997 to 2002, he served as Executive Director at Merrill Lynch International Bank, London, ultimately as deputy head of UK Private Client business. He started his career at Lloyds Bank International in 1980 and held various senior management positions in the USA and Latin America, ultimately as Director, International Investments, Brazil.
Sir Anthony is a British citizen, was born in 1956, and holds a degree in economics from Gonville & Caius College, Cambridge University.
Annual Report 2018 | 45
Marcelo Coscarelli Head of Latin America Region
Marcelo Coscarelli was appointed as head of EFG’s Latin America Region effective as of 01 January 2017. In addition, he is a
member of EFG International’s Global Business Committee, effective as of 01 July 2018 and was a member of EFG International and EFG Bank’s Executive Committees from June 2017 to 30 June 2018.
Before joining EFG, Mr Coscarelli worked at Citibank Latin America as Managing Director and head of the Wealth Management Business, covering international high-net-worth and affluent clients. From 2008 to 2012, he was Chief Operating Officer of Itaù Private Bank International, based in Miami. Before that, he worked at UBS as head of the Brazil Wealth Management Sales Desk in Zurich, and at Citigroup as head of Citigold Wealth Management for Europe, the Middle East and Africa, based in London. He also held different positions with the Citigroup Private Bank.
Mr Coscarelli was born in 1971 and is a Brazilian and US citizen. He holds an MBA from the University of Chicago, USA, and a bachelor’s degree in economics from the University of Campinas (UNICAMP) in São Paulo, Brazil.
Adrian Kyriazi Head of Continental Europe Region
Adrian Kyriazi is the head of EFG International’s Continental Europe Region and member of EFG International’s Global
Business Committee since 01 July 2018. He was a member of EFG International and EFG Bank’s Executive Committees from July 2014 to 30 June 2018.
He is also a member of the Board of Directors of EFG International’s subsidiaries EFG Investment (Luxembourg) SA, EFG Bank (Luxembourg) SA, Asesores y Gestores Financieros SA, A&G Banca Privada SA, EFG Bank (Monaco) and Oudart SA.
Mr Kyriazi was previously with Credit Suisse, where from 2010 to 2014 he was Managing Director, Market Group head for Greece, CEE/Poland. Prior to that, he spent nineteen years at HSBC in a variety of different roles, including: Managing Director, Private Banking and Co-CEO, HSBC Private Bank, Monaco; CEO of West Coast Region, USA, HSBC Private Bank; and CEO of Global Practices (encompassing
wealth and tax advisory, corporate finance, and family office), HSBC Private Bank.
Mr Kyriazi is a Greek citizen, was born in 1960, and holds a master’s degree in law from Robinson College, Cambridge University.
Maurizio Moranzoni Head of Global Markets
Mr Moranzoni was appointed head of Global Markets of EFG International and EFG Bank effective as of 31 October 2016.
He is also a member of EFG International’s Global Business Committee, effective as of 01 July 2018 and a member of the Executive Committee of EFG Bank since October 2016. He was also a member of EFG International’s Executive Committee from October 2016 to 30 June 2018. Prior to his current role, Mr Moranzoni was the global head of Capital Markets at BSI SA since 2003 and served as member of the Group Executive Board of BSI SA since September 2015.
Mr Moranzoni spent his entire career at BSI, where he started working in 1982 – first in the Forex Department and then covering various positions in the Capital Markets Area. In 1997, he was appointed as head of Treasury, Fixed Income & Securities Lending, and in 2003 he became head of Capital Markets. He is currently a member of the BSI SA Pension Fund Board.
Mr Moranzoni is a Swiss citizen and was born in 1960.
Franco Polloni Head of Switzerland & Italy Region
Franco Polloni is the head of EFG’s Switzerland & Italy Region. He is also a member of EFG International’s Global
Business Committee, effective 01 July 2018, and a member of the Executive Committee of EFG Bank AG since 05 May 2017. He was a member of EFG International’s Executive Committee from May 2017 to 30 June 2018. Mr Polloni joined EFG in May 2017 as head of Central Switzerland, Ticino & Italy Region. He is also a member of the Board of EFG’s International subsidiaries Oudart SA in Paris and EFG Bank (Luxembourg) SA.
Before joining EFG, Mr Polloni was head of Private Clients & Asset Management and member of the Executive Board of
Corporate Governance
46 | Annual Report 2018
Banca del Ceresio in Lugano, a role he took in December 2014. Between 2008 and 2014, he held various leadership positions at BSI and was head of Private Banking Switzerland and member of the Group Executive Board from 2011 to 2014. From 2001 to 2008, he worked at Banca del Gottardo, where he was appointed as member of the Executive Board in 2006 and served as head Products & Services until the bank’s integration into BSI in 2008. From 1997 to 2001, he has worked for Coopers & Lybrand (later PricewaterhouseCoopers) as manager in tax department advising international corporations and individuals. He began his career in 1993 with Ernst & Young in Zurich.
Mr Polloni is a Swiss citizen and was born in 1965. He holds a degree in business and economics from the University of Zurich and a diploma as a Swiss federal tax expert, a Trust & Estate Practitioner (TEP) and a Certified Financial Planner (CFP).
New members of the Global Business Committee in 2019
Richard Thomas Head of UK Region
Richard Thomas was appointed the head of EFG International’s UK Region and member of the Global Business Committee, effective as of 02 January 2019. In addition, he is a
member of the Board of Directors and CEO of EFG Private Bank Ltd, London, EFG International’s wholly owned subsidiary in United Kingdom.
Prior to joining EFG, Mr Thomas worked at Barclays UK, where he last held the role of Chief Operating Officer, Savings, Wealth and Investments. He joined Barclays in 2008 and served as Chief Operating Officer UK Private Bank from 2015 to 2017 and business head London Region and Specialist Proposition UK from 2012 to 2015. Before that, he was a Managing Director and Team Leader UK. Prior to his career at Barclays, he held senior posts in the UK’s Ministry of Defence and held the rank of Captain in the Royal Navy.
Mr Thomas is a British citizen and was born in 1967. He holds a Sloan Fellowship MSc in Business Strategy and Leadership from London Business School as well as a Masters in Defence Studies from King’s College London. He was awarded the MBE by Her Majesty The Queen in the year 2000 for service abroad.
6. External mandates and vested interests
Please refer to the information provided in the biographies of each member of the Executive Committee and Global Business Committee (GBC) in sections 4 and 5, where the significant activities in governing, advisory and supervising bodies of important organisations, institutions and foundations are mentioned.
6.1 Provisions on the number of permitted external mandates in the Articles of Association
In accordance with the Art. 12 para. 1 point 1 of the Ordinance, the number of permitted external mandates of the members of the Executive Committee are outlined in the Art. 37 of the Articles of Association*. The members of the Executive Committee may upon approval by the Board of Directors or the Remuneration & Nomination Committee each have up to three external mandates of which a maximum of one may be in a listed company. Additionally, a member of the Executive Committee may perform up to ten mandates in associations, charitable institutions as well as welfare and pension institutions.
6.2 Management contracts
EFG International and its subsidiaries have not entered into management contracts with third parties.
7. Compensation, shareholdings and loans of the members of the Board of Directors and the Executive Committee
In application of Art. 5 and Art. 13 of the Ordinance, the Board of Directors issued a Compensation Report for the year ended 31 December 2018. The Compensation Report includes all compensation directly or indirectly paid to current members of the Board of Directors and of the Executive Committee, as well as any direct or indirect remuneration to former members of the Board of Directors and of the Executive Committee in connection with their prior functions. The Compensation Report also discloses the loans and credits granted directly or indirectly by the Company to the members of the Board of Directors and the Executive Committee as well as loans, credits and remuneration to closely related parties thereof, which are not granted at market conditions.
Annual Report 2018 | 47
Details can be found in the Compensation Report, presented separately on page 51 ff. of this Annual Report.
In addition to the aforementioned, further details on the compensation and compensation related elements granted to the members of the Board of Directors and of the Executive Committee can be found in the following provisions of the Articles of Association*: – Art. 17 and Art. 18 of the Articles of Association defining
the mechanism for the approval of the compensation of the Board of Directors and the Executive Committee by the general meeting of shareholders. For further details see pages 58 ff.
– Art. 30 of the Articles of Association describing the authorities and the procedure of determining the form and amount of compensation for members of the Board of Directors and the Executive Committee. For further details see pages 52
– Art. 32 and Art. 33 of the Articles of Association determining the basic principles and elements of the compensation for members of the Board of Directors and the Executive Committee (for further details see pages 53 ff.)
– Art. 34 of the Articles of Association determining the available additional amount for payments to members of the Executive Committee appointed after the vote on-pay at the general meeting of shareholders
– Art. 35 of the Articles of Association on the principles applicable to performance related variable compensation and to the allocation of equity securities or RSUs as part of the Company’s shareholding programmes for members of the Executive Committee (for further details see pages 54 ff.)
– Art. 35a of the Articles of Association on the principles applicable to variable compensation for members of the Board of Directors (for further details see page 53)
– Art. 36 of the Articles of Association containing the rules on pension benefits not based on occupational pension schemes
– Art. 36a of the Articles of Association describes the principles for granting loans and credits to the members of the Board and the Executive Committee (for further details see page 60)
Details of the compensation paid to the members of the Board of Directors and the Executive Committee in 2018 and 2017 can be found on pages 61 ff. With regard to shareholdings of the members of the Board of Directors and the Executive Committee, please see the
section ‘Loans and Credit to the Board of Directors and Executive Committee’ on page 64.
8. Shareholders’ rights of participation
8.1 Voting-rights restriction and representation
Persons who acquired registered shares will, upon application, be entered in the share register without limitation as shareholders with voting power, provided they expressly declare themselves to have acquired the shares concerned in their own name and for their own account and comply with the disclosure requirement stipulated by FMIA (for details please refer to Art. 6 of the Articles of Association* and see also section 2.6 above).
Former employees’ vested RSUs are exercised upon the last day of their employment and held in a mandatory depository account administered by the custodian appointed by EFG International. Such shares are blocked until the first day of the exercise period and do not entitle the former employee to voting rights pertaining to the shares or to any dividends, distributions made out of the reserves from capital contributions, reimbursements of capital, etc.
According to Art. 23 of the Articles of Association*, shareholders can exercise their voting rights either by themselves or appoint a third party authorised in writing or the independent proxy to vote on their behalf. Such representatives need not to be shareholders. All shareholders receive with the invitation to the general meeting a proxy appointment form for the appointment of the independent proxy and instruct him regarding each agenda item and additional ad-hoc motions.
EFG International offers to their shareholders the possibility to exercise their voting rights prior to the general meeting via the online platform of Smartprimes. Furthermore, the voting at the shareholders’ meeting takes place in electronic form via a televoting device. The televoting devices allow a timely and accurate result delivery during the general meeting.
* See www.efginternational.com/articlesofassociation * See www.efginternational.com/articlesofassociation
Corporate Governance
48 | Annual Report 2018
8.2 Statutory quorums
No statutory quorums other than those defined by Swiss Corporate Law and the Swiss Federal Merger Act apply.
8.3 Convocation of the general meetings
The statutory rules on the convocation of the general meeting correspond with legal provisions. Accordingly, the general meeting is summoned at least twenty days before the date of the meeting by notice published in the ‘Swiss Official Gazette of Commerce’ and by letter sent to the addresses of the shareholders entered in the share register.
8.4 Agenda
The Board of Directors announces the agenda for the general meeting. Shareholders representing shares with a nominal value of at least CHF 1.0 million may request that an item of business be placed on the agenda until latest forty days prior to the date of the general meeting. Such request must be in writing and must state the relevant motions.
8.5 Registrations in the share register
There is no statutory rule on the deadline for registering shareholders in connection with the attendance of the general meeting. However, for organisational reasons, no shareholders will be entered into the share register during the period beginning fifteen days prior to a general meeting and ending immediately after the closing of the general meeting.
9. Changes of control and defence measures
9.1 Duty to make an offer
EFG International has not taken any defence measures against takeover attempts. Therefore, there are no statutory rules on ‘opting up’ and ‘opting out’. The Articles of Association contain no provision which would rule out the obligation of an acquirer of shares exceeding the threshold of 33.33% of the voting rights to proceed with a public purchase offer (opting-out provision pursuant to Art. 125 FMIA) or which would increase such threshold to 49% of the voting rights (opting-up provision pursuant to Art. 135 para. 1 FMIA).
9.2 Clauses on changes of control
Options and RSUs granted to employees would become exercisable during the extended offer period granted by the offeror upon a mandatory or a voluntary tender offer that becomes unconditional according to the FMIA. In the event that more than 90% of EFG International registered shares are acquired by a company listed at a recognised stock exchange, options or RSUs become exercisable or the outstanding options can be exchanged prior to the start of the exercise period by replacing the options or RSUs with options to acquire shares of the successor company (Successor Options) on terms and conditions which will result in such Successor Options being in all other material aspects identical to those that apply to options or RSUs.
10. Auditors
10.1 Duration of mandate and term of office of Head Auditor
PricewaterhouseCoopers SA (PwC), Geneva, were appointed as statutory auditors and group auditors of EFG International on 8 September 2005, when EFG International was incorporated. The shareholders must confirm the appointment of the auditors on an annual basis at the general meeting.
Mr Christophe Kratzer took up office as lead audit partner on 24 April 2015. Mr Thomas Romer, the Global Relationship Partner, co-signs the auditors’ report for 2018.
10.2 Auditing fees
PwC received fees totalling CHF 6.5 million for the 2018 audits of EFG International and its subsidiaries.
10.3 Additional fees
For additional audit-related services covering topics such as accounting, control reporting as well as compliance, EFG International Group paid PwC fees totalling CHF 2.5 million during the 2018 financial year.
For additional consulting-related services comprising legal, IT, tax and other project-related counselling, EFG International Group paid PwC fees totalling CHF 0.9 million during the 2018 financial year.
Annual Report 2018 | 49
10.4 Supervisory and control instruments vis-à-vis the auditors
The Audit Committee, on behalf of the Board of Directors, monitors the qualification, performance and remuneration of the statutory external auditors (‘auditors’) in order to satisfy itself as to their independence. Among others, the Audit Committee confers with EFG International Group’s auditors about the effectiveness of the internal control system in view of the risk profile of the EFG International Group.
The auditors report annually to the Audit Committee the recurring and non-recurring fees they receive for professional services provided throughout the EFG International Group. On a quarterly basis, the auditors report to the Audit Committee the approved mandates throughout the EFG International Group for conducting permissible non-audit/non-recurring services and how these compare to the approved fees for audit/recurring services. Additionally, the auditors assure the Audit Committee on an annual basis as to whether they comply with the rules of the EFG International Group’s ‘External Auditor Independence Policy’ and their internal rules regarding auditor independence.
The auditors report to the Audit Committee on areas where critical accounting estimates/judgements are made by management, on alternative treatments of financial information discussed with management, corrected and uncorrected misstatements, and other significant written communication between the auditors and management.
The Audit Committee meets regularly with the lead partners of the auditors, at least four times per year. In addition, the Chair of the Audit Committee discusses with the lead partners of the auditors the audit work performed, their main conclusions and potential important issues that arose during the audit.
The Chair of the Audit Committee briefs the Board of Directors about the Audit Committee’s contacts and discussions with the auditors.
The auditors have direct access to the Audit Committee at all times.
11. Information policy
EFG International regularly informs its shareholders and the public by means of annual and half-year reports, Compensation Reports, Pillar III disclosures as well as
media releases and presentations as needed. The documents are available, in electronic form at: www.efginternational.com/financial-reporting www.efginternational.com/investors www.efginternational.com/press-releases as well as in printed form upon request.
Interested parties can subscribe to the e-mail distribution service to receive free and timely notifications of potentially price-sensitive facts and media releases: www.efginternational.com/newsalert
These releases are also published on the EFG International website at the same time as they are sent to the subscribers, and are available online for several years at: www.efginternational.com/press-releases
Additional corporate information, such as documents related to general meetings, Articles of Association and Organisational and Management Regulations, can be found at: www.efginternational.com/agm www.efginternational.com/articlesofassociation www.efginternational.com/internalregulations
Financial calendar Important dates: 26 April 2019: Annual General Meeting 2019, Zurich 30 April 2019: Ex-dividend date 02 May 2019: Record date 03 May 2019: Dividend payment date 24 July 2019: Publication of half-year results 2019
The financial calendar of upcoming events relevant to shareholders, analysts, the media and other interested parties can be found on our investor relations website at: www.efginternational.com/investors
The Company’s notices are published in the ‘Swiss Official Gazette of Commerce’ (SOGC).
Address and Contact EFG INTERNATIONAL AG Bleicherweg 8 - P.O. Box 6012 8022 ZURICH Tel +41 44 226 1850 Fax +41 44 226 1855 www.efginternational.com
Investor Relations Jens Brueckner, Head of Investor Relations Tel +41 44 226 1799 [email protected]

Compensation Report
Annual Report 2018 | 51
1. Philosophy
EFG International Group (‘EFG’ or ‘the Company’) recognises that private banking is a people business. It is therefore committed to building its business activities around the individual needs of its clients, rather than focusing primarily on the sale of products and services. EFG’s employees are its most valuable asset. They help to craft its distinctive competitive profile and deliver results. EFG brings together experienced, entrepreneurial private bankers and asset managers, supported by a global team of professionals who focus on servicing internal and external clients. Together, they strive to achieve outstanding performance supported by an embedded risk culture.
EFG International Group seeks to attract and retain individuals who have the intellect, energy and entrepreneurial mindset to deal effectively with complex situations in a fast-changing and challenging environment. To achieve this, EFG uses a compensation model for all employees as well as the members of the Board of Directors that comprises three main components: Fixed compensation, also called the ‘base salary’; variable compensation, in the form of cash or non-cash awards such as restricted stock units (RSUs); and non-financial rewards.
Through their expertise and integrity, EFG’s employees create value for clients and therefore also for the Company. A corporate culture based on teamwork and meritocracy motivates the Company’s employees to deliver the best possible performance and achieve their full potential. Providing the right incentive structures and compensation models is of vital importance in this context. The following guidelines have been defined to outline EFG International’s remuneration framework: – Total remuneration includes fixed and variable
remuneration as well as statutory and non-statutory benefits
– Total remuneration must support the development and implementation of business plans; it must be funded out of business results and includes a substantial risk-adjusted variable component for profit generators
– EFG International is known for its distinctive Client Relationship Officer (CRO) remuneration model and this will remain a core part of how the bank operates
– Total remuneration schemes support meritocracy; they follow function and not hierarchy and are based on factual assessments of individual contributions to the short and longer-term success of the Company
– In calibrating total remuneration levels, market competitiveness within specific functions or business units has taken priority over internal comparability across functions or business units
– The annual compensation review process is primarily a managers’ process; HR provides the tools for this process and supports managers throughout this review
– EFG International actively lives meritocracy through recognition of individual performance and contribution, and it takes appropriate action where performance is below standards
2. Regulations
According to the Ordinance against Excessive Compensation in Listed Companies (hereafter called ‘Ordinance’) and the Articles of Association*, the Board of Directors has the non-transferable and inalienable duty to issue a written Compensation Report each year (Articles 5 and 13 of the Ordinance; Article 28 paragraph 2 section 7 of the Articles of Association*). EFG International has already published a Compensation Report in previous years and is thus continuing this practice. In line with the requirements set out in the Ordinance (Article 17), our statutory auditors, PricewaterhouseCoopers Ltd, have reviewed the Compensation Report to verify it is compliant with the applicable law and the Ordinance (see the auditors’ report on page 65).
3. Methodology
In addition to implementing the requirements of the Ordinance (information pursuant to Articles 14–16 of the Ordinance), EFG International already implemented in 2011 the principles of FINMA Circular 2010/1 – which defines minimum standards for remuneration schemes applicable to financial institutions – as well as the Corporate Governance Directive and its annex and commentary, issued by SIX Swiss Exchange AG. These standards have been transposed into a comprehensive internal Group Remuneration General Directive, an amended version of which was implemented in 2018 and includes the following principles: – Remuneration shall be simple, transparent,
implementable and long-term oriented – Performance shall drive total compensation: All variable
compensation must be linked to individual and Company performance. The contribution of individuals and units
* See www.efginternational.com/articlesofassociation
Compensation Report
52 | Annual Report 2018
within the business units (Private Banking) and revenue-generating functions is assessed, taking into account performance across all business aspects including profitability, competitive environment and the contribution to the Company’s total results
– Risk awareness shall determine total compensation: The remuneration model is a fundamental and decisive element for materialising accountability and ensuring effectiveness of the First Line of Defence within EFG International Group’s approach to systematic risk management. Risk awareness shall impact the variable compensation of individuals as well as their supervisors. A risk scorecard forms part of the remuneration model for CROs
– Total remuneration shall be linked to market practice: Total remuneration shall be benchmarked for each business line, support function and control function
– Individual recognition shall be a total compensation approach: Individual performance impacts variable compensation as well as fixed compensation
– Equal compensation opportunity: The drivers determining compensation are based on individual skills, qualifications, performance, behaviour and any other legitimate business considerations. Discrimination is not tolerated in any form
– High performers shall be exposed to EFG International equity through deferred compensation plans: High performers’ interests shall be aligned with those of the Company’s shareholders by delivering a significant portion of an individual’s variable compensation in the form of deferred equity-based instruments
Employees and governing bodies are categorised accordance according with their risk profile, as defined below:
i) Members of the Board of Directors of EFG International and its subsidiaries
ii) Chief Executive Officer (CEO) and other members of the Executive Committee of EFG International
iii) Global Business Committee members of EFG International
iv) Regional Business Heads, Local Business Heads and Global Function Heads
v) Senior Managers (Direct reports to Executive Committee or Global Business Committee members at regional level or at a functional level [Local Business Heads, Global Function Heads, Local Function Heads], all Heads of Private Banking and some other cases defined by the Executive Committee in consultation with the Global Business Committee)
vi) Key Executives (defined according to criteria set out periodically by the Remuneration & Nomination Committee), including Material Risk Takers (MRTs) as defined by local regulations
vii) Control functions (Audit, Compliance and Risk) viii) CROs ix) Other staff
The compensation of the members of the Board of Directors and the Executive Committee complies with the Ordinance, FINMA Circular 2010/1 and the Corporate Governance Directive.
For information on staff costs, please refer to page 137 (note 19 to the consolidated financial statements).
4. Responsibilities
The Remuneration & Nomination Committee currently comprises the following members of the Board of Directors who were individually elected by the Annual General Meeting 2018 for a term of office of one year until the conclusion of the Annual General Meeting 2019: – Niccolò H. Burki (Chair) – Emmanuel L. Bussetil – Steven M. Jacobs – Bernd-A. von Maltzan – Périclès Petalas – John A. Williamson
According to Article 30 paragraph 2 of the Articles of Association* and in application of the Ordinance, the Remuneration & Nomination Committee has the following specific tasks and responsibilities in relation to the compensation of the Board of Directors and the Executive Committee: – To establish the compensation strategy for the Company,
to approve the compensation and to make recommendations to the Board of Directors with regard to certain compensation matters in particular, this includes reviewing, on behalf of the Board of Directors and within the limits set by the Annual General Meeting, the amount of compensation to be paid to the members of the Board of Directors and the members of the Executive Committee
– To annually review, and make a recommendation to the Board of Directors regarding the form and amount of the compensation of the members of the Board of Directors and any additional compensation to be paid for service as Chair and Vice-Chair of the Board of Directors, for service
* See www.efginternational.com/articlesofassociation

Annual Report 2018 | 53
on Board-delegated committees and for service as a Chair of Board-delegated committees
– To annually (a) review and assess the corporate goals and objectives upon which the compensation of the CEO and the other members of the Executive Committee is based and (b) evaluate the performance of the CEO and the other members of the Executive Committee in respect of these goals and objectives
– To make a recommendation to the Board of Directors concerning appropriate compensation levels for the CEO after the evaluation of the CEO’s performance
– To annually review the amount of compensation of the other members of the Executive Committee and make a recommendation to the Board of Directors regarding the appropriate level of compensation for: (a) the annual base salary; (b) annual variable compensation; (c) the long-term compensation component; and (d) any special or supplemental rewards
In addition, and in accordance with the Organisational and Management Regulations**, the Group Remuneration General Directive and the Terms of Reference of the Remuneration & Nomination Committee, the Remuneration & Nomination Committee has, among others, the following additional responsibilities and competencies: – To ensure that EFG International and its subsidiaries
follow up-to-date procedures ensuring the implementation of and compliance with the provisions of the FINMA Circular 2010/1
– To ensure that annual salary increases and all discretionary variable compensation amounts are within the overall budget and guidelines approved by the Board of Directors and the Annual General Meeting, where applicable
– To ensure that the policy on variable compensation and other variable elements of employee compensation is not in conflict with client interests, shareholder interests, the Ordinance, FINMA Circular 2010/1, and the Corporate Governance Directive
– To decide on the contractual arrangements of the members and the Chair of the Board of Directors, the CEO and other members of the Executive Committee of EFG International, which must all be in line with the Articles of Association as well as the Ordinance, and to decide on the contractual arrangements of other Key Executives, including those at the Company’s subsidiaries, as appropriate
– To approve all salary increases to other staff members, with the exception of those resulting from existing contractual terms, in cases where the salary increase places the person within the Key Executive group
– To define the rules governing staff loans, in particular for
those loans made against shares of EFG International and the thresholds above which any staff loan is to be submitted to the Remuneration & Nomination Committee for approval
– To decide on the granting of loans and credits to members of the Board of Directors and related parties thereof as well as members of the Executive Committee and Regional CEOs (for loans and credits exceeding CHF 500,000)
– To decide on EFG International’s contribution to pension and social institutions for the Swiss entities and their branches
– To review the overall annual salary, annual increases and variable compensation as proposed by management for all other staff of EFG International and its subsidiaries
– To be informed by the CEO each year, in the context of the annual compensation review, of a recommendation on RSU receivers. The Remuneration & Nomination Committee shall consider the recommendations and, at its absolute discretion, determine the allocation of RSUs for each receiver, if any
5. Principles
5.1 Members of the Board of Directors
5.1.1 Fixed compensation
The fixed compensation of the members of the Board of Directors, which is subject to the approval of the Annual General Meeting, consists of a fixed base fee paid in cash, which is determined according to the function performed by the member within the Board of Directors, the number of committee activities, and the function within those committees. Since the Annual General Meeting 2017, the fixed compensation of the members of the Board of Directors also includes an award in the form equity or equity linked instruments (e.g. RSUs). For further details see Article 32 of the Articles of Association*.
5.1.2 Variable compensation
The variable compensation of members of the Board of Directors, which is subject to the approval of the Annual General Meeting, is paid in cash and/or awarded the form of equities or equity linked instruments (e.g. RSUs). For further details, see Articles 32 and 35a of the Articles of Association*.
* See www.efginternational.com/articlesofassociation ** See www.efginternational.com/internalregulations

Compensation Report
54 | Annual Report 2018
5.1.3 Compensation for advisory services
Subject to the approval of the Annual General Meeting, members of the Board of Directors may receive additional compensation in cash, in line with market practice, for advisory services unrelated to their function as a member of the Board of Directors that are rendered to the Company and/or direct or indirect subsidiaries of the Company. In 2018, one member of the Board of Directors received an additional fee for his membership of and service to the EFG Advisory Board for Asia.
5.2 Members of the Executive Committee
5.2.1 Fixed compensation
The fixed compensation of the members of the Executive Committee, which is subject to the approval of the Annual General Meeting, consists of fixed compensation paid in cash. For further details, see Articles 33 and 35 of the Articles of Association*.
5.2.2 Variable compensation
Variable compensation is awarded to members of the Executive Committee at the discretion of the Remuneration & Nomination Committee and is subject to the approval of the Annual General Meeting. The Remuneration & Nomination Committee considers a number of quantitative and qualitative criteria when awarding variable compensation, such as profitability and the development of the Company’s share price, the relationship between variable compensation and key performance indicators, the risk profile of the Company and the individual performance of the members of the Executive Committee during the year. The Remuneration & Nomination Committee approves targets and maximum award levels for each member of the Executive Committee taking into account their position, responsibilities and duties. Variable compensation is payable in cash, and a certain percentage is awarded in the form of RSUs relating to shares of EFG International under the Employee Equity Incentive Plan (see section 6.2). A minimum of 50% of compensation must be awarded in the form of RSUs (threshold defined in Article 35 of the Articles of Association*). The threshold is determined annually by the Remuneration & Nomination Committee. The current minimum threshold is 60%. For further details see Articles 33 and 35 of the Articles of Association*.
Long term incentive plan introduction in 2019 The Board of Directors further intends to implement a one-off long term incentive plan (LTIP) for EFG International’s senior management (Executive Committee, Global Business Committee and Senior Managers). The LTIP shall be implemented to underline management’s commitment to achieving EFG International’s targets, to further align management’s interests with shareholders’ interests through increased stock based remuneration, and to honour valuable employees as well as to incentivise long-lasting employment relationships.
The LTIP to be implemented shall be a plan covering a three years performance period starting in 2019 and rewarding senior management’s achievement based on financial and business targets. In the base case scenario, 8,000,000 shares of EFG International will be awarded to senior management (including, subject to shareholders’ approval, the Executive Committee) via restricted stock units (RSUs).
Subject to meeting minimum thresholds and depending on the performance achieved, the award of RSUs will be within 45% to 140% of the base case allocation, corresponding to the percentage achievement of the financial targets, plus add-ons or reductions depending on the achievement of the business targets, and any reduction due to risk and conduct aspects.
If either of the minimum financial targets or the minimum commercial targets will not have been achieved, the whole award is forfeited. If both minimum targets will have been achieved, the award will be between 3,600,000 and 11,200,000 RSUs.
The award will be distributed in two allocations over the three year cycle of the LTIP. 4,700,000 shares will be allocated at the start of the LTIP in 2019. The balance of RSUs will be allocated at the end of the LTIP in 2021. For the members of the Executive Committee the currently envisaged full award (i.e. 140% of the allocation in the base case scenario) will be allocated at the start of the LTIP with special restrictions and rules regarding forfeiture, resulting in an equal treatment of, and equal incentive for, all participants in the LTIP.
The RSUs granted shall, under normal circumstances, vest in three equal instalments in April 2022, April 2023 and April 2024, and the vesting shall be further subject to certain conditions (most notably continuing employment).
* See www.efginternational.com/articlesofassociation
Annual Report 2018 | 55
5.3 Other categories of staff
5.3.1 Fixed compensation
Fixed compensation paid to employees other than members of the Board of Directors and the Executive Committee is determined according to their level qualifications, professional experience and expertise, degree of seniority, the skills required to perform their role, the scope of the role, and the relevant business sector and region.
In Switzerland, and in most other countries where reliable data is available, fixed compensation is also linked to a professional annual compensation survey conducted in the banking sector.
EFG International uses the performance reviews and market benchmarks on an individual basis to review whether a salary increase is necessary or strongly advisable for the purpose of talent retention. In countries where legislation prescribes a general minimum salary increase (e.g. legal indexation of salaries), any additional increases would then still follow Group-wide procedures. Compensation surveys are used to help establish the appropriate salary for most members of staff. However they are rarely used at the highest level of management, since there are insufficient numbers of organisations with the same level of international complexity to allow for a meaningful comparison.
All staff salaries are subject to review on an annual basis, first by local management and Human Resources, and subsequently by the Regional Business Head, EFG International’s CEO together with the Global Head of Human Resources and finally by the Remuneration & Nomination Committee.
Exceptional increases may be granted during the year. If increases exceed certain limits defined in the Group Remuneration General Directive, they require the approval of the Remuneration & Nomination Committee before being granted.
5.3.2 Variable compensation
Variable remuneration awarded to employees other than members of the Board of Directors and the Executive Committee – with the exception of CROs (see section 5.4); certain asset managers and certain Regional Business Heads – is of a discretionary nature and is determined on the basis of their individual performance (annual assessment), the performance of their business line, and
that of the Company. The relative importance of each performance criterion is determined in advance and the criteria are then balanced to take into account the position or responsibilities held by the employee, defined by job category. The proportion of variable compensation that may be deferred depends on the potential impact that the job category can have on the risk profile of the Company, as well as the responsibilities and tasks performed. The minimum deferral period for ‘higher risk’ job categories is three years.
Variable compensation can be awarded in the form of cash, deferred cash or deferred equity.
The discretionary variable compensation pool is funded by means of an ongoing process throughout the year. The size of the pool depends on the long-term performance of EFG International, which is determined on the basis of the sustainability of profits and risk adjustments through the calculation of economic profit. Several additional factors are also considered, such as the Group’s financial performance, functional performance indicators, market trends and outlook, achievement of strategic goals, risk management and control culture, present and future risks, and discretion. These factors ensure that the rewarding and retention of employees is aligned with the interests of shareholders as well as the regulatory requirements.
Variable compensation is incorporated into capital and liquidity planning and must not jeopardise the attainment of capital targets. If EFG International posts unsatisfactory results, the total pool may be reduced or eliminated entirely.
A framework is in place to ensure the critical review of compensation proposals by Regional Business Heads, EFG International’s CEO and the Remuneration & Nomination Committee.
The variable compensation review is carried out annually. A strong emphasis is placed on the personal contribution of employees when determining the discretionary variable compensation for staff with a modest fixed salary. For Key Executives and Senior Managers, there is a much stronger emphasis on corporate performance, in particular profitability, with the focus on of personal contribution being reduced accordingly.
For Key Executives and Senior Managers, the Remuneration & Nomination Committee considers a number of quantitative and qualitative criteria such as performance – in terms of profitability and the development of the share
Compensation Report
56 | Annual Report 2018
price of EFG International through the year, the relationship between variable compensation and key performance indicators, the risk profile of the institution, and the individual performance of these employees. An unsatisfac-tory performance by the EFG International Group can result in a significant reduction or even the elimination of discretionary variable compensation for Key Executives and Senior Managers.
Staff who breach internal regulations or regulatory or legal requirements, or who significantly raise the Company’s risk exposure, may have their variable compensation reduced or eliminated.
Exceptional variable awards may be granted during the year. If exceptional variable awards exceed a certain predefined limit, they require the approval of the Remuneration & Nomination Committee before being granted.
The Board of Directors plans to implement a long term incentive plan (LTIP) for EFG International’s senior management. For further details, see section 5.2.2. above.
5.4 Client Relationship Officers
5.4.1 Fixed compensation
EFG International generally only hires experienced bankers for the role of CROs who bring with them previous business development experience in this area.
The fixed compensation of CROs is defined individually at the time of hiring based on their historic compensation and may be reviewed from time to time to ensure they are aligned with market practices.
5.4.2 Variable compensation
Variable compensation is contractual and formulaic (percentage of the business booked by the CRO). Booked business reflects the true net financial contribution of each CRO and does not entail any ‘pre-payment’ of anticipated future revenues.
Variable compensation includes all revenues and related costs attributable to them. Bona fide operating errors leading to losses are debited from the CRO’s booked business and impact their variable compensation. Losses arising from recurring operating errors, serious mistakes, or non-compliance with internal or external regulations or applicable laws, directly reduce their variable compensation as laid out in the CRO risk scorecard. CROs with variable compensation of more than CHF 50,000 are required to receive 25% of the portion of variable compensation exceeding CHF 50,000 (or the equivalent in local currencies) in the form of RSUs.
5.5 Employees in control functions
The compensation level of employees in control functions is determined in such a way as to enable the Company to attract qualified and experienced professionals. The mix of fixed and variable compensation for control function personnel is weighted in favour of fixed compensation; the variable component is based on function-specific objectives and is not determined by the individual financial performance of the business area they monitor.
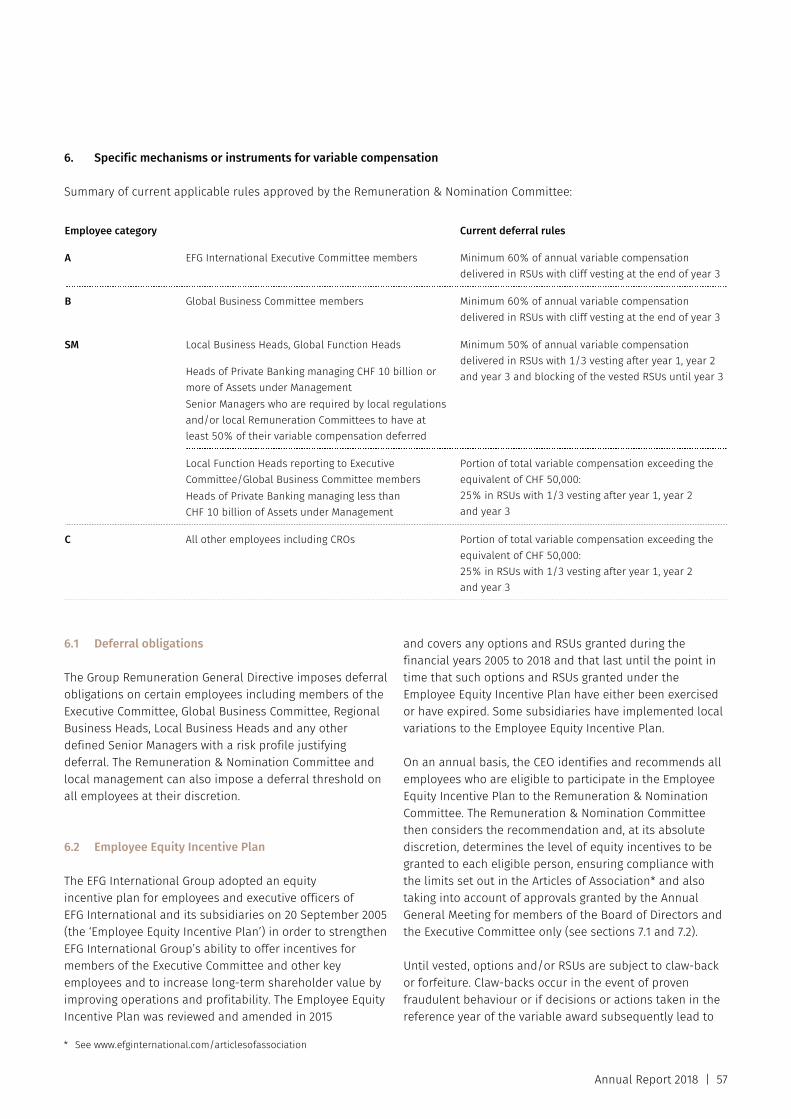
Annual Report 2018 | 57
6. Specific mechanisms or instruments for variable compensation
Summary of current applicable rules approved by the Remuneration & Nomination Committee:
Employee category Current deferral rules
A EFG International Executive Committee members Minimum 60% of annual variable compensation delivered in RSUs with cliff vesting at the end of year 3
B Global Business Committee members Minimum 60% of annual variable compensation delivered in RSUs with cliff vesting at the end of year 3
SM Local Business Heads, Global Function Heads Minimum 50% of annual variable compensation delivered in RSUs with 1/3 vesting after year 1, year 2 and year 3 and blocking of the vested RSUs until year 3 Heads of Private Banking managing CHF 10 billion or
more of Assets under Management Senior Managers who are required by local regulations and/or local Remuneration Committees to have at least 50% of their variable compensation deferred
Local Function Heads reporting to Executive Committee/Global Business Committee members Heads of Private Banking managing less than CHF 10 billion of Assets under Management
Portion of total variable compensation exceeding the equivalent of CHF 50,000: 25% in RSUs with 1/3 vesting after year 1, year 2 and year 3
C All other employees including CROs Portion of total variable compensation exceeding the equivalent of CHF 50,000: 25% in RSUs with 1/3 vesting after year 1, year 2 and year 3
6.1 Deferral obligations
The Group Remuneration General Directive imposes deferral obligations on certain employees including members of the Executive Committee, Global Business Committee, Regional Business Heads, Local Business Heads and any other defined Senior Managers with a risk profile justifying deferral. The Remuneration & Nomination Committee and local management can also impose a deferral threshold on all employees at their discretion.
6.2 Employee Equity Incentive Plan
The EFG International Group adopted an equity incentive plan for employees and executive officers of EFG International and its subsidiaries on 20 September 2005 (the ‘Employee Equity Incentive Plan’) in order to strengthen EFG International Group’s ability to offer incentives for members of the Executive Committee and other key employees and to increase long-term shareholder value by improving operations and profitability. The Employee Equity Incentive Plan was reviewed and amended in 2015
and covers any options and RSUs granted during the financial years 2005 to 2018 and that last until the point in time that such options and RSUs granted under the Employee Equity Incentive Plan have either been exercised or have expired. Some subsidiaries have implemented local variations to the Employee Equity Incentive Plan.
On an annual basis, the CEO identifies and recommends all employees who are eligible to participate in the Employee Equity Incentive Plan to the Remuneration & Nomination Committee. The Remuneration & Nomination Committee then considers the recommendation and, at its absolute discretion, determines the level of equity incentives to be granted to each eligible person, ensuring compliance with the limits set out in the Articles of Association* and also taking into account of approvals granted by the Annual General Meeting for members of the Board of Directors and the Executive Committee only (see sections 7.1 and 7.2).
Until vested, options and/or RSUs are subject to claw-back or forfeiture. Claw-backs occur in the event of proven fraudulent behaviour or if decisions or actions taken in the reference year of the variable award subsequently lead to
* See www.efginternational.com/articlesofassociation
Compensation Report
58 | Annual Report 2018
financial losses for the Company. This is reflected in the employment contract or other documentation agreed with the employee at the time of the variable compensation award. Options and/or RSUs are also subject to forfeiture on the resignation of the employee or termination for cause.
The Remuneration & Nomination Committee may, in exceptional cases, decide to grant accelerated vesting to employees leaving the Company depending on the circumstances of the departure, subject to applicable law.
6.3 Other compensation
Other compensation for members of the Board of Directors and the Executive Committee is subject to the mandatory rules of the Ordinance. Sign-on payments, guaranteed compensation, severance payments or any other special form of remuneration packages for staff other than members of the Board of Directors or the Executive Committee are subject to predefined rules and are made only in exceptional cases. If special compensation exceeds a certain limit, it must be submitted to the Remuneration & Nomination Committee for approval before being granted.
7. Implementation of compensation principles
7.1 Members of the Board of Directors
The compensation of those members of the Board of Directors who receive compensation is determined by the Remuneration & Nomination Committee and is subject to the approval of the Annual General Meeting (see Articles 17 and 18 of the Articles of Association*). The fixed compensation of the members of the Board of Directors is approved prospectively for their term of office until the end of the next Annual General Meeting.
No variable compensation for members of the Board of Directors related to the business year 2018 will be proposed to the Annual General Meeting 2019.
Details of the compensation paid to the members of the Board of Directors in 2018 and 2017 can be found on pages 61–63.
No agreement with members of the Board of Directors foresees a sign-on bonus or severance payment.
7.2 Members of the Executive Committee
The compensation of the members of the Executive Committee is determined annually by the Remuneration & Nomination Committee and is subject to the approval of the Annual General Meeting (see Articles 17 and 18 of the Articles of Association*). The fixed compensation of members of the Executive Committee is approved prospectively for the current business year and variable compensation is approved retrospectively (awarded in the current business year based on the performance in the business year preceding the Annual General Meeting).
The following compensation components are provided at Executive Committee level: – Fixed compensation in cash – Variable compensation defined annually (including
Employee Equity Incentive Plan) – Social charges
Subject to the approval of the Annual General Meeting, variable compensation for members of the Executive Committee is determined entirely at the discretion of the Remuneration & Nomination Committee based upon recommendations of the CEO (except in relation to his own variable compensation). The Remuneration & Nomination Committee has determined that a minimum threshold of 60% of the variable compensation awarded to the members of the Executive Committee is to be taken in the form of RSUs and deferred over a minimum period of three years, with cliff vesting. In exceptional cases, the Remuneration & Nomination Committee may approve amendments of this rule for specific events, subject to mandatory law.
Variable compensation is awarded on the basis of an assessment of individual performance and the performance of EFG International as a whole. Criteria discussed by the Remuneration & Nomination Committee include personal performance, the performance of subordinates, sound management, budget control, and the realisation of defined objectives, the realisation of last-minute projects/objectives and any other contributions benefiting EFG International.
The variable component of compensation awarded to members of the Executive Committee constituted from 0% to 130% of the annualised fixed component,
* See www.efginternational.com/articlesofassociation
Annual Report 2018 | 59
averaging 51.4%. The average variable component of annualised total compensation is 30.3%, of which the average deferral for a member of the Executive Committee is 60.7%.
The Remuneration & Nomination Committee may, in exceptional cases, decide to grant accelerated vesting to employees leaving the Company, depending on the circumstances of their departure, subject to applicable law.
Details of the compensation paid to the members of the Executive Committee in 2018 and 2017 can be found on pages 61–63.
No employment contract with members of the Executive Committee foresees a sign-on bonus or severance payment.
7.3 Members of the Global Business Committee
The Global Business Committee performs an advisory role to support the Executive Committee, assessing business strategy, key business topics and priorities as well as discussing industry trends and issues. The Global Business Committee is responsible for driving forward the business. With respect to HR-related matters, the responsibilities of the Global Business Committee include: – Supporting the Executive Committee and focusing on
assessing and validating the Company’s strategy, key business topics and priorities, as well as client services and solutions, to drive the sustainable and profitable growth of EFG International
– Supporting the Executive Committee in developing and maintaining the Company’s resources (human and others), internal processes and systems. For human resources this includes performance management, succession planning, talent management, recruiting and remuneration
– Supporting the Executive Committee to ensure that the organisation embraces its corporate values and lives a ‘One-Bank’ culture
The Global Business Committee meets on a regular basis and includes the members of the Executive Committee, the Regional Business Heads and other direct reports to the CEO with global function responsibility. The Global Business Committee had 13 members in 2018.
The compensation of the members of the Global Business Committee is determined in the same way as for all staff and is reviewed annually by the Remuneration & Nomination Committee. The following compensation components are provided at Global Business Committee level: – Fixed compensation in cash – Variable compensation defined annually (including
Employee Equity Incentive Plan) – Social charges
It should be noted that the members of the Global Business Committee do not receive additional compensation for their membership of the Committee.
The minimum proportion of variable compensation awarded in the form of RSUs cannot be below 50% and is determined annually by the Remuneration & Nomination Committee. The current minimum threshold is 60%. Variable compensation is deferred over a minimum period of three years, with either progressive or cliff vesting. In exceptional cases, the Remuneration & Nomination Committee may approve amendments to this rule for specific events, subject to mandatory law.
The variable component of compensation awarded to members of the Global Business Committee (excluding members of the Executive Committee) constituted from 30.1% to 71.7% of the annualised fixed component, averaging 54.2%. The average variable component of annualised total compensation is 31.2%, of which the average deferral for a Global Business Committee member is 60%.
Compensation Report
60 | Annual Report 2018
8. Loans and credits
The Articles of Association* set out rules governing the granting of loans and credits at market conditions or generally applicable employee conditions to the members of the Board of Directors and the Executive Committee. They specify that such loans and credits should not exceed a maximum of CHF 3,000,000 for unsecured loans and credits, and CHF 20,000,000 for secured loans and credits per member of the Board of Directors or the Executive Committee (see Article 36a paragraph 1 of the Articles of Association*).
The Remuneration & Nomination Committee decides on the granting of loans and credits to members of the Board of Directors and related parties, as well as to members of the Executive Committee and Regional CEOs (for loans and
credits exceeding CHF 500,000). All other loans and credits granted to members of the Executive Committee and Regional CEOs that do not require the approval of the Remuneration & Nomination Committee are handled by the approval body of EFG International (‘Approval Body’). The Approval Body comprises three members of the Executive Committee and, as a backup, the Head of the Credit Department. Details on loans and credits granted to members of the Board of Directors and the Executive Committee can be found on page 64.
9. External advice
EFG International uses local market surveys where available for benchmarking purposes and obtains advice from external consultants when necessary.
* See www.efginternational.com/articlesofassociation
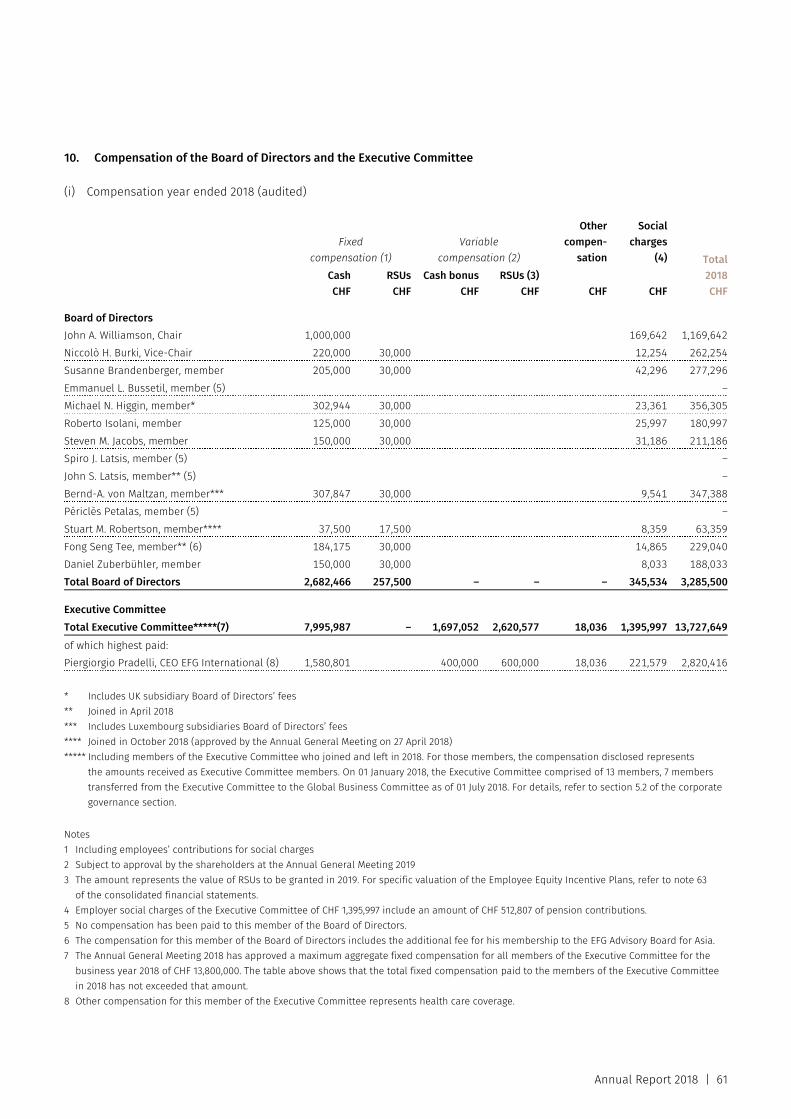
Annual Report 2018 | 61
10. Compensation of the Board of Directors and the Executive Committee
(i) Compensation year ended 2018 (audited)
Fixed compensation (1)
Variable compensation (2)
Othercompen-
sation
Social charges
(4) Total2018CHF
CashCHF
RSUsCHF
Cash bonusCHF
RSUs (3)CHF CHF CHF
Board of Directors John A. Williamson, Chair 1,000,000 169,642 1,169,642Niccolò H. Burki, Vice-Chair 220,000 30,000 12,254 262,254Susanne Brandenberger, member 205,000 30,000 42,296 277,296Emmanuel L. Bussetil, member (5) –Michael N. Higgin, member* 302,944 30,000 23,361 356,305Roberto Isolani, member 125,000 30,000 25,997 180,997Steven M. Jacobs, member 150,000 30,000 31,186 211,186Spiro J. Latsis, member (5) –John S. Latsis, member** (5) –Bernd-A. von Maltzan, member*** 307,847 30,000 9,541 347,388Périclès Petalas, member (5) –Stuart M. Robertson, member**** 37,500 17,500 8,359 63,359Fong Seng Tee, member** (6) 184,175 30,000 14,865 229,040Daniel Zuberbühler, member 150,000 30,000 8,033 188,033Total Board of Directors 2,682,466 257,500 – – – 345,534 3,285,500 Executive Committee Total Executive Committee*****(7) 7,995,987 – 1,697,052 2,620,577 18,036 1,395,997 13,727,649of which highest paid: Piergiorgio Pradelli, CEO EFG International (8) 1,580,801 400,000 600,000 18,036 221,579 2,820,416 * Includes UK subsidiary Board of Directors’ fees ** Joined in April 2018 *** Includes Luxembourg subsidiaries Board of Directors’ fees **** Joined in October 2018 (approved by the Annual General Meeting on 27 April 2018) ***** Including members of the Executive Committee who joined and left in 2018. For those members, the compensation disclosed represents
the amounts received as Executive Committee members. On 01 January 2018, the Executive Committee comprised of 13 members, 7 members transferred from the Executive Committee to the Global Business Committee as of 01 July 2018. For details, refer to section 5.2 of the corporate governance section.
Notes 1 Including employees’ contributions for social charges 2 Subject to approval by the shareholders at the Annual General Meeting 2019 3 The amount represents the value of RSUs to be granted in 2019. For specific valuation of the Employee Equity Incentive Plans, refer to note 63
of the consolidated financial statements. 4 Employer social charges of the Executive Committee of CHF 1,395,997 include an amount of CHF 512,807 of pension contributions. 5 No compensation has been paid to this member of the Board of Directors. 6 The compensation for this member of the Board of Directors includes the additional fee for his membership to the EFG Advisory Board for Asia. 7 The Annual General Meeting 2018 has approved a maximum aggregate fixed compensation for all members of the Executive Committee for the
business year 2018 of CHF 13,800,000. The table above shows that the total fixed compensation paid to the members of the Executive Committee in 2018 has not exceeded that amount.
8 Other compensation for this member of the Executive Committee represents health care coverage.

Compensation Report
62 | Annual Report 2018
No compensation has been granted to related parties of members of the Board of Directors and the Executive Committee.
Members of the Board of Directors and the Executive Committee benefit from the same preferential conditions for banking transactions executed in-house (EFG Bank AG) that are available to all employees of the EFG International Group.
(ii) Board of Directors’ compensation approved at the Annual General Meeting 2018
The table above shows the compensation of the individual members of the Board of Directors for the
business year 2018 as they are calculated for the Financial Statements 2018. The shareholders have approved at the Annual General Meeting 2018 a maximum aggregate fixed compensation for all members of the Board of Directors of CHF 3,950,000 for their term of office from Annual General Meeting 2018 to Annual General Meeting 2019. The table below shows that the expected total fixed compensation paid to the members of the Board of Directors for such term of office has not exceeded the amount approved by the shareholders.
Fixed compensation (1) Social chargesFrom AGM 2018
to AGM 2019TotalCHF
CashCHF
RSUsCHF CHF
Board of Directors John A. Williamson, Chair 1,000,000 169,642 1,169,642 Niccolò H. Burki, Vice-Chair 220,000 30,000 12,254 262,254 Susanne Brandenberger, member 205,000 30,000 42,296 277,296 Emmanuel L. Bussetil, member (2) –Michael N. Higgin, member* 302,944 30,000 23,361 356,305 Roberto Isolani, member 125,000 30,000 25,997 180,997 Steven M. Jacobs, member 150,000 30,000 31,186 211,186 Spiro J. Latsis, member (2) –John S. Latsis, member** (2) –Bernd-A. von Maltzan, member*** 307,847 30,000 9,541 347,388 Périclès Petalas, member (2) –Stuart Robertson, member**** 87,500 17,500 19,504 124,504 Fong Seng Tee, member** (3) 217,508 30,000 17,556 265,064 Daniel Zuberbühler, member 150,000 30,000 8,033 188,033 Total Board of Directors 2,765,799 257,500 359,370 3,382,669 * Includes UK subsidiary Board of Directors’ fees ** Joined in April 2018 *** Includes Luxembourg subsidiaries Board of Directors’ fees **** Joined in October 2018 (approved by the Annual General Meeting on 27 April 2018) Notes 1 Including employees’ contributions for social charges 2 No compensation has been paid to this member of the Board of Directors. 3 The compensation for this member of the Board of Directors includes the additional fee for his membership to the EFG Advisory Board for Asia. No compensation has been granted to related parties of members of the Board of Directors and the Executive Committee.
Members of the Board of Directors and the Executive Committee benefit from the same preferential conditions for banking transactions executed in-house (EFG Bank AG) that are available to all employees of the EFG International Group.
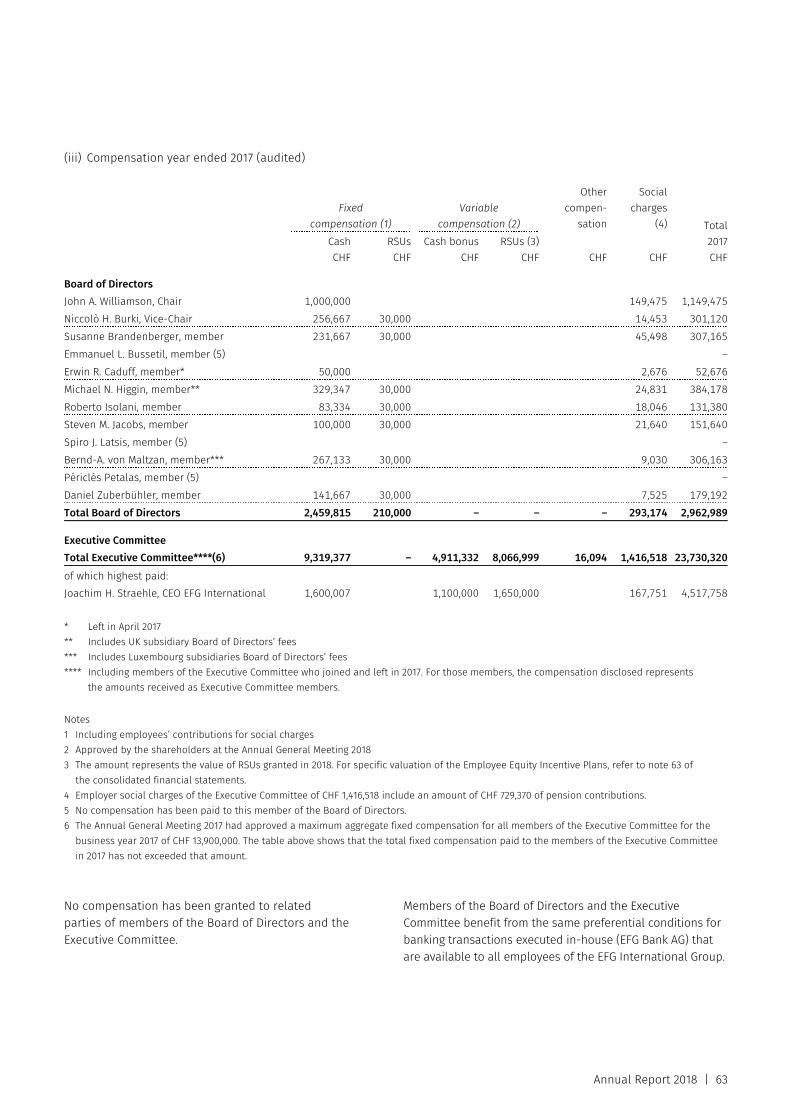
Annual Report 2018 | 63
(iii) Compensation year ended 2017 (audited)
Fixed compensation (1)
Variable compensation (2)
Othercompen-
sation
Socialcharges
(4) Total2017CHF
CashCHF
RSUsCHF
Cash bonusCHF
RSUs (3)CHF CHF CHF
Board of Directors John A. Williamson, Chair 1,000,000 149,475 1,149,475Niccolò H. Burki, Vice-Chair 256,667 30,000 14,453 301,120Susanne Brandenberger, member 231,667 30,000 45,498 307,165Emmanuel L. Bussetil, member (5) –Erwin R. Caduff, member* 50,000 2,676 52,676Michael N. Higgin, member** 329,347 30,000 24,831 384,178Roberto Isolani, member 83,334 30,000 18,046 131,380Steven M. Jacobs, member 100,000 30,000 21,640 151,640Spiro J. Latsis, member (5) –Bernd-A. von Maltzan, member*** 267,133 30,000 9,030 306,163Périclès Petalas, member (5) –Daniel Zuberbühler, member 141,667 30,000 7,525 179,192Total Board of Directors 2,459,815 210,000 – – – 293,174 2,962,989 Executive Committee Total Executive Committee****(6) 9,319,377 – 4,911,332 8,066,999 16,094 1,416,518 23,730,320of which highest paid: Joachim H. Straehle, CEO EFG International 1,600,007 1,100,000 1,650,000 167,751 4,517,758 * Left in April 2017 ** Includes UK subsidiary Board of Directors’ fees *** Includes Luxembourg subsidiaries Board of Directors’ fees **** Including members of the Executive Committee who joined and left in 2017. For those members, the compensation disclosed represents
the amounts received as Executive Committee members. Notes 1 Including employees’ contributions for social charges 2 Approved by the shareholders at the Annual General Meeting 2018 3 The amount represents the value of RSUs granted in 2018. For specific valuation of the Employee Equity Incentive Plans, refer to note 63 of
the consolidated financial statements. 4 Employer social charges of the Executive Committee of CHF 1,416,518 include an amount of CHF 729,370 of pension contributions. 5 No compensation has been paid to this member of the Board of Directors. 6 The Annual General Meeting 2017 had approved a maximum aggregate fixed compensation for all members of the Executive Committee for the
business year 2017 of CHF 13,900,000. The table above shows that the total fixed compensation paid to the members of the Executive Committee in 2017 has not exceeded that amount.
No compensation has been granted to related parties of members of the Board of Directors and the Executive Committee.
Members of the Board of Directors and the Executive Committee benefit from the same preferential conditions for banking transactions executed in-house (EFG Bank AG) that are available to all employees of the EFG International Group.
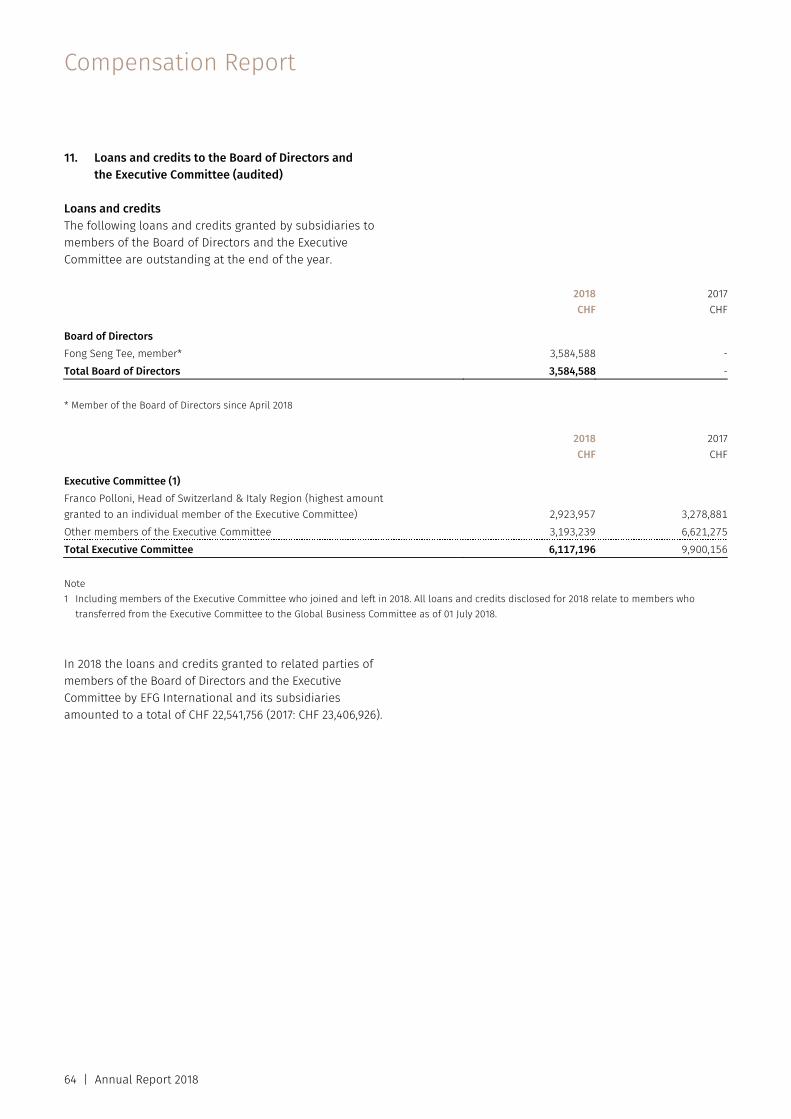
Compensation Report
64 | Annual Report 2018
11. Loans and credits to the Board of Directors and the Executive Committee (audited)
Loans and credits The following loans and credits granted by subsidiaries to members of the Board of Directors and the Executive Committee are outstanding at the end of the year.
2018CHF
2017CHF
Board of Directors Fong Seng Tee, member* 3,584,588 -Total Board of Directors 3,584,588 -
* Member of the Board of Directors since April 2018
2018CHF
2017CHF
Executive Committee (1) Franco Polloni, Head of Switzerland & Italy Region (highest amount granted to an individual member of the Executive Committee) 2,923,957 3,278,881Other members of the Executive Committee 3,193,239 6,621,275Total Executive Committee 6,117,196 9,900,156
Note 1 Including members of the Executive Committee who joined and left in 2018. All loans and credits disclosed for 2018 relate to members who
transferred from the Executive Committee to the Global Business Committee as of 01 July 2018. In 2018 the loans and credits granted to related parties of members of the Board of Directors and the Executive Committee by EFG International and its subsidiaries amounted to a total of CHF 22,541,756 (2017: CHF 23,406,926).
Auditor’s report
Annual Report 2018 | 65
Report of the statutory auditor to the General Meeting of EFG International AG Zurich
Report on the audit of the Compensation Report We have audited the Compensation Report of EFG International AG for the year ended 31 December 2018. The audit was limited to the information according to articles 14–16 of the Ordinance against Excessive Compensation in Stock Exchange Listed Companies (Ordinance) contained in the tables labeled “audited” on pages 61 to 64 of the Compensation Report.
Board of Directors’ responsibility The Board of Directors is responsible for the preparation and overall fair presentation of the Compensation Report in accordance with Swiss law and the Ordinance against Excessive Compensation in Stock Exchange Listed Companies (Ordinance). The Board of Directors is also responsible for designing the remuneration system and defining individual remuneration packages.
Auditor’s responsibility Our responsibility is to express an opinion on the accompanying Compensation Report. We conducted our audit in accordance with Swiss Auditing Standards. Those standards require that we comply with ethical requirements and plan and perform the audit to obtain reasonable assurance about whether the Compensation Report complies with Swiss law and articles 14–16 of the Ordinance.
An audit involves performing procedures to obtain audit evidence on the disclosures made in the Compensation Report with regard to compensation, loans and credits in accordance with articles 14–16 of the Ordinance. The procedures selected depend on the auditor’s judgment, including the assessment of the risks of material misstatements in the Compensation Report, whether due to fraud or error. This audit also includes evaluating the reasonableness of the methods applied to value components of remuneration, as well as assessing the overall presentation of the Compensation Report.
We believe that the audit evidence we have obtained is sufficient and appropriate to provide a basis for our opinion.
Opinion In our opinion, the Compensation Report of EFG International AG for the year ended 31 December 2018 complies with Swiss law and articles 14–16 of the Ordinance.
PricewaterhouseCoopers Ltd
Christophe Kratzer Thomas Romer Audit expert Audit expert Auditor in charge
Geneva, 12 March 2019

66 | Annual Report 2018
EFG International Consolidated Financial Statements for the year ended 31 December 2018
Annual Report 2018 | 67
Consolidated Income Statement 68
Consolidated Statement of Comprehensive Income 69
Consolidated Balance Sheet 70
Consolidated Statement of Changes in Equity 71
Consolidated Cash Flow Statement 73
Notes to the Consolidated Financial Statements 76
Report on the Audit of the Consolidated Financial Statements 205
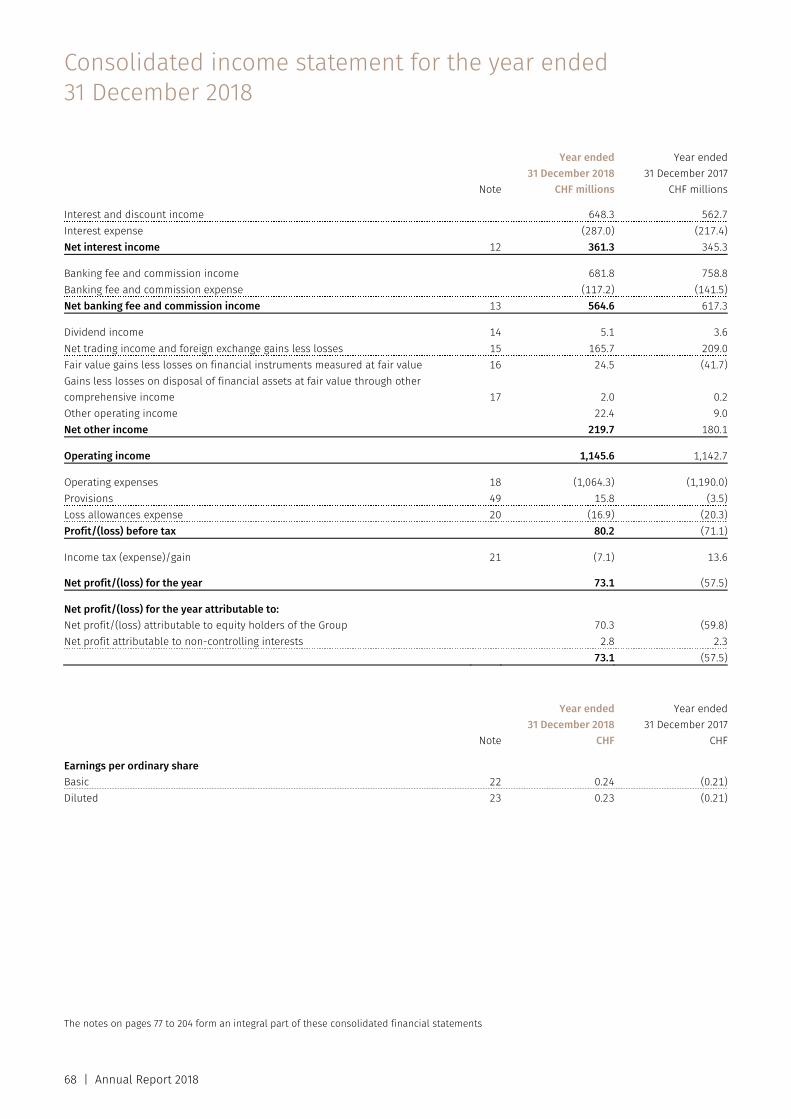
68 | Annual Report 2018
Note
Year ended31 December 2018
CHF millions
Year ended31 December 2017
CHF millions Interest and discount income 648.3 562.7Interest expense (287.0) (217.4)Net interest income 12 361.3 345.3 Banking fee and commission income 681.8 758.8Banking fee and commission expense (117.2) (141.5)Net banking fee and commission income 13 564.6 617.3 Dividend income 14 5.1 3.6Net trading income and foreign exchange gains less losses 15 165.7 209.0Fair value gains less losses on financial instruments measured at fair value 16 24.5 (41.7)Gains less losses on disposal of financial assets at fair value through other comprehensive income 17 2.0 0.2Other operating income 22.4 9.0Net other income 219.7 180.1 Operating income 1,145.6 1,142.7 Operating expenses 18 (1,064.3) (1,190.0)Provisions 49 15.8 (3.5)Loss allowances expense 20 (16.9) (20.3)Profit/(loss) before tax 80.2 (71.1) Income tax (expense)/gain 21 (7.1) 13.6 Net profit/(loss) for the year 73.1 (57.5) Net profit/(loss) for the year attributable to: Net profit/(loss) attributable to equity holders of the Group 70.3 (59.8)Net profit attributable to non-controlling interests 2.8 2.3 73.1 (57.5)
Note
Year ended31 December 2018
CHF
Year ended31 December 2017
CHF Earnings per ordinary share Basic 22 0.24 (0.21)Diluted 23 0.23 (0.21)
Consolidated income statement for the year ended 31 December 2018
The notes on pages 77 to 204 form an integral part of these consolidated financial statements
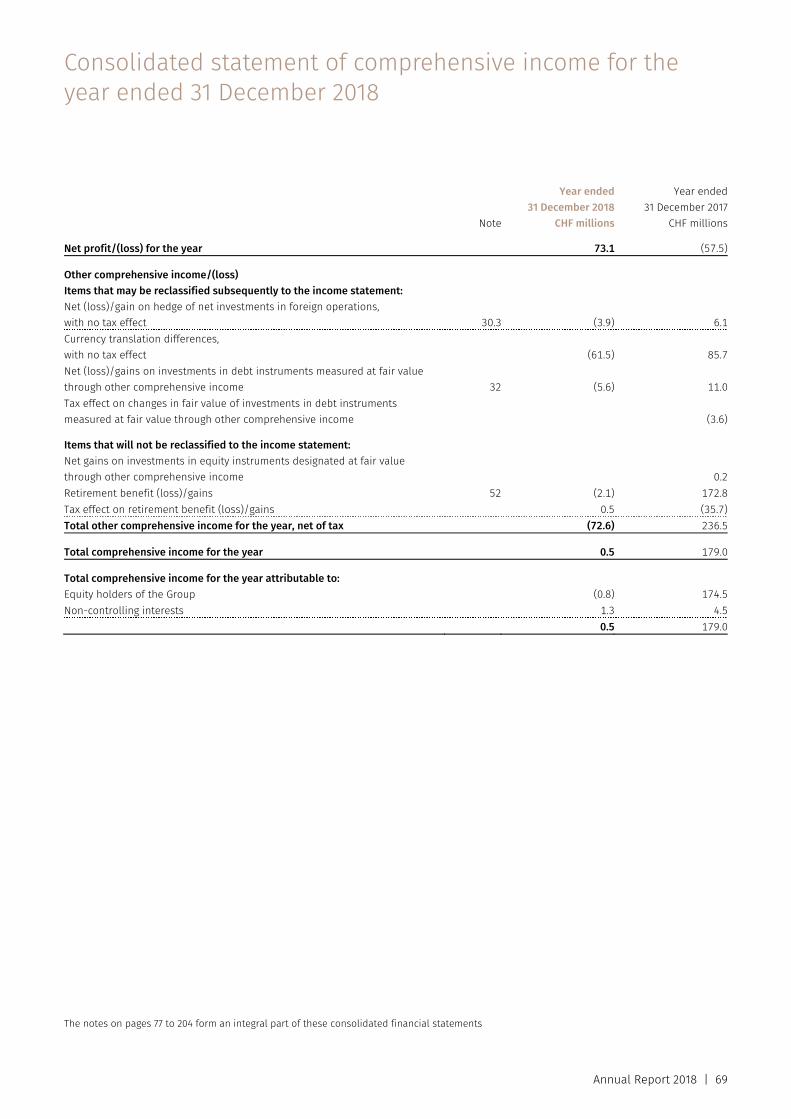
Annual Report 2018 | 69
Note
Year ended31 December 2018
CHF millions
Year ended31 December 2017
CHF millions Net profit/(loss) for the year 73.1 (57.5) Other comprehensive income/(loss) Items that may be reclassified subsequently to the income statement: Net (loss)/gain on hedge of net investments in foreign operations, with no tax effect 30.3 (3.9) 6.1Currency translation differences, with no tax effect (61.5) 85.7Net (loss)/gains on investments in debt instruments measured at fair value through other comprehensive income 32 (5.6) 11.0Tax effect on changes in fair value of investments in debt instruments measured at fair value through other comprehensive income (3.6) Items that will not be reclassified to the income statement: Net gains on investments in equity instruments designated at fair value through other comprehensive income 0.2Retirement benefit (loss)/gains 52 (2.1) 172.8Tax effect on retirement benefit (loss)/gains 0.5 (35.7)Total other comprehensive income for the year, net of tax (72.6) 236.5 Total comprehensive income for the year 0.5 179.0 Total comprehensive income for the year attributable to: Equity holders of the Group (0.8) 174.5Non-controlling interests 1.3 4.5 0.5 179.0
Consolidated statement of comprehensive income for the year ended 31 December 2018
The notes on pages 77 to 204 form an integral part of these consolidated financial statements
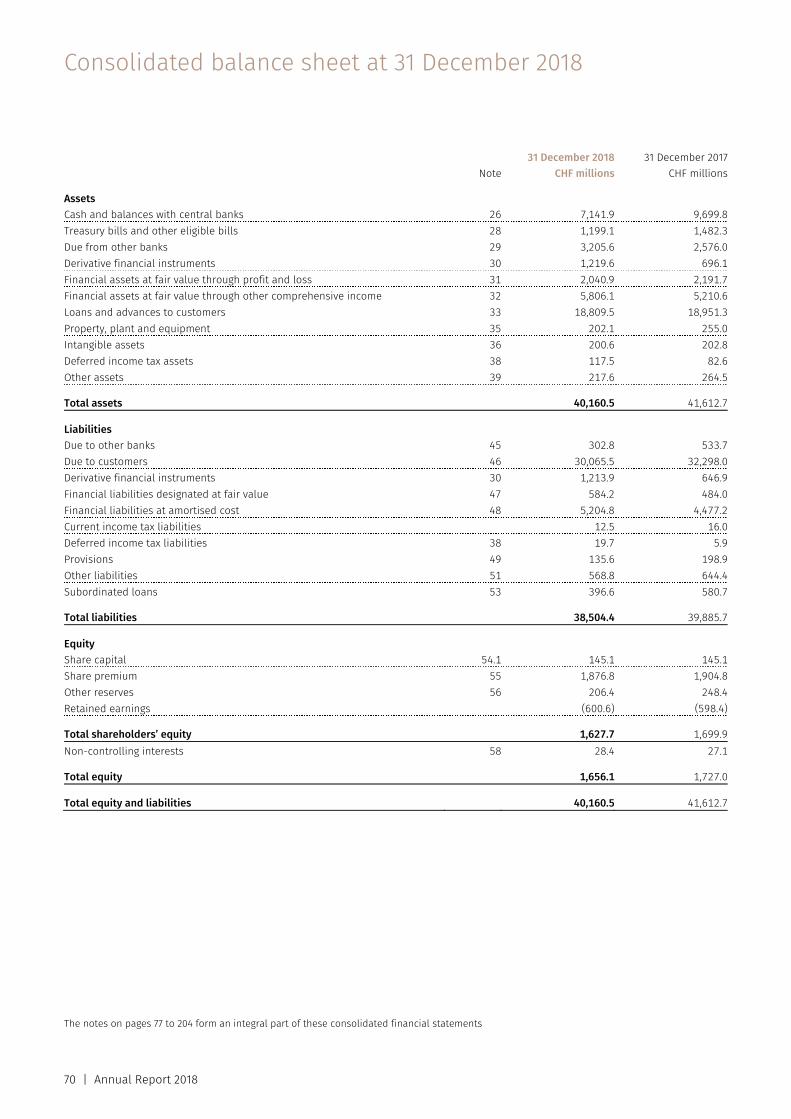
70 | Annual Report 2018
31 December 2018 31 December 2017 Note CHF millions CHF millions Assets Cash and balances with central banks 26 7,141.9 9,699.8Treasury bills and other eligible bills 28 1,199.1 1,482.3Due from other banks 29 3,205.6 2,576.0Derivative financial instruments 30 1,219.6 696.1Financial assets at fair value through profit and loss 31 2,040.9 2,191.7Financial assets at fair value through other comprehensive income 32 5,806.1 5,210.6Loans and advances to customers 33 18,809.5 18,951.3Property, plant and equipment 35 202.1 255.0Intangible assets 36 200.6 202.8Deferred income tax assets 38 117.5 82.6Other assets 39 217.6 264.5 Total assets 40,160.5 41,612.7 Liabilities Due to other banks 45 302.8 533.7Due to customers 46 30,065.5 32,298.0Derivative financial instruments 30 1,213.9 646.9Financial liabilities designated at fair value 47 584.2 484.0Financial liabilities at amortised cost 48 5,204.8 4,477.2Current income tax liabilities 12.5 16.0Deferred income tax liabilities 38 19.7 5.9Provisions 49 135.6 198.9Other liabilities 51 568.8 644.4Subordinated loans 53 396.6 580.7
Total liabilities 38,504.4 39,885.7 Equity Share capital 54.1 145.1 145.1Share premium 55 1,876.8 1,904.8Other reserves 56 206.4 248.4Retained earnings (600.6) (598.4)
Total shareholders’ equity 1,627.7 1,699.9Non-controlling interests 58 28.4 27.1 Total equity 1,656.1 1,727.0 Total equity and liabilities 40,160.5 41,612.7
Consolidated balance sheet at 31 December 2018
The notes on pages 77 to 204 form an integral part of these consolidated financial statements
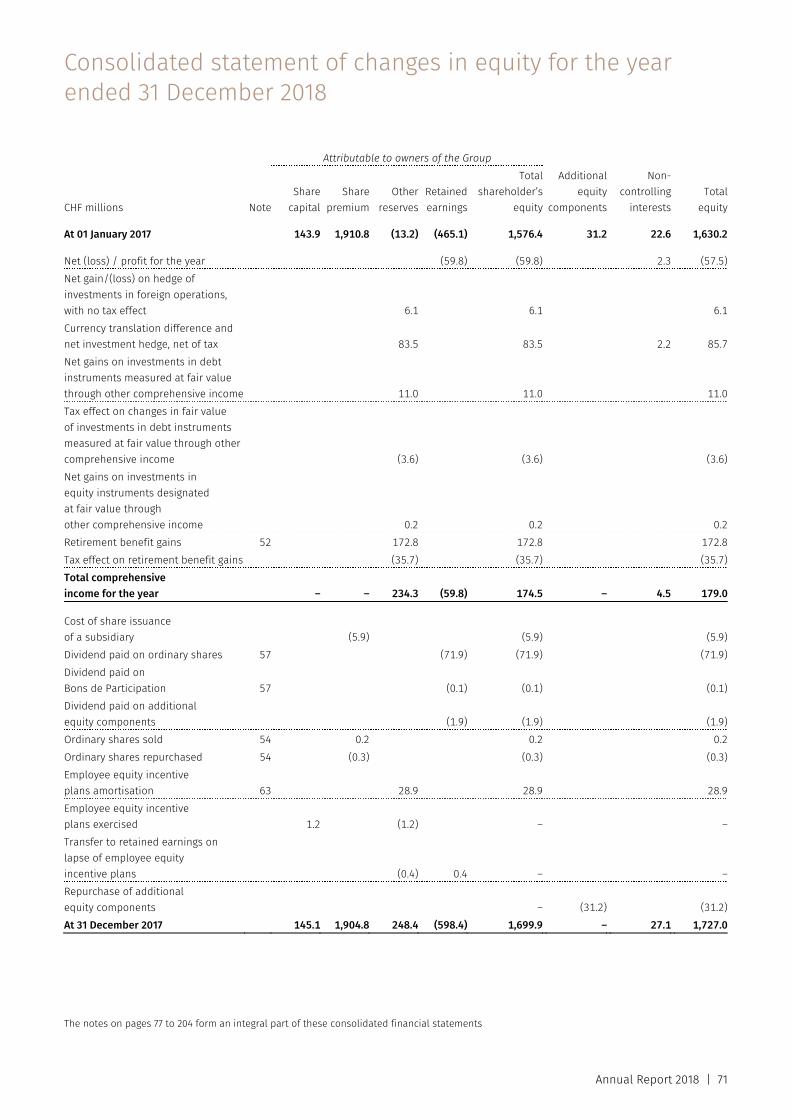
Annual Report 2018 | 71
Attributable to owners of the Group
CHF millions NoteShare
capitalShare
premiumOther
reservesRetainedearnings
Total shareholder’s
equity
Additional equity
components
Non-controlling
interestsTotal
equity At 01 January 2017 143.9 1,910.8 (13.2) (465.1) 1,576.4 31.2 22.6 1,630.2 Net (loss) / profit for the year (59.8) (59.8) 2.3 (57.5)Net gain/(loss) on hedge of investments in foreign operations, with no tax effect 6.1 6.1 6.1 Currency translation difference and net investment hedge, net of tax 83.5 83.5 2.2 85.7 Net gains on investments in debt instruments measured at fair value through other comprehensive income 11.0 11.0 11.0 Tax effect on changes in fair value of investments in debt instruments measured at fair value through other comprehensive income (3.6) (3.6) (3.6)Net gains on investments in equity instruments designated at fair value through other comprehensive income 0.2 0.2 0.2 Retirement benefit gains 52 172.8 172.8 172.8 Tax effect on retirement benefit gains (35.7) (35.7) (35.7)Total comprehensive income for the year – – 234.3 (59.8) 174.5 – 4.5 179.0 Cost of share issuance of a subsidiary (5.9) (5.9) (5.9)Dividend paid on ordinary shares 57 (71.9) (71.9) (71.9)Dividend paid on Bons de Participation 57 (0.1) (0.1) (0.1)Dividend paid on additional equity components (1.9) (1.9) (1.9)Ordinary shares sold 54 0.2 0.2 0.2 Ordinary shares repurchased 54 (0.3) (0.3) (0.3)Employee equity incentive plans amortisation 63 28.9 28.9 28.9 Employee equity incentive plans exercised 1.2 (1.2) – –Transfer to retained earnings on lapse of employee equity incentive plans (0.4) 0.4 – –Repurchase of additional equity components – (31.2) (31.2)At 31 December 2017 145.1 1,904.8 248.4 (598.4) 1,699.9 – 27.1 1,727.0
Consolidated statement of changes in equity for the year ended 31 December 2018
The notes on pages 77 to 204 form an integral part of these consolidated financial statements
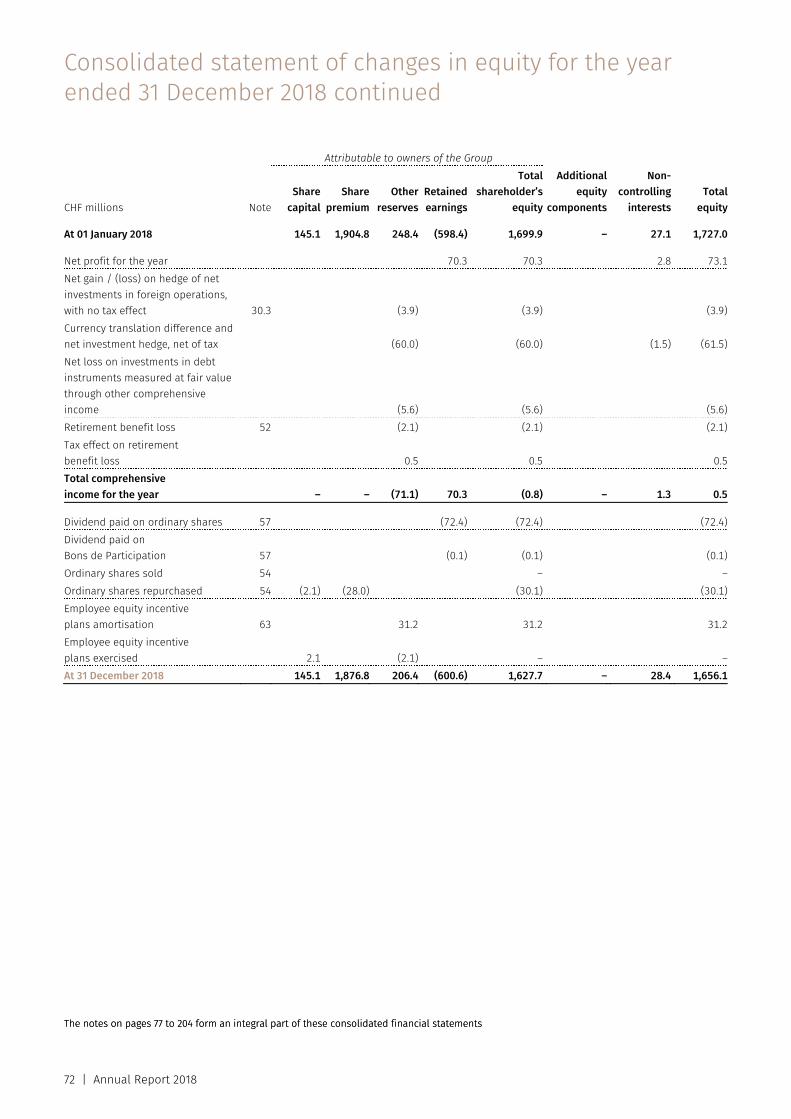
72 | Annual Report 2018
Attributable to owners of the Group
CHF millions Note Share
capitalShare
premiumOther
reservesRetainedearnings
Total shareholder’s
equity
Additional equity
components
Non-controlling
interestsTotal
equity At 01 January 2018 145.1 1,904.8 248.4 (598.4) 1,699.9 – 27.1 1,727.0 Net profit for the year 70.3 70.3 2.8 73.1 Net gain / (loss) on hedge of net investments in foreign operations, with no tax effect 30.3 (3.9) (3.9) (3.9)Currency translation difference and net investment hedge, net of tax (60.0) (60.0) (1.5) (61.5)Net loss on investments in debt instruments measured at fair value through other comprehensive income (5.6) (5.6) (5.6)Retirement benefit loss 52 (2.1) (2.1) (2.1)Tax effect on retirement benefit loss 0.5 0.5 0.5 Total comprehensive income for the year – – (71.1) 70.3 (0.8) – 1.3 0.5 Dividend paid on ordinary shares 57 (72.4) (72.4) (72.4)Dividend paid on Bons de Participation 57 (0.1) (0.1) (0.1)Ordinary shares sold 54 – –Ordinary shares repurchased 54 (2.1) (28.0) (30.1) (30.1)Employee equity incentive plans amortisation 63 31.2 31.2 31.2 Employee equity incentive plans exercised 2.1 (2.1) – –At 31 December 2018 145.1 1,876.8 206.4 (600.6) 1,627.7 – 28.4 1,656.1
Consolidated statement of changes in equity for the year ended 31 December 2018 continued
The notes on pages 77 to 204 form an integral part of these consolidated financial statements The notes on pages 77 to 204 form an integral part of these consolidated financial statements
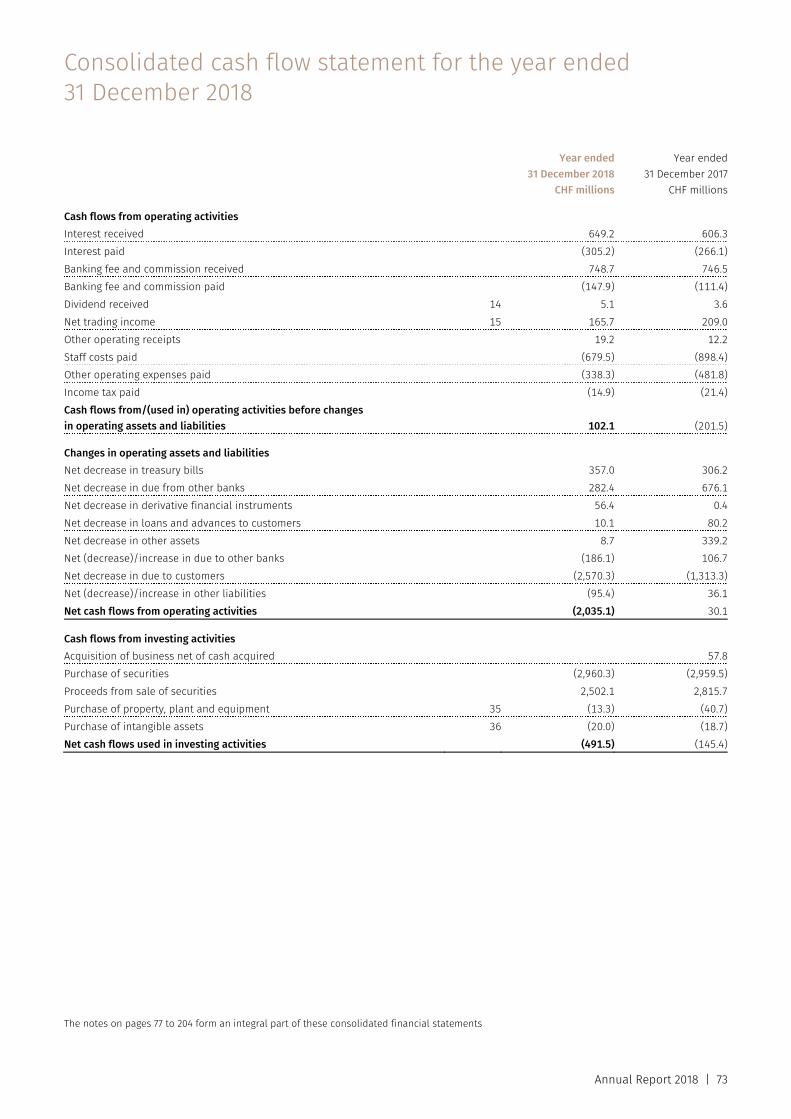
Annual Report 2018 | 73
Year ended31 December 2018
CHF millions
Year ended31 December 2017
CHF millions Cash flows from operating activities Interest received 649.2 606.3Interest paid (305.2) (266.1)Banking fee and commission received 748.7 746.5Banking fee and commission paid (147.9) (111.4)Dividend received 14 5.1 3.6Net trading income 15 165.7 209.0Other operating receipts 19.2 12.2Staff costs paid (679.5) (898.4)Other operating expenses paid (338.3) (481.8)Income tax paid (14.9) (21.4)Cash flows from/(used in) operating activities before changes in operating assets and liabilities 102.1 (201.5) Changes in operating assets and liabilities Net decrease in treasury bills 357.0 306.2Net decrease in due from other banks 282.4 676.1Net decrease in derivative financial instruments 56.4 0.4Net decrease in loans and advances to customers 10.1 80.2Net decrease in other assets 8.7 339.2Net (decrease)/increase in due to other banks (186.1) 106.7Net decrease in due to customers (2,570.3) (1,313.3)Net (decrease)/increase in other liabilities (95.4) 36.1Net cash flows from operating activities (2,035.1) 30.1 Cash flows from investing activities Acquisition of business net of cash acquired 57.8Purchase of securities (2,960.3) (2,959.5)Proceeds from sale of securities 2,502.1 2,815.7Purchase of property, plant and equipment 35 (13.3) (40.7)Purchase of intangible assets 36 (20.0) (18.7)Net cash flows used in investing activities (491.5) (145.4)
Consolidated cash flow statement for the year ended 31 December 2018
The notes on pages 77 to 204 form an integral part of these consolidated financial statements
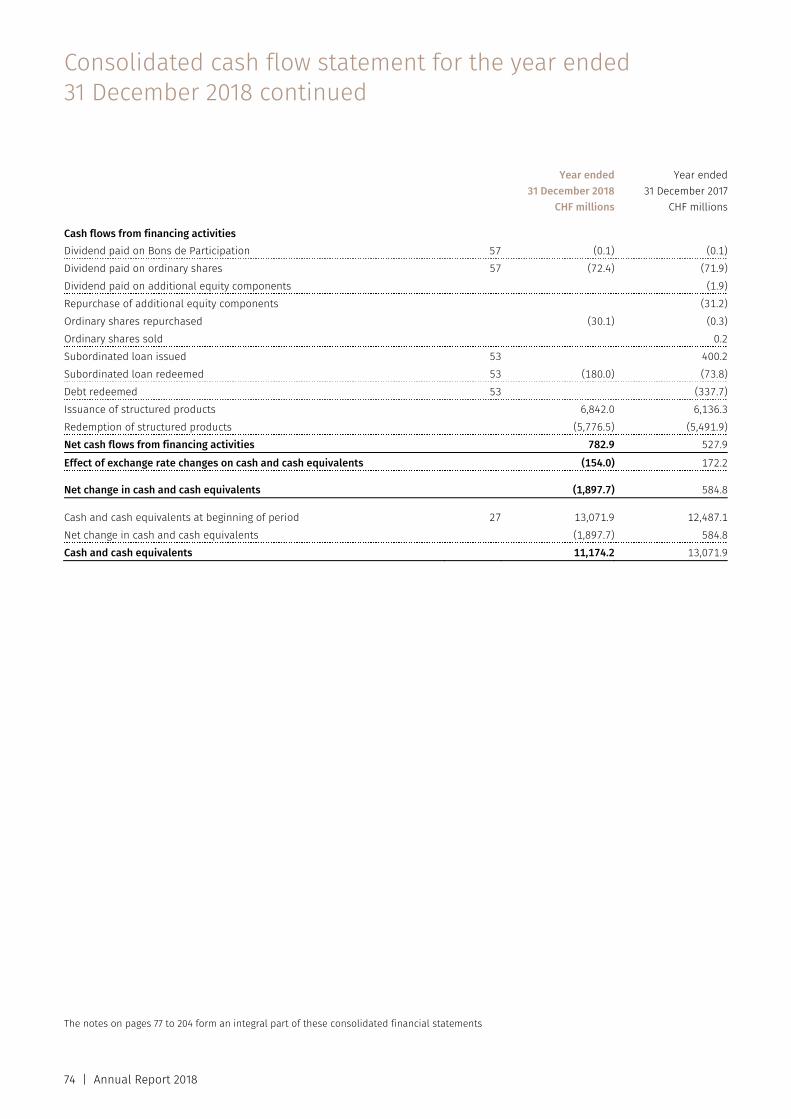
74 | Annual Report 2018
Year ended31 December 2018
CHF millions
Year ended31 December 2017
CHF millions Cash flows from financing activities Dividend paid on Bons de Participation 57 (0.1) (0.1)Dividend paid on ordinary shares 57 (72.4) (71.9)Dividend paid on additional equity components (1.9)Repurchase of additional equity components (31.2)Ordinary shares repurchased (30.1) (0.3)Ordinary shares sold 0.2Subordinated loan issued 53 400.2Subordinated loan redeemed 53 (180.0) (73.8)Debt redeemed 53 (337.7)Issuance of structured products 6,842.0 6,136.3Redemption of structured products (5,776.5) (5,491.9)Net cash flows from financing activities 782.9 527.9
Effect of exchange rate changes on cash and cash equivalents (154.0) 172.2 Net change in cash and cash equivalents (1,897.7) 584.8 Cash and cash equivalents at beginning of period 27 13,071.9 12,487.1Net change in cash and cash equivalents (1,897.7) 584.8Cash and cash equivalents 11,174.2 13,071.9
Consolidated cash flow statement for the year ended 31 December 2018 continued
The notes on pages 77 to 204 form an integral part of these consolidated financial statements

Annual Report 2018 | 75

76 | Annual Report 2018
Notes to the consolidated financial statements
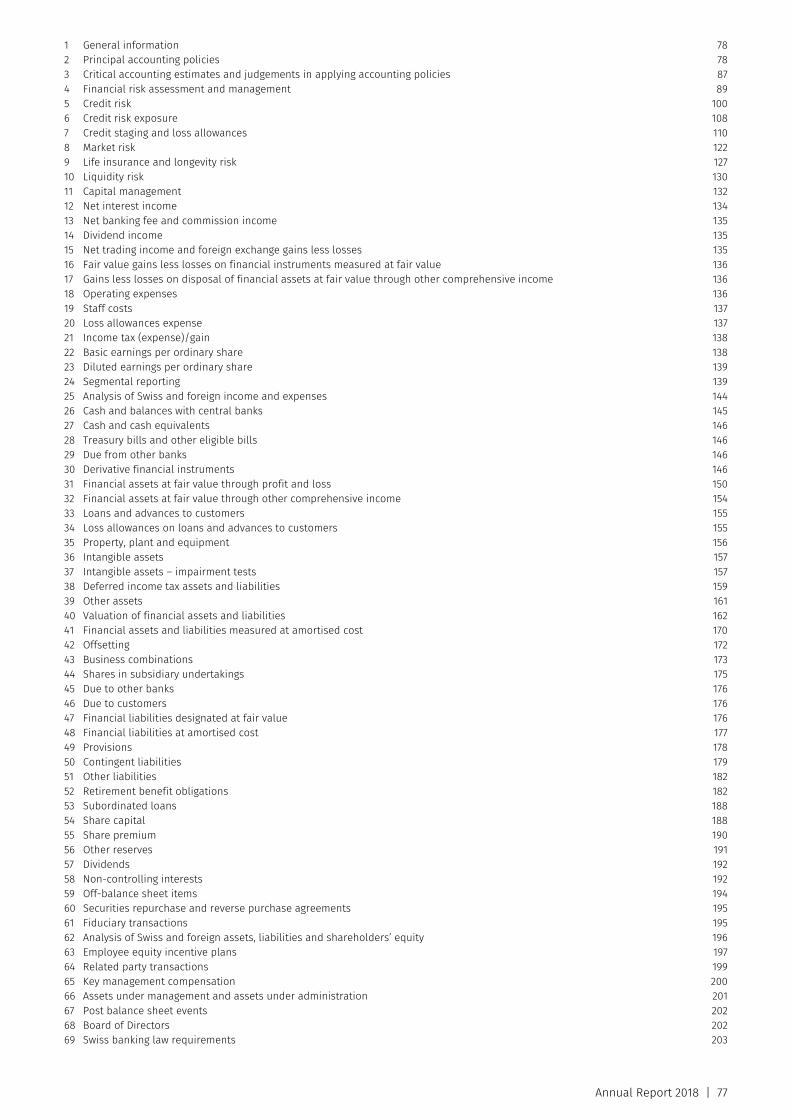
Annual Report 2018 | 77
1 General information 78 2 Principal accounting policies 78 3 Critical accounting estimates and judgements in applying accounting policies 87 4 Financial risk assessment and management 89 5 Credit risk 100 6 Credit risk exposure 108 7 Credit staging and loss allowances 110 8 Market risk 122 9 Life insurance and longevity risk 127 10 Liquidity risk 130 11 Capital management 132 12 Net interest income 134 13 Net banking fee and commission income 135 14 Dividend income 135 15 Net trading income and foreign exchange gains less losses 135 16 Fair value gains less losses on financial instruments measured at fair value 136 17 Gains less losses on disposal of financial assets at fair value through other comprehensive income 136 18 Operating expenses 136 19 Staff costs 137 20 Loss allowances expense 137 21 Income tax (expense)/gain 138 22 Basic earnings per ordinary share 138 23 Diluted earnings per ordinary share 139 24 Segmental reporting 139 25 Analysis of Swiss and foreign income and expenses 144 26 Cash and balances with central banks 145 27 Cash and cash equivalents 146 28 Treasury bills and other eligible bills 146 29 Due from other banks 146 30 Derivative financial instruments 146 31 Financial assets at fair value through profit and loss 150 32 Financial assets at fair value through other comprehensive income 154 33 Loans and advances to customers 155 34 Loss allowances on loans and advances to customers 155 35 Property, plant and equipment 156 36 Intangible assets 157 37 Intangible assets – impairment tests 157 38 Deferred income tax assets and liabilities 159 39 Other assets 161 40 Valuation of financial assets and liabilities 162 41 Financial assets and liabilities measured at amortised cost 170 42 Offsetting 172 43 Business combinations 173 44 Shares in subsidiary undertakings 175 45 Due to other banks 176 46 Due to customers 176 47 Financial liabilities designated at fair value 176 48 Financial liabilities at amortised cost 177 49 Provisions 178 50 Contingent liabilities 179 51 Other liabilities 182 52 Retirement benefit obligations 182 53 Subordinated loans 188 54 Share capital 188 55 Share premium 190 56 Other reserves 191 57 Dividends 192 58 Non-controlling interests 192 59 Off-balance sheet items 194 60 Securities repurchase and reverse purchase agreements 195 61 Fiduciary transactions 195 62 Analysis of Swiss and foreign assets, liabilities and shareholders’ equity 196 63 Employee equity incentive plans 197 64 Related party transactions 199 65 Key management compensation 200 66 Assets under management and assets under administration 201 67 Post balance sheet events 202 68 Board of Directors 202 69 Swiss banking law requirements 203
Notes to the consolidated financial statements EFG International consolidated entities
78 | Annual Report 2018
1. General information
EFG International AG and its subsidiaries (hereinafter collectively referred to as ‘EFG International Group’ or ‘The Group’) are a leading global private banking group, offering private banking, wealth management and asset management services. The Group’s principal places of business are in Bahamas, Cayman, Channel Islands, Hong Kong, Italy, Liechtenstein, Luxembourg, Monaco, Singapore, Spain, Switzerland, the United Kingdom and the United States of America. Across the whole Group, the number of employees (FTEs) at 31 December 2018 was 3,275 (31 December 2017: 3,366).
EFG International AG is a limited liability company and is incorporated and domiciled in Switzerland. The Group is listed on the SIX Swiss Exchange with its registered office at Bleicherweg 8, 8022 Zurich. For details of significant shareholders, refer to note 13 of the Parent Company Financial Statements.
These consolidated financial statements were approved for issue by the Board of Directors on 12 March 2019.
2. Principal accounting policies
The principal accounting policies applied in the preparation of the consolidated financial statements are set out below. These policies have been consistently applied to all the years presented, unless otherwise stated.
(a) Basis of preparation The consolidated financial statements are for the year ended 31 December 2018. These financial statements have been prepared in accordance with those International Financial Reporting Standards (IFRS) and International Financial Reporting Standards Interpretations Committee (IFRS Interpretations Committee) interpretations issued and effective for the year ended 31 December 2018. These consolidated financial statements are subject to the approval of the shareholders.
The consolidated financial statements are prepared under the historical cost convention as modified by the revaluation of financial assets and financial liabilities (including derivative instruments) at fair value.
The preparation of financial statements in conformity with IFRS requires the use of estimates and assumptions that affect the reported amounts of assets and liabilities and disclosure of contingent liabilities at the date of the financial
statements and the reported amounts of revenues and expenses during the reporting period. The process also requires management to exercise its judgement in the process of applying the group’s accounting policies.
Although these estimates are based on management’s best knowledge of current events and actions, actual results ultimately may differ from those estimates. Further information about critical estimates and judgements are presented in note 3.
The Group’s presentation currency is the Swiss franc (CHF) being the functional currency of the parent company and of its major operating subsidiary, EFG Bank AG.
The accounting policies adopted in the preparation of the consolidated financial statements are consistent with those followed in the preparation of the Group’s annual consolidated financial statements for the year ended 31 December 2017. The Group adopted IFRS 9 effective 01 January 2017.
New and amended standards adopted by the Group: The Group has applied the following standards and amendments for the first time for their annual reporting period commencing 01 January 2018: – IFRS 15 Revenue from Contracts with Customers – Classification and Measurement of Share-based Payment
Transactions – Amendments to IFRS 2 – Annual Improvements to IFRS Standards 2014–2016 Cycle – Interpretation 22 Foreign Currency Transactions and
Advance Consideration
The Group also elected to adopt the following amendments early: – Annual Improvements to IFRS Standards 2015–2017 Cycle
The Group adopted IFRS 15 Revenue from Contracts with Customers, which replaces IAS 18 Revenue and establishes principles for revenue recognition that apply to all contracts with customers except those relating to financial instruments, leases and insurance contracts and requires an entity to recognise revenue as performance obligations are satisfied.
The adoption of IFRS 15 resulted in changes to the Groups accounting policies applicable from 01 January 2018. The primary changes arise from the IFRS 15 requirements that fee and commission income is measured based on consideration specified in a legally enforceable contract and variable consideration that is contingent on an uncertain event can only be recognised to the extent that it is highly probable that a significant reversal will not occur.
Annual Report 2018 | 79
As permitted by the transitional provisions of IFRS 15, the Group has not elected to restate the prior-year comparative information. No transition adjustment was required to retained earnings at 01 January 2018.
IFRS 15 also resulted in a change in presentation. Banking fee and commission income is presented gross on the face of the income statement when the Group is considered as principal to the contract. Similarly, Banking fee and commission income are presented net on the face of the income statement when the Group is considered as an agent.
Except for certain reclassifications listed above, the new and amended standards adopted by the Group are not expected to significantly affect the current or future periods.
New and amended standards not yet adopted: Certain new accounting standards and interpretations have been published that are not mandatory for 31 December 2018 reporting periods and have not been early adopted by the Group. The Group’s assessment of the impact of these new standards and interpretations is set out below.
IFRS 16 Leases - IFRS 16 was issued in January 2016. It will result in almost all leases being recognised on the balance sheet by lessees, as the distinction between operating and finance leases is removed. Under the new standard, an asset (the right to use the leased item) and a financial liability to pay rentals are recognised. The only exceptions are short-term and low-value leases.
The Group has reviewed all of the Group’s leasing arrangements over the last year in light of the new lease accounting rules in IFRS 16. The standard will affect primarily the accounting for the Group’s operating leases.
As at the reporting date, the Group has non-cancellable operating lease commitments of CHF 173.9 million. Of these commitments, approximately CHF 7.0 million relate to short-term leases and to low-value leases which will both be recognised on a straight-line basis as expense in profit or loss.
The expected expenses for both the depreciation of the right-of-use asset and the interest expense on the lease liability are not materially different to the currently recognised expenses related to operating leases. The difference between the lease liability under IFRS 16 and the currently reported operating lease commitments (see note 59 Off-balance sheet items) is mainly based on the fact that the operating lease commitments are not discounted to their present value
For the remaining lease commitments, the Group expects to recognise right-of-use assets of approximately CHF 153 million on 01 January 2019, lease liabilities of CHF 153 million (after adjustments for prepayments and accrued lease payments recognised as at 31 December 2018).
The Group expects that net profit after tax will decrease by less than CHF 1.0 million for 2019 as a result of adopting the new rules.
Operating cash flows will increase and financing cash flows decrease by approximately CHF 0.4 million as repayment of the principal portion of the lease liabilities will be classified as cash flows from financing activities.
The Group’s activities as a lessor are not material and hence the Group does not expect any significant impact on the financial statements. However, some additional disclosures will be required from next year.
The Group will apply the standard from its mandatory adoption date of 01 January 2019. The Group intends to apply the simplified transition approach and will not restate comparative amounts for the year prior to first adoption. Right-of-use assets for property leases will be measured on transition as if the new rules had always been applied. All other right-of-use assets will be measured at the amount of the lease liability on adoption (adjusted for any prepaid or accrued lease expenses).
There are no other standards that are not yet effective and that would be expected to have a material impact on the entity in the current or future reporting periods and on foreseeable future transactions. (b) Consolidation (i) Subsidiaries Subsidiary undertakings are all entities (including structured entities) over which the Group, directly or indirectly, has control. The Group controls an entity when the Group is exposed to, or has rights to variable returns from its involvement with the entity and has the ability to affect those returns through its power over the entity. Subsidiaries are fully consolidated from the date on which control is transferred to the Group and are no longer consolidated from the date that control ceases. The Group applies the acquisition method of accounting to account for business combinations. The cost of an acquisition is measured at the fair value of the assets acquired, equity instruments or liabilities undertaken at the date of acquisition including those resulting from contingent consideration arrangements. Costs related to the

Notes to the consolidated financial statements EFG International consolidated entities
80 | Annual Report 2018
acquisition are expensed as incurred. Identifiable assets acquired and liabilities and contingent liabilities assumed in a business combination are measured initially at their fair values at the acquisition date irrespective of the extent of any non-controlling interests. The excess of the cost of acquisition over the fair value of the identifiable net assets of the subsidiary acquired is recorded as goodwill. If the cost of acquisition is less than the fair value of the net assets of the subsidiary acquired, the difference is recognised directly in the income statement.
Intercompany transactions, balances and unrealised gains on transactions between Group companies are eliminated. Unrealised losses are also eliminated but considered an impairment indicator of the asset transferred. Where necessary, accounting policies of subsidiaries have been changed to ensure consistency with the policies adopted by the Group.
A listing of the Company’s main subsidiaries is set out in note 44.
(ii) Non-controlling interests The Group treats transactions with non-controlling interests that do not result in loss of control as transactions with equity owners of the Group. For purchases from non-controlling interests, the difference between any consideration paid and the relevant share acquired of the carrying value of net assets of the subsidiary is recorded in equity. Gains or losses on disposals to non-controlling interests are also recorded in equity.
(iii) Disposal of subsidiaries When the Group ceases to have control or significant influence, any retained interest in the entity is remeasured to its fair value, with the change in carrying amount recognised in the income statement. The fair value is the initial carrying amount for the purposes of subsequently accounting for the retained interest as an associate, joint venture or financial asset. In addition, any amounts previously recognised in other comprehensive income in respect of that entity are accounted for as if the Group had directly disposed of the related assets or liabilities. This may mean that amounts previously recognised in other
comprehensive income are reclassified to the income statement.
(iv) Put options over non-controlling interests A wholly owned subsidiary of EFG International wrote a put option on shares in its subsidiary that are held by non-controlling interests. As the risks and rewards of the shares subject to the put option have not been transferred to the Group, the Group has adopted the double credit approach for balance sheet recognition. It has continued to recognise the non-controlling interest and separately recognised the put option as a liability by reclassification from other reserves within Group equity. This financial liability is measured at management’s best estimate of the redemption amount. Subsequent changes in the value of this liability are recorded in the income statement.
(c) Foreign currencies (i) Functional and presentation currency Items included in the financial statements of each of the Groups entities are measured using the currency of the primary economic environment in which the entity operates (functional currency). The consolidated financial statements are presented in CHF which is the Group’s presentation currency, as the functional currency of the parent company and of its major operating subsidiary, EFG Bank AG.
Assets and liabilities of foreign subsidiaries are translated using the closing exchange rate and income statement items at the average exchange rate for the period reported. All resulting exchange differences are recognised as a separate component of equity (currency translation adjustment) which is reflected in other reserves. Exchange differences arising from the retranslation of the net investment in foreign subsidiaries are taken to shareholders equity until disposal of the net investment and then released to the income statement. Goodwill and fair value adjustments arising on the acquisition of a foreign entity are treated as assets and liabilities of the foreign entity and translated at the closing rate.
Year-end exchange rates and average exchange rates for translation of foreign denominated subsidiaries for the main currencies are as follows:
2018 2018 2017 2017 Closing rate Average rate Closing rate Average rate USD 0.9842 0.9785 0.9760 0.9850GBP 1.2598 1.3059 1.3190 1.2680EUR 1.1269 1.1552 1.1700 1.1110
Annual Report 2018 | 81
(ii) Transactions and balances Foreign currency transactions are translated into the functional currency using the exchange rates prevailing at the dates of the transactions.
(d) Derivative financial instruments and hedging Derivative financial instruments are initially recognised in the balance sheet at fair value on the date on which the derivative contract is entered into, and are subsequently re-measured at their fair value. Fair values are obtained from quoted market prices, including recent market transactions, discounted cash flow models and option pricing models, as appropriate. All derivatives are carried as assets when fair value is positive and as liabilities when fair value is negative.
The best evidence of the fair value of a derivative at initial recognition is the transaction price (i.e. the fair value of the consideration given or received) unless the fair value of that instrument is derived from its comparison with other observable current market transactions in the same instrument (i.e. without modification or repackaging), or based on a valuation technique whose variables include only data from observable markets.
Certain derivatives embedded in other financial instruments, such as the option in a structured product, are treated as separate derivatives when their economic characteristics and risks are not closely related to those of the host contract and the host contract is not carried at fair value through profit and loss. These embedded derivatives are measured at fair value with changes in fair value recognised in the income statement, unless the Group chooses to designate the hybrid contracts at fair value through profit and loss. The method of recognising the resulting fair value gain or loss depends on whether the derivative is designated as a hedging instrument (applying IFRS 9); and if so, the nature of the item being hedged. The Group designates certain derivatives as hedges of the fair value of recognised assets or liabilities or unrecognised firm commitments (fair value hedge).
Hedge accounting is used for derivatives designated as such, provided certain criteria are met. The Group documents, at the inception of the transaction, the relationship between hedged items and hedging instruments, as well as its risk management objective and strategy for undertaking various hedge transactions. The Group also documents its assessment, at hedge inception and on an ongoing basis, as well as upon a significant
change in the circumstances affecting the hedge effective-ness requirements, of whether a hedging relationship meets the hedge effectiveness requirements.
The Group will discontinue hedge accounting in the following scenarios: – When the Group determines that a hedging relationship
no longer meets the risk management objective – When the hedging instrument expires or is sold or
terminated – When there is no longer an economic relationship
between the hedge item and the hedging instrument or the effect of credit risk starts to dominate the value changes that result from that economic relationship
The below summarises the different treatment of derivatives (whether or not hedge accounting is applied):
(i) Fair value hedge Changes in the fair value of derivatives that are designated and qualify as fair value hedges are recorded in the income statement, together with any changes in the fair value of the hedged asset or liability that are attributable to the hedged risk. If the hedge no longer meets the criteria for hedge accounting, the adjustment to the carrying amount of a hedged item, for which the effective interest method is used, is amortised to the income statement over the period to maturity.
(ii) Net investment hedge Any gain or loss on the hedging instrument relating to the effective portion of the hedge is recognised in other comprehensive income; the gain or loss relating to the ineffective portion is recognised immediately in the income statement. Gains and losses accumulated in other comprehensive income are included in the income statement when the foreign operation is disposed of.
(iii) Derivatives that do not qualify for hedge accounting Certain derivative instruments do not qualify for hedge accounting. Changes in the fair value of any derivative instrument that does not qualify for hedge accounting are recognised immediately in the income statement. The fair values of derivative instruments held for trading and hedging purposes are disclosed in note 30.
(e) Offsetting financial instruments Financial assets and liabilities are offset and the net amount presented in the balance sheet when there is a legally enforceable right to offset the recognised amounts and there is an intention to settle on a net basis, or realise the asset and settle the liability simultaneously. Such a right
Notes to the consolidated financial statements EFG International consolidated entities
82 | Annual Report 2018
of set-off must not be contingent on a future event and must be legally enforceable in all of the following circumstances: – In the normal course of business – The event of default – The event of insolvency or bankruptcy
(f) Income Statement (i) Interest income and expenses Interest income and expenses are recognised in the income statement for all interest-bearing instruments on an accrual basis, using the effective interest method. The effective interest rate is the rate that exactly discounts estimated future cash payments or receipts through the expected life of the financial instrument or, when appropriate, a shorter period to the net carrying amount of the financial asset or financial liability. When calculating the effective interest rate, the Group estimates cash flows considering all contractual terms of the financial instrument, but does not consider future credit losses. The calculation includes all amounts paid or received between parties to the contract that are an integral part of the effective interest rate, transaction costs, and any other premiums or discounts. Negative interest on assets is recorded as an interest expense, and negative interest on liabilities is recorded as interest income.
For financial assets at amortised cost or debt instruments at fair value through other comprehensive income in stage 3, the original effective interest rate is applied to the amortised cost of the asset rather than to the gross carrying amount.
Negative interest recorded on placements with Swiss National Bank and the European Central Bank are presented within interest expense.
(ii) Banking fees and commissions Fees and commissions are recognised on an accrual basis.
The Group generates fee and commission income from services provided over time (such as portfolio management and advisory services) or when the Group delivers a specific transaction at a point in time (such as brokerage services). The Group recognises fees earned on transaction-based arrangements at a point in time when the service has been fully provided to the customer. Where the contract requires services to be provided over time, income is recognised on a systematic basis over the life of the agreement.
With the exception of certain portfolio management and advisory fees, all fees are generated at a fixed price.
Portfolio management and advisory fees can be variable depending on the size of the customer portfolio and the Group’s performance as fund manager. Variable fees are recognised when the performance benchmark has been met and when collectability is assured.
The Group acts as principal in the majority of contracts with customers. Where the Group acts as agent (in certain brokerage, custody and retrocession arrangements), it recognises income net of fees payable to other parties in the arrangement.
Fee income generated from providing a service that does not result in the recognition of a financial instrument is presented within banking fees and commission income. Fees generated from the acquisition, issue or disposal of a financial instrument are presented in the income statement in line with the balance sheet classification of that financial instrument.
Performance-related fees or fee components are recognised when the performance criteria are fulfilled and the fee can be reliably measured.
(g) Property, plant and equipment Property, plant and equipment are stated at cost less accumulated depreciation and accumulated impairment losses. Property, plant and equipment are periodically reviewed for impairment, with any impairment charge being recognised immediately in the income statement.
Depreciation is calculated using the straight-line method to write down the cost of property, plant and equipment, to their residual values over their estimated useful life as follows: – Buildings own use: 50 years – Buildings and leasehold improvements: 5–20 years – Computer hardware: 3–10 years – Furniture, equipment and motor vehicles: 3–10 years
Gains and losses on disposals are determined by comparing proceeds with carrying amount. These are included in other operating expenses in the income statement.
(h) Intangible assets This includes the following categories:
(i) Goodwill Goodwill represents the excess, of the cost of an acquisition over the fair value of the Groups share of the net identifiable assets of the acquired undertaking at the date of acquisition. Goodwill on acquisitions of subsidiaries is

Annual Report 2018 | 83
reported under 'Intangible assets’, while goodwill on acquisition of associates is included in 'Investments in associates'. The carrying amount of goodwill is reviewed at least annually. Where evidence of impairment exists, the carrying amount of goodwill is re-assessed and written down to recoverable amount (where recoverable amount is defined as the higher of the assets’ fair value less costs to sell and value in use). Goodwill is allocated to cash-generating units for the purpose of impairment testing. Gains and losses on the disposal of an entity include the carrying amount of goodwill relating to the entity sold.
(ii) Other intangible assets – Client relationships They are stated at costs less accumulated amortisation calculated on the basis of a 14-year useful life. The remaining life is reviewed periodically for reasonableness.
(iii) Other intangible assets – Computer software Computer software is stated at cost less accumulated amortisation and impairment losses. It is periodically reviewed for impairment, with any impairment charge being recognised in the income statement. Amortisation is calculated using the straight-line method over a 3-10 year basis. The acquisition cost of software capitalised is on the basis of the cost to acquire and bring into use the specific software.
(i) Financial assets and liabilities All financial assets are recorded on the day the transaction is undertaken, with the exception of loans and advances to customers, which are entered in the balance sheet on their respective value dates. Purchases and sales of other financial assets at fair value or amortised cost are recognised on trade date, which is the date on which the Group commits to purchase or sell the asset. Loans and advances to customers are recognised when cash is advanced to the borrowers.
Measurement methods: Amortised cost and effective interest rate The amortised cost is the value at which the financial asset or financial liability is measured at initial recognition minus the principal repayments, plus or minus the cumulative amortisation using the effective interest method of any difference between that initial value and the maturity value and, for financial assets, adjusted for any loss allowance.
The effective interest rate is the rate that exactly discounts estimated future cash payments or receipts through the expected life of the financial asset or financial liability to the gross carrying value of a financial asset or to the amortised cost of a financial liability. The calculation does
not consider expected credit losses and includes transaction costs, premiums or discounts and fees paid or received that are integral to the effective interest rate, such as origination fees. For purchased or originated credit-impaired financial assets (i.e. assets that are credit-impaired at initial recognition), the Group calculates the credit-adjusted effective interest rate, which is calculated based on the amortised cost of the financial asset instead of its gross carrying value and incorporates the impact of expected credit losses in estimated future cash flows.
When the Group revises the estimates of future cash flows, the carrying value of the respective financial asset or financial liability is adjusted to reflect the new estimated discount using the original effective interest rate. Any changes are recognised in profit or loss.
Initial recognition and measurement At initial recognition, the Group measures a financial asset or financial liability at its fair value. In case of a financial asset or financial liability subsequently not measured at fair value through profit or loss, transaction costs that are incremental and directly attributable to the acquisition or issue of the financial asset or financial liability, such as fees and commissions, are included to the fair value at initial recognition. Transaction costs of financial assets and financial liabilities carried at fair value through profit or loss are expensed as incurred.
Immediately after initial recognition, an expected credit loss is recognised for financial assets measured at amortised cost and investments in debt instruments measured at fair value through other comprehensive income, which results in an accounting loss being recognised in profit or loss when an asset is newly originated.
Business models: The business model reflects how the Group manages the assets in order to generate cash flows. That is, whether the Group’s objective is solely to collect the contractual cash flows from the assets or is to collect both the contractual cash flows and cash flows arising from the sale of assets. If neither of these is applicable (e.g. financial assets are held for trading purposes), then the financial assets are classified as ‘other’ business model and measured at FVTPL. Factors considered by the Group in determining the business model for a group of assets include past experience on how the cash flows for these assets were collected, how the asset’s performance is evaluated and reported to key management personnel, how risks are assessed and managed and how management are compensated.
Notes to the consolidated financial statements EFG International consolidated entities
84 | Annual Report 2018
Solely payment of principal and interest: where the business model is to hold assets to collect contractual cash flows or to collect contractual cash flows and sell, the Group assesses whether the financial instrument’s cash flows represent solely payments of principal and interest (the ‘SPPI test’). In making this assessment, the Group considers whether the contractual cash flows are consistent with a basic lending arrangement, i.e. interest includes only consideration for the time value of money, credit risk, other basic lending risks and a profit margin that is consistent with a basic lending arrangement. Where the contractual terms introduce exposure to risk or volatility that are inconsistent with a basic lending arrangement, based on qualitative or quantitative criteria, the related financial asset is classified and measured at fair value through profit or loss.
Fair value through other comprehensive income Debt instruments that are held for collection of contractual cash flows and for selling the assets, where the asset’s cash flows represent solely payments of principal and interest, and that are not designated at fair value through profit or loss, are measured at fair value through other comprehensive income. Movements in the carrying amount are taken through other comprehensive income, except for loss allowances, interest revenue and foreign exchange gains and losses on the instruments’ amortised cost, which are recognised in profit and loss. When the financial asset is derecognised, the cumulative gain or loss previously recognised in other comprehensive income is reclassified from equity to profit or loss and recognised in 'Net gains/losses on derecognition of financial assets and liabilities’. Interest income from these financial assets is included in 'Interest income' using the effective interest rate method.
Equity instruments are instruments that meet the definition of equity from the issuer’s perspective; that is, instruments that do not contain a contractual obligation to pay and that evidence a residual interest in the issuer’s net assets. Examples of equity instruments include basic ordinary shares.
The Group subsequently measures all equity investments at fair value through profit and loss, except where the Group’s management has elected at initial recognition, to irrevocably designate an equity investment at fair value through other comprehensive income. The Group’s policy is to designate equity investments in fair value through other comprehensive income when those investments are held for purposes other than to generate investment returns. When this election is used, fair value gains and losses are
recognised in other comprehensive income and are not subsequently reclassified to profit and loss, including on disposal. Impairment losses (and reversal of impairment losses) are not reported separately from other changes in fair value. Dividends, when representing a return on such investments, continue to be recognised in profit and loss as other income when the Group’s right to receive payment is established.
Fair value through profit or loss Assets that do not meet the criteria for amortised cost or fair value through other comprehensive income are measured at fair value through profit or loss. Other movements in the fair value (for example from interest rate or credit risk changes) are not part of a hedging relationship and are presented in the income statement within ‘Fair value gains less losses on financial instruments measured at fair value’ in the period in which they arise.
Gains and losses on equity investments at fair value through profit and loss are included in “Fair value gains less losses on financial instruments measured as fair value).
Impairment The Group assesses on a forward-looking basis the expected credit loss associated with the related financial assets carried at amortised cost and fair value through other comprehensive income and with the exposure arising from loan commitments and financial guarantee contracts. The Group recognises a loss allowance for such losses at each reporting date. The measurement of expected credit loss reflects: – An unbiased and probability-weighted value that is
determined by evaluating a range of possible outcomes – The time value of money – Reasonable and supportable information that is available
without undue cost or effort at the reporting date about past events, current conditions and forecasts of future economic conditions
See notes 5 and 7.
Classification and subsequent measurement of financial liabilities, financial guarantees contracts and loan commitments In both the current and prior period, financial liabilities are classified as subsequently measured at amortised cost, except for: – Financial liabilities at fair value through profit or loss: this
classification is applied to derivatives, financial liabilities held for trading (e.g. short positions in the trading booking). Gains or losses on financial liabilities designated at fair value through profit or loss are
Annual Report 2018 | 85
presented partially in other comprehensive income (the value of change in the fair value of the financial liability that is attributable to changes in the credit risk of that liability, which is determined as the value that is not attributable to changes in market conditions that give rise to market risk) and partially profit or loss (the remaining value of change in the fair value of the liability). This is unless such a presentation would create, or enlarge, an accounting mismatch in which case the gains and losses attributable to changes in the credit risk of the liability are also presented in profit or loss
– Financial guarantee contracts and loan commitments: Financial guarantee contracts are initially measured at fair value and subsequently measured at the higher of the expected credit loss value; and the premium received on initial recognition less income recognised in accordance with the principles of IAS 18 for 2017 and IFRS 15 for 2018. Loan commitments provided by the Group are measured as the value of the expected loss allowance. For loan commitments and financial guarantee contracts, the loss allowance is recognised as a provision. If the contract includes both a loan and an undrawn commitment and the expected credit loss on the undrawn commitment cannot be separated from the loan component, the expected credit loss on the undrawn commitment is recognised together with the loss allowance for the loan. If the combined expected credit loss exceeds the carrying amount of the loan, the excess is recognised as a provision
Derecognition of financial assets and liabilities A financial asset, or a portion thereof, is derecognised when the contractual rights to receive cash flows from the asset have expired, or when they have been transferred and either (i) the Group transfers substantially all the risks and rewards of ownership, or (ii) the Group neither transfers nor retains substantially all the risks and rewards of ownership and the Group has not retained control. In case of modification of loans when the Group renegotiates or otherwise modifies the contractual cash flows of a loan, it assesses whether or not the new terms are substantially different from the original terms, considering a range of factors that include reduction in cash flows when the borrower is expected to be able to pay, new substantial terms are introduced, extension of the loan term, changes in interest rate and currency or insertion of collaterals or credit enhancement facilities. If terms are substantially different after the modification, the Group derecognises the original financial asset and recognises a new asset at fair value, recalculating a new effective interest rate for the asset. If the terms of the modified asset are not substantially different, the asset is not derecognised, but
the Group revises the new cash flows, resulting in a modification gain or loss.
A financial liability is derecognised when extinguished (i.e. the obligation specified in the contract is discharged, cancelled or expires). In case of modification of terms of financial liabilities, the Group extinguishes the current liability and recognises a new liability only if the modification is considered a substantial modification of the terms (i.e. if the discounted present value of the cash flows under the new terms, including any fees paid net of any fees received and discounting using the original effective interest rate, is at least 10% different from the discounted present value of the remaining cash flows of the original financial liability). Any costs or fees incurred are recognised as part of the gain or loss on the extinguishment if the modification is accounted for as an extinguishment. Otherwise, costs and fees incurred adjust the carrying amount of the liability and are amortised over the remaining term of the modified liability.
(j) Debt securities in issue and other financial liabilities Borrowings are recognised initially at fair value, being their issue proceeds (fair value of consideration received) net of transaction costs incurred. Borrowings are subsequently stated at amortised cost; any difference between proceeds, net of transaction costs and the redemption value is recognised in the income statement over the life of the borrowings using the effective interest method. If the Group purchases its own debt, it is removed from the balance sheet, and the difference between the carrying amount of the liability and the consideration paid is included in gains less losses from other securities.
(k) Leases The leases entered into by the Group are operating leases. The total payments made under operating leases are charged to the income statement on a straight-line basis over the life of the lease. This policy will change for periods ended after 01 January 2019 - see note 2 (a).
(l) Deferred income tax Deferred income tax is provided, using the liability method, on all temporary differences arising between the tax bases of assets and liabilities and their carrying values for financial reporting purposes. The expected effective tax rates are used to determine deferred income tax. The principal temporary differences arise from goodwill impairment, property, plant and equipment depreciation, pension and other retirement benefits obligations, and revaluation of certain financial assets and liabilities, including derivative instruments.
Notes to the consolidated financial statements EFG International consolidated entities
86 | Annual Report 2018
Deferred tax assets are only recognised to the extent that it is probable that they will crystallise in the future. Deferred tax relating to changes in fair values of financial assets classified as Fair Value through other comprehensive income, which is taken directly to the Statement of other comprehensive income, is charged or credited directly to other comprehensive income and is subsequently recognised in the income statement together with the deferred gain or loss.
Income tax payable on profits, based on the applicable tax law in each jurisdiction, is recognised as an expense in the period in which profits arise. The tax effects of income tax losses available for carry forward are recognised as an asset when it is probable that future taxable profits will be available against which these losses can be utilised.
(m) Employee benefits (i) Retirement benefit obligations The Group operates various pension schemes which are either defined contribution or defined benefit plans, depending on prevailing practice in each country.
For defined contribution plans, the Group pays contribu-tions to publicly or privately administered pension plans and has no further payment obligations once the contributions have been paid. The contributions are recognised as employee benefit expense when they are due. Prepaid contributions are recognised as an asset. The Group has no legal or constructive obligations to pay further contributions if the funds do not hold sufficient assets to pay all employees the benefits relating to employee service in the current and prior periods.
This applies to most of the locations where the Group operates except for Switzerland.
A defined benefit plan is a pension plan that is not a defined contribution plan. The Switzerland pension plans in place are classified as defined benefit plans. Typically, defined benefit plans define an amount of pension benefit that an employee will receive on retirement, usually dependent on one or more factors such as age, years of service and compensation. In Switzerland, the Group maintains pension plans according to Swiss pension law. The Groups legal obligation, in respect of these plans, is merely to pay contributions at defined rates (defined contribution). However, these plans incorporate certain guarantees of minimum interest accumulation and conversion of capital to pension. As a result, these plans have been reported as defined benefit pension plans for IFRS purposes.
The liability recognised in the balance sheet in respect of defined benefit pension plans is the present value of the defined benefit obligation at the end of the reporting period less the fair value of plan assets. The defined benefit obligation is calculated annually by independent actuaries using the projected unit credit method. The present value of the defined benefit obligation is determined by discounting the estimated future cash outflows using interest rates of high-quality corporate bonds that are denominated in the currency in which the benefits will be paid, and that have terms to maturity approximating to the terms of the related pension obligation. In countries where there is no deep market in such bonds, the market rates on government bonds are used as reference of risk-free rates. Actuarial gains and losses arising from experience adjustments and changes in actuarial assumptions are charged or credited to other comprehensive income in the period in which they arise. Past-service costs are recognised immediately in income statement.
(ii) Short-term employee benefits The Group recognises short-term compensated absences and approved bonuses as a liability and an expense.
(iii) Share-based compensation The Group operates an equity-settled, share-based compensation plan. The fair value of the employee services received in exchange for the grant of the options or restricted stock units is recognised as an expense over the vesting period for options or restricted stock units granted under the plan.
The total amount to be expensed over the vesting period is determined by reference to the fair value of the options or restricted stock units granted, excluding the impact of any non-market-vesting conditions (for example, profitability and revenue growth targets). Non-market-vesting conditions are included in assumptions about the number of options and restricted stock units that are expected to become exercisable. The expense recognised during each period is the pro-rata amount of the fair value of options expected to become exercisable plus the impact of the revision of original estimates, if any, which is recognised in the income statement, and a corresponding adjustment to equity over the remaining vesting period.
The proceeds received net of any directly attributable transaction costs are credited to the share capital (nominal value) and share premium when the options are exercised.
Annual Report 2018 | 87
(n) Related party transactions Related parties include associates, fellow subsidiaries, directors and key members of the management, their close families, companies owned or controlled by them and companies whose financial and operating policies they can influence. Transactions of similar nature are disclosed on an aggregate basis.
(o) Provisions Provisions are recognised when: – The Group has a present legal or constructive obligation
as a result of past events – It is probable that an outflow of economic benefits will be
required to settle the obligation – Reliable estimates of the amount of the obligation can
be made
Restructuring provisions comprise lease termination penalties and employee termination payments. Provisions are not recognised for future operating losses. Where there are a number of similar obligations, the likelihood that an outflow will be required in settlement is determined by considering the class of obligations as a whole. A provision is recognised even if the likelihood of an outflow with respect to any one item included in the same class of obligations may be small.
(p) Share capital and share premium Ordinary shares and non-voting Bons de Participation issued are classified as equity.
(i) Share issue costs Incremental costs directly attributable to the issue of new shares or Bons de Participation are shown in equity as a deduction from the proceeds attributable to share premium.
(ii) Dividends on ordinary shares Dividends on ordinary shares are recognised in equity in the period in which they are approved by the Company’s shareholders.
(iii) Treasury shares Where the Group purchases its own equity share capital, the consideration paid is deducted from total shareholders’ equity, and classified as treasury shares until they are cancelled. If such shares are subsequently sold or reissued, any consideration received is included in shareholders’ equity.
(q) Fiduciary activities Where the Group acts in a fiduciary capacity, such as nominee, trustee or agent, assets and income arising on fiduciary activities, together with related undertakings to return such assets to customers, are excluded from the financial statements. See note 61.
(r) Cash and cash equivalents Cash and cash equivalents include cash in hand, deposits held at call with banks, short-term deposits and other short-term highly liquid investments with original maturities of three months or less.
(s) Comparatives Where necessary, comparative figures have been adjusted to conform to changes in presentation in the current year.
(t) Repurchase and reverse-repurchase agreements Repurchase and reverse-repurchase agreements are treated as secured financing agreements. The transfer of securities in the case of repurchase and reverse-repurchase agreements is not recorded in the balance sheet since the risks and rewards of ownership of the securities are not transferred. In reverse-repurchase agreements, cash collateral provided and in repurchase agreements, the cash collateral received is stated on the balance sheet. Interest income from reverse-repurchase agreements and interest expense from repurchase agreements are accrued in the period in which they are incurred.
3. Critical accounting estimates and judgements in applying accounting policies
In the process of applying the EFG International Group’s accounting policies, the Group’s management makes various judgements, estimates and assumptions that may affect the reported amounts of assets and liabilities recognised in the financial statements in future periods. Estimates and judgements are continually evaluated and are based on historical experience and other factors, including expectations of future events that are believed to be reasonable under the circumstances.
(a) Fair value of financial instruments The fair value of financial instruments that are not quoted in an active market is determined using valuation techniques (note 40). Where valuation techniques (for example, models) are used to determine fair values, they are validated and periodically reviewed by qualified personnel independent of the personnel that created them. All models are validated before they are used, and models
Notes to the consolidated financial statements EFG International consolidated entities
88 | Annual Report 2018
are calibrated to ensure that outputs reflect actual data and comparative market prices. To the extent practicable, models use only observable data, however areas such as credit risk (both own and counterparty), volatilities and correlations require management to make estimates. Changes in assumptions about these factors could affect the reported fair value of financial instruments.
(b) Expected credit loss allowance The measurement of the expected credit loss allowance for financial assets measured at amortised cost and fair value through other comprehensive income is an area that requires the use of complex models and significant assumptions about future economic conditions and credit behaviour (e.g. the likelihood of customers defaulting and the resulting losses). Explanation of the inputs, assumptions and estimation techniques used in measuring the expected credit losses are further detailed in note 7, which also sets out the key sensitivities of the expected credit losses to changes in these elements.
A number of significant judgements are also required in applying the accounting requirements for measuring the expected credit losses, such as: – Determining the criteria for significant increase in
credit risk – Choosing appropriate models and assumptions for the
measurement of expected credit losses – Establishing the number and relative weightings of
forward-looking scenarios for each type of product and the associated expected credit losses
– Establishing groups of similar financial assets for the purposes of measuring the expected credit losses
As described in note 7.5 (ii) the Group has a gross exposure, which including accrued interest, amounts to USD 197.0 million (2017: USD 193.8 million) for a lombard loan extended to an affiliate of a Taiwanese insurance company. This loan was determined to be credit impaired. Due to the uncertainty relating to the outcome of the litigations, the Group has exercised judgement in determining the loss allowances for this loan. The Group has estimated the expected credit loss based on probability-weighted expected values of multiple outcomes. The expected credit loss related to this loan totalled CHF 76.3 million (2017: CHF 70.2 million).
As described in note 7.5 (ii), lombard loans of CHF 337.8 million at 31 December 2018 have been extended to third party funds in Sweden collateralised by the assets of these funds. The collateral mainly comprises of life insurance policies issued by US life insurance companies. The funds pay a periodic premium to the life insurance companies to keep
the policies valid and the funds rely on the funding provided by the Group to make the premium payments. The Group assessed whether the funds’ reliance on the future death benefits in order to repay the loans to the Group prevented the loans passing the “Solely payment of principal and interest” (SPPI) test. It was judged that the SPPI test was passed as (i) the repayment of the loans was not contractually dependent on the collection of the death benefits by the fund, and (ii) the Fund had contributed significant assets by the time the loans were issued. The expected credit losses related to these loans totalled CHF 107.8 million (2017: CHF 81.1 million).
(c) Financial instruments at fair value – Life insurance policies
EFG International Group follows the guidance of IFRS 13 on the valuation of unquoted designated at fair value life insurance policies. Given the illiquidity of the market for life insurance policies and the absence of market observable valuations for portfolios of similar characteristics, EFG International Group had to exercise judgement in determining the fair value and the carrying amount of life insurance policies. For determining the fair value, the Group has adopted an Income Approach (Method 1). The Income Approach risk adjusts future cash flows and then discounts these using a risk-free rate. The key risk adjustments made in the fair value measurement include longevity risk (including the risk of statistical volatility) and risk of change in cost of insurance. The valuation is highly sensitive to longevity risk and risk of change in cost of insurance (premium increase risk), and as a result the Group discloses sensitivities to these in note 31. Management judgement is applied to the estimation of future premium streams and cost of insurance, and the outcome of disputes with insurers involving significant increases in premiums. See note 31 for futher details.
(d) Impairment of intangible assets EFG International Group tests at least annually whether goodwill has suffered impairment in accordance with the accounting policy stated in note 2 (h). The recoverable amounts of cash-generating units are the higher of the assets’ value in use and fair value less costs of disposal which is determined on the basis of the best information available on the amount that could be obtained from the disposal of the assets in an arm’s-length transaction, after deduction of the costs of disposal. The value in use is determined by using a discounted cash flow calculation based on the estimated future operating cash flows of the asset. An impairment is recorded when the carrying amount exceeds the recoverable amount. For key assumptions used
Annual Report 2018 | 89
in value in use calculations and further information please refer to note 36.
(e) Income taxes and deferred tax EFG International Group is subject to income taxes in various jurisdictions. Estimates are required in determining the worldwide provision for income taxes. There are many transactions and calculations for which the ultimate tax determination is uncertain during the ordinary course of business.
Significant estimates are required to determine the current and deferred tax assets and liabilities. A deferred tax asset is recognised for the carry forward of unused tax losses to the extent that it is probable that future taxable profits will be available against which the unused tax losses can be utilised. To the extent that it is not probable that taxable profit will be available against which unused tax losses can be utilised, the deferred tax asset is not recognised.
(f) Provisions Provisions are recognised when the EFG International Group has a present legal or constructive obligation as a result of past events; it is probable that an outflow of resources will be required to settle the obligation; and the amount can be reliably estimated. The determination of whether an outflow is probable and the amount, which is assessed by EFG International Group management in conjunction with the Group’s legal and other advisors, requires the judgement of the Group’s management.
(g) Retirement benefit obligations The present value of the pension obligations depends on a number of factors that are determined on an actuarial basis using a number of assumptions. The assumptions used in determining the net cost (income) for pensions include the discount rate. Any changes in these assumptions will impact the carrying amount of pension obligations.
EFG International Group determines the appropriate discount rate at the end of each year. This is the interest rate that should be used to determine the present value of estimated future cash outflows expected to be required to settle the pension obligations. In determining the appropriate discount rate, the EFG International Group considers the interest rates of high-quality corporate bonds that are denominated in the currency in which the benefits will be paid and that have terms to maturity approximating the terms of the related pension obligation. Other key assumptions for pension obligations are based in part on current market conditions. Additional information is disclosed in note 52.
4. Financial risk assessment and management
EFG International AG (EFG International; the Company) and all its subsidiaries (together EFG International Group) acknowledges that carrying out business in the banking and financial services industry entails risks, i.e. that events may occur which impact EFG International Group’s ability to deliver on its objectives. EFG International Group believes that the proper management of risks is critical for the continued success of EFG International.
Risk management comprises the people, processes, and systems designed to ensure that risks are appropriately identified, measured, monitored and reported, as well as mitigated on an ongoing basis.
Importance of risk management For EFG International Group, risk management is of crucial importance in order to: – Ensure it understands and controls its exposure to risk – Ensure that risk exposures are in line with risk capacity
and defined risk appetite and strategy – Help EFG International Group successfully implement its
corporate strategy – Protect clients from potential risks, such as unsuitable
products or excess concentrations – Contribute to the orderly functioning and sound
reputation on the markets in which EFG International Group operates
Approach to risk management EFG International Group has developed a multi-dimensional approach to risk management: – There are independent Risk Control and Compliance
functions with clearly defined objectives – There is a comprehensive and prioritised list of risk
categories – There is a defined risk strategy and risk appetite – There is a coherent and comprehensive set of policies,
directives and procedures to govern risk management including compliance
– The effectiveness and efficiency of risk management is supervised by the Board of Directors with the support and advice of a dedicated Risk Committee
Purpose and objectives of the risk management The objectives of risk management are to: – Provide transparency on the risks EFG International Group
incurs – Provide independent oversight and challenge that risks
are adequately managed – Enable better management of the risk-return trade-off
Notes to the consolidated financial statements EFG International consolidated entities
90 | Annual Report 2018
– Support the Board of Directors in defining an adequate risk appetite and strategy and ensure the actual risk profile remains in line with these
– Secure an appropriate degree of protection and promote effective competition in the interest of clients
The role of risk culture in supporting effective risk management EFG International Group believes the behavioural element is key to ensure sound risk management, and that this is guided by the risk culture of the organisation. Accordingly, risk culture is viewed as a core component of effective risk management.
To frame this topic, EFG International Group approaches risk culture along four dimensions in line with Financial Stability Board principles: – Tone from the top: The Board of Directors, the Executive
Committee and senior management are the starting point for setting EFG International Group’s core values and risk culture; their behaviour reflects the risk culture that is expected throughout EFG International Group and is communicated through formal and informal channels
– Accountability: The risk management framework and the risk policies clearly assign accountability for risk management and decision-making to functions and specific unit heads
– Effective communication and challenge: An environment must allow for open communication and promote effective challenge in the decision-making process; this is supported by independent Risk Control and Compliance functions
– Incentives: Financial and non-financial incentives are monitored to ensure they do not encourage excessive risk-taking
The risk awareness & culture programme, which follows the above mentioned principles, during 2018 focused on following activities: – Embedding of the risk management and risk appetite
frameworks across the EFG International Group – Performing comprehensive trainings in several risk and
compliance topics – Implementing the client relationship officer’s scorecard to
foster a risk-conscious culture among them and reduce operational risks

Annual Report 2018 | 91
Global Business Committee *
Operational, Regulatory & Compliance Committee
Client Acceptance Committee
Acquisition Committee
Board of Directors
Risk Committee Remuneration & Nomination Committee Audit Committee
Audit Services Department
Asset & Liability Management Committee
Executive Credit Committee
Financial Risk Committee
Group Product Committee
Executive Committee
Country & Counterparty Risk (Sub) Committee
Internal Regulations
(Sub) Committee
Risk governance and organisation Risk management in EFG International Group involves committees, functions and business units. The table below provides an overview of EFG International Group while the roles of the different committees for risk management are described below: Board of Directors & committees 2018
* Advisory role to the Executive Committee, effective as of 01 July 2018
Notes to the consolidated financial statements EFG International consolidated entities
92 | Annual Report 2018
EFG International Board of Directors sets and approves the risk appetite statement and the risk management framework of EFG International Group, and monitors its risk profile versus the risk appetite, as well as the effectiveness of risk management.
The Risk Committee is the primary advisory committee to the Board of Directors on matters relating to risk and compliance. The Risk Committee proposes the risk management framework of EFG International Group and advises the Board of Directors accordingly. In addition, it monitors the risk profile, ensures that the risk management is effective, reports on the state of risk culture, and interacts with and oversees the performance and activities of the Chief Risk Officer and the Chief Compliance Officer. The Risk Committee’s tasks include oversight of the strategies for capital and liquidity management as well as oversight of the management of all relevant risks of EFG International Group, such as credit, market, liquidity, operational and reputational risks, to ensure they are consistent with the stated risk appetite. It examines any situations or circumstances giving rise to a substantial risk for EFG International Group and has the authority to require the reduction of any position or limit.
The Audit Committee oversees the Internal Audit function, which represents the third line of defence, and is responsible for the oversight of: – The financial and business reporting processes,
including the selection and application of appropriate accounting policies
– The integrated internal control systems for financial reporting as well as the internal controls of areas beyond financial reporting
– EFG International Group’s tax risks – The internal and external audit processes
EFG International Executive Committee is tasked by the Board of Directors with the following responsibilities with regards to risk management: – Managing the day-to-day business, operational revenue
and risk management, including the balance sheet structure and liquidity
– Representing EFG International Group vis-à-vis third parties in operational matters
– Approving the risk limits for each risk category, as proposed by EFG International risk management committees
– Monitoring and managing the risk profile of EFG International Group through regular reports from the Chief Risk Officer and the Chief Compliance Officer as well as breaches in risk limits
– Issuing general directives for regulating business operations
– Developing and maintaining effective internal processes, an appropriate management information system (MIS), a comprehensive internal control system and the necessary technological infrastructure
– Submitting applications regarding transactions for which the Board of Directors is responsible
The EFG International Global Business Committee, reporting to EFG International Executive Committee, has an advisory role in assessing and validating business strategies, key business aspects and priorities as well as in debating industry trends and issues.
EFG International risk management committees, reporting to EFG International Executive Committee, play key roles in the oversight of risk management. These committees are established as forums for discussion on important risk management issues, for the identification of relevant changes in the risk profile and new risks arising, for decision-making, and as a point of escalation where resolution is required. The roles of these committees are clearly defined in accordance with EFG International Group standards. Each EFG International risk management com-mittee has dedicated Terms of Reference, which provide more detail on membership, scope and responsibilities. EFG International Group risk management committees play an important role in the approval and review of risk limits and jointly they ensure that there is coverage of the key risk categories for discussion, decision and escalation. Information exchange across committees is maintained through cross-membership.
The Operational, Regulatory & Compliance Committee is responsible for the oversight of EFG International Group with regards to matters relating to regulatory, compliance activities and operational risks.
The role of the Client Acceptance Committee is to oversee and mitigate the risk of money laundering, including reputational and legal risk. This is done by assessing the risks of the new and existing clients. The Client Acceptance Committee is responsible for approving and reviewing periodically within the authorities delegated by the EFG International Group Executive Committee, non-standard clients (PEPs, US persons, special high-risk and tier 3 country clients) in line with relevant EFG International Group internal regulations. It is also responsible for keeping a record of all higher-risk clients.
Annual Report 2018 | 93
The Asset & Liability Management Committee is responsible for the management of EFG International Group’s consolidated balance sheet and for the implementation of capital allocation across risk categories. In particular, it is responsible for the management of EFG International Group’s balance sheet market risk exposure and liquidity risk, with control delegated to the Financial Risk Committee.
The Financial Risk Committee is responsible for the review of market, credit, concentration and liquidity and funding risks’ exposures incurred by EFG International Group and the structures in place for monitoring and reporting them, including compliance with policies and directives, as well as exposures relative to limits. The Financial Risk Committee is also responsible of the overall stress test programme encompassing trading and banking book portfolios.
The Executive Credit Committee has responsibility for the management of client credit risk. The Country and Counterparty Risk (Sub) Committee of the Executive Credit Committee is responsible for correspondent banking, broker and custodian relationships and for counterparty credit risk for banks and financial institutions as well as country limits within approved guidelines and parameters.
EFG International Global Product Committee is responsible to assess the risks and viability of the new products and services, and for the oversight with regards to the governance of the product approval, review and monitoring processes across EFG International Group.
The Chief Risk Officer is accountable for enabling the Group’s efficient and effective risk governance. The CRO is accountable to the Executive Committee, the Board of Directors and the Risk Committee for enabling the business to balance risk and reward. In the same regard, he is responsible for coordinating the Risk Management approach and for assessing and causing mitigating actions to significant competitive, regulatory, and technological threats to EFG International Group’s capital and earnings. The responsibilities also include managing, identifying, evaluating, reporting and overseeing EFG International Group’s risks externally and internally to ensure a functioning internal control system. In achieving this, further to the appointment of global risk officers within specific risk management responsibility for each of these risks, he also collaborates with other central EFG International Group functions that also undertake risk oversight activities for their respective area of responsibility, such as the Chief Financial Officer, Chief Operating Officer, Group Chief Compliance Officer, Chief Technology Officer and General Counsel. Each business
region has its own designated regional risk officer who is responsible for the oversight of risk management in the region and reports to the Chief Risk Officer and to local senior management.
The Chief Financial Officer is responsible for all financial, tax and prudential regulation matters of EFG International Group as well as other business or control areas allocated to the position. He ensures transparent and timely financial reporting – for internal and regulatory purposes as well as public reporting – in line with legal and regulatory requirements and industry best practices.
The Chief Financial Officer has the oversight of liquidity and capital management within the general regulations and guidelines set by FINMA and other regulators in jurisdictions where the EFG International Group operates, the Board of Directors, the Audit Committee and the Risk Committee. The Chief Financial Officer oversees and monitors business performance, strategic acquisitions, and the EFG International Group’s relationship with rating agencies. He also has primary responsibility for the Investor Relations, Legal, Regulatory Affairs, and Group Corporate Office functions. In addition, he supervises the activities of Global Treasury, Financial Reporting and Financial Planning.
The Chief Operating Officer is responsible for the management, coordination, supervision, planning and control of the Operations, Central Filing & General Services, Tax & International Projects of EFG International Group.
The Chief Technology Officer is responsible for overseeing all aspects of EFG International Group’s IT platform, infrastructure and data security globally, with particular focus on the ongoing investments in digital strategy which is designed to take the existing strategic IT platform to the next level.
The Group Chief Compliance Officer is responsible for the management, coordination and supervision of the consolidated compliance risks of EFG International Group. He supervises the Compliance activities deployed in the entities of EFG International Group. In this function, he also reports to the Risk Committee of EFG International’s Board.
The General Counsel is responsible for the management and oversight of legal risk, together with the Litigation unit.
The Chief Executive Officer of EFG International is responsible to the Board of Directors for the overall management and performance of EFG International Group. He manages the implementation and development of
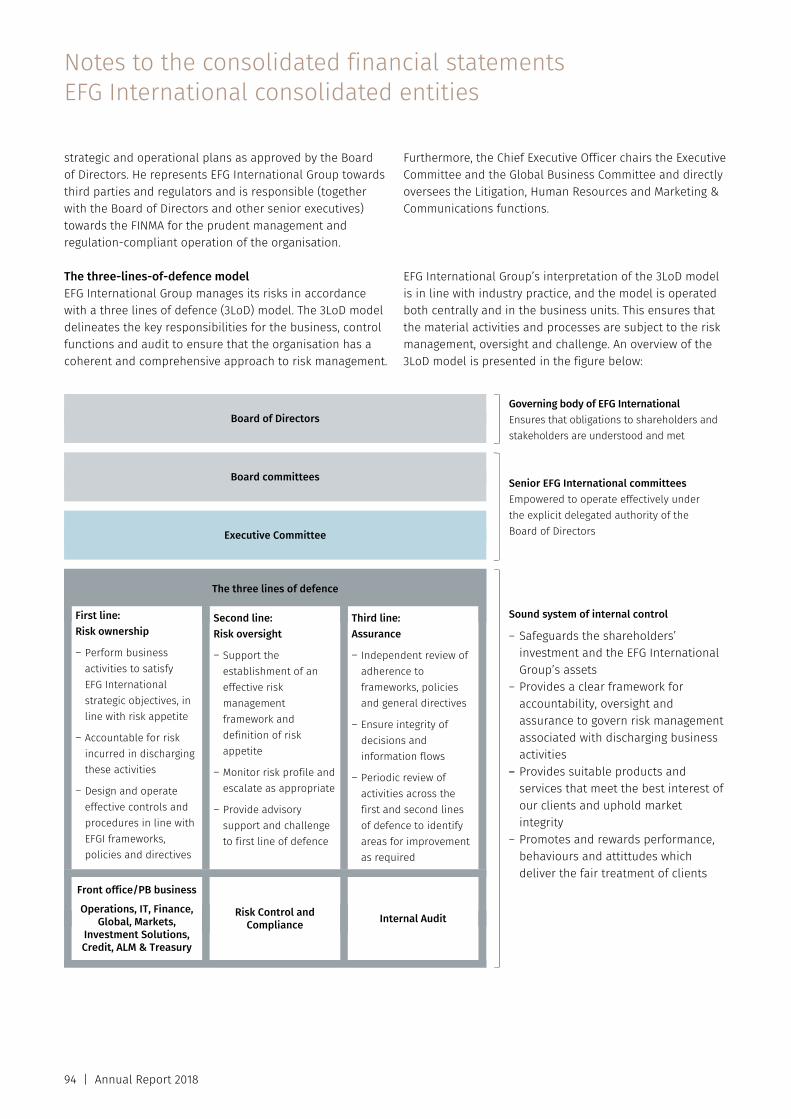
Notes to the consolidated financial statements EFG International consolidated entities
94 | Annual Report 2018
strategic and operational plans as approved by the Board of Directors. He represents EFG International Group towards third parties and regulators and is responsible (together with the Board of Directors and other senior executives) towards the FINMA for the prudent management and regulation-compliant operation of the organisation.
Furthermore, the Chief Executive Officer chairs the Executive Committee and the Global Business Committee and directly oversees the Litigation, Human Resources and Marketing & Communications functions.
The three-lines-of-defence model EFG International Group manages its risks in accordance with a three lines of defence (3LoD) model. The 3LoD model delineates the key responsibilities for the business, control functions and audit to ensure that the organisation has a coherent and comprehensive approach to risk management.
EFG International Group’s interpretation of the 3LoD model is in line with industry practice, and the model is operated both centrally and in the business units. This ensures that the material activities and processes are subject to the risk management, oversight and challenge. An overview of the 3LoD model is presented in the figure below:
Board of Directors Governing body of EFG International
Ensures that obligations to shareholders and stakeholders are understood and met
Board committees
Senior EFG International committees Empowered to operate effectively under the explicit delegated authority of the Board of Directors
Executive Committee
The three lines of defence
Sound system of internal control
– Safeguards the shareholders’ investment and the EFG International Group’s assets
– Provides a clear framework for accountability, oversight and assurance to govern risk management associated with discharging business activities
– Provides suitable products and services that meet the best interest of our clients and uphold market integrity
– Promotes and rewards performance, behaviours and attittudes which deliver the fair treatment of clients
First line: Risk ownership
– Perform business activities to satisfy EFG International strategic objectives, in line with risk appetite
– Accountable for risk incurred in discharging these activities
– Design and operate effective controls and procedures in line with EFGI frameworks, policies and directives
Second line: Risk oversight
– Support the establishment of an effective risk management framework and definition of risk appetite
– Monitor risk profile and escalate as appropriate
– Provide advisory support and challenge to first line of defence
Third line: Assurance
– Independent review of adherence to frameworks, policies and general directives
– Ensure integrity of decisions and information flows
– Periodic review of activities across the first and second lines of defence to identify areas for improvement as required
Front office/PB business
Operations, IT, Finance, Global, Markets,
Investment Solutions, Credit, ALM & Treasury
Risk Control and
Compliance Internal Audit
Annual Report 2018 | 95
Risk appetite framework The risk appetite framework describes EFG International Group’s approach, governance and processes in relation to setting risk appetite and is structured by qualitative considerations (risk appetite statement) as well as quantitative considerations (risk appetite metrics). The risk appetite framework sets the overall approach to risk appetite, documenting the level of risk that EFG International Group is prepared to incur; it includes: – The risk appetite statement – The risk appetite metrics – The responsibilities of the bodies overseeing the
implementation and monitoring of the risk appetite framework
– The risk appetite process, including the escalation of the risk metrics exceeding their pre-determined thresholds
Risk categories The capital adequacy, strategic, market, liquidity, credit, operational, compliance and reputational risks of EFG International Group are defined in the risk management framework, in the risk taxonomy and are described in the related risk policies. The risk taxonomy identifies the risk categories that the organisation wants to consider in its discussion of risk and provides a definition of the identified risks. The risk categories establish a common language on risks across EFG International and thereby enable alignment across business units, geographies and functions.
Business and strategic risk Business and strategic risk is the risk of loss arising from changes in the business environment and from adverse business decisions or improper implementation of decisions. The business and strategic risk includes the following risk categories: – Client portfolio risk: The risk inherent in client portfolios
in general as well as the risk of a reduction in assets under management and/or loss of client relationships as a result of other risk types, e.g. performance, reputation, operational risks, compliance, etc.
– Strategic risk and governance: The risk of the enterprise or particular business areas making inappropriate strategic choices, or being unable to successfully implement selected strategies or related plans and decisions, which may result in a variance to business plans and strategies
– Competitive risk: The risk of an inability to build or maintain sustainable competitive advantage in a given market or markets
– Project risk: The risk of damage or loss resulting from an acquisition and/or subsequent post-merger integration or any other large-scale project the institution is undertaking
– Human resources risk: The risk arising from inadequate or insufficient human resource performance and/or staffing or key people (including client relationship officers) leaving the EFG International Group
Credit risk Credit risk is defined as the risk of loss resulting from the failure of EFG International Group’s borrowers and other counterparties to fulfil their contractual obligations and that collateral provided (if any) does not cover EFG International Group’s claims. The credit risk arises not only from EFG International Group’s clients lending operations but also from its Treasury and Global Market activities. EFG International Group incurs credit risk from counterparty default, on traditional on-balance sheet products (such as loan or issued debt), where the credit exposure is the full value but also on off-balance sheet products (such as derivatives) where the credit equivalent exposure covers both actual exposure (as a function of prevailing market prices) and potential exposures (i.e. an add-on for volatility of market price) or other guarantees issued (contingent liabilities).
Credit risks related to clients The credit risk strategy for private banking clients is explicitly defined in EFG International Group’s risk appetite framework, and is based on four dimensions, as described below: – Client type: EFG International Group’s client business is
focused on its private banking clients and includes loans to individuals and to standard wealth planning structures held by private individuals. Loans to operating and/or commercial companies, to regulated financial institutions, funds as well as loans relating to complex structures are acceptable within the respective business lines where the overall client relationship justifies such an exposure. In all cases, the borrower or beneficial owner must be able to bear the financial risk of the loan. In addition, where the loan is secured by real estate or any other non-financial asset or where the extension of credit relies on elements other than the value of the collateral, the borrower or guarantor must be sufficiently creditworthy to repay the loan should the collateral (if any) be insufficient to cover the loan balance
– Credit purpose: Credits are extended in order to leverage portfolios of financial assets, to permit clients to purchase illiquid assets without the need to sell existing portfolios of financial assets and to support margin requirements for foreign exchange or other derivative positions. In addition, EFG International Group extends credits to finance or re-finance the purchase of real estate. EFG International Group may extend credits to

Notes to the consolidated financial statements EFG International consolidated entities
96 | Annual Report 2018
clients in order to provide liquidity to individuals or corporate entities
– Collateral type: Credits are secured by diversified port-folios of financial assets including cash, bonds, equities, precious metals and funds or by real estate primarily residential but also commercial in selected markets, as well as EFG International Group guarantees and life insurance policies. EFG International Group may consider exposures with a risk concentration against shares at conservative loanable values provided that the quality and the liquidity of the collateral justifies it; or, depending on the business line, may provide loans on an unsecured basis, subject to the creditworthiness of the client
– Profitability: EFG International Group seeks to optimise the profitability of its lending business and has established requirements for the minimum pricing of loans and the minimum amount of banking business required to justify the extension of credit. EFG International Group focuses on the profitability of the overall banking relationship
Counterparty credit risk EFG International Group incurs counterparty credit risk in its treasury activities, where credit risk derives from the financial assets and derivative instruments that EFG International Group uses for investing its liquidity and managing foreign exchange and interest rate risks in its funding and lending transactions. To ensure the efficient management of its banking activities, EFG International Group engages and maintains business relationships with said counterparties only if certain criteria with regard to solvency, reputation and the quality of the services received are met.
Global limits are proposed and approved centrally and delegated to the respective business units. The responsi-bility for management of delegated counterparty credit risk lies fully with the business units assuming the risk. Credit department monitors the adherence to delegated limits.
The counterparty credit risk strategy approved by the Board of Directors is the following: – EFG International Group actively monitors and manages
the credit portfolio and consciously takes concentrations in certain sectors, countries and clients/counterparties
– EFG International Group engages and maintains relationships with counterparties that either have an explicit investment grade rating or are non-rated but fulfil comparable criteria
– EFG International Group accepts a speculative rating of counterparties within our trading portfolio activities
– EFG International Group targets collateralised transactions when interacting with counterparties or
negotiates ISDA master agreement/credit support annexes limiting our risk appetite with them
Moreover, at inception of a transaction, the portfolio managers and traders have to ensure that: – Any product has been authorised
(list of authorised products) – The underlier of the transaction (e.g. currency pair)
is an authorised one – The maturity of the transaction is authorised – Depending of the type of the transaction, the risk
mitigation of the collateral have been adequately assessed
– The counterparty is located in a country where EFG International Group wishes to conduct business and in case accept the exposure
Country risk Country risk is defined as the transfer and conversion risk that arises from cross-border transactions. Country risk also encompasses direct and indirect sovereign risk, the default risk of sovereigns or state entities acting as borrowers, guarantors or issuers.
EFG International Group determines the country risk that it wishes to accept, including the countries in which it wishes to operate and the exposure allowed to these countries. The strategy is directed towards an increasing limitation of country risks via a country classification in primary countries, secondary countries and risk countries. Strategy is geared to containing country risk by selecting countries for own securities investments and credit activities towards private banking clients and banking counterparties. The investment grade country categories include countries with which business relationships exist and for which the risk is intended to be accepted, albeit to a differing extent. In the area of lombard loans, country risk strategy is limited, allowing for the acceptance of risk in off-shore countries and selected risk countries. Within the trading book are included exposures related to risk countries, which are subject to market and concentration risk control metrics and are liquid and negotiable. The risk countries category includes selected countries with a speculative grade for which risk is nonetheless maintained between tight global limits.
Market risk EFG International Group is exposed to market risk, which mainly arises from foreign exchange, interest rate, credit spread and life insurance settlement positions maintained within defined parameters.
Annual Report 2018 | 97
EFG International Group’s balance sheet and off-balance sheet positions generate low foreign exchange risk and medium interest rate exposures. The management of EFG International Group’s interest rate risk exposure is performed in accordance with risk appetite on the impact of various interest rate scenarios on economic value and interest income sensitivity. EFG International Group uses value at risk (VaR), sensitivity analysis and stress tests as methodologies to monitor and manage foreign exchange risks inherent to its structure.
The market risk strategy at balance sheet level approved by the Board of Directors is defined as follows: – To manage interest rate risk in line with predefined
interest rate limits and risk appetite to generate profits for the benefit of EFG International Group
– To manage foreign exchange risk in order to control its impact on annual results
EFG International Group holds investment portfolios, which allow to diversify balance sheet assets and to optimise any excess liquidity. The investment portfolio is divided into a range of portfolios on the basis of the type of product and strategy.
To mitigate the credit spread and interest rate exposure, minimum country and issuer rating standards and concentration limits have been determined. In addition, VaR, interest rate, credit spread sensitivities and stress metrics as well as P&L limit are computed and monitored at stand-alone portfolio level and on a combined basis.
The investment portfolio risk strategy approved by the Board of Directors is the following: – To seek to turn liquidity into profit while maintaining
liquidity buffers with high-quality liquid securities in accordance with external rules
– To generate income primarily through taking liquidity, interest rate and credit spread risk, and only incur non-material foreign exchange risk in the banking book
– To not take on any equity, commodity, longevity and mortality risk (with the exception of the legacy life insurance portfolio)
– To limit the extent of concentrations in the Group’s investment portfolios
EFG International Group is also exposed to market risk in relation to its holding of life insurance policies and to lombard exposures collateralised by life insurance policies. The major market risk factors of these portfolios are longevity risk, increase in cost of insurance and increase in interest rate risk.
EFG International Group manages those risks using internal models to calculate the fair value of each life insurance policy and through independent estimations done by external service providers as far as the estimation of life expectancies and forecasted premium payments are concerned, in conjunction with management judgements. Moreover, scenario analyses are done to calculate the sensitivity of the life insurance portfolio to increases in life expectancies, in premium payments and in interest rates. Finally, management judgement is applied to these models and scenarios.
EFG International Group engages in trading of securities, derivatives, foreign exchange, money market paper and precious metals primarily on behalf of its clients. This business is conducted out of dealing rooms in Switzerland and Asia. Moreover, it manages a fixed income, a foreign exchange delta, forward and options trading book on its own account. All the trading books are managed by dedicated Lugano trading desks.
The market risk strategy approved by the Board of Directors for the trading portfolios is the following: – EFG International Group trading activities are designed to
ensure that EFG International Group can effectively serve EFG International Group clients’ needs
– In addition to execution-only services on behalf of EFG International Group clients, EFG International Group takes market risk in form of foreign exchange principal trading where beneficial for EFG International Group clients, principal trading on EFG International Group own accounts to deliver a return to EFG International Group as well as EFG International Group structured products business
– EFG International Group has appetite for a small amount of higher-risk activity in the trading portfolio fixed income sector where risk-return justifies this risk and EFG International Group has sufficient expertise in the front office and risk organisation to exploit opportunities without exposing EFG International Group to undue risk
Liquidity risk Liquidity reflects the ability of EFG International Group to fund increases in assets and meet obligations as they come due, without incurring unacceptable losses. Liquidity risk has a twofold dimension: funding risk and asset liquidity risk. The two liquidity risk types are connected, as asset liquidity risk could directly increase funding risk, if EFG International Group is not any more able to raise sufficient liquidity in case of need. If EFG International Group is wishing to face unexpected cash outflows, it may
Notes to the consolidated financial statements EFG International consolidated entities
98 | Annual Report 2018
need to sell a large amount of securities, with exposure to market prices and liquidity.
EFG International Group manages liquidity risk in such a way as to ensure that ample liquidity is available to meet commitments to customers, both in demand for loans and repayments of deposits and to satisfy EFG International Group’s own cash flow needs within all of its business entities. EFG International Group customer deposit base, EFG International Group capital and liquidity reserves position and EFG International Group conservative gapping policy when funding customer loans ensure that EFG International Group runs only limited liquidity risks.
Liquidity is handled by treasury, which ensures the ongoing process of sourcing new funds, in the case of a lack of liquidity or the investing of funds, if there is an excess of liquidity. Main subsidiaries/regions have their own local Treasury departments, regulated by the Treasury/ALM EFG International Group internal guidelines and responsible for ensuring compliance with legal restrictions concerning liquidity risk, observing global strategic constraints, local regulation and risk management limits.
Funding operations aim to avoid concentrations in funding facilities. EFG International Group also has a liquidity management process in place that includes liquidity contingency plans, encompassing repo borrowing and liquidation of marketable securities. Stress tests are undertaken monthly as part of the reporting requirements established within EFG International Group risk guidelines.
Operational risk Operational risk is defined as the risk of losses resulting from the inadequacy or failure of internal processes, people and/or systems or from external events. Operational risk is an inherent part of the day-to-day activities and is therefore a risk common to all EFG International Group's activities.
EFG International Group aims at mitigating significant operational risks it may inherently run to a level it considers appropriate and commensurate with its size, structure, nature and complexity of its service/product offerings, thus adequately protecting its assets and its shareholders’ interests.
The Board of Directors and senior management strive to set the operational risk culture through, among others, the definition of the overall operational risk appetite of the organisation (expressed in quantitative thresholds and qualitative statements), which is embedded in the organisation’s risk management practices. The supervision
of operational risk at the Board of Directors level is under the responsibility of the Board Risk Committee.
While the primary responsibility for managing operational risk lies with EFG International Group’s business entities and business lines (first line of defence), the development, implementation and oversight of the operational risk policy of EFG International Group forms part of the objectives of the Operational Risk Management function of EFG International Group.
The Operational Risk Management function works in collaboration with the operational risk officers of the local business entities, the regional risk officers within EFG International Group as well as certain centralised EFG International Group functions that also undertake operational risk oversight for their respective area of responsibility, such as the Chief Financial Officer, the Chief Operating Officer, the Chief Technology Officer, the Group Chief Compliance Officer and the General Counsel. The principal aim of the Operational Risk Management function is to ensure that EFG International Group has an appropriate operational risk management framework and programme in place for identifying, assessing, mitigating, monitoring and reporting operational risk. The Operational Risk Management function reports to the Chief Risk Officer.
Main measures applied by the Operational Risk Management function for the identification, assessment, monitoring and reporting of operational risk are: – Assessment and monitoring of key operational risks – Monitoring of key risk indicators – Collection, analysis and reporting of operational risk
events and losses – Consolidated operational risk reporting to the Chief Risk
Officer and Board of Directors Risk Committee – Follow-up of actions taken to remedy key operational
risk-related control issues – Establishment of an operational risk awareness
programme
EFG International Group and its local business entities design and implement internal controls and monitoring mechanisms in order to mitigate key operational risks that EFG International Group inherently runs in conducting its business.
EFG International Group continuously invests in business continuity management in order to ensure continuity of critical operations in the event of a major disruptive event. Business continuity management encompasses backup
Annual Report 2018 | 99
operating facilities and IT disaster recovery plans, which are in place throughout EFG International Group.
Considering the rapidly evolving risks relating to IT security and data confidentiality in the financial industry, EFG International Group continuously assesses its cyber defences and internal processes (including benchmarking with comparable banks) in order to ensure adequate mitigation of risks and adherence to the increasing regulatory requirements in this area.
Where appropriate, EFG International Group establishes operational risk transfer mechanisms; in particular, all entities of EFG International Group are covered by insurance to hedge (subject to defined exclusions) potential low-frequency-high-impact events. EFG International Group administers centrally for all its subsidiaries three layers of insurance cover, being comprehensive crime insurance, professional indemnity insurance and directors, and officers, liability insurance. Other insurances such as general insurances are managed locally.
Compliance risk Compliance risk is defined as the risk of legal or regulatory sanctions, material financial loss, or loss of reputation which the Group may suffer as a result of its failure to comply with laws, regulations, rules, related self-regulatory organisation standards, generally accepted practices, and codes of conduct applicable to all its activities.
The compliance risk is identified, measured, monitored, reported and mitigated by the Compliance department and its clearly distinguished and dedicated units in alignment with the roles and responsibilities defined in EFG International Group’s risk management framework.
Changes in the regulatory environment are monitored, and directives and procedures are adapted as required. In line with these evolving regulations, EFG International Group continuously invests in personnel and technical resources to maintain adequate compliance coverage.
EFG International Group’s Compliance function is centrally managed from Switzerland with local compliance officers situated in all the organisation’s booking centre entities around the world. A compliance risk policy is in place, complemented by a comprehensive set of directives and procedures and regular specialised training sessions delivered to all staff to raise their awareness and understanding of the compliance risks. Group Compliance, implemented a common platform of tools and processes to ensure the consistent application of compliance guidelines.
Compliance risk in EFG International Group is managed in accordance with the 3LoD model, outlined in details in the risk management framework of EFG International Group. The 3LoD model delineates the key responsibilities for the business, control functions and audit to ensure that the organisation has a coherent and comprehensive approach to risk management.
EFG International Group aims at mitigating compliance risks that it inherently runs taking into account the size, structure, nature and complexity of its business and services/product offering. EFG International Group is committed to sound and effective compliance risk management as the core foundation for a sustainable financial institution. Effective compliance risk management means meeting the compliance obligations and protecting EFG International Group from loss or damage. It improves the way the Group conducts business for our shareholders and stakeholders and it is vital for long-term and sustainable growth.
A major focus of regulators around the world is the fight against money laundering and terrorism financing. EFG International Group has in place comprehensive directives on anti-money laundering and know your customer, as well as on anti-bribery and corruption, to detect, prevent and report such risks. Through dedicated monitoring and quality assessment programmes, EFG International Group Compliance ensures compliance with such directives in every EFG International Group’s subsidiary and branch.
EFG International Group has defined a set of standards governing the cross-border services it offers, and has developed country-specific manuals for the major markets it serves. A mandatory staff training and education concept is in place to ensure adherence to the standards and compliance with the country manuals. They are complemented by a tax compliance framework, the purpose of which is to prevent the unlawful acceptance of untaxed assets. Those frameworks are continuously enhanced to comply with new regulations such as MiFID II or CRS.
Conduct risk refers to all risks associated to the firm’s behaviour or activity that could threaten consumer protection or market integrity and might subsequently damage the reputation of EFG International Group. EFG International Group has directives on customer conduct, market conduct, cross border, suitability and conflicts of interest. The EFG International Group Global Product Committee ensures that all products or securities sold to clients or bought for them meet their best interest and have been through the appropriate approval process.

Notes to the consolidated financial statements EFG International consolidated entities
100 | Annual Report 2018
Legal risk Legal risk is the risk to the firm’s profitability arising from changes in legislation and/or as results from legal actions against the institution.
The General Counsel function and Litigation unit ensure that EFG International Group adequately manages and controls its legal risks. This includes supervising and giving strategic direction to all outside counsels advising EFG International Group on civil, regulatory and enforcement matters.
Any change in the legal environment can constitute a challenge for EFG International Group in its relations with competent authorities, clients and counterparties in Switzerland and globally. The General Counsel function is responsible for providing legal advice to EFG International Group’s management as well as handling client complaints and assisting federal and local authorities in their criminal and administrative investigations. The Litigation unit has principal responsibility for overseeing and advising the Group’s management on significant civil litigation and all government enforcement matters involving EFG International Group globally.
Reputational risk Reputational risk is defined as the risk of an activity performed by a Group entity or its representatives impairing its image in the community or public confidence, and that this will result in the loss of business and/or legal action or potential regulatory sanction. Typically a result of other risk categories.
EFG International Group considers its reputation to be among its most important assets and is committed to protecting it. Reputational risk for EFG International Group inherently arises from: – Potential non-compliance with increasingly complex
regulatory requirements – Potential non-compliance with anti-money laundering
regulatory requirements – Its dealings with politically exposed persons or other
clients with prominent public profiles – Its involvement in transactions executed on behalf of
clients other than standard investment products – Potential major incidents in the area of IT security and
data confidentiality – Potential misconduct by its employees – Any other potential negative internal or external event
arising from other risk categories (e.g. in case of significant downturn on bonds, equities markets or of a particular housing market speculative bubble, etc.)
EFG International Group manages these potential reputational risks through the establishment and monitoring of the risk appetite by the Board of Directors, and through established policies and control procedures.
5. Credit risk
Credit risk refers to the probability that a default will occur as a result of a borrower’s or counterparty’s deteriorating creditworthiness and/or inability to meet its financial obligations. EFG International AG (EFG International; the Company) and all its subsidiaries’ (together EFG International Group) primary credit exposures relate to loans collateralised by securities portfolios and by mortgages, or to rated financial institutions, sovereigns and corporates.
5.1 Credit risk management
Loans and advances (a)A basic feature of the credit approval process is a separa-tion between the firm’s business origination and credit risk management activities.
The approval of loans and other exposures has been dele-gated, depending on predefined risk, collateral and size parameters, to the credit departments of EFG International’s business units, to local credit committees, to specific EFG International Group executives and management functions within the organisation and to the Executive Credit Committee of EFG International Group. The approval competencies for large exposures and exposures with increased risk profiles are centralised in Switzerland, in compliance with local regulatory and legal requirements of the individual international business units.
To qualify as collateral for a lombard loan, a client’s securities portfolio must meet minimum eligibility criteria and be sufficiently liquid. Different haircuts are applied depending on asset-class and collateral risk profile. Mortgages are mainly booked at EFG Bank AG and EFG Private Bank Ltd, London. They are granted predominantly on properties in Switzerland and in prime London locations.
Management is required to understand the purpose of each loan (which is typically for investment in securities, funds, and investment-related insurance policies or real estate) and all risk aspects involved in the granting of each loan, mitigating those when possible.
Annual Report 2018 | 101
EFG International Group’s internal grading system assigns each client credit exposure to one of ten grading categories. The grading assesses the borrower’s repayment ability and the value, quality, liquidity and diversification of the collateral securing the credit exposure. The credit policy and the nature of the loans ensure that EFG International Group’s loan book is of high quality. Consequently, an overwhelming majority of EFG International Group’s credit exposures are graded within the top three categories.
Debt securities and other bills (b)For debt securities and other bills, external ratings such as S&P’s rating or their equivalents are used by EFG International Group for managing the credit risk exposures.
5.2 Risk limit control and mitigation policies
To qualify as collateral for a lombard loan, a client’s securities portfolio must generally be well diversified with different haircuts applied depending on the asset class and collateral risk profile. Additional haircuts are applied if the loan and the collateral are not in the same currency or diversification criteria are not fully met.
Loans guaranteed by real estate are treated in conformity with local regulatory requirements and with the internal directives (regulations, procedures) pertaining to valuation and affordability calculation. All real estate property used as collateral must be evaluated by internal appraisers or by selected external surveyors. External valuations are accepted, as long as the competence and the independence of the external professional have been verified.
Credit departments monitor credit exposures against approved limits and pledged collateral. If necessary, they initiate rectification steps. Financial collateral is valued where possible on a daily basis (but may be valued more frequently, if particular portfolios and severe market conditions demand). Certain mutual and hedge funds are valued weekly or monthly, whereas insurance policies are valued at least quarterly.
Management of exposure to financial institutions is based on a system of counterparty limits coordinated at the EFG International Group level, and also subject to pre-approved country limits. Limits for exposure to counterparties are granted based upon internal analysis. The limits are set and monitored by the Country & Counterparty Credit (Sub) Committee depending on each
counterparty’s S&P or Moody’s ratings (with reference to individual and support ratings).
Other specific control and mitigation measures are outlined below.
(a) Collateral EFG International Group employs a range of policies and procedures to mitigate credit risk. The EFG International Group implements guidelines and procedures on the acceptability of specific asset classes as collateral for credit risk mitigation. The main asset classes accepted as collateral for loans and advances are: – Cash and cash equivalent – Financial instruments such as debt securities, equities
and funds – Bank guarantees – Mortgages over residential and to a limited extent
commercial properties – Assignment of guaranteed cash surrender value of life
insurance policies
(b) Derivatives EFG International Group maintains a strict monitoring of credit risk exposure induced by over-the-counter derivative transactions and exchanged-traded derivatives against limits granted. Credit risk exposure is computed as the sum of the mark-to-market of the transactions and the potential future exposure calculated through dedicated add-on factors applied to the notional of the transactions. EFG International Group has signed risk mitigating agreements with its most important financial institutions counterparties.
(c) Credit-related commitments Credit-related commitments include the following: – Guarantees and standby letters of credit; these carry the
same credit risk as loans – Commitments to extend credit; these represent unused
portions of authorisations to extend credit in the form of loans, guarantees or letters of credit. The EFG International Group is potentially exposed to loss in an amount equal to the total unused commitments. However, commitments to extend credit are contingent upon customers maintaining specific credit standards
For all of the above, the same standards apply regarding approval competences, collateral requirements and monitoring procedures as outlined in note 6.
The guarantees and irrevocable lines of credit can be drawn by the customers only if the client has adequate collateral
Notes to the consolidated financial statements EFG International consolidated entities
102 | Annual Report 2018
pledged with EFG International Group. Should the guarantees and irrevocable lines of credit be drawn, the majority of the facilities would be rated by the EFG International Group with an internal grading of 1 to 3.
5.3 Credit loss measurement
The entity applies the three-stage approach introduced by IFRS 9 for impairment measurement based on changes in credit quality since initial recognition: – Stage 1: financial assets that have not experienced a
significant increase in credit risks since initial recognition – Stage 2: significant increase in credit risks since initial
recognition but not yet deemed to be credit-impaired – Stage 3: credit-impaired on payment default
Financial instruments in stage 1 have their expected credit losses (ECL) measured at an amount equal to the portion of lifetime expected credit losses that result from default events possible within the next 12 months. Instruments in stages 2 or 3 have their ECL measured based on expected credit losses on a lifetime basis.
Specific ECL measurements have been developed for each type of credit exposure. Generally, the three components to compute ECL are exposure at default, probability of default and loss given default, defined as follows: – Exposure at default (EAD) is based on the amounts
EFG International Group expects to be owed at the time of default over the next 12 months (12-month EAD) or over the remaining lifetime (Lifetime EAD). For example, for a revolving commitment, EFG International Group includes the current drawn balance plus any further amount that is expected to be drawn up to the current contractual limit by the time of default, should it occur
– Probability of default (PD) represents the likelihood of a borrower defaulting on its financial obligation (as per definition of default and credit-impaired below), either over the next 12 months (12-month PD), or over the remaining lifetime (Lifetime PD) of the obligation
– Loss given default (LGD) represents EFG International Group’s expectation of the extent of loss on a defaulted exposure. LGD varies by type of counterparty, and availability of collateral or other credit support. LGD is expressed as a percentage loss per unit of exposure at the time of default (EAD). LGD is calculated on a 12-month or lifetime basis, where 12-month LGD is the percentage of EAD expected to be non-recoverable if the default occurs in the next 12 months and lifetime LGD is the percentage of EAD expected to be non-recoverable, the default occurs over the remaining expected lifetime of the loan
5.4 Due from banks and investment securities
This includes all assets that are classified as follows: – Cash and balances with central banks – Treasury bills and other eligible bills – Due from other banks – Financial assets at fair value through other
comprehensive income (FVTOCI)
Inputs and assumptions The ECL for all products above is estimated via three components: – EAD: Depending on the product and on the IFRS 9 asset
classification; book value for amortised cost assets and purchase value adjusted for amortisation and discount unwind for assets designated as FVTOCI
– PD: Estimated for a 12-month and lifetime period based on external counterparty credit risk rating information (Standard & Poor’s annual global corporate default study and rating transition). For public entity loans, the PD is estimated using official statistics
– LGD: For stage 1 and stage 2 assets. LGD for sovereign, bank and corporate exposure is approximated by an expert judgement aligned to the credit default swap ISDA market standard that estimates a recovery rate for sovereign exposure of 40%, resulting in 60% LGD. In case of stage 3 assets, LGD value is determined on an individual basis for sovereign, bank and corporate exposure
Estimation techniques Macroeconomic expectations for sovereign securities and central banks debt are incorporated via their respective rating obtained from Standard & Poor’s as part of their assessment of counterparty credit risk. For banks and cor-porate counterparties, the PD and related transition matrices are impacted on the basis of EFG International Group’s macroeconomic expectations.
Significant increase in credit risk A rapid deterioration in credit quality triggers an ad hoc review of the individual asset. An internal expert panel performs a quarterly assessment to determine if this asset is subject to a significant increase in credit risk (SICR). In addition to the quantitative SICR test based on changes in the rating agency’s rating for the respective financial instrument, the assessment of the expert panel considers a range of external market information (e.g. credit default spreads, rating outlook).
Annual Report 2018 | 103
Definition of default The default is triggered through a payment default on the instrument or any cross-default indication from rating agencies.
5.5 Lombard lending
Lombard lending includes assets that are classified within loans and advances to customers, including lombard loans and other exposures covered by financial collaterals.
Lombard loans are loans secured by diversified portfolios of investment securities, and the risk of default of the loan is driven by the valuation of the collateral. The lending decision is not based on traditional lending criteria such as affordability, and is typically undertaken by clients with an existing investment portfolio who wish to leverage their portfolio in pursuit of higher investment returns or for diversification reasons or who have short-term liquidity needs.
Inputs and assumptions The ECL for lombard loans are estimated with two components: – ECL due to adverse market price movements in the
collateral that captures the risk that a shortfall arises when collateral values decrease to a level insufficient to cover the respective lombard loan exposure and
– ECL due to a default of a large single collateral position (Top 1 to Top 5) yielding a shortfall for the lombard loan exposure
Due to the importance of collateral characteristics for lombard lending, asset segmentation has been defined balancing the need for a high granularity and the tractability of overall model. Asset classes have been distinguished by asset price volatility, credit and liquidity risk. Asset classes differentiate cash and cash equivalent, bonds, equities, funds, commodities, guarantees, derivatives, real estate, insurance policies and other assets. Further asset sub-classes consider other relevant characteristics such as investment grade or non-investment grade issuance, or country of issuance.
ECL due to adverse market price movements is based on assumptions regarding: – Loan-to-value (LTV) close-out trigger levels – Market price volatility of underlying collateral
sub-asset class – Currency mismatch between loan and collateral – Close-out periods
– Exposure at close-out considering a credit conversion factor for undrawn lombard credit lines
– LGD considering sales cost incurred during collateral liquidation
ECL due to default of a large single collateral position are based on assumptions regarding: – Risk concentrations in top 5 collateral per asset sub-class – PD for each sub-asset class based on counterparty
risk ratings – LGD to assess the collateral value after default – LTV close-out trigger levels – Market price volatility of underlying collateral
sub-asset class – Currency mismatch between loan and collateral – Close-out periods – Exposure at close-out considering a credit conversion
factor for undrawn lombard credit lines – LGD considering sales cost incurred during collateral
liquidation
Estimation techniques As opposed to the general measurement approach, ECL measurement for lombard loans does not consider the PD of the borrower. The measurement approach calculates the probability that a given loan hits its close-out trigger level, conditional on this, its expected positive exposure (EPE) is calculated. This corresponds to an uncovered shortfall which in combination with the LGD parameter determines the ECL. For lombard lending, no additional macro-conditioning of variables is necessary as macroeconomic effects are captured through parameters such as volatility and LTV levels.
Significant increase in credit risk Credit risk for lombard loans is based on the underlying collateral. Hence, a SICR is driven by LTV metric for each individual lombard loan that is at or above the close-out trigger. Stage 2 lombard loans are loans with LTV above the close-out trigger which according to policy could have been closed out, but have been decided to be maintained, taking a higher credit risk.
Definition of default Lombard loans that were closed out or have their collateral liquidated, resulting in an actual shortfall, or where liquidation is still in progress resulting in a potential shortfall, are considered credit-impaired and classified as stage 3.
Notes to the consolidated financial statements EFG International consolidated entities
104 | Annual Report 2018
5.6 Residential and commercial mortgages
This includes assets that are classified within loans and advances to customers that are predominantly secured by real estate collateral.
Inputs and assumptions The ECL for mortgages is estimated by four components: – EAD: the exposure considers contractual repayments, as
well as potential drawdown over the lifetime of the loan – Rank ordering of loans: each loan is assigned to a risk
grade on the basis of its credit quality (i.e. rank order estimation)
– PD is derived from historical transition matrices. To derive forward-looking default estimates, these matrices are calibrated to the macroeconomic expectation of EFG International Group
– LGD: the loss estimate is calculated based on the possibility to cure (derived from the transition matrix) and on the loss given loss (LGL) component. The LGL takes into account the current LTV and the future recovery value of the underlying collateral. The recovery value depends on parameters such valuation haircuts and their volatility, time to sell the collateral, as well as associated selling costs. The house price development until sale, as well as the effective interest rate, are also taken into account
Estimation techniques Forward-looking macroeconomic effects are incorporated with forecasts on gross domestic product (GDP) growth and house price development.
The GDP forecasts impact the migration matrices used to determine the PD and the probability to cure considered in the LGD: – GDP growth for Switzerland is estimated based on an
explicit forecast for Switzerland – GDP growth for all countries but Switzerland is estimated
with a weighted forecast for the major global economies
House price developments for Switzerland, France and Singapore are estimated with explicit forecasts. House price developments for the UK are estimated with an explicit forecast for the London area. House prices for countries other than the aforementioned markets are estimated with a weighted forecast. The house prices impact the LTV ratios used to calculate the LGD.
Significant increase in credit risk SICR for these assets has occurred if any credit is greater than 30 days past due. Other criteria used to identify assets with SICR are the relative deterioration in credit quality
since origination, also taking into account the internal scorecard rating and credit watch list status, or if a loan has previously been defaulted.
Definition of default Mortgages are considered to be in default if the credits are greater than 90 days past due. Other criteria used to identify non-performing assets are the internal scorecard rating, watch list status and individual assessment of the respective counterparty.
5.7 Other loans
This includes assets that are classified within loans and advances to customers that are not lombard loans nor mortgage loans and includes commercial loans and overdrafts.
Inputs and assumptions The ECL for other loans is estimated by four components: – EAD: the exposure considers contractual repayments, as
well as potential drawdown over the lifetime of the loan – Rank ordering of loans: each loan is assigned to a risk
grade on the basis of its credit quality (i.e. rank order estimation)
– PDs are derived from historical transition matrices for commercial loans. To derive forward-looking default estimates, these matrices are conditioned to the macro-economic expectation of the Group. Other, non-commercial loans used an adjusted transition matrix that replicated their historical default rates due to the insufficient number of historical observations
– LGD: the loss estimate is calculated based on the possibility to cure (derived from the transition matrix), as well as a LGL component. The LGL takes into account the current LTV level and the future recovery value of the underlying collateral, for collateralised or partially collateralised exposures. Expert-based LGL rates are used for exposures without collateral
Estimation techniques Forward-looking macroeconomic effects are incorporated with forecasts on GDP growth and house price developments. See residential and commercial mortgages for details.
Significant increase in credit risk SICR for these assets has occurred if any credit is greater than 30 days past due. Other criteria used to identify assets with SICR are the relative deterioration in credit quality since origination, also taking into account the internal
Annual Report 2018 | 105
scorecard rating and credit watch list status, or if a loan has previously been defaulted.
Definition of default Other loans are considered to be in default if they are more than 90 days past due. Other criteria used to identify non-performing assets are the internal scorecard rating, watch list status and individual assessment of the respective counterparty.
5.8 Contractual modifications
EFG International Group modifies the terms of loans provided to customers due to commercial renegotiations, or for distressed loans, with a view of maximising recovery. Such restructuring activities include extended payment term arrangements, payment holidays and payment forgiveness. Restructuring policies and practices are based on indicators or criteria which, in the judgement of management, indicate that payment will most likely continue.
The risk of default of such assets after modification is assessed at the reporting date and compared with the risk under the original terms of initial recognition, when the modification is not substantial and so does not result in derecognition of the original asset. EFG International Group may determine that the credit risk has significantly improved after restructuring, so that the assets are moved from stage 3 or stage 2 in accordance with the new terms for the six consecutive months or more.
5.9 Write-off policy
EFG International Group writes-off financial assets, in whole or in part, when it has exhausted all practical recovery efforts and has concluded there is no reasonable expectation of recovery. Indicators that there is no reasonable expectation of recovery include: – Ceasing enforcement activity
– Where the EFG International Group’s recovery method is foreclosing on collateral and the value of the collateral is such that there is no reasonable expectation of recovering in full
EFG International Group may write-off financial assets that are still subject to enforcement activity. EFG International Group still seeks to recover amounts it is legally owed in full, but which have been partially written-off due to no reasonable expectations of full recovery.
5.10 Macro-economic scenario and sensitivity analysis
The ECL results are based on forward-looking projections. These projections consider different macroeconomic scenarios, in particular a base, upside and downside scenario is considered.
The most significant assumptions affecting the ECL are as follows: – For residential and commercial mortgages: House price
index, given the impact it has on mortgage collateral valuations; GDP, given the correlation with the customers’ wealth, as well as the commercial clients’ business environment, hence in turn their ability to repay the loans
– For due from customers – lombard lending (other than lombard loans secured by life insurance policies): Asset volatility, given the impact it has on financial collateral valuations
– For due from customers – lombard lending (secured by life insurance policies): Cost of insurance, given the significant impact on performance of funds’ assets and collateral valuations, and longevity
– For due from customers – other loans: GDP, given the correlation with the customers’ wealth, as well as the commercial clients’ business environment, hence in turn their ability to repay the loans
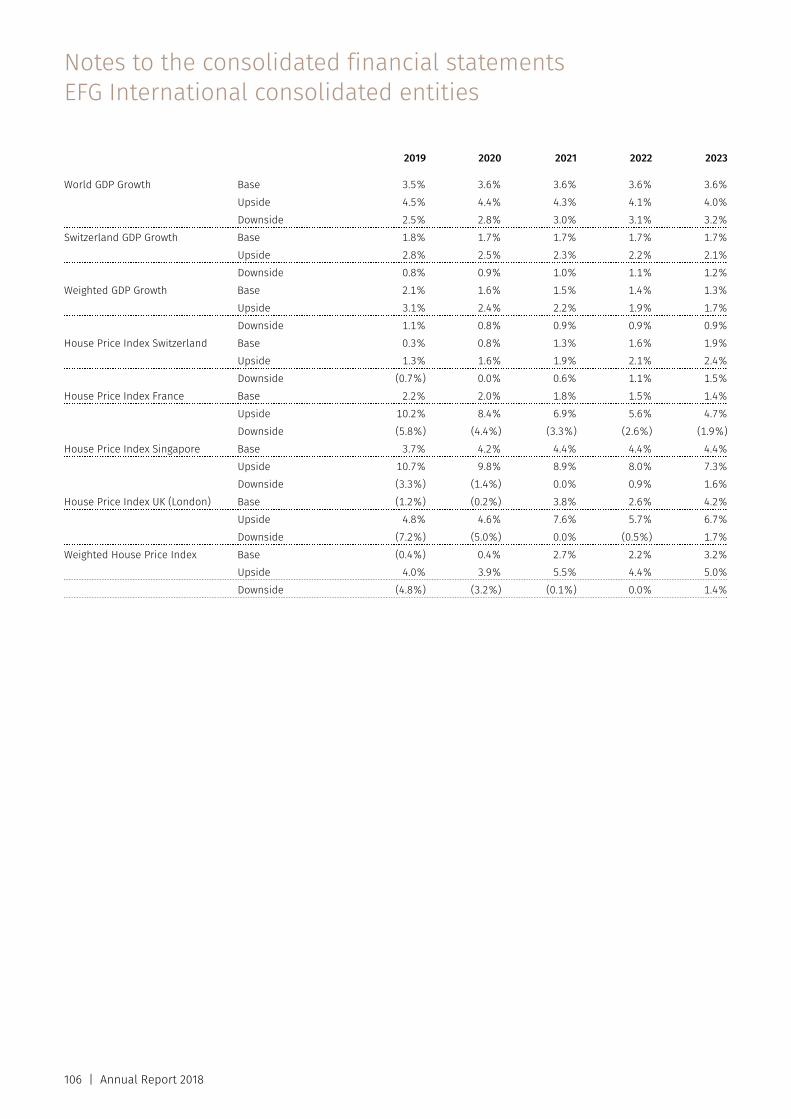
Notes to the consolidated financial statements EFG International consolidated entities
106 | Annual Report 2018
2019 2020 2021 2022 2023 World GDP Growth Base 3.5% 3.6% 3.6% 3.6% 3.6% Upside 4.5% 4.4% 4.3% 4.1% 4.0% Downside 2.5% 2.8% 3.0% 3.1% 3.2%Switzerland GDP Growth Base 1.8% 1.7% 1.7% 1.7% 1.7% Upside 2.8% 2.5% 2.3% 2.2% 2.1% Downside 0.8% 0.9% 1.0% 1.1% 1.2%Weighted GDP Growth Base 2.1% 1.6% 1.5% 1.4% 1.3% Upside 3.1% 2.4% 2.2% 1.9% 1.7% Downside 1.1% 0.8% 0.9% 0.9% 0.9%House Price Index Switzerland Base 0.3% 0.8% 1.3% 1.6% 1.9% Upside 1.3% 1.6% 1.9% 2.1% 2.4% Downside (0.7%) 0.0% 0.6% 1.1% 1.5%House Price Index France Base 2.2% 2.0% 1.8% 1.5% 1.4% Upside 10.2% 8.4% 6.9% 5.6% 4.7% Downside (5.8%) (4.4%) (3.3%) (2.6%) (1.9%)House Price Index Singapore Base 3.7% 4.2% 4.4% 4.4% 4.4% Upside 10.7% 9.8% 8.9% 8.0% 7.3% Downside (3.3%) (1.4%) 0.0% 0.9% 1.6%House Price Index UK (London) Base (1.2%) (0.2%) 3.8% 2.6% 4.2% Upside 4.8% 4.6% 7.6% 5.7% 6.7% Downside (7.2%) (5.0%) 0.0% (0.5%) 1.7%Weighted House Price Index Base (0.4%) 0.4% 2.7% 2.2% 3.2% Upside 4.0% 3.9% 5.5% 4.4% 5.0% Downside (4.8%) (3.2%) (0.1%) 0.0% 1.4%
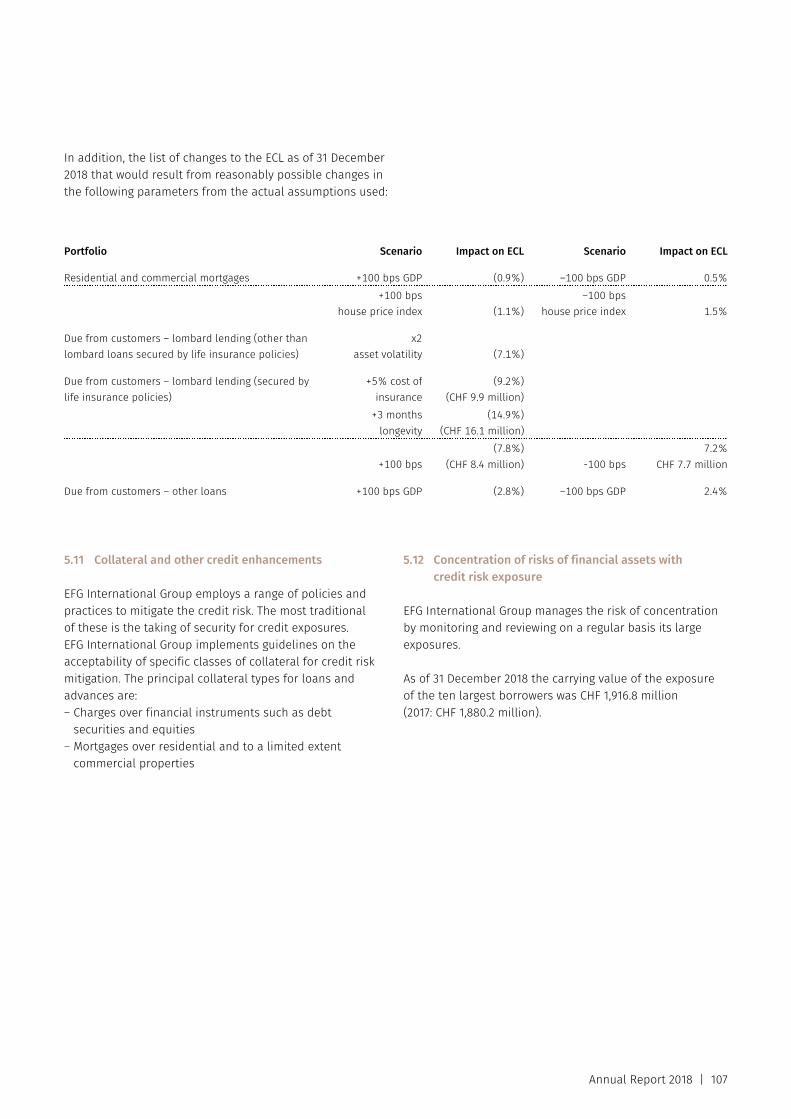
Annual Report 2018 | 107
In addition, the list of changes to the ECL as of 31 December 2018 that would result from reasonably possible changes in the following parameters from the actual assumptions used:
Portfolio Scenario Impact on ECL Scenario Impact on ECL Residential and commercial mortgages +100 bps GDP (0.9%) –100 bps GDP 0.5% +100 bps
house price index (1.1%)–100 bps
house price index 1.5% Due from customers – lombard lending (other than lombard loans secured by life insurance policies)
x2asset volatility (7.1%)
Due from customers – lombard lending (secured by life insurance policies)
+5% cost ofinsurance
(9.2%)(CHF 9.9 million)
+3 monthslongevity
(14.9%)(CHF 16.1 million)
+100 bps
(7.8%)(CHF 8.4 million) -100 bps
7.2%CHF 7.7 million
Due from customers – other loans +100 bps GDP (2.8%) –100 bps GDP 2.4% 5.11 Collateral and other credit enhancements
EFG International Group employs a range of policies and practices to mitigate the credit risk. The most traditional of these is the taking of security for credit exposures. EFG International Group implements guidelines on the acceptability of specific classes of collateral for credit risk mitigation. The principal collateral types for loans and advances are: – Charges over financial instruments such as debt
securities and equities – Mortgages over residential and to a limited extent
commercial properties
5.12 Concentration of risks of financial assets with credit risk exposure
EFG International Group manages the risk of concentration by monitoring and reviewing on a regular basis its large exposures.
As of 31 December 2018 the carrying value of the exposure of the ten largest borrowers was CHF 1,916.8 million (2017: CHF 1,880.2 million).
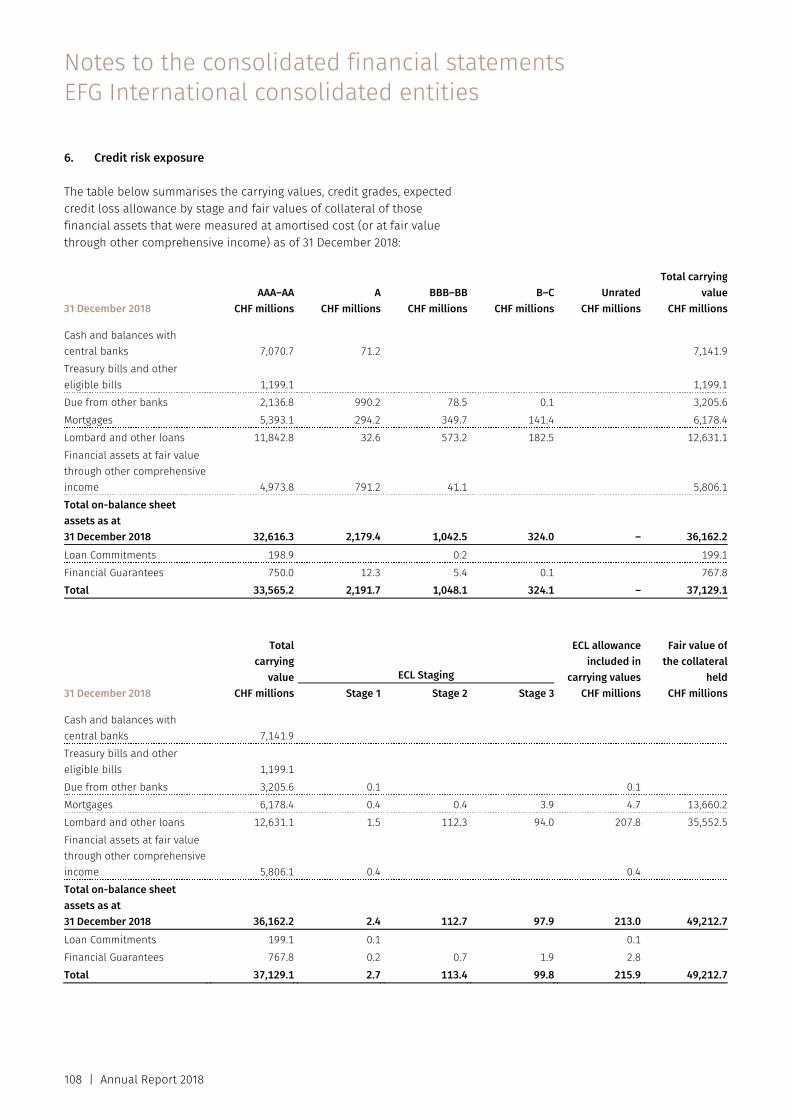
Notes to the consolidated financial statements EFG International consolidated entities
108 | Annual Report 2018
6. Credit risk exposure
The table below summarises the carrying values, credit grades, expected credit loss allowance by stage and fair values of collateral of those financial assets that were measured at amortised cost (or at fair value through other comprehensive income) as of 31 December 2018:
31 December 2018 AAA–AA
CHF millionsA
CHF millions BBB–BB
CHF millionsB–C
CHF millionsUnrated
CHF millions
Total carrying value
CHF millions Cash and balances with central banks 7,070.7 71.2 7,141.9Treasury bills and other eligible bills 1,199.1 1,199.1Due from other banks 2,136.8 990.2 78.5 0.1 3,205.6Mortgages 5,393.1 294.2 349.7 141.4 6,178.4Lombard and other loans 11,842.8 32.6 573.2 182.5 12,631.1Financial assets at fair value through other comprehensive income 4,973.8 791.2 41.1 5,806.1Total on-balance sheet assets as at 31 December 2018 32,616.3 2,179.4 1,042.5 324.0 – 36,162.2Loan Commitments 198.9 0.2 199.1Financial Guarantees 750.0 12.3 5.4 0.1 767.8Total 33,565.2 2,191.7 1,048.1 324.1 – 37,129.1
31 December 2018
Totalcarrying
valueCHF millions
ECL Staging
ECL allowance included in
carrying valuesCHF millions
Fair value ofthe collateral
heldCHF millionsStage 1 Stage 2 Stage 3
Cash and balances with central banks 7,141.9 Treasury bills and other eligible bills 1,199.1 Due from other banks 3,205.6 0.1 0.1Mortgages 6,178.4 0.4 0.4 3.9 4.7 13,660.2Lombard and other loans 12,631.1 1.5 112.3 94.0 207.8 35,552.5Financial assets at fair value through other comprehensive income 5,806.1 0.4 0.4Total on-balance sheet assets as at 31 December 2018 36,162.2 2.4 112.7 97.9 213.0 49,212.7Loan Commitments 199.1 0.1 0.1Financial Guarantees 767.8 0.2 0.7 1.9 2.8Total 37,129.1 2.7 113.4 99.8 215.9 49,212.7
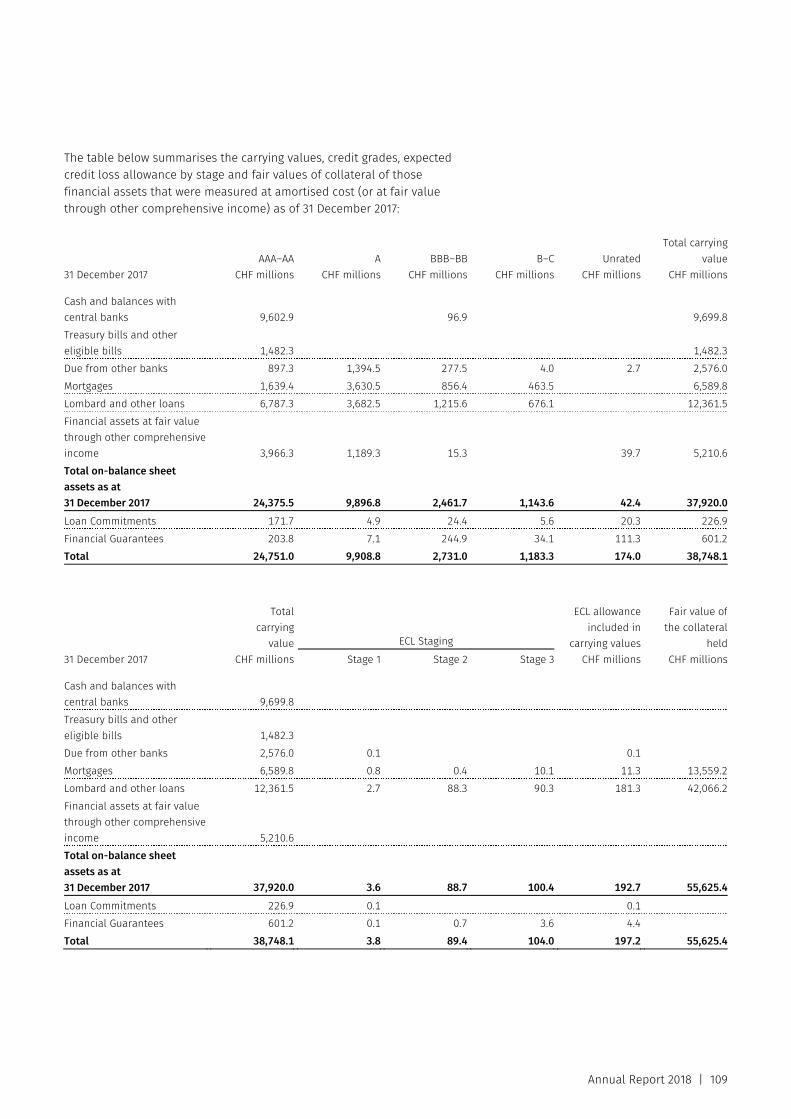
Annual Report 2018 | 109
The table below summarises the carrying values, credit grades, expected credit loss allowance by stage and fair values of collateral of those financial assets that were measured at amortised cost (or at fair value through other comprehensive income) as of 31 December 2017:
31 December 2017 AAA–AA
CHF millionsA
CHF millions BBB–BB
CHF millionsB–C
CHF millionsUnrated
CHF millions
Total carrying value
CHF millions Cash and balances with central banks 9,602.9 96.9 9,699.8Treasury bills and other eligible bills 1,482.3 1,482.3Due from other banks 897.3 1,394.5 277.5 4.0 2.7 2,576.0Mortgages 1,639.4 3,630.5 856.4 463.5 6,589.8Lombard and other loans 6,787.3 3,682.5 1,215.6 676.1 12,361.5Financial assets at fair value through other comprehensive income 3,966.3 1,189.3 15.3 39.7 5,210.6Total on-balance sheet assets as at 31 December 2017 24,375.5 9,896.8 2,461.7 1,143.6 42.4 37,920.0Loan Commitments 171.7 4.9 24.4 5.6 20.3 226.9Financial Guarantees 203.8 7.1 244.9 34.1 111.3 601.2Total 24,751.0 9,908.8 2,731.0 1,183.3 174.0 38,748.1
31 December 2017
Totalcarrying
valueCHF millions
ECL Staging
ECL allowance included in
carrying valuesCHF millions
Fair value ofthe collateral
heldCHF millionsStage 1 Stage 2 Stage 3
Cash and balances with central banks 9,699.8 Treasury bills and other eligible bills 1,482.3 Due from other banks 2,576.0 0.1 0.1Mortgages 6,589.8 0.8 0.4 10.1 11.3 13,559.2Lombard and other loans 12,361.5 2.7 88.3 90.3 181.3 42,066.2Financial assets at fair value through other comprehensive income 5,210.6 Total on-balance sheet assets as at 31 December 2017 37,920.0 3.6 88.7 100.4 192.7 55,625.4Loan Commitments 226.9 0.1 0.1Financial Guarantees 601.2 0.1 0.7 3.6 4.4Total 38,748.1 3.8 89.4 104.0 197.2 55,625.4
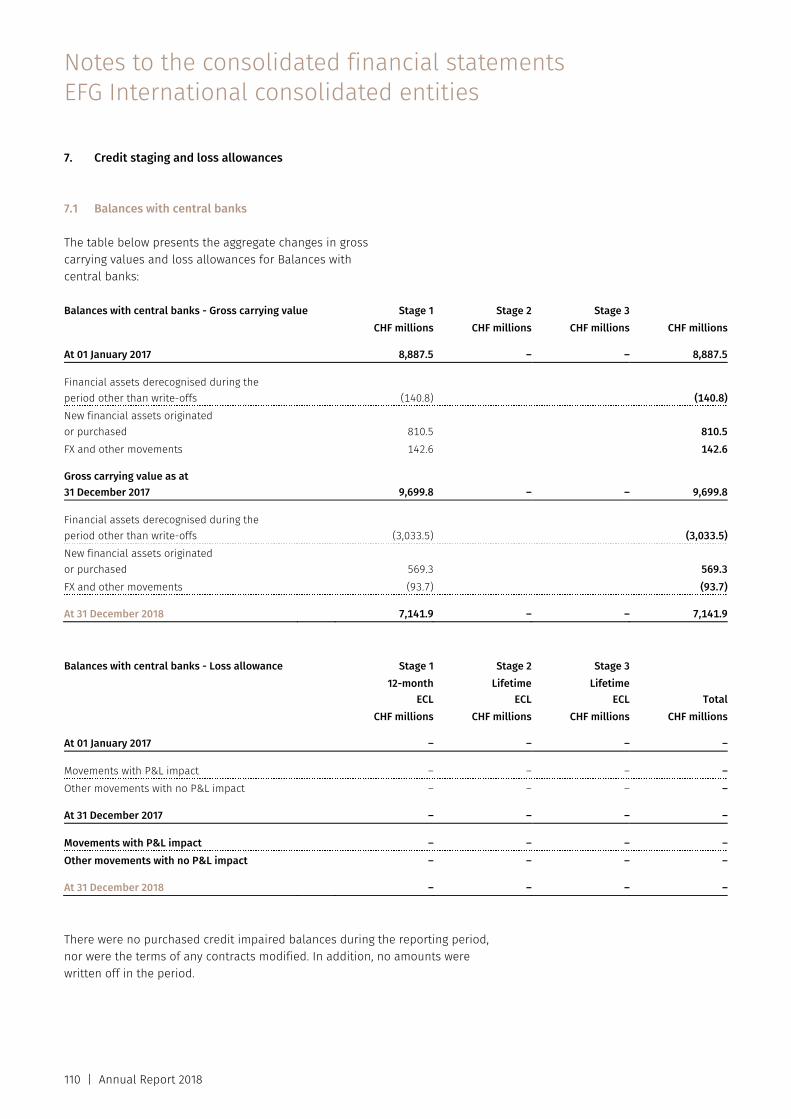
Notes to the consolidated financial statements EFG International consolidated entities
110 | Annual Report 2018
7. Credit staging and loss allowances
7.1 Balances with central banks
The table below presents the aggregate changes in gross carrying values and loss allowances for Balances with central banks:
Balances with central banks - Gross carrying value Stage 1 Stage 2 Stage 3 CHF millions CHF millions CHF millions CHF millions At 01 January 2017 8,887.5 – – 8,887.5 Financial assets derecognised during the period other than write-offs (140.8) (140.8)New financial assets originated or purchased 810.5 810.5FX and other movements 142.6 142.6 Gross carrying value as at 31 December 2017 9,699.8 – – 9,699.8 Financial assets derecognised during the period other than write-offs (3,033.5) (3,033.5)New financial assets originated or purchased 569.3 569.3FX and other movements (93.7) (93.7) At 31 December 2018 7,141.9 – – 7,141.9 Balances with central banks - Loss allowance Stage 1 Stage 2 Stage 3 12-month
ECLLifetime
ECL Lifetime
ECL Total CHF millions CHF millions CHF millions CHF millions At 01 January 2017 – – – – Movements with P&L impact – – – –Other movements with no P&L impact – – – – At 31 December 2017 – – – – Movements with P&L impact – – – –Other movements with no P&L impact – – – – At 31 December 2018 – – – –
There were no purchased credit impaired balances during the reporting period, nor were the terms of any contracts modified. In addition, no amounts were written off in the period.
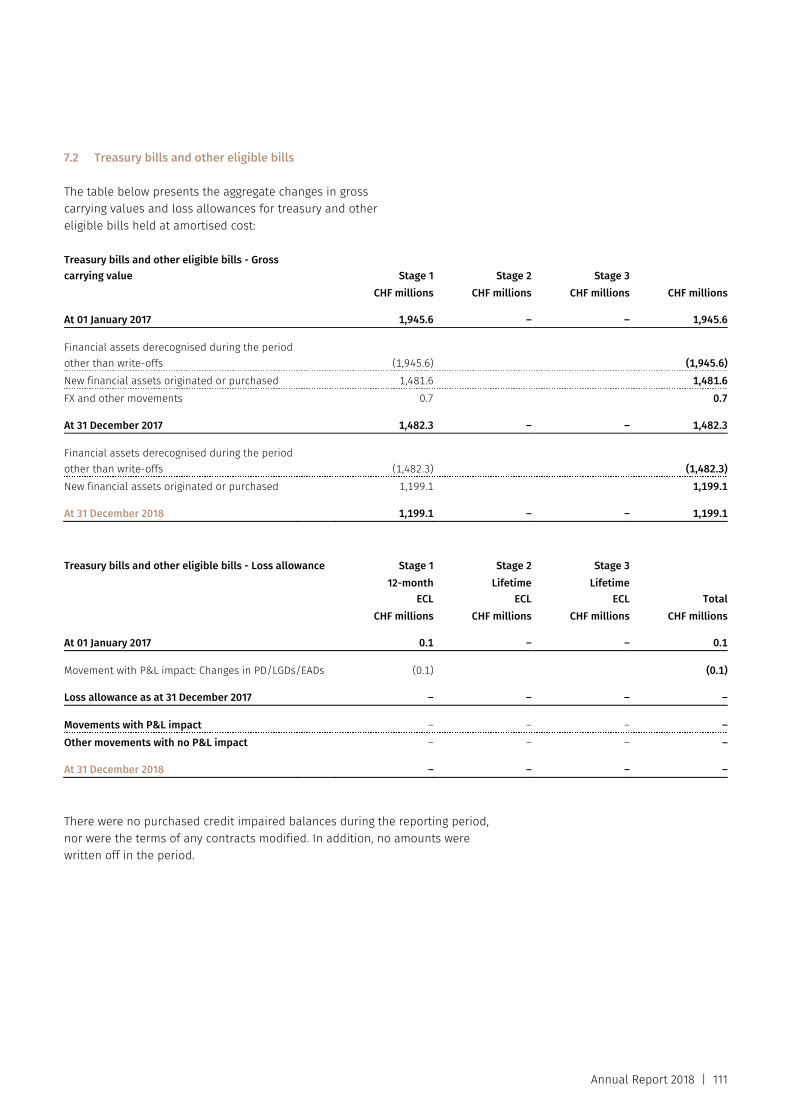
Annual Report 2018 | 111
7.2 Treasury bills and other eligible bills
The table below presents the aggregate changes in gross carrying values and loss allowances for treasury and other eligible bills held at amortised cost:
Treasury bills and other eligible bills - Gross carrying value Stage 1 Stage 2 Stage 3 CHF millions CHF millions CHF millions CHF millions At 01 January 2017 1,945.6 – – 1,945.6 Financial assets derecognised during the period other than write-offs (1,945.6) (1,945.6)New financial assets originated or purchased 1,481.6 1,481.6FX and other movements 0.7 0.7
At 31 December 2017 1,482.3 – – 1,482.3 Financial assets derecognised during the period other than write-offs (1,482.3) (1,482.3)New financial assets originated or purchased 1,199.1 1,199.1 At 31 December 2018 1,199.1 – – 1,199.1 Treasury bills and other eligible bills - Loss allowance Stage 1 Stage 2 Stage 3 12-month
ECLLifetime
ECL Lifetime
ECL Total CHF millions CHF millions CHF millions CHF millions At 01 January 2017 0.1 – – 0.1 Movement with P&L impact: Changes in PD/LGDs/EADs (0.1) (0.1) Loss allowance as at 31 December 2017 – – – – Movements with P&L impact – – – –Other movements with no P&L impact – – – – At 31 December 2018 – – – – There were no purchased credit impaired balances during the reporting period, nor were the terms of any contracts modified. In addition, no amounts were written off in the period.
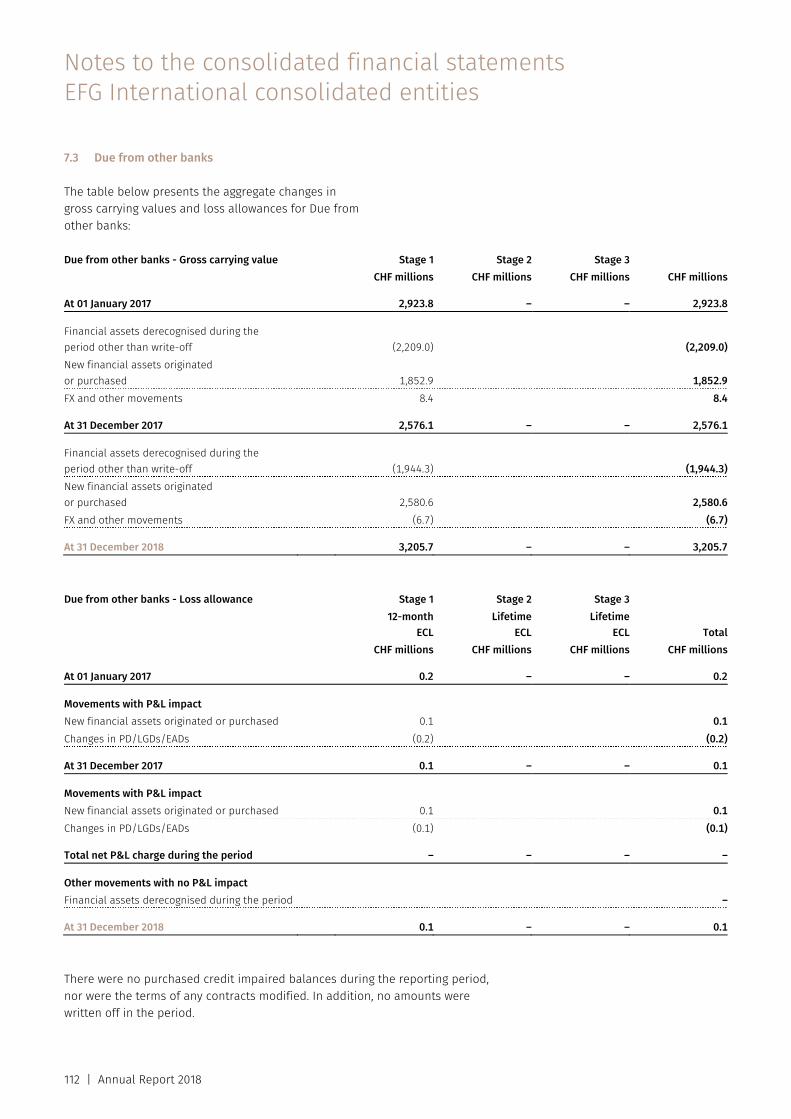
Notes to the consolidated financial statements EFG International consolidated entities
112 | Annual Report 2018
7.3 Due from other banks
The table below presents the aggregate changes in gross carrying values and loss allowances for Due from other banks:
Due from other banks - Gross carrying value Stage 1 Stage 2 Stage 3 CHF millions CHF millions CHF millions CHF millions At 01 January 2017 2,923.8 – – 2,923.8 Financial assets derecognised during the period other than write-off (2,209.0) (2,209.0)New financial assets originated or purchased 1,852.9 1,852.9FX and other movements 8.4 8.4 At 31 December 2017 2,576.1 – – 2,576.1 Financial assets derecognised during the period other than write-off (1,944.3) (1,944.3)New financial assets originated or purchased 2,580.6 2,580.6FX and other movements (6.7) (6.7) At 31 December 2018 3,205.7 – – 3,205.7 Due from other banks - Loss allowance Stage 1 Stage 2 Stage 3 12-month
ECLLifetime
ECL Lifetime
ECL Total CHF millions CHF millions CHF millions CHF millions At 01 January 2017 0.2 – – 0.2 Movements with P&L impact New financial assets originated or purchased 0.1 0.1Changes in PD/LGDs/EADs (0.2) (0.2) At 31 December 2017 0.1 – – 0.1 Movements with P&L impact New financial assets originated or purchased 0.1 0.1Changes in PD/LGDs/EADs (0.1) (0.1) Total net P&L charge during the period – – – – Other movements with no P&L impact Financial assets derecognised during the period – At 31 December 2018 0.1 – – 0.1 There were no purchased credit impaired balances during the reporting period, nor were the terms of any contracts modified. In addition, no amounts were written off in the period.
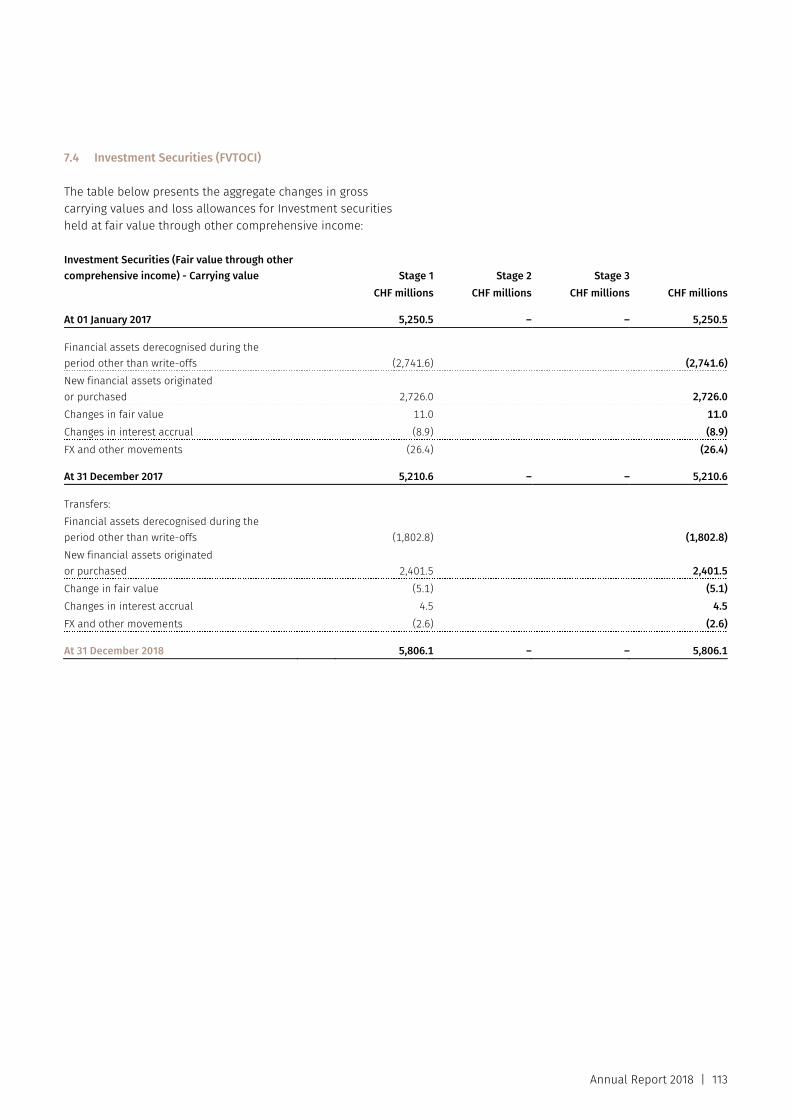
Annual Report 2018 | 113
7.4 Investment Securities (FVTOCI)
The table below presents the aggregate changes in gross carrying values and loss allowances for Investment securities held at fair value through other comprehensive income:
Investment Securities (Fair value through other comprehensive income) - Carrying value Stage 1 Stage 2 Stage 3 CHF millions CHF millions CHF millions CHF millions At 01 January 2017 5,250.5 – – 5,250.5 Financial assets derecognised during the period other than write-offs (2,741.6) (2,741.6)New financial assets originated or purchased 2,726.0 2,726.0Changes in fair value 11.0 11.0Changes in interest accrual (8.9) (8.9)FX and other movements (26.4) (26.4) At 31 December 2017 5,210.6 – – 5,210.6 Transfers: Financial assets derecognised during the period other than write-offs (1,802.8) (1,802.8)New financial assets originated or purchased 2,401.5 2,401.5Change in fair value (5.1) (5.1)Changes in interest accrual 4.5 4.5FX and other movements (2.6) (2.6) At 31 December 2018 5,806.1 – – 5,806.1
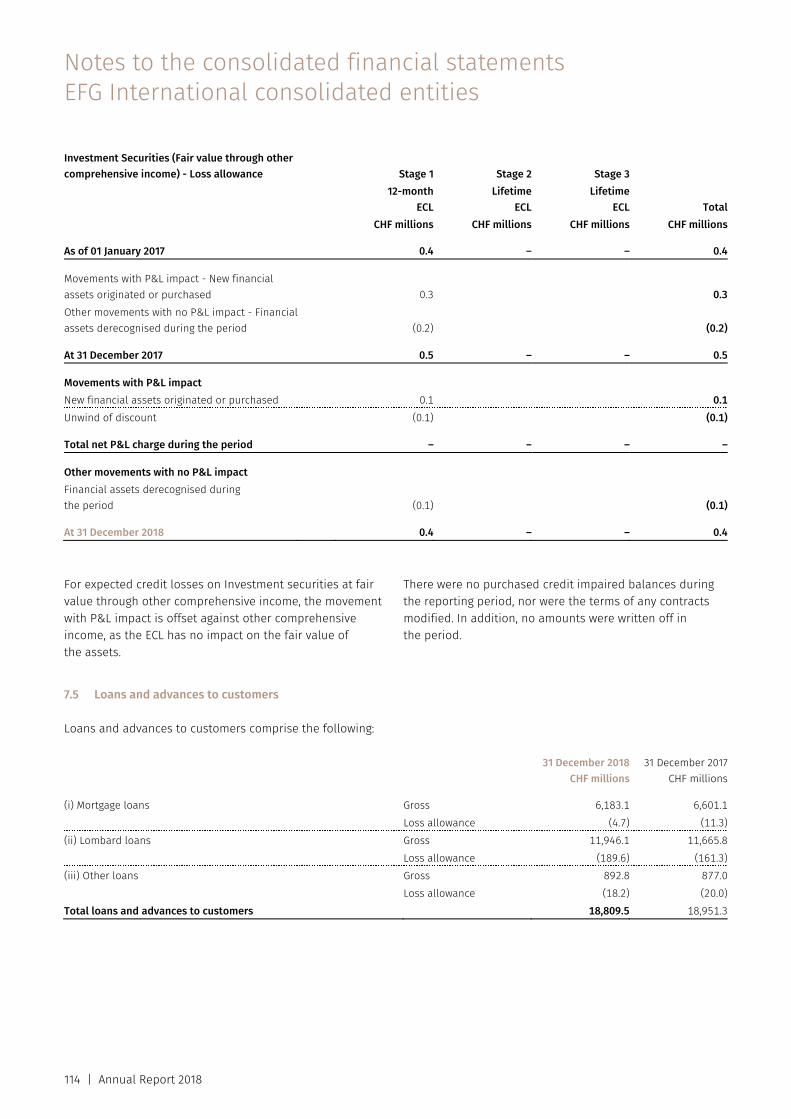
Notes to the consolidated financial statements EFG International consolidated entities
114 | Annual Report 2018
Investment Securities (Fair value through other comprehensive income) - Loss allowance Stage 1 Stage 2 Stage 3 12-month
ECLLifetime
ECL Lifetime
ECL Total CHF millions CHF millions CHF millions CHF millions As of 01 January 2017 0.4 – – 0.4 Movements with P&L impact - New financial assets originated or purchased 0.3 0.3Other movements with no P&L impact - Financial assets derecognised during the period (0.2) (0.2) At 31 December 2017 0.5 – – 0.5 Movements with P&L impact New financial assets originated or purchased 0.1 0.1Unwind of discount (0.1) (0.1) Total net P&L charge during the period – – – – Other movements with no P&L impact Financial assets derecognised during the period (0.1) (0.1) At 31 December 2018 0.4 – – 0.4
For expected credit losses on Investment securities at fair value through other comprehensive income, the movement with P&L impact is offset against other comprehensive income, as the ECL has no impact on the fair value of the assets.
There were no purchased credit impaired balances during the reporting period, nor were the terms of any contracts modified. In addition, no amounts were written off in the period.
7.5 Loans and advances to customers
Loans and advances to customers comprise the following:
31 December 2018
CHF millions31 December 2017
CHF millions (i) Mortgage loans Gross 6,183.1 6,601.1 Loss allowance (4.7) (11.3)(ii) Lombard loans Gross 11,946.1 11,665.8 Loss allowance (189.6) (161.3)(iii) Other loans Gross 892.8 877.0 Loss allowance (18.2) (20.0)Total loans and advances to customers 18,809.5 18,951.3
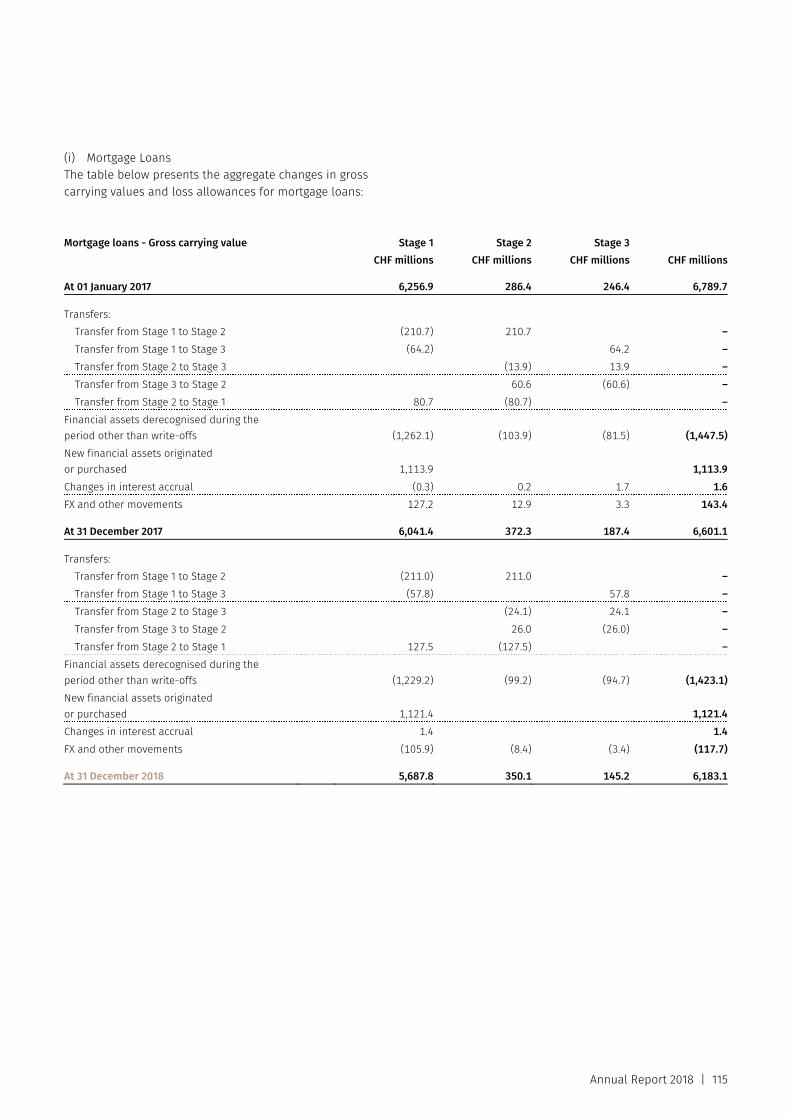
Annual Report 2018 | 115
(i) Mortgage Loans The table below presents the aggregate changes in gross carrying values and loss allowances for mortgage loans:
Mortgage loans - Gross carrying value Stage 1 Stage 2 Stage 3 CHF millions CHF millions CHF millions CHF millions At 01 January 2017 6,256.9 286.4 246.4 6,789.7 Transfers:
Transfer from Stage 1 to Stage 2 (210.7) 210.7 –Transfer from Stage 1 to Stage 3 (64.2) 64.2 –Transfer from Stage 2 to Stage 3 (13.9) 13.9 –Transfer from Stage 3 to Stage 2 60.6 (60.6) –Transfer from Stage 2 to Stage 1 80.7 (80.7) –
Financial assets derecognised during the period other than write-offs (1,262.1) (103.9) (81.5) (1,447.5)New financial assets originated or purchased 1,113.9 1,113.9Changes in interest accrual (0.3) 0.2 1.7 1.6FX and other movements 127.2 12.9 3.3 143.4 At 31 December 2017 6,041.4 372.3 187.4 6,601.1 Transfers:
Transfer from Stage 1 to Stage 2 (211.0) 211.0 –Transfer from Stage 1 to Stage 3 (57.8) 57.8 –Transfer from Stage 2 to Stage 3 (24.1) 24.1 –Transfer from Stage 3 to Stage 2 26.0 (26.0) –Transfer from Stage 2 to Stage 1 127.5 (127.5) –
Financial assets derecognised during the period other than write-offs (1,229.2) (99.2) (94.7) (1,423.1)New financial assets originated or purchased 1,121.4 1,121.4Changes in interest accrual 1.4 1.4FX and other movements (105.9) (8.4) (3.4) (117.7) At 31 December 2018 5,687.8 350.1 145.2 6,183.1
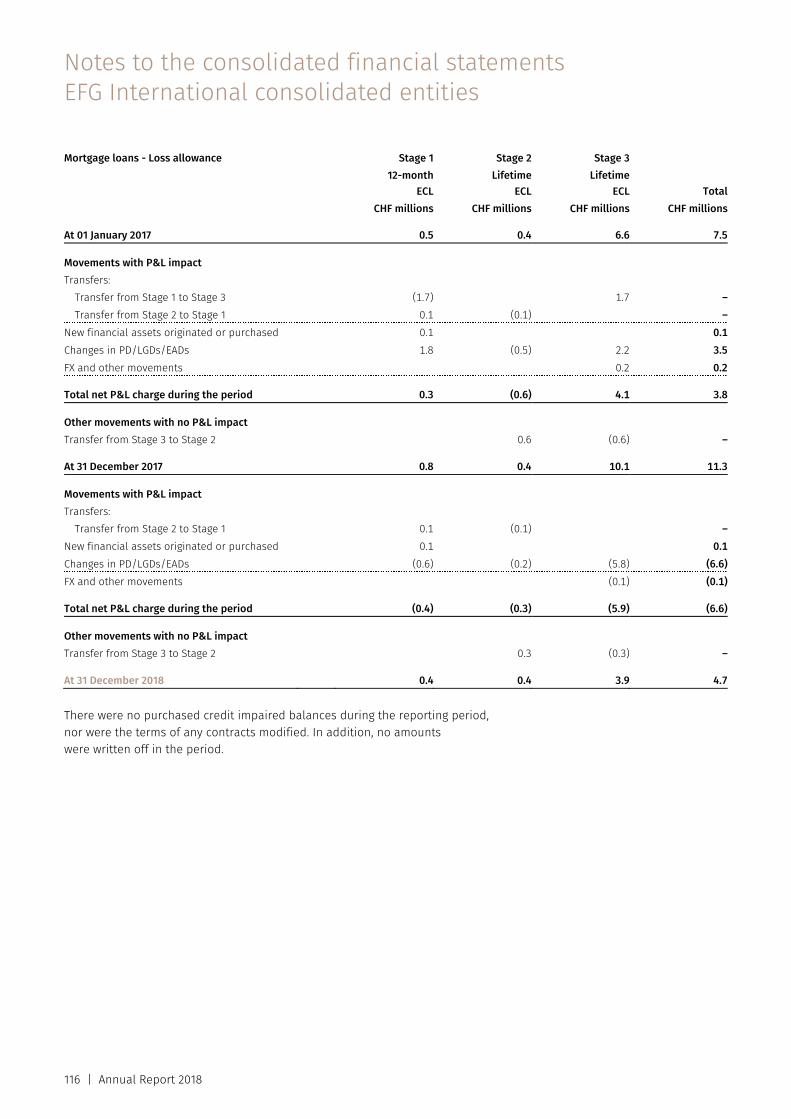
Notes to the consolidated financial statements EFG International consolidated entities
116 | Annual Report 2018
Mortgage loans - Loss allowance Stage 1 Stage 2 Stage 3 12-month
ECLLifetime
ECL Lifetime
ECL Total CHF millions CHF millions CHF millions CHF millions At 01 January 2017 0.5 0.4 6.6 7.5 Movements with P&L impact Transfers:
Transfer from Stage 1 to Stage 3 (1.7) 1.7 –Transfer from Stage 2 to Stage 1 0.1 (0.1) –
New financial assets originated or purchased 0.1 0.1Changes in PD/LGDs/EADs 1.8 (0.5) 2.2 3.5FX and other movements 0.2 0.2 Total net P&L charge during the period 0.3 (0.6) 4.1 3.8 Other movements with no P&L impact Transfer from Stage 3 to Stage 2 0.6 (0.6) –
At 31 December 2017 0.8 0.4 10.1 11.3 Movements with P&L impact Transfers:
Transfer from Stage 2 to Stage 1 0.1 (0.1) –New financial assets originated or purchased 0.1 0.1Changes in PD/LGDs/EADs (0.6) (0.2) (5.8) (6.6)FX and other movements (0.1) (0.1) Total net P&L charge during the period (0.4) (0.3) (5.9) (6.6) Other movements with no P&L impact Transfer from Stage 3 to Stage 2 0.3 (0.3) – At 31 December 2018 0.4 0.4 3.9 4.7 There were no purchased credit impaired balances during the reporting period, nor were the terms of any contracts modified. In addition, no amounts were written off in the period.
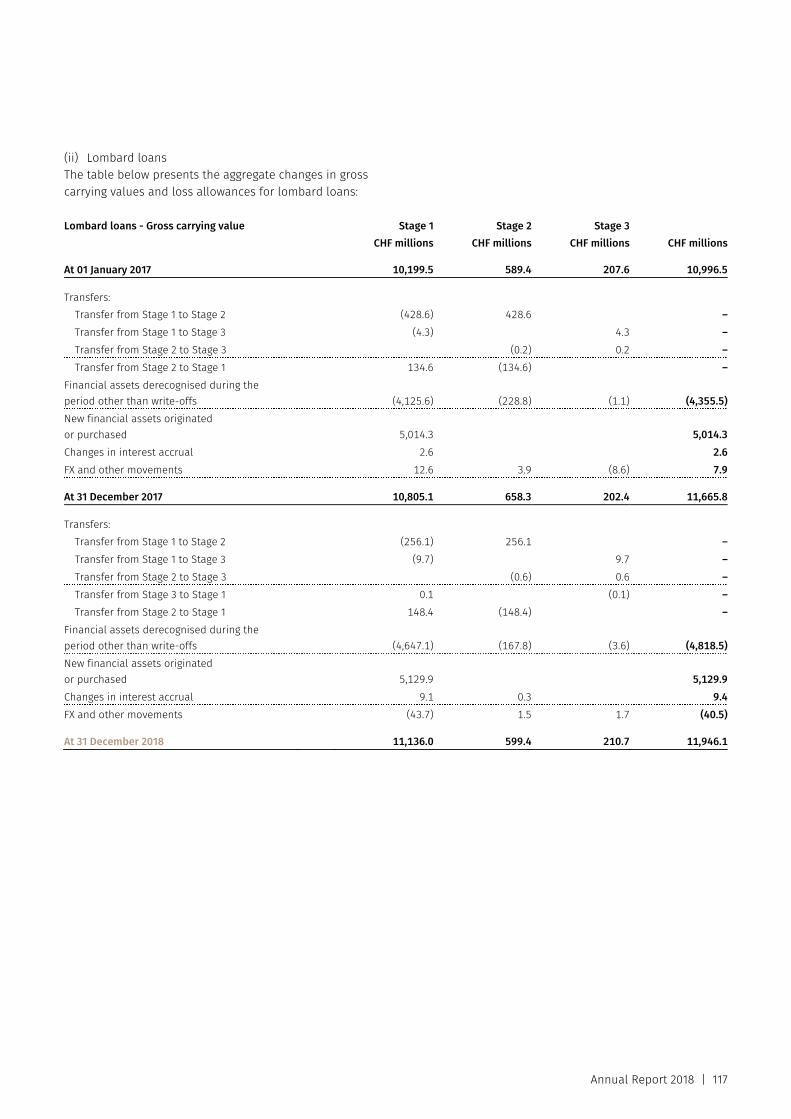
Annual Report 2018 | 117
(ii) Lombard loans The table below presents the aggregate changes in gross carrying values and loss allowances for lombard loans:
Lombard loans - Gross carrying value Stage 1 Stage 2 Stage 3 CHF millions CHF millions CHF millions CHF millions At 01 January 2017 10,199.5 589.4 207.6 10,996.5 Transfers:
Transfer from Stage 1 to Stage 2 (428.6) 428.6 –Transfer from Stage 1 to Stage 3 (4.3) 4.3 –Transfer from Stage 2 to Stage 3 (0.2) 0.2 –Transfer from Stage 2 to Stage 1 134.6 (134.6) –
Financial assets derecognised during the period other than write-offs (4,125.6) (228.8) (1.1) (4,355.5)New financial assets originated or purchased 5,014.3 5,014.3Changes in interest accrual 2.6 2.6FX and other movements 12.6 3.9 (8.6) 7.9 At 31 December 2017 10,805.1 658.3 202.4 11,665.8 Transfers:
Transfer from Stage 1 to Stage 2 (256.1) 256.1 –Transfer from Stage 1 to Stage 3 (9.7) 9.7 –Transfer from Stage 2 to Stage 3 (0.6) 0.6 –Transfer from Stage 3 to Stage 1 0.1 (0.1) –Transfer from Stage 2 to Stage 1 148.4 (148.4) –
Financial assets derecognised during the period other than write-offs (4,647.1) (167.8) (3.6) (4,818.5)New financial assets originated or purchased 5,129.9 5,129.9Changes in interest accrual 9.1 0.3 9.4FX and other movements (43.7) 1.5 1.7 (40.5) At 31 December 2018 11,136.0 599.4 210.7 11,946.1
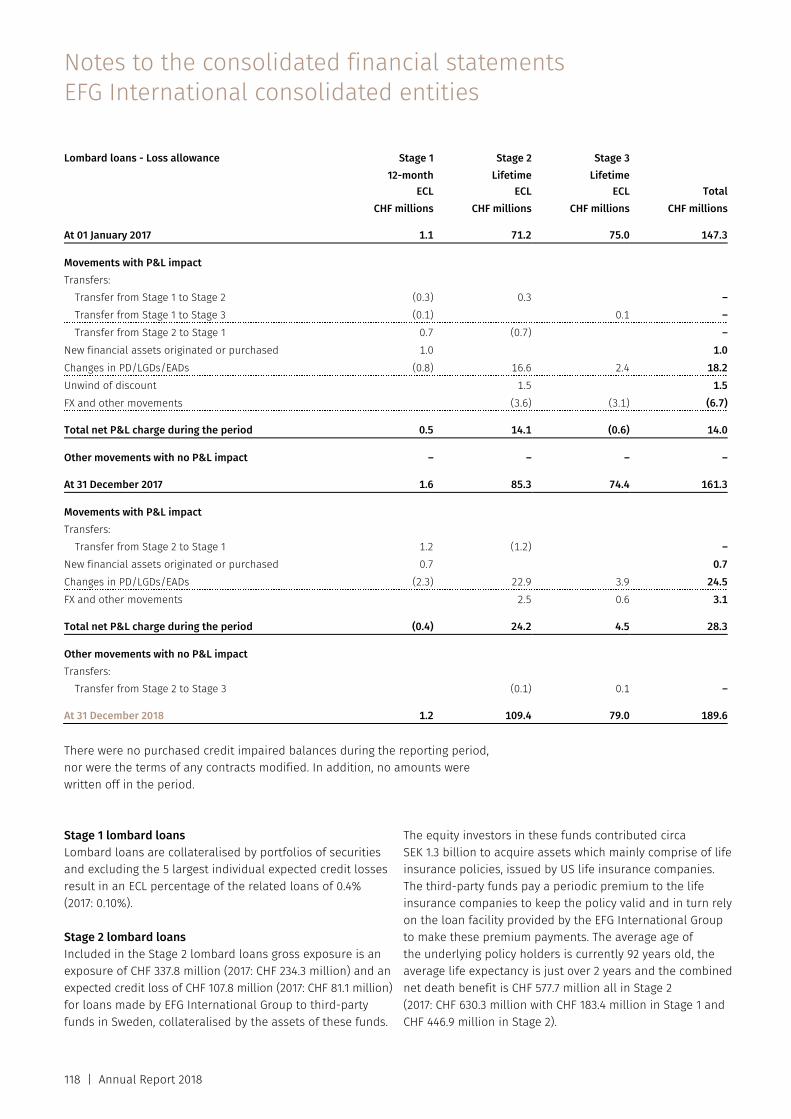
Notes to the consolidated financial statements EFG International consolidated entities
118 | Annual Report 2018
Lombard loans - Loss allowance Stage 1 Stage 2 Stage 3 12-month
ECLLifetime
ECL Lifetime
ECL Total CHF millions CHF millions CHF millions CHF millions At 01 January 2017 1.1 71.2 75.0 147.3 Movements with P&L impact Transfers:
Transfer from Stage 1 to Stage 2 (0.3) 0.3 –Transfer from Stage 1 to Stage 3 (0.1) 0.1 –Transfer from Stage 2 to Stage 1 0.7 (0.7) –
New financial assets originated or purchased 1.0 1.0Changes in PD/LGDs/EADs (0.8) 16.6 2.4 18.2Unwind of discount 1.5 1.5FX and other movements (3.6) (3.1) (6.7) Total net P&L charge during the period 0.5 14.1 (0.6) 14.0 Other movements with no P&L impact – – – – At 31 December 2017 1.6 85.3 74.4 161.3 Movements with P&L impact Transfers:
Transfer from Stage 2 to Stage 1 1.2 (1.2) –New financial assets originated or purchased 0.7 0.7Changes in PD/LGDs/EADs (2.3) 22.9 3.9 24.5FX and other movements 2.5 0.6 3.1 Total net P&L charge during the period (0.4) 24.2 4.5 28.3 Other movements with no P&L impact Transfers:
Transfer from Stage 2 to Stage 3 (0.1) 0.1 – At 31 December 2018 1.2 109.4 79.0 189.6 There were no purchased credit impaired balances during the reporting period, nor were the terms of any contracts modified. In addition, no amounts were written off in the period.
Stage 1 lombard loans Lombard loans are collateralised by portfolios of securities and excluding the 5 largest individual expected credit losses result in an ECL percentage of the related loans of 0.4% (2017: 0.10%).
Stage 2 lombard loans Included in the Stage 2 lombard loans gross exposure is an exposure of CHF 337.8 million (2017: CHF 234.3 million) and an expected credit loss of CHF 107.8 million (2017: CHF 81.1 million) for loans made by EFG International Group to third-party funds in Sweden, collateralised by the assets of these funds.
The equity investors in these funds contributed circa SEK 1.3 billion to acquire assets which mainly comprise of life insurance policies, issued by US life insurance companies. The third-party funds pay a periodic premium to the life insurance companies to keep the policy valid and in turn rely on the loan facility provided by the EFG International Group to make these premium payments. The average age of the underlying policy holders is currently 92 years old, the average life expectancy is just over 2 years and the combined net death benefit is CHF 577.7 million all in Stage 2 (2017: CHF 630.3 million with CHF 183.4 million in Stage 1 and CHF 446.9 million in Stage 2).
Annual Report 2018 | 119
Whilst the loans are still performing, due to the extensions in life expectancies and the increases in cost of insurance that the US life insurance industry has encountered over the last few years, the EFG International Group considers that these loans have experienced a significant increase in credit risk (relative to the date when the loans were originally drawn down, as required by IFRS 9).
As a result these loans are classified as Stage 2 loans and EFG International Group is required to provide for ‘lifetime expected credit losses’ on them. The Group concluded that these loans met the SPPI requirements as the initial loan to value was approximately 60% when originated and due to the level of equity that the investors of the funds had initially invested.
Determination of this ECL required EFG International Group to use actuarial models to determine the potential cash flows that the funds will experience, and thus the valuation of the collateral. The sensitivities to the funds collateral values is determined using a discounted cash flow valuation technique for the determination of the ECL, which makes use of market observable and non-market observable inputs. The inputs incorporate: – Actuarially based assumptions on life expectancy – Premium estimates – Risk adjustments – Interest rate curves or discount factors
The methodology applied for the determination of the ECL of these exposures is the same as the one applied for the calculation of the fair value in EFG International Group’s proprietary investments in life insurance policies.
The LGD of these loans will be dependent on certain financial risks that the funds are exposed to, which primarily include: – Potential increases in the cost of insurance charges – Longevity risk (see note 9)
Stage 3 lombard loans Included in Stage 3 lombard loans is a gross exposure including accrued interest of USD 197.0 million (2017: USD 193.8 million) that EFG Bank AG disbursed in 2007 and on which an expected credit loss of CHF 76.3 million (2017: CHF 70.2 million) has been calculated. EFG International Group is party to multi-jurisdictional legal proceedings relating to a client relationship with a Taiwanese insurance company, including arbitration proceedings in Taiwan. EFG International Group has extended a loan of USD 193.8 million (excluding interest) to
an affiliate of the insurance company, which was placed into receivership in 2014. The loan is secured by the assets of another affiliate of the insurance company, domiciled in Singapore that was placed into receivership. The former ultimate beneficial owner and chairman of the insurance company (who has been found guilty in Taiwan of various criminal offenses related to the misappropriation of company funds, including the proceeds of the bank loan) also gave EFG International Group a personal indemnity covering the loan. The overall relationship with the insurance company included accounts held at EFG in Hong Kong, Singapore and Switzerland.
In January 2018, an arbitration tribunal in Taiwan concluded that the transaction was invalid under the law of Taiwan as a result of the insurance company’s non-compliance with Taiwanese insurance regulations. Based on that reasoning, the tribunal required EFG International Group to return the USD 193.8 million plus interest in assets held by the affiliate of the insurance company and used as collateral for the loan, plus interest.
EFG International Group fundamentally disagrees with the tribunal’s reasoning and the result. It is vigorously challenging in court the validity of the award and is currently resisting an attempt in Hong Kong to enforce it, which will be considered by the Hong Kong courts in 2020. Moreover, the tribunal did not opine on the validity of the loan collateral under the governing laws of Singapore. EFG International Group had already commenced legal proceedings to confirm the validity of the loan collateral in Singapore, which are now progressing. In addition, EFG International Group is considering how most appropriately to enforce the personal indemnity of the former chairman, secured through successful legal proceedings in Singapore and taking steps to recover assets from the former chairman.
The Group has assessed a multitude of potential outcomes in regards to the recoverability of this loan and has recorded the discounted probability weighted impairment arising from these scenarios as the ECL. EFG International Group has recorded a provision of equal amount in its Swiss GAAP financial statements, which form the basis of the EFG International Group’s regulatory capital adequacy reporting.
(iii) Other loans The table below presents the aggregate changes in gross carrying values and loss allowances for other loans (which include commercial loans, loans to public entities, unsecured overdrafts):
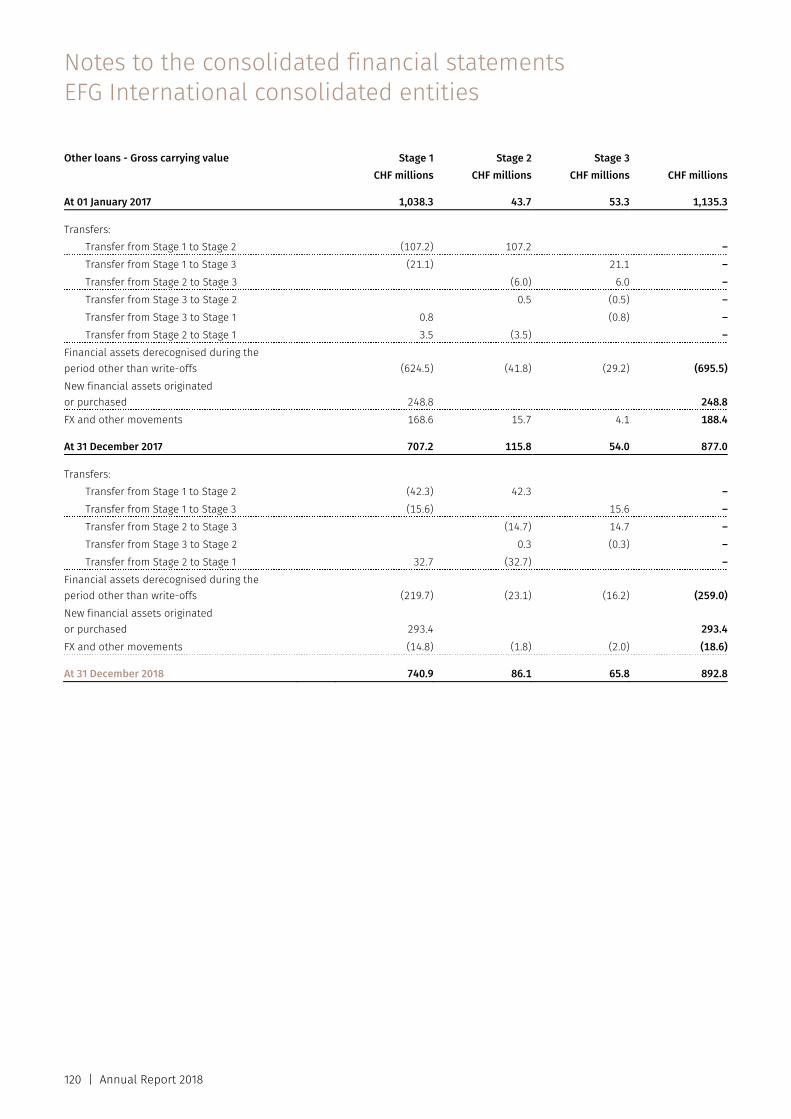
Notes to the consolidated financial statements EFG International consolidated entities
120 | Annual Report 2018
Other loans - Gross carrying value Stage 1 Stage 2 Stage 3 CHF millions CHF millions CHF millions CHF millions At 01 January 2017 1,038.3 43.7 53.3 1,135.3 Transfers:
Transfer from Stage 1 to Stage 2 (107.2) 107.2 –Transfer from Stage 1 to Stage 3 (21.1) 21.1 –Transfer from Stage 2 to Stage 3 (6.0) 6.0 –Transfer from Stage 3 to Stage 2 0.5 (0.5) –Transfer from Stage 3 to Stage 1 0.8 (0.8) –Transfer from Stage 2 to Stage 1 3.5 (3.5) –
Financial assets derecognised during the period other than write-offs (624.5) (41.8) (29.2) (695.5)New financial assets originated or purchased 248.8 248.8FX and other movements 168.6 15.7 4.1 188.4 At 31 December 2017 707.2 115.8 54.0 877.0 Transfers:
Transfer from Stage 1 to Stage 2 (42.3) 42.3 –Transfer from Stage 1 to Stage 3 (15.6) 15.6 –Transfer from Stage 2 to Stage 3 (14.7) 14.7 –Transfer from Stage 3 to Stage 2 0.3 (0.3) –Transfer from Stage 2 to Stage 1 32.7 (32.7) –
Financial assets derecognised during the period other than write-offs (219.7) (23.1) (16.2) (259.0)New financial assets originated or purchased 293.4 293.4FX and other movements (14.8) (1.8) (2.0) (18.6) At 31 December 2018 740.9 86.1 65.8 892.8
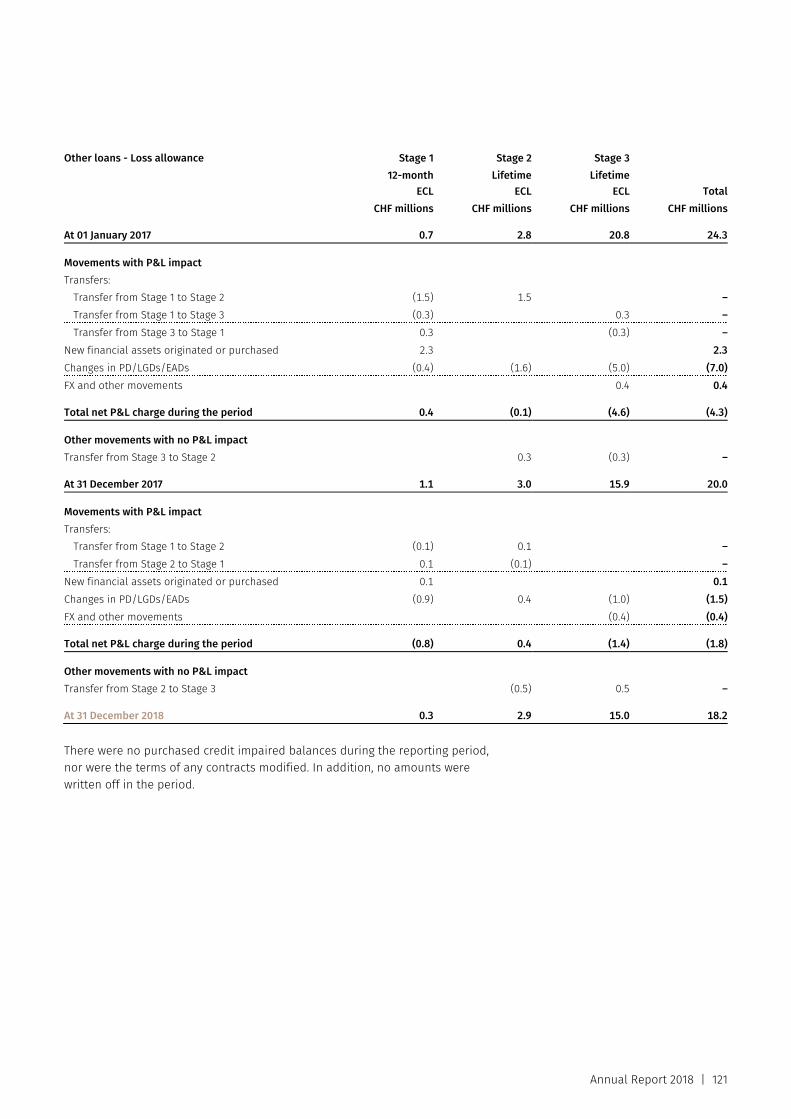
Annual Report 2018 | 121
Other loans - Loss allowance Stage 1 Stage 2 Stage 3 12-month
ECLLifetime
ECL Lifetime
ECL Total CHF millions CHF millions CHF millions CHF millions At 01 January 2017 0.7 2.8 20.8 24.3 Movements with P&L impact Transfers:
Transfer from Stage 1 to Stage 2 (1.5) 1.5 –Transfer from Stage 1 to Stage 3 (0.3) 0.3 –Transfer from Stage 3 to Stage 1 0.3 (0.3) –
New financial assets originated or purchased 2.3 2.3Changes in PD/LGDs/EADs (0.4) (1.6) (5.0) (7.0)FX and other movements 0.4 0.4 Total net P&L charge during the period 0.4 (0.1) (4.6) (4.3) Other movements with no P&L impact Transfer from Stage 3 to Stage 2 0.3 (0.3) – At 31 December 2017 1.1 3.0 15.9 20.0 Movements with P&L impact Transfers:
Transfer from Stage 1 to Stage 2 (0.1) 0.1 –Transfer from Stage 2 to Stage 1 0.1 (0.1) –
New financial assets originated or purchased 0.1 0.1Changes in PD/LGDs/EADs (0.9) 0.4 (1.0) (1.5)FX and other movements (0.4) (0.4) Total net P&L charge during the period (0.8) 0.4 (1.4) (1.8) Other movements with no P&L impact Transfer from Stage 2 to Stage 3 (0.5) 0.5 – At 31 December 2018 0.3 2.9 15.0 18.2 There were no purchased credit impaired balances during the reporting period, nor were the terms of any contracts modified. In addition, no amounts were written off in the period.
Notes to the consolidated financial statements EFG International consolidated entities
122 | Annual Report 2018
8. Market risk
Market risk is the risk of losses arising from unexpected changes in interest rates, exchange rates, share prices or the prices of precious metals and commodities, as well as the corresponding expected volatility. Market risk can have an impact on EFG International AG’s (EFG International; the Company) and all its subsidiaries’ (together EFG International Group) income statement and the value of its assets. EFG International Group uses derivative finan-cial instruments for hedging and for trading purposes.
Banking book Risks related to the balance sheet structure (interest rate and foreign exchange rate) are managed by the Asset & Liability Management Committee and monitored by the Financial Risk Committee, in accordance with the principles and the risk appetite defined in the market risk policy, which defines the organisational structure, responsibilities, limit systems and maximum acceptable risk set by the Board of Directors.
The interest rate risk appetite at balance sheet level is approved by the Board of Directors and has the objective to manage interest rate risk in line with predefined limits and risk appetite to generate profits for the benefit of EFG International Group.
EFG International Group interest rate risk in banking book is monitored centrally by Group Risk division with strategic management done by the Asset & Liability Management Committee and risk monitoring done by the Financial Risk Committee. The interest rate risk assessment includes risks deriving from assets, liabilities and off-balance sheet transactions, considering behavioural assumptions on sight deposits. Although non-maturing current accounts are considered at sight from a contractual point of view, in practice and from an economical point of view it has been observed that they provide a stable funding source. EFG International Group distinguishes between the stable and the non-stable part of non maturing deposits, performing an historical analysis to define core stable volume. Current deposits are therefore slotted into appropriate time buckets assuming a high degree of likelihood: non-core and volatile part of deposits is considered at sight, while core and stable part of deposits is slotted based on the natural decay rate.
EFG International Group holds investment portfolios, which allow to diversify balance sheet assets and to optimise any excess liquidity.
EFG International Group investment portfolios carry material credit spread exposure on governments, government-related entities, multilateral development banks, banking institutions and, to a lesser extent, to corporate names. The investment activities are organised within Treasury department and are monitored centrally by Group Risk division and under the supervision of the Asset & Liability Management Committee and of the Financial Risk Committee. Market risk exposure, encompassing interest rate and credit spread risks, carried by the financial invest-ment portfolios belonging to the banking book is monitored, on a daily and month-end basis. It is monitored through various metrics: sensitivity to risk factors, value at risk (VaR) and hypothetical stress tests, all previous metrics being computed with a full revaluation of all the positions. On top of minimum issuer and issuer country of domicile rating standards, counterparty and country concentration risk is monitored through a dedicated set of limits. Month-to-date and year-to-date P&L limits complement the financial investment portfolio risk monitoring framework.
Trading book The market risk carried by proprietary trading primarily relates to position risk which derives from the fact that any interest rate, foreign exchange rate fluctuation, can cause a change in the EFG International Group’s profits.
EFG International Group carries out trading operations both for its clients and on its own account with a daily basis monitoring. The trading activities are based in Lugano and organised in different trading desks: Forex Delta, Forex Forwards, Forex Options, Precious Metals and Banknotes; Fixed Income and Structured Finance managed by expert traders.
All trading positions are valued at market value using mar-ket prices, data and parameters published by recognised stock exchanges or financial data providers. For the trading portfolios, on an intra-day or daily basis, the risk measure-ment systems support the computation and analysis of: (i) the mark-to-market of the positions exposed to risk; (ii) the daily and cumulative monthly and year-to-date P&L; (iii) the various risk metrics (incl. sensitivities – greeks, stress test, VaR, concentration risk) and (iv) the regulatory and eco-nomic capital requirements.
Adherence to all limits is independently monitored by the Group Market Risk department. Daily risk reports are pro-duced which review compliance with nominal and sensitiv-ity limits and stop loss limits.
Annual Report 2018 | 123
8.1 Market risk measurement methodology
(a) Value at risk The VaR computation is a risk analysis tool statistically designed to estimate the maximum potential periodic loss from adverse movements in interest rates (excluding credit spreads), foreign currencies and equity prices, under normal market conditions. VaR is calculated using statistically expected changes in market parameters for a given holding-period-specified confidence level.
The EFG International Group’s VaR methodology is based on a full revaluation historical VaR approach and considering a 10-day holding period with a 501-day observation period and a 99% confidence level.
VaR is used for internal control purpose and not for regulatory reporting of risks.
(b) Sensitivity analysis The risk assessment through sensitivity analysis considers all major market risks deriving from assets, liabilities and off-balance sheet transactions. The simulations analyse the impacts on risk exposures of adverse movements in market parameters. For interest rate risk the following risk exposures are assessed: Impact on net interest income (NII): The NII assessment
determines the impact of a change in the interest rate structure on the forecast interest income (and thus on current earnings). This view is based on nominal values and considers the impact on the basis of a 12-month time horizon. This short-term approach enables the EFG International Group to quantify the impact of changes in interest rates on the interest margin
Impact on economic value of equity (EVE): The EVE assess-ment measures the impact of changes in interest rates on current values of future cash flows and thus on the current economic value of EFG International Group’s equity. When interest rates are used for discounting change, this causes a change in the current value of future cash flows. In contrast to the first approach, which focuses solely on a one-year time frame, the impact on the market value expresses the long-term impact deriving from all future cash flows, if there is a shift in market interest rates
For foreign exchange rate risks the sensitivity measurement covers in particular: The mismatch between on- and off-balance sheet
positions denominated in foreign currencies The forecasted earnings that will be made in foreign
currencies
(c) Stress tests VaR calculation and sensitivity analysis are complemented by stress tests, which identify the potential impact of extreme market scenarios on the EFG International Group’s equity and income statements. These stress tests simulate both exceptional movements in prices or rates, and drastic deteriorations in market correlations.
Stress tests provide an indication of the potential size of losses that could arise in extreme conditions. The stress tests include: Risk factor stress testing, where stress movements are
applied to each risk category Ad hoc stress testing, which includes applying possible
stress events to specific positions or regions
8.2 Market risk hedging strategies
EFG International Group is exposed to financial risks arising from many aspects of its business. The International Group implements different risk management strategies to eliminate or reduce market risk exposures. Risks being hedged through derivative financial instruments are typically changes in interest rates, foreign currency rates or effects of other risks (e.g. mortality risk on insurance policies portfolio). EFG International Group implements fair value hedging strategies.
The risk being hedged in a fair value hedging strategy is a change in the fair value of an asset or liability that is attributable to a particular risk and could affect P&L or the economic value of equity. Changes in fair value might arise through changes in interest rates, foreign exchange rates or other attributes. EFG International Group implements fair value hedges of individual hedged items (micro fair value hedging).
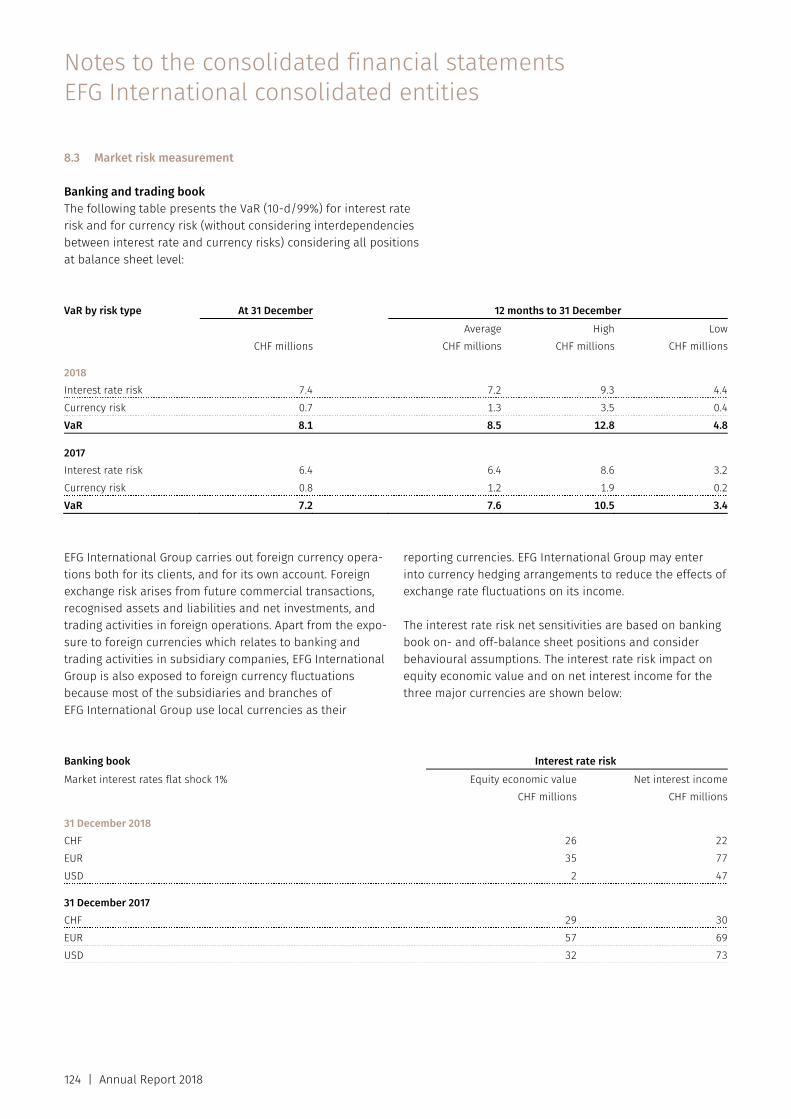
Notes to the consolidated financial statements EFG International consolidated entities
124 | Annual Report 2018
8.3 Market risk measurement
Banking and trading book The following table presents the VaR (10-d/99%) for interest rate risk and for currency risk (without considering interdependencies between interest rate and currency risks) considering all positions at balance sheet level:
VaR by risk type At 31 December 12 months to 31 December Average High Low CHF millions CHF millions CHF millions CHF millions 2018 Interest rate risk 7.4 7.2 9.3 4.4Currency risk 0.7 1.3 3.5 0.4VaR 8.1 8.5 12.8 4.8 2017 Interest rate risk 6.4 6.4 8.6 3.2Currency risk 0.8 1.2 1.9 0.2VaR 7.2 7.6 10.5 3.4 EFG International Group carries out foreign currency opera-tions both for its clients, and for its own account. Foreign exchange risk arises from future commercial transactions, recognised assets and liabilities and net investments, and trading activities in foreign operations. Apart from the expo-sure to foreign currencies which relates to banking and trading activities in subsidiary companies, EFG International Group is also exposed to foreign currency fluctuations because most of the subsidiaries and branches of EFG International Group use local currencies as their
reporting currencies. EFG International Group may enter into currency hedging arrangements to reduce the effects of exchange rate fluctuations on its income.
The interest rate risk net sensitivities are based on banking book on- and off-balance sheet positions and consider behavioural assumptions. The interest rate risk impact on equity economic value and on net interest income for the three major currencies are shown below:
Banking book Interest rate risk Market interest rates flat shock 1% Equity economic value Net interest income CHF millions CHF millions 31 December 2018 CHF 26 22EUR 35 77USD 2 47 31 December 2017 CHF 29 30EUR 57 69USD 32 73

Annual Report 2018 | 125
The table below summarises the repricing gap of the EFG International Group’s financial instruments at carrying amounts, categorised by the earlier of contractual repricing or maturity dates:
Up to 3months
CHF millions
3–12months
CHF millions
1–5 years
CHF millions
Over 5years
CHF millions
Non-interestbearing
CHF millionsTotal
CHF millions As at 31 December 2018 Assets Cash and balances with central banks 7,141.9 7,141.9Treasury bills 1,173.9 25.2 1,199.1Due from other banks 1,013.1 54.2 112.7 2,025.6 3,205.6Loans and advances to customers 10,557.2 3,075.7 4,499.2 677.4 18,809.5Derivative financial instruments 376.7 0.2 1.1 841.6 1,219.6Financial assets at fair value through profit and loss 718.3 253.1 0.7 1.0 1,067.8 2,040.9Financial assets at fair value through other comprehensive income 701.6 2,932.1 1,550.3 313.7 308.4 5,806.1Total financial assets 21,682.7 6,340.5 6,164.0 992.1 4,243.4 39,422.7 Liabilities Due to other banks 253.1 49.7 302.8Due to customers 11,845.6 1,046.7 103.3 17,069.9 30,065.5Derivative financial instruments 359.8 0.2 0.4 4.8 848.7 1,213.9Financial liabilities designated at fair value 322.9 223.5 37.8 584.2Financial liabilities at amortised cost 829.9 1,281.6 2,281.9 811.4 5,204.8Subordinated loans 391.7 4.9 396.6Provisions 135.6 135.6Other liabilities 568.8 568.8Total financial liabilities 13,611.3 2,552.0 2,777.3 816.2 18,715.4 38,472.2 On-balance-sheet interest repricing gap 8,071.4 3,788.5 3,386.7 175.9 (14,472.0) 950.5Off-balance-sheet interest repricing gap 1,863.6 (788.8) (847.3) (226.0) 1.5 3.0
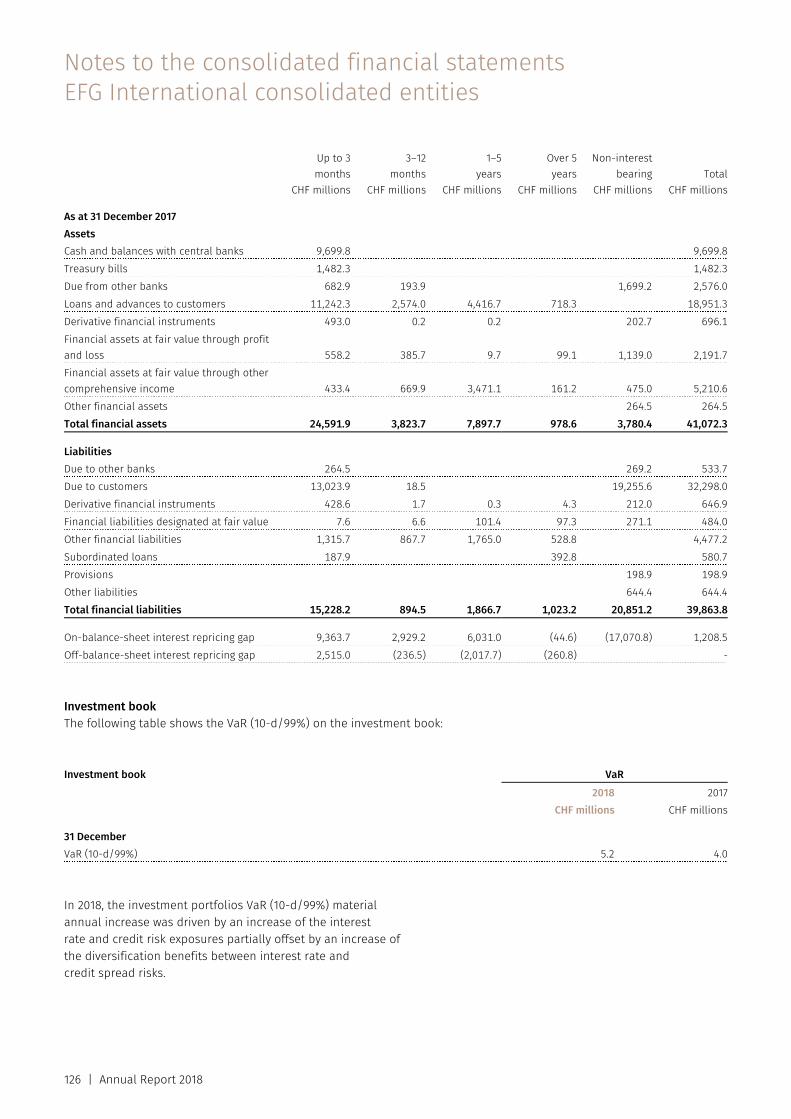
Notes to the consolidated financial statements EFG International consolidated entities
126 | Annual Report 2018
Up to 3months
CHF millions
3–12months
CHF millions
1–5 years
CHF millions
Over 5years
CHF millions
Non-interestbearing
CHF millionsTotal
CHF millions As at 31 December 2017 Assets Cash and balances with central banks 9,699.8 9,699.8Treasury bills 1,482.3 1,482.3Due from other banks 682.9 193.9 1,699.2 2,576.0Loans and advances to customers 11,242.3 2,574.0 4,416.7 718.3 18,951.3Derivative financial instruments 493.0 0.2 0.2 202.7 696.1Financial assets at fair value through profit and loss 558.2 385.7 9.7 99.1 1,139.0 2,191.7Financial assets at fair value through other comprehensive income 433.4 669.9 3,471.1 161.2 475.0 5,210.6Other financial assets 264.5 264.5Total financial assets 24,591.9 3,823.7 7,897.7 978.6 3,780.4 41,072.3 Liabilities Due to other banks 264.5 269.2 533.7Due to customers 13,023.9 18.5 19,255.6 32,298.0Derivative financial instruments 428.6 1.7 0.3 4.3 212.0 646.9Financial liabilities designated at fair value 7.6 6.6 101.4 97.3 271.1 484.0Other financial liabilities 1,315.7 867.7 1,765.0 528.8 4,477.2Subordinated loans 187.9 392.8 580.7Provisions 198.9 198.9Other liabilities 644.4 644.4Total financial liabilities 15,228.2 894.5 1,866.7 1,023.2 20,851.2 39,863.8 On-balance-sheet interest repricing gap 9,363.7 2,929.2 6,031.0 (44.6) (17,070.8) 1,208.5Off-balance-sheet interest repricing gap 2,515.0 (236.5) (2,017.7) (260.8) - Investment book The following table shows the VaR (10-d/99%) on the investment book:
Investment book VaR 2018 2017 CHF millions CHF millions 31 December VaR (10-d/99%) 5.2 4.0 In 2018, the investment portfolios VaR (10-d/99%) material annual increase was driven by an increase of the interest rate and credit risk exposures partially offset by an increase of the diversification benefits between interest rate and credit spread risks.
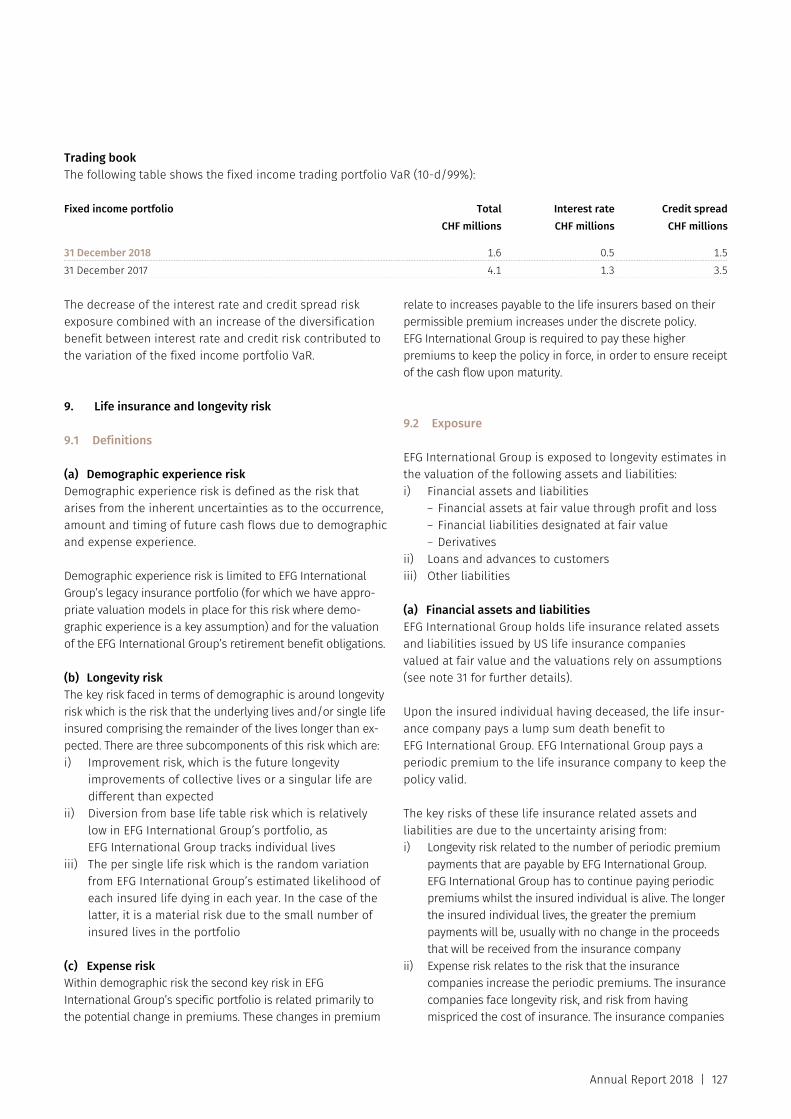
Annual Report 2018 | 127
Trading book The following table shows the fixed income trading portfolio VaR (10-d/99%): Fixed income portfolio Total Interest rate Credit spread CHF millions CHF millions CHF millions 31 December 2018 1.6 0.5 1.531 December 2017 4.1 1.3 3.5 The decrease of the interest rate and credit spread risk exposure combined with an increase of the diversification benefit between interest rate and credit risk contributed to the variation of the fixed income portfolio VaR.
9. Life insurance and longevity risk
9.1 Definitions
(a) Demographic experience risk Demographic experience risk is defined as the risk that arises from the inherent uncertainties as to the occurrence, amount and timing of future cash flows due to demographic and expense experience.
Demographic experience risk is limited to EFG International Group’s legacy insurance portfolio (for which we have appro-priate valuation models in place for this risk where demo-graphic experience is a key assumption) and for the valuation of the EFG International Group’s retirement benefit obligations.
(b) Longevity risk The key risk faced in terms of demographic is around longevity risk which is the risk that the underlying lives and/or single life insured comprising the remainder of the lives longer than ex-pected. There are three subcomponents of this risk which are: i) Improvement risk, which is the future longevity
improvements of collective lives or a singular life are different than expected
ii) Diversion from base life table risk which is relatively low in EFG International Group’s portfolio, as EFG International Group tracks individual lives
iii) The per single life risk which is the random variation from EFG International Group’s estimated likelihood of each insured life dying in each year. In the case of the latter, it is a material risk due to the small number of insured lives in the portfolio
(c) Expense risk Within demographic risk the second key risk in EFG International Group’s specific portfolio is related primarily to the potential change in premiums. These changes in premium
relate to increases payable to the life insurers based on their permissible premium increases under the discrete policy. EFG International Group is required to pay these higher premiums to keep the policy in force, in order to ensure receipt of the cash flow upon maturity.
9.2 Exposure
EFG International Group is exposed to longevity estimates in the valuation of the following assets and liabilities: i) Financial assets and liabilities
– Financial assets at fair value through profit and loss – Financial liabilities designated at fair value – Derivatives
ii) Loans and advances to customers iii) Other liabilities (a) Financial assets and liabilities EFG International Group holds life insurance related assets and liabilities issued by US life insurance companies valued at fair value and the valuations rely on assumptions (see note 31 for further details).
Upon the insured individual having deceased, the life insur-ance company pays a lump sum death benefit to EFG International Group. EFG International Group pays a periodic premium to the life insurance company to keep the policy valid.
The key risks of these life insurance related assets and liabilities are due to the uncertainty arising from: i) Longevity risk related to the number of periodic premium
payments that are payable by EFG International Group. EFG International Group has to continue paying periodic premiums whilst the insured individual is alive. The longer the insured individual lives, the greater the premium payments will be, usually with no change in the proceeds that will be received from the insurance company
ii) Expense risk relates to the risk that the insurance companies increase the periodic premiums. The insurance companies face longevity risk, and risk from having mispriced the cost of insurance. The insurance companies
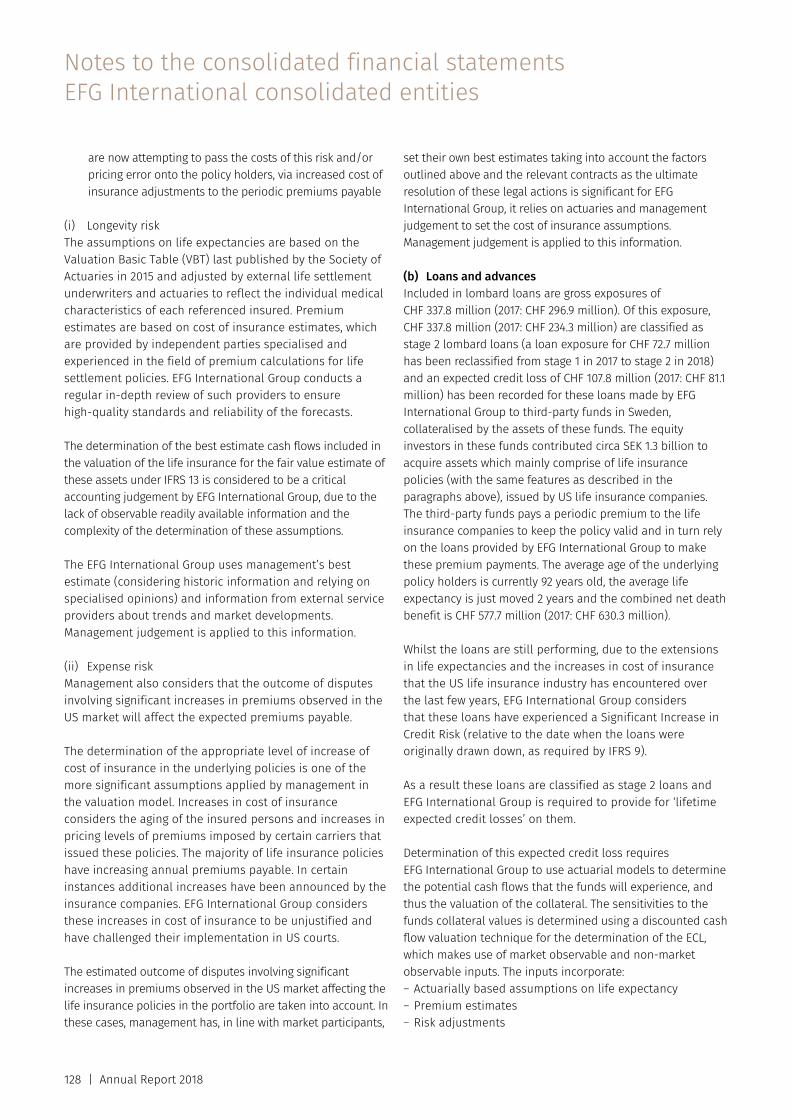
Notes to the consolidated financial statements EFG International consolidated entities
128 | Annual Report 2018
are now attempting to pass the costs of this risk and/or pricing error onto the policy holders, via increased cost of insurance adjustments to the periodic premiums payable
(i) Longevity risk The assumptions on life expectancies are based on the Valuation Basic Table (VBT) last published by the Society of Actuaries in 2015 and adjusted by external life settlement underwriters and actuaries to reflect the individual medical characteristics of each referenced insured. Premium estimates are based on cost of insurance estimates, which are provided by independent parties specialised and experienced in the field of premium calculations for life settlement policies. EFG International Group conducts a regular in-depth review of such providers to ensure high-quality standards and reliability of the forecasts.
The determination of the best estimate cash flows included in the valuation of the life insurance for the fair value estimate of these assets under IFRS 13 is considered to be a critical accounting judgement by EFG International Group, due to the lack of observable readily available information and the complexity of the determination of these assumptions.
The EFG International Group uses management’s best estimate (considering historic information and relying on specialised opinions) and information from external service providers about trends and market developments. Management judgement is applied to this information.
(ii) Expense risk Management also considers that the outcome of disputes involving significant increases in premiums observed in the US market will affect the expected premiums payable.
The determination of the appropriate level of increase of cost of insurance in the underlying policies is one of the more significant assumptions applied by management in the valuation model. Increases in cost of insurance considers the aging of the insured persons and increases in pricing levels of premiums imposed by certain carriers that issued these policies. The majority of life insurance policies have increasing annual premiums payable. In certain instances additional increases have been announced by the insurance companies. EFG International Group considers these increases in cost of insurance to be unjustified and have challenged their implementation in US courts.
The estimated outcome of disputes involving significant increases in premiums observed in the US market affecting the life insurance policies in the portfolio are taken into account. In these cases, management has, in line with market participants,
set their own best estimates taking into account the factors outlined above and the relevant contracts as the ultimate resolution of these legal actions is significant for EFG International Group, it relies on actuaries and management judgement to set the cost of insurance assumptions. Management judgement is applied to this information.
(b) Loans and advances Included in lombard loans are gross exposures of CHF 337.8 million (2017: CHF 296.9 million). Of this exposure, CHF 337.8 million (2017: CHF 234.3 million) are classified as stage 2 lombard loans (a loan exposure for CHF 72.7 million has been reclassified from stage 1 in 2017 to stage 2 in 2018) and an expected credit loss of CHF 107.8 million (2017: CHF 81.1 million) has been recorded for these loans made by EFG International Group to third-party funds in Sweden, collateralised by the assets of these funds. The equity investors in these funds contributed circa SEK 1.3 billion to acquire assets which mainly comprise of life insurance policies (with the same features as described in the paragraphs above), issued by US life insurance companies. The third-party funds pays a periodic premium to the life insurance companies to keep the policy valid and in turn rely on the loans provided by EFG International Group to make these premium payments. The average age of the underlying policy holders is currently 92 years old, the average life expectancy is just moved 2 years and the combined net death benefit is CHF 577.7 million (2017: CHF 630.3 million).
Whilst the loans are still performing, due to the extensions in life expectancies and the increases in cost of insurance that the US life insurance industry has encountered over the last few years, EFG International Group considers that these loans have experienced a Significant Increase in Credit Risk (relative to the date when the loans were originally drawn down, as required by IFRS 9).
As a result these loans are classified as stage 2 loans and EFG International Group is required to provide for ‘lifetime expected credit losses’ on them.
Determination of this expected credit loss requires EFG International Group to use actuarial models to determine the potential cash flows that the funds will experience, and thus the valuation of the collateral. The sensitivities to the funds collateral values is determined using a discounted cash flow valuation technique for the determination of the ECL, which makes use of market observable and non-market observable inputs. The inputs incorporate: – Actuarially based assumptions on life expectancy – Premium estimates – Risk adjustments
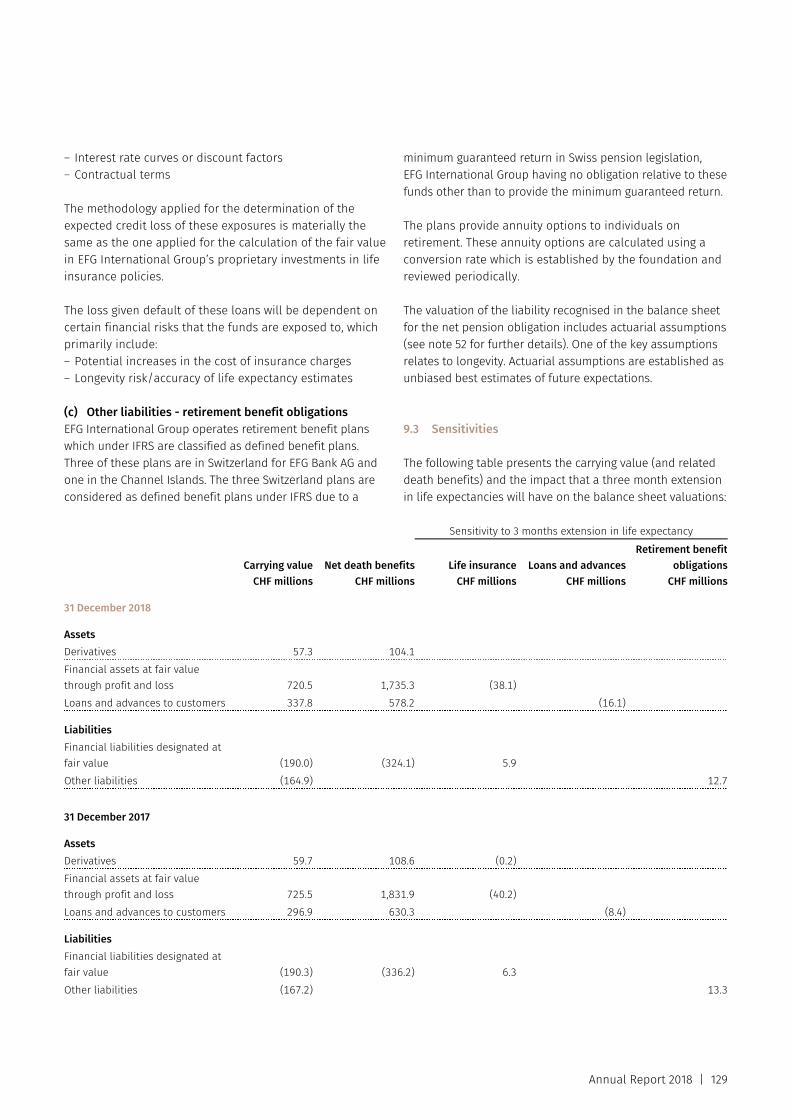
Annual Report 2018 | 129
– Interest rate curves or discount factors – Contractual terms
The methodology applied for the determination of the expected credit loss of these exposures is materially the same as the one applied for the calculation of the fair value in EFG International Group’s proprietary investments in life insurance policies.
The loss given default of these loans will be dependent on certain financial risks that the funds are exposed to, which primarily include: – Potential increases in the cost of insurance charges – Longevity risk/accuracy of life expectancy estimates
(c) Other liabilities - retirement benefit obligations EFG International Group operates retirement benefit plans which under IFRS are classified as defined benefit plans. Three of these plans are in Switzerland for EFG Bank AG and one in the Channel Islands. The three Switzerland plans are considered as defined benefit plans under IFRS due to a
minimum guaranteed return in Swiss pension legislation, EFG International Group having no obligation relative to these funds other than to provide the minimum guaranteed return.
The plans provide annuity options to individuals on retirement. These annuity options are calculated using a conversion rate which is established by the foundation and reviewed periodically.
The valuation of the liability recognised in the balance sheet for the net pension obligation includes actuarial assumptions (see note 52 for further details). One of the key assumptions relates to longevity. Actuarial assumptions are established as unbiased best estimates of future expectations.
9.3 Sensitivities
The following table presents the carrying value (and related death benefits) and the impact that a three month extension in life expectancies will have on the balance sheet valuations:
Sensitivity to 3 months extension in life expectancy
Carrying value
CHF millionsNet death benefits
CHF millionsLife insurance
CHF millionsLoans and advances
CHF millions
Retirement benefit obligations
CHF millions 31 December 2018 Assets Derivatives 57.3 104.1Financial assets at fair value through profit and loss 720.5 1,735.3 (38.1)Loans and advances to customers 337.8 578.2 (16.1) Liabilities Financial liabilities designated at fair value (190.0) (324.1) 5.9Other liabilities (164.9) 12.7 31 December 2017 Assets Derivatives 59.7 108.6 (0.2)Financial assets at fair value through profit and loss 725.5 1,831.9 (40.2)Loans and advances to customers 296.9 630.3 (8.4) Liabilities Financial liabilities designated at fair value (190.3) (336.2) 6.3Other liabilities (167.2) 13.3
Notes to the consolidated financial statements EFG International consolidated entities
130 | Annual Report 2018
10. Liquidity risk
Liquidity risks arise when financing activities are difficult or expensive as a result of liquidity crisis on the markets or reputational issues. They also arise when it is difficult to meet own commitments in a timely manner due to a lack of very liquid assets.
As defined in the risk appetite framework, the liquidity risk strategies are defined as follows: – EFG International Group holds sufficient liquid assets that
it could survive a sustained and severe run on its deposit base without any recourse to mitigating actions beyond liquidating those assets, and without breaching regulatory liquidity limits
– EFG International Group funds the balance sheet primarily from customer deposits, using capital markets opportunistically, without being subject to funding concentration due to a small number of funding sources or clients
EFG International Group manages liquidity risk in such a way as to ensure that ample liquidity is available to meet commitments to customers, both in demand for loans and repayments of deposits and to satisfy the EFG International Group’s own cash flow needs within all of its business entities.
EFG International Group has a liquidity risk management process in place that includes contingency funding plans, and stress tests that are undertaken to highlight EFG International Group’s liquidity profile in adverse conditions, analysing also intraday liquidity stress scenarios.
The liquidity excess is quite typical from the Group’s private banking activity.
As a result, liquidity risks are limited.
Financial assets are constantly monitored and a significant portion of safe and highly liquid assets is maintained. Cash and balances with central banks represent 18% of total assets, to which additional 9% derive from high-quality liquid securities.
At the end of 2018, the EFG International Group is well positioned with a liquidity coverage ratio of 163%.
10.1 Liquidity risk management process
EFG International Group’s liquidity risk management process is carried out by the Asset & Liability Management Committee and monitored by the Financial Risk Committee, in accordance with the principles and the risk appetite defined in the liquidity risk policy, which defines the organisational structure, responsibilities, limit systems and maximum acceptable risk set by the Board of Directors. The operative management is undertaken by Treasury. The liquidity risk management process includes: – Day-to-day funding, managed by monitoring future cash
flows to ensure that requirements can be met. This includes replenishment of funds as they mature or are borrowed by customers
– Maintaining a portfolio of highly marketable assets that can easily be liquidated as protection against any unforeseen interruption to cash flow
– Monitoring balance sheet liquidity ratios against internal and regulatory requirements
– Managing the concentration and profile of debt maturities – Monitoring unmatched medium-term assets and the
usage of overdraft facilities
EFG International Group aims to avoid concentrations of its funding facilities. It observes its current liquidity situation and determines the pricing of its assets and credit business through the liquidity transfer pricing model. The liquidity risk management process also includes EFG International Group contingency funding plans. The contingency measures include, among other actions, the activation of repo transactions with prime counterparties, the liquidation of marketable securities and/or draw downs on lines of credit (liquidity shortage financing) with the Swiss National Bank.
EFG International Group complies with all regulatory requirements.
10.2 Funding approach
Overall, EFG International Group, through its business units, enjoys a favourable funding base with stable and diversified customer deposits, which provide the vast majority of the EFG International Group’s total funding. The surplus of stable customer deposits over loans and other funding resources are placed by Treasury units in compliance with the local regulatory requirements and internal guidelines.
EFG International Group manages the liquidity and funding risks on an integrated basis. The liquidity positions of the
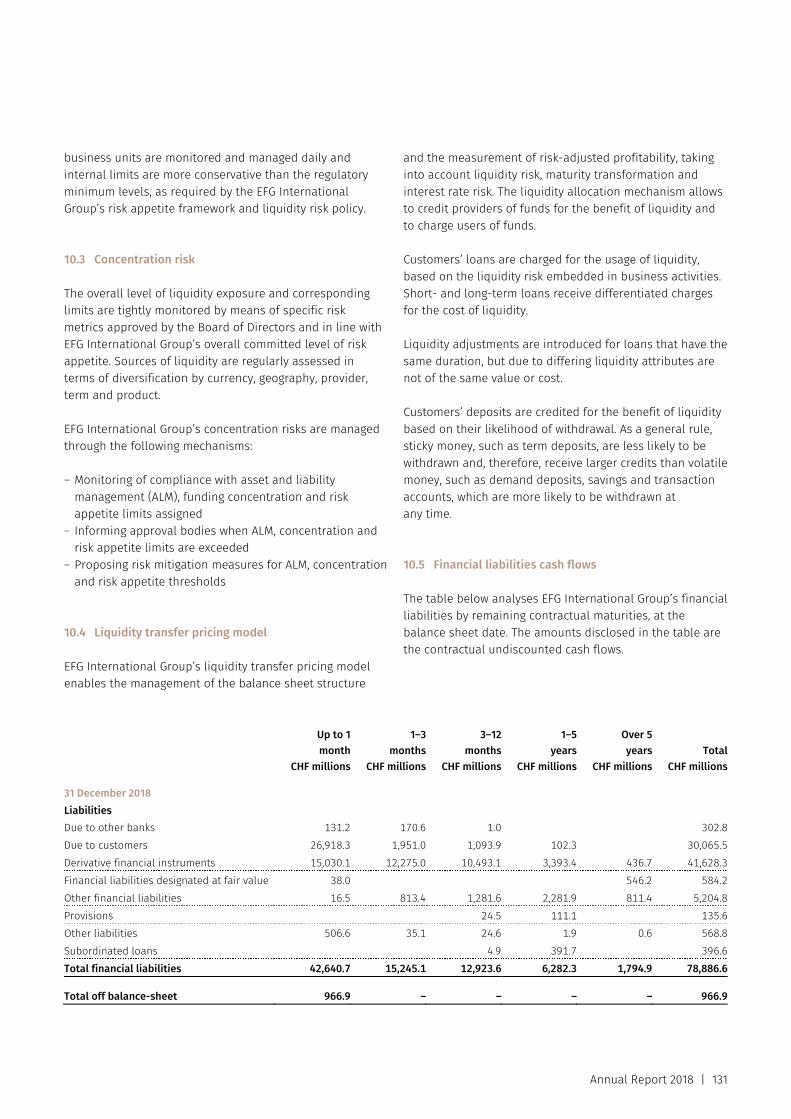
Annual Report 2018 | 131
business units are monitored and managed daily and internal limits are more conservative than the regulatory minimum levels, as required by the EFG International Group’s risk appetite framework and liquidity risk policy.
10.3 Concentration risk
The overall level of liquidity exposure and corresponding limits are tightly monitored by means of specific risk metrics approved by the Board of Directors and in line with EFG International Group’s overall committed level of risk appetite. Sources of liquidity are regularly assessed in terms of diversification by currency, geography, provider, term and product.
EFG International Group’s concentration risks are managed through the following mechanisms:
– Monitoring of compliance with asset and liability management (ALM), funding concentration and risk appetite limits assigned
– Informing approval bodies when ALM, concentration and risk appetite limits are exceeded
– Proposing risk mitigation measures for ALM, concentration and risk appetite thresholds
10.4 Liquidity transfer pricing model
EFG International Group’s liquidity transfer pricing model enables the management of the balance sheet structure
and the measurement of risk-adjusted profitability, taking into account liquidity risk, maturity transformation and interest rate risk. The liquidity allocation mechanism allows to credit providers of funds for the benefit of liquidity and to charge users of funds.
Customers’ loans are charged for the usage of liquidity, based on the liquidity risk embedded in business activities. Short- and long-term loans receive differentiated charges for the cost of liquidity.
Liquidity adjustments are introduced for loans that have the same duration, but due to differing liquidity attributes are not of the same value or cost.
Customers’ deposits are credited for the benefit of liquidity based on their likelihood of withdrawal. As a general rule, sticky money, such as term deposits, are less likely to be withdrawn and, therefore, receive larger credits than volatile money, such as demand deposits, savings and transaction accounts, which are more likely to be withdrawn at any time.
10.5 Financial liabilities cash flows
The table below analyses EFG International Group’s financial liabilities by remaining contractual maturities, at the balance sheet date. The amounts disclosed in the table are the contractual undiscounted cash flows.
Up to 1month
CHF millions
1–3months
CHF millions
3–12months
CHF millions
1–5years
CHF millions
Over 5years
CHF millionsTotal
CHF millions 31 December 2018 Liabilities Due to other banks 131.2 170.6 1.0 302.8Due to customers 26,918.3 1,951.0 1,093.9 102.3 30,065.5Derivative financial instruments 15,030.1 12,275.0 10,493.1 3,393.4 436.7 41,628.3Financial liabilities designated at fair value 38.0 546.2 584.2Other financial liabilities 16.5 813.4 1,281.6 2,281.9 811.4 5,204.8Provisions 24.5 111.1 135.6Other liabilities 506.6 35.1 24.6 1.9 0.6 568.8Subordinated loans 4.9 391.7 396.6Total financial liabilities 42,640.7 15,245.1 12,923.6 6,282.3 1,794.9 78,886.6 Total off balance-sheet 966.9 – – – – 966.9
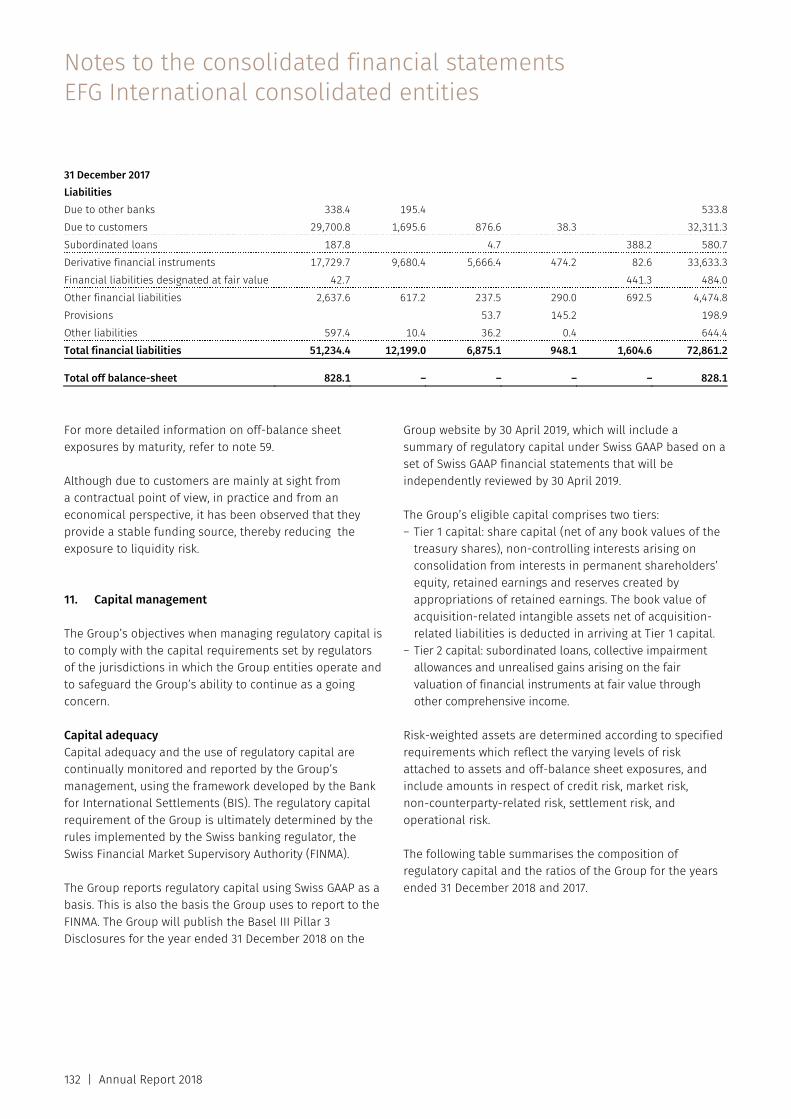
Notes to the consolidated financial statements EFG International consolidated entities
132 | Annual Report 2018
31 December 2017 Liabilities Due to other banks 338.4 195.4 533.8Due to customers 29,700.8 1,695.6 876.6 38.3 32,311.3Subordinated loans 187.8 4.7 388.2 580.7Derivative financial instruments 17,729.7 9,680.4 5,666.4 474.2 82.6 33,633.3Financial liabilities designated at fair value 42.7 441.3 484.0Other financial liabilities 2,637.6 617.2 237.5 290.0 692.5 4,474.8Provisions 53.7 145.2 198.9Other liabilities 597.4 10.4 36.2 0.4 644.4Total financial liabilities 51,234.4 12,199.0 6,875.1 948.1 1,604.6 72,861.2 Total off balance-sheet 828.1 – – – – 828.1 For more detailed information on off-balance sheet exposures by maturity, refer to note 59.
Although due to customers are mainly at sight from a contractual point of view, in practice and from an economical perspective, it has been observed that they provide a stable funding source, thereby reducing the exposure to liquidity risk.
11. Capital management
The Group’s objectives when managing regulatory capital is to comply with the capital requirements set by regulators of the jurisdictions in which the Group entities operate and to safeguard the Group’s ability to continue as a going concern.
Capital adequacy Capital adequacy and the use of regulatory capital are continually monitored and reported by the Group’s management, using the framework developed by the Bank for International Settlements (BIS). The regulatory capital requirement of the Group is ultimately determined by the rules implemented by the Swiss banking regulator, the Swiss Financial Market Supervisory Authority (FINMA).
The Group reports regulatory capital using Swiss GAAP as a basis. This is also the basis the Group uses to report to the FINMA. The Group will publish the Basel III Pillar 3 Disclosures for the year ended 31 December 2018 on the
Group website by 30 April 2019, which will include a summary of regulatory capital under Swiss GAAP based on a set of Swiss GAAP financial statements that will be independently reviewed by 30 April 2019.
The Group’s eligible capital comprises two tiers: – Tier 1 capital: share capital (net of any book values of the
treasury shares), non-controlling interests arising on consolidation from interests in permanent shareholders’ equity, retained earnings and reserves created by appropriations of retained earnings. The book value of acquisition-related intangible assets net of acquisition-related liabilities is deducted in arriving at Tier 1 capital.
– Tier 2 capital: subordinated loans, collective impairment allowances and unrealised gains arising on the fair valuation of financial instruments at fair value through other comprehensive income.
Risk-weighted assets are determined according to specified requirements which reflect the varying levels of risk attached to assets and off-balance sheet exposures, and include amounts in respect of credit risk, market risk, non-counterparty-related risk, settlement risk, and operational risk.
The following table summarises the composition of regulatory capital and the ratios of the Group for the years ended 31 December 2018 and 2017.
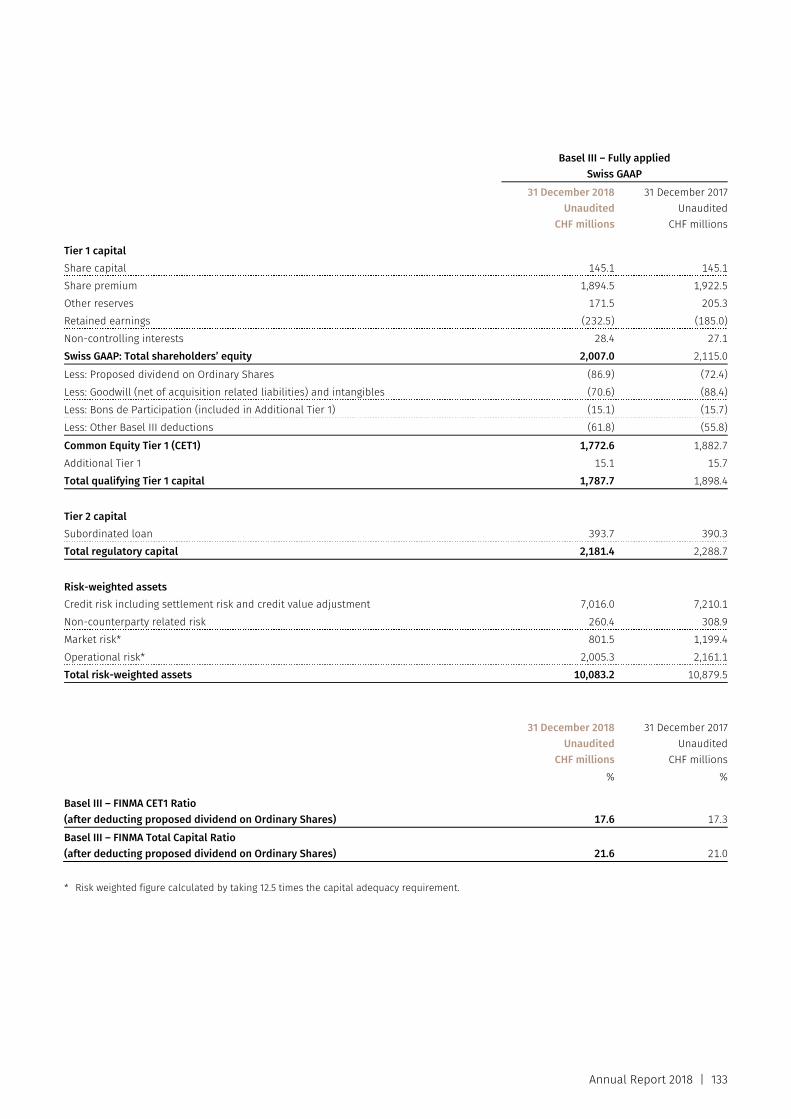
Annual Report 2018 | 133
Basel III – Fully applied
Swiss GAAP
31 December 2018Unaudited
CHF millions
31 December 2017Unaudited
CHF millions Tier 1 capital Share capital 145.1 145.1Share premium 1,894.5 1,922.5Other reserves 171.5 205.3Retained earnings (232.5) (185.0)Non-controlling interests 28.4 27.1Swiss GAAP: Total shareholders’ equity 2,007.0 2,115.0Less: Proposed dividend on Ordinary Shares (86.9) (72.4)Less: Goodwill (net of acquisition related liabilities) and intangibles (70.6) (88.4)Less: Bons de Participation (included in Additional Tier 1) (15.1) (15.7)Less: Other Basel III deductions (61.8) (55.8)Common Equity Tier 1 (CET1) 1,772.6 1,882.7Additional Tier 1 15.1 15.7Total qualifying Tier 1 capital 1,787.7 1,898.4 Tier 2 capital Subordinated loan 393.7 390.3Total regulatory capital 2,181.4 2,288.7 Risk-weighted assets Credit risk including settlement risk and credit value adjustment 7,016.0 7,210.1Non-counterparty related risk 260.4 308.9Market risk* 801.5 1,199.4Operational risk* 2,005.3 2,161.1Total risk-weighted assets 10,083.2 10,879.5
31 December 2018Unaudited
CHF millions
31 December 2017Unaudited
CHF millions % % Basel III – FINMA CET1 Ratio (after deducting proposed dividend on Ordinary Shares) 17.6 17.3Basel III – FINMA Total Capital Ratio (after deducting proposed dividend on Ordinary Shares) 21.6 21.0
* Risk weighted figure calculated by taking 12.5 times the capital adequacy requirement.
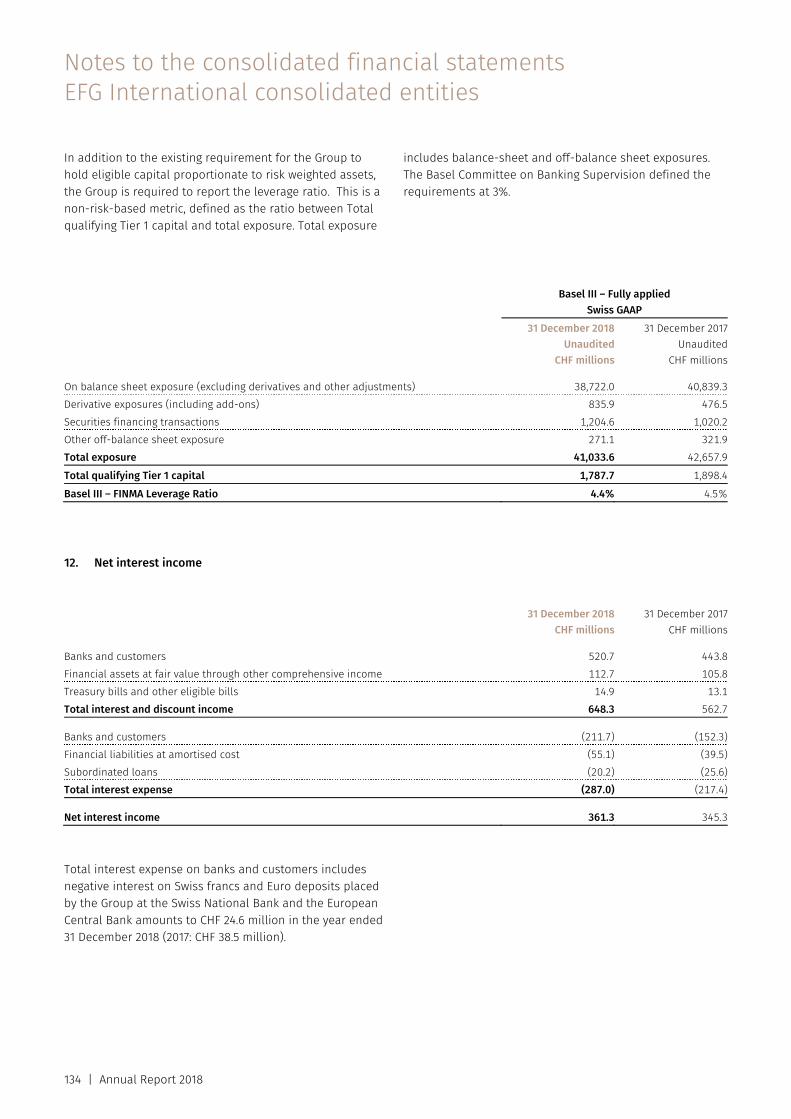
Notes to the consolidated financial statements EFG International consolidated entities
134 | Annual Report 2018
In addition to the existing requirement for the Group to hold eligible capital proportionate to risk weighted assets, the Group is required to report the leverage ratio. This is a non-risk-based metric, defined as the ratio between Total qualifying Tier 1 capital and total exposure. Total exposure
includes balance-sheet and off-balance sheet exposures. The Basel Committee on Banking Supervision defined the requirements at 3%.
Basel III – Fully applied
Swiss GAAP 31 December 2018
UnauditedCHF millions
31 December 2017Unaudited
CHF millions On balance sheet exposure (excluding derivatives and other adjustments) 38,722.0 40,839.3Derivative exposures (including add-ons) 835.9 476.5Securities financing transactions 1,204.6 1,020.2Other off-balance sheet exposure 271.1 321.9Total exposure 41,033.6 42,657.9Total qualifying Tier 1 capital 1,787.7 1,898.4Basel III – FINMA Leverage Ratio 4.4% 4.5%
12. Net interest income
31 December 2018
CHF millions31 December 2017
CHF millions Banks and customers 520.7 443.8Financial assets at fair value through other comprehensive income 112.7 105.8Treasury bills and other eligible bills 14.9 13.1Total interest and discount income 648.3 562.7 Banks and customers (211.7) (152.3)Financial liabilities at amortised cost (55.1) (39.5)Subordinated loans (20.2) (25.6)Total interest expense (287.0) (217.4) Net interest income 361.3 345.3
Total interest expense on banks and customers includes negative interest on Swiss francs and Euro deposits placed by the Group at the Swiss National Bank and the European Central Bank amounts to CHF 24.6 million in the year ended 31 December 2018 (2017: CHF 38.5 million).
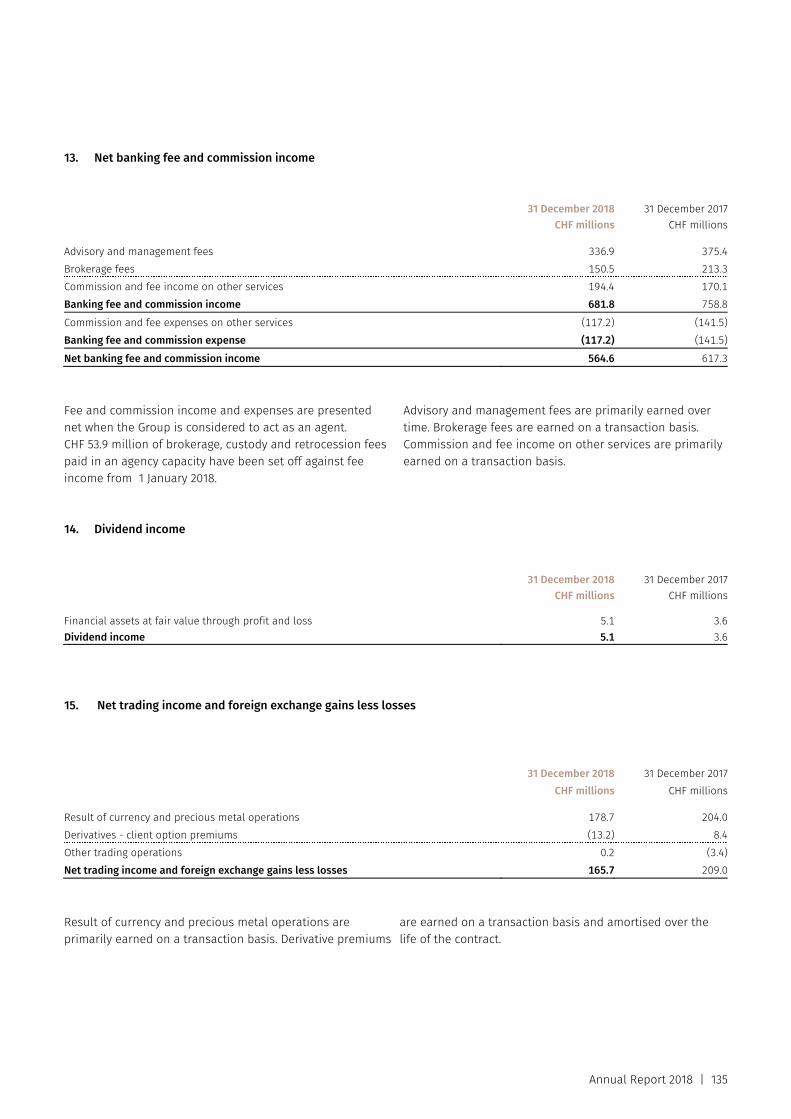
Annual Report 2018 | 135
13. Net banking fee and commission income
31 December 2018
CHF millions31 December 2017
CHF millions Advisory and management fees 336.9 375.4Brokerage fees 150.5 213.3Commission and fee income on other services 194.4 170.1Banking fee and commission income 681.8 758.8Commission and fee expenses on other services (117.2) (141.5)Banking fee and commission expense (117.2) (141.5)Net banking fee and commission income 564.6 617.3
Fee and commission income and expenses are presented net when the Group is considered to act as an agent. CHF 53.9 million of brokerage, custody and retrocession fees paid in an agency capacity have been set off against fee income from 1 January 2018.
Advisory and management fees are primarily earned over time. Brokerage fees are earned on a transaction basis. Commission and fee income on other services are primarily earned on a transaction basis.
14. Dividend income
31 December 2018
CHF millions31 December 2017
CHF millions Financial assets at fair value through profit and loss 5.1 3.6Dividend income 5.1 3.6
15. Net trading income and foreign exchange gains less losses
31 December 2018 31 December 2017 CHF millions CHF millions Result of currency and precious metal operations 178.7 204.0Derivatives - client option premiums (13.2) 8.4Other trading operations 0.2 (3.4)Net trading income and foreign exchange gains less losses 165.7 209.0
Result of currency and precious metal operations are primarily earned on a transaction basis. Derivative premiums
are earned on a transaction basis and amortised over the life of the contract.
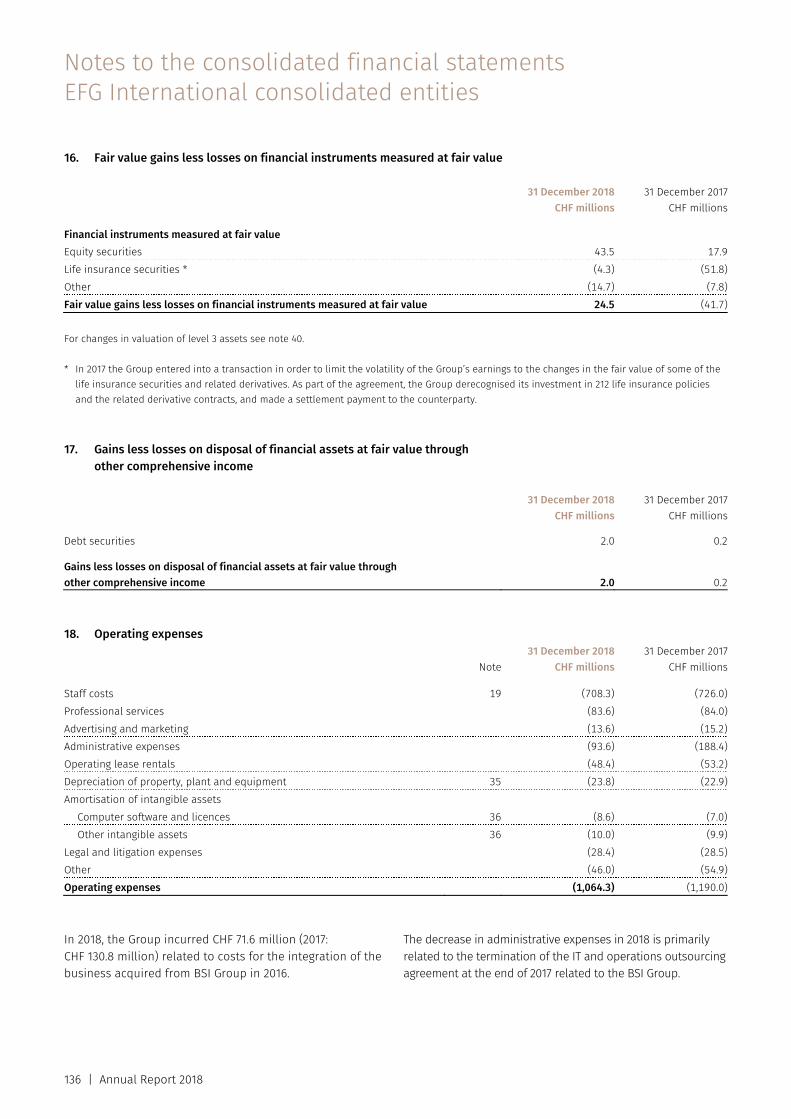
Notes to the consolidated financial statements EFG International consolidated entities
136 | Annual Report 2018
16. Fair value gains less losses on financial instruments measured at fair value
31 December 2018
CHF millions31 December 2017
CHF millions Financial instruments measured at fair value Equity securities 43.5 17.9Life insurance securities * (4.3) (51.8)Other (14.7) (7.8)Fair value gains less losses on financial instruments measured at fair value 24.5 (41.7)
For changes in valuation of level 3 assets see note 40. * In 2017 the Group entered into a transaction in order to limit the volatility of the Group’s earnings to the changes in the fair value of some of the
life insurance securities and related derivatives. As part of the agreement, the Group derecognised its investment in 212 life insurance policies and the related derivative contracts, and made a settlement payment to the counterparty.
17. Gains less losses on disposal of financial assets at fair value through other comprehensive income
31 December 2018
CHF millions31 December 2017
CHF millions Debt securities 2.0 0.2 Gains less losses on disposal of financial assets at fair value through other comprehensive income 2.0 0.2
18. Operating expenses
Note31 December 2018
CHF millions31 December 2017
CHF millions Staff costs 19 (708.3) (726.0)Professional services (83.6) (84.0)Advertising and marketing (13.6) (15.2)Administrative expenses (93.6) (188.4)Operating lease rentals (48.4) (53.2)Depreciation of property, plant and equipment 35 (23.8) (22.9)Amortisation of intangible assets
Computer software and licences 36 (8.6) (7.0)Other intangible assets 36 (10.0) (9.9)
Legal and litigation expenses (28.4) (28.5)Other (46.0) (54.9)Operating expenses (1,064.3) (1,190.0)
In 2018, the Group incurred CHF 71.6 million (2017: CHF 130.8 million) related to costs for the integration of the business acquired from BSI Group in 2016.
The decrease in administrative expenses in 2018 is primarily related to the termination of the IT and operations outsourcing agreement at the end of 2017 related to the BSI Group.
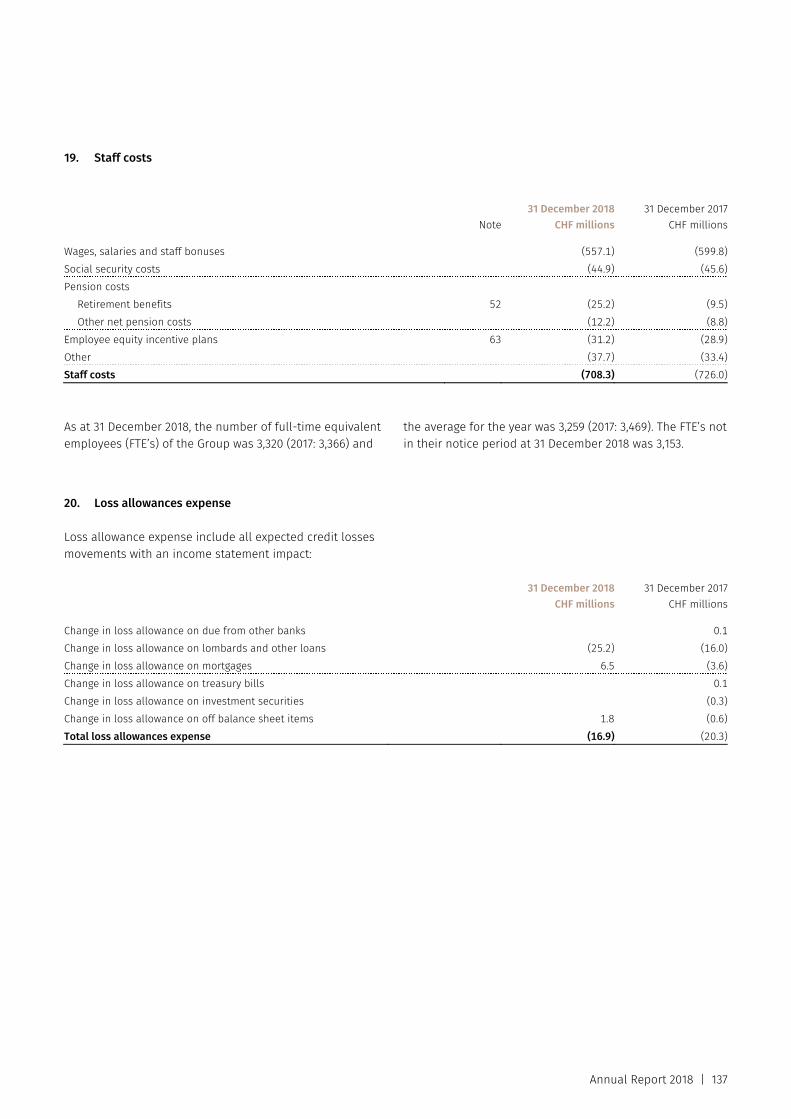
Annual Report 2018 | 137
19. Staff costs
Note31 December 2018
CHF millions31 December 2017
CHF millions Wages, salaries and staff bonuses (557.1) (599.8)Social security costs (44.9) (45.6)Pension costs
Retirement benefits 52 (25.2) (9.5)Other net pension costs (12.2) (8.8)
Employee equity incentive plans 63 (31.2) (28.9)Other (37.7) (33.4)Staff costs (708.3) (726.0)
As at 31 December 2018, the number of full-time equivalent employees (FTE’s) of the Group was 3,320 (2017: 3,366) and
the average for the year was 3,259 (2017: 3,469). The FTE’s not in their notice period at 31 December 2018 was 3,153.
20. Loss allowances expense
Loss allowance expense include all expected credit losses movements with an income statement impact:
31 December 2018
CHF millions31 December 2017
CHF millions Change in loss allowance on due from other banks 0.1Change in loss allowance on lombards and other loans (25.2) (16.0)Change in loss allowance on mortgages 6.5 (3.6)Change in loss allowance on treasury bills 0.1Change in loss allowance on investment securities (0.3)Change in loss allowance on off balance sheet items 1.8 (0.6)Total loss allowances expense (16.9) (20.3)
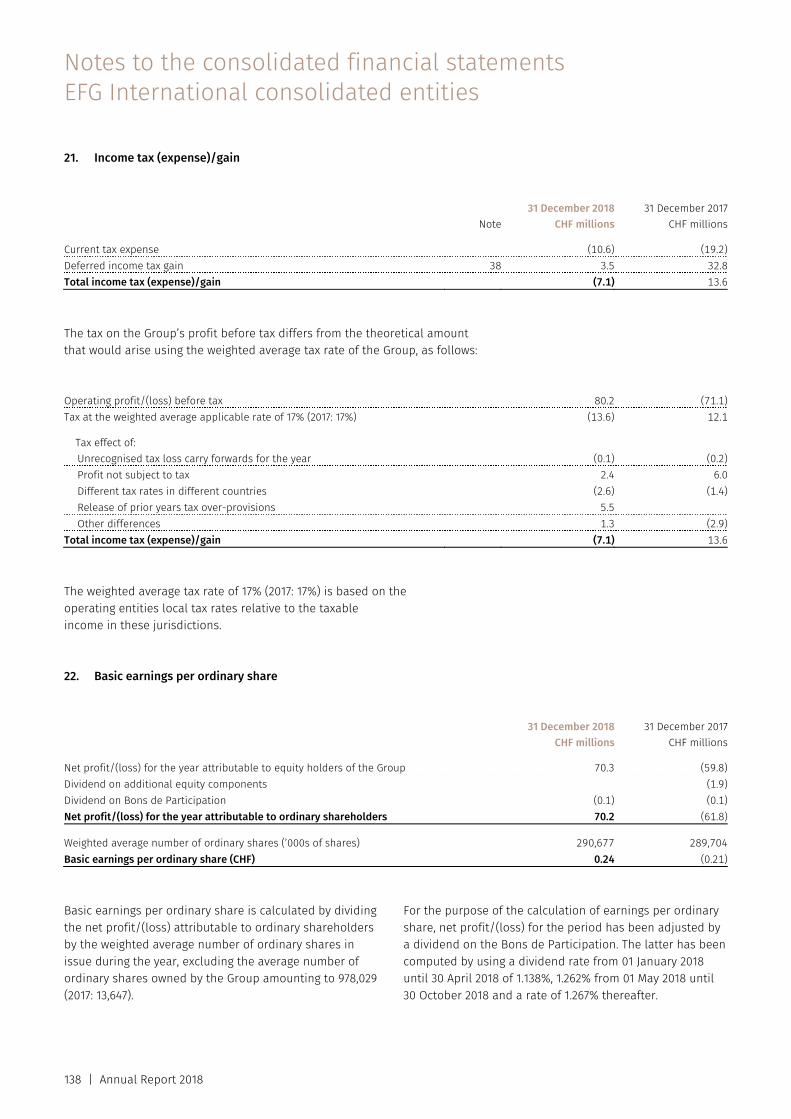
Notes to the consolidated financial statements EFG International consolidated entities
138 | Annual Report 2018
21. Income tax (expense)/gain
Note31 December 2018
CHF millions31 December 2017
CHF millions Current tax expense (10.6) (19.2)Deferred income tax gain 38 3.5 32.8Total income tax (expense)/gain (7.1) 13.6 The tax on the Group’s profit before tax differs from the theoretical amount that would arise using the weighted average tax rate of the Group, as follows: Operating profit/(loss) before tax 80.2 (71.1)Tax at the weighted average applicable rate of 17% (2017: 17%) (13.6) 12.1
Tax effect of: Unrecognised tax loss carry forwards for the year (0.1) (0.2)Profit not subject to tax 2.4 6.0Different tax rates in different countries (2.6) (1.4)Release of prior years tax over-provisions 5.5Other differences 1.3 (2.9)
Total income tax (expense)/gain (7.1) 13.6 The weighted average tax rate of 17% (2017: 17%) is based on the operating entities local tax rates relative to the taxable income in these jurisdictions.
22. Basic earnings per ordinary share
31 December 2018
CHF millions31 December 2017
CHF millions Net profit/(loss) for the year attributable to equity holders of the Group 70.3 (59.8)Dividend on additional equity components (1.9)Dividend on Bons de Participation (0.1) (0.1)Net profit/(loss) for the year attributable to ordinary shareholders 70.2 (61.8) Weighted average number of ordinary shares (’000s of shares) 290,677 289,704Basic earnings per ordinary share (CHF) 0.24 (0.21) Basic earnings per ordinary share is calculated by dividing the net profit/(loss) attributable to ordinary shareholders by the weighted average number of ordinary shares in issue during the year, excluding the average number of ordinary shares owned by the Group amounting to 978,029 (2017: 13,647).
For the purpose of the calculation of earnings per ordinary share, net profit/(loss) for the period has been adjusted by a dividend on the Bons de Participation. The latter has been computed by using a dividend rate from 01 January 2018 until 30 April 2018 of 1.138%, 1.262% from 01 May 2018 until 30 October 2018 and a rate of 1.267% thereafter.
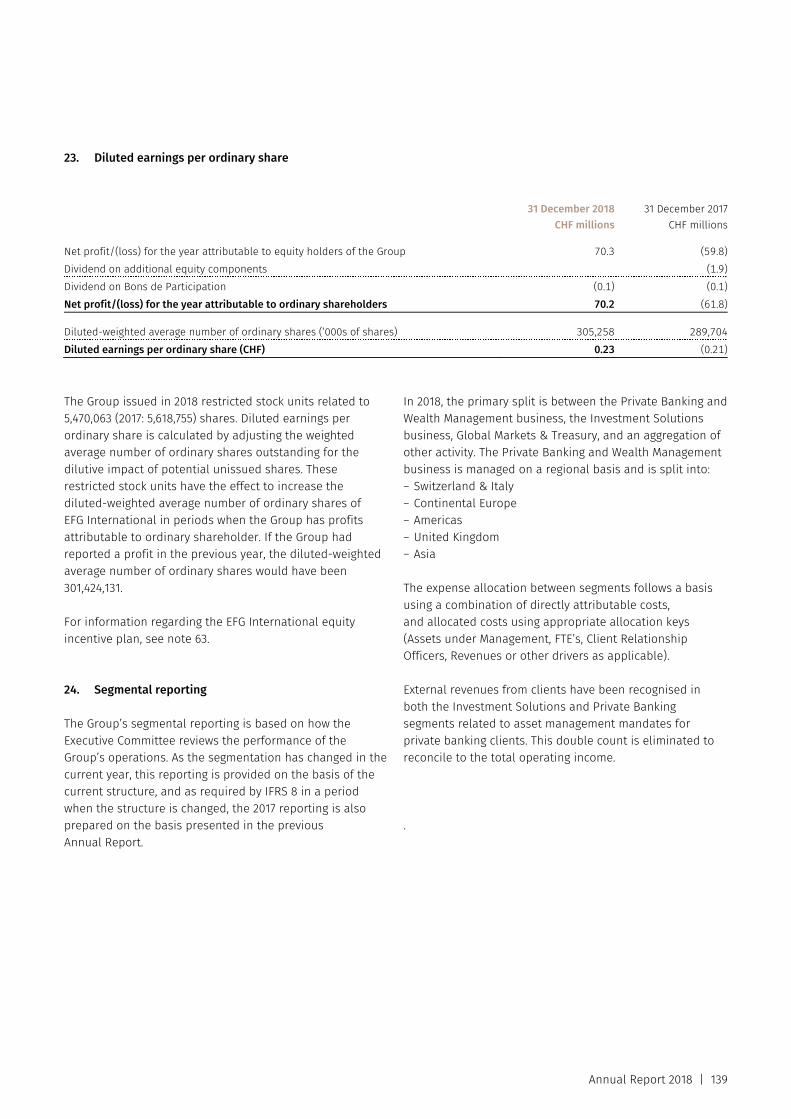
Annual Report 2018 | 139
23. Diluted earnings per ordinary share
31 December 2018
CHF millions31 December 2017
CHF millions Net profit/(loss) for the year attributable to equity holders of the Group 70.3 (59.8)Dividend on additional equity components (1.9)Dividend on Bons de Participation (0.1) (0.1)Net profit/(loss) for the year attributable to ordinary shareholders 70.2 (61.8) Diluted-weighted average number of ordinary shares (’000s of shares) 305,258 289,704Diluted earnings per ordinary share (CHF) 0.23 (0.21)
The Group issued in 2018 restricted stock units related to 5,470,063 (2017: 5,618,755) shares. Diluted earnings per ordinary share is calculated by adjusting the weighted average number of ordinary shares outstanding for the dilutive impact of potential unissued shares. These restricted stock units have the effect to increase the diluted-weighted average number of ordinary shares of EFG International in periods when the Group has profits attributable to ordinary shareholder. If the Group had reported a profit in the previous year, the diluted-weighted average number of ordinary shares would have been 301,424,131.
For information regarding the EFG International equity incentive plan, see note 63.
24. Segmental reporting
The Group’s segmental reporting is based on how the Executive Committee reviews the performance of the Group’s operations. As the segmentation has changed in the current year, this reporting is provided on the basis of the current structure, and as required by IFRS 8 in a period when the structure is changed, the 2017 reporting is also prepared on the basis presented in the previous Annual Report.
In 2018, the primary split is between the Private Banking and Wealth Management business, the Investment Solutions business, Global Markets & Treasury, and an aggregation of other activity. The Private Banking and Wealth Management business is managed on a regional basis and is split into: – Switzerland & Italy – Continental Europe – Americas – United Kingdom – Asia
The expense allocation between segments follows a basis using a combination of directly attributable costs, and allocated costs using appropriate allocation keys (Assets under Management, FTE’s, Client Relationship Officers, Revenues or other drivers as applicable).
External revenues from clients have been recognised in both the Investment Solutions and Private Banking segments related to asset management mandates for private banking clients. This double count is eliminated to reconcile to the total operating income.
.
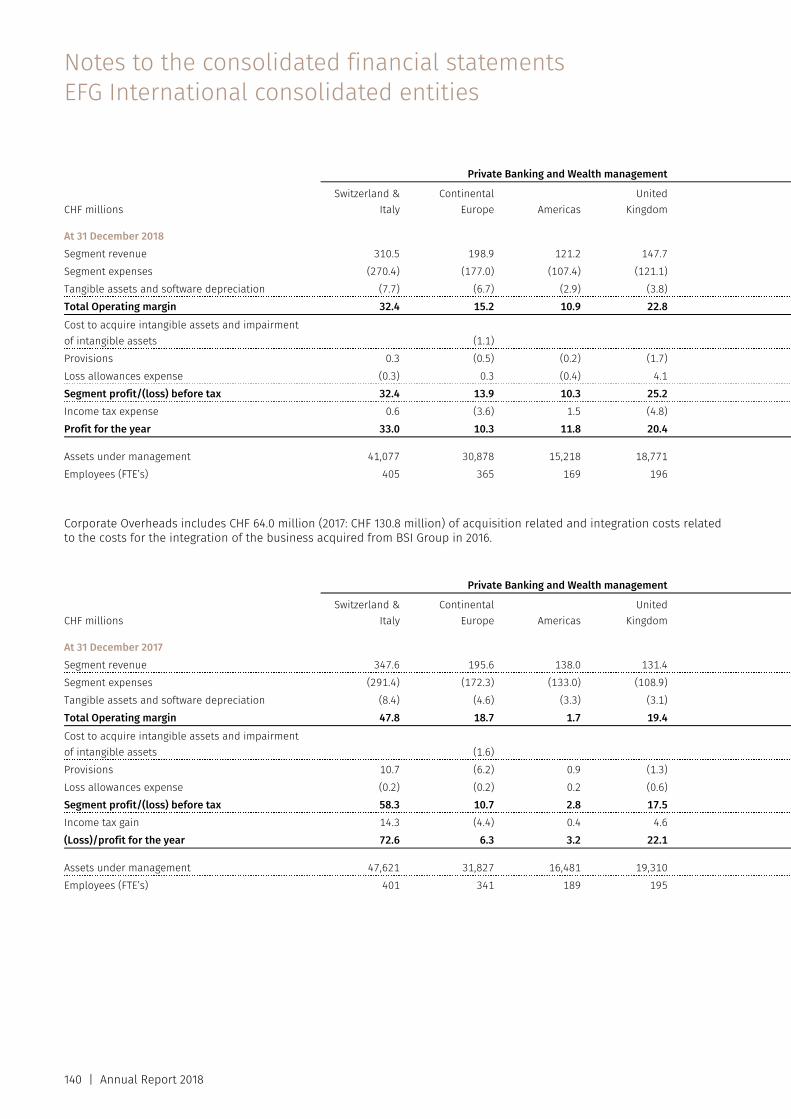
Notes to the consolidated financial statements EFG International consolidated entities
140 | Annual Report 2018
Private Banking and Wealth management
CHF millions Switzerland &
Italy Continental
Europe AmericasUnited
Kingdom At 31 December 2018 Segment revenue 310.5 198.9 121.2 147.7Segment expenses (270.4) (177.0) (107.4) (121.1)Tangible assets and software depreciation (7.7) (6.7) (2.9) (3.8)Total Operating margin 32.4 15.2 10.9 22.8Cost to acquire intangible assets and impairment of intangible assets (1.1)Provisions 0.3 (0.5) (0.2) (1.7)Loss allowances expense (0.3) 0.3 (0.4) 4.1Segment profit/(loss) before tax 32.4 13.9 10.3 25.2Income tax expense 0.6 (3.6) 1.5 (4.8)Profit for the year 33.0 10.3 11.8 20.4 Assets under management 41,077 30,878 15,218 18,771Employees (FTE’s) 405 365 169 196 Corporate Overheads includes CHF 64.0 million (2017: CHF 130.8 million) of acquisition related and integration costs related to the costs for the integration of the business acquired from BSI Group in 2016.
Private Banking and Wealth management
CHF millions Switzerland &
Italy Continental
Europe AmericasUnited
Kingdom At 31 December 2017 Segment revenue 347.6 195.6 138.0 131.4Segment expenses (291.4) (172.3) (133.0) (108.9)Tangible assets and software depreciation (8.4) (4.6) (3.3) (3.1)Total Operating margin 47.8 18.7 1.7 19.4Cost to acquire intangible assets and impairment of intangible assets (1.6)Provisions 10.7 (6.2) 0.9 (1.3)Loss allowances expense (0.2) (0.2) 0.2 (0.6)Segment profit/(loss) before tax 58.3 10.7 2.8 17.5Income tax gain 14.3 (4.4) 0.4 4.6(Loss)/profit for the year 72.6 6.3 3.2 22.1 Assets under management 47,621 31,827 16,481 19,310Employees (FTE’s) 401 341 189 195
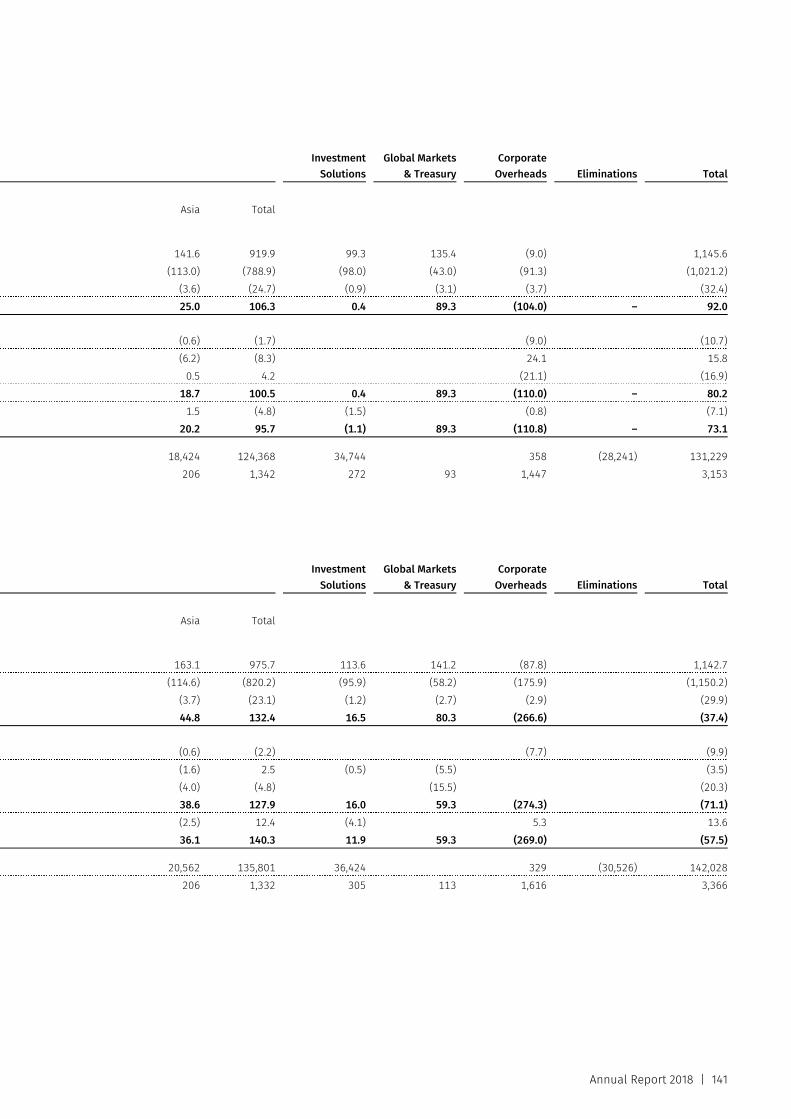
Annual Report 2018 | 141
Investment
SolutionsGlobal Markets
& TreasuryCorporate
Overheads Eliminations Total
Asia Total
141.6 919.9 99.3 135.4 (9.0) 1,145.6 (113.0) (788.9) (98.0) (43.0) (91.3) (1,021.2) (3.6) (24.7) (0.9) (3.1) (3.7) (32.4) 25.0 106.3 0.4 89.3 (104.0) – 92.0
(0.6) (1.7) (9.0) (10.7) (6.2) (8.3) 24.1 15.8 0.5 4.2 (21.1) (16.9) 18.7 100.5 0.4 89.3 (110.0) – 80.2 1.5 (4.8) (1.5) (0.8) (7.1) 20.2 95.7 (1.1) 89.3 (110.8) – 73.1
18,424 124,368 34,744 358 (28,241) 131,229 206 1,342 272 93 1,447 3,153
Investment
SolutionsGlobal Markets
& TreasuryCorporate
Overheads Eliminations Total
Asia Total
163.1 975.7 113.6 141.2 (87.8) 1,142.7 (114.6) (820.2) (95.9) (58.2) (175.9) (1,150.2) (3.7) (23.1) (1.2) (2.7) (2.9) (29.9) 44.8 132.4 16.5 80.3 (266.6) (37.4)
(0.6) (2.2) (7.7) (9.9) (1.6) 2.5 (0.5) (5.5) (3.5) (4.0) (4.8) (15.5) (20.3) 38.6 127.9 16.0 59.3 (274.3) (71.1) (2.5) 12.4 (4.1) 5.3 13.6 36.1 140.3 11.9 59.3 (269.0) (57.5)
20,562 135,801 36,424 329 (30,526) 142,028 206 1,332 305 113 1,616 3,366
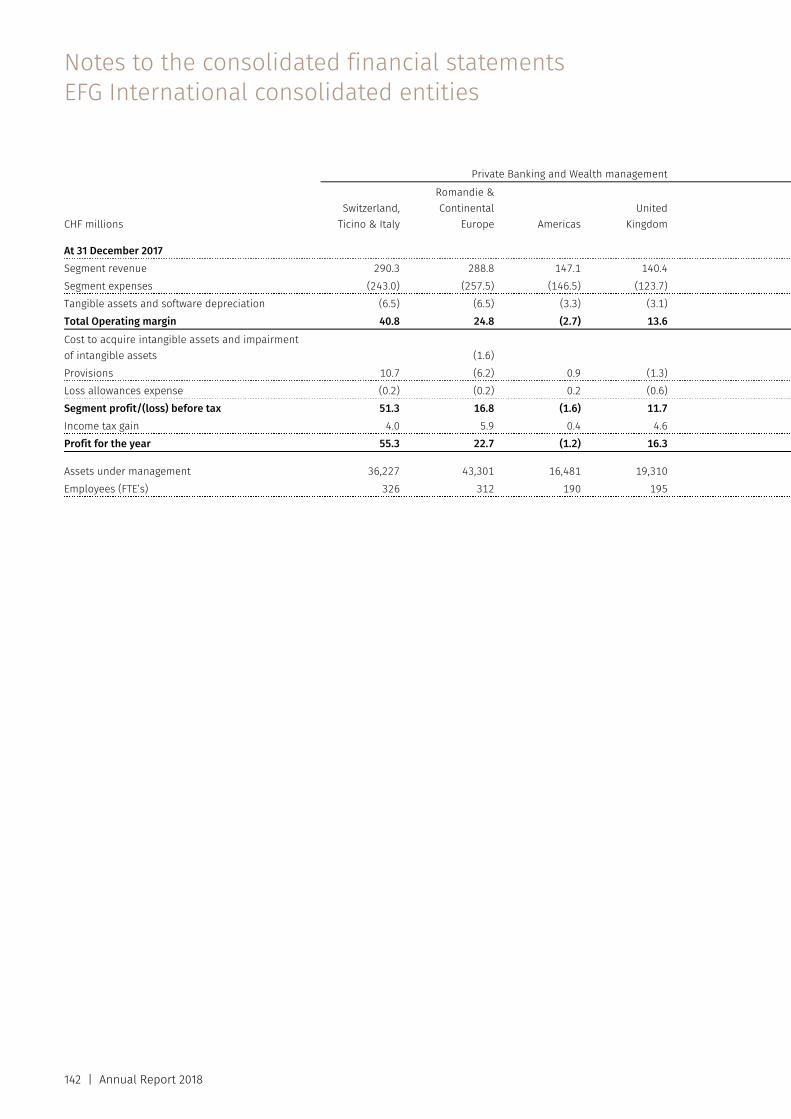
Notes to the consolidated financial statements EFG International consolidated entities
142 | Annual Report 2018
Private Banking and Wealth management
CHF millions Switzerland,
Ticino & Italy
Romandie &Continental
Europe AmericasUnited
Kingdom At 31 December 2017 Segment revenue 290.3 288.8 147.1 140.4Segment expenses (243.0) (257.5) (146.5) (123.7)Tangible assets and software depreciation (6.5) (6.5) (3.3) (3.1)Total Operating margin 40.8 24.8 (2.7) 13.6Cost to acquire intangible assets and impairment of intangible assets (1.6)Provisions 10.7 (6.2) 0.9 (1.3)Loss allowances expense (0.2) (0.2) 0.2 (0.6)Segment profit/(loss) before tax 51.3 16.8 (1.6) 11.7Income tax gain 4.0 5.9 0.4 4.6Profit for the year 55.3 22.7 (1.2) 16.3 Assets under management 36,227 43,301 16,481 19,310Employees (FTE’s) 326 312 190 195
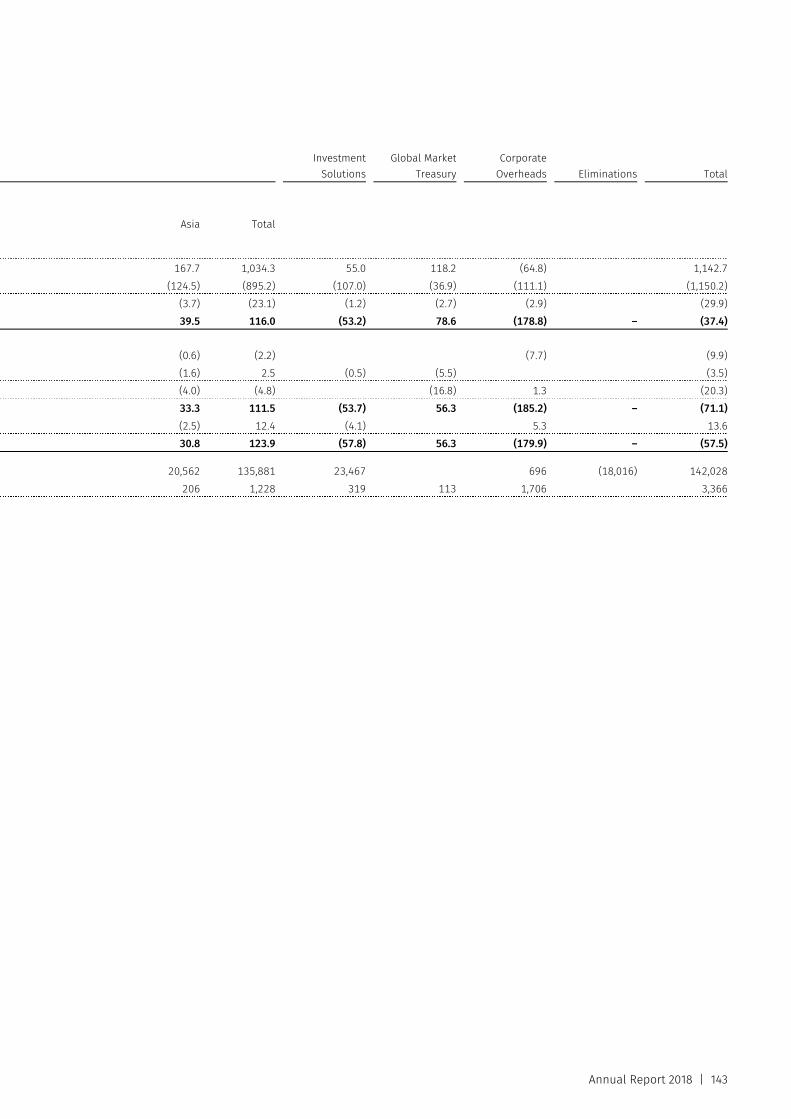
Annual Report 2018 | 143
Investment
SolutionsGlobal Market
TreasuryCorporate
Overheads Eliminations Total
Asia Total
167.7 1,034.3 55.0 118.2 (64.8) 1,142.7 (124.5) (895.2) (107.0) (36.9) (111.1) (1,150.2) (3.7) (23.1) (1.2) (2.7) (2.9) (29.9) 39.5 116.0 (53.2) 78.6 (178.8) – (37.4)
(0.6) (2.2) (7.7) (9.9) (1.6) 2.5 (0.5) (5.5) (3.5) (4.0) (4.8) (16.8) 1.3 (20.3) 33.3 111.5 (53.7) 56.3 (185.2) – (71.1) (2.5) 12.4 (4.1) 5.3 13.6 30.8 123.9 (57.8) 56.3 (179.9) – (57.5)
20,562 135,881 23,467 696 (18,016) 142,028 206 1,228 319 113 1,706 3,366
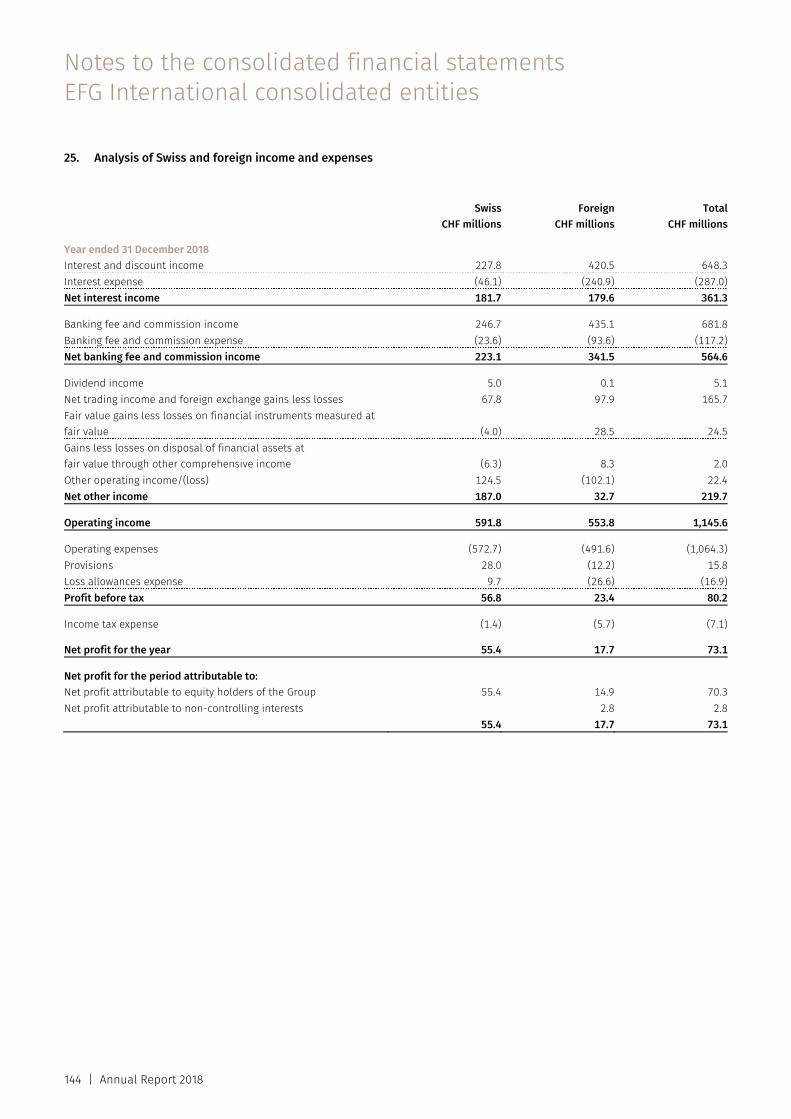
Notes to the consolidated financial statements EFG International consolidated entities
144 | Annual Report 2018
25. Analysis of Swiss and foreign income and expenses
Swiss
CHF millionsForeign
CHF millionsTotal
CHF millions Year ended 31 December 2018 Interest and discount income 227.8 420.5 648.3Interest expense (46.1) (240.9) (287.0)Net interest income 181.7 179.6 361.3 Banking fee and commission income 246.7 435.1 681.8Banking fee and commission expense (23.6) (93.6) (117.2)Net banking fee and commission income 223.1 341.5 564.6 Dividend income 5.0 0.1 5.1Net trading income and foreign exchange gains less losses 67.8 97.9 165.7Fair value gains less losses on financial instruments measured at fair value (4.0) 28.5 24.5Gains less losses on disposal of financial assets at fair value through other comprehensive income (6.3) 8.3 2.0Other operating income/(loss) 124.5 (102.1) 22.4Net other income 187.0 32.7 219.7 Operating income 591.8 553.8 1,145.6 Operating expenses (572.7) (491.6) (1,064.3)Provisions 28.0 (12.2) 15.8Loss allowances expense 9.7 (26.6) (16.9)Profit before tax 56.8 23.4 80.2 Income tax expense (1.4) (5.7) (7.1) Net profit for the year 55.4 17.7 73.1 Net profit for the period attributable to: Net profit attributable to equity holders of the Group 55.4 14.9 70.3Net profit attributable to non-controlling interests 2.8 2.8 55.4 17.7 73.1
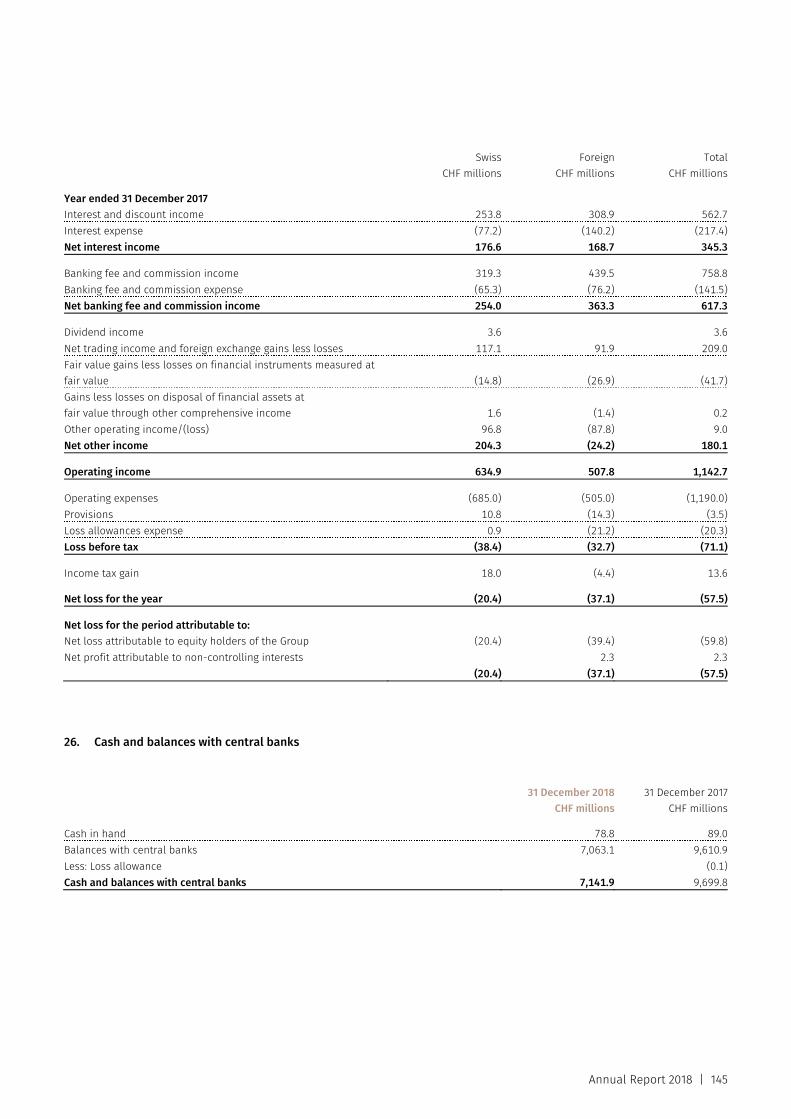
Annual Report 2018 | 145
SwissCHF millions
ForeignCHF millions
TotalCHF millions
Year ended 31 December 2017 Interest and discount income 253.8 308.9 562.7Interest expense (77.2) (140.2) (217.4)Net interest income 176.6 168.7 345.3 Banking fee and commission income 319.3 439.5 758.8Banking fee and commission expense (65.3) (76.2) (141.5)Net banking fee and commission income 254.0 363.3 617.3 Dividend income 3.6 3.6Net trading income and foreign exchange gains less losses 117.1 91.9 209.0Fair value gains less losses on financial instruments measured at fair value (14.8) (26.9) (41.7)Gains less losses on disposal of financial assets at fair value through other comprehensive income 1.6 (1.4) 0.2Other operating income/(loss) 96.8 (87.8) 9.0Net other income 204.3 (24.2) 180.1 Operating income 634.9 507.8 1,142.7 Operating expenses (685.0) (505.0) (1,190.0)Provisions 10.8 (14.3) (3.5)Loss allowances expense 0.9 (21.2) (20.3)Loss before tax (38.4) (32.7) (71.1) Income tax gain 18.0 (4.4) 13.6 Net loss for the year (20.4) (37.1) (57.5) Net loss for the period attributable to: Net loss attributable to equity holders of the Group (20.4) (39.4) (59.8)Net profit attributable to non-controlling interests 2.3 2.3 (20.4) (37.1) (57.5)
26. Cash and balances with central banks
31 December 2018
CHF millions31 December 2017
CHF millions Cash in hand 78.8 89.0Balances with central banks 7,063.1 9,610.9Less: Loss allowance (0.1)Cash and balances with central banks 7,141.9 9,699.8
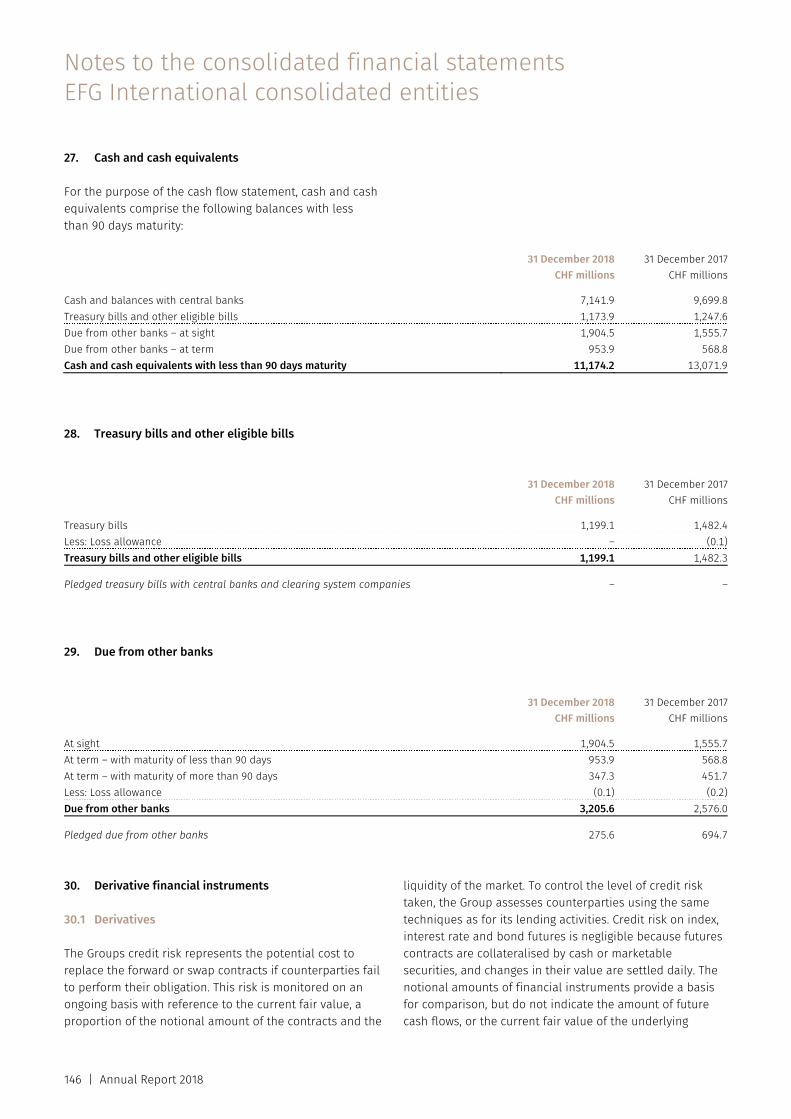
Notes to the consolidated financial statements EFG International consolidated entities
146 | Annual Report 2018
27. Cash and cash equivalents
For the purpose of the cash flow statement, cash and cash equivalents comprise the following balances with less than 90 days maturity:
31 December 2018 CHF millions
31 December 2017CHF millions
Cash and balances with central banks 7,141.9 9,699.8Treasury bills and other eligible bills 1,173.9 1,247.6Due from other banks – at sight 1,904.5 1,555.7Due from other banks – at term 953.9 568.8Cash and cash equivalents with less than 90 days maturity 11,174.2 13,071.9
28. Treasury bills and other eligible bills
31 December 2018
CHF millions31 December 2017
CHF millions Treasury bills 1,199.1 1,482.4Less: Loss allowance – (0.1)Treasury bills and other eligible bills 1,199.1 1,482.3 Pledged treasury bills with central banks and clearing system companies – –
29. Due from other banks
31 December 2018
CHF millions31 December 2017
CHF millions At sight 1,904.5 1,555.7At term – with maturity of less than 90 days 953.9 568.8At term – with maturity of more than 90 days 347.3 451.7Less: Loss allowance (0.1) (0.2)Due from other banks 3,205.6 2,576.0 Pledged due from other banks 275.6 694.7 30. Derivative financial instruments
30.1 Derivatives
The Groups credit risk represents the potential cost to replace the forward or swap contracts if counterparties fail to perform their obligation. This risk is monitored on an ongoing basis with reference to the current fair value, a proportion of the notional amount of the contracts and the
liquidity of the market. To control the level of credit risk taken, the Group assesses counterparties using the same techniques as for its lending activities. Credit risk on index, interest rate and bond futures is negligible because futures contracts are collateralised by cash or marketable securities, and changes in their value are settled daily. The notional amounts of financial instruments provide a basis for comparison, but do not indicate the amount of future cash flows, or the current fair value of the underlying
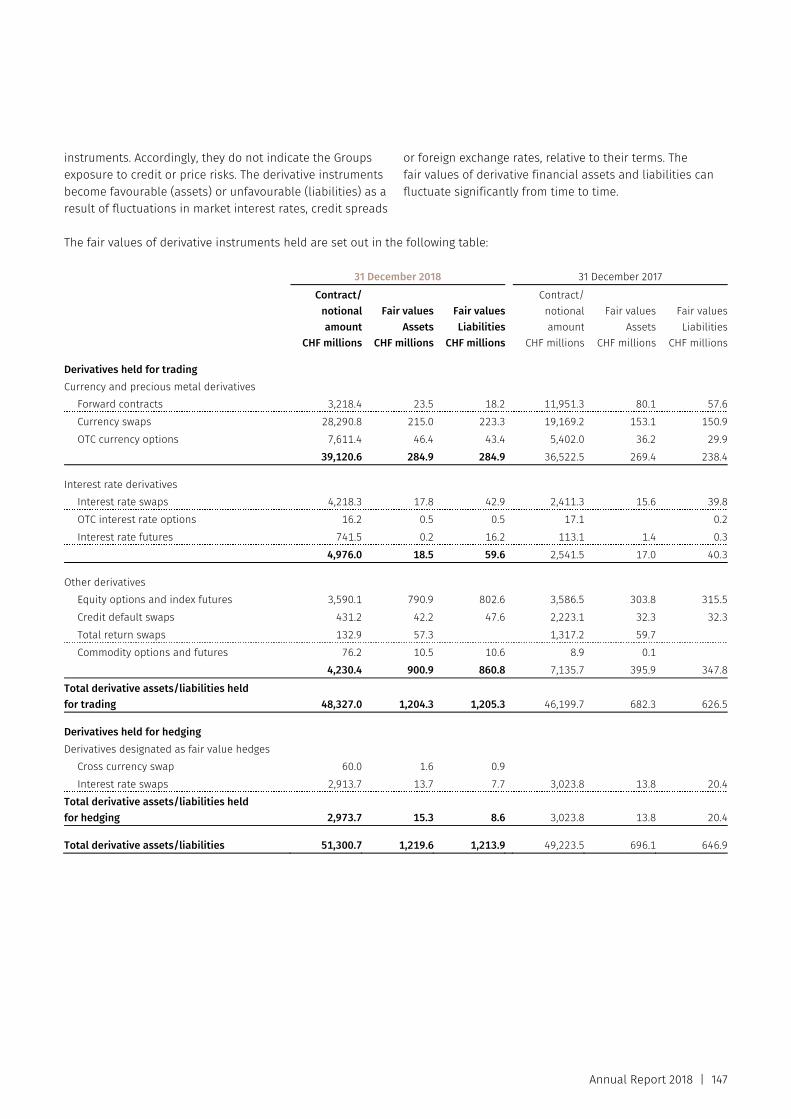
Annual Report 2018 | 147
instruments. Accordingly, they do not indicate the Groups exposure to credit or price risks. The derivative instruments become favourable (assets) or unfavourable (liabilities) as a result of fluctuations in market interest rates, credit spreads
or foreign exchange rates, relative to their terms. The fair values of derivative financial assets and liabilities can fluctuate significantly from time to time.
The fair values of derivative instruments held are set out in the following table: 31 December 2018 31 December 2017
Contract/notionalamount
CHF millions
Fair valuesAssets
CHF millions
Fair valuesLiabilities
CHF millions
Contract/notionalamount
CHF millions
Fair valuesAssets
CHF millions
Fair valuesLiabilities
CHF millions Derivatives held for trading Currency and precious metal derivatives
Forward contracts 3,218.4 23.5 18.2 11,951.3 80.1 57.6Currency swaps 28,290.8 215.0 223.3 19,169.2 153.1 150.9OTC currency options 7,611.4 46.4 43.4 5,402.0 36.2 29.9
39,120.6 284.9 284.9 36,522.5 269.4 238.4 Interest rate derivatives
Interest rate swaps 4,218.3 17.8 42.9 2,411.3 15.6 39.8OTC interest rate options 16.2 0.5 0.5 17.1 0.2Interest rate futures 741.5 0.2 16.2 113.1 1.4 0.3
4,976.0 18.5 59.6 2,541.5 17.0 40.3 Other derivatives
Equity options and index futures 3,590.1 790.9 802.6 3,586.5 303.8 315.5Credit default swaps 431.2 42.2 47.6 2,223.1 32.3 32.3Total return swaps 132.9 57.3 1,317.2 59.7Commodity options and futures 76.2 10.5 10.6 8.9 0.1
4,230.4 900.9 860.8 7,135.7 395.9 347.8
Total derivative assets/liabilities held for trading 48,327.0 1,204.3 1,205.3 46,199.7 682.3 626.5 Derivatives held for hedging Derivatives designated as fair value hedges
Cross currency swap 60.0 1.6 0.9 Interest rate swaps 2,913.7 13.7 7.7 3,023.8 13.8 20.4
Total derivative assets/liabilities held for hedging 2,973.7 15.3 8.6 3,023.8 13.8 20.4 Total derivative assets/liabilities 51,300.7 1,219.6 1,213.9 49,223.5 696.1 646.9

Notes to the consolidated financial statements EFG International consolidated entities
148 | Annual Report 2018
30.2 Hedge accounting
The hedging practices and accounting treatment are disclosed in note 2 (d).
Hedge effectiveness The Group applies hedge accounting under IFRS 9 to interest rate risk on fixed rate bonds (fair value hedge). The Group holds a portfolio of long dated fixed rate bonds and therefore is exposed to changes in fair value due to movements in market interest rates. The Group manages the risk exposure by entering into cross currency swaps and interest rate swaps that pay fixed rates matching the coupons of the bonds and receive floating interest rates.
Only the interest rate element is hedged and therefore other risks, such as credit risk, are managed but not hedged by the Group. The interest rate risk component is
determined as the change in fair value of the long-term fixed rate bond arising solely from changes of the interest rate environment. Such changes are usually the largest component of the overall changes in fair value.
This strategy is designated as a fair value hedge and its effectiveness is assessed by comparing changes in the fair value of the bonds attributable to changes in the benchmark rate of interest with changes in the fair value of the interest rate swaps.
The Group enters into these transactions on a ‘package basis’, i.e. enters into the swap at the same time as purchasing the bond, and structures the swap so that the principal terms of the swap exactly match those of the bond. As a result the hedging ratio is 100% and there is no ineffectiveness
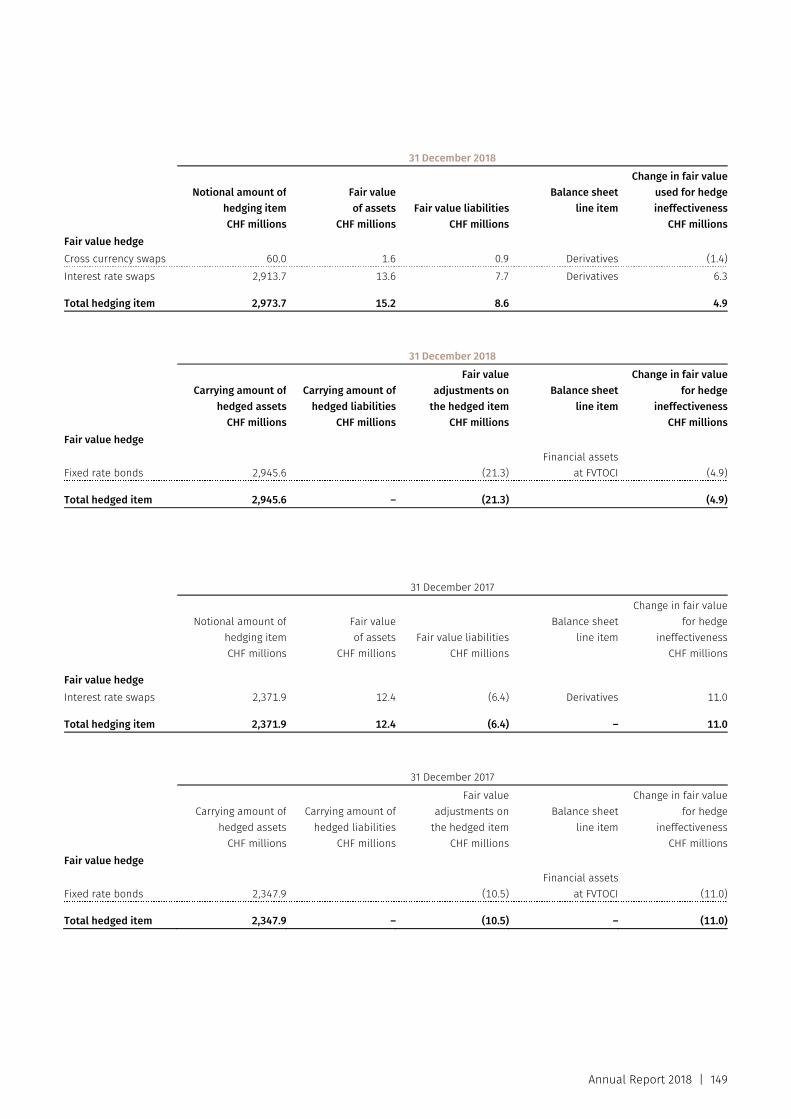
Annual Report 2018 | 149
31 December 2018
Notional amount of hedging itemCHF millions
Fair valueof assets
CHF millionsFair value liabilities
CHF millions
Balance sheetline item
Change in fair value used for hedge ineffectiveness
CHF millions
Fair value hedge Cross currency swaps 60.0 1.6 0.9 Derivatives (1.4)Interest rate swaps 2,913.7 13.6 7.7 Derivatives 6.3 Total hedging item 2,973.7 15.2 8.6 4.9 31 December 2018
Carrying amount ofhedged assets
CHF millions
Carrying amount ofhedged liabilities
CHF millions
Fair valueadjustments on
the hedged itemCHF millions
Balance sheetline item
Change in fair value for hedge
ineffectivenessCHF millions
Fair value hedge
Fixed rate bonds 2,945.6 (21.3)Financial assets
at FVTOCI (4.9) Total hedged item 2,945.6 – (21.3) (4.9)
31 December 2017
Notional amount ofhedging itemCHF millions
Fair valueof assets
CHF millionsFair value liabilities
CHF millions
Balance sheetline item
Change in fair value for hedge
ineffectivenessCHF millions
Fair value hedge Interest rate swaps 2,371.9 12.4 (6.4) Derivatives 11.0 Total hedging item 2,371.9 12.4 (6.4) – 11.0 31 December 2017
Carrying amount ofhedged assets
CHF millions
Carrying amount ofhedged liabilities
CHF millions
Fair valueadjustments on
the hedged itemCHF millions
Balance sheetline item
Change in fair value for hedge
ineffectivenessCHF millions
Fair value hedge
Fixed rate bonds 2,347.9 (10.5)Financial assets
at FVTOCI (11.0) Total hedged item 2,347.9 – (10.5) – (11.0)
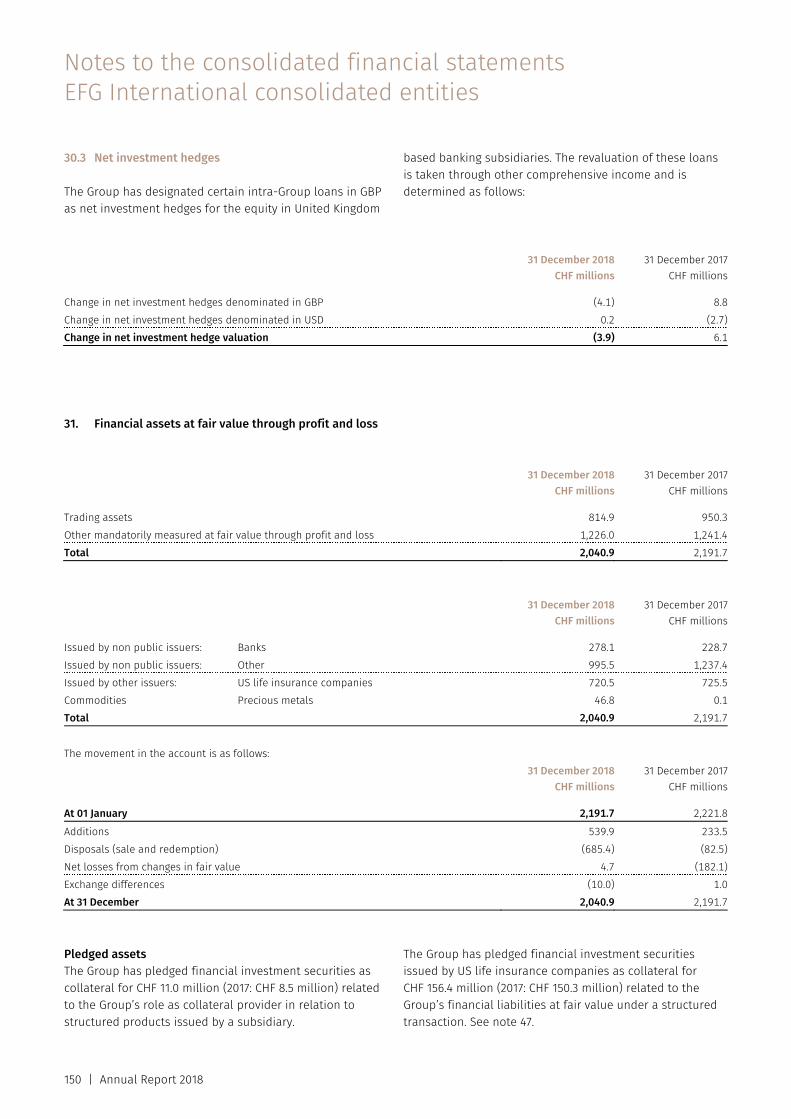
Notes to the consolidated financial statements EFG International consolidated entities
150 | Annual Report 2018
30.3 Net investment hedges
The Group has designated certain intra-Group loans in GBP as net investment hedges for the equity in United Kingdom
based banking subsidiaries. The revaluation of these loans is taken through other comprehensive income and is determined as follows:
31 December 2018
CHF millions31 December 2017
CHF millions Change in net investment hedges denominated in GBP (4.1) 8.8Change in net investment hedges denominated in USD 0.2 (2.7)Change in net investment hedge valuation (3.9) 6.1
31. Financial assets at fair value through profit and loss
31 December 2018
CHF millions31 December 2017
CHF millions Trading assets 814.9 950.3Other mandatorily measured at fair value through profit and loss 1,226.0 1,241.4Total 2,040.9 2,191.7
31 December 2018
CHF millions31 December 2017
CHF millions Issued by non public issuers: Banks 278.1 228.7Issued by non public issuers: Other 995.5 1,237.4Issued by other issuers: US life insurance companies 720.5 725.5Commodities Precious metals 46.8 0.1Total 2,040.9 2,191.7
The movement in the account is as follows:
31 December 2018
CHF millions31 December 2017
CHF millions At 01 January 2,191.7 2,221.8Additions 539.9 233.5Disposals (sale and redemption) (685.4) (82.5)Net losses from changes in fair value 4.7 (182.1)Exchange differences (10.0) 1.0At 31 December 2,040.9 2,191.7
Pledged assets The Group has pledged financial investment securities as collateral for CHF 11.0 million (2017: CHF 8.5 million) related to the Group’s role as collateral provider in relation to structured products issued by a subsidiary.
The Group has pledged financial investment securities issued by US life insurance companies as collateral for CHF 156.4 million (2017: CHF 150.3 million) related to the Group’s financial liabilities at fair value under a structured transaction. See note 47.
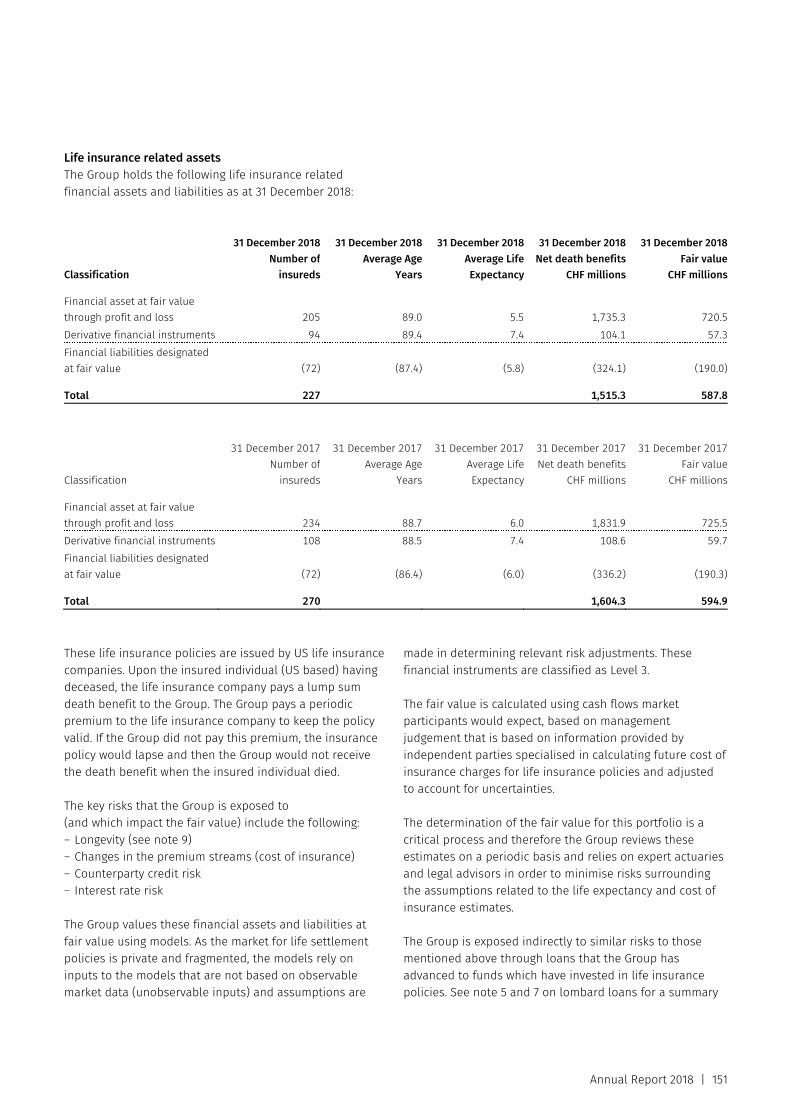
Annual Report 2018 | 151
Life insurance related assets The Group holds the following life insurance related financial assets and liabilities as at 31 December 2018:
Classification
31 December 2018Number of
insureds
31 December 2018Average Age
Years
31 December 2018Average Life Expectancy
31 December 2018Net death benefits
CHF millions
31 December 2018Fair value
CHF millions Financial asset at fair value through profit and loss 205 89.0 5.5 1,735.3 720.5 Derivative financial instruments 94 89.4 7.4 104.1 57.3 Financial liabilities designated at fair value (72) (87.4) (5.8) (324.1) (190.0) Total 227 1,515.3 587.8
Classification
31 December 2017Number of
insureds
31 December 2017Average Age
Years
31 December 2017Average Life Expectancy
31 December 2017Net death benefits
CHF millions
31 December 2017Fair value
CHF millions Financial asset at fair value through profit and loss 234 88.7 6.0 1,831.9 725.5 Derivative financial instruments 108 88.5 7.4 108.6 59.7 Financial liabilities designated at fair value (72) (86.4) (6.0) (336.2) (190.3) Total 270 1,604.3 594.9 These life insurance policies are issued by US life insurance companies. Upon the insured individual (US based) having deceased, the life insurance company pays a lump sum death benefit to the Group. The Group pays a periodic premium to the life insurance company to keep the policy valid. If the Group did not pay this premium, the insurance policy would lapse and then the Group would not receive the death benefit when the insured individual died.
The key risks that the Group is exposed to (and which impact the fair value) include the following: – Longevity (see note 9) – Changes in the premium streams (cost of insurance) – Counterparty credit risk – Interest rate risk
The Group values these financial assets and liabilities at fair value using models. As the market for life settlement policies is private and fragmented, the models rely on inputs to the models that are not based on observable market data (unobservable inputs) and assumptions are
made in determining relevant risk adjustments. These financial instruments are classified as Level 3.
The fair value is calculated using cash flows market participants would expect, based on management judgement that is based on information provided by independent parties specialised in calculating future cost of insurance charges for life insurance policies and adjusted to account for uncertainties.
The determination of the fair value for this portfolio is a critical process and therefore the Group reviews these estimates on a periodic basis and relies on expert actuaries and legal advisors in order to minimise risks surrounding the assumptions related to the life expectancy and cost of insurance estimates.
The Group is exposed indirectly to similar risks to those mentioned above through loans that the Group has advanced to funds which have invested in life insurance policies. See note 5 and 7 on lombard loans for a summary
Notes to the consolidated financial statements EFG International consolidated entities
152 | Annual Report 2018
of the loans and the related expected credit loss allowance that has been recognised.
The determination of the fair value of these financial assets and liabilities requires management judgment on the below valuation inputs:
(a) Longevity assumptions The assumptions on life expectancy are based on the Valuation Basic Table (VBT) last published by the Society of Actuaries in 2015 and adjusted by external life settlement underwriters and actuaries to reflect the individual medical characteristics of the referenced insureds. Premium estimates are based on cost of insurance estimates, which are provided by independent parties specialised and experienced in the field of premium calculations for life settlement policies. The Group conducts a regular in-depth review of such providers to ensure high-quality standards and reliability of the forecasts.
(b) Premium streams and cost of insurance The determination of the best estimate cash flows included in the valuation of the life insurance for the fair value estimate of these assets under IFRS 13 is considered to be a critical accounting judgement for the Group, due to the lack of observable readily available information and the complexity of the determination of these assumptions.
The Group uses management’s best estimate (considering historic information and relying on specialised opinions) and information from external service providers about trends and market developments. Management also considers that the outcome of disputes involving significant increases in premiums observed in the US market will affect the expected premiums payable.
The determination of the appropriate level of increase of cost of insurance in the underlying policies is one of the most important assumptions applied by management in the valuation model. Increases in cost of insurance considers the aging of the insured persons and increases in pricing levels of premiums imposed by certain carriers that issued these policies. The majority of life insurance policies have increasing annual premiums payable. In certain instances additional increases have been announced by the insurance companies. The Group considers these increases in cost of insurance to be unjustified and have challenged their implementation in US courts.
The outcome of disputes involving significant increases in premiums observed in the US market affecting the life insurance policies in the portfolio are taken into account. In
these cases, management has, in line with market participants, set their own best estimates taking into account the factors outlined above and the relevant contracts. As the ultimate resolution of these legal actions is significant for the Group, it relies on actuaries to set the cost of insurance assumptions.
The Group will also take legal actions against other carriers that have indicated that they will increase premiums. The Group believes that it will prevail in these claims, however legal proceedings are inherently unpredictable and the actual future outcome might materially differ from the Group’s expectations.
(c) Counterparty credit risk This is the risk of default of the insurance carrier. Credit risk is taken into account through applying a notching based probability of default approach that takes the credit rating assigned by a recognised agency into consideration as starting point. The Group is of the view that US life insur-ance carriers are operating in a highly regulated environ-ment, which would ensure that the rights of the beneficiary under a life insurance policy remain protected and claims under such policies rank among the most senior liabilities.
(d) Interest rate risk The risk adjusted cash flows have been discounted at the term matching linearly interpolated market swap curve.
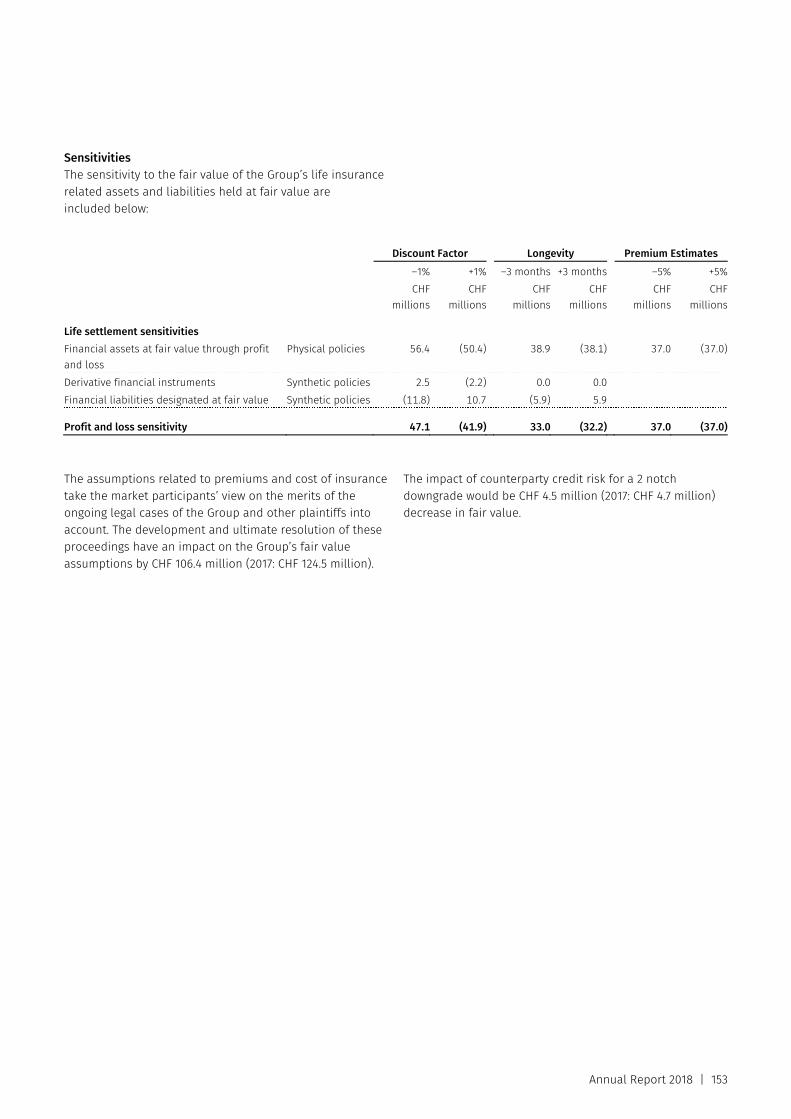
Annual Report 2018 | 153
Sensitivities The sensitivity to the fair value of the Group’s life insurance related assets and liabilities held at fair value are included below:
Discount Factor Longevity Premium Estimates –1% +1% –3 months +3 months –5% +5% CHF
millionsCHF
millions CHF
millionsCHF
millionsCHF
millions CHF
millions Life settlement sensitivities Financial assets at fair value through profit and loss
Physical policies 56.4 (50.4) 38.9 (38.1) 37.0 (37.0)
Derivative financial instruments Synthetic policies 2.5 (2.2) 0.0 0.0 Financial liabilities designated at fair value Synthetic policies (11.8) 10.7 (5.9) 5.9 Profit and loss sensitivity 47.1 (41.9) 33.0 (32.2) 37.0 (37.0) The assumptions related to premiums and cost of insurance take the market participants’ view on the merits of the ongoing legal cases of the Group and other plaintiffs into account. The development and ultimate resolution of these proceedings have an impact on the Group’s fair value assumptions by CHF 106.4 million (2017: CHF 124.5 million).
The impact of counterparty credit risk for a 2 notch downgrade would be CHF 4.5 million (2017: CHF 4.7 million) decrease in fair value.
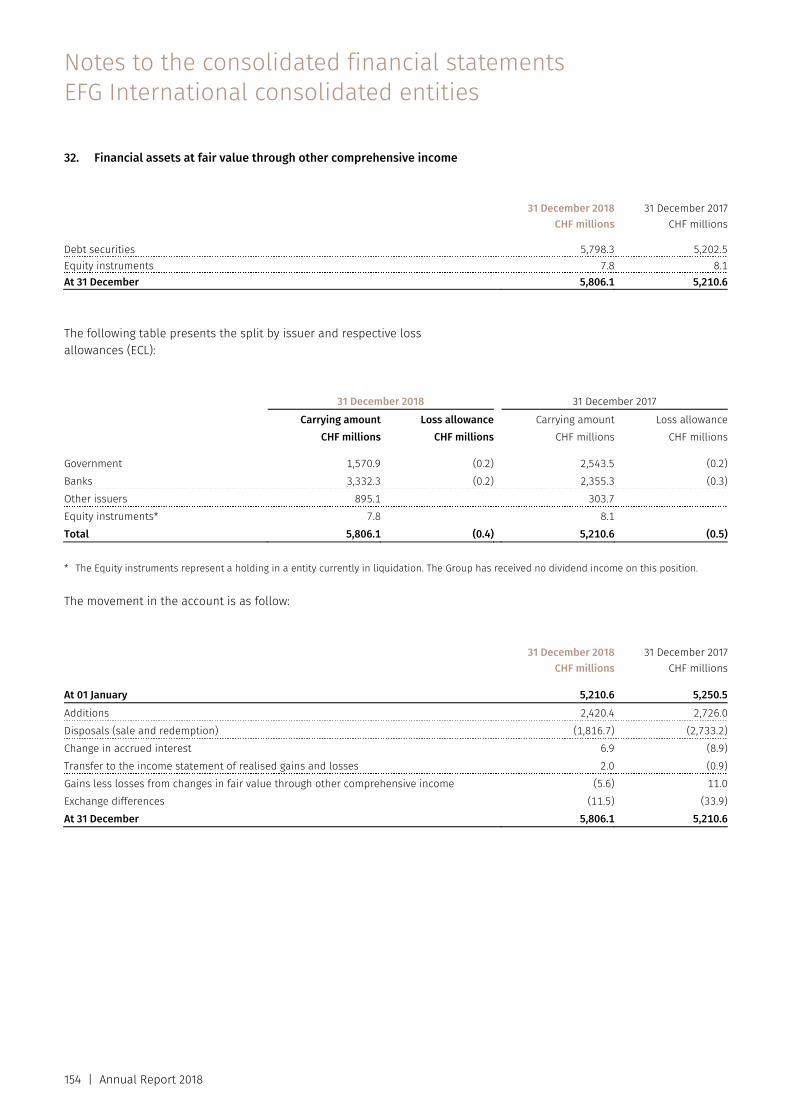
Notes to the consolidated financial statements EFG International consolidated entities
154 | Annual Report 2018
32. Financial assets at fair value through other comprehensive income
31 December 2018
CHF millions31 December 2017
CHF millions Debt securities 5,798.3 5,202.5Equity instruments 7.8 8.1At 31 December 5,806.1 5,210.6 The following table presents the split by issuer and respective loss allowances (ECL): 31 December 2018 31 December 2017 Carrying amount Loss allowance Carrying amount Loss allowance CHF millions CHF millions CHF millions CHF millions Government 1,570.9 (0.2) 2,543.5 (0.2)Banks 3,332.3 (0.2) 2,355.3 (0.3)Other issuers 895.1 303.7Equity instruments* 7.8 8.1Total 5,806.1 (0.4) 5,210.6 (0.5) * The Equity instruments represent a holding in a entity currently in liquidation. The Group has received no dividend income on this position. The movement in the account is as follow:
31 December 2018
CHF millions31 December 2017
CHF millions At 01 January 5,210.6 5,250.5Additions 2,420.4 2,726.0Disposals (sale and redemption) (1,816.7) (2,733.2)Change in accrued interest 6.9 (8.9)Transfer to the income statement of realised gains and losses 2.0 (0.9)Gains less losses from changes in fair value through other comprehensive income (5.6) 11.0Exchange differences (11.5) (33.9)At 31 December 5,806.1 5,210.6
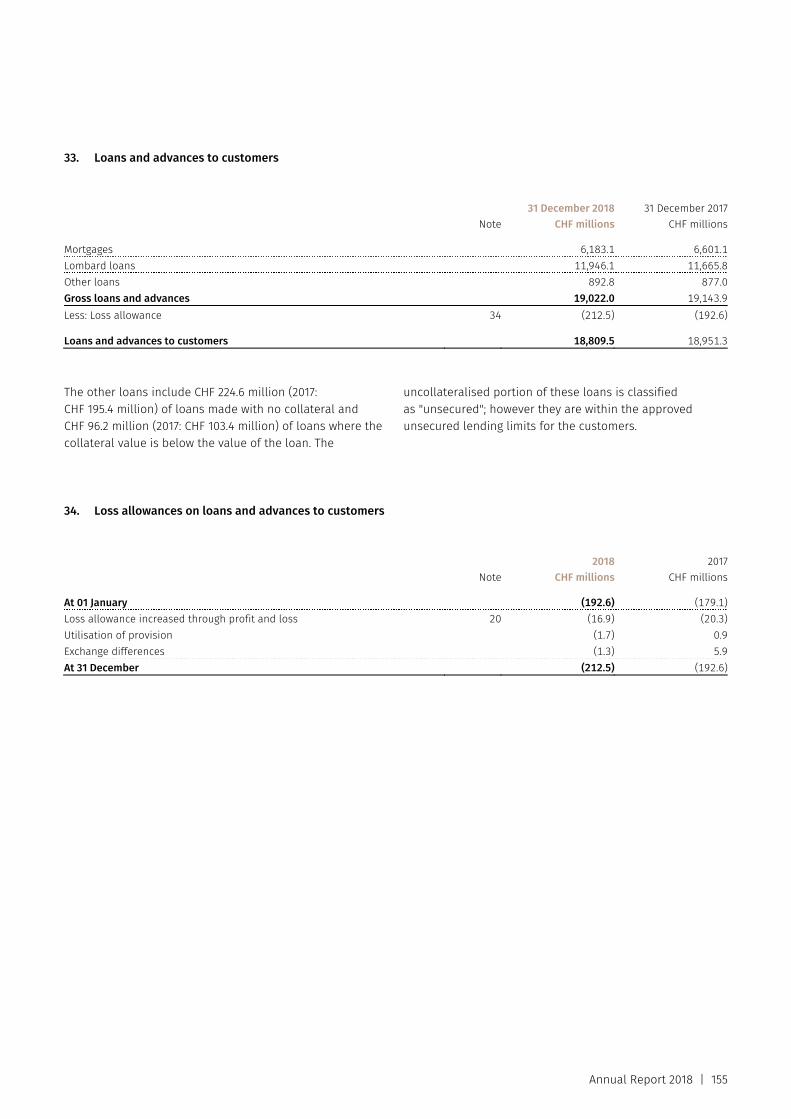
Annual Report 2018 | 155
33. Loans and advances to customers
Note31 December 2018
CHF millions31 December 2017
CHF millions Mortgages 6,183.1 6,601.1Lombard loans 11,946.1 11,665.8Other loans 892.8 877.0Gross loans and advances 19,022.0 19,143.9Less: Loss allowance 34 (212.5) (192.6) Loans and advances to customers 18,809.5 18,951.3 The other loans include CHF 224.6 million (2017: CHF 195.4 million) of loans made with no collateral and CHF 96.2 million (2017: CHF 103.4 million) of loans where the collateral value is below the value of the loan. The
uncollateralised portion of these loans is classified as "unsecured"; however they are within the approved unsecured lending limits for the customers.
34. Loss allowances on loans and advances to customers
Note2018
CHF millions2017
CHF millions At 01 January (192.6) (179.1)Loss allowance increased through profit and loss 20 (16.9) (20.3)Utilisation of provision (1.7) 0.9Exchange differences (1.3) 5.9At 31 December (212.5) (192.6)
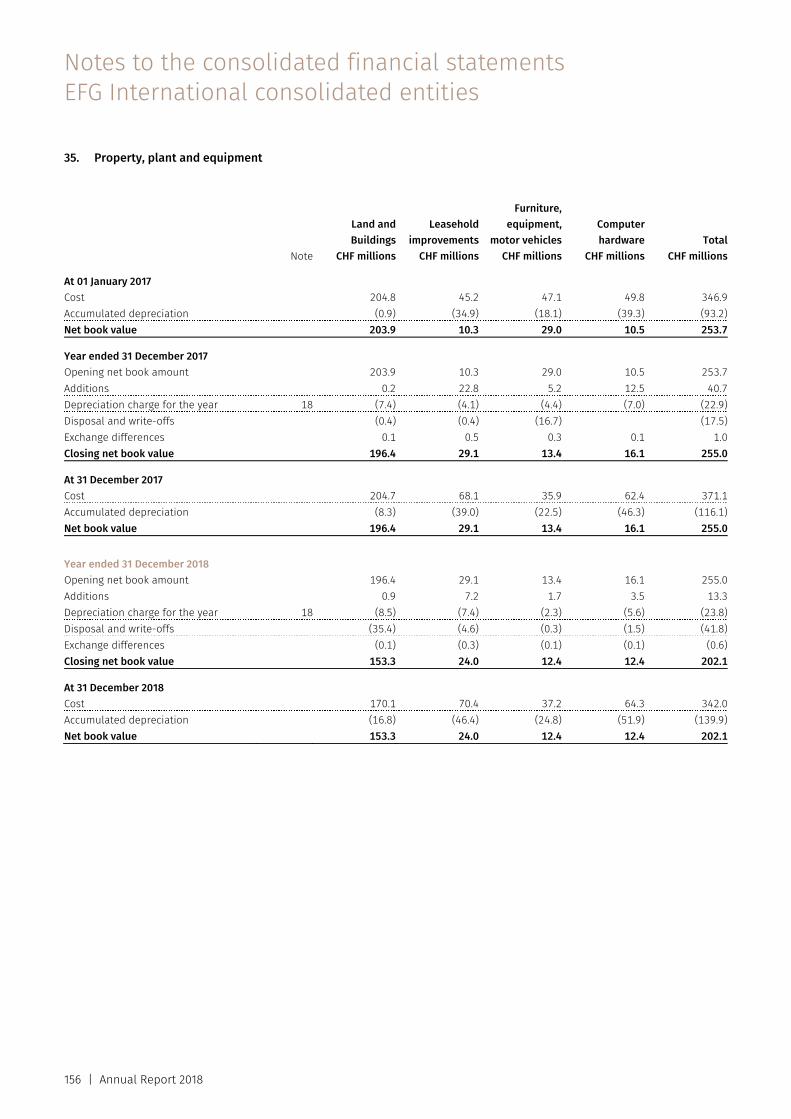
Notes to the consolidated financial statements EFG International consolidated entities
156 | Annual Report 2018
35. Property, plant and equipment
Note
Land and Buildings
CHF millions
Leasehold improvements
CHF millions
Furniture, equipment,
motor vehiclesCHF millions
Computer hardware
CHF millionsTotal
CHF millions At 01 January 2017 Cost 204.8 45.2 47.1 49.8 346.9Accumulated depreciation (0.9) (34.9) (18.1) (39.3) (93.2)Net book value 203.9 10.3 29.0 10.5 253.7 Year ended 31 December 2017 Opening net book amount 203.9 10.3 29.0 10.5 253.7Additions 0.2 22.8 5.2 12.5 40.7Depreciation charge for the year 18 (7.4) (4.1) (4.4) (7.0) (22.9)Disposal and write-offs (0.4) (0.4) (16.7) (17.5)Exchange differences 0.1 0.5 0.3 0.1 1.0Closing net book value 196.4 29.1 13.4 16.1 255.0 At 31 December 2017 Cost 204.7 68.1 35.9 62.4 371.1Accumulated depreciation (8.3) (39.0) (22.5) (46.3) (116.1)Net book value 196.4 29.1 13.4 16.1 255.0 Year ended 31 December 2018 Opening net book amount 196.4 29.1 13.4 16.1 255.0Additions 0.9 7.2 1.7 3.5 13.3Depreciation charge for the year 18 (8.5) (7.4) (2.3) (5.6) (23.8)Disposal and write-offs (35.4) (4.6) (0.3) (1.5) (41.8)Exchange differences (0.1) (0.3) (0.1) (0.1) (0.6)Closing net book value 153.3 24.0 12.4 12.4 202.1 At 31 December 2018 Cost 170.1 70.4 37.2 64.3 342.0Accumulated depreciation (16.8) (46.4) (24.8) (51.9) (139.9)Net book value 153.3 24.0 12.4 12.4 202.1
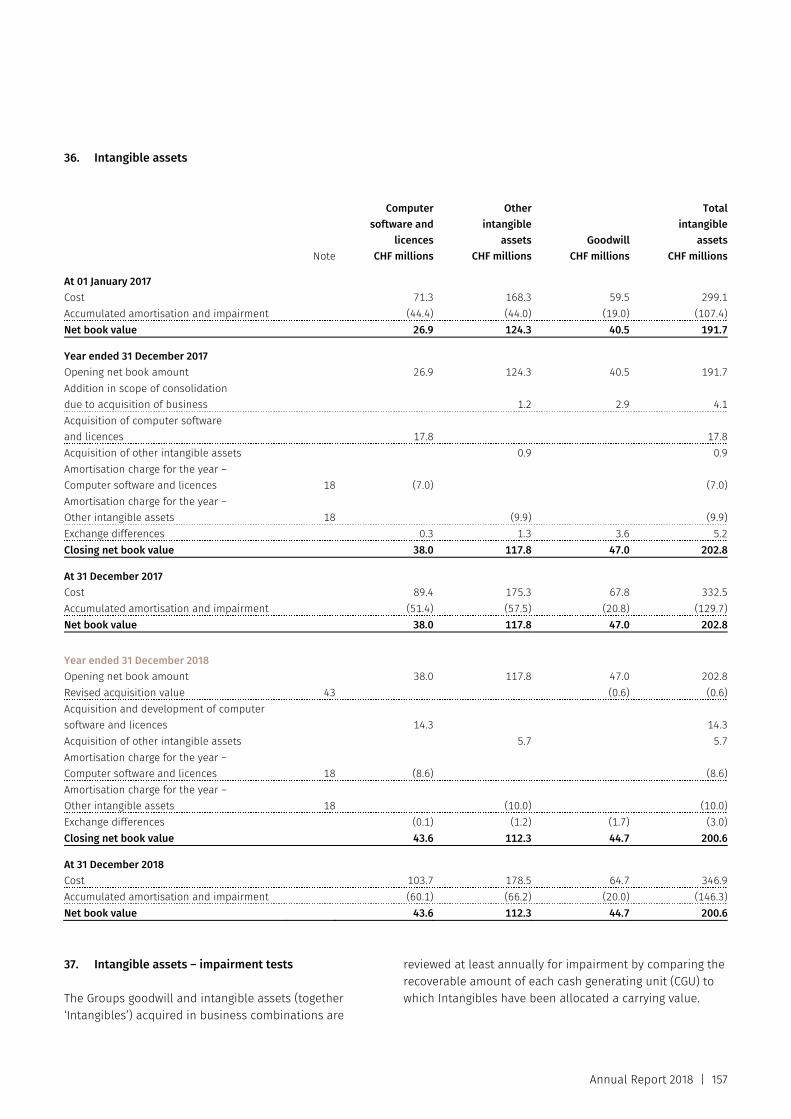
Annual Report 2018 | 157
36. Intangible assets
Note
Computersoftware and
licencesCHF millions
Other intangible
assets CHF millions
GoodwillCHF millions
Totalintangible
assetsCHF millions
At 01 January 2017 Cost 71.3 168.3 59.5 299.1Accumulated amortisation and impairment (44.4) (44.0) (19.0) (107.4)Net book value 26.9 124.3 40.5 191.7 Year ended 31 December 2017 Opening net book amount 26.9 124.3 40.5 191.7Addition in scope of consolidation due to acquisition of business 1.2 2.9 4.1Acquisition of computer software and licences 17.8 17.8Acquisition of other intangible assets 0.9 0.9Amortisation charge for the year – Computer software and licences 18 (7.0) (7.0)Amortisation charge for the year – Other intangible assets 18 (9.9) (9.9)Exchange differences 0.3 1.3 3.6 5.2Closing net book value 38.0 117.8 47.0 202.8 At 31 December 2017 Cost 89.4 175.3 67.8 332.5Accumulated amortisation and impairment (51.4) (57.5) (20.8) (129.7)Net book value 38.0 117.8 47.0 202.8 Year ended 31 December 2018 Opening net book amount 38.0 117.8 47.0 202.8Revised acquisition value 43 (0.6) (0.6)Acquisition and development of computer software and licences 14.3 14.3Acquisition of other intangible assets 5.7 5.7Amortisation charge for the year – Computer software and licences 18 (8.6) (8.6)Amortisation charge for the year – Other intangible assets 18 (10.0) (10.0)Exchange differences (0.1) (1.2) (1.7) (3.0)Closing net book value 43.6 112.3 44.7 200.6 At 31 December 2018 Cost 103.7 178.5 64.7 346.9Accumulated amortisation and impairment (60.1) (66.2) (20.0) (146.3)Net book value 43.6 112.3 44.7 200.6 37. Intangible assets – impairment tests
The Groups goodwill and intangible assets (together ‘Intangibles’) acquired in business combinations are
reviewed at least annually for impairment by comparing the recoverable amount of each cash generating unit (CGU) to which Intangibles have been allocated a carrying value.
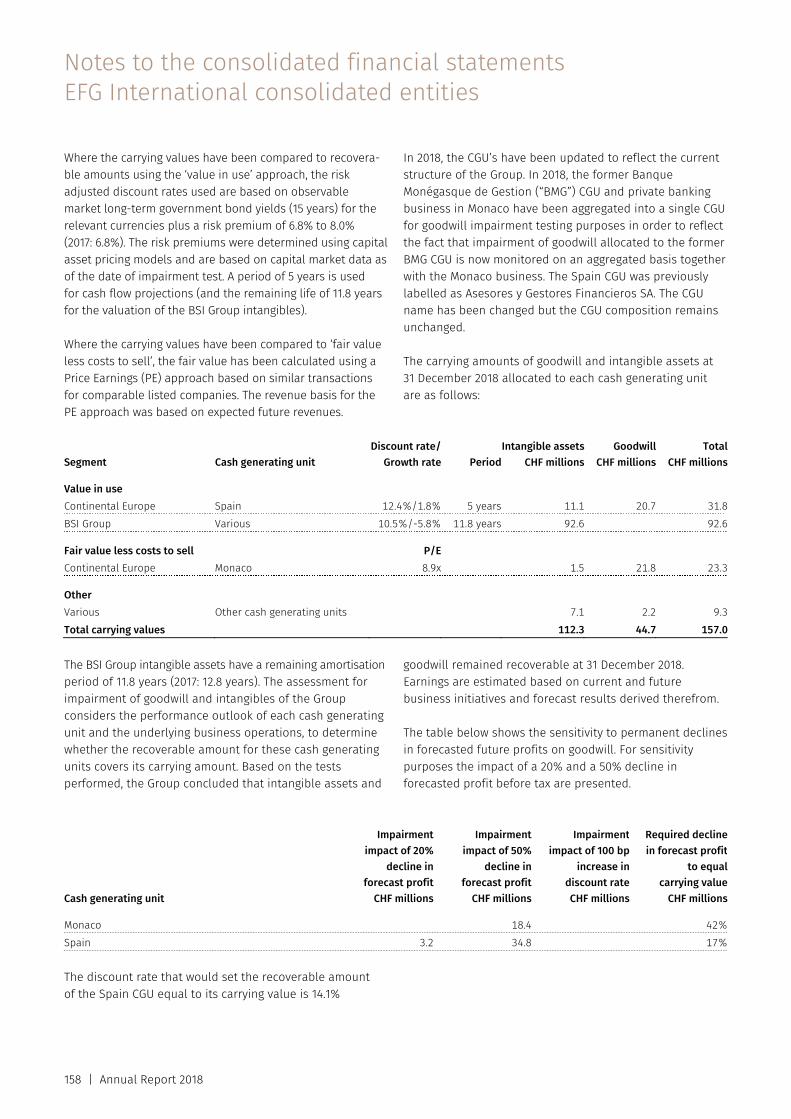
Notes to the consolidated financial statements EFG International consolidated entities
158 | Annual Report 2018
Where the carrying values have been compared to recovera-ble amounts using the ‘value in use’ approach, the risk adjusted discount rates used are based on observable market long-term government bond yields (15 years) for the relevant currencies plus a risk premium of 6.8% to 8.0% (2017: 6.8%). The risk premiums were determined using capital asset pricing models and are based on capital market data as of the date of impairment test. A period of 5 years is used for cash flow projections (and the remaining life of 11.8 years for the valuation of the BSI Group intangibles).
Where the carrying values have been compared to ‘fair value less costs to sell’, the fair value has been calculated using a Price Earnings (PE) approach based on similar transactions for comparable listed companies. The revenue basis for the PE approach was based on expected future revenues.
In 2018, the CGU’s have been updated to reflect the current structure of the Group. In 2018, the former Banque Monégasque de Gestion (“BMG”) CGU and private banking business in Monaco have been aggregated into a single CGU for goodwill impairment testing purposes in order to reflect the fact that impairment of goodwill allocated to the former BMG CGU is now monitored on an aggregated basis together with the Monaco business. The Spain CGU was previously labelled as Asesores y Gestores Financieros SA. The CGU name has been changed but the CGU composition remains unchanged.
The carrying amounts of goodwill and intangible assets at 31 December 2018 allocated to each cash generating unit are as follows:
Segment Cash generating unit Discount rate/
Growth rate PeriodIntangible assets
CHF millionsGoodwill
CHF millionsTotal
CHF millions Value in use Continental Europe Spain 12.4%/1.8% 5 years 11.1 20.7 31.8BSI Group Various 10.5%/-5.8% 11.8 years 92.6 92.6 Fair value less costs to sell P/EContinental Europe Monaco 8.9x 1.5 21.8 23.3 Other Various Other cash generating units 7.1 2.2 9.3Total carrying values 112.3 44.7 157.0 The BSI Group intangible assets have a remaining amortisation period of 11.8 years (2017: 12.8 years). The assessment for impairment of goodwill and intangibles of the Group considers the performance outlook of each cash generating unit and the underlying business operations, to determine whether the recoverable amount for these cash generating units covers its carrying amount. Based on the tests performed, the Group concluded that intangible assets and
goodwill remained recoverable at 31 December 2018. Earnings are estimated based on current and future business initiatives and forecast results derived therefrom.
The table below shows the sensitivity to permanent declines in forecasted future profits on goodwill. For sensitivity purposes the impact of a 20% and a 50% decline in forecasted profit before tax are presented.
Cash generating unit
Impairmentimpact of 20%
decline inforecast profit
CHF millions
Impairment impact of 50%
decline in forecast profit
CHF millions
Impairment impact of 100 bp
increase in discount rateCHF millions
Required decline in forecast profit
to equal carrying value
CHF millions Monaco 18.4 42%Spain 3.2 34.8 17% The discount rate that would set the recoverable amount of the Spain CGU equal to its carrying value is 14.1%
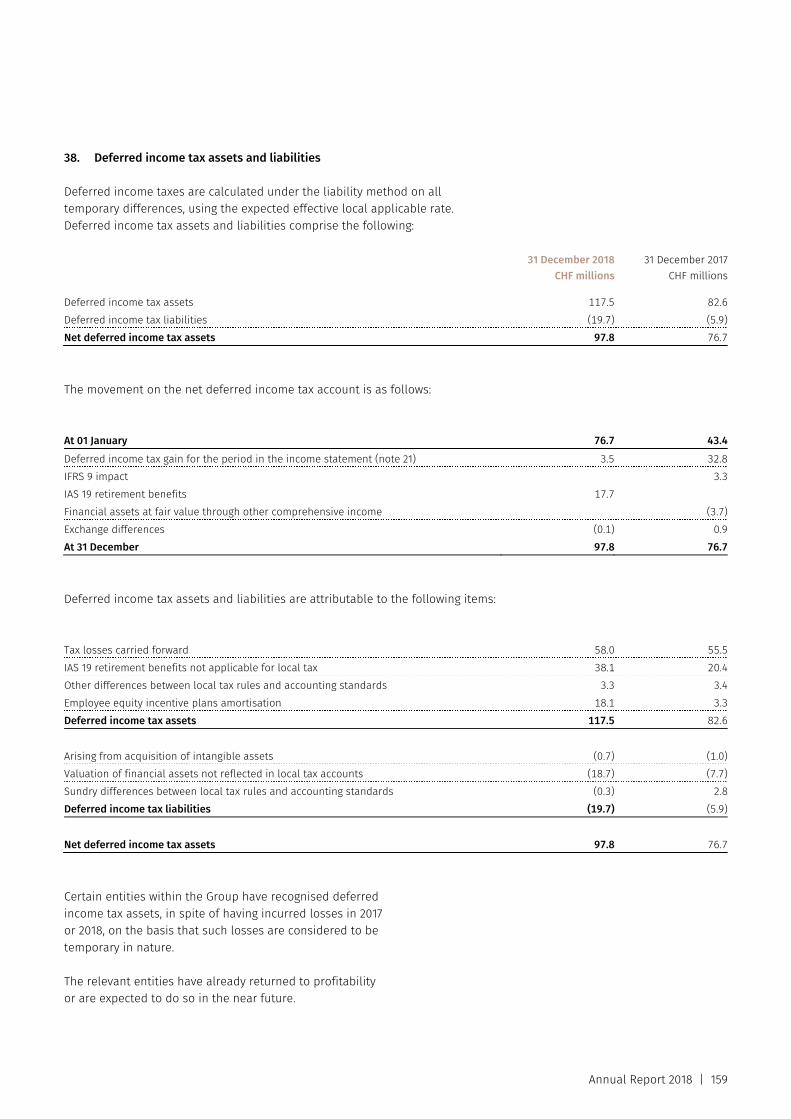
Annual Report 2018 | 159
38. Deferred income tax assets and liabilities
Deferred income taxes are calculated under the liability method on all temporary differences, using the expected effective local applicable rate. Deferred income tax assets and liabilities comprise the following:
31 December 2018
CHF millions31 December 2017
CHF millions Deferred income tax assets 117.5 82.6Deferred income tax liabilities (19.7) (5.9)Net deferred income tax assets 97.8 76.7
The movement on the net deferred income tax account is as follows: At 01 January 76.7 43.4Deferred income tax gain for the period in the income statement (note 21) 3.5 32.8IFRS 9 impact 3.3IAS 19 retirement benefits 17.7Financial assets at fair value through other comprehensive income (3.7)Exchange differences (0.1) 0.9At 31 December 97.8 76.7 Deferred income tax assets and liabilities are attributable to the following items: Tax losses carried forward 58.0 55.5IAS 19 retirement benefits not applicable for local tax 38.1 20.4Other differences between local tax rules and accounting standards 3.3 3.4Employee equity incentive plans amortisation 18.1 3.3Deferred income tax assets 117.5 82.6 Arising from acquisition of intangible assets (0.7) (1.0)Valuation of financial assets not reflected in local tax accounts (18.7) (7.7)Sundry differences between local tax rules and accounting standards (0.3) 2.8Deferred income tax liabilities (19.7) (5.9) Net deferred income tax assets 97.8 76.7
Certain entities within the Group have recognised deferred income tax assets, in spite of having incurred losses in 2017 or 2018, on the basis that such losses are considered to be temporary in nature. The relevant entities have already returned to profitability or are expected to do so in the near future.
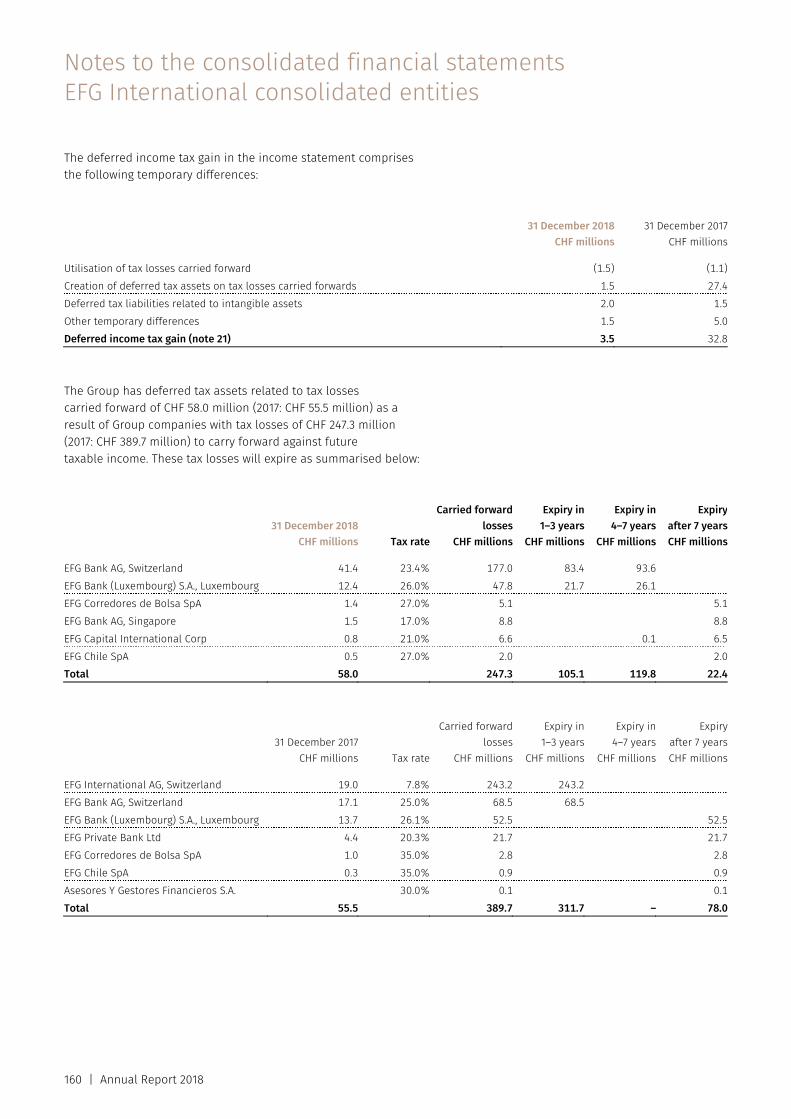
Notes to the consolidated financial statements EFG International consolidated entities
160 | Annual Report 2018
The deferred income tax gain in the income statement comprises the following temporary differences: 31 December 2018
CHF millions31 December 2017
CHF millions Utilisation of tax losses carried forward (1.5) (1.1)Creation of deferred tax assets on tax losses carried forwards 1.5 27.4Deferred tax liabilities related to intangible assets 2.0 1.5Other temporary differences 1.5 5.0Deferred income tax gain (note 21) 3.5 32.8
The Group has deferred tax assets related to tax losses carried forward of CHF 58.0 million (2017: CHF 55.5 million) as a result of Group companies with tax losses of CHF 247.3 million (2017: CHF 389.7 million) to carry forward against future taxable income. These tax losses will expire as summarised below:
31 December 2018
CHF millions Tax rate
Carried forward losses
CHF millions
Expiry in1–3 years
CHF millions
Expiry in4–7 years
CHF millions
Expiryafter 7 yearsCHF millions
EFG Bank AG, Switzerland 41.4 23.4% 177.0 83.4 93.6 EFG Bank (Luxembourg) S.A., Luxembourg 12.4 26.0% 47.8 21.7 26.1 EFG Corredores de Bolsa SpA 1.4 27.0% 5.1 5.1EFG Bank AG, Singapore 1.5 17.0% 8.8 8.8EFG Capital International Corp 0.8 21.0% 6.6 0.1 6.5EFG Chile SpA 0.5 27.0% 2.0 2.0Total 58.0 247.3 105.1 119.8 22.4
31 December 2017
CHF millions Tax rate
Carried forward losses
CHF millions
Expiry in1–3 years
CHF millions
Expiry in4–7 years
CHF millions
Expiryafter 7 yearsCHF millions
EFG International AG, Switzerland 19.0 7.8% 243.2 243.2EFG Bank AG, Switzerland 17.1 25.0% 68.5 68.5EFG Bank (Luxembourg) S.A., Luxembourg 13.7 26.1% 52.5 52.5EFG Private Bank Ltd 4.4 20.3% 21.7 21.7EFG Corredores de Bolsa SpA 1.0 35.0% 2.8 2.8EFG Chile SpA 0.3 35.0% 0.9 0.9Asesores Y Gestores Financieros S.A. 30.0% 0.1 0.1Total 55.5 389.7 311.7 – 78.0
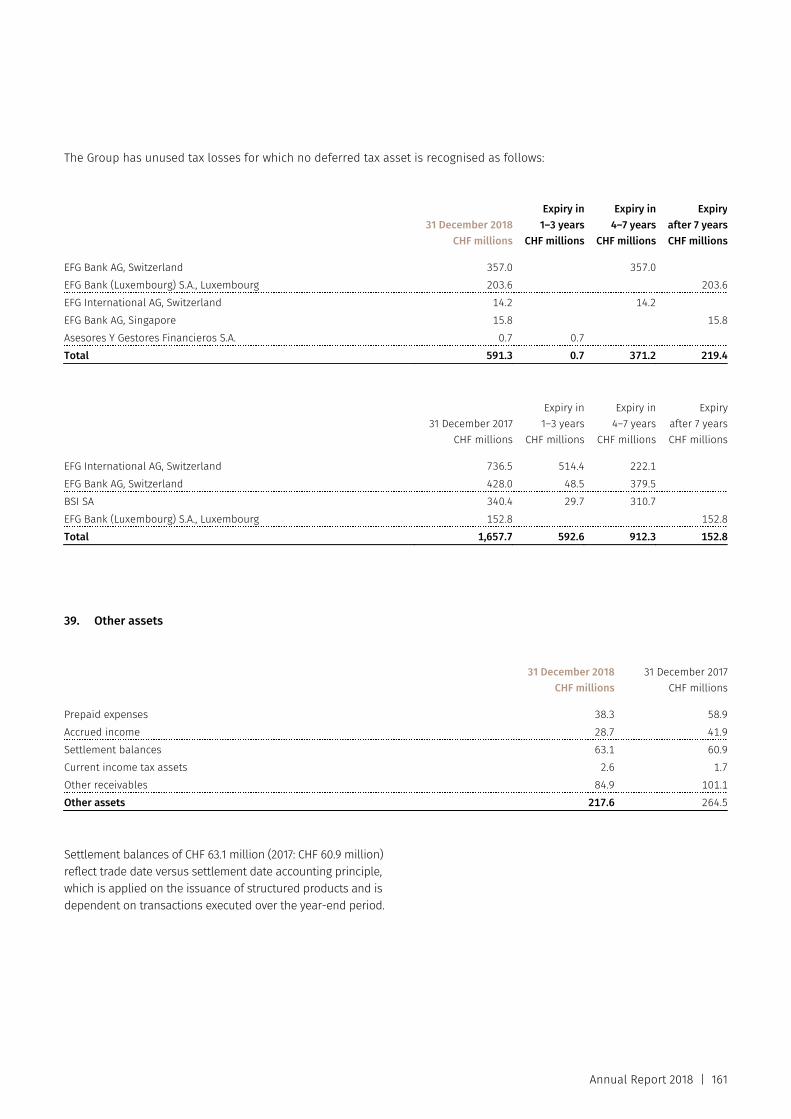
Annual Report 2018 | 161
The Group has unused tax losses for which no deferred tax asset is recognised as follows:
31 December 2018
CHF millions
Expiry in1–3 years
CHF millions
Expiry in4–7 years
CHF millions
Expiryafter 7 yearsCHF millions
EFG Bank AG, Switzerland 357.0 357.0 EFG Bank (Luxembourg) S.A., Luxembourg 203.6 203.6EFG International AG, Switzerland 14.2 14.2 EFG Bank AG, Singapore 15.8 15.8Asesores Y Gestores Financieros S.A. 0.7 0.7Total 591.3 0.7 371.2 219.4
31 December 2017
CHF millions
Expiry in1–3 years
CHF millions
Expiry in4–7 years
CHF millions
Expiryafter 7 yearsCHF millions
EFG International AG, Switzerland 736.5 514.4 222.1 EFG Bank AG, Switzerland 428.0 48.5 379.5 BSI SA 340.4 29.7 310.7 EFG Bank (Luxembourg) S.A., Luxembourg 152.8 152.8Total 1,657.7 592.6 912.3 152.8
39. Other assets
31 December 2018
CHF millions31 December 2017
CHF millions Prepaid expenses 38.3 58.9Accrued income 28.7 41.9Settlement balances 63.1 60.9Current income tax assets 2.6 1.7Other receivables 84.9 101.1Other assets 217.6 264.5
Settlement balances of CHF 63.1 million (2017: CHF 60.9 million) reflect trade date versus settlement date accounting principle, which is applied on the issuance of structured products and is dependent on transactions executed over the year-end period.
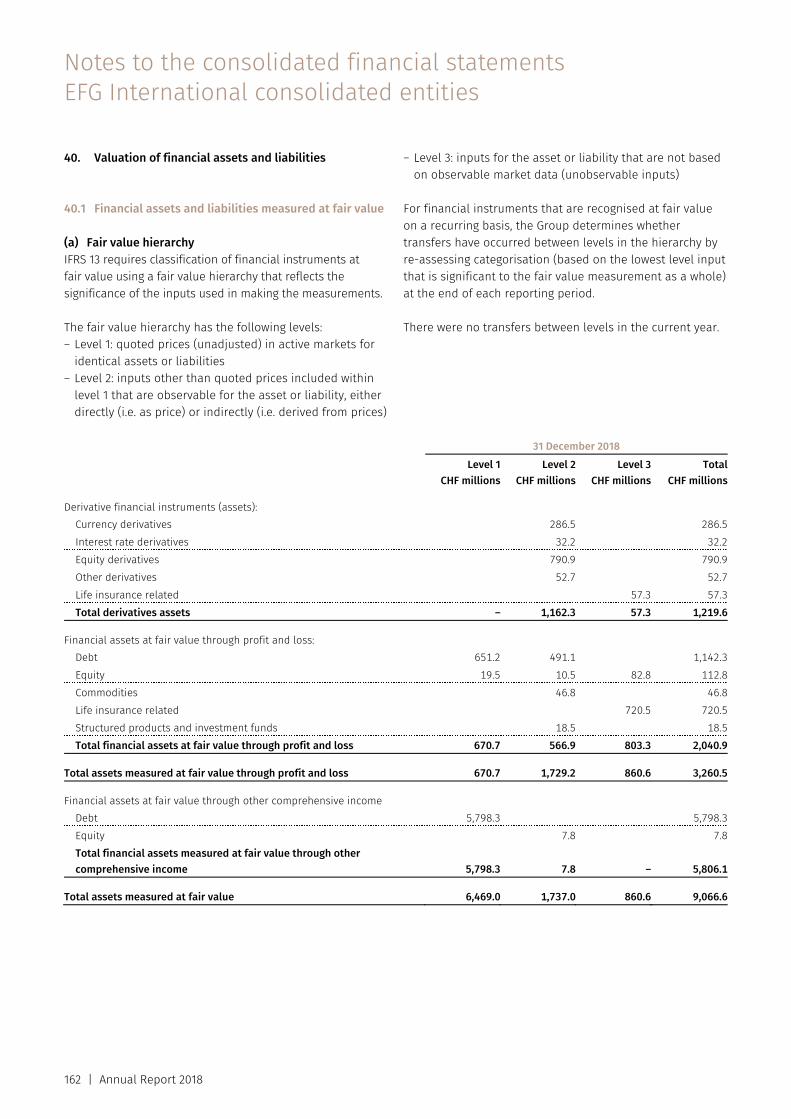
Notes to the consolidated financial statements EFG International consolidated entities
162 | Annual Report 2018
40. Valuation of financial assets and liabilities
40.1 Financial assets and liabilities measured at fair value
(a) Fair value hierarchy IFRS 13 requires classification of financial instruments at fair value using a fair value hierarchy that reflects the significance of the inputs used in making the measurements.
The fair value hierarchy has the following levels: – Level 1: quoted prices (unadjusted) in active markets for
identical assets or liabilities – Level 2: inputs other than quoted prices included within
level 1 that are observable for the asset or liability, either directly (i.e. as price) or indirectly (i.e. derived from prices)
– Level 3: inputs for the asset or liability that are not based on observable market data (unobservable inputs)
For financial instruments that are recognised at fair value on a recurring basis, the Group determines whether transfers have occurred between levels in the hierarchy by re-assessing categorisation (based on the lowest level input that is significant to the fair value measurement as a whole) at the end of each reporting period.
There were no transfers between levels in the current year.
31 December 2018 Level 1
CHF millions Level 2
CHF millions Level 3
CHF millionsTotal
CHF millions Derivative financial instruments (assets):
Currency derivatives 286.5 286.5Interest rate derivatives 32.2 32.2Equity derivatives 790.9 790.9Other derivatives 52.7 52.7Life insurance related 57.3 57.3Total derivatives assets – 1,162.3 57.3 1,219.6
Financial assets at fair value through profit and loss:
Debt 651.2 491.1 1,142.3Equity 19.5 10.5 82.8 112.8Commodities 46.8 46.8Life insurance related 720.5 720.5Structured products and investment funds 18.5 18.5Total financial assets at fair value through profit and loss 670.7 566.9 803.3 2,040.9
Total assets measured at fair value through profit and loss 670.7 1,729.2 860.6 3,260.5 Financial assets at fair value through other comprehensive income
Debt 5,798.3 5,798.3Equity 7.8 7.8Total financial assets measured at fair value through other comprehensive income 5,798.3 7.8 – 5,806.1
Total assets measured at fair value 6,469.0 1,737.0 860.6 9,066.6
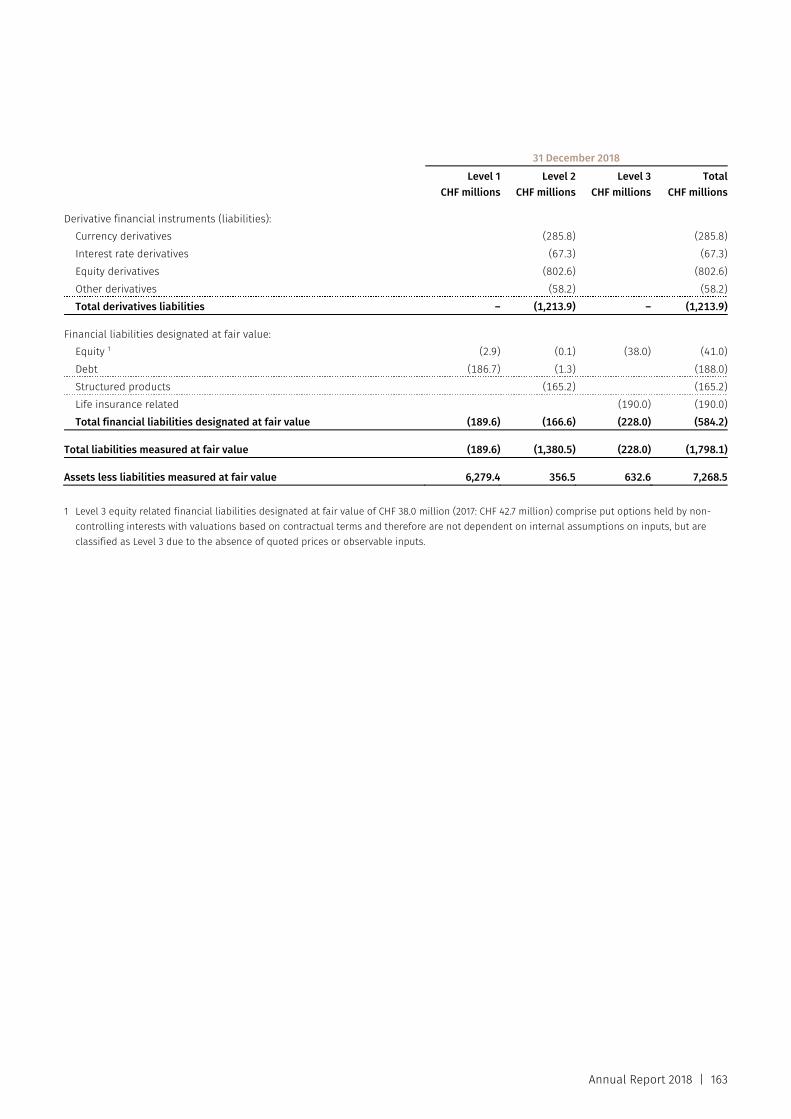
Annual Report 2018 | 163
31 December 2018 Level 1
CHF millions Level 2
CHF millions Level 3
CHF millionsTotal
CHF millions Derivative financial instruments (liabilities):
Currency derivatives (285.8) (285.8)Interest rate derivatives (67.3) (67.3)Equity derivatives (802.6) (802.6)Other derivatives (58.2) (58.2)Total derivatives liabilities – (1,213.9) – (1,213.9)
Financial liabilities designated at fair value:
Equity 1 (2.9) (0.1) (38.0) (41.0)Debt (186.7) (1.3) (188.0)Structured products (165.2) (165.2)Life insurance related (190.0) (190.0)Total financial liabilities designated at fair value (189.6) (166.6) (228.0) (584.2)
Total liabilities measured at fair value (189.6) (1,380.5) (228.0) (1,798.1) Assets less liabilities measured at fair value 6,279.4 356.5 632.6 7,268.5 1 Level 3 equity related financial liabilities designated at fair value of CHF 38.0 million (2017: CHF 42.7 million) comprise put options held by non-
controlling interests with valuations based on contractual terms and therefore are not dependent on internal assumptions on inputs, but are classified as Level 3 due to the absence of quoted prices or observable inputs.
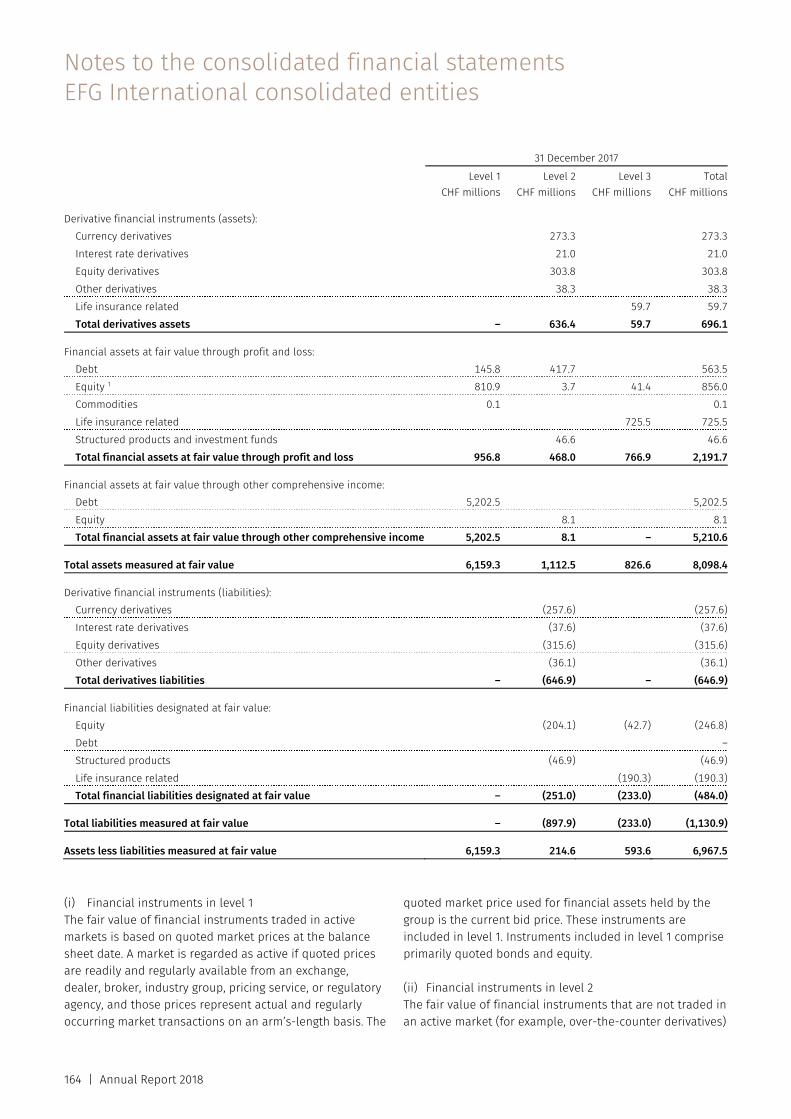
Notes to the consolidated financial statements EFG International consolidated entities
164 | Annual Report 2018
31 December 2017 Level 1
CHF millions Level 2
CHF millions Level 3
CHF millionsTotal
CHF millions Derivative financial instruments (assets):
Currency derivatives 273.3 273.3Interest rate derivatives 21.0 21.0Equity derivatives 303.8 303.8Other derivatives 38.3 38.3Life insurance related 59.7 59.7Total derivatives assets – 636.4 59.7 696.1
Financial assets at fair value through profit and loss:
Debt 145.8 417.7 563.5Equity 1 810.9 3.7 41.4 856.0Commodities 0.1 0.1Life insurance related 725.5 725.5Structured products and investment funds 46.6 46.6Total financial assets at fair value through profit and loss 956.8 468.0 766.9 2,191.7
Financial assets at fair value through other comprehensive income:
Debt 5,202.5 5,202.5Equity 8.1 8.1Total financial assets at fair value through other comprehensive income 5,202.5 8.1 – 5,210.6
Total assets measured at fair value 6,159.3 1,112.5 826.6 8,098.4 Derivative financial instruments (liabilities):
Currency derivatives (257.6) (257.6)Interest rate derivatives (37.6) (37.6)Equity derivatives (315.6) (315.6)Other derivatives (36.1) (36.1)Total derivatives liabilities – (646.9) – (646.9)
Financial liabilities designated at fair value:
Equity (204.1) (42.7) (246.8)Debt –Structured products (46.9) (46.9)Life insurance related (190.3) (190.3)Total financial liabilities designated at fair value – (251.0) (233.0) (484.0)
Total liabilities measured at fair value – (897.9) (233.0) (1,130.9) Assets less liabilities measured at fair value 6,159.3 214.6 593.6 6,967.5 (i) Financial instruments in level 1 The fair value of financial instruments traded in active markets is based on quoted market prices at the balance sheet date. A market is regarded as active if quoted prices are readily and regularly available from an exchange, dealer, broker, industry group, pricing service, or regulatory agency, and those prices represent actual and regularly occurring market transactions on an arm’s-length basis. The
quoted market price used for financial assets held by the group is the current bid price. These instruments are included in level 1. Instruments included in level 1 comprise primarily quoted bonds and equity.
(ii) Financial instruments in level 2 The fair value of financial instruments that are not traded in an active market (for example, over-the-counter derivatives)

Annual Report 2018 | 165
is determined by using valuation techniques. These valuation techniques maximise the use of observable market data where it is available and rely as little as possible on entity specific estimates. If all significant inputs required to fair value an instrument are observable, the instrument is included in level 2. If one or more of the significant inputs is not based on observable market data, the instrument is included in level 3.
Specific valuation techniques used to value financial instruments include: – Quoted market prices or dealer quotes for similar
instruments – The fair value of interest rate swaps is calculated as the
present value of the estimated future cash flows based on observable yield curves
– The fair value of forward foreign exchange contracts is determined using forward exchange rates at the balance sheet date, with the resulting value discounted back to present value
– Other techniques, such as discounted cash flow analysis, are used to determine fair value for the remaining financial instruments
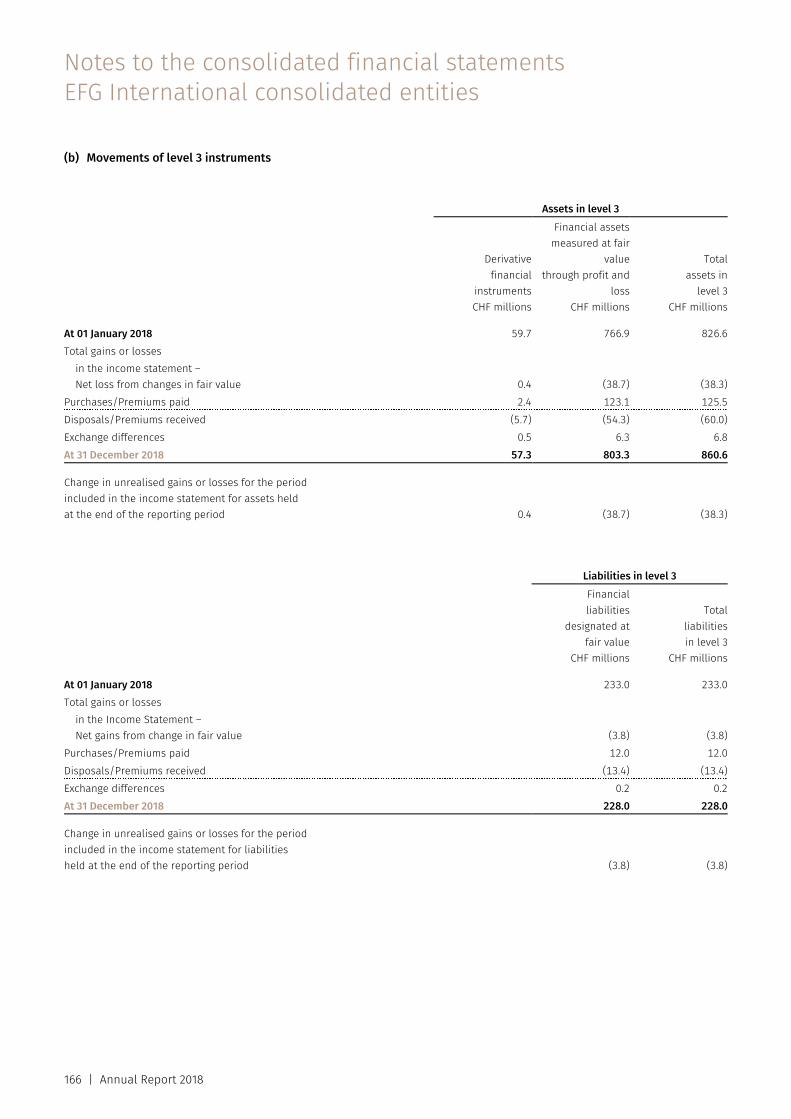
Notes to the consolidated financial statements EFG International consolidated entities
166 | Annual Report 2018
(b) Movements of level 3 instruments Assets in level 3
Derivative financial
instruments CHF millions
Financial assets measured at fair
value through profit and
lossCHF millions
Total assets in
level 3CHF millions
At 01 January 2018 59.7 766.9 826.6Total gains or losses
in the income statement – Net loss from changes in fair value 0.4 (38.7) (38.3)
Purchases/Premiums paid 2.4 123.1 125.5Disposals/Premiums received (5.7) (54.3) (60.0)Exchange differences 0.5 6.3 6.8At 31 December 2018 57.3 803.3 860.6 Change in unrealised gains or losses for the period included in the income statement for assets held at the end of the reporting period 0.4 (38.7) (38.3) Liabilities in level 3
Financialliabilities
designated atfair value
CHF millions
Totalliabilitiesin level 3
CHF millions At 01 January 2018 233.0 233.0Total gains or losses
in the Income Statement – Net gains from change in fair value (3.8) (3.8)
Purchases/Premiums paid 12.0 12.0Disposals/Premiums received (13.4) (13.4)Exchange differences 0.2 0.2At 31 December 2018 228.0 228.0 Change in unrealised gains or losses for the period included in the income statement for liabilities held at the end of the reporting period (3.8) (3.8)
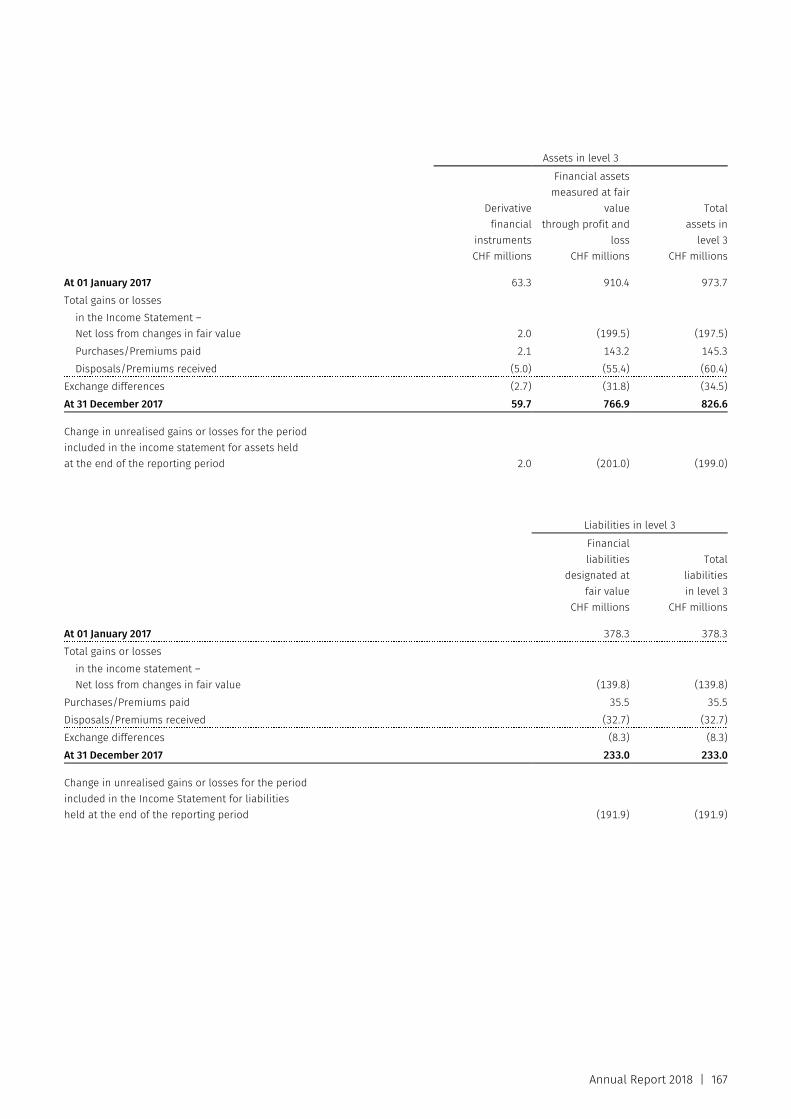
Annual Report 2018 | 167
Assets in level 3
Derivative financial
instruments CHF millions
Financial assets measured at fair
value through profit and
lossCHF millions
Total assets in
level 3CHF millions
At 01 January 2017 63.3 910.4 973.7Total gains or losses
in the Income Statement – Net loss from changes in fair value 2.0 (199.5) (197.5)Purchases/Premiums paid 2.1 143.2 145.3Disposals/Premiums received (5.0) (55.4) (60.4)
Exchange differences (2.7) (31.8) (34.5)At 31 December 2017 59.7 766.9 826.6 Change in unrealised gains or losses for the period included in the income statement for assets held at the end of the reporting period 2.0 (201.0) (199.0) Liabilities in level 3
Financialliabilities
designated atfair value
CHF millions
Totalliabilitiesin level 3
CHF millions At 01 January 2017 378.3 378.3Total gains or losses
in the income statement – Net loss from changes in fair value (139.8) (139.8)
Purchases/Premiums paid 35.5 35.5Disposals/Premiums received (32.7) (32.7)Exchange differences (8.3) (8.3)At 31 December 2017 233.0 233.0 Change in unrealised gains or losses for the period included in the Income Statement for liabilities held at the end of the reporting period (191.9) (191.9)
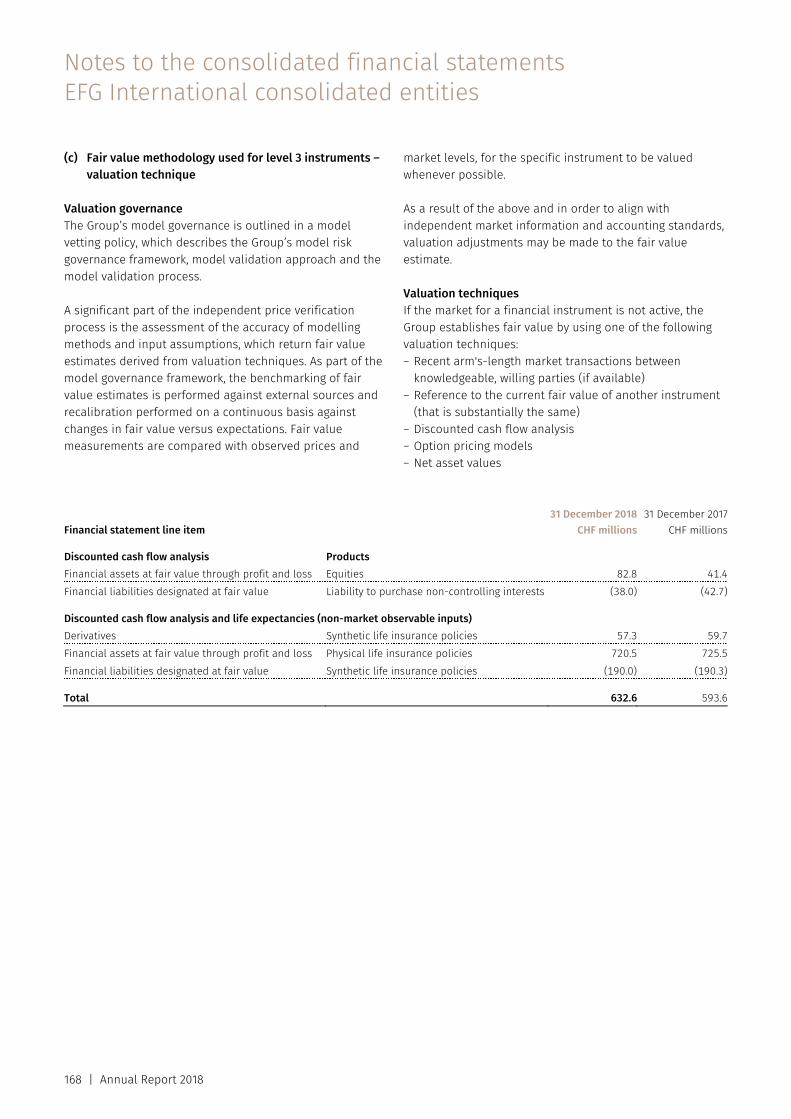
Notes to the consolidated financial statements EFG International consolidated entities
168 | Annual Report 2018
(c) Fair value methodology used for level 3 instruments – valuation technique
Valuation governance The Group’s model governance is outlined in a model vetting policy, which describes the Group’s model risk governance framework, model validation approach and the model validation process.
A significant part of the independent price verification process is the assessment of the accuracy of modelling methods and input assumptions, which return fair value estimates derived from valuation techniques. As part of the model governance framework, the benchmarking of fair value estimates is performed against external sources and recalibration performed on a continuous basis against changes in fair value versus expectations. Fair value measurements are compared with observed prices and
market levels, for the specific instrument to be valued whenever possible.
As a result of the above and in order to align with independent market information and accounting standards, valuation adjustments may be made to the fair value estimate.
Valuation techniques If the market for a financial instrument is not active, the Group establishes fair value by using one of the following valuation techniques: – Recent arm's-length market transactions between
knowledgeable, willing parties (if available) – Reference to the current fair value of another instrument
(that is substantially the same) – Discounted cash flow analysis – Option pricing models – Net asset values
Financial statement line item 31 December 2018
CHF millions31 December 2017
CHF millions Discounted cash flow analysis Products Financial assets at fair value through profit and loss Equities 82.8 41.4Financial liabilities designated at fair value Liability to purchase non-controlling interests (38.0) (42.7) Discounted cash flow analysis and life expectancies (non-market observable inputs) Derivatives Synthetic life insurance policies 57.3 59.7Financial assets at fair value through profit and loss Physical life insurance policies 720.5 725.5Financial liabilities designated at fair value Synthetic life insurance policies (190.0) (190.3) Total 632.6 593.6
Annual Report 2018 | 169
The Group values certain financial instruments at fair value using models which rely on inputs to the models that are not based on observable market data (unobservable inputs). These financial instruments are classified as level 3. Below is a summary of the valuation techniques and unobservable inputs to the valuations of these level 3 financial instruments that significantly affect the value, and describe the interrelationship between observable inputs and how they affect the valuation.
(i) Life insurance policies
The Group uses a discounted cash flow valuation technique for the valuation of physical and synthetic life settlement policies and related financial instruments. The approach makes use of market observable and non-market observable inputs. See note 31 for further details.
(ii) Equities Equities comprise primarily the Groups holding in SIX Group for CHF 63.6 million (2017: CHF 40.8 million) and Aduno Group for CHF 13.5 million (2017: CHF 2.8 million).
The participation in SIX Group is based on a valuation using the expected net asset value of SIX Group at the end of December 2018 which the Group understands would be the basis for any sale or purchase between SIX Group shareholders. As SIX Group has not yet published its financial statements for 2018 at the time of preparing these consolidated financial statements, the Group has made an estimate of the net asset value. To determine the net asset value as of 31 December 2018, the Group estimated SIX Group year-end net profit. During 2018, SIX Group disposed of SIX Payment Services to Worldline in exchange for cash and listed shares in Worldline. As a result of this transaction, the valuation of SIX Group is derived partially from the quoted price of the Worldline shares. Primarily as a result of this transaction, the net asset value of SIX Group has increased materially and as a result the EFG International Group has recorded a gain of CHF 22.8 million (2017: CHF 3.1 million) as the asset is recorded at fair value through the profit and loss.
The sensitivity to the valuation of SIX Group is primarily linked to the changes in the share price of Worldline, and the gain/loss taken through profit and loss for a 10% higher and 10% lower Worldline share price would be CHF 3.5 million gain or CHF (3.5) million loss on this position classified as fair value through profit and loss.
The participation in Aduno Group is based on a valuation using the expected net asset value of Aduno Group at the end of December 2018. The net asset value of Aduno Group was reviewed in 2018 and as a result the EFG International Group has recorded a gain of CHF 10.7 million (2017: CHF 0) in the profit and loss as the asset is recorded at fair value through the profit and loss.
(iii) Put option over non-controlling interests – liability to purchase non-controlling interests
The put options of the minority shareholders of Asesores y Gestores Financieros SA give rise to a financial liability designated at fair value of CHF 38.0 million (2017: CHF 42.7 million) that corresponds to the estimated discounted repurchase amount.
The put options valuation methodology has been contractually agreed upon with the minority shareholders and is based on unobservable but objective accounting information related to the Continuing Valuation Methodology (“CVM”). The actual CVM calculated as of 31 December 2018 is sensitive to the profits of Asesores y Gestores Financieros SA. A 10% increase in profits would increase the value of the put options by CHF 4.7 million, resulting in a loss through the income statement as the liability is classified as a financial liability at fair value through profit and loss.
Put options held by non-controlling interests have valuations primarily based on contractual terms and depend on internal assumptions only to a limited extent and are classified as level 3.
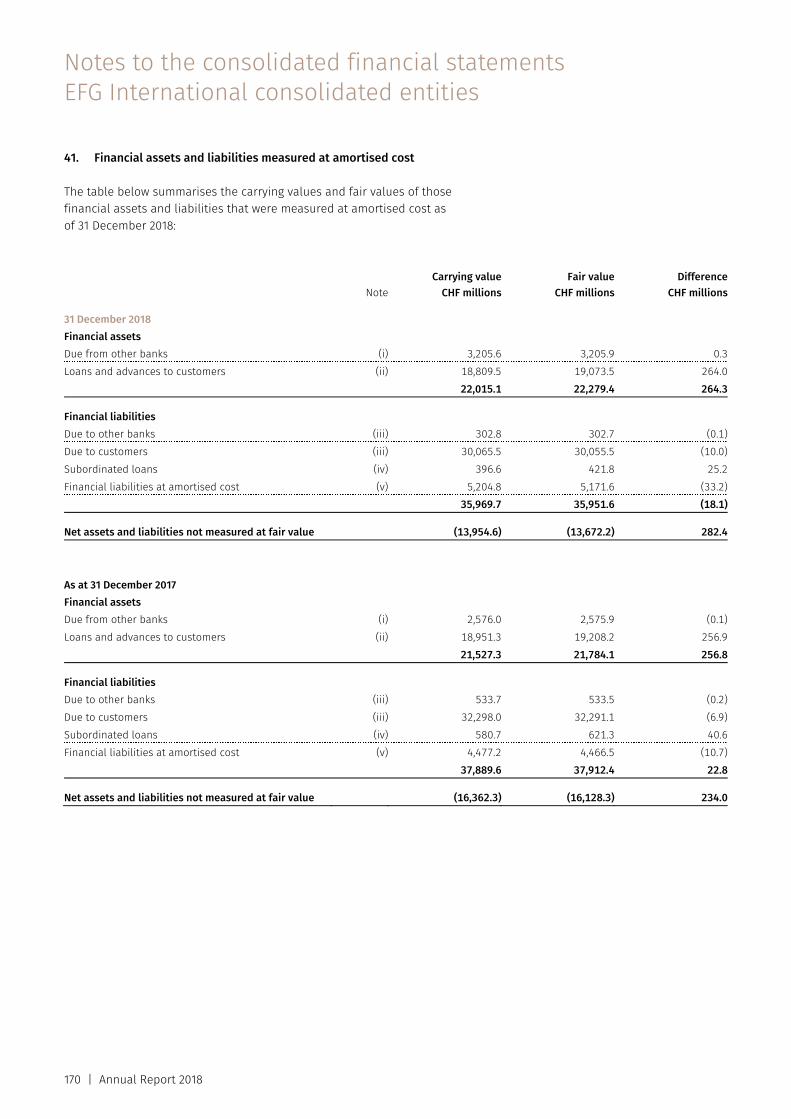
Notes to the consolidated financial statements EFG International consolidated entities
170 | Annual Report 2018
41. Financial assets and liabilities measured at amortised cost
The table below summarises the carrying values and fair values of those financial assets and liabilities that were measured at amortised cost as of 31 December 2018:
Note Carrying value
CHF millionsFair value
CHF millionsDifference
CHF millions 31 December 2018 Financial assets Due from other banks (i) 3,205.6 3,205.9 0.3Loans and advances to customers (ii) 18,809.5 19,073.5 264.0 22,015.1 22,279.4 264.3 Financial liabilities Due to other banks (iii) 302.8 302.7 (0.1)Due to customers (iii) 30,065.5 30,055.5 (10.0)Subordinated loans (iv) 396.6 421.8 25.2Financial liabilities at amortised cost (v) 5,204.8 5,171.6 (33.2) 35,969.7 35,951.6 (18.1) Net assets and liabilities not measured at fair value (13,954.6) (13,672.2) 282.4 As at 31 December 2017 Financial assets Due from other banks (i) 2,576.0 2,575.9 (0.1)Loans and advances to customers (ii) 18,951.3 19,208.2 256.9 21,527.3 21,784.1 256.8 Financial liabilities Due to other banks (iii) 533.7 533.5 (0.2)Due to customers (iii) 32,298.0 32,291.1 (6.9)Subordinated loans (iv) 580.7 621.3 40.6Financial liabilities at amortised cost (v) 4,477.2 4,466.5 (10.7) 37,889.6 37,912.4 22.8 Net assets and liabilities not measured at fair value (16,362.3) (16,128.3) 234.0
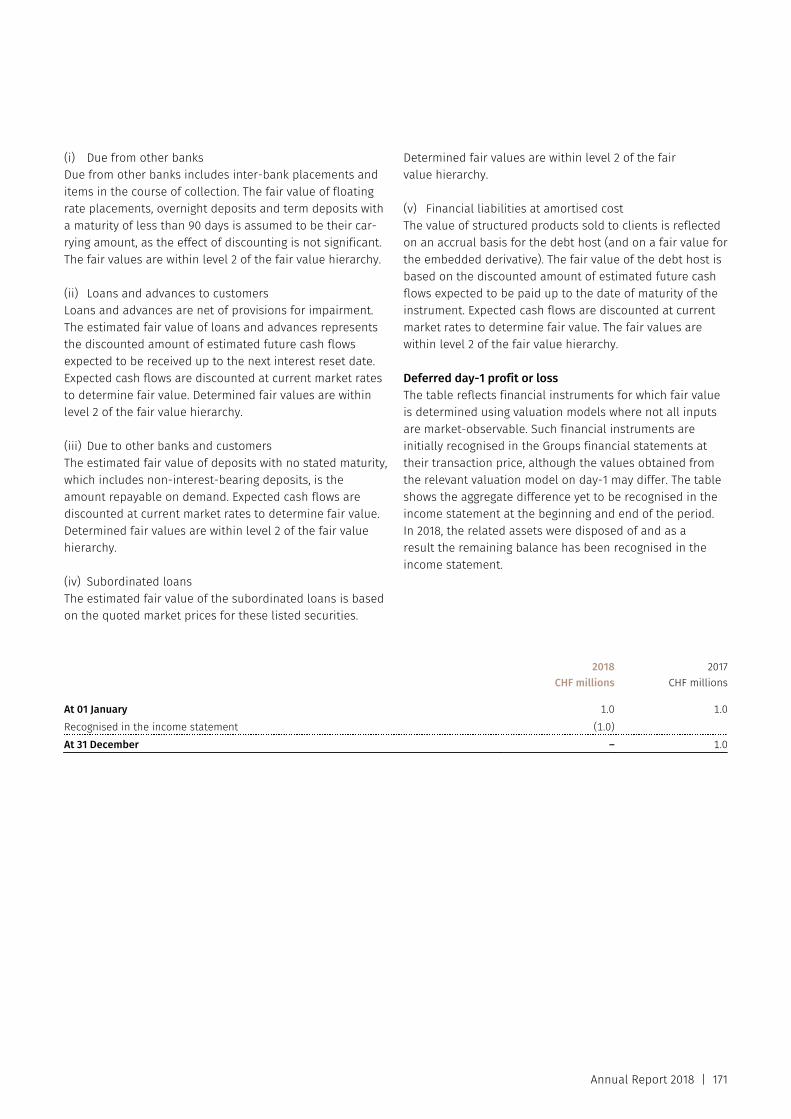
Annual Report 2018 | 171
(i) Due from other banks Due from other banks includes inter-bank placements and items in the course of collection. The fair value of floating rate placements, overnight deposits and term deposits with a maturity of less than 90 days is assumed to be their car-rying amount, as the effect of discounting is not significant. The fair values are within level 2 of the fair value hierarchy.
(ii) Loans and advances to customers Loans and advances are net of provisions for impairment. The estimated fair value of loans and advances represents the discounted amount of estimated future cash flows expected to be received up to the next interest reset date. Expected cash flows are discounted at current market rates to determine fair value. Determined fair values are within level 2 of the fair value hierarchy.
(iii) Due to other banks and customers The estimated fair value of deposits with no stated maturity, which includes non-interest-bearing deposits, is the amount repayable on demand. Expected cash flows are discounted at current market rates to determine fair value. Determined fair values are within level 2 of the fair value hierarchy.
(iv) Subordinated loans The estimated fair value of the subordinated loans is based on the quoted market prices for these listed securities.
Determined fair values are within level 2 of the fair value hierarchy.
(v) Financial liabilities at amortised cost The value of structured products sold to clients is reflected on an accrual basis for the debt host (and on a fair value for the embedded derivative). The fair value of the debt host is based on the discounted amount of estimated future cash flows expected to be paid up to the date of maturity of the instrument. Expected cash flows are discounted at current market rates to determine fair value. The fair values are within level 2 of the fair value hierarchy.
Deferred day-1 profit or loss The table reflects financial instruments for which fair value is determined using valuation models where not all inputs are market-observable. Such financial instruments are initially recognised in the Groups financial statements at their transaction price, although the values obtained from the relevant valuation model on day-1 may differ. The table shows the aggregate difference yet to be recognised in the income statement at the beginning and end of the period. In 2018, the related assets were disposed of and as a result the remaining balance has been recognised in the income statement.
2018
CHF millions2017
CHF millions At 01 January 1.0 1.0Recognised in the income statement (1.0)At 31 December – 1.0
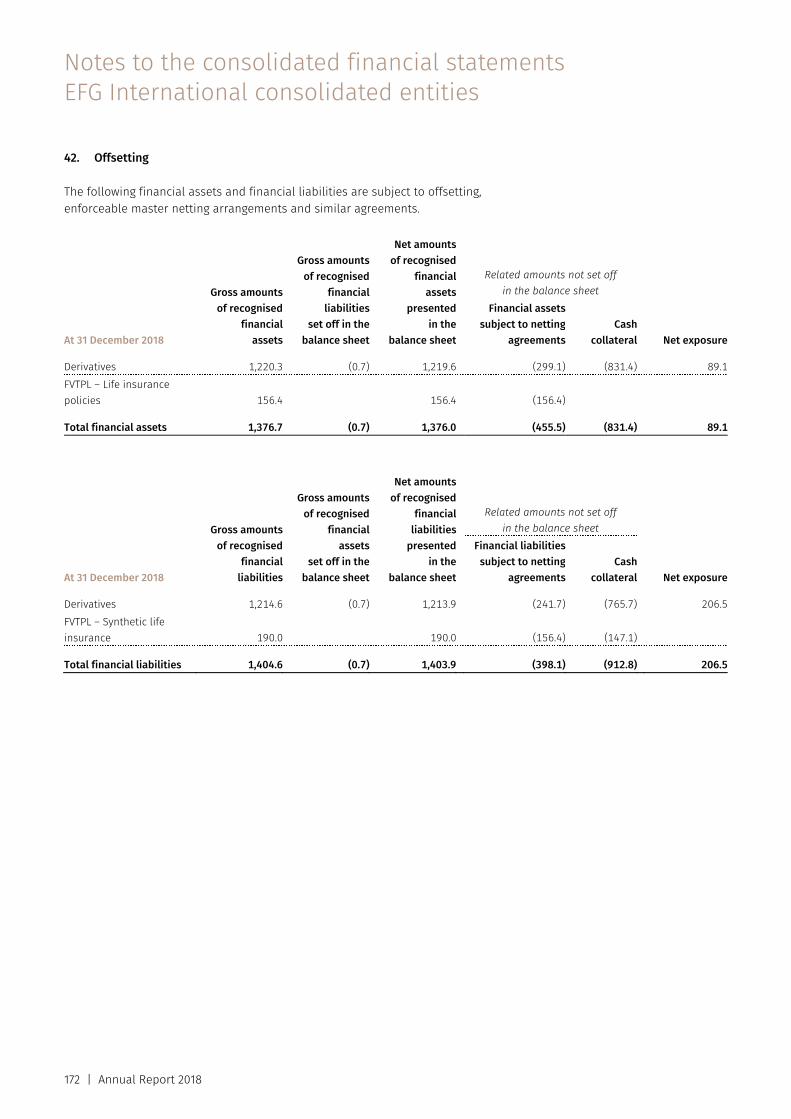
Notes to the consolidated financial statements EFG International consolidated entities
172 | Annual Report 2018
42. Offsetting
The following financial assets and financial liabilities are subject to offsetting, enforceable master netting arrangements and similar agreements.
Gross amountsof recognised
financialassets
Gross amountsof recognised
financialliabilities
set off in thebalance sheet
Net amountsof recognised
financialassets
presentedin the
balance sheet
Related amounts not set off in the balance sheet
At 31 December 2018
Financial assetssubject to netting
agreementsCash
collateral Net exposure Derivatives 1,220.3 (0.7) 1,219.6 (299.1) (831.4) 89.1 FVTPL – Life insurance policies 156.4 156.4 (156.4) Total financial assets 1,376.7 (0.7) 1,376.0 (455.5) (831.4) 89.1
Gross amountsof recognised
financialliabilities
Gross amountsof recognised
financialassets
set off in thebalance sheet
Net amountsof recognised
financialliabilities
presentedin the
balance sheet
Related amounts not set off in the balance sheet
At 31 December 2018
Financial liabilitiessubject to netting
agreementsCash
collateral Net exposure Derivatives 1,214.6 (0.7) 1,213.9 (241.7) (765.7) 206.5 FVTPL – Synthetic life insurance 190.0 190.0 (156.4) (147.1) Total financial liabilities 1,404.6 (0.7) 1,403.9 (398.1) (912.8) 206.5

Annual Report 2018 | 173
Gross amountsof recognised
financialassets
Gross amountsof recognised
financialliabilities
set off in thebalance sheet
Net amountsof recognised
financialassets
presentedin the
balance sheet
Related amounts not set off in the balance sheet
At 31 December 2017
Financial assetssubject to netting
agreementsCash
collateral Net exposure Derivatives 725.6 (29.5) 696.1 (196.9) (330.5) 168.7 FVTPL – Life insurance policies 150.3 150.3 (150.3) Total financial assets 875.9 (29.5) 846.4 (347.2) (330.5) 168.7
Gross amountsof recognised
financialassets
Gross amountsof recognised
financialliabilities
set off in thebalance sheet
Net amountsof recognised
financialassets
presentedin the
balance sheet
Related amounts not set off in the balance sheet
At 31 December 2017
Financial liabilitiessubject to netting
agreementsCash
collateral Net exposure Derivatives 676.4 (29.5) 646.9 (196.9) (129.5) 320.5 FVTPL – Synthetic life insurance 190.3 190.3 (150.3) (159.0) Total financial liabilities 866.7 (29.5) 837.2 (347.2) (288.5) 320.5 At the end of December 2018, derivative financial instruments valued at CHF 0.7 million (2017: CHF 29.5 million) have been netted with derivative financial instruments with a negative value of CHF 6.4 million (2017: CHF 29.3 million) for a net presentation of derivative financial instruments as a liability with a value of CHF 5.7 million (2017: asset of CHF 0.1 million).
For the financial assets and liabilities subject to enforceable master netting arrangements or similar arrangements above, each agreement between the Group and the counterparty allows for the net settlement of the relevant financial assets and liabilities when both elect to settle on a net basis. In the absence of such an election, financial assets and liabilities will be settled on a gross basis, however, each party to the master netting agreement or similar agreement will have the option to settle all such amounts on a net basis in the event of default of the other party. Per the terms of each agreement, an event of default includes failure by a party to make payment when due; failure by a party to perform any obligation required by the agreement (other than payment) if such failure is not remedied within periods of 30 to 60 days after notice of such failure is given to the party; or bankruptcy.
43. Business combinations
i) BSI Group On 31 October 2016, EFG International Group acquired 100% of the share capital of BSI Holdings AG (BSI Group). In 2017, the final purchase price was determined and the acquisition accounting finalised. As part of the acquisition, the EFG International Group became a party in certain legal matters. Details of these matters are included in the contingent liabilities note (see note 50). Certain of these contingent liabilities are subject to indemnification from the seller, however, as at 31 December 2017 and 2018, there are no indemnification assets (nor provisions for the potential liabilities, as the amounts cannot yet be estimated). EFG International Group has agreed indemnities with the seller up to the final purchase consideration for breaches of warranties and indemnity matters regarding certain legal and regulatory matters.
EFG International Group has filed indemnification claims for all relevant BSI Group legal proceedings and circumstances known and identified to date. These proceedings are ongoing and any potential financial liabilities subject to indemnification by BTG remains uncertain.
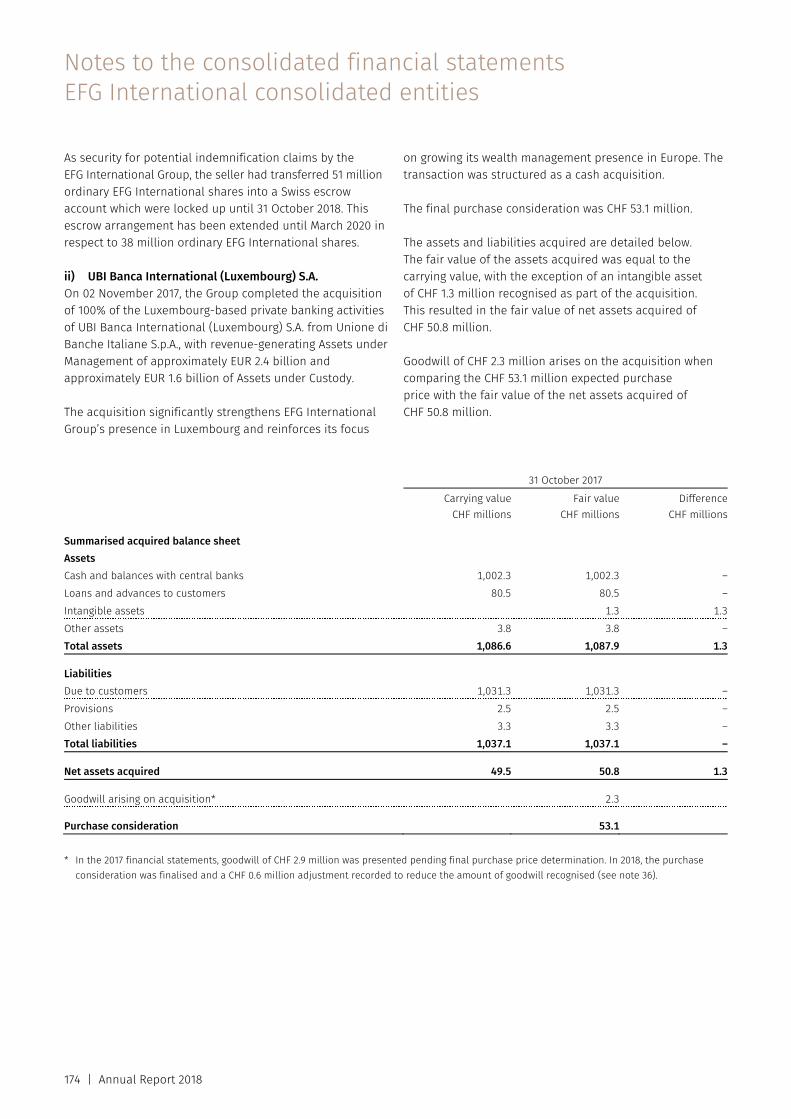
Notes to the consolidated financial statements EFG International consolidated entities
174 | Annual Report 2018
As security for potential indemnification claims by the EFG International Group, the seller had transferred 51 million ordinary EFG International shares into a Swiss escrow account which were locked up until 31 October 2018. This escrow arrangement has been extended until March 2020 in respect to 38 million ordinary EFG International shares.
ii) UBI Banca International (Luxembourg) S.A. On 02 November 2017, the Group completed the acquisition of 100% of the Luxembourg-based private banking activities of UBI Banca International (Luxembourg) S.A. from Unione di Banche Italiane S.p.A., with revenue-generating Assets under Management of approximately EUR 2.4 billion and approximately EUR 1.6 billion of Assets under Custody.
The acquisition significantly strengthens EFG International Group’s presence in Luxembourg and reinforces its focus
on growing its wealth management presence in Europe. The transaction was structured as a cash acquisition.
The final purchase consideration was CHF 53.1 million.
The assets and liabilities acquired are detailed below. The fair value of the assets acquired was equal to the carrying value, with the exception of an intangible asset of CHF 1.3 million recognised as part of the acquisition. This resulted in the fair value of net assets acquired of CHF 50.8 million.
Goodwill of CHF 2.3 million arises on the acquisition when comparing the CHF 53.1 million expected purchase price with the fair value of the net assets acquired of CHF 50.8 million.
31 October 2017
Carrying value
CHF millionsFair value
CHF millionsDifference
CHF millions Summarised acquired balance sheet Assets Cash and balances with central banks 1,002.3 1,002.3 –Loans and advances to customers 80.5 80.5 –Intangible assets 1.3 1.3Other assets 3.8 3.8 –Total assets 1,086.6 1,087.9 1.3 Liabilities Due to customers 1,031.3 1,031.3 –Provisions 2.5 2.5 –Other liabilities 3.3 3.3 –Total liabilities 1,037.1 1,037.1 – Net assets acquired 49.5 50.8 1.3 Goodwill arising on acquisition* 2.3 Purchase consideration 53.1 * In the 2017 financial statements, goodwill of CHF 2.9 million was presented pending final purchase price determination. In 2018, the purchase
consideration was finalised and a CHF 0.6 million adjustment recorded to reduce the amount of goodwill recognised (see note 36).
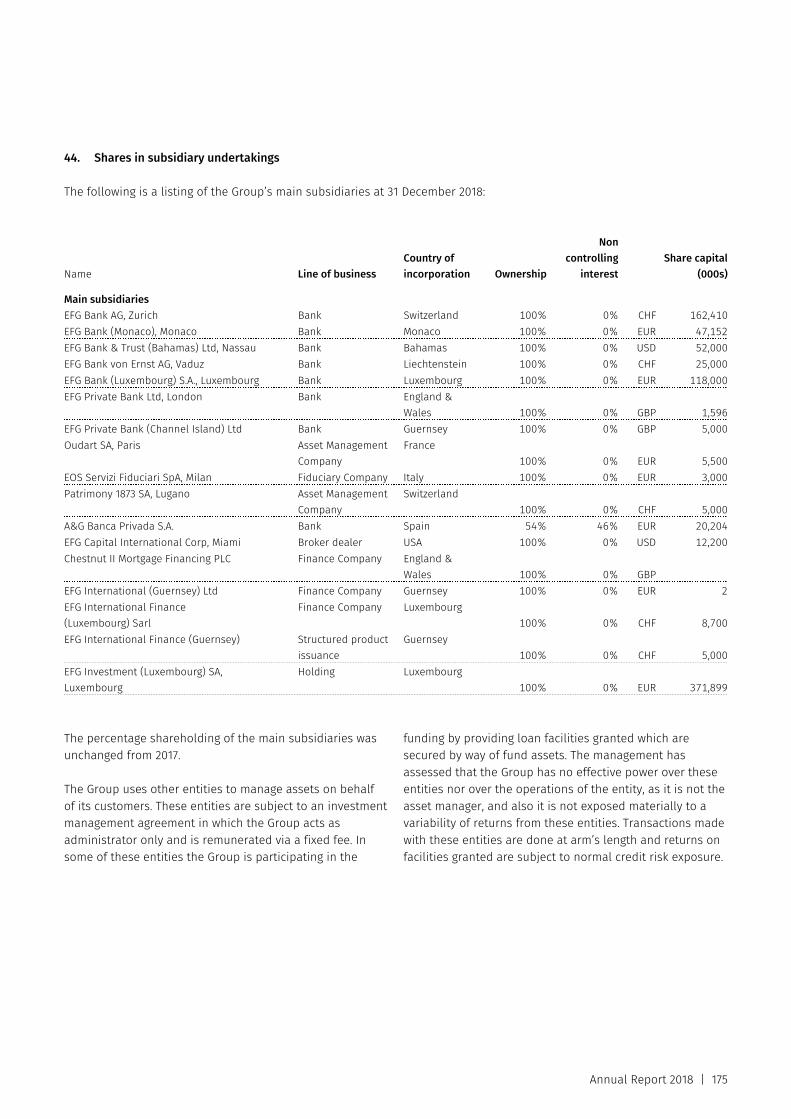
Annual Report 2018 | 175
44. Shares in subsidiary undertakings
The following is a listing of the Group’s main subsidiaries at 31 December 2018:
Name Line of business Country of incorporation Ownership
Noncontrolling
interestShare capital
(000s) Main subsidiaries EFG Bank AG, Zurich Bank Switzerland 100% 0% CHF 162,410EFG Bank (Monaco), Monaco Bank Monaco 100% 0% EUR 47,152EFG Bank & Trust (Bahamas) Ltd, Nassau Bank Bahamas 100% 0% USD 52,000EFG Bank von Ernst AG, Vaduz Bank Liechtenstein 100% 0% CHF 25,000EFG Bank (Luxembourg) S.A., Luxembourg Bank Luxembourg 100% 0% EUR 118,000EFG Private Bank Ltd, London Bank England &
Wales 100% 0% GBP 1,596EFG Private Bank (Channel Island) Ltd Bank Guernsey 100% 0% GBP 5,000Oudart SA, Paris Asset Management
Company France
100% 0% EUR 5,500EOS Servizi Fiduciari SpA, Milan Fiduciary Company Italy 100% 0% EUR 3,000Patrimony 1873 SA, Lugano Asset Management
Company Switzerland
100% 0% CHF 5,000A&G Banca Privada S.A. Bank Spain 54% 46% EUR 20,204EFG Capital International Corp, Miami Broker dealer USA 100% 0% USD 12,200Chestnut II Mortgage Financing PLC Finance Company England &
Wales 100% 0% GBPEFG International (Guernsey) Ltd Finance Company Guernsey 100% 0% EUR 2EFG International Finance (Luxembourg) Sarl
Finance Company Luxembourg 100% 0% CHF 8,700
EFG International Finance (Guernsey) Structured product issuance
Guernsey 100% 0% CHF 5,000
EFG Investment (Luxembourg) SA, Luxembourg
Holding Luxembourg 100% 0% EUR 371,899
The percentage shareholding of the main subsidiaries was unchanged from 2017.
The Group uses other entities to manage assets on behalf of its customers. These entities are subject to an investment management agreement in which the Group acts as administrator only and is remunerated via a fixed fee. In some of these entities the Group is participating in the
funding by providing loan facilities granted which are secured by way of fund assets. The management has assessed that the Group has no effective power over these entities nor over the operations of the entity, as it is not the asset manager, and also it is not exposed materially to a variability of returns from these entities. Transactions made with these entities are done at arm’s length and returns on facilities granted are subject to normal credit risk exposure.
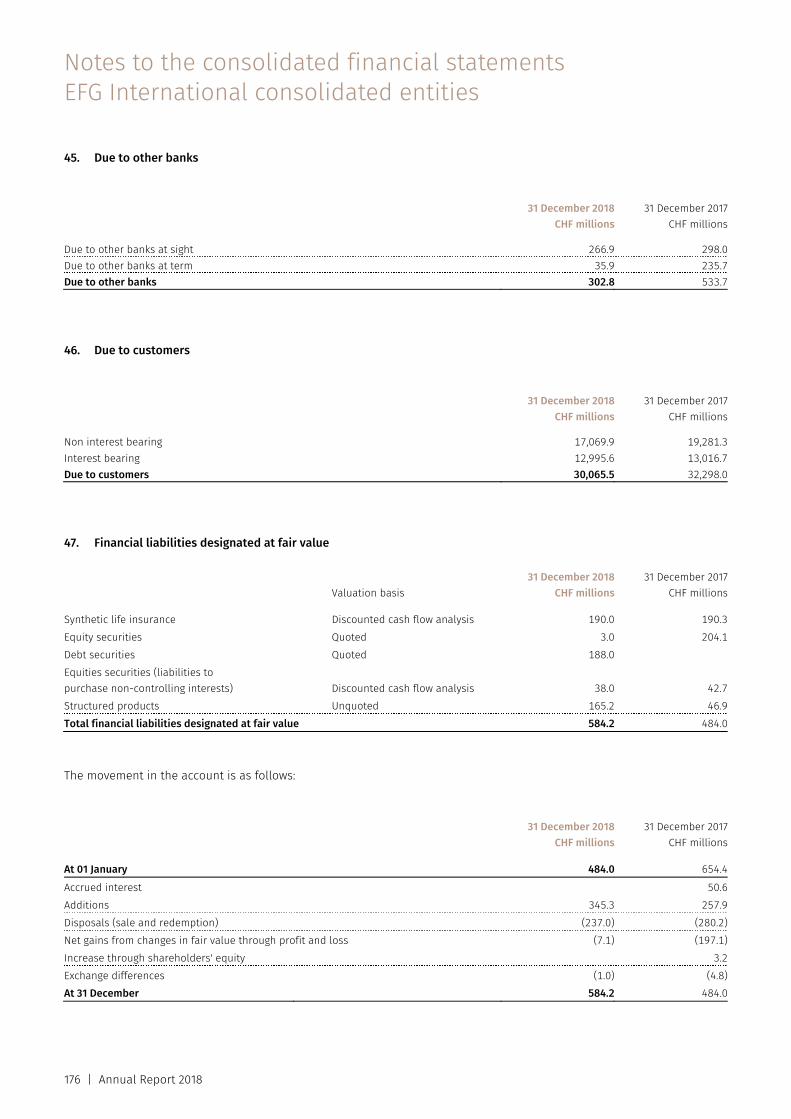
Notes to the consolidated financial statements EFG International consolidated entities
176 | Annual Report 2018
45. Due to other banks
31 December 2018
CHF millions31 December 2017
CHF millions Due to other banks at sight 266.9 298.0Due to other banks at term 35.9 235.7Due to other banks 302.8 533.7
46. Due to customers
31 December 2018
CHF millions31 December 2017
CHF millions Non interest bearing 17,069.9 19,281.3Interest bearing 12,995.6 13,016.7Due to customers 30,065.5 32,298.0
47. Financial liabilities designated at fair value
Valuation basis 31 December 2018
CHF millions31 December 2017
CHF millions Synthetic life insurance Discounted cash flow analysis 190.0 190.3Equity securities Quoted 3.0 204.1Debt securities Quoted 188.0Equities securities (liabilities to purchase non-controlling interests) Discounted cash flow analysis 38.0 42.7Structured products Unquoted 165.2 46.9Total financial liabilities designated at fair value 584.2 484.0
The movement in the account is as follows:
31 December 2018
CHF millions31 December 2017
CHF millions At 01 January 484.0 654.4Accrued interest 50.6Additions 345.3 257.9Disposals (sale and redemption) (237.0) (280.2)Net gains from changes in fair value through profit and loss (7.1) (197.1)Increase through shareholders' equity 3.2Exchange differences (1.0) (4.8)At 31 December 584.2 484.0
Annual Report 2018 | 177
Synthetic life insurance The synthetic life insurance liability relates to a structured transaction. See note 31 for further details.
Liability to purchase non-controlling shareholders interests The non-controlling shareholders of Asesores y Gestores Financieros SA have the right to sell their shares to a wholly
owned subsidiary of EFG International AG. This right applied from 01 January 2010 and that right expires on the occurrence of potential future events. According to IAS 32, these put options give rise to a financial liability that corresponds to the discounted repurchase amount. As of 31 December 2018, the financial liability was valued at CHF 38.0 million (2017: CHF 42.7 million).
48. Financial liabilities at amortised cost
31 December 2018
CHF millions31 December 2017
CHF millions Structured products issued 5,204.8 4,477.2Total financial liabilities at amortised cost 5,204.8 4,477.2 The movement in the account is as follows:
31 December 2018
CHF millions31 December 2017
CHF millions At 01 January 4,477.2 3,828.5
Additions 6,842.0 6,919.7Disposals (sale and redemptions) (5,776.5) (6,089.0)Net gains from changes in fair value (337.9) (182.0)At 31 December 5,204.8 4,477.2
Notes to the consolidated financial statements EFG International consolidated entities
178 | Annual Report 2018
49. Provisions
Provision for credit
default risks
Provision forlitigation risks
CHF millions
Provision for restructuring CHF millions
Other provisionsCHF millions
TotalCHF millions
At 01 January 2017 4.1 44.2 1.4 153.7 203.4 Increase in provisions recognised in the income statement – Loss allowance 0.4 0.4 Increase in provisions recognised in the income statement 11.7 5.1 4.4 21.2 Release of provisions recognised in the income statement (17.7) (17.7)Provisions used during the year (6.9) (4.8) (1.5) (13.2)Exchange differences 0.1 0.1 4.6 4.8 At 31 December 2017 4.5 49.1 1.8 143.5 198.9 At 01 January 2018 4.5 49.1 1.8 143.5 198.9 Decrease in provisions recognised in the income statement – Loss allowance (1.8) (1.8)Increase in provisions recognised in the income statement 13.0 3.4 8.4 24.8 Release of provisions recognised in the income statement (20.2) (1.3) (19.1) (40.6)Provisions used during the year (17.5) (0.2) (26.9) (44.6)Exchange differences 0.1 (0.1) (0.1) (1.0) (1.1)At 31 December 2018 2.8 24.3 3.6 104.9 135.6 Expected payment within 12 months 11.0 3.6 9.9 24.5 Expected payment thereafter 2.8 13.3 95.0 111.1 2.8 24.3 3.6 104.9 135.6 Provision for credit default risks This relates to the expected credit losses under IFRS 9. The Group calculates expected credit losses on off-balance sheet positions primarily related to guarantees. These losses are not expected to arise in the next 12 months. The profit and loss impact is reflected in the loss allowance expense (while for all other provision movements above, the profit and loss impact is reflected in the provision expense line of the profit and loss). Provision for litigation risks The Group is involved in various legal and arbitration proceedings in the normal course of its business operations. The Group establishes provisions for current and pending legal proceedings if management is of the opinion that the Group is more likely than not to face
payments or losses and if the amount of such payments or losses can be reliably estimated.
A provision of CHF 6.0 million (2017: CHF 3.0 million) relates to several client claims, following the discovery of irregularities in the management of clients’ accounts by a former employee. The overall position is unlikely to be resolved within a year.
A provision of CHF 4.9 million (2017: CHF 1.2 million) relates to a client who claims to have suffered significant losses due to the Group having invested his assets in highly speculative investments without instruction. The Group denies liability. The Group received an unexpected negative first instance judgement in 2018, against which the Group is vigorously appealing. The overall position is unlikely to be resolved within a year.
Annual Report 2018 | 179
The Group is defending against a civil claim by a client who alleges that due to a breach of duties in providing investment management services by the Group, he suffered losses on one of his accounts ranging from USD 2 million to USD 11 million. While the Group is vigorously defending the case and believes it has strong defences to the claims, a provision of CHF 2.7 million has been made. The overall position is unlikely to be resolved within a year.
Other provisions of CHF 10.7 million remain for various small litigation cases which are expected to be settled within a year.
Provision for restructuring During the year EFG International Group continued the integration of the BSI Group businesses acquired. In certain locations where EFG International Group and the former BSI Group have a booking centre, the operations are being integrated. As a result, certain announced restructurings are taking place to integrate two businesses in one location and EFG International Group has provisions of CHF 3.6 million related to these announced restructurings. These are expected to be settled within a year.
Other provisions The BSI Group took a provision of CHF 95.0 million for disgorgement of profits levied by FINMA on the BSI Group with regard to the investigations into 1MDB, arising from activities that occurred between 2011 and April 2015. The former BSI Group appealed FINMAs decision prior to the acquisition and suspended the payment of the disgorgement of profits. With the acquisition of the BSI Group, the provision was maintained for the existing amount of CHF 95.0 million. The overall position is unlikely to be resolved within a year.
A provision of CHF 5.2 million (2017: CHF 0) has been created, where initial analysis indicates that there may have been fraudulent activity by an ex-CRO. An internal investigation has discovered several possible frauds resulting in the possibility of client claims against the Group. Proceedings and investigations are ongoing. In addition, the Group has been made aware that additional claims of approximately CHF 14.5 million may arise, against which the Group is not able to assess the potential loss (see contingent liabilities). The Group is assessing the legal and factual merits of all these claims. The overall position is likely to be resolved within a year.
Other provisions of CHF 4.7 million remain for various other potential cash outflows which are expected to be settled within a year.
50. Contingent liabilities
EFG International Group is involved in various legal and arbitration proceedings in the normal course of its business operations. The Group establishes provisions (see note 49) for current and threatened pending legal proceedings if management is of the opinion that the Group is more likely than not to face payments or losses and if the amount of such payments or losses can be reliably estimated.
The Group has differentiated the contingent liabilities into three categories as follows:
a) Group does not expect a material cash outflow b) Group cannot reliably measure the obligation c) Group cannot reliably measure the obligation, however
any obligation arising would be offset by indemnification received
(a) Group does not expect a material cash outflow The following contingent liabilities that management is aware of relate to legal proceedings which could have a material effect on the Group. However, based on presently available information and assessments, the Group currently does not expect that any of these contingent liabilities will result in material provisions or other liabilities.
The Group is engaged in certain litigation proceedings mentioned below and is vigorously defending the cases. The Group believes it has strong defences to the claims. The Group does not expect the ultimate resolution of any of the below mentioned proceedings to which the Group is party to have a significantly adverse effect on its financial position.
i) Several entities in EFG International Group have been named as defendants in lawsuits by the liquidators of Fairfield Sentry Ltd. and Fairfield Sigma Ltd. in the US Bankruptcy Court for the Southern District of New York and in the High Court of Justice of the British Virgin Islands, asserting that redemption payments received by the Group entities on behalf of clients should be returned to Fairfield Sentry Ltd. and Fairfield Sigma Ltd. The amount claimed is uncertain, but the Group believes the amount claimed is approximately USD 217 million. After dismissal of the British Virgin Islands lawsuits in 2017, several New York claims were additionally dismissed in 2018. The Group maintains its vigorous defence of the remaining lawsuits and believes itself to have strong defences to the claims.
ii) The Trustee of Bernard L Madoff Investment Securities LLC (BLMIS) has filed a complaint in the US Bankruptcy
Notes to the consolidated financial statements EFG International consolidated entities
180 | Annual Report 2018
Court for the Southern District of New York (SDNY) asserting that redemption payments totalling USD 411 million allegedly received by certain Group entities on behalf of clients through Fairfield and Kingate feeder funds should be returned to BLMIS. This action includes the redemptions claimed by the Fairfield liquidators (see previous paragraph). The Group entities are vigorously defending the cases and believe they have strong defences to the claims. The Group entities have obtained a complete dismissal of the Madoff action in the SDNY, and BLMIS’s appeal is now proceeding before the Second Court of Appeals.
iii) The Group is engaged in litigation proceedings initiated by a client claiming that he has been misled insofar as he thought that his investments were capital protected, that the agreed investment strategy has not been followed and that unauthorised transactions were performed. The amount claimed is approximately EUR 49 million plus interest. The Group is vigorously defending the cases and believes it has strong defences to the claims.
iv) Various claims have been made against the Group in several jurisdictions for approximately USD 28 million, which the Group is vigorously defending. These proceedings relate to alleged mismanagement practices by a party unrelated to the Group, who was a former investment manager of a fund for which the Group acted as the administrator and custodian. In addition, the Group is being sued by the investors in the fund and the fund itself for approximately USD 9 million on the grounds of various alleged breaches. In response, the Group has filed a claim against the investment manager. The Group strongly believes that there has been no wrongdoing on its part and that it has strong defences to the claims.
v) The Group has been named as a co-defendant in litigation brought against certain individuals who have allegedly diverted approximately CAD 127 million from their employer for their own benefit. The plaintiffs allege that an employee of the Group acted on behalf of the alleged fraudsters and executed numerous potentially fraudulent transactions while being fully aware of the wrong doings, and by doing so participated in causing damage to the plaintiffs. The plaintiffs also claim approximately CAD 13 million as compensation for incurred for reputational damage. The Group is vigorously defending the case and believes it has strong defences to the claims.
vi) The liquidator of an investment company has brought a claim against the Group in the Commercial Court of Paris. The liquidator alleges that the Group is liable for processing a specific transfer of USD 50 million. A first
judgement was favourable to the Group, and the liquidator appealed. The Group is vigorously defending the claim and believes it has strong defences to the claim.
vii) An Irish family (not a client of the Group) sued several unrelated defendants in 2017, claiming they refused to return monies in the amount of EUR 6.9 million. In February 2018, the Group and several other parties were joined to these primary proceedings as a third party by one of the defendants. The allegation seems to be misrepresentation, negligent misstatement, breach of duty, negligence and unjust enrichment. The Group is vigorously defending against these claims and believes it has strong defences to the claims.
(b) Group cannot reliably measure the obligation The following contingent liabilities that management is aware of, could have a material effect on the Group. However, based on presently available information and assessments, the Group is not able to reliably measure the possible obligation. i) In 2016, the Group had two accounts in the name of an
institutional client. This institutional client was designated by the Office of Foreign Assets Control ("OFAC") of the US Department of the Treasury as Specially Designated Nationals on account of assisting drug trafficking groups in money laundering. It is alleged that the Group violated OFAC sanctions after the clients OFAC designation because of subsequent transactions and interactions between US persons at the Group and the institutional client. The Group promptly initiated an internal investigation (which is ongoing) and is actively cooperating with OFAC on the matter.
ii) The Group has launched an investigation into possible fraudulent activities by a former employee. Certain claims have been provided for (see provisions note 49), whilst investigations are ongoing related to additional potential claims of approximately CHF 14.5 million. The Group is assessing the legal and factual merits of these claims, however currently there is no reliable estimate of the potential loss on these potential claims.
(c) Group cannot reliably measure the obligation, however
any obligation arising would be offset by indemnification received
The following contingent liabilities (that arose through the acquisition of BSI) that management is aware of, could have a material effect on the Group. However, based on presently available information and assessments, the Group is not able reliably to measure the possible obligation. The Group is entitled to indemnification against losses that may arise
Annual Report 2018 | 181
from these matters listed below from the seller of the former BSI Group (see note 43). i) The US Department of Justice (DoJ) and the Office of the
Attorney General in Switzerland are currently conducting criminal investigations into money-laundering allegations involving 1Malaysia Development Berhad (1MDB), a sovereign wealth fund owned by the government of Malaysia. Certain 1MDB-related accounts were opened and maintained by the BSI Group pre-acquisition by the EFG International Group, and are currently under review. DoJ has issued requests for assistance to the Swiss authorities in obtaining information on some of the 1MDB-related accounts. The US and Swiss authorities are also investigating whether the Group complied with their anti-money laundering obligations in connection with the 1MDB-related accounts. The Group is cooperating fully with the Swiss and US authorities in these ongoing investigations.
ii) The BSI Group participated in Category 2 of the DoJ Program for Swiss Banks and entered into a Non-Prosecution Agreement ("NPA") with DoJ in March 2015 in connection with its US cross-border business. The NPA runs for a term of four years and obliges the Group to provide cooperation to DoJ in connection with the underlying conduct and accounts for the duration of that term. The Group has been providing additional information, documents, and data in response to DoJ's post-NPA requests. DoJ also requested the Group to provide detailed background and explanations for 76 US related accounts that were not identified until after the execution of the NPA. The Group will continue its ongoing cooperation with DoJ, including by timely responding to DoJs ongoing requests, as well as monitoring any areas where the Group may face potential additional exposure.
iii) In 2015, the US Attorney’s Office for the Eastern District of New York and the Office of the Attorney General in Switzerland initiated criminal investigations into bribery and money laundering allegations involving officials of Fédération Internationale de Football Association (FIFA) and its member associations and related parties. Certain FIFA-related accounts were opened and maintained by
the Group and they are currently under review. The US Department of Justice has issued requests for assistance to the Swiss authorities in obtaining information for some of the FIFA-related accounts. The US and Swiss authorities are also investigating whether the Group complied with their anti-money laundering obligations in connection with the FIFA-related accounts. The Group is cooperating fully with the US authorities in the ongoing investigations.
iv) The Group (through the acquisition of BSI) was the counterparty in a shareholder agreement, where the Group sold their holding in a company that was also a supplier of services to the Group. The buyer of the shareholding has brought a claim for losses of CHF 90 million allegedly suffered as a result of the Group terminating its contract with that supplier. The Group is vigorously defending against the claim and believes it has strong defences to the claim.
v) A client has brought legal claims against the Group for CHF 54 million in purported actual and consequential damages, alleging that the Group did not manage the account in accordance with the mandate. The Group is vigorously defending against these claims and believes it has strong defences to the claims.
vi) EFG International Group (through the acquisition of BSI) is the defendant in two civil proceedings pending before the Court of Torre Annunziata, arising from its role as a trustee of certain trusts associated with three families who owned an Italian shipping company which was declared bankrupt in 2012, allegedly causing aggregate losses to approximately 13,000 bondholders through the issuance of approximately EUR 1 billion of bonds that did not comply with applicable laws. In 2014, members of the families involved were convicted for embezzlement and fraud in Italy. The claimants in the civil proceedings claim that the Group was aware of the embezzlement scheme and the Group, in its capacity as trustee of these trusts, would be liable for damages and disgorgement of assets and profits should it be found to have committed any wrongdoing. The Group is vigorously defending and believes it has strong defences to the claims.
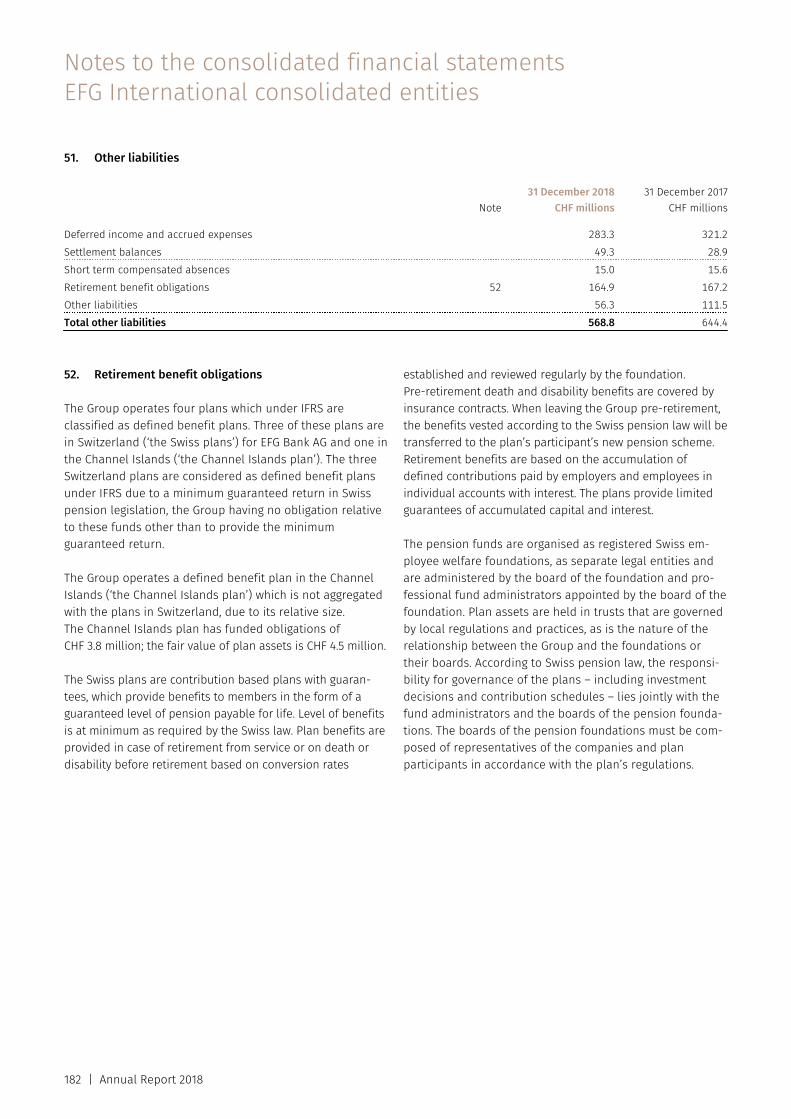
Notes to the consolidated financial statements EFG International consolidated entities
182 | Annual Report 2018
51. Other liabilities
Note31 December 2018
CHF millions31 December 2017
CHF millions Deferred income and accrued expenses 283.3 321.2Settlement balances 49.3 28.9Short term compensated absences 15.0 15.6Retirement benefit obligations 52 164.9 167.2Other liabilities 56.3 111.5Total other liabilities 568.8 644.4
52. Retirement benefit obligations
The Group operates four plans which under IFRS are classified as defined benefit plans. Three of these plans are in Switzerland (‘the Swiss plans’) for EFG Bank AG and one in the Channel Islands (‘the Channel Islands plan’). The three Switzerland plans are considered as defined benefit plans under IFRS due to a minimum guaranteed return in Swiss pension legislation, the Group having no obligation relative to these funds other than to provide the minimum guaranteed return.
The Group operates a defined benefit plan in the Channel Islands (‘the Channel Islands plan’) which is not aggregated with the plans in Switzerland, due to its relative size. The Channel Islands plan has funded obligations of CHF 3.8 million; the fair value of plan assets is CHF 4.5 million.
The Swiss plans are contribution based plans with guaran-tees, which provide benefits to members in the form of a guaranteed level of pension payable for life. Level of benefits is at minimum as required by the Swiss law. Plan benefits are provided in case of retirement from service or on death or disability before retirement based on conversion rates
established and reviewed regularly by the foundation. Pre-retirement death and disability benefits are covered by insurance contracts. When leaving the Group pre-retirement, the benefits vested according to the Swiss pension law will be transferred to the plan’s participant’s new pension scheme. Retirement benefits are based on the accumulation of defined contributions paid by employers and employees in individual accounts with interest. The plans provide limited guarantees of accumulated capital and interest.
The pension funds are organised as registered Swiss em-ployee welfare foundations, as separate legal entities and are administered by the board of the foundation and pro-fessional fund administrators appointed by the board of the foundation. Plan assets are held in trusts that are governed by local regulations and practices, as is the nature of the relationship between the Group and the foundations or their boards. According to Swiss pension law, the responsi-bility for governance of the plans – including investment decisions and contribution schedules – lies jointly with the fund administrators and the boards of the pension founda-tions. The boards of the pension foundations must be com-posed of representatives of the companies and plan participants in accordance with the plan’s regulations.
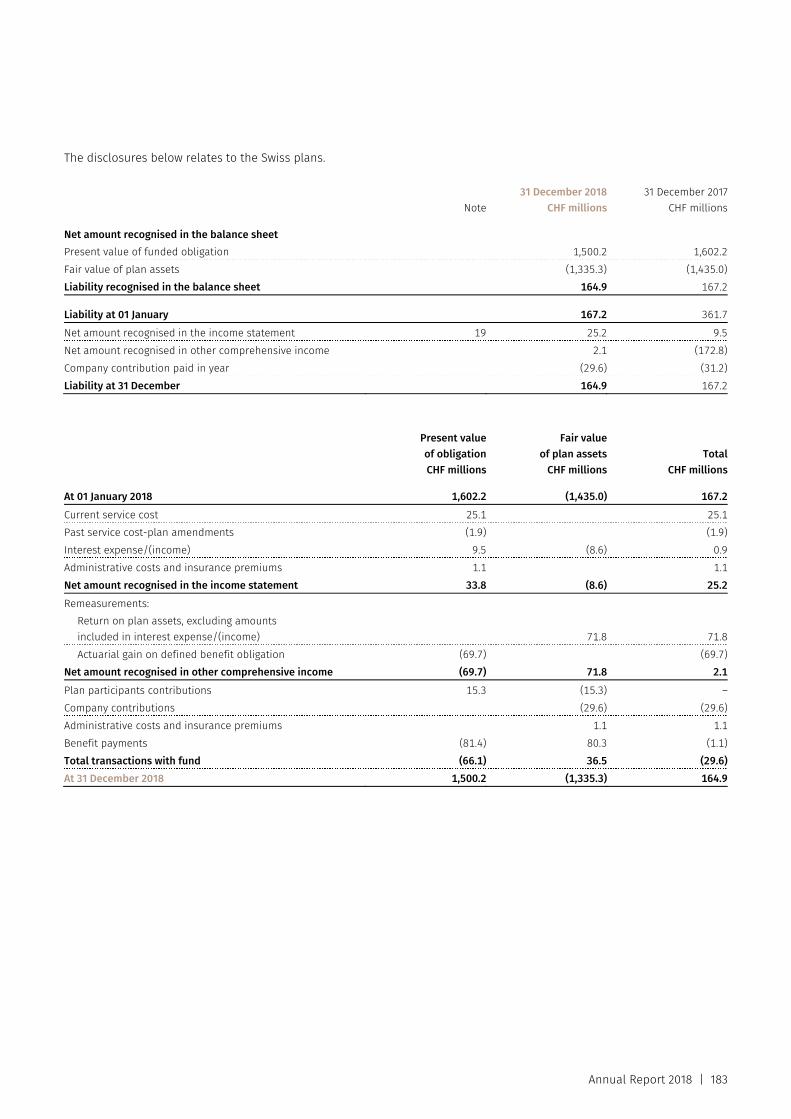
Annual Report 2018 | 183
The disclosures below relates to the Swiss plans.
Note31 December 2018
CHF millions31 December 2017
CHF millions Net amount recognised in the balance sheet Present value of funded obligation 1,500.2 1,602.2Fair value of plan assets (1,335.3) (1,435.0)Liability recognised in the balance sheet 164.9 167.2 Liability at 01 January 167.2 361.7Net amount recognised in the income statement 19 25.2 9.5Net amount recognised in other comprehensive income 2.1 (172.8)Company contribution paid in year (29.6) (31.2)Liability at 31 December 164.9 167.2
Present value of obligationCHF millions
Fair valueof plan assets
CHF millions Total
CHF millions At 01 January 2018 1,602.2 (1,435.0) 167.2Current service cost 25.1 25.1Past service cost-plan amendments (1.9) (1.9)Interest expense/(income) 9.5 (8.6) 0.9Administrative costs and insurance premiums 1.1 1.1Net amount recognised in the income statement 33.8 (8.6) 25.2Remeasurements:
Return on plan assets, excluding amounts included in interest expense/(income) 71.8 71.8Actuarial gain on defined benefit obligation (69.7) (69.7)
Net amount recognised in other comprehensive income (69.7) 71.8 2.1Plan participants contributions 15.3 (15.3) –Company contributions (29.6) (29.6)Administrative costs and insurance premiums 1.1 1.1Benefit payments (81.4) 80.3 (1.1)Total transactions with fund (66.1) 36.5 (29.6)At 31 December 2018 1,500.2 (1,335.3) 164.9
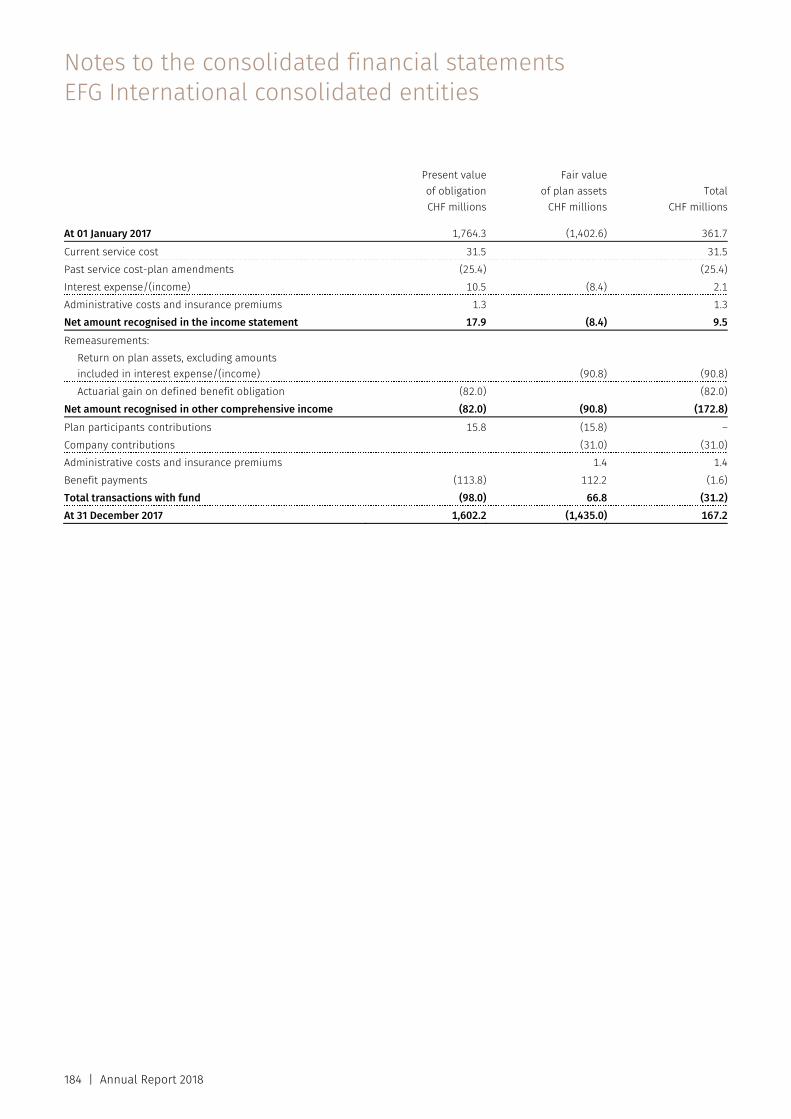
Notes to the consolidated financial statements EFG International consolidated entities
184 | Annual Report 2018
Present value of obligationCHF millions
Fair valueof plan assets
CHF millions Total
CHF millions At 01 January 2017 1,764.3 (1,402.6) 361.7Current service cost 31.5 31.5Past service cost-plan amendments (25.4) (25.4)Interest expense/(income) 10.5 (8.4) 2.1Administrative costs and insurance premiums 1.3 1.3Net amount recognised in the income statement 17.9 (8.4) 9.5Remeasurements:
Return on plan assets, excluding amounts included in interest expense/(income) (90.8) (90.8)Actuarial gain on defined benefit obligation (82.0) (82.0)
Net amount recognised in other comprehensive income (82.0) (90.8) (172.8)Plan participants contributions 15.8 (15.8) –Company contributions (31.0) (31.0)Administrative costs and insurance premiums 1.4 1.4Benefit payments (113.8) 112.2 (1.6)Total transactions with fund (98.0) 66.8 (31.2)At 31 December 2017 1,602.2 (1,435.0) 167.2
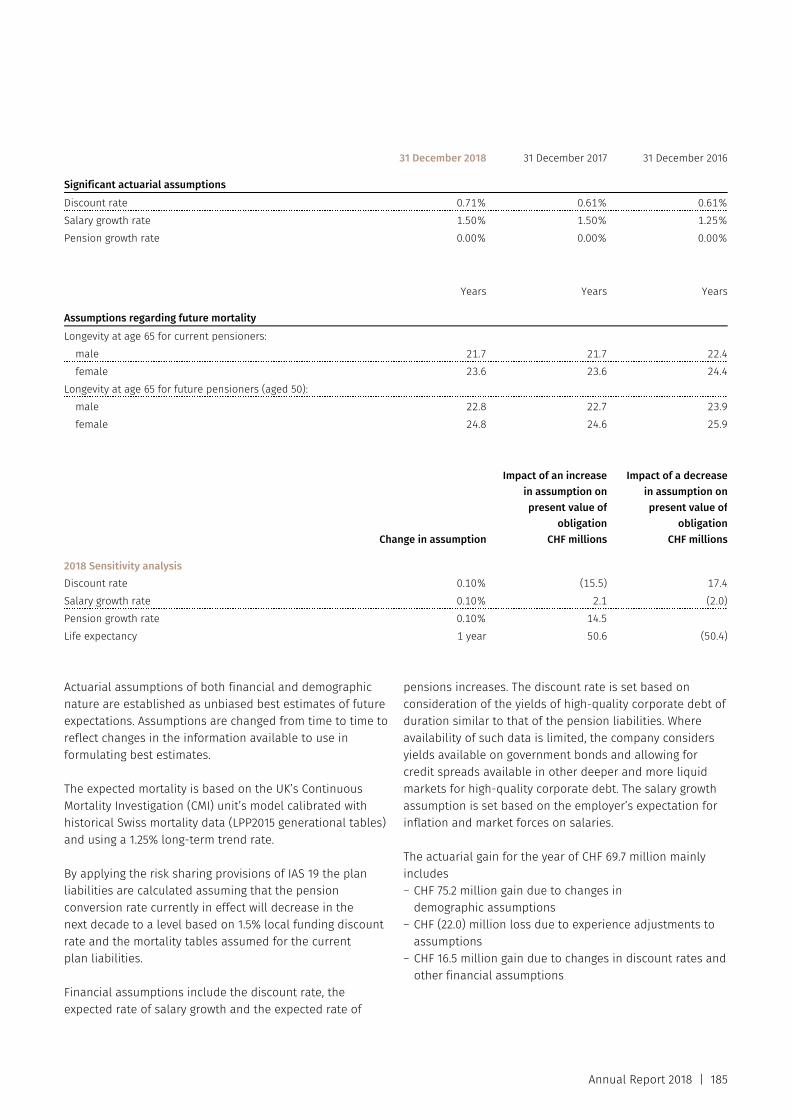
Annual Report 2018 | 185
31 December 2018 31 December 2017 31 December 2016 Significant actuarial assumptions Discount rate 0.71% 0.61% 0.61%Salary growth rate 1.50% 1.50% 1.25%Pension growth rate 0.00% 0.00% 0.00% Years Years Years Assumptions regarding future mortality Longevity at age 65 for current pensioners:
male 21.7 21.7 22.4female 23.6 23.6 24.4
Longevity at age 65 for future pensioners (aged 50): male 22.8 22.7 23.9female 24.8 24.6 25.9
Change in assumption
Impact of an increasein assumption onpresent value of
obligationCHF millions
Impact of a decreasein assumption onpresent value of
obligationCHF millions
2018 Sensitivity analysis Discount rate 0.10% (15.5) 17.4 Salary growth rate 0.10% 2.1 (2.0)Pension growth rate 0.10% 14.5Life expectancy 1 year 50.6 (50.4) Actuarial assumptions of both financial and demographic nature are established as unbiased best estimates of future expectations. Assumptions are changed from time to time to reflect changes in the information available to use in formulating best estimates.
The expected mortality is based on the UK’s Continuous Mortality Investigation (CMI) unit’s model calibrated with historical Swiss mortality data (LPP2015 generational tables) and using a 1.25% long-term trend rate.
By applying the risk sharing provisions of IAS 19 the plan liabilities are calculated assuming that the pension conversion rate currently in effect will decrease in the next decade to a level based on 1.5% local funding discount rate and the mortality tables assumed for the current plan liabilities.
Financial assumptions include the discount rate, the expected rate of salary growth and the expected rate of
pensions increases. The discount rate is set based on consideration of the yields of high-quality corporate debt of duration similar to that of the pension liabilities. Where availability of such data is limited, the company considers yields available on government bonds and allowing for credit spreads available in other deeper and more liquid markets for high-quality corporate debt. The salary growth assumption is set based on the employer’s expectation for inflation and market forces on salaries.
The actuarial gain for the year of CHF 69.7 million mainly includes – CHF 75.2 million gain due to changes in
demographic assumptions – CHF (22.0) million loss due to experience adjustments to
assumptions – CHF 16.5 million gain due to changes in discount rates and
other financial assumptions
Notes to the consolidated financial statements EFG International consolidated entities
186 | Annual Report 2018
The plans do not guarantee any pension increases, although in the event that the plan developed a surplus according to Swiss pension law, then a discretionary pension adjustment could be possible. At the present time, projections for the plans development do not indicate a pension adjustment is likely and so it is assumed that pensions are fixed.
The sensitivity of the valuation result to changes in assumptions is illustrated by introducing changes to one specific assumption at a time and comparing the result before and after the change. This is separately illustrated for changes in the discount rate and the expected rate of future salary increases. In practice, there may be some correlation in changes of assumptions, but for the purposes of the valuation the effect is ignored.
The operation of the pension plans involves exposure to a range of risks most significant being presented further below. The impact of these risks is shared between the Group and the plan participants in case of negative effects. In situations where the pension funds will accumulate surplus assets after providing the target benefits, the boards of the foundation may consider a distribution of the surplus to participants. No part of the surplus may be attributed to the Group.
(i) Investment risk Plan assets are invested to achieve a target return. The actual returns earned each year are likely to vary with a result higher or lower than the target. There is a risk that the long-term average return may be higher or lower than the target. If the long-term return is lower than the target then the fund will not have sufficient assets for plan benefits. The year on year variation in the return will generally be reflected directly in the defined benefit re-measurements.
A component of the return earned each year is derived from investment in bonds, and these bond returns are reflected in changes in the discount rate used to measure the defined benefit obligation. As a result benefit remeasurements through other comprehensive income resulting from asset volatility may be reduced by changes in the related obligation resulting from changes in the discount rate.
(ii) Longevity risk The plans provide annuity options to individuals on retirement. These annuity options are calculated using a
conversion rate which is established by the foundation and reviewed periodically.
The conversion rate is calculated with an assumption for the target rate of return and the life expectancy of the pensioner. Historic experience is that life expectancy improved faster than actuarial tables predicted and so longevity risk tended to be ‘loss generating’.
(iii) Interest volatility risk There is a substantial year-on-year liability volatility due to the volatility of the discount rate used in the model which is based on market yields on bonds of a specified type. The funds allocates a substantial proportion of assets to bonds, but the availability of bonds of duration and characteristics similar in nature to the discount rate is limited so that interest rate volatility risk cannot be eliminated. Interest rate volatility does not result in any effect on the Group performance but rather on the re-measurements recognised in other comprehensive income.
(iv) Death and disability risk The number of cases of death and disability of active employees may fluctuate considerably from year to year. To mitigate the effect of this risk the Swiss plans have contracted insurance contracts covering the cost of death and disability benefits arising each year.
Plan asset The pension funds have established written investment policies whereby the fund periodically establishes an allocation strategy with target allocations and tactical ranges for the principal classes of investments (equity, fixed income, real estate and liquidity) which aims to maximise the returns on plan assets. Plan assets are invested under mandates to a number of investment portfolio managers. Investment portfolio managers’ performance is regularly evaluated against its established strategy. The actual return on plan assets was a loss of CHF 63.2 million in 2018 (2017: gain of CHF 99.2 million). The net interest cost is calculated by applying the discount rate to the net balance of the defined benefit obligation and the fair value of plan assets. This cost is included in employee benefit expense in the income statement.
The plan assets do not include any shares of the EFG International Group or of any of its subsidiaries.
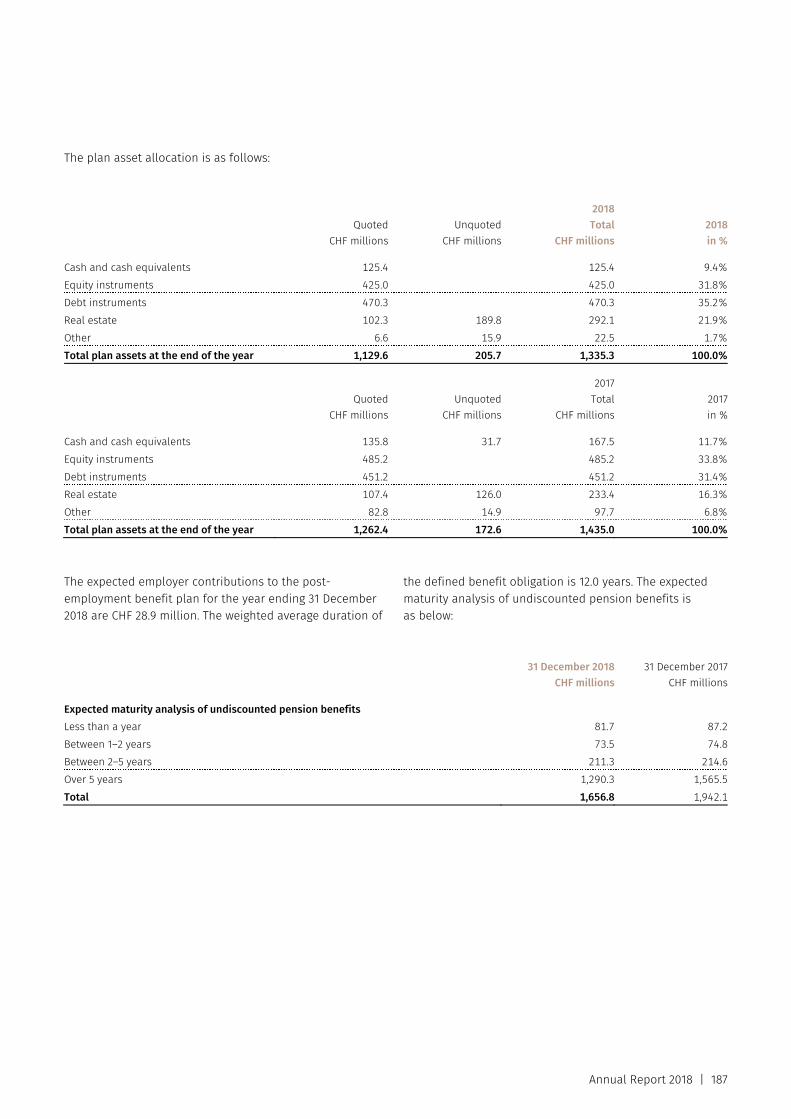
Annual Report 2018 | 187
The plan asset allocation is as follows:
Quoted
CHF millionsUnquoted
CHF millions
2018Total
CHF millions2018in %
Cash and cash equivalents 125.4 125.4 9.4%Equity instruments 425.0 425.0 31.8%Debt instruments 470.3 470.3 35.2%Real estate 102.3 189.8 292.1 21.9%Other 6.6 15.9 22.5 1.7%Total plan assets at the end of the year 1,129.6 205.7 1,335.3 100.0%
Quoted
CHF millionsUnquoted
CHF millions
2017Total
CHF millions2017in %
Cash and cash equivalents 135.8 31.7 167.5 11.7%Equity instruments 485.2 485.2 33.8%Debt instruments 451.2 451.2 31.4%Real estate 107.4 126.0 233.4 16.3%Other 82.8 14.9 97.7 6.8%Total plan assets at the end of the year 1,262.4 172.6 1,435.0 100.0% The expected employer contributions to the post-employment benefit plan for the year ending 31 December 2018 are CHF 28.9 million. The weighted average duration of
the defined benefit obligation is 12.0 years. The expected maturity analysis of undiscounted pension benefits is as below:
31 December 2018
CHF millions31 December 2017
CHF millions Expected maturity analysis of undiscounted pension benefits Less than a year 81.7 87.2Between 1–2 years 73.5 74.8Between 2–5 years 211.3 214.6Over 5 years 1,290.3 1,565.5Total 1,656.8 1,942.1
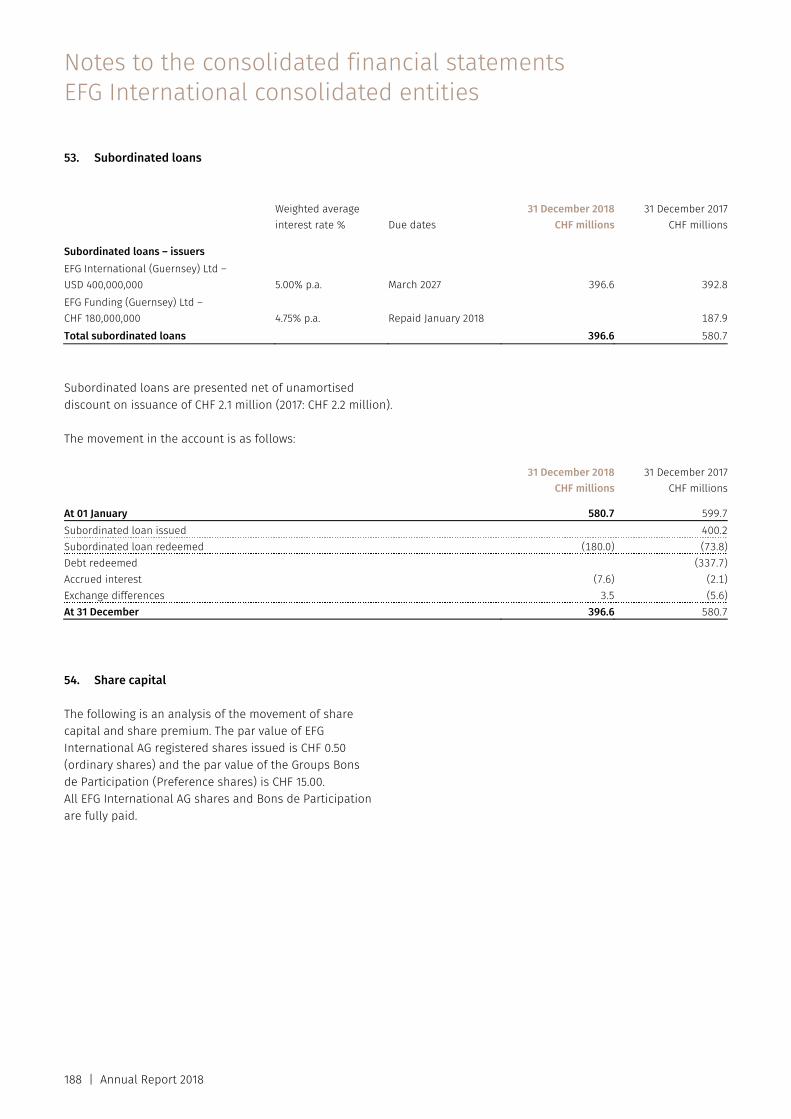
Notes to the consolidated financial statements EFG International consolidated entities
188 | Annual Report 2018
53. Subordinated loans
Weighted average interest rate % Due dates
31 December 2018 CHF millions
31 December 2017CHF millions
Subordinated loans – issuers EFG International (Guernsey) Ltd – USD 400,000,000 5.00% p.a. March 2027 396.6 392.8EFG Funding (Guernsey) Ltd – CHF 180,000,000 4.75% p.a. Repaid January 2018 187.9Total subordinated loans 396.6 580.7
Subordinated loans are presented net of unamortised discount on issuance of CHF 2.1 million (2017: CHF 2.2 million).
The movement in the account is as follows:
31 December 2018
CHF millions31 December 2017
CHF millions At 01 January 580.7 599.7Subordinated loan issued 400.2Subordinated loan redeemed (180.0) (73.8)Debt redeemed (337.7)Accrued interest (7.6) (2.1)Exchange differences 3.5 (5.6)At 31 December 396.6 580.7
54. Share capital
The following is an analysis of the movement of share capital and share premium. The par value of EFG International AG registered shares issued is CHF 0.50 (ordinary shares) and the par value of the Groups Bons de Participation (Preference shares) is CHF 15.00. All EFG International AG shares and Bons de Participation are fully paid.
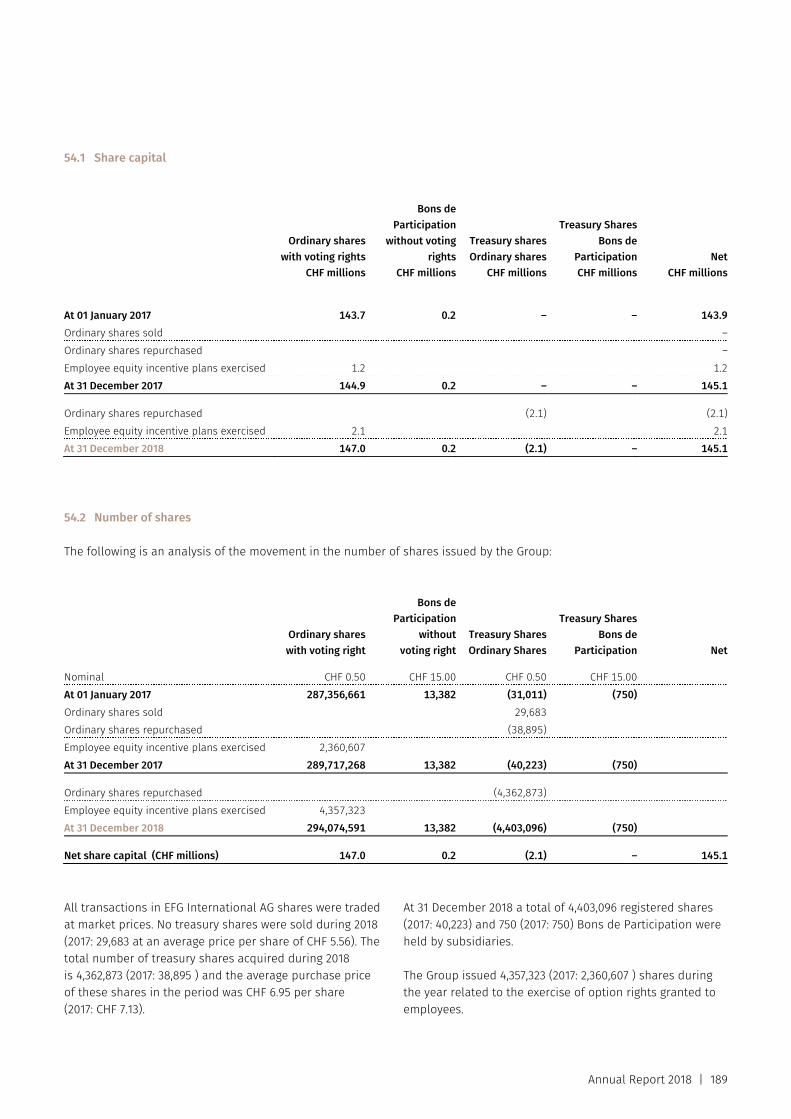
Annual Report 2018 | 189
54.1 Share capital
Ordinary shareswith voting rights
CHF millions
Bons de Participation
without voting rights
CHF millions
Treasury sharesOrdinary shares
CHF millions
Treasury SharesBons de
ParticipationCHF millions
NetCHF millions
At 01 January 2017 143.7 0.2 – – 143.9 Ordinary shares sold –Ordinary shares repurchased –Employee equity incentive plans exercised 1.2 1.2 At 31 December 2017 144.9 0.2 – – 145.1 Ordinary shares repurchased (2.1) (2.1)Employee equity incentive plans exercised 2.1 2.1 At 31 December 2018 147.0 0.2 (2.1) – 145.1
54.2 Number of shares
The following is an analysis of the movement in the number of shares issued by the Group:
Ordinary shareswith voting right
Bons de Participation
without voting right
Treasury SharesOrdinary Shares
Treasury SharesBons de
Participation Net Nominal CHF 0.50 CHF 15.00 CHF 0.50 CHF 15.00At 01 January 2017 287,356,661 13,382 (31,011) (750)Ordinary shares sold 29,683Ordinary shares repurchased (38,895)Employee equity incentive plans exercised 2,360,607 At 31 December 2017 289,717,268 13,382 (40,223) (750) Ordinary shares repurchased (4,362,873)Employee equity incentive plans exercised 4,357,323 At 31 December 2018 294,074,591 13,382 (4,403,096) (750) Net share capital (CHF millions) 147.0 0.2 (2.1) – 145.1
All transactions in EFG International AG shares were traded at market prices. No treasury shares were sold during 2018 (2017: 29,683 at an average price per share of CHF 5.56). The total number of treasury shares acquired during 2018 is 4,362,873 (2017: 38,895 ) and the average purchase price of these shares in the period was CHF 6.95 per share (2017: CHF 7.13).
At 31 December 2018 a total of 4,403,096 registered shares (2017: 40,223) and 750 (2017: 750) Bons de Participation were held by subsidiaries.
The Group issued 4,357,323 (2017: 2,360,607 ) shares during the year related to the exercise of option rights granted to employees.
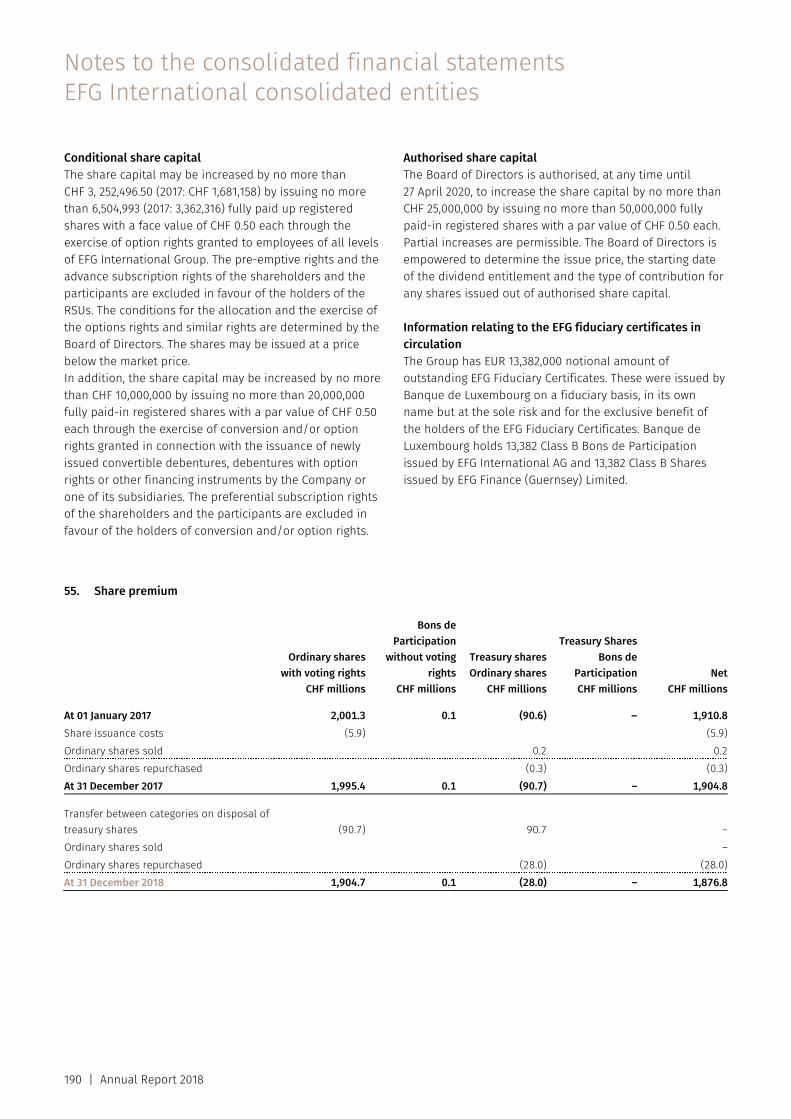
Notes to the consolidated financial statements EFG International consolidated entities
190 | Annual Report 2018
Conditional share capital The share capital may be increased by no more than CHF 3, 252,496.50 (2017: CHF 1,681,158) by issuing no more than 6,504,993 (2017: 3,362,316) fully paid up registered shares with a face value of CHF 0.50 each through the exercise of option rights granted to employees of all levels of EFG International Group. The pre-emptive rights and the advance subscription rights of the shareholders and the participants are excluded in favour of the holders of the RSUs. The conditions for the allocation and the exercise of the options rights and similar rights are determined by the Board of Directors. The shares may be issued at a price below the market price. In addition, the share capital may be increased by no more than CHF 10,000,000 by issuing no more than 20,000,000 fully paid-in registered shares with a par value of CHF 0.50 each through the exercise of conversion and/or option rights granted in connection with the issuance of newly issued convertible debentures, debentures with option rights or other financing instruments by the Company or one of its subsidiaries. The preferential subscription rights of the shareholders and the participants are excluded in favour of the holders of conversion and/or option rights.
Authorised share capital The Board of Directors is authorised, at any time until 27 April 2020, to increase the share capital by no more than CHF 25,000,000 by issuing no more than 50,000,000 fully paid-in registered shares with a par value of CHF 0.50 each. Partial increases are permissible. The Board of Directors is empowered to determine the issue price, the starting date of the dividend entitlement and the type of contribution for any shares issued out of authorised share capital.
Information relating to the EFG fiduciary certificates in circulation The Group has EUR 13,382,000 notional amount of outstanding EFG Fiduciary Certificates. These were issued by Banque de Luxembourg on a fiduciary basis, in its own name but at the sole risk and for the exclusive benefit of the holders of the EFG Fiduciary Certificates. Banque de Luxembourg holds 13,382 Class B Bons de Participation issued by EFG International AG and 13,382 Class B Shares issued by EFG Finance (Guernsey) Limited.
55. Share premium
Ordinary shareswith voting rights
CHF millions
Bons de Participation
without voting rights
CHF millions
Treasury sharesOrdinary shares
CHF millions
Treasury SharesBons de
ParticipationCHF millions
NetCHF millions
At 01 January 2017 2,001.3 0.1 (90.6) – 1,910.8Share issuance costs (5.9) (5.9)Ordinary shares sold 0.2 0.2Ordinary shares repurchased (0.3) (0.3)At 31 December 2017 1,995.4 0.1 (90.7) – 1,904.8 Transfer between categories on disposal of treasury shares (90.7) 90.7 –Ordinary shares sold –Ordinary shares repurchased (28.0) (28.0)At 31 December 2018 1,904.7 0.1 (28.0) – 1,876.8
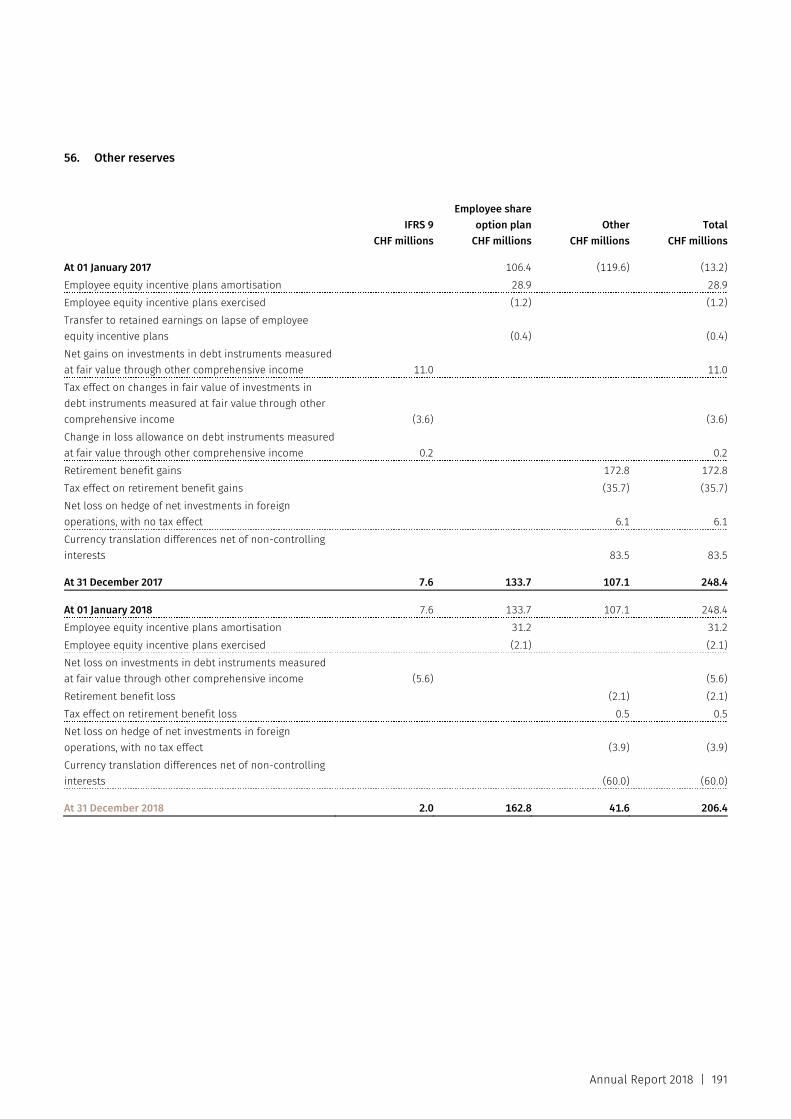
Annual Report 2018 | 191
56. Other reserves
IFRS 9
CHF millions
Employee share option plan
CHF millions Other
CHF millionsTotal
CHF millions At 01 January 2017 106.4 (119.6) (13.2)Employee equity incentive plans amortisation 28.9 28.9 Employee equity incentive plans exercised (1.2) (1.2)Transfer to retained earnings on lapse of employee equity incentive plans (0.4) (0.4)Net gains on investments in debt instruments measured at fair value through other comprehensive income 11.0 11.0 Tax effect on changes in fair value of investments in debt instruments measured at fair value through other comprehensive income (3.6) (3.6)Change in loss allowance on debt instruments measured at fair value through other comprehensive income 0.2 0.2 Retirement benefit gains 172.8 172.8 Tax effect on retirement benefit gains (35.7) (35.7)Net loss on hedge of net investments in foreign operations, with no tax effect 6.1 6.1 Currency translation differences net of non-controlling interests 83.5 83.5 At 31 December 2017 7.6 133.7 107.1 248.4 At 01 January 2018 7.6 133.7 107.1 248.4 Employee equity incentive plans amortisation 31.2 31.2 Employee equity incentive plans exercised (2.1) (2.1)Net loss on investments in debt instruments measured at fair value through other comprehensive income (5.6) (5.6)Retirement benefit loss (2.1) (2.1)Tax effect on retirement benefit loss 0.5 0.5 Net loss on hedge of net investments in foreign operations, with no tax effect (3.9) (3.9)Currency translation differences net of non-controlling interests (60.0) (60.0) At 31 December 2018 2.0 162.8 41.6 206.4
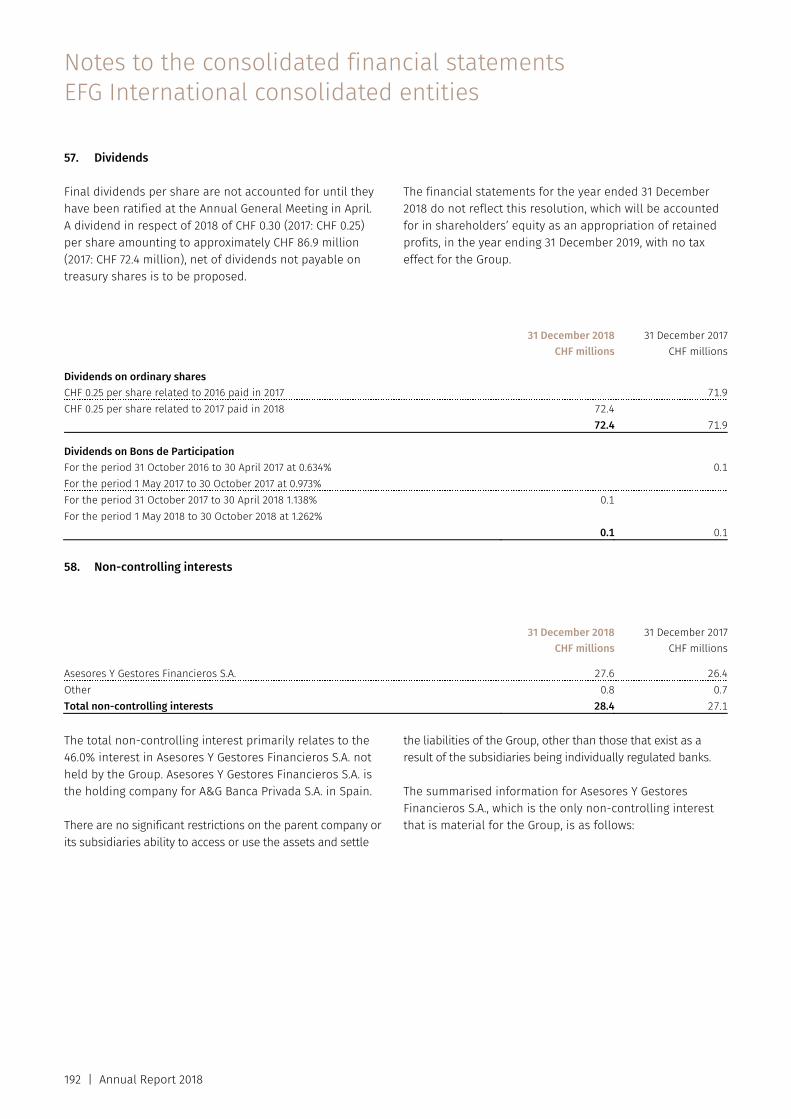
Notes to the consolidated financial statements EFG International consolidated entities
192 | Annual Report 2018
57. Dividends
Final dividends per share are not accounted for until they have been ratified at the Annual General Meeting in April. A dividend in respect of 2018 of CHF 0.30 (2017: CHF 0.25) per share amounting to approximately CHF 86.9 million (2017: CHF 72.4 million), net of dividends not payable on treasury shares is to be proposed.
The financial statements for the year ended 31 December 2018 do not reflect this resolution, which will be accounted for in shareholders’ equity as an appropriation of retained profits, in the year ending 31 December 2019, with no tax effect for the Group.
31 December 2018
CHF millions31 December 2017
CHF millions Dividends on ordinary shares CHF 0.25 per share related to 2016 paid in 2017 71.9CHF 0.25 per share related to 2017 paid in 2018 72.4 72.4 71.9 Dividends on Bons de Participation For the period 31 October 2016 to 30 April 2017 at 0.634% 0.1For the period 1 May 2017 to 30 October 2017 at 0.973% For the period 31 October 2017 to 30 April 2018 1.138% 0.1For the period 1 May 2018 to 30 October 2018 at 1.262% 0.1 0.1 58. Non-controlling interests
31 December 2018
CHF millions31 December 2017
CHF millions Asesores Y Gestores Financieros S.A. 27.6 26.4Other 0.8 0.7Total non-controlling interests 28.4 27.1 The total non-controlling interest primarily relates to the 46.0% interest in Asesores Y Gestores Financieros S.A. not held by the Group. Asesores Y Gestores Financieros S.A. is the holding company for A&G Banca Privada S.A. in Spain.
There are no significant restrictions on the parent company or its subsidiaries ability to access or use the assets and settle
the liabilities of the Group, other than those that exist as a result of the subsidiaries being individually regulated banks.
The summarised information for Asesores Y Gestores Financieros S.A., which is the only non-controlling interest that is material for the Group, is as follows:
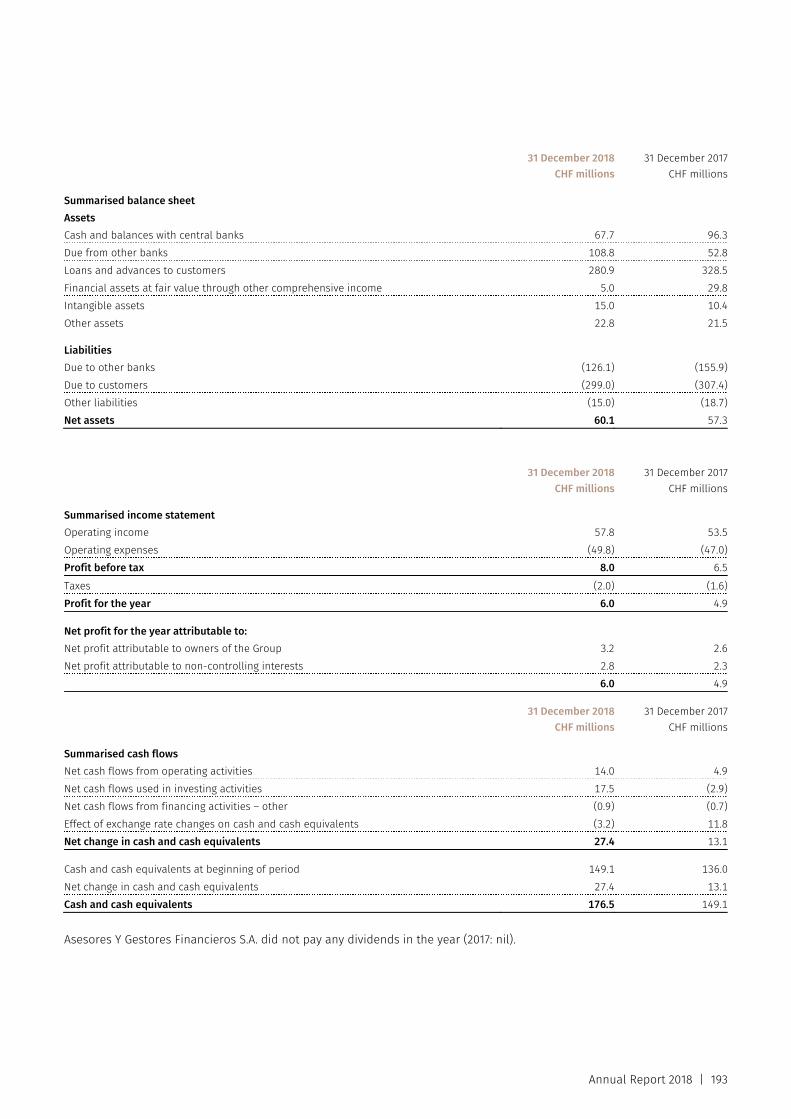
Annual Report 2018 | 193
31 December 2018
CHF millions31 December 2017
CHF millions Summarised balance sheet Assets Cash and balances with central banks 67.7 96.3Due from other banks 108.8 52.8Loans and advances to customers 280.9 328.5Financial assets at fair value through other comprehensive income 5.0 29.8Intangible assets 15.0 10.4Other assets 22.8 21.5 Liabilities Due to other banks (126.1) (155.9)Due to customers (299.0) (307.4)Other liabilities (15.0) (18.7)Net assets 60.1 57.3
31 December 2018
CHF millions31 December 2017
CHF millions Summarised income statement Operating income 57.8 53.5Operating expenses (49.8) (47.0)Profit before tax 8.0 6.5Taxes (2.0) (1.6)Profit for the year 6.0 4.9 Net profit for the year attributable to: Net profit attributable to owners of the Group 3.2 2.6Net profit attributable to non-controlling interests 2.8 2.3 6.0 4.9
31 December 2018
CHF millions31 December 2017
CHF millions Summarised cash flows Net cash flows from operating activities 14.0 4.9Net cash flows used in investing activities 17.5 (2.9)Net cash flows from financing activities – other (0.9) (0.7)Effect of exchange rate changes on cash and cash equivalents (3.2) 11.8Net change in cash and cash equivalents 27.4 13.1 Cash and cash equivalents at beginning of period 149.1 136.0Net change in cash and cash equivalents 27.4 13.1Cash and cash equivalents 176.5 149.1
Asesores Y Gestores Financieros S.A. did not pay any dividends in the year (2017: nil).
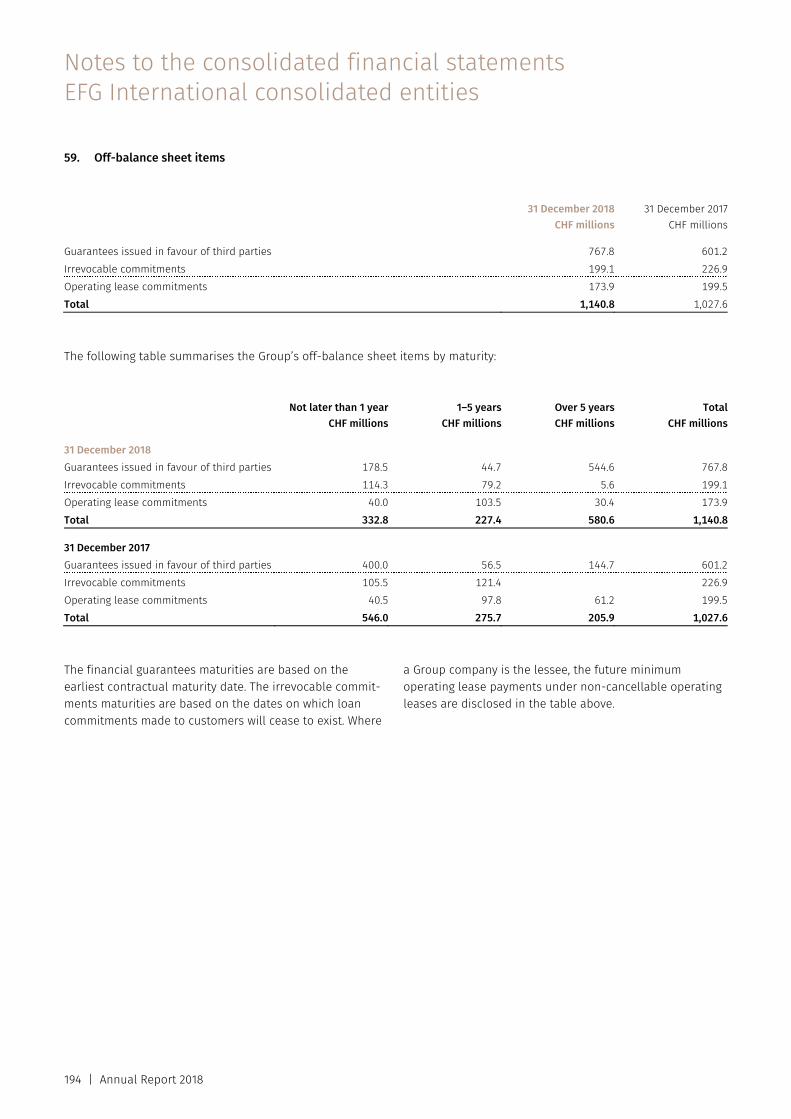
Notes to the consolidated financial statements EFG International consolidated entities
194 | Annual Report 2018
59. Off-balance sheet items
31 December 2018
CHF millions31 December 2017
CHF millions Guarantees issued in favour of third parties 767.8 601.2Irrevocable commitments 199.1 226.9Operating lease commitments 173.9 199.5Total 1,140.8 1,027.6
The following table summarises the Group’s off-balance sheet items by maturity: Not later than 1 year
CHF millions1–5 years
CHF millionsOver 5 yearsCHF millions
TotalCHF millions
31 December 2018 Guarantees issued in favour of third parties 178.5 44.7 544.6 767.8Irrevocable commitments 114.3 79.2 5.6 199.1Operating lease commitments 40.0 103.5 30.4 173.9Total 332.8 227.4 580.6 1,140.8 31 December 2017 Guarantees issued in favour of third parties 400.0 56.5 144.7 601.2Irrevocable commitments 105.5 121.4 226.9Operating lease commitments 40.5 97.8 61.2 199.5Total 546.0 275.7 205.9 1,027.6 The financial guarantees maturities are based on the earliest contractual maturity date. The irrevocable commit-ments maturities are based on the dates on which loan commitments made to customers will cease to exist. Where
a Group company is the lessee, the future minimum operating lease payments under non-cancellable operating leases are disclosed in the table above.
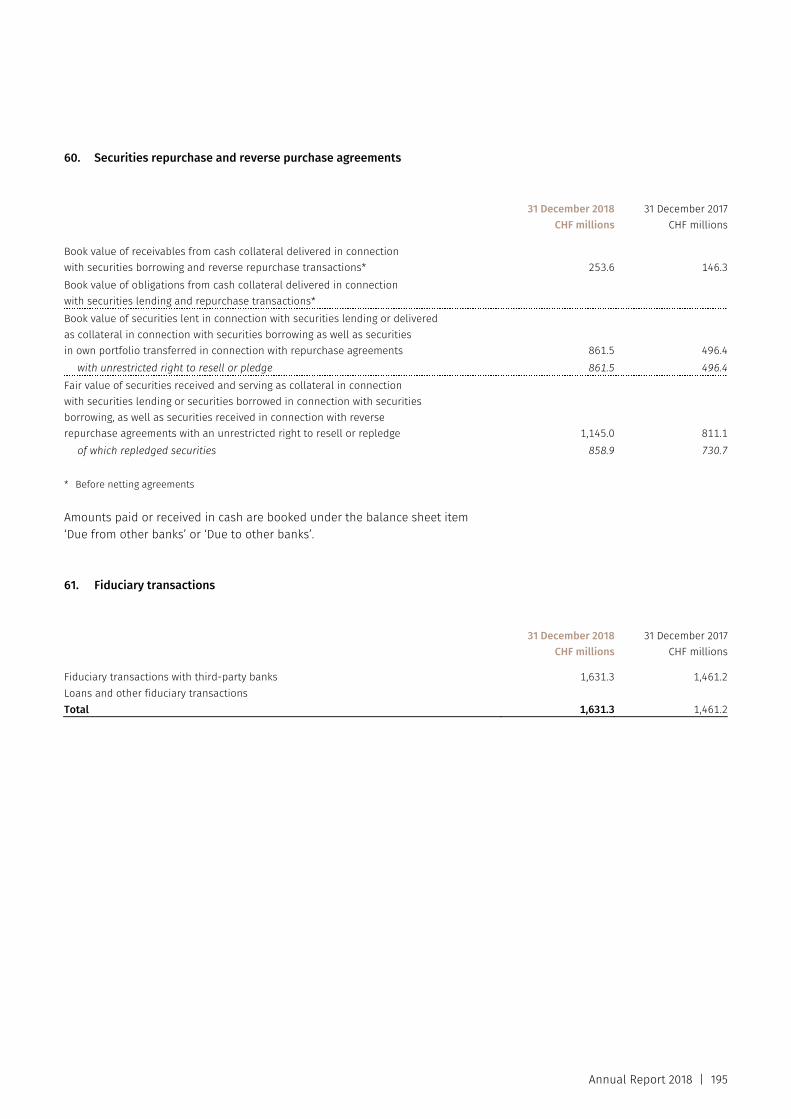
Annual Report 2018 | 195
60. Securities repurchase and reverse purchase agreements
31 December 2018
CHF millions31 December 2017
CHF millions Book value of receivables from cash collateral delivered in connection with securities borrowing and reverse repurchase transactions* 253.6 146.3Book value of obligations from cash collateral delivered in connection with securities lending and repurchase transactions* Book value of securities lent in connection with securities lending or delivered as collateral in connection with securities borrowing as well as securities in own portfolio transferred in connection with repurchase agreements 861.5 496.4
with unrestricted right to resell or pledge 861.5 496.4Fair value of securities received and serving as collateral in connection with securities lending or securities borrowed in connection with securities borrowing, as well as securities received in connection with reverse repurchase agreements with an unrestricted right to resell or repledge 1,145.0 811.1
of which repledged securities 858.9 730.7 * Before netting agreements Amounts paid or received in cash are booked under the balance sheet item ‘Due from other banks’ or ‘Due to other banks’.
61. Fiduciary transactions
31 December 2018
CHF millions31 December 2017
CHF millions Fiduciary transactions with third-party banks 1,631.3 1,461.2Loans and other fiduciary transactions Total 1,631.3 1,461.2
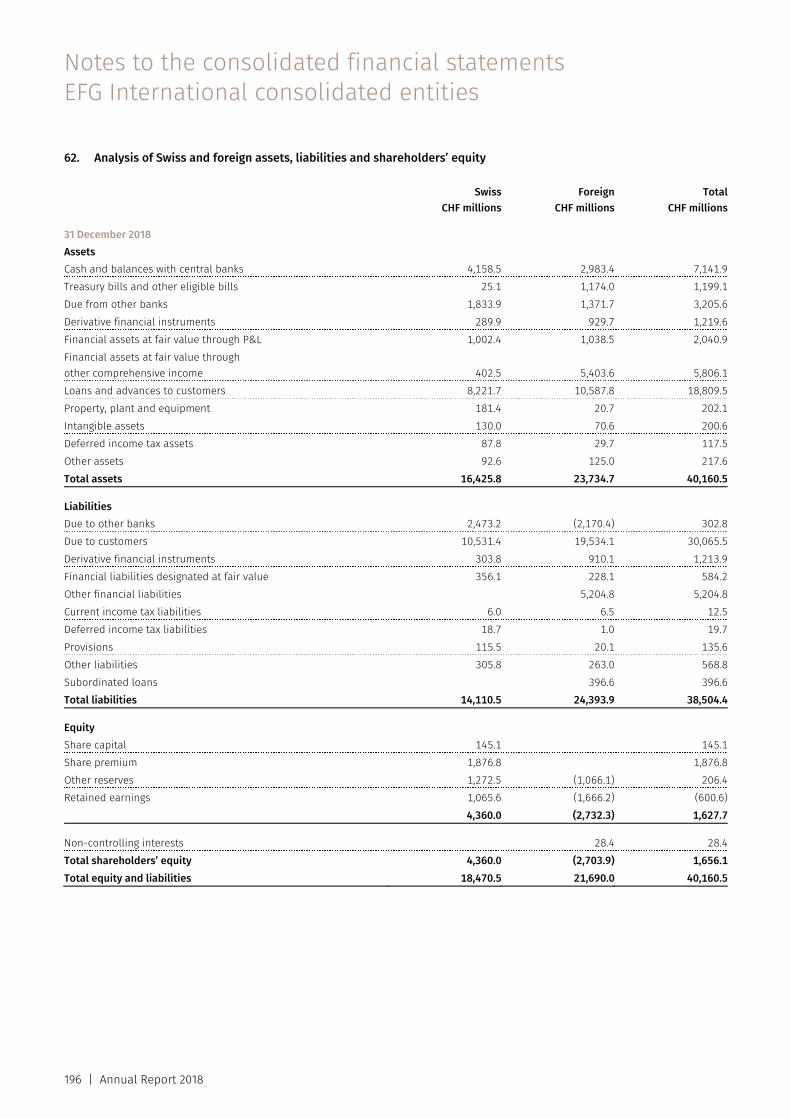
Notes to the consolidated financial statements EFG International consolidated entities
196 | Annual Report 2018
62. Analysis of Swiss and foreign assets, liabilities and shareholders’ equity
Swiss
CHF millionsForeign
CHF millionsTotal
CHF millions 31 December 2018 Assets Cash and balances with central banks 4,158.5 2,983.4 7,141.9Treasury bills and other eligible bills 25.1 1,174.0 1,199.1Due from other banks 1,833.9 1,371.7 3,205.6Derivative financial instruments 289.9 929.7 1,219.6Financial assets at fair value through P&L 1,002.4 1,038.5 2,040.9Financial assets at fair value through other comprehensive income 402.5 5,403.6 5,806.1Loans and advances to customers 8,221.7 10,587.8 18,809.5Property, plant and equipment 181.4 20.7 202.1Intangible assets 130.0 70.6 200.6Deferred income tax assets 87.8 29.7 117.5Other assets 92.6 125.0 217.6Total assets 16,425.8 23,734.7 40,160.5 Liabilities Due to other banks 2,473.2 (2,170.4) 302.8Due to customers 10,531.4 19,534.1 30,065.5Derivative financial instruments 303.8 910.1 1,213.9Financial liabilities designated at fair value 356.1 228.1 584.2Other financial liabilities 5,204.8 5,204.8Current income tax liabilities 6.0 6.5 12.5Deferred income tax liabilities 18.7 1.0 19.7Provisions 115.5 20.1 135.6Other liabilities 305.8 263.0 568.8Subordinated loans 396.6 396.6Total liabilities 14,110.5 24,393.9 38,504.4 Equity Share capital 145.1 145.1Share premium 1,876.8 1,876.8Other reserves 1,272.5 (1,066.1) 206.4Retained earnings 1,065.6 (1,666.2) (600.6) 4,360.0 (2,732.3) 1,627.7 Non-controlling interests 28.4 28.4Total shareholders’ equity 4,360.0 (2,703.9) 1,656.1Total equity and liabilities 18,470.5 21,690.0 40,160.5
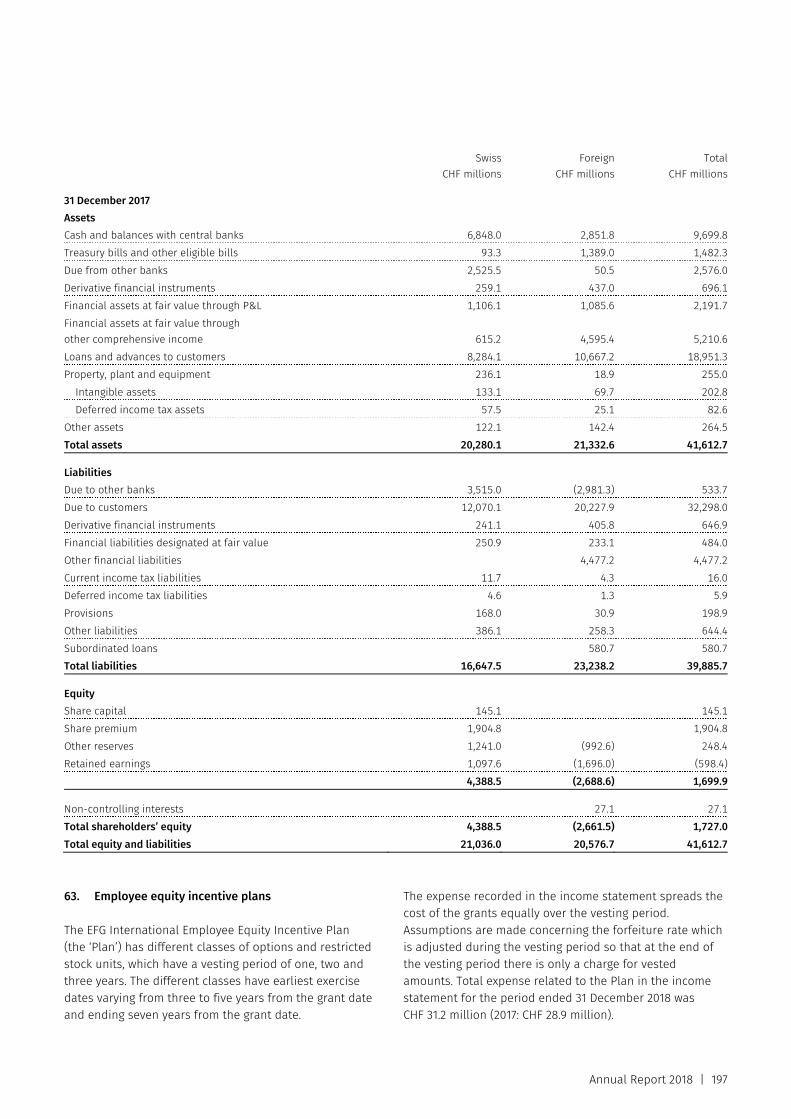
Annual Report 2018 | 197
Swiss
CHF millionsForeign
CHF millionsTotal
CHF millions 31 December 2017 Assets Cash and balances with central banks 6,848.0 2,851.8 9,699.8Treasury bills and other eligible bills 93.3 1,389.0 1,482.3Due from other banks 2,525.5 50.5 2,576.0Derivative financial instruments 259.1 437.0 696.1Financial assets at fair value through P&L 1,106.1 1,085.6 2,191.7Financial assets at fair value through other comprehensive income 615.2 4,595.4 5,210.6Loans and advances to customers 8,284.1 10,667.2 18,951.3Property, plant and equipment 236.1 18.9 255.0
Intangible assets 133.1 69.7 202.8Deferred income tax assets 57.5 25.1 82.6
Other assets 122.1 142.4 264.5Total assets 20,280.1 21,332.6 41,612.7 Liabilities Due to other banks 3,515.0 (2,981.3) 533.7Due to customers 12,070.1 20,227.9 32,298.0Derivative financial instruments 241.1 405.8 646.9Financial liabilities designated at fair value 250.9 233.1 484.0Other financial liabilities 4,477.2 4,477.2Current income tax liabilities 11.7 4.3 16.0Deferred income tax liabilities 4.6 1.3 5.9Provisions 168.0 30.9 198.9Other liabilities 386.1 258.3 644.4Subordinated loans 580.7 580.7Total liabilities 16,647.5 23,238.2 39,885.7 Equity Share capital 145.1 145.1Share premium 1,904.8 1,904.8Other reserves 1,241.0 (992.6) 248.4Retained earnings 1,097.6 (1,696.0) (598.4) 4,388.5 (2,688.6) 1,699.9 Non-controlling interests 27.1 27.1Total shareholders’ equity 4,388.5 (2,661.5) 1,727.0Total equity and liabilities 21,036.0 20,576.7 41,612.7 63. Employee equity incentive plans
The EFG International Employee Equity Incentive Plan (the ‘Plan’) has different classes of options and restricted stock units, which have a vesting period of one, two and three years. The different classes have earliest exercise dates varying from three to five years from the grant date and ending seven years from the grant date.
The expense recorded in the income statement spreads the cost of the grants equally over the vesting period. Assumptions are made concerning the forfeiture rate which is adjusted during the vesting period so that at the end of the vesting period there is only a charge for vested amounts. Total expense related to the Plan in the income statement for the period ended 31 December 2018 was CHF 31.2 million (2017: CHF 28.9 million).
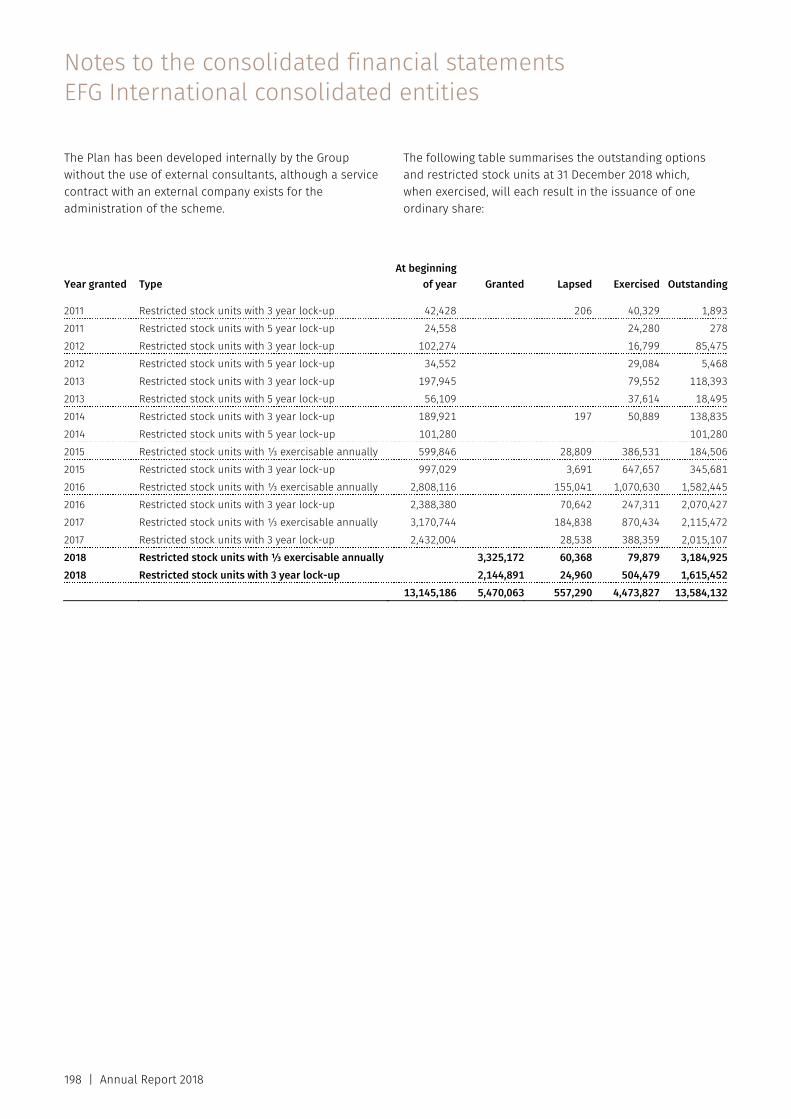
Notes to the consolidated financial statements EFG International consolidated entities
198 | Annual Report 2018
The Plan has been developed internally by the Group without the use of external consultants, although a service contract with an external company exists for the administration of the scheme.
The following table summarises the outstanding options and restricted stock units at 31 December 2018 which, when exercised, will each result in the issuance of one ordinary share:
Year granted Type At beginning
of year Granted Lapsed Exercised Outstanding 2011 Restricted stock units with 3 year lock-up 42,428 206 40,329 1,8932011 Restricted stock units with 5 year lock-up 24,558 24,280 2782012 Restricted stock units with 3 year lock-up 102,274 16,799 85,4752012 Restricted stock units with 5 year lock-up 34,552 29,084 5,4682013 Restricted stock units with 3 year lock-up 197,945 79,552 118,3932013 Restricted stock units with 5 year lock-up 56,109 37,614 18,4952014 Restricted stock units with 3 year lock-up 189,921 197 50,889 138,8352014 Restricted stock units with 5 year lock-up 101,280 101,2802015 Restricted stock units with ⅓ exercisable annually 599,846 28,809 386,531 184,5062015 Restricted stock units with 3 year lock-up 997,029 3,691 647,657 345,6812016 Restricted stock units with ⅓ exercisable annually 2,808,116 155,041 1,070,630 1,582,4452016 Restricted stock units with 3 year lock-up 2,388,380 70,642 247,311 2,070,4272017 Restricted stock units with ⅓ exercisable annually 3,170,744 184,838 870,434 2,115,4722017 Restricted stock units with 3 year lock-up 2,432,004 28,538 388,359 2,015,1072018 Restricted stock units with ⅓ exercisable annually 3,325,172 60,368 79,879 3,184,9252018 Restricted stock units with 3 year lock-up 2,144,891 24,960 504,479 1,615,452 13,145,186 5,470,063 557,290 4,473,827 13,584,132
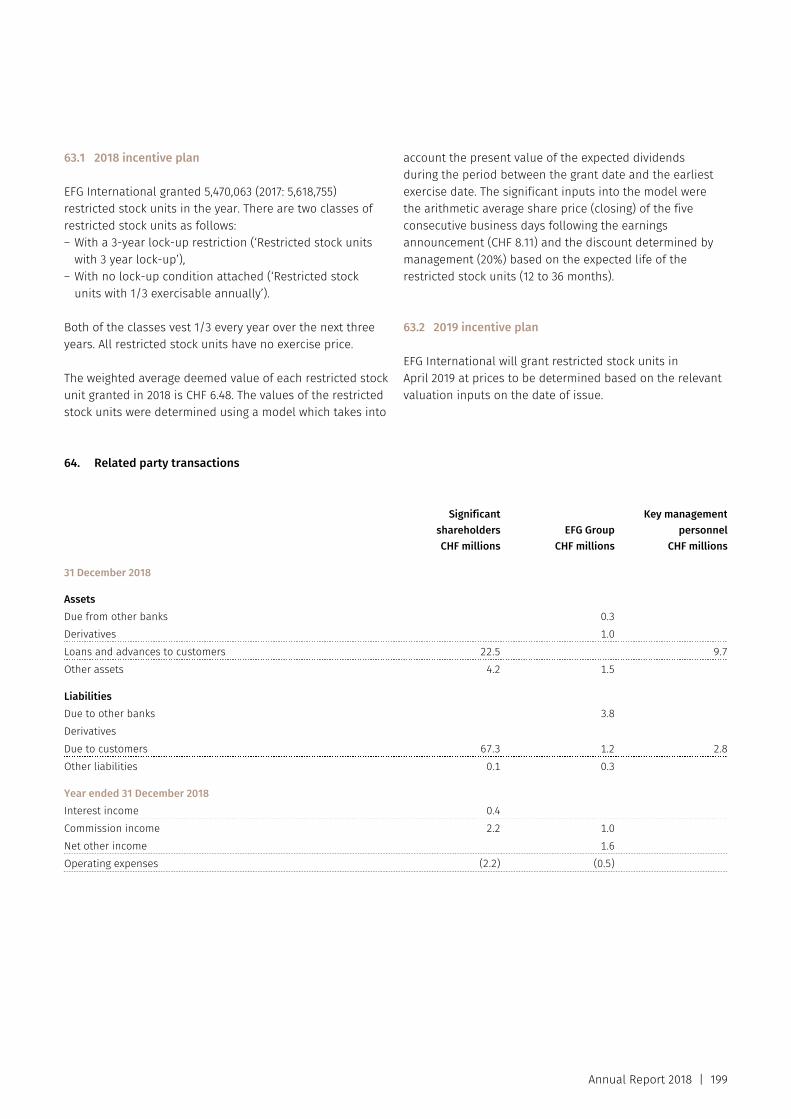
Annual Report 2018 | 199
63.1 2018 incentive plan
EFG International granted 5,470,063 (2017: 5,618,755) restricted stock units in the year. There are two classes of restricted stock units as follows: – With a 3-year lock-up restriction (‘Restricted stock units
with 3 year lock-up’), – With no lock-up condition attached (‘Restricted stock
units with 1/3 exercisable annually’).
Both of the classes vest 1/3 every year over the next three years. All restricted stock units have no exercise price.
The weighted average deemed value of each restricted stock unit granted in 2018 is CHF 6.48. The values of the restricted stock units were determined using a model which takes into
account the present value of the expected dividends during the period between the grant date and the earliest exercise date. The significant inputs into the model were the arithmetic average share price (closing) of the five consecutive business days following the earnings announcement (CHF 8.11) and the discount determined by management (20%) based on the expected life of the restricted stock units (12 to 36 months).
63.2 2019 incentive plan
EFG International will grant restricted stock units in April 2019 at prices to be determined based on the relevant valuation inputs on the date of issue.
64. Related party transactions
SignificantshareholdersCHF millions
EFG GroupCHF millions
Key management personnel
CHF millions 31 December 2018 Assets Due from other banks 0.3Derivatives 1.0Loans and advances to customers 22.5 9.7Other assets 4.2 1.5 Liabilities Due to other banks 3.8Derivatives Due to customers 67.3 1.2 2.8Other liabilities 0.1 0.3 Year ended 31 December 2018 Interest income 0.4Commission income 2.2 1.0Net other income 1.6Operating expenses (2.2) (0.5)
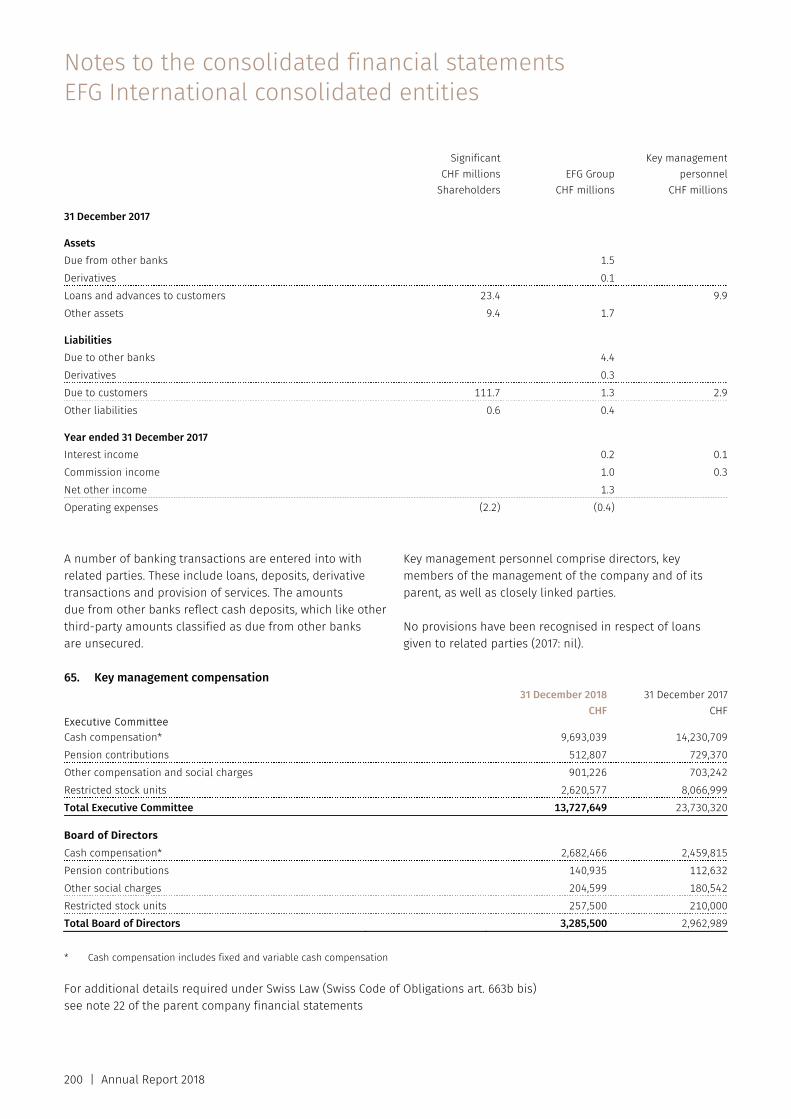
Notes to the consolidated financial statements EFG International consolidated entities
200 | Annual Report 2018
SignificantCHF millions
ShareholdersEFG Group
CHF millions
Key management personnel
CHF millions 31 December 2017 Assets Due from other banks 1.5Derivatives 0.1Loans and advances to customers 23.4 9.9Other assets 9.4 1.7 Liabilities Due to other banks 4.4Derivatives 0.3Due to customers 111.7 1.3 2.9Other liabilities 0.6 0.4 Year ended 31 December 2017 Interest income 0.2 0.1Commission income 1.0 0.3Net other income 1.3Operating expenses (2.2) (0.4) A number of banking transactions are entered into with related parties. These include loans, deposits, derivative transactions and provision of services. The amounts due from other banks reflect cash deposits, which like other third-party amounts classified as due from other banks are unsecured.
Key management personnel comprise directors, key members of the management of the company and of its parent, as well as closely linked parties.
No provisions have been recognised in respect of loans given to related parties (2017: nil).
65. Key management compensation
31 December 2018
CHF31 December 2017
CHFExecutive Committee Cash compensation* 9,693,039 14,230,709Pension contributions 512,807 729,370Other compensation and social charges 901,226 703,242Restricted stock units 2,620,577 8,066,999Total Executive Committee 13,727,649 23,730,320 Board of Directors Cash compensation* 2,682,466 2,459,815Pension contributions 140,935 112,632Other social charges 204,599 180,542Restricted stock units 257,500 210,000Total Board of Directors 3,285,500 2,962,989
* Cash compensation includes fixed and variable cash compensation For additional details required under Swiss Law (Swiss Code of Obligations art. 663b bis) see note 22 of the parent company financial statements
Annual Report 2018 | 201
66. Assets under management and assets under administration
31 December 2018
CHF millions31 December 2017
CHF millions Character of client assets Equities 26,854 32,279Deposits 31,026 34,018Bonds 32,333 35,122Loans 18,726 18,978Structured notes 4,035 4,205Hedge funds/Fund of hedge funds 3,281 3,817Fiduciary deposits 1,431 1,275Other 13,543 12,334 Total Revenue Generating Assets under Management 131,229 142,028 Total Assets under Administration 18,479 12,319 Total Assets under Management and Administration 149,708 154,347
Assets under Administration are trust assets administered by the Group. The Group has CHF 7,680 million (2017: CHF 13,274 million) of Assets under Custody not included in the above.
31 December 2018
CHF millions31 December 2017
CHF millions Assets under Management Character of Assets under Management: Assets in own administrated collective investment schemes 10,696 7,847Assets under discretionary management agreements 21,681 24,447Other assets under management 80,126 90,756 Total Assets under Management (including double counts) 112,503 123,050 Thereof double counts 5,327 4,963 Loans 18,726 18,978Total Assets under Administration 18,479 12,319 Total Assets under Management and Administration 149,708 154,347 Net new asset (outflows)/inflows (including double counts) (2,132) (5,845)
Double counts primarily include the self-managed collective investment schemes and structured products issued by Group companies which are also included in customer portfolios and already included in assets under management
Notes to the consolidated financial statements EFG International consolidated entities
202 | Annual Report 2018
2018 CHF millions
2017CHF millions
At 01 January 123,050 125,510Net new money outflow (2,682) (5,616)Market performance and currency impact (6,998) 6,706Increase in scope of consolidation due to acquisition 2,546Other effects (867) (6,096)At 31 December 112,503 123,050
Net new money consists of new client acquisition, client departures and inflows or outflows attributable to existing clients (whether in cash or securities). Interest and dividend income from assets under management, market or currency
movements as well as fees and commissions are not included in net new assets. Effects resulting from any acquisition or disposal of Group companies are not included in net new money.
67. Post balance sheet events
The Group has agreed to acquire 51% of Shaw and Partners. Shaw and Partners are based in Australia and provides a full suite of wealth management services, including brokerage, portfolio management and administration, investment advice and corporate finance.
Shaw and Partners have funds under administration of approximately CHF 11 billion. The consideration to be paid in cash and shares, corresponds to approximately CHF 44 million, including deferred consideration. Completion of the transaction is expected in mid 2019, subject to regulatory approval.
68. Board of Directors
The Board of Directors of EFG International AG comprises:
John A. Williamson* Chair Niccolò H. Burki* Vice-Chair Susanne Brandenberger* Emmanuel L. Bussetil Michael Higgin* Roberto Isolani Steven M. Jacobs Spiro J. Latsis John S. Latsis Appointed 28 April 2018 Pericles Petalas Stuart M. Robertson* Appointed 01 October 2018 Fong Seng Tee* Appointed 28 April 2018 Bernd-A. von Maltzan* Daniel Zuberbühler* * Independent directors
Annual Report 2018 | 203
69. Swiss banking law requirements
The Group is subject to consolidated supervision by Swiss Financial Markets Supervisory Authority. The consolidated financial statements of the Group are prepared in accord-ance with International Financial Reporting Standards (IFRS). Set out below are the deviations which would result if the provisions of the Banking Ordinance and the Guide-lines of Swiss Financial Markets Supervisory Authority governing financial statement reporting, pursuant to Article 23 through Article 27 of Banking Federal Ordinance, were applied in the preparation of the consolidated financial statements of the Group.
(a) Financial investments Under IFRS, changes in the fair value of financial assets at fair value through other comprehensive income are recorded as increases or decreases to shareholders’ equity (refer to consolidated Statement of other comprehensive income) until an investment is sold, collected or otherwise disposed of, or until an investment is determined to be impaired. On disposal of a debt financial instrument at fair value through other comprehensive income, the difference between the net disposal proceeds and carrying amount, including any previously recognised unrealised gain or loss arising from a change in fair value reported in other comprehensive income, is included in the income statement for the period.
Under Swiss law, financial investments are carried at the lower of cost or market value. Positive and negative balance of market-related and/or credit worthiness-related value adjustments to financial investments valued according to the lower of cost or market value principle are included in the income statement as sundry ordinary income and sundry ordinary expenses respectively. Gains or losses on disposals are recognized in the income statement as income from the sale of financial investments.
(b) Fair value option Even if an instrument meets the requirements to be measured at amortised cost or fair value through other comprehensive income, IFRS 9 contains an option to designate, at initial recognition, a financial asset as measured at fair value through profit and loss if doing so eliminates or significantly reduces a measurement or recognition inconsistency (‘accounting mismatch’) that would otherwise arise from measuring assets or liabilities (or recognising the gains and losses on them) on different bases.
Under Swiss law, this option is not available. Only the financial assets held for trading are reflected on the balance sheet at fair value. Hybrid instruments are bifurcated: the embedded derivative is marked to market through net trading income and the host contract is accounted for on an accrued cost basis. No own credit adjustments are booked for hybrid instruments. Generally, loans are accounted for at amortised cost less impairment, loan commitments stay off-balance sheet and fund investments are accounted for as financial investments.
(c) Derivative financial instruments Under IFRS 9, derivatives are recorded in the balance sheet at fair value with changes in fair value being recognised in fair value gains less losses on financial instruments measured at fair value.
Under Swiss law, the Group’s derivative instruments are recorded on balance sheet at their market values (gross positive and negative replacement values). Replacement values are reported on a net basis provided the netting agreements are legally enforceable. Hedging transactions are valued using the same principles as those for the underlying transactions being hedged.
(d) Goodwill and intangible assets Under both IFRS and under Swiss law, goodwill and intangible assets resulting from acquisitions and mergers are capitalised in the balance sheet.
Under IFRS, goodwill is not amortised but is tested for impairment at least annually and is carried at cost less accumulated impairment losses. Intangible assets are amortised on a systematic basis over their useful lives. In addition, intangible assets are tested for impairment when there is any indication that the asset may be impaired. Intangible assets are carried at cost less amortisation and accumulated impairment losses.
Under Swiss law, goodwill and intangible assets are amortised over the estimated economic life on a straight-line basis. The net carrying value of intangible assets is, in addition, reappraised annually, with any reduction to the net carrying value taken immediately as an expense in the income statement.
(e) Extraordinary income and expense Under IFRS, items of income and expense shall not be classified as extraordinary items, in the income statement or the separate income statement (if presented), or in the notes.
Notes to the consolidated financial statements EFG International consolidated entities
204 | Annual Report 2018
Under Swiss law, income and expense items related to other accounting periods, as long as they are attributable to corrections or mistakes from previous periods, and/or not directly related with the core business activities of the enterprise (realised gains on sale of investments in associated undertakings or property, plant and equipment) are recorded as extraordinary income or expense.
(f) Discontinued operations Under IFRS, assets and liabilities of an entity held-for-sale are separated from the ordinary balance sheet positions and reported in separate discontinued operations items. In addition, such assets and liabilities are re-measured at the lower of their carrying value or fair value less costs to sell.
Under Swiss law, these positions remain in the ordinary balance sheet positions until disposal and are not remeasured.
(g) Retirement benefit obligations Under IFRS and the specific rules of IAS 19R, the Group records a liability for the Swiss pension funds as if they are defined benefit schemes.
Under Swiss law, the funds are classified as defined contribution schemes and the Group’s liability for a fully funded pension fund is limited and as a result no liability exists for any amounts other than unpaid employers’ contributions.
(h) Expected credit losses Under IFRS, the Group records a loss allowance for all financial assets measured on amortised cost basis and debt instruments at fair value through other comprehensive income, reflecting a forward looking expectation of future losses even where there is no loss incurred.
Under Swiss law, impairments are only recorded on an incurred basis.

Auditorʼs Report
Statutory auditor’s report
206 | Annual Report 2018
Report of the statutory auditor to the General Meeting of EFG International AG, Zurich
Report on the audit of the consolidated financial statements Opinion We have audited the consolidated financial statements of EFG International AG and its subsidiaries (“the Group”), which comprise the consolidated balance sheet as at 31 December 2018, consolidated income statement, consolidated statement of comprehensive income, consolidated statement of changes in equity, consolidated cash flow statement and notes for the year then ended (pages 66 to 204), including a summary of significant accounting policies.
In our opinion, the consolidated financial statements as at 31 December 2018 give a true and fair view of the consolidated financial position of the Group, its consolidated results of operations and its consolidated cash flows in accordance with the International Financial Reporting Standards (IFRS) and comply with Swiss law.
Basis for opinion We conducted our audit in accordance with Swiss law, International Standards on Auditing (ISAs) and Swiss Auditing Standards. Our responsibilities under those provisions and standards are further de-scribed in the “Auditor’s responsibilities for the audit of the consolidated financial statements” section of our report.
We are independent of the Group in accordance with the provisions of Swiss law and the requirements of the Swiss audit profession, as well as the IESBA Code of Ethics for Professional Accountants and we have fulfilled our other ethical responsibilities in accordance with these requirements. We believe that the audit evidence we have obtained is sufficient and appropriate to provide a basis for our opinion.
Our audit approach Overview
Overall group materiality: CHF 5’700’000
We concluded full scope audit work at 13 reporting units in 9 countries. Our audit scope addressed 90% of the Group's profit before tax and 93% of the Group's total assets.
As key audit matters the following areas of focus have been identified: – Impairment of loans and advances to customers – Valuation of investments in life insurance policies – Provisions and contingent liabilities in respect of ongoing
disputes and litigations
Materiality The scope of our audit was influenced by our application of materiality. Our audit opinion aims to provide reasonable assurance that the consolidated financial statements are free from material misstatement. Misstatements may arise due to fraud or error. They are considered material if individually or in aggregate, they could reasonably be expected to influence the economic decisions of users taken on the basis of the consolidated financial statements.
Based on our professional judgement, we determined certain quantitative thresholds for materiality, including the overall group materiality for the consolidated financial statements as a whole as set out in the table below. These, together with qualitative considerations, helped us to determine the scope of our audit and the nature, timing and extent of our audit procedures and to evaluate the effect of
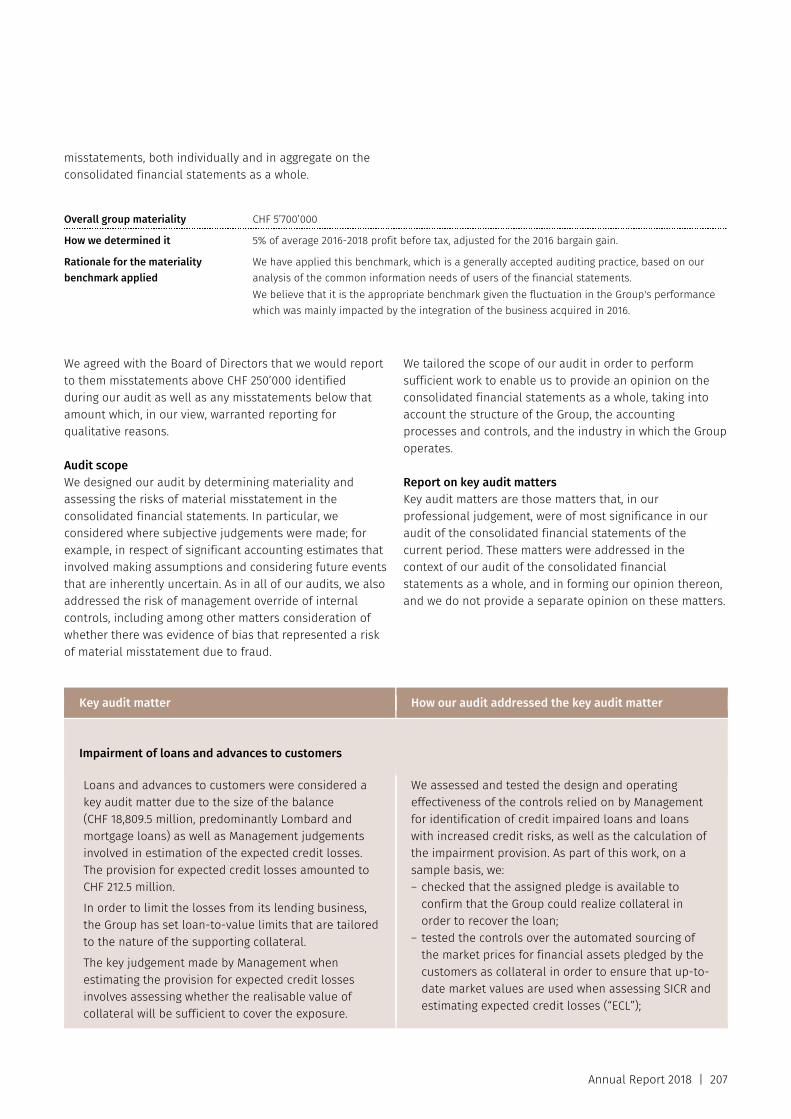
Annual Report 2018 | 207
misstatements, both individually and in aggregate on the consolidated financial statements as a whole.
Overall group materiality CHF 5’700’000
How we determined it 5% of average 2016-2018 profit before tax, adjusted for the 2016 bargain gain.
Rationale for the materiality benchmark applied
We have applied this benchmark, which is a generally accepted auditing practice, based on our analysis of the common information needs of users of the financial statements. We believe that it is the appropriate benchmark given the fluctuation in the Group's performance which was mainly impacted by the integration of the business acquired in 2016.
We agreed with the Board of Directors that we would report to them misstatements above CHF 250’000 identified during our audit as well as any misstatements below that amount which, in our view, warranted reporting for qualitative reasons.
Audit scope We designed our audit by determining materiality and assessing the risks of material misstatement in the consolidated financial statements. In particular, we considered where subjective judgements were made; for example, in respect of significant accounting estimates that involved making assumptions and considering future events that are inherently uncertain. As in all of our audits, we also addressed the risk of management override of internal controls, including among other matters consideration of whether there was evidence of bias that represented a risk of material misstatement due to fraud.
We tailored the scope of our audit in order to perform sufficient work to enable us to provide an opinion on the consolidated financial statements as a whole, taking into account the structure of the Group, the accounting processes and controls, and the industry in which the Group operates.
Report on key audit matters Key audit matters are those matters that, in our professional judgement, were of most significance in our audit of the consolidated financial statements of the current period. These matters were addressed in the context of our audit of the consolidated financial statements as a whole, and in forming our opinion thereon, and we do not provide a separate opinion on these matters.
Key audit matter How our audit addressed the key audit matter
Impairment of loans and advances to customers
Loans and advances to customers were considered a key audit matter due to the size of the balance (CHF 18,809.5 million, predominantly Lombard and mortgage loans) as well as Management judgements involved in estimation of the expected credit losses. The provision for expected credit losses amounted to CHF 212.5 million.
In order to limit the losses from its lending business, the Group has set loan-to-value limits that are tailored to the nature of the supporting collateral.
The key judgement made by Management when estimating the provision for expected credit losses involves assessing whether the realisable value of collateral will be sufficient to cover the exposure.
We assessed and tested the design and operating effectiveness of the controls relied on by Management for identification of credit impaired loans and loans with increased credit risks, as well as the calculation of the impairment provision. As part of this work, on a sample basis, we: – checked that the assigned pledge is available to
confirm that the Group could realize collateral in order to recover the loan;
– tested the controls over the automated sourcing of the market prices for financial assets pledged by the customers as collateral in order to ensure that up-to-date market values are used when assessing SICR and estimating expected credit losses (“ECL”);
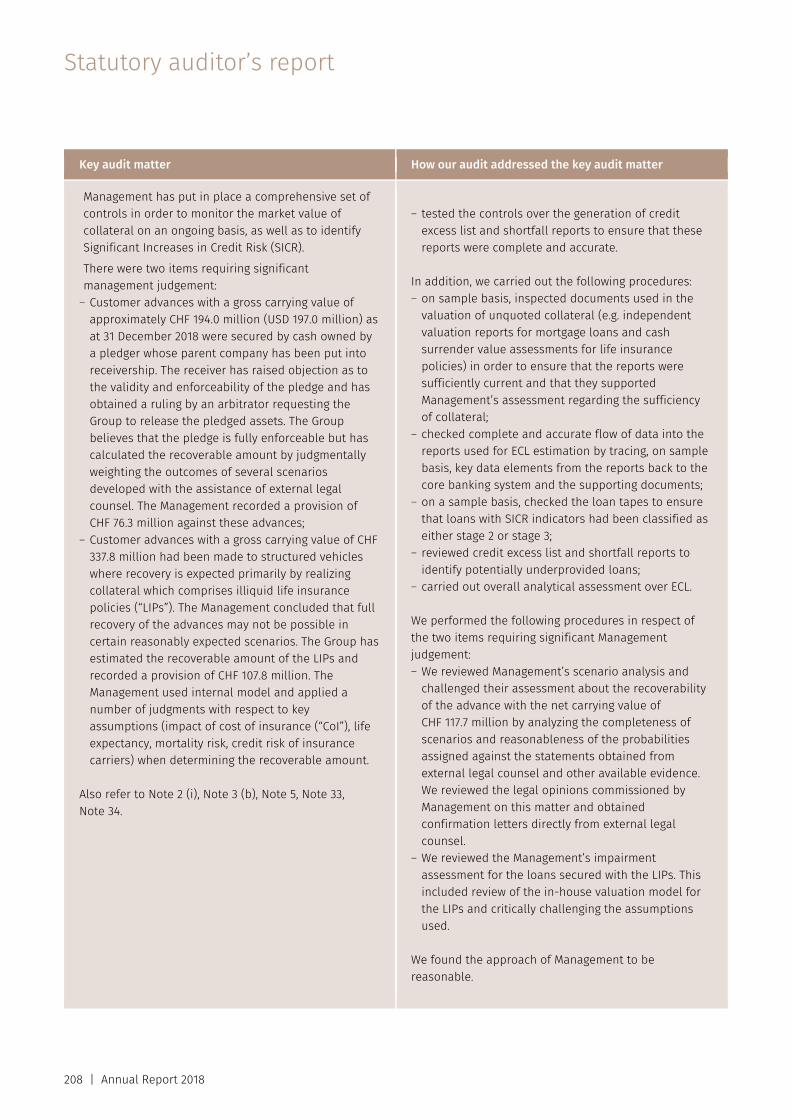
Statutory auditor’s report
208 | Annual Report 2018
Key audit matter How our audit addressed the key audit matter
Management has put in place a comprehensive set of controls in order to monitor the market value of collateral on an ongoing basis, as well as to identify Significant Increases in Credit Risk (SICR).
There were two items requiring significant management judgement:
– Customer advances with a gross carrying value of approximately CHF 194.0 million (USD 197.0 million) as at 31 December 2018 were secured by cash owned by a pledger whose parent company has been put into receivership. The receiver has raised objection as to the validity and enforceability of the pledge and has obtained a ruling by an arbitrator requesting the Group to release the pledged assets. The Group believes that the pledge is fully enforceable but has calculated the recoverable amount by judgmentally weighting the outcomes of several scenarios developed with the assistance of external legal counsel. The Management recorded a provision of CHF 76.3 million against these advances;
– Customer advances with a gross carrying value of CHF 337.8 million had been made to structured vehicles where recovery is expected primarily by realizing collateral which comprises illiquid life insurance policies (“LIPs”). The Management concluded that full recovery of the advances may not be possible in certain reasonably expected scenarios. The Group has estimated the recoverable amount of the LIPs and recorded a provision of CHF 107.8 million. The Management used internal model and applied a number of judgments with respect to key assumptions (impact of cost of insurance (“CoI”), life expectancy, mortality risk, credit risk of insurance carriers) when determining the recoverable amount.
Also refer to Note 2 (i), Note 3 (b), Note 5, Note 33, Note 34.
– tested the controls over the generation of credit
excess list and shortfall reports to ensure that these reports were complete and accurate.
In addition, we carried out the following procedures: – on sample basis, inspected documents used in the
valuation of unquoted collateral (e.g. independent valuation reports for mortgage loans and cash surrender value assessments for life insurance policies) in order to ensure that the reports were sufficiently current and that they supported Management’s assessment regarding the sufficiency of collateral;
– checked complete and accurate flow of data into the reports used for ECL estimation by tracing, on sample basis, key data elements from the reports back to the core banking system and the supporting documents;
– on a sample basis, checked the loan tapes to ensure that loans with SICR indicators had been classified as either stage 2 or stage 3;
– reviewed credit excess list and shortfall reports to identify potentially underprovided loans;
– carried out overall analytical assessment over ECL.
We performed the following procedures in respect of the two items requiring significant Management judgement: – We reviewed Management’s scenario analysis and
challenged their assessment about the recoverability of the advance with the net carrying value of CHF 117.7 million by analyzing the completeness of scenarios and reasonableness of the probabilities assigned against the statements obtained from external legal counsel and other available evidence. We reviewed the legal opinions commissioned by Management on this matter and obtained confirmation letters directly from external legal counsel.
– We reviewed the Management’s impairment assessment for the loans secured with the LIPs. This included review of the in-house valuation model for the LIPs and critically challenging the assumptions used.
We found the approach of Management to be reasonable.
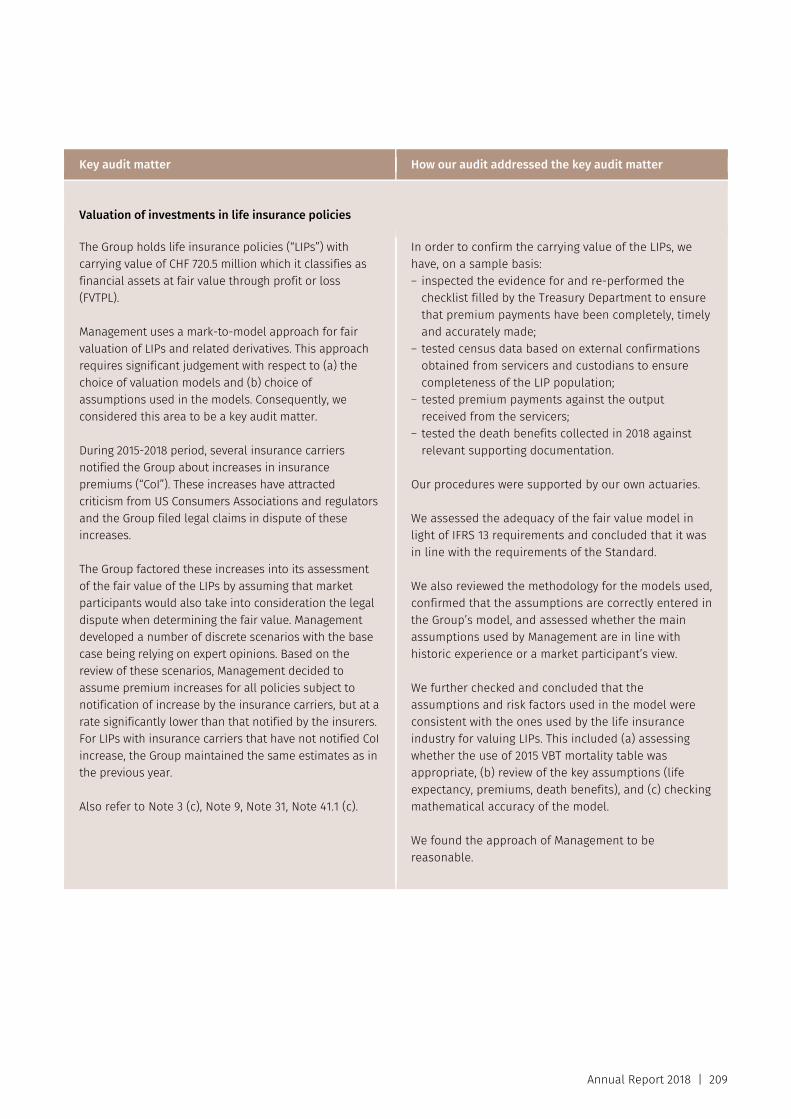
Annual Report 2018 | 209
Key audit matter How our audit addressed the key audit matter
Valuation of investments in life insurance policies
The Group holds life insurance policies (“LIPs”) with carrying value of CHF 720.5 million which it classifies as financial assets at fair value through profit or loss (FVTPL).
Management uses a mark-to-model approach for fair valuation of LIPs and related derivatives. This approach requires significant judgement with respect to (a) the choice of valuation models and (b) choice of assumptions used in the models. Consequently, we considered this area to be a key audit matter.
During 2015-2018 period, several insurance carriers notified the Group about increases in insurance premiums (“CoI”). These increases have attracted criticism from US Consumers Associations and regulators and the Group filed legal claims in dispute of these increases.
The Group factored these increases into its assessment of the fair value of the LIPs by assuming that market participants would also take into consideration the legal dispute when determining the fair value. Management developed a number of discrete scenarios with the base case being relying on expert opinions. Based on the review of these scenarios, Management decided to assume premium increases for all policies subject to notification of increase by the insurance carriers, but at a rate significantly lower than that notified by the insurers. For LIPs with insurance carriers that have not notified CoI increase, the Group maintained the same estimates as in the previous year.
Also refer to Note 3 (c), Note 9, Note 31, Note 41.1 (c).
In order to confirm the carrying value of the LIPs, we have, on a sample basis: – inspected the evidence for and re-performed the
checklist filled by the Treasury Department to ensure that premium payments have been completely, timely and accurately made;
– tested census data based on external confirmations obtained from servicers and custodians to ensure completeness of the LIP population;
– tested premium payments against the output received from the servicers;
– tested the death benefits collected in 2018 against relevant supporting documentation.
Our procedures were supported by our own actuaries.
We assessed the adequacy of the fair value model in light of IFRS 13 requirements and concluded that it was in line with the requirements of the Standard.
We also reviewed the methodology for the models used, confirmed that the assumptions are correctly entered in the Group’s model, and assessed whether the main assumptions used by Management are in line with historic experience or a market participant’s view.
We further checked and concluded that the assumptions and risk factors used in the model were consistent with the ones used by the life insurance industry for valuing LIPs. This included (a) assessing whether the use of 2015 VBT mortality table was appropriate, (b) review of the key assumptions (life expectancy, premiums, death benefits), and (c) checking mathematical accuracy of the model.
We found the approach of Management to be reasonable.
Statutory auditor’s report
210 | Annual Report 2018
Key audit matter How our audit addressed the key audit matter
Provisions and contingent liabilities in respect of ongoing disputes and litigations
We focused on this area because the Group is a defendant in a number of disputes where, as disclosed in Note 49 and Note 50, the amount of compensation claimed is significant and the impact of the cases on the financial statements depends on Management’s judgement.
Management, informed by the internal and external legal counsels, makes judgements about the probability of outcomes and magnitude of the liabilities arising from claims which are subject to the future outcome of legal processes. Per Note 49, as of 31 December 2018, the Group had recognised provisions of CHF 129.2 million for litigations and other claims.
Also refer to Note 2 (o), Note 3 (f), Note 49, Note 50.
In view of the significant judgements required, we discussed the outstanding claims against the Group with Management (including in-house counsel), evaluated the Management’s assessment of the nature and status of claims and sought additional evidence we considered appropriate.
We examined the Management’s conclusions with respect to the provisions and disclosures made for significant cases, both considering the correspondence between the Group and its external legal counsel and obtaining confirmation letters (with status and outlook of the case) directly from the external legal counsel.
We further reviewed the disclosures for cases provided for (Note 49) and contingent liabilities (Note 50) to ensure that they were in line with the reports provided by the external legal counsels.
We concluded that the judgements and disclosures made were reasonable.
Other information in the annual report The Board of Directors is responsible for the other information in the annual report. The other information comprises all information included in the annual report, but does not include the consolidated financial statements, the stand alone financial statements and the compensation report of EFG International AG and our auditor’s reports thereon.
Our opinion on the consolidated financial statements does not cover the other information in the annual report and we do not express any form of assurance conclusion thereon.
In connection with our audit of the consolidated financial statements, our responsibility is to read the other information in the annual report and, in doing so, consider whether the other information is materially inconsistent with the consolidated financial statements or our knowledge obtained in the audit, or otherwise appears to be materially misstated. If, based on the work we have performed, we conclude that there is a material misstatement of this other information, we are required to report that fact. We have nothing to report in this regard.
Responsibilities of the Board of Directors for the consolidated financial statements The Board of Directors is responsible for the preparation of the consolidated financial statements that give a true and fair view in accordance with the IFRS, the provisions of Swiss law, and for such internal control as the Board of Directors determines is necessary to enable the preparation of consolidated financial statements that are free from material misstatement, whether due to fraud or error.
In preparing the consolidated financial statements, the Board of Directors is responsible for assessing the Group's ability to continue as a going concern, disclosing, as applicable, matters related to going concern and using the going concern basis of accounting unless the Board of Directors either intends to liquidate the Group or to cease operations, or has no realistic alternative but to do so.
Auditor’s responsibilities for the audit of the consolidated financial statements Our objectives are to obtain reasonable assurance about whether the consolidated financial statements as a whole are free from material misstatement, whether due to fraud
Annual Report 2018 | 211
or error, and to issue an auditor’s report that includes our opinion. Reasonable assurance is a high level of assurance, but is not a guarantee that an audit conducted in accordance with Swiss law, ISAs and Swiss Auditing Standards will always detect a material misstatement when it exists. Misstatements can arise from fraud or error and are considered material if, individually or in the aggregate, they could reasonably be expected to influence the economic decisions of users taken on the basis of these consolidated financial statements.
As part of an audit in accordance with Swiss law, ISAs and Swiss Auditing Standards, we exercise professional judgment and maintain professional scepticism throughout the audit. We also: – Identify and assess the risks of material misstatement of
the consolidated financial statements, whether due to fraud or error, design and perform audit procedures re-sponsive to those risks, and obtain audit evidence that is sufficient and appropriate to provide a basis for our opinion. The risk of not detecting a material misstatement resulting from fraud is higher than for one resulting from error, as fraud may involve collusion, forgery, intentional omissions, misrepresentations, or the override of internal control.
– Evaluate the appropriateness of accounting policies used and the reasonableness of accounting estimates and related disclosures made.
– Obtain an understanding of internal control relevant to the audit in order to design audit procedures that are appropriate in the circumstances, but not for the purpose of expressing an opinion on the effectiveness of the Group's internal control.
– Conclude on the appropriateness of Board of Directors' use of the going concern basis of accounting and, based on the audit evidence obtained, whether a material uncertainty exists related to events or conditions that may cast significant doubt on the Group's ability to continue as a going concern. If we conclude that a material uncertainty exists, we are required to draw attention in our auditor’s report to the related disclosures in the consolidated financial statements or, if such disclosures are inadequate, to modify our opinion. Our conclusions are based on the audit evidence obtained up to the date of our auditor’s report. However, future events or conditions may cause the Group to cease to continue as a going concern.
– Obtain sufficient appropriate audit evidence regarding the financial information of the entities or business activities within the Group to express an opinion on the consolidated financial statements. We are responsible for the direction, supervision and performance of the Group audit. We remain solely responsible for our audit opinion.
We communicate with the Board of Directors or its relevant committee regarding, among other matters, the planned scope and timing of the audit and significant audit findings, including any significant deficiencies in internal control that we identify during our audit.
We also provide the Board of Directors or its relevant committee with a statement that we have complied with relevant ethical requirements regarding independence, and to communicate with them all relationships and other matters that may reasonably be thought to bear on our independence, and where applicable, related safeguards.
From the matters communicated with the Board of Directors or its relevant committee, we determine those matters that were of most significance in the audit of the consolidated financial statements of the current period and are therefore the key audit matters. We describe these matters in our auditor’s report unless law or regulation precludes public disclosure about the matter or when, in extremely rare circumstances, we determine that a matter should not be communicated in our report because the adverse conse-quences of doing so would reasonably be expected to out-weigh the public interest benefits of such communication.
Report on other legal and regulatory requirements In accordance with article 728a paragraph 1 item 3 CO and Swiss Auditing Standard 890, we confirm that an internal control system exists which has been designed for the preparation of consolidated financial statements according to the instructions of the Board of Directors.
We recommend that the consolidated financial statements submitted to you be approved.
PricewaterhouseCoopers Ltd
Christophe Kratzer Thomas Romer Audit expert Audit expert Auditor in charge Geneva, 12 March 2019

212 | Annual Report 2018
EFG International, Zurich Parent Company Financial Statements for the year ended 31 December 2018
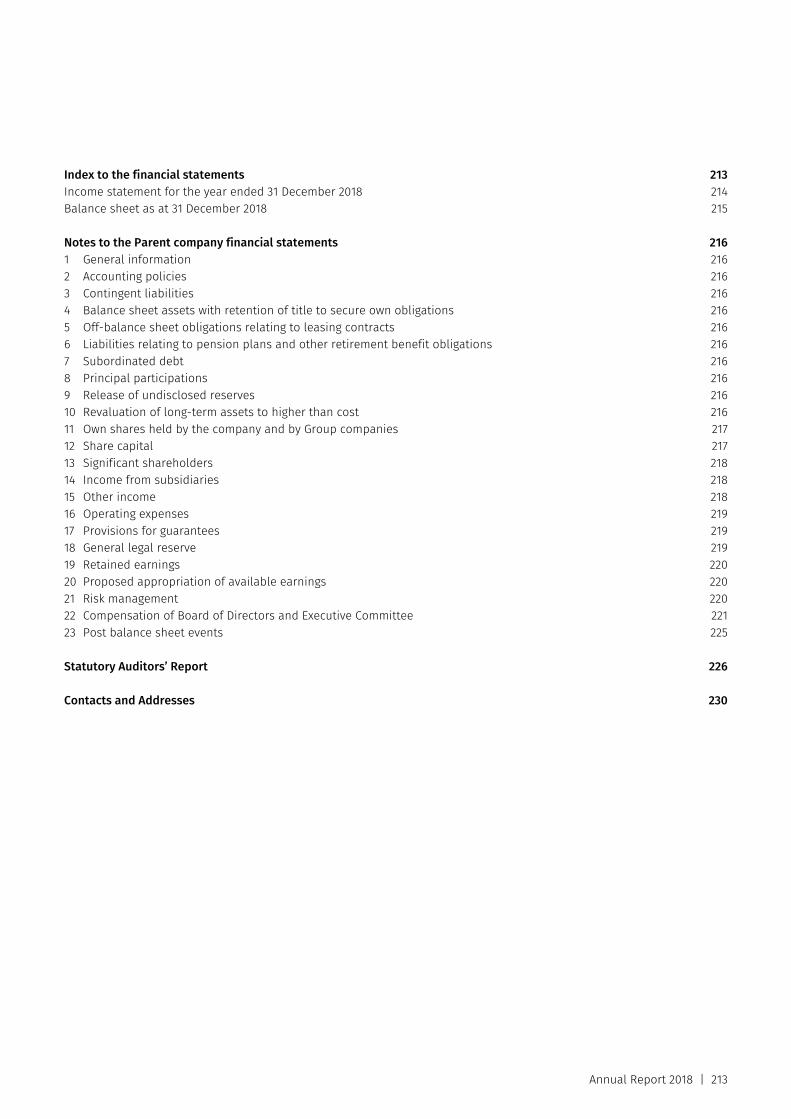
Annual Report 2018 | 213
Index to the financial statements 213 Income statement for the year ended 31 December 2018 214 Balance sheet as at 31 December 2018 215
Notes to the Parent company financial statements 216 1 General information 216 2 Accounting policies 216 3 Contingent liabilities 216 4 Balance sheet assets with retention of title to secure own obligations 216 5 Off-balance sheet obligations relating to leasing contracts 216 6 Liabilities relating to pension plans and other retirement benefit obligations 216 7 Subordinated debt 216 8 Principal participations 216 9 Release of undisclosed reserves 216 10 Revaluation of long-term assets to higher than cost 216 11 Own shares held by the company and by Group companies 217 12 Share capital 217 13 Significant shareholders 218 14 Income from subsidiaries 218 15 Other income 218 16 Operating expenses 219 17 Provisions for guarantees 219 18 General legal reserve 219 19 Retained earnings 220 20 Proposed appropriation of available earnings 220 21 Risk management 220 22 Compensation of Board of Directors and Executive Committee 221 23 Post balance sheet events 225
Statutory Auditors’ Report 226
Contacts and Addresses 230
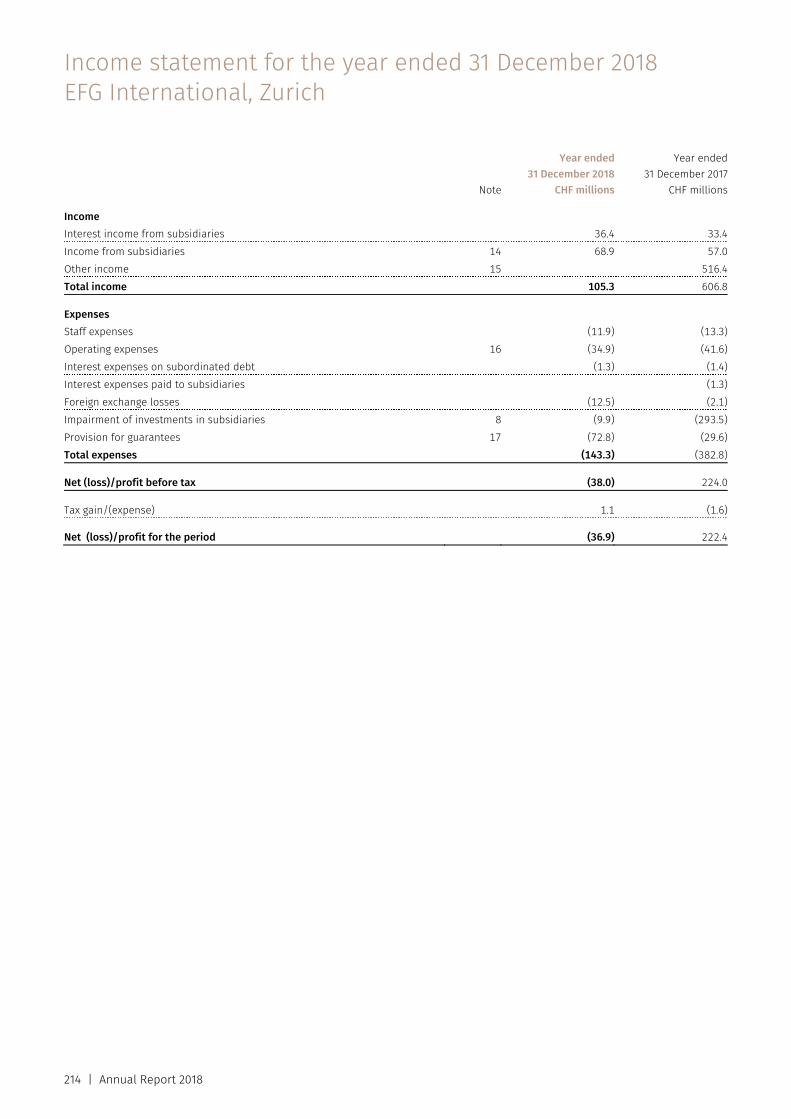
214 | Annual Report 2018
Note
Year ended 31 December 2018
CHF millions
Year ended31 December 2017
CHF millions Income Interest income from subsidiaries 36.4 33.4Income from subsidiaries 14 68.9 57.0Other income 15 516.4Total income 105.3 606.8 Expenses Staff expenses (11.9) (13.3)Operating expenses 16 (34.9) (41.6)Interest expenses on subordinated debt (1.3) (1.4)Interest expenses paid to subsidiaries (1.3)Foreign exchange losses (12.5) (2.1)Impairment of investments in subsidiaries 8 (9.9) (293.5)Provision for guarantees 17 (72.8) (29.6)Total expenses (143.3) (382.8) Net (loss)/profit before tax (38.0) 224.0 Tax gain/(expense) 1.1 (1.6) Net (loss)/profit for the period (36.9) 222.4
Income statement for the year ended 31 December 2018 EFG International, Zurich
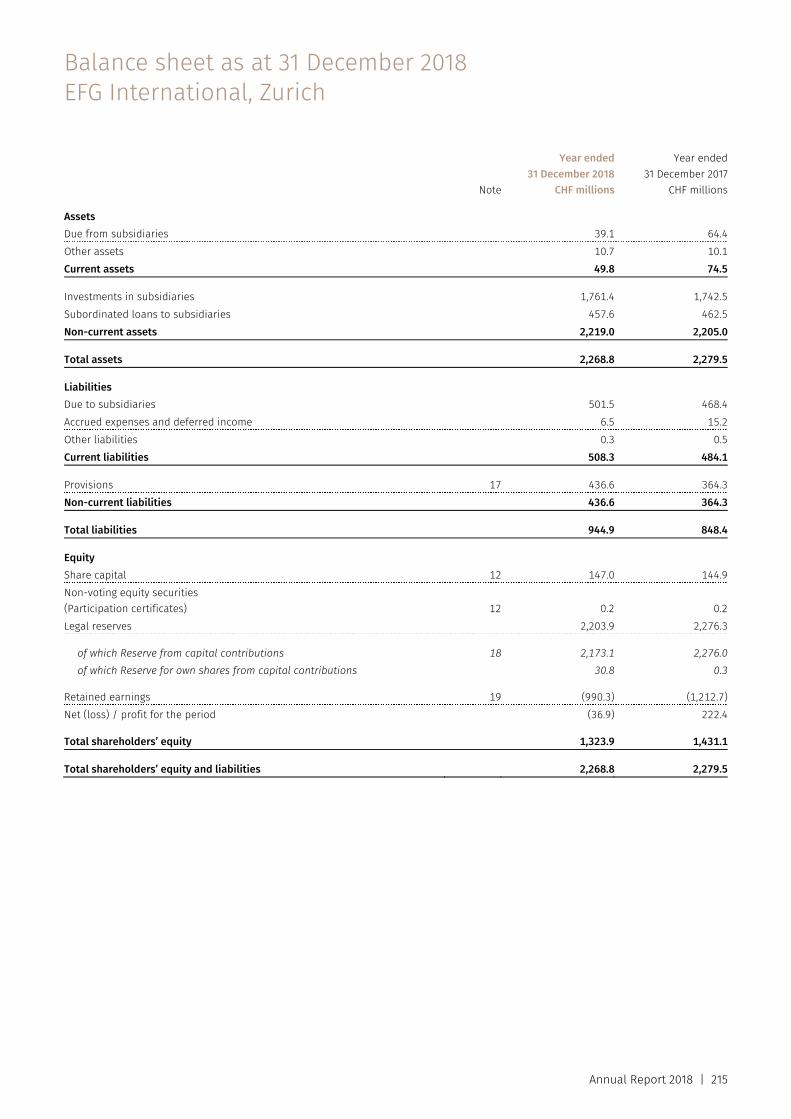
Annual Report 2018 | 215
Note
Year ended31 December 2018
CHF millions
Year ended31 December 2017
CHF millions Assets Due from subsidiaries 39.1 64.4Other assets 10.7 10.1Current assets 49.8 74.5 Investments in subsidiaries 1,761.4 1,742.5Subordinated loans to subsidiaries 457.6 462.5Non-current assets 2,219.0 2,205.0 Total assets 2,268.8 2,279.5 Liabilities Due to subsidiaries 501.5 468.4Accrued expenses and deferred income 6.5 15.2Other liabilities 0.3 0.5Current liabilities 508.3 484.1 Provisions 17 436.6 364.3Non-current liabilities 436.6 364.3 Total liabilities 944.9 848.4 Equity Share capital 12 147.0 144.9Non-voting equity securities (Participation certificates) 12 0.2 0.2Legal reserves 2,203.9 2,276.3
of which Reserve from capital contributions 18 2,173.1 2,276.0of which Reserve for own shares from capital contributions 30.8 0.3
Retained earnings 19 (990.3) (1,212.7)Net (loss) / profit for the period (36.9) 222.4 Total shareholders’ equity 1,323.9 1,431.1 Total shareholders’ equity and liabilities 2,268.8 2,279.5
Balance sheet as at 31 December 2018 EFG International, Zurich
Notes to the financial statements EFG International, Zurich
216 | Annual Report 2018
1. General information
EFG International AG is incorporated and domiciled in Switzerland. Its registered office is at Bleicherweg 8, 8022 Zurich.
2. Accounting policies
The EFG International AG standalone financial statements are prepared in accordance with the principles of the Swiss Law on Accounting Law (art. 957 to 963b of the Swiss Code of Obligations). As the Group is preparing its consolidated financial statements in accordance with IFRS, EFG International AG (standalone) is exempt from various disclosures in the standalone financial statements.
The standalone financial statements of EFG International AG are presented in CHF, its functional currency. Assets and liabilities denominated in foreign currencies are converted at rates of exchange prevailing at year end, which are presented in note 2 (c) of the consolidated financial statements.
Investments in subsidiaries Investments in subsidiaries are equity interests and are directly held subsidiaries through which EFG International conducts its business on a global basis. They are measured individually and carried at historical cost less any impairments.
Provisions Provisions are recognised when: a) There is a present legal or constructive obligation
as a result of past events b) It is probable that an outflow of economic benefits will
be required to settle the obligation c) Reliable estimates of the amount of the obligation
can be made
3. Contingent liabilities
EFG International AG has entered into several guarantee agreements mainly with subsidiaries which could theoreti-cally lead to potential obligations of CHF 3,746 million (2017: CHF 4,265 million). Included in this amount is CHF 3,075 million (2017: CHF 3,276 million) related to structured products issued by a fellow subsidiary company (which does not have a stand-alone credit rating) and are guaranteed by EFG International AG (which does have a credit rating). The risks related to these liabilities of the subsidiary are fully hedged by the subsidiary and are fully
collateralised in the subsidiary by equal valued assets (primarily cash deposits).
4. Balance sheet assets with retention of title to secure own obligations
There are no such assets.
5. Off-balance sheet obligations relating to leasing contracts
There are no such obligations.
6. Liabilities relating to pension plans and other retirement benefit obligations
There are no such liabilities.
7. Subordinated debt
There are no such liabilities.
8. Principal participations
The company’s principal participations are shown in the note 43 to the consolidated financial statements.
In the current year the company impaired the carrying value of investments in subsidiaries by CHF 9.9 million (2017: CHF 293.5 million) where capital was invested in subsidiaries with net asset values below the carrying value of the subsidiaries. The existing carrying value is still below its original acquisition cost.
9. Release of undisclosed reserves
During the period, no undisclosed reserves were released (2017: nil).
10. Revaluation of long-term assets to higher than cost
There was no such revaluation.
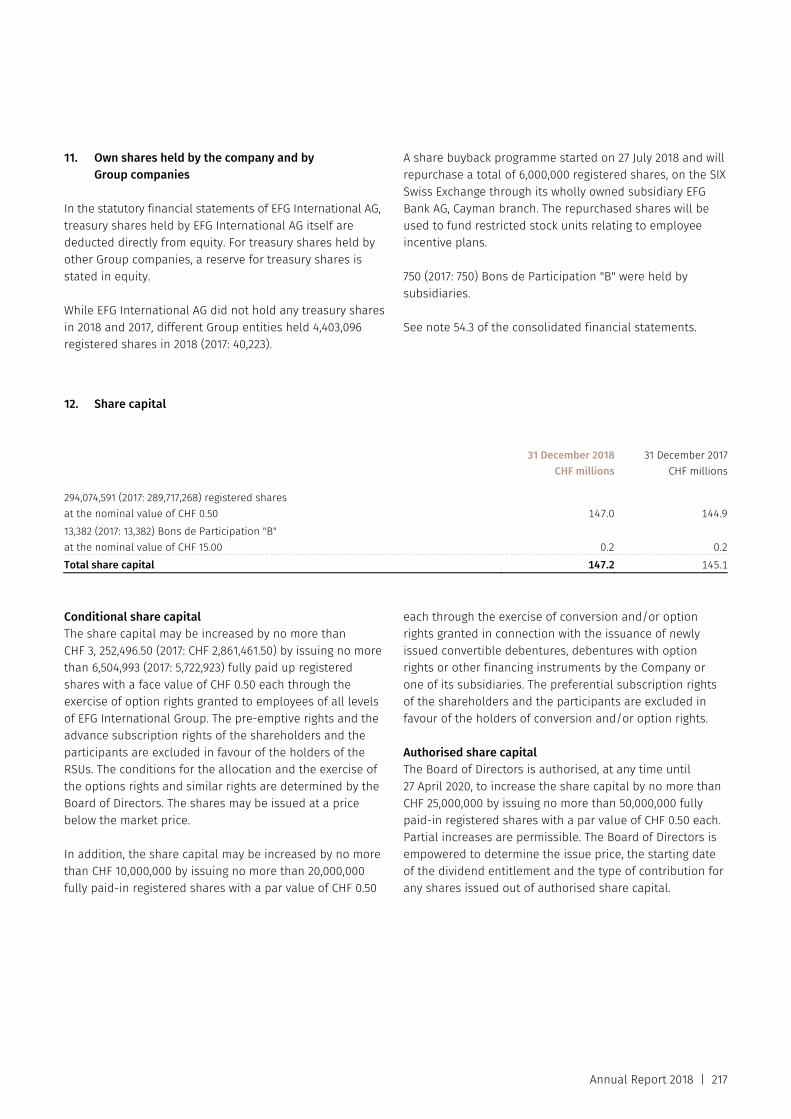
Annual Report 2018 | 217
11. Own shares held by the company and by Group companies
In the statutory financial statements of EFG International AG, treasury shares held by EFG International AG itself are deducted directly from equity. For treasury shares held by other Group companies, a reserve for treasury shares is stated in equity.
While EFG International AG did not hold any treasury shares in 2018 and 2017, different Group entities held 4,403,096 registered shares in 2018 (2017: 40,223).
A share buyback programme started on 27 July 2018 and will repurchase a total of 6,000,000 registered shares, on the SIX Swiss Exchange through its wholly owned subsidiary EFG Bank AG, Cayman branch. The repurchased shares will be used to fund restricted stock units relating to employee incentive plans.
750 (2017: 750) Bons de Participation "B" were held by subsidiaries.
See note 54.3 of the consolidated financial statements.
12. Share capital
31 December 2018
CHF millions31 December 2017
CHF millions 294,074,591 (2017: 289,717,268) registered shares at the nominal value of CHF 0.50 147.0 144.913,382 (2017: 13,382) Bons de Participation "B" at the nominal value of CHF 15.00 0.2 0.2Total share capital 147.2 145.1
Conditional share capital The share capital may be increased by no more than CHF 3, 252,496.50 (2017: CHF 2,861,461.50) by issuing no more than 6,504,993 (2017: 5,722,923) fully paid up registered shares with a face value of CHF 0.50 each through the exercise of option rights granted to employees of all levels of EFG International Group. The pre-emptive rights and the advance subscription rights of the shareholders and the participants are excluded in favour of the holders of the RSUs. The conditions for the allocation and the exercise of the options rights and similar rights are determined by the Board of Directors. The shares may be issued at a price below the market price.
In addition, the share capital may be increased by no more than CHF 10,000,000 by issuing no more than 20,000,000 fully paid-in registered shares with a par value of CHF 0.50
each through the exercise of conversion and/or option rights granted in connection with the issuance of newly issued convertible debentures, debentures with option rights or other financing instruments by the Company or one of its subsidiaries. The preferential subscription rights of the shareholders and the participants are excluded in favour of the holders of conversion and/or option rights.
Authorised share capital The Board of Directors is authorised, at any time until 27 April 2020, to increase the share capital by no more than CHF 25,000,000 by issuing no more than 50,000,000 fully paid-in registered shares with a par value of CHF 0.50 each. Partial increases are permissible. The Board of Directors is empowered to determine the issue price, the starting date of the dividend entitlement and the type of contribution for any shares issued out of authorised share capital.
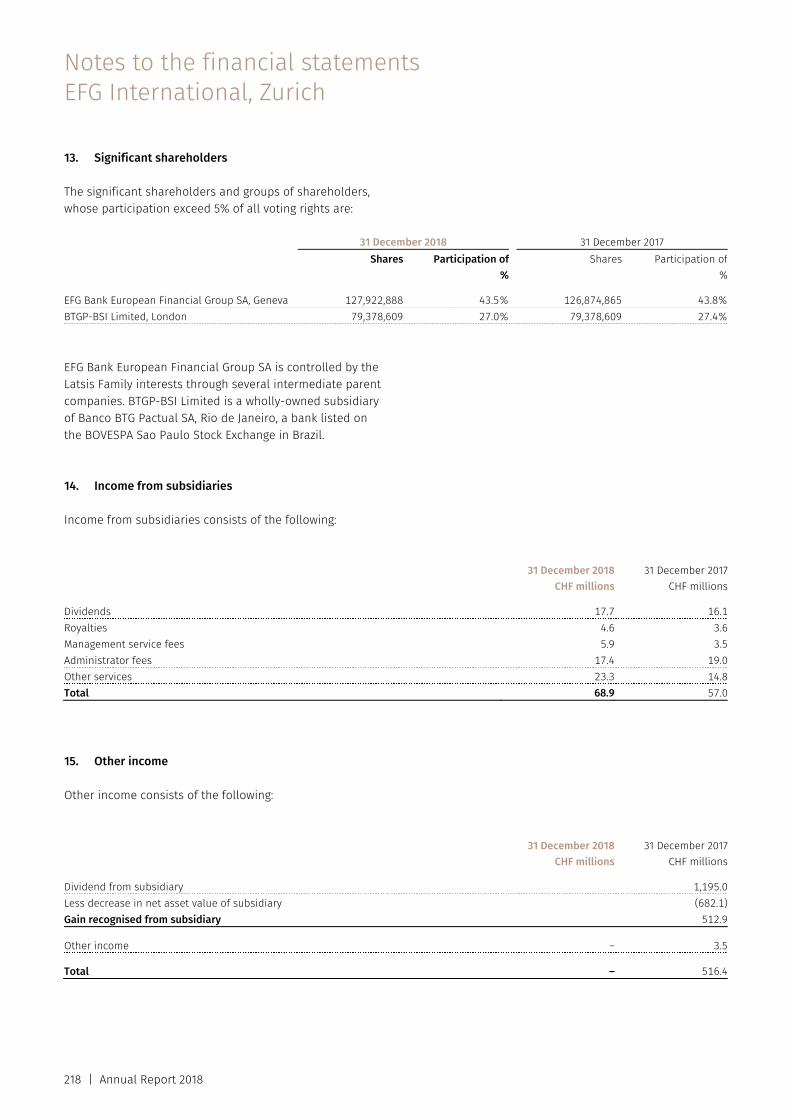
Notes to the financial statements EFG International, Zurich
218 | Annual Report 2018
13. Significant shareholders
The significant shareholders and groups of shareholders, whose participation exceed 5% of all voting rights are:
31 December 2018 31 December 2017 Shares Participation of Shares Participation of % % EFG Bank European Financial Group SA, Geneva 127,922,888 43.5% 126,874,865 43.8%BTGP-BSI Limited, London 79,378,609 27.0% 79,378,609 27.4% EFG Bank European Financial Group SA is controlled by the Latsis Family interests through several intermediate parent companies. BTGP-BSI Limited is a wholly-owned subsidiary of Banco BTG Pactual SA, Rio de Janeiro, a bank listed on the BOVESPA Sao Paulo Stock Exchange in Brazil.
14. Income from subsidiaries
Income from subsidiaries consists of the following:
31 December 2018
CHF millions31 December 2017
CHF millions Dividends 17.7 16.1Royalties 4.6 3.6Management service fees 5.9 3.5Administrator fees 17.4 19.0Other services 23.3 14.8Total 68.9 57.0
15. Other income
Other income consists of the following:
31 December 2018
CHF millions31 December 2017
CHF millions Dividend from subsidiary 1,195.0Less decrease in net asset value of subsidiary (682.1)Gain recognised from subsidiary 512.9 Other income – 3.5 Total – 516.4
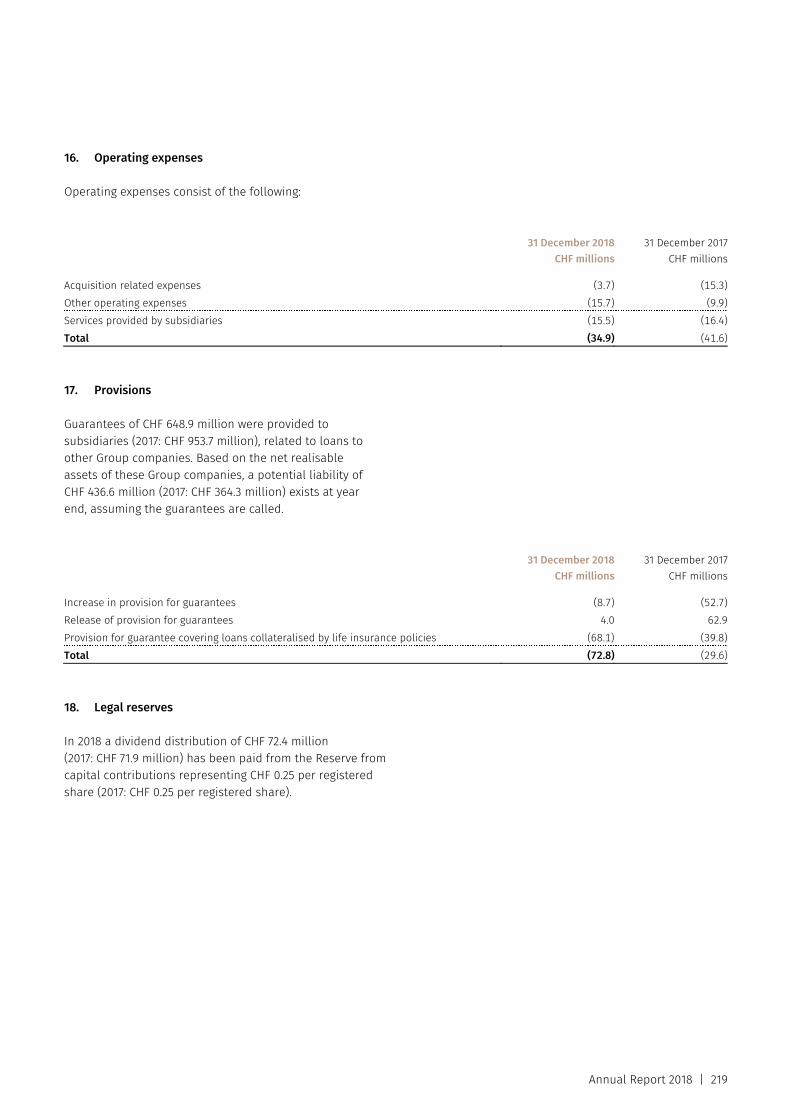
Annual Report 2018 | 219
16. Operating expenses
Operating expenses consist of the following:
31 December 2018
CHF millions31 December 2017
CHF millions Acquisition related expenses (3.7) (15.3)Other operating expenses (15.7) (9.9)Services provided by subsidiaries (15.5) (16.4)Total (34.9) (41.6)
17. Provisions
Guarantees of CHF 648.9 million were provided to subsidiaries (2017: CHF 953.7 million), related to loans to other Group companies. Based on the net realisable assets of these Group companies, a potential liability of CHF 436.6 million (2017: CHF 364.3 million) exists at year end, assuming the guarantees are called.
31 December 2018
CHF millions31 December 2017
CHF millions Increase in provision for guarantees (8.7) (52.7)Release of provision for guarantees 4.0 62.9Provision for guarantee covering loans collateralised by life insurance policies (68.1) (39.8)Total (72.8) (29.6)
18. Legal reserves
In 2018 a dividend distribution of CHF 72.4 million (2017: CHF 71.9 million) has been paid from the Reserve from capital contributions representing CHF 0.25 per registered share (2017: CHF 0.25 per registered share).
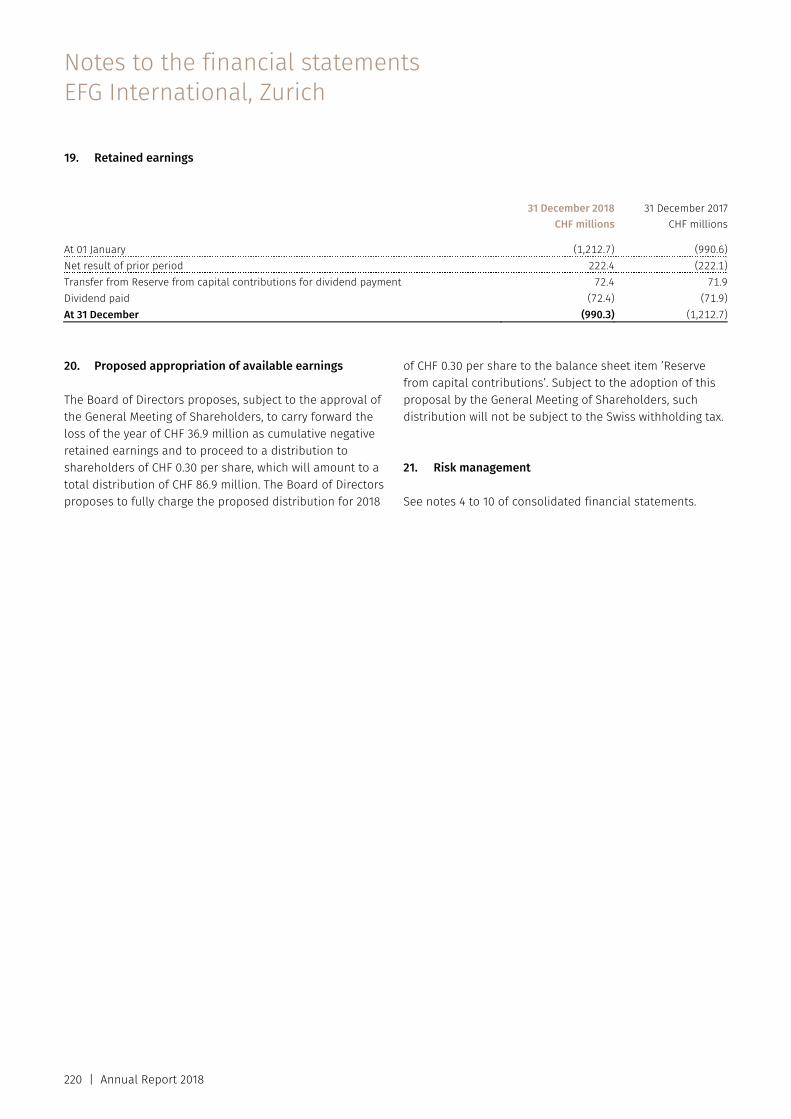
Notes to the financial statements EFG International, Zurich
220 | Annual Report 2018
19. Retained earnings
31 December 2018
CHF millions31 December 2017
CHF millions At 01 January (1,212.7) (990.6)Net result of prior period 222.4 (222.1)Transfer from Reserve from capital contributions for dividend payment 72.4 71.9Dividend paid (72.4) (71.9)At 31 December (990.3) (1,212.7) 20. Proposed appropriation of available earnings
The Board of Directors proposes, subject to the approval of the General Meeting of Shareholders, to carry forward the loss of the year of CHF 36.9 million as cumulative negative retained earnings and to proceed to a distribution to shareholders of CHF 0.30 per share, which will amount to a total distribution of CHF 86.9 million. The Board of Directors proposes to fully charge the proposed distribution for 2018
of CHF 0.30 per share to the balance sheet item ’Reserve from capital contributions’. Subject to the adoption of this proposal by the General Meeting of Shareholders, such distribution will not be subject to the Swiss withholding tax.
21. Risk management
See notes 4 to 10 of consolidated financial statements.
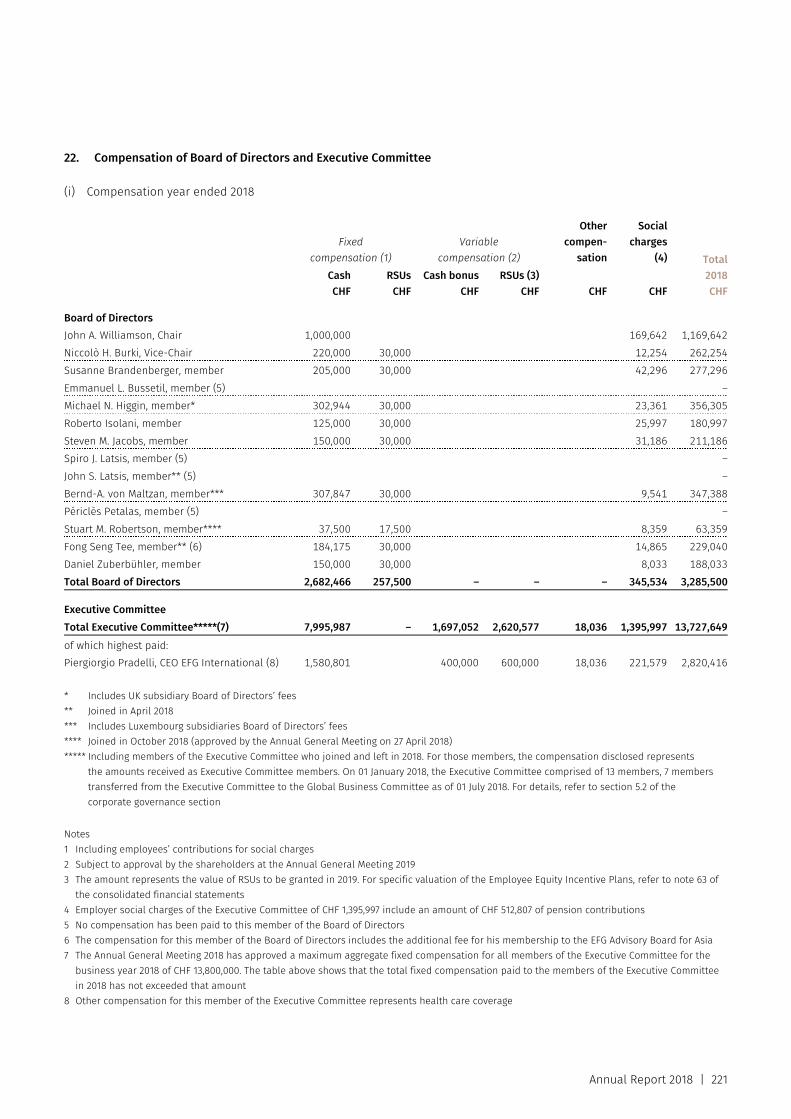
Annual Report 2018 | 221
22. Compensation of Board of Directors and Executive Committee
(i) Compensation year ended 2018
Fixed compensation (1)
Variable compensation (2)
Othercompen-
sation
Social charges
(4) Total2018CHF
CashCHF
RSUsCHF
Cash bonusCHF
RSUs (3)CHF CHF CHF
Board of Directors John A. Williamson, Chair 1,000,000 169,642 1,169,642Niccolò H. Burki, Vice-Chair 220,000 30,000 12,254 262,254Susanne Brandenberger, member 205,000 30,000 42,296 277,296Emmanuel L. Bussetil, member (5) –Michael N. Higgin, member* 302,944 30,000 23,361 356,305Roberto Isolani, member 125,000 30,000 25,997 180,997Steven M. Jacobs, member 150,000 30,000 31,186 211,186Spiro J. Latsis, member (5) –John S. Latsis, member** (5) –Bernd-A. von Maltzan, member*** 307,847 30,000 9,541 347,388Périclès Petalas, member (5) –Stuart M. Robertson, member**** 37,500 17,500 8,359 63,359Fong Seng Tee, member** (6) 184,175 30,000 14,865 229,040Daniel Zuberbühler, member 150,000 30,000 8,033 188,033Total Board of Directors 2,682,466 257,500 – – – 345,534 3,285,500 Executive Committee Total Executive Committee*****(7) 7,995,987 – 1,697,052 2,620,577 18,036 1,395,997 13,727,649of which highest paid: Piergiorgio Pradelli, CEO EFG International (8) 1,580,801 400,000 600,000 18,036 221,579 2,820,416 * Includes UK subsidiary Board of Directors’ fees ** Joined in April 2018 *** Includes Luxembourg subsidiaries Board of Directors’ fees **** Joined in October 2018 (approved by the Annual General Meeting on 27 April 2018) ***** Including members of the Executive Committee who joined and left in 2018. For those members, the compensation disclosed represents
the amounts received as Executive Committee members. On 01 January 2018, the Executive Committee comprised of 13 members, 7 members transferred from the Executive Committee to the Global Business Committee as of 01 July 2018. For details, refer to section 5.2 of the corporate governance section
Notes 1 Including employees’ contributions for social charges 2 Subject to approval by the shareholders at the Annual General Meeting 2019 3 The amount represents the value of RSUs to be granted in 2019. For specific valuation of the Employee Equity Incentive Plans, refer to note 63 of
the consolidated financial statements 4 Employer social charges of the Executive Committee of CHF 1,395,997 include an amount of CHF 512,807 of pension contributions 5 No compensation has been paid to this member of the Board of Directors 6 The compensation for this member of the Board of Directors includes the additional fee for his membership to the EFG Advisory Board for Asia 7 The Annual General Meeting 2018 has approved a maximum aggregate fixed compensation for all members of the Executive Committee for the
business year 2018 of CHF 13,800,000. The table above shows that the total fixed compensation paid to the members of the Executive Committee in 2018 has not exceeded that amount
8 Other compensation for this member of the Executive Committee represents health care coverage
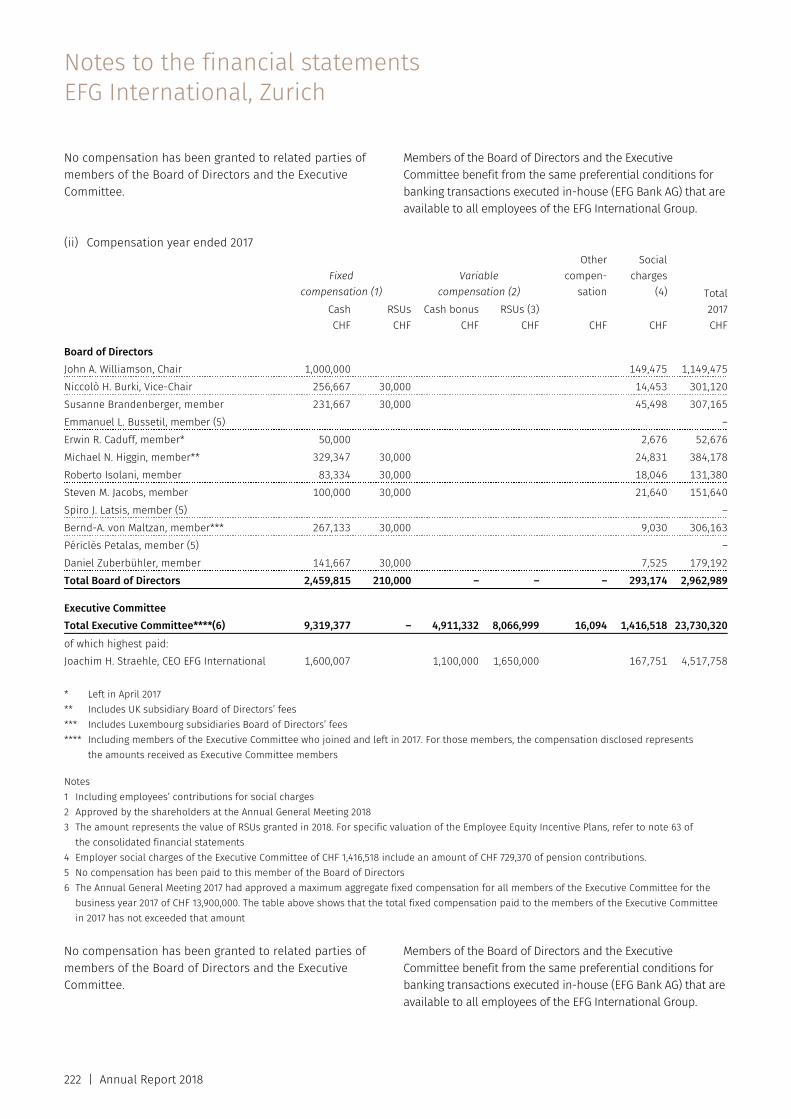
Notes to the financial statements EFG International, Zurich
222 | Annual Report 2018
No compensation has been granted to related parties of members of the Board of Directors and the Executive Committee.
Members of the Board of Directors and the Executive Committee benefit from the same preferential conditions for banking transactions executed in-house (EFG Bank AG) that are available to all employees of the EFG International Group.
(ii) Compensation year ended 2017
Fixed compensation (1)
Variable compensation (2)
Othercompen-
sation
Socialcharges
(4) Total2017CHF
CashCHF
RSUsCHF
Cash bonusCHF
RSUs (3)CHF CHF CHF
Board of Directors John A. Williamson, Chair 1,000,000 149,475 1,149,475Niccolò H. Burki, Vice-Chair 256,667 30,000 14,453 301,120Susanne Brandenberger, member 231,667 30,000 45,498 307,165Emmanuel L. Bussetil, member (5) –Erwin R. Caduff, member* 50,000 2,676 52,676Michael N. Higgin, member** 329,347 30,000 24,831 384,178Roberto Isolani, member 83,334 30,000 18,046 131,380Steven M. Jacobs, member 100,000 30,000 21,640 151,640Spiro J. Latsis, member (5) –Bernd-A. von Maltzan, member*** 267,133 30,000 9,030 306,163Périclès Petalas, member (5) –Daniel Zuberbühler, member 141,667 30,000 7,525 179,192Total Board of Directors 2,459,815 210,000 – – – 293,174 2,962,989 Executive Committee Total Executive Committee****(6) 9,319,377 – 4,911,332 8,066,999 16,094 1,416,518 23,730,320of which highest paid: Joachim H. Straehle, CEO EFG International 1,600,007 1,100,000 1,650,000 167,751 4,517,758 * Left in April 2017 ** Includes UK subsidiary Board of Directors’ fees *** Includes Luxembourg subsidiaries Board of Directors’ fees **** Including members of the Executive Committee who joined and left in 2017. For those members, the compensation disclosed represents
the amounts received as Executive Committee members Notes 1 Including employees’ contributions for social charges 2 Approved by the shareholders at the Annual General Meeting 2018 3 The amount represents the value of RSUs granted in 2018. For specific valuation of the Employee Equity Incentive Plans, refer to note 63 of
the consolidated financial statements 4 Employer social charges of the Executive Committee of CHF 1,416,518 include an amount of CHF 729,370 of pension contributions. 5 No compensation has been paid to this member of the Board of Directors 6 The Annual General Meeting 2017 had approved a maximum aggregate fixed compensation for all members of the Executive Committee for the
business year 2017 of CHF 13,900,000. The table above shows that the total fixed compensation paid to the members of the Executive Committee in 2017 has not exceeded that amount
No compensation has been granted to related parties of members of the Board of Directors and the Executive Committee.
Members of the Board of Directors and the Executive Committee benefit from the same preferential conditions for banking transactions executed in-house (EFG Bank AG) that are available to all employees of the EFG International Group.
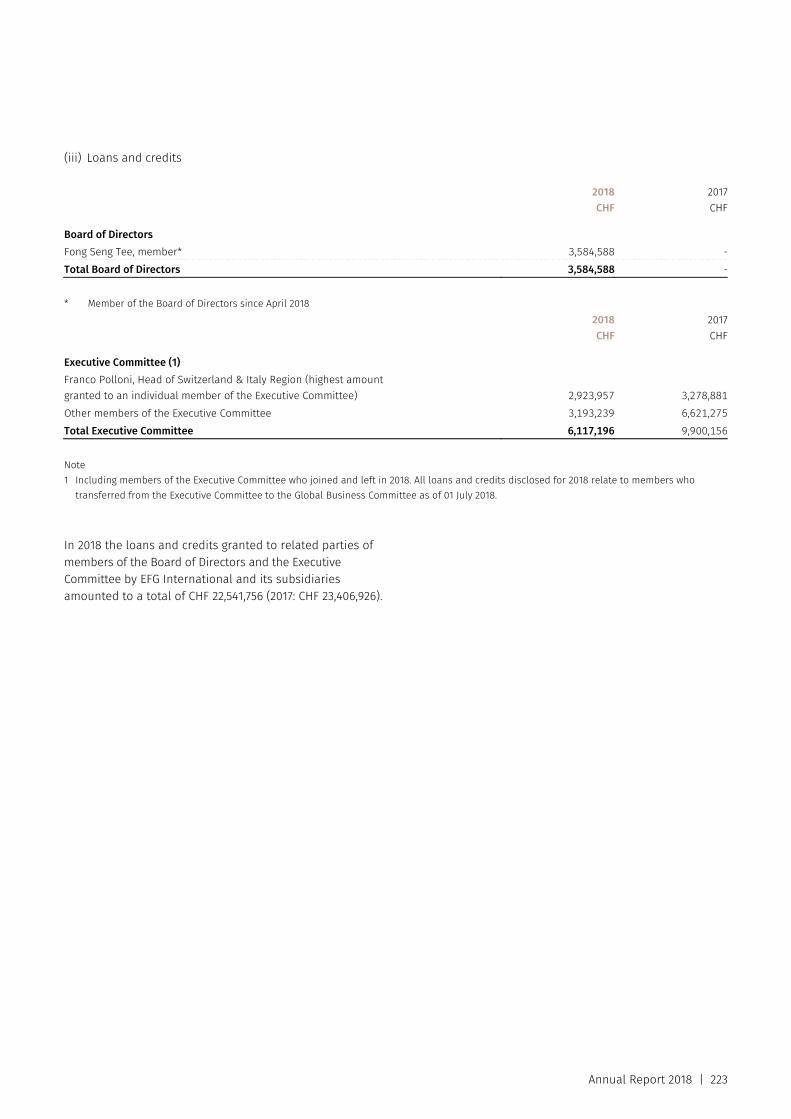
Annual Report 2018 | 223
(iii) Loans and credits
2018CHF
2017CHF
Board of Directors Fong Seng Tee, member* 3,584,588 -Total Board of Directors 3,584,588 -
* Member of the Board of Directors since April 2018
2018CHF
2017CHF
Executive Committee (1) Franco Polloni, Head of Switzerland & Italy Region (highest amount granted to an individual member of the Executive Committee) 2,923,957 3,278,881Other members of the Executive Committee 3,193,239 6,621,275Total Executive Committee 6,117,196 9,900,156
Note 1 Including members of the Executive Committee who joined and left in 2018. All loans and credits disclosed for 2018 relate to members who
transferred from the Executive Committee to the Global Business Committee as of 01 July 2018.
In 2018 the loans and credits granted to related parties of members of the Board of Directors and the Executive Committee by EFG International and its subsidiaries amounted to a total of CHF 22,541,756 (2017: CHF 23,406,926).
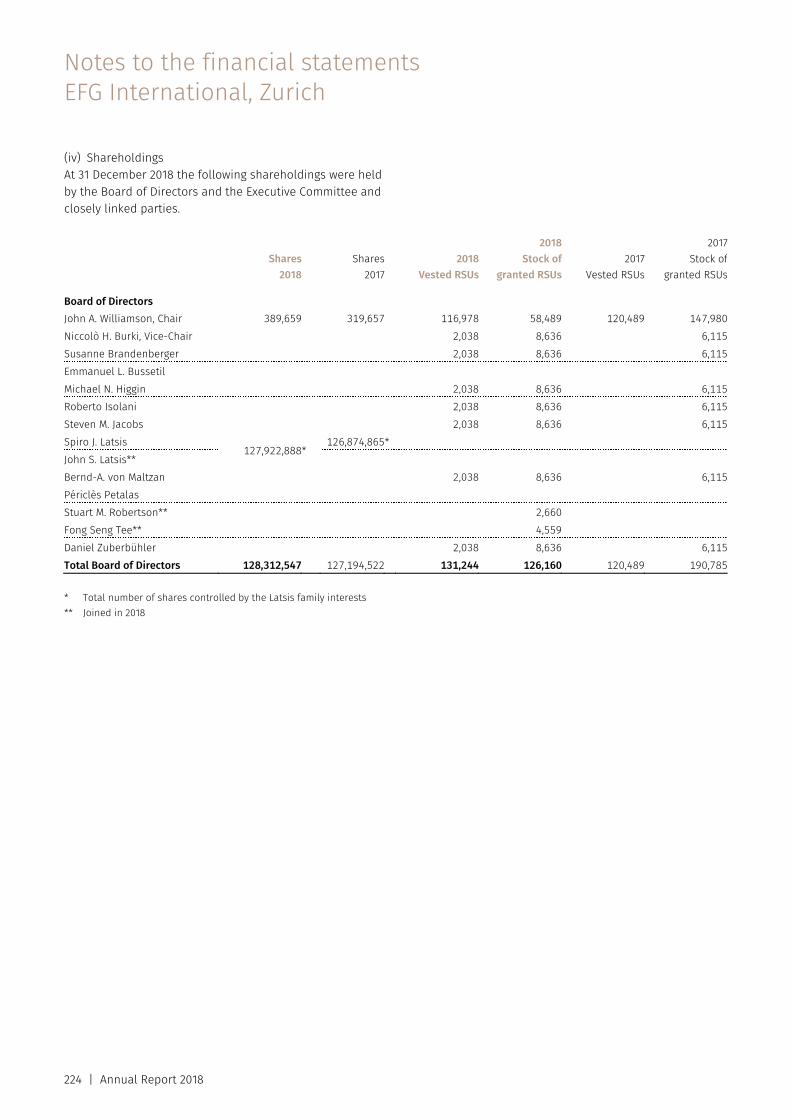
Notes to the financial statements EFG International, Zurich
224 | Annual Report 2018
(iv) Shareholdings At 31 December 2018 the following shareholdings were held by the Board of Directors and the Executive Committee and closely linked parties.
Shares
2018Shares
20172018
Vested RSUs
2018Stock of
granted RSUs2017
Vested RSUs
2017Stock of
granted RSUs Board of Directors John A. Williamson, Chair 389,659 319,657 116,978 58,489 120,489 147,980Niccolò H. Burki, Vice-Chair 2,038 8,636 6,115Susanne Brandenberger 2,038 8,636 6,115Emmanuel L. Bussetil Michael N. Higgin 2,038 8,636 6,115Roberto Isolani 2,038 8,636 6,115Steven M. Jacobs 2,038 8,636 6,115Spiro J. Latsis
127,922,888* 126,874,865*
John S. Latsis** Bernd-A. von Maltzan 2,038 8,636 6,115Périclès Petalas Stuart M. Robertson** 2,660Fong Seng Tee** 4,559Daniel Zuberbühler 2,038 8,636 6,115Total Board of Directors 128,312,547 127,194,522 131,244 126,160 120,489 190,785 * Total number of shares controlled by the Latsis family interests ** Joined in 2018
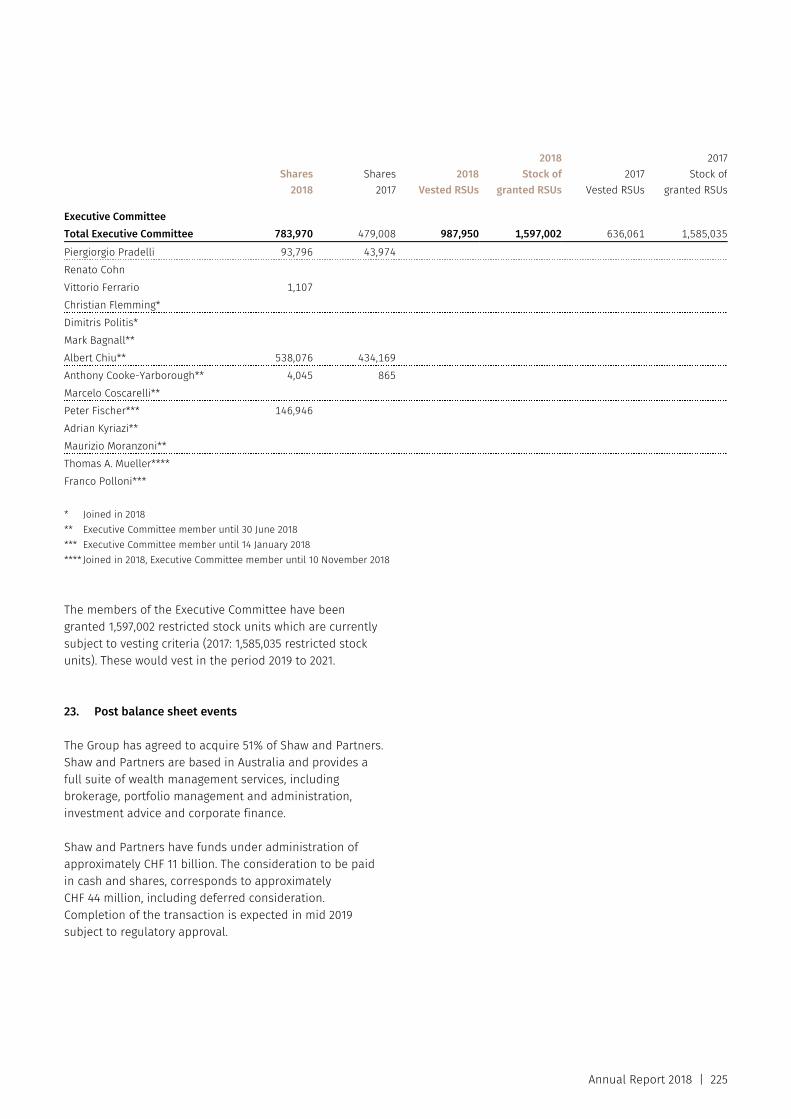
Annual Report 2018 | 225
Shares
2018Shares
2017 2018
Vested RSUs
2018Stock of
granted RSUs2017
Vested RSUs
2017Stock of
granted RSUs Executive Committee Total Executive Committee 783,970 479,008 987,950 1,597,002 636,061 1,585,035Piergiorgio Pradelli 93,796 43,974 Renato Cohn Vittorio Ferrario 1,107 Christian Flemming* Dimitris Politis* Mark Bagnall** Albert Chiu** 538,076 434,169 Anthony Cooke-Yarborough** 4,045 865 Marcelo Coscarelli** Peter Fischer*** 146,946 Adrian Kyriazi** Maurizio Moranzoni** Thomas A. Mueller**** Franco Polloni*** * Joined in 2018 ** Executive Committee member until 30 June 2018 *** Executive Committee member until 14 January 2018 **** Joined in 2018, Executive Committee member until 10 November 2018
The members of the Executive Committee have been granted 1,597,002 restricted stock units which are currently subject to vesting criteria (2017: 1,585,035 restricted stock units). These would vest in the period 2019 to 2021.
23. Post balance sheet events
The Group has agreed to acquire 51% of Shaw and Partners. Shaw and Partners are based in Australia and provides a full suite of wealth management services, including brokerage, portfolio management and administration, investment advice and corporate finance.
Shaw and Partners have funds under administration of approximately CHF 11 billion. The consideration to be paid in cash and shares, corresponds to approximately CHF 44 million, including deferred consideration. Completion of the transaction is expected in mid 2019 subject to regulatory approval.
Statutory Auditorʼs Report
226 | Annual Report 2018
Report of the statutory auditor to the General Meeting of EFG International AG Zurich
Report on the audit of the financial statements Opinion We have audited the financial statements of EFG International AG, which comprise the balance sheet as at 31 December 2018, income statement and notes for the year then ended, including a summary of significant accounting policies.
In our opinion, the accompanying financial statements (pages 212 to 225) as at 31 December 2018 comply with Swiss law and the company’s articles of incorporation.
Basis for opinion We conducted our audit in accordance with Swiss law and Swiss Auditing Standards. Our responsibilities under those provisions and standards are further described in the “Auditor’s responsibilities for the audit of the financial statements” section of our report.
We are independent of the entity in accordance with the provisions of Swiss law and the requirements of the Swiss audit profession and we have fulfilled our other ethical responsibilities in accordance with these requirements. We believe that the audit evidence we have obtained is sufficient and appropriate to provide a basis for our opinion.
Materiality The scope of our audit was influenced by our application of materiality. Our audit opinion aims to provide reasonable assurance that the financial statements are free from material misstatement. Misstatements may arise due to fraud or error. They are considered material if, individually or in aggregate, they could reasonably be expected to influence the economic decisions of users taken on the basis of the financial statements.
Our audit approach Overview
Overall materiality: CHF 13’200’000
We tailored the scope of our audit in order to perform sufficient work to enable us to provide an opinion on the financial statements as a whole, taking into account the structure of the entity, the accounting processes and controls, and the industry in which the entity operates. We have determined that there are no key audit matters to communicate in our report.
Based on our professional judgement, we determined certain quantitative thresholds for materiality, including the overall materiality for the financial statements as a whole as set out in the table below. These, together with qualitative considerations, helped us to determine the scope of our audit and the nature, timing and extent of our audit procedures and to evaluate the effect of misstatements, both individually and in aggregate, on the financial statements as a whole.
Annual Report 2018 | 227
Overall materiality CHF 13’200’000
How we determined it 1% of Net assets
Rationale for the materiality benchmark applied
We chose this benchmark because, in our view, it is the one typically used to measure the result of a holding company.
We agreed with the Audit Committee that we would report to them misstatements above CHF 250’000 identified during our audit as well as any misstatements below that amount which, in our view, warranted reporting for qualitative reasons.
Audit scope We designed our audit by determining materiality and assessing the risks of material misstatement in the financial statements. In particular, we considered where subjective judgements were made; for example, in respect of significant accounting estimates that involved making assumptions and considering future events that are inherently uncertain. As in all of our audits, we also addressed the risk of management override of internal controls, including among other matters consideration of whether there was evidence of bias that represented a risk of material misstatement due to fraud.
Report on key audit matters based on the circular 1/2015 of the Federal Audit Oversight Authority We have determined that there is no key audit matter to communicate in our report.
Responsibilities of the Board of Directors for the financial statements The Board of Directors is responsible for the preparation of the financial statements in accordance with the provisions of Swiss law and the company’s articles of incorporation, and for such internal control as the Board of Directors determines is necessary to enable the preparation of financial statements that are free from material misstatement, whether due to fraud or error.
In preparing the financial statements, the Board of Directors is responsible for assessing the entity’s ability to continue as a going concern, disclosing, as applicable, matters related to going concern and using the going concern basis of accounting unless the Board of Directors either intends to liquidate the entity or to cease operations, or has no realistic alternative but to do so.
Auditor’s responsibilities for the audit of the financial statements Our objectives are to obtain reasonable assurance about whether the financial statements as a whole are free from material misstatement, whether due to fraud or error, and to issue an auditor’s report that includes our opinion. Reasonable assurance is a high level of assurance, but is not a guarantee that an audit conducted in accordance with Swiss law and Swiss Auditing Standards will always detect a material misstatement when it exists. Misstatements can arise from fraud or error and are considered material if, individually or in the aggregate, they could reasonably be expected to influence the economic decisions of users taken on the basis of these financial statements.
As part of an audit in accordance with Swiss law and Swiss Auditing Standards, we exercise professional judgment and maintain professional scepticism throughout the audit. We also: – Identify and assess the risks of material misstatement of
the financial statements, whether due to fraud or error, design and perform audit procedures responsive to those risks, and obtain audit evidence that is sufficient and appropriate to provide a basis for our opinion. The risk of not detecting a material misstatement resulting from fraud is higher than for one resulting from error, as fraud may involve collusion, forgery, intentional omissions, misrepresentations, or the override of internal control.
– Obtain an understanding of internal control relevant to the audit in order to design audit procedures that are appropriate in the circumstances, but not for the purpose of expressing an opinion on the effectiveness of the entity’s internal control.
– Evaluate the appropriateness of accounting policies used and the reasonableness of accounting estimates and related disclosures made.
– Conclude on the appropriateness of the Board of Directors’ use of the going concern basis of accounting and, based on the audit evidence obtained, whether a material uncertainty exists related to events or conditions that may cast significant doubt on the entity’s ability to continue as a going concern. If we conclude that a material uncertainty exists, we are required to draw
Statutory Auditorʼs Report
228 | Annual Report 2018
attention in our auditor’s report to the related disclosures in the financial statements or, if such disclosures are inadequate, to modify our opinion. Our conclusions are based on the audit evidence obtained up to the date of our auditor’s report. However, future events or conditions may cause the entity to cease to continue as a going concern.
We communicate with the Board of Directors or its relevant committee regarding, among other matters, the planned scope and timing of the audit and significant audit findings, including any significant deficiencies in internal control that we identify during our audit.
We also provide the Board of Directors or its relevant committee with a statement that we have complied with relevant ethical requirements regarding independence, and to communicate with them all relationships and other matters that may reasonably be thought to bear on our independence, and where applicable, related safeguards.
From the matters communicated with the Board of Directors or its relevant committee, we determine those matters that were of most significance in the audit of the financial statements of the current period and are therefore the key audit matters. We describe these matters in our auditor’s report unless law or regulation precludes public disclosure about the matter or when, in extremely rare circumstances, we determine that a matter should not be communicated in our report because the adverse consequences of doing so would reasonably be expected to outweigh the public interest benefits of such communication.
Report on other legal and regulatory requirements In accordance with article 728a paragraph 1 item 3 CO and Swiss Auditing Standard 890, we confirm that an internal control system exists which has been designed for the preparation of financial statements according to the instructions of the Board of Directors.
We further confirm that the proposed appropriation of available earnings complies with Swiss law and the company’s articles of incorporation. We recommend that the financial statements submitted to you be approved.
PricewaterhouseCoopers Ltd
Christophe Kratzer Thomas Romer Audit expert Audit expert Auditor in charge
Geneva, 12 March 2019

Annual Report 2018 | 229

230 | Annual Report 2018
Contacts and Addresses
Annual Report 2018 | 231
Europe Switzerland Zurich EFG Bank AG Bleicherweg 8 P.O. Box 6012 8022 Zurich Tel +41 44 226 18 50 Geneva EFG Bank AG 24 Quai du Seujet P.O. Box 2391 1211 Geneva Tel +41 22 918 71 71 Lugano EFG Bank AG Via Magatti 2 6900 Lugano Tel +41 58 809 31 11 Lugano EFG Bank AG Viale Stefano Franscini 8 6901 Lugano Tel +41 58 809 31 11 Chiasso EFG Bank AG Corso S. Gottardo 20 6830 Chiasso Tel +41 58 809 31 11 Crans-Montana EFG Bank AG Immeuble Le Scandia 3963 Crans-Montana Tel +41 58 809 19 00 Lausanne EFG Bank AG 3, Avenue de Rumine 1005 Lausanne Tel +41 58 809 41 41
Locarno EFG Bank AG Piazza Grande7 6600 Locarno Tel +41 58 809 63 11 Martigny EFG SA Rue du Simplon 4 1920 Martigny Tel +41 58 808 74 92 Channel Islands Guernsey EFG Private Bank (Channel Islands) Ltd St. Julian’s Ave. St. Peter Port Guernsey GY1 4NN Tel + 44 1481 723 432. Jersey EFG Private Bank Ltd Jersey Branch 5th Floor 44 Esplanade St. Helier Jersey JE1 3FG Tel +44 1534 605 600 Cyprus Nicosia EFG Bank (Luxembourg) SA 23 Kennedy Avenue Globe House, 6th Floor Nicosia 1075 Tel +357 22 025 900 Limassol EFG Bank (Luxembourg) SA Kitallides Building, 7th Floor 3 Georgiou Katsounotou Street 3036, Limassol, CYPRUS Tel +357 25 025 400 France Paris Oudart SA 10, Rue de la Paix 75002 Paris www.oudart.fr
Greece Athens EFG Bank (Luxembourg) SA 342 Kifisias Ave. & Ethnikis Antistaseos Str. N. Psychiko 154 51 Athens Tel +30 210 678 46 00 Italy Milan EFG Bank (Luxembourg) S.A. Succursale Italiana Via Paleocapa, 5 20121 Milano Tel +39 02 722 22 71 Milan EOS Servizi Fiduciari SpA Via Paleocapa, 5 20121 Milano Tel +39 02 63 69 62 20 Milan AEON Trust Società Italiana Trust Srl Via Paleocapa, 5 20121 Milano Tel +39 02 636 96 21 Genoa EOS Servizi Fiduciari S.p.A. Affiliate local unit Via XX settembre 33 16121 Genoa Tel +39 010 553 10 06
Contacts and Addresses
232 | Annual Report 2018
Liechtenstein Vaduz EFG Bank von Ernst AG Egertastrasse 10 9490 Vaduz Tel +423 265 53 53 www.efgbankvonernst.com Luxembourg Luxembourg EFG Bank (Luxembourg) SA 56 Grand-Rue 2013 Luxembourg Tel +352 26 454 1 Monaco Monte Carlo EFG Bank (Monaco) Villa Les Aigles 15 avenue d’Ostende Boîte postale 37 98001 Monaco Tel +377 93 15 11 11 Monte Carlo EFG Asset Managers SAM Affiliated company Europa Résidence, Place des Moulins 98000 Monaco Tel +377 97 97 39 79 Spain Madrid A&G Banca Privada S.A.U. Paseo de la Castellana, 92 28046 Madrid Tel +34 91 590 21 21 Madrid A&G Group Asesores y Gestores Financieros SA Paseo de la Castellana, 92 28046 Madrid Tel +34 91 590 21 21 www.ayg.es
United Kingdom London EFG Private Bank (UK) Curzon Street Leconfield House W1J 5JB London Tel +44 207 491 9111 Birmingham EFG Harris Allday 33 Great Charles Street B3 3JN Birmingham Tel +44 121 233 1222 Bridgnorth EFG Harris Allday 25a St. Leonard’s Close Shropshire WV16 4EJ Bridgnorth Tel +44 1746 761 444 Ombersley EFG Harris Allday Church Mews Worcestershire WR9 0EW Ombersley Middle East Bahrain EFG AG – Bahrain Branch Bahrain Financial Harbour West Tower, 14th Floor P.O. Box 11321 Manama Tel +973 17 155 155 Asia China Shanghai EFG Bank AG Unit 23, 13th Floor Hang Seng Bank Tower 1000, Lujiazui Ring Road Pudong New Area 200120 Shanghai
Hong Kong Hong Kong EFG Bank AG 18th Floor, International Commerce Centre 1 Austin Road West Kowloon, Hong Kong Tel +852 2298 3000 Hong Kong EFG Asset Management (Hong Kong) Ltd 18th Floor, International Commerce Centre 1 Austin Road West Kowloon, Hong Kong Tel +852 2298 3000 Indonesia Jakarta EFG Bank Ltd Jl. M.H. Thamrin, Kav. 28-30 The Plaza Office Tower Level 20, Unit F2 10350 Jakarta Tel +6221 299 20304 Singapore Singapore EFG Bank AG 25 North Bridge Road #07-00 EFG Bank Building 179104 Singapore Tel +65 6595 4888 Singapore EFG Wealth Solutions (Singapore) Ltd 25 North Bridge Road #07-00 EFG Bank Building 179107 Singapore Tel +65 6595 4998 Singapore EFG Asset Management (Singapore) Pte.Ltd 25 North Bridge Road #07-00 EFG Bank Building 179107 Singapore Tel +65 6595 4888
Annual Report 2018 | 233
Americas USA Miami EFG Capital International Corp. 701 Brickell Avenue, 9th Floor Miami, FL 33131 Tel +1 305 482 8000 Miami EFG Asset Management (Americas) Corp 701 Brickell Avenue, 9th Floor Miami, FL 33131 Tel +1 305 482 8000 Bahamas Nassau EFG Bank & Trust (Bahamas) Ltd Goodman’s Bay Corporate Centre West Bay Street and Sea View Drive Nassau Tel +1 242 502 5400 Nassau EFG Bank & Trust (Bahamas) Ltd Offices at Old Fort, Building One Lyford Cay Nassau Tel +1 242 502 5400 Bermuda Hamilton EFG Wealth Management (Bermuda) Ltd Thistle House 4 Burnaby Street, 2nd Floor HM MX Hamilton Tel +1 441 296 3126 Cayman Islands Camana Bay EFG Bank AG 9 Forum Lane Suite 3208 KY1-1003 Grand Gayman Tel +1 345 943 3350
Camana Bay EFG Wealth Management (Cayman) Ltd Suite 3208 9 Forum Lane Camana Bay P.O. Box 10360 KY1 - 1003 Grand Cayman Tel +1 345 943 33 50 Latin America Chile Santiago EFG Asesorías Financieras SpA Av. Isidora Goyenechea 2800 Piso 29, Edificio Titanium Las Condes, Santiago Tel +562 2 7975600 Santiago EFG Corredores de Bolsa SpA Av. Isidora Goyenechea 2800, Piso 29 Edificio Titanium, Las Condes – Santiago Tel +562 2 7975600 Colombia Bogotá EFG Bank AG Carrera 7 No. 71-21 Torre B, Oficina 506 Bogotá D.C. Tel +571 317 4332 Panama Panama EFG (Panamá) S.A. Representative Office Torre Generali, Piso 14 Ave. Samuel Lewis y Calle 54 Obarrio, Apartado 832-1637, WTC Panama Tel +507 366 9800 Peru Lima EFG Capital Asesores Financieros S.A.C. Alberto del Campo 411 Of. 604, Magdalena del Mar Lima 17 Tel +51 1 212 5060
Uruguay Montevideo EFG Oficina de Representación Uruguay SA Av. Dr. Luis A. de Herrera 1248 WTC Torre II, Piso 20 CP 11300 Montevideo Tel +598 2 628 6010 Punta Del Este EFG Oficina de Representación Uruguay SA Rambla Gral. Artigas esq. Calle 15 Edificio Calypso, Of. 003 CP 20100 Punta del Este Tel +598 42 44 8882
234 | Annual Report 2018
Forward looking statements
This document has been prepared by EFG International AG (“EFG”) solely for use by you for general information only and does not contain and is not to be taken as containing any securities advice, recommendation, offer or invitation to subscribe for or purchase or redemption of any securities regarding EFG.
This presentation contains specific forward-looking state-ments, e.g. statements which include terms like “believe”, “assume”, “expect”, “target” or similar expressions. Such forward-looking statements represent EFG’s judgements and expectations and are subject to known and unknown risks, uncertainties and other factors which may result in a substantial divergence between the actual results, the financial situation, and/or the development or performance of the company and those explicitly or implicitly presumed in these statements. These factors include, but are not limited to: (1) the ability to successfully integrate BSI and realise expected synergies, (2) general market, macroeconomic, governmental and regulatory trends, (3) movements in securities markets, exchange rates and interest rates, (4) competitive pressures, and (5) other risks and uncertainties inherent in the business of EFG and its subsidiaries, including BSI group. EFG is not under any obligation to (and expressly disclaims any such obligation to) update or alter its forward-looking statements, whether as a result of new information, future events or otherwise, except as required by applicable law or regulation.
Nothing contained herein is, or shall be relied on as, a promise or representation as to the future performance of EFG and its subsidiaries, including BSI. EFG and BSI as a combined group may not realise the full benefits of the contemplated transaction, including the expected synergies, cost savings or growth opportunities within the anticipated time frame or at all.

This document is being provided by EFG International AG or/and its affiliates (hereinafter referred to as “EFG”) solely for information purposes and is not intended to be a solicitation or offer, recommendation or advice to buy or sell interests in any security or financial instrument mentioned in it, to effect any transaction, or to conclude any transaction of any kind whatsoever (referred to hereafter as “Investments”). It is intended for the sole use of the recipient and may not be further distributed, published, used, reproduced for any other purpose or referred to in any manner and the information, opinions or conclusions contained in it may not be referred to without, in each case, the prior express consent of EFG. Whilst EFG shall use reasonable efforts to obtain information from sources which it believes to be reliable, EFG, its directors, officers, employees, agents or shareholders assume no liability regarding the content of the document and give no warranty as to the accuracy, completeness or reliability of any data relating to securities and Investment products, information, opinions or forecasts mentioned in the document and thus assume no liability for losses arising from the use of this document. The content of the document is intended only for persons who understand and are capable of assuming all risks involved. Before entering into any transaction, the recipient should determine if the relevant security or financial instrument mentioned in the document suits his particular circumstances and should ensure that he independently assesses (together with his professional advisers) the specific risks and the legal, regulatory, credit, tax and accounting consequences of any purchase of securities or financial instruments mentioned in the document. The content of this document shall be limited to opportunities represented by certain Investments with respect to the conditions in the market at a given time, and thus is only valid for a very limited period of time. EFG makes no representation as to the suitability of the information, opinions or securities and financial instruments mentioned in the document. Historical data on the performance of the securities and financial instruments or the underlying assets in this document is no indication for future performance. The value of the Investment and the income arising from the Investment may fall as well as rise. Part or even the whole amount invested may not be recovered upon realization of the Investment. The present document has been compiled by a department of EFG which is not an ”organizational unit responsible for financial research” as defined in the Swiss Bankers Association’s Directives on the Independence of Financial Research and, as such, is not subject to the provisions of that regulation. EFG may engage in securities transactions, on a proprietary basis or otherwise and hold long or short positions with regard to the Investment, both in a manner inconsistent with the view taken in this document. In addition, others within EFG, including sales staff, may take a view that is inconsistent with that taken in this report. The content of this document provide information, opinions or conclusions that may differ from analyses carried out by other units of the Bank, and in particular may not comply with the Investment strategy of the Bank.

EFG International AG Bleicherweg 8 8001 Zurich Switzerland Phone +41 44 226 18 50 Fax +41 44 226 18 55 www.efginternational.com Investor Relations Phone +41 44 212 73 77 [email protected] Media Relations Phone +41 44 226 12 72 [email protected]