ANNUAL REPORT 30 JUNE 2015 - Indo Mines Limited · INDO MINES LIMITED ANNUAL REPORT 2015 ......
61
ANNUAL REPORT 30 JUNE 2015 ABN 40 009 245 210
Transcript of ANNUAL REPORT 30 JUNE 2015 - Indo Mines Limited · INDO MINES LIMITED ANNUAL REPORT 2015 ......

A N N U A L R E P O R T
3 0 J U N E 2 0 1 5
ABN 40 009 245 210

INDO MINES LIMITED ANNUAL REPORT 2015
Page 1
CONTENTS PAGE
CORPORATE DIRECTORY 2
CEO'S REPORT 3
DIRECTORS' REPORT 4
AUDITOR'S INDEPENDENCE DECLARATION 20
CONSOLIDATED STATEMENT OF PROFIT OR LOSS AND COMPREHENSIVE INCOME 21
CONSOLIDATED STATEMENT OF FINANCIAL POSITION 22
CONSOLIDATED STATEMENT OF CASH FLOWS 23
CONSOLIDATED STATEMENT OF CHANGES IN EQUITY 24
NOTES TO AND FORMING PART OF THE FINANCIAL STATEMENTS 26
DIRECTORS' DECLARATION 55
INDEPENDENT AUDIT REPORT 56
ASX ADDITIONAL INFORMATION 58

INDO MINES LIMITED ANNUAL REPORT 2015
Page 2
CORPORATE DIRECTORY
Directors
Mr Peter Chambers – Non-Executive Chairman
Mr Darryl Harris – Non-Executive Director
Mr Darjoto Setyawan – Non-Executive Director
Mr Hendra Surya – Non-Executive Director
Chief Executive Officer
Mr Arran Marshall
Company Secretary
Mr Richard Edwards
Registered and Principal Office
Level 2, 66 Hunter Street
Sydney, NSW, 2000
Australia
Telephone: +61 2 9300 3377
Facsimile: +61 2 9221 6333
Share Register
Computershare Investor Services Pty Ltd
Level 4
60 Carrington Street
Sydney NSW 2000
Telephone: 1300 787 272
International: +61 3 9415 4000
Facsimile: +61 3 9473 2500
Stock Exchange Listing
Australian Securities Exchange Limited
Home Branch – Perth
2 The Esplanade
Perth WA 6000
ASX Code
IDO – Fully paid ordinary shares
Solicitors
Herbert Smith Freehills
QV.1 Building
250 St Georges Terrace
Perth WA 6845
Hadiputranto, Hadinoto & Partners
The Jakarta Stock Exchange Building
Tower II, 21st Floor
Sudirman Central Business District
Jl. Jendral Sudirman Kav 52-53
Jakarta 12190
Auditor
PricewaterhouseCoopers
Brookfield Place
125 St Georges Terrace
Perth WA 6000
Bankers
National Australia Bank
Westpac Banking Corporation

INDO MINES LIMITED ANNUAL REPORT 2015
Page 3
CEO’s Report Against the backdrop of the weakening global economic conditions and lower commodity prices the company has faced numerous challenges this year in the development of the Kulon Progo iron sands/pig iron project. However restructuring of the Company’s operations and focus on operating cost optimisation has placed the Company in a strong position to positively progress the development of its flagship project at Kulon Progo. An unprecedented drop in the value of both iron ore and finished steel product has been driven by the Chinese to drive export growth in the sector to counter weaker internal demand. In many cases Chinese producers are so desperate for cash on balance sheet, they are selling finished product cheaper than pig iron. This has seen consolidation in the Chinese market take longer than anticipated and the impact on pricing has been significant, seeing almost a 30% drop since December 2014. In addition Chinese, South Korean and Taiwanese producers are putting significant pressure on Western and Japanese steel producers as they operate in much lower cost environments. This influx of cheap Chinese imports has filtered through to Indonesian domestic sales – the Indonesian Government has applied tariffs to finished product imports such as rebar, but will have to be more aggressive if they wish to protect and nurture development of a domestic steel industry as stated in the 2011 Economic Masterplan. In 2014, Indonesia experienced a 6 percent increase in steel sales to 15.1 million tonnes, while domestic capacity is only approximately 7 million tonnes. This significant deficit is the reason foreign steel producers such as Mitsubishi Steel Manufacturing and Nippon Steel and Sumitomo Metal Corporation invested US$450 million for the acquisition of Jatim Steel and the establishment of steel facilities with Indonesia’s Krakatau Steel. Additionally, Indonesia’s new Government’s drive to attract significant foreign investment in infrastructure, makes Indonesia an attractive proposition to long product manufacturers. However Indonesian steel mills have suffered from high operating costs and a reliance on EAF steelmaking from primarily scrap – this raw material limitation on steel makers has made them uncompetitive with Chinese imports. This reliance on scrap as a raw material is driven by the fact domestic iron ore tends to be poor quality and coking coal deposits suitable for steel making are virtually non-existent in Indonesia. Indo Mines’ strategy to develop an RKEF plant in central Java utilises low cost iron sand concentrate and low rank coal. All raw materials are sourced locally and produce a high quality pig iron that is suitable for either steel billet or upgrading to foundry pig iron with ferro-manganese. Vanadium concentrate (16.5% V2O5) is a by-product of the process, as is power generation from volatile gases produced from charring coal. The Company’s ultimate goal is to align itself with one of the large foreign steel producers already committed to developing a steel mill in Indonesia. However as with all junior developers in the resource space, the key focus has been to retain as much cash as possible while maintaining progress. A significant focus has been cutting operational expenses at the local company level while progressing the project through to feasibility. The first phase of the definitive feasibility study has been completed. This included basic engineering design of the beneficiation plant, GAP analysis for Equator Principle standard studies and SL/RN test work on both the iron sand and coal raw material. It is anticipated that the next year will see completion of the bankable feasibility study, a continued focus on cost reduction and alignment of the Company with a significant strategic partner. In closing I would like to take this opportunity to thank all of the project team for their application and hard work over the past year and look forward to making positive progress in the coming year.
Arran Marshall Chief Executive Officer

INDO MINES LIMITED ANNUAL REPORT 2015
DIRECTORS’ REPORT
30 JUNE 2015
Page 4
The Directors of Indo Mines Limited present their report on the Consolidated Entity consisting of Indo Mines Limited (“the Company” or “Indo Mines” or “Parent Entity”) and the entities it controlled at the end of, or during, the year ended 30 June 2015 (“Consolidated Entity” or “Group”). DIRECTORS The names of Directors in office at any time during the financial year or since the end of the financial year are:
Mr Peter Chambers Non-Executive Chairman Mr Christopher Catlow Non-Executive Director (resigned 30 September 2014) Mr Darryl Harris Non-Executive Director Mr Darjoto Setyawan Non-Executive Director Mr Hendra Surya Non-Executive Director Ms Stacey Apostolou Executive Director (resigned 30 September 2014)
Unless otherwise disclosed, Directors held their office from 1 July 2014 until the date of this report. CURRENT DIRECTORS AND OFFICERS Peter Chambers – Non-Executive Chairman Qualifications – B Bus.
Mr Peter Chambers most recently held the position of Managing Director - Strategy and Governance with the Rajawali Group which he retired from at the end of June 2014. He served as a member of the Board of Directors of PT. Rajawali Corpora since 2005. Mr Chambers is a member of the Board of Commissioners and Chairman of the Audit Committee of Excelcomindo, Indonesia's third largest mobile telephone operator. He was one of the key persons when Rajawali established Excelcomindo in the late 1990s. He has more than 20 years' experience in the finance and telecommunications industries having been the Head of the South East Asia Communication Practice of Coopers and Lybrand (Hong Kong based). Mr Chambers has also held executive roles with various international companies over the years. Mr Chambers graduated from the Royal Melbourne Institute of Technology in Melbourne, Australia, with a degree in Finance and Accounting. Mr Chambers was appointed a Director of Indo Mines on 26 November 2012 and has not held a directorship in any other listed company in the past three years. Darryl Harris – Non-Executive Director Qualifications - B.Sc. MAusIMM
Mr Harris is an engineering metallurgist with over 35 years’ experience in the design and commissioning of mineral processing plants, across a range of different commodities. Mr Harris has had a long association with engineering companies including Nedpac, Signet Engineering, Lurgi and Outotec. He was involved in the development of various projects, including project coordinator for the An Feng-Kingstream Steel Project and other Australian ferrous projects as well a several projects in Indonesia. Mr Harris was appointed a Director of Indo Mines on 16 June 1987 and during the three year period to the end of the financial year, Mr Harris also held a directorship in Consolidated Tin Mines Limited (October 2010 – present).

INDO MINES LIMITED ANNUAL REPORT 2015
DIRECTORS’ REPORT
30 JUNE 2015
Page 5
CURRENT DIRECTORS AND OFFICERS (continued) Darjoto Setyawan – Non-Executive Director Qualifications – BSc, Masters of Management Mr Darojoto Setyawan has been employed with the Rajawali Group since 1996 and has held the role of Managing Director - Mining & Resources since 2005. He was the President Director of the Bentoel Group, a subsidiary of Rajawali, from 1996 to 2006 and continued from 2006 - 2009 as the President Commissioner. Under his leadership, the Bentoel Group successfully negotiated with a syndicate of international banks as well as two leading State-Owned banks and restructured its loans. During the same period Bentoel underwent some structural changes including organization restructuring. The loan and organizational restructuring have paved the way for Bentoel to regain its position as one of the biggest cigarette manufacturers in Indonesia. In addition to being in charge of mining and resources, Mr Setyawan handles all matters related to external relations including those related to Government officials and agencies. He has also served as a member of the board on a number of companies where the Rajawali Group has an interest, including PT. Nusantara Infrastructure and the Semen Gresik Group. Mr Setyawan was appointed a Director of Indo Mines on 26 November 2012 and has not held a directorship in any other listed company in the past three years. Hendra Surya – Non-Executive Director Qualifications – BSc, Masters of International Management Mr Surya joined the Rajawali Group in 2005 and is currently the Deputy Managing Director - Mining and Resources. Since he joined with the Rajawali Group, Mr Surya has played a significant role in the on-going success of Rajawali’s business in Mining and Resources. His main contributions and deliverables include M&A, Corporate Finance, Project Development and Operation of Rajawali’s mining assets. He currently holds executive management positions in the several subsidiaries and affiliates of Rajawali Group and is President Director of PT Jogja Magasa Iron. Prior to his role with the Rajawali Group, Mr Surya spent eight years with PricewaterhouseCoopers where he was involved with a number of government related projects and a wide number of privatisations and major project financings. He holds a Masters Degree in International Business from the American Graduate School of International Management in Arizona. Mr Surya was appointed a Director of Indo Mines on 6 February 2012 and has not held a directorship in any other listed company in the past three years. Chief Executive Officer Arran Marshall – BA, MBA Mr Marshall most recently held the role of Country Head for AWR Lloyd in Indonesia. AWR Lloyd is a specialist mining and energy advisor in South East Asia. He holds an MBA from the Auckland University of Technology and his core competencies are in the areas of business development, project management/development, financial analysis, strategy, investor relations and capital markets. Mr Marshall was appointed Chief Executive Officer of Indo Mines on 25 February 2014. Company Secretary Richard Edwards – B Comm., CPA, SA Fin
Richard graduated with a Bachelor of Commerce degree from the University of New South Wales and is a member of CPA Australia and FINSIA. Following eight years as an owner/manager of his own business, Mr Edwards has worked for over ten years providing financial reporting and company secretarial services to a range of publicly listed companies in Australia with a focus on the mining sector. He was Company Secretary and Chief Financial Officer for Sumatra Copper & Gold plc for three years and Company Secretary and Chief Financial Officer of Callabonna Uranium Limited for two years. He is also Company Secretary of ASX listed Augur Resources Ltd and unlisted public companies Nickel Mines Limited and Prospech Limited. Mr Edwards was appointed Company Secretary of Indo Mines on 31 October 2014.

INDO MINES LIMITED ANNUAL REPORT 2015
DIRECTORS’ REPORT
30 JUNE 2015
Page 6
MEETINGS OF DIRECTORS The following table sets out the number of meetings of the Company's Directors held during the year ended 30 June 2015, and the number of meetings attended by each Director.
Board Meetings Number eligible
to attend
Board Meetings Number
Attended
Peter Chambers 4 4 Christopher Catlow
(1) 1 1
Darryl Harris 4 4 Darjoto Setyawan 4 4 Hendra Surya 4 4 Stacey Apostolou
(2) 1 1
(1)
Reflects the meetings held and Mr Catlow’s attendance up until the date of his resignation. (2)
Reflects the meetings held and Ms Apostolou’s attendance up until the date of her resignation. The membership of the audit committee was reconstituted during the year and consequently did not meet until the following the end of the financial year. PRINCIPAL ACTIVITIES The principal activities of the Consolidated Entity during the year consisted of mineral exploration and development activities and there has been no change in the nature of those activities. DIVIDENDS No dividends have been declared, provided for or paid in respect of the financial year ended 30 June 2015 (2014: nil). EARNINGS PER SHARE 2015
Cents 2014
Cents
Basic earnings/(loss) per share (0.36) (9.1) Diluted earnings/(loss) per share (0.36) (9.1)

INDO MINES LIMITED ANNUAL REPORT 2015
DIRECTORS’ REPORT
30 JUNE 2015
Page 7
CORPORATE STRUCTURE Indo Mines is a company limited by shares that is incorporated and domiciled in Australia. The Company has prepared a consolidated financial report including the entities it incorporated and controlled during the financial year. CONSOLIDATED RESULTS 2015
$ 2014
$ Loss of the Consolidated Entity before income tax expense (3,142,244) (56,761,163) Income tax expense - -
Net loss (3,142,244) (56,761,163)
Net loss attributable to minority interest (1,182,371) (7,828,990)
Net loss attributable to members of Indo Mines Limited (1,959,873) (48,932,173)
OPERATING AND FINANCIAL REVIEW Operating Review PT Jogja Magasa Iron (‘PT JMI’) is a joint venture between Indo Mines, which holds 70% of the issued capital and PT. Jogja Magasa Mining (‘PT JMM’) which holds the remaining 30%. PT JMM is a consortium of individuals, including the Sultan of Yogyakarta. Indo Mines and PT JMI are currently going through a restructuring process, from a mining company to a development organisation.
Figure 1 Project location map PT JMI holds a Contract of Work (‘CoW’) concession in the Kulon Progo region, ~30 kilometres from the Javanese city of Yogyakarta. The CoW holds a production license to mine iron sands and produce pig iron within a 2,977 hectare area. The area covered by the license is approximately a 22 kilometre long by 1.8 kilometre wide stretch of beach, between the Kulon Progo and Serang Rivers. On 30 September 2015 the Company announced a 2012 JORC compliant resource update. For a summary of this report please see the Mineral Resources and Reserves Statement on page 59.

INDO MINES LIMITED ANNUAL REPORT 2015
DIRECTORS’ REPORT
30 JUNE 2015
Page 8
Technical strategy
Indo Mines have reviewed over 30 alternative technologies to process the low average grade Kulon Progo iron sands – the key aspects technically was a process that accommodated 100% titano-magnetite iron sands and was able to accept elevated titania and domestic low rank coal. The chosen process also had to be low risk, proven and warrantable (for financing purposes). Both Hismelt and Ausiron were assessed including pilot plant trials, but there were issues in vanadium recovery (a key revenue line) and sourcing appropriate coal in Indonesia. Hismelt in particular is a complicated process and deemed un-warrantable, with no vanadium recovery available. In addition to restricted local coal sources appropriate as a reductant, there was no cost effective access to natural gas in the region.
Figure 1 Outotec SL/RN-Xtra process
After completing a techno-economic review on technology with Hatch Consultants during 2014, it became clear from both a technical and financial risk perspective, to replicate as close to the New Zealand Steel (NZS) iron making process as possible. The ‘bottle neck’ in the process is the capacity of the rotary kilns – but the hot direct reduced iron introduced to the submerged arc furnace allowed for consistent vanadium recovery and, more importantly, reliable operation with highly capricious slags. The Hatch ‘mass and energy balance model’ for the rotary kiln and smelter has been utilised to assess the concentrate and other raw material consumptions, energy usage and product chemistry for 55% Fe at 105 micron, 58% Fe at 45 micron and 59% Fe at 38 micron feed. A premium pig iron product is produced from both 58% and 59% Fe concentrate feed, unfortunately not with 55% Fe feed which can only be utilised for blast furnace feed. The reason is very simple – the beneficiation process required to increase Fe content liberates significant gangue, in particular phosphorous and silica, which requires significant energy to process in furnace.
Table 1 Typical estimated pig iron product (Hatch pre-feasibility study
COMPONENT MODEL OUTPUT
(WT%)
Fe 96.55
C 3.05
Si 0.05
Mn 0.05
S 0.04
P 0.07
Ti 0.03
V 0.09
Cr 0.07
Cu 0.00

INDO MINES LIMITED ANNUAL REPORT 2015
DIRECTORS’ REPORT
30 JUNE 2015
Page 9
The pre-feasibility study focused on production associated with processing the current Kulon Progo reserves (first production module) – this will produce approximately 341ktpa pig iron. The remaining two production modules would focus on an NZS process where higher grade iron sands at 105 micron plus are introduced to the rotary kilns, removing the need for the agglomeration process, which provides for lower operating costs. Opportunities for improvement
Indo Mines has hired key ex-NZS individuals with previous feasibility experience in developing operating efficiencies and additional revenue streams. These opportunities for improvement are available to Indo Mines and include but are not limited to;
A significant vanadium recovery increase from 60% as modelled by Hatch
Increased Cogeneration capability
Reduced phosphorus content
Beneficiation plant optimisation of yield recovery
Increased pig iron production tonnage
Refractory life optimisation (significant and practised by Indo Mines Head Technologist)
Key individuals with previous experience in these stated opportunities are available as and when required.
Figure 2 Process diagram comparison between JMI and NZS
Power requirements
The co-generation plant will likely meet the power requirements of the iron plant only (smelter and perhaps rotary kiln). The plant size was determined by accounting for the beneficiation plant, iron plant power requirements, auxiliary loads, plant degradation, electrical losses and growth to account for future load increases as the process loads are finalised. The required net capacity of the power plant is 100 MW nominal which will be produced by a combination of 1 X 50 MW nominal coal-fired power plant unit and 1 x 50 MW off-gas waste heat recovery boilers (WHRBs). The co-generation plant will operate as a captive plant, and therefore is required to have high reliability. An emergency diesel generator can also be installed at the co-generation plant for redundancy purposes. The Company has assumed at 1Mtpa pig iron capacity the power requirements will approximately triple, with all excess energy sold to the City of Yogyakarta PT PLN division (Indonesian national energy group).

INDO MINES LIMITED ANNUAL REPORT 2015
DIRECTORS’ REPORT
30 JUNE 2015
Page 10
Potential logistics options
During the pre-feasibility study, Royal Haskoning DHV was appointed to assess potential logistic options for the project including viability of road, rail and port development. In addition, options were also assessed in moving oversized equipment to the site during construction phase – Royal Haskoning suggested Landing Craft Transport (LCT) was the preferable method to overcome the narrow and busy roads in Java Island. Development of a port is not financially practical at this stage. Indo Mines commissioned LAPI-ITB to conduct logistical modelling (rail, road and port) to find an appropriate solution in regards to sea ports (Cirebon, Semarang, or Cilacap or combinations) to deliver raw materials to the plant site. The study is expected to be concluded by end of 2015. PT JMI has also consulted with PT Kereta Api (PT KAI), the Indonesian national rail carrier, on a potential ‘Public-Private Partnership’ (PPP) and ‘take or pay’ arrangements. A commercial rail line runs within 6 kilometres from the CoW and has proven to be a potential option for delivery of coal and iron sands from outside the region. The Royal Haskoning study confirms that capacity is available on this line that could fulfil the iron and power plant throughput requirements (even at 1Mtpa pig iron capacity). If the rail option is pursued then raw material would be barged to Cilacap then carried via train approximately 100 kilometres to Kedundang Station – from here raw material would be trucked the final 6 kilometres to site.
Figure 3 : Barge and rail logistics options (Royal Haskoning)
Basic Engineering Design (BED) for beneficiation plant contract
In November 2014 the Ferrostaal Indonesia BED contract for the iron sand beneficiation plant was reactivated after being put on hold in May 2014 (Ferrostaal was appointed in January 2014 by PT JMI). The suspension of the contract had occurred because of both Indonesia’s mineral ore export ban and the fact that beneficiation plant outputs would likely change, given the results of the pre-feasibility study on the iron plant. Due to the higher iron content required than initially requested in the original BED scope of work (55% Fe for Chinese export market), Figure 4 PT JMI concentrate plant basic PFD (closed circuit) the process flow design (PFD) that will see a concentrate produced at approximately 58% - 59% Fe with low phosphorous content (at 45 micron). This quality and consistency of supply to the reduction process is critical in producing a quality pig iron product. Cyclones are utilised to separate large vs small particle size after grinding to lower grinding requirements - while low intensity magnetic separators (LIMS) minimize gangue collected along with magnetic material. In addition Indo Mines has hired two ex-NZS employees:
Jeremy Bachelor has been with NZS for 36 years and was NZS Chief Chemist.
Paul Foote was previously a metallurgist and mining engineer for NZS and has 33 years of experience in developing, constructing and commissioning various coal and mineral plants around the world.
Both have proven to be invaluable assets to the company as the general understanding of iron sands compared to mineral sands by most consultants/companies is very poor.

INDO MINES LIMITED ANNUAL REPORT 2015
DIRECTORS’ REPORT
30 JUNE 2015
Page 11
Figure 4 PT JMI concentrate plant basic PFD (closed circuit)
Land acquisition
Industrial land in Java, Indonesia, is notoriously difficult to acquire and there are many good examples of large international infrastructure developers having to put projects on hold, because of the inability to acquire land or obtain permits. Meetings with high profile developers are impressed with the fact 160 hectares has been acquired to date for development of the smelter. In Sulawesi pricing of land for smelter development varies from US$80, 000 to US$100,000 per hectare. PT JMI is fortunate to have stakeholders who understand managing industrial projects in Yogyakarta. Both PT Rajawali Corpora and PT JMM have a successful track record in land acquisition and know the importance of balancing project interest with local interests. Significant emphasis has taken place at PT JMI in its Community and Social Responsibility (CSR) program and local co-operative (Koperasi) activities (ground activities providing local employment and training). In conjunction with education and work programs, PT JMI has invested considerable time and money in understanding reclamation as the mining progresses down the beach. The CSR team has proven that crop yields will increase as the tailings are reclaimed – this is because many minerals that impact plant life from developing on the beach are removed in the beneficiation process. The result has seen all permits and licenses issued that PT JMI has required to date from local villages, local authorities and Central Government. More importantly it has also seen the successful acquisition of 160.66 hectares of land for the iron plant site (within the CoW area) and continued support by the Sultan of Yogyakarta. Land acquired to date has been ‘cleared’, meaning farmers have been paid compensation for potential lost earnings – this gives PT JMI the right to use the land for industrial purposes. In addition the owners of the land, the Pakualaman Kingdom, are paid a yearly rent from total smelter revenue, with a grace period of 5 years until first payment. During the grace period PT JMI will pay a basic land rent to the Pakualaman Kingdom. Successful land acquisition is one challenge in maintaining acquired industrial land. The area acquired then must be protected from farmers and villagers settling back into the cleared area. Another mining company made the unfortunate mistake of paying for land to be cleared, but they made the assumption the process was complete and allowed villagers to resettle in the cleared area. This ended up costing the company nearly double what they originally budgeted to complete the ‘clean & clear’ process. PT JMI has taken the steps of building a fence around the boundary of the clean and clear area. This serves several purposes including protection of acquired area, continued ‘on-ground’ activities and jobs for the local community. In addition to the fence boundary PT JMI have recruited a significant number of security personnel from the local community.
INDO MINES LIMITED ANNUAL REPORT 2015
DIRECTORS’ REPORT
30 JUNE 2015
Page 12
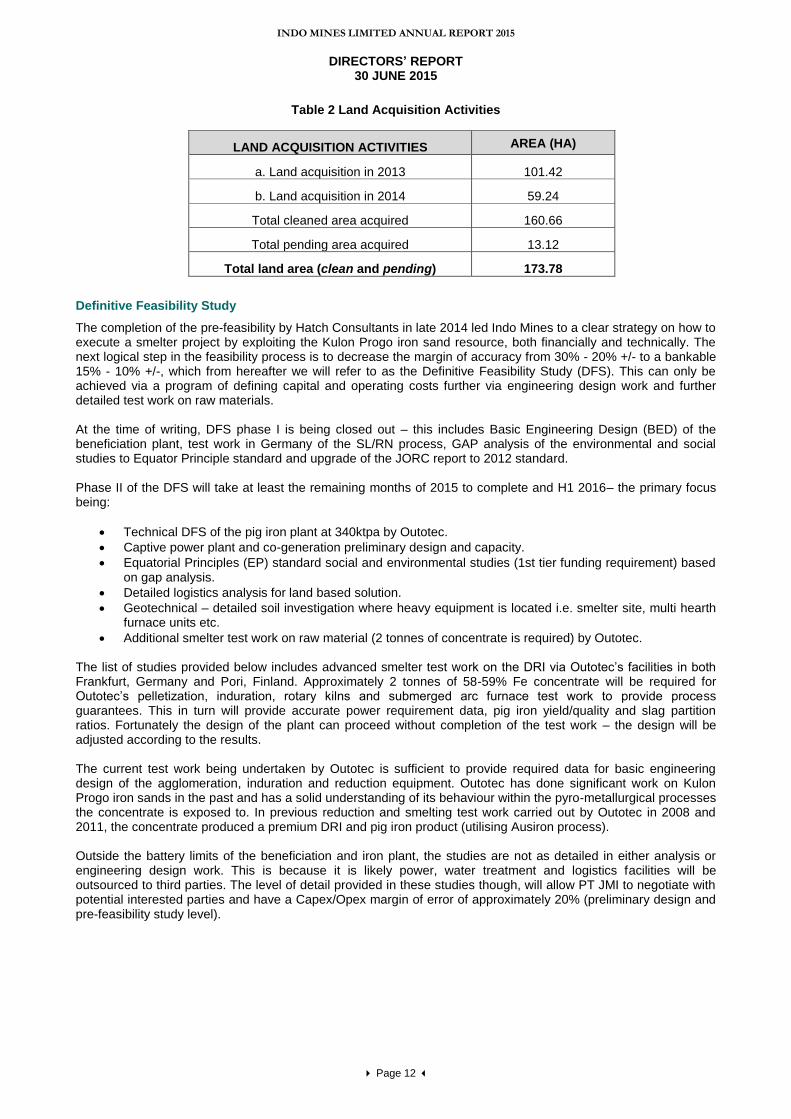
Table 2 Land Acquisition Activities
LAND ACQUISITION ACTIVITIES AREA (HA)
a. Land acquisition in 2013 101.42
b. Land acquisition in 2014 59.24
Total cleaned area acquired 160.66
Total pending area acquired 13.12
Total land area (clean and pending) 173.78
Definitive Feasibility Study
The completion of the pre-feasibility by Hatch Consultants in late 2014 led Indo Mines to a clear strategy on how to execute a smelter project by exploiting the Kulon Progo iron sand resource, both financially and technically. The next logical step in the feasibility process is to decrease the margin of accuracy from 30% - 20% +/- to a bankable 15% - 10% +/-, which from hereafter we will refer to as the Definitive Feasibility Study (DFS). This can only be achieved via a program of defining capital and operating costs further via engineering design work and further detailed test work on raw materials. At the time of writing, DFS phase I is being closed out – this includes Basic Engineering Design (BED) of the beneficiation plant, test work in Germany of the SL/RN process, GAP analysis of the environmental and social studies to Equator Principle standard and upgrade of the JORC report to 2012 standard. Phase II of the DFS will take at least the remaining months of 2015 to complete and H1 2016– the primary focus being:
Technical DFS of the pig iron plant at 340ktpa by Outotec.
Captive power plant and co-generation preliminary design and capacity.
Equatorial Principles (EP) standard social and environmental studies (1st tier funding requirement) based on gap analysis.
Detailed logistics analysis for land based solution.
Geotechnical – detailed soil investigation where heavy equipment is located i.e. smelter site, multi hearth furnace units etc.
Additional smelter test work on raw material (2 tonnes of concentrate is required) by Outotec. The list of studies provided below includes advanced smelter test work on the DRI via Outotec’s facilities in both Frankfurt, Germany and Pori, Finland. Approximately 2 tonnes of 58-59% Fe concentrate will be required for Outotec’s pelletization, induration, rotary kilns and submerged arc furnace test work to provide process guarantees. This in turn will provide accurate power requirement data, pig iron yield/quality and slag partition ratios. Fortunately the design of the plant can proceed without completion of the test work – the design will be adjusted according to the results. The current test work being undertaken by Outotec is sufficient to provide required data for basic engineering design of the agglomeration, induration and reduction equipment. Outotec has done significant work on Kulon Progo iron sands in the past and has a solid understanding of its behaviour within the pyro-metallurgical processes the concentrate is exposed to. In previous reduction and smelting test work carried out by Outotec in 2008 and 2011, the concentrate produced a premium DRI and pig iron product (utilising Ausiron process). Outside the battery limits of the beneficiation and iron plant, the studies are not as detailed in either analysis or engineering design work. This is because it is likely power, water treatment and logistics facilities will be outsourced to third parties. The level of detail provided in these studies though, will allow PT JMI to negotiate with potential interested parties and have a Capex/Opex margin of error of approximately 20% (preliminary design and pre-feasibility study level).
INDO MINES LIMITED ANNUAL REPORT 2015
DIRECTORS’ REPORT
30 JUNE 2015
Page 13
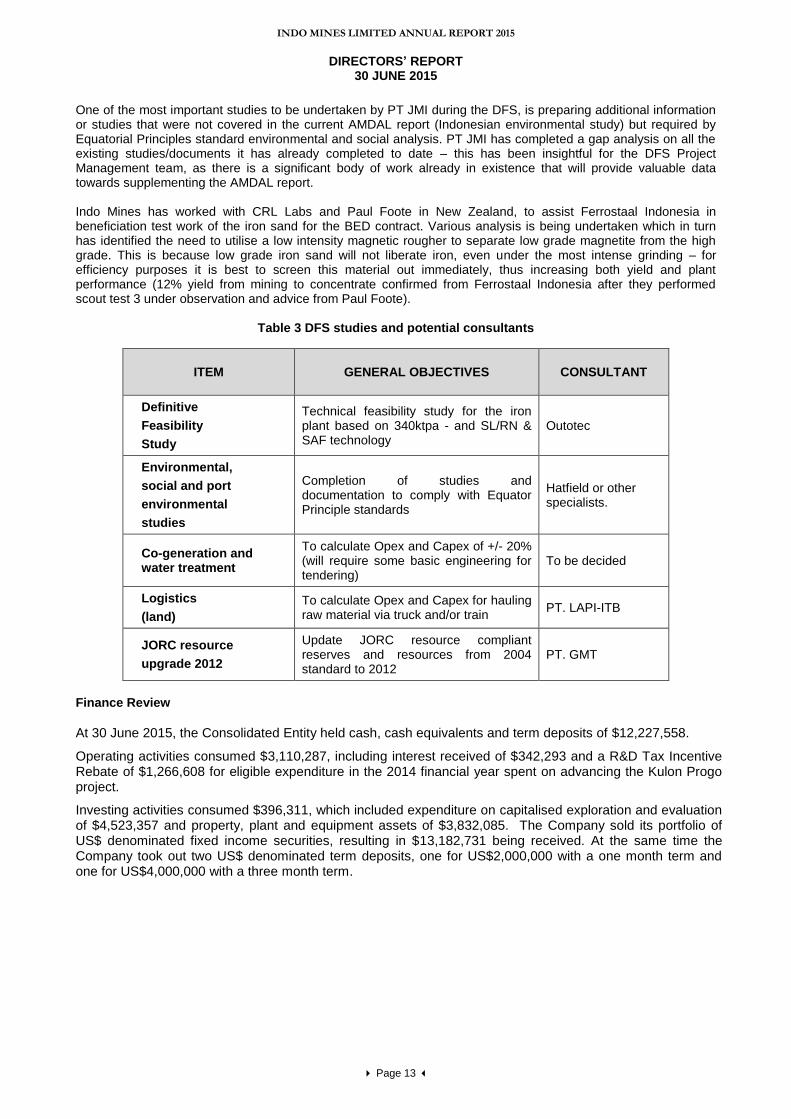
One of the most important studies to be undertaken by PT JMI during the DFS, is preparing additional information or studies that were not covered in the current AMDAL report (Indonesian environmental study) but required by Equatorial Principles standard environmental and social analysis. PT JMI has completed a gap analysis on all the existing studies/documents it has already completed to date – this has been insightful for the DFS Project Management team, as there is a significant body of work already in existence that will provide valuable data towards supplementing the AMDAL report. Indo Mines has worked with CRL Labs and Paul Foote in New Zealand, to assist Ferrostaal Indonesia in beneficiation test work of the iron sand for the BED contract. Various analysis is being undertaken which in turn has identified the need to utilise a low intensity magnetic rougher to separate low grade magnetite from the high grade. This is because low grade iron sand will not liberate iron, even under the most intense grinding – for efficiency purposes it is best to screen this material out immediately, thus increasing both yield and plant performance (12% yield from mining to concentrate confirmed from Ferrostaal Indonesia after they performed scout test 3 under observation and advice from Paul Foote).
Table 3 DFS studies and potential consultants
ITEM GENERAL OBJECTIVES CONSULTANT
Definitive
Feasibility
Study
Technical feasibility study for the iron plant based on 340ktpa - and SL/RN & SAF technology
Outotec
Environmental,
social and port
environmental
studies
Completion of studies and documentation to comply with Equator Principle standards
Hatfield or other specialists.
Co-generation and water treatment
To calculate Opex and Capex of +/- 20% (will require some basic engineering for tendering)
To be decided
Logistics
(land)
To calculate Opex and Capex for hauling raw material via truck and/or train
PT. LAPI-ITB
JORC resource
upgrade 2012
Update JORC resource compliant reserves and resources from 2004 standard to 2012
PT. GMT
Finance Review
At 30 June 2015, the Consolidated Entity held cash, cash equivalents and term deposits of $12,227,558.
Operating activities consumed $3,110,287, including interest received of $342,293 and a R&D Tax Incentive Rebate of $1,266,608 for eligible expenditure in the 2014 financial year spent on advancing the Kulon Progo project.
Investing activities consumed $396,311, which included expenditure on capitalised exploration and evaluation of $4,523,357 and property, plant and equipment assets of $3,832,085. The Company sold its portfolio of US$ denominated fixed income securities, resulting in $13,182,731 being received. At the same time the Company took out two US$ denominated term deposits, one for US$2,000,000 with a one month term and one for US$4,000,000 with a three month term.

INDO MINES LIMITED ANNUAL REPORT 2015
DIRECTORS’ REPORT
30 JUNE 2015
Page 14
CORPORATE GOVERNANCE STATEMENT The Board is committed to maintaining the highest standards of Corporate Governance. Corporate Governance is about having a set of core values and behaviours that underpin the Company's activities and ensure transparency, fair dealing and protection of the interests of stakeholders. The Company has reviewed its corporate governance practices against the Corporate Governance Principles and Recommendations (3rd edition) published by the ASX Corporate Governance Council. The 2015 Corporate Governance Statement is dated as at 30 September 2015 and reflects the corporate governance practices throughout the 2015 financial year. The 2015 Corporate Governance Statement was approved by the Board on 30 September 2015. A description of the Company’s current corporate governance practices is set out in the Company’s Corporate Governance Statement which can be viewed at www.indomines.com.au. SIGNIFICANT CHANGES IN THE STATE OF AFFAIRS
In the opinion of the directors, significant changes in the state of affairs of the Group that occurred during the year ended 30 June 2015 were as follows:
Near completion of Definitive Feasibility Study Stage I and completion of Pre-Feasibility Study at the Kulon Progo iron sands project.
In June 2015 the Company received an R&D incentive refund of $1,266,608 from the Australian Government, on its eligible expenditure on research and development expenditure incurred during 2014 financial year, on the Company’s Kulon Progo iron sands project.
SIGNIFICANT POST BALANCE DATE EVENTS In September 2015 the Company signed an Agreement for sale of the Vertimill for US$750,000. The sale is subject to a number of conditions precedent. A 5% refundable deposit (US$37,500) has already been received. In September 2015 the Company announced an updated 2012 JORC compliant resource report for the Kulon Progo iron sands project. A summary of this report can be seen in the Resources and Reserves Statement contained in this report. Outside of the matters outlined above there has not arisen in the interval between the end of the financial year and the date of this report any item, transaction or event of a material and unusual nature likely, in the opinion of the Directors of the Company, to affect significantly the operations of the Group, the results of those operations, or the state of affairs of the Group, in future financial years. ENVIRONMENTAL REGULATION AND PERFORMANCE The Consolidated Entity’s operations are subject to various environmental laws and regulations under the relevant government’s legislation. Full compliance with these laws and regulations is regarded as a minimum standard for all operations to achieve. Instances of environmental non-compliance by an operation are identified either by external compliance audits or inspections by relevant government authorities. During the year the Company’s subsidiary PT JMI has been upgrading the current AMDAL report (Indonesian environmental study) to Equator Principle Standard environmental and social analysis. Currently PT JMI is completing a GAP analysis on the current studies it has already completed to date. There have been no significant known breaches by the Consolidated Entity during the financial year. LIKELY DEVELOPMENTS AND EXPECTED RESULTS During the coming year, the Company will complete the Definitive Feasibility Study Phase I for its pig iron before proceeding with a bankable feasibility study for an iron making facility for the production of pig iron and vanadium by product.

INDO MINES LIMITED ANNUAL REPORT 2015
DIRECTORS’ REPORT
30 JUNE 2015
Page 15
SHARE OPTIONS During the year ended 30 June 2015 1,500,000 vendor options exercisable at $0.20 each on or before 1 October 2014 expired unexercised. As at 30 June 2015 there are no further options over unissued ordinary shares on issue and no options have been granted since the end of the year. The following table sets out each Director’s relevant interest in shares and options in the Company as at the date of this report:
Ordinary Shares Directors Peter Chambers - Christopher Catlow
(1) 5,702,861
Darryl Harris 210,000 Darjoto Setyawan - Hendra Surya - Stacey Apostolou
(1) 5,000
Notes (1)
Number held at the date of resignation as a Director.
REMUNERATION REPORT (AUDITED)
The remuneration policy for the Group’s Key Management Personnel (including the Chief Executive Officer) has been developed by the Board taking into account:
the size of the Group;
the size of the management team for the Group;
the nature of the Group’s current operations; and
market conditions and comparable salary levels for companies of a similar size and operating in similar sectors.
In considering the above general factors, the Board has also placed emphasis on the following specific issues:
risks associated with resource companies whilst exploring and developing projects; and
other than income which may be generated from asset sales (if any), the Group does not expect to be undertaking significant profitable operations until sometime after the successful commercialisation, production and sales of commodities from its Kulon Progo iron sands project, or the acquisition of a large scale profitable mining operation.
Remuneration Policy for Executives The Group’s remuneration policy is to provide a fixed remuneration component and a performance based component (incentive options, see below). The Board believes that this remuneration policy is appropriate given the stage of development of the Group and the activities which it undertakes and is appropriate in aligning Key Management Personnel objectives with shareholder and business objectives. Performance Based Remuneration – Incentive Options The Board has, in prior years, chosen to issue incentive options to Key Management Personnel as a key component of the incentive portion of their remuneration, in order to attract and retain the services of the Key Management Personnel and to provide an incentive linked to the performance of the Group. The Board considers that each Key Management Personnel’s experience in the resources industry will greatly assist the Group in progressing its projects to the next stage of development and the identification of new projects. As such, the Board believes that the number of incentive options granted to Key Management Personnel is commensurate to their value to the Group. Whilst no incentive options were granted during the current financial year, the Board’s policy has been to grant options to Key Management Personnel with exercise prices at and/or above market share price (at time of agreement). As such, incentive options granted to Key Management Personnel will generally only be of benefit if the Key Management Personnel perform to the level whereby the value of the Group increases sufficiently to warrant exercising the incentive options granted.
Other than market-based vesting conditions, there have been no additional performance criteria on the incentive options granted to Key Management Personnel historically, as given the speculative nature of the Group’s activities and the small management team responsible for its running, it is considered the performance of the Key Management Personnel and the performance and value of the Group are closely related.

INDO MINES LIMITED ANNUAL REPORT 2015
DIRECTORS’ REPORT
30 JUNE 2015
Page 16
REMUNERATION REPORT (AUDITED) (continued) Key Management Personnel are prohibited at all times from entering into margin lending or similar arrangements in respect to securities in the Company they hold or in which they have a relevant interest. Key Management Personnel are prohibited at all times from dealing in financial products issued or created over or in respect of the Company’s Securities. Impact of Shareholder Wealth on Key Management Personnel Remuneration The Board does not directly base remuneration levels on the Group’s share price or movement in the share price over the financial year. The Company does not expect to be undertaking significant profitable operations until sometime after the successful commercialisation, production and sales of commodities from its Kulon Progo iron sands project, or the acquisition of a large scale profitable mining operation. Accordingly the Board does not consider current or prior year earnings or share price movements when assessing remuneration of Key Management Personnel. The compensation structures take into account the capability and experience of the key management personnel and their ability to assist Company performance. As a result of the Group’s exploration and development activities, the Board anticipates that it will retain future earnings (if any) and other cash resources for the operation and development of its business. Accordingly the Group does not currently have a policy with respect to the payment of dividends, and as a result the remuneration policy does not take into account the level of dividends or other distributions to shareholders (e.g. return of capital). Impact of Earnings on Key Management Personnel Remuneration The Company does not expect to be undertaking significant profitable operations until sometime after the successful commercialisation, production and sales of commodities from its Kulon Progo iron sands project, or the acquisition of a large scale profitable mining operation. Accordingly the Board does not consider current or prior year earnings or share price movements when assessing remuneration of Key Management Personnel. The compensation structures take into account the capability and experience of the key management personnel and their ability to assist Company performance. Fixed Compensation
Fixed compensation consists of base compensation (which is calculated on a total cost basis and includes any FBT charges related to employee benefits including motor vehicles), as well as employer contributions to superannuation funds. Compensation levels are generally reviewed annually by the Board through a process that considers individual, segment and overall performance of the Group. In addition, where necessary, external consultants provide analysis and advice to ensure the Directors’ and senior executives’ compensation is competitive in the market place. A senior executive’s compensation is also reviewed on promotion. No external consultants were engaged during the year ended 30 June 2015.
Remuneration Policy for Non-Executive Directors The Board policy is to remunerate Non-Executive Directors at market rates for comparable companies for time, commitment and responsibilities. Given the current size, nature and risks of the Group, incentive options have previously been used to attract and retain Non-Executive Directors. The Board determines payments to the Non-Executive Directors and reviews their remuneration annually, based on market practice, duties and accountability. Independent external advice is sought when required. No external consultants were engaged during the year ended 30 June 2015. The maximum aggregate amount of fees that can be paid to Non-Executive Directors is subject to approval by shareholders at a General Meeting. Fees for Non-Executive Directors are not linked to the performance of the Group. General Where required, Key Management Personnel receive superannuation contributions, which for the year ended 30 June 2015 was equal to 9.5% of salary. Key Management Personnel do not receive any other retirement benefit. From time to time, individuals have chosen to sacrifice part of their salary to increase payments towards superannuation.
INDO MINES LIMITED ANNUAL REPORT 2015
DIRECTORS’ REPORT
30 JUNE 2015
Page 17
REMUNERATION REPORT (AUDITED) (continued) All remuneration paid to Key Management Personnel is valued at cost to the Company and expensed. Incentive options are valued using an appropriate option valuation methodology depending upon the terms of the options. The value of these incentive options is expensed over the vesting period. Employment Contracts with Key Management Personnel Ms Stacey Apostolou, who resigned on 30 September 2014 as a Director of the Company and on 31 October 2014 as Company Secretary and Chief Financial Officer of the Group, entered into a fixed term contract with effect from 1 March 2013 which initially expired on 31 December 2013, but was extended by mutual agreement until 31 December 2014. Prior to Ms Apostolou’s appointment as a Director, she received a fixed remuneration component of $20,000 per month inclusive of superannuation. Subsequent to her appointment, this was increased to $23,333 per month (inclusive of superannuation). Mr Arran Marshall, Chief Executive Officer, entered into an executive services agreement with the Company with effect from 25 February 2014. Pursuant to that agreement, Mr Marshall is paid a base salary of A$275,000 per annum, a housing allowance of US$3,000 per month and a motor vehicle allowance of IDR12.5 million per month. In addition, Mr Marshall may be entitled to receive a bonus of up to A$370,000 subject to him achieving certain performance based milestones during the period to 31 December 2015. The Company may terminate Mr Marshall’s employment at any time upon three months' notice, where that termination is effected within twelve months of his commencement, and upon 6 months’ notice, where the termination is effected following the expiration of twelve months from commencement. In lieu of notice, the Company may pay Mr Marshall an amount calculated in proportion to his base salary for any period of short notice. Mr Marshall can resign by providing three months’ written notice. The Company can terminate the agreement without notice for serious misconduct. Non-Executive directors Total compensation for all Non-Executive Directors, last voted upon by shareholders at the 2011 AGM, is not to exceed $500,000 per annum and is set with reference to fees paid to other non-executive directors of comparable companies. With effect from 1 December 2012, fees payable for the independent Non-Executive Directors are $50,000 per annum inclusive of superannuation contributions. Directors appointed by the Rajawali Group do not receive any Directors’ fees. Mr Surya was paid $17,324 during the year as remuneration for his role as CEO of PT JMI. Mr Chambers retired from his executive role with the Rajawali Group on 30 June 2014. With effect from 1 July 2014, Mr Chambers receives a fee in his capacity as Chairman of $78,000 per annum inclusive of superannuation contributions. Non-Executive Directors did not receive any performance related compensation in 2015 (2014: Nil). Directors’ fees cover all main board activities and committee memberships. External consultants were not engaged in the preparation of the remuneration report.
INDO MINES LIMITED ANNUAL REPORT 2015
DIRECTORS’ REPORT
30 JUNE 2015
Page 18
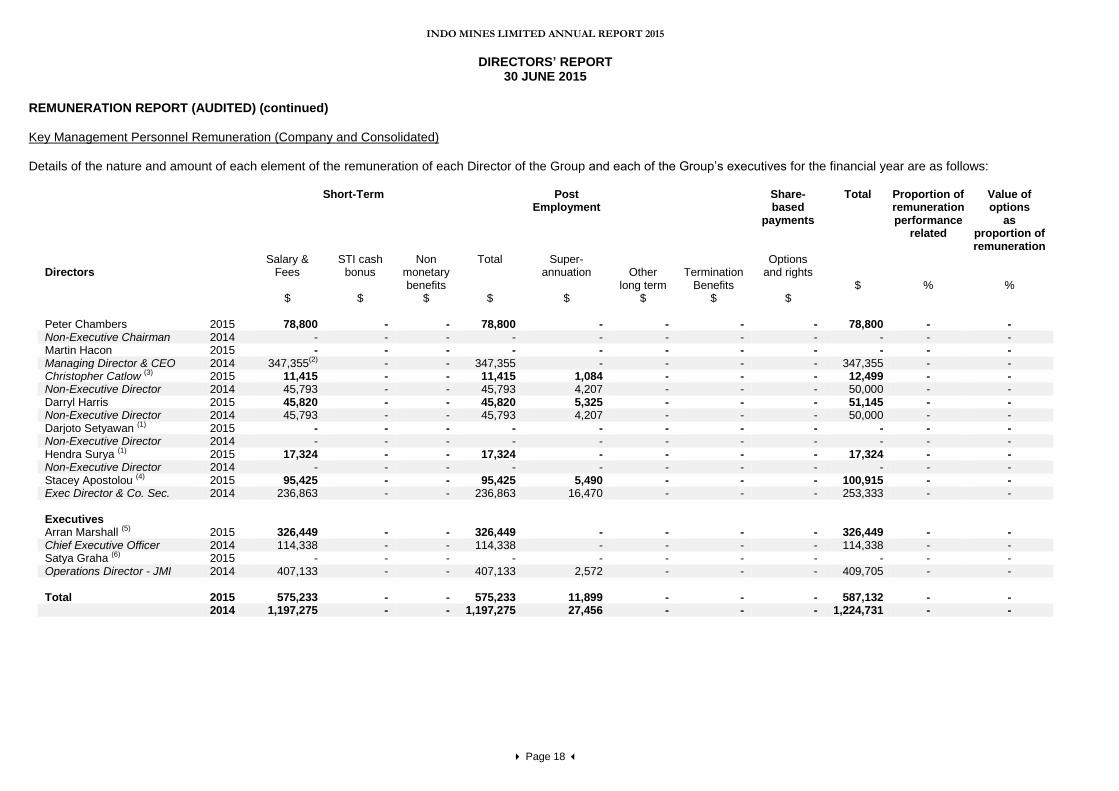
REMUNERATION REPORT (AUDITED) (continued) Key Management Personnel Remuneration (Company and Consolidated) Details of the nature and amount of each element of the remuneration of each Director of the Group and each of the Group’s executives for the financial year are as follows:
Short-Term Post Employment
Other long term
$
Termination Benefits
$
Share- based
payments
Total Proportion of remuneration performance
related
Value of options
as proportion of remuneration
Directors
Salary & Fees
$
STI cash bonus
$
Non monetary benefits
$
Total
$
Super- annuation
$
Options and rights
$
$
%
%
Peter Chambers 2015 78,800 - - 78,800 - - - - 78,800 - - Non-Executive Chairman 2014 - - - - - - - - - - - Martin Hacon 2015 - - - - - - - - - - - Managing Director & CEO 2014 347,355(2) - - 347,355 - - - - 347,355 - - Christopher Catlow (3) 2015 11,415 - - 11,415 1,084 - - - 12,499 - - Non-Executive Director 2014 45,793 - - 45,793 4,207 - - - 50,000 - - Darryl Harris 2015 45,820 - - 45,820 5,325 - - - 51,145 - - Non-Executive Director 2014 45,793 - - 45,793 4,207 - - - 50,000 - - Darjoto Setyawan (1) 2015 - - - - - - - - - - - Non-Executive Director 2014 - - - - - - - - - - - Hendra Surya (1) 2015 17,324 - - 17,324 - - - - 17,324 - - Non-Executive Director 2014 - - - - - - - - - - - Stacey Apostolou (4) 2015 95,425 - - 95,425 5,490 - - - 100,915 - - Exec Director & Co. Sec. 2014 236,863 - - 236,863 16,470 - - - 253,333 - - Executives Arran Marshall (5) 2015 326,449 - - 326,449 - - - - 326,449 - - Chief Executive Officer 2014 114,338 - - 114,338 - - - - 114,338 - - Satya Graha (6) 2015 - - - - - - - - - - - Operations Director - JMI 2014 407,133 - - 407,133 2,572 - - - 409,705 - - Total 2015 575,233 - - 575,233 11,899 - - - 587,132 - - 2014 1,197,275 - - 1,197,275 27,456 - - - 1,224,731 - -

INDO MINES LIMITED ANNUAL REPORT 2015
DIRECTORS’ REPORT
30 JUNE 2015
Page 19
REMUNERATION REPORT (AUDITED) (continued) Notes (1) No Directors Fees were payable to Messrs Setyawan and Surya for the year ended 30 June 2015.
Remuneration paid for Mr Surya for his role as CEO of PT JMI during the year totalled $17,324. (2) Includes the payment of $84,855 in annual leave paid out on termination. (3) Mr Catlow resigned as a Director on 30 September 2014 (4) Ms Apostolou resigned as a Director on 30 September 2014 and as Company Secretary on 31 October 2014. (5) Mr Marshall commenced employment on 25 February 2014. (6) Mr Graha remains an employee of JMI but due to a change in role and responsibilities is no longer classified
as key management personnel. Options Granted to Key Management Personnel No options were granted, exercised or lapsed during the year.
End of Remuneration Report INSURANCE OF OFFICERS AND AUDITORS
Under the Constitution the Company is obliged, to the extent permitted by law, to indemnify an officer (including Directors) of the Company against liabilities incurred by the officer in that capacity, against costs and expenses incurred by the officer in successfully defending civil or criminal proceedings, and against any liability which arises out of conduct not involving a lack of good faith. The Company has in respect of any person who is or has been an officer of the Company or a related body corporate paid or agreed to pay a premium of $18,901 (2014: $18,051) in respect of a contract insuring against a liability incurred as an officer for the costs or expenses to defend legal proceedings. The Company has indemnified officers of the Company against a liability incurred as an officer including costs and expenses in successfully defending legal proceedings. The Company has not, during or since the end of the financial year, indemnified or agreed to indemnify an auditor of the Company or of any related body corporate against a liability incurred as such an auditor. NON-AUDIT SERVICES There were no non-audit services provided by the auditor (or by another person or firm on the auditor’s behalf) during the financial year. AUDITOR’S INDEPENDENCE DECLARATION The auditor’s independence declaration, which forms part of this Directors’ Report, for the year ended 30 June 2015 is on page 20. This report is made in accordance with a resolution of the Directors made pursuant to section 298(2) of the Corporations Act 2001. For and on behalf of the Directors
PETER CHAMBERS Non-Executive Chairman Dated this 30th day of September 2015

Page 20
AUDITORS’ INDEPENDENCE DECLARATION
INDO MINES LIMITED ANNUAL REPORT 2015
Page 21
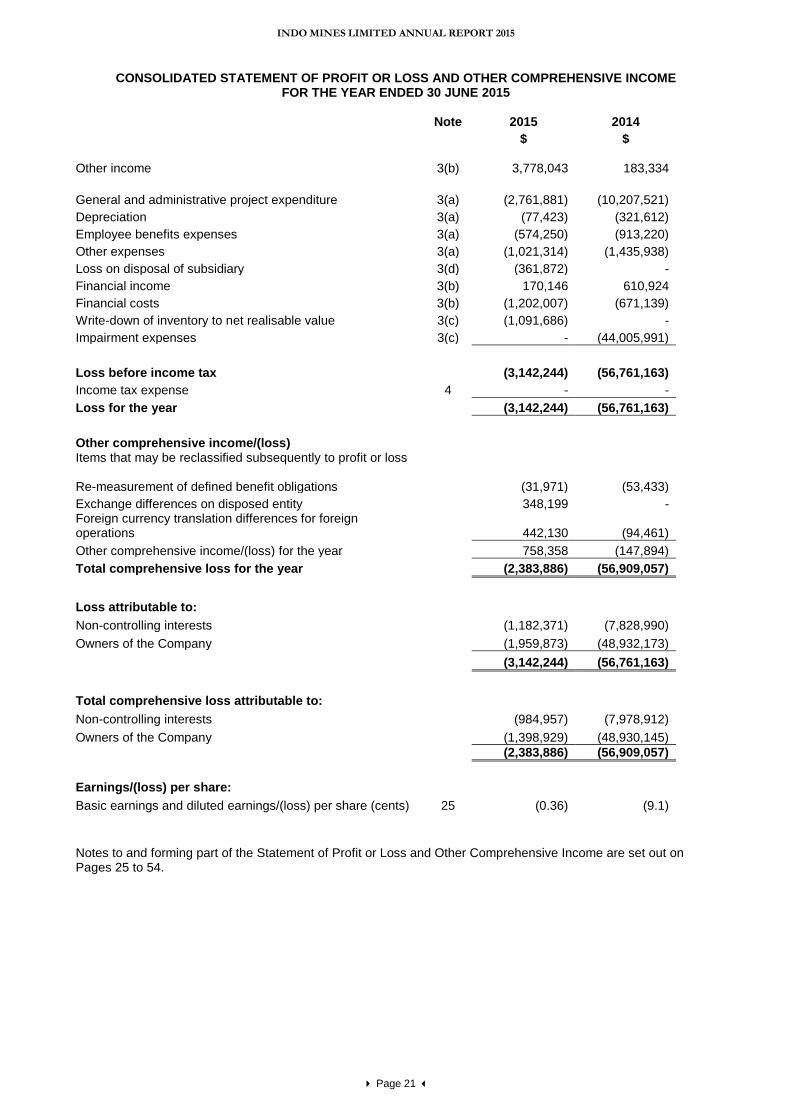
CONSOLIDATED STATEMENT OF PROFIT OR LOSS AND OTHER COMPREHENSIVE INCOME FOR THE YEAR ENDED 30 JUNE 2015
Note 2015 2014
$ $
Other income 3(b) 3,778,043 183,334
General and administrative project expenditure 3(a) (2,761,881) (10,207,521)
Depreciation 3(a) (77,423) (321,612)
Employee benefits expenses 3(a) (574,250) (913,220)
Other expenses 3(a) (1,021,314) (1,435,938)
Loss on disposal of subsidiary 3(d) (361,872) -
Financial income 3(b) 170,146 610,924
Financial costs 3(b) (1,202,007) (671,139)
Write-down of inventory to net realisable value 3(c) (1,091,686) -
Impairment expenses 3(c) - (44,005,991)
Loss before income tax (3,142,244) (56,761,163)
Income tax expense 4 - -
Loss for the year (3,142,244) (56,761,163)
Other comprehensive income/(loss) Items that may be reclassified subsequently to profit or loss Re-measurement of defined benefit obligations (31,971) (53,433)
Exchange differences on disposed entity 348,199 - Foreign currency translation differences for foreign operations
442,130
(94,461)
Other comprehensive income/(loss) for the year 758,358 (147,894)
Total comprehensive loss for the year (2,383,886) (56,909,057)
Loss attributable to:
Non-controlling interests (1,182,371) (7,828,990)
Owners of the Company (1,959,873) (48,932,173)
(3,142,244) (56,761,163)
Total comprehensive loss attributable to:
Non-controlling interests (984,957) (7,978,912)
Owners of the Company (1,398,929) (48,930,145)
(2,383,886) (56,909,057)
Earnings/(loss) per share: Basic earnings and diluted earnings/(loss) per share (cents) 25 (0.36) (9.1)
Notes to and forming part of the Statement of Profit or Loss and Other Comprehensive Income are set out on Pages 25 to 54.
INDO MINES LIMITED ANNUAL REPORT 2015
Page 22
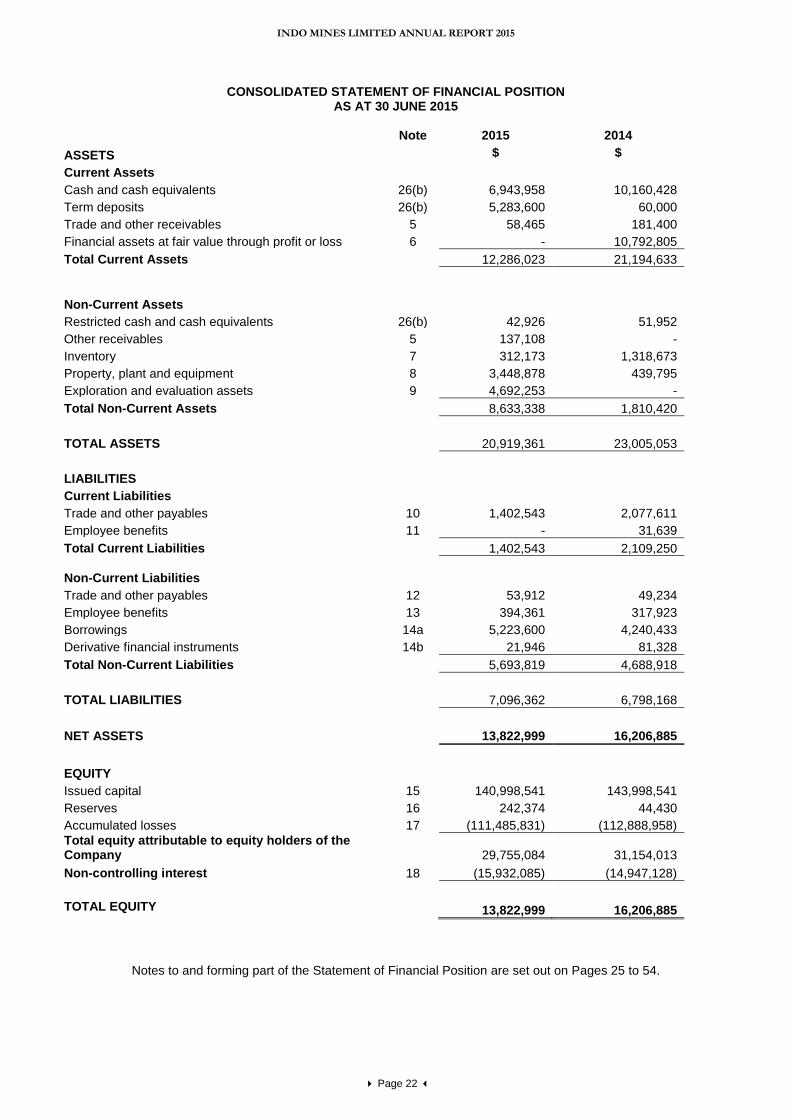
CONSOLIDATED STATEMENT OF FINANCIAL POSITION AS AT 30 JUNE 2015
Note 2015 2014
ASSETS $ $
Current Assets
Cash and cash equivalents 26(b) 6,943,958 10,160,428
Term deposits 26(b) 5,283,600 60,000
Trade and other receivables 5 58,465 181,400
Financial assets at fair value through profit or loss 6 - 10,792,805
Total Current Assets 12,286,023 21,194,633
Non-Current Assets
Restricted cash and cash equivalents 26(b) 42,926 51,952
Other receivables 5 137,108 -
Inventory 7 312,173 1,318,673
Property, plant and equipment 8 3,448,878 439,795
Exploration and evaluation assets 9 4,692,253 -
Total Non-Current Assets 8,633,338 1,810,420
TOTAL ASSETS 20,919,361 23,005,053
LIABILITIES
Current Liabilities
Trade and other payables 10 1,402,543 2,077,611
Employee benefits 11 - 31,639
Total Current Liabilities 1,402,543 2,109,250
Non-Current Liabilities
Trade and other payables 12 53,912 49,234
Employee benefits 13 394,361 317,923
Borrowings 14a 5,223,600 4,240,433
Derivative financial instruments 14b 21,946 81,328
Total Non-Current Liabilities 5,693,819 4,688,918
TOTAL LIABILITIES 7,096,362 6,798,168
NET ASSETS 13,822,999 16,206,885
EQUITY
Issued capital 15 140,998,541 143,998,541
Reserves 16 242,374 44,430
Accumulated losses 17 (111,485,831) (112,888,958)
Total equity attributable to equity holders of the Company
29,755,084
31,154,013
Non-controlling interest 18 (15,932,085) (14,947,128)
TOTAL EQUITY 13,822,999 16,206,885
Notes to and forming part of the Statement of Financial Position are set out on Pages 25 to 54.
INDO MINES LIMITED ANNUAL REPORT 2015
Page 23
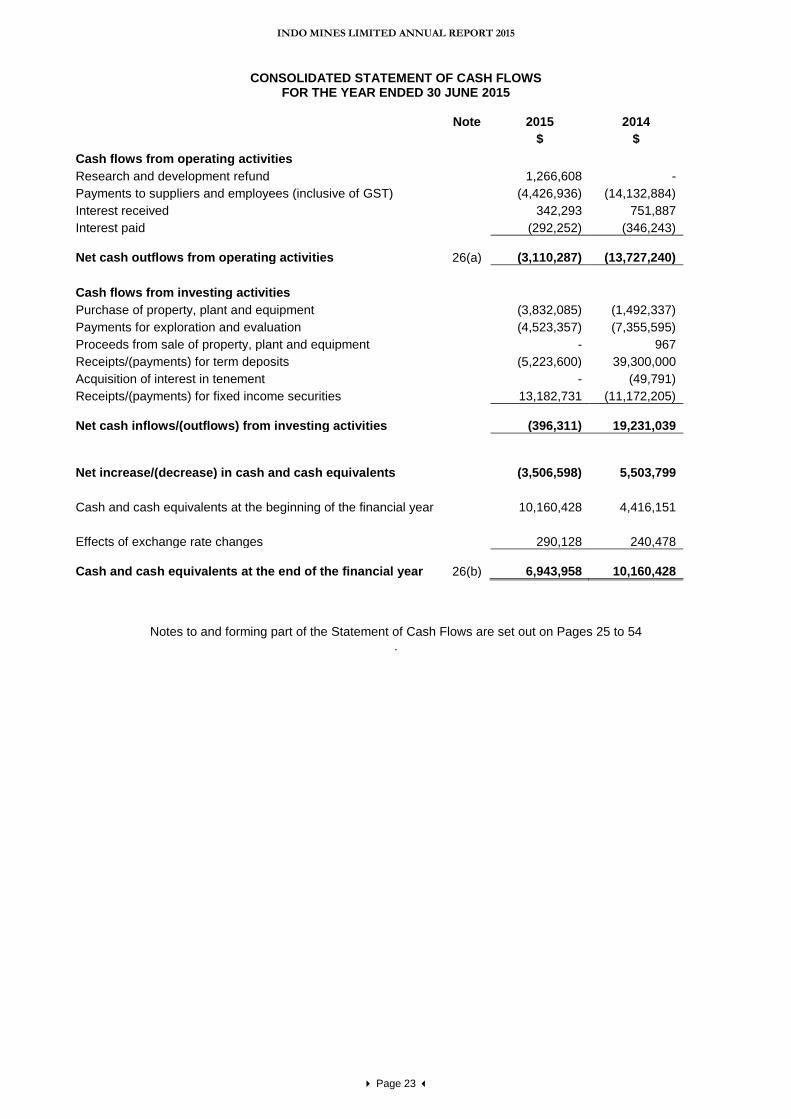
CONSOLIDATED STATEMENT OF CASH FLOWS FOR THE YEAR ENDED 30 JUNE 2015
Note 2015 2014
$ $
Cash flows from operating activities
Research and development refund 1,266,608 -
Payments to suppliers and employees (inclusive of GST) (4,426,936) (14,132,884)
Interest received 342,293 751,887
Interest paid (292,252) (346,243)
Net cash outflows from operating activities
26(a)
(3,110,287)
(13,727,240)
Cash flows from investing activities
Purchase of property, plant and equipment (3,832,085) (1,492,337)
Payments for exploration and evaluation (4,523,357) (7,355,595)
Proceeds from sale of property, plant and equipment - 967
Receipts/(payments) for term deposits (5,223,600) 39,300,000
Acquisition of interest in tenement - (49,791)
Receipts/(payments) for fixed income securities 13,182,731 (11,172,205)
Net cash inflows/(outflows) from investing activities
(396,311)
19,231,039
Net increase/(decrease) in cash and cash equivalents
(3,506,598)
5,503,799
Cash and cash equivalents at the beginning of the financial year 10,160,428 4,416,151
Effects of exchange rate changes 290,128 240,478
Cash and cash equivalents at the end of the financial year
26(b)
6,943,958
10,160,428
Notes to and forming part of the Statement of Cash Flows are set out on Pages 25 to 54 .
INDO MINES LIMITED ANNUAL REPORT 2015
Page 24
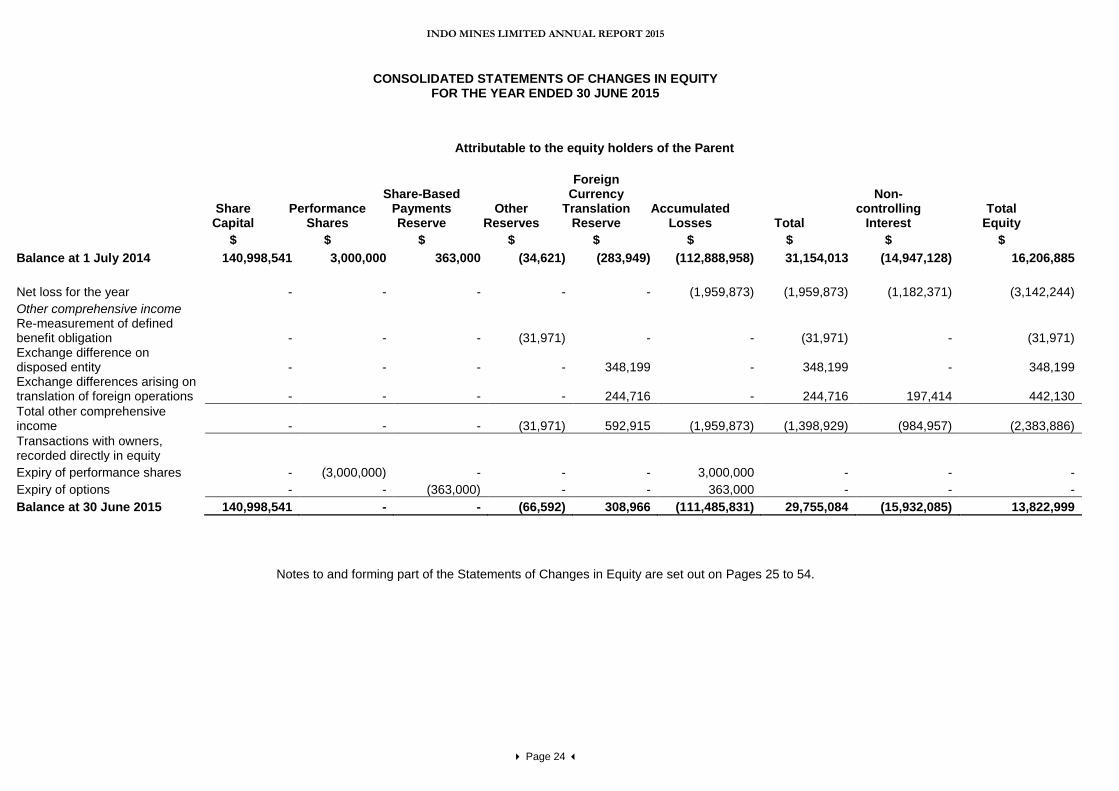
CONSOLIDATED STATEMENTS OF CHANGES IN EQUITY FOR THE YEAR ENDED 30 JUNE 2015
Notes to and forming part of the Statements of Changes in Equity are set out on Pages 25 to 54.
Attributable to the equity holders of the Parent
Share
Capital
Performance Shares
Share-Based Payments Reserve
Other Reserves
Foreign Currency
TranslationReserve
Accumulated Losses
Total
Non-controlling
Interest Total
Equity
$ $ $ $ $ $ $ $ $
Balance at 1 July 2014 140,998,541 3,000,000 363,000 (34,621) (283,949) (112,888,958) 31,154,013 (14,947,128) 16,206,885
Net loss for the year - - - - - (1,959,873) (1,959,873) (1,182,371) (3,142,244)
Other comprehensive income Re-measurement of defined benefit obligation - - - (31,971) - - (31,971) - (31,971) Exchange difference on disposed entity - - - - 348,199 - 348,199 - 348,199 Exchange differences arising on translation of foreign operations - - - - 244,716 - 244,716 197,414 442,130
Total other comprehensive income - - - (31,971) 592,915 (1,959,873) (1,398,929) (984,957) (2,383,886)
Transactions with owners, recorded directly in equity
Expiry of performance shares - (3,000,000) - - - 3,000,000 - - -
Expiry of options - - (363,000) - - 363,000 - - -
Balance at 30 June 2015 140,998,541 - - (66,592) 308,966 (111,485,831) 29,755,084 (15,932,085) 13,822,999
INDO MINES LIMITED ANNUAL REPORT 2015
Page 25
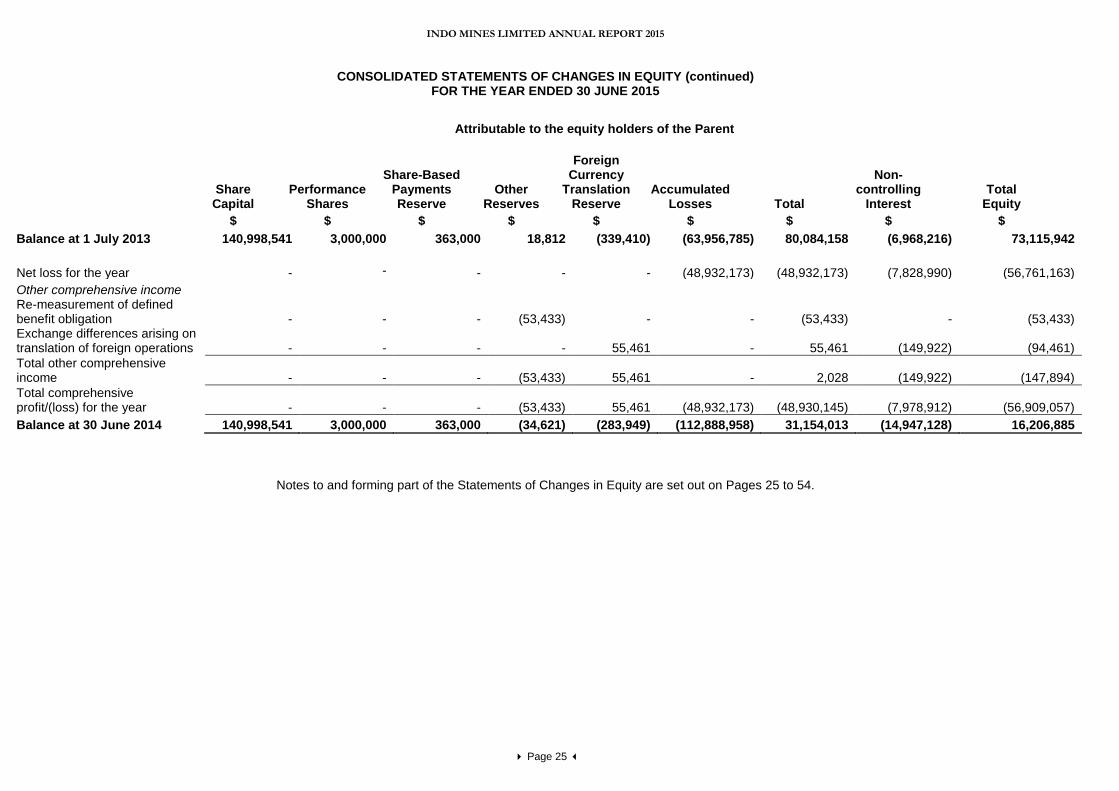
CONSOLIDATED STATEMENTS OF CHANGES IN EQUITY (continued) FOR THE YEAR ENDED 30 JUNE 2015
Notes to and forming part of the Statements of Changes in Equity are set out on Pages 25 to 54.
Attributable to the equity holders of the Parent
Share
Capital
Performance Shares
Share-Based Payments Reserve
Other Reserves
Foreign Currency
TranslationReserve
Accumulated Losses
Total
Non-controlling
Interest Total
Equity
$ $ $ $ $ $ $ $ $
Balance at 1 July 2013 140,998,541 3,000,000 363,000 18,812 (339,410) (63,956,785) 80,084,158 (6,968,216) 73,115,942
Net loss for the year - - - - - (48,932,173) (48,932,173) (7,828,990) (56,761,163)
Other comprehensive income Re-measurement of defined benefit obligation -
- - (53,433) - - (53,433) - (53,433)
Exchange differences arising on translation of foreign operations -
- - - 55,461 - 55,461 (149,922) (94,461)
Total other comprehensive income -
- - (53,433) 55,461 - 2,028 (149,922) (147,894)
Total comprehensive profit/(loss) for the year -
- - (53,433) 55,461 (48,932,173) (48,930,145) (7,978,912) (56,909,057)
Balance at 30 June 2014 140,998,541 3,000,000 363,000 (34,621) (283,949) (112,888,958) 31,154,013 (14,947,128) 16,206,885

INDO MINES LIMITED ANNUAL REPORT 2015
NOTES TO AND FORMING PART OF THE FINANCIAL STATEMENTS
Page 26
1. STATEMENT OF SIGNIFICANT ACCOUNTING POLICIES
The principal accounting policies adopted in preparing the financial report of the Company, Indo Mines Limited and its consolidated entities (“Consolidated Entity” or “Group”) for the year ended 30 June 2015 are stated to assist in a general understanding of the financial report. These policies have been consistently applied to all the years presented, except as described below. Indo Mines is domiciled in Australia and is a for-profit entity, limited by shares and these shares are publicly traded on the Australian Securities Exchange. The financial report of the Group for the year ended 30 June 2015 was authorised for issue in accordance with a resolution of the Directors on 30 September 2015. (a) Going Concern The Group incurred a loss for the year of $3,142,244 (2014: $56,761,163) whilst it continued with studies for the development of the Kulon Progo iron sands project. The financial report has been prepared on a going concern basis which contemplates the continuation of business activity and the realisation of assets and settlement of liabilities in the ordinary course of business. (b) Basis of Preparation Statement of compliance The financial report is a general purpose financial report which has been prepared in accordance with Australian Accounting Standards (AASs) adopted by the Australian Accounting Standards Board (AASB) and the Corporations Act 2001. The consolidated financial report of the Group complies with International Financial Reporting Standards (IFRSs) adopted by the International Accounting Standards Board (IASB). Basis of measurement The consolidated financial statements have been prepared on the historical cost basis, as modified by the revaluation of financial assets and liabilities (including derivative instruments) at fair value through profit or loss.
New or revised accounting standards and interpretations
A number of new standards, amendments to standards and interpretations are effective for annual periods beginning after 1 July 2014, and have been applied in preparing these financial statements. Those which may be relevant to the Group are set out below.
Certain new or revised accounting standards and interpretations became effective for the annual reporting period commencing 1 July 2014. The Group assesses that these recently issued or revised standards and interpretations will not have a significant impact on the group’s financial statements.
INDO MINES LIMITED ANNUAL REPORT 2015
NOTES TO AND FORMING PART OF THE FINANCIAL STATEMENTS
Page 27
1. STATEMENT OF SIGNIFICANT ACCOUNTING POLICIES (continued) (c) Principles of Consolidation The consolidated financial statements incorporate the assets and liabilities of all subsidiaries of Indo Mines Limited as at 30 June 2015 and the results of all subsidiaries for the year then ended. Indo Mines and its subsidiaries together are referred to as the Group or the Consolidated Entity. Subsidiaries are all those entities (including special purpose entities) over which the Group has the power to govern the financial and operating policies, generally accompanying a shareholding of more than one-half of the voting rights. The existence and potential effect of potential voting rights that are currently exercisable or convertible are considered when assessing whether the Group controls another entity. The Group controls an entity when it is exposed to, or has rights to, variable returns through it power over the entity. Subsidiaries are fully consolidated from the date on which control is transferred to the Group. They are de-consolidated from the date that control ceases. Intercompany transactions and balances, and unrealised gains on transactions between Group companies, are eliminated. Unrealised losses are also eliminated unless the transaction provides evidence of the impairment of the asset transferred. Accounting policies of subsidiaries have been changed where necessary to ensure consistency with the policies adopted by the Group. Non-controlling interest The Group measures any non-controlling interest at its proportionate interest in the identifiable net assets of the subsidiary. (d) Exploration and evaluation expenditure
Exploration and evaluation expenditure encompasses expenditures incurred by the Group in connection with the exploration for and evaluation of mineral resources before the technical feasibility and commercial viability of extracting a mineral resource are demonstrable. Exploration and evaluation expenditure incurred by the Group is accumulated for each area of interest and recorded as an asset if:
(i) the rights to tenure of the area of interest are current; and (ii) at least one of the following conditions is also met:
(1) the exploration and evaluation expenditures are expected to be recouped through successful development and exploitation of the area of interest, or alternatively, by its sale; and/or
(2) exploration and evaluation activities in the area of interest have not at the reporting date reached a stage which permits a reasonable assessment of the existence or otherwise of economically recoverable reserves, and active and significant operations in, or in relation to, the area of interest are continuing.
For each area of interest, expenditure incurred in the acquisition of rights to explore is capitalised and recognised as an exploration and evaluation asset. Exploration and evaluation assets are measured at cost on recognition. Capitalised exploration costs are reviewed each reporting date to establish whether an indication of impairment exists. If any such indication exists, the recoverable amount of the capitalised exploration costs is estimated to determine the extent of the impairment loss (if any). Where a decision is made to proceed with development, accumulated expenditure is tested for impairment and transferred to development properties, and then amortised over the life of the reserves associated with the area of interest once mining operations have commenced.
Recoverability of the carrying amount of the exploration and evaluation assets is dependent on successful development and commercial exploitation, or alternatively, sale of the respective areas of interest.
INDO MINES LIMITED ANNUAL REPORT 2015
NOTES TO AND FORMING PART OF THE FINANCIAL STATEMENTS
Page 28
1. STATEMENT OF SIGNIFICANT ACCOUNTING POLICIES (continued) (e) Revenue Recognition Interest income Interest income is recognised in the Statement of Profit or Loss as it accrues, using the effective interest method. (f) Income Tax The income tax expense or revenue for the period is the tax payable on the current period’s taxable income based on the national income tax rate for each jurisdiction adjusted by changes in deferred tax assets and liabilities attributable to temporary differences between the tax bases of assets and liabilities and their carrying amounts in the financial statements, and to unused tax losses. Deferred tax assets and liabilities are recognised for temporary differences at the tax rates expected to apply when the assets are recovered or liabilities are settled, based on those tax rates which are enacted or substantively enacted for each jurisdiction. The relevant tax rates are applied to the cumulative amounts of deductible and taxable temporary differences to measure the deferred tax asset or liability. An exception is made for certain temporary differences arising from the initial recognition of an asset or a liability. No deferred tax asset or liability is recognised in relation to these temporary differences if they arose in a transaction, other than a business combination, that at the time of the transaction did not affect either accounting profit or taxable profit or loss. Deferred tax assets are recognised for deductible temporary differences and unused tax losses only if it is probable that future taxable amounts will be available to utilise those temporary differences and losses. Deferred tax liabilities and assets are not recognised for temporary differences between the carrying amount and tax bases of investments in controlled entities where the parent entity is able to control the timing of the reversal of the temporary differences and it is probable that the differences will not reverse in the foreseeable future. Current and deferred tax balances attributable to amounts recognised directly in equity are also recognised directly in equity. Indo Mines and its wholly-owned Australian subsidiaries have formed an income tax consolidated group under the tax consolidation regime. Each entity in the group recognises its own current and deferred taxes, except for any deferred tax assets resulting from unused tax losses and tax credits, which are immediately assumed by the Company. The current tax liability of each group entity is then subsequently assumed by the Company. The group notified the Australian Tax Office that it had formed an income tax consolidated group from 1 July 2008. (g) Impairment of Non-Financial Assets
Assets that have an indefinite useful life are not subject to amortisation and are tested annually for impairment. Assets that are subject to amortisation are reviewed for impairment whenever events or changes in circumstances indicate that the carrying amount may not be recoverable. An impairment loss is recognised for the amount by which the asset’s carrying amount exceeds its recoverable amount. The recoverable amount is the higher of an asset’s fair value less cost of disposal and its value in use. For the purposes of assessing impairment, assets are grouped at the lowest levels for which there are separately identifiable cash flows (cash generating units). (h) Cash and Cash Equivalents Cash and cash equivalents includes cash on hand, deposits held at call with financial institutions and other short-term highly liquid investments that are readily convertible to known amounts of cash (maturities of three months or less) and which are subject to an insignificant risk of changes in value. Bank overdrafts are shown within borrowings in current liabilities on the balance sheet. Restricted cash and cash equivalents represents deposits held with financial institutions that are held as security and are not readily convertible to cash.

INDO MINES LIMITED ANNUAL REPORT 2015
NOTES TO AND FORMING PART OF THE FINANCIAL STATEMENTS
Page 29
1. STATEMENT OF SIGNIFICANT ACCOUNTING POLICIES (continued) (i) Trade Receivables Trade receivables are recognised initially at fair value and subsequently measured at amortised cost less an allowance for doubtful debts. Trade receivables are due for settlement no more than 30 days from the date of recognition. An estimate of doubtful debts is made when collection of the full amount is no longer probable. Bad debts are written off as incurred. (j) Inventories Inventories are measured at the lower of cost and net realisable value. The cost of inventories is based on the first-in first-out principle, and includes expenditure incurred in acquiring the inventories, production or conversion costs and other costs incurred in bringing them to their existing location and condition. Net realisable value is the estimated selling price in the ordinary course of business, less the estimated costs of bringing the inventory into a saleable state and selling expenses. (k) Property, Plant and Equipment Plant and equipment is stated at historical cost less accumulated depreciation. Historical cost includes expenditure that is directly attributable to the acquisition of the items. Subsequent costs are included in the asset’s carrying amount or recognised as a separate asset, as appropriate, only when it is probable that future economic benefits associated with the item will flow to the Group and the cost of the item can be measured reliably. All other repairs and maintenance are charged to the income statement during the financial period in which they are incurred. Plant and equipment are depreciated or amortised on a straight line basis at rates based upon their expected useful lives as follows:
Life (years)
Buildings Machinery Office equipment
4-10 8-16
4 The assets’ residual values and useful lives are reviewed, and adjusted if appropriate, at each balance sheet date. Gains and losses on disposals are determined by comparing proceeds with carrying amount. These are included in the income statement. (l) Fair value estimation The fair value of financial instruments traded in active markets (such as publicly traded derivatives, and trading and equity securities) is based on quoted market prices at the balance sheet date. The quoted market price used for financial assets held by the Group is the current bid price; the appropriate quoted market price for financial liabilities is the current ask price. The fair value of financial instruments that are not traded in an active market (for example, over the counter derivatives) is determined using valuation techniques. The Group uses a variety of methods and makes assumptions that are based on market conditions existing at each balance date. Quoted market prices or dealer quotes for similar instruments are used for long-term debt instruments held. Other techniques, such as discounted cash flows, are used to determine fair value for the remaining financial instruments. The fair value of interest-rate swaps is calculated as the present value of the estimated future cash flows. The fair value of forward exchange contracts is determined using forward exchange market rates at the balance sheet date.
INDO MINES LIMITED ANNUAL REPORT 2015
NOTES TO AND FORMING PART OF THE FINANCIAL STATEMENTS
Page 30
1. STATEMENT OF SIGNIFICANT ACCOUNTING POLICIES (continued) (m) Investments and Other Financial Assets The Group classifies its investments in the following categories: financial assets at fair value through profit or loss, loans and receivables, held-to-maturity investments, and available-for-sale financial assets. The classification depends on the purpose for which the investments were acquired. Management determines the classification of its investments at initial recognition and re-evaluates this designation at each reporting date. Financial assets at fair value through profit or loss are acquired for the purpose of selling in the short term with the intention of making a profit. Fair value movements are recognised in profit or loss. The Group assesses at each balance date whether there is objective evidence that a financial asset or group of financial assets is impaired. In the case of equity securities classified as available-for-sale, a significant or prolonged decline in the fair value of a security below its cost is considered in determining whether the security is impaired. If any such evidence exists for available-for-sale financial assets, the cumulative loss – measured as the difference between the acquisition cost and the current fair value, less any impairment loss on that financial asset previously recognised in profit and loss – is removed from equity and recognised in the income statement. Impairment losses recognised in the income statement on equity instruments are not reversed through the income statement. (n) Trade and Other Payables
Liabilities for trade creditors and other amounts are carried at cost which is the fair value of the consideration to be paid in the future for goods and services received, whether or not billed to the consolidated entity. The amounts are unsecured and are usually paid within 30 days. Payables to related parties are carried at the principal amount. (o) Employee Benefits (i) Short term benefits Liabilities for wages and salaries, including non-monetary benefits and annual leave expected to be settled within twelve months of the reporting date are recognised in provisions in respect of employees’ services up to the reporting date and are measured at the amounts expected to be paid when the liabilities are settled. Liabilities for non-accumulating sick leave are recognised when the leave is taken and measured at the rates paid or payable. Employee benefits payable later than one year are measured at the present value of the estimated future cash flows to be made for those benefits. (ii) Defined contribution plans A defined contribution plan is a post-employment benefit plan under which an entity pays fixed contributions into a separate entity and will have no legal or constructive obligation to pay further amounts. Obligations for contributions to defined contribution plans are recognised as an employee benefit expense in profit or loss in the periods during which services are rendered by employees. Prepaid contributions are recognised as an asset to the extent that a cash refund or a reduction in future payments is available. Contributions to a defined contribution plan that are due more than 12 months after the end of the period in which the employees render the service are discounted to their present value. (iii) Defined benefit obligation The Indonesian subsidiary is required to provide minimum benefits as stipulated in government labour law regulations. Since the regulations establish the formula for determining the minimum amount of benefits, in substance the pension obligation under the regulations represent a defined benefit obligation. In determining the estimated employee benefit obligations, the subsidiary determines the present value of the defined benefit obligation, current service costs and past service cost using the ‘Project Unit Credit’ actuarial valuation method, with actuarial gains or losses recognised in other comprehensive income.

INDO MINES LIMITED ANNUAL REPORT 2015
NOTES TO AND FORMING PART OF THE FINANCIAL STATEMENTS
Page 31
1. STATEMENT OF SIGNIFICANT ACCOUNTING POLICIES (continued)
(p) Issued Capital Ordinary shares are classified as equity. Issued and paid up capital is recognised at the fair value of the consideration received by the Company. Incremental costs directly attributable to the issue of new shares or options are shown in equity as a deduction, net of tax, from the proceeds. (q) Dividends Provision is made for the amount of any dividend declared on or before the end of the year but not distributed at balance date. (r) Earnings per Share Basic earnings per share is calculated by dividing the profit/loss attributable to equity holders of the Company, excluding any costs of servicing equity other than ordinary shares, by the weighted average number of ordinary shares outstanding during the year, adjusted for bonus elements in ordinary shares issued during the year. Diluted earnings per share adjusts the figures used in the determination of basic earnings/loss per share to take into account the after tax effect of interest and other financing costs associated with dilutive potential ordinary shares and the weighted average number of shares assumed to have been issued for no consideration in relation to dilutive potential ordinary shares. (s) Goods and Services Tax
Revenues, expenses and assets are recognised net of the amount of GST except:
where the GST incurred on a purchase of goods and services is not recoverable from the taxation authority, in which case the GST is recognised as part of the cost of acquisition of the asset or as part of the expense item as applicable; and
receivables and payables are stated with the amount of GST included.
The net amount of GST recoverable from, or payable to, the taxation authority is included as part of receivables or payables in the balance sheet. Cash flows are included in the Cash Flow Statement on a gross basis and the GST component of cash flows arising from investing and financing activities, which is recoverable from, or payable to, the taxation authority are classified as operating cash flows. (t) Segment Reporting An operating segment is a component of the Group that engages in business activities from which it may earn revenues and incur expenses, including revenues and expenses that relate to transactions with any of the Group’s other components. All operating segments’ operating results are regularly reviewed by the chief operating decision maker to make decisions about resources to be allocated to the segment and assess its performance, and for which discrete financial information is available. The Chief operating decision maker is the CEO of the Group. Segment results that are reported include items directly attributable to a segment as well as those that can be allocated on a reasonable basis. Segment capital expenditure is the total cost incurred during the period to acquire property, plant and equipment, and intangible assets other than goodwill. (u) Finance income and finance costs Finance income comprises interest income on funds invested (including available-for-sale financial assets), dividend income, gains on the disposal of available-for-sale financial assets, changes in the fair value of financial assets and liabilities at fair value through profit or loss, and gains on hedging instruments that are recognised in profit or loss. Interest income is recognised as it accrues in profit or loss, using the effective interest method. Dividend income is recognised in profit or loss on the date that the Group’s right to receive payment is established, which in the case of quoted securities is the ex-dividend date.

INDO MINES LIMITED ANNUAL REPORT 2015
NOTES TO AND FORMING PART OF THE FINANCIAL STATEMENTS
Page 32
1. STATEMENT OF SIGNIFICANT ACCOUNTING POLICIES (continued) (u) Finance income and finance costs (continued) Finance costs comprise interest expense on borrowings, unwinding of the discount on provisions, dividends on preference shares classified as liabilities, changes in the fair value of financial assets at fair value through profit or loss, impairment losses recognised on financial assets, and losses on hedging instruments that are recognised in profit or loss. Borrowing costs that are not directly attributable to the acquisition, construction or production of a qualifying asset are recognised in profit or loss using the effective interest method. Foreign currency gains and losses are reported on a net basis. (v) Foreign Currency Both the functional and presentation currency of Indo Mines Limited at 30 June 2015 was Australian Dollars. The following table sets out the functional currency of the subsidiaries (unless dormant) of the Group: Company Name Functional Currency PT Jogja Magasa Iron Indonesian Rupiah PT Indomines Mineral Perkasa Indonesian Rupiah
Each entity in the Group determines its own functional currency and items included in the financial statements of each entity are measured using that functional currency. Transactions in foreign currencies are initially recorded in the functional currency at the exchange rates ruling at the date of the transaction. Monetary assets and liabilities denominated in foreign currencies are retranslated at the rate of exchange ruling at the balance sheet date. All exchange differences in the consolidated financial report are taken to the income statement with the exception of differences in foreign currency borrowings that provide a hedge against a net investment in a foreign entity. These are taken directly to equity until the disposal of the net investment, at which time they are recognised in the income statement. Tax charges and tax credits attributable to exchange differences on those borrowings are also recognised in equity. Non-monetary items that are measured in terms of historical cost in a foreign currency are translated using the exchange rate as at the date of the initial transaction. Non-monetary items that are measured at fair value in a foreign currency are translated using the exchange rates at the date when the fair value was determined. Where the functional currency of a subsidiary of Indo Mines is not Australian Dollars the assets and liabilities of the subsidiary at reporting date are translated into the presentation currency of Indo Mines at the rate of exchange ruling at the balance sheet date and the income statements are translated by applying the average exchange rate for the year. Any exchange differences arising on this retranslation are taken directly to a separate component of equity. On disposal of a foreign entity, the deferred cumulative amount recognised in equity and relating to that particular foreign operation is recognised in the Statement of Profit or Loss. (w) Impairment of financial assets (including receivables) A financial asset not carried at fair value through profit or loss is assessed at each reporting date to determine whether there is objective evidence that it is impaired. A financial asset is impaired if objective evidence indicates that a loss event has occurred after the initial recognition of the asset, and that the loss event had a negative effect on the estimated future cash flows of that asset that can be estimated reliably. Objective evidence that financial assets (including equity securities) are impaired can include default or delinquency by a debtor, restructuring of an amount due to the Group on terms that the Group would not consider otherwise, indications that a debtor or issuer will enter bankruptcy, the disappearance of an active market for a security. In addition, for an investment in an equity security, a significant or prolonged decline in its fair value below its cost is objective evidence of impairment. The Group considers evidence of impairment for receivables and held-to-maturity investment securities at both a specific asset and collective level. All individually significant receivables and held-to-maturity investment securities are assessed for specific impairment. All individually significant receivables and held-to-maturity investment securities found not to be specifically impaired are then collectively assessed for any impairment that has been incurred but not yet identified. Receivables and held-to-maturity investment securities that are not individually significant are collectively assessed for impairment by grouping together receivables and held-to-maturity investment securities with similar risk characteristics.

INDO MINES LIMITED ANNUAL REPORT 2015
NOTES TO AND FORMING PART OF THE FINANCIAL STATEMENTS
Page 33
1. STATEMENT OF SIGNIFICANT ACCOUNTING POLICIES (continued) (w) Impairment of financial assets (including receivables) (continued) In assessing collective impairment the Group uses historical trends of the probability of default, timing of recoveries and the amount of loss incurred, adjusted for management’s judgement as to whether current economic and credit conditions are such that the actual losses are likely to be greater or less than suggested by historical trends. An impairment loss in respect of a financial asset measured at amortised cost is calculated as the difference between its carrying amount and the present value of the estimated future cash flows discounted at the asset’s original effective interest rate. Losses are recognised in profit or loss and reflected in an allowance account against receivables. Interest on the impaired asset continues to be recognised through the unwinding of the discount. When a subsequent event causes the amount of impairment loss to decrease, the decrease in impairment loss is reversed through profit or loss. Impairment losses on available-for-sale investment securities are recognised by transferring the cumulative loss that has been recognised in other comprehensive income, and presented in the fair value reserve in equity, to profit or loss. The cumulative loss that is removed from other comprehensive income and recognised in profit or loss is the difference between the acquisition cost, net of any principal repayment and amortisation, and the current fair value, less any impairment loss previously recognised in profit or loss. Changes in impairment provisions attributable to time value are reflected as a component of interest income. If, in a subsequent period, the fair value of an impaired available-for-sale debt security increases and the increase can be related objectively to an event occurring after the impairment loss was recognised in profit or loss, then the impairment loss is reversed, with the amount of the reversal recognised in profit or loss. However, any subsequent recovery in the fair value of an impaired available-for-sale equity security is recognised in other comprehensive income. (aa) Compound financial instruments Compound financial instruments issued by the Group comprise convertible notes that can be converted to share capital at the option of the holder, and the number of shares to be issued does not vary with changes in their fair value. The liability component of a compound financial instrument is recognised initially at the fair value of a similar liability that does not have an equity conversion option. The conversion component is recognised at fair value as a liability. Subsequent to initial recognition, the liability component of a compound financial instrument is measured at amortised cost using the effective interest method. The conversion component is measured at fair value through profit and loss. Interest, dividends, losses and gains relating to the financial liability are recognised in profit or loss. Distributions to the equity holders are recognised against equity, net of any tax benefit. (ab) Research and development rebates Where a rebate is received relating to research and development costs that have been expensed, the rebate is recognised as other income when the rebate becomes receivable and the Company complies with all attached conditions. If the research and development costs have been capitalised, the rebate is deducted from the carrying value of the underlying asset, unless that asset has been fully impaired in a prior period.

INDO MINES LIMITED ANNUAL REPORT 2015
NOTES TO AND FORMING PART OF THE FINANCIAL STATEMENTS
Page 34
2. CRITICAL ACCOUNTING ESTIMATES AND JUDGEMENTS
Estimates and judgments are continually evaluated and are based on historical experience and other factors, including expectations of future events that are believed to be reasonable under the circumstances.
a) Uses of estimates and judgements The preparation of the consolidated financial statements in conformity with AASs requires management to make judgements, estimates and assumptions that affect the application of accounting policies and the reported amounts of assets, liabilities, income and expenses. Actual results may differ from these estimates. Estimates and underlying assumptions are reviewed on an ongoing basis. Revisions to accounting estimates are recognised in the period in which the estimates are revised and in any future periods affected. Information about critical judgements in applying accounting policies that have the most significant effect on the amounts recongised in the financial statements is included in the following notes: (i) Estimated impairment of deferred exploration, evaluation and development expenditure (refer Note 9) Determining the recoverability of exploration and evaluation expenditure capitalised in accordance with the groups accounting policy (refer note 1(e)), requires estimates and assumptions as to future events and circumstances, in particular, whether successful development and commercial exploitation, or alternatively sale, of the respective areas of interest will be achieved. Critical to this assessment is estimates and assumptions as to reserves, timing of expected cash flows, exchange rates, commodity prices and future capital requirements. Changes in these estimates and assumptions as new information about the presence or recoverability of an ore reserve becomes available, may impact the assessment of the recoverable amount of exploration and evaluation assets. If, after having capitalised the expenditure under accounting policy 1(e), a judgement is made that recovery of the expenditure is unlikely, an impairment loss is recorded in the income statement. The carrying amounts of exploration and evaluation assets are set out in Note 9. (ii) Convertible Note (refer Note 14) The option component of the convertible note is classifed as a derivative financial instrument and is measured at fair value through the Income statement. The option component of the convertible note is valued using the Balck Scholes option valuation methodology. This valuation method calculates the expected benefit from acquiring the shares outright less the present value of paying the exercise price for the options on the date of expiration. (iii) Income tax benefit (refer Note 4) Judgement is required in assessing whether deferred tax assets and liabilities are recognised on the statement of financial position. Deferred tax assets, including those arising from temporary differences, are recognised only when it is considered more likely than not that they will be recovered, which is dependent on the generation of future assessable income of a nature and of an amount sufficient to enable the benefits to be utilised. (iv) Property, plant and equipment (refer Note 8) Management review the carrying value and the estimate of the useful lives of depreciable assets at each reporting date, based on the expected utility of the assets. Uncertainties in these estimates relate to expected future usage and utility of the assets. (v) Inventory Net Realisable Value (refer Note 7) In the absence of market based prices being readily available, judgement is required in assessing the net realisable value of inventory and when applying an apporpriate risk discount. (vi) Non-Current Assets (refer Note 9) Judgement is required in determining the appropriate level of project related costs that should be capitalised as deferred exploration and evaluation expenditure and what percentage of this expenditure should be expensed. Management has estimated the percentage of each departments activities can be directly related to project activities and capitalised the corresponding percentage of expenditure relating to that department.

INDO MINES LIMITED ANNUAL REPORT 2015
NOTES TO AND FORMING PART OF THE FINANCIAL STATEMENTS
Page 35
2015 2014
3. LOSS FROM OPERATIONS $ $
(a) Loss before tax Loss before income tax has been arrived at after charging the following expenses attributable to operations:
General and administrative project expenditure General and administrative project expenditure 2,761,881 10,207,521
2,761,881 10,207,521
Depreciation Depreciation – plant and equipment 77,423 321,612
77,423 321,612
Employee benefits expense
Salaries and wages and costs of employment 574,250 913,220
Other expenses
Property expenses 6,380 129,257 Corporate expenses 603,198 357,809 Audit expenses 104,980 123,549 Other expenses 306,756 825,323
1,021,314 1,435,938
(b) Financial income/(expenses) Interest revenue 110,764 477,617 Sundry income - 74,548 Changes in fair value adjustment of
convertible debenture option (1) 59,382 58,759
Finance income 170,146 610,924 (1)
Gain relates to a fair value adjustment for the option component of the convertible note from Anglo Pacific Group. Refer Note 14b for further details. Research and development refund
(2) 1,266,608 -
Changes in fair value of financial assets 2,511,435 183,334
Other income 3,778,043 183,334
(2)
As the research and development refund received related to prior period expenditure on the development of the Kulon Progo project that had previously been capitalised and then fully impaired at 30 June 2014, the refund was recognised as income rather than being deducted from the carrying value of the underlying asset. Interest expense (394,858) (346,243) Bank charges (9,780) (10,319) Foreign exchange loss (783,040) (314,577) Other (14,329) -
Finance costs (1,202,007) (671,139)
(c) Impairment expenses Write-down of inventory to net realisable value 1,091,686 - Plant and equipment - 9,372,388 Exploration and evaluation assets - 34,633,603
1,091,686 44,005,991
During the 2014 financial year, the introduction of the Indonesian Government Regulation 7/2012 and the export tax provisions announced on 12 January 2014 provided the Company with very limited opportunity for its 70% owned subsidiary, PT Jogja Magasa Iron (JMI) to profitably implement concentrate production through export, nor was there sufficient demand domestically to justify the early capital required to establish the facilities. As a consequence, the Company has reviewed the carrying value of the property, plant and equipment assets associated with the proposed concentrate production and elected to impair those assets in full. This has resulted in an impairment cost of $9,372,388 being recognised. At the same time the Company impaired the acquisition costs that were originally brought to account when it acquired its interest in the Project, plus the deferred costs at 31 December 2013 relating to the rights to land use, totalling $34,633,603.

INDO MINES LIMITED ANNUAL REPORT 2015
NOTES TO AND FORMING PART OF THE FINANCIAL STATEMENTS
Page 36
3. LOSS FROM OPERATIONS (continued)
During the 2015 financial year the Company and JMI have progressed with its strategy of assessing the viability of developing its pig iron project in Kulon Progo, Indonesia (Project) into a fully integrated mining and iron plant operation, to comply with the Indonesian Government value add laws. During the year the Group saw near completion of Definitive Feasibility Study (‘DFS’) stage I at the Project with preparations being made for DFS stage II. As a results of these studies and the progression of the development of the Project the Directors, when performing impairment testing of the carrying value of plant and equipment and exploration and evaluation assets related to the project, have concluded that no impairment charges were required. (d) Loss on disposal of subsidiary During the year the Company voluntarily deregistered 100% owned Australian subsidiaries Indo Energy Pty Ltd, Indo Mines (Indonesia) Pty Ltd and Fireside Resources Pty Ltd. The effect of the deregistration was as follows:
$ Net assets of the disposed subsidiaries (130,222) Impairment of intercompany receivable 143,895 Exchange differences on disposed entity 348,199
Loss on disposal 361,872
4. INCOME TAX BENEFIT 2015 2014
$ $
(a) Recognised in the profit and loss
Current income tax: Current income tax expense/(benefit)
-
-
Deferred income tax:
Adjustments in respect of deferred income tax of previous years -
(97,678)
Origination and reversal of temporary differences (977,320) (16,276,119)
Deferred tax assets not brought to account 977,320
16,373,797
Income tax expense reported in the income statement -
-
(b) Reconciliation of income tax expense to prima facie tax payable
Loss from operations before income tax (3,142,245) (56,761,163)
Tax at the Australian tax rate of 30% (2014: 30%)
(942,673)
(17,028,349) Tax effect of amounts which are not deductible in calculating taxable income: Non-deductible interest - 103,873 Non-deductible overseas salary and wages 83,970 113,051 Sundry Items 30,584 17,724 Non-deductible benefits in kind 166,931 399,092 R&D tax incentive refund (379,982) - Exploration expenditure not deductible 91,673 87,327 Difference in overseas tax rates (27,823) (66,515)
(977,320) (16,373,797) Income tax benefit not recognised 977,320 16,373,797
Income tax expense - -
c) Tax losses not brought to account
Unused tax losses for which no deferred tax asset has been recognised 86,703,003 85,086,362
Potential tax benefit @ 30% (2014: 30%) 26,010,900 25,525,909
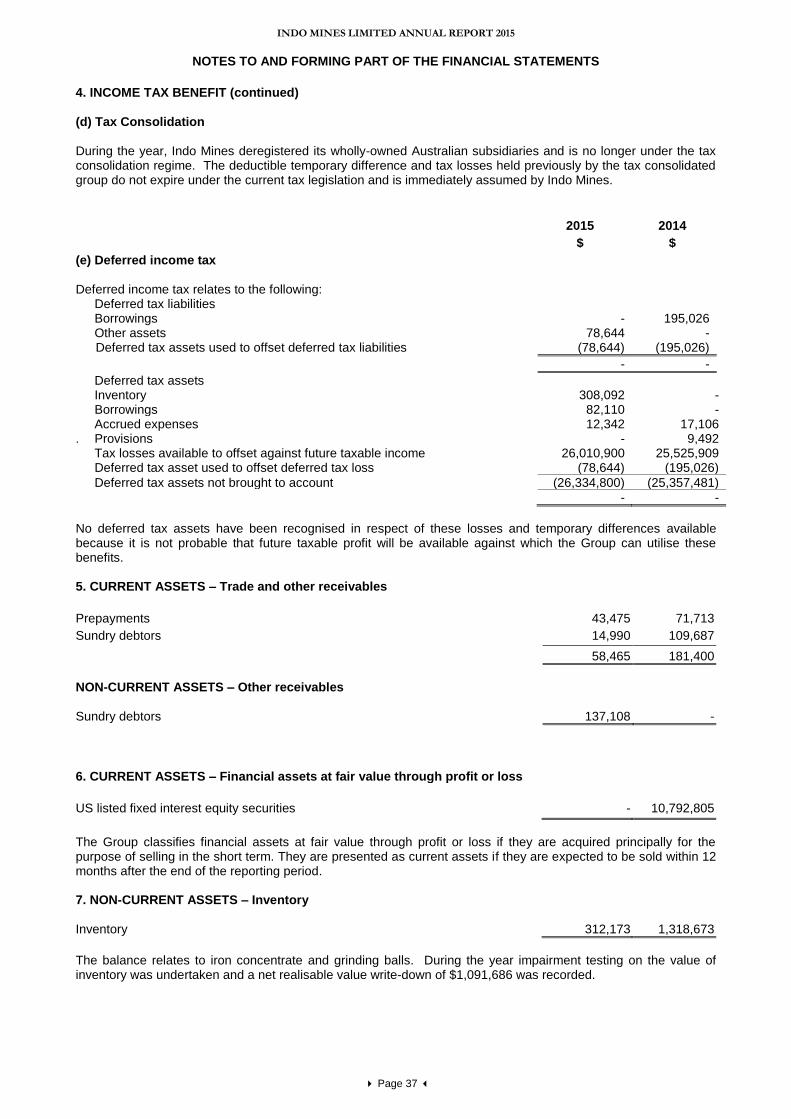
INDO MINES LIMITED ANNUAL REPORT 2015
NOTES TO AND FORMING PART OF THE FINANCIAL STATEMENTS
Page 37
4. INCOME TAX BENEFIT (continued) (d) Tax Consolidation During the year, Indo Mines deregistered its wholly-owned Australian subsidiaries and is no longer under the tax consolidation regime. The deductible temporary difference and tax losses held previously by the tax consolidated group do not expire under the current tax legislation and is immediately assumed by Indo Mines.
2015 2014
$ $
(e) Deferred income tax
Deferred income tax relates to the following: Deferred tax liabilities Borrowings Other assets
- 195,026 78,644 -
Deferred tax assets used to offset deferred tax liabilities (78,644) (195,026)
- -
Deferred tax assets Inventory 308,092 - Borrowings 82,110 - Accrued expenses 12,342 17,106 . Provisions - 9,492 Tax losses available to offset against future taxable income 26,010,900 25,525,909 Deferred tax asset used to offset deferred tax loss (78,644) (195,026)
Deferred tax assets not brought to account (26,334,800) (25,357,481)
- -
No deferred tax assets have been recognised in respect of these losses and temporary differences available because it is not probable that future taxable profit will be available against which the Group can utilise these benefits. 5. CURRENT ASSETS – Trade and other receivables
Prepayments 43,475 71,713
Sundry debtors 14,990 109,687
58,465 181,400
NON-CURRENT ASSETS – Other receivables
Sundry debtors
137,108
-
6. CURRENT ASSETS – Financial assets at fair value through profit or loss
US listed fixed interest equity securities - 10,792,805
The Group classifies financial assets at fair value through profit or loss if they are acquired principally for the purpose of selling in the short term. They are presented as current assets if they are expected to be sold within 12 months after the end of the reporting period. 7. NON-CURRENT ASSETS – Inventory
Inventory
312,173
1,318,673
The balance relates to iron concentrate and grinding balls. During the year impairment testing on the value of inventory was undertaken and a net realisable value write-down of $1,091,686 was recorded.

INDO MINES LIMITED ANNUAL REPORT 2015
NOTES TO AND FORMING PART OF THE FINANCIAL STATEMENTS
Page 38
8. NON-CURRENT ASSETS – Property, Plant and Equipment 2015 2014 $ $ (a) Plant and equipment Cost
13,660,443
10,573,937
Accumulated depreciation and impairment (10,211,565) (10,134,142)
Net carrying amount
3,448,878
439,795
(b) Reconciliation Carrying amount at beginning of year, net of accumulated depreciation and impairment
439,795 8,698,956
Additions 3,044,769 2,035,562 Disposals - (967) Impairment
(i) - (9,372,388)
Effect of movements in exchange rates 41,737 (599,756) Depreciation charge for the year (77,423) (321,612)
Carrying amount at end of year, net of accumulated depreciation and impairment
3,448,878
439,795
Property, plant and equipment assets are comprised of the following amounts:
2015 2014 $ $ Construction in Progress 3,094,490 38,919 Building 158,368 160,573 Office Equipment 108,561 141,360 Field Equipment 25,315 35,958 Vehicles 3,875 4,585 Furniture and Fittings 17,212 25,451 Barrack sample 41,057 32,949
3,448,878 439,975
(i)
The introduction of the Indonesian Government Regulation 7/2012 and the export tax provisions announced on 12 January 2014 provided the Company with very limited opportunity for its 70% owned subsidiary, PT Jogja Magasa Iron to profitably implement concentrate production through export, nor was there sufficient demand domestically to justify the early capital required to establish the facilities.
As a consequence, at 30 June 2014 the Company reviewed the carrying value of the property, plant and equipment assets associated with the proposed concentrate production and elected to impair those assets in full. This resulted in an impairment cost of $9,372,388 being recognised as follows:
Vertimill (3,955,965) Karangwuni trial plant (3,503,054) Plant design costs (1,913,369)
Impairment (9,372,388)
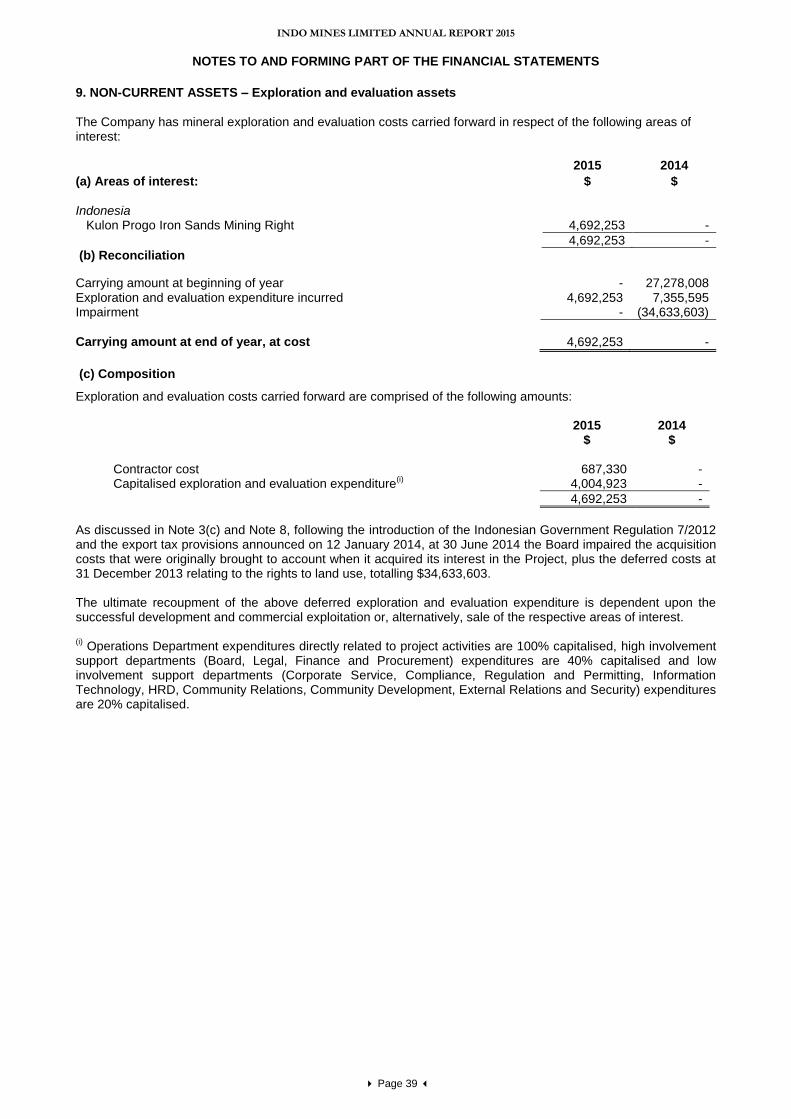
INDO MINES LIMITED ANNUAL REPORT 2015
NOTES TO AND FORMING PART OF THE FINANCIAL STATEMENTS
Page 39
9. NON-CURRENT ASSETS – Exploration and evaluation assets
The Company has mineral exploration and evaluation costs carried forward in respect of the following areas of interest: 2015 2014
(a) Areas of interest: $ $
Indonesia
Kulon Progo Iron Sands Mining Right 4,692,253 -
4,692,253 -
(b) Reconciliation
Carrying amount at beginning of year - 27,278,008 Exploration and evaluation expenditure incurred 4,692,253 7,355,595 Impairment - (34,633,603)
Carrying amount at end of year, at cost
4,692,253
-
(c) Composition
Exploration and evaluation costs carried forward are comprised of the following amounts:
2015 2014 $ $ Contractor cost 687,330 - Capitalised exploration and evaluation expenditure
(i) 4,004,923 -
4,692,253 -
As discussed in Note 3(c) and Note 8, following the introduction of the Indonesian Government Regulation 7/2012 and the export tax provisions announced on 12 January 2014, at 30 June 2014 the Board impaired the acquisition costs that were originally brought to account when it acquired its interest in the Project, plus the deferred costs at 31 December 2013 relating to the rights to land use, totalling $34,633,603. The ultimate recoupment of the above deferred exploration and evaluation expenditure is dependent upon the successful development and commercial exploitation or, alternatively, sale of the respective areas of interest. (i)
Operations Department expenditures directly related to project activities are 100% capitalised, high involvement support departments (Board, Legal, Finance and Procurement) expenditures are 40% capitalised and low involvement support departments (Corporate Service, Compliance, Regulation and Permitting, Information Technology, HRD, Community Relations, Community Development, External Relations and Security) expenditures are 20% capitalised.
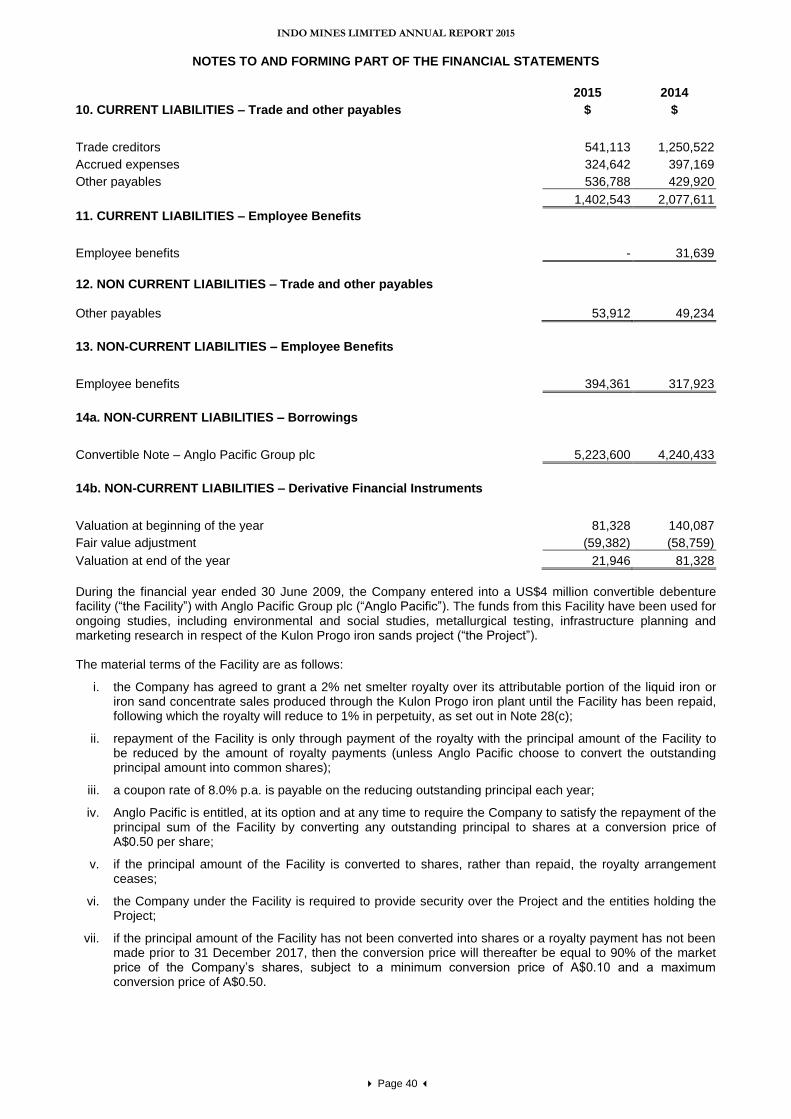
INDO MINES LIMITED ANNUAL REPORT 2015
NOTES TO AND FORMING PART OF THE FINANCIAL STATEMENTS
Page 40
2015 2014
10. CURRENT LIABILITIES – Trade and other payables $ $
Trade creditors 541,113 1,250,522
Accrued expenses 324,642 397,169
Other payables 536,788 429,920
1,402,543 2,077,611
11. CURRENT LIABILITIES – Employee Benefits
Employee benefits - 31,639
12. NON CURRENT LIABILITIES – Trade and other payables
Other payables
53,912
49,234
13. NON-CURRENT LIABILITIES – Employee Benefits
Employee benefits 394,361 317,923
14a. NON-CURRENT LIABILITIES – Borrowings
Convertible Note – Anglo Pacific Group plc 5,223,600 4,240,433
14b. NON-CURRENT LIABILITIES – Derivative Financial Instruments
Valuation at beginning of the year 81,328 140,087
Fair value adjustment (59,382) (58,759)
Valuation at end of the year 21,946 81,328
During the financial year ended 30 June 2009, the Company entered into a US$4 million convertible debenture facility (“the Facility”) with Anglo Pacific Group plc (“Anglo Pacific”). The funds from this Facility have been used for ongoing studies, including environmental and social studies, metallurgical testing, infrastructure planning and marketing research in respect of the Kulon Progo iron sands project (“the Project”). The material terms of the Facility are as follows:
i. the Company has agreed to grant a 2% net smelter royalty over its attributable portion of the liquid iron or iron sand concentrate sales produced through the Kulon Progo iron plant until the Facility has been repaid, following which the royalty will reduce to 1% in perpetuity, as set out in Note 28(c);
ii. repayment of the Facility is only through payment of the royalty with the principal amount of the Facility to be reduced by the amount of royalty payments (unless Anglo Pacific choose to convert the outstanding principal amount into common shares);
iii. a coupon rate of 8.0% p.a. is payable on the reducing outstanding principal each year;
iv. Anglo Pacific is entitled, at its option and at any time to require the Company to satisfy the repayment of the principal sum of the Facility by converting any outstanding principal to shares at a conversion price of A$0.50 per share;
v. if the principal amount of the Facility is converted to shares, rather than repaid, the royalty arrangement ceases;
vi. the Company under the Facility is required to provide security over the Project and the entities holding the Project;
vii. if the principal amount of the Facility has not been converted into shares or a royalty payment has not been made prior to 31 December 2017, then the conversion price will thereafter be equal to 90% of the market price of the Company’s shares, subject to a minimum conversion price of A$0.10 and a maximum conversion price of A$0.50.
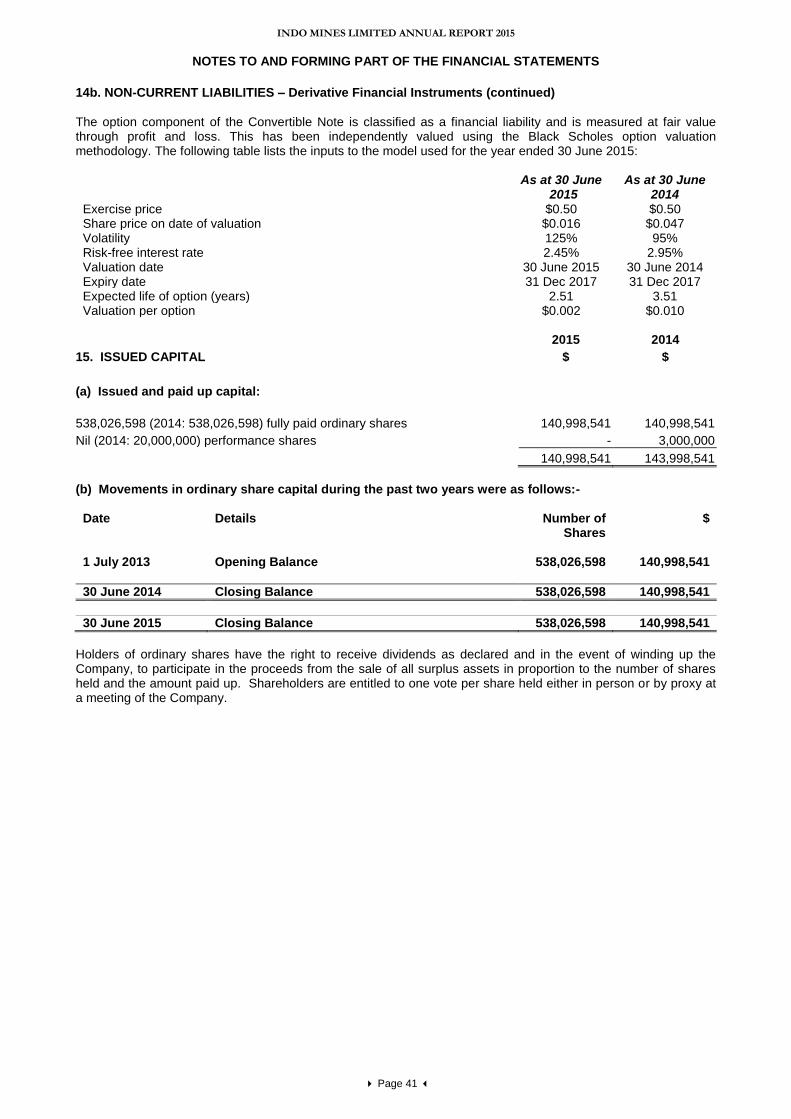
INDO MINES LIMITED ANNUAL REPORT 2015
NOTES TO AND FORMING PART OF THE FINANCIAL STATEMENTS
Page 41
14b. NON-CURRENT LIABILITIES – Derivative Financial Instruments (continued) The option component of the Convertible Note is classified as a financial liability and is measured at fair value through profit and loss. This has been independently valued using the Black Scholes option valuation methodology. The following table lists the inputs to the model used for the year ended 30 June 2015:
As at 30 June 2015
As at 30 June 2014
Exercise price $0.50 $0.50 Share price on date of valuation $0.016 $0.047 Volatility 125% 95% Risk-free interest rate 2.45% 2.95% Valuation date 30 June 2015 30 June 2014 Expiry date 31 Dec 2017 31 Dec 2017 Expected life of option (years) 2.51 3.51 Valuation per option $0.002 $0.010
2015 2014
15. ISSUED CAPITAL $ $
(a) Issued and paid up capital:
538,026,598 (2014: 538,026,598) fully paid ordinary shares
140,998,541
140,998,541
Nil (2014: 20,000,000) performance shares - 3,000,000
140,998,541 143,998,541
(b) Movements in ordinary share capital during the past two years were as follows:-
Date Details Number of Shares
$
1 July 2013 Opening Balance 538,026,598 140,998,541
30 June 2014 Closing Balance 538,026,598 140,998,541
30 June 2015 Closing Balance 538,026,598 140,998,541
Holders of ordinary shares have the right to receive dividends as declared and in the event of winding up the Company, to participate in the proceeds from the sale of all surplus assets in proportion to the number of shares held and the amount paid up. Shareholders are entitled to one vote per share held either in person or by proxy at a meeting of the Company.

INDO MINES LIMITED ANNUAL REPORT 2015
NOTES TO AND FORMING PART OF THE FINANCIAL STATEMENTS
Page 42
15. ISSUED CAPITAL (continued)
(c) Movements in performance shares during the past two years were as follows:
The milestones for conversion of the performance shares were not achieved prior to expiry. 16. RESERVES (a) Reserves:
2015 2014
Share-based payments reserve $ $
Nil (2014: 1,500,000) $0.20 Vendor Options exercisable on or before 1 October 2014 - 363,000 Other reserves (66,592) (34,621) Foreign currency translation reserve 308,966 (283,949)
Total Reserves 242,374 44,430
Share-based payments reserve The share-based payments reserve is used to recognise the fair value of share-based payments made by the Company, as described in Note 1(u). Other reserves The other reserves is used to recognise expenses relating to actuarial gains and losses on defined benefit obligations. Foreign currency translation reserve Exchange differences arising on translation of a foreign controlled entity are taken to the foreign currency translation reserve, as described in Note 1(y). (b) Movements in options during the past two years were as follows: There were no movements in the exercise or expiry of options in the past two years.
17. ACCUMULATED LOSSES 2015 2014
$ $
Balance at the beginning of year (112,888,958) (63,956,785)
Transfer from issued capital 3,000,000 -
Transfer from reserves 363,000 -
Net loss attributable to owners (1,959,873) (48,932,173)
Balance at end of year (111,485,831) (112,888,958)
18. NON-CONTROLLING INTERESTS IN CONTROLLED ENTITIES Interest in:
- Share capital 123,814 122,730
- Reserves 307,606 111,276
- Accumulated losses (16,363,505) (15,181,134)
(15,932,085) (14,947,128)
Date Details Number $ 1 July 2013 Opening Balance 20,000,000 3,000,000
30 June 2014 Closing Balances 20,000,000 3,000,000
31 December 2014 Expiry of Class D Performance Shares (20,000,000) (3,000,000)
30 June 2015 Closing Balances - -

INDO MINES LIMITED ANNUAL REPORT 2015
NOTES TO AND FORMING PART OF THE FINANCIAL STATEMENTS
Page 43
19. KEY MANAGEMENT PERSONNEL COMPENSATION
(a) Details of Key Management Personnel
Mr Peter Chambers Non-Executive Chairman Mr Christopher Catlow Non-Executive Director (resigned 30 September 2014) Mr Darryl Harris Non-Executive Director Mr Darjoto Setyawan Non- Executive Director Mr Hendra Surya Non-Executive Director Ms Stacey Apostolou Executive Director and Company Secretary (resigned as Director on 30
September 2014 and as Company Secretary on 31 October 2014) Mr Arran Marshall Chief Executive Officer
There were no other Key Management Personnel of the Group. (b) Key Management Personnel Compensation
Consolidated:
2015
$ 2014
Short-term employee benefits 575,233 1,197,275
Post-employment benefits 11,899 27,456
Total compensation 587,132 1,224,731
Loans to Key Management Personnel and their related parties There were no loans made to Key Management Personnel or their related parties during the reporting period. Other Key Management Personnel transactions There were no other transactions with Key Management Personnel during the year ended 30 June 2015. (c) Other related party transactions
Mr Lutfi Heyder who is a shareholder of PT Jogja Magasa Mining (the 30% shareholder of PT Jogja Magasa Iron) provides consultancy services to Indo Mines. Total payments made during the year ended 30 June 2015 to Mr Heyder and his associated companies totalled $287,253 (2014: $356,564). Medical insurance paid for Mr Heyder during the year totalled $2,878 (2014: $1,779). During the year ended 30 June 2015 funds totalling $137,108 (2014: nil) were advanced by PT Jogja Magasa Iron to PT Jogja Magasa Mining. At balance date the balance outstanding was $137,108 (2014: nil). Medical Insurance was paid for the Commissioners of PT Jogja Magasa Iron during the year ended 30 June 2015 totalling $2,599 (2014: $1,876). The Commissioners were: Gusti Seno $1,867(2014: $1,433) and Gusti Pembayun $731 (2014: $443). Rajawali Group, the Company’s largest shareholder provided the services of Non-Executive Directors Hendra Surya and Darjoto Setyawan to the Company for nil consideration.

INDO MINES LIMITED ANNUAL REPORT 2015
NOTES TO AND FORMING PART OF THE FINANCIAL STATEMENTS
Page 44
20. SHARE-BASED PAYMENTS The following table illustrates the number and weighted average exercise prices (WAEP) of, and movements in, share options issued during the year:
2015 2015 2014 2014 Number WAEP Number WAEP
Outstanding at beginning of year 1,500,000 $0.20 1,500,000 $0.20 Granted during the year - - - - Expired during the year (1,500,000) $0.20 - - Exercised during the year - - - -
Outstanding at end of year - - 1,500,000 $0.20
No options were granted by the Company during the year ended 30 June 2015. Performance Shares The following table illustrates the number of, and movements in, performance shares during the year:
2015 2014 Number Number
The milestones for conversion of the performance shares were not achieved prior to expiry on 31 December 2014. The fair value of the performance shares was based on an independent valuation on the maximum number of performance shares issued multiplied by the prevailing share price as at the date of issue of the performance shares multiplied by the probability that the performance milestones (as outlined above) are achieved. The fair value of the performance shares issued was recognised as exploration expenditure and mining rights at the date of their issue with a corresponding increase in equity. The following table lists the inputs to the model used for the performance shares: Class E Performance
Shares
Share price on date of valuation $0.30 Valuation date 21 May 2010 Expiry date 31 Dec 2014 Probability factor 25% Fair value at grant date $0.15 21. CONTROLLED ENTITIES
All controlled entities are included in the consolidated financial statements. The financial year-end of the controlled entities is the same as that of the Parent Entity, excluding the Indonesian subsidiaries which have a 31 December year end. Place of
incorporation % of Shares
held(i)
Name of controlled entity 2015 2014 PT Jogja Magasa Iron Indonesia 70 70 Indo Energy Pty Ltd Australia - 100 Indo Mines (Indonesia) Pty Ltd Australia - 100 Fireside Resources Pty Ltd Australia - 100 PT Puerto Nirvana Indonesia - 100 PT Kanlubang Bara Utama Indonesia - 100 PT Indomines Mineral Perkasa Indonesia 99.67 -
Notes
(i) The percentage of voting power is its proportion to ownership .
Outstanding at beginning of year 20,000,000 20,000,000 Granted during the year - - Expired during the year (20,000,000) - Converted during the year - -
Outstanding at end of year - 20,000,000

INDO MINES LIMITED ANNUAL REPORT 2015
NOTES TO AND FORMING PART OF THE FINANCIAL STATEMENTS
Page 45
22. PARENT ENTITY DISCLOSURES 2015
2014
$ $
Assets
Current Assets 9,865,784 19,242,052
Non-Current Assets 9,572,990 335,578
Total Assets 19,438,774 19,577,630
Liabilities
Current Liabilities 370,229 640,518
Non-Current Liabilities 5,245,546 4,321,761
Total Liabilities 5,615,775 4,962,279
Equity
Issued Capital 140,998,542 143,998,542
Share based payments reserve - 363,000
Accumulated losses (127,175,543) (129,746,191)
Total Equity 13,822,999 14,615,351
(b) Financial Performance
Loss for the year (792,352) (82,200,098)
Other comprehensive income - -
Total comprehensive loss (792,352) (82,200,098)
(c) Financial Support of Controlled Entities
The Parent Entity has committed to provide financial support to its controlled entities. 23. REMUNERATION OF AUDITORS
2015 2014
$ $
Audit services KPMG (Australia & Indonesia)
-
8,056
PricewaterhouseCoopers (Indonesia) 40,700 32,333
PricewaterhouseCoopers (Australia & Indonesia) 64,280 83,160
Total Auditors’ Remuneration 104,980 123,549
24. SEGMENT INFORMATION
Segment information is presented in respect of the Group’s management and internal reporting structure. Segment results, assets and liabilities include items directly attributable to a segment as well as those that can be allocated on a reasonable basis. Unallocated items comprise mainly income earning assets and revenue, interest bearing loans, borrowings and expenses, and corporate assets and expenses. Segment capital expenditure is the total cost incurred during the period to acquire segment assets that are expected to be used for more than one period in that geographic region. For the year ended 30 June 2015, the Group had one operating segment, being iron sands development in Indonesia.

INDO MINES LIMITED ANNUAL REPORT 2015
NOTES TO AND FORMING PART OF THE FINANCIAL STATEMENTS
Page 46
24. SEGMENT INFORMATION (continued)
Geographical Segment Indonesia (Iron Sands)
Unallocated Consolidated Entity
2015 2014 2015 2014 2015 2014
$ $ $ $ $ $ Revenue Other revenues - - - - - -
Unallocated revenue - -
Total revenue - -
Results Segment result (4,285,712) (26,096,663) 1,143,468 (30,664,500) (3,142,244) (56,761,163)
Loss before income tax expense (3,142,244) (56,761,163) Income tax expense - -
Net loss (3,142,244) (56,761,163)
Assets Segment assets 11,250,768 3,758,951 9,668,593 19,246,102 20,919,361 23,005,053
Unallocated assets - -
Total assets 20,919,361 23,005,053
Liabilities Segment liabilities 1,550,500 1,835,885 5,545,862 4,962,283 7,096,362 6,798,168
Unallocated liabilities - -
Total liabilities 7,096,362 6,798,168
Other Acquisition of property, plant and equipment 3,043,119
2,178,673 1,650
(143,111) 3,044,769 2,035,562
Depreciation of segment assets 76,615 319,768 808 1,844 77,423 321,612 Exploration and evaluation expenditure 2,631,831 9,635,246 - 572,275 2,631,831 10,207,521 Impairment expense 1,091,686 14,250,320 - 29,755,671 1,091,686 44,005,991

INDO MINES LIMITED ANNUAL REPORT 2015
NOTES TO AND FORMING PART OF THE FINANCIAL STATEMENTS
Page 47
25. EARNINGS PER SHARE
2015 Cents per
Share
2014 Cents per
Share Basic loss per share: Total basic loss per share 0.36 9.1
Diluted loss per share: Total diluted loss per share 0.36 9.1
The following reflects the income and share data used in the calculations of basic and diluted earnings per share:
2015 2014 $ $ Net loss used in calculating basic and diluted earnings per share
(1,959,873)
(48,932,173)
Number of Number of Shares Shares 2015 2014
Weighted average number of ordinary shares used in calculating basic earnings/(loss) per share
538,026,598
538,026,598
Dilutive securities At 30 June 2015 and 30 June 2014, options were not included in the calculation of diluted EPS as they were considered anti-dilutive. Accordingly, diluted loss per share is the same as the basic loss per share. Conversions, calls, subscriptions or issues after 30 June 2015 No shares have been issued as a result of the exercise of options since 30 June 2014 and no options have been issued or expired.

INDO MINES LIMITED ANNUAL REPORT 2015
NOTES TO AND FORMING PART OF THE FINANCIAL STATEMENTS
Page 48
2015 2014
$ $
26. NOTES TO THE CASH FLOW STATEMENTS
Loss for the year (3,142,244) (56,761,163)
Adjustment for non-cash income and expense items
Depreciation and amortisation 77,423 321,612
Impairment expenses - 44,005,991
Write-down of inventory to net realisable value 1,091,686
Fair value adjustments on financial liability (59,382) (58,759)
Fair value adjustments on financial asset (2,437,366) (183,334)
Net unrealised foreign exchange loss 783,040 1,055,194
Loss on disposal of subsidiary 361,872 -
Changes in assets and liabilities
Decrease/(Increase) in trade and other receivables (14,173) 241,077
Increase/(Decrease) in trade and other payables 184,058 (1,680,913)
Fixed asset acquisitions accrued - (543,225)
Increase/(Decrease) in provisions 44,799 (123,720)
Net cash outflows from operating activities (3,110,287) (13,727,240)
(b) Reconciliation of Cash and Cash Equivalents
Cash at bank and on hand 3,384,788 8,160,428
Short term deposits with < 90 day term 3,559,170 2,000,000
Cash and cash equivalents for purposes of the cash flow statement 6,943,958 10,160,428
Term deposits with >90 day term 5,223,600 -
Security deposits (current) 60,000 60,000
Security deposits (non-current) 42,926 51,952
Total cash and cash equivalents and term deposits 12,270,484 10,272,380
(c) Non-cash Financing and Investing Activities 30 June 2015 There were no non-cash Financing and Investing Activities during the year. 30 June 2014 There were no non-cash Financing and Investing Activities during the year.

INDO MINES LIMITED ANNUAL REPORT 2015
NOTES TO AND FORMING PART OF THE FINANCIAL STATEMENTS
Page 49
27. FINANCIAL RISK MANAGEMENT OBJECTIVES AND POLICIES
(a) Overview The Company’s and Group’s principal financial instruments comprise trade and other receivables, trade and other payables, convertible note, derivative financial instrument, cash and short-term deposits. The main risks arising from the Company’s and Group’s financial instruments are interest rate risk, equity price risk, foreign currency risk, credit risk and liquidity risk. This note presents information about the Company’s and Group’s exposure to each of the above risks, its objectives, policies and processes for measuring and managing risk, and the management of capital. Other than as disclosed, there have been no significant changes since the previous financial year to the exposure or management of these risks. The Board has overall responsibility for the establishment and oversight of the risk management framework. Given the nature and size of the business, no formal risk management committees have been established, however responsibility for control and risk management is delegated to the appropriate level of management with the Chief Executive Officer and Chief Financial Officer (or their equivalent) having ultimate responsibility to the Board for the risk management and control framework. Risk management policies are established to identify and analyse the risks faced by the Company, to set appropriate risk limits and controls, and to monitor risks and adherence to limits. Risk management policies and systems are reviewed regularly to reflect changes in market conditions and the Company’s activities. Arrangements put in place by the Board to monitor risk management include quarterly reporting to the Board in respect of the operations and financial position of the Company. The Board also reviews risks that relate to operations and financial instruments as required, but at least every six months. Given the uncertainty as to the timing and amount of cash inflows and outflows, the Company has not implemented any additional strategies to mitigate the financial risks and no hedging has been put in place. As the Company’s operations change, the Board will review this policy periodically going forward. (b) Credit risk Credit risk is the risk of financial loss to the Group if a customer or counterparty to a financial instrument fails to meet its contractual obligations. This arises principally from cash and cash equivalents and trade and other receivables. The carrying amount of the Company’s and Group’s financial assets represents the maximum credit risk exposure, as presented below:
2015 2014 $ $ Cash and cash equivalents 6,943,958 10,160,428
Term deposits 5,283,600 60,000
Trade and other receivables 195,573 181,400
Restricted cash and cash equivalents 42,926 51,952
12,466,057 10,453,780
Trade and other receivables comprise GST and other tax refunds due and accrued interest revenue. Where possible the Group trades only with recognised, creditworthy third parties. It is the Group's policy that all customers who wish to trade on credit terms are subject to credit verification procedures. Significant concentration of credit risk exists within cash and cash equivalents and other financial assets. Cash and cash equivalents are invested at a counterparty bank with a good credit rating. With respect to credit risk arising from cash, cash equivalents and term deposits, the Company’s and Group’s exposure to credit risk arises from default of the counter party, with a maximum exposure equal to the carrying amount of these instruments. Cash and cash equivalents are held with the National Australia Bank and the Westpac Banking Corporation, which are Australian banks with AA- credit ratings (Standard & Poor’s), with the exception of cash and cash equivalents of $2,435,816, which are held with Indonesian banks that have credit ratings between AAA and A- (Pefindo).
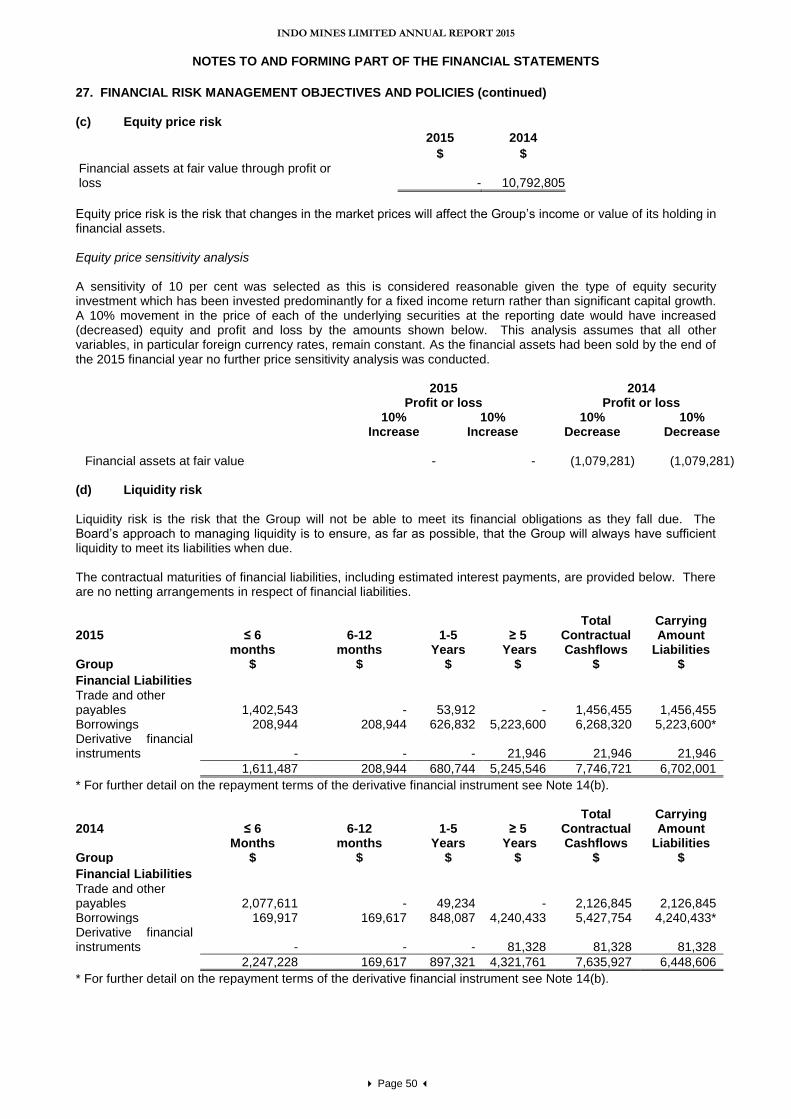
INDO MINES LIMITED ANNUAL REPORT 2015
NOTES TO AND FORMING PART OF THE FINANCIAL STATEMENTS
Page 50
27. FINANCIAL RISK MANAGEMENT OBJECTIVES AND POLICIES (continued) (c) Equity price risk 2015 2014 $ $ Financial assets at fair value through profit or loss - 10,792,805
Equity price risk is the risk that changes in the market prices will affect the Group’s income or value of its holding in financial assets. Equity price sensitivity analysis A sensitivity of 10 per cent was selected as this is considered reasonable given the type of equity security investment which has been invested predominantly for a fixed income return rather than significant capital growth. A 10% movement in the price of each of the underlying securities at the reporting date would have increased (decreased) equity and profit and loss by the amounts shown below. This analysis assumes that all other variables, in particular foreign currency rates, remain constant. As the financial assets had been sold by the end of the 2015 financial year no further price sensitivity analysis was conducted.
2015 2014 Profit or loss Profit or loss
10% Increase
10% Increase
10% Decrease
10% Decrease
Financial assets at fair value - - (1,079,281) (1,079,281)
(d) Liquidity risk Liquidity risk is the risk that the Group will not be able to meet its financial obligations as they fall due. The Board’s approach to managing liquidity is to ensure, as far as possible, that the Group will always have sufficient liquidity to meet its liabilities when due. The contractual maturities of financial liabilities, including estimated interest payments, are provided below. There are no netting arrangements in respect of financial liabilities. 2015
≤ 6
months
6-12
months
1-5
Years
≥ 5
Years
Total Contractual Cashflows
Carrying Amount
Liabilities Group $ $ $ $ $ $
Financial Liabilities Trade and other payables 1,402,543 - 53,912 - 1,456,455 1,456,455 Borrowings 208,944 208,944 626,832 5,223,600 6,268,320 5,223,600* Derivative financial instruments - - - 21,946 21,946 21,946
1,611,487 208,944 680,744 5,245,546 7,746,721 6,702,001
* For further detail on the repayment terms of the derivative financial instrument see Note 14(b). 2014
≤ 6 Months
6-12 months
1-5 Years
≥ 5 Years
Total
Contractual Cashflows
Carrying Amount
Liabilities Group $ $ $ $ $ $
Financial Liabilities Trade and other payables 2,077,611 - 49,234 - 2,126,845 2,126,845 Borrowings 169,917 169,617 848,087 4,240,433 5,427,754 4,240,433* Derivative financial instruments - - - 81,328 81,328 81,328
2,247,228 169,617 897,321 4,321,761 7,635,927 6,448,606
* For further detail on the repayment terms of the derivative financial instrument see Note 14(b).

INDO MINES LIMITED ANNUAL REPORT 2015
NOTES TO AND FORMING PART OF THE FINANCIAL STATEMENTS
Page 51
27. FINANCIAL RISK MANAGEMENT OBJECTIVES AND POLICIES (continued) (e) Interest rate risk The Company’s and Group’s exposure to the risk of changes in market interest rates relates primarily to the cash and short-term deposits with a floating interest rate. These financial assets with variable rates expose the Company and Group to cash flow interest rate risk. All other financial assets and liabilities, in the form of receivables, investments and payables are non-interest bearing. Variable interest bearing cash holdings are disclosed below: 2015 2014 $ $
Variable rate instruments
Financial assets - 10,272,381
- 10,272,381
The Group’s cash at bank and on hand and short term deposits had a weighted average floating interest rate at year end of 1.06% (2014: 1.74%). The Group currently does not engage in any hedging or derivative transactions to manage interest rate risk. Interest rate sensitivity A sensitivity of 20 per cent has been selected as this is considered reasonable given the current level of both short term and long term interest rates. A 20% movement in interest rates at the reporting date would have increased (decreased) equity and profit and loss by the amounts shown below. This analysis assumes that all other variables, in particular foreign currency rates, remain constant. This analysis is prepared based on cash balances as at year end and due to significant movements in the cash balance throughout the year is not considered representative of the risk during the year.
Profit or loss 2015 Group
20% Increase
20% Decrease
Cash and cash equivalents 26,111 (26,111)
Profit or loss 2014 Group
20% Increase
20% Decrease
Cash and cash equivalents 34,405 (34,405) (f) Foreign currency risk The financial liabilties are at fixed interest rates therefore not subject to interest rate risk. As a result of activities overseas, the Company's and Group's balance sheet can be affected by movements in exchange rates. The Group also has transactional currency exposures. Such exposure arises from transactions denominated in currencies other than the functional currency of the entity. The Group currently does not engage in any hedging or derivative transactions to manage foreign currency risk.

INDO MINES LIMITED ANNUAL REPORT 2015
NOTES TO AND FORMING PART OF THE FINANCIAL STATEMENTS
Page 52
27. FINANCIAL RISK MANAGEMENT OBJECTIVES AND POLICIES (continued) (f) Foreign currency risk (continued) The Group’s exposure to foreign currency risk was as follows, based on notional amounts in AUD: Indonesian Rupiah United States Dollar 2015 2014 2015 2014
Cash and cash equivalents 1,243,154 1,609,570 4,317,889 179,865
Term Deposits - - 5,223,600 -
Restricted cash and equivalents 1,960 51,952 40,966 -
Trade and other receivables 1,954 230,788 2,612 -
Prepayments 34,728 52,907 - -
Equity securities - - - 10,792,805
Trade and other payables (1,236,294) (732,014) (485,273) -
Borrowings - - (5,223,600) (4,240,433)
Derivative financial instruments - - (21,946) (81,328)
45,502 1,213,203 3,854,248 6,650,909
The following significant exchange rates applied during the year: Average Rate As at 30 June AUD 2015 2014 2015 2014
IDR 10,391 10,486 10,207 11,177
USD 0.8328 0.9182 0.7658 0.9420 Sensitivity analysis for currency risk A strengthening of the AUD, as indicated below, against the IDR and USD at 30 June would have increased (decreased) equity and profit or loss by the amounts shown below. This analysis is based on foreign currency exchange rate variances that the Group considered to be reasonably possible at the end of the reporting period. This analysis assumes that all other variables, in particular interest rates, remain constant. The analysis is performed on the same basis for 2014. 2015 2014 Equity Profit or (loss) Equity Profit or (loss)
USD (10% strengthening) (385,425) (385,425) (665,091) (665,091)
IDR (10% strengthening) (4,550) (4,550) (121,320) (121,320)
(g) Capital management The Board’s policy is to maintain a suitable capital base so as to maintain investor, creditor and market confidence and to sustain future development of the business. Given the stage of development of the Group, the Board’s objective is to minimise debt and to raise funds as required through the issue of new shares. There were no changes in the Group’s approach to capital management during the year. The Group is not subject to externally imposed capital requirements. (h) Fair Value measurement Fair value hierarchy The following tables detail the Group’s assets and liabilities measured or disclosed at fair value using a three level hierarchy based on the lowest level of input that is significant to the entire fair value measurement, being: Level 1: Quoted prices (unadjusted) in active markets for identical assets or liabilities that the Group can
access at measurement date. Level 2: Inputs other than quoted prices included within Level 1 that are observable for the asset or
liability, either directly or indirectly. Level 3: Unobservable inputs for the asset or liability.

INDO MINES LIMITED ANNUAL REPORT 2015
NOTES TO AND FORMING PART OF THE FINANCIAL STATEMENTS
Page 53
27. FINANCIAL RISK MANAGEMENT OBJECTIVES AND POLICIES (continued) (h) Fair Value measurement (continued)
Level 1 Level 2 Level 3 Total Consolidated 2015 $ $ $ $ Assets Financial assets at fair value through profit or loss
-
-
-
-
- - - -
Liabilities Derivative financial instruments - - 21,946 21,946
- - 21,946 21,946
Consolidated 2014 Assets Financial assets at fair value through profit or loss
10,792,805
-
-
10,792,805
10,792,805 - - 10,792,805
Liabilities Derivative financial instruments - - 81,328 81,328
- - 81,328 81,328
The $10,792,805 decrease in level1 financial assets during the year is represented by the sale of the US listed fixed interest equity securities during the year. The $59,382 decrease in level 3 liabilities during the year is represented by a re-measurement of the option component of the derivative financial instrument with Anglo Pacific Group plc (see Note 14(b)). The carrying amount of trade and other receivables and trade and other payables are assumed to approximate their fair values due to their short term nature. The carrying amount of the convertible note is assumed to approximate its fair value as it incurs a market rate of interest. 28. CONTINGENCIES AND COMMITMENTS
Estimated commitments for which no provisions were included in the financial statements are as follows:
(a) Exploration expenditure commitments
The Company has no obligations to incur minimum exploration expenditure on the Kulon Progo iron sands Project. (b) Operating lease commitments 2015 2014 $ $ Non-cancellable operating lease contracted for but not capitalised in the financial statements
Minimum lease payments payable: - not later than one year 77,935 21,576 - later than one year but not later than 5 years - 17,672 - later than 5 years - -
77,935 39,248
(c) Net smelter royalty As noted in Note 14(b), under the terms of the US$4 million convertible debenture facility with Anglo Pacific Group plc, the Company has agreed to grant a 2% net smelter royalty over its attributable portion of the liquid iron or iron sand concentrate sales produced through the Kulon Progo liquid iron plant until the Facility has been repaid, following which the royalty will reduce to 1% in perpetuity;

INDO MINES LIMITED ANNUAL REPORT 2015
NOTES TO AND FORMING PART OF THE FINANCIAL STATEMENTS
Page 54
29. SUBSEQUENT EVENTS In September 2015 the Company signed an Agreement for sale of the Vertimill for US$750,000. The sale is subject to a number of conditions precedent. A 5% refundable deposit (US$37,500) has already been received. In September 2015 the Company announced an updated 2012 JORC compliant resource report for the Kulon Progo iron sands project. A summary of this report can be seen in the Resources and Reserves Statement contained in this report. Outside of the matters outlined above there has not arisen in the interval between the end of the financial year and the date of this report any item, transaction or event of a material and unusual nature likely, in the opinion of the Directors of the Company, to affect significantly the operations of the Group, the results of those operations, or the state of affairs of the Group, in future financial years.
INDO MINES LIMITED ANNUAL REPORT 2015
NOTES TO AND FORMING PART OF THE FINANCIAL STATEMENTS
Page 55
DIRECTORS' DECLARATION In the directors ’opinion:
(a) the financial statements and notes set out on pages 21 to 54 are in accordance with the Corporations Act 2001 including:
(i) complying with Accounting Standards, the Corporations Regulations 2001 and other
mandatory professional reporting requirements; and (ii) giving a true and fair view of the consolidated entity's financial position as at 30 June 2015
and of its performance for the financial year ended on that date; and
(b) there are reasonable grounds to believe that the Company will be able to pay its debts as and when they become due and payable;
Note 1(b) confirms that the financial statements also comply with International Financial Reporting Standards as issued by the International Accounting Standards Board. The directors have been given the declarations by the Chief Executive Officer and Chief Financial Officer required by section 295A of the Corporations Act 2001. This declaration is made in accordance with a resolution of the Directors.
PETER CHAMBERS Non-Executive Chairman Jakarta, Indonesia Dated this 30th day of September 2015

Page 56
INDEPENDENT AUDIT REPORT

Page 57
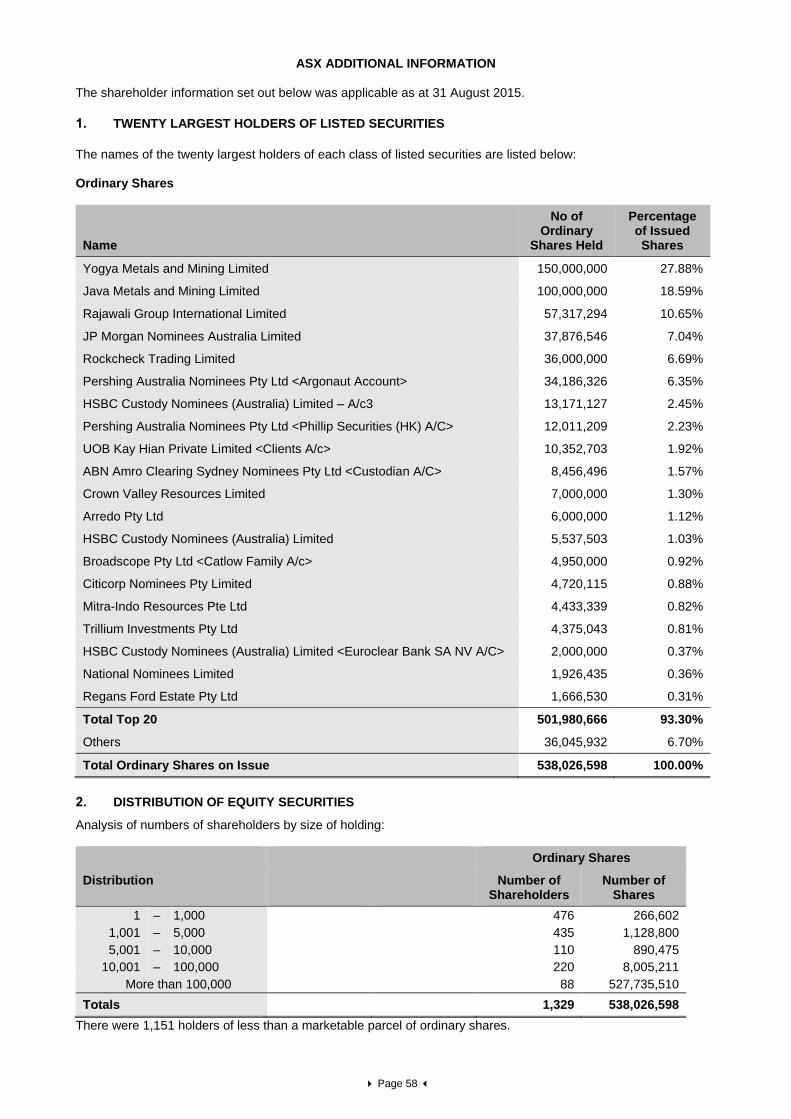
Page 58
ASX ADDITIONAL INFORMATION The shareholder information set out below was applicable as at 31 August 2015.
1. TWENTY LARGEST HOLDERS OF LISTED SECURITIES
The names of the twenty largest holders of each class of listed securities are listed below: Ordinary Shares
Name
No of Ordinary
Shares Held
Percentage of Issued Shares
Yogya Metals and Mining Limited 150,000,000 27.88%
Java Metals and Mining Limited 100,000,000 18.59%
Rajawali Group International Limited 57,317,294 10.65%
JP Morgan Nominees Australia Limited 37,876,546 7.04%
Rockcheck Trading Limited 36,000,000 6.69%
Pershing Australia Nominees Pty Ltd <Argonaut Account> 34,186,326 6.35%
HSBC Custody Nominees (Australia) Limited – A/c3 13,171,127 2.45%
Pershing Australia Nominees Pty Ltd <Phillip Securities (HK) A/C> 12,011,209 2.23%
UOB Kay Hian Private Limited <Clients A/c> 10,352,703 1.92%
ABN Amro Clearing Sydney Nominees Pty Ltd <Custodian A/C> 8,456,496 1.57%
Crown Valley Resources Limited 7,000,000 1.30%
Arredo Pty Ltd 6,000,000 1.12%
HSBC Custody Nominees (Australia) Limited 5,537,503 1.03%
Broadscope Pty Ltd <Catlow Family A/c> 4,950,000 0.92%
Citicorp Nominees Pty Limited 4,720,115 0.88%
Mitra-Indo Resources Pte Ltd 4,433,339 0.82%
Trillium Investments Pty Ltd 4,375,043 0.81%
HSBC Custody Nominees (Australia) Limited <Euroclear Bank SA NV A/C> 2,000,000 0.37%
National Nominees Limited 1,926,435 0.36%
Regans Ford Estate Pty Ltd 1,666,530 0.31%
Total Top 20 501,980,666 93.30%
Others 36,045,932 6.70%
Total Ordinary Shares on Issue 538,026,598 100.00%
2. DISTRIBUTION OF EQUITY SECURITIES
Analysis of numbers of shareholders by size of holding:
Ordinary Shares
Distribution
Number of Shareholders
Number of Shares
1 – 1,000 476 266,602
1,001 – 5,000 435 1,128,800
5,001 – 10,000 110 890,475
10,001 – 100,000 220 8,005,211
More than 100,000 88 527,735,510
Totals 1,329 538,026,598
There were 1,151 holders of less than a marketable parcel of ordinary shares.
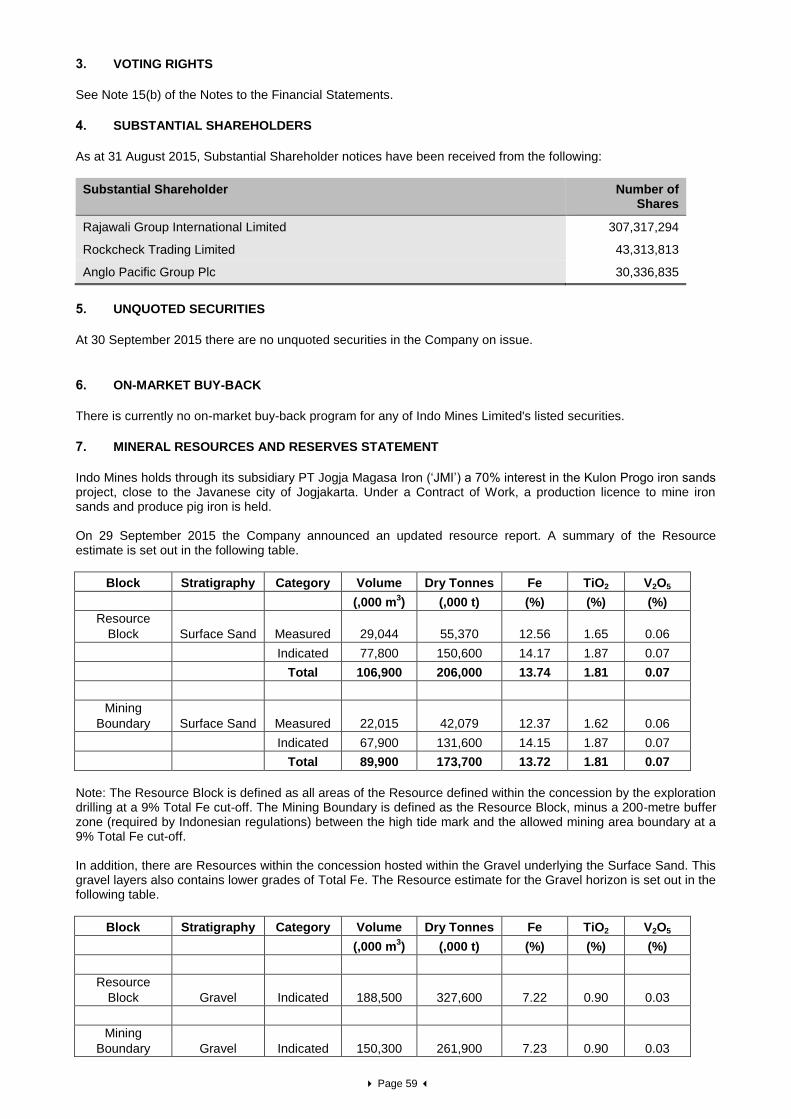
Page 59
3. VOTING RIGHTS
See Note 15(b) of the Notes to the Financial Statements.
4. SUBSTANTIAL SHAREHOLDERS
As at 31 August 2015, Substantial Shareholder notices have been received from the following:
Substantial Shareholder Number of Shares
Rajawali Group International Limited 307,317,294
Rockcheck Trading Limited 43,313,813
Anglo Pacific Group Plc 30,336,835
5. UNQUOTED SECURITIES
At 30 September 2015 there are no unquoted securities in the Company on issue.
6. ON-MARKET BUY-BACK
There is currently no on-market buy-back program for any of Indo Mines Limited's listed securities.
7. MINERAL RESOURCES AND RESERVES STATEMENT
Indo Mines holds through its subsidiary PT Jogja Magasa Iron (‘JMI’) a 70% interest in the Kulon Progo iron sands project, close to the Javanese city of Jogjakarta. Under a Contract of Work, a production licence to mine iron sands and produce pig iron is held. On 29 September 2015 the Company announced an updated resource report. A summary of the Resource estimate is set out in the following table.
Block Stratigraphy Category Volume Dry Tonnes Fe TiO2 V2O5
(,000 m3) (,000 t) (%) (%) (%)
Resource
Block Surface Sand Measured 29,044 55,370 12.56 1.65 0.06
Indicated 77,800 150,600 14.17 1.87 0.07
Total 106,900 206,000 13.74 1.81 0.07
Mining
Boundary Surface Sand Measured 22,015 42,079 12.37 1.62 0.06
Indicated 67,900 131,600 14.15 1.87 0.07
Total 89,900 173,700 13.72 1.81 0.07
Note: The Resource Block is defined as all areas of the Resource defined within the concession by the exploration drilling at a 9% Total Fe cut-off. The Mining Boundary is defined as the Resource Block, minus a 200-metre buffer zone (required by Indonesian regulations) between the high tide mark and the allowed mining area boundary at a 9% Total Fe cut-off. In addition, there are Resources within the concession hosted within the Gravel underlying the Surface Sand. This gravel layers also contains lower grades of Total Fe. The Resource estimate for the Gravel horizon is set out in the following table.
Block Stratigraphy Category Volume Dry Tonnes Fe TiO2 V2O5
(,000 m3) (,000 t) (%) (%) (%)
Resource
Block Gravel Indicated 188,500 327,600 7.22 0.90 0.03
Mining
Boundary Gravel Indicated 150,300 261,900 7.23 0.90 0.03

Page 60
Note: The Resource Block is defined as all areas of the Resource defined within the concession by the exploration drilling at a 5% Total Fe cut-off. The Mining Boundary is defined as the Resource Block, minus a 200-metre buffer zone (required by Indonesian regulations) between the high tide mark and the allowed mining area boundary at a 5% Total Fe cut-off. Mineral Resource Comparison 30 September 2015 to 30 September 2014 A summary of the Resource Estimate at 30 September 2014 is set out in the table below. The Resource Block used in the latest Resource estimate is almost identical to that used in the previous Resource estimate.
Boundary Category Volume (m3) Tonnes (Mt) Total Fe (%)
Resource Boundary
Measured 19,626,000 37.5 12.7
Indicated 86,017,000 162.7 13.8
Total 105,643,000 200.2 13.6
Mining Boundary
Measured 14,932,000 28.5 12.8
Indicated 75,788,000 143.4 13.8
Total 90,720,000 171.9 13.6
Note: The Resource above was prepared by CSA Global Pty Ltd and first disclosed under the 2004 Edition of the ‘Australasian Code for Reporting of Exploration Results, Mineral Resources and Ore Reserves.’ The resource is quoted from blocks above 9% Fe cut-off grade and includes material above and below the water table within the Resource Block. Corporate Governance – Reserves and Resources Calculations
Due to the nature, stage and size of Indo Mine’s existing operation, Indo Mines believes there would be no efficiencies gained by establishing a separate mineral reserves committee responsible for reviewing and monitoring the processes for calculating mineral reserves and resources and for ensuring that the appropriate internal controls are applied to such calculations. Mineral Resources are estimated by suitably qualified consultants to Indo Mines in accordance with the requirements of the JORC Code, using industry standard techniques and consultant’s internal guidelines for the estimation and reporting of Mineral Resources. Competent Persons Statement The information in this report that relates to Exploration Results and Mineral Resources of the Kulon Progo Iron Sands Project is based on information compiled and reviewed by Mr. Brett Gunter, who is a Member of the Australian Institute of Mining and Metallurgy and works full time for PT GMT Indonesia. The information has been forwarded to him by Indo Mines Limited as being representative of the work completed on the concession. Mr Gunter, signing on behalf of PT GMT Indonesia, is a qualified Geologist who has more than 25 years of relevant mining and geological experience in coal, bulk commodities and metals, working for major mining companies and for consultants. During this time he has either managed or contributed significantly to a number of exploration and mining studies related to the estimation, assessment, evaluation and economic extraction of mineral resources in Indonesia. He has sufficient experience which is relevant to the style and type of deposit under consideration and to the activity he is undertaking to qualify him as a Competent Person as defined in the 2012 Edition of the Australasian Code for Reporting of Exploration Results, Mineral Resources and Ore Reserves. Information relating to the Mineral Resources Statement is based on, and fairly represents, information and supporting documentation prepared by Indo Mines staff and consultants and approved by Mr Brett Gunter. The Mineral Resource Statement as a whole has been approved by Brett Gunter and he has consented to the form and context in which it appears in this report.