Annual Report 2019 - Marston's PLC · Strategic Report. Marston’s PLC Annual Report and Accounts...
144
Marston’s PLC Annual Report and Accounts 2019
Transcript of Annual Report 2019 - Marston's PLC · Strategic Report. Marston’s PLC Annual Report and Accounts...

Marston’s PLC Annual Report and Accounts 2019

Revenue
£1,173.5m +3%
Underlying* operating profit
£178.7m -2%
Underlying* profit before tax
£101.0m -3%
Underlying* earnings per share
13.5p -3%
Total dividend per share
7.5pStatutory loss before tax
£20.0mStatutory reporting* The underlying results reflect the performance of the Group before
exceptional and other adjusting items. The Directors consider that these figures provide a more appropriate indication of the underlying performance of the Group.
A Snapshot of 2019
On a statutory basis, the loss before tax was £20.0 million (2018: £54.3 million profit) and the loss per share was 2.8 pence per share (2018: 7.1 pence per share profit), reflecting the impairment of properties and the adverse impact of the swap mark-to-market as a consequence of well-publicised lower gilt yields. A reconciliation between the underlying results and the statutory numbers can be found in the Group Income Statement on page 85.
Strategic Report approvalThe Strategic Report, outlined from the inside front cover to page 40 incorporates: A Snapshot of 2019, Our Investment Case, At a Glance, Chairman’s Statement, Chief Executive’s Statement, Our Business Model, Resources and Relationships underpinning our Business Model, Stakeholder Engagement, Our Marketplace, Our Strategy, Our Key Performance Indicators, Group Operating and Financial Review, Non-Financial Information Statement, Risks and Risk Management, Our Principal Risks and Uncertainties, Our Levels of Defence, and Corporate Responsibility.
By order of the Board
Ralph FindlayChief Executive Officer
27 November 2019
Revenue growth in all trading segments; earnings momentum in drinks businesses.
Sales growth in both pub segments and continued growth in brewing.
Improved operating cash flow.
Debt reduction of £200 million between 2020–23 progressing well; targeting at least £70 million disposals of non-core pubs and assets in 2020, £50 million of which already exchanged or completed.
Full year dividend maintained at 7.5 pence per share. Dividend cover at 1.8 times.
Clear plans and objectives for 2020.

Strategic ReportA Snapshot of 2019 IFCOur Investment Case 2At a Glance 4Chairman’s Statement 6Chief Executive’s Statement 7Our Business Model 8Resources and Relationships underpinning our Business Model 12Stakeholder Engagement 15Our Marketplace 16Our Strategy 18Our Key Performance Indicators 24Group Operating and Financial Review 26Non-Financial Information Statement 29Risks and Risk Management 30
Our Principal Risks and Uncertainties 31Our Levels of Defence 35
Corporate Responsibility 37
GovernanceChairman’s Introduction 42Board of Directors 44Corporate Governance Report 46Nomination Committee Report 50Audit Committee Report 52Directors’ Remuneration Report: 54
Annual Statement by Chairman 54Remuneration Policy 57Remuneration Summary 2019 65Annual Report on Remuneration 66
Directors’ Report 73Statement of Directors’ Responsibilities 76
Financial StatementsFive Year Record 78Independent Auditors’ Report to the Members of Marston’s PLC 79Group Income Statement 85Group Statement of Comprehensive Income 85Group Cash Flow Statement 86Group Balance Sheet 87Group Statement of Changes in Equity 88Notes to the Group Accounts 89Company Balance Sheet 124Company Statement of Changes in Equity 125Notes to the Company Accounts 126
Additional InformationInformation for Shareholders 136Glossary 139Pubs-restaurants and lodges completed during the period 140
Marston’s PLC Annual Report and Accounts 2019Strategic Report
About Us
We have more than 14,000 employees and a diverse estate of over 1,400 bars, pubs and lodges, breweries, depots and offices that allows us to offer something for every guest, customer and community.
It is our purpose to bring people together for happy and meaningful experiences. We do this by empowering and enabling our teams across every part of our business.
Find out more onlineThis year we have incorporated information on our community involvement and our people into our main narrative report. More case studies about Marston’s and additional Corporate Responsibility information can be found on our website. www.marstons.co.uk/responsibility
For a full year-end press release, preliminary results presentation and webcast, visit: www.marstons.co.uk/investors
In This Document
1

Our Investment Case
Our unique culture is what makes Marston’s different: we are passionate about our business and proud of its heritage. We take pride in doing things properly and we run our business in an ethical and responsible way to deliver long-term sustainable growth.
Clear and consistent strategyOur pubs business operates across all segments of the market, catering for a broad range of guests.
Our beer business has evolved to be a market leader in premium ale with a lager and craft licensed portfolio and a leading service business.
See page 18 for more information
Our peopleOur people are engaged, involved, motivated and proud to work for Marston’s.
“ I really enjoy working for Marston’s. The people are friendly, welcoming, and are always available to give advice.”Daniel Smith, Engineer Apprentice
Good track recordAverage profit per pub in line with last year and increasing by around 7% after the disposals announced in November 2019.
Completion of Charles Wells Brewing Business integration delivering £4 million targeted synergies.
We create value through our use of capital; we have committed to targeting a £0.2 billion reduction in net debt by 2023 and we have a stable dividend payment.
Increase in average profit per pub since 2012
55%Increase in total underlying revenue
2.9%Total dividend per share
7.5p
2 Marston’s PLC Annual Report and Accounts 2019

Future growth plans
Roll out of a programme that will see all our pubs receive investment on a five year cycle, ensuring that our estate is maintained and refreshed consistently.
Additional £2 million investment in training. Through our Talent Academy Online, which is available to all of our people, we are aiming to reduce staff turnover in key roles during 2020, and we have plans to further improve skill levels in our kitchen teams.
Our new recruitment website launches in 2020 and we continue to invest in apprenticeships.
Marston’s PLC Annual Report and Accounts 2019Strategic Report
Investment and innovation in digital including: a marketing initiative aimed at improving the use of social media locally, the introduction of flexible payment facilities for our guests, the completion of our new EPOS system in 2020, and continuing to build on the capabilities of our data team.
Our beer business continues to grow through its great portfolio of beers, trusted by on-trade and off-trade customers and consumers, our expertise and capacity in contract services and logistics.
Focus on a long-term sustainable business with plans to further reduce energy consumption and our carbon footprint with a planned investment of £1–2 million.
3
Lobster Pot, Bridlington
Secure financing and valuable assetsThe financing of our business is supported by a combination of a long-term debt structure and an agreed bank facility for the next five years; fixed charge cover is 2.5 times.
Our estate has been valued at £2.1 billion and 91% of that is freehold.
Estate value
£2.1bn

At a Glance
We have three operating segments supported by Group Services, as set out below, which reflect different guest profiles, flexible operating models, products and services.
Taverns • Community and independently run pubs, either
managed, franchised or tenanted.
• Great pubs with a licensee who connects with their community or that maximise the abilities of skilled entrepreneurs.
• Typical guests: those wanting to enjoy a drink, socialise and be entertained with people from their community.
Destination and Premium • Larger food-led managed pubs, premium bars
and restaurants, accommodation.
• Marston’s Two for One, Heritage, Milestone Rotisserie, Milestone Carvery, Accent, Firebrand, Pitcher & Piano, Lost & Found, Foundry and Revere Country.
• Typical guests: value seekers or those looking for a premium experience.
Brewing• Six breweries producing a wide portfolio
of cask, keg and packaged beers.
• Key brands: Pedigree, Hobgoblin, Wainwright and Shipyard and licensed brands including Estrella Damm.
• Local provenance in regional markets with Banks’s, Jennings, Mansfield, Ringwood, Brakspear and Eagle.
• Typical consumers: discerning and knowledgeable drinker at home and away from home (in pubs, clubs and bars).
Rooms
1,593Locations
412Underlying revenue
£460.1m+2.1%
Underlying operating profit
£87.1m-2.6%
Rooms
90Locations
1,125*
Underlying revenue
£324.1m+3.9%
Underlying operating profit
£86.3m+0.2%
Locations
18Underlying revenue
£389.3m+3.1%
Underlying operating profit
£32.6m+1.9%
Group Services • Our Group Services team provides a range of functional services that support and connect the wider business, including IT,
HR, Finance, Retail Systems, Company Secretariat, Legal, Risk and Compliance. All are focused on setting the strategic, financial and governance framework to deliver growth to investors, our people and the communities in which we operate.
* Number of pubs does not reflect the disposal of 137 pubs completed in November 2019.
4 Marston’s PLC Annual Report and Accounts 2019

Marston’s estate in 2018/19
We operate across the UK and are focused on maximising our return on investment from our high quality estate, which we continue to strengthen through organic development of pub-restaurants, bars and franchise-style pubs. Our six breweries and 12 depots and distribution centres provide national coverage to supply and distribute a wide portfolio of beers to our estate, supermarkets and other pub and leisure businesses across the nation.
Key
Destination and Premium Taverns BrewingRooms
Scotland
North ofEngland
Wales
Midlands
South ofEngland
21 250
127123
3 4
556
Distribution centres and depots
9930
1
168
565135
2 3
477
334103
1 4
232
5Marston’s PLC Annual Report and Accounts 2019Strategic Report

Chairman’s Statement
“ Marston’s has a strong culture, great brands, pubs, and heritage.”
On joining the Board last year, I stated that we would review our strategy and financial targets in view of current market conditions. We have done that and, in 2019, have significantly increased our focus on cash generation and debt reduction. As a consequence, we reduced growth capital spend on new-build pubs and lodges in 2019, and have no plans for new openings
6
in 2020.
Instead, our operational priorities will focus on driving better performance from the assets we already own, and in further improving guest and customer measures.
As reported in May, we are targeting a £0.2 billion reduction in debt by financial year 2023. We have made good progress and, in November, announced the disposal of 137 smaller pubs for £45 million. We are now aiming to bring forward the debt reduction target date and have increased our disposals target in 2020 from £40 million to £70 million.
ResultsTurnover increased 3% to £1.2 billion, reflecting the positive impact of new openings, pub acquisitions, like-for-like sales growth in pubs and growth in brewing helped by new distribution contracts.
Underlying profit before taxation of £101.0 million was £3.0 million below last year (£104.0 million).
This was below our target for the year. Our pubs reported like-for-like sales growth of 0.8% in comparison with 2018, and our brewing business achieved growth, but this was not sufficient to offset cost increases, with labour costs rising above the general level of inflation.
On a statutory basis there was a loss before tax of £20.0 million (2018: £54.3 million profit) principally arising from non-cash adjustments which are largely outside our control; they do not have any direct impact on cash generation or our debt reduction target.
I am pleased to note that guest satisfaction and food hygiene measures improved significantly in 2019. The challenge of balancing top line targets and rising costs whilst prioritising customer service remains a key priority for 2020.
Underlying earnings per share were 13.5 pence per share (2018: 13.9 pence per share). Statutory loss per share was 2.8 pence per share (2018: 7.1 pence per share profit).
DividendThe Board recommends a final dividend of 4.8 pence per share, bringing the full year dividend to 7.5 pence per share, unchanged compared to 2018. Dividend cover is 1.8 times and, in the medium term, our dividend policy remains to maintain cover of around 2 times. We expect to maintain the dividend at current levels at least until the end of the debt reduction period.
Market and BrexitConsumer confidence has been weaker in recent months and uncertainty over political and economic direction has made forecasting more difficult. Our sector faces significant cost challenges and skills shortages, and we hope that the Government will help to address these pressures when Brexit is resolved.
Our strategy is appropriate for current market conditions.
Our people I am grateful for the hard work and dedication of all at Marston’s who contribute to our performance, and to the open, down-to-earth and friendly culture that is evident across the business. At the same time, professional capability was recognised through several awards in 2019 in relation to environmental matters, female executive management talent, apprenticeships and beer brands, and I congratulate all those involved.
The BoardCatherine Glickman will step down from the Board at the Annual General Meeting in January 2020. She will be succeeded as Chair of the Remuneration Committee by Octavia Morley, who joins the Board as a Non-executive Director in January bringing extensive executive and non-executive experience. I would like to thank Catherine for the knowledge and contribution that she has brought to the Board.
I was delighted to welcome Bridget Lea as a Non-executive Director in September 2019. Bridget is a senior executive with Sainsbury’s PLC and brings valuable operational experience and consumer insight.
OutlookAlthough the market is currently challenging, our strategy is for the long term.
Marston’s has a strong culture, great brands, pubs, and heritage. I am confident that shareholders will see these attributes recognised in increased shareholder value over time.
William Rucker Chairman
Marston’s PLC Annual Report and Accounts 2019

Chief Executive’s Statement
“ A robust performance given weak consumer confidence and rising costs.”
7
Group overviewOur financial results represent a robust performance given weak consumer confidence and rising costs. The strengths of our business model include freehold asset backing, a mix of operating segments including brewing, wet-led pubs and bars and food-led pubs, and a secure long-term debt structure.
2019 performance overviewDuring the year we reviewed our strategy and, in light of the current political and economic uncertainty, determined that we would prioritise debt reduction and cash flow. Specifically, in January this year we set out a plan to reduce the Group’s net debt by £0.2 billion by 2023, with a commitment to maintaining the dividend during this period.
As a consequence of this review we have reduced growth capital spend on new-build pubs and lodges in 2019, and have no plans for new openings in 2020. Our operational and investment priorities will be focused on driving exceptional performance from the assets we already own, and on further improving guest and customer measures. To support these objectives we will reallocate some capital investment into our existing pub portfolio, creating an even higher quality business and driving higher returns on capital.
We have made good progress in implementing the debt reduction plan to date. In the 2019 financial year operating cash flow increased by £13 million to £196 million and, for financial year 2020, we have raised the disposals target from £40 million to £70 million, with a targeted net cash inflow for the year of £45–55 million. As a result of this good progress we are aiming to achieve the debt reduction target within a shorter timeframe.
The Chairman’s Statement provides details of underlying and statutory earnings and profit and further details are set out in the Group Operating and Financial Review on page 26.
In wet-led pubs, we have also benefited from our flexible approach, which includes managed, tenanted and franchise-style operating models, and from focused, targeted investment. In food-led pubs, menu development has mirrored market trends towards healthier food and, improved guest service measures reflect increased training and retail systems development,
as a result of the successful roll out of the new EPOS system. In brewing, our strategy to provide a range of beer styles with a focus on regional, premium and craft beers, together with the benefit of new distribution contracts, has contributed to market outperformance, with total volumes up 1%.
Strategy and objectivesOur trading performance in 2019 was strong in wet-led pubs and brewing, despite challenging comparatives which included the benefits of the 2018 World Cup and a hot summer, but with more subdued sales in food-led pubs. This performance was consistent with market trends. Pub like-for-like sales increased by 0.8% and brewing volumes were 1% ahead of the previous year.
When we achieve the debt reduction target, our intention is to continue to operate a high quality pub and beer business generating sustainable and consistent net cash flow after dividends of at least £50 million per annum. This will provide us with the optionality to continue to reduce the Group’s overall levels of debt or, alternatively, inject additional growth investment into the business, having regard to re-evaluating the optimal gearing level, market conditions and opportunities available.
Details of the progress made so far is set out in the Group Operating and Financial Review on page 26.
Our people and cultureOur business is all about bringing people together and helping them to feel good. We have a committed and loyal team of over 14,000 people who are critical to our success, so it is essential that our people work well together, care about each other, know what they have to do and always strive to be the best. The labour market is tight in a number of areas, particularly in pub management. Given that the calibre of pub and kitchen management is a key determinant in the success of individual pubs we have introduced a number of initiatives, including revised incentive plans, to reduce employee turnover and identify a stronger pipeline for future appointments. For hourly paid employees in pubs, we introduced new employment contracts this year which guarantee minimum hours to replace zero hours contracts, which do not always suit the needs of our people.
We completed an employee engagement survey in September 2019. Across the business, employee engagement remains high and above average for UK businesses.
Current trading and outlookIn the first seven weeks of the period pub like-for-like sales are ahead of last year and beer performance is in line with expectations. As noted previously, the majority of profit in the first quarter is generated over Christmas and New Year and we are well prepared for this all-important trading period.
As noted earlier, consumer confidence remains weak. Brexit, political uncertainty and real-wage pressures further impact on consumer confidence but, to date, there has been no marked change in spending patterns across the business.
Brexit contingency plans are in place to ensure we are as prepared as we can be for the critical Christmas and New Year trading period though current indications are that the risk of a disorderly Brexit have reduced. If a disruptive exit from the EU does happen we believe it would impact the wider sector in relation to the cost of goods and labour. Our direct exposure is relatively limited, with only 5% of our workforce of non-UK EU origin.
The year ahead will be a 53 week period and will see the implementation of IFRS 16 which will impact a number of the reported KPIs. Further information is provided in the Group Operating and Financial Review on page 26 and in Note 1 of the Financial Statements on page 89.
Ralph FindlayChief Executive Officer
Marston’s PLC Annual Report and Accounts 2019Strategic Report

Our Business Model
Our core business is running pubs, brewing, selling and delivering beer; something we have done for over 180 years. Whilst our business has grown and changed in that time, it is still focused on delivering robust and sustainable long-term returns from offering guests and customers a great experience.
To do what we have done for over 180 years:
To build relationships and bring people together, creating happy, memorable and meaningful experiences.
Our purpose:
We add our key ingredients:
Brands
Insight and innovation
Financial capital
People
Property
Measured by our KPIs
We operate in a fast-moving and fiercely competitive market so we need to stand out from the crowd. Our competitive advantage comes from our people, our unique culture,
and how we use our property, our brands, our innovation and insight and our disciplined approach to finance.
Financial Group
Operating a high quality pub and rooms business and operating a ‘best in
class’ beer business
Underlying earnings per share (EPS) Employee engagement
Cash Return on Cash Capital Employed (CROCCE)
Net cash flow (NCF) FTSE4Good ESG score
8
See pages 12–13 for more information
Marston’s PLC Annual Report and Accounts 2019

Delivering success:
Food 36 million meals served by our pubs
Drink 95 million pints sold by our pubs
Contract Services We brew and bottle ales on behalf of other businesses
Distribution Our national distribution network delivers to over 11,000 customers
Exports We export beer to 61 countries
To create:
Pubs and bars Beer business
Like-for-like sales Total own ale – market share
Happiness score On time in full (retail and logistics)
Critical role turnover
A great guest experience
A high quality, balanced pub estate*
An unrivalled portfolio of beer and brands
Complete customer solutions
*The King Brychan, Merthyr Tydfil
World beer – market share growth
See page 24 for more information
Hospitality apprenticeship employer of the year
Best neighbourhood pub menu
Best ale supplier
Recycling partnership excellence
9Marston’s PLC Annual Report and Accounts 2019Strategic Report

B MOur Business Model continued
Pubs and bars
Our usiness odel
We are focused on operating a high-quality pubs and rooms business offering great places to drink, eat and stay.
While pubs may have changed a lot over the years, the reasons people use them remains the same. The pub is where we go to socialise, celebrate, share an experience or simply enjoy a cold beer or a bite to eat at the end of a long day. We are at the heart of local communities, offering a warm welcome and value for money.
Our biggest contributor of profit comes from the sites under our direct management and our flexible approach enables us to select the right operating model and proposition for each pub to maximise its return.
Ability to link our brewing heritage to the pub brand.
Room guests offer an increased contribution from drinking and eating in our pubs.
Focusing on pub values within a range of guest offers that reflect modern tastes and trends providing something to suit everyone.
Places that allow people to drink, eat and stay, that create a sense of belonging to a community.
Proposition
Family
Community
Premium
Rooms
Operating model
Managed – ‘Work for us’
Franchised – ‘Work with us’
Leased – ‘Partner with us’
Success factors
Quality and value: best experience rather than lowest price
Service: a focus on guest satisfaction
Experience: creating an enhanced environment to attract new and returning guests
Value created
Growth in sales through increased spend per head or number of visits
Engaged teams and happy guests
Different models provide flexibility to maximise the return from each pub and attract licensees to run a pub under a business arrangement that best suits their needs.
Enhancing the drinks portfolio to create more premium offers provides choice for different occasions.
Investing in our pub teams will improve engagement, reduce employee turnover and ultimately improve standards of service.
Reducing the complexity of food menus and simplifying the guest journey will improve the offer and experience.
Our balanced pub portfolio has delivered a long track record of sales growth.
Average profit per pub has increased 55% since 2012.
Measured by our KPIs See page 24 for more information
Like-for-Iike sales
Happiness score
10
Lost & Found, Sheffield
Critical role turnover
Marston’s PLC Annual Report and Accounts 2019

Beer business
We are focused on operating a ‘best in class’ beer business with our blend of traditional and contemporary breweries, crafting a portfolio of cask, keg, bottled and canned beers with appeal for all types of drinkers. We have extended our offer to include an award-winning range of exclusive world beers and ciders.
In addition, we operate our own national distribution network to supply and distribute not only to our own pubs but also to other customers: from supermarkets to the local shop and other pub and leisure businesses.
Building on our heritage and expertise we have evolved our business further to include a contract services business, initially aimed at maximising brewery capacity, brewing and distributing ales on behalf of other businesses.
We distribute to around one quarter of the UK’s on-trade outlets.
We package a significant proportion of the UK premium bottled ale market.
A portfolio of local, national and global brands provide consumers with a wide choice of beers including premium, craft and an increasing range of low and no-alcohol drinks.
Our team of in-house master brewers ensure our beers meet exacting standards to create consistent quality.
Proposition
Beer brands
Brewing expertise
Customer offer
New product innovation
Local provenance
National reach
Craftsmanship
Expertise
Success factors
Value: highest quality at optimum cost
Capacity utilisation
Consolidation opportunities
A team that differentiates us
Value created
Increased sales through an unrivalled portfolio of beer and brands
Complete customer service solutions
Insight-led thinking supports the development of new products that meet changing consumer preferences.
Our annual On-Trade and Off-Trade Beer Reports add value to our customers own offerings.
Targeted sponsorships promote and broaden our appeal.
Investment in our facilities, equipment and systems has enhanced our capabilities and improved our efficiencies.
Our reputation for service excellence creates opportunities for new business.
Our range of own beers, licensed brands and wider drinks offering provides our sales teams with greater opportunities to grow our customer base.
Our expertise in brewing, packaging and distribution attracts many industry customers.
91.5% of own-brewed volume is sold externally.
Marston’s PLC Annual Report and Accounts 2019Strategic Report
Measured by our KPIs See page 25 for more information
Total own ale – market share
On time in full (retail and logistics)
11
World beer – market share growth

Resources and Relationships underpinning our Business Model
Our competitive advantagecomes from the quality of our people.
Our people – our biggest enabler We know that the key to unlocking the potential of our people is to engage, involve and motivate them, whilst enabling them to make decisions, take action and play their part. We invest in our people and their future, as much as they invest in Marston’s. We devote time, effort and resources in making sure that our people feel enabled and inspired to be their best, delivering a great guest experience and supporting value creation.
We aim to attract and retain the best talent across all parts of our business. We strive to nurture and create a working environment where all team members are equally valued, truly supported and duly recognised for their contribution. Our People Strategy clearly articulates the way in which our people will both lead and participate in making the changes necessary to realise Marston’s ambitions. We will do this through transformational leadership and enabling an inclusive high-performance culture.
The engagement and enablement of our people is key to our success. Working in strategic partnership with leaders and managers across all areas of the business, our focus is to make sure that our teams have the necessary tools and support to deliver the required actions that enable and inspire our people to be their best.
Our activities support our people from recruitment and early career development, continuing personal and professional development, performance and talent management, to succession planning. We nurture the highest standards of leadership to sustain a motivated and engaged workforce which creates an inclusive high performance and customer focused culture that balances the need for stimulating and challenging work with a healthy lifestyle.
Our People Strategy is built up of four key strategic priorities, each of which support value creation:
1. How we bring people in
Marston’s PLC Annual Report and Accounts 2019
Attracting and retaining the best people, giving them the best startOne of our key focuses is to ensure that Marston’s becomes an employer and partner of choice, developing creative and new ways to attract the best talent. We work with our leaders to fully understand their requirements for the future and develop workforce plans to meet their demands, including the identification of critical roles across the business and develop strategies to minimise risk. Examples of how we do this are focusing on raising awareness of hospitality as a career choice and growing our early talent pipeline through work experience and apprenticeships.
Our recruitment processes and practices are inclusive, simple, straight forward, consistent and ensure that we deliver an integrated recruitment and induction process that is aligned to our values.
2. How we treat our people Creating a positive working environment for our people, bringing to life our Ways of WorkingWe continue to articulate our Ways of Working and expected behaviours for our people, which ensures a diverse, inclusive and enabling culture. Working with our leaders and managers, we identify the engagement and enablement priorities that support our people to be their very best.
We recognise the importance of the employee voice as a vital enabler to business performance. We provide opportunities to make sure that every employee is able to voice what they see as important, encouraging productivity and organisational improvement.
3. How we grow our people Releasing the potential of our people and building capability for the futureWe develop a performance culture, through our Performance, Career and Development Review process and Personal Development Plans, where an individual’s personal and career development is supported. Retaining internal talent and providing opportunity for all employees to be their best is core to our strategy. A key focus is to continue effectively utilising apprenticeships to develop knowledge, skills and behaviours and provide career pathways to enable long-term development, progression and support succession planning.
4. How we enable our people Recognising and supporting our people to achieve great resultsWe recognise that we need to be clear about our reward and benefits priorities. Our reward plan focuses on ensuring that we deliver the basics to inspire and motivate our people to be the very best they can be.
Core HR excellence covers our business critical processes that are vital to the credibility and success of any high performing business. We develop and continually improve those processes and system capabilities to meet the demanding needs of our business. To support the delivery of the business strategy, we will fully utilise our metrics to drive greater insights and decision making. Our code of conduct, The Marston’s Way, provides guidance and direction in how to work in an ethical and responsible manner.
12

Netdebt(£m)
Securitised Sale and leaseback Bank and cash
745 776806
358 364301
296 246 222
19 18 17
High quality freehold pub estate
Our balanced business model is underpinned by our predominantly freehold pub estate of around 1,400 pubs. Our flexible operating models ensure we have the right guest offer for each pub.
How this supports value creation• Higher quality of earnings
• Improved profit per pub
• Enhanced guest experience
Financial capital
We have a mix of long-term debt and equity together with the availability of asset-backed financing for new-build sites.
How this supports value creation• 91% freehold estate provides attractive security for funding providers
at competitive rates
• Flexibility to invest in assets to maximise long-term returns without covenant reporting obligations
Innovation and insight
Our sales are dependent on executing our food, drink and service consistently and adapting to key trends. We monitor data and trends in the UK eating-out and drinking markets and use our insights toimprove our guest experience. Our pub teams develop and evolve the food, drink and service offerings in response to this and collaborate with our beer teams to maximise the guest experience in-pub through range, quality and consistent delivery of the perfect pint.
How this supports value creation• Guests who feel they are getting value for money (not low price)
will return
• Promoting the role of the pub in bringing people together through enhanced social experiences creates a sense of belonging to that community and encourages frequency of visit
• Reducing the complexity in food menus to ensure consistent execution supports a better guest experience
Independent
Wet-led
Food-led
Taverns
Destination and Premium
Managed
Leased
Valued and recognised brands
We have an extensive portfolio of beers with strong brands in local and national ale; standard, world and discovery lagers; as well as craft beers; and a strong low and no-alcohol range.
How this supports value creation• Broad appeal with focus on the growth areas of the market
• Keg, cask, bottled, canned and mini keg enables our teams to deliver the right pack format for all drinker occasions
• Ability to offer differential ranging to customers, getting the right beers in the right outlets
• National trading footprint
• Value-adding partnerships with licensed brands and supply chain
13Marston’s PLC Annual Report and Accounts 2019Strategic Report

Resources and Relationships continued
Our guests and customers
To keep attracting our guests to our pubs we ensure we keep them at the heart of all we do by offering choice and value, as well as a great experience and always striving to exceed their expectations. Offering memorable experiences, whilst still offering value for money, is key to the relationship with our guests. For our beer and drinks customers it is our trusted partner status which is valued the most; our quality of service, delivering brands and innovation that help to support their businesses, and at price levels which allow them to grow their own customer base.
Our suppliers All our activities are dependent upon our suppliers. Our business model is based upon the utilisation of their services and the provision of raw materials and products into our business, at prices which underpin our own profit generation, and ultimately deliver our guest offering at the price points that they demand. Quality of service and product are of the highest priority because both are vital to achieving guest satisfaction. Relationships with our key suppliers are managed in a responsible way, with mutual respect for the commercial interests of our businesses. We insist upon an ethical approach to business that reflects our own values with regard to employees, the environment, quality control, legal compliance and integrity.
Our community Our pubs and breweries are a physical part of the communities where they are located. Their relationship with the community is more than just a place to eat and drink, it is where happy times with family and friends are shared and where memories are created. In a modern digital age the pub is where people in a community meet each other, talk, laugh and enjoy one another’s company. Our pubs and breweries have been part of the historic character of our cities, towns and villages over many years. We have never taken this special relationship for granted.
Our investors We want to attract long-term investors who believe in and support our strategy. This enables us to remain focused on delivering sustainable growth and maximising return on capital invested, for the benefit of all our stakeholders.
The environment Our pubs and breweries are both sustained by and impact upon the environment. This is true at a local physical level as well as an indirect global level, particularly through our global sourcing of food. Every year we publish details of our environmental impact together with the innovative solutions in which we have invested in to reduce that impact. We recognise the huge challenge we face from climate change and the part our business has in helping our country to move closer to reducing its emissions to ‘net zero’. We understand the destructive nature of waste in terms of volume and the potential dangers if not correctly controlled.
The government
14
Our business model also depends on strong relationships with our stakeholders that help create and share in the value.
The values and expectations of our stakeholders shape our performance and success, influencing the way we make decisions. Long-term value creation is about more than just financial results alone – we recognise that we need to act responsibly in partnership with our key stakeholders to build a sustainable business.
Our Corporate Responsibility section on page 37 expands on our approach and the relationship with our guests and customers, our people, our suppliers, our communities and our environmental impact.
Government policy decisions impact the Group and, directly and indirectly, all of our stakeholders. For example, the introduction of the Apprenticeship Levy and changes to the National Living Wage and National Minimum Wage on our employees, and legislation on environmental issues. As a responsible business we engage with, for example, UK Government Public Health on health initiatives. We also collect and pay a wide range of taxes totalling £528.8 million (2018: £530.9 million).
Marston’s PLC Annual Report and Accounts 2019
Stakeholder Engagement
How we engage Key topics raised Our response
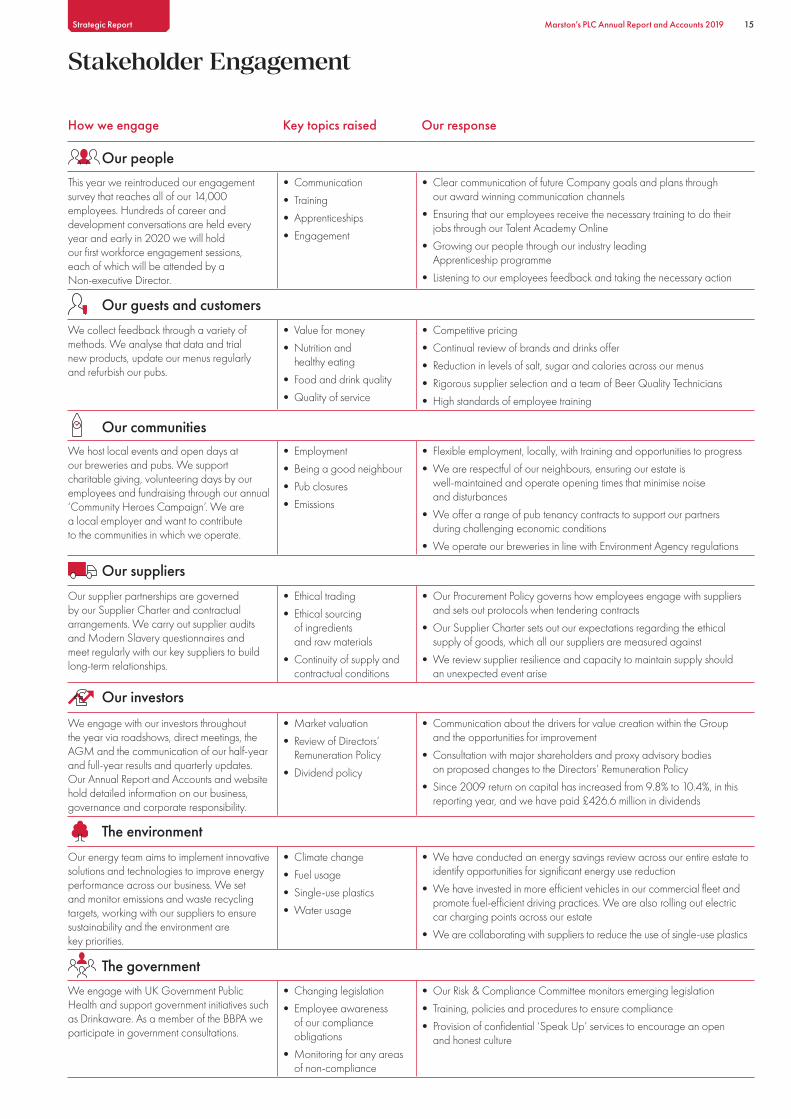
Our peopleThis year we reintroduced our engagement survey that reaches all of our 14,000 employees. Hundreds of career and development conversations are held every year and early in 2020 we will hold our first workforce engagement sessions, each of which will be attended by a Non-executive Director.
• Communication
• Training
• Apprenticeships
• Engagement
• Clear communication of future Company goals and plans through our award winning communication channels
• Ensuring that our employees receive the necessary training to do their jobs through our Talent Academy Online
• Growing our people through our industry leading Apprenticeship programme
• Listening to our employees feedback and taking the necessary action
Marston’s PLC Annual Report and Accounts 2019Strategic Report
Our guests and customersWe collect feedback through a variety of methods. We analyse that data and trial new products, update our menus regularly and refurbish our pubs.
• Value for money
• Nutrition and healthy eating
• Food and drink quality
• Quality of service
• Competitive pricing
• Continual review of brands and drinks offer
• Reduction in levels of salt, sugar and calories across our menus
• Rigorous supplier selection and a team of Beer Quality Technicians
• High standards of employee training
Our communitiesWe host local events and open days at our breweries and pubs. We support charitable giving, volunteering days by our employees and fundraising through our annual ‘Community Heroes Campaign’. We are a local employer and want to contribute to the communities in which we operate.
• Employment
• Being a good neighbour
• Pub closures
• Emissions
• Flexible employment, locally, with training and opportunities to progress
• We are respectful of our neighbours, ensuring our estate is well-maintained and operate opening times that minimise noise and disturbances
• We offer a range of pub tenancy contracts to support our partners during challenging economic conditions
• We operate our breweries in line with Environment Agency regulations
Our suppliersOur supplier partnerships are governed by our Supplier Charter and contractual arrangements. We carry out supplier audits and Modern Slavery questionnaires and meet regularly with our key suppliers to build long-term relationships.
• Ethical trading
• Ethical sourcing of ingredients and raw materials
• Continuity of supply and contractual conditions
• Our Procurement Policy governs how employees engage with suppliers and sets out protocols when tendering contracts
• Our Supplier Charter sets out our expectations regarding the ethical supply of goods, which all our suppliers are measured against
• We review supplier resilience and capacity to maintain supply should an unexpected event arise
Our investors
We engage with our investors throughout the year via roadshows, direct meetings, the AGM and the communication of our half-year and full-year results and quarterly updates. Our Annual Report and Accounts and website hold detailed information on our business, governance and corporate responsibility.
• Market valuation
• Review of Directors’ Remuneration Policy
• Dividend policy
• Communication about the drivers for value creation within the Group and the opportunities for improvement
• Consultation with major shareholders and proxy advisory bodies on proposed changes to the Directors’ Remuneration Policy
• Since 2009 return on capital has increased from 9.8% to 10.4%, in this reporting year, and we have paid £426.6 million in dividends
The environment
Our energy team aims to implement innovative solutions and technologies to improve energy performance across our business. We set and monitor emissions and waste recycling targets, working with our suppliers to ensure sustainability and the environment are key priorities.
• Climate change
• Fuel usage
• Single-use plastics
• Water usage
• We have conducted an energy savings review across our entire estate to identify opportunities for significant energy use reduction
• We have invested in more efficient vehicles in our commercial fleet and promote fuel-efficient driving practices. We are also rolling out electric car charging points across our estate
• We are collaborating with suppliers to reduce the use of single-use plastics
The governmentWe engage with UK Government Public Health and support government initiatives such as Drinkaware. As a member of the BBPA we participate in government consultations.
• Changing legislation
• Employee awareness of our compliance obligations
• Monitoring for any areas of non-compliance
• Our Risk & Compliance Committee monitors emerging legislation
• Training, policies and procedures to ensure compliance
• Provision of confidential ‘Speak Up’ services to encourage an open and honest culture
15

Our Marketplace
We operate in a competitive marketplace, which presents both immediate challenges and long-term opportunities. Our market and consumer insight helps to support our strategic and investment decisions.
DrinkOur pubs optimise their range to capitalise on the key macro trends and our beer portfolio covers a variety of styles and packaging formats to appeal to a broad range of drinkers.
Trends• Consumers are demanding memorable occasions
and experiences in our pubs and elsewhere.
• Consumers continue to drink less overall but they are choosing better, more premium drinks and are prepared to spend more on these.
• Products with heritage and provenance continue to grow as consumers are looking for authenticity.
• Consumers continue to seek a healthy and balanced lifestyle which includes reducing alcohol consumption.
Challenges• Providing compelling reasons to visit our pubs
by offering better experiences than the competition.
• Guests continue to demand better quality at all levels of the market amidst tough competition.
• Communicating our heritage and provenance in an emotive and engaging way.
• Balancing health with an occasional treat and providing drinkers with attractive options if they choose to reduce their alcohol intake.
Marston’s PLC Annual Report and Accounts 2019
EatOur pubs offer something for everyone, from great value traditional favourites, to healthy options and emerging culinary trends.
Trends• Guests are looking to balance a healthier lifestyle
with the occasional indulgence – especially when eating out.
• Delivering the basics brilliantly is a necessity for guests – hot food fast has never been more important.
• Eating out has become less formal with guests looking for more interactive and social dining experiences.
• An increasing demand for great value, yet high quality food that is customisable to an individual’s tastes and requirements.
• Guests are more conscious than ever about their impact on the environment, even when it comes to food, for example, animal welfare, food waste and plastic packaging.
Challenges• Developing dishes that appeal to a wide range
of restrictive diets, understanding the preparation of those dishes within commercial kitchens where there is potential risk of cross-contamination.
• Government focus on sugar and salt reduction targets, and potential legislation on calorie information on menus.
• Consumption habits are changing, breakfast and afternoon occasions are increasing whilst traditional pub occasions of lunch and dinner are in decline.
• Standing out in a saturated eating-out market whilst maintaining value for guests and profit margins.
• With childhood obesity on the rise, ensuring our menus provide healthy and nutritious options whilst still appealing to children and facilitating frictionless family dining occasions.
StayMarston’s Inns provide great value accommodation in convenient locations adjacent to our pubs.
Trends• There is reduced demand in the market, in part
caused by Brexit uncertainty. Whilst the London market was boosted by tourism, from sporting events such as the Cricket World Cup and Baseball League, the regional hotel market declined by 0.3% year-on-year (Alix Partners).
• Guest usage of budget hotels appears to be declining.
• Younger people are particularly aware of the alternative choices and experiences available and seek the best value for money.
Challenges• The market is overcrowded with many new entrants
offering B&B style models or capsule rooms.
• The use of online travel agency bookings by guests is increasing each year.
• Staying relevant by keeping up with technology developments and competing on a budget level with operators.
16

Opportunities• Deliver genuine engaging experiences in relaxed and
enjoyable surroundings which separate our pubs from the rest of the market. Utilise cask as an experience that cannot be replicated at home.
• Offer a breadth of range which encourages consumers to trade up into more premium brands and categories. Drive the development of new beer products in contemporary categories and respond to changes in consumer tastes.
• Leverage our expertise in brewing built up over more than a century to ensure that we have the best offer in the market, delivered brilliantly.
• Consumers are prepared to spend more on living healthier lives if it does not mean missing out on experience, premiumisation and authenticity.
Our response• We work to deliver a drinks range and drinks-led
events that offer great experiences including beer, gin and whisky festivals and tastings.
• We have increased the range and depth of premium brands in all categories in our pubs through the launch of premium cask and keg beers, including Hobgoblin IPA and Wainwright Altitude, and the increase of our portfolio of premium licensed brands in other categories.
• Our compelling portfolio of brands provides authenticity to our range of drinks offered in each of our pubs.
• Increasing the range of low and no-alcohol products, premium soft drinks under 100 calories and no-sugar options in our pub. Development of Wainwright Gluten Free and Shipyard Low Tide (0.5% abv).
Opportunities• Developing balanced menus which offer healthier
options and indulgent treats to cater for varied demand from guests.
• Enhancing guest satisfaction through improved food quality, presentation and speed of service.
• Broadening the food offer to provide choices at breakfast and more informal snacking and grazing occasions.
• Working closely with suppliers to deliver the best possible products at prices our guests are happy to pay.
Our response• All menus feature a range of lower calorie dishes,
healthy switches and a range of vegan and vegetarian dishes.
• All new products comply with the Government’s salt and sugar targets.
• We are reducing the complexity of food preparation in our kitchens to serve food more efficiently to our guests.
• Our menus focus on delivering pub classics alongside more adventurous and specialist dishes, and emerging culinary trends.
• All food suppliers are required to comply with high standards of animal welfare, where relevant, source locally and minimise food miles, minimise packaging in products and distribution and target the removal, reuse or recyclability of plastic packaging.
Opportunities• Online travel agencies give Marston’s exposure
to a wider group of guests.
• Use our pubs to more actively drive awareness and promotion of Inns.
• Enhance the overall experience by highlighting the benefits of being part of a pub and all that that can bring in entertainment, food and drink choices.
• Reinforce the ‘something for everyone’ message not only through our pubs, but with Inns too.
Our response• Full presence on the biggest online travel agency
sites plus incentives to book direct for future visits, to maximise the best of both worlds.
• Investment in more digital activity and advertising to target our pub guests and to raise awareness of Inns to prospective guests.
• Measuring the guest experience by identifying any key needs that differ by age groups. This data will allow us to better identify our guests’ needs.
(XX%
Marston’s PLC Annual Report and Accounts 2019Strategic Report
80.8%
19
77.6%
18
72.4%
171
Premium beer sold (as a % of total beer sales)
1. Includes beers acquired through the acquisition of Charles Wells Beer Business from June 2017.
£38.18
£38.99
£37.34
Revenue per available room(RevPAR)
19 18 17
)
(1.2%)
10.5%
Eating-out sales growth
Marston’s
Market
19
(1.4%)
18 17
1.3%
19
1.4%
18
1.7%
17
17

Our Strategy
Our Group strategy
1Operating a high quality pub and rooms business offering great places to drink, eat and stay.
Our purpose is to build relationships, bring people together and create happy, memorable and meaningful experiences for our teams, our guests and our customers, every day.
2Operating a ‘best in class’ beer business with a wide range of premium and local brands and great service.
Underpinned by our values and culture
The Marston’s WayTo achieve our purpose it’s important that we can run our business in an ethical and responsible manner, truly caring for the people and places we impact along the way. Our code of conduct, The Marston’s Way, directs and guides our people with the help and support they may need along with policies and other useful reference information.
Our Ways of WorkingThe success of our business depends on our Ways of Working (WoW), which are the behaviours we expect of our people. We are a people-powered business, so it is essential our people work together, care about each other, recognise a job well done and always strive to be the best.
WE ARE ONE TEAMWe are one Marston’s, one team – trusted to make the right decisions and play our part.
WE CAREWe care – we take time to listen, understand and do the right things for our customers and stakeholders.
WE CELEBRATEWe celebrate – when we do something really well, we shout about it and have fun celebrating.
WE DREAM BIGWe dream big – together we strive to make Marston’s ‘The Place to Be’ and always exceed expectations.
• Maintaining a balanced pub portfolio across all segments of the market.
• Targeted capital investment to improve pub values and premiumise the guest experience.
• Operational investment to improve the execution of the offer.
• Further investment in our technology and digital resources to improve the guest experience and operational efficiency.
See page 19 for more information
• Continue to exploit growth segments in the beer market.
• Sustainable long-term growth of a local, national and global portfolio of brands.
• Delivering a complete customer experience solution.
• A world-class supply chain delivering the highest quality service at optimal cost.
See page 22 for more information
18 Marston’s PLC Annual Report and Accounts 2019

Progress to date• LFL sales growth of 0.8% in both wet-led and food pub segments
• Average profit per pub in line with last year but increasing by 7% after the disposals announced in November 2019
A balanced pub portfolio operating across all segments of the marketWe operate a predominately freehold pub estate that caters for a broad range of guests, with flexible operating models. This allows us to ensure we have the right consumer offer, accompanied by the most appropriate operating model, to maximise sales and profits for each individual pub, thus maximising long-term value.
Our pub business comprises the following:
Family pub-restaurants – our family pub-restaurants offer family dining and great value in a relaxed pub environment. We aim to retain strong pub values while reflecting modern tastes and trends in a fast moving and competitive market.
Community pubs – our community pubs are great ‘locals’ with a more traditional pub ambience in strong locations. The contribution of the licensee, together with strong community engagement, are critical to the success of these pubs with entertainment, team-led engagement and games often at the heart of the pub’s activities. Our community pubs operate under managed, franchised and leased models offering flexibility for our licensees to run their pub under a business model that is best suited to their needs.
Premium pubs and bars – our Pitcher & Piano bars and Revere bars and pubs offer premium food and drink in attractive, often iconic town centre and suburban locations.
Accommodation – we operate around 1,700 rooms across our business. We operate 30 stand-alone lodges adjacent to pubs together with integrated rooms within pubs ranging from rooms above pubs to boutique premium bedrooms.
New pub-restaurants opened
8New lodges opened
2Wet-led pubs opened
15Smart investment across the pub estateTargeted capital investment is integral to improving the performance of our pub estate. An effective capital programme provides an enhanced environment for existing guests and is a catalyst to attracting new guests in a highly competitive market.
Destination Tavernsand Premium
The eating-out and drinking markets remain in growth overall. Marston’s drinks-led pubs achieved good growth in 2019 against very strong comparatives which included the benefits of a World Cup and hot summer. These strong performances reflect underlying strength in wet-led pubs, which continue to benefit from consumer trends including demand for engagement, experiences, and premiumisation.
Consistent with market trends, sales growth in food-led pubs has been more subdued. While there has been good growth at the premium end of the market within our Revere and Pitcher & Piano pub and bar portfolio, the value segment has been more challenging as a consequence of continued sector over-supply, and extensive price discounting. More positively, the last two years have seen some capacity reduction which has manifested itself in the form of some high profile CVAs, reductions in previously aggressive expansion plans and estate rationalisation from some of the larger scale operators. Marston’s Destination pub estate remains well placed to benefit from this reduced supply.
KPIs• LFL sales
• Critical role turnover
• Happiness score
19
Priorities for 2019/20• Targeted smart investment to generate stronger, sustainable returns
• Improving the guest experience
• Investing in digital and technology enhancements
1. Operating a high quality pub androoms businessoffering great places to drink, eat and stay.We remain focused on emphasising the ‘pub’ brand. Regardless of the food mix and dining offer, our clear market positioning as a pub and bar operator reflects the enduring appeal of pubs compared to the more cyclical and fashion-led trends which influence the casual dining market. We believe we are in a unique position to further exploit this point of difference by linking our brewing heritage to the pub brand, an approach embedded throughout the business from head office through to our pub teams.
Marston’s PLC Annual Report and Accounts 2019Strategic Report
Our Strategy continued
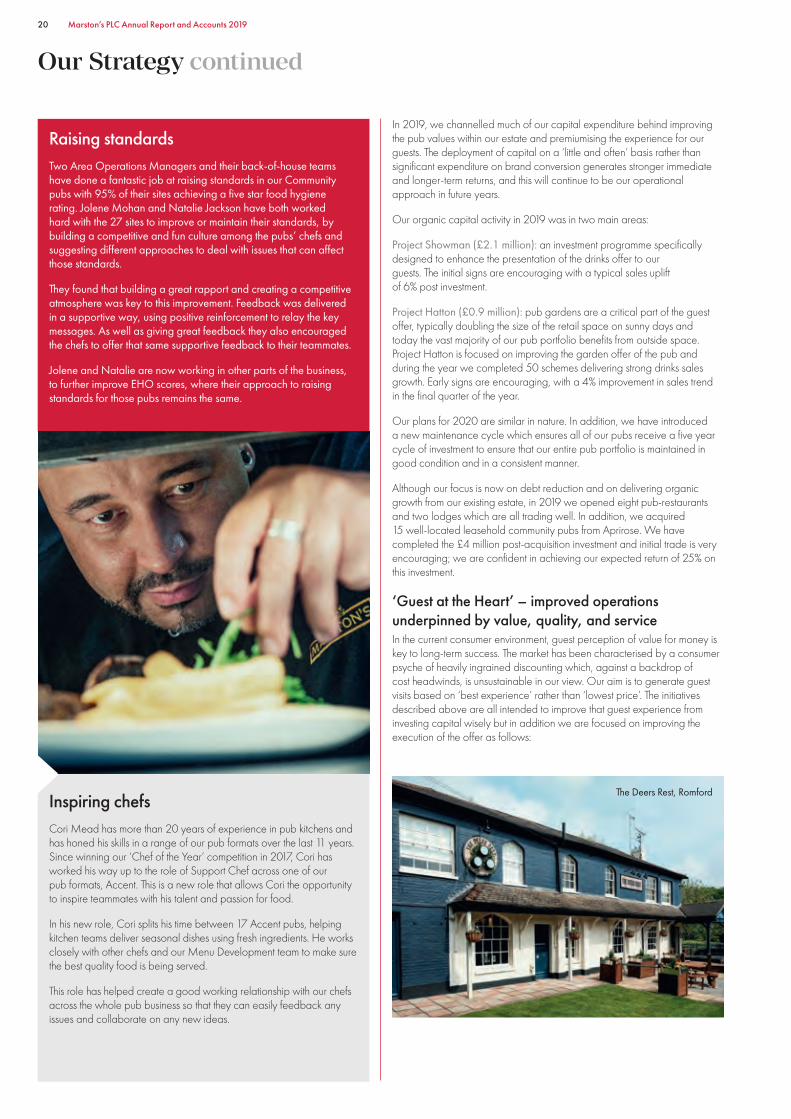
Inspiring chefs Cori Mead has more than 20 years of experience in pub kitchens and has honed his skills in a range of our pub formats over the last 11 years. Since winning our ‘Chef of the Year’ competition in 2017, Cori has worked his way up to the role of Support Chef across one of our pub formats, Accent. This is a new role that allows Cori the opportunity to inspire teammates with his talent and passion for food.
In his new role, Cori splits his time between 17 Accent pubs, helping kitchen teams deliver seasonal dishes using fresh ingredients. He works closely with other chefs and our Menu Development team to make sure the best quality food is being served.
This role has helped create a good working relationship with our chefs across the whole pub business so that they can easily feedback any issues and collaborate on any new ideas.
In 2019, we channelled much of our capital expenditure behind improving the pub values within our estate and premiumising the experience for our guests. The deployment of capital on a ‘little and often’ basis rather than significant expenditure on brand conversion generates stronger immediate and longer-term returns, and this will continue to be our operational approach in future years.
Our organic capital activity in 2019 was in two main areas:
Project Showman (£2.1 million): an investment programme specifically designed to enhance the presentation of the drinks offer to our guests. The initial signs are encouraging with a typical sales uplift of 6% post investment.
Project Hatton (£0.9 million): pub gardens are a critical part of the guest offer, typically doubling the size of the retail space on sunny days and today the vast majority of our pub portfolio benefits from outside space. Project Hatton is focused on improving the garden offer of the pub and during the year we completed 50 schemes delivering strong drinks sales growth. Early signs are encouraging, with a 4% improvement in sales trend in the final quarter of the year.
Our plans for 2020 are similar in nature. In addition, we have introduced a new maintenance cycle which ensures all of our pubs receive a five year cycle of investment to ensure that our entire pub portfolio is maintained in good condition and in a consistent manner.
Although our focus is now on debt reduction and on delivering organic growth from our existing estate, in 2019 we opened eight pub-restaurants and two lodges which are all trading well. In addition, we acquired 15 well-located leasehold community pubs from Aprirose. We have completed the £4 million post-acquisition investment and initial trade is very encouraging; we are confident in achieving our expected return of 25% on this investment.
‘Guest at the Heart’ – improved operations underpinned by value, quality, and service In the current consumer environment, guest perception of value for money is key to long-term success. The market has been characterised by a consumer psyche of heavily ingrained discounting which, against a backdrop of cost headwinds, is unsustainable in our view. Our aim is to generate guest visits based on ‘best experience’ rather than ‘lowest price’. The initiatives described above are all intended to improve that guest experience from investing capital wisely but in addition we are focused on improving the execution of the offer as follows:
Raising standards Two Area Operations Managers and their back-of-house teams have done a fantastic job at raising standards in our Community pubs with 95% of their sites achieving a five star food hygiene rating. Jolene Mohan and Natalie Jackson have both worked hard with the 27 sites to improve or maintain their standards, by building a competitive and fun culture among the pubs’ chefs and suggesting different approaches to deal with issues that can affect those standards.
They found that building a great rapport and creating a competitive atmosphere was key to this improvement. Feedback was delivered in a supportive way, using positive reinforcement to relay the key messages. As well as giving great feedback they also encouraged the chefs to offer that same supportive feedback to their teammates.
Jolene and Natalie are now working in other parts of the business, to further improve EHO scores, where their approach to raising standards for those pubs remains the same.
The Deers Rest, Romford
20 Marston’s PLC Annual Report and Accounts 2019
Improved operational effectiveness• We have combined the former Destination and Premium and Taverns
businesses under one umbrella, Marston’s Pubs & Bars, to facilitate clearer direction and cultural identity in our pub teams.
• We have reorganised the estate along geographical lines to allow Area Operations Managers to spend more time in their pubs, working closely with pub staff.
• In 2019, pub audit scores continued to show improvement and EHO scores have improved to an average of 4.54. We are targeting further improvements, having recruited a team of food safety advisers, and replaced our health and safety auditors to drive further change.
Marston’s PLC Annual Report and Accounts 2019Strategic Report
Investment in pub teams• We invest significantly in training and development of our pub teams at
every level and plan to invest a further £2 million in this regard in 2020; the Marston’s Talent Academy offers in-depth face-to-face and online training, and was a factor in our winning The Caterer’s Apprenticeship Employer of The Year Award in 2019. Reduced staff turnover in key roles is a priority for 2020 and we are aiming to further improve skill levels in our kitchens.
• We have introduced new bonus schemes for pub management staff with a notably increased emphasis on guest satisfaction ratings and exemplary food hygiene standards.
Improved guest offer and experience• Reduced complexity: recent menu launches across the business have been
designed to eliminate unnecessary ingredient and recipe duplication. This will benefit our guests through clearer menus and reduce wastage.
• Premiumisation: the trend towards more premium brands in drinks continues across all categories. We will target additional portfolio enhancement to further leverage this trend.
• Health: we were early to market in introducing an award-winning vegan menu in 2018, and the ‘plant burger’ in October of that year. This trend towards health awareness and wellness continues in food and drink; we have improved our already strong range of low and no-alcohol beers by introducing Shipyard Low Tide, a 0.5% abv pale ale.
• We have replaced our external guest feedback provider with the objective of increasing the quality of information received, as well as improving the response rate.
Digital, technology and data developmentOur plans to further improve our technology and digital presence to the benefit of guests and to increase operational efficiency are in several areas:
• We will invest an additional £1 million into a new and innovative digital marketing programme in 2020 targeted at improving the social media relationship between our pubs and local guests. Social media is a key mechanism to build traffic in pubs, facilitating communication about events, activities and promotions.
• As part of an ongoing plan to simplify the customer journey in 2019 we introduced a new online table booking system ‘Book Your Table’. In 2020, we will introduce more flexible payment facilities enabling guests to pay from mobile devices, together with a ‘digital tab service’ which will allow for tabs to be opened securely.
• The implementation of our new EPOS system is substantially complete, and will conclude in 2020. We are already seeing clear operational benefits both from a guest facing perspective and efficiency improvements in our back-of-house operations.
• In 2020, we are rolling out a new in-house developed labour scheduling system to facilitate improved labour allocation.
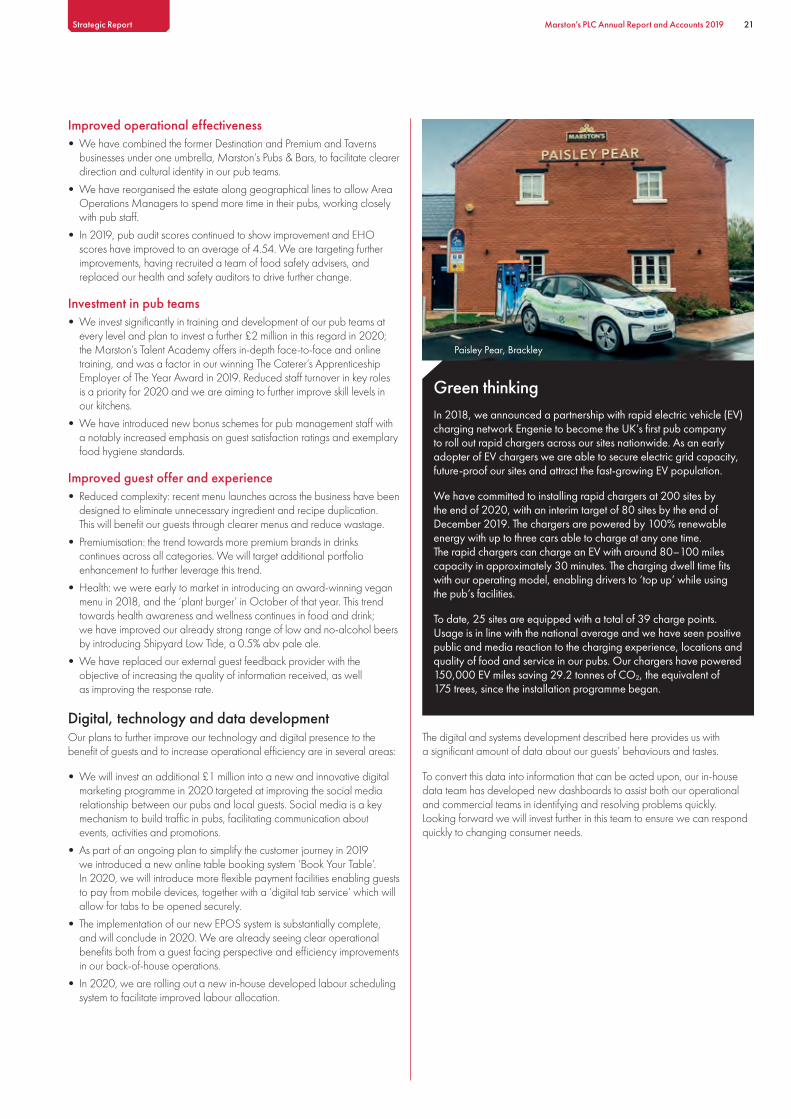
Green thinkingIn 2018, we announced a partnership with rapid electric vehicle (EV) charging network Engenie to become the UK’s first pub company to roll out rapid chargers across our sites nationwide. As an early adopter of EV chargers we are able to secure electric grid capacity, future-proof our sites and attract the fast-growing EV population.
We have committed to installing rapid chargers at 200 sites by the end of 2020, with an interim target of 80 sites by the end of December 2019. The chargers are powered by 100% renewable energy with up to three cars able to charge at any one time. The rapid chargers can charge an EV with around 80–100 miles capacity in approximately 30 minutes. The charging dwell time fits with our operating model, enabling drivers to ‘top up’ while using the pub’s facilities.
To date, 25 sites are equipped with a total of 39 charge points. Usage is in line with the national average and we have seen positive public and media reaction to the charging experience, locations and quality of food and service in our pubs. Our chargers have powered 150,000 EV miles saving 29.2 tonnes of CO2, the equivalent of 175 trees, since the installation programme began.
21
Paisley Pear, Brackley
The digital and systems development described here provides us with a significant amount of data about our guests’ behaviours and tastes.
To convert this data into information that can be acted upon, our in-house data team has developed new dashboards to assist both our operational and commercial teams in identifying and resolving problems quickly. Looking forward we will invest further in this team to ensure we can respond quickly to changing consumer needs.

Our Strategy continued
2. Operating a ‘best in class’ beer business with a wide range of premium and local brands and great service.Our Brewing business has a vision to be the UK’s leading beer business with premium brands that are loved and demanded by customers and consumers. Its strategy is based around five strategic pillars of beer and brands, customers and consumers, supply chain, service and people that provide a framework for its forward-looking approach.
Brewing
Marston’s brewing business achieved good growth in 2019 against very strong comparatives which included the benefits of a World Cup and hot summer. This strong performance reflects underlying strength in wet-led pubs and the wide range of consumer choice from our owned and licensed brands within our extensive beer portfolio.
KPIs• Total own ale – market share
• World beer – market share growth
• On time in full (retail and logistics)
Progress to date• Total volume up 1%
• New 15 year licence agreement with Shipyard
• 2.5 million composite barrels of beer delivered to one in four UK pubs
• Best Ale Supplier – Readers Choice Awards 2019
• Hobgoblin IPA, World’s Best English Style IPA – World Beer Awards
• Estrella Damm, Best Beer Brand – The Restaurant Magazines Readers Choice Awards
Exploiting the growth segments in the beer marketThere are positive trends driven by consumers seeking a wider choice of beers with local provenance and taste, particularly within the craft beer segment where Marston’s excels. IPAs, including US craft beers and craft keg beers, are increasing in popularity and non-alcoholic beers are in significant growth from a small base.
The off-trade continues to grow in both absolute terms and in share of the total drinks market. The strongest growth is in premium bottled ale where we are market leader, and canned craft beer.
Our strategy has anticipated many of these trends. In the last ten years, we have achieved a fourfold increase in turnover and profits have doubled as we have increased our market share. Our market position continues to strengthen with a 14% share of the total ale market, 24% of the premium ale market in the on-trade and 25% of the premium ale market in the off-trade.
Sustainable long-term growth of local, national and global portfolio of brandsOur ale portfolio has been enhanced significantly through acquisitions. Wainwright, acquired in 2015, is our fastest growing cask ale brand and in 2017 the acquisition of Bombardier, Young’s and Courage provided distribution opportunities in London and the south of England, as did McEwan’s in Scotland. These acquisitions enhanced an already strong and unrivalled core brand range including Marston’s, Banks’s, Jennings, Wychwood and Ringwood.
Hobgoblin remains our biggest ale brand and the ‘unofficial Beer of Halloween’. We continue to evolve the brand with the introduction of Hobgoblin IPA which was awarded the ‘Best IPA in the World’ in the 2018 World Beer Awards. We achieved a total of ten Gold, Silver or Bronze medals in 2019, including 61 Deep winning the World Beer Award for golden beers.
In addition to our ale portfolio, Marston’s has exclusive UK licences for USA craft beers including Shipyard and Founders; world lagers including Estrella Damm, Warsteiner and Kirin; and Kingstone Press Cider. We have renewed the Shipyard licence for a further 15 years. These brands have been important growth drivers and have supported our geographical expansion in the independent free trade.
Priorities for 2019/20• Continue growth and distribution of our core own-brewed brands
• Continue insight-driven innovation at an even greater pace
• Build on our growth in licensed world beers
• Focus on class-leading customer support and service
The Boat RaceThis year, one of our largest growing beer brands, Wainwright, became The Official Beer of the Boat Race, a four mile battle along the River Thames between Oxford and Cambridge Universities.
Our investment in a three year agreement is an important element of our plan to develop national awareness of Wainwright beer. From its historic heartland in the Lakes, Wainwright has continued to expand its geographic reach and it is currently the UK’s No.1 Golden Cask Ale.
The Boat Race is a popular spectator event watched by millions of TV viewers and several hundred thousand visitors who line the banks of the Thames. The Wainwright Fan Park experience and wider brand activation enables us to promote our ‘Find Your Mountain’ brand campaign – engaging our customers with on-pack and in-outlet promotions – that celebrate this partnership and has increased our trade distribution.
22 Marston’s PLC Annual Report and Accounts 2019

Our brands are also demanded globally, with exports now accounting for around 10% of our own-brewed beer sales. We export 19 brands to 61 countries, including our six key markets of Russia, Canada, France, Italy, Germany and the USA.
Our marketing strategy is underpinned by a combination of both national and local marketing activity, with a focus on digital, print media and sports sponsorship. At a local level we have long standing sponsorships at the New Forest Show, Henley Regatta and Keswick Jazz Festival, and we operate highly acclaimed brewery tours across our breweries.
Sports sponsorship includes a recent five year extension to the beer supply into Lord’s Cricket Ground, and Wainwright sponsorship of the 2019 Oxford and Cambridge University Boat Race, both of which provide us with a platform to showcase our brands in both London and on a national basis.
Recognised as best in class by our customers, delivering a complete customer experience solutionWe pride ourselves that our customers in both the on-trade and off-trade value our market leading position and insight. We leverage our knowledge of the beer market with our customers to improve their offers, receiving supplier awards from several of our major customers. Our annual On-Trade and Off-Trade Beer Reports are valued by our customers and the industry generally.
Deliver to UK pubs
1 in 4World class supply chain delivering highest quality at optimal cost in brewing and logisticsOur beer business provides brewing, packaging and distribution services for a wide range of customers, in addition to our own pubs. Three of our six breweries are British Retail Consortium ‘A’ rated or above. We now distribute to around a quarter of the 46,000 on-trade outlets in the UK and we recently opened a new distribution facility in Thurrock, in addition to the 11 depots we have nationwide, to further enhance our distribution capability.
In addition to the new business generated in 2018 as distributor to Punch, Hawthorn and Brakspear, we have secured additional distribution agreements with New River, Trust Inns and Young’s.
The Marston’s brewery in Burton-upon-Trent is our centre of excellence for packaging both bottled and canned beers. The completion of the new canning line in 2018 has further improved our canning efficiency and opens up more customer opportunities in addition to bottling. We currently package a significant portion of the UK premium bottled ale market.
This strong foundation in brewing and logistics excellence, together with sensible investment in our business makes us well placed to participate in continued consolidation of the UK beer supply chain.
New 15 year licence agreement signed with Shipyard We have reached a new long-term trade agreement with Shipyard Brewing Co. who are based in Portland, Maine. The new multi-million pound agreement for 15 years renews the partnership between the two companies and extends it until 2034. This next phase of our partnership will cover exciting new product development plans for 2020 and beyond. The collaboration, which already has a 12-year history, has gone from strength to strength as the popularity of USA styled craft beers has grown in the UK.
Shipyard American Pale Ale, the first beer to be brewed solely in the UK for Shipyard, was permanently available in 2013 and has gone on to be the UK’s biggest selling craft keg beer and Shipyard IPA continues to grow in the off-trade. In June 2019, Marston’s launched Low Tide, Shipyard’s first low-alcohol alternative, a 0.5% abv pale ale, into the UK market. This has improved our already strong range of low and no-alcohol beers.
Supply chain capability increasing business opportunities During the year, we were awarded retail distribution contracts with an additional three national pub companies: Young’s, Trust Inns and New River Retail, each of which had fully transitioned into our supply chain by March 2019. Ongoing investment in our supply chain infrastructure and IT systems has increased our capacity to service the additional volume from these agreements; we are now delivering to around 1,000 more pubs across the country.
Competing against major national and international drinks logistics companies, we secured each contract as a result of our industry-leading customer service, supply chain efficiency and our extensive range of beers, cider, wines, spirits and minerals. Increasing our nationwide logistics capability enables our customers to offer more of our category-leading own and world beer brands to consumers.
23Marston’s PLC Annual Report and Accounts 2019Strategic Report

General Manager
Head Chef
32.9%
19
28.3%
18
26.3%
17
64.7%
19
72.2%
18
59.3%
17
Our Key Performance Indicators
We have reviewed our financial and non-financial KPIs during the year, introducing new measures to help us stay focused on our strategic objectives and align remuneration to performance.
Financial
Pubs and bars
Underlying earnings per share (EPS)Why we have chosen this KPIA widely used profitability and valuation measure.
How it links to:Strategy – an important indicator of profitability
Risk – market/operational, business continuity and political
Remuneration – LTIP measure
19
Net cash flow (NCF) Why we have chosen this KPIOur objective is to reduce borrowings by at least £200 million by 2023. This will be achieved through a combination of earnings growth, reduced capital expenditure and increased disposal activity. The most appropriate measure of our progress in achieving this target is through the NCF measure.
How it links to:Strategy – a measure to track cash generated and available to reduce debt
Risk – business continuity, political and financial covenants
Remuneration – LTIP measure
CROCCE Why we have chosen this KPIA key driver of shareholder value and reflects progress made on investments, disposals and profitability of our core estate. How we calculate CROCCE is shown on page 28.
How it links to:Strategy – improving the returns from our assets is an indicator of the quality of our estate
Risk – market/operational, and business continuity
Remuneration – impact on earnings and profit
Like-for-like salesWhy we have chosen this KPIThe best indicator of our pub performance against the market (based on the Coffer Peach Business Tracker).
How it links to:Strategy – measures organic sales growth in our pubs reflecting the quality of our offer
Risk – market/operational business continuity and political
Remuneration – impact on earnings and profit
Critical role turnoverWhy we have chosen this KPIOur General Managers and Head Chefs have the biggest impact and influence over pub performance.
How it links to:Strategy – our competitive advantage comes from our people
Risk – our people, food safety, health and safety
Remuneration – indirect impact on earnings and profit
Happiness scoreWhy we have chosen this KPIThe barometer by which we measure our guests’ satisfaction.
How it links to:Strategy – vital for growth and essential for retaining guests
Risk – market/operational, food safety, health and safety, our people
Remuneration – impact on earnings and profit
In October 2019, we launched a new guest satisfaction survey to accurately record guest satisfaction at all our pubs. We will start reporting on this from next year.
0.9%
19
0.6%
18
1.1%
17
13.5p
19
13.9p
18
14.2p
17
£(10.5)m
19
£(61.2)m
18
£(57.4)m
17
10.4%
19
10.3%
18
10.7%
17
24 Marston’s PLC Annual Report and Accounts 2019

Two key components to our strategy:1 Operating a high quality pubs and rooms business offering great places to drink, eat and stay.
2 Operating a ‘best in class’ beer business with a wide range of premium and local brands and great service.
Beer business∆
Group
Total own ale – market shareWhy we have chosen this KPIKey indicator of the success of our brands.
How it links to:Strategy – a measure of the success of our own brands
Risk – business continuity, our people
Remuneration – impact on earnings and profit
World beers – market share growthWhy we have chosen this KPIReflects the volume of sales of our world beers within the Premium lager category in the on-trade and off-trade.
How it links to:Strategy – a measure of our growth in this market
Risk – business continuity, political
Remuneration – impact on earnings and profit
Employee engagementWhy we have chosen this KPIGreat customer service and improved business performance comes through engaged and enabled employees.
How it links to:Strategy – a great customer experience is reliant on the quality of our people
Risk – our people, food safety, health and safety
Remuneration – impact on earnings and profit
FTSE4Good ESG scoreWhy we have chosen this KPIConsolidated external metric of key sustainability factors.
How it links to:Strategy – important to the long-term sustainable success of our business
Risk – business continuity, food safety, health and safety, our people
Remuneration – indirect impact on earnings and profit
On time in full (retail and logistics)Why we have chosen this KPIDemonstrates our focus in excelling at customer service.
How it links to:Strategy – a measure of the quality of our service offer
Risk – business continuity, health and safety, information technology, our people
Remuneration – impact on earnings and profit
14.2%
19
14.0%
18
94.6%
19
95.5%
93.6%
18
95.4%
Retail
Primary
Engagement
Enablement
Benchmark
6863
19 18*
7368
17
6965
19 18*
7665
17
2.5%
19
2.6%
18
2.7
19
2.5
18
2.4
17
*
∆
In 2018, we decided not to undertake an employee engagement survey as we wanted to maximise the opportunity to embed action planning put in place from the 2017 survey, maximising the return on our investment. As a result we are not able to provide any like-for like comparisons for 2018.
Source: BBPA Market Share Report 2019 Source: BBPA Market Share Report 2019
Owing to the acquisition of CWBB in 2017, and other major distribution contracts, it has not been possible to provide meaningful comparatives for 2017.
See page 18 for more on Our Strategy
See page 31 for more on Our Principal Risks
25
See page 54 for our Remuneration Report
Marston’s PLC Annual Report and Accounts 2019Strategic Report

Group Operating and Financial Review
Group performanceTotal underlying revenue increased by 2.9%. This reflected the positive impact of new openings and pub acquisitions and like-for-like sales growth in our pubs, and growth in brewing helped by new distribution contracts with New River, Trust Inns and Young’s.
Underlying EBITDA of £221.9 million (2018: £222.6 million) was maintained compared to last year and operating profit was £178.7 million (2018: £182.5 million). Operating profit per pub was in line with last year; EBITDAR per pub (adjusting for sale and leaseback agreements) increased by 1%.
Group operating margins were 0.8% behind last year. Cost challenges remain a significant issue for the sector, particularly people and property costs. In addition, operating margin was impacted by converting pubs to franchise style agreements and the impact of the acquisition of 15 community pubs in the first half-year.
Underlying profit before tax was £101.0 million (2018: £104.0 million). Basic underlying earnings per share for the period were 13.5 pence per share (2018: 13.9 pence per share).
On a statutory basis, the loss before tax was £20.0 million (2018: £54.3 million profit) and the loss per share was 2.8 pence per share (2018: 7.1 pence per share profit). The year-on-year change principally reflects a non-cash impairment charge from the revaluation of certain properties and the adverse impact on the mark-to-market of our interest rate
swap arrangements as a consequence of well-publicised lower gilt yields. Non-underlying items before tax were £121 million, of which £112 million were non-cash items, described in further detail below.
Operating cash flow of £195.6 million was £13.2 million higher than last year. The increase principally reflects improvements in working capital in the period.
Net debt at the period end was £1,399 million (2018: £1,386 million) reflecting investment in new sites during the course of the year. Fixed charge cover remains strong at 2.5 times, in line with last year. Cash Return on Cash Capital Employed (CROCCE) was 10.4% up 0.1% versus 2018.
The proposed final dividend of 4.8 pence per share provides a total dividend for the year of 7.5 pence per share, in line with 2018. Dividend cover is 1.8 times. In the medium term, our dividend policy remains to maintain cover of around 2 times.
Destination and PremiumTotal revenue increased by 2.1% to £460.1 million reflecting the performance of our new-build pub-restaurants and growth in like-for-like sales. Underlying operating profit was £87.1 million (2018: £89.4 million). Profit per pub is 4% down compared to last year.
Total like-for-like sales were 0.1% ahead of last year, principally reflecting positive drink and accommodation sales, offset by weaker food sales.
Reported underlying operating margin of 18.9% is slightly below last year, reflecting increased margin investment and cost increases in labour, business rates and energy costs.
TavernsTotal revenue increased by 3.9% to £324.1 million, principally reflecting like-for-like sales growth in the year in our managed and franchised pubs. Operating profit was up 0.2% on last year reflecting growth in the core business offset by disposals and £0.7 million of opening costs for the new pub acquisitions described above. Profit per pub was up 2% on last year.
In our managed and franchised pubs, like-for-like sales were up 1.9%.
Underlying operating margin was 1.0% below last year at 26.6%, reflecting cost increases, the continued impact of franchise conversions, and increased rent and opening costs from the Aprirose acquisition.
BrewingTotal revenue increased by 3.1% to £389.3 million, principally reflecting volume growth in our core business and the benefits of the new distribution contracts in the year. Underlying operating profit increased by 1.9% to £32.6 million.
Underlying operating margin of 8.4% was broadly in line with last year.
Underlyingrevenue
Underlyingoperating profit Margin
2019 £m
2018 £m
2019 £m
2018 £m
2019 %
2018 %
Destination and Premium 460.1 450.7 87.1 89.4 18.9 19.8Taverns 324.1 312.0 86.3 86.1 26.6 27.6Brewing 389.3 377.7 32.6 32.0 8.4 8.5Group Services – – (27.3) (25.0) (2.3) (2.2)Group 1,173.5 1,140.4 178.7 182.5 15.2 16.0
“ Our debt reduction strategy is underpinned by clear capex reduction
26
and disposal plans.”
Marston’s PLC Annual Report and Accounts 2019

Group ServicesCentral costs as a proportion of turnover were 0.1% higher than in 2018. Absolute costs increased reflecting inflationary pay increases, the impact of both the apprenticeship and pub code levies, and higher training and IT costs.
TaxationThe underlying rate of taxation of 15.2% in 2019 (2018: 15.5%) was below the standard rate of corporation tax due to (i) significant deferred tax movements in the year at the future enacted rate of 17%, (ii) a deferred tax benefit created by the retention of capital allowances on fixtures in property disposals and (iii) a prior year deferred tax credit arising from rollover relief claims in respect of capital gains, where the reduction in tax base cost of property is offset by previously unrecognised indexation.
Total tax contribution
£528.8m
Duty £256.1m
VAT £168.1m
Employee payroll £39.8m
Business rates £32.9m
Employee payroll taxes £17.5m
Corporation tax £9.0m
Other £5.4m
Total £528.8m
Pensions The deficit on our final salary scheme was £36.4 million at 28 September 2019 which compares to the £15.6 million surplus at last year end. This movement is principally due to the increase in liabilities as a consequence of the significant decrease in corporate bond yields in the period.
Non-underlying itemsNon-underlying items before taxation were £121 million, of which £112 million were non-cash items, consisting of a £72.2 million charge to operating profit and a £48.8 million charge to finance costs. A net non-underlying tax credit of £17.4 million has also been recognised.
Items recognised in the year included the following:
• The impairment of underperforming Destination and Premium properties in the period, which resulted in a £43.4 million charge to the income statement.
• A non-cash £48.7 million net loss reflecting interest rate swap valuation movements. Most of these movements would historically have been recognised in the hedging reserve – clearly any increase in gilt yields would result in a positive impact on the income statement.
• A write-off of acquisition and development costs of £9.9 million in respect of properties that will no longer be purchased/developed and £3.9 million of old EPOS equipment due to the rollout of the new system across the estate.
• A charge of £2.3 million in respect of the change in the rate assumptions used in calculating our onerous lease provisions.
• Reorganisation and integration costs of £8.1 million, principally from the integration of the Charles Wells beer business – this Charles Wells integration process is now complete and no further costs are expected to be incurred.
• A pension scheme past service cost of £4.6 million in respect of Guaranteed Minimum Pension equalisation.
Capital expenditure and disposalsCapital expenditure was £133.8 million in the year (2018: £162.7 million) including £50 million on new pubs. We expect that capital expenditure will be around £90–95 million in 2020.
Cash proceeds of £49.8 million have been received from the sale of pubs and other assets, including £35 million of leasing transactions. Disposal proceeds of around £70 million are anticipated in 2020, an increase in the guidance provided at the Interim Results in May, and a targeted net cash inflow of £45–55 million over the next year.
Financing and financial strategyOur debt structure is long term, secured on our 91% freehold estate, with interest rate exposure hedged using interest rate swaps.
The Group has a £360 million bank facility to March 2024. This facility, together with a long-term securitisation of approximately £745 million and the lease financing arrangements described below, provide us with an appropriate level of financing headroom for the medium term. The Group has sufficient headroom on both the banking and securitisation covenants and also has flexibility to transfer pubs between the banking and securitisation groups.
In recent years, the Group has entered into lease financing arrangements which have a total value of £358 million as at 28 September 2019. This financing is a form of sale and leaseback agreement whereby the freehold reverts to the Group at the end of the term at nil cost, consistent with our preference for predominantly freehold asset tenure. The agreements range from 35 to 40 years and provide the Group with an extended debt maturity profile at attractive rates of interest. Unlike a traditional sale and leaseback (before IFRS16), the associated liability is recognised as debt on the balance sheet due to the reversion of the freehold.
Operating cash flow of £195.6 million is £13.2 million ahead of last year.
For the period ended 28 September 2019, the ratio of net debt before lease financing to underlying EBITDA was 4.7 times (2018: 4.6 times). It remains our intention to reduce this ratio over time.
During the year, we set out a commitment targeting a £0.2 billion reduction in net debt by 2023. Thereafter, we expect to operate a business that generates consistent net cashflow, after dividends, of at least £50 million per annum. The achievement of this will provide us with the optionality to continue to reduce the Group’s overall levels of debt or, alternatively, inject additional growth investment into the business.
As a consequence of this strategy, our focus is on the following:
• Continued deferral of new-build pub investment for the time being.
• Increased focus on improving performance and returns from the existing pub and beer business through the reallocation of some capital expenditure away from new pub investment to the operational initiatives described on pages 19 to 23.
27
Future pub reportingFollowing a reorganisation of the pub operational and commercial structure, the business is no longer operated as Destination and Premium and Taverns segments. As a consequence of this, from financial year 2020 we will be reporting our pub business under a single ‘Pubs and Bars’ segment to reflect this change. Strategically this enables us to operate the pub estate in a more flexible manner, permitting quicker changes in format where required. In addition, our operational structure is now more geographically, rather than format aligned, enabling area managers to focus on local competition across all pub types.
Marston’s PLC Annual Report and Accounts 2019Strategic Report
Group Operating and Financial Review continued
• The disposal of £150 million of certain non-core assets in 2020–23.
• Through improvements relating to the final salary pension scheme (which has a modest deficit that is expected to reduce in the next two years subject to gilt yields), and the costs of servicing the securitised debt.
Our progress to date towards these targets is encouraging, we are currently ahead of schedule in our overall debt reduction plans and we are reviewing the extent to which we can accelerate the achievement of this.
Reduction in interest payments: we have successfully reprofiled the swap interest payments within the securitisation. This benefit has been slightly offset by an increase in the cost of the liquidity facility. We expect the net reduction in interest payments to contribute to at least £3 million of interest savings per annum for the next five years compared to our original plans. Importantly, this reprofiling has not incurred any swap break costs.
Capital expenditure reduction: having reduced capital expenditure by around £30 million in 2019, we are targeting a further £40 million reduction in 2020 principally reflecting lower levels of new-build expenditure. Our organic capital expenditure will be £80–90 million reflecting a commitment to improving the quality of our existing pub estate and generating further growth from this portfolio. We expect capital expenditure to reduce by a further £10–15 million in 2021.
Disposals: our guidance for 2020 is at least £70 million and we are targeting at least £150 million of disposals in the period 2020–23 in total.
Maintain dividend: the Board is committed to maintaining the dividend at the current level during this period of debt reduction focus.
Lease accountingThe Group will adopt IFRS 16 ‘Leases’ in its financial statements from the start of the new financial year.
The main effect of this new accounting standard is to bring all leases ‘on balance sheet’ for lessees. This means that the Group will have to recognise a lease liability within borrowings in respect of the majority of its existing operating leases along with either a right-of-use asset in property, plant and equipment or a finance lease debtor (for some sublet properties). The rental payments/receipts currently charged to the income statement will be treated as repayments of the lease liability/finance lease debtor and instead the income statement will include depreciation of the right-of-use asset and interest on the lease liability/finance lease debtor.
The Group will follow the modified retrospective approach in IFRS 16 and will also take the option to measure the right-of-use assets as if IFRS 16 had always applied but using the Group’s incremental borrowing rate at the date of initial application.
It is expected that upon adopting IFRS 16 and making related accounting policy changes on 29 September 2019, the Group’s borrowings will increase by around £285–310 million and net assets will reduce by around £45–55 million.
Assuming there are no significant changes to the portfolio of leases held by the Group as at 29 September 2019, it is expected that profit after tax for the period ended 3 October 2020 will be around £3–7 million lower. There will be no impact on the overall net cash flow of the Group.
Andrew AndreaChief Financial and Corporate Development Officer
CROCCE 2019
Balance£m
Depreciation£m
Revaluation£m
Adjusted£m
Non-current assets:Goodwill 230.3 230.3Other intangible assets 88.5 6.3 94.8Property, plant and equipment 2,350.4 184.4 (598.9) 1,935.9Other non-current assets 9.3 9.3Current assets:Inventories 43.6 43.6Assets held for sale 1.7 1.7Trade and other receivables 90.9 90.9Liabilities:Creditors* (273.2) (273.2)Cash capital employed 2,541.5 190.7 (598.9) 2,133.3EBITDA 221.9CROCCE 10.4%
Free cash flow2019
£m
Net cash inflow from operating activities 195.6Interest received 0.5Interest paid (74.4)Arrangement costs of borrowings (1.1)Purchase of own shares –Free cash flow 120.6
*Creditors comprise trade and other payables, other non-current liabilities and provisions for other liabilities and charges.
28 Marston’s PLC Annual Report and Accounts 2019

Non-Financial Information Statement
To summarise our compliance with the Non-Financial Reporting requirements on environmental, employee and social matters we have set out below the Group’s approach, related policies and monitoring in the five areas covered by the requirements, together with signposts to other relevant sections of the Annual Report and Accounts or our corporate website.
EnvironmentWe continue to strive towards reducing our environmental impact and take our responsibilities very seriously. We continually look for innovative and technological solutions to reduce the use of resources, minimise waste and increase efficiency, and we set targets aimed at achieving continual improvements. Our Environmental policy sets out the Group’s approach to reducing our impact and all our employees play a part in this. Every year we engage the services of an energy professional to measure our emissions and highlight areas of improvement. We have been encouraged to see that this year’s total CO2 emissions have decreased despite an increase in revenue. We are required to target and monitor our environmental performance across a number of regulatory schemes including our brewing industry climate change agreement, EU Emissions Trading Scheme and the Streamlined Energy and Carbon Reporting regulation.
• Environmental policy and greenhouse gas emissions – page 74
• Targets and performance – Corporate Responsibility report – page 37
Marston’s PLC Annual Report and Accounts 2019Strategic Report
• Environmental report – www.marstons.co.uk/responsibility
EmployeesThrough our people, our purpose is to operate high quality pubs and lodges and a ‘best in class’ beer business. Our ambition is to enable and inspire our people to be their best.
We aim to attract and retain the very best talent across all levels. We offer learning, development and career opportunities for all who play a part in achieving our vision – an aspiration we can only realise through our people.
We want Marston’s to be a great place to work for all our people, creating happy, memorable and meaningful experiences to make our business successful. We aim to provide a safe working environment and our code of conduct, The Marston’s Way, sets out our expectations of employees to ensure we run our business in an ethical and responsible manner.
• Business Model – People resource – page 12
• Equal Opportunities policy – www.marstons.co.uk/responsibility• Gender Pay Gap report – www.marstons.co.uk/responsibility• Health and Safety policy – www.marstons.co.uk/responsibility• People risk – page 33
• Health and Safety risk – page 32
• Engagement and enablement – page 25
Social mattersWe are proud that our pubs and breweries are an integral part of our communities and we believe that these relationships are crucial to the long-term sustainable success of our heritage in beer and pubs. We create employment and engagement in our local communities and actively involve ourselves in pub community events and charitable causes, matching fund raising through our charity schemes. Our breweries all hold open events, provide tours and retail shops as a way of engaging and communicating
with their local community and our brewery teams get involved in local events and fundraising.
We recognise the importance of helping people to make informed decisions regarding alcohol consumption, increasing awareness of harmful levels and providing access to factual advice. We do this by being a sponsor of Drinkaware, an independent UK-wide alcohol education charity, and promoting them on our website.
• Business Model – page 8
• Corporate Responsibility report – page 37
• Alcohol awareness – www.marstons.co.uk/responsibility
• Information on charitable causes we have supported is available at www.marstons.co.uk/responsibility
Human rightsWe are committed to respecting and upholding the human rights of all people and we recognise the rights of any person connected with our business. We recognise our responsibility to identify and address potential or actual human rights infringements linked to the products and services we provide. We encourage our suppliers to uphold the same standards that we apply to ourselves and we conduct checks, audits, questionnaires and ethical searches as part of our new supplier due diligence. Our Human Rights policy is communicated to all our employees and is linked to our code of conduct, The Marston’s Way. We have become full members of SEDEX this year, allowing us to increase the depth of our ethical searches on suppliers and the accountability of our suppliers in fighting modern slavery. A secure digital environment is essential to safeguard personal data and we continually test the robustness of our systems including the threat from a cyber attack.
• Human Rights policy
• Group purchasing policy
• Supplier charter
• Modern Slavery Statement
• Data privacy policy
• IT risk – page 33
Policies relating to Human Rights are available at www.marstons.co.uk/responsibility linked to our code of conduct.
Anti-corruption and anti-briberyMarston’s is committed to conducting its operations in a fair and ethical manner, and adopts a zero tolerance to any form of bribery or corruption from its employees, suppliers or any other parties. We operate a Speakup line and email address to facilitate reports from our employees who wish to raise issues anonymously. Our systems allow visibility of disclosure by line management and the Board, who monitor reports regularly, and our policies are linked to our code of conduct found at www.marstons.co.uk/responsibility.
• Anti-bribery and anti-corruption policy
• Corporate Hospitality policy
• Fraud policy
We aim to comply with the Non-Financial Reporting requirements as set out in sections 414CA and 414CB of the Companies Act 2006.
29

Risk and Risk Management
Keeping risk managementat the heart of our business
The Board and Audit Committee recognise the importance of sound risk management to the achievement of our strategic objectives. Keeping risk management integral to the operation of the Group is a priority, requiring a continuous scan of threats and opportunities.
The trading environment in which our business operates is constantly changing, driven by the needs of our guests, our customers and the opportunities for growth. These external factors continually change the risks faced by our business, many of which are unavoidable and must be robustly mitigated if our strategic objectives are to be met. Such factors this year have included Brexit, food nutritional content, in particular allergens, environmental impacts and new technology. All these areas have created opportunities to further protect our existing guests and customers’ interests and attract new guests and customers.
Our risk management processes aim to identify risks before they impact upon our activities to ensure that we are in the best place to mitigate those risks, and recognise the opportunities they may bring in a competitive marketplace. We believe that our guests and customers rightly have a high expectation of our ability to maintain the quality of its products and services. Risk management is ultimately about control. For all our key risks, we identify the key mitigating controls and their ownership. Our assurance activities are focused upon those controls so we can continually gauge their effectiveness.
The continuity of our business is implicit in the relationship with our guests and customers. We have, in recent years, invested in our IT network to increase capacity and resilience to mitigate the threat of disruption. We actively consider and rehearse for unexpected scenarios which could impact upon us at short notice. This in turn informs the practices and policies which we follow and the emergency plans we adopt.
This year we launched a code of conduct The Marston’s Way, to articulate what the business expects of our employees and provides links to all the central policies that apply to all roles. We have successfully handled emerging risks during the year, and improved resilience in a number of key areas including: upgrading our computer network, data servers and cyber defence, new systems and training for data security, and by increasing the auditing of our suppliers.
Our appetite for risk The Board’s appetite for risk is a statement of the degree of risk the Group is prepared to accept in order to achieve its business strategy. The statement reflects the involvement the Board takes in matters of risk and the shared understanding of the risk management practices operated and their degree of effectiveness.
Marston’s is open to taking risks, providing those risks align with, and help us to achieve, our strategic objectives in a responsible way and within agreed parameters. Marston’s will, wherever possible, remove risks completely that pose a threat to achieving our strategic objectives. If avoidance is impossible, Marston’s will seek to mitigate risk by investing in effective controls, or by or sharing risks with a third party. These controls are managed and monitored to give assurance that the risk level is in accordance with the parameters set by the PLC Executive Committee (PLC Exec). Our overriding principle of care remains integral to achieving our strategic objectives. We continually review the risks affecting our business to ensure we maintain our responsibilities to our employees, guests, customers and the public, by guarding against threats to health, hygiene and safety as an absolute priority.
Principal risk assessment Current key risk drivers1. Macro-economic/market factorsCompetition for guests in the casual dining market has intensified in recent years. Guests have a high expectation that food is delivered with excellent service, good quality and at a reasonable value. Levels of discretionary spend is impacted by consumer nervousness about the economy, with little prospect that this will change in the near future given current political uncertainty. Our diverse range of pub formats, beer brands and the flexibility of our menus provide us with insight on changing trends and allows us to respond by adapting our guest offer.
2. Food safetyWe recognises that identification and control of the food constituents of our menu items is essential in order to provide accurate information to our guests at the point of sale. There is an increased need to ensure that accurate information on allergens is available for our guests. Public sentiment on this matter is quite rightly sensitive, with an expectation that food safety is paramount.
3. PoliticalUncertainty over how the UK leaves the EU continues to impact upon our business. Stocks of food and drink items arranged with our suppliers will alleviate any short-term disruption, however the business could be quickly impacted by a shortage of fresh meat, vegetables and fruit.
Key areas of mitigation this year1. IT data and business continuityInvestment in the resilience of our IT network has increased the assurance that our systems are adequately protected against interference, and that our IT contingency arrangements have been engineered to cope with unexpected disruption. Policies and practices have been improved in order to better protect the personal data we hold internally and contractually with the third parties that process data on our behalf.
2. Succession planningOur Performance, Career and Development Review (PCDR) process has been embedded into the business over the last three years. The PCDR supports our employees in achieving their personal objectives and provides our managers with a clearer vision of how teams can develop to meet the future demands of the business.
1. Market/operational
2. Business continuity
3. Food safety
4. Health and safety
5. Information technology
6. Our people
7. Financial covenants and accounting controls
8. Political
Impa
ct
Likelihood
7
1 4
56
3 8
Increasing risk Decreasing risk No change in risk
30
Principal risksThe principal corporate risks are shown on the matrix plotted against impact and likelihood. The position of the risk reflects the position as a result of the mitigating controls in operation.
2
Key
Marston’s PLC Annual Report and Accounts 2019

Our Principal Risks and Uncertainties
The following risks are recognised by the Board to be the principal risks that could impact upon the operation of the business strategy. This is not intended to be a complete analysis of all the risks, which may change over time.
All the principal risks listed have an impact upon the two key components of our strategy, which are:
1. Operating a high quality pubs and rooms business offering great places to drink, eat and stay.
2. Operating a ‘best in class’ beer business with a wide range of premium and local brands and great service.
Market/operational
Risk context The risk Potential impact MitigationOur revenue is dependent upon being That our pubs, brands or Reduction in sales, or heavy • Continual assessment of guest preferences:able to offer, and attract, our guests to an enjoyable experience, of high
services fail to attract guests, do not reflect changing
discounting in order to attract customers.
quality at the right price. It is reliant upon attracting back existing guests
consumer preferences, or offer poor service
and winning new guests. or quality. Equally there is a risk that our prices become uncompetitive.
market and consumer insight data.
• Continual analysis of sales performance dataof individual sites and by pub format.
• Pricing strategy, built upon careful analysisat sufficient detail of guests’ sensitivities.
• Marketing, including digital marketing campaigns.
• Cost control, including menu margin analysis.
• Investment, location and design of our pubs.
Movement: The UK economy has been in a period of uncertainty in recent years. Currently the economic drivers for our guests remain similar to previous years as the country pulls away from the EU – employment uncertainty, depreciation in the value of sterling and the threat of inflation. This creates a risk for our Group in attracting guests and setting prices at an appropriate level.
Opportunity: The market conditions present an opportunity to gain market share from other operators exiting the market, or who cannot manage the risk as effectively.
Business continuity
Risk context The risk Potential impact MitigationThe continuous operation of our business is dependent upon the
Disruption to key suppliers, particularly those closely
Disruption to trade impacting upon profit.
• Continual assessment of suppliers’ resilience and capacity.
uninterrupted running of our IT network, site links and the internet. In addition Marston’s operations are heavily dependent on the continual supply
involved with our day-to-day activities (logistics, food, drink), or shortage of commodities could
of goods and services often from significantly impactsingle sources. Marston’s operations.
The impact of Brexit on the efficiency of supply of fresh food to our business is an uncertain threat in the short term.
• Site visits to our suppliers to assess crisis planning.
• Contingency planning identifying how products or services can be substituted.
• IT defences, including dual server capacity, dualnetwork links and rehearsed recovery plans.
31
Movement: An internal audit this year of our network resilience confirmed that investment into additional links and upgraded technology has significantly reduced the likelihood of external threats impacting upon our computer operations.
Opportunity: Our business reputation for continually high quality products and services continues to grow in the minds of our customers. We have a reputation for hard work, dependency and care which helps us to win contracts and create trading relationships.
Marston’s PLC Annual Report and Accounts 2019Strategic Report

Food safety
Risk context The risk Potential impact MitigationOur guests’ need for safe and reliable Breaches of food standards Increased regulation directly • Maintain excellent levels of compliance throughinformation on the food ingredients regulations now attract affecting Marston’s, or ourwithin our products has never increased media attention suppliers, could increasebeen higher. and higher penalties. the cost of compliance.
Food hygiene is fundamental to us and Our customers trust in ourthe safety we guarantee to our guests. high standards of food
hygiene. That trust could quickly be eroded by individual incidents.
policies, training and monitoring.
• Working with our supply chain to maintainrobust systems for identifying constituent food ingredients.
• Due diligence on accepting new suppliers, monitoring and auditing.
• Tracking meal constituents all the way through to our menus and the descriptions contained therein and the accompanying allergens lists supplied to our team members and the public.
• Rigorous investigation of complaints.
• Tracking legislative changes and adapting operations.
Movement: Public concern over allergens is growing. Media coverage of the tragic consequences when allergens are unknowingly consumed have increased the public expectation that retailers should do more to protect consumers.
Opportunity: There is an opportunity for Marston’s reputation to grow in our guests’ appreciation for the safety of food. We recognise that the reliability of the information given to our team members, their training, and their care to engage with this matter is key.
Health and safety
Risk context The risk Potential impact MitigationThe safety of our customers, our Breaches of health and Significant damage • Health, safety and hygiene managementpeople and the public underpins all safety or food hygiene to reputation.our activities. We seek to attain the regulations now attracthighest levels of safety. Lapses of safety increased media attentiondamage the trust and reputation of our Group.
and higher penalties.
systems embedded.
• Dedicated safety advisers seekingcontinuous improvement.
• Regular independent expert safety audits at our pubs.
• Training of team members.
• Escalation of potential safety threats to senior operational management.
32
Our Principal Risks and Uncertainties continued
Movement: During 2018/19, we have taken steps to invest in more resource for health and safety by employing the services of three additional Regional Safety Advisers to support our pub teams.
Breaches of safety are taken seriously by all levels of our business. When our systems of control are found to be at fault we confront any failing honestly, in order to learn and build stronger processes for the future.
Opportunity: In a competitive marketplace there is an increased opportunity to be differentiated in our guests’ minds by absolute commitment to guest care, thereby building long-term trust.
Marston’s PLC Annual Report and Accounts 2019

Information Technology
Risk context The risk Potential impact MitigationOur business is very reliant upon the Threats to IT are both Reduction in the effectiveness • Anti-virus and firewall protection.Group’s IT network to communicate, operate effectively, serve our
external and internal and could result in a network
of operations, business interruption and loss of profit.
customers, process transactions and report on results.
outage, loss, theft or corruption of data or denial of service.
Regulatory fines as a result of the loss of data.
• Access control, password protection and IT policy adherence.
• Network controls and monitoring.
• Penetration testing and remediation.
• Backup procedures.
• Data recovery plans and rehearsals.
Movement: Global cyber risk has evolved in recent years, theft of personal data is becoming more common, ransomware attacks are now more widespread, and attacks are more sophisticated.
Marston’s has conducted penetration testing on its network for many years. Specific cyber risk reviews have been conducted in recent years on IT security by independent teams. We have invested in additional network and device monitoring functionality.
Opportunity: Our engagement with customers creates increasing digital marketing opportunities for which the security and continuity of our IT network, as well as the trust of our customers, is fundamental.
Our people
Risk context The risk Potential impact MitigationMarston’s operates in a very Failure to attract or retain Reduction in customer • Continual awareness of our people offercompetitive environment. There is an the best people. satisfaction levels.increasing demand for high calibre Financial targetspeople, particularly in our pubs where and strategic objectivesBrexit does have an impact tightening the labour market. The ability to achieve our strategic objectives has a heavy reliance upon the quality and training of our people.
not being met.
compared to our competitors throughparticipation in appropriate networks.
• Improved training, induction anddevelopment programmes.
• Development of Marston’s ‘People Promise’.
• Employee appraisals and development programmes – Performance, Career andDevelopment Review (PCDR).
• Employee engagement survey and identifying action points for teams.
• Increased focus on the development of our line managers to improve employee retention.
33
Movement: The sustained growth in our business has allowed for improvements in training programmes and given more opportunity for our people to progress.
Our PCDR cycle, now in its third year, has brought a common approach to people development across the Group. PCDR enhances the dialogue with employees on expectation, achievement and career progression.
Opportunity: The continual investment in our people creates an opportunity to retain and develop the most talented and committed individuals and to remain a very attractive employer when advertising roles.
Marston’s PLC Annual Report and Accounts 2019Strategic Report

Financial covenants and accounting controls
Risk context The risk Potential impact MitigationThe Group’s financial system handles a large number of transactions accurately
Breach of the covenants with our lenders.
Loss of investor confidence, and reputational damage.
• Regular detailed management accounts, budgets and forecasts.
and securely. Accurate reporting Incorrect reporting Potential loss as a result ofis key to running the business effectively, and in compliance with our financial covenants.
of financial results. Unauthorised transactions.
fraud. Breach of covenants, resulting in additional financial operating restrictions.
• Constant monitoring of financial ratios.
• Internal and external audits.
• Segregation of duties.
• Access controls within our systems.
• Levels of authority.
Movement: There are strong controls mitigating this risk to a low level. There has been no change in the risk since last year.
Opportunity: Significant new investment over the last two years in our pub financial system has created a unique opportunity to better understand our guests’ spend. We have developed our capability to analyse this data to a depth not possible before. The system has improved our ability to target offers to customers in a focused way, to roll out marketing campaigns and to price our offers to guests quickly across the whole of our pub estate.
Political
Risk context The risk Potential impact MitigationThe way in which the UK leaves the EU A no-deal Brexit will impact A ‘no deal’ scenario would • Continual assessment of supply contractsis currently uncertain. There is a risk that no deal is agreed and that there is a
upon the deliveries of supplies from the EU, in
impact upon our costs to import food and drink due
‘hard’ exit. particular for us those goods to currency fluctuation, tariffswhich we cannot stockpile and inflation. Our abilityand where there are no to export beer could alsoalternative UK supplies at the same cost level for
be impacted by new tariffs. It may be harder to secure
the quality and quantity required, namely fresh meat,
long-term agreements with our suppliers. Border delays
vegetables and fruit. could disrupt our supply chain impacting upon the availability of food and drink brands to our pubs and our customers’ businesses.The UK job market could continue to be less desirable for EU nationals which could increase the shortage of specific types of skilled workers within our market sector.
and renegotiation of terms when they fall due, to protect our business from Brexit related costs.
• Where feasible, working with our key suppliersto hold stocks in the UK of food and drink whichwould be sufficient to cover short-term disruption.
• Consider alternative sources of supply if our existing suppliers experience difficultyimporting goods.
• Review our agents and procedures for the accounting of customs duties and declarations.
• Support those employees who are EU nationals staying and working in the UK.
34
Our Principal Risks and Uncertainties continued
Movement: Marston’s recognises the disruptive effects that Brexit could have upon our business and the UK economy, particularly as the uncertainty continues to exist without a future trading agreement.
Opportunity: Brexit related risks are monitored closely by management and reported to the PLC Exec. The business is well-placed regarding the preparations it can make, and the understanding of the legal implications of trading with the EU. In 2019/20, we plan to seek independent assurance on our preparations for the transition to UK legislation and operations outside the EU once the UK has left.
Marston’s PLC Annual Report and Accounts 2019

Our Levels of Defence
1. Management ownershipOur managers are responsible for identifying risks, communicating risks and developing responses to those risks which mitigate them to a level which is considered acceptable for the business.
Governance frameworkThe Group operates within a clear set of policies established by the Board, and the PLC Executive Committee (PLC Exec). Such policies ultimately manage the criteria within which the business accepts risk. Authority is delegated through the business to ensure that management is empowered to operate effectively within a system of governance approved by the Board. Changes to policies occur, normally at the instigation of management, in response to either new threats, legislation or new opportunities.
Management are responsible for monitoring and reporting upon the effectiveness of the controls to the Board via the Corporate Risk Director. The managers’ assessment of the effectiveness of the key business controls is tested by the Internal Audit plan and reported to the Board on a regular basis.
The key features of the internal control system are:
• A clearly defined management structure operating within a framework of policies and procedures covering authority levels, responsibilities and accountabilities. The communication of policies has been improved this year by the adoption of our code of conduct, ‘The Marston’s Way’.
• Embedded risk management into day-to-day activities.
• Ensuring that our operations abide by all applicable laws and regulations.
• Continual improvement by reporting on effectiveness, recognition of weaknesses, investment, and by encouraging and rewarding achievement.
• A detailed formal budgeting process for all Group activities, with the annual Group budget and projections for future years being formally approved by the Board.
• Established procedures for planning, approving and monitoring capital expenditure and major projects designed within a sound framework of risk management.
• Board approval is needed for all major investment, divestment and strategic plans and programmes.
• At each meeting the Board reviews financial and non-financial progress towards the Group’s goals.
Marston’s PLC Annual Report and Accounts 2019Strategic Report
Control systems are designed to manage rather than eliminate risk. By their nature, such systems provide only a reasonable and not absolute defence against material errors, losses, fraud or breaches of the law.
2. Committee oversightThe PLC Exec and our beer business divisional board each meet regularly to consider how to implement the actions required for the Group to achieve its business objectives, and to monitor its risks and opportunities.
Our Operational Directors within the PLC Exec take ownership of the implementation of the business strategy, the operation of the business to meet operational and financial targets, and the design of internal controls to reduce risks. Management collects information through internal processes in order to understand fundamentally the risks and directs the response to those risks. The management committees consider, communicate and implement the decisions on risk made by the Board and the PLC Exec.
See page 43 for more information
We operate a number of committees in order to focus attention upon particular areas of risk requiring senior management attention:
Risk & Compliance Committee (chaired by the Group Secretary)
The Committee reviews the identification of the principal risks, and considers the alignment of audit and compliance testing with the risks. It also conducts a focused examination of areas where risks are significantly changing. In addition, the Committee tracks the emergence of new legislation and monitors the Group’s response to compliance.
Data Security Committee (chaired by the Group Secretary)
The protection of personal and commercial data is considered. Network protection is reported. Policies are developed and monitored to encourage best practice by employees and awareness. Legal compliance is monitored and audit test data relevant to data protection is considered.
Corporate Responsibility Committee (chaired by the Corporate Risk Director)
The ethical approach of the business is considered in all respects. The Committee defines the Corporate Responsibility priorities of the business and sets targets for the actions associated with those targets.
See page 37 for more information
Business Continuity Steering Committee (chaired by the Corporate Risk Director)
The resilience of the Group to events outside of its control is considered, and lessons learned from actual incidents or scenario tests. Consideration is given to the resilience of our supply chain and the ability of the business to seek alternative supplies at short notice. The Committee is briefed on improvements to the resilience of our IT network, its protection from interference and the plans in place to recover from any disruption.
3. Assurance governanceGroup Risk comprises of the Corporate Risk Director and the Internal Audit function. The team reports to the Group Secretary who is a member of the PLC Exec and can elevate matters regarding risk where appropriate to the Board. The Corporate Risk Director and the Group Internal Audit Manager attend the Audit Committee meetings and can raise any concerns regarding risks independently.
Enterprise Risk Management (ERM)The Corporate Risk Director, who heads the Group Risk team, operates an ERM process in order to identify, monitor and report on those risks which could impact on our ability to achieve our strategic objectives. The key risks and controls, and their ownership, are assessed more formally during bi-annual meetings with the managers.
The risks are documented in a corporate risk register, access to which is appropriately shared with the managers who own those risks. We use common risk management tools and language to engender cross functional consistency and measurement across the Group.
The effectiveness of the controls at reducing risk to an acceptable level is considered and reported to the Audit Committee.
Levels of insurance cover are managed by the Corporate Risk Director with the authority of the Board and in consultation with external advisers. New levels of insurance are considered each year in the context of changing external threats. This year we expanded our insurance cover to include cyber risk.
35

Our Levels of Defence continued
Internal AuditThe Internal Audit function is managed by the Group Internal Audit Manager, reporting to the Corporate Risk Director, and is independent from the operations of the Group. Internal audit strategy is risk based and is focused upon the greatest risks to the Group. The strategy has been approved by the Audit Committee and aims to provide a sufficient level of assurance regarding the strength of the control environment as well as supporting continual improvement in risk management.
The Internal Audit plan is produced by the Group Internal Audit Manager. The plan takes into consideration the key risks within the business, areas of increased risk and the regularity of the testing. The Group Internal Audit Manager consults with the PLC Exec and the Risk & Compliance Committee regarding areas of concern which require additional assurance. Resource and expertise is sought from an independent professional internal audit co-source for individual projects. The budget for internal audit is submitted annually for approval by the PLC Exec and the Audit Committee.
The internal audit projects are planned with the assistance of senior management and the results are reported to the business, the Risk & Compliance Committee and the Audit Committee. Our internal audit co-source assists with the projects associated with higher risks or which require specialist skills.
The Group Risk team gathers assurance during the year on a wide range of legal compliance areas, pub financial controls, pub compliance, data security and health and safety.
4. StrategicThe PLC Exec is chaired by the Chief Executive Officer and comprises of, amongst others, operational directors who are responsible for the implementation of strategy and for carrying out actions directed by Board, monitoring performance and overseeing risk management and internal control. Actions required are communicated to the senior managers of the Group.
5. Board/Audit CommitteeThe Board is ultimately responsible for the Group’s framework of governance, internal control and risk management. The mitigation of risk is delegated to the Executive Directors and other senior management. The Board is responsible for ensuring that management review and report on the effectiveness of the internal controls. The Board is also responsible for understanding the nature and extent of the principal risks, its risk appetite and the Viability Statement.
Management reporting to the Board must be in sufficient detail for the Board to assess its risk appetite in the context of the risks and opportunities, and to make informed decisions in order to accomplish the strategic objectives.
During the year, the Board has robustly assessed the risks and opportunities faced by the business, taking into account the ability of the business to achieve its strategic objectives.
Viability StatementThe Directors regularly undertake an assessment of the prospects of the Group by reference to its current and historical financial performance, the current financial position, and the principal risks as described in this Strategic Report. The longer-term strategy and business model is intended to spread the operational risk of the business. This is achieved through operating in food-led and wet-led pub businesses, accommodation and a premium beer business. This means that the Group is less exposed to a downturn in any single part of the pub or beer market.
The Board annually reviews the Group strategy, which incorporates five year financial projections of trading performance, cash flows and financing requirements. In recent years the Group has performed strongly, delivering growth whilst transforming both the pub and beer divisions into businesses well placed to meet future market challenges.
In forming our plans, the Board has visibility of:
• the sensitivities of our results to changes in either the sales or margin assumptions;
• the actions required to conserve cash in the event of a significant downturn;
• the principal areas of risk as described in this Strategic Report and the mitigating actions in place to offset those risks; and
• confirmation that there is no single material contract or activity that would affect the going concern of the business.
36
During the period, the Group extended its existing bank facility by one year to the financial period 2023/24, utilising an option included in the facility renewal last year and utilised a £40 million accordion facility to add further financial flexibility in our short-term financing. In addition, the Group received proceeds of £35 million from property lease transactions during the period, demonstrating the continued attractiveness of the Group’s pub estate. In addition, we reprofiled the interest rate swap payments within the securitisation, which will provide more headroom against the covenants within the securitisation.
The Group continues to have strong headroom against the financial covenants underpinning the financing structure with strong fixed charge cover of 2.5 times. As described in the Strategic Report, the Board has approved a £200 million debt reduction plan which will improve free cash flow to further underpin our ability to meet our financial obligations.
The Board has assessed the viability of the Group over a five year period as this is consistent with their strategy review process, as described above. Given the considerations above, the Directors confirm that they believe the Group will continue to be operationally and financially viable over the five year period.
Marston’s PLC Annual Report and Accounts 2019

Corporate Responsibility
Marston’s recognises the importance of corporate responsibility to the long-term sustainability of the business, its future growth, commercial viability and in maintaining stable relationships with stakeholders.
For this reason we align our Corporate Responsibility (CR) priorities with our strategic objectives and identify the actions taken by the Group for each CR priority. The actions have been cross referenced to the United Nations Sustainable Development Goals in order to understand the alignment of our CR agenda with global initiatives. Our CR Committee plays a central role in defining the CR priorities and tracking progress against targets set for the associated actions. The CR Committee has a wide representation of members from across the business including operations, procurement, food development, HR, risk and communications.
This year has seen good progress working to achieve the majority of our CR targets, and has seen the adoption of new targets reflecting our ambition to adapt our CR agenda as our business activities change. A vibrant CR agenda keeps our people engaged with its relevance to the business and reflects the character of the business to strive to achieve long-term, sustained success.
We remain committed and track our progress in achieving our five CR priorities:• We invest in our people
• We partner with suppliers who share our values
• We care about our guests’ and customers’ wellbeing
• We celebrate our local communities
• We reduce our environmental impact
With our CR priorities in mind, we track the actions associated with our key areas of focus which are ultimately aligned to the Group’s strategic objectives. This serves as a CR guide to the operational areas of business:
Strategic objectives
Areas offocus during
2018/19
Operating a high quality pub and rooms business offering great places to drink, eat and stay.
Apprenticeships
Training in our pubs
Talent Academy Online
Operating a ‘best in class’ beer business with a wide range of premium and local brands and great service.
Food supplier charter
Improve supplier audit programme
Supplier innovation
Healthy options on our menus
Food safety
Allergens
Support for aligned charities
Community Heroes Week
Local charities
Increasing recycling
Energy consumption
Electric car charging points
We reduce our environmental
impacts
We celebrate our local
communities
We partner with suppliers who share
our values
We care about our guests’ and
customers’ wellbeing
We invest in our people
37Marston’s PLC Annual Report and Accounts 2019Strategic Report

Why this matters to us Marston’s recognises the responsibility it has to its employees, they are its greatest asset upon which the achievement of strategic objectives is dependent. The long-term development of our people, their confidence, skills and experience, is a responsibility of the business, but also a critical requirement for sustained commercial success. The character of our Group attracts talented people to work for us and we recognise the growing importance of ESG factors, particularly to the younger generation, when choosing employment. We believe that the alignment of corporate values with individual values contributes to our people’s enthusiasm to strive for success and, ultimately, contributes to healthy customer engagement.
What we have focused upon this year• Delivering training earlier
The target for the completion of induction training for new starters in our pubs has reduced from 12 to 2 weeks. This includes all the essential knowledge on our Ways of Working, customer care, safety, food hygiene, licensing and legal responsibilities.
• Broader e-learning user base and more modules Further development of our online Talent Academy and widened its reach to employees across the business. Ability to self-author our own e-learning training courses. Over 26,000 learning on demand documents were accessed by our employees this year. To date, over 100,000 employees have received online training. Data protection training was delivered to all areas of the business and completion tracked and reported.
• Expansion in the range of apprenticeships We continue to train over 500 apprentices a year within the Group, across a range of disciplines, including all six hospitality apprenticeships, credit control, learning and development, customer service specialists, operations manager and our first senior leader Level 7 master’s apprenticeship. 18 employees within our beer business are now studying an apprenticeship in order to master their craft. This includes the second intake of engineers, in partnership with the JCB Academy, and our first Warehouse to Wheels apprenticeship. Our first logistics apprentices have progressed to Level 3 supply chain practitioner standard and are seen as our Transport Managers of the future. 60% of our apprentices are under 23 years old; our youngest is 16 and our oldest is 63.
• A year of recognition for Marston’s• Listed in the Top 100 Employers on RateMyApprenticeship, the UK’s
leading job resource for young people seeking apprenticeships.
• Hospitality Apprenticeship Employer of the Year (over 1,500 employees) at the 2019 Caterer.com People Awards.
Progress against key targets1. Performance, Career and Development Review (PCDR)Following three years of successful roll out of PCDR we intend to extend its operation to further embed it into the business. In 2019/20 our area managers will use it in their reviews with our pub managers. PCDR has proven a valuable means of engaging with our employees on their performance, expectations and future areas of development and aspiration.
2. Employee engagement and enablementOur scores this year were strong for engagement and enablement 68% and 69%; 2% above the UK average (2017: 73% / 76%). We intended to explore the reasons for the fall in score from the previous survey and work with our teams to improve on engagement and enablement.
Why this matters to us Our partnerships with suppliers are key to our success, we seek long-term relationships built upon mutual trust, understanding and profitability. Our guests rightly expect that we are diligent in our sourcing of suppliers to ensure that goods, products and services are delivered to an excellent standard. We seek suppliers who reflect our own corporate values, and can demonstrate this during the selection process, their accreditations and during the audits which we carry out. We have centralised our management of procurement and effectively govern tendering, contract reviews, authorisations and the secure transfer of data.
Marston’s PLC Annual Report and Accounts 2019
What we have focused upon this year• Reducing our supply chain carbon footprint
New partnership with Yorkshire Greens for our Premium peas which have the lowest carbon footprint for frozen peas in the industry; grown within ten miles of the factory by a partnership of over 40 family farms. Their state-of-the-art GWE Biogas plant generates electricity from the production waste for processing, packing and cold storage operation.
• Support for local businesses Marston’s is proud to be a strong partner of local family businesses. Scheff Foods, established in 1987, is a family run business based in the Birmingham area and produces a range of authentic ethnic foods. We have a long standing relationship with Scheff Foods and continue to work in partnership with them bringing the latest innovative, high quality food products to our menus.
• Supporting our supply chain moving to greener energy Our supplier Accolade Wines has installed a MW wind turbine at its site in Bristol supplying 50% of the energy to their distribution centre, the largest in Europe. Despite the restrictive regulations that govern onshore wind development in England, the local planning authority quickly recognised the contribution that the turbine would make to carbon reduction targets with strong support from the local community.
• Partnerships with technological innovators for green energy Our continued partnership with rapid electric vehicle charging network Engenie to become the UK’s first pub company to roll out 50 kW rapid chargers across sites nationwide. As an early adopter we are able to secure electric grid capacity, future-proof our sites and attract the fast-growing EV population. Usage is in line with the national average and we have seen positive media and public reaction. Our chargers have powered 150,000 EV miles saving 21.4 tonnes of CO2, the equivalent of 175 trees.
Corporate Responsibility continued
Progress against key targets1. Re-issue our pub Food Supplier Charter
38
Our Food Supplier Charter continues to be shared with our food suppliers, both current and potential, setting out our expectations on quality of product, traceability of ingredients, ethical approach, sustainable sourcing and employment rights. The 2019 update provides further detail on our expectations regarding the amount and type of packaging used and our support for Public Health England’s dietary improvement which has meant we were able to achieve our target of only using free-range shell egg over a year early.
2. Extensive food supplier auditsWith supply chains becoming increasingly globalised and complex, we are conducting deeper audits into our supply chain to ensure our standards are being maintained throughout. Our rolling programme of food supplier audits has completed over 60 audits this year. The audit protocol has been updated to ensure it is more robust and challenges key areas within our Supplier Charter.
We invest in our people
We partner with suppliers who share our values

Why this matters to us Our ability to deliver a memorable happy experience to our guests is of the highest priority. We work to ensure that our guests are in a comfortable environment, catering for the safe consumption of food and drink at the highest level. With an increased public sensitivity to allergens we have strengthened our processes to identify constituent elements of food items within our menu options. We recognise that food can be healthy as well as special for our guests, and there are innovative ways in which food can be produced to achieve this. We listen to our guests and customers’ preferences to adapt our pubs, brands and beers to satisfy changing tastes, lifestyle and curiosity. We maintain a catering hotline for our pubs every day of the year so that concerns regarding food can be immediately addressed.
Why this matters to us Our breweries and pubs are highly valued by the communities in which they are located. These strong relationships are essential for the long-term success of our pubs and form part of the heritage and character of our beer brands. We encourage our operators to participate in community initiatives such as Best Bar None, Pub Watch and Purple Flag schemes. Every year we involve ourselves in community events such as beer festivals, carnivals, coffee mornings, family fun days and carol services. We support charities and fundraising activities within our communities.
What we have focused upon this year• Menu calorie reduction
We have removed millions of calories from our menus, through the introduction of exciting new products and removing unnecessary items. For example, during the year, guests could choose garlic bread rather than automatically receiving it with certain menu choices. This year we have tasked ourselves to include at least one vegan dish, and our salads are typically below 400 calories.
• Public health targets and sugar reduction We are working with suppliers to reduce the amount of sugar in our top selling lines to bring them in line with Public Health England’s 2020 sugar reduction targets. Through extensive reformulations our ice cream supplier, Beechdean Dairies, reduced the amount of sugar in one of our vanilla ice creams. Based on average weekly sales this means our customers are consuming a staggering 180kg less sugar per week. In September 2019, Public Health England reported that average sugar content (per 100 grams) in food purchased out of the home has reduced by 4.9% since 2017 levels. We continue to work with suppliers to contribute to this encouraging trend.
• A greater range of low and no-alcohol drinks and soft drinks • We have extended the range of low and no-alcohol beers and
ciders, including the introduction of Shipyard Low Tide and the trial of Heineken 0.0 on draught.
• We offer a wider range of soft drinks in our pubs, from traditional draught favourites to bottled fruit drinks and more adult focused premium minerals and mocktails.
• We recognise the growth of the hot drinks category and have invested in new coffee machines to improve the offering to our guests. We have partnered with suppliers who have sourced our own Rain Forest Alliance accredited coffee bean.
Progress against key targets1. Children’s food strategyWe are working on improving the healthy characteristics of our children’s menus while at the same time keeping them appealing for younger taste buds. Quorn® chicken nuggets are an example of how innovation can provide more healthy alternatives without compromising on taste.
2. Drink allergensWe are extending the recording of drink ingredients which can contain allergens. We feel this is a necessary step to ensure our pub teams can respond accurately to enquiries.
3. Maintain the level of test purchases and age verification checksAll managed and franchise pubs received test purchase visits during the year.
Progress against key targets1. Encourage our pubs to engage with their local communitiesWe increased the number of pubs taking part in our Community Heroes Week to include many more of our managed pubs.
2. To match any contributions made to charities by our people through the payrollWe have matched the contributions of our employees to both the Marston’s Inns and Taverns Charitable Trust and the Marston’s Employee Charitable Fund.
Marston’s PLC Annual Report and Accounts 2019Strategic Report
What we have focused upon this year• Corporate donations to charities aligned to our business
39
Each year we donate to Pub is the Hub, which supports pubs diversifying within often small rural communities to incorporate local stores, play areas, postal services and libraries. We help fund the Youth Zone (‘The Way’) in the City of Wolverhampton which provides valuable youth services to over 2,500 young people. We have worked with The Way to provide work experiences for school children introducing them to what it is like to work in an office, brewery or pub. Our support of these charities is aligned to our own business: the many small businesses operating in our tenanted pubs and the high proportion of young people working in our pubs, for many of whom it is their first job.
• Employee involvement in charitable activities – Food for Christmas We opened up a food bank donation point in our head office before Christmas 2018 and the food donated was given to local charities. Our area managers nominated pubs that had carried out charitable activities during the Christmas period and sent them hampers to support their fundraising, packed by our office teams.
• Promoting and supporting fundraising across our pub estate – Community Heroes Week 2019
We care about our guests’ and customers’ wellbeing
Our second national Community Heroes Week took place at the end of April. This was our largest fundraising activity to date, encompassing our offices, breweries and pubs. Over 400 pubs took part with support for fundraising ideas from our pub format teams. Our head office was buzzing with activities: car washes, bake stalls, quizzes, pub games, and BBQs. Around the country our teams were involved in sponsored walks, cycle rides, volunteering, car washes and dragging a firkin along tow paths in the Midlands. All the funds raised went to different charities chosen by our head office teams and pubs.
We celebrate our local communities

Corporate Responsibility continued
Why this matters to us We believe in the importance of the reduction in environmental impact which we monitor continually for our pubs, breweries and logistics operations. We publish our emissions online at www.marstons.co.uk/responsibility. The business has developed a broad environmental agenda reporting to the PLC Exec on initiatives taken at a corporate level and at a local site level; remaining responsive to reducing environmental harm in an ever-expanding business; and developing business activity with sustainability as a key ethos.
Progress against key targets1. Increased recyclingBy moving to a paper alternative, we have reduced the amount of plastic straws in our pubs by 13 million per year – a 76% reduction. During 2018/19 we began installing cardboard balers at our pub sites. These compact cardboard into dense bales of high quality compacted cardboard, making UK recycling more viable and reducing vehicle mileage. As well as operating ‘Zero Waste to Landfill’ we have improved our food recycling: during 2018/19, 80% of sites with a food offer were recycling food waste, equating to 4,300 tonnes diverted from landfill. We are also donating surplus edible food stock from our depots and training kitchen to charity.
2. Aim to manage CO2 emissions in relation to activityOur total energy emissions have decreased this year by 3.7% reflecting the investments made, particularly on reducing electricity consumption which fell by 4.9%. Improvements include the installation of LED lighting into back-of-house areas, timer controls, voltage optimisation and the use of ambient air to cool our cellars rather than air conditioning. Completion of our Energy & Savings Opportunity Scheme review during the year has identified additional opportunities to save energy in the future.
Our future plans
We invest in people• We have launched a new Training Team plan aimed at releasing
the potential of our people and building capability for the future. This encompasses induction training, CPD, keyholder pathways, employee support, and increased digital training.
• We are currently building relationships with universities with the aim of collaborating on building a future leaders programme.
We partner with suppliers who share our values• To explore the possibility of an ingredients supplier charter for
beer production.
• We intend to further our knowledge gathering on our supply chain. We are working with SEDEX on how we can utilise their ESG database compiled on companies.
We care about our guests’ and customers’ wellbeing• To further improve our pub food offering, we will continue to seek
the views of our guests and customers and work with suppliers to deliver innovative, exciting and healthy offers with less sugar, salt and calorie content.
We celebrate our local communities• To target 600 pubs being involved in our Community Heroes Week.
We reduce our environmental impacts• Marston’s is committed to further reducing single use plastics.
For example, removing plastic bottled water from our hotel rooms would remove circa 400,000 bottles each year.
• Our Rapid Electric Vehicle Charging Network – we have committed to installing rapid chargers at 200 sites by the end of 2020, with an interim target of 80 sites by the end of December 2019.
What we have focused upon this year• Investment in energy efficiency
Since installing the new boiler in our Wolverhampton brewery, gas consumption there has fallen by 9% during the year and, over the last five years, we have reduced our gas consumption by 21%, lowering our emissions and helping to meet our breweries’ climate change targets.
• Environmental awards received this year • EMA Energy Management Awards – Energy Management Team of
the Year
• National Recycling Awards – Partnership Excellence (Commercial)
• Foodservice Equipment Journal Awards – Operator of the Year for Multi-Site Kitchen Projects
• Footprint Drinks Sustainability Awards – Sustainable Use of Water Award & Waste Prevention and Management Award
• Our water self supply licence allowing us to drive down water usage: ‘Marston’s Water’
We reduce our environmental impact
Becoming our own water retailer has allowed us to take control of billing and water data and, with increased water meter readings, ensure all sites are billed in line with consumption. We were the second company in the UK to operate a water self-supply licence in England, supplying retail services into our pub estate, breweries and offices. Self-supply has been a catalyst for wider water saving initiatives and awareness campaigns across the business, saving 135,448 pints of water per day during 2018/19. Drought intensification is anticipated to increase in the UK and it is hoped that ‘Marston’s Water’ will give us the ability to drive further water and wastewater reductions.
40
For more information see our CR report at www.marstons.co.uk/responsibility
Marston’s PLC Annual Report and Accounts 2019

GovernanceChairman’s Introduction 42Board of Directors 44Corporate Governance Report 46Nomination Committee Report 50Audit Committee Report 52Directors’ Remuneration Report: 54
Annual Statement by Chairman 54Remuneration Policy 57 Remuneration Summary 2019 65Annual Report on Remuneration 66
Directors’ Report 73Statement of Directors’ Responsibilities 76
Marston’s PLC Annual Report and Accounts 2019Governance 41

Chairman’s Introduction
UK Corporate Governance Code compliance statementThe version of the Corporate Governance Code applicable to the 2018/19 reporting period is the April 2016 UK Corporate Governance Code. The Code is available on the Financial Reporting Council’s website: www.frc.org.uk
Marston’s PLC was compliant with the 2016 Code throughout the reporting period under review, with the exception of a short period from when the Company was non-compliant with Provisions C.3.1 and D.2.1 of the 2016 Code. Robin Rowland, a member of both the Audit and Remuneration Committees, stepped down from the Board with effect from 31 July 2019. Bridget Lea joined the Remuneration Committee upon appointment, 1 September 2019, and Octavia Morley will join the Audit Committee and Remuneration Committee with effect from her appointment date, 1 January 2020. Further details are set out within the Governance Report.
Governance ReportWe have used the key themes of the Code to structure this report:1. LeadershipOur governance framework, management structure, roles and responsibilities are set out on pages 43 to 48.2. EffectivenessFor details of this year’s Board evaluation, training and induction and our approach to diversity, see pages 48 to 51.3. Shareholder relationsFor details of our engagement with shareholders see page 51.4. AccountabilityDetails of our internal processes and the report from our Audit Committee start on page 51.5. RemunerationFor details of our proposed new Directors’ Remuneration Policy and payments made to Directors during the period, see pages 54 to 72.
Dear shareholder
A key role for any Board is to establish the culture, values and ethics of the Group; setting the tone from the top. In my first full year as Chairman, I am proud to say that rather than setting the tone, the Board is able to reflect the unique and special culture that is evident across the entire Marston’s business.
Our code of conduct ‘The Marston’s Way’, launched earlier this year, recognises that our people care about the importance of running our business in an ethical and responsible manner, for the benefit of all our stakeholders, and that we are proud to be a part of Marston’s. The Marston’s Way, together with the work undertaken to evolve and clarify our belief, our purpose, our promise and our Ways of Working, further strengthens our governance framework. This framework continues to support the delivery of a long-term sustainable business.
The 2016 UK Corporate Governance Code (the ‘2016 Code’) has applied throughout the reporting period under review and, with the exception of a short period from 31 July 2019 when the membership of the Audit and Remuneration Committees did not comply with the relevant provisions, as a result of Robin Rowlands’ retirement, the Board considers that we have fully complied with the principles of the Code. Further explanation of this is set out on the following pages.
The 2018 UK Corporate Governance Code (the ‘2018 Code’) applies to the Company with effect from the 2019/20 financial year and, during the year, the Board and Committees have given consideration to the new and updated principles and provisions, recognising that the business already demonstrates many of the behaviours and practices set out in the 2018 Code. Where relevant, particularly in relation to the proposed new Directors’ Remuneration Policy, we have chosen to implement elements of the 2018 Code. We will report on the application of the 2018 Code in full, in our 2020 Annual Report and Accounts.
Board effectiveness and successionThis year we have carried out an internal evaluation; the summary of our findings, plus progress on the actions from the 2018 evaluation, are set out on page 48, together with the rationale for not conducting an external evaluation this year. This will instead be undertaken in 2020.
As announced last year, Robin Rowland stepped down from the Board in July 2019 after nine years as a Non-executive Director. I thank him for his valuable contribution to the Group during that period. Following a thorough recruitment process we were delighted to announce the appointments of Bridget Lea (with effect from 1 September 2019) and Octavia Morley (with effect from 1 January 2020) to the Board. Their appointments enhance and add to the breadth and diversity of knowledge and experience on our Board. Profiles of each Director are set out on pages 44 and 45.
Catherine Glickman, who has served as a Director of the Board since 2014 and as Chairman of the Remuneration Committee since 2017, has indicated her intention to not stand for re-election at our 2020 AGM. I would like to thank Catherine for her contribution and her valued insight during her time
Policy that will support the Group’s continued growth and development over the next three years.
Remuneration and engagement with shareholdersThe focus for our Remuneration Committee this year has been the review of our current Directors’ Remuneration Policy, last approved by shareholders in 2017. Our principles are unchanged: we aim to provide remuneration that motivates, with incentives aligned to strategy that encourage enhanced and sustainable performance, without encouraging excessive risk taking. The Committee have considered the impact of the 2018 Code on our Policy and the outcome of the policy review. Our proposed new Policy, together with details of how the current Policy has been applied during the period, are set out in the Remuneration Committee report on pages 54 to 72. In reviewing the Policy we engaged with our major shareholders to seek their views on our proposals. We thank our shareholders for their feedback and willingness to engage on these important matters.
AuditThe principal responsibility of the Audit Committee continues to be the integrity of our financial reporting and internal controls. During the year, the Committee has also overseen the process for re-tendering and selecting the internal audit co-source provision. The report from the Audit Committee is on pages 52 and 53.
The following pages provide an overview of our key governance activities, how we comply with the 2016 Code and reports from each of the Nomination, Audit and Remuneration Committees.
William RuckerChairmanwith Marston’s. Catherine leaves us with a new Directors’ Remuneration
42 Marston’s PLC Annual Report and Accounts 2019

1. Leadership
Governance frameworkThe Board
Enterprise wide-risk management Our Ways of Working
Supporting CommitteesRisk & Compliance, Business Continuity,
Data Security, Corporate Responsibility,
Treasury
Management CommitteesPLC Exec,
Marston’s Beer CompanyDivisional Board,
Disclosure Committee
Roles and Responsibilities Matters Reserved for the BoardCommittee terms of reference
AssuranceInternal controls,
auditing,legal and
regulatory compliance
Implementation of StrategyMonitoring
performance
‘The Marston’s Way’
Principal CommitteesAudit, Nomination, Remuneration
Our governance report explains how we have applied the main principles of the 2016 Code, through our governance framework, supporting procedures and the work of the Board, its Committees and management.
The role of the Board is to provide guidance and effective leadership, setting the strategic direction of the Group and overseeing management’s implementation of that strategy. The Board recognises the unique and special culture at Marston’s and looks to support and sustain it by promoting our belief, our purpose, our promise and our ways of working. The Board supports and encourages good relationships with all our stakeholders.
The governance framework facilitates the formal arrangements for sharing of information, encouraging strategic debate and facilitating informed and timely decision-making. The Board is supported by the PLC Executive Committee (PLC Exec) which comprises key members of the Marston’s management team.
The Management Committees meet regularly to oversee the implementation of strategy and monitor performance of the business. The Supporting Committees’ primary role is to provide assurance to the Board on the operation of internal controls, auditing and compliance with legal and other regulatory obligations. This framework is supported and enabled by the risk management process (see page 30), our Ways of Working and The Marston’s Way (see page 18).
Board and Committee compositionAt the date of this report, our Board comprises an independent Non-executive Chairman, a Senior Independent Director, three further independent Non-executive Directors and two Executive Directors, supported by the Group Secretary. There is a clear division of responsibility between the roles of the Chairman and the Chief Executive Officer which are set out in writing and agreed by the Board. Details of the roles and responsibilities of each Board member and the Group Secretary are set out on page 46.
Having served on the Board since December 2014, Catherine Glickman will step down from the Board following the conclusion of the AGM on 24 January 2020. As previously announced, Octavia Morley will join the Board with effect from 1 January 2020. Octavia will be appointed as Chairman of the Remuneration Committee following the conclusion of the AGM. We consider all our Non-executive Directors (NEDs) to be independent and the charts on page 45 show the balance and tenure of the Board.
Provision D.2.1 of the 2016 Code requires the Company to establish a Remuneration Committee comprised of three independent Non-executive Directors. Robin Rowland, a member of the Committee, stepped down from the Board on 31 July 2019 and, accordingly, the Company was not compliant with this provision until 1 September 2019 when Bridget Lea joined the Committee upon her appointment to the Board. No Remuneration Committee meetings were held during this period.
Provision C.3.1 of the 2016 Code requires the Company to establish an Audit Committee comprised of three independent Non-executive Directors. Robin Rowland was also a member of the Audit Committee. Octavia Morley will join the Committee upon her appointment, with effect from 1 January 2020, at which point the Company will be compliant with the equivalent provision in the 2018 Code (Provision 24). The Nomination Committee considered whether Catherine Glickman or Bridget Lea should be appointed in the interim period, given the Audit Committee meeting would be held in November with only two members. However, as it was not intended for either Catherine or Bridget to be a member of the Committee in the long term and the existing members had comprehensive knowledge of the matters to be discussed, it was agreed not to make any interim changes to the Committee membership and to explain the non-compliance in the Annual Report and Accounts. Prior to the November 2019 Committee meeting, the Chairman of the Board met with the audit partner and the Chairman of the Audit Committee to avail himself of the key points for discussion and to hear directly from the Auditors.
Matters Reserved for the BoardMain matters relate to: strategy, major capital expenditure, acquisitions and disposals, capital structure and financial results, internal controls, governance and risk management, committee membership, and terms of reference. The schedule, most recently reviewed in October 2019, is available on the Company’s website www.marstons.co.uk
43Marston’s PLC Annual Report and Accounts 2019Governance

Board of Directors
William Rucker Chairman
Catherine GlickmanNon-executive Director
William is a Chartered Accountant with experience in banking and financial services. He is Chairman of Lazard in the UK, and brings a wealth of knowledge and experience of financial markets, corporate finance and strategy to his leadership of the Board. William is also currently Chairman of the UK Dementia Research Institute. William’s City and financial experience, together with strong stakeholder management, ability to help businesses grow and his previous Chairman roles make him ideally placed to be Chairman of Marston’s.
IndependentYes
Appointed to the BoardOctober 2018
Past experienceChairman of Crest Nicholson Holdings plc Chairman of Quintain Estates and Developments Non-executive Director of Rentokil Initial plc
Matthew is currently Chief Executive of Intu Properties plc, having previously served as Chief Financial Officer from 2010 to April 2019, and is a qualified Chartered Accountant (FCA). Matthew has significant real estate and retail experience and a strong track record on the use of and recycling of capital. Matthew also has recent and relevant financial experience, enabling him to contribute effectively to the Company as the chair of the Audit Committee.
IndependentYes
Appointed to the BoardMarch 2017
Past experienceChief Financial Officer of Intu Properties plcChief Financial Officer of Gala Coral Group LimitedFinance Director of Debenhams plc
Catherine has extensive senior level executive experience in public companies, most recently as Group HR Director at Genus Plc, where she led an agenda on talent and leadership development to support growth plans. Catherine retired from Genus Plc in 2018. She is currently a Non-executive Director of Renishaw Plc, RPS Group plc and TheWorks.co.uk Plc. Catherine’s experience, including developing reward structures that align leadership motivation with group strategy and talent and leadership development, make her well placed to chair the Remuneration Committee.
IndependentYes
Appointed to the BoardDecember 2014
Past experienceGroup HR Director at Genus PlcGroup HR Director at Tesco
Bridget is Managing Director (North) at J Sainsbury PLC and has had a distinguished career working across multiple leading retail brands. Starting at Marks & Spencer in 1994, she went on to hold senior positions – spanning a wide range of disciplines including sales, operations, marketing, supply chain and digital – within retail corporates such as Body Shop International Ltd and Clarks Shoes Ltd. Most recently she was Director of Stores, Online and Omnichannel at O2 where she led the re-engineering of the store experience, development of an industry-leading digital experience and the omnichannel transformation. Bridget has been a member of the Board of Governors at Manchester University since 2018.
IndependentYes
Appointed to the BoardSeptember 2019
Andrew joined the Company in 2002 as Divisional Finance Director for Marston’s Beer Company and in 2006 he became Operations Director for Marston’s Pub Company. Andrew was appointed to the Board as Finance Director in March 2009. His role was expanded to Chief Financial and Corporate Development Officer in 2016. He is currently a Non-executive Director at Portmeirion Group PLC. Andrew is a qualified Chartered Accountant and brings to the Board a wealth of experience gained in financial and commercial roles, including strategy and leadership, risk management and mergers and acquisitions.
IndependentNo
Appointed to the BoardMarch 2009
Past experienceRoles held at Guinness Brewing Worldwide, Bass Brewers Limited and Dolland & Aitchison
Ralph was appointed to the Board as Finance Director in 1996 becoming Chief Executive in 2001. Ralph is currently the Senior Independent Director at Bovis Homes Group PLC and a Director of the British Beer and Pub Association (BBPA).
In his role as Chief Executive, Ralph brings extensive commercial, financial and general management experience in a consumer facing industry, together with a strong track record of business growth.
IndependentNo
Appointed to the BoardMay 1996
Past experienceFinancial Controller at Geest plc Treasury Manager at Bass plc
Ralph FindlayChief Executive Officer (CEO)
Andrew AndreaChief Financial and Corporate Development Officer (CFO)
Matthew RobertsNon-executive Director
Chairman Executive Directors
Board Committees
Non-executive Directors
Board Committees
Board Committees
Board Committees
Bridget LeaNon-executive Director
Board Committees
N* N
A* N RN R*
Marston’s PLC Annual Report and Accounts 201944

Carolyn is a Non-executive Director of B&M European Value Retail S.A., SSP Group plc, The Mentoring Foundation and Majid Al Futtain Retail LLC. Carolyn has a strong consumer focused background having spent over 25 years at Tesco. She is a Trustee of Cancer Research UK and a Member of the Advisory Board of Cambridge Judge Business School. Carolyn brings significant board and committee advisory experience and, through her extensive experience in marketing, in the retail industry, brings a strong consumer focus to the Board.
IndependentYes
Appointed to the BoardOctober 2014
Past experienceNon-Executive Director at Legal & General plcUK Marketing Director at TescoTrustee of the Drink Aware Trust
Anne-Marie joined the Company in 1998 as Group Tax Manager. A qualified Chartered Accountant and Chartered Secretary, she was appointed Secretary in 2004.
Appointed as SecretaryOctober 2004
Carolyn BradleySenior Independent Director (SID)
Anne-Marie BrennanGroup Secretary
Key: Board Committees
Octavia is currently Executive Chair of Spicers-Office Team Group Ltd, Senior Independent Director at Card Factory PLC and a Non-executive Director of Crest Nicholson Holdings PLC and Ascensos Ltd. Octavia has extensive experience in both executive and non-executive roles in retail and multisite companies having held various senior operational and strategic roles across all areas of retail at companies including Asda Stores Limited, Laura Ashley Holdings PLC and Woolworths plc.
IndependentYes
Appointed to the BoardAppointment effective 1 January 2020
Past experienceNon-executive Director of John Menzies PLCChief Executive Officer, then Chair, at LighterLife UK LimitedManaging Director at Crew Clothing Co Ltd Chief Executive at OKA Direct Limited
Senior Independent Director
Upcoming appointment
Octavia MorleyNon-executive Director
Group Secretary Balance between Executive and Non-executive Directors
Chairman
Executive
Non-executive
Male/female representation on the Board
Male
Female
Tenure of Chairman and Non-executive Directors
0–3 years
3–6 years
6+ years
Board Committees
Board Committees
A
A
N
R
R
Audit CommitteeA
Nomination CommitteeN
Remuneration CommitteeR
Denotes Committee Chairman*
Marston’s PLC Annual Report and Accounts 2019Governance 45

Corporate Governance Report
There is a clear division of responsibility between the roles of the Chairman and the Chief Executive Officer that are set out in writing and agreed by the Board. The key responsibilities for each Board member are set out below:
ChairmanWilliam Rucker is responsible for:
• The operation, leadership and governance of the Board.
• Safeguarding the effectiveness of the Board.
• Setting the agenda, style and tone of Board discussions with a particular focus on strategic matters.
• Ensuring each Non-executive Director makes an effective contribution to the Board.
• Ensuring, through the Group Secretary, that the Directors receive accurate, timely and clear information.
Chief Executive Officer (CEO)Ralph Findlay is responsible for:
• The performance of the Group in line with the strategies and objectives established by the Board and under powers delegated by the Board.
• Ensuring the Board is supplied with information relevant to its strategic role.
• Leading the PLC Exec and senior management in the operational and financial management of the business.
• Providing clear and visible leadership in business conduct.
• The effective and ongoing communication with shareholders.
Senior Independent Director (SID)Carolyn Bradley is responsible for:
• Acting as a ‘sounding board’ for the Chairman and an intermediary for the other Directors.
• Acting as Chairman if the Chairman is conflicted.
• Leading the Non-executive Directors in their annual assessment of the Chairman’s performance and providing feedback.
• Acting as a conduit to the Board for the communication of shareholder concerns that the normal channels have failed to resolve, or for when such contact would be inappropriate.
Chief Financial and Corporate Development Officer (CFO)Andrew Andrea is responsible for:
• Working with the CEO to develop and implement the Group’s strategic objectives.
• Managing the capital structure and projecting the long-term financial picture of the Group.
• Delivering the financial performance and timely and accurate financial reporting of the Group.
• Ensuring that the Group remains appropriately funded to pursue its strategic objectives.
• Investor relations activities (and communications to investors) with the CEO.
Non-executive Directors (NED)The roles of Catherine Glickman, Bridget Lea, Matthew Roberts and (with effect from 1 January 2020) Octavia Morley are to:
• Constructively challenge proposals on strategy.
• Contribute to the development of longer-term strategy.
• Meet with the Chairman, at least annually, without the Executive Directors being present.
• Scrutinise management performance in the delivery of strategic objectives.
• Monitor operational and financial performance.
Group SecretaryAnne-Marie Brennan is responsible for:
• Framing the agenda for the Board and Committee meetings and ensuring effective information channels within the Board and its Committees, and between senior management and Non-executive Directors.
• Advising on regulatory compliance and corporate governance.
• Facilitating individual induction programmes for Directors and assisting with their development as required.
• Communications with retail shareholders and organisation of the AGM.
• Chairing the Risk & Compliance Committee and Data Security Committee.
46 Marston’s PLC Annual Report and Accounts 2019

Management CommitteesOur PLC Exec meets on a monthly basis to review operational performance, controls and people matters; consider property proposals, capital investment and new initiatives; and to approve internal policies, governance and financial matters within the authority limits delegated annually by the Board. The Committee comprises the CEO, CFO, Managing Director (MD) of our beer company, the Director of Venture Pubs and Estates, Director of Operations for Pubs and Bars, Director of Strategy and Services for Pubs and Bars, MD of Premium Bars and Restaurants, Group HR Director and Group Secretary.
Due to the breadth and complexity of operations within our beer company division, a separate management board is in place. The MBC Board comprises the MD, Director of Finance and Customer Services, Director of Brewing, Director of Logistics, Director of Sales (Free Trade), Director of Sales (National), Director of Marketing, Group HR Director and Group Director of IT. The MBC strategy is presented to the PLC Board for review and approval annually. The extent of the MBC Board’s autonomy is determined by this strategy and the Group’s financial authority limits. The MBC Board meets on a bi-monthly basis to review the operational performance of each channel, capital investment proposals, people matters and strategic initiatives.
The Disclosure Committee, comprising the CEO, CFO and Group Secretary, meets as and when required to discuss matters arising in accordance with the EU Market Abuse Regulation, the FCA (Financial Conduct Authority) Listing Rules and the Disclosure Guidance and Transparency Rules to ensure Marston’s PLC meets its obligations.
The work of our supporting committees is described in the Risk Management section on page 30.
Board agenda and activities during the yearThe Board agenda provides the framework for the Board to shape and monitor the Group’s strategy, performance and our Ways of Working. The agenda comprises a number of regular reports providing updates on the financial and operational performance, consumer insight and share analysis. The rest of the agenda is taken up with specific items for discussion or debate, taken from a forward agenda or as required according to the circumstance. Further detail is set out in the table below. The Board met nine times during the year, which allowed sufficient opportunities to effectively challenge and monitor the Group’s progress against its strategic objectives and within the governance framework. Meetings during the year focused on the delivery of our strategic and financial plans having regard to the continuing uncertainty from a political and macro-economic perspective. Board papers are circulated well in advance of each meeting to ensure that the Directors have sufficient time to consider them before the meeting. Meetings have been held at a number of our brewery sites and pubs during the year. The Chairman introduced a programme of pre-Board presentations taking place the evening before the Board meeting, at which senior management present on various matters in greater depth. The managers then join the Board for an informal dinner allowing Directors an opportunity to further engage with the teams on the specific subject areas and more generally.
On the Board agenda
Strategy and performance
Guest and customer focus Shareholder and business operations focus
Governance and risk
Leadership and people development
Financing arrangements and debt reduction plans
Health and safety and food safety
Share price performance and investor relations
Risk and risk management Gender pay gap reporting
Operating plans and targets for 2019 (Annual Plan)
Operating plans and reviews Shareholder feedback and market perceptions
Evaluation of Board and Committee effectiveness
Executive succession planning
Consumer segmentation and consumer insight reports
Property and estate management Forthcoming AGM The UK Corporate Governance Code and other reporting obligations
People Strategy
Post investment appraisal – Charles Wells Beer Business (CWBB)
Regular Brexit updates Share register analysis Environmental and Corporate Responsibility updates
Workforce engagement mechanism
Results, trading updates and Annual Report and Accounts
The Marston’s Way
47Marston’s PLC Annual Report and Accounts 2019Governance

CommitteesThe three principal Committees of the Board deal with financial and risk matters, remuneration and succession planning. Each has its own terms of reference which are reviewed at least annually, and updated as necessary, by the Committee before they are considered and approved by the Board. Reports from each Committee can be found on pages 50, 52 and 54.
Board and Committee meeting attendanceBoard and Committee meeting attendance is shown in the table below. The Board calendar of meetings is set and reviewed at least 18 months in advance, allowing the Directors to plan their time accordingly.
– – –Name Board Nomination Audit Remuneration
Andrew Andrea 9/9Carolyn Bradley 9/9 3/3 3/3 3/3Ralph Findlay 9/9 3/3 – –Catherine Glickman 9/9 3/3 – 3/3Bridget Lea1 1/1 – – –Robin Rowland2 8/8 2/2 3/3 3/3Matthew Roberts 9/9 3/3 3/3 –William Rucker 9/9 3/3 – –
1 Bridget Lea joined the Board with effect from 1 September 2019.
2 Robin Rowland stepped down from the Board with effect from 31 July 2019.
3 Octavia Morley joins the Board with effect from 1 January 2020 and as part of her induction attended the September Board meeting.
2019 strategy day – on the agendaThe Board held this year’s annual strategy day at The Farmhouse, Mackworth, Derbyshire and were joined by the PLC Exec to consider strategy, implementation plans and people in greater depth. The key themes of the day comprised:
• Market trends, industry competition and consumer behaviour.
• Pub estate structures, opportunities to drive further improvement and cultural shift.
• Greater focus on building partnership relationships with property-based agreements.
• Factors determining the rate of growth of the beer business, the brand strategy and the importance of new product development and innovation.
• A review of the talent pipeline and an alignment of the People Strategy to the employee journey.
• Financial plans and de-leveraging opportunities.
Corporate Governance Report continued
Presentations were received from the pubs business, beer business and HR management which informed open discussions and challenge from the Board. The Board heard how the managed pub estate had undergone an operational restructure based on insight and customer segmentation work, how menus were being simplified further whilst keeping pace with consumer trends and the cultural shift to identifying purpose and delivering it. The Board discussed whether even more emphasis should be given to the cultural shift. The beer business outlined its growth plans and opportunities for greater growth; the Board challenged the ambition of the brand strategy. The HR Director presented the evolved People Strategy and the Board considered the review of pub management capability and the talent pipeline.
2. Effectiveness
The Board is responsible for ensuring that it maintains the necessary skills, experience and knowledge to discharge its responsibility for the long-term sustainable success of the Group.
CommitmentAll of our Directors are expected to allocate sufficient time to the Group to discharge their duties and responsibilities effectively and this is reviewed regularly with the Chairman as part of the annual evaluation process. Significant commitments of the Directors, outside of Marston’s, are disclosed to and approved by the Chairman prior to appointment and when there are any changes. The Board has authority, under the Company’s Articles of Association, to authorise potential conflicts of interest and to impose any conditions it sees fit. Actual and potential conflicts are reviewed by the Board on an annual basis.
Board evaluation and summaryIn considering this year’s annual Board evaluation the Directors had regard to the fact that the Chairman had yet to complete his first year in office and the Board was in the process of Non-executive Director recruitment. As such, it was considered appropriate to defer an externally facilitated evaluation until next year when the Chairman and the new Non-executive Directors will have had time to assess the operation of the Board. An internal evaluation of the effectiveness of the Board and each of its Committees was undertaken this year in a consolidated approach, led by the new Chairman. In addition to the Chairman’s own induction meetings with each Director, a questionnaire was completed by each Director which formed part of the annual meetings to discuss effectiveness and contribution. The Non-executive Directors also met without the Chairman being present to discuss his performance and the conclusions were fed back to the Chairman by the Senior Independent Director. The Chairman then summarised the comments for consideration and discussion by the Board. Agreed action points, together with an update on progress against 2018, are shown opposite.
The Chairman concluded that the Board is satisfied with its own effectiveness and that of its committees. The Non-executive Directors have welcomed the NED-only catch ups at the conclusion of each Board meeting and the opportunity to meet more of the teams at pre-Board dinners. The Board is satisfied that the financial plans to achieve our stated debt reduction are well managed.
Training and developmentFollowing on from the introduction of a more formal site visit programme last year, the Non-executive Directors have continued to spend days in trade with members of the PLC Exec and senior management to maintain their knowledge or better understand the current operational challenges for the business. The pre-Board presentations are also designed to update the knowledge of NEDs and their familiarity with the business as well as providing an opportunity to spend time with those teams more informally. In addition, the NEDs attend external technical seminars offered by professional advisers and have received internal briefings on emerging legislation as it relates to the Group, compliance and regulatory matters which this year included the 2018 UK Corporate Governance Code and new Company Reporting Regulations. The Group Secretary advises the Board on matters of governance and is available to all Directors in an advisory capacity, including the appropriateness of seeking independent professional advice.
48 Marston’s PLC Annual Report and Accounts 2019

The Company’s bespoke induction programme offers a range of information, a series of meetings with senior management and advisers and site visits. The programme is tailored to each individual Director joining the Board through input from the Chairman, CEO, CFO, Group Secretary and the new Director. Prior to her first Board meeting, Bridget Lea met the Group Secretary, CEO and CFO at the Group’s head office in Wolverhampton along with various team members as she toured the offices. This provided an opportunity to discuss the Group’s strategy, performance, finances and governance matters; as well as having a tour of Banks’s Brewery by the MD of the beer business and lunch in a Tavern. In addition, Bridget has also met with the Corporate Risk Director, our Group Head of Health and Safety and undertaken the required training in relation to GDPR and Competition Law. Bridget has had meetings with our brokers, financial PR agency, audit partner and remuneration advisers to fully brief her on, amongst other matters, the obligations of a listed company. She will also spend days in trade with each Operational Director (of the PLC Exec) visiting various pub and brewery sites and will spend time with the Group HR Director to understand the People Strategy.
Our approach to diversity (including gender diversity)The Board, through the CEO, takes overall responsibility for diversity, inclusion and equality across the Group. Catering for the preferences of our many different customers is fundamental to our business and therefore it is essential that we consider diversity in our decision-making processes. We recognise the importance that equality legislation has to play in promoting equality and eliminating unlawful discrimination and we seek to exceed our legal obligations.
In recent years, female representation in senior roles in pub management, brewing, logistics and Group Services has increased and we are committed to ensuring that this will continue. Our view has been that the best way to increase senior female representation is to ensure equality of opportunity at all levels, and that more appointments of women in junior roles will result in well qualified, experienced female talent coming through the business to take senior roles in the future. Similarly, where we recruit new candidates into our business, whilst we will always appoint the most qualified for the role, we have used this as an opportunity to bring females into senior roles.
The WeQual national awards have been launched to recognise the contribution that women one level below Executive Committee in FTSE 350 companies make to the business. The awards are designed to help drive equality in the hospitality industry. We are proud to have one individual winner in the category of Best Operator along with three individuals who have been recognised as finalists.
This year, having signed up to the Diversity in Hospitality, Travel and Leisure Charter, we have further strengthened our approach to diversity by extending our work to include a focus on inclusion. We understand
that simply having diversity in our workforce is not enough; we must create an inclusive environment where all people can contribute their best work. Our focus has been on including and engaging with the uniqueness and talents, beliefs, backgrounds, capabilities and ways of working of individuals. We are continually developing our culture in which people are valued and respected. By embracing employee inclusion and diversity, we know we can draw on the best talent, contribution and commitment from all backgrounds, as does all of our work within our People Strategy.
Both our Equal Opportunity and our Diversity and Inclusion policies can be found on our website. These polices are also reflective of our Ways of Working which are shared throughout Marston’s.
Gender diversityNumber of employees at 28 September 2019:
Male 4
Female 3
Male 6,832
Female 7,206
Male 30
Female 19
Directors
Total employees
Senior Managers
Board evaluation
Our 2018 recommendations Update Our 2019 recommendations
• A review of the succession planning strategy
• Board papers to contain more insight data where relevant
• More time to be spent by the Board in trade and at beer business sites
• Board meetings to be held at various Group premises
• Consideration of the investor register, engagement and objectives of stakeholders
• The Board has reviewed succession planning at Board and PLC Exec level
• In addition to regular consumer insight papers, the Board received a presentation on customer behaviours and segmentation
• The Board has visited three brewery sites during the year and stayed in four of our managed pubs
• Board meetings have been held away from head office and at various Group sites on four occasions
• The Board received a presentation from the Company’s brokers on market perceptions
• A continued review of succession planning at Board and senior management level
• A continuation of Board meetings held at various Group premises and of pre-Board presentations by specialist teams
• A list of future topics for presentation to inform Board discussion
• Greater focus on customer experience to achieve operational performance
49
Re-election of DirectorsWith the exception of Bridget Lea and Octavia Morley (who will offer themselves for election by shareholders at their first AGM) and Catherine Glickman (who is stepping down after serving on the Board for over five years), all Directors will offer themselves for re-election at the AGM. Details of each Director serving on the Board at the date of this report are set out on pages 44 to 45 and shall be set out to shareholders in the papers accompanying the re-election resolutions for the AGM. The Board is of the opinion, supported by the Nomination Committee, that each Director continues to make an effective and valuable contribution and demonstrates commitment to his or her role.
Marston’s PLC Annual Report and Accounts 2019Governance
Nomination Committee Report
Dear shareholder
At the end of my first year, as Chairman both of the Company and Nomination Committee, I’m pleased to report that we have made progress on our succession planning strategy. With the retirement of Robin Rowland, we took the opportunity to review the future needs of the business and challenges we face in the market. Following that review, we have appointed two new Non-executive Directors both of whom have a customer-centric focus with operational retail experience. We will continue to review our succession planning strategy to ensure the Board composition and that of the senior management team reflects and aligns with the needs of the business. In addition, we have made changes to the structure of Board meetings to allow for the Directors to be briefed more regularly on operational initiatives by teams in an informal environment to better understand the activities and views of our people.
Our approach to Board diversityWe recognise the importance and value that diverse perspectives bring to the Board and our business. As a Committee we will continue to make appointments on merit and we require the recruitment process to incorporate the widest range of suitable candidates when drawing up long lists and short lists. The Board’s approach to diversity is aligned to the Group’s policy referred to on the previous page. Currently, three of Marston’s seven Directors are female. One member of the PLC Exec is female, two of the MBC Board are female and 38% of the senior management population are female.
Evaluation and re-electionAs previously stated, Robin Rowland retired from the Board during the year and Catherine Glickman has indicated her intention not to stand for re-election having served five years on the Board.
In this, my first year as Chairman and with the subsequent changes in Non-executive Directors, I wanted to spend time getting to know each Director and to assess the overall performance of the Board. For this reason, I have deferred the external evaluation until next year by which time all Board members will be better placed and informed to contribute to the process. As part of this year’s internal evaluation I have met with each Director to discuss their personal effectiveness and commitment to the Board. I am satisfied that the tenure of each Board member provides the right balance of experience and fresh thinking. I have concluded that all Directors have been effective in their role during the year and therefore recommend each Director standing for election or re-election at the forthcoming AGM.
William RuckerChairman of the Nomination Committee
MembershipWilliam Rucker (Chairman)
Ralph Findlay
Carolyn Bradley
Catherine Glickman
Robin Rowland (until 31 July 2019)
Matthew Roberts
Our responsibilities• To ensure the Board and its Committees have the right balance of
skills, knowledge and experience.
• To plan for the orderly succession of Directors to the Board and other senior managers.
• To identify and nominate suitable candidates for Executive and Non-executive Director vacancies having regard to, amongst other factors, the benefits of diversity.
AttendeesOther Executive Directors, senior management and external advisers may be invited to attend meetings.
Terms of referenceFull terms of reference of the Committee can be found in the Investors section of the Company’s website: www.marstons.co.uk
Key activities during the reporting year• Review structure, size and composition of Board and Committees.
• Succession planning review to consider the Executive pipeline and actions to address requirements.
• Consideration of this year’s Board evaluation process.
• Reviewing the contribution and tenure of each Director before recommending for re-election.
• Appointment of two new Non-executive Directors.
Developing the NED teamHaving served nine years on the Board, Robin Rowland stepped down at the end of July. Ahead of his departure the Committee had considered the desired skills, personal attributes and experience that would be of benefit to the Board in future Non-executive Directors. As a result, two new NEDs have been appointed to refresh the Board. The Chairman has also introduced pre-Board briefings where management provide presentations on particular areas of the business to a greater depth.
Executive managementEach of the Directors responsible for pub operations and property and the Managing Director of our beer business, together with the new Group HR Director, have attended a number of Board meetings at which they have presented their respective strategies, provided updates on implementation plans and performance and partaken in wider discussions. Additionally, the Chairman and NEDs have spent time with individual PLC Exec members to ensure visibility and accountability for performance. As a result, the Committee is satisfied that the Board continues to discharge its duties effectively with two Executive Directors.
50 Marston’s PLC Annual Report and Accounts 2019

RecruitmentHaving considered the key attributes the Board was looking for, the Committee also discussed the recruitment process and the composition of a panel to manage the selection. To assess the suitability of prospective search agencies, the Chairman and Group Secretary short-listed two firms that best demonstrated their understanding of the business, its needs and how they could support the process. Having met both firms, the Company appointed Ridgway Partners to assist with the search. A panel comprising the Chairman, CEO and Group Secretary reviewed a long list of potential candidates, in conjunction with Ridgway Partners, before drawing up a list of seven candidates to meet. Following these interviews, the panel were unanimous in their recommendation of both Bridget Lea and Octavia Morley for consideration. Both displayed a strong customer-centric focus and operational retail experience during their interviews along with an ability to understand and form an opinion on wider business matters. Octavia has PLC experience whilst Bridget brings a perspective that is different to the current composition of the Board as a result of a more diverse background. For these reasons the Board concluded that offering a role to both candidates would be in the best interests of the business.
3. Shareholder relations
Engagement with our shareholders is essential to ensure that Marston’s attracts and retains long-term investors who support our strategy. Meetings and communications focus on providing updates on progress against strategy, clarifying understanding of the business and an opportunity to listen to feedback. The CEO and CFO host meetings with our major shareholders and private client fund managers to present the half year and year-end results. Following these meetings, the Board receives formal feedback from analysts and institutional shareholders. The views and any concerns are considered by the Board and, in particular, whether any action or response is appropriate. The Chairman and Senior Independent Director make themselves available for meetings with the Company’s major institutional investors each year and, this year, the Chairman met with existing and potential investors.
The investor relations programme is managed by the Executive Directors and focuses on engagement with institutional shareholders, fund managers and analysts. The CEO and CFO meet with private client fund managers on a regular basis, and at several locations across the country, to discuss strategy, performance, management and governance. The key topics discussed with investors this year covered:
• Current market conditions
• Consumer trends
• Cost outlook
• Evolution of pub offer
• Expansion of wet-led pubs
• Beer company strategy and expansion plans
• The debt reduction strategy
On behalf of the Board, the Group Secretary oversees communication with private individual shareholders. The key source of communication is through the corporate section of the Marston’s website which provides a wealth of general information on the business as well as details of our responsible approach to business. The shareholder section provides share price information, financial calendars, results presentations and regulatory announcements. The Annual Report and Accounts is the main tool for providing a comprehensive review of the business, details of our governance framework in action and annual results. All shareholders have the opportunity to communicate directly with the Board of Directors at the Company’s AGM. Prior to the formal business of that meeting, the CEO presents a summary of trading performance and developments in the business over the financial period after which shareholders are invited to ask questions. All Directors attend the AGM and the Chairman of the Board and each Committee are available to answer questions during the meeting. The senior management team are also in attendance and meet with shareholders before and after the meeting to assist with questions and understanding.
To allow all shareholders whether present in person, by proxy or unable to attend, to vote on all resolutions in proportion to their shareholding, the voting at the AGM is conducted by way of a poll. The Company releases the results of voting including proxy votes on each resolution, on its website on the next business day and announces them through a regulatory news service. Details of the 2020 AGM are set out in the separate Notice of Meeting.
Shareholder engagement summary Key communication channelsInstitutional shareholders and analysts Private client fund managers Private shareholders
Rolling investor relations programme
Regular meetings with CEO and CFO
AGM with full Board and senior management present
Bi-annual written feedback received
Annual Report and Accounts
Chairman and SID available to meet with largest shareholders
Website
4. Accountability
Fair, balanced and understandableTo support the Board’s assessment of whether the Annual Report and Accounts as a whole is fair, balanced and understandable, comprehensive reviews are undertaken throughout the year-end process by Company Secretariat in conjunction with the Finance team and support from other teams across the business. Drafts of each section of the Annual Report and Accounts are reviewed for consistency across the whole document and the accuracy of all information is verified by supporting evidence. Once ready, the drafts are submitted to the Board ahead of approving the final documents to allow them time to review, discuss and where thought appropriate, challenge the content. The external Auditors review the consistency between the narrative reporting and financial disclosures.
ComplianceThe Risk & Compliance Committee monitors all areas of legal and regulatory compliance across the business. At its quarterly meetings the Committee, which includes representatives from across the business as well as the Corporate Risk Director and Group Internal Audit Manager, consider the impact of any emerging legislation on the business, the effectiveness of our internal controls and compliance processes. The discussions inform the Internal Audit plan and provide focus for annual compliance testing that seek reassurance that the Group is complying with relevant legislation as well as its own policies and procedures.
Risks and internal controlsThe Group’s approach to risk management, systems and internal controls is explained in the Strategic Report on pages 30 to 39.
Private client fund managers 28.86%
Private investors 15.66%
Institutional investors 55.48%
Analysis of shareholder register by investor type
51Marston’s PLC Annual Report and Accounts 2019Governance

Audit Committee Report
Dear shareholder
I am pleased to present the Audit Committee’s report for the period ended 28 September 2019. Throughout the year we have continued our focus on the integrity of financial reporting and internal controls as well as the principal risks and the potential impact on our business.
As well as reviewing the Group’s financial statements for the full and half year, the Committee considers all forthcoming accounting changes. Due to the potential magnitude of IFRS 16 ‘Leases’ on the Group, it was felt more appropriate that the Board as a whole consider our proposed approach to these changes. Further details are outlined in Note 1 to the Financial Statements, on page 89.
As Chairman, I also meet independently with the external Auditors, the CFO, the Corporate Risk Director and the Group Internal Audit Manager. I have an open and professional relationship with each of them and I am confident in their capabilities and the level of assurance that they provide.
This is the final year of service by our external Auditors, PwC, and I should like to acknowledge the quality of their audit and independent judgement which has challenged management’s thinking over the years and contributed to improved standards. Following the sign off of this year’s Annual Report and Accounts, PwC will resign to allow our incoming auditors, KPMG, to begin preparations for their first audit of our Interim Results in 2020.
Shortly after the year-end, the Committee has also overseen the selection of a new internal audit co-source to support the work of the Internal Audit team, most notably where specialist knowledge or experience is required.
Matthew RobertsChairman of the Audit Committee
MembershipMatthew Roberts (Chairman)
Robin Rowland (until 31 July 2019)
Carolyn Bradley
Octavia Morley joins with effect from 1 January 2020
Our responsibilities• Reviewing the integrity of the Group’s financial statements including
the Interim Results and the Annual Report and Accounts.
• Reviewing the effectiveness of the internal controls and risk management system.
• Reviewing the Group’s systems for detecting fraud, preventing bribery and allowing employees to raise concerns in a safe and confidential manner.
• Overseeing the relationship with the external Auditors, specifically reviewing and approving their fees and the terms of engagement.
• Reviewing and monitoring the external Auditors’ objectivity and independence and the effectiveness of the audit process.
AttendeesThe Corporate Risk Director and external Auditors attend each meeting.
Other individuals, such as the CEO and CFO and members of the Internal Audit team, are usually invited to attend all or part of the Committee’s meetings.
Terms of referenceFull terms of reference of the Committee can be found in the Investors section of the Company’s website: www.marstons.co.uk
Key activities during the reporting year • Reviewing the Interim Results and the Annual Report and Accounts
prior to Board approval.
• Reviewing the main corporate risks and assurances from testing the systems and processes for managing and mitigating those risks.
• Reviewing the Viability Statement and five-year time period.
• Approving the Internal Audit Plan and review audit outcomes.
• Considering and approving the process for re-tendering the co-source provision.
• Reviewing and approving the Statutory Pubs Code compliance report.
• Considering and reviewing the activity and effectiveness of the Whistleblowing Policy.
• Reviewing the expected impact of IFRS 16 ‘Leases’ disclosures.
52 Marston’s PLC Annual Report and Accounts 2019

AuditorsThe external Auditors attend each meeting, providing the Committee an opportunity to discuss the integrity of the Company’s financial reports. The Auditors present their audit strategy, findings and conclusions in respect of the Annual Report and Accounts and Interim Results. Noting the annual review of independence that the Auditors conduct in respect of all services provided to the Group, the Committee is satisfied that the Auditors remain independent and objective in their conduct of the audit. In assessing the work of the Auditors, the Committee remain satisfied with the scope of their work and their effectiveness. As previously announced, KPMG will assume the role of external Auditor at the conclusion of the FY2018/19 audit and, therefore, the Committee does not recommend the re-appointment of PwC to the Board. The Committee considered the transition arrangements for the change of Auditor and noted that PwC will resign following the sign off of the Annual Report and Accounts to enable KPMG to commence their audit work preparations for 2020.
The Committee accepts that some non-audit work is most appropriately undertaken by the external Auditors; it must be in accordance with the Committee’s terms of reference and its policy on non-audit services. In accordance with the policy, where the Auditors are considered to be the most appropriate provider of permissible work the Chairman of the Audit Committee must approve work expected to be in excess of £50,000, or, for fees in excess of £100,000 the Audit Committee must approve the appointment. Below that amount, the CFO has authority to approve such work. The Company has used other accounting firms for some non-audit work comprising VAT advice and on the automation of some tax compliance processes. In each case, consideration is given to the need for value for money, experience and objectivity required in the particular circumstances.
Internal Audit function The Corporate Risk Director and Group Internal Audit manager attend each Committee meeting to provide ongoing assurance and regular updates on the Group’s main risks and internal audit activities. The findings from internal audits, together with progress on actions identified are reviewed and considered. During the year, the Committee also considered the tender process for the Internal Audit co-source. Following discussion, it was agreed to invite BDO, Deloitte, PwC and Grant Thornton, the incumbents, to tender. Each firm met with the Corporate Risk Director and Group Internal Audit manager for an information gathering and briefing session before presenting their proposals to a panel of the Committee Chairman, CFO, Group Secretary, Corporate Risk Director and Group Internal Audit Manager. In assessing the tender proposals and presentation received the panel considered the ability of each firm to deliver their service, their methodology, relevant experience and knowledge of key audit issues. The panel concluded unanimously that PwC should be appointed as the new internal audit co-source. They will be appointed after the conclusion of the 2020 AGM when PwC will complete their role as outgoing external Auditor.
Statutory Pubs CodeThe Group has continued its commitment to working effectively within the Pubs Code regulations. Processes are reviewed on an ongoing basis and any changes that are required are implemented to ensure streamlined operations which are compliant with the provisions of the Pubs Code.
Following internal approval by the Chair of the Audit Committee, the Code Compliance Officer submitted an annual compliance report to the Pubs Code Adjudicator (PCA), for the reporting period from 1 April 2018 to 31 March 2019.
During the reporting period, Marston’s were not subject to any investigations, enforcements or representations of unfair business practices by the PCA.
Nine referrals were made to the PCA, all of which were in relation to the MRO provisions of the Pubs Code. Two referrals made prior to the reporting period were awarded against Marston’s during the reporting period. Remedial actions were implemented in both cases.
During the reporting period, all of Marston’s Business Development Managers received updates and training on the Pubs Code.
Significant financial judgementsIn recommending the Interim Results and Annual Report and Accounts to the Board for approval, the Committee reviewed in particular the accounting for and disclosure of the following key matters:
1.
53
Valuation of property assetsThe Committee considered management’s annual assessment of the value of the Group’s properties and the methodology applied thereto. Noting the assumptions adopted and recent market indicators, the Committee are satisfied that the impairment of £70.7 million is appropriate to reflect the permanent diminution in value of certain underperforming sites within the Destination and Premium estate. Having considered management’s rationale, the Committee concluded further that the disposal of a portfolio of pubs subsequent to the balance sheet date does not necessitate any additional impairments within the remaining estate.
2.
Marston’s PLC Annual Report and Accounts 2019Governance
Valuation of financial instrumentsNoting that the recouponing of one of the interest rate swaps has caused the hedging relationship to cease, the Committee considered the fair value movement in respect of this swap which will be accounted for through the income statement from this year onwards, noting the volatility to the results that it will create. The remaining swap continues to be effectively hedged with movements recognised in the hedging reserve. The Committee also considered management’s calculation of its own credit risk for these liabilities and concluded that the approach and resulting calculation is appropriate.
3. Non-underlying itemsThe Committee considered the items classified as non-underlying and in particular the reorganisation and integration costs and the valuation and disclosure of financial instruments. Noting the consistency of approach with prior years, the methodology and the Group’s accounting policies, the Committee is satisfied that the items are classified appropriately.
4. The expected impact of IFRS 16 ‘Leases’The Committee and Board considered the assumptions, calculations and assessment of the impact on the accounts of the new lease accounting standard. The Committee considers the approach adopted to be appropriate and is satisfied that the disclosed impact range on the income statement and balance sheet represents a reasonable assessment of the effect of the new IFRS 16 ‘Leases’ which comes into effect from the start of the new financial year.

Dear shareholder
I am pleased to present our report for the period ended 28 September 2019. Our focus for the year has been the review of the current Directors’ Remuneration Policy and its alignment with our updated strategy.
Strategic contextOur operational strategy remains focused on offering our customers and guests a great experience through both our pubs and our beer business. During the reporting year, we announced that we planned to reduce net debt by £200 million to £1.2 billion by 2023. This will be achieved by deferring our new-build programme, reallocating and reducing capital expenditure; disposing of certain non-core assets; interest savings within the securitisation and a forecast reduction in contributions to the final salary pension scheme.
We are focused on improving organic growth and driving returns in our core business across our existing high quality property portfolio of leased and managed pubs and in our beer business. We have also committed to maintaining our dividend at the current level over the debt reduction period.
The Committee works to ensure there is a clear, simple and consistent reward structure across the business, aligned with shareholder interests and supporting the creation of sustainable shareholder value. The Committee recognises and takes seriously its responsibility to provide an appropriate balance between fixed and variable pay, setting suitably stretching performance conditions that act as an appropriate incentive, without encouraging excessive risk taking. We believe that the changes outlined below deliver a Remuneration Policy (‘policy’) that rewards delivery of our strategy, whilst aligning with the provisions of the 2018 UK Corporate Governance Code (‘2018 Code’), in a commercial and pragmatic way.
Review of the yearPerformanceBoth the Chairman’s Statement and CEO Statement report on our performance in 2018/19 and comment on the challenges we face in an uncertain economic climate. The business delivered growth in underlying revenue with a strong trading performance in wet-led pubs and brewing despite challenging comparatives against 2017/18 but with more subdued sales in food-led pubs. Underlying profit before tax was £101.0 million (2018: £104.0 million).
Performance outcomes for the yearAnnual bonus 2018/19The 2.9% decrease in underlying Group profit before tax versus 2017/18 is below threshold performance of £104.0 million for that element of the bonus. Cash return on cash capital employed for the year was 10.4% and below threshold performance of 10.5% for that element of the bonus. Based on these results no bonus is payable to the Executive Directors; further information is given on page 67.
LTIP 2015/16 award vestingAs reported in the 2018 Directors’ Remuneration Report, the performance targets for the 2015/16 LTIP award were not met and the award lapsed in June 2019.
LTIP 2016/17The performance period for the 2016/17 LTIP award ended on 28 September 2019. For the CROCCE and relative TSR measures, the Group did not exceed threshold performance of base +0.25% and median performance respectively and, as such, these elements of the award did not vest. For the Free Cash Flow (‘FCF’) element, the Group achieved £325.2 million which exceeded threshold performance of base +7.5%. The Committee agreed that 11.2% of the maximum award had met the performance conditions and were due to vest, however, given the challenging performance in 2018/19 and in recognition that there will be no bonus payable under the Group bonus scheme, the current Executive Directors have chosen to waive their rights to the award. Further information is provided on page 67.
Proposed policy changes for 2020The Committee has undertaken a detailed review of remuneration, in the context of strategy, performance and in response to the 2018 Code. The policy has been determined after reviewing the impact of the previous policy and taking into account discussions with shareholders. Measures to avoid or manage conflicts of interest are discussed within our Corporate Governance Report on page 48. We are not proposing fundamental changes to our remuneration structure, which we believe is aligned with shareholder interests, supports the delivery of our business strategy and appropriately rewards our leadership team. The changes made to the proposed policy compared to the policy approved at the 2017 AGM are summarised below.
• Under the current policy, pension provision is 25% of salary for Ralph Findlay and 20% of salary for Andrew Andrea, delivered as a cash allowance. Ralph’s pension allowance is a legacy arrangement arising from his previous participation in the Group’s defined benefit plan. Recognising the provisions of the Code and the developing practice and shareholder sentiment in this area, the Committee originally intended that his pension would remain fixed at an absolute amount and would not increase over the next three years, thereby reducing his pension contribution in line with any salary increases. However, after further discussions with shareholders and in response to shareholder feedback, the CEO has volunteered to reduce his pension provision to 20% of salary, effective from the start of 2019/20. The Committee will continue to review and consider evolving market practice and investor views with regards to the pension arrangements for existing Executive Directors recognising that these are contractual rights.
For future hires at Executive Director level, pension provision (or cash allowance) will not exceed the pension contributions available to the majority of those employees who participate in the Company’s Group Personal Pension Plan (‘GPPP’). A current population of around 1,800 employees participate in the GPPP. Company contributions under the GPPP range from 5% to 10.5% of salary with the majority of employees in the GPPP benefiting from a 7% salary rate. Future hires at Executive Director level would also receive this rate.
• Extending the recovery provisions (malus and clawback) for both the bonus and LTIP to include, as trigger events, serious reputational damage, corporate failure and material failure of risk management.
54 Marston’s PLC Annual Report and Accounts 2019
• Increasing minimum shareholding guideline to 200% of salary for all Executive Directors (previously 200% of salary for the CEO and 100% of salary for other Executive Directors).
• Introduction of a post-employment shareholding guideline, as discussed further on page 71.
• The Committee has reviewed the structure of the annual bonus scheme and determined that, going forward, up to 20% of maximum would be payable for delivering an appropriately stretching level of threshold performance. The Committee considers this to be a better construct as, over recent years, our employees (including our Executive Directors and PLC Executive Committee) have been instrumental in delivering strong results against budget and improvements against the prior year but this has not been appropriately recognised under our current bonus parameters. In prior years, there has been no vesting unless growth is delivered year-on-year.
Directors’ Remuneration ReportAnnual Statement

Given the uncertainty in the market and current environment we are facing, we believe that delivering this threshold performance year-on-year is becoming progressively more demanding, especially in light of our tighter margins from an increasingly competitive market and lowering demand. Rather than reducing the performance required at threshold, the Committee believes that vesting for threshold performance, of up to 20% of maximum for achievement of prior year performance is a more appropriate recognition of the team’s contribution to delivering strong results in this challenging market. We plan to set stretching annual profit targets, based on our strategic plan and reward organic growth in the existing estate, to motivate our employees. Vesting for on-target performance (i.e. the achievement of target budget) will remain at 50% of maximum and in line with our previous target-setting approach, maximum performance will demand high growth delivery from the management team.
Review of performance metrics for variable payAlongside the policy review we also took this opportunity to review the current performance metrics for both the annual bonus plan and Long Term Incentive Plan for the Executive Directors.
Annual bonus planThe bonus will continue to be based on quantifiable financial measures. The Committee proposes to replace CROCCE with FCF and adjust the weighting as follows:
Current bonus measures Proposed bonus measures
67% PBT 60% PBT33% CROCCE 40% FCF
The Committee aims for internal alignment and consistency in reward; cascading the principles at Board level down through the organisation where possible, is one of our key principles. CROCCE, a complex measure, has been used in our variable pay plans to limited effect and participants in our senior leadership incentive scheme, other than our Executive Directors, find it difficult to relate to day-to-day decision-making. As we pursue organic growth and a reduction in debt, rewarding management on Group profit before tax and FCF ensures simplicity, visibility of progress and focus.
Long Term Incentive PlanAs noted above, one of our primary objectives is to deliver a reward structure which is as consistent as possible across the business, including the performance metrics in our variable pay plans, whilst also ensuring that our measures best support our strategy. Our LTIP has been based on FCF, CROCCE and relative TSR.
Following extensive discussions, the Committee has determined that changing two of the performance measures will improve the relevance and quality of our LTIP for all participants. We recognise that many of our shareholders like to see an external return measure as a balance to internal ones; we therefore plan to retain the relative TSR measure at its current weighting of 20% of maximum. We propose to change the other two measures as shown below:
�
�
�
�
�
Current LTIP measures Proposed LTIP measures
20% relative TSR against the FTSE 250 Index excluding Investment Trusts
20% relative TSR against the FTSE 250 Index excluding Investment Trusts
40% CROCCE 40% underlying EPS40% FCF 40% net cash flow (‘NCF’)
As we focus on earnings growth and a reduction in debt, we expect to continue to deliver strong TSR growth to our shareholders. These three elements are captured in underlying EPS, NCF and relative TSR. For relative TSR, upper quartile performance will be required for 100% of the element to vest, previously upper quintile performance was required for 100% of the element to vest. Rather than seeking to increase the maximum LTIP opportunity, we believe setting maximum performance of the relative TSR element at upper quartile performance will provide a fair and equitable LTIP opportunity for delivering strong performance. Further detail on each measure is set out in the Annual Report on Remuneration on pages 66 to 72.
Across all of these measures the Committee retains a broad business performance underpin and more general discretion under the plan rules and the policy to reduce the vesting outcome if it considers that the formulaic outcome is inappropriate.
The 2018 UK Corporate Governance CodeThe 2018 Code applies to the Company from the start of the 2019/20 financial period and we will report on compliance with the 2018 Code in our 2020 Annual Report and Accounts. Our current policy is compliant with existing requirements, for example, the Committee has discretion to override formulaic outcomes and holding periods for shares that already form part of the incentive scheme arrangements. During the policy review in 2018/19, the Committee considered the elements introduced in the 2018 Code thus ensuring that the new policy remains compliant. This includes the introduction of a formal policy for post-employment shareholding requirements, changes to the pension contribution rates for new hires at Executive Director level and the enhancement of malus and clawback provisions within our incentive schemes. We have also updated our Terms of Reference to reflect the wider remit of the Committee.
How the Committee addressed the factors in Provision 40 of the 2018 Code when determining the new policy• Clarity – remuneration arrangements are transparent and competitive;
the outcomes of variable elements are dependent on the achievement of performance measures aligned with our stated strategy and the interests of all stakeholders. Performance targets are set in line with Group budgets and plans and reviewed and tested by the Committee. Executive Directors are required to build meaningful personal shareholdings in the Company, this is monitored by the Committee.
• Simplicity – we follow a standard UK market approach to remuneration with established variable incentive schemes that operate on a clear and consistent basis. The measures we have introduced are used to monitor business performance, support the operation of the business and are reviewed regularly by management.
• Risk – the new policy includes the following:
� Limits are set on the maximum incentive scheme awards that can be granted;
� Alignment of performance measures with our strategy;
� The LTIP incentivises Executive Directors to deliver against strategy over the longer term. Long-term performance measures and share-based remuneration support the creation of sustainable shareholder value.
� The Committee has discretion to override formulaic outcomes which may not accurately reflect the underlying performance of the Group. Malus and clawback provisions in the incentive scheme rules also provide flexibility to adjust payments.
� Introduction of a post-employment shareholding guideline, as discussed further on page 71.
• Predictability – detailed information on the potential values that may be earned through the incentive plans is provided in the policy document (set out on pages 57 to 64) and the Risk section above refers to limits and Committee discretion.
• Proportionality – the performance metrics for both incentive plans are clearly aligned to strategy and are designed to reward the successful execution of that strategy over a long-term performance period. Outcomes are tested in the context of underlying Group performance, the broader economic environment and the wider workforce, ensuring that poor performance cannot be rewarded.
• Alignment to culture – in determining the policy, the Committee was clear that it should drive the right behaviours, reflect our values and support our Group purpose and strategy. Our culture encourages high performance and supports sustainable growth. The Committee will review the remuneration framework regularly to ensure it continues to support our strategy.
55Marston’s PLC Annual Report and Accounts 2019Governance

Other key activities of the Committee during the year• Consideration of pay review proposals for the Executive Directors,
as outlined below.
• 2019 bonus outturn and 2015/16 and 2016/17 LTIP award vesting, as outlined above.
• Bonus scheme for senior management.
• Approval of SAYE and LTIP grants.
• Review of Executive Directors and senior management shareholdings in the Company, in the context of shareholding guidelines.
• Implementation of the remuneration aspects of the 2018 UK Code.
Directors’ Remuneration Report continued
Looking forward to 2019/20Pay award effective 1 October 2019The Committee reviewed the salaries paid to Executive Directors and an increase in base salaries of 2% was approved, which is in line with the average salary increases across the Group.
The Chairman and other Non-executive Directors fees were last reviewed in 2017/18 and no changes will be made for 2019/20. The next review will be in line with the usual timetable as set out in the policy.
As discussed above, the CEO has volunteered to reduce his pension provision to 20% of salary, effective from the start of 2019/20.
Incentive remuneration for 2019/20As outlined above, no changes in quantum are proposed in respect of the Executive Directors’ annual bonus plan and LTIP for 2019/20 but the revised performance metrics will apply for the forthcoming financial period.
Committee focus for 2019/20The Committee will monitor the implementation of the proposed policy, in particular the change to performance metrics, to ensure our incentive schemes remain aligned with strategy and provide the right balance of challenge and reward. The Company and the Committee remain committed to a fair and responsible approach to executive pay, which is aligned with the interests of shareholders and other stakeholders in our business. The Committee will continue to review developing market practice and emerging trends with regards to aligning pension contributions with the wider workforce.
Shareholder engagementThe Committee remains committed to ongoing shareholder dialogue and takes an active interest in voting outcomes. We are delighted again, that the 2018 Annual Report on Remuneration received high levels of support, with over 99% of votes cast in favour of the resolution. We welcome feedback from our shareholders as it helps inform our thinking on remuneration matters.
As part of the preparation of the 2020 policy that we are proposing to shareholders, the Committee consulted with major shareholders in July and August this year, as well as the institutional investor bodies, on the proposed changes to the policy and setting out the thinking behind these proposals. We are grateful for the responses received, which were overall supportive. Having considered the responses and adjusted the proposed policy for the CEO pension as discussed on page 66, we believe that the proposed policy should not be adjusted further but we have undertaken to monitor certain areas as best practice develops following the full implementation of the 2018 Code.
We will continue to engage with our shareholders and hope we can rely on your continuing support. If you would like to contact me directly to discuss any aspect of our policy or this report then please email me at [email protected]. I will also be available to answer your questions at our AGM on 24 January 2020.
MembershipCatherine Glickman (Chairman)
Carolyn Bradley
Bridget Lea (from 1 September 2019)
Robin Rowland (until 31 July 2019)
Octavia Morley will join the Committee from 1 January 2020
Our responsibilities• Determining the framework and policy for Executive Directors’
remuneration.
• Within that framework, setting the remuneration for the Executive Directors and other members of the PLC Executive Committee (including the Group Secretary).
• Setting the Chairman’s remuneration.
• Approve the design and pay-outs of annual and long-term incentives awards.
• To take note of any major changes in employee benefit structures applicable to the wider workforce and review pension provision and remuneration trends across the Group.
56
Finally, I would like to take this opportunity to say that I have thoroughly enjoyed serving on the Board and Remuneration Committee of Marston’s PLC for the last five years. I am confident that the proposed policy is aligned with shareholder interests and will continue to support the delivery of Marston’s strategic objectives and the creation of sustainable shareholder value. I will hand over the chairmanship of the Remuneration Committee to Octavia Morley at the end of the 2020 AGM, safe in the knowledge that she will continue the responsible approach to remuneration for which Marston’s is known for.
Catherine GlickmanChairman of the Remuneration Committee
AttendeesThe Committee receives advice from a number of different sources. This helps to inform decision-making and ensures the Committee is aware of pay and conditions in the Group as a whole, and conditions in the wider market.
Ralph Findlay, CEO, has attended each meeting during the year to provide advice in respect of the remuneration of the other Executive Directors. The Group Secretary, Anne-Marie Brennan, and the Group HR Director, Liam Powell, also attend each meeting and provide advice to the Committee.
No person is in attendance for any discussions regarding their own remuneration.
Deloitte LLP (Deloitte) were appointed by the Committee in 2003 and are retained as an independent adviser to the Committee, attending meetings as and when required. Deloitte is a member of the Remuneration Consultants Group and, as such, voluntarily operates under its Code of Conduct in relation to executive remuneration consulting in the UK. Deloitte received fees amounting to £33,710 during the year in respect of advice given to the Committee, and also provided advice during the year in relation to VAT and the operation of the Company’s share plans.
Terms of referenceThe Committee has considered the requirements of the 2018 Code and agreed a number of changes to be made to its terms of reference, as part of the annual review. Full terms of reference can be found in the Investors section of the Company’s website www.marstons.co.uk
Marston’s PLC Annual Report and Accounts 2019

Remuneration Policy
This part of the report sets out the Directors’ Remuneration Policy, which will be subject to a binding vote at the 2020 AGM and take effect from the close of the meeting. The policy is determined by the Company’s Remuneration Committee (‘the Committee’). References in this policy to Executive Directors include both Executive Directors and any other person who is required to be treated as an Executive Director under the applicable legislation.
No significant changes have been made to the policy approved at the 2017 AGM. However, certain amendments have been made to take account of developments since the 2017 AGM, including aligning the policy to our updated strategy and our response to the 2018 UK Corporate Governance Code. This is to ensure the policy remains appropriate for the Company going forward. A summary of the changes made to the proposed policy as compared to the policy approved at the 2017 AGM are as set out in the Annual Statement from the Committee Chairman.
AimsThe policy is designed to ensure that Executive Directors are provided with sufficient remuneration to motivate each individual with incentives that are aligned to strategy and encourage enhanced performance. The Committee believes that variable pay should only be earned for achievement against stretching targets and will continue to ensure that targets provide an appropriate balance between motivating and rewarding Executive Directors to deliver stretching but sustainable performance, without encouraging excessive risk taking.
Base salary
Purpose and link to strategy
Core element of fixed remuneration, reflecting the individual’s role and experience.
Operation Usually reviewed annually and fixed for 12 months commencing 1 October.
Whilst Executive Directors are contractually entitled to an annual review of their salary, there is no entitlement to an increase as a result of this review.
Salary levels are determined by the Committee taking into account a range of factors including:
• role, experience and performance;
• underlying Group performance;
• alignment with workforce;
• prevailing market conditions; and
• external benchmarks for similar roles at comparable companies.
Opportunity Salary increases are reviewed in the context of salary increases across the wider Group. The Committee considers any increase which is out of line with these very carefully and such increases may be awarded where there is a reason to do so taking into account relevant factors. These circumstances may include but are not limited to:
57
• increase in scope and responsibility;
• development and performance in the role (including if a newly appointed Executive Director’s salary is positioned below a market rate that it may be increased to a market rate over such period as the Committee considers appropriate); or
• a salary falling significantly below market positioning.
Performance metrics Not applicable, although the individual’s contribution and overall performance are considerations in determining the level of any salary increase.
Marston’s PLC Annual Report and Accounts 2019Governance

Remuneration Policy continued
58
Benefits
Purpose and link to strategy
Ensures the overall package is competitive.
Participation in the Save As You Earn scheme (SAYE) creates staff alignment with the Group and promotes a sense of ownership.
Operation Executive Directors receive benefits in line with market practice which include a car allowance, private medical insurance and life assurance.
The SAYE is an HMRC tax qualifying monthly savings scheme facilitating the purchase of shares at a discount.
Other benefits may be provided based on the role and individual circumstances. These may include, for example, relocation and travel allowances.
Opportunity Set at a level which the Committee considers appropriate against the market and provides a sufficient level of benefit based on individual circumstances.
SAYE contribution and operation of the SAYE scheme as permitted in accordance with the relevant tax legislation.
Performance metrics Not applicable.
Annual Bonus and Deferred Bonus Plan (‘DBP’)
Purpose and link to strategy
Rewards performance against annual targets which support the strategic direction of the Group.
Compulsory deferral into shares aligns Executive Directors with shareholder interests and provides a retention element.
Operation Performance measures and applicable targets are set annually and any payout is determined by the Committee after the period end, based on performance. The Committee has discretion to vary the bonus payout should any formulaic output not reflect the Committee’s assessment of overall business performance or not be appropriate in the context of circumstances that were unexpected or unforeseen at the start of the bonus year.
Any bonus earned in excess of 40% of the maximum award is usually payable in shares in the Company which will be deferred for a period of three years. Executive Directors can opt to defer a greater proportion if they wish. Deferral of any bonus earned is subject to a de minimis limit of £5,000.
As with all Group bonuses, they remain discretionary and can be adjusted or removed at the Committee’s discretion.
At its discretion, the Committee may award dividend equivalents to reflect dividends that would have been paid over the period from grant to vesting on vested shares under the DBP. These dividend equivalents may be calculated assuming the reinvestment of dividends in the Company’s shares on a cumulative basis.
Recovery provisions apply, as referred to below.
Opportunity The usual maximum annual bonus opportunity is 100% of base salary.
Performance metrics Performance measures are determined each year reflecting the business priorities that underpin Group strategy.
At least 50% of the award will be based on financial performance measures aligned to the Group’s financial key performance indicators, which may include Group profit, return on capital and cash measures. The balance of the bonus opportunity will be based on financial measures and/or the delivery of strategic/individual objectives.
Financial measuresSubject to the Committee’s discretion to override formulaic outturns, payment at threshold is up to 20% of the maximum, up to 50% of the maximum will be payable for on-target performance and all the bonus will be payable for maximum performance.
There is usually straight-line vesting between the threshold and target performance levels and between target and maximum performance levels.
The Committee has the discretion to vary the vesting schedules by reducing the percentage that vests at each performance level but not by increasing the percentage that vests.
Non-financial strategic or individual measuresSubject to the Committee’s discretion to override formulaic outturns, a non-financial strategic or individual measure will vest between 0% and 100% based on the Committee’s assessment of the extent to which the relevant measure has been achieved.
Marston’s PLC Annual Report and Accounts 2019

Long Term Incentive Plan (‘LTIP’)
Purpose and link to strategy
Incentivises Executive Directors to deliver against the Group’s strategy over the longer term.
Long-term performance targets and share-based remuneration support the creation of sustainable shareholder value.
Operation The Committee makes long-term incentive awards under the 2014 LTIP which was approved by shareholders at the 2014 AGM.
Under the 2014 LTIP, awards of conditional shares, restricted stock or nil cost options can be made with vesting dependent on the achievement of performance conditions, normally over a three-year performance period. Vested awards are normally subject to an additional holding period of two years before being released to participants.
59
The Committee has discretion to vary the formulaic vesting output applying to any LTIP award where it believes the outcome does not reflect the Committee’s assessment of overall business performance or is not appropriate in the context of circumstances that were unexpected or unforeseen at the date of grant. This discretion does not apply to any tax-qualifying option granted as part of an Approved Performance Share Plan (APSP) award as described below where such discretion would not be permitted in accordance with the applicable tax legislation.
The Committee may at its discretion structure awards as APSP awards. APSP awards enable the participant and Company to benefit from HMRC approved option tax treatment in respect of part of the award, without increasing the pre-tax value delivered to participants. APSP awards may be structured either as a tax-qualifying option for the part of the award up to the HMRC limit (currently £30,000) with an unapproved option for the balance and a ‘linked award’ to fund the exercise price of the tax-qualifying option, or as a tax-qualifying option and an LTIP award, with the vesting of the LTIP award scaled back to take account of any gain made on exercise of the tax-qualifying option.
At its discretion, the Committee may award dividend equivalents to reflect dividends that would have been paid on vested awards under the LTIP from the end of the performance period until the date of release (i.e. the date on which the awards become exercisable). These dividend equivalents may assume the reinvestment of dividends.
Recovery provisions apply as referred to below.
Opportunity The normal maximum award size will be up to 150% of base salary in respect of any financial year. Awards for 2019/20 will be granted at the level of 125% of salary and it is currently intended that awards will continue to be made at this level.
In exceptional circumstances the Committee reserves the right to award up to 200% of base salary in respect of any financial year.
These limits do not include the value of shares subject to any tax-qualifying option granted as part of an APSP award.
Performance metrics The vesting of LTIP awards is subject to the satisfaction of performance targets set by the Committee.
The performance measures are reviewed regularly to ensure they remain relevant but will be based on financial measures and/or share price growth related measures, aligned to the Group’s long-term strategy, which may include but not be limited to:
• net cash flow;
• underlying earnings per share; and
• relative total shareholder return.
The relevant metrics and the respective weightings may vary each year based upon Group strategic priorities.
Subject to the Committee’s discretion to override formulaic outturns, for the achievement of threshold performance no more than 25% of each respective element of the award will vest, rising to 100% vesting for the achievement of maximum performance.
The Committee will regularly review the performance conditions and targets to ensure they are aligned to Marston’s strategy and remain challenging and reflective of commercial expectations.
Marston’s PLC Annual Report and Accounts 2019Governance

Retirement benefits
Purpose and link to strategy
Provide a competitive means of saving to deliver appropriate income in retirement.
Operation Executive Directors are eligible to participate in the defined contribution pension scheme (or such other pension plan as may be deemed appropriate) and, if a member before closure of the scheme, the defined benefit scheme.
The defined benefit scheme was closed to new entrants from 29 September 1997. Executive Directors who are members of the closed scheme can continue to receive benefits in accordance with the terms of this scheme.
In appropriate circumstances, Executive Directors may take a salary supplement instead of contributions into a pension plan.
Opportunity All current Executive Directors may receive contributions of up to 20% of base salary under the defined contribution pension scheme, an equivalent cash allowance or a combination of the two (up to 20% of base salary).
Pension contributions (or cash allowance) for any Executive Director appointed after the date on which this policy takes effect will not exceed the pension contributions available to the majority of those employees who participate in the Company’s Group Personal Pension Plan (which is currently 7% of salary).
Active members of the defined benefit pension scheme continued to accrue benefits under this scheme until 30 September 2014.
Performance metrics Not applicable.
Recovery provisions (malus and clawback)Annual bonus awards and LTIP awards granted on or after 1 October 2019 are subject to recovery provisions which may be applied for up to two years following the payment in the case of a cash bonus, until the vesting date in the case of a Deferred Bonus award, and for up to two years following vesting in the case of an LTIP award. These provisions may be applied in the following circumstances:
• a material misstatement of any Group company’s financial results;
• a material failure of risk management;
• serious reputational damage;
• serious misconduct or material error on the part of the participant;
• an error in assessing a performance condition applicable to the bonus or LTIP award;
• corporate failure; and
• in the case of recovery before vesting, other relevant circumstances at the discretion of the Committee.
Malus and clawback may be applied to any tax-qualifying option granted under the LTIP to the extent permitted by the applicable tax legislation.
60
Remuneration Policy continued
Non-executive Director fees
Purpose and link to strategy
Non-executive Director fees are set at a level that reflects market conditions and is sufficient to attract individuals with appropriate knowledge and experience.
Operation Fees are usually reviewed every two years and amended to reflect market positioning and any change in responsibilities.
The Committee recommends the remuneration of the Chairman to the Board. Fees paid to Non-executive Directors are determined and approved by the Board as a whole.
The Non-executive Directors do not participate in the annual bonus plan or any of the Group’s share incentive plans. Non-executive Directors may be eligible to receive benefits such as the use of secretarial support, travel costs or other benefits that may be appropriate.
Opportunity Fees are based on the level of fees paid to Non-executive Directors serving on Boards of similar-sized UK-listed companies and the time commitment and contribution expected for the role.
Non-executive Directors receive a basic fee and an additional fee for further duties (for example chairmanship of a Committee or Senior Independent Director responsibilities or holding the position of Non-executive Director responsible for employee engagement).
Performance metrics Not applicable.
Marston’s PLC Annual Report and Accounts 2019

The Committee reserves the right to make any remuneration payments and payments for loss of office notwithstanding that they are not in line with the policy set out above where the terms of the payment were agreed:
(i) before the policy came into effect (and, in the case of the terms of a payment agreed on or after 5 October 2014, were in line with the policy applying at the date of agreement); or
(ii) at a time when the relevant individual was not a Director of the Company (or other person to whom this policy applies) and, in the opinion of the Committee, the payment was not in consideration for the individual becoming a Director of the Company (or other such person).
For these purposes the term payments includes the Committee satisfying awards of variable remuneration and, in relation to an award over shares, the terms of the payment are agreed at the time the award is granted.
Explanation of performance metrics chosenPerformance measures are selected to reflect the Group’s strategy. Stretching performance targets are set each year for the annual bonus and long-term incentive awards. In setting these performance targets the Committee will take into account a number of different reference points which may include the Group’s business plans and strategy and the market environment. Where relative total shareholder return is used there will be no payment for performance below median (compared to the comparator group).
The annual bonus performance targets reflect key financial objectives of the Group and reward for delivery against these. For 2019/20, the bonus opportunity will be based on underlying profit before tax (60% of the award) and free cash flow (40% of the award).
The LTIP performance targets reflect the Group’s strategic objectives and therefore the financial and strategic decisions which ultimately determine the success of the Group. The LTIP performance measures are based on financial measures and/or share price growth related measures to provide alignment with the Group’s strategy. For 2019/20, the LTIP opportunity will be based on underlying earnings per share (40% of the award), net cash flow (40% of the award) and total shareholder return (20% of the award).
The Committee retains the discretion to adjust or set different performance measures or targets if events occur (such as a change in strategy, a material acquisition and/or a divestment of a Group business or a change in prevailing market conditions) which cause the Committee to determine that the measures are no longer appropriate and that amendment is required so that they achieve their original purpose.
Operation of share plansThe Committee may amend the terms of awards and options under its share plans in accordance with the plan rules in the event of a variation of the Company’s share capital or a demerger, special dividend or other similar event or otherwise in accordance with the rules of those plans. Shares awards granted under any such plan may be settled (in whole or in part) in cash although the Committee would only do so where the particular circumstances made it appropriate to do so – for example, where there is a regulatory restriction on the delivery of shares.
Illustration of application of Remuneration PolicyThe charts on the following page show the relative split of remuneration between fixed pay (base salary, benefits and pension) and variable pay (annual bonus, DBP and LTIP) for each Executive Director on the basis of minimum remuneration, remuneration receivable for performance in line with the Company’s expectations and maximum remuneration (including and excluding share price appreciation of 50% on the LTIP award).
In illustrating the potential reward the following assumptions have been made:
61
Base salary is the latest known salary (i.e. the salary effective from 1 October 2019) and the value for benefits has been assumed to be equivalent to that included in the single figure calculation on page 66
Employer pension contributions at an assumed rate of 20% based on latest known salaryMaximum performance with share
price appreciation of 50%
Fixed pay Annual bonus and DBP LTIP
Minimum performance Fixed elements of remuneration are base salary, benefits and pension
Performance in line with expectations 50% of salary delivered for achieving
No bonus No LTIP vesting
target performance25% of maximum award vesting (i.e. 31.25% of salary) for achieving threshold performance across all performance measures
Maximum performance 100% of salary awarded for delivering at or above the highest performance in respect of the annual bonus measures
100% of award vesting (125% of salary) for achieving the most stretching level of performance measures attached to the LTIP awards
100% of salary awarded for delivering at or above the highest performance in respect of the annual bonus measures
100% of award vesting (125% of salary) for achieving the most stretching level of performance measures attached to the LTIP awards, plus share price appreciation of 50%.
Awards under the LTIP and deferred shares vesting under the DBP ignore any dividend equivalents that may be awarded.
Marston’s PLC Annual Report and Accounts 2019Governance

Differences in policy from the wider employee populationThe Company aims to provide a remuneration package that is market competitive, complies with any statutory requirements and is applied fairly and equitably across the wider employee population. Where remuneration is not determined by statutory regulation, the Company operates the same core principles as it does for Executive Directors namely:
• we remunerate people in a manner that allows for stability of the business and the opportunity for sustainable long-term growth.
�
�
�
• we seek to remunerate fairly and consistently for each role with due regard to the marketplace, internal consistency and the Group’s ability to pay.
With the exception of a small number of specific operational teams and below Board members of the PLC Executive Committee, all bonus arrangements within the Group normally have the same structure and payout mechanism as those for Executive Directors.
Participation in the DBP and LTIP is extended to the senior management team at the discretion of the Board and, in line with the policy for Executive Directors, share ownership is encouraged and LTIP participants are expected to build and maintain a minimum level of shareholding. We also encourage long-term employee engagement through the offer of SAYE to all employees of the Group who meet a minimum service requirement.
Recruitment remuneration policyExecutive DirectorsWhen hiring a new Executive Director, the Committee will typically seek to use the policy detailed in the table above to determine the Executive Director’s ongoing remuneration package. In determining appropriate remuneration, the Committee will take into consideration all relevant factors (including the quantum and nature of remuneration) to ensure the arrangements are in the best interests of Marston’s and its shareholders. To facilitate the hiring of candidates of the appropriate calibre required to implement the Group’s strategy, the Committee also retains the discretion to include any other remuneration component or award which is outside the policy, however, this discretion is subject to the limits and principles referred to below.
• Base salary will be set at a level appropriate to the role and experience of the Executive Director being appointed. This may include agreement on future increases up to a market rate, in line with experience and/or responsibilities and subject to good performance, where it is considered appropriate.
• Pension and benefits will be provided in line with the policy.
• The Committee will not offer non-performance related incentives (for example a ‘guaranteed sign-on bonus’).
• The circumstances in which other elements may be offered include:
� an interim appointment being made to fill an Executive Director role on a short-term basis;
� if exceptional circumstances require that the Chairman or a Non-executive Director takes on an executive function on a short-term basis.
� if an Executive Director is recruited at a time in the year when it would be inappropriate to provide a bonus or long-term incentive award for that year as there would not be sufficient time to assess performance. Subject to the limit on variable remuneration, the quantum in respect of the months employed during the year may be transferred to the subsequent year so that reward is provided on a fair and appropriate basis.
• The Committee may also alter the performance measures, performance period and vesting period and holding period of the annual bonus, DBP or LTIP, if the Committee determines that the circumstances of the recruitment merit such alteration. The rationale will be clearly explained in the following year’s Directors’ Remuneration Report.
Remuneration Policy continued
The Committee may make an award to ‘buy-out’ remuneration arrangements forfeited on leaving a previous employer. In doing so the Committee will take account of relevant factors including the form of award, any performance conditions attached to these awards and the time over which they would have vested. The Committee would seek to incorporate buy-out awards in line with the Company’s remuneration framework as far as is practical. The Committee may consider other components for structuring the buy-out, including cash or share awards, restricted stock awards and share options where there is a commercial rationale for doing so.
Appropriate costs and support will be covered if the recruitment requires relocation of the individual.
All recruitment awards will normally be liable to forfeiture or ‘clawback’ on early departure. For Executive Directors, early departure is defined as being within the first two years of employment.
The maximum level of variable remuneration which may be granted (excluding buy-out arrangements) is 300% of salary. The Committee will ensure that such awards are linked to the achievement of appropriate and challenging performance measures and will be forfeited if performance or continued employment conditions are not met.
£708k
Ralph Findlay
Minimiumperformance
£1.2m
Performance in line with
expectations
Maximum performance
Maximum performance
(with 50% share price increase)
£2.4m
£2.0m
Tota
l rem
uner
atio
n (£
000)
£2,600
£1,950
£1,300
£650
£0
Base salary, benefits and pension Annual bonus LTIP
100%
16%24%
60%
46%
36%
29% 24%
35% 30%
£477k
Andrew Andrea
£1.6m
£1.3m46%
36%
£790k
16% 29% 24%24%
100% 60% 35% 30%
Minimumperformance
Performance in line with
expectations
Maximum performance
Maximum performance
(with 50% share price increase)
Tota
l rem
uner
atio
n (£
000)
£2,000
£1,500
£1,000
£500
£0
Base salary, benefits and pension Annual bonus LTIP
62 Marston’s PLC Annual Report and Accounts 2019

Non-executive DirectorsFees payable to a newly-appointed Chairman or Non-executive Director will be in line with the fee policy in place at the time of appointment.
Service contracts and policy on payment for loss of officeExecutive Directors’ contracts are on a rolling 12 month basis and are subject to 12 months’ notice when terminated by the Company and six months’ notice when terminated by the Director.
The current Non-executive Directors, including the Chairman, do not have a service contract and their appointments, whilst for a term of three years, may be terminated without compensation at any time. All Non-executive Directors have letters of appointment and their appointment and subsequent re-appointment is subject to annual approval by shareholders.
Name Commencement date Unexpired term remaining as at 28 September 2019
Andrew Andrea 31 March 2009 Terminable on 12 months’ notice.Ralph Findlay 15 August 2001 Terminable on 12 months’ notice.Carolyn Bradley 1 October 2014 Fixed term expiring on 30 September 2020 (subject to renewal) and terminable on one month’s notice.Catherine Glickman 1 December 2014 Fixed term expiring on 30 November 2020 (subject to renewal) and terminable on one month’s notice.Bridget Lea 1 September 2019 Fixed term expiring on 31 August 2022 (subject to renewal) and terminable on one month’s notice.Mathew Roberts 1 March 2017 Fixed term expiring on 24 January 2020 (subject to renewal) and terminable on one month’s notice.William Rucker 1 October 2018 Fixed term expiring on 30 September 2021 (subject to renewal) and terminable on one month’s notice.
Further details on current serving Directors’ service contracts and letters of appointment are available at www.marstons.co.uk in the Investors section.
The principles on which the determination of payments of loss of office will be approached are summarised below:
63
Provision Treatment upon loss of office
Payment in lieu of notice Payments to Executive Directors upon termination of their contracts will be equal to base salary plus the value of core benefits for the duration of the notional notice period.
They will also be entitled to pension contributions for the duration of the notional notice period or the requisite cash allowance equivalent.
Annual bonus This will be at the discretion of the Committee on an individual basis and the decision whether or not to award a bonus in full or in part will be dependent upon a number of factors including the circumstances of their departure and their contribution to the business during the bonus period in question. Any bonus amounts paid (as estimated by the Committee) will typically be pro-rated for time in service to termination and will, subject to performance, be paid at the usual time, although the Committee retains discretion to pay the bonus award earlier in appropriate circumstances. Any bonus earned for the year of departure and the preceding year may be paid wholly in cash, with no deferral.
Deferred bonus The treatment of any award under the DBP will be determined based on the leaver provisions contained within the DBP rules.
For participants leaving before the first anniversary of the date of grant, deferred awards will lapse unless the participant is a ‘good leaver’. For a good leaver the deferred award will vest in full. ‘Good leavers’ are participants who leave as a result of redundancy, death, ill-health, injury or disability, the sale of his employer out of the Group or any other reason at the discretion of the Committee.
For a participant leaving after the first anniversary of the date of grant, the award will vest in full unless employment is terminated for reasons of misconduct (in which case the award will lapse).
Where an award vests, it will ordinarily vest at the originally anticipated vesting date, although the Committee has discretion to accelerate vesting to the date of cessation in appropriate circumstances.
2014 LTIP The treatment of any award under the 2014 LTIP would be determined based on the leaver provisions contained within the 2014 LTIP plan rules.
For ‘good leavers’ unvested LTIP awards will usually be released at the ordinary release date (i.e. following the end of the holding period), although the Committee retains discretion to release awards earlier (for example following the end of the performance period or at the date of cessation) in appropriate circumstances. The vesting of awards is subject to the performance conditions and, unless the Committee determines otherwise, pro-rating for time to reflect the proportion of the performance period that has elapsed. ‘Good leavers’ are participants who leave as a result of death, ill-health, injury or disability, the sale of their employer out of the Group or any other reason at the discretion of the Committee. In other circumstances, unvested LTIP awards will lapse upon the cessation of employment.
If a participant leaves for any reason (other than summary dismissal) after an award has vested but before it has been released (for example, during a holding period), the award will ordinarily continue to the normal release date when it will be released to the extent it vested. The Committee retains discretion to release awards at the date of cessation in appropriate circumstances.
Marston’s PLC Annual Report and Accounts 2019Governance

Remuneration Policy continued
Provision Treatment upon loss of office
Change of control Upon a change of control incentive awards will usually vest and be subject to performance conditions. Pro-rating for time, to reflect the proportion of the performance period that has elapsed will ordinarily apply to LTIP awards. The Committee retains the discretion to waive pro-rating for time. Awards may vest on a similar basis on the occurrence of any other relevant event.
Mitigation Ralph Findlay’s service contract is formed under a model which was approved by the Committee in 2001 and there is no reduction in payments for mitigation or for early payment as the Committee has taken the view that as a long-standing employee of the Group, full compensation would be merited in the event of unilateral termination of his employment by the Group.
Andrew Andrea’s service contract was formed under a new model approved in 2009 and provides that, subject to formal notice being given by either party, any payment during the notice period will be reduced by any amount earned in that period from alternative employment as a result of being released to work for another employer prior to the conclusion of their notice period.
Other payments Payments may be made in the event of loss of office under the SAYE scheme (which is governed by its rules and the applicable tax legislation and does not provide for discretionary treatment). The Committee reserves the right to make any other payments in connection with a Director’s cessation of office or employment where the payments are made in good faith in discharge of an existing legal obligation (or by way of damages for breach of such an obligation) or by way of settlement of any claim arising in connection with the cessation of a Director’s office or employment. Any such payments may include but are not limited to payments in respect of accrued holiday pay, outplacement and legal fees and other relevant benefits.
Further details on current serving Directors’ service contracts and letters of appointment are available at www.marstons.co.uk in the Investors section.
Statement of consideration of employment conditions elsewhere in the GroupSalary, benefits and performance-related rewards provided to employees are taken into account when setting policy for Executive Directors’ remuneration. Although employees are not actively consulted on Directors’ remuneration the Group has regular contact with union bodies on matters of pay and remuneration for employees covered by collective bargaining or consultation arrangements.
In October of each year a paper is submitted to the Committee by the Group HR Director summarising the outcome of any annual reviews made to the wider workforce (which includes all employees except for the majority of pub-based employees who have their remuneration rate set by statute rather than the market). This paper is taken into account when setting Executive Directors’ remuneration effective from the start of October for the following 12 months. In addition, and where relevant, a similar paper is submitted in October covering the decisions taken by the PLC Executive Committee relating to bonus payments for employees within the wider workforce. This is taken into consideration by the Committee when approving bonus awards for Executive Directors.
Our annual engagement survey reaches all of our employees and our first workforce engagement sessions, each of which will be attended by a Non-executive Director, are currently planned to take place during 2020.
Statement of consideration of shareholder viewsThe Committee is committed to open and transparent dialogue with shareholders and welcomes feedback on Executive and Non-executive Directors’ remuneration.
Shareholding guidelinesIn order to further align the interests of Executive Directors with those of shareholders, the Committee applies shareholding guidelines. These guidelines provide that each Executive Director is required to hold shares with a value equal to two times salary. To achieve these holdings Directors are required to retain any vested shares from the LTIP, net of tax, until the guidelines are satisfied. Shares subject to vested LTIP awards which are in a holding period count towards this guideline (on a net of assumed tax basis).
Following employment, Executive Directors are required to retain in their first year post-employment such number of their ‘relevant shares’ as they held at the date of cessation of employment, up to a maximum of the number of shares they were required to hold during employment. In their second year post-employment they are required to retain such number of their ‘relevant shares’ up to a maximum of 50% of the shares they were required to hold during employment. For these purposes, ‘relevant shares’ do not include any shares purchased by the Executive Director, or acquired by the Executive Director as a result of a share plan award granted in respect of a financial year before 2019/20.
64 Marston’s PLC Annual Report and Accounts 2019

Principles• Ensure remuneration arrangements support sustainable growth and strategic objectives of the Group
• Substantial part of the incentive package for Executive Directors is delivered in the Company’s shares to ensure interests are aligned with shareholders• Ensure Director and senior management salaries are set with reference to the wider workforce
Component Time horizon Key features (current Policy) Implementation in 2018/19
2019 2020 2021 2022 2023 2024
Basic salary and core benefits
Reflects scope of the role; to recruit and retain calibre required; and reviewed in context of wider Group
2% increase in salary in 2019 in line with the average salary increases across the Group
Benefits package unchangedAnnual bonus
Maximum 100% of salary
Committee discretion
Clawback provisions apply for up to two years
0% bonus awarded reflecting performance against targets as described on page 67
Deferred element of bonus
Payments in excess of 40% of maximum usually deferred into shares
Malus provisions apply for up to three years
No bonus awarded so no deferral into shares
Long Term Incentive Plan (LTIP)
Maximum annual award is 150% of salary
Normal maximum is 125% of salary
Malus and clawback provisions apply for up to two years
11.2% of the 2016/17 LTIP maximum met the performance conditions and were due to vest. However, the Executive Directors have waived their rights to the award
Awards of 125% of salary granted during the periodShare ownership policy
200% of salary for CEO
100% of salary for other Executive Directors
316% of salary for Ralph Findlay, CEO
118% of salary for Andrew Andrea, CFO
OutcomesFixed
Basic salary, core benefits and pension
VariableAnnual bonus Long-term incentives Total
Andrew Andrea2019 £486,061 £0 £01 £468,0612018 £459,085 £65,536 £0 £524,621
Ralph Findlay2019 £722,432 £0 £01 £722,4322018 £708,523 £97,852 £1,2902 £807,665
1. 11.2% of the 2016/17 LTIP maximum met the performance conditions and were due to vest. However, the Executive Directors have waived their rights to this award.
2. The long-term incentive figure for 2018, for Ralph Findlay, relates to the grant of SAYE option.
How we performed against our objectivesAnnual bonus for 2018/19Performance metric Link to strategy
Underlying Group profit before taxation
Return on capital
Bonus
These measures reflect the Group’s business priorities that underpin our strategy during the year
LTIP vesting in 2018/19 (2016/17 LTIP Award)
Weighting Threshold Target Maximum Actual % of salary
67% £104.0m £107.5m £111.0m £101.0m 0%
33% 10.5% 10.9% 11.3% 10.4% 0%
0%
Remuneration Summary 2019
Performance metric Link to strategy Weighting
CROCCEFree cash flow
Relative TSR
These reflect the sum total of our strategy and ultimately determine the success of the Group during the year
Base ThresholdOn-target
50% vestingMaximum
100% vesting ActualLTIP vesting
% of max
40% 10.5% Base+0.25% Base+0.5% Base+1.0% 10.4% 0%40% £300m Base+7.5% Base+15.0% Base+30.0% £325.2m 11.2%1
Upper 20% – Median –
quintileBelow
median0%
1. 11.2% of the 2016/17 LTIP maximum met the performance conditions and were due to vest. However, the Executive Directors have waived their rights to this award.
65Marston’s PLC Annual Report and Accounts 2019Governance

Annual Report on Remuneration
This part of the Directors’ Remuneration Report sets out how we have implemented our current remuneration policy during the period ended 28 September 2019.
Executive DirectorsSingle total figure of remuneration (audited)
Salary Benefits BonusLong-term incentives Pension Total
Period ended 28 September 2019 £ £ £ £ £ £
Andrew Andrea 377,670 14,857 0 0 75,534 468,061Ralph Findlay 563,900 17,557 0 0 140,975 722,432
Period ended 29 September 2018Salary
£Benefits
£Bonus
£
Long-term incentives1
£Pension
£Total
£
Andrew Andrea 370,260 14,773 65,536 0 74,052 524,621Ralph Findlay 552,840 17,473 97,852 1,290 138,210 807,665
1. The long-term incentives figure for the period ended 29 September 2018, for Ralph Findlay, relates to the grant of SAYE options.
Individual elements of remuneration (audited)Fixed elementsBase SalaryBase salary was reviewed by the Committee and, for 2019/20, the basic salary increase for Executive Directors is 2%, which is in line with the average salary increases across the Group. The base salaries for the individual Executive Directors are as set out below:
2019/20 base salary
2018/19 base salary
Period ended 28 September 2019 £ £ Increase
Andrew Andrea 385,223 377,670 2%Ralph Findlay 575,178 563,900 2%
BenefitsThe single figure table above shows the taxable value of benefits received by the Executive Directors in the period which comprises car allowance, private medical insurance and life assurance.
Retirement benefitsThe pension figures shown in the single figure table above represent the cash value of pension contributions received by the Executive Directors. This includes any salary supplement in lieu of a Company pension contribution.
Pension entitlements:Executive Directors (excluding the Chief Executive Officer) may receive contributions of up to 20% of base salary under the defined contribution pension scheme, an equivalent taxable cash allowance or a combination of the two (up to 20% of base salary).
• Defined contribution scheme. No contributions were made into the Group Personal Pension Plan (GPPP) on behalf of Andrew Andrea during the year. For the period ended 28 September 2019, Andrew Andrea received a cash supplement of 20% in lieu of pension contributions.
• Cash supplement. Ralph Findlay was previously a member of the defined benefit scheme and has opted to no longer accrue future benefits. For the period ended 28 September 2019, Ralph Findlay received a cash supplement of 25% as a salary supplement in lieu of pension contributions. In line with the proposed new policy, from the start of the 2019/20 financial year, Ralph Findlay will receive a cash supplement of 20% in lieu of pension contributions.
• The Committee will continue to review and consider evolving market practice and investor views with regards to the pension arrangements for existing Executive Directors recognising that these are contractual rights. For future hires at Executive Director level, pension provision (or cash allowance) will not exceed the pension contributions available to the majority of those employees who participate in the Company’s GPPP (a current population of around 1,800 employees); this is currently 7% of salary.
• Defined benefit scheme. Ralph Findlay accrued benefits in the defined benefit scheme which closed to future accrual in 2014. Details are shown in the table below:
66
Accrued pension at 30.09.19
£
Accrued pension at 30.09.18
£
Normal retirement
age
Ralph Findlay 117,049 114,349 60
Early retirement can be taken from age 55 provided the Group gives its consent. The accrued pension will then be reduced to take account of its early payment. On Ralph Findlay’s death, before retirement, a spouse’s pension is payable equal to 50% of his pension plus a lump sum equal to his contributions (including those made via salary sacrifice). On death after retirement the spouse’s pension payable is 60% of the member’s pre-commutation pension.
Marston’s PLC Annual Report and Accounts 2019

Variable elementsAnnual Bonus and Deferred Bonus PlanWith the exception of a small number of specific operational teams, and below Board members of the PLC Executive Committee, all bonus arrangements within the Group have the same structure and payout mechanism, though the maximum potential award, expressed as a percentage of salary, varies between different employee groups. Payments are calculated based upon achieving or exceeding pre-set targets for both Group profit and return on capital. Sales and operations teams have additional elements within their bonus schemes linked to segmental and individual performance.
Bonuses to Executive Directors, for the period under review, are based on performance against pre-set targets for both Group profit (two thirds) and return on capital (one third).
2018/19 outturnExecutive Directors could earn a bonus equivalent to 50% of base salary for on-target performance. Above this, the award increases on a linear basis up to a maximum of 100% of base salary. If on-target performance is not achieved then there is a linear reduction in the award using, in the case of the profit measure, the prior period performance as a base.
The targets and actual performance for 2018/19 are set out below:
2018/19 Threshold Target Maximum Actual % of salary Opportunity
Underlying Group profit before taxation £104.0m £107.5m £111.0m £101.0m 0% 67%Return on capital 10.5%1 10.9% 11.3% 10.4% 0% 33%Award 0% 100%
1. The threshold for return on capital is the same as the CROCCE base used for the LTIP performance metric.
2019/20 opportunityThe bonus opportunity for the annual bonus scheme for 2019/20 remains at 100% of salary. However, as detailed in the Annual Statement, CROCCE has been replaced as a performance metric by FCF and the weighting of each measure will be adjusted slightly. Underlying Group profit before tax will represent 60% of the award and FCF 40% of the award.
As detailed in the Annual Statement, up to 20% of potential maximum bonus will be payable for achievement of prior year performance. Given the uncertainty in the market and current environment we are facing, we believe that delivering threshold performance year-on-year is becoming progressively more demanding, especially in light of our tighter margins from an increasingly competitive market and lowering demand. Vesting for on-target performance (i.e. the achievement of target budget) will remain at 50% of maximum and in line with our previous target setting approach, maximum performance will demand high growth delivery from the management team.
The Directors consider that the future Group profit and FCF targets are commercially sensitive matters as they provide competitors with insight into our business plans and expectations and therefore they should remain confidential to the Group until the performance period has ended. The Committee will continue to disclose how the bonus payout delivered relates to performance against the targets on a retrospective basis.
Long Term Incentive PlanVesting in respect of performance during 2018/19 (2016/17 LTIP award)LTIP awards granted in 2016/17 were subject to the achievement of the metrics in the following table. Although the formal vesting date is not until June 2020 the three year performance period ended on 28 September 2019 and the Committee have reviewed the outturn for each measure. Both CROCCE and relative TSR failed to meet threshold performance. However, for the FCF element, the Group achieved £325.2 million which meets the threshold criteria of base +7.5% for this measure. The Committee agreed that 11.2% of the maximum award had met the performance conditions and were due to vest, however, given the challenging performance in 2018/19 and in recognition that there is no bonus payable under the Group bonus scheme, the current Executive Directors have chosen to waive their rights to the award.
– –
Weighting BaseThreshold
at 25%On-target
50% vestingMaximum
100% vesting ActualVesting
% of max
CROCCE 40% 10.5% Base +0.25% Base +0.5% Base +1.0% 10.4% 0%FCF 40% £300m Base +7.5% Base +15% Base +30% £325.2m 11.2%1
Relative TSR 20% MedianUpper quintile
Below median 0%
1. 11.2% of the 2016/17 maximum met the performance conditions and were due to vest. However, the Executive Directors have waived their rights to this award.
• CROCCE removes any potential distortions from subjective decisions on depreciation policy and asset revaluation.
• FCF is set as a three-year cumulative amount.
• Relative TSR against the FTSE 250 Index (excluding Investment Trusts), aligns management’s objectives with those of shareholders and is a broad measure of the extent to which Group strategy is considered appropriate by the market as well as the extent to which it is being well implemented.
• In addition, the Committee applies a general performance underpin which enables the adjustment of the overall level of vesting, if the formulaic output is not justified on the basis of broader business and financial performance.
67
LTIP 2015/16 award lapseThe 2018 Directors’ Remuneration Report stated that the performance measures for the 2015/16 LTIP award had not been achieved. Following the formal vesting date in June 2019, the Committee has confirmed that the awards have lapsed.
Marston’s PLC Annual Report and Accounts 2019Governance

Granted during 2018/19LTIP awards granted during 2018/19 were as follows:
2018/19Percentage of
salary Number of sharesFace value
at grant1% of award
vesting at threshold Performance period Holding period
Andrew Andrea 125% 473,033 £472,087 25% Financial periods Financial periods2018/19–2020/21 2021/22–2022/23Ralph Findlay 125% 706,287 £704,874 25%
1. Calculated using the mid-market share price at date of grant of £0.998.
The same performance conditions and targets apply as for previous awards as set out above.
2019/20 awardsIt is intended to grant awards under the LTIP in 2019/20 at the level of 125% of salary. As set out in the Annual Statement it is proposed to apply the following performance measures and weightings to the plan.
�
�
�
Proposed LTIP measures
20% relative TSR against the FTSE 250 Index (excluding Investment Trusts)40% underlying EPS40% net cash flow (NCF)
The detailed performance metrics and targets are set out below.
• Relative TSR: TSR remains a performance measure. The Committee did consider moving our comparator group to a bespoke peer group. However, after researching different indices and comparator groups, we concluded that this was neither practical nor ultimately of great benefit to either our LTIP participants or our shareholders; we are therefore proposing to retain the FTSE 250 Index (excluding Investment Trusts). For median performance 25% of this element will vest. Upper quartile performance will be required for 100% of the relative TSR element to vest. Rather than seeking to increase the maximum LTIP opportunity we believe setting maximum performance for the relative TSR element at upper quartile performance will provide a fair and equitable LTIP opportunity for delivering strong performance. Upper quartile performance for maximum vesting is also in line with market practice (where the overall LTIP maximum opportunity is not excessive).
• EPS: to allay any concerns regarding the use of underlying EPS as a measure, the Committee will ensure that the earnings being used are quality earnings with safeguards in place which will include the following:
� underlying EPS is an adjusted EPS definition which allows the Committee to adjust reported underlying EPS (for example for material acquisitions or divestments or the impact of new significant changes to accounting such as IFRS 16) to ensure we are reflecting genuine profit improvement;
� the Committee has discretion to amend the pay-out should any formulaic output not reflect the Committee’s assessment of overall business performance;
� malus and clawback triggers are in place and as there is a two year holding period on the LTIP, this makes those provisions easier to apply in practice.
• NCF: net cash flow is as close a measure to debt reduction as we consider appropriate. The Committee wants to ensure that we encourage management to maximise cash available for debt reduction but, if there is an opportunity to use that cash in a more efficient way than paying down debt, for example an acquisition, we do not want to penalise management for what may be a better decision for the Group and all our stakeholders, and which would be reflected in share price and therefore our TSR performance. The Committee will have safeguards in place to ensure that there are no other unintended consequences of this measure, for example, underinvestment in our properties, and the link to earnings will also help to ensure that our capital expenditure investment strategy is delivered or we will see a consequential fall in income.
• Across all of these measures the Committee retains a broad business performance underpin and more general discretion under the plan rules and the policy, to reduce the vesting outcome if it considers that the formulaic outcome is inappropriate.
Weighting Threshold at 25% On-target 50% vesting Maximum 100% vesting
Underlying EPS¹ 40% 12.7p 13.1p 13.9pNCF 40% £100m £125m £150mTSR v FTSE 250 (excluding Investment Trusts) 20% Median – Upper quartile
1. During the performance period the implementation of IFRS 16 ‘Leases’ will have an impact, hence EPS targets are lower than the current year figure.
68
Annual Report on Remuneration continued
Straight-line vesting applies between threshold, on-target and maximum performance.
Marston’s PLC Annual Report and Accounts 2019

Non-executive DirectorsTotal remuneration (Chairman and Non-executive Directors) (audited)Non-executive Directors’ fees are usually reviewed every two years and are set at a level that reflects market conditions and is sufficient to attract individuals with appropriate knowledge and experience. Fees are based on the level of fees paid to Non-executive Directors serving on Boards of similar-sized UK-listed companies and the time commitment and contribution expected for the role. Non-executive Directors receive a basic fee and an additional fee for further duties (for example, chairmanship of a Committee or Senior Independent Director responsibilities).
Base Fee £
Committee Chairman
£SID
£2018/19 Total
£2017/18 Total
£
Carolyn Bradley 54,000 – 7,500 61,500 99,833Catherine Glickman 54,000 7,500 – 61,500 56,000Bridget Lea1 4,500 – – 4,500 –Matthew Roberts 54,000 7,500 – 61,500 54,818William Rucker2 200,000 – – 200,000 –Past Directors
Robin Rowland3 45,000 – – 45,000 50,000
1. Bridget Lea was appointed as a Non-executive Director on 1 September 2019.
2. William Rucker was appointed as Chairman on 1 October 2018.
3. Robin Rowland stepped down from the Board on 31 July 2019.
FeesWilliam Rucker was appointed as Chairman of the Board with effect from 1 October 2018 and receives a fee of £200,000 per annum. Non-executive Directors’ fees, other than the Chairman’s, are determined by the Board and are reviewed every two years. These fees were last reviewed by the Board in 2017/18. The fee structure below has applied for Non-executive Directors since 1 October 2018 and will remain unchanged for 2019/20. Fees for both the Chairman and Non-executive Directors are next scheduled to be reviewed ahead of the 2020/21 financial period, in line with the usual review timetable.
Basic fee £54,000Additional fee for:Chairmanship of the Audit Committee £7,500Chairmanship of the Remuneration Committee £7,500Senior Independent Director £7,500
The maximum authority for Non-executive Directors’ fees (in aggregate), as outlined in our Articles of Association, is £750,000 a year, as approved by shareholders at our 2017 AGM.
Interests in ordinary shares (audited)The beneficial interests of the Non-executive Directors and their connected persons in the share capital of the Company are shown below:
69
As at 28.09.19 As at 29.09.18
Carolyn Bradley 25,000 25,000Catherine Glickman 50,000 50,000Bridget Lea1 – –William Rucker2 100,000 –Matthew Roberts 25,000 25,000Robin Rowland3 152,219 152,219
1. Bridget Lea was appointed as a Non-executive Director on 1 September 2019.
2. William Rucker was appointed as Chairman on 1 October 2018.
3. Robin Rowland stepped down from the Board on 31 July 2019. His interests in ordinary shares are shown as at that date.
Marston’s PLC Annual Report and Accounts 2019Governance

Marston’s TSR FTSE All Share TSR
50
350
300
250
200
150
100
£
3 October 2009
2 October2010
1 October 2011
29 September 2012
5 October 2013
4 October 2014
3 October 2015
1 October2016
29 September 2018
30 September 2017
28 September 2019
Payments to past Directors and payment for loss of office (audited)As disclosed in the 2016/17 Directors Remuneration Report, Peter Dalzell was treated as a ‘good leaver’ for the purpose of his entitlement to vested and unvested LTIPs under the 2014 LTIP plan rules and SAYE. As disclosed on page 67, the 2016/17 LTIP has met the performance conditions for vesting at 11.2% of maximum in June 2020. A time-prorating percentage of 33% will apply to reflect the proportion of the performance period that elapsed whilst still employed by the Group. Details of the award, which will not be released until the ordinary date, are:
Marston’s PLC Annual Report and Accounts 2019
Number of sharesPerformance
% of maxTime pro-rating
percentageNumber of
sharesAverage
share price Value of shares
2016/17 LTIP 310,751 11.2% 33% 11,601 £1.1894¹ £13,798
1. The value of the LTIP for the year ended 28 September 2019 has been calculated at the average share price for three months ending 28 September 2019.
Annual Report on Remuneration continued
Total shareholder return chart and CEO remunerationThis graph shows the value, at 28 September 2019, of £100 invested in the Company on 3 October 2009 compared to the value of £100 invested in the FTSE All Share Index. The FTSE All Share Index has been selected as a comparator because the Company is a member of that index.
The intermediate points show the value at the intervening financial period ends.
The total remuneration of the CEO over the past ten financial periods is shown below. The annual bonus payout and LTIP vesting level as a percentage of the maximum opportunity is also shown.
70
Total remuneration
£
Annual bonus
(% of maximum)
LTIP vesting
(% of maximum)
2018/19 722,432 0% 0%1
2017/18 807,665 17.7% 0%2016/17 803,303 20% 0%2015/16 1,008,320 40% 21%2014/15 876,788 40% 0%2013/14 1,121,294 25% 41.9%2012/13 937,312 0% 44.2%2011/12 815,690 40% 0%2010/11 974,784 46% 0%2009/10 826,677 40% 0%
1. 11.2% of the 2016/17 LTIP maximum met the performance conditions. However, the Executive Directors have waived their rights to this award.

Change in CEO and employee payThe table below shows the percentage change in the salary, benefits and annual bonus for the CEO between the current and previous financial period, compared to the wider workforce, excluding pub staff. The Committee believes this provides a more appropriate comparison as the majority of pub-based staff have their remuneration rate set by statute rather than the market.
Salary Benefits Annual bonus1
CEO 2% 6.6% (100%)Wider workforce 2% 6.6% (100%)
1. With the exception of a small number of sales employees within the wider workforce, no bonuses were payable this year based on Group performance.
Relative importance of spend on payThe table below demonstrates the relative importance of the Group’s expenditure on total employee pay compared to dividend payments to shareholders.
2018/19 2017/18 % change
Dividend payments £47.5m £47.5m –Total employee pay1 £237.7m £230.6m 3.1%
1. Excluding non-underlying items.
External appointments for Executive Directors Executive Directors are permitted to take up external appointments, subject to approval by the Board, and are allowed to retain any fees received.
Ralph Findlay is a Non-executive Director of Bovis Homes Group PLC and during the year he received fees of £71,750. Andrew Andrea is a Non-executive Director of Portmeirion Group Plc and during the year he received fees of £18,300.
Shareholder votingThe following table sets out actual voting outcomes in respect of the Annual Report on Remuneration resolution at the Annual General Meeting (AGM) held on 23 January 2019 and the Directors’ Remuneration Policy resolution at the AGM held on 24 January 2017.
71
Votes for % of vote Votes against % of vote Votes withheld
Approval of the Annual Report on Remuneration (23 January 2019) 87,583,005 99.77% 202,686 0.23% 117,751Approval of the Directors’ Remuneration Policy (24 January 2017) 80,921,034 97.88% 1,753,514 2.12% 1,214,429
Supplementary schedulesShareholding guidelinesIn order to further align the interests of Executive Directors with those of shareholders, the Committee applies shareholding guidelines. These guidelines provide that the Chief Executive Officer is required to hold shares with a value equal to 200% of salary and the Chief Financial Officer is required to hold shares with a value equal to 100% of salary. To achieve these holdings Directors are required to retain any vested shares from the LTIP, net of tax, until the guidelines are satisfied. Shares subject to vested LTIP awards which are in a holding period count towards this guideline (on a net of assumed tax basis).
Under the proposed policy, the minimum shareholding guideline will be increased to 200% of salary for all Executive Directors from the 2019/20 financial period.
Post-employment shareholding requirementIn line with the 2018 Code, from the 2019/20 financial year, Executive Directors are required to retain in their first year post-employment such number of their ‘relevant shares’ as they held at the date of cessation of employment, up to a maximum of the number of shares they were required to hold during employment. In their second year post-employment they are required to retain such number of their ‘relevant shares’ up to a maximum of 50% of the shares they were required to hold during employment. For these purposes, ‘relevant shares’ do not include any shares purchased by the Executive Director, or acquired by the Executive Director pursuant to a share plan award granted in respect of a financial year before 2019/20.
Marston’s PLC Annual Report and Accounts 2019Governance
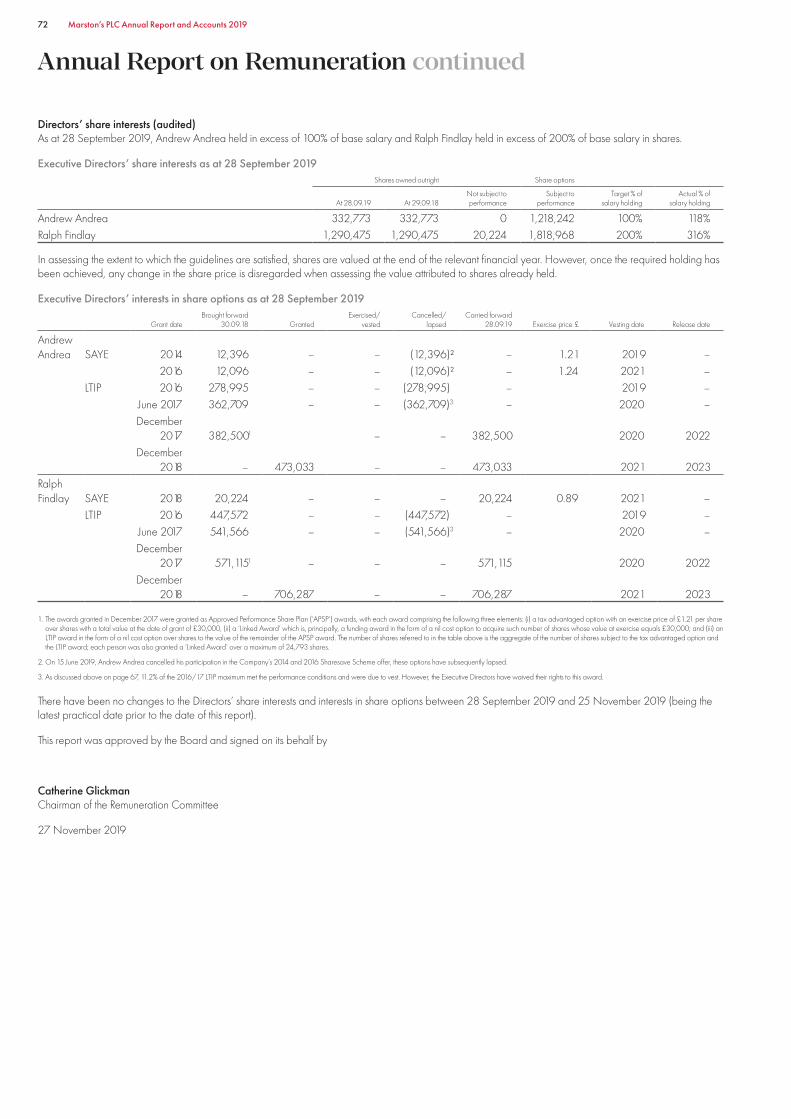
Directors’ share interests (audited)As at 28 September 2019, Andrew Andrea held in excess of 100% of base salary and Ralph Findlay held in excess of 200% of base salary in shares.
Executive Directors’ share interests as at 28 September 2019Shares owned outright Share options
At 28.09.19 At 29.09.18Not subject to performance
Subject to performance
Target % of salary holding
Actual % of salary holding
Andrew Andrea 332,773 332,773 0 1,218,242 100% 118%Ralph Findlay 1,290,475 1,290,475 20,224 1,818,968 200% 316%
In assessing the extent to which the guidelines are satisfied, shares are valued at the end of the relevant financial year. However, once the required holding has been achieved, any change in the share price is disregarded when assessing the value attributed to shares already held.
Executive Directors’ interests in share options as at 28 September 2019
72
Grant dateBrought forward
30.09.18 GrantedExercised/ Cancelled/
vested lapsedCarried forward
28.09.19 Exercise price £ Vesting date Release date
AndrewAndrea SAYE 2014 12,396 – – (12,396)² – 1.21 2019 –
2016 12,096 – – (12,096)² – 1.24 2021 –LTIP 2016 278,995 – – (278,995) – 2019 –
June 2017 362,709 – – (362,709)3 – 2020 –December
2017 382,5001 – – 382,500 2020 2022December
2018 – 473,033 – – 473,033 2021 2023RalphFindlay SAYE 2018 20,224 – – – 20,224 0.89 2021 –
LTIP 2016 447,572 – – (447,572) – 2019 –June 2017 541,566 – – (541,566)3 – 2020 –December
2017 571,1151 – – – 571,115 2020 2022December
2018 – 706,287 – – 706,287 2021 2023
1. The awards granted in December 2017 were granted as Approved Performance Share Plan (‘APSP’) awards, with each award comprising the following three elements: (i) a tax advantaged option with an exercise price of £1.21 per share over shares with a total value at the date of grant of £30,000, (ii) a ‘Linked Award’ which is, principally, a funding award in the form of a nil cost option to acquire such number of shares whose value at exercise equals £30,000; and (iii) an LTIP award in the form of a nil cost option over shares to the value of the remainder of the APSP award. The number of shares referred to in the table above is the aggregate of the number of shares subject to the tax advantaged option and the LTIP award; each person was also granted a ‘Linked Award’ over a maximum of 24,793 shares.
2.
Annual Report on Remuneration continued
On 15 June 2019, Andrew Andrea cancelled his participation in the Company’s 2014 and 2016 Sharesave Scheme offer, these options have subsequently lapsed.
3. As discussed above on page 67, 11.2% of the 2016/17 LTIP maximum met the performance conditions and were due to vest. However, the Executive Directors have waived their rights to this award.
There have been no changes to the Directors’ share interests and interests in share options between 28 September 2019 and 25 November 2019 (being the latest practical date prior to the date of this report).
This report was approved by the Board and signed on its behalf by
Catherine GlickmanChairman of the Remuneration Committee
27 November 2019
Marston’s PLC Annual Report and Accounts 2019

Directors’ Report
Directors’ ReportThis section contains additional information which the Directors are required by law and regulation to include within the Annual Report and Accounts. This section, along with the information from the Chairman’s Statement on page 6 to the Statement of Directors’ Responsibilities on page 76, constitutes the Directors’ Report in accordance with the Companies Act 2006.
Strategic ReportThe Company is required by the Companies Act to include a Strategic Report in this document. The information that fulfils the requirements of the Strategic Report can be found on the inside front cover to page 40, which is incorporated in this report by reference.
Corporate Governance StatementThe Corporate Governance Statement, as required by the Financial Conduct Authority’s Disclosure Guidance and Transparency Rules (DTR) 7.2.1, is set out on page 42 and is incorporated into this report by reference.
Research and developmentOur category and insights team work with external data providers including CGA for on-trade sales and market data; IRI for on-trade data; as well as the BBPA, Kantar and IGD. We undertake in-house consumer research as well as customer satisfaction studies. The annual Marston’s On- and Off-Trade Beer Reports provide an overview of key sector trends as well as recommendations to grow beer sales.
Capital structureDetails of the Company’s issued share capital and of the movements during the period are shown in note 28 to the financial statements on page 119. The Company has one class of ordinary shares and one class of preference shares. On a poll vote, ordinary and preference shareholders have one vote for every 25 pence of nominal value of ordinary and preference share capital held in relation to all circumstances at general meetings of the Company. The issued nominal value of the ordinary shares and preference shares is 100% of the total issued nominal value of all share capital.
There are no specific restrictions on the size of a holding nor on the transfer of shares, which are both governed by the general provisions of the Articles of Association and prevailing legislation. The Directors are not aware of any agreements between holders of the Company’s shares that may result in restrictions on the transfer of securities or on voting rights.
Details of employee share schemes are set out in note 27 to the financial statements on pages 118 to 119. Where shares are held on behalf of the Company’s share schemes, the trustees have waived their right to vote and to dividends.
No person has any special rights of control over the Company’s share capital and all issued shares are fully paid.
Under the Articles of Association, the Directors have authority to allot ordinary shares subject to the aggregate set at the 2019 Annual General Meeting (AGM). The Company was also given authority at its 2019 AGM to make market purchases of ordinary shares up to a maximum number of 63,397,461 shares. Similar authority will again be sought from shareholders at the 2020 AGM.
With regard to the appointment and replacement of Directors, the Company is governed by its Articles of Association, the UK Corporate Governance Code, the Companies Act 2006 and related legislation. The Articles may be amended by special resolution of the shareholders. The powers of the Directors are further described in the Corporate Governance Report on pages 46 to 49.
DirectorsBiographies of the Directors currently serving on the Board are set out on pages 44 and 45.
Changes to the Board during the period are set out in the Corporate Governance Report starting on page 46. Details of Directors’ service contracts are set out in the Directors’ Remuneration Report on page 63.
In accordance with the requirements of the UK Corporate Governance Code, all Directors will offer themselves for re-election at the AGM on 24 January 2020, other than Bridget Lea and Octavia Morley who will offer themselves for election following their appointments to the Board, and Catherine Glickman who is not standing for re-election.
Change of controlThere are a number of agreements that take effect after, or terminate upon, a change of control of the Company, such as commercial contracts, bank loan agreements, property lease arrangements and employee share plans. None of these are considered to be significant in terms of their likely impact on the business as a whole. Furthermore, the Directors are not aware of any agreements between the Company and its Directors or employees that provide for compensation for loss of office or employment that occurs because of a takeover bid.
Dividends on ordinary sharesAn interim dividend of 2.7 pence per ordinary share was paid on 2 July 2019. The Directors recommend a final dividend of 4.8 pence per ordinary share to be paid on 27 January 2020 to shareholders on the register on 13 December 2019. This would bring the total dividend for 2018/19 to 7.5 pence per ordinary share (2018: 7.5 pence per ordinary share). The payment of the final dividend is subject to shareholder approval at the AGM.
Preference sharesThe preference shares carry the right to a fixed cumulative preferential dividend at the rate of 6% per annum payable in June and December. Further details are given in note 19 to the financial statements on page 110.
Interests in voting rightsNotifications of the following voting interests in the Company’s ordinary share capital have been received by the Company (in accordance with Chapter 5 of the DTR). The information shown below was correct at the time of disclosure. However, the date received may not have been within the current financial reporting period and the percentages shown (as provided at the time of disclosure) have not been re-calculated based on the issued share capital at the period end. It should also be noted that these holdings may have changed since the Company was notified, however, notification of any change is not required until the next notifiable threshold is crossed.
No further notifications have been received by the Company between 28 September 2019 and 25 November 2019 (being the latest practical date prior to the date of this report).
Ordinary shares of 7.375 pence each
Shareholder
As at 28 September 2019
Voting rights% of
voting rightsNature of
interest
Dimensional Fund Advisors LLP 9,373,005 5.00% IndirectThe Capital Group Companies, Inc 9,291,379 4.97% IndirectStandard Life Aberdeen plc 9,228,860 4.93% IndirectBrewin Dolphin 8,392,337 4.94% IndirectRoyal London Asset Management Limited 6,794,023 3.99% Direct
73Marston’s PLC Annual Report and Accounts 2019Governance

The Company also discloses the following information, obtained from the Register of Members, for the preference shares:
Preference shares
Shareholder Number
% ofpreference
share voting rights
Fiske Nominees Ltd 34,048 45.40%Mrs HM Medlock 10,407 13.88%George Mary Allison Ltd 5,500 7.33%Mr PF and Dr K Knowles 4,356 5.81%Mr N Aston and Mr TA Southall 2,855 3.81%CGWL Nominees Limited 2,805 3.74%Mrs H Michels 2,750 3.67%Mr R Somerville 2,750 3.67%
Insurance and indemnitiesThe Company maintains Directors’ and Officers’ Liability Insurance in respect of legal action that might be brought against its Directors and Officers. In accordance with the Company’s Articles of Association and to the extent permitted by law, the Company has indemnified each of its Directors and other Officers of the Group against certain liabilities that may be incurred as a result of their position within the Group. These indemnities were in place for the whole of the period ended 28 September 2019 and as at the date of the report. There are no indemnities in place for the benefit of the Auditors.
Employee informationThe average number of employees within the Group is shown in note 5 to the financial statements on page 99.
Apart from ensuring that an individual has the ability to carry out a particular role, we do not discriminate in any way. We endeavour to retain employees if they become disabled, making reasonable adjustments to their role and, if necessary, look for redeployment opportunities within the Group. We also ensure that training, career development and promotion opportunities are available to all employees irrespective of gender, race, age or disability.
The Group is committed to keeping employees informed of business performance and our strategy, aiming to drive engagement and ensure employees are enabled. We do this in a variety of ways from presentations of the interim and annual results by senior management, to video and email messages from our CEO. In addition, there are a range of internal communication channels including newsletters, magazines, apps and briefings to keep employees abreast of developments. Employees’ views are sought through regular engagement surveys across the Group and action plans are put in place to respond to issues arising. Employees are also encouraged to participate in the Company’s SAYE scheme.
Human rightsMarston’s is committed to respecting and upholding human rights, as expressed in the United Nations Universal Declaration of Human Rights, within our business and also within our supply chain. Our Ways of Working are aligned with our belief of, and commitment to, the Declaration of Human Rights. Our Human Rights policy is available at www.marstons.co.uk/responsibility
Modern Slavery StatementOur Modern Slavery Act disclosure is available on our website www.marstons.co.uk/responsibility
Environmental policy and mandatory greenhouse gas emissions reportingOur approach to corporate responsibility is closely correlated with our Group’s strategic objectives. One of our key priorities is to reduce our environmental impact. We recognise the importance of this to the long-term profitability of the business and operating a high quality estate. Many of the environmental initiatives we adopt reduce our environmental impact as well saving expenditure on energy and utilities.
Each year Marston’s publishes its approach on Corporate Responsibility on its website available at www.marstons.co.uk. The report includes information on our environmental performance by business area including energy consumption, water usage, waste volumes and recycling rates.
We have made particularly good progress increasing the waste recycling rates within our pubs over the last three years from 60% to 77%, and we now operate as a ‘Zero Waste to Landfill’ business.
We have operated as a ‘Zero Waste to Landfill’ business now for two years, and this year we have further improved our food recycling. Up to 80% of our sites with a food offer now recycle their food waste, equating to 4,300 tonnes a year diverted from landfill.
Total energy emissions decreased by 3.7% this year compared to last. Our gas emissions actually increased by 6.7% as a result of activity, but our electricity emissions fell by 14.1% as a result of completing various energy saving investments including: free air cellar cooling where we have cellars above ground, this uses ambient air to cool our cellars rather than air conditioning, installation of LED lighting into back-of-house areas, voltage optimisation, building management systems, heating control systems and heat recovery systems.
Fuel Types
2019 2018
CO2e tonnes
CO2e tonnes
Electricity and gas 96,190 100,365Petrol and diesel 13,730 13,788Refrigerants – breweries 1 9Refrigerants – pubs 4,813 5,179LPG 2,719 2,575Oil 187 215
20182019
Greenhouse Gas Emissions Intensity Ratio:CO2e tonnes per £100,000 of turnover 10.05 10.71
Notes:
1. We report on all the measured emissions sources required under the Companies Act 2006 (Strategic Report and Directors’ Reports) Regulations 2013.
2.
Directors’ Report continued
Data collected is in respect of the year ended 30 June 2019, in accordance with the Simplified Energy and Carbon Reporting regulation.
74 Marston’s PLC Annual Report and Accounts 2019
Political donationsOur policy is not to make any donations for political purposes in the UK or to donate to EU political parties or incur EU political expenditure.
Financial instrumentsThe disclosures required in relation to the use of financial instruments by the Group together with details of our treasury policy and management are set out in note 25 to the financial statements on pages 112 to 118.
AuditorsFollowing the audit tender process in 2017, KPMG LLP will succeed PricewaterhouseCoopers LLP as the Company’s Independent Auditors from the 2019/20 financial year.
Going concernThe Group’s business activities, together with the factors likely to affect its future development, performance and position are set out in the Strategic Report. The financial position of the Group is described on pages 26 to 28. In addition, note 25 to the financial statements on pages 112 to 118 includes the Group’s objectives, policies and processes for managing its exposures to interest rate risk, foreign currency risk, counterparty risk, credit risk and liquidity risk. Details of the Group’s financial instruments and hedging activities are also provided in note 25.
The Board has a reasonable expectation that the Group and the Company have adequate resources to continue in operational existence for the foreseeable future. Accordingly, the financial statements set out on pages 85 to 123 and 124 to 134 have been prepared on the going concern basis.
Annual General MeetingThe AGM of the Company will be held at Wolverhampton Wanderers Football Club, Molineux Stadium, Waterloo Road, Wolverhampton WV1 4QR at 11:00am on 24 January 2020. The notice convening the meeting, together with details of the special business to be considered and explanatory notes for each resolution, is distributed separately to shareholders. It is also available in the shareholder section of our website at www.marstons.co.uk/investors where a copy can be viewed and downloaded.
By order of the Board
Anne-Marie BrennanGroup Secretary
27 November 2019
Company registration number: 31461
75Marston’s PLC Annual Report and Accounts 2019Governance

Statement of Directors’ Responsibilities in respect of the Financial Statements
Marston’s PLC Annual Report and Accounts 2019
The Directors are responsible for preparing the Annual Report and the financial statements in accordance with applicable law and regulation.
Company law requires the Directors to prepare financial statements for each financial year. Under that law the Directors have prepared the Group financial statements in accordance with International Financial Reporting Standards (IFRS) as adopted by the European Union and the Company financial statements in accordance with United Kingdom Generally Accepted Accounting Practice (United Kingdom Accounting Standards, comprising FRS 102 “The Financial Reporting Standard applicable in the UK and Republic of Ireland”, and applicable law). Under company law the Directors must not approve the financial statements unless they are satisfied that they give a true and fair view of the state of affairs of the Group and Company and of the profit or loss of the Group for that period. In preparing the financial statements, the Directors are required to:
• select suitable accounting policies and then apply them consistently;
• state whether applicable IFRS as adopted by the European Union have been followed for the Group financial statements and United Kingdom Accounting Standards, comprising FRS 102, have been followed for the Company financial statements, subject to any material departures disclosed and explained in the financial statements;
• make judgements and accounting estimates that are reasonable and prudent; and
• prepare the financial statements on the going concern basis unless it is inappropriate to presume that the Group and Company will continue in business.
The Directors are responsible for safeguarding the assets of the Group and Company and hence for taking reasonable steps for the prevention and detection of fraud and other irregularities.
The Directors are also responsible for keeping adequate accounting records that are sufficient to show and explain the Group and Company’s transactions and disclose with reasonable accuracy at any time the financial position of the Group and Company and enable them to ensure that the financial statements and the Directors’ Remuneration Report comply with the Companies Act 2006 and, as regards the Group financial statements, Article 4 of the IAS Regulation.
The Directors are responsible for the maintenance and integrity of the Company’s website. Legislation in the United Kingdom governing the preparation and dissemination of financial statements may differ from legislation in other jurisdictions.
Directors’ confirmationsThe Directors consider that the Annual Report and Accounts, taken as a whole, is fair, balanced and understandable and provides the information necessary for shareholders to assess the Group and Company’s position and performance, business model and strategy.
Each of the Directors, whose names and functions are listed on pages 44 and 45 confirm that, to the best of their knowledge:
• the Company financial statements, which have been prepared in accordance with United Kingdom Generally Accepted Accounting Practice (United Kingdom Accounting Standards, comprising FRS 102 and applicable law), give a true and fair view of the assets, liabilities, financial position and loss of the Company;
• the Group financial statements, which have been prepared in accordance with IFRS as adopted by the European Union, give a true and fair view of the assets, liabilities, financial position and loss of the Group; and
• the Strategic Report together with the Directors’ Report includes a fair review of the development and performance of the business and the position of the Group and Company, together with a description of the principal risks and uncertainties that it faces.
In the case of each Director in office at the date the Directors’ Report is approved:
• so far as the Director is aware, there is no relevant audit information of which the Company’s auditors are unaware; and
• they have taken all the steps that they ought to have taken as a Director in order to make themselves aware of any relevant audit information and to establish that the Company’s auditors are aware of that information.
Ralph Findlay Andrew AndreaChief Executive Officer Chief Financial and
Corporate Development Officer
27 November 2019
76

77Marston’s PLC Annual Report and Accounts 2019Financial Statements
Financial StatementsFive Year Record 78Independent Auditors’ Report 79Group Accounts 85Notes to the Group Accounts 89Company Accounts 124Notes to the Company Accounts 126

78 Marston’s PLC Annual Report and Accounts 2019
2015 (52 weeks)
£m
2016 (52 weeks)
£m
2017 (52 weeks)
£m
2018 (52 weeks)
£m
2019 (52 weeks)
£m
Underlying revenue 845.5 905.8 992.2 1,140.4 1,173.5Underlying profit before taxation 90.9 97.3 100.1 104.0 101.0Non-underlying items (59.6) (16.5) 0.2 (49.7) (121.0)Profit/(loss) before taxation 31.3 80.8 100.3 54.3 (20.0)Taxation* (8.0) (7.8) (15.6) (9.3) 2.0Profit/(loss) after taxation 23.3 73.0 84.7 45.0 (18.0)
Net assets 782.9 752.1 931.4 957.6 811.1
Earnings/(loss) per ordinary share 4.1p 12.7p 14.2p 7.1p (2.8)pNon-underlying items 8.7p 1.2p – 6.8p 16.3pUnderlying earnings per ordinary share 12.8p 13.9p 14.2p 13.9p 13.5p
Dividend per ordinary share 7.0p 7.3p 7.5p 7.5p 7.5p
*
Five Year Record
Taxation includes the tax on non-underlying items together with a non-underlying credit of £2.4 million in 2016 in respect of the change in corporation tax rate and a non-underlying credit of £4.1 million in 2016 in respect of the additional tax relief claimed for previous periods following the agreement of the tax treatment of certain items with HM Revenue & Customs.

79Marston’s PLC Annual Report and Accounts 2019Financial Statements
Report on the audit of the financial statements
OpinionIn our opinion,
• Marston’s PLC’s Group financial statements and Company financial statements (the “financial statements”) give a true and fair view of the state of the Group’s and of the Company’s affairs as at 28 September 2019 and of the Group’s loss and cash flows for the 52 week period (the “period”) then ended;
• the Group financial statements have been properly prepared in accordance with International Financial Reporting Standards (IFRS) as adopted by the European Union;
• the Company financial statements have been properly prepared in accordance with United Kingdom Generally Accepted Accounting Practice (United Kingdom Accounting Standards, comprising FRS 102 “The Financial Reporting Standard applicable in the UK and Republic of Ireland”, and applicable law); and
• the financial statements have been prepared in accordance with the requirements of the Companies Act 2006 and, as regards the Group financial statements, Article 4 of the IAS Regulation.
Independent auditors’ report to the members of Marston’s PLC
We have audited the financial statements, included within the Annual Report and Accounts (the “Annual Report”), which comprise: the Group and Company Balance Sheets as at 28 September 2019; the Group Income Statement and Group Statement of Comprehensive Income, the Group Cash Flow Statement, and the Group and Company Statements of Changes in Equity for the period then ended; and the notes to the financial statements, which include a description of the significant accounting policies.
Our opinion is consistent with our reporting to the Audit Committee.
Basis for opinionWe conducted our audit in accordance with International Standards on Auditing (UK) (“ISAs (UK)”) and applicable law. Our responsibilities under ISAs (UK) are further described in the Auditors’ responsibilities for the audit of the financial statements section of our report. We believe that the audit evidence we have obtained is sufficient and appropriate to provide a basis for our opinion.
IndependenceWe remained independent of the Group in accordance with the ethical requirements that are relevant to our audit of the financial statements in the UK, which includes the FRC’s Ethical Standard, as applicable to listed public interest entities, and we have fulfilled our other ethical responsibilities in accordance with these requirements.
To the best of our knowledge and belief, we declare that non-audit services prohibited by the FRC’s Ethical Standard were not provided to the Group or the Company.
Other than those disclosed in note 3 to the financial statements, we have provided no non-audit services to the Group or the Company in the period from 30 September 2018 to 28 September 2019.
Our audit approachOverview
• Valuation of the estate (notes 1, 4, 11, 12 and 18) (Group and Company).• Disclosure of items as ‘non-underlying’ (notes 1 and 4) (Group).• Valuation of financial instruments (notes 1, 4, 21 and 25) (Group).• Presentation and disclosure of the expected impact of IFRS 16 (note 1) (Group).
• Overall Group materiality: £5.1 million (2018: £5.2 million), based on 5% of profit before tax and non-underlying items.
• Overall Company materiality: £23.7 million (2018: £23.0 million), based on 1.75% of net assets.
• Audit performed at the level of the consolidated Group.
Materiality
Audit scope
Key auditmatters

80 Marston’s PLC Annual Report and Accounts 2019
Independent auditors’ report to the members of Marston’s PLC continuedThe scope of our auditAs part of designing our audit, we determined materiality and assessed the risks of material misstatement in the financial statements. In particular, we looked at where the Directors made subjective judgements, for example in respect of significant accounting estimates that involved making assumptions and considering future events that are inherently uncertain.
Capability of the audit in detecting irregularities, including fraudBased on our understanding of the Group and industry, we identified that the principal risks of non-compliance with laws and regulations related to unethical and prohibited business practices, and we considered the extent to which non-compliance might have a material effect on the financial statements. We also considered those laws and regulations that have a direct impact on the preparation of the financial statements such as the Companies Act 2006, the Listing Rules and UK tax legislation. We evaluated management’s incentives and opportunities for fraudulent manipulation of the financial statements (including the risk of override of controls), and determined that the principal risks were related to posting inappropriate entries to increase revenue or reduce expenditure, and management bias in accounting estimates. The Group engagement team audits the whole Group, therefore the risk assessment and procedures performed was consistent throughout the whole Group. Audit procedures performed by the Group engagement team included:
• Discussions with management and internal audit to ascertain whether there were any known or suspected instances of non-compliance with laws and regulations and fraud;
• Identifying and testing journal entries, in particular any journal entries posted with unusual account combinations or posted by senior management;
• Challenging assumptions and judgements made by management in their significant accounting estimates.
There are inherent limitations in the audit procedures described above and the further removed non-compliance with laws and regulations is from the events and transactions reflected in the financial statements, the less likely we would become aware of it. Also, the risk of not detecting a material misstatement due to fraud is higher than the risk of not detecting one resulting from error, as fraud may involve deliberate concealment by, for example, forgery or intentional misrepresentations, or through collusion.
Key audit mattersKey audit matters are those matters that, in the auditors’ professional judgement, were of most significance in the audit of the financial statements of the current period and include the most significant assessed risks of material misstatement (whether or not due to fraud) identified by the auditors, including those which had the greatest effect on: the overall audit strategy; the allocation of resources in the audit; and directing the efforts of the engagement team. These matters, and any comments we make on the results of our procedures thereon, were addressed in the context of our audit of the financial statements as a whole, and in forming our opinion thereon, and we do not provide a separate opinion on these matters. This is not a complete list of all risks identified by our audit.
Key audit matter How our audit addressed the key audit matter
Valuation of the estate (notes 1, 4, 11, 12 and 18) – Group and CompanyWe focus on the Directors’ annual assessment of the carrying value of land and buildings because properties are a significant item on the balance sheet and there are complex and subjective assumptions used in the valuations, including the future expected financial performance of pubs and the earnings multiples applied. A full external valuation of the estate was undertaken during FY18.
In FY19, management have undertaken an exercise to identify if there have been any impairment triggers or changes in value such as a change in market conditions or a fall in the trading results of a pub or segment. Other factors considered relate to property based transactions both within the marketplace and the Marston’s estate, which could indicate changes in the carrying value of the estate. Management have noted such triggers and have recognised a net impairment charge of £69.2 million, of which a net charge of £44.6 million has been recorded in the income statement and a net charge of £24.6 million has been recorded within the revaluation reserve within equity.
This represents a significant matter considered by the Audit Committee as discussed on page 53 to the financial statements.
We reviewed the Directors’ annual assessment and assessed the appropriateness and completeness of the impairment triggers identified. We utilised internal specialists to validate the conclusions reached, taking into account the impact of any changes in macroeconomic conditions, pub performance within each segment and recent market transactions.
We have examined the assumptions within the impairment model and checked that the source data utilised therein agrees to the underlying financial records. For those premises identified as having an impairment trigger, largely as a result of poor trading performance, we looked at historical pub performance and the planned level of investment in a property which would be required to bring that location up to the Fair Maintainable Trade (FMT) value determined in the FY18 full external valuation. Those premises where the investment spend was not merited and where there were no other relevant factors impacting performance were subject to an impairment charge.
We found management’s assumptions to be reasonable and have concluded that the estate continues to be valued in line with the Group’s policy using appropriate methodologies and assumptions, which are consistent with IFRS.
In light of the announcement relating to disposal of a portfolio of pubs subsequent to the balance sheet date we have considered whether the loss on disposal represents an impairment trigger requiring further impairment reviews by management. We are satisfied that no such factors exist in the remaining estate. We are also satisfied that the disposal was not committed to at the current period end and the related pubs did not meet the definition of “assets held for sale”.

81Marston’s PLC Annual Report and Accounts 2019Financial Statements
Key audit matter How our audit addressed the key audit matter
Valuation of financial instruments (notes 1, 4, 21 and 25) – GroupThe Group holds a number of interest rate swaps which are categorised as financial instruments at fair value through profit or loss. There is one instrument which is currently designated as part of a hedging relationship. The fair value of these instruments represents a material liability on the Group’s balance sheet. The Group is exposed to fair value and interest rate movements across all of these instruments, and where a hedging relationship has not been designated, this creates volatility in the income statement.
This represents a significant matter considered by the Audit Committee as discussed on page 53 to the financial statements.
We have obtained third party confirmations for all interest rate swaps and ensured these are consistent with the amounts recognised by the Group.
We used valuation specialists to form an independent expectation of the risk free valuation for all of these interest rate swaps. Our valuation specialists also estimated the impact of the credit risk adjustment arising from the Group’s own credit risk for these liabilities.
We considered the hedge effectiveness testing for the one hedging relationship, validating the accuracy of the calculation and confirming that the hedge remains effective.
We found the valuation of interest rate swaps to be consistent with the evidence obtained.
Disclosure of items as ‘non-underlying’ (notes 1 and 4) – GroupThe financial statements include certain items which are disclosed as ‘non-underlying’ such as movements in financial assumptions used in determining onerous lease provisions, reorganisation and integration costs, impairment of freehold and leasehold properties, write-off of EPOS equipment, write-off of acquisition and development costs, past service cost in respect of Guaranteed Minimum Pension equalisation, net interest on the net defined benefit asset/liability, swap recouponing fees and interest rate swap movements. Management has included these items as non-underlying using the criteria explained in their accounting policy which is disclosed in note 1 to the financial statements.
We focused on this area because non-underlying items are not defined by IFRS as adopted by the European Union and it therefore requires judgement by the Directors to identify such items. Consistency in identifying and disclosing items as non-underlying is important to maintain comparability of the current period results with previous periods.
This represents a significant matter considered by the Audit Committee as discussed on page 53 to the financial statements.
We challenged the appropriateness of the Group’s accounting policy and whether those items disclosed as non-underlying were consistent with the accounting policy and the approach taken in previous accounting periods. We found the Group’s accounting policy to be appropriate and the classification of items to be consistent with the accounting policy.
We also considered whether the threshold applied by management to non-underlying items by reference to the financial statement line item affected. For example, certain property related items are considered by management to have a higher threshold for disclosure as non-underlying. We concluded that the thresholds adopted are appropriate in the circumstances.
We challenged whether other non-recurring items should have been classified as non-underlying and discussed this with the Directors and the Audit Committee. We confirmed that all significant items meet the criteria in the Group’s accounting policy and that the treatment was consistent year on year and there are no further significant items that require disclosure as non-underlying.
Presentation and disclosure of the expected impact ofIFRS 16 (note 1) – GroupIFRS 16 will be adopted by the Group from 29 September 2019 on a modified retrospective basis. The Group has finalised its assessment of the impact that the new accounting standard will have on its balance sheet and income statement. In accordance with IAS 8 the expected impact is disclosed in note 1 to the financial statements.
In order to compute the transitional impact of IFRS 16 the Group has created a spreadsheet model summarising all property and equipment lease data. There are a number of judgements applied and estimates made within the model for example the appropriate discount rate to be utilised for each lease and the assumptions around lease renewals.
This represents a significant matter considered by the Audit Committee as discussed on page 53 to the financial statements.
We have obtained and inspected a sample of inputs into management’s model and agreed these back to the original lease agreements and the underlying financial records. We have recalculated the accounting entries for a sample of leases and confirmed management’s model is performing this calculation accurately. We have considered completeness by reconciling the model to the Group’s operating lease commitments (disclosed per note 32 to the financial statements).
We have assessed the methodology applied to calculate the discount rate using an incremental borrowing rate specific to the Group in line with IFRS 16. We have considered the other assumptions to be appropriate including ensuring all the leases meet the definition of a lease under IFRS 16 and that the lease term is accurate.
We are satisfied that the disclosure of the expected impact of IFRS 16 is in accordance with the Group’s stated accounting policy in relation to new accounting standards and the disclosure of the transitional impact on adoption, per note 1 to the financial statements, is appropriate.
How we tailored the audit scopeWe tailored the scope of our audit to ensure that we performed enough work to be able to give an opinion on the financial statements as a whole, taking into account the structure of the Group and the Company, the accounting processes and controls, and the industry in which they operate.
The Group is structured along three business lines being Destination and Premium, Taverns and Brewing, supported by Group Services. The Group financial statements are a consolidation of subsidiaries and special purpose entities, principally comprising the Group’s operating businesses, property companies, securitisation vehicles, holding companies and an insurance company. In establishing the overall approach to the Group audit we considered the consolidated trial balance for the Group as a whole and designed our audit testing for each financial statement line item based on the size and nature of the transactions and balances that are aggregated to form that line item and our assessment of the risk of material misstatement. We used our professional judgement to determine the nature and extent of testing required over each line item in the financial statements.
We did not identify any key audit matters relating to irregularities, including fraud. As in all of our audits we also addressed the risk of management override of internal controls, including testing journals and evaluating whether there was evidence of bias by the Directors that represented a risk of material misstatement due to fraud.
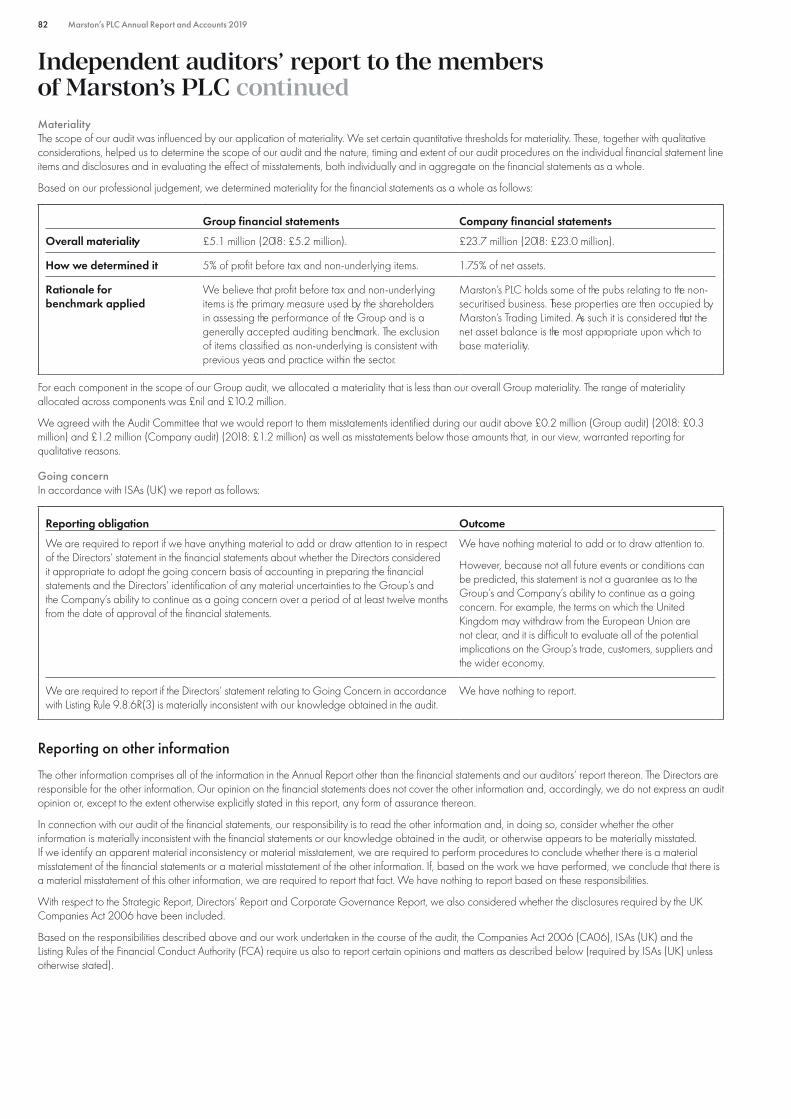
82 Marston’s PLC Annual Report and Accounts 2019
Independent auditors’ report to the members of Marston’s PLC continuedMaterialityThe scope of our audit was influenced by our application of materiality. We set certain quantitative thresholds for materiality. These, together with qualitative considerations, helped us to determine the scope of our audit and the nature, timing and extent of our audit procedures on the individual financial statement line items and disclosures and in evaluating the effect of misstatements, both individually and in aggregate on the financial statements as a whole.
Based on our professional judgement, we determined materiality for the financial statements as a whole as follows:
Group financial statements Company financial statements
Overall materiality £5.1 million (2018: £5.2 million). £23.7 million (2018: £23.0 million).
How we determined it 5% of profit before tax and non-underlying items. 1.75% of net assets.
Rationale for benchmark applied
We believe that profit before tax and non-underlying items is the primary measure used by the shareholders in assessing the performance of the Group and is a generally accepted auditing benchmark. The exclusion of items classified as non-underlying is consistent with previous years and practice within the sector.
Marston’s PLC holds some of the pubs relating to the non-securitised business. These properties are then occupied by Marston’s Trading Limited. As such it is considered that the net asset balance is the most appropriate upon which to base materiality.
For each component in the scope of our Group audit, we allocated a materiality that is less than our overall Group materiality. The range of materiality allocated across components was £nil and £10.2 million.
We agreed with the Audit Committee that we would report to them misstatements identified during our audit above £0.2 million (Group audit) (2018: £0.3 million) and £1.2 million (Company audit) (2018: £1.2 million) as well as misstatements below those amounts that, in our view, warranted reporting for qualitative reasons.
Going concernIn accordance with ISAs (UK) we report as follows:
Reporting obligation Outcome
We are required to report if we have anything material to add or draw attention to in respect of the Directors’ statement in the financial statements about whether the Directors considered it appropriate to adopt the going concern basis of accounting in preparing the financial statements and the Directors’ identification of any material uncertainties to the Group’s and the Company’s ability to continue as a going concern over a period of at least twelve months from the date of approval of the financial statements.
We have nothing material to add or to draw attention to.
However, because not all future events or conditions can be predicted, this statement is not a guarantee as to the Group’s and Company’s ability to continue as a going concern. For example, the terms on which the United Kingdom may withdraw from the European Union are not clear, and it is difficult to evaluate all of the potential implications on the Group’s trade, customers, suppliers and the wider economy.
We are required to report if the Directors’ statement relating to Going Concern in accordance with Listing Rule 9.8.6R(3) is materially inconsistent with our knowledge obtained in the audit.
We have nothing to report.
Reporting on other information
The other information comprises all of the information in the Annual Report other than the financial statements and our auditors’ report thereon. The Directors are responsible for the other information. Our opinion on the financial statements does not cover the other information and, accordingly, we do not express an audit opinion or, except to the extent otherwise explicitly stated in this report, any form of assurance thereon.
In connection with our audit of the financial statements, our responsibility is to read the other information and, in doing so, consider whether the other information is materially inconsistent with the financial statements or our knowledge obtained in the audit, or otherwise appears to be materially misstated. If we identify an apparent material inconsistency or material misstatement, we are required to perform procedures to conclude whether there is a material misstatement of the financial statements or a material misstatement of the other information. If, based on the work we have performed, we conclude that there is a material misstatement of this other information, we are required to report that fact. We have nothing to report based on these responsibilities.
With respect to the Strategic Report, Directors’ Report and Corporate Governance Report, we also considered whether the disclosures required by the UK Companies Act 2006 have been included.
Based on the responsibilities described above and our work undertaken in the course of the audit, the Companies Act 2006 (CA06), ISAs (UK) and the Listing Rules of the Financial Conduct Authority (FCA) require us also to report certain opinions and matters as described below (required by ISAs (UK) unless otherwise stated).
83Marston’s PLC Annual Report and Accounts 2019Financial Statements
Strategic Report and Directors’ Report
In our opinion, based on the work undertaken in the course of the audit, the information given in the Strategic Report and Directors’ Report for the period ended 28 September 2019 is consistent with the financial statements and has been prepared in accordance with applicable legal requirements. (CA06)
In light of the knowledge and understanding of the Group and Company and their environment obtained in the course of the audit, we did not identify any material misstatements in the Strategic Report and Directors’ Report. (CA06)
Corporate Governance Statement
In our opinion, based on the work undertaken in the course of the audit, the information given in the Corporate Governance Report (on pages 46 to 49)about internal controls and risk management systems in relation to financial reporting processes and about share capital structures in compliance with rules 7.2.5 and 7.2.6 of the Disclosure Guidance and Transparency Rules sourcebook of the FCA (“DTR”) is consistent with the financial statements and has been prepared in accordance with applicable legal requirements. (CA06)
In light of the knowledge and understanding of the Group and Company and their environment obtained in the course of the audit, we did not identify any material misstatements in this information. (CA06)
In our opinion, based on the work undertaken in the course of the audit, the information given in the Corporate Governance Report (on pages 46 to 49)with respect to the Company’s corporate governance code and practices and about its administrative, management and supervisory bodies and their committees complies with rules 7.2.2, 7.2.3 and 7.2.7 of the DTR. (CA06)
We have nothing to report arising from our responsibility to report if a corporate governance statement has not been prepared by the Company. (CA06)
The Directors’ assessment of the prospects of the Group and of the principal risks that would threaten the solvency or liquidity of the Group
We have nothing material to add or draw attention to regarding:
• The Directors’ confirmation on page 30 of the Annual Report that they have carried out a robust assessment of the principal risks facing the Group, including those that would threaten its business model, future performance, solvency or liquidity.
• The disclosures in the Annual Report that describe those risks and explain how they are being managed or mitigated.
• The Directors’ explanation on page 36 of the Annual Report as to how they have assessed the prospects of the Group, over what period they have done so and why they consider that period to be appropriate, and their statement as to whether they have a reasonable expectation that the Group will be able to continue in operation and meet its liabilities as they fall due over the period of their assessment, including any related disclosures drawing attention to any necessary qualifications or assumptions.
We have nothing to report having performed a review of the Directors’ statement that they have carried out a robust assessment of the principal risks facing the Group and statement in relation to the longer-term viability of the Group. Our review was substantially less in scope than an audit and only consisted of making enquiries and considering the Directors’ process supporting their statements; checking that the statements are in alignment with the relevant provisions of the UK Corporate Governance Code (the “Code”); and considering whether the statements are consistent with the knowledge and understanding of the Group and Company and their environment obtained in the course of the audit. (Listing Rules)
Other Code Provisions
We have nothing to report in respect of our responsibility to report when:
• The statement given by the Directors, on page 76, that they consider the Annual Report taken as a whole to be fair, balanced and understandable, and provides the information necessary for the members to assess the Group’s and Company’s position and performance, business model and strategy is materially inconsistent with our knowledge of the Group and Company obtained in the course of performing our audit.
• The section of the Annual Report on page 52 to 53 describing the work of the Audit Committee does not appropriately address matters communicated by us to the Audit Committee.
• The Directors’ statement relating to the Company’s compliance with the Code does not properly disclose a departure from a relevant provision of the Code specified, under the Listing Rules, for review by the auditors.
Directors’ Remuneration
In our opinion, the part of the Directors’ Remuneration Report to be audited has been properly prepared in accordance with the Companies Act 2006. (CA06)

84 Marston’s PLC Annual Report and Accounts 2019
Responsibilities for the financial statements and the audit
Responsibilities of the Directors for the financial statementsAs explained more fully in the Statement of Directors’ Responsibilities set out on page 76, the Directors are responsible for the preparation of the financial statements in accordance with the applicable framework and for being satisfied that they give a true and fair view. The Directors are also responsible for such internal control as they determine is necessary to enable the preparation of financial statements that are free from material misstatement, whether due to fraud or error.
In preparing the financial statements, the Directors are responsible for assessing the Group’s and the Company’s ability to continue as a going concern, disclosing as applicable, matters related to going concern and using the going concern basis of accounting unless the Directors either intend to liquidate the Group or the Company or to cease operations, or have no realistic alternative but to do so.
Auditors’ responsibilities for the audit of the financial statementsOur objectives are to obtain reasonable assurance about whether the financial statements as a whole are free from material misstatement, whether due to fraud or error, and to issue an auditors’ report that includes our opinion. Reasonable assurance is a high level of assurance, but is not a guarantee that an audit conducted in accordance with ISAs (UK) will always detect a material misstatement when it exists. Misstatements can arise from fraud or error and are considered material if, individually or in the aggregate, they could reasonably be expected to influence the economic decisions of users taken on the basis of these financial statements.
A further description of our responsibilities for the audit of the financial statements is located on the FRC’s website at: www.frc.org.uk/auditorsresponsibilities. This description forms part of our auditors’ report.
Use of this reportThis report, including the opinions, has been prepared for and only for the Company’s members as a body in accordance with Chapter 3 of Part 16 of the Companies Act 2006 and for no other purpose. We do not, in giving these opinions, accept or assume responsibility for any other purpose or to any other person to whom this report is shown or into whose hands it may come save where expressly agreed by our prior consent in writing.
Other required reporting
Companies Act 2006 exception reportingUnder the Companies Act 2006 we are required to report to you if, in our opinion:
• we have not received all the information and explanations we require for our audit; or
• adequate accounting records have not been kept by the Company, or returns adequate for our audit have not been received from branches not visited by us; or
• certain disclosures of Directors’ remuneration specified by law are not made; or
• the Company financial statements and the part of the Directors’ Remuneration Report to be audited are not in agreement with the accounting records and returns.
Independent auditors’ report to the members of Marston’s PLC continued
We have no exceptions to report arising from this responsibility.
AppointmentFollowing the recommendation of the Audit Committee, we were appointed by the members on 27 January 2003 to audit the financial statements for the period ended 27 September 2003 and subsequent financial periods. The period of total uninterrupted engagement is 17 years, covering the periods ended 27 September 2003 to 28 September 2019.
Andrew Lyon (Senior Statutory Auditor)for and on behalf of PricewaterhouseCoopers LLP Chartered Accountants and Statutory Auditors Birmingham
27 November 2019

85Marston’s PLC Annual Report and Accounts 2019Financial Statements
Group Income StatementFor the 52 weeks ended 28 September 2019
Note
2019 2018
Underlying £m
Non- underlying
£mTotal
£mUnderlying
£m
Non-underlying
£mTotal £m
Revenue 2, 3, 4 1,173.5 – 1,173.5 1,140.4 0.9 1,141.3Operating expenses 3 (994.8) (72.2) (1,067.0) (957.9) (50.0) (1,007.9)Operating profit 2, 4 178.7 (72.2) 106.5 182.5 (49.1) 133.4Finance costs 6 (78.1) (0.6) (78.7) (78.9) (0.1) (79.0)Finance income 6 0.4 0.5 0.9 0.4 – 0.4Interest rate swap movements 4, 6 – (48.7) (48.7) – (0.5) (0.5)
Net finance costs 4, 6 (77.7) (48.8) (126.5) (78.5) (0.6) (79.1)Profit/(loss) before taxation 101.0 (121.0) (20.0) 104.0 (49.7) 54.3Taxation 4, 7 (15.4) 17.4 2.0 (16.1) 6.8 (9.3)Profit/(loss) for the period attributable
to equity shareholders 85.6 (103.6) (18.0) 87.9 (42.9) 45.0
(Loss)/earnings per share:Basic (loss)/earnings per share 9 (2.8)p 7.1pBasic underlying earnings per share 9 13.5p 13.9pDiluted (loss)/earnings per share 9 (2.8)p 7.0pDiluted underlying earnings per share 9 13.4p 13.7p
Group Statement of Comprehensive IncomeFor the 52 weeks ended 28 September 2019
2019 £m
2018 £m
(Loss)/profit for the period (18.0) 45.0Items of other comprehensive income that may subsequently be reclassified to profit or lossLosses arising on cash flow hedges (20.5) –Transfers to the income statement on cash flow hedges 11.2 10.9Tax on items that may subsequently be reclassified to profit or loss 1.5 (1.8)
(7.8) 9.1Items of other comprehensive income that will not be reclassified to profit or lossRemeasurement of retirement benefits (54.7) 14.0Unrealised surplus on revaluation of properties 2.8 170.3Reversal of past revaluation surplus (27.4) (161.7)Tax on items that will not be reclassified to profit or loss 11.1 (2.3)
(68.2) 20.3Other comprehensive (expense)/income for the period (76.0) 29.4Total comprehensive (expense)/income for the period (94.0) 74.4

86 Marston’s PLC Annual Report and Accounts 2019
Group Cash Flow StatementFor the 52 weeks ended 28 September 2019
Note2019
£m2018
£m
Operating activitiesUnderlying operating profit 178.7 182.5Depreciation and amortisation 43.2 40.1Underlying EBITDA 221.9 222.6Non-underlying operating items (72.2) (49.1)EBITDA 149.7 173.5Working capital movement 31 10.3 (2.1)Non-cash movements 31 51.0 31.8Decrease in provisions and other non-current liabilities (3.4) (5.4)Difference between defined benefit pension contributions paid and amounts charged (3.0) (8.0)Income tax paid (9.0) (7.4)Net cash inflow from operating activities 195.6 182.4Investing activitiesInterest received 0.5 0.8Sale of property, plant and equipment and assets held for sale 49.8 46.9Purchase of property, plant and equipment and intangible assets (133.8) (162.7)Movement in other non-current assets 0.3 0.7Net transfer from other cash deposits 118.0 –Net cash inflow/(outflow) from investing activities 34.8 (114.3)Financing activitiesEquity dividends paid 8 (47.5) (47.5)Interest paid (74.4) (74.9)Arrangement costs of bank facilities (1.1) (0.6)Arrangement costs of other lease related borrowings – (5.1)Purchase of own shares – (1.2)Proceeds from sale of own shares 0.1 –Repayment of securitised debt (31.7) (30.0)Repayment of bank borrowings (0.7) –Advance of bank borrowings 48.6 10.2Capital element of finance leases repaid (7.5) (0.2)Advance of other lease related borrowings – 68.0Repayment of other borrowings (120.0) –Net cash outflow from financing activities (234.2) (81.3)Net decrease in cash and cash equivalents 30 (3.8) (13.2)

87Marston’s PLC Annual Report and Accounts 2019Financial Statements
Group Balance SheetAs at 28 September 2019
Note
28 September 2019
£m
29 September 2018
£m
Non-current assetsGoodwill 10 230.3 230.3Other intangible assets 11 88.5 70.0Property, plant and equipment 12 2,350.4 2,408.1Other non-current assets 13 9.3 9.6Deferred tax assets 14 5.8 –Retirement benefit surplus 15 – 15.6
2,684.3 2,733.6Current assetsInventories 16 43.6 44.6Trade and other receivables 17 90.9 104.9Other cash deposits* 2.0 120.0Cash and cash equivalents 37.6 41.4
174.1 310.9
Assets held for sale 18 1.7 2.3
Current liabilitiesBorrowings* 19 (54.9) (158.4)Derivative financial instruments 21 (184.2) (28.9)Trade and other payables 22 (248.3) (252.2)Current tax liabilities (1.7) (4.0)Provisions for other liabilities and charges 23 (2.6) (2.8)
(491.7) (446.3)Non-current liabilitiesBorrowings 19 (1,383.4) (1,389.0)Derivative financial instruments 21 (51.3) (148.6)Other non-current liabilities 24 (2.6) (1.5)Provisions for other liabilities and charges 23 (19.7) (22.5)Deferred tax liabilities 14 (63.9) (81.3)Retirement benefit obligations 15 (36.4) –
(1,557.3) (1,642.9)Net assets 811.1 957.6
Shareholders’ equityEquity share capital 28 48.7 48.7Share premium account 334.0 334.0Revaluation reserve 598.9 627.2Merger reserve 29 23.7 23.7Capital redemption reserve 29 6.8 6.8Hedging reserve (125.9) (118.1)Own shares 29 (112.0) (112.3)Retained earnings 36.9 147.6Total equity 811.1 957.6
The financial statements were approved by the Board and authorised for issue on 27 November 2019 and are signed on its behalf by:
Ralph Findlay Chief Executive Officer
27 November 2019
* At 29 September 2018 other cash deposits comprised £120.0 million drawn down under the liquidity facility and borrowings included the corresponding liability (note 30).

Marston’s PLC Annual Report and Accounts 201988
Equity share
capital £m
Share premium account
£m
Revaluation reserve
£m
Merger reserve
£m
Capitalredemption
reserve £m
Hedging reserve
£m
Own shares
£m
Retained earnings
£m
Total equity
£m
At 30 September 2018 (as previously reported)
Adjustment for adoption of IFRS 9Tax impact of IFRS 9 adjustment
48.7––
334.0––
627.2––
23.7––
6.8––
(118.1)– –
(112.3)––
147.6(6.7)1.2
957.6(6.7)1.2
At 30 September 2018 (as restated) 48.7 334.0 627.2 23.7 6.8 (118.1) (112.3) 142.1 952.1Loss for the period – – – – – – – (18.0) (18.0)Remeasurement of retirement benefits – – – – – – – (54.7) (54.7)Tax on remeasurement of retirement
benefits – – – – – – – 9.3 9.3Losses on cash flow hedges – – – – – (20.5) – – (20.5)Transfers to the income statement on
cash flow hedges – – – – – 11.2 – – 11.2Tax on hedging reserve movements – – – – – 1.5 – – 1.5Property revaluation – – 2.8 – – – – – 2.8Property impairment – – (27.4) – – – – – (27.4)Deferred tax on properties – – 1.8 – – – – – 1.8Total comprehensive expense – – (22.8) – – (7.8) – (63.4) (94.0)Share-based payments – – – – – – – 0.3 0.3Tax on share-based payments – – – – – – – 0.1 0.1Sale of own shares – – – – – – 0.3 (0.2) 0.1Transfer disposals to retained earnings – – (5.2) – – – – 5.2 –Transfer tax to retained earnings – – 0.7 – – – – (0.7) –Transfer depreciation to retained
earnings – – (1.0) – – – – 1.0 –Dividends paid – – – – – – – (47.5) (47.5)Total transactions with owners – – (5.5) – – – 0.3 (41.8) (47.0)At 28 September 2019 48.7 334.0 598.9 23.7 6.8 (125.9) (112.0) 36.9 811.1
– – – – –
Group Statement of Changes in EquityFor the 52 weeks ended 28 September 2019
Equity share
capital £m
Share premium account
£m
Revaluation reserve
£m
Merger reserve
£m
Capital redemption
reserve £m
Hedging reserve
£m
Own shares
£m
Retained earnings
£m
Total equity
£m
At 1 October 2017 48.7 334.0 624.2 71.2 6.8 (127.2) (111.3) 85.0 931.4Profit for the period – – – – – – – 45.0 45.0Remeasurement of retirement benefits – – – – – – – 14.0 14.0Tax on remeasurement of retirement
benefits – – – – – – – (2.4) (2.4)Transfers to the income statement on
cash flow hedges – – – – – 10.9 – – 10.9Tax on hedging reserve movements – – – – – (1.8) – – (1.8)Property revaluation – – 170.3 – – – – – 170.3Property impairment – – (161.7) – – – – – (161.7)Deferred tax on properties – – 0.1 – – – – – 0.1Total comprehensive income – – 8.7 – – 9.1 – 56.6 74.4Share-based payments – – – – – – – 0.5 0.5Purchase of own shares – – – – – – (1.2) – (1.2)Sale of own shares – – – – – – 0.2 (0.2) –Transfer disposals to retained earnings – – (5.6) – – – – 5.6 –Transfer tax to retained earnings – – 0.9 (0.9)Transfer depreciation to retained
earnings – – (1.0) – – – – 1.0 –Dividends paid – – – (47.5) – – – – (47.5)Total transactions with owners – – (5.7) (47.5) – – (1.0) 6.0 (48.2)At 29 September 2018 48.7 334.0 627.2 23.7 6.8 (118.1) (112.3) 147.6 957.6
Further detail in respect of the Group’s equity is provided in notes 28 and 29 to the financial statements.

89Marston’s PLC Annual Report and Accounts 2019Financial Statements
1 Accounting policies
Basis of preparationThese consolidated financial statements for the 52 weeks ended 28 September 2019 (2018: 52 weeks ended 29 September 2018) have been prepared in accordance with IFRS and IFRS Interpretations Committee (IFRS IC) and Standing Interpretations Committee interpretations adopted by the European Union and with those parts of the Companies Act 2006 applicable to companies reporting under IFRS. The financial statements have been prepared under the historical cost convention as modified by the revaluation of certain items, principally land and buildings, derivative financial instruments, retirement benefits and share-based payments.
At the time of approving the financial statements, the Directors have a reasonable expectation that the Group has adequate resources to continue in operational existence for the foreseeable future. Thus the Directors continue to adopt the going concern basis of accounting in preparing the financial statements. Further detail is provided in the Viability Statement within the Strategic Report.
New standards and interpretationsThe Group has adopted IFRS 15 ‘Revenue from Contracts with Customers’ in the current period using the modified retrospective approach in paragraph C3(b) of the standard. IFRS 15 introduces a new five step model for the recognition of revenue, which is based on the satisfaction of performance obligations. The core principle is that an entity will recognise revenue to depict the transfer of promised goods or services to customers in an amount that reflects the consideration to which the entity expects to be entitled in exchange for those goods and services. The adoption of IFRS 15 has not had any impact on the Group’s results or financial position.
The Group has adopted IFRS 9 ‘Financial Instruments’ in the current period. Comparative amounts have not been restated in accordance with the transitional provisions in paragraph 7.2.15 of the standard. IFRS 9 introduces a new model for the classification and measurement of financial assets, a new expected credit loss model for the impairment of financial assets held at amortised cost, and new requirements for hedge accounting. Details of the impact of the adoption of IFRS 9 are provided in note 35.
The International Accounting Standards Board (IASB) and IFRS IC have issued the following new or revised standards and interpretations with an effective date for financial periods beginning on or after the dates disclosed below. These standards and interpretations have not yet been adopted by the Group.
IFRS 3 Business Combinations Amendments to clarify the definition of a business 1 January 2020
IFRS 7 Financial Instruments: Disclosures Amendments regarding pre-replacement issues in the context of the IBOR reform 1 January 2020
IFRS 9 Financial Instruments Amendments regarding prepayment features with negative compensation and modifications of financial liabilities Amendments regarding pre-replacement issues in the context of the IBOR reform
1 January 2019 1 January 2020
IFRS 10 Consolidated Financial Statements Amendments regarding the sale or contribution of assets between an investor and its associate or joint venture Date deferred
IFRS 16 Leases New accounting standard 1 January 2019
IFRS 17 Insurance Contracts New accounting standard 1 January 2021
IAS 1 Presentation of Financial Statements Amendments regarding the definition of material 1 January 2020
IAS 8 Accounting Policies, Changes in Accounting Estimates and Errors Amendments regarding the definition of material 1 January 2020
IAS 19 Employee Benefits Amendments regarding plan amendments, curtailments or settlements 1 January 2019
IAS 28 Investments in Associates and Joint Ventures Amendments regarding the sale or contribution of assets between an investor and its associate or joint venture Amendments regarding long-term interests in associates and joint ventures
Date deferred1 January 2019
IFRIC 23 Uncertainty over Income Tax Treatments 1 January 2019
The IASB have also issued a number of minor amendments to standards as part of their Annual Improvements to IFRS.
The adoption of IFRS 16 ‘Leases’ is expected to have a significant impact on both the Group’s balance sheet and income statement. For those leases where it is the lessee the Group will be required to recognise assets and liabilities in the balance sheet in the majority of cases and recognise depreciation and finance costs in the income statement. The Group will follow the modified retrospective approach in IFRS 16 and will also take the option to measure the right-of-use assets as if IFRS 16 had always applied but using the Group’s incremental borrowing rate at the date of initial application. The Group has undertaken a detailed assessment to determine the overall impact of the adoption of IFRS 16 on its results and financial position. It is expected that upon adopting IFRS 16 and making related accounting policy changes on 29 September 2019, the Group’s borrowings will increase by around £285 million to £310 million and net assets will reduce by around £45 million to £55 million. Assuming there are no significant changes to the portfolio of leases held by the Group as at 29 September 2019, it is expected that profit after tax for the period ended 3 October 2020 will be around £3 million to £7 million lower.
NotesFor the 52 weeks ended 28 September 2019
It is not anticipated that any of the other above new standards or interpretations will have a material impact on the Group’s results or financial position.
Basis of consolidationThe consolidated financial statements incorporate the financial statements of Marston’s PLC and all of its subsidiary undertakings. The results of new subsidiary undertakings are included in the Group accounts from the date on which control transferred to the Group or, in the case of disposals, up to the effective date of disposal. Transactions between Group companies are eliminated on consolidation.

90 Marston’s PLC Annual Report and Accounts 2019
Notes continuedFor the 52 weeks ended 28 September 2019
1 Accounting policies (continued)
The Group has applied the purchase method in accounting for the acquisition of subsidiaries. The cost of an acquisition is measured as the fair value of the consideration paid and deferred. Identifiable assets acquired and liabilities assumed in a business combination are measured initially at their fair values at the acquisition date. Acquisition costs are expensed as incurred. The excess of the cost of acquisition over the fair value of the Group’s share of the identifiable net assets acquired is recorded as goodwill. If the cost of acquisition is less than the fair value of the Group’s share of the identifiable net assets of the subsidiary acquired, the difference is recognised immediately in the income statement.
The consolidated financial statements incorporate the results of Marston’s Issuer PLC and its parent company, Marston’s Issuer Parent Limited. Marston’s Issuer PLC was set up with the sole purpose of issuing debt secured on assets owned by the Group. Wilmington Trust SP Services (London) Limited holds the shares of Marston’s Issuer Parent Limited under a declaration of trust for charitable purposes. The rights provided to the Group through the securitisation give the Group power over these companies and the ability to use that power to affect its exposure to variable returns from them. As such the Directors of Marston’s PLC consider that these companies are controlled by the Group, as defined in IFRS 10 ‘Consolidated Financial Statements’, and hence for the purpose of the consolidated financial statements they have been treated as subsidiary undertakings.
Revenue and other operating incomeThe Group’s revenue from contracts with customers comprises retail sales, wholesale sales and contract services.
Retail salesThe Group sells food and drink to customers in its pubs. Revenue from the sale of food and drink is recognised when the goods are sold to the customers in the pubs. Payment of the transaction price is due immediately when the goods are provided to the customer.
The Group provides accommodation to customers in its public houses and lodges. Revenue from the provision of accommodation is recognised over the period of the customer’s stay. Payment of the transaction price is due at the time of the customer’s stay.
The Group provides gaming machines for customers to play in its pubs. Revenue from gaming machines is recognised when the game has been played. Payment of the transaction price is due when the game is played.
It is considered that, in respect of its franchised arrangements, the Group has exposure to the significant risks and rewards associated with the above sales of goods and rendering of services and as such the total income from franchised pubs is included within the Group’s revenue.
Wholesale salesThe Group sells drinks to tenants of its licensed properties, other pub operators, wholesalers and retailers. Revenue is recognised when the Group has transferred control of the goods to the customer. This occurs when the goods have been delivered to the customer, the customer has obtained legal title to the goods, the Group cannot require the return or transfer of the goods and the customer has an unconditional obligation to pay for the goods.
Drinks are often sold with retrospective volume discounts based on sales over a defined period. The anticipated discounts are estimated based on accumulated experience using the expected value method and are deducted from the sales price that is recognised in revenue. A refund liability is recognised within trade and other payables for the volume discounts expected to be paid in respect of sales made prior to the balance sheet date.
Contract servicesThe Group brews and packages drinks for customers. Revenue is recognised when the Group has transferred control of the goods to the customer. This occurs when the goods have been delivered to the customer, the customer has obtained legal title to the goods and the customer has an unconditional obligation to pay for the goods.
The Group also transports and delivers goods for customers. Revenue is recognised over time as the Group transports the goods; due to the short distances the goods are transported this is equivalent to recognising revenue at the point when the goods are delivered to the required location.
In respect of both wholesale sales and contract services, a receivable is recognised when the goods are delivered, and payment is due in line with each customer’s individual credit terms. These terms are all less than one year and as such no element of financing is considered to be present.
Revenue is recorded net of discounts, intra group transactions, VAT and excise duty relating to the brewing and packaging of certain products.
The Group has elected to apply the practical expedient in paragraph 63 of IFRS 15 ‘Revenue from Contracts with Customers’ whereby the promised amount of consideration is not adjusted for the effects of a significant financing component if it is expected that payment will be received within one year.
The Group also includes rent receivable from tenants of its licensed properties within revenue. This income is recognised in the period to which it relates.
Other operating income mainly comprises rent receivable from unlicensed properties, which is recognised in the period to which it relates.
Operating segmentsFor segment reporting purposes the Group is considered to have four distinguishable operating segments, being Destination and Premium, Taverns, Brewing and Group Services. This mirrors the Group’s internal reporting, and reflects the different distribution channels, customer profiles and nature of products and services provided within each segment. An element of Group Services’ costs is allocated to each of the trading segments. Transfer prices between operating segments are on an arm’s length basis.
The operating segments set out in note 2 are consistent with the internal reporting provided to the chief operating decision maker. For the purposes of IFRS 8 ‘Operating Segments’ the chief operating decision maker has been identified as the Executive Directors.
Acquired businesses are treated as separate reporting segments, where material, until they have been fully integrated with the Group’s operating segments.

91Marston’s PLC Annual Report and Accounts 2019Financial Statements
1 Accounting policies (continued)
Non-underlying itemsIn order to illustrate the underlying performance of the Group, presentation has been made of performance measures excluding those items which it is considered would distort the comparability of the Group’s results. These non-underlying items comprise exceptional items and other adjusting items.
Exceptional items are defined as those items that, by virtue of their nature, size or expected frequency, warrant separate additional disclosure in the financial statements in order to fully understand the underlying performance of the Group. As management of the freehold and leasehold property estate is an essential and significant area of the business, the threshold for classification of property related items as exceptional is higher than other items.
Other adjusting items comprised the revenue and expenses in respect of the ongoing management of the remainder of the portfolio of pubs disposed of in the period ended 4 October 2014. The pubs subject to the management agreement no longer formed part of the Group’s core activities and the Group did not have the ability to make strategic decisions in respect of them. As such it has been considered appropriate to exclude the results of these pubs from the Group’s underlying results.
Intangible assetsIntangible assets are carried at cost less accumulated amortisation and any impairment losses. Intangible assets arising on an acquisition are recognised separately from goodwill if the fair value of these assets can be identified separately and measured reliably.
Amortisation is calculated on a straight-line basis over the estimated useful life of the intangible asset. Where the useful life of the asset is considered to be indefinite no annual amortisation is provided but the asset is subject to annual impairment reviews. Impairment reviews are carried out more frequently if events or changes in circumstances indicate that the carrying value of an asset may be impaired. Any impairment of carrying value is charged to the income statement.
The useful lives of the Group’s intangible assets are:
Acquired brands Indefinite Lease premiums Life of the lease Computer software 3 to 20 years Development costs 10 years
Research and development expenditureAll expenditure on the research phase of an internal project is expensed as incurred.
Development costs are recognised as an intangible asset when the following conditions are met:
• It is technically feasible to complete the intangible asset so that it will be available for use;• Management intends to complete the asset and use or sell it;• There is an ability to use or sell the asset;• It can be demonstrated how the asset will generate probable future economic benefits;• Adequate technical, financial and other resources to complete the development and to use or sell the asset are available; and• The expenditure attributable to the asset during its development can be reliably measured.
Other development expenditure that does not meet these criteria is recognised as an expense as incurred. Development costs previously recognised as an expense are not recognised as an asset in a subsequent period.
GoodwillGoodwill arising on acquisitions is capitalised and represents the excess of the fair value of the consideration given over the fair value of the identifiable net assets and liabilities acquired. Goodwill is not amortised but instead is reviewed for impairment on an annual basis, or more frequently if events or changes in circumstances indicate that the carrying value may be impaired. Any impairment is recognised immediately in the income statement.
For the purposes of impairment testing, goodwill is allocated to cash generating units that are consistent with the Group’s operating segments.
Property, plant and equipment• Freehold and leasehold properties are initially stated at cost and subsequently at valuation. Plant and machinery and fixtures, fittings, tools and equipment
are stated at cost.• Depreciation is charged to the income statement on a straight-line basis to provide for the cost or valuation of the assets less their residual values over their
useful lives.• Freehold properties are depreciated to their residual values over 50 years.• Leasehold properties are depreciated to their residual values over the lower of the lease term and 50 years.• Plant and machinery and fixtures, fittings, tools and equipment are depreciated over periods ranging from 3 to 20 years.• Own labour and interest costs directly attributable to capital projects are capitalised.• Land is not depreciated.
Residual values and useful lives are reviewed and adjusted if appropriate at each balance sheet date.
92 Marston’s PLC Annual Report and Accounts 2019
Notes continuedFor the 52 weeks ended 28 September 2019
1 Accounting policies (continued)
Properties are revalued by qualified valuers on a sufficiently regular basis using open market value so that the carrying value of an asset does not differ significantly from its fair value at the balance sheet date. Substantially all of the Group’s properties have been externally valued in accordance with the Royal Institution of Chartered Surveyors’ Red Book. These valuations are performed directly by reference to observable prices in an active market or recent market transactions on arm’s length terms. Internal valuations are performed on the same basis.
The estate is reviewed for indication of impairment at each reporting date, using a process focusing on areas of risk and business performance throughout the portfolio to identify any exposure.
Impairment losses are charged to the revaluation reserve to the extent that a previous gain has been recorded, and thereafter to the income statement. Surpluses on revaluation are recognised in the revaluation reserve, except to the extent that they reverse previously charged impairment losses, in which case the reversal is recorded in the income statement.
Disposals of property, plant and equipmentProfit/loss on disposal of property, plant and equipment represents net sale proceeds less the carrying value of the assets. Any element of the revaluation reserve relating to the property disposed of is transferred to retained earnings at the date of sale.
ImpairmentIf there are indications of impairment or reversal of impairment, an assessment is made of the recoverable amount. An impairment loss is recognised where the recoverable amount is lower than the carrying value of assets, including goodwill. The recoverable amount is the higher of value in use and fair value less costs to sell.
Where there is an indication that any previously recognised impairment losses no longer exist or have decreased, a reversal of the loss is made if there has been a change in the estimates used to determine the recoverable amounts since the last impairment loss was recognised. The carrying amount of the asset is increased to its recoverable amount only up to the carrying amount that would have resulted, net of depreciation or amortisation, had no impairment loss been recognised for the asset in prior periods. The reversal is recognised in the income statement unless the asset is carried at a revalued amount. The reversal of an impairment loss on a revalued asset is recognised in other comprehensive income and increases the revaluation surplus for that asset. However, to the extent that an impairment loss on the same revalued asset was previously recognised in the income statement, the reversal of that impairment loss is recognised in the income statement. The depreciation charge is adjusted in future periods to allocate the asset’s revised carrying value, less any residual value, on a systematic basis over its remaining useful life. There is no reversal of impairment losses relating to goodwill.
Acquired brands are reviewed for impairment on a portfolio basis.
LeasesLeases are classified as finance leases if the terms of the lease transfer substantially all the risks and rewards of ownership to the lessee. All other leases are classified as operating leases.
The cost or valuation of assets held under finance leases is included within property, plant and equipment and depreciation is charged in accordance with the accounting policy for each class of asset concerned. The corresponding capital obligations under these leases are shown as liabilities. The finance charge element of rentals is charged to the income statement and classified within finance costs as incurred.
Rental costs under operating leases, including lease incentives, are charged to the income statement on a straight-line basis over the term of the lease. Similarly, income receivable under operating leases is credited to the income statement on a straight-line basis over the term of the lease.
Obligations arising from sale and leaseback arrangements with repurchase options that do not fall within the scope of IAS 17 ‘Leases’ are classified as other lease related borrowings and accounted for in accordance with IFRS 9 ‘Financial Instruments’.
InventoriesInventories are stated at the lower of cost and net realisable value. Raw materials are valued on a ‘first in, first out’ basis, with the exception of hops which are valued at average cost. Finished goods and work in progress include direct materials, labour and a proportion of attributable overheads.
Assets held for saleAssets, typically properties and related fixtures and fittings, are categorised as held for sale when the value of the asset will be recovered through a sale transaction rather than continuing use. This condition is met when the sale is highly probable, the asset is available for immediate sale in its present condition and is being actively marketed. In addition, the Group must be committed to the sale and completion should be expected to occur within one year from the date of classification. Assets held for sale are valued at the lower of carrying value and fair value less costs to sell, and are no longer depreciated.
Financial instrumentsThe Group classifies its financial assets in one of the following two categories: at fair value through profit or loss and at amortised cost. The Group classifies its financial liabilities in one of the following two categories: at fair value through profit or loss and other financial liabilities.
The Group classifies a financial asset as at amortised cost if the asset is held within a business model whose objective is to hold financial assets in order to collect contractual cash flows and the contractual terms of the asset give rise on specified dates to cash flows that are solely payments of principal and interest.
In the prior period, under IAS 39 ‘Financial Instruments: Recognition and Measurement’, the Group classified its financial assets as either at fair value through profit or loss or loans and receivables.

93Marston’s PLC Annual Report and Accounts 2019Financial Statements
1 Accounting policies (continued)
Financial instruments at fair value through profit or lossDerivatives are categorised as financial instruments at fair value through profit or loss unless they are designated as part of a hedging relationship. Trade loans are also categorised as at fair value through profit or loss as they do not give rise on specified dates to cash flows that are solely payments of principal and interest. The Group holds no other financial instruments at fair value through profit or loss.
Financial assets at amortised costFinancial assets at amortised cost comprise trade receivables, other receivables, other cash deposits and cash and cash equivalents in the balance sheet and are measured using the effective interest method.
Other financial liabilitiesNon-derivative financial liabilities are classified as other financial liabilities. The Group’s other financial liabilities comprise borrowings, trade payables and other payables. Other financial liabilities are carried at amortised cost using the effective interest method.
Financial assets are derecognised when the rights to receive cash flows from the investments have expired or have been transferred and the Group has transferred substantially all risks and rewards of ownership.
It is, and has been throughout the period under review, the Group’s policy that no trading in financial instruments shall be undertaken.
Derivative financial instrumentsThe only derivative financial instruments that the Group enters into are interest rate swaps. The purpose of these transactions is to manage the interest rate risk arising from the Group’s operations and its sources of finance.
Derivatives are initially recognised at fair value on the date the derivative contract is entered into and are subsequently remeasured at their fair value at each balance sheet date. The method of recognising the resulting gain or loss depends on whether the derivative is designated as a hedging instrument.
The effective portion of changes in the fair value of derivatives that are designated and qualify as cash flow hedges is recognised in other comprehensive income. The gain or loss relating to the ineffective portion is recognised immediately in the income statement.
Gains or losses arising from changes in the fair value of derivatives which are not designated as part of a hedging relationship are presented in the income statement in the period in which they arise.
The fair value of a hedging derivative is classified as a non-current asset or liability when the remaining maturity of the hedged item is more than 12 months and as a current asset or liability when the remaining maturity of the hedged item is less than 12 months. The fair values of derivatives which are not designated as part of a hedging relationship are classified as current assets or liabilities. Accrued interest is recognised separately in current assets or liabilities as appropriate.
At the inception of a hedging transaction, the Group documents the economic relationship between hedging instruments and hedged items, as well as its risk management objectives and strategy for undertaking the hedging transaction. The Group also documents its assessment, both at hedge inception and on an ongoing basis, of whether the derivatives that are used in hedging transactions are highly effective in offsetting changes in fair values or cash flows of hedged items.
When a hedging instrument expires or is sold, or when a hedge no longer meets the criteria for hedge accounting, any cumulative gain or loss existing in equity at that time remains in equity and is recognised when the forecast transaction is ultimately recognised in the income statement. When a forecast transaction is no longer expected to occur, the cumulative gain or loss that was reported in equity is immediately transferred to the income statement.
Amounts that have been recognised in other comprehensive income in respect of cash flow hedges are reclassified from equity to profit or loss as a reclassification adjustment in the same period or periods during which the hedged forecast cash flow affects profit or loss.
Trade loansIn common with other major brewers, the Group makes trade loans to publicans who purchase the Group’s beer. Significant trade loans are secured against the property of the loan recipient. Trade loans are classified as other non-current assets in the balance sheet. Since the adoption of IFRS 9 ‘Financial Instruments’ at the start of the current period trade loans are held at fair value. At the prior period end, under IAS 39 ‘Financial Instruments: Recognition and Measurement’, trade loans were previously classified as loans and receivables and were held at amortised cost.
Trade receivables and other receivablesTrade receivables and other receivables are recognised initially at fair value and subsequently measured at amortised cost less provision for impairment.
Since the adoption of IFRS 9 ‘Financial Instruments’ at the start of the current period the Group applies the expected credit loss model to calculate any loss allowance for trade receivables and other receivables.

94 Marston’s PLC Annual Report and Accounts 2019
Notes continuedFor the 52 weeks ended 28 September 2019
1 Accounting policies (continued)
For trade receivables and other receivables that result from transactions that are within the scope of IFRS 15 ‘Revenue from Contracts with Customers’ or from transactions that are within the scope of IFRS 16 ‘Leases’ the loss allowance is measured as the lifetime expected credit losses. For any other trade or other receivable the loss allowance is measured as the 12-month expected credit losses unless the credit risk has increased significantly since initial recognition, in which case the lifetime expected credit losses are used. Details of the methodologies used to calculate the expected credit losses for the different groupings of trade receivables and other receivables are given in note 25.
In the prior period, under IAS 39 ‘Financial Instruments: Recognition and Measurement’, the incurred loss model was applied and a provision for impairment of trade receivables and other receivables was established when there was objective evidence that the Group would not be able to collect all amounts due according to the original terms of the receivables. Significant financial difficulties of the debtor, probability that the debtor would enter bankruptcy or financial reorganisation and default or delinquency in payments were considered indicators that the trade or other receivable was impaired. The amount of the provision was the difference between the asset’s carrying amount and the estimated future cash flows.
The carrying amount of trade receivables and other receivables is reduced through the use of an allowance account, and the amount of the loss allowance is recognised in the income statement within other net operating charges. The Group’s policy is to write off trade receivables and other receivables when there is no reasonable expectation of recovery of the balance due. Indicators that there is no reasonable expectation of recovery depend on the type of debtor/customer and include a debt being over four months old, the failure of the debtor to engage in a repayment plan and the failure to recover any amounts through enforcement activity. Subsequent recoveries of amounts previously written off are credited against other net operating charges in the income statement.
Other cash depositsCash held on deposit with banks with a maturity of more than three months at the date of acquisition is classified within other cash deposits.
Cash and cash equivalentsCash and cash equivalents include cash in hand and deposits on call with banks. Any bank overdrafts are shown within borrowings in current liabilities. For the purpose of the cash flow statement, cash and cash equivalents are as defined above, net of outstanding bank overdrafts.
BorrowingsBorrowings are initially recognised at fair value, net of transaction costs incurred. Borrowings are subsequently stated at amortised cost; any difference between the proceeds (net of transaction costs) and the redemption value is recognised in the income statement over the period of the borrowings using the effective interest method.
Preference shares are classified as liabilities. The dividends on these preference shares are recognised in the income statement as finance costs.
Borrowing costs are recognised as an expense in the period in which they are incurred, except for interest costs incurred on the financing of major projects, which are capitalised until the time that the projects are available for use.
Trade payables and other payablesTrade payables and other payables are recognised initially at fair value and subsequently measured at amortised cost using the effective interest method.
Employee benefitsPension costs for the Group’s defined benefit pension plan are determined by the Projected Unit Credit Method, with actuarial calculations being carried out at each period end date. Costs are recognised in the income statement within operating expenses and net finance costs. The current service cost, past service cost and gains or losses arising from settlements are included within operating expenses. The net interest on the net defined benefit asset/liability is included within exceptional finance income or costs and the administrative expenses paid from plan assets are included within finance costs.
Actuarial gains or losses arising from experience adjustments and changes in actuarial assumptions are recognised in full in the period in which they occur in the statement of comprehensive income. The return on plan assets, excluding amounts included in the net interest on the net defined benefit asset/liability, is also recognised in other comprehensive income.
The asset/liability recognised in the balance sheet for the defined benefit pension plan is the fair value of plan assets less the present value of the defined benefit obligation. Where the fair value of plan assets exceeds the present value of the defined benefit obligation, the Group recognises an asset at the lower of the fair value of plan assets less the present value of the defined benefit obligation, and the present value of any economic benefits available in the form of refunds from the plan or reductions in future contributions to the plan.
Should contributions payable under a minimum funding requirement not be available as a refund or reduction in future contributions after they are paid into the plan, a liability would be recognised to this extent when the obligation arose.
Pension costs for the Group’s defined contribution pension plans are charged to the income statement in the period in which they arise.
Post-retirement medical benefits are accounted for in an identical way to the Group’s defined benefit pension plan.
Key management personnelKey management personnel are those who have authority and responsibility for planning, directing and controlling the activities of the Group. In the case of Marston’s PLC, the Directors of the Group are considered to be the only key management personnel.

95Marston’s PLC Annual Report and Accounts 2019Financial Statements
1 Accounting policies (continued)
Current and deferred taxThe current tax charge is calculated on the basis of the tax laws enacted or substantively enacted at the balance sheet date and is measured at the amount expected to be paid to, or recovered from, the tax authorities.
Deferred tax is provided in full, using the liability method, on all differences that have originated but not reversed by the balance sheet date, and which give rise to an obligation to pay more or less tax in the future. Differences are defined as the differences between the carrying value of assets and liabilities and their tax base.
Deferred tax assets are recognised to the extent that it is probable that future taxable profit will be available against which the assets can be utilised.
Deferred tax is calculated using tax rates that are expected to apply when the related deferred tax asset is realised or the deferred tax liability is settled.
ProvisionsProvisions are recognised in the balance sheet when the Group has a present legal or constructive obligation as a result of a past event and it is probable that an outflow of economic benefits will be required to settle the obligation.
When valuations of leasehold properties (based on future estimated income streams) give rise to a deficit as a result of onerous lease conditions they are recognised as provisions. These provisions are measured at the present value of the expenditure expected to be required to settle the obligation using a pre-tax rate that reflects current market assessments of the time value of money and the risks specific to the obligation for which the estimates of future cash flows have not been adjusted. The key assumptions used in the discounted cash flow calculations are the discount and inflation rates and the market rents, vacant periods and future trading income of the properties.
Other contractual property costs are also recorded as provisions as appropriate.
Share-based paymentsThe fair value of share-based remuneration at the date of grant is calculated using the Black-Scholes option-pricing model and charged to the income statement on a straight-line basis over the vesting period of the award. The charge to the income statement takes account of the estimated number of shares that will vest.
Non-vesting conditions are taken into account when determining the fair value of the Group’s share-based payments, and all cancellations of share-based payments, whether by the Group or by employees, are accounted for in an identical manner with any costs unrecognised at the date of cancellation being immediately accelerated.
Own sharesOwn shares comprise treasury shares, and shares held on trust for employee share schemes, which are used for the issuing of shares to applicable employees. Own shares are recognised at cost as a deduction from shareholders’ equity. Subsequent consideration received for the sale of such shares is also recognised in equity, with any difference between the sale proceeds and the original cost being taken to equity. No income or expense is recognised in the performance statements on own share transactions.
DividendsDividends proposed by the Board but unpaid at the period end are recognised in the financial statements when they have been approved by the shareholders. Interim dividends are recognised when paid.
Transactions and balance sheet items in a foreign currencyTransactions in a foreign currency are translated to sterling using the exchange rate at the date of the transaction. Monetary receivables and payables are remeasured at closing day rates at each balance sheet date. Exchange gains or losses that arise from such remeasurement and on settlement of the transaction are recognised in the income statement. Translation differences for non-monetary assets valued at fair value through profit or loss are reported as part of the fair value gain or loss. Gains or losses on disposal of non-monetary assets are recognised in the income statement.
Key assumptions and significant judgementsIFRS requires the Group to make estimates and assumptions that affect the application of policies and reported amounts. Estimates and judgements are continually evaluated and are based on historical experience and other factors including expectations of future events that are believed to be reasonable under the circumstances. Actual results may differ from these estimates. The Group’s key assumptions and significant judgements are in respect of retirement benefits, lease classification, non-underlying items, deferred tax, property, plant and equipment, impairment, financial instruments and property lease provisions as set out below. Where applicable further details are provided in the relevant accounting policy or detailed note to the financial statements.
The following judgements (apart from those involving estimates) have had the most significant effect on amounts recognised in the financial statements:
Retirement benefits• Recognition of a retirement benefit surplus (see accounting policy).
Lease classification• Judgements in respect of whether a lease has transferred substantially all the risks and rewards of ownership to the lessee, in particular whether the present
value of the minimum lease payments amounts to at least substantially all of the fair value of the leased asset and whether the lease term is for the major part of the economic life of the asset.

96 Marston’s PLC Annual Report and Accounts 2019
Notes continuedFor the 52 weeks ended 28 September 2019
1 Accounting policies (continued)
Non-underlying items• Determination of items to be classed as non-underlying (see accounting policy).
Deferred tax• Judgements in respect of certain tax elections and claims that can be made by the Group in future periods.
The following estimates and assumptions have a significant risk of causing a material adjustment to the carrying amount of assets and liabilities:
Property, plant and equipment• Valuation of properties (see accounting policy).• Assets’ useful lives and residual values (see accounting policy).
Impairment• Assumptions made in the value in use calculation, in particular the pre-tax discount rate applied to cash flow projections and the growth rate used to
extrapolate projected cash flows beyond one year budgets (notes 10 and 11).
Retirement benefits• Actuarial assumptions in respect of the defined benefit pension plan, which include discount rates, rates of increase in pensions, inflation rates and life
expectancies (note 15).
Financial instruments• Valuation of financial instruments that are not traded in an active market (note 25).
Property lease provisions• Assumptions made in the discounted cash flow calculations, in particular the market rents, vacant periods, future trading income, inflation rates and discount
rates (see accounting policy).
2 Segment reportingUnderlying revenue by segment
2019 £m
2018 £m
Destination and Premium 460.1 450.7Taverns 324.1 312.0Brewing 389.3 377.7Group Services – –Underlying revenue 1,173.5 1,140.4Non-underlying items – 0.9Revenue 1,173.5 1,141.3
20182019Underlying operating profit by segment £m £m
Destination and Premium 87.1 89.4Taverns 86.3 86.1Brewing 32.6 32.0Group Services (27.3) (25.0)Underlying operating profit 178.7 182.5Non-underlying operating items (72.2) (49.1)Operating profit 106.5 133.4Net finance costs (126.5) (79.1)(Loss)/profit before taxation (20.0) 54.3
Additions to non-current assets*
Depreciation and amortisation
Other segment information2019
£m2018
£m2019
£m2018
£m
Destination and Premium 73.5 102.6 17.3 16.4Taverns 31.4 29.1 10.0 9.2Brewing 16.7 27.3 11.5 10.7Group Services 7.6 6.7 4.4 3.8Total 129.2 165.7 43.2 40.1
* Excludes amounts relating to goodwill, deferred tax, retirement benefits and financial instruments.
Geographical areasRevenue generated outside the United Kingdom during the period was £12.8 million (2018: £12.2 million).

97Marston’s PLC Annual Report and Accounts 2019Financial Statements
3 Revenue and operating expensesRevenue
2019 £m
2018 £m
Retail salesDestination and Premium 460.1 450.7Taverns 262.7 247.6
722.8 698.3Wholesale sales
Taverns 46.7 49.9Brewing 366.1 359.4
412.8 409.3Contract services
Brewing 23.2 18.3Revenue from contracts with customers 1,158.8 1,125.9Rental income
Taverns 14.7 15.4Total revenue 1,173.5 1,141.3
Operating expenses2019
£m2018
£m
Change in stocks of finished goods and work in progress 0.3 (3.4)Own work capitalised (7.9) (7.3)Other operating income (9.2) (10.6)Raw materials, consumables and excise duties 466.2 456.4Depreciation of property, plant and equipment 41.7 39.0Amortisation of intangible assets 1.5 1.1Employee costs 246.1 234.3Hire of plant and machinery 2.7 3.1Property lease rentals 19.9 17.6Income from other non-current assets (0.1) (0.4)Impairment of freehold and leasehold properties 44.6 39.4Other net operating charges 261.2 238.7
1,067.0 1,007.9
The amounts included in the line items above which have been classed as non-underlying are as follows:2019 2018
£m £m
Change in stocks of finished goods and work in progress – 0.2Employee costs 8.4 3.7Property lease rentals – 0.2Impairment of freehold and leasehold properties 43.4 39.4Other net operating charges 20.4 6.5
72.2 50.0
20182019PricewaterhouseCoopers LLP fees: £m £m
Fees payable to the Company’s Auditors for the audit of the Company’s annual accounts 0.2 0.2Fees payable to the Company’s Auditors for other services to the Group:
The audit of the Company’s subsidiaries 0.1 0.1Audit related assurance services 0.1 0.1
0.4 0.4

98 Marston’s PLC Annual Report and Accounts 2019
Notes continuedFor the 52 weeks ended 28 September 2019
4 Non-underlying items2019
£m2018
£m
Exceptional operating itemsImpact of change in rate assumptions used for onerous lease provisions 2.3 0.1Reorganisation and integration costs 8.1 7.3Impairment of freehold and leasehold properties 43.4 39.8Write-off of EPOS equipment 3.9 –Write-off of acquisition and development costs 9.9 –Past service cost in respect of Guaranteed Minimum Pension equalisation 4.6 –
72.2 47.2Other adjusting operating itemsResults in respect of the ongoing management of pubs in the portfolio disposal – 1.9
– 1.9Non-underlying operating items 72.2 49.1
Exceptional non-operating itemsNet interest on net defined benefit asset/liability (0.5) 0.1Swap recouponing fees 0.6 –Interest rate swap movements 48.7 0.5
48.8 0.6Total non-underlying items 121.0 49.7
Impact of change in rate assumptions used for onerous lease provisionsThe update of the discount rate assumptions used in the calculation of the Group’s onerous property lease provisions resulted in an increase of £2.3 million (2018: £0.1 million) in the total provision.
Reorganisation and integration costsDuring the current period the Group incurred reorganisation and integration costs of £8.1 million (2018: £7.3 million), primarily as a result of the acquisition of the beer business of Charles Wells in the period ended 30 September 2017.
Impairment of freehold and leasehold propertiesIn light of changes in the market and pub performance the Group undertook a detailed valuation review of its Destination and Premium estate in the current period, which resulted in the impairment of a number of these properties.
At 28 January 2018 the Group’s freehold and leasehold properties were revalued by independent chartered surveyors on an open market value basis.
The revaluation adjustments in respect of each of the above were recognised in the revaluation reserve or income statement as appropriate. The amounts recognised in the income statement were:
2019 £m
2018 £m
Impairment of other intangible assets (note 11)Reversal of past impairment of other intangible assets (note 11)
––
0.1(0.3)
Impairment of property, plant and equipment (note 12) 43.4 70.6Reversal of past impairment of property, plant and equipment (note 12) – (31.4)Impairment of assets held for sale (note 18) – 0.4Valuation fees – 0.4
43.4 39.8
Write-off of EPOS equipmentDue to the rollout of the Group’s new EPOS system the assets relating to the old system have been written off in the current period.
Write-off of acquisition and development costsThe Group has decided to focus its capital expenditure upon its existing estate and as such acquisition and development costs of £9.9 million in respect of sites which the Group no longer intends to acquire and/or develop have been written off in the current period.
Past service cost in respect of Guaranteed Minimum Pension equalisationOn 26 October 2018 a High Court ruling indicated that Guaranteed Minimum Pensions must be equalised for men and women. This requirement has been reflected in the calculation of the Group’s net defined benefit asset/liability at 28 September 2019 and the resulting additional past service cost has been presented as an exceptional item.
Net interest on net defined benefit asset/liability The net interest on the net defined benefit asset/liability in respect of the Group’s defined benefit pension plan was a credit of £0.5 million (2018: charge of £0.1 million) (note 15).

99Marston’s PLC Annual Report and Accounts 2019Financial Statements
4 Non-underlying items (continued)
Swap recouponing feesOn 27 March 2019 the Group recouponed the interest rate swap that fixes the interest rate payable on the floating rate elements of its A1, A2, A3 and B securitised notes. The recouponing has had the effect of reducing the fixed interest rate paid for the next five years and increasing the fixed interest rate paid in the final four years of the swap’s term. The Group incurred fees of £0.6 million in relation to this transaction.
Interest rate swap movementsThe Group’s interest rate swaps are revalued to fair value at each balance sheet date. For interest rate swaps which were designated as part of a hedging relationship a loss of £20.5 million (2018: £nil) has been recognised in the hedging reserve in respect of the effective portion of the fair value movement and £7.7 million (2018: £10.9 million) has been reclassified from the hedging reserve to underlying finance costs in the income statement in respect of the cash paid in the period. The ineffective portion of the fair value movement has been recognised within the income statement. The cash paid of £1.8 million (2018: £nil) has been recognised within underlying finance costs to ensure that underlying finance costs reflect the resulting fixed rate paid on the associated debt. The remainder of the ineffective portion of the fair value movement, a gain of £1.5 million (2018: loss of £0.3 million), has been recognised within non-underlying items. In addition £3.5 million (2018: £nil) of the balance remaining in the hedging reserve in respect of discontinued cash flow hedges has been reclassified to the income statement within non-underlying items.
For interest rate swaps which were not designated as part of a hedging relationship the fair value movement has been recognised within the income statement. The net cash received of £1.3 million (2018: £2.6 million paid) has been recognised within underlying finance costs to ensure that underlying finance costs reflect the resulting fixed rate paid on the associated debt. The remainder of the fair value movement, a loss of £46.7 million (2018: £0.2 million), equal to the change in the carrying value of the interest rate swaps in the period, or from when hedge accounting ceased to be applied, has been recognised within non-underlying items.
As a result of the above swap recouponing the hedging relationship between this interest rate swap and the associated debt ceased to meet the qualifying criteria for hedge accounting. The cumulative hedging loss existing in equity at 27 March 2019 remained in equity and is being recognised when the forecast transactions are ultimately recognised in the income statement. Fair value movements in respect of this interest rate swap after 27 March 2019 have been recognised wholly within the income statement.
Impact of taxationThe current tax credit relating to the above non-underlying items amounts to £2.6 million (2018: £1.6 million). The deferred tax credit relating to the above non-underlying items amounts to £14.8 million (2018: £5.2 million).
Prior period non-underlying itemsDuring the period ended 4 October 2014 the Group disposed of a portfolio of 202 pubs and subsequently entered into a four year lease and five year management agreement in respect thereof. During the period ended 30 September 2017 the Group entered into new 15 year leases in respect of 22 of the properties and these were removed from the management agreement. All of the other pubs were removed from the arrangements by the purchaser before the end of the four year lease term in December 2017. The Group no longer had strategic control of the pubs whilst they were subject to the management agreement and they did not form part of its core activities. As such the results in respect of the ongoing operation and management of these pubs were classified as a non-underlying item, comprised as follows:
2018£m
Revenue 0.9Operating expenses (2.8)
(1.9)
5 EmployeesEmployee costs
2019 £m
2018 £m
Wages and salaries 211.5 206.4Social security costs 17.6 17.1Pension costs 14.4 8.7Share-based payments 0.3 0.5Termination costs 2.3 1.6
246.1 234.3
A non-underlying charge of £8.4 million (2018: £3.7 million) is included in employee costs.
2019 2018Average monthly number of employees Number Number
Bar staff 11,139 11,433Management, administration and production 2,914 2,865
20182019Key management personnel compensation £m £m
Short-term employee benefits 1.6 1.7

100 Marston’s PLC Annual Report and Accounts 2019
Notes continuedFor the 52 weeks ended 28 September 2019
6 Finance costs and incomeFinance costs
2019 £m
2018 £m
Bank borrowings 14.9 11.6Securitised debt 40.4 46.2Finance leases 1.3 1.4Other lease related borrowings 19.9 18.0Other interest payable and similar charges 1.6 1.7
78.1 78.9Exceptional finance costsNet interest on net defined benefit asset/liability – 0.1Swap recouponing fees 0.6 –
0.6 0.1Total finance costs 78.7 79.0
Finance incomeDeposit and other interest receivable (0.4) (0.4)
(0.4) (0.4)Exceptional finance incomeNet interest on net defined benefit asset/liability (0.5) –
(0.5) –Total finance income (0.9) (0.4)
Interest rate swap movementsHedge ineffectiveness on cash flow hedges (net of cash paid) (1.5) 0.3Change in carrying value of interest rate swaps 46.7 0.2Transfer of hedging reserve balance in respect of discontinued hedges 3.5 –
48.7 0.5Net finance costs 126.5 79.1
7 TaxationIncome statement
2019 £m
2018 £m
Current taxCurrent period 11.1 10.1Adjustments in respect of prior periods (0.7) (0.4)Credit in respect of tax on non-underlying items (2.6) (1.6)
7.8 8.1Deferred tax
Current period 6.8 7.6Adjustments in respect of prior periods (1.8) (1.2)Credit in respect of tax on non-underlying items (14.8) (5.2)
(9.8) 1.2Taxation (credit)/charge reported in the income statement (2.0) 9.3
Statement of comprehensive income2019
£m2018
£m
Remeasurement of retirement benefits (9.3) 2.4Impairment and revaluation of properties (1.8) (0.1)Hedging reserve movements (1.5) 1.8Taxation (credit)/charge reported in the statement of comprehensive income (12.6) 4.1
20182019Recognised directly in equity £m £m
Tax on share-based payments (0.1) –Taxation credit recognised directly in equity (0.1) –

101Marston’s PLC Annual Report and Accounts 2019Financial Statements
7 Taxation (continued)
The actual tax rate for the period is lower (2018: lower) than the standard rate of corporation tax of 19% (2018: 19%). The differences are explained below:
Tax reconciliation2019
£m2018
£m
(Loss)/profit before tax (20.0) 54.3
(Loss)/profit before tax multiplied by the corporation tax rate of 19% (2018: 19%) (3.8) 10.3Effect of:Adjustments in respect of prior periods (2.5) (1.6)Net deferred tax credit in respect of land and buildings (1.3) (1.1)Costs not deductible for tax purposes 5.2 2.6Other amounts upon which tax relief is available (0.6) (0.6)Impact of difference between deferred and current tax rates 1.0 (0.3)Current period taxation (credit)/charge (2.0) 9.3
The March 2016 Budget announced that the standard rate of corporation tax would change from 19% to 17% with effect from 1 April 2020. This change was substantively enacted in the Finance Act 2016 in September 2016.
8 Ordinary dividends on equity sharesPaid in the period
2019 £m
2018 £m
Final dividend for 2018 of 4.8p per share (2017: 4.8p) 30.4 30.4Interim dividend for 2019 of 2.7p per share (2018: 2.7p) 17.1 17.1
47.5 47.5
A final dividend for 2019 of 4.8p per share amounting to £30.4 million has been proposed for approval at the Annual General Meeting, but has not been reflected in the financial statements.
This dividend will be paid on 27 January 2020 to those shareholders on the register at close of business on 13 December 2019.
9 Earnings per ordinary share
Basic earnings per share are calculated by dividing the profit/loss attributable to equity shareholders by the weighted average number of ordinary shares in issue during the period, excluding treasury shares and those held on trust for employee share schemes.
For diluted earnings per share, the weighted average number of ordinary shares in issue is adjusted to assume conversion of all dilutive potential ordinary shares. These represent share options granted to employees where the exercise price is less than the weighted average market price of the Company’s shares during the period.
Underlying earnings per share figures are presented to exclude the effect of exceptional and other adjusting items. The Directors consider that the supplementary figures are a useful indicator of performance.
2019 2018
Earnings £m
Per share amount
pEarnings
£m
Per share amount
p
Basic (loss)/earnings per shareDiluted (loss)/earnings per share
(18.0)(18.0)
(2.8)(2.8)
45.045.0
7.17.0
Underlying earnings per share figuresBasic underlying earnings per share Diluted underlying earnings per share
85.685.6
13.513.4
87.987.9
13.913.7
2018 m
2019 m
Basic weighted average number of sharesDilutive options
632.67.6
633.16.7
Diluted weighted average number of shares 640.2 639.8

102 Marston’s PLC Annual Report and Accounts 2019
Notes continuedFor the 52 weeks ended 28 September 2019
10 Goodwill£m
CostAt 30 September 2018 and 28 September 2019 231.4
Aggregate impairmentAt 30 September 2018 and 28 September 2019 1.1
Net book amount at 29 September 2018 230.3Net book amount at 28 September 2019 230.3
£m
CostAt 1 October 2017 and 29 September 2018 231.4
Aggregate impairmentAt 1 October 2017 and 29 September 2018 1.1
Net book amount at 30 September 2017 230.3Net book amount at 29 September 2018 230.3
Impairment testing of goodwillGoodwill has been allocated across the operating segments, and the value of the recoverable amounts allocated to those segments has been estimated and compared to the carrying amounts. Recoverable amounts are determined based on the higher of value in use and fair value less costs to sell.
Goodwill has been allocated to operating segments based on the extent to which the benefits of acquisitions flow to that segment, as follows:
2019 £m
2018 £m
Destination and Premium 87.5 87.5Taverns 113.1 113.1Brewing 29.7 29.7
230.3 230.3
The key assumptions used in determining value in use are the pre-tax discount rate applied to the cash flow projections of 5% (2018: 5%) and the growth rate used to extrapolate the projected cash flows beyond the one year budgets of 2% (2018: 2%). Risk factors are considered to be similar in each of the Group’s operating segments. Other commercial assumptions relate to market growth, market share and net selling prices. These assumptions are based on historic trends adjusted for management estimates of future prospects. These estimates take account of economic forecasts, marketing plans, political factors and assessments of competitors’ strategy. The discount rate used is the Group’s weighted average cost of capital adjusted to reflect market conditions.
The above impairment tests demonstrated that the Group had substantial levels of headroom and as such no impairment of goodwill was required in the current or prior period.

103Marston’s PLC Annual Report and Accounts 2019Financial Statements
11 Other intangible assetsAcquired
brands £m
Lease premiums
£m
Computer software
£m
Development costs
£mTotal
£m
CostAt 30 September 2018AdditionsNet transfers to assets held for sale and disposals
62.1––
1.5 – –
12.520.3(1.7)
0.1––
76.220.3(1.7)
At 28 September 2019 62.1 1.5 31.1 0.1 94.8
AmortisationAt 30 September 2018Charge for the periodNet transfers to assets held for sale and disposals
–––
0.8––
5.31.5
(1.4)
0.1––
6.21.5
(1.4)At 28 September 2019 – 0.8 5.4 0.1 6.3
Net book amount at 29 September 2018 62.1 0.7 7.2 – 70.0Net book amount at 28 September 2019 62.1 0.7 25.7 – 88.5
Acquired brands are initially recognised at their fair value on acquisition. Given the anticipated level of investment in acquired brands, and there being no legal or regulatory limits to their useful lives, they are regarded as having indefinite useful lives and no annual amortisation is provided.
Lease premiums classified as intangible assets are those acquired with new subsidiaries.
Acquired brands
£m
Lease premiums
£m
Computer software
£m
Development costs
£mTotal
£m
CostAt 1 October 2017 62.1 1.5 10.7 0.1 74.4Additions – – 3.3 – 3.3Net transfers to assets held for sale and disposals – – (1.5) – (1.5)At 29 September 2018 62.1 1.5 12.5 0.1 76.2
AmortisationAt 1 October 2017 – 0.9 5.8 0.1 6.8Charge for the period – 0.1 1.0 – 1.1Impairment/reversal of impairment – (0.2) – – (0.2)Net transfers to assets held for sale and disposals – – (1.5) – (1.5)At 29 September 2018 – 0.8 5.3 0.1 6.2
Net book amount at 30 September 2017 62.1 0.6 4.9 – 67.6Net book amount at 29 September 2018 62.1 0.7 7.2 – 70.0
During the prior period there was an impairment of other intangible assets of £0.1 million and a reversal of past impairment of £0.3 million.
Acquired brands relate to Brewing. The carrying value of acquired brands is split as follows:2018
£m2019
£m
Wychwood 13.6 13.6Jennings 2.8 2.8Ringwood 2.9 2.9Thwaites 12.8 12.8Eagle 30.0 30.0
62.1 62.1
Impairment testing of acquired brandsThe carrying values of acquired brands are subject to annual impairment reviews. The recoverable amount of each brand is determined based on the higher of value in use and fair value less costs to sell. The fair value of each brand is determined by applying an appropriate earnings multiple to the anticipated future income generated by that brand. The key assumptions used in determining the value in use of each brand are the pre-tax discount rate of 5% (2018: 5%) and the long-term growth rate used to extrapolate cash flows beyond the cash flow projection period of one year of 2% (2018: 2%). These assumptions are based on historic trends adjusted for management estimates of future prospects, and take account of economic forecasts, marketing plans, political factors and assessments of competitors’ strategy. The discount rate used is the Group’s weighted average cost of capital adjusted to reflect market conditions.
The above impairment tests demonstrated that the Group had sufficient levels of headroom and as such no impairment of acquired brands was required in the current or prior period.

104 Marston’s PLC Annual Report and Accounts 2019
Notes continuedFor the 52 weeks ended 28 September 2019
12 Property, plant and equipment
–
Land and buildings
£m
Plant and machinery
£m
Fixtures, fittings,
tools and equipment
£mTotal
£m
Cost or valuationAt 30 September 2018AdditionsNet transfers to assets held for sale and disposalsRevaluation
2,166.168.5
(50.1)(69.9)
84.86.5
(4.7)–
344.733.9
(45.0)–
2,595.6108.9 (99.8)(69.9)
At 28 September 2019 2,114.6 86.6 333.6 2,534.8
DepreciationAt 30 September 2018Charge for the periodNet transfers to assets held for sale and disposalsRevaluation/impairment
2.44.4
–(0.9)
32.87.0
(4.1)
152.330.3
(40.0)0.2
187.541.7
(44.1)(0.7)
At 28 September 2019 5.9 35.7 142.8 184.4
Net book amount at 29 September 2018 2,163.7 52.0 192.4 2,408.1Net book amount at 28 September 2019 2,108.7 50.9 190.8 2,350.4
–
Land and buildings
£m
Fixtures, fittings,
Plant and tools and machinery equipment Total
£m £m £m
Cost or valuationAt 1 October 2017AdditionsNet transfers to assets held for sale and disposalsRevaluation
2,153.794.1
(42.7)(39.0)
72.2 331.4 2,557.317.7 50.6 162.4(5.1) (37.3) (85.1)
– – (39.0)At 29 September 2018 2,166.1 84.8 344.7 2,595.6
DepreciationAt 1 October 2017Charge for the periodNet transfers to assets held for sale and disposalsRevaluation/impairment
7.63.6
–(8.8)
30.8 158.2 196.66.4 29.0 39.0
(4.4) (35.3) (39.7)0.4 (8.4)
At 29 September 2018 2.4 32.8 152.3 187.5
Net book amount at 30 September 2017 2,146.1 41.4 173.2 2,360.7Net book amount at 29 September 2018 2,163.7 52.0 192.4 2,408.1
The net book amount of land and buildings is split as follows:2018
£m2019
£m
Freehold propertiesLeasehold properties over 50 years unexpiredLeasehold properties under 50 years unexpired
1,814.9206.7
87.1
1,855.5227.1
81.12,108.7 2,163.7
Cost or valuation of land and buildings comprises:2018
£m2019
£m
ValuationAt cost
2,054.060.6
2,116.549.6
2,114.6 2,166.1
If the freehold and leasehold properties had not been revalued, the historical cost net book amount would be £1,627.9 million (2018: £1,624.0 million).
Cost at 28 September 2019 includes £9.9 million (2018: £40.8 million) of assets in the course of construction.
Interest costs of £1.6 million (2018: £2.7 million) were capitalised in the period in respect of the financing of major projects. The capitalisation rate used was 5% (2018: 5% to 6%).

105Marston’s PLC Annual Report and Accounts 2019Financial Statements
12 Property, plant and equipment (continued)
The net loss on disposal of property, plant and equipment, intangible assets and assets held for sale was £6.2 million (2018: profit of £7.7 million). A net profit on disposal of £7.9 million (2018: £8.3 million) has been included within the Group’s underlying results.
Capital expenditure authorised and committed at the period end but not provided for in the financial statements was £3.5 million (2018: £10.2 million).
The net book amount of land and buildings held under finance leases at 28 September 2019 was £25.5 million (2018: £34.6 million). The net book amount of land and buildings held as part of sale and leaseback arrangements that do not fall within the scope of IAS 17 ‘Leases’ was £348.6 million (2018: £377.1 million). The net book amount of plant and machinery and fixtures, fittings, tools and equipment held under finance leases was £1.6 million (2018: £nil). The net book amount of plant and machinery held as security for bank borrowings was £12.5 million (2018: £3.2 million).
Revaluation/impairmentDuring the current and prior period various properties were reviewed for impairment and/or material changes in value. These valuation adjustments were recognised in the revaluation reserve or the income statement as appropriate.
At 28 January 2018 independent chartered surveyors revalued the Group’s freehold and leasehold properties on an open market value basis. These valuations were incorporated into the financial statements and the resulting revaluation adjustments were recognised in the revaluation reserve or income statement as appropriate.
The impact of the revaluations/impairments described above is as follows:2019
£m2018
£m
Income statement:Impairment (44.8) (70.6)Reversal of past impairment 0.2 31.4
(44.6) (39.2)Revaluation reserve:Unrealised revaluation surplus 2.8 170.3Reversal of past revaluation surplus (27.4) (161.7)
(24.6) 8.6Net decrease in shareholders’ equity/property, plant and equipment (69.2) (30.6)
An impairment of £43.4 million (2018: £70.6 million) and a reversal of past impairment of £nil (2018: £31.4 million) have been recognised within non-underlying items (note 4).
Fair value of land and buildingsIFRS 13 ‘Fair Value Measurement’ requires fair value measurements to be recognised using a fair value hierarchy that reflects the significance of the inputs used in the measurements, according to the following levels:
Level 1 – unadjusted quoted prices in active markets for identical assets or liabilities. Level 2 – inputs other than quoted prices included within Level 1 that are observable for the asset or liability, either directly or indirectly. Level 3 – inputs for the asset or liability that are not based on observable market data.
The table below shows the level in the fair value hierarchy into which the fair value measurements of land and buildings have been categorised:
Recurring fair value measurementsLand and buildings:
Level 1 £m
Level 2 £m
2019Level 3
£mTotal
£m
2018Level 1
£mLevel 2
£mLevel 3
£mTotal
£m
Specialised brewery properties – – 54.2 54.2 – – 53.1 53.1Other land and buildings – 2,054.5 – 2,054.5
– 2,054.5 54.2 2,108.7– 2,110.6 – 2,110.6– 2,110.6 53.1 2,163.7
In the prior period properties with a value of £5.1 million that were previously categorised within Level 2 were transferred to Level 3 to appropriately reflect the valuation basis used in the external property valuation undertaken in the prior period. There were no other transfers between Levels 1, 2 and 3 fair value measurements during the current or prior period.
The Level 2 fair values of land and buildings have been obtained using a market approach, primarily using earnings multiples derived from prices in observed transactions involving comparable businesses. Whilst there are two inputs to the fair value measurement of the public house assets, being the fair maintainable trade and the multiplier applied, it is considered that the most significant input relates to the multiplier which, being indirectly observable, is a Level 2 input. Thus it has been concluded that since the most significant influence on the valuation is observable indirectly Level 2 is the most appropriate categorisation for these fair value measurements.
The Level 3 fair values of the specialised brewery properties have been obtained using a cost approach. These breweries represent properties that are rarely, if ever, sold in the market, except by way of a sale of the business of which they are part, due to the uniqueness arising from their specialised nature, design and configuration. As such the valuation of these properties has been performed using the depreciated replacement cost approach, which values the properties at the current cost of replacing them with their modern equivalents less deductions for physical deterioration and all relevant forms of obsolescence and optimisation.

106 Marston’s PLC Annual Report and Accounts 2019
Notes continuedFor the 52 weeks ended 28 September 2019
12 Property, plant and equipment (continued)
The significant unobservable inputs to the Level 3 fair value measurements are:Sensitivity of fair value to unobservable inputs
Current cost of modern equivalent asset The higher the cost the higher the fair valueAmount of adjustment for physical deterioration/obsolescence The higher the adjustment the lower the fair value
20182019Level 3 recurring fair value measurements £m £m
At beginning of the period 53.1 45.5Additions 1.5 0.6Transfers – 5.1Revaluation – 2.3Depreciation charge for the period (0.4) (0.4)At end of the period 54.2 53.1
The Group’s properties are revalued by external independent qualified valuers at least once in each rolling three year period. The last external valuation of the Group’s freehold and leasehold properties was performed as at 28 January 2018. The Group has an internal team of qualified valuers and at each reporting date the estate is reviewed for any indication of significant changes in value. Where this is the case internal valuations are performed on a basis consistent with those performed externally.
13 Other non-current assets
Trade loans
2019 £m
9.3
2018£m
9.6
Upon adoption of IFRS 9 ‘Financial Instruments’ at the start of the current period trade loans were reclassified as financial assets at fair value through profit or loss. Under IAS 39 ‘Financial Instruments: Recognition and Measurement’ trade loans were previously classified as loans and receivables and were held at amortised cost net of a provision of £1.9 million.
Further detail regarding the fair value measurement of trade loans is provided in note 25.
14 Deferred tax
Deferred tax is calculated on temporary differences between tax bases of assets and liabilities and their carrying amounts under the liability method using a tax rate of 17% (2018: 17%). The movement on the deferred tax accounts is shown below:
Net deferred tax liability2019
£m2018
£m
At beginning of the period 81.3 76.0Adjustment for adoption of IFRS 9 (1.2) –(Credited)/charged to the income statement (9.8) 1.2(Credited)/charged to equity:
Impairment and revaluation of properties (1.8) (0.1)Hedging reserve (1.5) 1.8Retirement benefits (8.8) 2.4Share-based payments (0.1) –
At end of the period 58.1 81.3
20182019Recognised in the balance sheet £m £m
Deferred tax liabilities (after offsetting) 63.9 81.3Deferred tax assets (after offsetting) (5.8) –
58.1 81.3
The movements in deferred tax assets and liabilities (prior to the offsetting of balances within the same jurisdiction as permitted by IAS 12 ‘Income Taxes’) during the period are shown below. Deferred tax assets and liabilities are only offset where there is a legally enforceable right of offset and there is an intention to settle the balances net. Deferred tax assets have been recognised in respect of all tax losses and other temporary differences where it is probable that these assets will be recovered.

107Marston’s PLC Annual Report and Accounts 2019Financial Statements
14 Deferred tax (continued)
–
Deferred tax liabilitiesPensions
£m
Accelerated capital
allowances £m
Revaluation of properties
£m
Rolled over capital
gains £m
Other £m
Total £m
At 30 September 2018 2.7 35.0 87.7 6.8 4.3 136.5Charged/(credited) to the income statement – 3.8 (5.0) (0.3) 0.3 (1.2)Credited to equity (2.7) (1.8) – – (4.5)At 28 September 2019 – 38.8 80.9 6.5 4.6 130.8
–
HedgingPensions Tax losses reserve Other Total
Deferred tax assets £m £m £m £m £m
At 30 September 2018 – (26.4) (24.3) (4.5) (55.2)Adjustment for adoption of IFRS 9 – – – (1.2) (1.2)Credited to the income statement – (0.4) – (8.2) (8.6)Credited to equity (6.1) (1.5) (0.1) (7.7)At 28 September 2019 (6.1) (26.8) (25.8) (14.0) (72.7)
Net deferred tax liabilityAt 29 September 2018 81.3At 28 September 2019 58.1
Accelerated capital Revaluation
Rolled over capital
Pensions allowances of properties gains Other TotalDeferred tax liabilities £m £m £m £m £m £m
At 1 October 2017 – 30.2 94.3 6.1 4.0 134.6Charged/(credited) to the income statement 0.3 4.8 (6.5) 0.7 0.3 (0.4)Charged/(credited) to equity 2.4 – (0.1) – – 2.3At 29 September 2018 2.7 35.0 87.7 6.8 4.3 136.5
– –
HedgingPensions Tax losses reserve Other Total
Deferred tax assets £m £m £m £m £m
At 1 October 2017 (0.9) (27.1) (26.1) (4.5) (58.6)Charged to the income statement 0.9 0.7 1.6Charged to equity – – 1.8 – 1.8At 29 September 2018 – (26.4) (24.3) (4.5) (55.2)
Net deferred tax liabilityAt 30 September 2017 76.0At 29 September 2018 81.3
15 Retirement benefits
During the period the Group contributed to a funded defined benefit pension plan and a number of defined contribution pension plans.
Defined contribution plansPension costs for defined contribution plans are as follows:
2019 2018£m £m
Defined contribution plans 9.8 8.7
Defined benefit planThe Marston’s PLC Pension and Life Assurance Scheme is a final salary pension plan which provides benefits to members in the form of a guaranteed level of pension payable for life. The plan closed to future accrual on 30 September 2014 and the link to future salary increases was also removed.
The plan operates under the UK regulatory framework and is governed by a board of Trustees composed of plan participants and representatives of the Group. The Trustees make investment decisions and set the required contribution rates based on independent actuarial advice.
The key risks to which the plan exposes the Group are as follows:
• Volatility of plan assets • Changes in bond yields• Inflation risk• Changes in life expectancy

108 Marston’s PLC Annual Report and Accounts 2019
Notes continuedFor the 52 weeks ended 28 September 2019
15 Retirement benefits (continued)
The movements in the fair value of plan assets and the present value of the defined benefit obligation during the period were:
Fair value of plan assets
Present value of defined benefit obligation
Net (deficit)/ surplus
2019 £m
2018 £m
2019 £m
2018 £m
2019 £m
2018 £m
At beginning of the period 516.6 532.4 (501.0) (537.8) 15.6 (5.4)Past service cost – – (4.6) – (4.6) –Interest income/(expense) 14.6 14.1 (14.1) (14.2) 0.5 (0.1)Remeasurements:
Return on plan assets (excluding interest income) 20.3 (11.7) – – 20.3 (11.7)Effect of changes in financial assumptions – – (86.1) 16.6 (86.1) 16.6Effect of changes in demographic assumptions – – 11.2 2.9 11.2 2.9Effect of experience adjustments – – – 6.2 – 6.2
Cash flows:Employer contributions 7.6 8.0 – – 7.6 8.0Administrative expenses paid from plan assets (0.9) (0.9) – – (0.9) (0.9)Benefits paid (23.8) (25.3) 23.8 25.3 – –
At end of the period 534.4 516.6 (570.8) (501.0) (36.4) 15.6
Pension costs recognised in the income statementA charge of £4.6 million (2018: £nil) comprising the past service cost is included within employee costs, a credit of £0.5 million (2018: charge of £0.1 million) comprising the net interest on the net defined benefit asset/liability is included within exceptional finance income/costs and a charge of £0.9 million (2018: £0.9 million) comprising the administrative expenses paid from plan assets is included within finance costs.
On 26 October 2018 a High Court ruling indicated that Guaranteed Minimum Pensions must be equalised for men and women. This requirement has been reflected in the calculation of the Group’s net defined benefit asset/liability at 28 September 2019 and the resulting additional past service cost of £4.6 million has been classed as a non-underlying item (note 4).
An updated actuarial valuation of the plan was performed by Mercer as at 28 September 2019 for the purposes of IAS 19 ‘Employee Benefits’. The principal assumptions made by the actuaries were:
2019 2018
Discount rate 1.8% 2.9%Rate of increase in pensions – 5% LPI 2.9% 3.1%Rate of increase in pensions – 2.5% LPI 2.0% 2.2%Inflation assumption (RPI) 3.0% 3.1%Inflation assumption (CPI) 2.0% 2.1%Employed deferred revaluation 2.0% 2.1%Life expectancy for deferred members from age 65 (years)
Male 22.8 23.6Female 25.4 26.1
Life expectancy for current pensioners from age 65 (years)Male 21.1 21.8Female 23.4 24.0
Mortality assumptions are based on standard tables adjusted for plan experience and with an allowance for future improvement in life expectancy.
The sensitivity of the defined benefit obligation to changes in the principal actuarial assumptions is:
Change in assumption Increase in assumption Decrease in assumption
Discount rate 0.25% Decrease by 4.1% Increase by 4.4%Inflation assumption 0.25% Increase by 2.1% Decrease by 2.0%Life expectancy One year Increase by 4.3% Decrease by 4.3%
The above sensitivity analyses have been determined by changing one assumption while holding all other assumptions constant. This is unlikely to be the case in practice as changes in some of the assumptions could be correlated. When calculating the above sensitivities the same method has been applied as when calculating the net defined benefit asset/liability in the balance sheet i.e. the present value of the defined benefit obligation calculated using the Projected Unit Credit Method.
Plan assets2019
£m2018
£m
Equities 103.5 134.3Bonds/Gilts 162.0 191.1Cash/Other 10.0 7.6Buy-in policies (matching annuities) 258.9 183.6
534.4 516.6

109Marston’s PLC Annual Report and Accounts 2019Financial Statements
15 Retirement benefits (continued)
The actual return on plan assets was a gain of £34.9 million (2018: £2.4 million).
A proportion of the defined benefit obligation has been secured by buy-in policies and as such this proportion of liabilities is matched by annuities.
The Trustees of the plan hold a range of assets and are aiming to better align the cash flows from these to those of the plan. They are also working with the Group to de-risk their portfolio further.
The Group is aiming to eliminate the plan’s funding deficit in the medium term. A schedule of contributions was agreed as part of the 30 September 2017 triennial valuation and contributions of £0.5 million per month are payable until 30 September 2021 and may continue until 2031 depending on the plan’s funding position. Contributions are also payable in respect of the plan’s expenses. The next triennial valuation will be performed as at 30 September 2020.
The employer contributions expected to be paid during the financial period ending 3 October 2020 amount to £7.6 million.
The weighted average duration of the defined benefit obligation is 17 years.
Post-retirement medical benefitsA loss of £0.1 million (2018: £nil) in respect of the remeasurement of post-retirement medical benefits has been included in the statement of comprehensive income.
16 Inventories2019
£m2018
£m
Raw materials and consumables 10.5 11.2Work in progress 1.4 1.6Finished goods 31.7 31.8
43.6 44.6
17 Trade and other receivables2019
£m2018
£m
Trade receivables 61.5 66.8Prepayments and accrued income 25.4 27.9Other receivables 4.0 10.2
90.9 104.9
Trade receivables are shown net of a provision of £2.7 million (2018: £1.5 million). Other receivables are shown net of a provision of £9.1 million (2018: £4.2 million). Further detail regarding the impairment of trade receivables and other receivables is provided in note 25.
All of the Group’s trade receivables are denominated in pounds sterling.
At 28 September 2019 the value of collateral held in the form of cash deposits was £6.6 million (2018: £6.7 million).
18 Assets held for sale
Properties
2019 £m
1.7
2018£m
2.3
In accordance with IFRS 5 ‘Non-current Assets Held for Sale and Discontinued Operations’, properties categorised as held for sale have been written down to their fair value less costs to sell. This is a non-recurring fair value measurement falling within Level 2 of the fair value hierarchy. These Level 2 fair values have been obtained using a market approach, and are derived from sales prices in recent transactions involving comparable properties.
During the current and prior period, all properties classed as held for sale were reviewed for impairment or reversal of impairment. This review identified an impairment of £nil (2018: £0.4 million) which has been recognised in the income statement.

110 Marston’s PLC Annual Report and Accounts 2019
Notes continuedFor the 52 weeks ended 28 September 2019
19 BorrowingsCurrent
2019 £m
2018 £m
Bank borrowings 21.5 –Securitised debt 32.9 31.2Finance leases 0.8 7.5Other lease related borrowings (0.3) (0.3)Other borrowings – 120.0
54.9 158.4
20182019Non-current £m £m
Bank borrowings 313.3 287.3Securitised debt 712.2 745.1Finance leases 21.1 20.1Other lease related borrowings 336.7 336.4Preference shares 0.1 0.1
1,383.4 1,389.0
Bank borrowings of £9.2 million (2018: £3.2 million) are secured against items of property, plant and equipment. All other bank borrowings are unsecured.
Other lease related borrowings represent amounts due under sale and leaseback arrangements that do not fall within the scope of IAS 17 ‘Leases’. The Group has an option to repurchase each leased property for a nominal amount at the end of the lease. The leases have terms of 35 to 40 years and rents which are linked to RPI, subject to a cap and collar.
At 29 September 2018 other borrowings represented the amounts drawn down under the securitisation’s liquidity facility. During the period ended 4 October 2014 the facility’s provider, the Royal Bank of Scotland Group plc, had its short-term credit rating downgraded below the minimum prescribed in the facility agreement and as such the Group exercised its entitlement to draw the full amount of the facility and hold it in a designated bank account. The corresponding balance of £120.0 million held in the relevant bank account was included within other cash deposits. During the current period the facility was novated to a new provider whose credit rating is above the prescribed minimum and as such the amounts drawn down were repaid.
The Group has 75,000 (2018: 75,000) preference shares of £1 each in issue at the balance sheet date. The preference shares carry the right to a fixed cumulative preferential dividend at the rate of 6% per annum (they are also entitled to a non-cumulative dividend of 1% per annum provided that dividends of not less than £24,000 have been paid on the ordinary shares in that year). They participate in the event of a winding-up and on a return of capital and carry the right to attend and vote at general meetings of the Company, carrying four votes per share.
All of the Group’s borrowings are denominated in pounds sterling. There were no instances of default, including covenant terms, in either the current or prior period.
Maturity of borrowingsThe maturity profile of the carrying amount of the Group’s borrowings at the period end was as follows:
Due:
2019 2018Gross
borrowings £m
Unamortised issue costs
£m
Net borrowings
£m
Gross borrowings
£m
Unamortised issue costs
£m
Net borrowings
£m
Within one year 56.5 (1.6) 54.9 159.9 (1.5) 158.4In more than one year but less than two years 38.1 (1.6) 36.5 34.3 (1.5) 32.8In more than two years but less than five years 433.5 (4.4) 429.1 401.6 (4.1) 397.5In more than five years 943.1 (25.3) 917.8 984.9 (26.2) 958.7
1,471.2 (32.9) 1,438.3 1,580.7 (33.3) 1,547.4
Fair value of borrowingsThe carrying amount and the fair value of the Group’s borrowings are as follows:
Carrying amount Fair value2019
£m2018
£m2019
£m2018
£m
Bank borrowings 338.1 290.2 338.1 290.2Securitised debt 749.4 781.1 725.5 770.0Finance leases 21.9 27.6 21.9 27.6Other lease related borrowings 361.7 361.7 361.7 361.7Other borrowings – 120.0 – 120.0Preference shares 0.1 0.1 0.1 0.1
1,471.2 1,580.7 1,447.3 1,569.6
The fair value of the Group’s securitised debt is based on quoted market prices and is within Level 1 of the fair value hierarchy. The fair values of all of the Group’s other borrowings approximate to their carrying amounts and are within Level 2 of the fair value hierarchy.

111Marston’s PLC Annual Report and Accounts 2019Financial Statements
20 Securitised debt
On 9 August 2005 £805.0 million of secured loan notes were issued in connection with the securitisation of 1,592 of the Group’s pubs held in Marston’s Pubs Limited. On 22 November 2007, a further £330.0 million of secured loan notes (tranches A4 and AB1) were issued in connection with the securitisation of an additional 437 of the Group’s pubs, also held in Marston’s Pubs Limited. The loan notes are secured over the properties and their future income streams and were issued by Marston’s Issuer PLC, a special purpose entity. On 15 January 2014 all of the AB1 notes were repurchased by the Group at par and immediately cancelled.
During the period ended 28 September 2019, 26 (2018: 29) of the securitised pubs were sold to third parties and 1 pub (2018: 1) was sold to another member of the Group. The carrying amount of the securitised pubs at 28 September 2019 was £1,303.0 million (2018: £1,293.3 million).
The securitisation is governed by various covenants, warranties and events of default, many of which apply to Marston’s Pubs Limited. These include covenants regarding the maintenance and disposal of securitised properties and restrictions on the ability to move cash to other companies within the Group.
The tranches of securitised debt have the following principal terms:
Tranche2019
£m2018
£m InterestPrincipal repayment Expected
period – by instalments average lifeExpected
maturity date
A1 18.8 40.1 Floating 2019 to 2020 1 year 2020A2 214.0 214.0 Fixed/floating 2020 to 2027 8 years 2027A3 200.0 200.0 Fixed/floating 2027 to 2032 13 years 2032A4 161.6 172.0 Floating 2019 to 2031 12 years 2031B 155.0 155.0 Fixed/floating 2032 to 2035 16 years 2035
749.4 781.1
The interest payable on each tranche is as follows:
Tranche Before step up After step up Step up date
A1 3 month LIBOR + 0.55%A2 5.1576%A3 5.1774%A4 3 month LIBOR + 0.65%B 5.6410%
3 month LIBOR + 1.375%3 month LIBOR + 1.32%3 month LIBOR + 1.45%
3 month LIBOR + 1.625%3 month LIBOR + 2.55%
July 2012July 2019
April 2027October 2012
July 2019
All floating rate notes are economically hedged in full by the Group using interest rate swaps whereby all interest payments are swapped to fixed interest payable.
At 28 September 2019 Marston’s Pubs Limited held cash of £19.7 million (2018: £27.5 million), which was governed by certain restrictions under the covenants associated with the securitisation. In addition, Marston’s Issuer PLC held cash of £0.1 million (2018: £0.1 million) and other cash deposits of £nil (2018: £120.0 million), which at 29 September 2018 was principally in respect of the amounts drawn down under the liquidity facility.
21 Derivative financial instrumentsInterest rate swaps
2019 £m
2018 £m
Current liabilitiesNon-current liabilities
(184.2)(51.3)
(28.9)(148.6)
(235.5) (177.5)
Details of the Group’s interest rate swaps are provided in note 25.
22 Trade and other payables2019
£m2018
£m
Trade payables 117.9 123.2Other taxes and social security 41.2 33.1Accruals and deferred income 74.5 82.1Other payables 14.7 13.8
248.3 252.2

Marston’s PLC Annual Report and Accounts 2019
Notes continuedFor the 52 weeks ended 28 September 2019
23 Provisions for other liabilities and charges
112
Property leases2019
£m2018
£m
At beginning of the period 25.3 30.2Released in the period (3.5) (3.7)Provided in the period 4.4 3.0Unwinding of discount 0.4 0.5Utilised in the period (4.3) (4.7)At end of the period 22.3 25.3
20182019Recognised in the balance sheet £m £m
Current liabilities 2.6 2.8Non-current liabilities 19.7 22.5
22.3 25.3
When valuations of leasehold properties (based on future estimated income streams) give rise to a deficit as a result of onerous lease conditions they are recognised as liabilities in provisions. Other contractual property costs are also recorded as provisions as appropriate.
Payments are expected to continue on these properties for periods of 1 to 68 years (2018: 1 to 51 years).
The £2.3 million (2018: £0.1 million) increase in the provision as a result of updating the discount rate assumptions used in the calculation has been classified as a non-underlying item (note 4).
24 Other non-current liabilities
Other liabilities
25 Financial instruments
2019 £m
2.6
2018£m
1.5
Financial instruments by category
––
At 28 September 2019Assets as per the balance sheetTrade loans Trade receivables (before provision)Other receivables (before provision)Other cash depositsCash and cash equivalents
Assets at fair value through profit or
loss £m
9.3
––
Assets at amortised
cost £m
Total £m
– 9.364.2 64.213.1 13.12.0 2.0
37.6 37.69.3 116.9 126.2
–– –
At 28 September 2019Liabilities as per the balance sheetDerivative financial instrumentsBorrowingsTrade payablesOther payables
Derivatives used for hedging
£m
Liabilities at fair value
through profit or
loss £m
Other financial
liabilities £m
Total £m
51.3 184.2 235.51,438.3 1,438.3
– – 117.9 117.9– – 14.7 14.7
51.3 184.2 1,570.9 1,806.4

113Marston’s PLC Annual Report and Accounts 2019Financial Statements
25 Financial instruments (continued)
At 29 September 2018
Loans and receivables
£mTotal
£m
Assets as per the balance sheetTrade loans (before provision) 11.5 11.5Trade receivables (before provision) 68.3 68.3Other receivables (before provision) 14.4 14.4Other cash deposits 120.0 120.0Cash and cash equivalents 41.4 41.4
255.6 255.6
At 29 September 2018
Derivatives used for hedging
£m
Liabilities at fair value
through profit or
loss £m
Other financial
liabilities £m
Total £m
Liabilities as per the balance sheetDerivative financial instruments 148.6 28.9 – 177.5Borrowings – – 1,547.4 1,547.4Trade payables – – 123.2 123.2Other payables – – 13.8 13.8
148.6 28.9 1,684.4 1,861.9
Fair values of financial instrumentsThe only financial instruments which the Group holds at fair value are trade loans and derivative financial instruments, which are classified as at fair value through profit or loss or derivatives used for hedging.
IFRS 13 ‘Fair Value Measurement’ requires fair value measurements to be recognised using a fair value hierarchy that reflects the significance of the inputs used in the measurements, according to the following levels:
Level 1 – unadjusted quoted prices in active markets for identical assets or liabilities. Level 2 – inputs other than quoted prices included within Level 1 that are observable for the asset or liability, either directly or indirectly. Level 3 – inputs for the asset or liability that are not based on observable market data.
The table below shows the level in the fair value hierarchy into which fair value measurements have been categorised:
Assets as per the balance sheet
2019 2018Level 1
£mLevel 2
£mLevel 3
£mTotal
£mLevel 1
£mLevel 2
£mLevel 3
£mTotal
£m
Trade loans – – 9.3 9.3 – – – –
– –Liabilities as per the balance sheet
20182019Level 1
£mLevel 2
£mLevel 3
£mTotal
£mLevel 1
£mLevel 2
£mLevel 3
£mTotal
£m
Derivative financial instruments – 235.5 – 235.5 177.5 177.5
There were no transfers between Levels 1, 2 and 3 fair value measurements during the current or prior period. Trade loans were reclassified as financial assets at fair value through profit or loss upon adoption of IFRS 9 ‘Financial Instruments’ at the start of the current period. Under IAS 39 ‘Financial Instruments: Recognition and Measurement’ trade loans were previously classified as loans and receivables and were held at amortised cost.
The Level 2 fair values of derivative financial instruments have been obtained using a market approach and reflect the estimated amount the Group would expect to pay or receive on termination of the instruments, adjusted for the Group’s own credit risk. The Group utilises valuations from counterparties who use a variety of assumptions based on market conditions existing at each balance sheet date. The fair values are highly sensitive to the inputs to the valuations, such as discount rates, analysis of credit risk and yield curves.
The Level 3 fair values of trade loans reflect the loan balances outstanding net of any deemed impairment.
Level 3 recurring fair value measurementsAt beginning of the periodAdditionsDisposals and repaymentsValuation changesAt end of the period
2019 £m
9.62.6
(2.7)(0.2)9.3

114 Marston’s PLC Annual Report and Accounts 2019
Notes continuedFor the 52 weeks ended 28 September 2019
25 Financial instruments (continued)
The fair values of all the Group’s other financial instruments are equal to their book values, with the exception of borrowings (note 19). The carrying amount less impairment provision of trade receivables and other receivables, and the carrying amount of other cash deposits, cash and cash equivalents, trade payables and other payables, are assumed to approximate their fair values.
Financial risk factorsThe Group’s activities expose it to a variety of financial risks: market risk (including interest rate risk and foreign currency risk), counterparty risk, credit risk and liquidity risk. The Group’s overall risk management programme focuses on the unpredictability of financial markets and seeks to minimise potential adverse effects on the Group’s financial performance. The Group uses derivative financial instruments to hedge certain risk exposures.
Risk management is carried out by a central treasury department (Group Treasury) under policies approved by the Board. Group Treasury identifies, evaluates and hedges financial risks. The Board provides principles for overall risk management, as well as policies covering specific areas, such as interest rate risk, credit risk, investment of excess liquidity and use of derivative and non-derivative financial instruments.
Interest rate risk:The Group’s income and operating cash flows are substantially independent of changes in market interest rates, and as such the Group’s interest rate risk arises from its borrowings. Borrowings issued at variable rates expose the Group to cash flow interest rate risk. Borrowings issued at fixed rates expose the Group to fair value interest rate risk.
The Group analyses its interest rate exposure on a dynamic basis. Various scenarios are simulated taking into consideration refinancing, renewal of existing positions, alternative financing and hedging. Based on these scenarios, the Group calculates the impact on the income statement of a defined interest rate shift. The scenarios are run only for liabilities that represent the major interest-bearing positions.
The Group manages its cash flow interest rate risk by using floating-to-fixed interest rate swaps. Such interest rate swaps have the economic effect of converting borrowings from floating rates to fixed rates. Generally, the Group raises borrowings at floating rates and will often swap them into fixed rates that are lower than those available if the Group borrowed at fixed rates directly. Under the interest rate swaps, the Group agrees with other parties to exchange, at specified intervals, the difference between fixed contract and floating rate interest amounts calculated by reference to the agreed notional amounts.
If interest rates had been 0.5% higher/lower during the period ended 28 September 2019, with all other variables held constant, the post-tax (loss)/profit for the period would have been £1.0 million (2018: £0.8 million) lower/higher as a result of higher/lower interest expense.
Interest rate swaps designated as part of a hedging relationshipThe Group uses interest rate swaps to fix the interest rate payable on the floating rate tranches of its securitised debt. The weighted average fixed rate of the interest rate swaps designated as hedging instruments at 28 September 2019 was 6.0% (2018: 5.8%).
The interest rate swaps have the same critical terms as the securitised debt including reset dates, payment dates, maturities and notional amounts (note 20). The economic relationship between the forecast floating rate interest payments and the interest rate swaps is determined and assessed through quantitative hedge effectiveness calculations performed at each reporting date, and upon a significant change in the circumstances affecting the hedge effectiveness requirements. As the interest rate swaps have a notional amount profile the same as that of the principal amount profile of the securitised debt on which the floating rate interest is paid the hedge ratio is 1:1. Sources of ineffectiveness that might affect the hedging relationships are the Group’s own credit risk, changes in the timing and amount of the interest payments and the recouponing of the swaps from a single fixed rate to a stepped profile.
On 27 March 2019 the Group recouponed the interest rate swap that fixes the interest rate payable on the floating rate elements of its A1, A2, A3 and B securitised notes. The recouponing has had the effect of reducing the fixed interest rate paid for the next five years and increasing the fixed interest rate paid in the final four years of the swap’s term. As a result, the hedging relationship between this interest rate swap and the associated debt ceased to meet the qualifying criteria for hedge accounting. The cumulative hedging loss existing in equity at 27 March 2019 remained in equity and is being recognised when the forecast transaction is ultimately recognised in the income statement. Fair value movements in respect of this interest rate swap after 27 March 2019 have been recognised wholly within the income statement.
Interest rate swaps designated as part of a hedging relationshipCarrying amount of hedging instruments (included within derivative financial instruments in non-current liabilities)Change in fair value of hedging instruments used as the basis for recognising hedge ineffectiveness in the periodNominal amount of hedging instrumentsChange in fair value of hedged items used as the basis for recognising hedge ineffectiveness in the periodHedging reserve balance in respect of continuing hedgesHedging reserve balance in respect of discontinued hedgesHedging losses recognised in other comprehensive incomeHedge ineffectiveness losses recognised in profit or lossAmount reclassified from the hedging reserve to profit or loss in respect of continuing hedgesAmount reclassified from the hedging reserve to profit or loss in respect of discontinued hedges
2019 £m
51.320.8
161.6(35.3)(38.6)(87.3)(20.5)
(0.3)7.73.5
2018£m
148.60.3
212.14.3
(118.1)––
(0.3)10.9
–

115Marston’s PLC Annual Report and Accounts 2019Financial Statements
25 Financial instruments (continued)Hedging reserve
2019 £m
2018 £m
At beginning of the period (118.1) (127.2)Hedging losses recognised in other comprehensive income (20.5) –Amount reclassified from the hedging reserve to profit or loss 11.2 10.9Deferred tax on hedging reserve movements 1.5 (1.8)At end of the period (125.9) (118.1)
Interest rate swaps not designated as part of a hedging relationshipOn 22 March 2012 the Group entered into two forward starting interest rate swaps of £60.0 million each to fix the interest rate payable on the Group’s bank borrowings. These interest rate swaps previously fixed interest at 3.0% until 30 April 2018 and at 4.5% and 4.6% thereafter and were due to terminate on 30 April 2025. In the prior period the termination date of the swaps was extended to 30 September 2029 and the terms were amended to fix interest at 2.8% until 30 September 2019 and 3.9% and 4.0% thereafter.
On 30 October 2017 the Group entered into a forward starting interest rate swap of £60.0 million to fix the interest rate payable on the Group’s bank borrowings. This interest rate swap commences on 30 April 2025, fixes interest at 2.2% and terminates on 30 April 2029.
Following the above recouponing of the interest rate swap that fixes the interest rate payable on the floating rate elements of the A1, A2, A3 and B securitised notes and the resulting discontinuance of hedge accounting, fair value movements on this swap after 27 March 2019 have been recognised wholly within the income statement.
The interest rate risk profile, after taking account of derivative financial instruments, is as follows:
Borrowings
2019 2018Floating rate Fixed rate Floating rate Fixed rate
financial financial financial financialliabilities liabilities Total liabilities liabilities Total
£m £m £m £m £m £m
600.3 870.9 1,471.2 679.5 901.2 1,580.7
The weighted average interest rate of the fixed rate borrowings was 5.1% (2018: 5.5%) and the weighted average period for which the rate is fixed was 11 years (2018: 12 years).
Foreign currency risk:The Group buys and sells goods denominated in non-sterling currencies, principally US dollars, Canadian dollars and euros. As a result, movements in exchange rates can affect the value of the Group’s income and expenditure. The Group’s exposure in this area is not considered to be significant.
Counterparty risk:The Group’s counterparty risk in respect of its cash and cash equivalents and other cash deposits is mitigated by the use of various banking institutions for its deposits.
There is no significant concentration of counterparty risk in respect of the Group’s pension assets, as these are held with a range of institutions.
Credit risk:Credit risk is managed on a Group basis. Credit risk arises from credit exposure to customers, including outstanding receivables and committed transactions. If customers are independently rated, these ratings are used. Otherwise, if there is no independent rating, an assessment is made of the credit quality of the customer, taking into account its financial position, past experience and other factors. Individual credit limits are set based on internal or external ratings in accordance with limits set by the Board. The utilisation of and adherence to credit limits is regularly monitored.
The financial assets of the Group which are subject to the new expected credit loss model under IFRS 9 ‘Financial Instruments’ from the start of the current period comprise trade receivables and other receivables. Other cash deposits and cash and cash equivalents are also subject to the impairment requirements of IFRS 9 however the impairment loss is immaterial.

116 Marston’s PLC Annual Report and Accounts 2019
Notes continuedFor the 52 weeks ended 28 September 2019
25 Financial instruments (continued)
Trade receivables and other receivables have been grouped as set out below for the purposes of calculating the expected credit losses:
Gross Loss allowance28 September
2019 £m
30 September 2018
£m
28 September 2019
£m
30 September 2018
£m
Trade receivablesAmounts due from current pub tenants 3.1 2.4 0.1 –Amounts invoiced to non-tenant customers 59.4 64.2 2.5 3.1Miscellaneous trade receivables 1.7 1.7 0.1 0.1
64.2 68.3 2.7 3.2Other receivablesAmounts due from previous pub tenants 8.7 8.9 8.4 8.5Amounts due from other property tenants 0.9 2.1 0.5 0.5Miscellaneous other receivables 3.5 3.4 0.2 0.2
13.1 14.4 9.1 9.277.3 82.7 11.8 12.4
Expected credit losses have been calculated as follows:Gross Loss allowance
28 September 2019
£m
30 September 2018
£m
28 September 2019
£m
30 September 2018
£m
12-month expected credit losses 3.5 3.4 0.2 0.2Lifetime expected credit losses for trade and lease receivables 73.8 79.3 11.6 12.2
77.3 82.7 11.8 12.4
Amounts due from pub tenantsAmounts due from current pub tenants result almost entirely from transactions that are within the scope of IFRS 15 ‘Revenue from Contracts with Customers’ or are lease receivables that result from transactions that are within the scope of IFRS 16 ‘Leases’, and as such the loss allowance is calculated as the lifetime expected credit losses. After accounting for collateral held in the form of cash deposits and fixtures and fittings the remaining balance due is low and as such the expected credit losses are minimal.
Amounts due from previous pub tenants predominantly result from transactions that are within the scope of IFRS 15 or are lease receivables that result from transactions that are within the scope of IFRS 16 and as such the loss allowance is calculated as the lifetime expected credit losses. The historical loss rate on closed accounts, adjusted to reflect current and forward looking information regarding macroeconomic factors affecting customers’ ability to pay, such as the impact of Brexit and forecasts of the UK’s GDP, is used to measure the expected credit losses on these receivables.
Amounts invoiced to non-tenant customersAmounts invoiced to non-tenant customers result almost entirely from transactions that are within the scope of IFRS 15 and as such the loss allowance is calculated as the lifetime expected credit losses. The receivables have been grouped based on the number of months the balance has been outstanding. The expected loss rates are based on historical payment profiles of sales and the credit losses incurred thereon. The historical loss rates are adjusted to reflect current and forward looking information regarding macroeconomic factors affecting customers’ ability to pay, such as the impact of Brexit and forecasts of the UK’s GDP.
The groupings of the gross carrying amounts and the associated expected loss rates are as follows:
At 28 September 2019Gross carrying amountExpected loss rate
1 month or less
£m
1 to 2 months
£m
2 to 3 months
£m
3 to 4 months
£m
4 to 5 months
£m
5 to 6 months
£m
6 to 12 months
£m
12 to 24 months
£m
More than 24 months
£mTotal
£m
31.6 17.5 3.5 2.5 0.1 0.7 1.5 0.5 1.5 59.40.2% 0.4% 0.7% 1.5% 5.7% 9.1% 35.1% 74.7% 86.0%
At 30 September 2018
1 month or less
£m
1 to 2 months
£m
2 to 3 months
£m
3 to 4 months
£m
4 to 5 months
£m
5 to 6 months
£m
6 to 12 months
£m
12 to 24 months
£m
More than 24 months
£mTotal
£m
Gross carrying amount 40.5 14.6 2.2 1.1 0.6 0.5 1.6 1.8 1.3 64.2Expected loss rate 0.3% 0.5% 0.7% 2.7% 19.6% 26.7% 18.4% 68.8% 80.9%

117Marston’s PLC Annual Report and Accounts 2019Financial Statements
25 Financial instruments (continued)
Miscellaneous trade receivablesMiscellaneous trade receivables result almost entirely from transactions that are within the scope of IFRS 15 and as such the loss allowance is calculated as the lifetime expected credit losses.
Amounts due from other property tenantsAmounts due from other property tenants are almost entirely lease receivables that result from transactions that are within the scope of IFRS 16 and as such the loss allowance is calculated as the lifetime expected credit losses. For tenants where it is considered that there is a significant risk of default the expected credit losses are calculated on an individual basis taking into account the circumstances involved. For all other tenants, after accounting for collateral held in the form of cash deposits, the remaining balance due is minimal and as such the expected credit losses are immaterial.
Miscellaneous other receivablesMiscellaneous other receivables do not generally result from transactions that are within the scope of IFRS 15 and do not comprise lease receivables resulting from transactions that are within the scope of IFRS 16. These receivables are considered to have low credit risk and as such the loss allowance is calculated as the 12-month expected credit losses. Receivables are considered to have low credit risk where there is a low risk of default and it is expected that the debtor will be able to meet its payment obligations in the near future.
The movements in the loss allowances for trade receivables and other receivables are as follows:
Trade receivables2018
£m2019
£m
At beginning of the period (before restatement) 1.5 1.4Amounts restated through opening retained earnings 1.7 –At beginning of the period (after restatement) 3.2 1.4Net increase in loss allowance recognised in profit or loss 0.2 0.6Amounts written off as uncollectible (0.7) (0.5)At end of the period 2.7 1.5
12-month expected credit losses
Lifetime expected credit losses
Other receivables2019
£m2018
£m2019
£m2018
£m
At beginning of the period (before restatement) – – 4.2 3.3Amounts restated through opening retained earnings 0.2 – 4.8 –At beginning of the period (after restatement) 0.2 – 9.0 3.3Net increase in loss allowance recognised in profit or loss – – 0.2 1.0Amounts written off as uncollectible – – (0.3) (0.1)At end of the period 0.2 – 8.9 4.2
In the prior period under IAS 39 ‘Financial Instruments: Recognition and Measurement’ a provision for impairment of trade receivables, other receivables and trade loans was estimated by management and was based on prior experience and known factors at the balance sheet date after taking into account collateral held in the form of cash deposits and fixtures and fittings.
The Group has no significant concentration of credit risk in respect of its customers. The maximum exposure to credit risk at the reporting date is the carrying value of each class of receivable.
Liquidity risk:The Group applies a prudent liquidity risk management policy, which involves maintaining sufficient cash, ensuring the availability of funding through an adequate amount of committed credit facilities and having the ability to close out market positions. Due to the dynamic nature of the underlying business, Group Treasury maintains the availability of committed credit lines to ensure that the Group has flexibility in funding.
Management monitors rolling forecasts of the Group’s liquidity reserve (comprising undrawn borrowing facilities and cash and cash equivalents) on the basis of expected cash flow. In addition, the Group’s liquidity management policy involves maintaining debt financing plans, projecting cash flows and considering the level of liquid assets necessary to meet these, and monitoring balance sheet liquidity ratios against internal and external regulatory requirements. The Group’s borrowing covenants are subject to regular review.

118 Marston’s PLC Annual Report and Accounts 2019
Notes continuedFor the 52 weeks ended 28 September 2019
25 Financial instruments (continued)
The tables below analyse the Group’s financial liabilities and non-settled derivative financial instruments into relevant maturity groupings based on the remaining period at the balance sheet date to the contractual maturity date. The amounts disclosed in the tables are the contractual undiscounted cash flows.
At 28 September 2019
Less than 1 year
£m
Between 1 and 2 years
£m
Between 2 and 5 years
£m
Over 5 years
£mTotal
£m
Borrowings 115.4 92.8 591.4 1,603.9 2,403.5Derivative financial instruments 20.3 19.7 53.5 206.8 300.3Trade payables 117.9 – – – 117.9Other payables 14.7 – – – 14.7
268.3 112.5 644.9 1,810.7 2,836.4
Less than Between 1 Between 2 Over1 year and 2 years and 5 years 5 years Total
At 29 September 2018 £m £m £m £m £m
Borrowings 224.5 88.9 563.4 1,688.2 2,565.0Derivative financial instruments 12.3 25.2 61.2 116.4 215.1Trade payables 123.2 – – – 123.2Other payables 13.8 – – – 13.8
373.8 114.1 624.6 1,804.6 2,917.1
26 Subsidiary undertakings
Details of the Group’s subsidiary undertakings are provided in note 6 to the Company financial statements.
27 Share-based payments
During the period there were three classes of equity-settled employee share incentive plans outstanding:
(a) Save As You Earn (SAYE). Under this scheme employees enter into a savings contract for a period of three to seven years and options are granted on commencement of the contract, exercisable using the amount saved under the contract at the time it terminates. Options under the scheme are granted at a discount to the market price of the shares at the time of the invitation and are not subject to performance conditions. Exercise of options is subject to continued employment.
(b) Deferred bonus. Under this scheme nil cost options are granted to eligible employees in lieu of a cash bonus. Exercise of options is subject to a period of continued employment.
(c) Long Term Incentive Plan (LTIP). Under this scheme nil cost options are granted that will only vest provided the participant satisfies the minimum shareholding requirement and performance conditions relating to return on capital, free cash flow and relative total shareholder return are met.
In 2010, HM Revenue & Customs (HMRC) approved an Approved Performance Share Plan (APSP) to enable participants in the LTIP to benefit from UK tax efficiencies. As such, awards made in 2010 and subsequent years may comprise an HMRC approved option (in respect of the first £30,000 worth of an award) and an unapproved LTIP award for amounts in excess of this HMRC limit. A further share award (a linked award) is also provided to enable participants to fund the exercise of the approved option. This linked award is satisfied by way of shares held on trust but these additional shares are not generally delivered to the participant. Under these rules the LTIP options are still issued at nil cost to the employee.
The tables below summarise the outstanding share options:
Number of sharesWeighted average
exercise price
SAYE:2019
m2018
m2019
p2018
p
Outstanding at beginning of the period 7.6 8.4 102.3 117.8Granted 1.5 4.2 96.0 89.0Exercised (0.1) – 95.6 82.5Expired (1.9) (5.0) 112.7 117.3Outstanding at end of the period 7.1 7.6 98.2 102.3Exercisable at end of the period 0.6 0.7 123.1 131.0Range of exercise prices 78.7p 78.7p
to 136.0p to 136.0pWeighted average remaining contractual life (years) 2.3 2.8

119Marston’s PLC Annual Report and Accounts 2019Financial Statements
27 Share-based payments (continued)Number of shares
Weighted average exercise price
Deferred bonus:2019
m2018
m2019
p2018
p
Outstanding at beginning of the period 0.3 0.2 – –Granted 0.1 0.1 – –Outstanding at end of the period 0.4 0.3 – –Exercisable at end of the period 0.1 – – –
Number of sharesWeighted average
exercise price
LTIP:2019
m2018
m2019
p2018
p
Outstanding at beginning of the period 6.7 6.0 – –Granted 2.7 2.3 – –Expired (2.2) (1.6) – –Outstanding at end of the period 7.2 6.7 – –Exercisable at end of the period – – – –
LTIP and deferred bonus options are exercisable no later than the tenth anniversary of the date of grant.
The fair values of the SAYE, deferred bonus and LTIP rights are calculated at the date of grant using the Black-Scholes option-pricing model. The significant inputs into the model for all schemes unless otherwise stated were:
Dividend yield %Expected volatility %Risk-free interest rate %Expected life of rights
2019
7.7 to 7.820.7 to 22.5
0.5 to 0.9
2018
7.2 to 7.321.2 to 22.5
0.5 to 0.8
SAYE 3 years 3 yearsDeferred bonus 3 years 3 yearsLTIP 5 years 5 years
The expected volatility is based on historical volatility over the expected life of the rights.
The fair value of options granted during the period in relation to the SAYE was 7.9p (2018: 6.4p). The fair value of options granted during the period in relation to the deferred bonus scheme was 79.0p (2018: 97.6p). The fair value of options granted during the period in relation to the LTIP was 67.6p (2018: 84.5p).
The weighted average share price for options exercised over the period was 106.8p (2018: 101.7p). The total charge for the period relating to employee share-based payment plans was £0.3 million (2018: £0.5 million), all of which related to equity-settled share-based payment transactions. After tax, the total charge was £0.2 million (2018: £0.5 million).
28 Equity share capital
Allotted, called up and fully paid
2019 2018Number
mValue
£mNumber
mValue
£m
Ordinary shares of 7.375p each:At beginning and end of the period 660.4 48.7 660.4 48.7

120 Marston’s PLC Annual Report and Accounts 2019
Notes continuedFor the 52 weeks ended 28 September 2019
29 Other components of equity
The merger reserve of £23.7 million (2018: £23.7 million) arose on the issue of ordinary shares in the period ended 30 September 2017 and represents the difference between the nominal value of the shares issued and the net proceeds received, less the dividends paid in the prior period.
The capital redemption reserve of £6.8 million (2018: £6.8 million) arose on share buybacks.
Own shares represent the carrying value of the investment in treasury shares and shares held on trust for employee share schemes (including executive share option schemes) as set out in the table below. The trustees of the schemes are Banks’s Brewery Insurance Limited, a wholly-owned subsidiary of Marston’s PLC, and Computershare Trustees (C.I.) Limited.
2019 2018Number
mValue
£mNumber
mValue
£m
Shares held on trust for employee share schemes 1.4 1.7 1.4 1.7Treasury shares 26.3 110.3 26.4 110.6
27.7 112.0 27.8 112.3
The market value of own shares held is £36.3 million (2018: £27.5 million). Shares held on trust for employee share schemes represent 0.2% (2018: 0.2%) of issued share capital. Treasury shares held represent 4.0% (2018: 4.0%) of issued share capital. Dividends on own shares have been waived.
The Group considers its capital to comprise total equity (as disclosed on the face of the Group balance sheet) and net debt (note 30). In managing its capital the primary objectives are to ensure that the Group is able to continue to operate as a going concern and to maximise return to shareholders through a combination of capital growth and distributions. The Group seeks to maintain a ratio of debt to equity that both balances risks and returns at an acceptable level and retains sufficient funds to comply with lending covenants, achieve working capital targets and meet investment requirements. The Board reviews the Group’s dividend policy and funding requirements at least once a year.
30 Net debt
Analysis of net debt2019
£mCash flow
£m
Non-cash movements
and deferred issue costs
£m2018
£m
Cash and cash equivalentsCash at bank and in hand 37.6 (3.8) – 41.4
37.6 (3.8) – 41.4Financial assetsOther cash deposits 2.0 (118.0) – 120.0
2.0 (118.0) – 120.0Debt due within one yearBank borrowings (21.5) (19.3) (2.2) –Securitised debt (32.9) 31.7 (33.4) (31.2)Finance leases (0.8) 7.5 (0.8) (7.5)Other lease related borrowings 0.3 – – 0.3Other borrowings – 120.0 – (120.0)
(54.9) 139.9 (36.4) (158.4)Debt due after one yearBank borrowings (313.3) (28.6) 2.6 (287.3)Securitised debt (712.2) – 32.9 (745.1)Finance leases (21.1) – (1.0) (20.1)Other lease related borrowings (336.7) – (0.3) (336.4)Preference shares (0.1) – – (0.1)
(1,383.4) (28.6) 34.2 (1,389.0)Net debt (1,398.7) (10.5) (2.2) (1,386.0)
At 29 September 2018 other borrowings represented the amounts drawn down under the securitisation’s liquidity facility. During the period ended 4 October 2014 the facility’s provider, the Royal Bank of Scotland Group plc, had its short-term credit rating downgraded below the minimum prescribed in the facility agreement and as such the Group exercised its entitlement to draw the full amount of the facility and hold it in a designated bank account. The corresponding balance of £120.0 million held in the relevant bank account was included within other cash deposits at 29 September 2018. The amounts drawn down could only be used for the purpose of meeting the securitisation’s debt service obligations should there ever be insufficient funds available from operations to meet such payments. As such these amounts were considered to be restricted cash. During the current period the facility was novated to a new provider whose credit rating is above the prescribed minimum and as such the amounts drawn down were repaid.
Included within other cash deposits is an amount of £0.2 million (2018: £0.3 million within cash and cash equivalents) relating to a letter of credit with Royal & Sun Alliance Insurance, and an amount of £1.7 million (2018: £1.4 million within cash and cash equivalents) relating to a letter of credit with Aviva. Included within cash and cash equivalents is an amount of £6.6 million (2018: £6.7 million) relating to collateral held in the form of cash deposits. These amounts are also considered to be restricted cash. In addition, any other cash held in connection with the securitised business is governed by certain restrictions under the covenants associated with the securitisation (note 20).

121Marston’s PLC Annual Report and Accounts 2019Financial Statements
30 Net debt (continued)Reconciliation of net cash flow to movement in net debt
2019 £m
2018 £m
Decrease in cash and cash equivalents in the period (3.8) (13.2)Decrease in other cash deposits (118.0) –Cash outflow/(inflow) from movement in debt 111.3 (48.0)Change in debt resulting from cash flows (10.5) (61.2)Non-cash movements and deferred issue costs (2.2) 4.3Movement in net debt in the period (12.7) (56.9)Net debt at beginning of the period (1,386.0) (1,329.1)Net debt at end of the period (1,398.7) (1,386.0)
20182019Reconciliation of net debt before lease financing to net debt £m £m
Cash and cash equivalents 37.6 41.4Other cash deposits 2.0 120.0Bank borrowings (334.8) (287.3)Securitised debt (745.1) (776.3)Other borrowings – (120.0)Preference shares (0.1) (0.1)Net debt before lease financing (1,040.4) (1,022.3)Finance leases (21.9) (27.6)Other lease related borrowings (336.4) (336.1)Net debt (1,398.7) (1,386.0)
Changes in liabilities arising from financing activities are as follows:
––
2019 2018
Borrowings £m
Derivative financial
instruments £m
Total financing liabilities
£m Borrowings
£m
Derivative financial
instruments £m
Total financing liabilities
£m
At beginning of the period (1,547.4) (177.5) (1,724.9) (1,503.7) (187.9) (1,691.6)Cash flow 111.3 8.2 119.5 (48.0) 13.5 (34.5)Changes in fair value – (66.2) (66.2) (3.1) (3.1)Other changes (2.2) – (2.2) 4.3 4.3At end of the period (1,438.3) (235.5) (1,673.8) (1,547.4) (177.5) (1,724.9)
31 Working capital and non-cash movementsWorking capital movement
2019 £m
2018 £m
Decrease/(increase) in inventories 1.0 (4.4)Decrease in trade and other receivables 7.9 4.9Increase/(decrease) in trade and other payables 1.4 (2.6)
10.3 (2.1)
20182019Non-cash movements £m £m
Income from other non-current assets (0.1) (0.4)Movements in respect of property, plant and equipment, assets held for sale and intangible assets 50.8 31.7Share-based payments 0.3 0.5
51.0 31.8
Further details of movements in respect of property, plant and equipment, assets held for sale and intangible assets are given in notes 11, 12 and 18.

Marston’s PLC Annual Report and Accounts 2019122
Notes continuedFor the 52 weeks ended 28 September 2019
32 Operating leases
The Group as lesseeThe Group leases various properties and items of equipment under non-cancellable operating leases. The leases have various terms, escalation clauses and renewal rights. Future minimum lease rentals payable under non-cancellable operating leases are as follows:
–
Due:
2019 2018Land and buildings
£mOther
£m
Land and buildings
£mOther
£m
Within one year 22.6 1.6 20.0 0.4In more than one year but less than five years 87.6 1.0 76.7 0.2In more than five years 480.1 – 371.7
590.3 2.6 468.4 0.6
The Group as lessorThe Group leases a proportion of its licensed estate and other unlicensed properties to tenants. The majority of lease agreements have terms of 21 years or less and are classified as operating leases. Future minimum lease rentals receivable under non-cancellable operating leases are as follows:
––––
Due:
2019 2018Land and buildings Other
£m £m
Land and buildings Other
£m £m
Within one year 16.5 – 17.6In more than one year but less than five years 49.4 – 55.4In more than five years 38.9 – 66.4
104.8 – 139.4
33 Finance leases
The Group leases various properties and items of equipment under finance leases. The leases have various terms, escalation clauses and renewal rights. Future minimum lease payments under finance leases are as follows:
Due:2019
£m2018
£m
Within one year 1.9 8.7In more than one year but less than five years 6.4 5.1In more than five years 33.7 35.0
42.0 48.8Future finance charges (20.1) (21.2)Present value of finance lease obligations 21.9 27.6
The present value of finance lease obligations is as follows:2019 2018
Due: £m £m
Within one year 0.8 7.5In more than one year but less than five years 2.1 0.8In more than five years 19.0 19.3Present value of finance lease obligations 21.9 27.6
34 Contingent liabilities and financial commitments
On 9 August 2005 the Group entered into a Tax Deed of Covenant, which was amended on 22 November 2007, the primary objective of which was to ensure that the Group did not trigger a de-grouping liability comprising Capital Gains Tax (CGT) and Stamp Duty Land Tax (SDLT). This would arise in the event of Marston’s Pubs Limited being sold outside the Group, within six years of the relevant asset transfer date for CGT purposes, and within three years of the relevant asset transfer date for SDLT purposes. Due to the passage of time and changes in the statutory rate of corporation tax, the total potential de-grouping liability now stands at £2.1 million (2018: £2.2 million), all of which relates to CGT.
The Group has issued letters of credit in favour of Royal & Sun Alliance Insurance totalling £0.2 million (2018: £0.3 million) and letters of credit in favour of Aviva totalling £2.5 million (2018: £2.1 million) to secure reinsurance contracts. Certain of these letters of credit are secured on fixed deposits (note 30).
The Group has also entered into a Deed of Guarantee with the Trustees of the Marston’s PLC Pension and Life Assurance Scheme (‘the Scheme’) whereby it guarantees to the Trustees the ongoing obligations of the Group to contribute to the Scheme, and the obligations of the Group to contribute to the Scheme in the event of a debt becoming due under section 75 of the Pensions Act 1995 on the occurrence of either a Group company entering liquidation or the Scheme winding up.

123Marston’s PLC Annual Report and Accounts 2019Financial Statements
35 Change in accounting policy
Adoption of IFRS 9 ‘Financial Instruments’The Group has adopted IFRS 9 ‘Financial Instruments’ in the current period. Comparative amounts have not been restated in accordance with the transitional provisions in paragraph 7.2.15 of the standard.
At 30 September 2018, the date of initial application of IFRS 9, the Group has assessed which business models apply to each of its financial assets and classified them into the appropriate IFRS 9 measurement categories. The changes from the IAS 39 ‘Financial Instruments: Recognition and Measurement’ measurement categories are shown in the table below:
IAS 39 measurement category
Carrying amount
IFRS 9 measurement categoryIAS 39
£mIFRS 9
£m
Trade loans Loans and receivables Fair value through profit or loss 9.6 9.6Trade receivables Loans and receivables Amortised cost 66.8 65.1Other receivables Loans and receivables Amortised cost 10.2 5.2Other cash deposits Loans and receivables Amortised cost 120.0 120.0Cash and cash equivalents Loans and receivables Amortised cost 41.4 41.4
248.0 241.3
Under IAS 39 trade loans were classified as loans and receivables and measured at amortised cost. However, as the repayment of the loan principal and/or the amount of interest payable generally varies with the number of barrels of beer purchased, these loans do not give rise on specified dates to cash flows that are solely payments of principal and interest on the principal amount outstanding. As such under IFRS 9 trade loans are measured at fair value through profit or loss.
The adoption of IFRS 9 has also required the Group to revise its impairment methodology for financial assets held at amortised cost and adopt the expected credit loss model. This has required the earlier recognition of impairment losses in respect of the Group’s trade receivables and other receivables.
The impact of the change in measurement categories and the adoption of the expected credit loss model is shown in the table below:
–
Amortised cost/
Loans and receivables
£m
Fair value through profit or
loss £m
Total £m
At 29 September 2018 (under IAS 39) 248.0 – 248.0Reclassification of trade loans (9.6) 9.6Impact of adoption of the expected credit loss model (6.7) – (6.7)At 30 September 2018 (under IFRS 9) 231.7 9.6 241.3
The adoption of IFRS 9 has not had a material impact on the amounts recognised in the income statement in the current period.
36 Events after the balance sheet date
In November 2019 the Group disposed of a package of 137 pubs for consideration of £44.9 million.

124 Marston’s PLC Annual Report and Accounts 2019
Note
28 September 2019
£m
29 September 2018
£m
Fixed assetsTangible assets 5 375.7 389.8Investments 6 260.9 260.9
636.6 650.7Current assetsDebtors
Amounts falling due within one year 7 561.7 548.9
Company Balance SheetAs at 28 September 2019
Amounts falling due after more than one year 7 1,049.8 951.1Cash at bank 15.9 9.5
1,627.4 1,509.5
Creditors Amounts falling due within one year 8 (767.1) (700.9)Net current assets 860.3 808.6Total assets less current liabilities 1,496.9 1,459.3
Creditors Amounts falling due after more than one year 8 (123.6) (120.8)Provisions for liabilities and charges 9 (20.9) (23.1)Net assets 1,352.4 1,315.4
Capital and reservesEquity share capital 13 48.7 48.7Share premium account 14 334.0 334.0Revaluation reserve 14 72.6 78.9Merger reserve 14 23.7 23.7Capital redemption reserve 14 6.8 6.8Own shares 14 (112.0) (112.3)Profit and loss reserves 978.6 935.6Total equity 1,352.4 1,315.4
The profit of the Company for the 52 weeks ended 28 September 2019 was £89.4 million (2018: £211.5 million).
The financial statements were approved by the Board and authorised for issue on 27 November 2019 and are signed on its behalf by:
Ralph Findlay Chief Executive Officer
27 November 2019
Company registration number: 31461

125Marston’s PLC Annual Report and Accounts 2019Financial Statements
Equity share
capital £m
Share premium account
£m
Revaluation reserve
£m
Merger reserve
£m
Capital redemption
reserve £m
Own shares
£m
Profit and loss
reserves £m
Total equity
£m
At 30 September 2018 48.7 334.0 78.9 23.7 6.8 (112.3) 935.6 1,315.4Profit for the period – – – – – – 89.4 89.4Revaluation of properties – – (2.5) – – – – (2.5)Deferred tax on properties – – (2.8) – – – – (2.8)Total comprehensive (expense)/income – – (5.3) – – – 89.4 84.1Share-based payments – – – – – – 0.3 0.3Sale of own shares – – – – – 0.3 (0.2) 0.1Transfer to profit and loss reserves – – (1.0) – – – 1.0 –Dividends paid – – – – – – (47.5) (47.5)Total transactions with owners – – (1.0) – – 0.3 (46.4) (47.1)At 28 September 2019 48.7 334.0 72.6 23.7 6.8 (112.0) 978.6 1,352.4
Company Statement of Changes in EquityFor the 52 weeks ended 28 September 2019
Equity share
capital £m
Share premium account
£m
Revaluation reserve
£m
Merger reserve
£m
Capital redemption
reserve £m
Own shares
£m
Profit and loss
reserves £m
Total equity
£m
At 1 October 2017 48.7 334.0 77.3 71.2 6.8 (111.3) 723.1 1,149.8Profit for the period – – – – – – 211.5 211.5Revaluation of properties – – (1.5) – – – – (1.5)Deferred tax on properties – – 3.8 – – – – 3.8Total comprehensive income – – 2.3 – – – 211.5 213.8Share-based payments – – – – – – 0.5 0.5Purchase of own shares – – – – – (1.2) – (1.2)Sale of own shares – – – – – 0.2 (0.2) –Transfer to profit and loss reserves – – (0.7) – – – 0.7 –Dividends paid – – – (47.5) – – – (47.5)Total transactions with owners – – (0.7) (47.5) – (1.0) 1.0 (48.2)At 29 September 2018 48.7 334.0 78.9 23.7 6.8 (112.3) 935.6 1,315.4
126 Marston’s PLC Annual Report and Accounts 2019
1 Accounting policies
Company informationMarston’s PLC is a public company limited by shares incorporated in England and Wales and domiciled in the UK. The registered office is Marston’s House, Brewery Road, Wolverhampton, WV1 4JT.
Basis of preparationThese financial statements have been prepared in accordance with FRS 102 ‘The Financial Reporting Standard applicable in the UK and Republic of Ireland’ (FRS 102) and the requirements of the Companies Act 2006.
The financial statements are prepared in sterling, which is the functional currency of the Company. Monetary amounts in these financial statements are rounded to the nearest £0.1 million.
The financial statements have been prepared under the historical cost convention modified to include the revaluation of freehold and leasehold properties and the holding of certain financial instruments at fair value. The principal accounting policies adopted are set out below.
The Company is a qualifying entity for the purposes of FRS 102, as it prepares publicly available consolidated financial statements, which are intended to give a true and fair view of the assets, liabilities, financial position and profit or loss of the Group. The Company has therefore taken advantage of the exemptions from the following disclosure requirements in FRS 102:
• Section 4 ‘Statement of Financial Position’ – Reconciliation of the opening and closing number of shares;• Section 7 ‘Statement of Cash Flows’ – Presentation of a statement of cash flows and related notes and disclosures;• Section 11 ‘Basic Financial Instruments’ – Carrying amounts, interest income/expense and net gains/losses for each category of financial instrument not
measured at fair value through profit or loss, and information that enables users to evaluate the significance of financial instruments;• Section 33 ‘Related Party Disclosures’ – Compensation for key management personnel.
These financial statements present information about the Company as an individual entity and not about its group.
As permitted by section 408(3) of the Companies Act 2006, no profit and loss account has been presented for the Company.
At the time of approving the financial statements, the Directors have a reasonable expectation that the Company has adequate resources to continue in operational existence for the foreseeable future. Thus the Directors continue to adopt the going concern basis of accounting in preparing the financial statements.
TurnoverTurnover represents rent receivable which is recognised in the period to which it relates.
Current and deferred taxThe tax currently payable is based on taxable profit for the period. Taxable profit differs from net profit as reported in the accounts because it excludes items of income or expense that are taxable or deductible in other periods and it further excludes items that are never taxable or deductible. The Company’s liability for current tax is calculated using tax rates that have been enacted or substantively enacted by the reporting end date.
Deferred tax liabilities are generally recognised for all timing differences and deferred tax assets are recognised to the extent that it is probable that they will be recovered against the reversal of deferred tax liabilities or other future taxable profits. Such assets and liabilities are not recognised if the timing difference arises from goodwill or from the initial recognition of other assets and liabilities in a transaction that affects neither the tax profit nor the accounting profit.
The carrying amount of deferred tax assets is reviewed at each reporting end date and reduced to the extent that it is no longer probable that sufficient taxable profits will be available to allow all or part of the asset to be recovered. Deferred tax is calculated at the tax rates that are expected to apply in the period when the liability is settled or the asset is realised. Deferred tax is charged or credited to profit or loss, except when it relates to items charged or credited directly to equity, in which case the deferred tax is also dealt with in equity. Deferred tax assets and liabilities are offset when the Company has a legally enforceable right to offset current tax assets and liabilities and the deferred tax assets and liabilities relate to taxes levied by the same tax authority.
Fixed assets• Freehold and leasehold properties are initially stated at cost and subsequently at valuation. Fixtures, fittings, plant and equipment are stated at cost.• Depreciation is charged to the profit and loss account on a straight-line basis to provide for the cost or valuation of the assets less their residual values over
their useful lives.• Freehold properties are depreciated to their residual values over 50 years.• Leasehold properties are depreciated to their residual values over the lower of the lease term and 50 years.• Fixtures, fittings, plant and equipment are depreciated over periods ranging from 3 to 20 years.• Interest costs directly attributable to capital projects are capitalised.• Land is not depreciated.
NotesFor the 52 weeks ended 28 September 2019
Properties are revalued by qualified valuers at least once in each rolling three year period, on an open market value basis. Substantially all of the Company’s properties have been externally valued in accordance with the Royal Institution of Chartered Surveyors’ Red Book. These valuations are performed directly by reference to observable prices in an active market or recent market transactions on arm’s length terms. Internal valuations are performed on the same basis.

127Marston’s PLC Annual Report and Accounts 2019Financial Statements
1 Accounting policies (continued)
When a valuation is below current carrying value, the asset concerned is reviewed for impairment. Impairment losses are charged to the revaluation reserve to the extent that a previous gain has been recorded, and thereafter to the profit and loss account. Surpluses on revaluation are recognised in the revaluation reserve, except to the extent they reverse previously charged impairment losses, in which case the reversal is recorded in the profit and loss account.
Disposals of fixed assetsProfit/loss on disposal of fixed assets represents net sale proceeds less the carrying value of the assets. Any element of the revaluation reserve relating to the fixed assets disposed of is transferred to profit and loss reserves at the date of sale.
Financial instrumentsThe Company has elected to apply the provisions of Section 11 ‘Basic Financial Instruments’ and Section 12 ‘Other Financial Instruments Issues’ of FRS 102 to all of its financial instruments.
Financial instruments are recognised in the balance sheet when the Company becomes party to the contractual provisions of the instrument.
Financial assets and liabilities are offset, with the net amounts presented in the financial statements, when there is a legally enforceable right to set off the recognised amounts and there is an intention to settle on a net basis or to realise the asset and settle the liability simultaneously.
Basic financial assetsBasic financial assets, which comprise amounts owed by Group undertakings, other debtors and cash and cash equivalents, are initially measured at the transaction price including transaction costs and are subsequently carried at amortised cost using the effective interest method.
Other financial assetsDerivatives, including interest rate swaps, are not basic financial assets and are accounted for as set out below.
Financial assets, other than those held at fair value through profit or loss, are assessed for indicators of impairment at each reporting end date.
Financial assets are impaired where there is objective evidence that, as a result of one or more events that occurred after the initial recognition of the financial asset, the estimated future cash flows have been affected. If an asset is impaired, the impairment loss is the difference between the carrying amount and the present value of the estimated cash flows discounted at the asset’s original effective interest rate. The impairment loss is recognised in profit or loss.
If there is a decrease in the impairment loss arising from an event occurring after the impairment was recognised, the impairment is reversed. The reversal is such that the current carrying amount does not exceed what the carrying amount would have been, had the impairment not previously been recognised. The impairment reversal is recognised in profit or loss.
Financial assets are derecognised only when the contractual rights to the cash flows from the asset expire or are settled, or when the Company transfers the financial asset and substantially all the risks and rewards of ownership to another entity.
Financial liabilities and equity instruments are classified according to the substance of the contractual arrangements entered into. An equity instrument is any contract that evidences a residual interest in the assets of the Company after deducting all of its liabilities.
Basic financial liabilitiesBasic financial liabilities, comprising amounts owed to Group undertakings, other creditors and borrowings, are initially recognised at the transaction price and subsequently carried at amortised cost using the effective interest method.
Other financial liabilitiesDerivatives, including interest rate swaps, are not basic financial liabilities and are accounted for as set out below.
Financial liabilities are derecognised when the Company’s contractual obligations expire or are discharged or cancelled.
DerivativesThe Company uses derivative financial instruments to hedge the Group’s exposure to fluctuations in interest rates. Derivative financial instruments are initially recognised in the balance sheet at fair value and are subsequently remeasured to their fair value at each balance sheet date. The Company has not designated any derivative financial instruments as hedging instruments and as such any gains or losses on remeasurement are recognised in the profit and loss account immediately.
A derivative with a positive fair value is recognised as a financial asset, whereas a derivative with a negative fair value is recognised as a financial liability.
LeasesLeases are classified as finance leases whenever the terms of the lease transfer substantially all the risks and rewards of ownership to the lessee. All other leases are classified as operating leases.
Assets held under finance leases are recognised as assets at the lower of the assets’ fair value at the date of inception of the lease and the present value of the minimum lease payments. The related liability is included in the balance sheet as a finance lease obligation. Lease payments are treated as consisting of capital and interest elements. The interest is charged to the profit and loss account so as to produce a constant periodic rate of interest on the remaining balance of the liability.

128 Marston’s PLC Annual Report and Accounts 2019
Notes continuedFor the 52 weeks ended 28 September 2019
1 Accounting policies (continued)
Rentals payable under operating leases, including any lease incentives received, are charged to the profit and loss account on a straight-line basis over the term of the relevant lease except where another more systematic basis is more representative of the time pattern in which economic benefits from the leased asset are consumed.
Lease premiums received are recognised on a straight-line basis over the life of the lease.
Obligations arising from sale and leaseback arrangements with repurchase options that do not fall within the scope of Section 20 ‘Leases’ of FRS 102 are classified as other lease related borrowings and accounted for as secured loans on an amortised cost basis.
Investments in subsidiariesInterests in subsidiaries are initially measured at cost and subsequently measured at cost less any accumulated impairment losses. The investments are assessed for impairment at each reporting date and any impairment losses or reversals of impairment losses are recognised immediately in profit or loss.
ProvisionsProvisions are recognised in the balance sheet when the Company has a present legal or constructive obligation as a result of a past event and it is probable that an outflow of economic benefits will be required to settle the obligation.
The amount recognised as a provision is the best estimate of the consideration required to settle the present obligation at the balance sheet date, taking into account the risks and uncertainties surrounding the obligation.
Where the effect of the time value of money is material, the amount expected to be required to settle the obligation is recognised at present value, using a pre-tax rate that reflects current market assessments of the time value of money and the risks specific to the obligation for which the estimates of future cash flows have not been adjusted. When a provision is measured at present value the unwinding of the discount is recognised as a finance cost in profit or loss in the period it arises.
When valuations of leasehold properties (based on future estimated income streams) give rise to a deficit as a result of onerous lease conditions they are recognised as provisions. Other contractual property costs are also recorded as provisions as appropriate.
DividendsDividends proposed by the Board but unpaid at the period end are recognised in the financial statements when they have been approved by the shareholders. Interim dividends are recognised when paid.
Preference sharesPreference shares are treated as borrowings, and dividends payable on those preference shares are charged as interest in the profit and loss account.
Group undertakingsThere is an intra group funding agreement in place between the Company and certain other members of the Group. This agreement stipulates that all balances outstanding on any intercompany loan account between these companies which exceed £1 are interest bearing at a prescribed rate.
There is a 12.5% subordinated loan owed to the Company by Marston’s Pubs Limited and there are deep discount bonds owed by the Company to Banks’s Brewery Insurance Limited. No interest is payable on any other amounts owed by/to Group companies who are not party to the intra group funding agreement.
All amounts owed by/to Group undertakings are unsecured and, with the exception of the subordinated loan and deep discount bonds, repayable on demand.
2 Judgements and key sources of estimation uncertainty
In the application of the Company’s accounting policies, the Directors are required to make judgements, estimates and assumptions about the carrying amounts of assets and liabilities that are not readily apparent from other sources. The estimates and associated assumptions are based on historical experience and other factors that are considered to be relevant. Actual results may differ from these estimates.
The estimates and underlying assumptions are reviewed on an ongoing basis. Revisions to accounting estimates are recognised in the period in which the estimate is revised where the revision affects only that period, or in the period of the revision and future periods where the revision affects both current and future periods.
Critical judgementsThe following judgements (apart from those involving estimates) have had the most significant effect on amounts recognised in the financial statements:
Lease classificationIn determining whether a lease is classified as an operating lease or finance lease, judgements are required in respect of whether the lease has transferred substantially all the risks and rewards of ownership of the leased asset to the lessee, in particular whether the present value of the minimum lease payments amounts to at least substantially all of the fair value of the asset and whether the lease term is for the major part of the economic life of the asset.
Deferred taxThere is judgement inherent in certain tax elections and claims that can be made by the Company in future periods which could materially reduce the level of deferred tax recognised in the accounts.
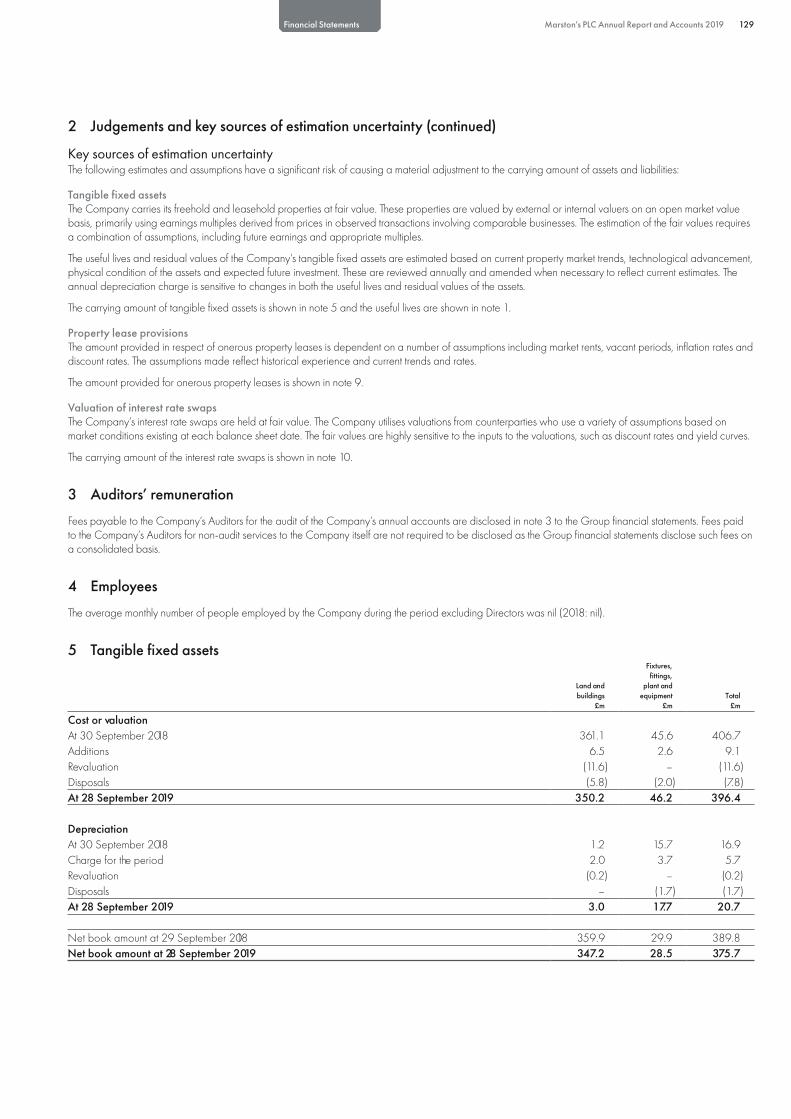
129Marston’s PLC Annual Report and Accounts 2019Financial Statements
2 Judgements and key sources of estimation uncertainty (continued)
Key sources of estimation uncertaintyThe following estimates and assumptions have a significant risk of causing a material adjustment to the carrying amount of assets and liabilities:
Tangible fixed assetsThe Company carries its freehold and leasehold properties at fair value. These properties are valued by external or internal valuers on an open market value basis, primarily using earnings multiples derived from prices in observed transactions involving comparable businesses. The estimation of the fair values requires a combination of assumptions, including future earnings and appropriate multiples.
The useful lives and residual values of the Company’s tangible fixed assets are estimated based on current property market trends, technological advancement, physical condition of the assets and expected future investment. These are reviewed annually and amended when necessary to reflect current estimates. The annual depreciation charge is sensitive to changes in both the useful lives and residual values of the assets.
The carrying amount of tangible fixed assets is shown in note 5 and the useful lives are shown in note 1.
Property lease provisionsThe amount provided in respect of onerous property leases is dependent on a number of assumptions including market rents, vacant periods, inflation rates and discount rates. The assumptions made reflect historical experience and current trends and rates.
The amount provided for onerous property leases is shown in note 9.
Valuation of interest rate swapsThe Company’s interest rate swaps are held at fair value. The Company utilises valuations from counterparties who use a variety of assumptions based on market conditions existing at each balance sheet date. The fair values are highly sensitive to the inputs to the valuations, such as discount rates and yield curves.
The carrying amount of the interest rate swaps is shown in note 10.
3 Auditors’ remuneration
Fees payable to the Company’s Auditors for the audit of the Company’s annual accounts are disclosed in note 3 to the Group financial statements. Fees paid to the Company’s Auditors for non-audit services to the Company itself are not required to be disclosed as the Group financial statements disclose such fees on a consolidated basis.
4 Employees
The average monthly number of people employed by the Company during the period excluding Directors was nil (2018: nil).
5 Tangible fixed assets
Land and buildings
£m
Fixtures, fittings,
plant and equipment
£mTotal
£m
Cost or valuationAt 30 September 2018AdditionsRevaluationDisposals
361.16.5
(11.6)(5.8)
45.6 2.6
–(2.0)
406.7 9.1
(11.6)(7.8)
At 28 September 2019 350.2 46.2 396.4
DepreciationAt 30 September 2018Charge for the periodRevaluationDisposals
1.2 2.0
(0.2)–
15.7 3.7
–(1.7)
16.9 5.7
(0.2)(1.7)
At 28 September 2019 3.0 17.7 20.7
Net book amount at 29 September 2018 359.9 29.9 389.8Net book amount at 28 September 2019 347.2 28.5 375.7

130 Marston’s PLC Annual Report and Accounts 2019
Notes continuedFor the 52 weeks ended 28 September 2019
5 Tangible fixed assets (continued)
The net book amount of land and buildings is split as follows:
Freehold propertiesLeasehold properties over 50 years unexpiredLeasehold properties under 50 years unexpired
2019 £m
2018 £m
254.5 265.667.9 69.424.8 24.9
347.2 359.9
If the land and buildings had not been revalued, the historical cost net book amount would be £262.8 million (2018: £272.0 million).
Interest costs of £nil (2018: £0.1 million) were capitalised in the period in respect of the financing of major projects.
Capital expenditure authorised and committed at the period end but not provided for in the financial statements was £0.4 million (2018: £1.4 million).
The net book amount of land and buildings held under finance leases at 28 September 2019 was £25.5 million (2018: £26.9 million). The net book amount of land and buildings held as part of sale and leaseback arrangements that do not fall within the scope of Section 20 ‘Leases’ of FRS 102 was £120.6 million (2018: £125.8 million). The net book amount of fixtures, fittings, plant and equipment held under finance leases was £0.5 million (2018: £nil). The net book amount of fixtures, fittings, plant and equipment held as security for bank borrowings was £7.0 million (2018: £nil).
The Company has charged property with a value of £4.9 million (2018: £4.9 million) in favour of the Marston’s PLC Pension and Life Assurance Scheme (the ‘Scheme’) as continuing security for the Group’s obligations to the Scheme.
Revaluation/impairmentDuring the current period various properties were reviewed for impairment and/or material changes in value. These valuation adjustments were recognised in the revaluation reserve or profit and account as appropriate.
At 28 January 2018 independent chartered surveyors revalued the Company’s freehold and leasehold properties on an open market value basis. These valuations were incorporated into the financial statements and the resulting revaluation adjustments were recognised in the revaluation reserve or profit and loss account as appropriate.
The impact of the revaluations/impairments described above is as follows:2019
£m2018
£m
Profit and loss account:Impairment (8.9) (16.9)Reversal of past impairment – 3.0
(8.9) (13.9)Revaluation reserve:Unrealised revaluation surplus – 23.7Reversal of past revaluation surplus (2.5) (25.2)
(2.5) (1.5)Net decrease in shareholders’ equity/tangible fixed assets (11.4) (15.4)
6 Fixed asset investmentsSubsidiary
undertakings £m
CostAt 30 September 2018Capital contribution in respect of equity-settled share-based payments
261.4 0.3
At 28 September 2019 261.7
ImpairmentsAt 30 September 2018Charged in the period
0.50.3
At 28 September 2019 0.8
Net book amount at 29 September 2018 260.9Net book amount at 28 September 2019 260.9

131Marston’s PLC Annual Report and Accounts 2019Financial Statements
6 Fixed asset investments (continued)
These financial statements are separate company financial statements for Marston’s PLC.
The Company had the following subsidiary undertakings at 28 September 2019:
Nature of business Class of share
Proportion of shares held directly by
Marston’s PLC
Proportion of shares held by the Group
Marston’s Estates Limited Property management Ordinary 25p – 100%Marston’s Operating Limited Pub retailer Ordinary £1 – 100%Marston’s Pubs Limited Pub retailer Ordinary £1 – 100%Marston’s Pubs Parent Limited Holding company Ordinary £1 – 100%Marston’s Telecoms Limited Telecommunications Ordinary £1 – 100%Marston’s Trading Limited Pub retailer and brewer Ordinary £5 – 100%Banks’s Brewery Insurance Limited Insurance Ordinary £1 – 100%Marston’s Acquisitions Limited Acquisition company Ordinary 25p – 100%
Preference £1 – 100%Marston’s Corporate Holdings Limited Holding company Ordinary £1 100% 100%Marston’s Issuer PLC Financing company Ordinary £1 – –Marston’s Issuer Parent Limited Holding company Ordinary £1 – –Bedford Canning Company Limited Dormant Ordinary £1 – 100%Bluu Limited Dormant Ordinary £1 – 100%Brasserie Restaurants Limited Dormant Ordinary £1 – 100%Celtic Inns Holdings Limited Dormant Ordinary 1p – 100%Celtic Inns Limited Dormant Ordinary £1 – 100%Eldridge, Pope & Co., Limited Dormant Ordinary 50p – 100%English Country Inns Limited Dormant Ordinary 50p – 100%EP Investments 2004 Limited Dormant Ordinary 1p – 100%Fairdeed Limited Dormant ‘A’ Ordinary £1 – 100%Fayolle Limited Dormant Ordinary £1 – 100%John Marston’s Taverners Limited Dormant Ordinary £1 – 100%Lambert Parker & Gaines Limited Dormant Ordinary £1 – 100%Mansfield Brewery Limited Dormant Ordinary 25p – 100%Mansfield Brewery Properties Limited Dormant Ordinary £1 – 100%Mansfield Brewery Trading Limited Dormant Ordinary £1 – 100%Marston, Thompson & Evershed Limited Dormant Ordinary 25p – 100%Marston’s Developments Limited Dormant Ordinary £1 – 100%Marston’s Property Developments Limited Dormant Ordinary £1 – 100%Osprey Inns Limited Dormant Ordinary £1 – 100%Pitcher and Piano Limited Dormant Ordinary £1 – 100%Porter Black (2003) Limited Dormant Ordinary £1 – 100%QP Bars Limited Dormant Ordinary £1 – 100%Refresh Group Limited Dormant Ordinary 1p – 100%Refresh UK Limited Dormant Ordinary 10p – 100%Ringwood Brewery Limited Dormant Ordinary £1 – 100%S.K. Williams Limited Dormant Ordinary £1 – 100%SDA Limited Dormant Ordinary £1 – 100%Sherwood Forest Properties Limited Dormant Ordinary £1 – 100%Sovereign Inns Limited Dormant Ordinary £1 – 100%The Gray Ox Limited Dormant Ordinary £1 – 100%The Wychwood Brewery Company Limited Dormant Ordinary £1 – 100%W&DB (Finance) Limited Dormant Ordinary £1 – 100%W. & D. Limited Dormant Ordinary £1 – 100%Wizard Inns Limited Dormant ‘A’ Ordinary 1p – 100%
Deferred 1p – 100%Wychwood Holdings Limited Dormant ‘A’ Ordinary 1p – 100%
‘B’ Ordinary 1p – 100%
The registered office of all of the above subsidiaries is Marston’s House, Brewery Road, Wolverhampton, WV1 4JT, with the exception of Banks’s Brewery Insurance Limited, Marston’s Issuer PLC and Marston’s Issuer Parent Limited. The registered office of Banks’s Brewery Insurance Limited is PO Box 33, Dorey Court, Admiral Park, St Peter Port, Guernsey, GY1 4AT. The registered office of Marston’s Issuer PLC and Marston’s Issuer Parent Limited is Wilmington Trust SP Services (London) Limited, Third Floor, 1 King’s Arms Yard, London, EC2R 7AF.
All subsidiaries have been included in the consolidated financial statements.
Although the Group does not hold any shares in Marston’s Issuer PLC and its parent company, Marston’s Issuer Parent Limited, these companies are treated as subsidiary undertakings for the purpose of the consolidated financial statements as it is considered that they are controlled by the Group. Marston’s Issuer PLC was set up with the sole purpose of issuing debt secured on the assets of Marston’s Pubs Limited. Wilmington Trust SP Services (London) Limited holds the shares of Marston’s Issuer Parent Limited under a declaration of trust for charitable purposes.

132 Marston’s PLC Annual Report and Accounts 2019
Notes continuedFor the 52 weeks ended 28 September 2019
7 DebtorsAmounts falling due within one year
2019 £m
2018 £m
Amounts owed by Group undertakings 520.5 520.5Derivative financial instruments 40.5 28.1Prepayments and accrued income 0.2 0.1Other debtors 0.5 0.2
561.7 548.9
20182019Amounts falling due after more than one year £m £m
12.5% subordinated loan owed by Group undertaking 1,049.8 951.1
8 CreditorsAmounts falling due within one year
2019 £m
2018 £m
Amounts owed to Group undertakings 707.8 654.4Bank borrowings 1.0 –Finance leases 0.6 0.2Other lease related borrowings (0.1) (0.1)Corporation tax 9.4 9.3Derivative financial instruments 40.5 28.1Accruals and deferred income 7.9 9.0
767.1 700.9
20182019Amounts falling due after more than one year £m £m
Bank borrowings 3.0 –Finance leases 20.4 20.1Other lease related borrowings 88.1 88.0Preference shares 0.1 0.1Accruals and deferred income 11.5 12.1Other creditors 0.5 0.5
123.6 120.8
The preference shares carry the right to a fixed cumulative preferential dividend. They participate in the event of a winding-up and on a return of capital and carry the right to attend and vote at general meetings of the Company, carrying four votes per share.
Other lease related borrowings represent amounts due under sale and leaseback arrangements that do not fall within the scope of Section 20 ‘Leases’ of FRS 102. The Company has an option to repurchase each leased property for a nominal amount at the end of the lease. The leases have terms of 35 to 40 years and rents which are linked to RPI, subject to a cap and collar.
The amount falling due for payment after more than five years from the balance sheet date on debts repayable by instalments was £107.6 million (2018: £107.8 million). Debts of £0.1 million (2018: £0.1 million) were repayable otherwise than by instalments after more than five years from the balance sheet date.
9 Provisions for liabilities and chargesDeferred
tax £m
Property leases
£mTotal
£m
At 30 September 2018 19.2 3.9 23.1Provided in the period – 0.9 0.9Released in the period – (0.5) (0.5)Unwinding of discount – 0.1 0.1Utilised in the period – (1.0) (1.0)Adjustment for change in discount rate – 0.3 0.3Credited to profit and loss (4.8) – (4.8)Charged to other comprehensive income 2.8 – 2.8At 28 September 2019 17.2 3.7 20.9
Payments are expected to continue in respect of these property leases for periods of 1 to 25 years (2018: 1 to 26 years).

133Marston’s PLC Annual Report and Accounts 2019Financial Statements
9 Provisions for liabilities and charges (continued)
Deferred taxThe amount provided in respect of deferred tax is as follows:
2018 £m
2019 £m
Excess of capital allowances over accumulated depreciation 6.1 6.1Property related items 11.1 13.1
17.2 19.2
10 Financial instruments2019 2018
Carrying amount of financial assets £m £m
Measured at fair value through profit or loss 40.5 28.1
20182019Carrying amount of financial liabilities £m £m
Measured at fair value through profit or loss 40.5 28.1
The only financial instruments that the Company holds at fair value are interest rate swaps. The fair values of the Company’s interest rate swaps are obtained using a market approach and reflect the estimated amount the Company would expect to pay or receive on termination of the instruments. The Company utilises valuations from counterparties who use a variety of assumptions based on market conditions existing at each balance sheet date.
11 Operating lease commitments
At 28 September 2019 the Company had outstanding commitments for future minimum lease payments under non-cancellable operating leases as follows:
Due:2019
£m2018
£m
Within one year 7.0 6.6In more than one year but less than five years 25.0 23.2In more than five years 71.9 70.4
103.9 100.2
12 Finance lease obligations
The Company leases various properties and items of equipment under finance leases. The leases have various terms, escalation clauses and renewal rights. Future minimum lease payments under finance leases are as follows:
Due:2019
£m2018
£m
Within one year 1.7 1.3In more than one year but less than five years 5.6 5.1In more than five years 33.7 35.0
41.0 41.4Future finance charges (20.0) (21.1)Present value of finance lease obligations 21.0 20.3
13 Equity share capital
Allotted, called up and fully paid
2019 2018Number
mValue
£mNumber
mValue
£m
Ordinary shares of 7.375p each 660.4 48.7 660.4 48.7

134 Marston’s PLC Annual Report and Accounts 2019
14 Reserves
The share premium account comprises amounts in excess of nominal value received for the issue of shares less any transaction costs.
When freehold and leasehold properties are revalued any gains and losses are recognised in the revaluation reserve, except to the extent that a revaluation gain reverses a revaluation loss previously recognised in profit or loss or a revaluation loss exceeds the accumulated revaluation gains recognised in the revaluation reserve; such gains and losses are recognised in profit or loss. The associated deferred tax on revaluations is also recognised in the revaluation reserve. Amounts representing the equivalent depreciation are transferred to profit and loss reserves annually and the full amount is transferred on disposal of the associated property.
The merger reserve arose on the issue of ordinary shares in the period ended 30 September 2017 and represents the difference between the nominal value of the shares issued and the net proceeds received, less the dividends paid in the prior period.
The capital redemption reserve arose on share buybacks.
Details of own shares are provided in note 29 to the Group financial statements.
15 Guarantees and contingent liabilities
Notes continuedFor the 52 weeks ended 28 September 2019
The Company has entered into a Deed of Guarantee with Marston’s Trading Limited (‘Trading’) and the Trustees of the Marston’s PLC Pension and Life Assurance Scheme (‘the Scheme’) whereby it guarantees to the Trustees the ongoing obligations of Trading to contribute to the Scheme and the obligations of Trading to contribute to the Scheme in the event of a debt becoming due under section 75 of the Pensions Act 1995 on the occurrence of either Trading entering liquidation or the Scheme winding up.
The Company has guaranteed the obligations of Trading under certain of its banking facilities and the obligations of Marston’s Estates Limited under various property leases.

Additional InformationInformation for Shareholders 136Glossary 139Pub-restaurants and lodges completed during the period 140
Additional Information Marston’s PLC Annual Report and Accounts 2019 135
136 Marston’s PLC Annual Report and Accounts 2019
Annual General Meeting (AGM)
The Company’s AGM will be held on 24 January 2020 at 11:00am at Wolverhampton Wanderers Football Club, Molineux Stadium, Waterloo Road, Wolverhampton, WV1 4QR.
Financial calendarEx-dividend date for final dividend 12 December 2019Record date for final dividend 13 December 2019AGM and Interim Management Statement 24 January 2020Final dividend payment date 27 January 2020Half-year results 13 May 2020Ex-dividend date for interim dividend May 2020Interim dividend payment date July 2020Full-year results 28 November 2020
These dates are indicative only and may be subject to change.
The Marston’s website
Shareholders are encouraged to visit our website www.marstons.co.uk for further information about the Company. The dedicated Investors section on the website contains information specifically for shareholders, including share price information, historical dividend amounts and payment dates together with this year’s (and prior years’) Annual Report and Accounts.
Registrars
The Company’s shareholder register is maintained by our Registrar, Equiniti. If you have any queries relating to your Marston’s PLC shareholding you should contact Equiniti directly by one of the methods below:
Online: help.shareview.co.uk – from here you will be able to securely email Equiniti with your query
Telephone: 0371 384 2274*
By post: Equiniti, Aspect House, Spencer Road, Lancing, West Sussex, BN99 6DA
* Lines are open from 8.30am to 5.30pm (UK time), Monday to Friday, excluding public holidays in England and Wales.
Information for Shareholders
Dividend payments
By completing a bank mandate form, dividends can be paid directly into your bank or building society account. Those selecting this payment method will benefit from receiving cleared funds in their bank account on the payment date, avoiding postal delays and removing the risk of any cheques being lost in the post. To change how you receive your dividends contact Equiniti or visit www.shareview.co.uk
Duplicate documents
If you have received two or more sets of the documents concerning the AGM this means that there is more than one account in your name on the shareholder register, perhaps because either your name or your address appear on each account in a slightly different way. If you think this might be the case and would like to combine your accounts, please contact Equiniti.
Moving house?
It is important that you notify Equiniti of your new address as soon as possible. If you hold 2,500 shares or fewer, and reside in the UK, this can be done quickly over the telephone. However, for holdings greater than 2,500 shares your instruction will need to be in writing, quoting your full name, shareholder reference number (if known), previous address and new address.

Additional Information 137Marston’s PLC Annual Report and Accounts 2019
Electronic communications
Changes in legislation in recent years allow the Company to use its corporate website as the main way to communicate with shareholders. Annual Report and Accounts are only sent to those shareholders who have opted to receive a paper copy. Registering to receive shareholder documentation from the Company electronically will allow shareholders to:
• view the Annual Report and Accounts on the day it is published;• receive an email alert when the Annual Report and Accounts and any other shareholder documents are available;• cast their AGM votes electronically; and• manage their shareholding quickly and securely online, through www.shareview.co.uk
This reduces our impact on the environment, minimises waste and reduces printing and mailing costs. For further information and to register for electronic shareholder communications visit www.shareview.co.uk
Buying and selling shares in the UK
If you wish to buy or sell Marston’s PLC shares and hold a share certificate, you can:
• use the services of a stockbroker or high street bank; or• use a telephone or online service.
If you sell your shares in this way you will need to present your share certificate at the time of sale. Details of low cost dealing services may be obtained from www.shareview.co.uk or 0345 603 7037**.
** Lines are open Monday to Friday, 8.00am to 4.30pm for dealing and until 6.00pm for enquiries (UK time), excluding English public holidays.
Ordinary shares
Range of shareholdingBalance ranges
Total number of holdings
Percentage of holders
Total number of shares
Percentage issued capital
1–1,000 3,613 40.27% 1,499,924 0.23%1,001–10,000 4,024 44.84% 15,511,166 2.35%10,001–100,000 1,026 11.44% 28,023,591 4.24%100,001–1,000,000 205 2.29% 73,033,742 11.06%1,000,001–9,999,999,999 104 1.16% 542,293,771 82.12%Totals 8,972 100.00% 660,362,194 100.00%
An analysis of the register by shareholder type can be found in the Governance section on page 51.
Company details
Registered office: Marston’s House, Brewery Road, Wolverhampton, WV1 4JT
Telephone: 01902 711811
Company registration number: 31461
Investor queries: [email protected]
Auditors
PricewaterhouseCoopers LLP, Cornwall Court, 19 Cornwall Street, Birmingham, B3 2DT (until December 2019, thereafter KPMG will be appointed) KPMG LLP, One Snowhill, Snowhill Queensway, Birmingham, B4 6GH
Advisers
JP Morgan Cazenove, 20 Moorgate, London, EC2R 6DA
Numis Securities Limited, The London Stock Exchange Building, 10 Paternoster Square, London, EC4M 7LT
Solicitors
Freshfield Bruckhaus Deringer LLP, 65 Fleet Street, London, EC4Y 1HS
Shoosmiths LLP, 2 Colmore Square, 38 Colmore Circus Queensway, Birmingham, B4 6BJ
Squire Patton Boggs (UK) LLP, Rutland House, 148 Edmund Street, Birmingham, B3 2JR
Pinsent Masons LLP, 55 Colmore Row, Birmingham, B3 2FF

138 Marston’s PLC Annual Report and Accounts 2019
Share fraud warning
Share fraud includes scams where investors are called out of the blue and offered an inflated price for shares they own or shares that often turn out to be worthless or non-existent. These calls come from fraudsters operating ‘boiler rooms’ that are mostly based abroad. While high profits are promised, those who buy or sell shares in this way usually lose their money. The Financial Conduct Authority (FCA) has found most share fraud victims are experienced investors who lose an average of £20,000, with around £200 million lost in the UK each year.
If you are offered unsolicited investment advice, discounted shares, a premium price for shares you own, or free company or research reports, you should take these steps before handing over any money:
• Get the name of the person and organisation contacting you.• Check the Financial Services Register at www.fca.org.uk/register to ensure they are authorised.• Use the details on the FCA Register to contact the firm.• Call the FCA Consumer Helpline on 0800 111 6768 if there are no contact details on the Register or you are told they are out of date.• Search the FCA list of unauthorised firms and individuals to avoid doing business with.
Remember, if it sounds too good to be true, it probably is.
Information for Shareholders continued
If you use an unauthorised firm to buy or sell shares or other investments, you will not have access to the Financial Ombudsman Service or Financial Services Compensation Scheme if things go wrong.
If you are approached about a share scam you should tell the FCA using the share fraud reporting form at www.fca.org.uk, where you will find out about the latest investment scams. You can also call the Consumer Helpline on 0800 111 6768.

Additional Information 139Marston’s PLC Annual Report and Accounts 2019
Glossary
Apprenticeship Levy A compulsory tax on employers to help fund the development and delivery of apprenticeships
BBPA British Beer & Pub Association – a body representing Britain’s brewers and pub companies
Beer Quality Technician Our BQTs provide equipment, repairs and quality training for pubs and bars
CGA Data and insight provider
Coffer Peach Business Tracker Sales data for the UK eating and drinking out market
Critical role turnover The number of times the person in a critical role changes
CROCCE Cash Return on Cash Capital Employed – calculated in the same way as ROC
CR Corporate Responsibility – businesses’ response to their impact on society
CWBB Charles Wells Beer Business
EBIT Earnings before interest and tax
EBITDA Earnings before interest, tax, depreciation and amortisation
EBITDAR Earnings before interest, tax, depreciation, amortisation and restructuring or rent
EHO Environmental Health Officer
EPOS Electronic point of sale
EPS Earnings per share
ESG Environmental, Social and Governance
EU Emissions Trading Scheme First large greenhouse gas emissions trading scheme, a major pillar of the EU Energy policy
EV Electric vehicle
Export Anything sold outside the UK
FCF Free cash flow – operating cash flow of the business after tax and interest
FRC Financial Reporting Council – independent regulator
Free trade Independently owned pubs and clubs
FTSE4Good Ethical stock market indices launched in 2001, with inclusion based on a range of Corporate Responsibility criteria
GWE Biogas plant Food waste processing plant
Happiness score Measure of guest satisfaction used in our pubs and bars
IPA Indian pale ale
IRI Market research provider for consumer and retail insight
Kantar Data and insight consultancy
kW Kilowatt – a measure of electric power
IGD Data and insight provider for food and grocery industry
LPG Liquefied petroleum gas, used as a fuel in heating appliances, cooking equipment and vehicles
Like-for-like Sales this year compared to sales in the previous year, of the some pubs trading in both periods, expressed as a percentage
Low and no-alcohol No more than 1.2% abv and no more than 0.05% abv, respectively
MBC Marston’s Beer Company, internal division
MRO Market rent only – as defined in The Pubs Code
MW Megawatt – a measure of electric power
National Living Wage Government minimum pay requirements for 25s and over
National Minimum Wage Government minimum pay requirements for under 25s
NED Non-executive Director
Net cash flow Cash inflows and outflows in a given period
Net zero Balance of carbon emissions with carbon removal or eliminating carbon emissions altogether
Off-trade Business with food and drink retailers, such as supermarkets (also known as take home)
On-trade Business with hotels, bars, restaurants and pub companies
On time in full Fulfilling 100% of order requirements within agreed timeframe
Packaged Includes bottles and cans
PBT Profit before tax
PBA Premium bottled ale
PCA Pubs Code Adjudicator
PCDR Performance, Career and Development Review
Primary logistics Delivery to off-trade and on-trade depots
Rapid electrical vehicle chargers Fast charging network for electric vehicles
Retail logistics Delivery direct to our pubs
RevPAR Revenue per available room
ROC Return on capital – a measure of how effectively we use the capital invested in our business
SEDEX Supplier Ethical Data Exchange – membership organisation for auditing supply chains
Streamlined Energy and Carbon Reporting Regulation Mandatory reporting regulation framework for businesses which aims to increase productivity and energy efficiency
The Pubs Code Statutory regulation effective 21 July 2016
TSR Total shareholder return – a combination of share price appreciation and dividends paid
United Nations Sustainable Development Goals See website sustainabledevelopment.un.org
Venture Pubs Tenanted and leased pubs
Ways of Working (WoW) Marston’s values and principles that guide our expected behaviours and actions

140 Marston’s PLC Annual Report and Accounts 2019
Pub-restaurants and lodges completed during the period
ScotlandCamperdown Elm, Dundee
NorthFlying Squirrel, Bradford
MidlandsPaisley Pear, Brackley (and lodge)
SouthCopper Coast, Camborne
Dragonfly, Basingstoke
Oakingham Belle, Wokingham
Smugglers Cove, Clacton (and lodge)
Turing Key, Bletchley

Designed and produced by Radley Yeldar | ry.com
This report has been printed on materials that are FSC Certified and sourced from a mill which is ISO14001 accredited.
The report is printed by an FSC and ISO14001 certified printer, using vegetable oil based inks and an alcohol free process.

Marston’s PLC
Marston’s House, Brewery Road, Wolverhampton WV1 4JT
Telephone 01902 711811 Registered No. 31461