ANNUAL REPORT 20181: Including active pharmaceutical ingredients (API) and bulk exports *2: Supply...
54
ANNUAL REPORT 2018 For the Year Ended March 31, 2018
Transcript of ANNUAL REPORT 20181: Including active pharmaceutical ingredients (API) and bulk exports *2: Supply...

ANNUAL REPORT 2018 For the Year Ended March 31, 2018

The Kissei Group’s history began with the founding of Tachibana Seikagaku Institute Co., Ltd. in 1946. Since then, we have operated under two management philosophies: “contribute to society through high-quality, innovative pharmaceutical products” and “serve society through our employees.” In 1982 we launched Rizaben®, the first oral drug for the treatment of allergic diseases in Japan. We later developed and launched Utemerin®, a drug for the treatment of threatened premature labor and threatened abortion; Bezatol®, a drug for the treatment of hyperlipid-emia; and a variety of other high-quality new drugs. In addition to these innovative pharmaceutical prod-ucts, we also offer other successful pharmaceutical prod-ucts that have earned top shares, including Urief®, a drug
for the treatment of dysuria associated with benign pros-tatic hyperplasia (BPH); Epoetin Alfa BS Injection [JCR], a drug for the treatment of renal anemia; and P-TOL®, a drug for the treatment of hyperphosphatemia, in our priority areas of urology, and renal diseases and dialysis, where we perform strongly. We are also growing our nutritional business through development and sales of special therapeutic food products represented by the Yume Series of protein controlled foods. We firmly believe that a pharmaceutical company cannot exist without R&D, an idea which has been passed on since our founding, and continue to develop and provide original pharmaceuticals to further improve global health.
Contribute to society through
high-quality, innovative pharmaceutical products
Serve society through our employees
We aim to be an R&D-oriented pharmaceutical company that
contributes to the health of people around the world through
innovative pharmaceutical products.
Management Philosophy
Management Vision

2 Kissei’s Business
3 Kissei’s Value Creation Process
4 Financial and Non-Financial Highlights
5 Medium-Term Management Plan
6 Letter from the CEO
8 Message from the COO
12 Research and Development (R&D)
16 Major Domestic Pharmaceuticals
18 Promoting Overseas Development
20 Corporate Governance
26 Corporate Social Responsibility (CSR)
29 Financial Review
30 Business Risks
Cautionary Notice regarding Forward-Looking Statements The financial forecasts, R&D plans, and other forward-looking statements that appear in this report are based on information available to the Company
at the time of disclosure. In other words, such information forms the basis of our future outlooks. For that reason, projections may differ from actual
financial and R&D results.
Numerical Data Amounts in this report are rounded down. As a result, the sum and breakdown of data may not equal the total amounts.
Contents
1Annual Report 2018 KISSEI
Financial Section
32 Consolidated Balance Sheets
34 Consolidated Statements of Income and
Consolidated Statements of
Comprehensive Income
35 Consolidated Statements of
Changes in Net Assets
36 Consolidated Statements of Cash Flows
37 Notes to the Consolidated
Financial Statements
49 Independent Auditor’s Report
50 Corporate Information
51 Investor Information

2 KISSEI Annual Report 2018
Kissei’s Business
Therapeutic and care foods
We develop and sell various food products, such as protein controlled foods and energy supply foods, so that people who have restricted dietary habits, such as the elderly and patients suffering from renal diseases, will feel comforted by our foods and be able to enjoy eating them. By leveraging the technology and devel-opment knowhow cultivated over many years in the pharmaceutical business, we are creating food products that are tasty, nutritionally balanced, easy to eat, and appropriate to a therapeutic diet.
The Kissei Group consists of five companies, including a consoli-
dated financial statement submitting company, three consoli-
dated domestic subsidiaries, and one unconsolidated overseas
subsidiary. The main focus of the Kissei Group is the manufac-
ture and sale of ethical drugs, and the related materials. We are
developing business activities such as purchase / sales, system
development / information processing, construction contract-
ing, facility / facility management, information gathering / devel-
opment support service, and other services.
Kissei is guided by its firm belief that a pharmaceutical company
cannot exist without R&D, which has been passed on since its
founding. As an R&D-oriented pharmaceutical company, Kissei is
conducting research and development, manufacturing, and sales
of mainly ethical drugs to improve the quality of life for patients and
their families around the world.
Furthermore, based on the principle that a healthy diet leads to
a healthy body, we are also developing our nutritional business in
order to contribute to medical care through food.
Other Businesses
¥10.1 billion, 13.7%
Others*2
¥6.7 billion, 10.6%
Pharmaceutical Business ¥63.8 billion, 86.3%
Pharmaceuticals*1
In the pharmaceutical business, we are conducting research and develop-ment on pharmaceutical products in the priority areas of urology, renal dis-eases and dialysis, and unmet medical needs. We aim to develop innovative pharmaceutical products that contrib-ute to the improvement of medicine and the health of people around the world by aggressive incorporation of leading-edge technology and joint research and collaborations with our foreign and domestic partners.
¥53.3 billion, 83.5%
¥3.7 billion, 5.9%
*1: Including active pharmaceutical ingredients (API) and bulk exports *2: Supply to domestic sales partners + revenue from technical fees (contract fees
from out-licensing of R&D themes, milestone income, and running royalties)
Fiscal 2017 Consolidated net sales
¥74.0 billion
Fiscal 2017 Non-consolidated net sales (Pharmaceutical Business)
¥63.8 billion

3Annual Report 2018 KISSEI
What Kissei Gives
Contribution to the health and medical care of people
around the world
Safe and high-quality products using its technical abilities
and human capital
Kissei’s Value Creation Process
Kissei conducts business activities while responding to changing external environments in pursuit of its management vision—to be an
R&D-oriented pharmaceutical company that contributes to the health of people around the world through innovative pharmaceutical
products. We are working to improve corporate value by sharing results with a range of stakeholders, building relationships of trust, and
further enhancing management capital. Our goal is to achieve continuous growth as a company that is invaluable to society by means of
enhancing this cycle throughout the medium to long term.
Kissei’s Management Philosophy
Contribute to society through high-quality,
innovative pharmaceutical products
Serve society through our employees
Drug development
Drug observation
Technical ability
Human capital
Etc.
External Environments that Impact Operations
The establishment of its unique presence
worldwide
Stable management base
The trust of its stakeholders
What Kissei Gets (outcomes)
Achieve continuous, long-term growth by carrying out enhancements of management
capital from business outcomes and strengthening competitiveness
Diversification of medical needs
Discovery of unmet medical needs
Policy in support of new drug development
CSR Management
ProcurementResearch
and development
Quality assurance Production Sales and
services
Business ActivitiesKissei’s business processes and strengths
As an R&D-oriented pharmaceutical company, build a uniform value chain for drugs and therapeutic food products that spans
from development to production and sales
Prescription drugs and special therapeutic food products
Patients and their families
Kissei’s Management Capital
Financial capitalStrong capital structure
Production capitalFactory and laboratory equipment
Natural capitalCo-existing with nature as a company
involved in life sciences
Intellectual capitalCompetitive intellectual property
Human capitalHuman resources with profound knowledge and technical skills
Social capitalPartnerships with local communities
and stakeholders
Management Vision

4 KISSEI Annual Report 2018
Kissei Pharmaceutical Co., Ltd. and its subsidiaries Years ended March 31
Financial and Non-Financial Highlights
Millions of yen, except per share dataThousands of U.S.
dollars, except per share data*1
2014 2015 2016 2017 2018 2018
For the Year:
Net Sales ¥70,399 ¥70,110 ¥71,294 ¥71,706 ¥74,009 $698,198
R&D Expenses 11,298 14,488 14,106 13,877 14,179 133,764
Capital Investment 2,382 1,825 1,942 1,477 1,989 18,764
Operating Income 12,301 8,334 10,274 8,491 9,887 93,274
Profit Attributable to Owners of Parent 9,093 7,165 8,165 7,726 9,045 85,330
At Year-End:
Total Assets ¥172,649 ¥181,484 ¥193,345 ¥186,801 ¥213,087 $2,010,255
Total Net Assets 142,821 150,720 158,125 157,783 176,092 1,661,245
Per Share (Yen and U.S. Dollars):
Profit Attributable to Owners of Parent*2:
Primary ¥176.67 ¥142.14 ¥166.89 ¥158.74 ¥188.26 $1.78
Fully Diluted — — — — — —
Cash Dividends 40.0 42.0 44.0 46.0 48.0 0.45
Key Ratios (%):
Operating Income Ratio 17.5 11.9 14.4 11.8 13.4
R&D Expenses Ratio 16.0 20.7 19.8 19.4 19.2
Return on Assets (ROA) 5.5 4.0 4.4 4.1 4.2
Return on Equity (ROE) 6.6 4.9 5.3 4.9 5.4
Shareholders’ Equity Ratio 82.6 82.9 81.6 84.3 82.5
Dividend Payout Ratio 22.6 29.5 26.4 29.0 25.5
Others:
Number of Employees 1,883 1,883 1,908 1,905 1,903
Number of Shares Issued 56,911,185 56,911,185 54,311,185 54,311,185 51,811,185
Non-Financial Data:
Energy Used (kL) 9,232 9,256 9,281 8,945 8,694
CO2 Emissions (tons) 20,843 20,916 20,695 19,701 19,162
Amount of Waste Generated (tons) 406 439 398 366 424
*1: U.S. dollar amounts are translated at the rate of ¥106=U.S.$1, the approximate effective rate of exchange at March 31, 2018.*2: Profit attributable to owners of parent per share is computed based on the weighted-average number of shares of common stock after subtracting the weighted-average number of
shares of treasury stock for the year.
5Annual Report 2018 KISSEI
Medium-Term Management Plan
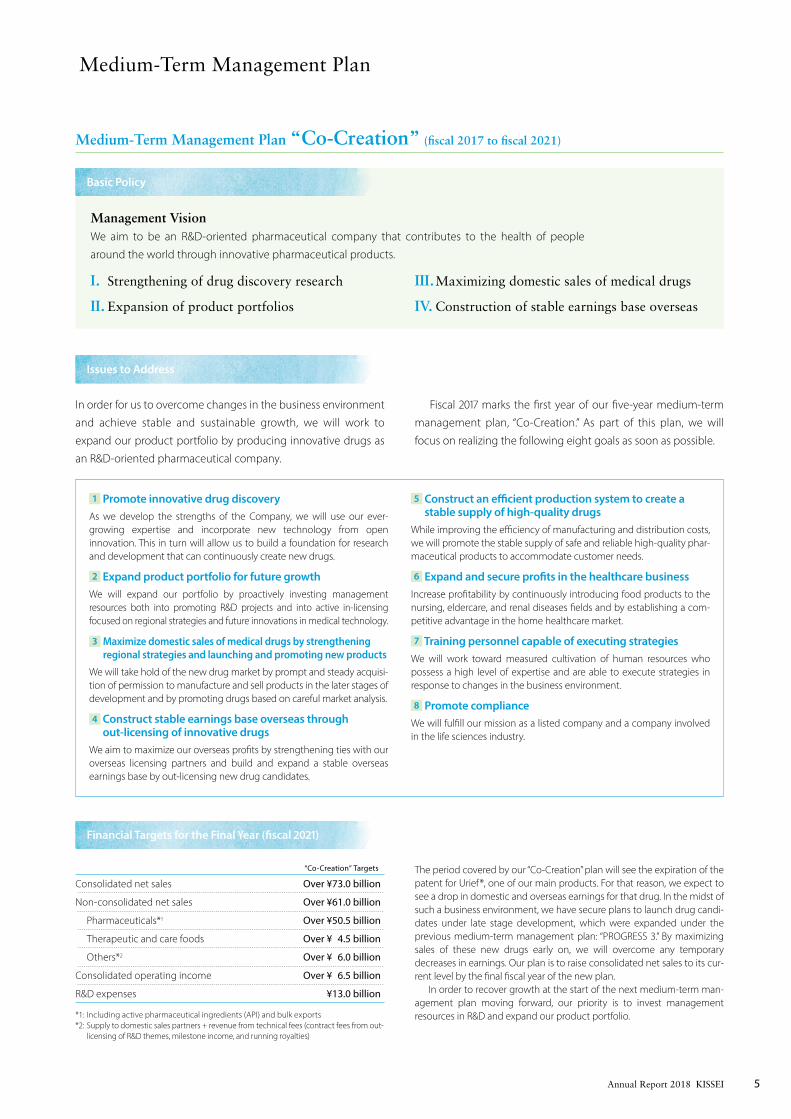
Medium-Term Management Plan “Co-Creation” (fiscal 2017 to fiscal 2021)
In order for us to overcome changes in the business environment
and achieve stable and sustainable growth, we will work to
expand our product portfolio by producing innovative drugs as
an R&D-oriented pharmaceutical company.
Fiscal 2017 marks the first year of our five-year medium-term
management plan, “Co-Creation.” As part of this plan, we will
focus on realizing the following eight goals as soon as possible.
“Co-Creation” Targets
Consolidated net sales Over ¥73.0 billion
Non-consolidated net sales Over ¥61.0 billion
Pharmaceuticals*1 Over ¥50.5 billion
Therapeutic and care foods Over ¥ 4.5 billion
Others*2 Over ¥ 6.0 billion
Consolidated operating income Over ¥ 6.5 billion
R&D expenses ¥13.0 billion
*1: Including active pharmaceutical ingredients (API) and bulk exports*2: Supply to domestic sales partners + revenue from technical fees (contract fees from out-
licensing of R&D themes, milestone income, and running royalties)
Basic Policy
Issues to Address
Financial Targets for the Final Year (fiscal 2021)
The period covered by our “Co-Creation” plan will see the expiration of the patent for Urief®, one of our main products. For that reason, we expect to see a drop in domestic and overseas earnings for that drug. In the midst of such a business environment, we have secure plans to launch drug candi-dates under late stage development, which were expanded under the previous medium-term management plan: “PROGRESS 3.” By maximizing sales of these new drugs early on, we will overcome any temporary decreases in earnings. Our plan is to raise consolidated net sales to its cur-rent level by the final fiscal year of the new plan. In order to recover growth at the start of the next medium-term man-agement plan moving forward, our priority is to invest management resources in R&D and expand our product portfolio.
Management VisionWe aim to be an R&D-oriented pharmaceutical company that contributes to the health of people
around the world through innovative pharmaceutical products.
I. Strengthening of drug discovery research
II. Expansion of product portfolios
III. Maximizing domestic sales of medical drugs
IV. Construction of stable earnings base overseas
1 Promote innovative drug discoveryAs we develop the strengths of the Company, we will use our ever-growing expertise and incorporate new technology from open innovation. This in turn will allow us to build a foundation for research and development that can continuously create new drugs.
2 Expand product portfolio for future growthWe will expand our portfolio by proactively investing management resources both into promoting R&D projects and into active in-licensing focused on regional strategies and future innovations in medical technology.
3 Maximize domestic sales of medical drugs by strengthening regional strategies and launching and promoting new products
We will take hold of the new drug market by prompt and steady acquisi-tion of permission to manufacture and sell products in the later stages of development and by promoting drugs based on careful market analysis.
4 Construct stable earnings base overseas through out-licensing of innovative drugs
We aim to maximize our overseas profits by strengthening ties with our overseas licensing partners and build and expand a stable overseas earnings base by out-licensing new drug candidates.
5 Construct an efficient production system to create a stable supply of high-quality drugs
While improving the efficiency of manufacturing and distribution costs, we will promote the stable supply of safe and reliable high-quality phar-maceutical products to accommodate customer needs.
6 Expand and secure profits in the healthcare businessIncrease profitability by continuously introducing food products to the nursing, eldercare, and renal diseases fields and by establishing a com-petitive advantage in the home healthcare market.
7 Training personnel capable of executing strategiesWe will work toward measured cultivation of human resources who possess a high level of expertise and are able to execute strategies in response to changes in the business environment.
8 Promote compliance We will fulfill our mission as a listed company and a company involved in the life sciences industry.

6 KISSEI Annual Report 2018
Guided by its management philosophy, the Kissei
Group is aiming to make significant contributions to
society. The Group promotes management policies
that emphasize the importance of shareholders,
employees, local communities, history and culture,
and the environment. The management vision
underpinning its core pharmaceutical business chal-
lenges Kissei Pharmaceuticals Co., Ltd. (Kissei) to be
an R&D-oriented pharmaceutical company that con-
tributes to the health of people around the world
through innovative pharmaceutical products. To that
end, Kissei is pushing forward with patient-centered
measures including the undertaking of R&D activi-
ties, high-quality manufacturing, the collection and
provision of information necessary for the optimum
use of its products, the implementation of efficient
operations, and the construction of a total marketing
system. In addition, each Kissei Group company
assists in our pharmaceutical business and leverages
its technologies to help develop our operations both
domestically and internationally.
Currently, the environment surrounding the
pharmaceutical industry is one in the midst of a
structural transformation. In the face of growing
demand for development of medicine for both rare
diseases and intractable diseases, and as medical
needs such as improved quality of life are becom-
ing more sophisticated and diversified, the resource
pool for new medicine is shrinking. This, combined
with growing R&D risks, which leads to growing
R&D costs, have resulted in increased difficulties in
the development of new medicine. In addition,
Japan’s population decline—brought on by a
shrinking birthrate and an aging population—has
led to an increasingly stringent supply of social
security resources. This has led to several social
security reforms, particularly in the health insurance
and medical care provision systems, one of which is
to implement measures to promote the use of
generic drugs in order to curb healthcare expenses.
In particular, as part of this year’s overhaul of the
National Health Insurance Drug Prices Standard
System, former systems intended to foster the cre-
ation of new drugs and eliminate off-label drug use
have been throttled and prices of long-listed drugs
are under substantial review. This new system
bears a major negative impact on the pharmaceu-
tical industry.
Furthermore, competition within the industry
is fierce as companies adapt to a new market
structure, spurred by major changes in the global
market in the midst of instability overseas.
Amid these significant changes in the business
environment, it is our duty as a part of the medical
industry to reexamine our role and respond quickly
to the coming changes. We believe that our manage-
ment philosophy, to contribute to society through
high-quality, innovative pharmaceutical products
and serve society through our employees, will carry
us through these changing times and to an even
stronger position. We recognize the major turning
point that the new Drug Pricing Standard represents,
and even in the face of those changes, we plan to
continue forward as an R&D-oriented company.
To this end, we have formulated and are imple-
menting our five-year medium-term management
plan, “Co-Creation” (fiscal 2017–fiscal 2021), to serve as
a concrete roadmap for realizing our management
philosophy and vision. In fiscal 2018, the second year
of the plan, will see the patent expire for Urief®, a
drug treatment for dysuria and one of our main
products. In anticipation to this, one of the goals of
As an R&D-oriented company, we will make full
use of our traditions and work to create new,
original value in order to contribute to the healthy
and affluent lifestyles of people around the world.
Letter from the CEO

7Annual Report 2018 KISSEI
Mutsuo KanzawaChairman and Chief Executive Officer
Letter from the CEO
“Co-Creation” is to steadily introduce products that
are currently in the later stages of our development
pipeline into the market. Accordingly, we will work
to continuously create new drugs and move them
to the early clinical stage with a combination of
speed and quality. At the same time, we will expand
our portfolio through vigorous licensing activities.
At the annual General Meeting of Shareholders
held on June 27, 2018 and the Board of Directors’
meeting held the same day, Yoshio Furihata was
appointed President and Chief Operating Officer
(COO). Reinforced marketing capabilities and a
strengthened product portfolio established by Mr.
Masaki Morozumi, the previous President and
COO, provide the foundation for changes in our
management structure. These changes aim to fur-
ther strengthen R&D capabilities and stimulate the
continuous creation of new drugs while establish-
ing a management base for the future that will
allow us to tackle new issues that may arise in the
changing business environment.
As Chairman and CEO I will continue to oversee
overall management and strengthen our framework
for sustainable growth as an R&D-oriented company.
Our aim is to always be a highly trusted com-
pany that lives up to the expectations of all our
stakeholders, including patients, their families, and
healthcare professionals as well as our sharehold-
ers and employees and the local communities we
serve. To accomplish this goal, we will relentlessly
pursue our quest to realize Kissei’s management
vision while forging a path for creating future value
through never-ending innovation.
I ask for the ongoing understanding and sup-
port of all our stakeholders moving forward.
June 2018

8 KISSEI Annual Report 2018
Review of Operations
Overview of Operations in the Year under Review
The outlook for the Japanese economy became unclear in fiscal
2017, the year ended March 31, 2018, due to concerns over the direc-
tion of U.S. trade policies and a strong yen, despite economic
improvement in developed countries in North America and Europe
as well as a pickup in economies in China and developing countries
in Asia.
Conditions in the pharmaceutical business continue to be
harsh, characterized by measures to promote the use of generic
drugs aimed at curbing healthcare expenses on top of fierce
market competition within the industry. Moreover, despite increas-
ing corporate demand for investment in IT and capital investment
in the information services, merchandising, and construction
industries, and a gradual recovery of consumer spending, these
were not enough to fully drive the economy, which still languishes
in a highly competitive environment.
In the pharmaceutical business, net sales increased 4.0% year on
year, to ¥63,891 million. While sales of long-listed drugs fell, thanks to
efforts including vigorous promotional activities to spread medical
information about our mainstay products, sales of P-TOL® chewable
tablets for the treatment of hyperphosphatemia; Urief® and Urief®
oral disintegration (OD) tablets for the treatment of dysuria associ-
ated with benign prostatic hyperplasia (BPH); Epoetin Alfa BS
Injection [JCR] drug treatment for renal anemia; and other drugs
increased. This, plus increased revenues from exports and technical
fees led to an overall increase of pharmaceutical net sales. One of our
new products, RECTABUL® 2mg Rectal Foam 14 Doses, jointly devel-
oped with EA Pharma Co., Ltd. as a treatment for ulcerative colitis,
was released in December 2017. In addition, we have continued our
licensing agreement for silodosin (generic name, brand name in
Japan: Urief®) in Europe, the Middle East, and Africa with Recordati
S.p.A (Italy), which has continued to promote this product in these
licensed areas in fiscal 2017.
Yoshio FurihataPresident and Chief Operating Officer
Message from the COO

9Annual Report 2018 KISSEI
Message from the COO
In other businesses, net sales decreased 1.3% year on year, to
¥10,118 million, reflecting a decrease in revenues for the merchan-
dising and construction industries, despite an increase in informa-
tion services.
Turning to income, selling, general and administrative (SG&A)
expenses increased mainly due to R&D expenses, but operating
income and profit attributable to owners of parent also increased
due to increased revenues.
In terms of R&D, in September 2017 we applied for approval of an
additional granular formulation of P-TOL® chewable tablets. In the
same month, KYORIN Pharmaceutical Co., Ltd. applied for approval
of KRP-114V (development code, generic name: vibegron), an over-
active bladder medication co-developed with Kissei. In June
2017, we finalized a contract with Swiss company Vifor Fresenius
Medical Care Renal Pharma, Ltd., granting us exclusive rights to
develop and commercialize CCX168 (development code,
generic name: avacopan), a selective inhibitor of the comple-
ment C5a receptor. We are currently participating in interna-
tional phase III joint clinical trials for the drug with American
company ChemoCentryx, Inc. Moreover, in other phase III clini-
cal trials we were able to demonstrate equivalence for darbepo-
etin alfa (generic name), a long-acting erythropoiesis-stimulating
agent for the treatment of renal anemia, in JR-131 (development
code), jointly developed with JCR Pharmaceuticals Co., Ltd. as a
proposed biosimilar of darbepoetin alfa. In addition, an applica-
tion for the approval of an additional dosage form of Glubes®
(OD tablets) for the treatment of type 2 diabetes, submitted in
July 2016, was temporarily withdrawn in June 2017 to conduct
additional studies. We also began a phase III clinical trial for
AJM300 (development code, generic name: carotegrast methyl),
a treatment for ulcerative colitis which is being jointly devel-
oped with EA Pharma Co., Ltd. Results from the phase III clinical
trial of KPS-0373 (development code, generic name: rovatirelin),
a drug for the treatment of spinocerebellar ataxia, were deemed
negative after the drug did not show significant differences
from a placebo in terms of mean changes from baseline SARA*
scores, the main tool for assessing ataxia and the primary end-
point for the trial. Looking ahead, we will assess the results of the
trial in detail, including subgroup analysis, based on the severity
of the obtained results.
Business Results and Forecast For Fiscal 2018
* The SARA (Scale for the Assessment and Rating of Ataxia) is a tool for assessing ataxia. It has 8 categories with a cumulative score ranging from 0 (no ataxia) to 40 (most severe ataxia). When completing the outcome measure each category is assessed and scored accordingly. Scores for the 8 categories are as follows: 1. Gait, 2. Stance, 3. Sitting, 4. Speech disturbance, 5. Finger chase, 6. Nose-finger test, 7. Fast alternating hand movement, 8. Heel-shin slide.
8.4
9.8
7.9
16 17 18(Forecast)
(FY)
20.1%decrease
16.4%increase
71.7 74.0 71.7
16 17 18(Forecast)
(FY)
3.1%decrease
3.2%increase
7.7
9.0
6.6
16 17 18(Forecast)
(FY)
27.0%decrease
17.1%increase
Net SalesBillions of yen
Operating IncomeBillions of yen
Profit Attributable to Owners of ParentBillions of yen

10 KISSEI Annual Report 2018
Outlook for the Current Fiscal Year
In the domestic pharmaceutical market, business conditions will
likely remain difficult as the Japanese government continues to pro-
mote policies to reduce public medical treatment costs, such as by
encouraging the use of generic drugs. In terms of other businesses,
they will continue to exist within a harsh economic climate, despite
some signs of recovery.
Amid these circumstances, the Kissei Group will focus its efforts
on strengthening its management base through the creation of
synergies among Group companies. At the same time, we will
continue to strive for sustainable growth.
Net SalesIn the pharmaceutical business, we will continue our efforts to
cultivate Urief®, Glubes®, P-TOL®, and other drugs. However, due
to the impact of drug repricing that took place in April 2018,
coupled with a decrease in technology sales, we forecast a
decrease in sales. For other businesses, however, we anticipate
an increase.
IncomeSelling, general and administration expenses will decrease, but we
anticipate a decline in profit due to a decrease in sales and a rising
cost of sales ratio. We do not anticipate any other noteworthy
changes to profit and loss.
Message from the COO
In fiscal 2018, the second year of our
Medium-Term Management Plan,
we will give top priority to investing
management resources toward continued
expansion of our portfolio while
maximizing sales of our existing products.
0
6
12
18
24
0
4,000
8,000
12,000
16,000
1514 16 17 18
Millions of yen %
R&D Expenses / R&D Expenses Ratio
R&D Expenses R&D Expenses Ratio (right)
Years ended March 31

11Annual Report 2018 KISSEI
Management Strategy
Kissei aims to contribute to society as an R&D-oriented pharma-
ceutical company that develops and offers innovative pharma-
ceutical products to support the health of people all over the
world. By advancing the basic strategies of our five-year medium-
term management plan “Co-Creation”, launched in fiscal 2017, we
will work to strengthen our business foundations in order to
achieve stable growth into the future. Our management strategy
focuses on the following key points.
(1) We will strengthen the functionality of our drug discovery
efforts in order to spur the continuous creation of new drugs
that are highly unique and competitive.
(2) We will expand our product portfolio that will carry us into the
future by way of promoting R&D projects and through dedi-
cated licensing.
(3) We will expand our presence in the urology, and renal diseases
and dialysis areas of medical treatment and increase the
domestic sales of ethical drugs through the steady transition of
products, from the late-development stage to application and
approval and smooth introduction to the market.
(4) We will build a stable earnings base overseas through out-
licensing new drug discovery.
Essential to expanding our product portfolio is maintaining a
proper balance of speed and quality both from a drug discovery
perspective, in terms of continuous creation and sending cre-
ations to early clinical trials, and from a development perspective,
in terms of advancing production according to plan. In terms of
licensing, we are focused on introducing products in the late
stage of development and cultivating KLH-2109 as our new pillar
for overseas earnings.
In order to maximize earnings both domestically and interna-
tionally, we will focus on maximizing sales on key strategic items,
including Urief® and Urief® OD tablets; P-TOL® chewable tablets;
Glubes® Combination Tablet; and RECTABUL® 2mg Rectal Foam 14
Doses. We will also continue careful preparations to introduce
KRP-114V and granular formulations of P-TOL® into the market for
prompt penetration. This action is designed to spark develop-
ment of the two brands, which are expected to experience large
growth in the future. In the therapeutic and care foods business
we will establish a robust quality assurance system and improve
profitability by strengthening the mail-order business and intro-
ducing new products.
In fiscal 2018, we will strengthen our management base and
reform our cost structure. This will involve streamlining medium-
to long-term costs in terms of Companywide optimization while
performing a complete review of our business processes by re-
examining all operations. It also involves optimal allotment of our
resources—whether human, objects, money, or time—in order to
improve quality. The increased resources generated by these
endeavors will be prioritized for future growth drivers.
We will also cultivate highly specialized personnel capable of
implementing our strategy through taking on challenging busi-
ness in each organization and department, such as exploring new
areas, employing new methods, and adopting new mechanisms,
as well as promoting cross-organizational operations. By enabling
each employee to reach their full potential, we can achieve our
management goals.
As for profit allocation, we recognize the importance of making
stable dividend payouts while taking care to secure lasting busi-
ness foundations, a process based on ensuring that payouts are in
line with earnings while working to improve capital efficiency.
Moreover, we will strive to fulfill our mission as a company involved
in life sciences through appropriate management of corporate
governance and internal control systems, as well as the promo-
tion of our Compliance Program.
Going forward, we would like to ask for the continued under-
standing and support of our stakeholders.
June 2018
Message from the COO
Yoshio FurihataPresident and Chief Operating Officer

12 KISSEI Annual Report 2018
Research and Development (R&D)
Basic Policy
As an R&D-oriented pharmaceutical company, Kissei aims to
develop and provide innovative drugs by investing management
resources predominantly in research on drug discovery. The driv-
ing force behind the Company’s R&D efforts is the desire to help
patients who are suffering from illnesses and contribute to the
health of people around the world.
Kissei has adopted “strengthening of drug discovery research”
as the first basic policy of our medium-term management plan,
“Co-Creation,” which went into effect in April 2017. Based on this
policy, we are focusing on the key areas of urology, renal diseases
and dialysis, as well as the field of unmet medical needs, where
satisfaction with treatment is low, in pursuit of creating new, highly
original, and innovative pharmaceutical products.
Our drug discovery research targets mainly revolve around low
molecular weight compounds, but in recent years we have been
actively researching biologics as well. In this way, we are working
to improve our knowledge and technical skill in this field and
thereby strengthen our overall research base.
Strengthening Drug Discovery Research
Due to the drastic reforms of the NHI Drug Prices Standard System in
Japan that took place in April 2018, it is more essential than before
that the Company continues to release new drugs.
Our medium-term management plan, “Co-Creation,” aims to add
multiple original products to our development pipeline which will
be responsible for renewed growth for the Company while we con-
tinue to introduce developed products to the market.
In April 2017, Kissei reorganized its R&D departmental systems into
a cross-functional matrix-type system that combines management
based on the function of each specialized field of research with indi-
vidual project management. This system allows for each research
institute to collaborate in each development project, and will ulti-
mately lead to strengthened drug discovery research functions.
In addition, we have been developing a high level of exper-
tise of in silico drug discovery efforts spanning over 30 years.
Because of the increased number of compound libraries that can
be accessed, we are working on the fusion of HTS and in silico
technologies to secure the early detection of candidate
compounds.
In addition, we are finding more drug seeds through collabora-
tion with biotech ventures and enhanced ties with the Japan Agency
for Medical Research and Development (AMED) and Shinshu
University. Furthermore, we are actively working to push open inno-
vation forward in order to strengthen our biologics research.
At the present time, we are reviewing a number of drug discovery
projects and are dedicated to reporting on them in the near future.
Reorganizing the R&D Division (April 2017) Migrating to a matrix-type system that combines management based on the function of each specialized
field of research with individual project management
Early detection of drug candidate compounds by fusion of in silico drug discovery and high-throughput screening (HTS)
Promoting Open InnovationCollaborating with biotech ventures, finding novel drug seeds by strengthening ties with
industry-government-academia, and strengthening biologics research
1
2
3
13Annual Report 2018 KISSEI
Research and Development (R&D)
Status of Main Research and Development Activities
The features and progress of the main R&D projects we are cur-
rently pursuing are as follows.
In September 2017, applications were submitted for approval
for manufacturing and sale of KRP-114V (development code,
generic name: vibegron), a drug for the treatment of overactive
bladder, and a new granular formation of P-TOL®, a drug for treat-
ing hyperphosphatemia in patients on dialysis.
KPS-0373 (development code, generic name: rovatirelin), an
orally administered drug for the treatment of spinocerebellar
ataxia, is a derivative of the thyrotropin-releasing hormone intro-
duced by Shionogi & Co., Ltd. Additional phase III clinical trials
conducted in 2016 showed no statistically significant changes in
the total SARA score evaluating ataxia, the primary endpoint of
the trial, when compared to a placebo. Moving forward, we will
conduct detailed studies including subgroup analysis based on
the severity of the results obtained from this trial.
JR-131 (development code) is a drug treatment for renal
anemia and a biosimilar of darbepoetin alfa (generic name), a
long-acting erythropoiesis-stimulating agent. Phase III clinical
trials conducted jointly with JCR Pharmaceuticals Co., Ltd. in 2016
confirmed equivalence with darbepoetin alfa, the leading bio-
pharmaceutical of its type. In this trial, we verified the equiva-
lence in efficacy and evaluated the safety of JR-131 in comparison
to darbepoetin alfa. Results verified equivalence for variations in
hemoglobin concentration (the primary endpoint for efficacy),
and similarity with regard to the safety profile was also con-
firmed. JCR Pharmaceuticals Co., Ltd. is preparing to file an
application for approval of manufacturing and sale of this drug
based on the trial results.
AJM300 (development code, generic name: carotegrast methyl),
for the treatment of ulcerative colitis, began an additional phase III
clinical trial based on consultations with the Pharmaceuticals and
Medical Devices Agency (PMDA) concerning the results of the prior
phase III clinical trial.
CCX 168 (development code, generic name: avacopan), a treat-
ment for rare diseases in the renal disease field, is involved in phase III
international joint clinical trials for use as a treatment for anti-
neutrophil cytoplasmic auto-antibody-associated vasculitis (AAV).
We are conducting late phase II clinical trials in Japan for the
GnRH antagonist KLH-2109 for the treatment of endometriosis.
Overseas, development of the drug is underway for the treatment
of endometriosis and uterine fibroids by Swiss-based ObsEva SA,
the out-licensee for this drug.
Phase II clinical trials of MR13A9 (development code, generic
name: difelikefalin), a kappa opioid receptor agonist for the treat-
ment of uremic pruritus in dialysis patients, are being carried out
by Maruishi Pharmaceutical Co., Ltd., with whom we have a col-
laboration agreement with. This drug, which is delivered intrave-
nously, is both convenient for patients and improves drug
compliance, and shows promise as a new treatment for pruritus.
Based on the results of a clinical trial focused on malignant
mesothelioma held in France, we are conducting phase I and II
clinical trials on YS110 (development code), a humanized anti-
CD26 monoclonal antibody, on patients in Japan.
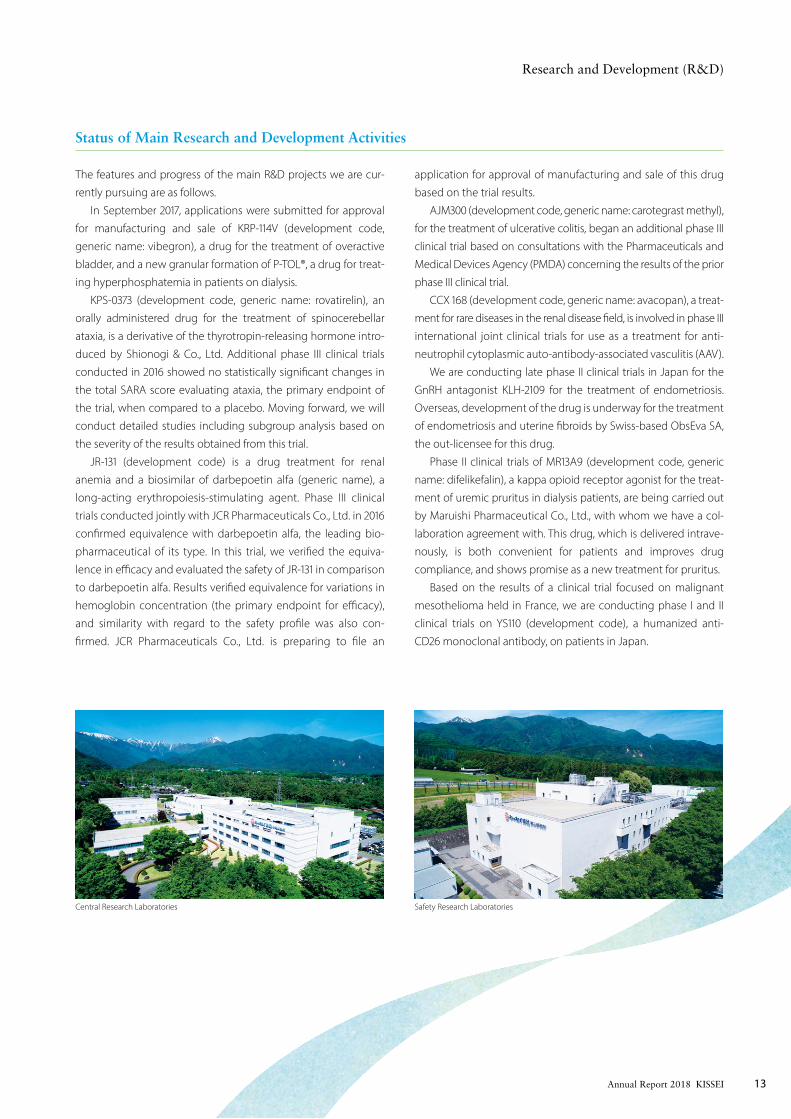
Central Research Laboratories Safety Research Laboratories

14 KISSEI Annual Report 2018
R&D Pipeline As of July 2018
Research and Development (R&D)
Development Code (Generic Name)
StagePhase NDA
prepa-ration
NDA filedExpected Indications Category Development Classification 1 2 3 Remarks
UrologyKRP-114V(Vibegron)
Overactive bladder Beta 3 adrenergic receptor agonist
In-licensed / Co-development withKYORIN Pharmaceutical (Japan)
Renal and dialysis P-TOL®
(Sucroferric Oxyhydroxide)
Hyperphosphatemia in hemodialysis patients
Phosphate binder In-licensed / Vifor Fresenius Medical Care Renal Pharma (Switzerland)
Additional dosage form: Granule
JR-131 Renal anemia Increase the red blood cell (RBC) count
In-licensed / Co-development with JCR Pharmaceuticals (Japan)
A biosimilar “darbepoetin alfa”
CCX168 (Avacopan)
ANCA (anti-neutrophil cytoplasmic auto-antibody)-associated vasculitis
A selective inhibitor of the complement C5a receptor
In-licensed / Vifor Fresenius Medical Care Renal Pharma (Switzerland)
MR13A9(Difelikefalin)
Uremic pruritus in dialysis patients
Kappa opioid receptor agonist
In-licensed / Co-development with Maruishi Pharmaceutical (Japan)
Unmet medical needs
KPS-0373 (Rovatirelin)
Spinocerebellar ataxia Product mimetic of TRH action
In-licensed / Shionogi (Japan)
AJM300 (Carotegrast Methyl)
Ulcerative colitis Alpha 4 integrin antagonist
In-licensed / Co-development with EA Pharma (Japan)
YS110 Malignant mesothelioma Humanized anti-CD26 monoclonal antibody
In-licensed / Y’s AC, University of Tokyo, AMED (Japan)
Phase 1/2
KLH-2109 Endometriosis GnRH antagonist Kissei
KDT-3594 Parkinson’s disease Dopamine receptor stimulation
Kissei
UrologySilodosin Dysuria associated with
benign prostatic hyperplasiaAlpha 1A-adrenoceptor blocker
ASEAN, India, Sri Lanka *1 Eisai (Japan)
DiabetesMitiglinide Type 2 diabetes mellitus Rapid-acting insulin
secretagogueASEAN *2 Eisai (Japan)
KLH-2109 Uterine fibroids GnRH antagonist Worldwide, excluding some Asian countries such as Japan
ObsEva SA (Switzerland)
KLH-2109 Endometriosis GnRH antagonist Worldwide, excluding some Asian countries such as Japan
ObsEva SA (Switzerland)
Bedoradrine Acute exacerbation of asthma
Beta 2 adrenergic receptor agonist
Worldwide, except for Japan MediciNova (U.S.)
Bedoradrine COPD Beta 2 adrenergic receptor agonist
Worldwide, except for Japan MediciNova (U.S.)
*1: Launched in Thailand, India, Indonesia, the Philippines, Cambodia, Myanmar ; Approved in Malaysia; NDA in 2 ASEAN countries*2: Launched in Thailand, the Philippines, Cambodia, Myanmar ; NDA in 2 countries
Progress after August 2017 covers the area inside the dashed lines.
In-House
Out-Licensing
Development Code (Generic Name)
StagePhase NDA
prepa-ration
NDA filed
Development CompanyExpected Indications Category Territory 1 2 3

15Annual Report 2018 KISSEI
Vibegron is a once daily overactive bladder (OAB) medication having
selective beta 3 adrenergic receptor agonist activity which we jointly
developed with KYORIN Pharmaceutical Co., Ltd. in Japan.
In phase III clinical trials conducted in Japan, superiority over a
placebo was confirmed in average daily urinary frequency, the
primary endpoint, and in all secondary endpoints as well. Results
of this clinical trial were presented at the European Association of
Urology Congress held in March 2018, and the paper was pub-
lished in the medical journal, European Urology.
Application for approval for manufacturing and sale was sub-
mitted by KYORIN in September 2017, after acquiring approval and
incorporating drug price standards, and the product will be
jointly marketed by Kissei and KYORIN.
We consider the urology field to be one of our priority areas
and are working to expand our product lineup and heighten our
presence in the market. Moving forward, we will utilize our
strengths and expertise to promote early market penetration of
this drug and in doing so, we strive to further contribute to
improving the quality of life of patients suffering from the various
symptoms of OAB.
In June 2017 we signed an agreement with Swiss-based Vifor
Fresenius Medical Care Renal Pharma Ltd. (VFMCRP) for exclusive
rights to develop and market the complement c5a receptor*1
(C5aR) avacopan in Japan.
Under the terms of this agreement, we acquired exclusive devel-
opment rights and marketing rights in Japan from VFMCRP, which
holds the global commercial rights of the drug outside of the
United States and China. Kissei will conduct development in Japan
and exclusively market avacopan once approval of sale is received.
Avacopan, an orally administered small-molecule agent for the
treatment of rare kidney diseases, was developed by ChemoCentryx,
Inc., in the US. It inhibits C5a receptors in leukocytes, including neu-
trophils, and exhibits anti-inflammatory properties by preventing
the migration of leukocytes as well as the expression and induc-
tion of adhesion molecules. Anti-neutrophil cytoplasmic auto-anti-
body (ANCA)-associated vasculitis (AAV)*2, which is one of the
targets of avacopan, is a rare and severe autoimmune disease that
is designated as an intractable disease by the Ministry of Health,
Labour, and Welfare in Japan. The number of patients with AAV has
increased rapidly in recent years, and in many cases, they present
necrotizing glomerulonephritis.
Currently, phase III clinical trials are being conducted by
ChemoCentryx in Europe, the United States, and other countries for
the indication of AAV. Kissei is participating in this international joint
clinical trial as it conducts a phase I clinical trial in Japan. Development
for this drug is expected to proceed quickly and efficiently.
Phase II clinical trials around C3 glomerulopathy*3 are also in
progress and phase II clinical trials regarding atypical hemolytic
uremic syndrome*4 are in the planning stage. These trials, being
conducted overseas, are being handled by ChemoCentryx.
Domestic developments regarding these two indications will be
under the authority of Kissei.
We are working to expand our product portfolio in the areas of
urology, renal and dialysis, and also in areas with high unmet
medical needs. We will continue to further strengthen our efforts
to treat rare diseases and aim to provide this drug to patients suf-
fering from intractable diseases as soon as possible.
Applying for Approval for Manufacturing and Sale of Vibegron (generic name, development code: KRP-114V)
Exclusive License Agreement and Participation in International Joint Clinical Trials for Avacopan (generic name, development code: CCX168), a Selective Inhibitor of the Complement C5a Receptor for Rare Kidney Diseases
Topic 2
Topic 1
*1: The complement C5a receptor:A complement is a system of proteins found in blood and is involved in various immune responses and preventing infection. There are many kinds of complements, generally expressed as C by taking the initial letter of complement. Of these, C5a acts as a chemokine (chemotactic factor), attracting neutrophils to the inflamed area. Avacopan is thought to exhibit anti-inflammatory properties by inhibiting the C5a receptor, thereby suppressing the activity of neutrophils that damage blood vessels.*2: Anti-neutrophil cytoplasmic auto-antibody (ANCA)-associated vasculitis (AAV):AAV is a rare and severe autoimmune disease characterized by no or very little immune complex deposition, necrotizing inflammation of the small blood vessels, and high ANCA-positive rates. It damages various organs, including the kidneys, lungs, and nervous system. The number of patients with AAV is estimated to be over 10,000 in Japan (based on the number of recipients of the certificates for special disease treatment in 2015). The current standard treatment for AAV is the concurrent use of adrenocorticosteroids and immunosuppressants. Steroid replacement with avacopan is expected to avoid the adverse events associated with steroid use.*3: C3 glomerulopathy (C3G):C3G, a designated intractable disease, is a type of primary membranoproliferative glomerulone-phritis. It is caused by renal tissue disorders induced by abnormalities in the complement pathway. In Japan, the number of patients with primary membranoproliferative glomerulonephritis is estimated to be over 40 (based on the number of recipients of the certificates for special disease treatment in 2015). Currently, there are no drugs approved for the indication of C3 glomerulopathy.*4: Atypical hemolytic uremic syndrome (aHUS):aHUS is a designated intractable disease caused by abnormalities in complement factors. It is characterized mainly by 1) hemolytic anemia, 2) decrease in platelets, and 3) acute nephropathy. In Japan, the number of patients with aHUS is estimated to be over 40 (based on the number of recipients of the certificates for special disease treatment in 2015). The biopharmaceutical eculizumab is currently used to treat aHUS.
Research and Development (R&D)

16 KISSEI Annual Report 2018
Dysuria treatment:
Urief® Tablet and OD Tablet
Diabetes treatment:
Glubes® Combination Tablet
Glufast® Tablet and OD Tablet
Major Domestic Pharmaceuticals
Sales of Major Domestic Pharmaceuticals by Fiscal Year Base financial results
Urief® is a selective alpha 1A-adrenoceptor blocker developed by Kissei for the treatment of dysuria associ-ated with benign prostatic hyperplasia (BPH). By blocking alpha 1A-adrenoceptors in the prostate gland, it removes the tension of the prostate gland to improve urethral resistance. It has been co-marketed with Daiichi Sankyo Co., Ltd., since sales began in May 2006. Sales of Urief® in the form of an orally disintegrating (OD) tablet commenced in January 2016.
In November 2015, Kissei launched P-TOL® chewable tablets in Japan through Swiss-based Vifor Fresenius Medical Care Renal Pharma Ltd. (VFMCRP). P-TOL® decreases serum phosphate concentra-tion by binding oxyhydroxide with phosphoric acid in the gastrointestinal tract and reducing internal phosphate absorption to treat hyperphosphatemia in patients on dialysis. Overseas, VFMCRP, the licensing company of P-TOL®, has received approval for P-TOL® in 40 countries around the world (as of July, 2018), not including Japan, and is currently marketing the drug under the brand name Velphoro® in the United States, Europe, and other countries and regions.
(forecast)
The Glubes® Combination Tablet, a combination of Glufast® and voglibose (generic name), was first sold in July 2011 by Kissei, acting independently. The tablet has been highly praised for providing aggressive treatment of postprandial glucose increases as well as being easy to administer and for reducing the economic burden on patients.
Glufast® is a rapid-acting insulin secretagogue developed by Kissei that has been co-marketed with Takeda Pharmaceutical Co., Ltd., since May 2004. In September 2013, a partial revision to the indication for this agent was approved. It is now approved for treatment of type 2 diabetes, and can be used in conjunction with all oral hypoglycemic agents except sulfonylurea derivatives. Sales of Glufast® in the form of an OD tablet commenced in June 2016.
Ulcerative colitis treatment: RECTABUL® Renal anemia treatment: Epoetin Alfa BS Hyperphosphatemia treatment: P-TOL® Diabetes treatment: Glufast® Diabetes treatment: Glubes® Dysuria treatment: Urief®
Hyperphosphatemia treatment:
P-TOL® Chewable Tablet
0
10
20
30
40
1413 15 16 17 18
Billions of yen
5.55.7
3.4 3.4
13.3 14.0 15.4 16.1 17.2 17.7
2.5 3.3
6.0
3.60.6
5.76.0 5.6
3.6 2.7 1.53.0 4.2 5.8
0.2 0.5
3.94.4 4.6
4.2
NHI Price Revision
NHI Price Revision
NHI Price Revision

17Annual Report 2018 KISSEI
Expansion of Product Portfolio in Key Fields
*Generic name
Epoetin Alfa BS Injection [JCR] is a biosimilar recombinant human erythropoietin co-developed by Kissei Pharmaceutical and JCR Pharmaceuticals. It has been co-marketed since May 2010.
RECTABUL® is a rectal foam-type product jointly developed by Kissei and EA Pharma launched in December 2017. This product is the first rectal foam in Japan that uses budesonide as an active ingredient. The delivery method makes it possible to administer in a standing position and pre-vents leakage afterward.
The current environment surrounding our business is quite harsh, for reasons including the drastic reform of the NHI Drug Prices Standard System that took place in April 2018 combined with the upcoming patent expiration of Urief®, one of our main products, in December 2018. Our medium-term management plan employs various strate-gies to overcome this upcoming patent cliff. In order to achieve stable growth in the next medium-term management plan, we will position urology, renal diseases and dialysis, and unmet medical needs as three key fields to focus our management resources on and in which to expand our portfolio.
For fiscal 2018, we are planning launches in two of these areas. In urology, we are planning to release vibegron (generic name), an overactive bladder treatment, and in renal diseases and dialysis, we are planning to release a new granular formulation of P-TOL®. We will also maximize sales of our main products, including RECTABUL®, launched in fiscal 2017. At the same time, we will work to move new drugs to market and advance projects in develop-ment past the early stages. As we focus on in-licensing, we will continue expanding our product portfolio.
Major Domestic Pharmaceuticals
Urology
Kidneys and dialysis
Unment medical needs
Drug to alleviate dysuria
Urief ®
Drug treatment for ulcerative colitis
RECTABUL®
Drug treatment for hyperphosphatemia
P-TOL®
Drug treatment for hyperphosphatemia
P-TOL® granules
Drug treatment for renal anemia
JR-131
Drug for the treatment of ulcerative colitis
AJM300
Drug for the treatment of spinocerebellar ataxia
KPS-0373
Anti-malignant mesothelioma drug
YS110
Drug treatment for ANCA-associated vasculitis, C3 glomerulopathy, Atypical hemolytic uremic syndrome
CCX168
Drug for the treatment of overactive bladder
Vibegron* (KRP-114V)
Drug for the treatment of uremic pruritus in dialysis patients
MR13A9
Drug treatment for renal anemia
Epoetin Alfa BS
Main product R&D Pipeline
Renal anemia treatment:
Epoetin Alfa BS Injection [JCR]
Ulcerative colitis treatment:
RECTABUL® Rectal Foam

18 KISSEI Annual Report 2018
Promoting Overseas DevelopmentKissei’s basic strategy for overseas expansion is to obtain profits from supplying drug substances and obtain royalty income by out-licensing our products.
Silodosin has been sold in Japan by Kissei since May 2006 under the brand name of Urief®. It is a therapeutic drug for the treatment of dysuria associated with benign prostatic hyperplasia, and has earned a strong reputation around the world for its superior ability to relieve symptoms shortly after administration. This drug was launched in the United States in April 2009 by licensing partner Watson Pharmaceuticals, Inc. (currently Allergan plc), under the brand name RAPAFLO®. To date, this company has received additional licensing rights to develop and sell the drug in 19 countries throughout the Americas. Furthermore,
the drug was introduced in Germany in June 2010 under the brand name UROREC® by licensing partner Recordati S.p.A., of Italy. Recordati has received additional licensing rights to develop and sell the drug in 84 countries and regions such as Europe, the Middle East, Africa, and Oceania. In April 2013, licensing part-ner Daiichi Sankyo (Japan) began selling the drug in China through a local subsid-iary under the name Youlifu®. Silodosin is currently sold in 51 coun-tries including Australia, where it was released in July 2017, and active promotion is ongoing via our partners in Asia.
Past Exports*
14
Millions of yen
15 16 17 18
9,000
6,000
3,000
0
* “ Exports” is the total for overseas sales and revenue from dispensing fees (based on financial results).
Years ended March 31
Overseas Development of Silodosin As of July 2018
Brand name:Urief® / UROREC® / SILODYXTM / SILOSIN® / Youlifu® / Thrupas® / RAPAFLO®
Overseas Development of Silodosin
Europe Launched
Germany, Ireland, Spain, France, Portugal,
Belgium, Romania, Italy, Greece, the
Netherlands, Russia, the Czech Republic,
Slovakia, Bulgaria, Cyprus, Turkey, Poland, the
Ukraine, Georgia, Belarus, Croatia, Armenia,
Serbia, Moldova, Azerbaijan, Malta, Bosnia and
Herzegovina, Liechtenstein, Switzerland,
Estonia, and Lithuania
Approval acquired but not yet launched
The U.K., Austria, Sweden, Slovenia, Denmark,
Hungary, Finland, Latvia, Luxembourg, Norway,
Iceland, Uzbekistan, Kazakhstan, and Montenegro
Africa Launched
South Africa and Tunisia
Filed an NDA but not yet approved
Algeria

19Annual Report 2018 KISSEI
Silodosin launched in 51 countries
Kissei promotes out-licensing of new drugs and aims to build future overseas earnings bases following the U.S. patent expira-tion of Silodosin in fiscal 2018. In November 2015, Kissei granted exclusive rights to Swiss-based ObsEva SA to develop and commercialize the novel drug candidate KLH-2109 (development code), a GnRH antagonist dis-covered by Kissei, to all regions worldwide, excluding some countries in Asia, such as Japan. Moving forward, the Company will receive an upfront payment from ObsEva and will be eligible to receive milestone payments according to the development stage. In addition, the Company will supply drug substances to ObsEva. ObsEva is a pharmaceutical company that specializes in the development of new drugs in the area of obstetrics and gynecology.
The company is pursuing development of this drug (international development code: OBE2109) for European and North American mar-kets. This candidate is currently under phase II clinical trials (EDELWEISS) for use as treatment for endometriosis as well as phase III trials (PRIMROSE 1, PRIMROSE 2) for use as a treatment for uterine fibroids. KLH-2109 is a new orally administrable GnRH (gonadotropin-releasing hormone) antagonist. It acts by antagonizing GnRH at the GnRH receptor located in the pituitary gland, thereby suppressing the secretion of gonadotropin, a gonadotropic hormone. Kissei is focusing its efforts on R&D for new drugs and aims to expand globally by out-licensing original products overseas. Kissei will continue to actively develop new drugs that can con-tribute to the health of people around the world.
Promoting Overseas Development
Out-Licensing of KLH-2109 (Development Code) to ObsEva SA
Asia / Oceania Launched
Japan, China, South Korea, Taiwan, Macau,
Thailand, India, Indonesia, the Philippines,
Cambodia, Myanmar, Australia, Lebanon, the
UAE, Kuwait, and Qatar
Approval acquired but not yet launched
Malaysia, Hong Kong, and Israel
Filed an NDA but not yet approved
Laos, Vietnam, Bahrain, Oman, and Saudi Arabia
The Americas Launched
The U.S. and Canada
Approval acquired but not yet launched
Brazil

20 KISSEI Annual Report 2018
Corporate GovernanceBoard of Directors and Board of Corporate AuditorsAs of June 27, 2018
Standing, From Left Kando Nakagawa, Masayuki Isaji, Takahide Kitahara, Shinji Kikuchi, Hiroshi Kusama, Tetsu Takayama, Eiichi Matsushita, Suminori Sagara, Makoto Yonekubo, Hiroshi Ueno
Seated, From Left Minoru Nomura, Masaki Morozumi, Keiji Fukushima, Yoshio Furihata, Mutsuo Kanzawa, Hiroe Sato, Yasuo Takehana, Shigetaka Shimizu
Board of Directors
Mutsuo Kanzawa Chairman and CEO
1976 Joined the Company1982 Director1992 President and CEO2014 Chairman and CEO (current position)
Yoshio Furihata President and COO
1984 Joined the Company2008 Director, Department Manager of Business Development Department2010 Corporate Strategy and Planning Department2012 General Manager of Clinical Development Division2018 President and COO (current position)
Hiroe Sato Executive Vice President
1975 Joined the Company2006 Director, Department Manager of
Corporate Finance & Management Department2016 Executive Vice President (current position)
Keiji Fukushima Managing Director
General Manager of Sales & Marketing Division
1979 Joined the Company2012 Director2014 Managing Director (current position)
Yasuo Takehana Managing Director
Department Manager of Corporate Strategy & Planning Department
1984 Joined the Company2012 Director2016 Managing Director (current position)
Masaki Morozumi Director and Senior Adviser
1980 Joined the Company2008 Director2010 General Manager of Sales & Marketing Division2014 President and COO 2018 Director and Senior Adviser (current position)

21Annual Report 2018 KISSEI
Corporate Governance
Board of Corporate Auditors
Tetsu Takayama Director
Department Manager of Human Resources Department
1985 Joined the Company2014 Director (current position)
Hiroshi Kusama Director
General Manager of Pharmaceutical Manufacturing Division
1983 Joined the Company2016 Director (current position)
Eiichi Matsushita Director
Department Manager of General Administration Department
1983 Joined the Company2016 Director (current position)
Shinji Kikuchi Director
General Manager of Research and Development Division
1988 Joined the Company2016 Director (current position)
Suminori Sagara Director
Department Manager of Promotion Support Department
1982 Joined the Company2018 Director (current position)
Takahide Kitahara Director
Department Manager of Corporate Finance & Management Department
1986 Joined the Company2018 Director (current position)
Shigetaka Shimizu Outside Director (independent)
1972 Joined The Hachijuni Bank, Ltd.2011 President and CEO at Hachijuni Lease, Co., Ltd. &
Hachijuni Auto Lease, Co., Ltd.2013 Auditor at HACHIJUNI SECURITIES Co., Ltd.2014 Director at the Company (current position)
Minoru Nomura Outside Director (independent)
1969 Joined Nomura Kogyo Co., Ltd.1989 President and Representative Director of Nomura Kogyo Co., Ltd. President and Representative Director of SN SEIKI Co., Ltd.1998 Chairman of NOMURA CORPORATION OF TAIWAN (current position)2005 President and Representative Director of NOMURA UNISON Co., Ltd.
(current position)2008 President and Representative Director of Domaine de la Sénéchalière
(current position)2016 Director at the Company (current position)
Makoto Yonekubo Corporate Auditor (full-time)
1970 Joined the Company2004 Deputy Department Manager of Corporate Finance &
Management Department2011 Corporate Auditor (current position)
Masayuki Isaji Corporate Auditor (full-time)
1980 Joined the Company2010 Director, Department Manager of Research and
Development Planning Department2012 Managing Director2018 Corporate Auditor (current position)
Hiroshi Ueno Outside Corporate Auditor (independent)
1969 Certified Public Accountant1974 Certified Tax Accountant2008 Outside Corporate Auditor (current position)
Kando Nakagawa Outside Corporate Auditor (independent)
1976 Attorney at Law2011 Outside Corporate Auditor (current position)

22 KISSEI Annual Report 2018
Corporate Governance
Corporate Governance Bodies and Internal Control System
Our Basic Approach to Corporate Governance
Kissei aims to improve its corporate value and realize sustainable
growth as a company with a clear raison d’être. At the same time,
the Company positions the enhancement and reinforcement of
corporate governance as a core management issue in order to
maintain a positive relationship with all of its stakeholders, includ-
ing shareholders and other investors, customers, local communi-
ties, business partners, and employees, as well as to fulfill its social
responsibility. As such, the Company established the Kissei Basic
Policy on Corporate Governance in October 2015, which repre-
sents the Company’s basic framework for corporate governance.
To improve corporate value, Kissei continuously and periodically
revises this policy at Board of Directors’ meetings.
Overview of Bodies
Kissei’s Board of Directors sets basic strategies for Kissei and makes
decisions on all important matters while also providing oversight of
business execution. The Board of Directors strives to make prompt
business decisions and increase the transparency of operations.
The Company employs a corporate governance manage-
ment system under which the Board Chairman serves as chief
executive officer (CEO), given authority over all matters pertain-
ing to management, and the president serves as chief operating
officer (COO), responsible for all matters related to business
execution. This system delegates certain business execution
responsibilities from the Board of Directors, and it was instituted
with the aim of strengthening management systems and allow-
ing for management to be conducted more flexibly. In addition,
the CEO is responsible for convening meetings of the Board of
Managing Directors, which consists of managing directors and
directors of a higher rank and is responsible for discussing and
ruling on items from a predetermined agenda. Furthermore, the
Chairman andChief Executive Officer
(CEO)Board of Managing
Directors
Board of Corporate Auditors (4 Members, including 2
Outside Corporate Auditors)
Independent Auditor
Nomination and Compensation Deliberation Committee
Board of Directors (14 Members, including 2 Outside Directors)
Risk Management Committee
Compliance Committee
President and Chief Operating Officer
(COO)
Auditing Department
Business Departments
Business Execution Committee
Audit
Audit
Report
Report Consultation
Audit
Audit
Election /Dismissal, Supervision
Election / DismissalElection / Dismissal Election / Dismissal
General Meeting of Shareholders

23Annual Report 2018 KISSEI
Corporate Governance
Business Execution Committee has been established as an advi-
sory committee to the COO to aid the COO in decision making
and to assist in examining the management matters to be pro-
posed or reported to the Board of Directors.
The Company has adopted a corporate auditor system. This
system was deemed rational as the corporate auditors together
with the appointed outside directors effectively facilitate improve-
ments in the functionality of the Board of Directors while strength-
ening management oversight functions. The Company has 2
internal and 2 outside corporate auditors. Corporate auditors
attend meetings of the Board of Directors and actively state opin-
ions. One outside corporate auditor is a licensed attorney and the
other is a certified public accountant. Consequently, they are able
to conduct audits from a specialist perspective. Moreover, the 2
outside directors and 2 outside auditors are designated indepen-
dent officers in accordance with regulations of the Tokyo Stock
Exchange, to which they report.
Analysis and Evaluation of the Effectiveness of the Board of Directors as a Whole
In an effort to maintain and improve effectiveness, all direc-
tors and auditors perform self-evaluations once a year, which
are shared with the Board along with results of the analysis
and evaluation of the effectiveness of the entire Board of
Directors. The evaluation focuses on eight different areas: (1)
establishment of roles for the Board of Directors, directors,
and auditors; (2) organizational frameworks for the Company
as a whole; (3) content of proposals made by Board members
and corresponding deliberation times; (4) information that
should be pursued by the Board; (5) leadership shown by the
Chairman of the Board; (6) directors’ skills; (7) diversity of
Board of Directors members; and (8) performance of the
Board of Directors and directors.
In fiscal 2017, the Board was evaluated as being sufficiently
effective, displaying effectiveness in decision-making, busi-
ness execution, and supervisory functions. As we move for-
ward, we will continue to work toward full functionality and
improved effectiveness of the Board of Directors based on
the results of this year’s evaluation.
Internal Control System and Risk Management Structure
Kissei operates under the management philosophy of “contribute
to society through high-quality, innovative pharmaceutical prod-
ucts” and “serve society through our employees.” The Kissei Code
of Conduct guides employee conduct, with the aim of upholding
high ethical standards in R&D, manufacturing, and sales activities,
all of which are fundamental to our business as a company
involved in life sciences. In addition, Kissei has established the
Compliance Committee to provide advice to the Board of
Directors to help ensure that all laws and regulations are followed
both in letter and spirit. The Company’s Compliance Program is
conducted on a regular basis, and as part of this program Kissei
Pharmaceutical’s Compliance Program Manual is continually
updated with employees receiving regular instruction on compli-
ance related issues. Kissei also created the Kissei Basic Policy on
Internal Controls, in which every employee is trained. Based on
this policy, in addition to maintaining all Company rules, the Risk
Management Committee—which is an advisory body to the
Board of Directors—was established, and risk management and
other internal systems are consequently promoted.
Internal Audits
Kissei has established the Auditing Department, an indepen-
dent body that reports directly to the Chief Operating Officer
(COO). This 5-member body conducts internal audits for each
department and all internal systems in Kissei based on the
annual auditing plan, ensuring that all departments are carrying
out business activities in an appropriate manner. The Board of
Corporate Auditors and the Auditing Department discuss the
auditing systems and auditing plan at the beginning of each
fiscal year. In addition, they meet every month to exchange
opinions on the status of the audits being conducted.

24 KISSEI Annual Report 2018
Corporate Governance
Total Compensation of Officers by Type and Classification and Number of Applicable Officers
Millions of yen
Classification Total compensation
Totals by compensation type Number ofapplicable officersBase compensation Stock options Bonuses Retirement benefits
Directors(excluding outside directors)
357 334 — 22 — 12
Corporate auditors(excluding outside corporate auditors)
28 25 — 2 — 2
Outside officers 28 27 — 1 — 4
Independent Auditor
Kissei regularly undergoes outside auditing by an indepen-
dent auditor. The independent auditor engages in discussions
with members of the Board of Directors, finance officers, and
the Board of Corporate Auditors, which aids the strengthening
and maintenance of the corporate governance structure. In
addition, the Tripartite Auditing Council convenes periodically,
providing an opportunity for corporate auditors, Auditing
Department staff, and the independent auditor to work
together to make joint audit engagements more effective.
Furthermore, 2 certified public accountants belonging to
Ernst & Young ShinNihon LLC provide the Company with
accounting services. As well, 10 certified public accountants
and 9 other audit personnel provide assistance in the auditing
of the Company.
Nomination and Compensation Deliberation Committee
To ensure the independence and objectivity of the Board of
Directors’ deliberations related to director compensation or
the nomination of candidates for director and corporate audi-
tor, as well as enhance the transparency of these processes,
the Company established the Nomination and Compensation
Deliberation Committee as an advisory body to the Board of
Directors. This committee holds meetings where it engages in
debate on nominating director and corporate auditor candi-
dates as well as on determining director compensation. In
addition, when nominating a candidate for the corporate audi-
tor position, the Company has an outside corporate auditor
attend these meetings as a committee member.
Policies for Determining Director Compensation Amounts and Calculation Methods
Director compensation comprises a base salary and a bonus.
Base salary is determined by director rank, and also includes
an additional amount based on individual experience. Bonus
is determined by director rank, and takes into account the
director’s performance for the period.

25Annual Report 2018 KISSEI
Corporate Governance
Message from Outside Directors
Minoru NomuraOutside Director
In order for a company to continue its contributions to
society, it is important to gain social trust while main-
taining sustainable growth with it. Within this basic
foundation, it is necessary to strengthen corporate
governance. As an outside director, part of my role in
this regard is to join meetings with the Board and par-
ticipate in decision-making from a third-party point of
view. It is possible to take common sense as it exists in
society as a whole and apply it to advice given in
terms of business and industry alike. Furthermore,
I believe that incorporating the social point of view in
managerial decisions across a variety of affairs can
help maintain true competitive power.
Kissei provides information to its outside directors
with as much advance notice as possible to allow them
to participate in and contribute specialized knowledge
vital to the decision-making process. Moving forward,
I plan on applying my knowledge and experience gained
from working in financial institutions and company
management to Kissei’s decision-making process while
maintaining a required measure of independence as an
outside director.
The overhaul of the National Health Insurance (NHI)
Drug Prices Standard System, which took place in April
of this year, has been a major shock to the pharmaceu-
tical industry. As we move forward, it is believed that
long-listed drugs will play a shrinking role in accor-
dance with expected slowdown in domestic growth
and active movement toward developing the interna-
tional market. It is now necessary for new drug manu-
facturers to fully identify their strengths, which
overseas markets they want to focus on, and for which
disease areas they will develop new drugs.
In addition to the urology, and renal diseases and
dialysis fields, Kissei is actively engaging in opportunities
toward making new drugs for unmet medical needs—
a vital field for cases where there are few effective
drugs and new treatments are required. In the midst
of sudden technological innovations and intensifying
competition worldwide, quicker management deci-
sions and accelerated business execution are neces-
sary to stay ahead of other companies on the drug
creation front. With a full understanding of the impor-
tance of maintaining independence from the Company,
I will continue to make use of my many years of expe-
rience as a corporate manager and my knowledge in
international business to contribute to the wider man-
agement of Kissei.
Shigetaka ShimizuOutside Director

26 KISSEI Annual Report 2018
CSR Management
Based on its management philosophy and vision, the Kissei
Group has used its pharmaceutical products to contribute to
the health of its customers for many years in addition to con-
ducting a variety of initiatives as a corporate citizen and deep-
ening its relationships of trust with each and every stakeholder.
We are pushing ahead with CSR management as part of efforts
to expand our business activities and our goal for continuous
growth as a company that is truly needed by society.
Contributions to the Development of Medical Treatments and Sciences
Public Interest Incorporated Foundation Kanzawa Medical Research FoundationEstablished in 1997, the Kanzawa Medical Research Foundation
offers grants, awards, and lectures for multifaceted research on
various diseases affecting women of reproductive age, particu-
larly at the perinatal stage, and those of advanced age. In a
society with declining birth rates and an aging population,
developing medicine to maintain and improve the health of
women is a vital contribution to improving the health and wel-
fare of the population.
Number and Total Amounts of Awards and Grants Offered between Fiscal 1997 and 2017
Number Total amount
Kanzawa Medical Award 19 ¥ 56 millionResearch Grants 207 ¥232 millionOverseas Study Grants 78 ¥ 39 million
Establishment of Privately Funded University Courses including Joint ResearchWe established a privately funded university course under the
Shinshu University School of Medicine in 2010 to explore the
etiology and pathology of intractable neurological diseases,
such as spinocerebellar ataxia (SCA) and amyotrophic lateral
sclerosis (ALS). In 2012, we worked together with the university
to conduct courses with the aim of cultivating human resources
and exploring possibilities for new drug creation. This course
was different from the other highly dependable courses we
have sponsored in that both university and Company resources
were offered as part of its collaborative research nature. Through
such courses, we are promoting R&D to facilitate education,
information exchange, possibilities for new drug creation, and
commercialization. One of the achievements made through
this effort was the support of research taking place at the
Shinshu University Department of Pediatrics into immunotherapy
utilizing CAR-T (chimeric antigen receptor-expressing T cells)
technology for the treatment of cancer.
Another privately funded course we established, also in
Corporate Social Responsibility (CSR)
Concert by the Saito Kinen Orchestra© Takeshi Yamada
2012, is on cutting-edge treatment of immunological diseases
and cancer at the Graduate School of Medicine at Juntendo
University, and is continuing as a joint research course from
2018. Our goal is to contribute to the development of research
and new treatments for patients with cancer, immunological
diseases, and allergies.
Contribution to Music Culture
We believe that supporting and encouraging cultural activities
that move people is one of a company’s crucial roles. As such,
we have acted as a sponsor for the Seiji Ozawa Matsumoto
Festival (formerly the
Saito Kinen Festival
Matsumoto), an inter-
national music festival
held at the beginning
of fall every year in
Matsumoto City, since
its inception in 1992.
Activities to Spread Medical Information
Spreading Information on the Proper Use of Pharmaceutical ProductsTo ensure that pharmaceutical products are used accurately
and properly, medical representatives (MRs) cooperate with
the support departments, which are highly knowledgeable
and experienced in the medical and pharmaceutical sci-
ences, to deliver valid and precise information on pharma-
ceutical products to healthcare professionals. MRs also
collect information on the safety and effectiveness of phar-
maceutical products used at medical sites and offer feedback
to the pharmacovigilance and post-marketing surveillance /
R&D sections, which is applied to the development of better
pharmaceutical products and product information updates.
MRs add to their wealth of knowledge by means of educa-
tion and training. Through use of tablet PCs equipped for the
safety information system, which offers quick access to safety
information, and the “K-Net Conference” system, a service for
online meetings and conference sessions, MRs can deliver
higher quality information.
Establishment of the Product Customer Service CenterWe have established the Product Customer Service Center to
encourage proper use of pharmaceutical products and thus
improve their efficacy. In fiscal 2017, we responded to 11,080
questions from patients and healthcare professionals.
In addition, we are working to build more responsive sys-
tems, such as a dedicated phone line for urgent questions on
pharmaceutical products that must be administered immedi-
ately after the appearance of symptoms.

27Annual Report 2018 KISSEI
Corporate Social Responsibility (CSR)
Relationships with Our Employees
Our Stance on Human ResourcesWe are taking steps to cultivate human resources and create an
environment where our diverse employees can display their skills
to their utmost based on the stance that intellectual stimulation
results from mutual respect for a variety of mindsets and values,
inciting creativity and dynamism in the Company.
As part of our continued efforts to create a working envi-
ronment that encompasses employment, labor conditions,
and human resources management, we have adopted a multi-
selective human resources system which gives consideration
to our employees’ aptitudes and life plans. In addition, we are
also introducing multiple systems to our departments, such as
flextime and deemed working hours, in order to make work-
time more flexible, and allowing a variety of personnel to work
to their fullest capability.
Cultivating Human Resources
The Kissei Group has set “enabling employees to demonstrate
their strengths to the utmost degree as both an individual and
a part of an organization” as an objective in its vision for human
resources cultivation. To achieve this vision, we are developing
policies for human resource cultivation based on employee-
entered self-improvement, Company-centered environment
creation, and management-centered guidance.
Vision for Human Resources Cultivation
1. Cultivate independent employees that understand the Compa-ny’s social mission, contribute to the Company’s development, and are highly creative, responsible, and capable.
2. Cultivate competent businesspeople capable of promoting organizational objectives for efficiency and work to enhance in them the knowledge and skills necessary to perform Company duties in light of management and technology reform.
3. Cultivate members of society with open-minded, refined, and amiable personalities who are capable of building strong rela-tionships and are full of honesty and humanity.
Cultivating the Next GenerationKissei is a company that enables employees to balance work and
home life, including childcare, and by creating an environment
that is easy for all employees to work in, they are able to demon-
strate their full potential. Kissei is making every effort to establish
this type of work environment.
These efforts were evaluated and recognized in 2008, 2011, and
2015 with certification as a standards-compliant general business
owner (known as Kurumin) based on the Act on Advancement of
Measures to Support Raising Next-Generation Children.*
Furthermore, in 2017 Kissei was granted
special Platinum Kurumin certification in
recognition of reaching an even higher
standard in providing exemplary childcare
support.
* Act on Advancement of Measures to Support Raising Next-Generation Children: Laws enacted by national and local public entities and businesses to promote measures to
support raising next-generation children. These measures are designed to create an environment in which children, who will be responsible for society in the coming generation, can be born and raised in a healthy manner.
Efforts to Promote the Success of Women in the WorkplaceKissei has formulated a General Employers Action Plan based on the
Act on Promotion of Women’s Participation and Advancement in
the Workplace. We are working to further develop our infrastructure
so that women are able to fully express their individuality and ability
in their professional careers and see success in the workplace.
Our Primary Goals Regarding Women’s Success(April 1, 2018—March 31, 2020)
• Increase number of female applicants
• Provide support for balancing work life and home life
• Facilitate the use of shortened workday policies among female medical representatives
Workplace Health and SafetyIn order to guarantee a safe working environment where
employees can do their jobs with peace of mind, we have
established the Environment, Health and Safety Committee
and are implementing safety- and health-related activities. The
health and safety subcommittees at each respective work-
place head up these initiatives and maintain safe working
environments by training new hires in safety and disaster pre-
vention, conducting regular patrols of worksites and work
environment assessments, and through educational activities
to raise safety awareness.
In fiscal 2017, there were two incidences of work-related
accidents resulting in time off of work.
Work-Related Accidents
(FY) 2013 2014 2015 2016 2017
Incidences of work-related accidents(resulting in time off from work)
3(0)
4(0)
3(1)
5(0)
2(2)
Rate of frequency*1 0.00 0.00 0.31 0.00 0.65
Rate of severity*2 0.00 0.00 0.00 0.00 0.01
*1: Number of injuries resulting in one or more days off per 1 million hours worked*2: Number of work days lost due to injury per 1,000 hours worked

28 KISSEI Annual Report 2018
Enactment of the Kissei Health DeclarationKissei is committed to its management philosophy and will
“contribute to society through high-quality, innovative pharma-
ceutical products” and “serve society through our employees.” In
order to realize the goals stated in our management philosophy,
we established the Kissei Health Declaration in April 2017,
based on the belief that each and every employee must be
healthy both in mind and body.
Kissei strives to maintain and enhance the health of employ-
ees and their families, while instilling a sense of purpose and
drive. At the same time, we aim to create a healthy and vibrant
workplace environment where each and every employee is
able to reach their full potential.
Kissei Health Declaration Enacted on April 1, 2017
We will contribute to the health and medical care of people around the world by providing ethical drugs and other high-quality, inno-vative pharmaceutical products. (from the Kissei Code of Conduct)
To that end, each and every employee must be healthy both in mind and body.
Kissei strives to maintain and enhance the health of employees and their families while instilling a sense of purpose and drive. At the same time, we aim to create a healthy and vibrant workplace environment where each and every employee is able to reach their full potential.
1. The Company and the health insurance association recognize health problems of employees as important management issues and will therefore provide opportunities for employees to main-tain and improve the health of their mind and body, and create a workplace that is both healthy and easy to work in. We will actively engage in harmony (work-life balance) between com-pany life and personal life of our employees.
2. Employees recognize the importance of self-care in terms of managing their own health, and will create a healthy body and mind by actively maintaining and promoting their own health.
Environmental Initiatives
Basic StanceInitiatives to address environmental problems are the respon-
sibility of all of humanity and are an essential element of a
company’s survival and operations. In recognition of this, the
Kissei Group is working to preserve the environment and
reduce the environmental impact of all its business activities.
Our basic environmental policy lays out our fundamental phi-
losophy and six key principles. Every year, we establish specific
environmental objectives on the basis of this policy. Some of
those include efforts to reduce energy use and CO2 emissions,
as well as the amount of waste generated.
151413 16 17 (FY)
Crude oil equivalent (kL)
0
2,000
4,000
6,000
8,000
10,0009,232 9,256 9,281 8,945 8,694
151413 16 17 (FY)
Tons
0
5,000
10,000
15,000
20,000
25,000
20,843 20,916 20,695 19,701 19,162
151413 16 17 (FY)
Tons %
0 0
100
200
300
400
500 100
80
60
40
20
406
76% 74%
82% 86%439
366
424398
79%
151413 16 17 (FY)
Tons %
0 0
5
10
15
20
25 5
4
3
2
1
20 4.1%
18
14
3.6%
1312
3.5%
4.9%
2.8%
Trend in Energy Usage
CO2 Emissions
Amount of Waste Generated and Percentage Recycled
Final Disposal Amount and Final Rate of Disposal
Amount of waste generated Percentage recycled (right)
Final disposal amount Final disposal rate (right)
Electricity Heavy oil, kerosene, LPG
Natural gas, city gas Gasoline (MR cars)
Corporate Social Responsibility (CSR)

29Annual Report 2018 KISSEI
Financial Position
For the fiscal year under review, ended March 31, 2018, total assets
stood at ¥213,087 million, up ¥26,285 million from the previous
fiscal year-end. Total current assets increased ¥3,381 million, to
¥100,599 million, due to an increase in notes and accounts receiv-
able and marketable securities, which offset a decrease in cash on
hand and in banks as well as inventories. Total non-current assets
were up ¥22,904 million, to ¥112,487 million, mainly reflecting an
increase in investments in securities.
Total liabilities amounted to ¥36,994 million at the fiscal
year-end, up ¥7,976 million from the previous fiscal year-end.
Total current liabilities stood at ¥17,448 million, up ¥1,791 mil-
lion, mainly due to an increase in income taxes payable. Total
long-term liabilities were up ¥6,184 million, to ¥19,546 million,
due to an increase in deferred tax liabilities.
Total net assets amounted to ¥176,092 million at the fiscal
year-end, an increase of ¥18,309 million compared with the pre-
vious fiscal year-end. This increase reflected an increase in net
unrealized holding gains on securities and retained earnings in
addition to the acquisition and cancellation of treasury stock.
As a result, the shareholders’ equity ratio was 82.5%, down
from 84.3% at the previous fiscal year-end.
Financial Results
Net sales for the fiscal year ended March 31, 2018 increased 3.2%
year on year, to ¥74,009 million. Accounting for the majority of
net sales, the segment sales of the Kissei Group’s core pharma-
ceutical business were up ¥2,436 million, or 4.0%, to ¥63,891
million. The reason for this increase is increased sales of P-TOL®
Chewable Tablet for the treatment of hyperphosphatemia,
Urief® Tablet and Urief® OD Tablet for the treatment of dysuria
associated with benign prostatic hyperplasia, and Epoetin Alfa
BS Injection [JCR] for the treatment of renal anemia, in addition
to increased revenue from technical fees and export sales. In
other business segments, net sales were down ¥132 million, or
1.3% year on year, to ¥10,118 million despite increased revenues
in information services, due to decreased revenues in mer-
chandising and construction industries.
The cost of sales ratio was up 0.4 percentage point in the
pharmaceutical business while it fell in other businesses. As a
result, gross profit increased ¥1,489 million, or 3.2% year on
year, to ¥48,120 million.
In selling, general and administrative expenses, while sell-
ing expenses decreased, R&D and general and administrative
expenses increased. As a result, operating income increased
¥1,396 million, or 16.4% year on year, to ¥9,887 million.
Financial Review
While gain on sales of investment securities decreased, gain
on valuation of securities increased and foreign exchange loss
declined. As a result, total other income (expenses) came to
total other income of ¥1,809 million, up ¥184 million compared
to the previous fiscal year.
As a result of the above, profit before income taxes and non-
controlling interests was up ¥1,580 million, or 15.6% year on year,
to ¥11,697 million, and profit attributable to owners of parent grew
¥1,319 million, or 17.1% year on year, to ¥9,045 million.
Basic Policy on the Distribution of Profits / Dividends for the Current and Coming Fiscal Years
Kissei aims to secure a solid management base while providing
stable, consistent returns to shareholders through cash dividends.
Kissei considers working to make efficient use of capital while
paying fair dividends to shareholders in accordance with profit
levels to be a key management issue.
Kissei’s basic dividend policy is to make twice-yearly dividend
payments, comprised of interim and year-end cash dividends.
The Board of Directors decides the amount of the interim cash
dividend, while the General Meeting of Shareholders decides the
amount of the year-end cash dividend. Also, Kissei’s articles of
incorporation stipulate that a resolution of the Board of Directors
enables the payment of interim cash dividends with a date of
record of September 30 each year.
For the fiscal year under review, Kissei will pay a year-end cash
dividend of ¥24.0 per share, which when combined with an
interim cash dividend of ¥24.0 per share gives a full-year cash divi-
dend of ¥48.0 per share.
For the coming fiscal year, the Group plans to pay an interim
cash dividend of ¥25.0 per share and a year-end cash dividend of
¥25.0 per share, giving a full-year cash dividend of ¥50.0 per share.
Giving first priority to increasing shareholder value, Kissei will
acquire and dispose of treasury stock, based on resolutions of the
Board of Directors, flexibly and as necessary in light of operational
developments.
In the fiscal year ended March 31, 2018, based on a resolution of
the Board of Directors, Kissei acquired 1.6 million shares of treasury
stock, equivalent to ¥4,462 million, while cancelling 2.5 million of
its own shares held as treasury stock.
Internal funds are maintained to respond to expected changes
in government policy, system reforms, and the challenges of
increasing globalization. At the same time, Kissei will actively
invest in R&D to develop drugs that patients need. Kissei believes
this policy will not only contribute to future profits but also enable
Kissei to distribute profits to its shareholders appropriately.

30 KISSEI Annual Report 2018
Business Risks
1 R&D
The process of developing pharmaceuticals—from the R&D
stage to approval and sales—requires large investments of both
time and funds. When developing new drugs, the chances of
discovering beneficial indications are limited. In addition, Kissei
can guarantee neither that a new drug undergoing develop-
ment or an additional indication will have its intended benefit
nor predict when or if the drug will be approved.
2 Medical System Reform
The prices of pharmaceuticals in Japan are set based on the
government’s NHI drug prices and are revised on a regular
basis. There may be revisions to Japan’s health insurance
system or reforms that go beyond Kissei’s assumptions, such as
the introduction of diagnosis procedure combinations or the
promotion of generic drugs, which would negatively impact
Kissei’s operating results and financial position.
3 Competition with Other Companies’ Products
The Kissei Group faces competition from companies selling
products with the same application as its own. In addition,
once a patent expires, price competition with generic prod-
ucts of the same composition intensifies. This competition
could have a serious impact on the sales of existing drugs.
4 Unexpected Side-Effects
Unexpected side effects undiscovered at the R&D stage
sometimes appear after a drug has already been marketed. If
unexpected side effects or serious adverse events occur, the
use of a drug may be limited, or sales of the drug may be
terminated completely.
5 Manufacturing and Procurement
Malfunctions with production equipment or the inability to
procure raw materials in a timely fashion could delay or shut
down drug manufacturing. In addition, a quality problem
may cause a drug to be recalled, which would negatively
impact Kissei’s operating results and financial position.
6 Intellectual Property Rights
In the event that the Kissei Group is unable to appropriately
protect its intellectual property, a third party may be able to
use the Kissei Group’s technology, which would undermine
its competitive superiority in the market.
7 Litigation
At present, there is no outstanding litigation affecting the Kissei
Group’s management. There is the possibility, however, that in
the course of its business activities, the Kissei Group could face
lawsuits in the future both at home and abroad regarding
patent, product liability, environment, and labor matters.
8 Environmental Conservation
Pharmaceutical chemical substances used in research and
manufacturing processing could have an impact on the envi-
ronment. Every department and work site in the Kissei Group
is working diligently to follow stringent substance manage-
ment rules to protect the environment. However, if chemical
substances were found to have polluted areas around a work
site, legal action may be taken against the work site, and
Kissei may be faced with large costs to restore the environ-
ment, which would negatively impact Kissei’s operating
results and financial position.
9 Information Management
The Kissei Group is paying close attention to the need to pro-
tect information by establishing strict rules for the manage-
ment of personal and confidential information as well as
providing education on this issue to employees. However, if
an unexpected incident occurred in which information was
improperly disclosed, the Kissei Group’s image may be tar-
nished, which could negatively impact Kissei’s operating
results and financial position.
Besides the business risks mentioned above, there are vari-
ous other risks faced by the Kissei Group.
The following are the most significant risks which could potentially affect the Kissei Group’s operating
results and financial position. Forward-looking statements are based on the judgments the Kissei
Group has made from the consolidated financial statements for fiscal 2017.

Financial Section 32 Consolidated Balance Sheets
34 Consolidated Statements of Income and
Consolidated Statements of Comprehensive Income
35 Consolidated Statements of Changes in Net Assets
36 Consolidated Statements of Cash Flows
37 Notes to the Consolidated Financial Statements
49 Independent Auditor’s Report
50 Corporate Information
51 Investor Information

KISSEI Annual Report 2018 32
Kissei Pharmaceutical Co., Ltd. and its subsidiariesAt March 31, 2017 and 2018
Consolidated Balance Sheets
Millions of yen Thousands of U.S. dollars (Note 03)
Assets 2018 2017 2018
Current Assets:
Cash on hand and in banks (Notes 04 and 05) ¥ 24,371 ¥ 27,109 $ 229,915
Notes and accounts receivable (Note 05) 28,873 24,730 272,387
Marketable securities (Notes 04, 05 and 06) 23,288 21,039 219,698
Inventories (Note 07) 15,933 16,726 150,311
Deferred tax assets—current (Note 10) 2,436 2,179 22,981
Other current assets 5,698 5,434 53,755
Allowance for doubtful accounts (1) (1) (9)
Total current assets 100,599 97,218 949,047
Property, Plant and Equipment:
Buildings and structures (Note 14) 38,489 37,915 363,104
Less: accumulated depreciation (28,030) (27,326) (264,434)
Buildings and structures, net 10,458 10,589 98,660
Land (Note 14) 12,913 12,933 121,821
Construction in progress 19 59 179
Other 15,703 14,742 148,142
Less: accumulated depreciation (12,698) (12,016) (119,792)
Other, net 3,005 2,725 28,349
Total property, plant and equipment 26,396 26,308 249,019
Intangible Assets:
Software for internal use 1,028 1,082 9,698
Other 687 763 6,481
Total intangible assets 1,716 1,845 16,189
Investments and Other Assets:
Investment securities (Notes 05 and 06) 81,194 58,344 765,981
Long-term loans receivable 98 119 925
Long-term prepaid expenses 1,608 1,454 15,170
Deferred tax assets—non-current (Note 10) 500 517 4,717
Other 1,026 1,045 9,679
Allowance for doubtful accounts (54) (53) (509)
Total investments and other assets 84,374 61,428 795,981
Total assets ¥213,087 ¥186,801 $2,010,255
The accompanying notes are an integral part of these statements.

Annual Report 2018 KISSEI 33
Millions of yen Thousands of U.S. dollars (Note 03)
Liabilities and Net Assets 2018 2017 2018
Current Liabilities:
Notes and accounts payable ¥ 4,894 ¥ 4,849 $ 46,170
Short-term bank loans (Note 08) 1,730 1,730 16,321
Current portion of long-term debt (Note 08) 27 70 255
Income taxes payable 2,375 1,055 22,406
Accrued bonuses to employees 2,225 2,088 20,991
Accrued bonuses to directors and corporate auditors 26 25 245
Reserve for sales returns 22 11 208
Reserve for sales rebates 407 356 3,840
Reserve for sales promotion expenses 189 189 1,783
Other current liabilities 5,550 5,278 52,358
Total current liabilities 17,448 15,656 164,604
Long-Term Liabilities:
Long-term debt (Note 08) 1,876 1,656 17,698
Deferred tax liabilities—non-current (Note 10) 12,201 5,645 115,104
Net defined benefit liability (Note 11) 4,623 5,379 43,613
Accrued retirement benefits to directors and corporate auditors 151 134 1,425
Asset retirement obligations 114 112 1,075
Other long-term liabilities 577 433 5,443
Total long-term liabilities 19,546 13,361 184,396
Total liabilities 36,994 29,017 349,000
Contingent Liabilities (Note 13)
Net Assets:
Shareholders’ equity:
Common stock:
Authorized: 227,000,000 shares
Issued: 54,311,185 shares and 51,811,185 shares at March 31, 2017 and 2018, respectively 24,356 24,356 229,774
Additional paid-in capital 24,226 24,226 228,547
Retained earnings 102,834 101,755 970,132
Treasury stock (5,994,175 shares and 5,094,713 shares at March 31, 2017 and 2018, respectively) (11,607) (12,838) (109,500)
Total shareholders’ equity 139,809 137,499 1,318,953
Accumulated other comprehensive income:
Unrealized holding gains on securities 36,752 21,268 346,717
Retirement benefits liability adjustments (859) (1,313) (8,104)
Total accumulated other comprehensive income 35,892 19,954 338,604
Non-controlling interests 390 329 3,679
Total net assets 176,092 157,783 1,661,245
Total liabilities and net assets ¥213,087 ¥186,801 $2,010,255
Consolidated Balance Sheets

KISSEI Annual Report 2018 34
Consolidated Statements of Income
Millions of yen Thousands of U.S. dollars (Note 03)
2018 2017 2018
Net Sales ¥74,009 ¥71,706 $698,198 Cost of Sales 25,889 25,075 244,236 Gross profit 48,120 46,631 453,962
Selling, General and Administrative Expenses (Note 17) 38,232 38,140 360,679 Operating income 9,887 8,491 93,274 Other Income (Expenses): Interest and dividend income 1,081 963 10,198 Interest expense (23) (24) (217) Gain on sales of investment securities 320 652 3,019 Loss on sales or disposal of property, plant and equipment (37) (31) (349) Income (loss) from investments in partnerships (0) 10 (0) Gain on sales of property, plant and equipment — 18 — Gain on valuation of securities 387 226 3,651 Impairment loss — (47) — Foreign exchange gain (loss) 0 (94) 0 Loss on valuation of stocks of subsidiaries and affiliates — (53) — Loss on valuation of investments in capital of subsidiaries and affiliates — (59) — Other, net 80 66 755 Total other income (expenses) 1,809 1,625 17,066 Profit before income taxes and non-controlling interests 11,697 10,116 110,349 Income Taxes (Note 10): Current 3,223 2,291 30,406 Deferred (624) 59 (5,887) 2,598 2,351 24,509 Profit 9,098 7,765 85,830 Profit Attributable to Non-Controlling Interests 52 39 491 Profit Attributable to Owners of Parent (Note 18) ¥ 9,045 ¥ 7,726 $ 85,330
The accompanying notes are an integral part of these statements.
Consolidated Statements of Comprehensive Income
Millions of yen Thousands of U.S. dollars (Note 03)
2018 2017 2018
Profit ¥ 9,098 ¥ 7,765 $ 85,830 Other Comprehensive Income: Unrealized holding gains on securities 15,484 (4,677) 146,075 Retirement benefits liability adjustments 461 420 4,349 Total other comprehensive income (Note 12) 15,945 (4,256) 150,425 Comprehensive Income ¥25,044 ¥ 3,508 $236,264 Comprehensive income attributable to:
Shareholders of Kissei Pharmaceutical Co., Ltd. ¥24,983 ¥ 3,463 $235,689 Non-controlling interests 60 45 566
The accompanying notes are an integral part of these statements.
Kissei Pharmaceutical Co., Ltd. and its subsidiariesAt March 31, 2017 and 2018
Consolidated Statements of Income and Consolidated Statements of Comprehensive Income

Annual Report 2018 KISSEI 35
Kissei Pharmaceutical Co., Ltd. and its subsidiariesFor the years ended March 31, 2017 and 2018
Consolidated Statements of Changes in Net Assets
Millions of yen
Shareholders’ equityAccumulated other
comprehensive income
Number of shares of common stock
Common stock
Additional paid-in capital
Retained earnings
Treasury stock
Unrealized holding gains on securities
Retirement benefits liability
adjustmentsNon-controlling
interests Total net
assets
Balance at April 1, 2016 54,311,185 ¥24,356 ¥24,247 ¥ 96,230 ¥(11,189) ¥25,945 ¥(1,730) ¥265 ¥158,125
Profit attributable to owners of parent for the year — — — 7,726 — — — — 7,726
Cash dividends paid — — — (2,201) — — — — (2,201)
Treasury stock purchased (610,541 shares) — — — — (1,649) — — — (1,649)
Unrealized holding gains on securities — — — — — (4,677) — — (4,677)
Retirement benefits liability adjustments — — — — — — 416 — 416
Changes in equity of consolidated subsidiaries — — (21) — — — — — (21)
Net changes in items other than those in shareholders’ equity — — — — — — — 64 64
Balance at April 1, 2017 54,311,185 ¥24,356 ¥24,226 ¥101,755 ¥(12,838) ¥21,268 ¥(1,313) ¥329 ¥157,783
Profit attributable to owners of parent for the year — — — 9,045 — — — — 9,045
Cash dividends paid — — — (2,270) — — — — (2,270)
Treasury stock purchased (1,600,538 shares) — — — — (4,464) — — — (4,464)
Cancellation of treasury stock (2,500,000 shares) (2,500,000) — (0) (5,695) 5,695 — — — —
Unrealized holding gains on securities — — — — — 15,483 — — 15,483
Retirement benefits liability adjustments — — — — — — 454 — 454
Net changes in items other than those in shareholders’ equity — — — — — — — 60 60
Balance at March 31, 2018 51,811,185 ¥24,356 ¥24,226 ¥102,834 ¥(11,607) ¥36,752 ¥ (859) ¥390 ¥176,092
Thousands of U.S. dollars (Note 03)
Shareholders’ equityAccumulated other
comprehensive income
Number of shares of common stock
Common stock
Additional paid-in capital
Retained earnings
Treasury stock
Unrealized holding gains on securities
Retirement benefits liability
adjustmentsNon-controlling
interests Total net
assets
Balance at April 1, 2017 54,311,185 $229,774 $228,547 $959,953 $(121,113) $200,642 $(12,387) $3,104 $1,488,519
Profit attributable to owners of parent for the year — — — 85,330 — — — — 85,330
Cash dividends paid — — — (21,415) — — — — (21,415)
Treasury stock purchased (1,600,538 shares) — — — — (42,113) — — — (42,113)
Cancellation of treasury stock (2,500,000 shares) (2,500,000) — (0) (53,726) 53,726 — — — —
Unrealized holding gains on securities — — — — — 146,066 — — 146,066
Retirement benefits liability adjustments — — — — — — 4,283 — 4,283
Net changes in items other than those in shareholders’ equity — — — — — — — 566 566
Balance at March 31, 2018 51,811,185 $229,774 $228,547 $970,132 $(109,500) $346,717 $ (8,104) $3,679 $1,661,245
The accompanying notes are an integral part of these statements.

KISSEI Annual Report 2018 36
Millions of yen Thousands of U.S. dollars (Note 03)
2018 2017 2018
Cash Flows from Operating Activities: Profit before income taxes and non-controlling interests ¥11,697 ¥10,116 $110,349 Depreciation and amortization 2,492 2,370 23,509 Increase (decrease) in allowance reserves 217 (115) 2,047 Decrease in net defined benefit liability (91) (28) (858) Impairment loss — 47 — Interest and dividend income (1,081) (963) (10,198) Interest expense 23 24 217 Foreign exchange (gain) loss 2 0 19 (Gain) loss on valuation of securities (387) (226) (3,651) (Gain) loss on sales of property, plant and equipment — (18) — (Gain) loss on sales of investment securities (320) (652) (3,019) Loss on disposal of property, plant and equipment 37 31 349 (Increase) decrease in notes and accounts receivable (4,142) 236 (39,075) (Increase) decrease in inventories 793 650 7,481 (Increase) decrease in other current assets 128 342 1,208 Increase (decrease) in notes and accounts payable 44 (979) 415 Increase (decrease) in other current liabilities 922 (1,941) 8,698 Increase (decrease) in other long-term liabilities 1 (13) 9 Loss on valuation of stocks of subsidiaries and affiliates — 53 — Loss on valuation of investments in capital of subsidiaries and affiliates — 59 — Other 0 (3) 0 Sub total 10,336 8,990 97,509 Receipt of interest and dividends 985 883 9,292 Payment of interest (23) (24) (217) Payment of income taxes (2,453) (3,406) (23,142) Net cash provided by operating activities 8,845 6,441 83,443 Cash Flows from Investing Activities: Time deposits received 75 77 708 Time deposits paid (75) (79) (708) Reduction of investments in specified trusts 66 56 623 Proceeds from sales of marketable securities 1,999 — 18,858 Acquisition of sales of marketable securities (1,999) (1,331) (18,858) Acquisition of property, plant and equipment (1,867) (1,201) (17,613) Proceeds from sales of property, plant and equipment 20 28 189 Acquisition of intangible assets (253) (1,331) (2,387) Acquisition of investment securities (1,130) (4,347) (10,660) Proceeds from sales of investment securities 574 2,069 5,415 Payments for loans (61) (111) (575) Collection of loans 99 113 934 Long-term advance payment costs (403) (7) (3,802) Other (4) 60 (38) Net cash provided by (used in) investing activities (2,959) (4,671) (27,915)Cash Flows from Financing Activities: Short-term bank loans received 80 — 755 Repayment of short-term bank loans (80) — (755) Long-term debt received 248 238 2,340 Repayment of long-term debt (70) (85) (660) Repayment of finance lease obligation (64) (68) (604) Cash dividends paid (2,270) (2,201) (21,415) Treasury stock purchased (4,464) (1,649) (42,113) Net cash provided by (used in) financing activities (6,621) (3,766) (62,462)Effect of Exchange Rate Changes on Cash and Cash Equivalents (2) (0) (19)Increase (Decrease) in Cash and Cash Equivalents (737) (1,996) (6,953)Cash and Cash Equivalents at Beginning of Year (Note 04) 48,098 50,094 453,755 Cash and Cash Equivalents at End of Year (Note 04) ¥47,360 ¥48,098 $446,792
The accompanying notes are an integral part of these statements.
Kissei Pharmaceutical Co., Ltd. and its subsidiariesFor the years ended March 31, 2017 and 2018
Consolidated Statements of Cash Flows

Annual Report 2018 KISSEI 37
Kissei Pharmaceutical Co., Ltd. and its subsidiaries
Notes to the Consolidated Financial Statements
Note 01 Basis of Presenting the Consolidated Financial Statements
The accompanying consolidated financial statements of Kissei Pharmaceutical Co., Ltd. (the Company) and its subsidiaries (the Companies) are prepared on the basis of accounting principles generally accepted in Japan, which are different in certain respects as to application
and disclosure requirements of International Financial Reporting Standards, and are compiled from the consolidated financial statements prepared by the Company as required by the Financial Instruments and Exchange Act of Japan.
Note 02 Summary of Significant Accounting Policies
(1) Scope of ConsolidationThe numbers of subsidiaries the Company had for the years ended March 31, 2017 and 2018 were four, respectively, of which three were con-solidated in the respective years. The subsidiaries that have been included in the scope of consolidation are listed below:
Name of subsidiaries% of voting
rights ownedPaid-in capital, millions of yen
Kissei Shoji Co., Ltd. 100% ¥ 50Kissei Comtec Co., Ltd. 83% ¥334Hashiba Technos Co., Ltd. 100% ¥ 45
(2) Consolidation and Elimination In preparing the accompanying consolidated financial statements, all significant intercompany transactions, account balances, and unrealized profits between the Companies have been eliminated, and the portion thereof attributable to non-controlling interests is charged to non-controlling interests. In eliminating investments in the common stock of the consolidated subsidiaries against the underlying equity in the net assets of the subsidiaries, diff erences between the cost of the investments and the underlying equity in net assets were not recognized for the two years ended March 31, 2017 and 2018.
(3) Investments in Unconsolidated SubsidiariesInvestments in unconsolidated subsidiaries are carried at cost, cost being determined by the moving average method, as there would be no signifi-cant effect in the consolidated statements of income if they were accounted for by the equity method.
(4) Valuation of SecuritiesHeld-to-maturity debt securities are carried at amortized cost. Marketable securities classified as other securities are carried at fair value as of the balance sheet date with changes in unrealized holding gain or loss, net of the applicable income taxes, included directly in net assets. The cost of securities sold is primarily determined by the moving average method. Non-marketable securities classified as other securities are stated at cost primarily determined by the moving average method. Short-term investments in specified trusts are stated at market value.
(5) Inventory ValuationInventories are mainly valued at cost using the gross average method (the amount on the balance sheet is reduced to reflect decreased profitability).
(6) Method of Depreciation of Significant Depreciable Assets(i) Property, plant and equipment (excluding lease assets)Depreciation is computed using the declining-balance method at rates based on the estimated useful lives of the assets. The range of useful lives is principally from 3 to 50 years for buildings and structures.
Depreciation for buildings acquired on or after April 1, 1998 (excluding facilities attached to buildings) and for both facilities attached to build-ings and other non-building structures acquired on or after April 1, 2016 is computed using the straight-line method. (ii) Intangible assets (excluding lease assets)Depreciation is computed using the straight-line method. Software costs for internal use are amortized over their expected useful lives (mainly 5 years) on a straight-line basis.(iii) Lease assets (pertaining to lease transactions not involving the trans-
fer of ownership)Lease assets are depreciated by the straight-line method with the respective lease period and the residual value being zero.
(7) Accounting for Consumption TaxConsumption tax is imposed at the flat rate of 8% on all domestic consumption of goods and services (with certain exemptions). Consumption tax withheld upon sale and consumption tax paid by the Companies on their purchases of goods and services are not included in the respective revenue and cost or expenses in the accompanying consolidated statements of income.
(8) Foreign Currency TranslationReceivables and payables denominated in foreign currencies are trans-lated into yen at the rates of exchange in effect at the balance sheet date, and differences arising from the translation are included in the consoli-dated statements of income. Investments in unconsolidated subsidiaries denominated in foreign currencies are translated at the historical exchange rates prevailing at the time such transactions were made.
(9) Income TaxesIncome taxes of the Companies consist of corporate income tax, local inhabitants taxes, and enterprise tax. The asset and liability approach is used to recognize deferred tax assets and liabilities in respect of temporary differences between the carrying amounts and the basis of assets and liabilities.
(10) Allowances, Accrued Bonuses to Employees and Reserves for Certain Expenses
(i) Allowance for doubtful accountsThe Companies provide an “Allowance for doubtful accounts” based on the percentage of their historical bad debt loss incurred against the balance of total receivables in addition to the amount of uncollectable receivables estimated on an individual basis.(ii) Accrued bonuses to employees“Accrued bonuses to employees” is provided for based on estimated amounts which the Companies should pay to employees for their services rendered during the six-month period ended on the balance sheet date.

KISSEI Annual Report 2018 38
Note 03 United States Dollar Amounts
The accompanying consolidated financial statements are expressed in yen, and solely for the convenience of the reader, have been translated into U.S. dollars at the rate of ¥106=U.S.$1, the approximate rate of
exchange prevailing at March 31, 2018. This translation should not be construed as a representation that all amounts shown could be converted into U.S. dollars at such a rate.
Notes to the Consolidated Financial Statements
(iii) Accrued bonuses to directors and corporate auditors“Accrued bonuses to directors and corporate auditors” is provided for based on estimated payments for their performance during the year ended March 31.(iv) Reserve for sales returns“Reserve for sales returns” is estimated based on the percentage of the Companies’ own actual return history against sales.(v) Reserve for sales rebates“Reserve for sales rebates” is provided for in an amount equiv alent to the expected amount payable by the Companies to dealers in respect of the balance of accounts receivable at the balance sheet date based on current applicable rebate rates.
(11) Accounting Method for Retirement BenefitsAccrued retirement benefits and prepaid pension cost for employees have been recorded mainly at the amount calculated based on the retire-ment benefit obligation and the fair value of the plan assets as of the balance sheet date.(i) Allocation of expected benefit paymentsWhen calculating retirement benefit obligation, the benefit formula method is used to allocate expected benefit payments to the period.(ii) Actuarial differences and prior service costPrior service cost is amortized through the straight-line method over a term that does not exceed the average remaining service period of employees who are expected to receive benefits under the plans (10 years). Net actuarial gains or losses are amortized from the following year through the straight-line method over a term that does not exceed the average remaining service period of employees who are expected to receive benefits under the plans (10 years).(iii) Accounting treatment for unrecognized actuarial gains and losses
and unrecognized prior service costUnrecognized actuarial gains and losses and unrecognized prior service cost are adjusted for tax effects and then recorded in retirement benefits liability adjustments under accumulated other comprehensive income in the net assets portion of the consolidated balance sheets.
(12) Profit and Dividends per ShareProfit attributable to owners of the parent per share is based upon the weighted-average number of shares of common stock outstanding during each fiscal year. Cash dividends per share shown for each year in the accom panying consolidated statements of income represent dividends approved or declared as applicable to the respective years.
(13) Research and Development ExpensesResearch and development expenses are recognized as an expense when incurred in accordance with Japanese accounting standards.
(14) Accounting Standards Issued but Not Yet EffectiveImplementation Guidance on Tax Effect Accounting and Implementation Guidance on Recoverability of Deferred Tax Assets On February 16, 2018, the ASBJ issued “Implementation Guidance on Tax Effect Accounting” (ASBJ Guidance No. 28) and “Implementation Guidance on Recoverability of Deferred Tax Assets” (revised 2018) (ASBJ Guidance No. 26).(i) OverviewThe accounting treatment for taxable temporary differences related to investments in subsidiaries when an entity prepares separate financial statements was modified. In addition, the accounting treatment related to the recoverability of deferred tax assets in entities that qualify as Category 1 was clarified.(ii) Scheduled date of adoptionThe Companies expect to adopt the implementation guidance from the beginning of the fiscal year ending March 31, 2019.(iii) Impact of the adoption of implementation guidanceThe Companies are currently evaluating the effect of the adoption of this implementation guidance on its consolidated financial statements.
Accounting Standard and Implementation Guidance on Revenue Recognition On March 30, 2018, the ASBJ issued “Accounting Standard for Revenue Recognition” (ASBJ Statement No. 29) and “Implementation Guidance on Accounting Standard for Revenue Recognition” (ASBJ Guidance No. 30).(i) OverviewThis is a comprehensive accounting standard for revenue recognition. Specifically, the accounting standard establishes the following five-step model that will apply to revenue from customers:1. Identify the contract(s) with a customer2. Identify the performance obligations in the contract3. Determine the transaction price4. Allocate the transaction price to the performance obligations in the
contract5. Recognize revenue when (or as) the entity satisfies a performance
obligation(ii) Scheduled date of adoptionThe Companies expect to adopt the accounting standard and imple-mentation guidance from the beginning of the fiscal year ending March 31, 2022.(iii) Impact of the adoption of accounting standard and implementation
guidanceThe Companies are currently evaluating the effect of the adoption of this accounting standard and implementation guidance on its consolidated financial statements.

Annual Report 2018 KISSEI 39
Note 04 Cash and Cash Equivalents
Cash and cash equivalents at March 31, 2017 and 2018 are as follows:
Millions of yen Thousands of U.S. dollars
2018 2017 2018Cash on hand and in banks ¥24,371 ¥27,109 $229,915Marketable securities 23,288 21,039 219,698Time deposits with original maturities of over three months (50) (50) (472)Claims with redemption period exceeding 3 months, etc. (249) — (2,349)Cash and cash equivalents ¥47,360 ¥48,098 $446,792
Note 05 Financial Instruments
Overview(1) Policy for financial instrumentsThe Companies manage temporary cash surpluses through low-risk financial assets. Further, the Companies raise short-term capital through bank bor-rowings. The Companies use derivatives for the purpose of reducing risk arising from fluctuations in foreign currency exchange rates and do not enter into derivatives for speculative or trading purposes. (2) Types of financial instruments and related riskTrade receivables—notes and accounts receivable—are exposed to credit risk in relation to customers. In accordance with the internal policies for manag-ing credit risk of the Companies arising from receivables, each related division monitors credit worthiness of their main customers periodically, and moni-tors due dates and outstanding balances by individual customer. Marketable securities and investment securities are exposed to market risk. Those securities are composed of mainly the shares of common stock of other companies with which the Companies have business relationships. The market value of these securities is periodically reported to the Board of Directors.(3) Supplementary explanation of the estimated fair value of financial instrumentsThe fair value of financial instruments is based on their quoted market price, if available. When there is no quoted market price available, fair value is reasonably estimated. Since various assumptions and factors are reflected in estimating the fair value, different assumptions and factors could result in a different fair value.
Estimated Fair Value of Financial InstrumentsCarrying value of financial instruments on the consolidated balance sheets as of March 31, 2017 and 2018 and unrealized gains (losses) are shown in the following tables. The following does not include financial instruments for which it is extremely difficult to determine the fair value. (Please refer to *2 in the following.)
Millions of yen
As of March 31, 2018Carrying
valueEstimatedfair value
Unrealizedgains (losses)
Assets:Cash on hand and in banks ¥ 24,371 ¥ 24,371 ¥—Notes and accounts receivable 28,873 28,873 —Marketable securities and investment securities 102,709 102,709 —Total ¥155,954 ¥155,954 ¥—Derivatives ¥ — ¥ — ¥—
Millions of yen
As of March 31, 2017Carrying
valueEstimatedfair value
Unrealizedgains (losses)
Assets:Cash on hand and in banks ¥ 27,109 ¥ 27,109 ¥—Notes and accounts receivable 24,730 24,730 —Marketable securities and investment securities 78,310 78,310 —Total ¥130,150 ¥130,150 ¥—Derivatives ¥ — ¥ — ¥—
Notes to the Consolidated Financial Statements

KISSEI Annual Report 2018 40
Thousands of U.S. dollars
As of March 31, 2018Carrying
valueEstimatedfair value
Unrealizedgains (losses)
Assets:Cash on hand and in banks $ 229,915 $ 229,915 $—Notes and accounts receivable 272,387 272,387 —Marketable securities and investment securities 968,953 968,953 —Total $1,471,264 $1,471,264 $—Derivatives $ — $ — $—
*1: Methods to determine the estimated fair value of financial instruments and other matters related to securities and derivative transactions Cash on hand and in banks and notes and accounts receivable Since these items are settled in a short period of time, their carrying value approximates fair value. Marketable securities and investment securities
The fair value of stocks is based on quoted market prices. For information on securities classified by holding purpose, please refer to Note 06 Securities.*2: Financial instruments for which it is extremely difficult to determine the fair value are as follows:
Millions of yen Thousands of U.S. dollars
2018 2017 2018Unlisted stocks ¥1,272 ¥572 $12,000Investments in partnerships 34 33 321Investments in unconsolidated subsidiaries 467 467 4,406
Because no quoted market price is available and it is extremely difficult to determine the fair value, the above financial instruments are not included in “Marketable securities and investment securities.”*3: Redemption schedule for receivables and marketable securities with maturities at March 31, 2017 and 2018 are as follows:
Millions of yen
As of March 31, 2018Due in
one year or lessDue after one yearthrough five years
Due after five yearsthrough ten years
Due afterten years
Assets:Cash on hand and in banks ¥24,371 ¥ — ¥ — ¥ —Notes and accounts receivable 28,873 — — —Marketable securities and investment securities 23,243 1,378 2,162 1,299Total ¥76,487 ¥1,378 ¥2,162 ¥1,299
Millions of yen
As of March 31, 2017Due in
one year or lessDue after one yearthrough five years
Due after five yearsthrough ten years
Due afterten years
Assets:Cash on hand and in banks ¥27,109 ¥ — ¥ — ¥ —Notes and accounts receivable 24,730 — — —Marketable securities and investment securities 21,040 1,588 1,647 1,417Total ¥72,879 ¥1,588 ¥1,647 ¥1,417
Thousands of U.S. dollars
As of March 31, 2018Due in
one year or lessDue after one yearthrough five years
Due after five yearsthrough ten years
Due afterten years
Assets:Cash on hand and in banks $229,915 $ — $ — $ —Notes and accounts receivable 272,387 — — —Marketable securities and investment securities 219,274 13,000 20,396 12,255Total $721,575 $13,000 $20,396 $12,255
Note 06 Securities
The acquisition cost, carrying amount, and gross unrealized holding gains and losses for securities with fair value by security type at March 31, 2017 and 2018 are as follows:
Millions of yen
2018
Acquisition cost Carrying amountGross unrealized
holding gains Gross unrealized holding losses
Equity securities ¥18,115 ¥ 69,658 ¥51,634 ¥ 91Corporate debt securities 1,350 1,347 5 7Other 30,689 31,703 1,092 78Total ¥50,155 ¥102,709 ¥52,732 ¥178
Notes to the Consolidated Financial Statements

Annual Report 2018 KISSEI 41
Note 07 Inventories
Inventories at March 31, 2017 and 2018 are as follows:
Millions of yen Thousands of U.S. dollars
2018 2017 2018Merchandise ¥ 1,439 ¥ 1,340 $ 13,575Finished goods 2,559 3,109 24,142Work-in-process 2,043 1,540 19,274Raw materials 9,274 10,439 87,491Supplies 614 296 5,792Total ¥15,933 ¥16,726 $150,311
Millions of yen
2017
Acquisition cost Carrying amountGross unrealized
holding gains Gross unrealized holding losses
Equity securities ¥18,266 ¥48,128 ¥29,867 ¥ 5Corporate debt securities 1,350 1,320 — 29Other 28,362 28,861 558 59Total ¥47,979 ¥78,310 ¥30,426 ¥94
Thousands of U.S. dollars
2018
Acquisition cost Carrying amountGross unrealized
holding gains Gross unrealized holding losses
Equity securities $170,896 $657,151 $487,113 $ 858Corporate debt securities 12,736 12,708 47 66Other 289,519 299,085 10,302 736Total $473,160 $968,953 $497,472 $1,679
Unlisted stocks are not included in the preceding tables because there were no quoted market prices available and it is extremely difficult to deter-mine the fair value.
Sales proceeds of securities classified as other securities and the gross realized gains and losses for the years ended March 31, 2017 and 2018 are as follows:
Millions of yen Thousands of U.S. dollars
2018 2017 2018Sales proceeds ¥528 ¥1,449 $4,981Gross realized gains 320 652 3,019Gross realized losses — — —
Note 08 Short-Term Bank Loans and Long-Term Debt
Short-term bank loans outstanding at March 31, 2017 and 2018 represent one-year notes issued by the Companies to banks. Short-term bank loans made during the years ended March 31, 2017 and 2018 bore interest at an average annual rate of 1.08% and 1.08%, respectively.
Long-term debt outstanding of the Companies at March 31, 2017 and 2018 are as follows:
Millions of yen Thousands of U.S. dollars
2018 2017 2018Non-secured loans with financial institutions, bearing interest at rates ranging from 0.00% to 2.20% due from 2017 to 2020 ¥1,904 ¥1,726 $17,962Less: current maturities due within one year (27) (70) (255)Total ¥1,876 ¥1,656 $17,698
The aggregate annual maturities of long-term debt outstanding at March 31, 2018 are as follows:
Year ending March 31 Millions of yen Thousands of U.S. dollars
2020 ¥18 $1702021 — —2022 — —2023 — —
* As approval dates for successful development projects and the like are not yet fixed, borrowings of ¥1,858 million ($17,528 thousand) from the Japan Agency for Medical Research and Development, a National Research and Development Agency, are not included in the preceding scheduled repayment amounts.
Notes to the Consolidated Financial Statements
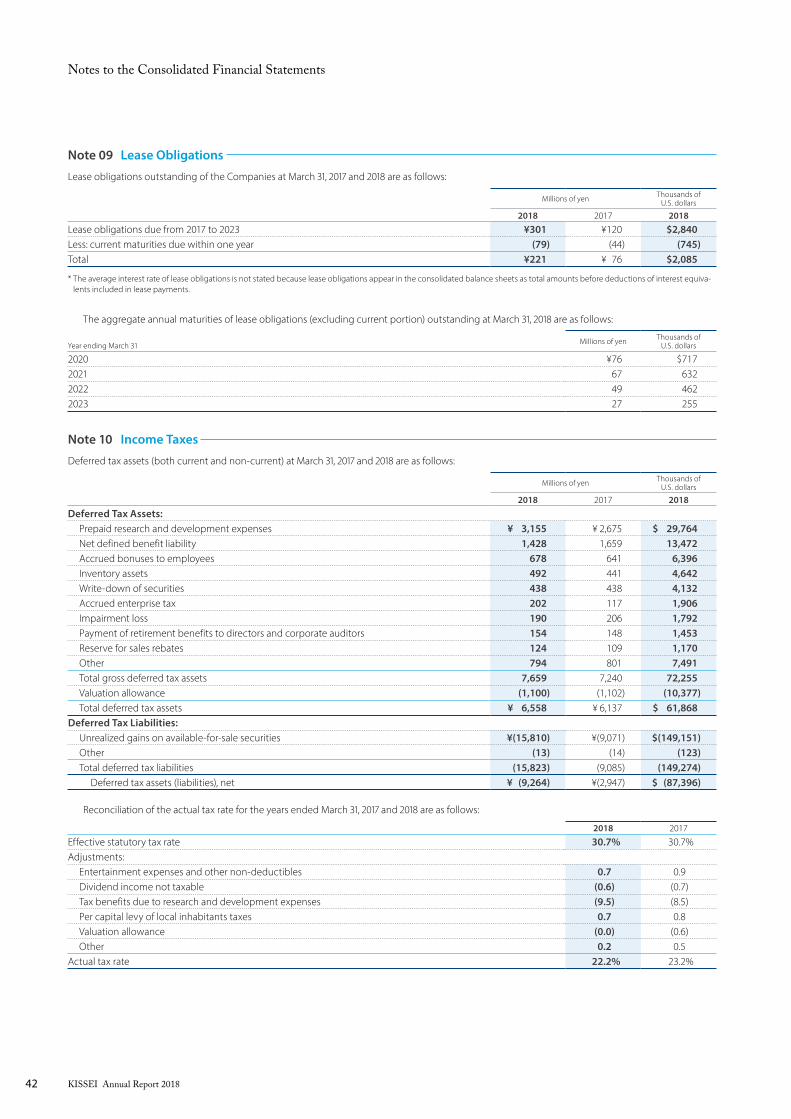
KISSEI Annual Report 2018 42
Note 10 Income Taxes
Deferred tax assets (both current and non-current) at March 31, 2017 and 2018 are as follows:
Millions of yen Thousands of U.S. dollars
2018 2017 2018Deferred Tax Assets: Prepaid research and development expenses ¥ 3,155 ¥ 2,675 $ 29,764 Net defined benefit liability 1,428 1,659 13,472 Accrued bonuses to employees 678 641 6,396 Inventory assets 492 441 4,642 Write-down of securities 438 438 4,132 Accrued enterprise tax 202 117 1,906 Impairment loss 190 206 1,792 Payment of retirement benefits to directors and corporate auditors 154 148 1,453 Reserve for sales rebates 124 109 1,170 Other 794 801 7,491 Total gross deferred tax assets 7,659 7,240 72,255 Valuation allowance (1,100) (1,102) (10,377) Total deferred tax assets ¥ 6,558 ¥ 6,137 $ 61,868Deferred Tax Liabilities: Unrealized gains on available-for-sale securities ¥(15,810) ¥(9,071) $(149,151) Other (13) (14) (123) Total deferred tax liabilities (15,823) (9,085) (149,274) Deferred tax assets (liabilities), net ¥ (9,264) ¥(2,947) $ (87,396)
Reconciliation of the actual tax rate for the years ended March 31, 2017 and 2018 are as follows:
2018 2017
Effective statutory tax rate 30.7% 30.7% Adjustments: Entertainment expenses and other non-deductibles 0.7 0.9 Dividend income not taxable (0.6) (0.7) Tax benefits due to research and development expenses (9.5) (8.5) Per capital levy of local inhabitants taxes 0.7 0.8 Valuation allowance (0.0) (0.6) Other 0.2 0.5Actual tax rate 22.2% 23.2%
Note 09 Lease Obligations
Lease obligations outstanding of the Companies at March 31, 2017 and 2018 are as follows:
Millions of yen Thousands of U.S. dollars
2018 2017 2018Lease obligations due from 2017 to 2023 ¥301 ¥120 $2,840Less: current maturities due within one year (79) (44) (745)Total ¥221 ¥ 76 $2,085
* The average interest rate of lease obligations is not stated because lease obligations appear in the consolidated balance sheets as total amounts before deductions of interest equiva-lents included in lease payments.
The aggregate annual maturities of lease obligations (excluding current portion) outstanding at March 31, 2018 are as follows:
Year ending March 31 Millions of yen Thousands of U.S. dollars
2020 ¥76 $7172021 67 6322022 49 4622023 27 255
Notes to the Consolidated Financial Statements

Annual Report 2018 KISSEI 43
Note 11 Funded Defined Benefits Plans
General Outline of Retirement Benefits Plans ImplementedThe Companies have introduced cash balance plans into their defined benefits corporate pension plans. In certain cases, the Group pays additional retirement benefits for employees that are not included in the retirement benefit obligations determined actuarially in accordance with the accounting standard for retirement benefits.
For the years ended March 31, 2017 and 2018(i) Reconciliation of defined benefit obligation at beginning and end of period
Millions of yen Thousands of U.S. dollars
2018 2017 2018Defined benefit obligation at beginning of period ¥21,021 ¥20,652 $198,311Service cost 861 792 8,123Interest cost 61 61 575Actuarial gains and losses incurred this period (5) 93 (47)Retirement benefits paid (426) (579) (4,019)Defined benefit obligation at end of period ¥21,511 ¥21,021 $202,934
(ii) Reconciliation of balance of plan assets at beginning and end of period
Millions of yen Thousands of U.S. dollars
2018 2017 2018Plan assets at beginning of period ¥15,641 ¥14,638 $147,557Expected return on plan assets 391 365 3,689Actuarial gains and losses incurred this period 253 201 2,387Employer contribution 1,028 1,014 9,698Retirement benefits paid (426) (579) (4,019)Plan assets at end of period ¥16,887 ¥15,641 $159,311
(iii) Reconciliation of defined benefit obligation and plan assets with net defined benefit liability and asset reflected on the consolidated balance sheets
Millions of yen Thousands of U.S. dollars
2018 2017 2018Defined benefit obligation for funded plan ¥ 21,511 ¥ 21,021 $ 202,934Plan assets (16,887) (15,641) (159,311)Net amount of defined benefit liability and asset on the consolidated balance sheets ¥ 4,623 ¥ 5,379 $ 43,613
Defined benefit liability 4,623 5,379 43,613Net amount of defined benefit liability and asset on the consolidated balance sheets ¥ 4,623 ¥ 5,379 $ 43,613
(iv) The components of retirement benefit expense
Millions of yen Thousands of U.S. dollars
2018 2017 2018Service cost ¥ 861 ¥ 792 $ 8,123Interest cost 61 61 575Expected return on plan assets (391) (365) (3,689)Amortization of actuarial gains and losses 660 753 6,226Amortization of prior service cost (255) (255) (2,406)Other 24 35 226Retirement benefit expense ¥ 960 ¥1,021 $ 9,057
(v) The components of retirement benefit liability adjustment included in other comprehensive income (before tax effect)
Millions of yen Thousands of U.S. dollars
2018 2017 2018Prior service cost ¥(255) ¥(255) $(2,406)Actuarial gains and losses 919 860 8,670Total ¥ 664 ¥ 605 $ 6,264
Notes to the Consolidated Financial Statements
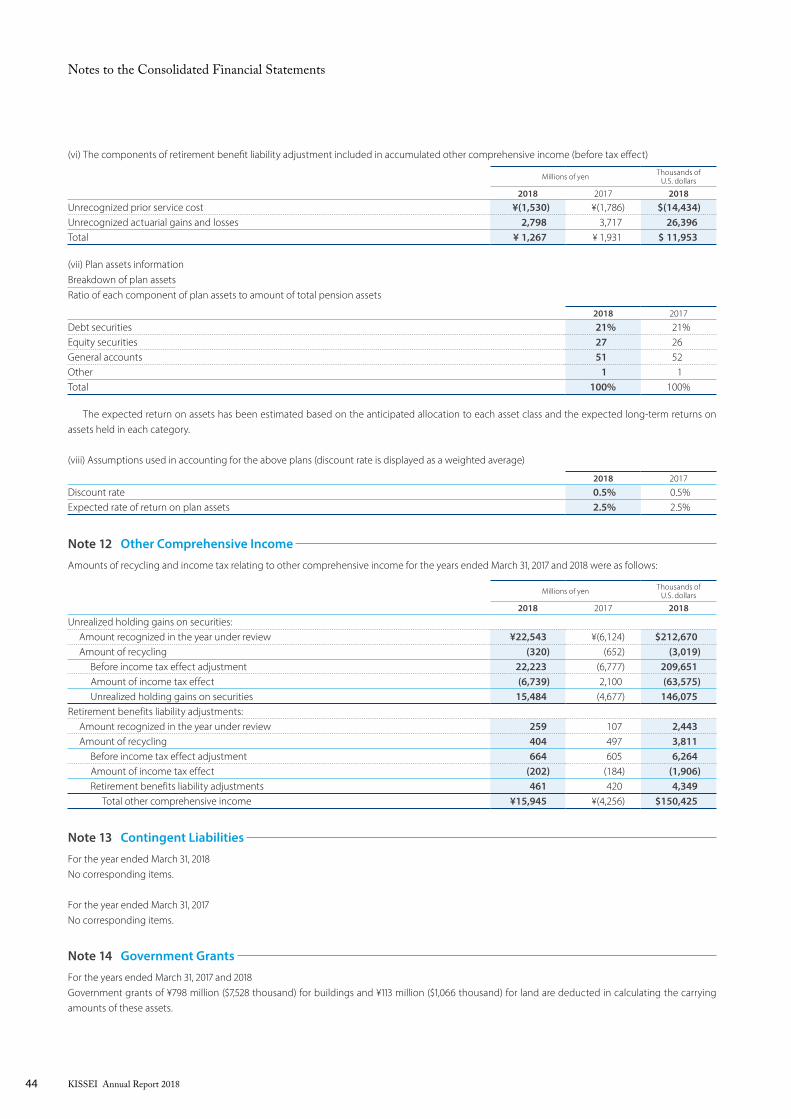
KISSEI Annual Report 2018 44
Note 12 Other Comprehensive Income
Amounts of recycling and income tax relating to other comprehensive income for the years ended March 31, 2017 and 2018 were as follows:
Millions of yen Thousands of U.S. dollars
2018 2017 2018Unrealized holding gains on securities: Amount recognized in the year under review ¥22,543 ¥(6,124) $212,670 Amount of recycling (320) (652) (3,019) Before income tax effect adjustment 22,223 (6,777) 209,651 Amount of income tax effect (6,739) 2,100 (63,575) Unrealized holding gains on securities 15,484 (4,677) 146,075Retirement benefits liability adjustments: Amount recognized in the year under review 259 107 2,443 Amount of recycling 404 497 3,811 Before income tax effect adjustment 664 605 6,264 Amount of income tax effect (202) (184) (1,906) Retirement benefits liability adjustments 461 420 4,349 Total other comprehensive income ¥15,945 ¥(4,256) $150,425
Note 13 Contingent Liabilities
For the year ended March 31, 2018No corresponding items.
For the year ended March 31, 2017No corresponding items.
Note 14 Government Grants
For the years ended March 31, 2017 and 2018Government grants of ¥798 million ($7,528 thousand) for buildings and ¥113 million ($1,066 thousand) for land are deducted in calculating the carrying amounts of these assets.
(vi) The components of retirement benefit liability adjustment included in accumulated other comprehensive income (before tax effect)
Millions of yen Thousands of U.S. dollars
2018 2017 2018Unrecognized prior service cost ¥(1,530) ¥(1,786) $(14,434)Unrecognized actuarial gains and losses 2,798 3,717 26,396Total ¥ 1,267 ¥ 1,931 $ 11,953
(vii) Plan assets informationBreakdown of plan assetsRatio of each component of plan assets to amount of total pension assets
2018 2017
Debt securities 21% 21%Equity securities 27 26General accounts 51 52Other 1 1Total 100% 100%
The expected return on assets has been estimated based on the anticipated allocation to each asset class and the expected long-term returns on assets held in each category.
(viii) Assumptions used in accounting for the above plans (discount rate is displayed as a weighted average)
2018 2017
Discount rate 0.5% 0.5%Expected rate of return on plan assets 2.5% 2.5%
Notes to the Consolidated Financial Statements

Annual Report 2018 KISSEI 45
Note 15 Segment Information
(1) Overview of Reportable SegmentsThe Reportable segments of the Companies are components for which discrete financial information is available and whose operating results are regu-larly reviewed by the Board of Directors to make decisions about resource allocation and to assess their performance. As the Companies’ primary business is the pharmaceutical business, its reportable segment is the pharmaceuticals segment.
(2) Method of Calculating Sales and Profit (Loss), Identifiable Assets / Liabilities, and Other Items by Reportable SegmentThe accounting procedure for Reportable segments is the same as that described in Note 02 Summary of Significant Accounting Policies. Segment profit is calculated based on operating income. Intersegment sales are recognized based on the price in an arm’s-length transaction.
(3) Information on Sales and Profit (Loss), Identifiable Assets / Liabilities, and Other Items by Reportable Segment
Millions of yen
Reportable segments
As of March 31, 2018 Pharmaceuticals Total Other*1 Total
Net sales: Sales to third parties ¥ 63,891 ¥ 63,891 ¥10,118 ¥ 74,009 Intersegment sales and transfers — — 5,124 5,124 Total ¥ 63,891 ¥ 63,891 ¥15,242 ¥ 79,134Segment profit ¥ 9,205 ¥ 9,205 ¥ 632 ¥ 9,837Segment assets ¥202,977 ¥202,977 ¥11,887 ¥214,865Other items: Depreciation*2 ¥ 2,290 ¥ 2,290 ¥ 366 ¥ 2,656 Increase of property, plant and equipment and intangible assets*2 2,449 2,449 497 2,947
*1: The Other segment is not a reportable segment; it includes sales of materials and other goods, information solution services, and construction subcontracting.*2: Depreciation includes the amortization of long-term prepaid expenses. Increase of property, plant and equipment and intangible assets reflects the increase in long-term
prepaid expenses.
Millions of yen
Reportable segments
As of March 31, 2017 Pharmaceuticals Total Other*1 Total
Net sales: Sales to third parties ¥ 61,454 ¥ 61,454 ¥10,251 ¥ 71,706 Intersegment sales and transfers — — 4,975 4,975 Total ¥ 61,454 ¥ 61,454 ¥15,227 ¥ 76,682Segment profit ¥ 7,670 ¥ 7,670 ¥ 744 ¥ 8,415Segment assets ¥178,393 ¥178,393 ¥10,618 ¥189,011Other items: Depreciation*2 ¥ 2,182 ¥ 2,182 ¥ 337 ¥ 2,519 Increase of property, plant and equipment and intangible assets*2 2,419 2,419 411 2,830
*1: The Other segment is not a reportable segment; it includes sales of materials and other goods, information solution services, and construction subcontracting.*2: Depreciation includes the amortization of long-term prepaid expenses. Increase of property, plant and equipment and intangible assets reflects the increase in long-term
prepaid expenses.
Thousands of U.S. dollars
Reportable segments
As of March 31, 2018 Pharmaceuticals Total Other*1 Total
Net sales: Sales to third parties $ 602,745 $ 602,745 $ 95,453 $ 698,198 Intersegment sales and transfers — — 48,340 48,340 Total $ 602,745 $ 602,745 $143,792 $ 746,547Segment profit $ 86,840 $ 86,840 $ 5,962 $ 92,802Segment assets $1,914,877 $1,914,877 $112,142 $2,027,028Other items: Depreciation*2 $ 21,604 $ 21,604 $ 3,453 $ 25,057 Increase of property, plant and equipment and intangible assets*2 23,104 23,104 4,689 27,802
*1: The Other segment is not a reportable segment; it includes sales of materials and other goods, information solution services, and construction subcontracting.*2: Depreciation includes the amortization of long-term prepaid expenses. Increase of property, plant and equipment and intangible assets reflects the increase in long-term
prepaid expenses.
Notes to the Consolidated Financial Statements

KISSEI Annual Report 2018 46
(4) Reconciliation Items between Segment Information and the Consolidated Financial Statements(i) Major items for adjustments
Millions of yen Thousands of U.S. dollars
2018 2017 2018Net sales: Total of reportable segments ¥ 63,891 ¥ 61,454 $ 602,745 Other segments 15,242 15,227 143,792 Elimination of intersegment transactions (5,124) (4,975) (48,340)Reported on consolidated financial statements ¥ 74,009 ¥ 71,706 $ 698,198Segment profit: Total of reportable segments ¥ 9,205 ¥ 7,670 86,840 Other segments 632 744 5,962 Elimination of intersegment transactions 65 54 613 Adjustments to depreciable assets (22) 17 (208) Other adjustments 7 4 66Reported on consolidated financial statements ¥ 9,887 ¥ 8,491 $ 93,274Segment assets: Total of reportable segments ¥202,977 ¥178,393 $1,914,877 Other segments 11,887 10,618 112,142 Elimination of intersegment transactions (1,777) (2,210) (16,764)Reported on consolidated financial statements ¥213,087 ¥186,801 $2,010,255
(ii) Other items for adjustments
Millions of yen Thousands of U.S. dollars
2018 2017 2018Depreciation: Total of reportable segments ¥2,290 ¥2,182 $21,604 Other segments 366 337 3,453 Adjustments (163) (148) (1,538)Reported on consolidated financial statements ¥2,492 ¥2,370 $23,509Increase of property, plant and equipment and intangible assets: Total of reportable segments ¥2,449 ¥2,419 $23,104 Other segments 497 411 4,689 Adjustments (301) (14) (2,840)Reported on consolidated financial statements ¥2,645 ¥2,815 $24,953
(5) Related Information(i) Product and service information
Millions of yen Thousands of U.S. dollars
2018 2017 2018Pharmaceuticals ¥63,891 ¥61,454 $602,745Other 10,118 10,251 95,453Total ¥74,009 ¥71,706 $698,198
(ii) Geographical information (1) Net sales
Millions of yen Thousands of U.S. dollars
2018 2017 2018Japan ¥65,666 ¥65,387 $619,491Europe 5,402 3,419 50,962Other 2,941 2,899 27,745Total ¥74,009 ¥71,706 $698,198
(2) Property, plant and equipment There are no corresponding items as the Companies do not possess any property, plant or equipment outside of Japan.
Notes to the Consolidated Financial Statements

Annual Report 2018 KISSEI 47
(iii) Major customer information
Millions of yen Thousands of U.S. dollars
2018 2017 2018Alfresa Corporation ¥11,797 ¥11,539 $111,292SUZUKEN CO., LTD. 10,455 10,178 98,632MEDICEO CORPORATION 8,027 8,026 75,726
* Related segment for each major customer is the pharmaceuticals segment.
(6) Information on Loss on Impairment of Property, Plant and Equipment by Reportable SegmentFor the year ended March 31, 2018No corresponding items.
For the year ended March 31, 2017
Millions of yen
Reportable segment
Pharmaceuticals Total Other* Total
Impairment loss 47 47 — 47
* The Other segment is not a reportable segment; it includes sales of materials and other goods, information solution services, and construction subcontracting.
(7) Information on Amortization of Goodwill and Remaining Unamortized Balance by Reportable SegmentFor the years ended March 31, 2017 and 2018No corresponding items.
(8) Information on the Remaining Balance and Gain on Negative Goodwill by Reportable SegmentFor the years ended March 31, 2017 and 2018No corresponding items.
Note 16 Related Party Transactions
(1) Transaction with Companies in which Executives and Their Close Relations Own a Majority of Voting Rights, etc.For the year ended March 31, 2018
Category
Name/ Name of
Company Location
Common stock or Investments
in capital (millions of yen)
Type of business or occupation
Ratio of voting rights holding
(held)*1 (%)
Relationship with related
partyDetails of
transaction
Transaction amount
(millions of yen) (thousands of U.S. dollars) Account
Outstanding amount at the end of the year
(millions of yen) (thousands of U.S. dollars)
Companies in which executives and their close relations own a
majority of voting rights
Kanzawa Limited
Matsumoto City,
Nagano Prefecture
10
Real estate rental,
insurance agency
6.6 (held) —Acquisition of treasury
stock*2¥4,183 $39,462 — — —
*1: Ratio of voting rights holding (held) is based on total shares issued net of treasury stock.*2: Terms and conditions of the transaction and its policies: The above transaction was conducted through the Tokyo Stock Exchange Trading Network System for Off-Auction Own
Share Repurchase Trading (ToSTNeT-3).
For the year ended March 31, 2017No corresponding items.
(2) Transaction with Executives of Important Subsidiaries and Their Close Relations, etc.For the year ended March 31, 2018
Category
Name/ Name of
Company Location
Common stock or Investments
in capital (millions of yen)
Type of business or occupation
Ratio of voting rights holding
(held) (%)
Relationship with related
partyDetails of
transaction
Transaction amount
(millions of yen) (thousands of U.S. dollars) Account
Outstanding amount at the end of the year
(millions of yen) (thousands of U.S. dollars)
Executives of important subsidiaries and their
close relations
Yuki Kanzawa — — — — *1
Acquisition of treasury
stock*2¥278 $2,622 — — —
*1: He is a close relative of the president and representative director of KISSEI COMTEC CO., LTD., Eiji Kanzawa*2: Terms and conditions of the transaction and its policies: The above transaction was conducted through the Tokyo Stock Exchange Trading Network System for Off-Auction Own
Share Repurchase Trading (ToSTNeT-3).
For the year ended March 31, 2017No corresponding items.
Notes to the Consolidated Financial Statements

KISSEI Annual Report 2018 48
Notes to the Consolidated Financial Statements
Note 17 Selling, General and Administrative Expenses
Selling, general and administrative expenses for the years ended March 31, 2017 and 2018 are as follows:
Millions of yen Thousands of U.S. dollars
2018 2017 2018Payroll costs ¥ 9,399 ¥ 9,512 $ 88,670Research and development expenses 14,179 13,877 133,764Depreciation 784 695 7,396Other 13,869 14,054 130,840Total ¥38,232 ¥38,140 $360,679
Note 18 Amounts Per Share
Amounts per share as of March 31, 2017 and 2018 are as follows:
Yen U.S. dollars
2018 2017 2018Net assets ¥3,761.03 ¥3,258.76 $35.48Profit attributable to owners of parent 188.26 158.74 1.78Cash dividends 48.0 46.0 0.45
Diluted profit attributable to owners of parent per share is not presented because there are no dilutive potential of shares of common stock. Net assets per share are computed based on the net assets excluding non-controlling interests and the number of common stock outstanding at the year end. Profit attributable to owners of parent per share is computed based on the profit attributable to owners of parent and the average number of shares of common stock outstanding during the year. Cash dividends per share represent the cash dividends proposed by the Board of Directors together with the interim cash dividends paid.
Note 19 Subsequent Events
No corresponding items.

Annual Report 2018 KISSEI 49
Independent Auditor’s Report

KISSEI Annual Report 2018 50
Company NameKISSEI PHARMACEUTICAL CO., LTD.
EstablishedAugust 9, 1946
Capital¥24,356 million
Number of Employees1,512 (Non-consolidated)
URLhttps://www.kissei.co.jp/e_contents/
As of March 31, 2018
Corporate Information
Head Offices
Head Office19-48, Yoshino, Matsumoto, Nagano 399-8710, Japan +81-263-25-9081
Tokyo Head Office8-9, Nihonbashi-Muromachi 1-chome, Chuo-ku, Tokyo 103-0022, Japan +81-3-3279-2761
Tokyo Head Office (Koishikawa)1-3, Koishikawa 3-chome, Bunkyo-ku, Tokyo 112-0002, Japan +81-3-5684-3530
Laboratories
Central Research Laboratories4365-1, Hotakakashiwabara, Azumino, Nagano 399-8304, Japan
Safety Research Laboratories2320-1, Hotakamaki, Azumino, Nagano 399-8305, Japan
Pharmaceutical Laboratories4365-1, Hotakakashiwabara, Azumino, Nagano 399-8304, Japan
Joetsu Chemical Laboratories197-5, Kamikichi, Kubiki-ku, Joetsu, Niigata 942-0145, Japan
Plants
Matsumoto Plants19-48, Yoshino, Matsumoto, Nagano 399-8710, Japan
Shiojiri Plants9637-5, Kataoka, Shiojiri, Nagano 399-0711, Japan
Centers
Nutritional Business Center9637-6, Kataoka, Shiojiri, Nagano 399-0711, Japan
Information Center4010-10, Wada, Matsumoto, Nagano 390-1293, Japan
Subsidiaries
Consolidated SubsidiariesKISSEI SHOJI CO., LTD.1-1, Hiratahigashi 2-chome, Matsumoto, Nagano 399-0014, Japan
KISSEI COMTEC CO., LTD.4010-10, Wada, Matsumoto, Nagano 390-1293, Japan
HASHIBA TECHNOS CO., LTD.1-1, Hiratahigashi 2-chome, Matsumoto, Nagano 399-0014, Japan
Unconsolidated SubsidiariesKISSEI AMERICA, INC.400 Kelby Street, 16FL Fort Lee, NJ 07024, USA+1-201-363-4630
Corporate Data
Major Business Locations/Consolidated Subsidiaries
Head Office

51Annual Report 2018 KISSEI
Principal Shareholders
Number of shares held (hundreds) Voting rights (%)
The Dai-ichi Life Insurance Company, Limited 32,000 6.8
Japan Trustee Services Bank, Ltd. (Trust account) 27,226 5.8
The Hachijuni Bank, Ltd. 24,132 5.2
Mizuho Bank, Ltd. 18,334 3.9
Kanzawa Limited 16,782 3.6
The Master Trust Bank of Japan, Ltd. (Trust account) 16,338 3.5
Mutsuo Kanzawa 15,406 3.3
Kissei Group Employee Stockholders Committee 12,790 2.7
Nabelin Co., Ltd. 12,223 2.6
THE NAGANO BANK, LTD 11,260 2.4
Note: Kissei holds 50,947 hundred shares of treasury stock but is not included in the above list of principal shareholders. Further, the calculation of voting rights percentages is based on total shares issued net of treasury stock.
Composition of Shareholders by Category
Stock Price Range / Trading Volume
Composition of Shareholders by Number of Shares Held
Securities companies: 28/ 255 thousand shares (0.5%)
Financial institutions: 50/ 18,470 thousand shares (35.7%)
Other companies: 180/ 12,170 thousand shares (23.5%)
Non-Japanese institutions and individuals: 230/ 8,514 thousand shares (16.4%)
Individuals and others: 3,328/ 12,400 thousand shares (23.9%)
1–999 shares: 2,330/ 542 thousand shares (1.1%)
1,000–9,999 shares: 1,237/ 2,764 thousand shares (5.3%) 10,000–99,999 shares: 178/ 5,109 thousand shares (9.9%)
100,000–999,999 shares: 60/ 19,650 thousand shares (37.9%) 1,000,000 and over shares: 11/ 23,744 thousand shares (45.8%)
As of March 31, 2018
Investor Information
Stock Exchange ListingTokyo
Stock Code4547
Common StockAuthorized 227,000,000 shares
Issued 51,811,185 shares
Number of Shareholders 3,816
(Year-on-year change: 10 decrease)
0
500
1,000
1,500
2,000
2,500
3,000
3,500
4,000
0
1,000
2,000
3,000
4,000
16/4 5 6 7 8 9 10 11 12 17/1 2 3 4 5 6 7 8 9 10 11 12 18/1 2 3
Stock Price (Yen) Trading Volume (Thousands of shares)

Printed in Japan
19-48, Yoshino, Matsumoto, Nagano 399-8710, Japan
In consideration of environmental concerns, this report is printed on FSC®-certified paper using the waterless printing process and vegetable oil ink.