ANNUAL REPORT 2017 - tomony-hd.co.jp · - 1 - For the Fiscal Year Ended March 31, 2017 ANNUAL...
25
- 1 - For the Fiscal Year Ended March 31, 2017 ANNUAL REPORT 2017 TOMONY Holdings, Inc. Corporate Message On behalf of TOMONY Holdings Group (the “Group”), we would like to express our sincere gratitude to everyone for your support. As of April 2017, TOMONY Holdings, Inc. (the “Company”) reached the seventh year since it was established as a financial holding company of THE TOKUSHIMA BANK, LTD. and THE KAGAWA BANK, LTD., in April 2010. In April 2016, after THE TAISHO BANK, LTD. was newly added to the Group, we started the third phase of its management plan as a new TOMONY Holdings Group and the Group are striving to improve its corporate value of the Group, aiming to be “a growing regional financial group,” with the cooperation and coordination of each Group company, through the development of the four basic strategies of “deepening relationships”, “strengthening group financial functions”, “strengthening group organization capabilities” and “strengthening earnings and financial base”. We will continue to further evolve a regional financial group, and by utilizing wide area network, sharing and utilizing each strength and know-how, realize growth strategy and provide high value added financial services, we will contribute to regional creation the development of the regional economy. We ask for your continued and undying support for the year ahead and beyond.
Transcript of ANNUAL REPORT 2017 - tomony-hd.co.jp · - 1 - For the Fiscal Year Ended March 31, 2017 ANNUAL...

- 1 -
For the Fiscal Year Ended March 31, 2017
ANNUAL REPORT 2017
TOMONY Holdings, Inc.
Corporate Message On behalf of TOMONY Holdings Group (the “Group”), we would like to express our sincere gratitude to
everyone for your support.
As of April 2017, TOMONY Holdings, Inc. (the “Company”) reached the seventh year since it was
established as a financial holding company of THE TOKUSHIMA BANK, LTD. and THE KAGAWA
BANK, LTD., in April 2010.
In April 2016, after THE TAISHO BANK, LTD. was newly added to the Group, we started the third phase
of its management plan as a new TOMONY Holdings Group and the Group are striving to improve its
corporate value of the Group, aiming to be “a growing regional financial group,” with the cooperation and
coordination of each Group company, through the development of the four basic strategies of “deepening
relationships”, “strengthening group financial functions”, “strengthening group organization capabilities”
and “strengthening earnings and financial base”.
We will continue to further evolve a regional financial group, and by utilizing wide area network, sharing
and utilizing each strength and know-how, realize growth strategy and provide high value added financial
services, we will contribute to regional creation the development of the regional economy.
We ask for your continued and undying support for the year ahead and beyond.

- 2 -
1. Summary of Selected Financial Data (Consolidated)
6th fiscal year 7th fiscal year
As of March 31, 2016 and
from April 1, 2015 to March 31, 2016
As of March 31, 2017 and from April 1, 2016 to March 31, 2017
Consolidated ordinary income (Millions of yen)
60,962 71,494
Consolidated ordinary profit (Millions of yen)
13,070 16,326
Profit attributable to owners of parent (Millions of yen)
7,931 25,810
Consolidated comprehensive income (Millions of yen)
910 25,294
Consolidated net assets (Millions of yen)
183,814 211,824
Consolidated total assets (Millions of yen)
3,080,000 3,620,611
Net assets per share (Yen)
1,200.70 1,284.39
Basic earnings per share (Yen)
52.90 159.31
Diluted earnings per share (Yen)
52.20 156.91
Capital adequacy ratio (%)
5.85 5.75
Consolidated return on equity (ROE) (%)
4.39 13.27
Consolidated price earnings ratio (PER) (Times)
6.29 3.70
Net cash provided by (used in) operating activities
(Millions of yen)
128,610 (57,293)
Net cash provided by (used in) investing activities
(Millions of yen)
(60,363) 73,524
Net cash provided by (used in) financing activities
(Millions of yen)
(1,057) (1,649)
Cash and cash equivalents at end of period (Millions of yen)
167,836 233,847
Number of employees [Separately, average number of temporary employees]
(Persons)
2,062[319]
2,403 [342]
Notes: 1. Consumption tax and local consumption tax of the Company and its consolidated subsidiaries are accounted for based on the tax exclusion method.
2. The consolidated capital adequacy ratio is calculated by dividing “(total net assets at end of period – subscription rights to shares at end of period – non-controlling interests at end of period)” by “total assets at end of period.”

- 3 -
2. Financial Statements
[TOMONY Holdings, Inc.]
(1) Consolidated Balance Sheet
(Millions of yen) (Thousands of
U.S. dollars)
As of March 31,
2016 As of March 31,
2017 As of March 31,
2017
Assets
Cash and due from banks 187,931 245,944 2,192,216
Trading account securities 372 466 4,161
Money held in trust 5,447 5,429 48,394
Securities 811,256 786,480 7,010,255
Loans and bills discounted 2,022,508 2,525,015 22,506,601
Foreign exchanges 4,179 3,428 30,558
Lease receivables and investment assets 8,393 8,561 76,309
Other assets 23,775 23,084 205,758
Tangible fixed assets 30,486 32,290 287,815
Buildings, net 11,623 12,634 112,613
Land 15,815 16,501 147,089
Leased assets, net 974 830 7,404
Construction in progress 136 268 2,392
Other tangible fixed assets 1,936 2,054 18,315
Intangible fixed assets 125 3,679 32,799
Software 0 3,549 31,636
Leased assets 10 6 58
Other intangible fixed assets 113 123 1,104
Net defined benefit asset 1,167 2,478 22,088
Deferred tax assets 765 826 7,364
Customers’ liabilities for acceptances and guarantees 6,180 6,866 61,202
Allowance for loan losses (22,591) (23,939) (213,386)
Total assets 3,080,000 3,620,611 32,272,142
Liabilities
Deposits 2,704,251 3,206,424 28,580,306
Negotiable certificates of deposit 52,883 56,143 500,430
Call money and bills sold 59,500 35,000 311,970
Borrowed money 43,796 70,976 632,648
Foreign exchanges 205 6 58
Other liabilities 22,405 26,368 235,033
Provision for bonuses 337 541 4,824
Provision for directors’ bonuses 76 92 824
Net defined benefit liability 362 295 2,634
Provision for reimbursement of deposits 444 470 4,197
Provision for contingent loss 150 135 1,205
Deferred tax liabilities 4,665 4,553 40,585
Deferred tax liabilities for land revaluation 926 912 8,135
Acceptances and guarantees 6,180 6,866 61,202
Total liabilities 2,896,185 3,408,787 30,384,058

- 4 -
(Millions of yen) (Thousands of
U.S. dollars)
As of March 31,
2016 As of March 31,
2017 As of March 31,
2017
Net assets
Capital stock 25,000 25,000 222,836
Capital surplus 21,886 25,974 231,518
Retained earnings 111,800 136,321 1,215,096
Treasury shares (776) (500) (4,457)
Total shareholders’ equity 157,910 186,795 1,664,993
Valuation difference on available-for-sale securities 21,357 20,104 179,197
Deferred gains or losses on hedges 0 0 5
Revaluation reserve for land 1,622 1,590 14,173
Remeasurements of defined benefit plans (502) (6) (61)
Total accumulated other comprehensive income 22,477 21,688 193,315
Subscription rights to shares 770 935 8,340
Non-controlling interests 2,655 2,404 21,434
Total net assets 183,814 211,824 1,888,084
Total liabilities and net assets 3,080,000 3,620,611 32,272,142

- 5 -
(2) Consolidated Statement of Income and Consolidated Statement of Comprehensive
Income
Consolidated Statement of Income
(Millions of yen) (Thousands of
U.S. dollars)
Fiscal year
ended March 31, 2016
Fiscal year ended
March 31, 2017
Fiscal year ended
March 31, 2017
Ordinary income 60,962 71,494 637,258
Interest income 44,089 51,024 454,802
Interest on loans and discounts 34,256 39,914 355,776
Interest and dividends on securities 9,597 10,882 96,999
Interest on call loans and bills bought 46 5 47
Interest on deposits with banks 162 198 1,770
Other interest income 27 23 208
Fees and commissions 6,810 7,946 70,827
Other ordinary income 7,056 8,443 75,258
Other income 3,006 4,080 36,369
Recoveries of written off claims 953 962 8,578
Other 2,052 3,117 27,790
Ordinary expenses 47,891 55,167 491,733
Interest expenses 2,185 2,563 22,854
Interest on deposits 1,925 2,220 19,792
Interest on negotiable certificates of deposit 89 44 400
Interest on call money and bills sold 0 75 673
Interest on borrowings and rediscounts 150 206 1,836
Other interest expenses 19 16 151
Fees and commissions payments 3,761 4,230 37,706
Other ordinary expenses 7,131 9,374 83,558
General and administrative expenses 29,482 35,897 319,969
Other expenses 5,330 3,101 27,644
Provision of allowance for loan losses 1,180 1,017 9,068
Other 4,149 2,084 18,576
Ordinary profit 13,070 16,326 145,524
Extraordinary income 4 14,880 132,632
Gain on disposal of non-current assets 4 30 275
Gain on bargain purchase – 14,849 132,357
Extraordinary losses 167 347 3,094
Loss on disposal of non-current assets 19 56 500
Impairment loss 147 285 2,545
Other – 5 49
Profit before income taxes 12,907 30,859 275,063
Income taxes - current 3,327 3,778 33,681
Income taxes - deferred 1,338 1,068 9,526
Total income taxes 4,666 4,847 43,208
Profit 8,240 26,011 231,854
Profit attributable to non-controlling interests 308 201 1,791
Profit attributable to owners of parent 7,931 25,810 230,063

- 6 -
Consolidated Statement of Comprehensive Income
(Millions of yen) (Thousands of
U.S. dollars)
Fiscal year
ended March 31, 2016
Fiscal year ended
March 31, 2017
Fiscal year ended
March 31, 2017
Profit 8,240 26,011 231,854
Other comprehensive income (7,330) (716) (6,390)
Valuation difference on available-for-sale securities (6,375) (1,212) (10,807)
Deferred gains or losses on hedges 1 (0) (0)
Revaluation reserve for land 48 – –
Remeasurements of defined benefit plans, net of tax (1,004) 495 4,417
Comprehensive income 910 25,294 225,464
Comprehensive income attributable to
Comprehensive income attributable to owners of parent 678 25,053 223,311
Comprehensive income attributable to non-controlling
interests 231 241 2,152

- 7 -
(3) Consolidated Statement of Changes in Net Assets
Fiscal year ended March 31, 2016
(Millions of yen)
Shareholders’ equity
Capital stock
Capital surplus
Retained earnings
Treasury shares
Total shareholders’
equity Balance at beginning of current period
25,000 21,886 105,067 (971) 150,982
Changes of items during period
Dividends of surplus (1,198) (1,198)
Profit attributable to owners of parent
7,931 7,931
Purchase of treasury shares
(0) (0)
Disposal of treasury shares
0 195 195
Net changes of items other than shareholders’ equity
Total changes of items during period
– 0 6,733 194 6,928
Balance at end of current period
25,000 21,886 111,800 (776) 157,910
Accumulated other comprehensive income
Valuation difference
on available- for-sale
securities
Deferred gains or losses on hedges
Revaluation reserve for
land
Remeasure-ments of defined
benefit plans
Total accumulated
other comprehensive
income
Subscription rights to shares
Non- controlling
interests Total net
assets
Balance at beginning of current period
27,656 (0) 1,573 501 29,731 614 2,425 183,753
Changes of items during period
Dividends of surplus (1,198)
Profit attributable to owners of parent
7,931
Purchase of treasury shares
(0)
Disposal of treasury shares
195
Net changes of items other than shareholders’ equity
(6,298) 1 48 (1,004) (7,253) 156 229 (6,867)
Total changes of items during period
(6,298) 1 48 (1,004) (7,253) 156 229 61
Balance at end of current period
21,357 0 1,622 (502) 22,477 770 2,655 183,814

- 8 -
Fiscal year ended March 31, 2017
(Millions of yen)
Shareholders’ equity
Capital stock
Capital surplus
Retained earnings
Treasury shares
Total shareholders’
equity Balance at beginning of current period 25,000 21,886 111,800 (776) 157,910
Changes of items during period
Dividends of surplus (1,322) (1,322)
Profit attributable to owners of parent
25,810 25,810
Purchase of treasury shares
(1) (1)
Disposal of treasury shares
5 277 283
Increase by share exchanges
3,760 3,760
Change in ownership interest of parent due to transactions with non-controlling shareholders
321 321
Reversal of revaluation reserve for land
32 32
Net changes of items other than shareholders’ equity
Total changes of items during period
– 4,087 24,520 276 28,884
Balance at end of current period
25,000 25,974 136,321 (500) 186,795
Accumulated other comprehensive income
Valuation difference
on available- for-sale
securities
Deferred gains or losses on hedges
Revaluation reserve for
land
Remeasure-ments of defined
benefit plans
Total accumulated
other comprehensive
income
Subscription rights to shares
Non- controlling
interests Total net
assets
Balance at beginning of current period
21,357 0 1,622 (502) 22,477 770 2,655 183,814
Changes of items during period
Dividends of surplus (1,322)
Profit attributable to owners of parent 25,810
Purchase of treasury shares (1)
Disposal of treasury shares 283
Increase by share exchanges 3,760
Change in ownership interest of parent due to transactions with non-controlling shareholders
321
Reversal of revaluation reserve for land
32
Net changes of items other than shareholders’ equity
(1,252) (0) (32) 495 (789) 165 (250) (875)
Total changes of items during period
(1,252) (0) (32) 495 (789) 165 (250) 28,009
Balance at end of current period
20,104 0 1,590 (6) 21,688 935 2,404 211,824

- 9 -
Fiscal year ended March 31, 2017
(Thousands of U.S. dollars)
Shareholders’ equity
Capital stock
Capital surplus
Retained earnings
Treasury shares
Total shareholders’
equity Balance at beginning of current period 222,836 195,085 996,530 (6,921) 1,407,529
Changes of items during period
Dividends of surplus (11,784) (11,784)
Profit attributable to owners of parent
230,063 230,063
Purchase of treasury shares
(10) (10)
Disposal of treasury shares
49 2,474 2,523
Increase by share exchanges
33,522 33,522
Change in ownership interest of parent due to transactions with non-controlling shareholders
2,861 2,861
Reversal of revaluation reserve for land
287 287
Net changes of items other than shareholders’ equity
Total changes of items during period
– 36,433 218,566 2,464 257,463
Balance at end of current period
222,836 231,518 1,215,096 (4,457) 1,664,993
Accumulated other comprehensive income
Valuation difference
on available- for-sale
securities
Deferred gains or losses on hedges
Revaluation reserve for
land
Remeasure-ments of defined
benefit plans
Total accumulated
other comprehensive
income
Subscription rights to shares
Non- controlling
interests Total net
assets
Balance at beginning of current period
190,365 6 14,461 (4,478) 200,354 6,868 23,667 1,638,419
Changes of items during period
Dividends of surplus (11,784)
Profit attributable to owners of parent 230,063
Purchase of treasury shares (10)
Disposal of treasury shares 2,523
Increase by share exchanges 33,522
Change in ownership interest of parent due to transactions with non-controlling shareholders
2,861
Reversal of revaluation reserve for land
287
Net changes of items other than shareholders’ equity
(11,168) (0) (287) 4,417 (7,039) 1,472 (2,232) (7,799)
Total changes of items during period (11,168) (0) (287) 4,417 (7,039) 1,472 (2,232) 249,664
Balance at end of current period 179,197 5 14,173 (61) 193,315 8,340 21,434 1,888,084

- 10 -
(4) Consolidated Statement of Cash Flows
(Millions of yen) (Thousands of
U.S. dollars)
Fiscal year ended March 31, 2016
Fiscal year ended March 31, 2017
Fiscal year ended March 31, 2017
Cash flows from operating activities
Profit before income taxes 12,907 30,859 275,063
Depreciation 1,560 2,224 19,828
Impairment loss 147 285 2,545
Gain on bargain purchase – (14,849) (132,357)
Increase (decrease) in allowance for loan losses (1,796) (611) (5,446)
Increase (decrease) in provision for bonuses 11 (6) (53)
Increase (decrease) in provision for directors’ bonuses 5 (0) (7)
Increase (decrease) in net defined benefit asset (782) (483) (4,311)
Increase (decrease) in net defined benefit liability 6 (320) (2,860)
Increase (decrease) in provision for reimbursement of
deposits 52 14 130
Increase (decrease) in provision for contingent loss (134) (42) (377)
Gain on fund management (44,089) (51,024) (454,802)
Financing expenses 2,185 2,563 22,854
Loss (gain) related to securities (694) (1,361) (12,137)
Loss (gain) on money held in trust (5) 106 948
Foreign exchange losses (gains) 8,916 359 3,208
Loss (gain) on disposal of non-current assets 15 25 224
Net decrease (increase) in loans and bills discounted (107,133) (131,095) (1,168,514)
Net increase (decrease) in deposit 43,873 85,569 762,718
Net increase (decrease) in negotiable certificates of
deposit 11,195 3,259 29,054
Net increase (decrease) in borrowed money (excluding
subordinated borrowings) (4,280) 3,580 31,913
Net decrease (increase) in deposit (excluding deposit paid
to Bank of Japan) (15,534) (4,675) (41,675)
Net decrease (increase) in call loans 120,000 – –
Net increase (decrease) in call money 59,500 (24,500) (218,379)
Net decrease (increase) in foreign exchanges - assets 2,815 751 6,698
Net increase (decrease) in foreign exchanges - liabilities 162 (199) (1,777)
Net decrease (increase) in lease receivables and
investment assets (15) (167) (1,495)
Proceeds from fund management 45,463 52,177 465,085
Payments for finance (2,356) (2,346) (20,919)
Other, net 494 (3,848) (34,305)
Subtotal 132,489 (53,755) (479,147)
Income taxes paid (3,878) (3,538) (31,536)
Net cash provided by (used in) operating activities 128,610 (57,293) (510,684)

- 11 -
(Millions of yen) (Thousands of
U.S. dollars)
Fiscal year ended March 31, 2016
Fiscal year ended March 31, 2017
Fiscal year ended March 31, 2017
Cash flows from investing activities
Purchase of securities (242,740) (217,078) (1,934,918)
Proceeds from sales of securities 34,215 127,550 1,136,914
Proceeds from redemption of securities 150,812 164,843 1,469,325
Increase in money held in trust (1,012) (90) (809)
Purchase of tangible fixed assets (1,722) (1,766) (15,741)
Proceeds from sales of tangible fixed assets 84 135 1,211
Purchase of intangible assets – (70) (627)
Net cash provided by (used in) investing activities (60,363) 73,524 655,353
Cash flows from financing activities
Repayment of subordinated loans – (300) (2,674)
Cash dividends paid (1,205) (1,325) (11,817)
Dividends paid to non-controlling interests (2) (7) (64)
Purchase of treasury shares (0) (1) (10)
Proceeds from disposal of treasury shares 255 254 2,272
Purchase of treasury stock of subsidiaries in consolidation – (62) (553)
Purchase of investments in subsidiaries resulting in no
change in scope of consolidation – (101) (906)
Repayments of lease obligations (104) (106) (951)
Net cash provided by (used in) financing activities (1,057) (1,649) (14,704)
Effect of exchange rate change on cash and cash equivalents 7 7 67
Net increase (decrease) in cash and cash equivalents 67,196 14,588 130,034
Cash and cash equivalents at beginning of period 100,640 167,836 1,496,005
Increase in cash equivalents newly – 51,422 458,353
Cash and cash equivalents at end of period 167,836 233,847 2,084,391

- 12 -
[THE TOKUSHIMA BANK, LTD.]
(1) Balance Sheets
(Millions of yen) (Thousands of U.S. dollars)
As of March 31, 2016 As of March 31, 2017 As of March 31, 2017
Assets
Cash and due from banks 93,691 120,726 1,076,091
Cash 13,107 13,959 124,431
Due from banks 80,584 106,766 951,660
Trading account securities 161 251 2,243
Trading government bonds 91 142 1,267
Trading local government bonds 69 109 976
Money held in trust 4,447 4,436 39,547
Securities 489,946 435,324 3,880,247
Government bonds 84,017 59,283 528,423
Local government bonds 28,964 34,618 308,569
Corporate bonds 166,103 127,159 1,133,429
Stocks 18,454 20,755 185,006
Other securities 192,406 193,507 1,724,818
Loans and bills discounted 924,640 987,761 8,804,365
Bills discounted 7,358 5,940 52,949
Loans on bills 94,119 96,184 857,339
Loans on deeds 736,352 783,237 6,981,352
Overdrafts 86,810 102,398 912,724
Foreign exchanges 1,149 1,449 12,919
Due from foreign banks (our accounts) 755 967 8,620
Foreign bills bought 141 174 1,559
Foreign bills receivable 252 307 2,740
Other assets 12,093 10,525 93,819
Prepaid expenses 16 18 168
Accrued income 1,597 1,665 14,843
Derivatives other than for trading-assets 2,543 2,200 19,617
Other 7,935 6,640 59,189
Tangible fixed assets 17,528 17,191 153,237
Buildings, net 7,532 7,367 65,665
Land 8,683 8,615 76,794
Lease assets, net 393 337 3,006
Construction in progress – 0 8
Other tangible fixed assets 918 870 7,762
Intangible fixed assets 64 64 578
Other intangible fixed assets 64 64 578
Prepaid pension cost 1,258 1,566 13,960
Deferred tax assets 546 164 1,467
Customers’ liabilities for acceptances and guarantees 2,635 2,638 23,515
Allowance for loan losses (12,992) (12,744) (113,597)
Total assets 1,535,172 1,569,358 13,988,395
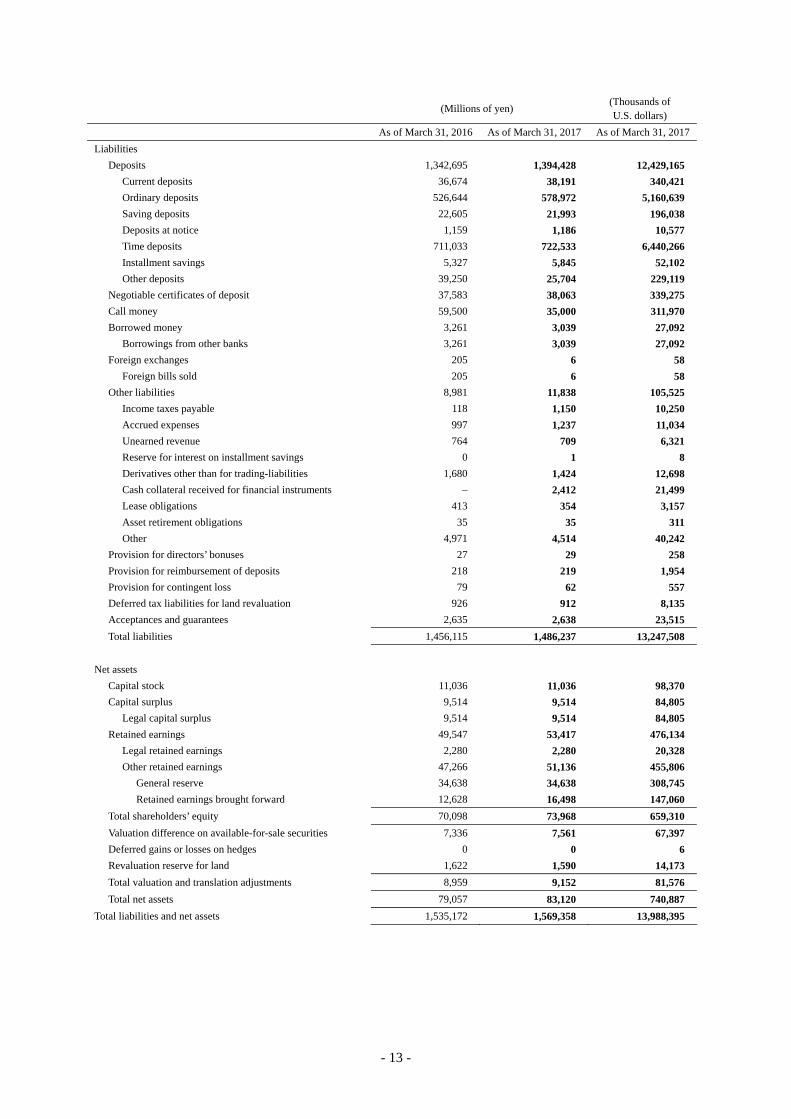
- 13 -
(Millions of yen) (Thousands of U.S. dollars)
As of March 31, 2016 As of March 31, 2017 As of March 31, 2017
Liabilities
Deposits 1,342,695 1,394,428 12,429,165
Current deposits 36,674 38,191 340,421
Ordinary deposits 526,644 578,972 5,160,639
Saving deposits 22,605 21,993 196,038
Deposits at notice 1,159 1,186 10,577
Time deposits 711,033 722,533 6,440,266
Installment savings 5,327 5,845 52,102
Other deposits 39,250 25,704 229,119
Negotiable certificates of deposit 37,583 38,063 339,275
Call money 59,500 35,000 311,970
Borrowed money 3,261 3,039 27,092
Borrowings from other banks 3,261 3,039 27,092
Foreign exchanges 205 6 58
Foreign bills sold 205 6 58
Other liabilities 8,981 11,838 105,525
Income taxes payable 118 1,150 10,250
Accrued expenses 997 1,237 11,034
Unearned revenue 764 709 6,321
Reserve for interest on installment savings 0 1 8
Derivatives other than for trading-liabilities 1,680 1,424 12,698
Cash collateral received for financial instruments – 2,412 21,499
Lease obligations 413 354 3,157
Asset retirement obligations 35 35 311
Other 4,971 4,514 40,242
Provision for directors’ bonuses 27 29 258
Provision for reimbursement of deposits 218 219 1,954
Provision for contingent loss 79 62 557
Deferred tax liabilities for land revaluation 926 912 8,135
Acceptances and guarantees 2,635 2,638 23,515
Total liabilities 1,456,115 1,486,237 13,247,508
Net assets
Capital stock 11,036 11,036 98,370
Capital surplus 9,514 9,514 84,805
Legal capital surplus 9,514 9,514 84,805
Retained earnings 49,547 53,417 476,134
Legal retained earnings 2,280 2,280 20,328
Other retained earnings 47,266 51,136 455,806
General reserve 34,638 34,638 308,745
Retained earnings brought forward 12,628 16,498 147,060
Total shareholders’ equity 70,098 73,968 659,310
Valuation difference on available-for-sale securities 7,336 7,561 67,397
Deferred gains or losses on hedges 0 0 6
Revaluation reserve for land 1,622 1,590 14,173
Total valuation and translation adjustments 8,959 9,152 81,576
Total net assets 79,057 83,120 740,887
Total liabilities and net assets 1,535,172 1,569,358 13,988,395

- 14 -
(2) Statements of Income
(Millions of yen) (Thousands of U.S. dollars)
Fiscal year ended March 31, 2016
Fiscal year ended March 31, 2017
Fiscal year ended March 31, 2017
Ordinary income 25,573 26,184 233,395
Interest income 21,362 21,248 189,399
Interest on loans and discounts 16,287 15,584 138,909
Interest and dividends on securities 4,954 5,549 49,462
Interest on call loans 7 0 0
Interest on deposits with banks 96 102 918
Other interest income 15 12 108
Fees and commissions 2,578 2,596 23,142
Fees and commissions on domestic and foreign exchanges
705 697 6,221
Other fees and commissions 1,873 1,898 16,921
Other ordinary income 202 948 8,452
Gain on trading account securities transactions 2 – –
Gains on sales of bonds 199 948 8,451
Other ordinary income – 0 1
Other income 1,430 1,391 12,401
Recoveries of written off claims 496 346 3,084
Gain on sales of stocks and other securities 512 724 6,453
Gain on money held in trust 18 – –
Other 402 321 2,862
Ordinary expenses 20,194 19,992 178,206
Interest expenses 884 850 7,582
Interest on deposits 753 682 6,081
Interest on negotiable certificates of deposit 55 25 231
Interest on call money 0 76 680
Interest on borrowings and rediscounts 65 63 564
Other interest expenses 9 2 24
Fees and commissions payments 1,610 1,620 14,442
Fees and commissions on domestic and foreign exchanges
135 131 1,169
Other fees and commissions 1,474 1,489 13,272
Other ordinary expenses 1,015 2,194 19,561
Loss on foreign exchange transactions 478 1,398 12,461
Loss on trading account securities transactions – 2 19
Loss on sales of bonds 521 774 6,902
Other 14 19 177
General and administrative expenses 13,664 13,688 122,008
Other expenses 3,020 1,639 14,610
Provision of allowance for loan losses 917 579 5,161
Written-off of loans 1,746 414 3,691
Losses on sales of stocks and other securities 101 384 3,424
Losses on devaluation of stocks and other securities 0 – –
Loss on money held in trust – 8 72
Other 254 253 2,260
Ordinary profit 5,379 6,191 55,188

- 15 -
(Millions of yen) (Thousands of U.S. dollars)
Fiscal year ended March 31, 2016
Fiscal year ended March 31, 2017
Fiscal year ended March 31, 2017
Extraordinary income 4 5 44
Gain on disposal of non-current assets 4 5 44
Extraordinary loss 44 80 719
Loss on disposal of non-current assets 3 2 24
Impairment loss 40 77 694
Profit before income taxes 5,340 6,115 54,514
Income taxes-current 978 1,463 13,045
Income taxes-deferred 650 197 1,759
Total income taxes 1,628 1,660 14,804
Profit 3,711 4,454 39,709

- 16 -
[THE KAGAWA BANK, LTD.]
(1) Balance Sheets
(Millions of yen) (Thousands of U.S. dollars)
As of March 31, 2016 As of March 31, 2017 As of March 31, 2017
Assets
Cash and due from banks 94,054 85,922 765,869
Cash 14,859 15,148 135,021
Due from banks 79,194 70,774 630,847
Trading account securities 211 215 1,917
Trading government bonds 211 215 1,917
Money held in trust 1,000 992 8,847
Securities 319,564 308,445 2,749,314
Government bonds 102,703 84,275 751,185
Local government bonds 16,441 15,096 134,559
Corporate bonds 102,266 87,872 783,247
Stocks 26,984 30,616 272,901
Other securities 71,169 90,584 807,420
Loans and bills discounted 1,106,065 1,162,411 10,361,097
Bills discounted 10,474 9,624 85,787
Loans on bills 64,911 67,744 603,839
Loans on deeds 970,455 1,016,412 9,059,746
Overdrafts 60,224 68,629 611,724
Foreign exchanges 3,030 1,978 17,639
Due from foreign banks (our accounts) 2,896 1,960 17,476
Foreign bills bought 1 – –
Foreign bills receivable 132 18 162
Other assets 1,939 1,711 15,251
Prepaid expenses 16 18 162
Accrued income 1,302 1,118 9,973
Derivatives other than for trading-assets 3 10 94
Other 617 563 5,021
Tangible fixed assets 24,125 23,984 213,787
Buildings, net 4,047 4,162 37,100
Land 18,306 18,096 161,306
Lease assets, net 565 482 4,299
Construction in progress 136 267 2,383
Other tangible fixed assets 1,068 975 8,696
Intangible fixed assets 46 46 414
Other intangible fixed assets 46 46 414
Prepaid pension cost 992 1,037 9,251
Customers’ liabilities for acceptances and guarantees 3,544 3,696 32,950
Allowance for loan losses (8,556) (8,621) (76,845)
Total assets 1,546,017 1,581,822 14,099,496

- 17 -
(Millions of yen) (Thousands of U.S. dollars)
As of March 31, 2016 As of March 31, 2017 As of March 31, 2017
Liabilities
Deposits 1,366,264 1,393,449 12,420,446
Current deposits 39,214 43,836 390,737
Ordinary deposits 542,992 581,163 5,180,172
Saving deposits 22,814 23,469 209,191
Deposits at notice 3,739 5,237 46,685
Time deposits 737,782 720,954 6,426,192
Installment savings 9,961 9,991 89,057
Other deposits 9,760 8,796 78,410
Negotiable certificates of deposit 15,300 18,080 161,155
Borrowed money 34,214 38,507 343,232
Borrowings from other banks 34,214 38,507 343,232
Foreign exchanges 0 – –
Foreign bills payable 0 – –
Other liabilities 10,143 9,725 86,685
Income taxes payable 1,185 724 6,458
Accrued expenses 1,475 1,508 13,447
Unearned revenue 872 856 7,632
Reserve for interest on installment savings 2 1 14
Derivatives other than for trading-liabilities 0 0 2
Lease obligations 243 210 1,874
Other 6,364 6,423 57,253
Provision for bonuses 299 299 2,666
Provision for directors’ bonuses 30 31 276
Provision for reimbursement of deposits 225 234 2,087
Provision for contingent loss 71 53 477
Deferred tax liabilities 4,036 3,554 31,679
Deferred tax liabilities for land revaluation 3,783 3,701 32,997
Acceptances and guarantees 3,544 3,696 32,950
Total liabilities 1,437,914 1,471,333 13,114,655
Net assets
Capital stock 12,014 12,014 107,089
Capital surplus 9,339 9,339 83,245
Legal capital surplus 9,339 9,339 83,245
Retained earnings 65,130 69,591 620,297
Legal retained earnings 2,674 2,674 23,843
Other retained earnings 62,455 66,916 596,454
Reserve for reduction entry 28 27 246
General reserve 43,436 43,436 387,170
Retained earnings brought forward 18,990 23,451 209,037
Total shareholders’ equity 86,483 90,944 810,632
Valuation difference on available-for-sale securities 14,462 12,573 112,075
Deferred gains or losses on hedges (0) (0) (0)
Revaluation reserve for land 7,156 6,970 62,132
Total valuation and translation adjustments 21,618 19,544 174,208
Total net assets 108,102 110,489 984,840
Total liabilities and net assets 1,546,017 1,581,822 14,099,496

- 18 -
(2) Statements of Income
(Millions of yen) (Thousands of U.S. dollars)
Fiscal year ended March 31, 2016
Fiscal year ended March 31, 2017
Fiscal year ended March 31, 2017
Ordinary income 28,134 29,024 258,706
Interest income 22,318 21,630 192,800
Interest on loans and discounts 17,982 16,961 151,187
Interest and dividends on securities 4,223 4,587 40,888
Interest on call loans 38 5 47
Interest on deposits with banks 65 69 616
Other interest income 8 6 61
Fees and commissions 3,501 3,888 34,664
Fees and commissions on domestic and foreign exchanges
923 906 8,083
Other fees and commissions 2,577 2,982 26,581
Other ordinary income 645 1,105 9,849
Gains on foreign exchange transactions – 85 759
Gains on sales of bonds 280 711 6,341
Gains on redemption of bonds 31 41 367
Income from derivatives other than for trading or hedging
– 11 100
Other 332 255 2,280
Other income 1,669 2,399 21,391
Recoveries of written off claims 456 584 5,206
Gain on sales of stocks and other securities 765 1,289 11,497
Other 447 525 4,687
Ordinary expenses 21,308 21,423 190,956
Interest expenses 1,249 978 8,725
Interest on deposits 1,173 935 8,335
Interest on negotiable certificates of deposit 34 18 169
Interest on call money – (0) (6)
Interest on borrowings and rediscounts 35 19 176
Other interest expenses 6 5 50
Fees and commissions payments 2,211 2,227 19,853
Fees and commissions on domestic and foreign exchanges
169 167 1,491
Other fees and commissions 2,042 2,060 18,361
Other ordinary expenses 465 1,548 13,801
Loss on foreign exchange transactions 41 – –
Loss on trading account securities transactions 0 3 29
Loss on sales of bonds 150 1,276 11,381
Expenses on derivatives other than for trading or hedging
51 – –
Other 223 268 2,390
General and administrative expenses 14,975 15,124 134,812
Other expenses 2,405 1,544 13,763
Provision of allowance for loan losses 439 625 5,571
Written-off of loans 1,484 454 4,051
Losses on sales of stocks and other securities 226 269 2,406
Losses on devaluation of stocks and other securities 0 0 0
Loss on money held in trust 12 98 875
Other 241 96 858
Ordinary profit 6,825 7,600 67,749

- 19 -
(Millions of yen) (Thousands of U.S. dollars)
Fiscal year ended March 31, 2016
Fiscal year ended March 31, 2017
Fiscal year ended March 31, 2017
Extraordinary income 0 25 230
Gain on disposal of non-current assets 0 25 230
Extraordinary loss 272 412 3,673
Loss on disposal of non-current assets 18 7 64
Impairment loss 254 404 3,608
Profit before income taxes 6,552 7,214 64,307
Income taxes-current 2,243 1,970 17,559
Income taxes-deferred 566 363 3,243
Total income taxes 2,809 2,333 20,803
Profit 3,743 4,880 43,504

- 20 -
[THE TAISHO BANK, LTD.]
(1) Balance Sheets
(Millions of yen) (Thousands of U.S. dollars)
As of March 31, 2016 As of March 31, 2017 As of March 31, 2017
Assets
Cash and due from banks 53,749 59,110 526,876
Cash 4,353 5,724 51,022
Due from banks 49,396 53,386 475,853
Securities 45,446 40,799 363,664
Government bonds 22,091 7,021 62,582
Local government bonds 9,879 22,164 197,558
Corporate bonds 1,413 503 4,488
Stocks 4,792 4,525 40,337
Other securities 7,269 6,585 58,697
Loans and bills discounted 371,411 382,807 3,412,138
Bills discounted 287 177 1,582
Loans on bills 64,265 60,831 542,217
Loans on deeds 263,101 271,597 2,420,873
Overdrafts 43,756 50,201 447,464
Other assets 544 566 5,051
Prepaid expenses 35 52 470
Accrued income 176 146 1,307
Other 333 367 3,273
Tangible fixed assets 2,735 2,660 23,718
Buildings, net 917 1,065 9,493
Land 1,338 1,338 11,932
Lease assets, net 5 3 30
Construction in progress 102 – –
Other tangible fixed assets 370 253 2,261
Intangible fixed assets 3,985 3,559 31,724
Software 3,948 3,549 31,635
Software in progress 26 – –
Other intangible fixed assets 10 10 89
Prepaid pension cost 461 444 3,957
Deferred tax assets 1,072 552 4,921
Customers’ liabilities for acceptances and guarantees 584 531 4,736
Allowance for loan losses (1,959) (1,720) (15,332)
Total assets 478,033 489,311 4,361,456

- 21 -
(Millions of yen) (Thousands of U.S. dollars)
As of March 31, 2016 As of March 31, 2017 As of March 31, 2017
Liabilities
Deposits 431,657 442,113 3,940,758
Current deposits 10,934 10,521 93,779
Ordinary deposits 114,154 122,469 1,091,627
Saving deposits 226 178 1,590
Deposits at notice 407 174 1,552
Time deposits 303,018 305,911 2,726,723
Installment savings 1,827 1,976 17,618
Other deposits 1,088 882 7,867
Borrowed money 23,900 23,600 210,357
Borrowings from other banks 23,900 23,600 210,357
Other liabilities 1,783 1,733 15,449
Income taxes payable 195 52 464
Accrued expenses 633 486 4,336
Unearned revenue 373 378 3,373
Reserve for interest on installment savings 0 0 4
Derivatives other than for trading-liabilities 24 13 123
Lease obligations 5 3 30
Asset retirement obligations 110 113 1,009
Other 438 685 6,106
Provision for bonuses 210 210 1,871
Provision for directors’ bonuses 17 15 141
Provision for retirement benefits 236 232 2,074
Provision for directors’ retirement benefits 148 – –
Provision for reimbursement of deposits 12 17 155
Provision for contingent loss 26 19 170
Deferred tax liabilities for land revaluation 184 184 1,640
Acceptances and guarantees 584 531 4,736
Total liabilities 458,760 468,657 4,177,355
Net assets
Capital stock 2,689 2,689 23,972
Capital surplus 1,973 1,973 17,588
Legal capital surplus 1,973 1,973 17,588
Retained earnings 14,564 15,099 134,591
Legal retained earnings 716 716 6,383
Other retained earnings 13,848 14,383 128,208
General reserve 5,509 5,509 49,109
Reserve for advanced depreciation of noncurrent assets
129 126 1,125
Retained earnings brought forward 8,209 8,747 77,974
Total shareholders’ equity 19,227 19,762 176,152
Valuation difference on available-for-sale securities (225) 620 5,527
Revaluation reserve for land 271 271 2,419
Total valuation and translation adjustments 46 891 7,947
Total net assets 19,273 20,654 184,100
Total liabilities and net assets 478,033 489,311 4,361,456

- 22 -
(2) Statements of Income
(Millions of yen) (Thousands of U.S. dollars)
Fiscal year ended March 31, 2016
Fiscal year ended March 31, 2017
Fiscal year ended March 31, 2017
Ordinary income 9,543 9,169 81,734
Interest income 8,343 7,977 71,102
Interest on loans and discounts 7,831 7,387 65,851
Interest and dividends on securities 469 548 4,888
Interest on call loans 0 – –
Interest on deposits with banks 41 40 360
Other interest income 0 0 0
Fees and commissions 712 722 6,439
Fees and commissions on domestic and foreign exchanges
137 134 1,202
Other fees and commissions 575 587 5,237
Other ordinary income 218 62 553
Gains on sales of bonds 218 51 455
Income from derivatives other than for trading or hedging
– 11 98
Other income 269 408 3,638
Reversal of allowance for doubtful accounts – 165 1,474
Recoveries of written off claims 10 31 278
Gain on sales of stocks and other securities 165 90 805
Other 93 121 1,080
Ordinary expenses 8,474 8,073 71,959
Interest expenses 857 706 6,299
Interest on deposits 736 617 5,504
Interest on call money 0 – –
Interest on borrowings and rediscounts 113 83 747
Other interest expenses 7 5 47
Fees and commissions payments 484 434 3,874
Fees and commissions on domestic and foreign exchanges
25 25 222
Other fees and commissions 459 409 3,651
Other ordinary expenses 24 21 189
Loss on foreign exchange transactions 0 0 0
Loss on sales of bonds – 21 189
Expenses on derivatives other than for trading or hedging
24 – –
General and administrative expenses 6,760 6,574 58,603
Other expenses 347 335 2,992
Provision of allowance for loan losses 232 – –
Written-off of loans – 0 2
Losses on sales of stocks and other securities 53 302 2,697
Losses on devaluation of stocks and other securities 9 – –
Other 52 32 292
Ordinary profit 1,068 1,096 9,775

- 23 -
(Millions of yen) (Thousands of U.S. dollars)
Fiscal year ended March 31, 2016
Fiscal year ended March 31, 2017
Fiscal year ended March 31, 2017
Extraordinary income 24 – –
Gain on disposal of non-current assets 24 – –
Extraordinary loss 0 51 459
Loss on disposal of non-current assets 0 46 410
Other – 5 49
Profit before income taxes 1,093 1,045 9,315
Income taxes-current 429 243 2,171
Income taxes-deferred 193 148 1,322
Total income taxes 622 391 3,493
Profit 470 653 5,821

- 24 -
3. Company Information / Stock Information
Company Information (as of March 31, 2017)
Trade name: TOMONY Holdings, Inc. THE TOKUSHIMA BANK, LTD. Date of establishment: April 2010 March 1918 Listing date: April 2010 December 1990 to March 2010 Business year: From April 1 to March 31 From April 1 to March 31 Paid-in capital: ¥25,000 million ¥11,036 million Number of employees: 2,403 (excluding contract and temporary
employees) 902 (excluding contract and temporary
employees) Head office: 7-1 Kamei-cho, Takamatsu-shi, Kagawa 1-41 Tomidahama, Tokushima-shi,
Tokushima Telephone: +81-87-812-0102 +81-88-623-3111 Consolidated subsidiaries: THE TOKUSHIMA BANK, LTD.
THE KAGAWA BANK, LTD. THE TAISHO BANK, LTD. TOMONY System Service, Inc. Tokugin Business Service Co., Ltd. Kagawa Business Service Co., Ltd. TOMONY Lease, Inc. TOMONY Card, Inc. Tokugin Capital Co., Ltd. Taisho Shinyo Hosho Co.,Ltd.
Tokugin Business Service Co., Ltd. TOMONY Card, Inc. Tokugin Capital Co., Ltd.
Trade name: THE KAGAWA BANK, LTD. THE TAISHO BANK, LTD. Date of establishment: February 1943 April 1922 Listing date: October 1988 to March 2010 -
Business year: From April 1 to March 31 From April 1 to March 31 Paid-in capital: ¥12,014 million ¥2,689 million Number of employees: 987 (excluding contract and temporary
employees) 340 (excluding contract and temporary
employees) Head office: 7-9 Kamei-cho, Takamatsu-shi, Kagawa 2-5-8 Imabashi,Chuo-ku,Osaka-shi,Osaka Telephone: +81-87-861-3121 +81-6-6205-8400 Consolidated subsidiaries: TOMONY Lease, Inc.
Kagawa Business Service Co., Ltd. Taisho Shinyo Hosho Co.,Ltd.
Officers (as of July 1, 2017)
Directors (except the Audit and Supervisory Committee Members): Representative Director and Chairman Shinichi Kakiuchi Representative Director, President and CEO Seiji Toyama Representative Director and Vice President Masaaki Yoshida Representative Senior Managing Director Takeshi Nakamura Managing Director Yoshifumi Gamo Managing Director Masaya Kakuda Managing Director Hitomi Fujii Director Toshio Yokote Director Hiromi Yoshioka Director Noritaka Honda Director Shinichi Mori
Audit and Supervisory Committee Members:
Director* Katsura Tada Director (Non-standing)* Toshiya Onishi Director (Non-standing)* Noboru Ohira
*Outside Director

- 25 -
Stock Information (as of March 31, 2017)
Total number of authorized shares: 476,000,000 shares Total number of shares issued: 163,728,911 shares Number of shareholders: 10,097 Major shareholders (Top 10)
Shareholder name Number of shares held
(Thousands) Share-holding ratio (%)
Japan Trustee Services Bank, Ltd. (Trust Account)
10,078 6.16
TOMONY Holdings Employee Shareholding Association
4,944 3.02
Sompo Japan Nipponkoa Insurance Inc. 3,775 2.30
Nichia Corporation 3,775 2.30
CBNY DFA INTL SMALL CAP VALUE PORTFOLIO(Standing proxy: Citibank Japan Ltd.)
3,442 2.10
The Bank of Tokyo-Mitsubishi UFJ, Ltd. 3,251 1.98
The Master Trust Bank of Japan, Ltd. (Trust Account)
3,089 1.88
Japan Trustee Services Bank, Ltd. (Trust Account 5)
2,986 1.82
Japan Trustee Services Bank, Ltd. (Trust Account 4)
2,964 1.81
NH Foods Ltd. 2,556 1.56
Total 40,864 24.95
* The financial statements in this Annual Report are stated in Japanese yen with amounts of less than one million yen omitted. As a result, the totals shown do not necessarily agree with the sums of the individual amounts. The translation of Japanese yen amounts into U.S. dollar amounts is included solely for the convenience of investors outside Japan. Such translation is carried out at the rate of ¥112.19 = U.S. $1, the approximate rate of exchange at March 31, 2017, and the resultant amounts are shown with amounts of less than 1,000 U.S. dollars omitted. * While every best effort has been made to provide a translation meeting the quality standards required of professionals, the Company does not guarantee it is 100% accurate. Therefore, please verify the original Japanese text for any final judgments made based on this information.