Annual report 2017 - mapfrere.com · Ricardo Blanco Member ... (ALASA) in Chile and Panama, the...
114
Annual report 2017
Transcript of Annual report 2017 - mapfrere.com · Ricardo Blanco Member ... (ALASA) in Chile and Panama, the...

www.mapfrere.com
Annual report 2017
Annual report 2017
Ann
ual r
epor
t 201
7

Annual report 2017

2 ANNUAL REPORT 2017
3
1Governing Bodies 4
2Consolidated Management Report 6Introduction 7Key Figures 8Key Activities 11Social and environmental matters 12Other Information 13Corporate Aspects 14Significant Subsequent Events for the Company occurring after the End of the Year 15Prospects 15
3Consolidated Annual Accounts 17Consolidated balance sheet 18Global consolidated income statement 20Consolidated statement of changes in equity 22Consolidated cash flow statement 24Financial information by segment 25Financial information by geographic area 28Consolidated Annual Accounts 28Table of subsidiary and associated companies 80
4Audit Report for the Consolidated Annual Accounts 2017 83
5Individual Management Report 90Introduction 91Key Figures 91Key Activities 91Social and Environmental Matters 92Other Information 94Corporate Aspects 95Significant Subsequent Events for the Company occurring after the End of the Year 95Prospects 95
6Individual Annual Accounts 97Balance sheet 98Profit and loss account 101Statement of changes in equity 105Cash flow statement 108
7Companies making up the Reinsurance Unit 110
8Offices, geographical distribution and contacts 110
Annual report 2017

4 ANNUAL REPORT 2017
Governing bodies
1

5Governing bodies
Board of Directors
Executive Committee
Chairman Esteban Tejera
Vice-Chairman & CEO Eduardo Pérez de Lema Chairman
Members Aristóbulo Bausela
Ricardo Blanco Member
Ana Isabel Fernández
Javier Fernández-Cid Member
Antonio Gómez Vice-Chairman
Philippe Hebeisen (Vaudoise Assurances Holding)
Mark Hews (Eccesiastical Insurance)
José Manuel Inchausti
Katsuhiko Kaneyoshi*
Pedro López Member
Ricky Louis Means (Shelter Reinsurance Company)
Daniel Quermia Member
Gregorio Robles
Jaime Tamayo
Non-Board Member Secretary
Juan Martín SanzSecretary
Includes appointments and reelections to be submitted to the Annual General Meeting.*With effect as off 3 April, 2018.

6 ANNUAL REPORT 2017
Consolidated Management
Report
2

7Consolidated Management Report
IntroductionIn 2017, the international reinsurance sector turned in an uneven performance that can be broken down into two phases:
During the first - which lasted just over half a year - intense competition continued, along with the impairment of the technical margin as a result of the accumulated worsening of rates and conditions experienced over the last few years. This loss of technical profitability in the industry was partly compensated for by reduced catastrophe claims, as was the case in previous years.
Nonetheless, the occurrence of several natural disasters in the Americas during the third quarter of the year radically changed the scenario. It is expected that these events (Hurricanes Harvey, Irma and María, and to a lesser extent, the Puebla earthquake) will make 2017 one of the most expensive years in terms of insured damages caused by natural events. This major increase in loss experience, together with the continued downturn in financial performance, are contributing to an increase in reinsurance prices at fiscal year-end, even if the sector is still a far cry from leaving behind the soft cycle in which it currently finds itself.
In these difficult circumstances, the 2017 performance from MAPFRE RE should be considered as excellent, with a very positive result and similar revenue and premium volumes as for the previous fiscal year. The net impact of natural disasters on results has been very limited, thanks to the solidity of risk management and the effectiveness of the financial protection measures in place.
The Standard and Poor's ratings agency has confirmed the financial strength of MAPFRE RE, assigning it a rating of A (two categories above the Spanish sovereign rating) with stable outlook. A.M. Best has maintained the A rating with stable outlook.
MAPFRE RE, Compañía de Reaseguros, S.A. (the “Company”), is a subsidiary of MAPFRE S.A., which company deposits its Consolidated Annual Accounts, together with the Consolidated Report on Operations and the Integrated Report, which include the Group's non-financial information, with the Commercial Registry of Madrid.
8 ANNUAL REPORT 2017
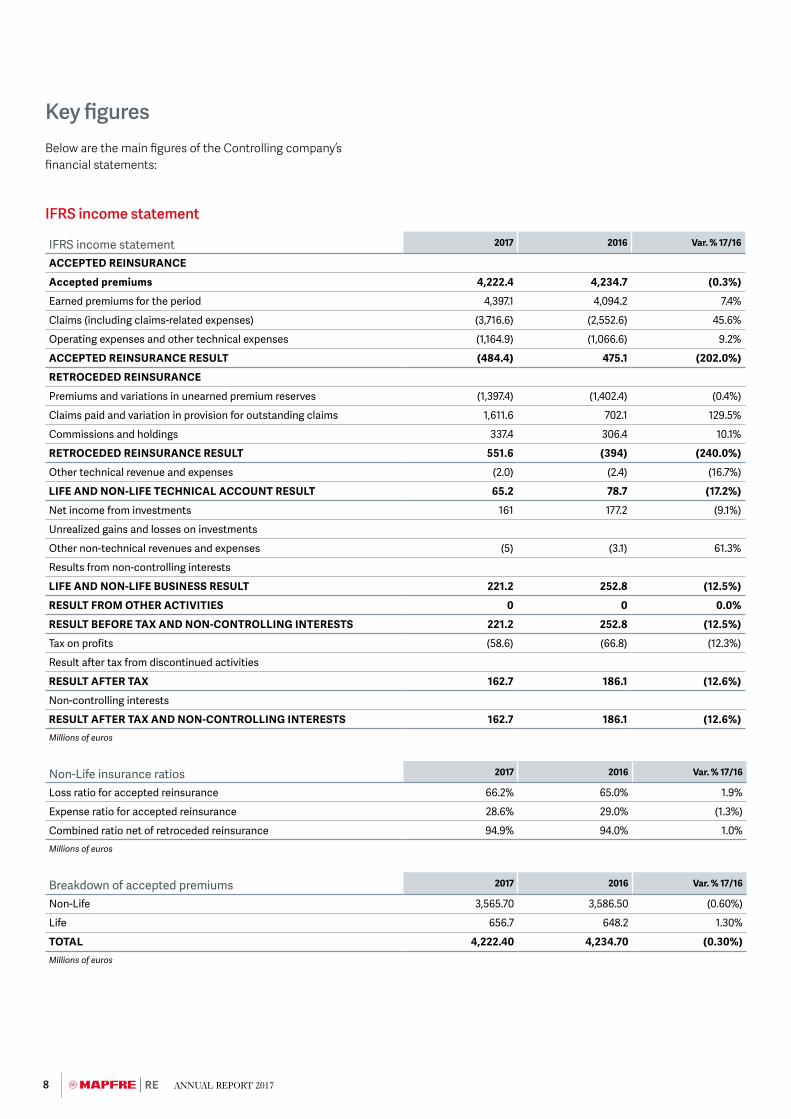
Key figures Below are the main figures of the Controlling company’s financial statements:
IFRS income statement
IFRS income statement 2017 2016 Var. % 17/16
ACCEPTED REINSURANCE
Accepted premiums 4,222.4 4,234.7 (0.3%)
Earned premiums for the period 4,397.1 4,094.2 7.4%
Claims (including claims-related expenses) (3,716.6) (2,552.6) 45.6%
Operating expenses and other technical expenses (1,164.9) (1,066.6) 9.2%
ACCEPTED REINSURANCE RESULT (484.4) 475.1 (202.0%)
RETROCEDED REINSURANCE
Premiums and variations in unearned premium reserves (1,397.4) (1,402.4) (0.4%)
Claims paid and variation in provision for outstanding claims 1,611.6 702.1 129.5%
Commissions and holdings 337.4 306.4 10.1%
RETROCEDED REINSURANCE RESULT 551.6 (394) (240.0%)
Other technical revenue and expenses (2.0) (2.4) (16.7%)
LIFE AND NON-LIFE TECHNICAL ACCOUNT RESULT 65.2 78.7 (17.2%)
Net income from investments 161 177.2 (9.1%)
Unrealized gains and losses on investments
Other non-technical revenues and expenses (5) (3.1) 61.3%
Results from non-controlling interests
LIFE AND NON-LIFE BUSINESS RESULT 221.2 252.8 (12.5%)
RESULT FROM OTHER ACTIVITIES 0 0 0.0%
RESULT BEFORE TAX AND NON-CONTROLLING INTERESTS 221.2 252.8 (12.5%)
Tax on profits (58.6) (66.8) (12.3%)
Result after tax from discontinued activities
RESULT AFTER TAX 162.7 186.1 (12.6%)
Non-controlling interests
RESULT AFTER TAX AND NON-CONTROLLING INTERESTS 162.7 186.1 (12.6%)Millions of euros
Non-Life insurance ratios 2017 2016 Var. % 17/16
Loss ratio for accepted reinsurance 66.2% 65.0% 1.9%
Expense ratio for accepted reinsurance 28.6% 29.0% (1.3%)
Combined ratio net of retroceded reinsurance 94.9% 94.0% 1.0%Millions of euros
Breakdown of accepted premiums 2017 2016 Var. % 17/16
Non-Life 3,565.70 3,586.50 (0.60%)
Life 656.7 648.2 1.30%
TOTAL 4,222.40 4,234.70 (0.30%)Millions of euros

9Consolidated Management Report
Balance Sheet
Key Balance Sheet figures (IFRS)
2017 2016 Var. % 17/16
Financial investments and cash 3,540.90 3,570.60 (0.80%)
Total assets 6,449.31 5,578.90 15.60%
Equity 1,301.50 1,279.40 1.70%
ROE 12.60% 15.20% (17.10%)
Millions of euros
OTHER INFORMATION
Other Information2017 2016 Var. %
17/16
Average number of employees 369 350 5.40%
% commissions over accepted written reinsurance premiums
26.40% 24.00% 10.00%
% internal management expenses over accepted premiums
1.35% 1.40% (3.60%)
APAC
EMEA
North America
LATAM
Iberia
18%
GROSS PREMIUMS BY GEOGRAPHIC AREA
16%
42%
8%
16%
APAC
EMEA
North America
LATAM
Iberia
18%
NET PREMIUMS BY GEOGRAPHIC AREA
10%
50%
10%
12%
Facultative
Proportional
Non-Proportional
13%
GROSS PREMIUMS BY BUSINESS TYPE
81%
6%
Facultative
Proportional
Non-Proportional
11%
NET PREMIUMS BY BUSINESS TYPE
85%
4%
10 ANNUAL REPORT 2017
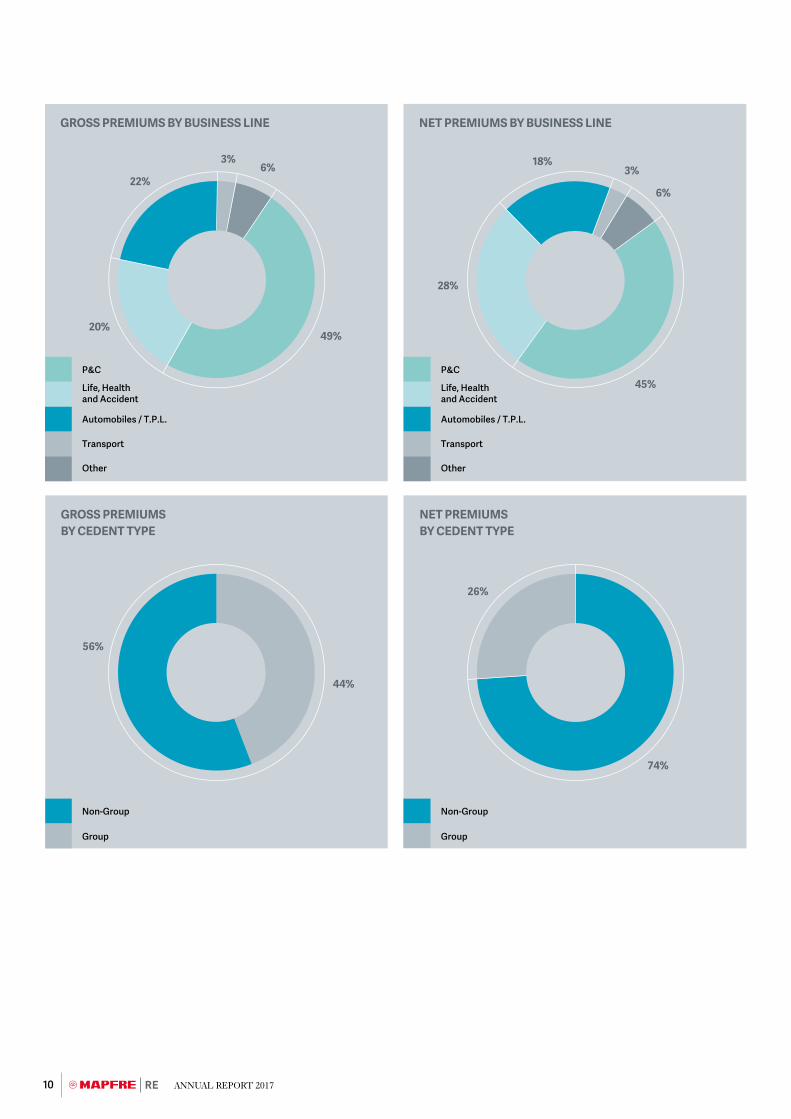
Life, Health and Accident
P&C
Automobiles / T.P.L.
Transport
Other
22%
GROSS PREMIUMS BY BUSINESS LINE
6%
20%49%
3% 18%
NET PREMIUMS BY BUSINESS LINE
28%
45%
6%
3%
Group
Non-Group
GROSS PREMIUMS BY CEDENT TYPE
NET PREMIUMS BY CEDENT TYPE
Life, Health and Accident
P&C
Automobiles / T.P.L.
Transport
Other
Group
Non-Group
26%
74%
56%
44%

11Consolidated Management Report
Key activitiesMAPFRE RE’s revenue reached 5,217.9 million euros, making for an increase of 5.7 percent on the previous fiscal year. The result before tax and non-controlling interests comes to 221.2 million euros, 12.5 percent less than that registered in 2016, with shareholders' equity at the close of the fiscal year standing at 1,301.5 million euros. The Non-Life combined ratio was 94.9 percent. All these are very positive figures, and even more so when regarded in the context of the disastrous losses recorded this year by the sector as a whole.
Commercial initiatives
MAPFRE RE has increased its operations to cover a total of 20 countries, opening a representative office in Tokyo in late 2017, which will allow it to consolidate the close relations with the Japanese market further, offering yet another example of the commitment made by MAPFRE RE to Asia, a continent in which it already has 5 offices.
In all geographic areas, commercial initiatives have been pursued to strengthen the relationship enjoyed by MAPFRE RE in its markets, with clients and brokers alike.
The Personal Area has held numerous meetings with clients and brokers on the range of Life reinsurance solutions offered by MAPFRE RE in accordance with the new solvency regulations, participating and speaking out in market events and academic forums on the selection of risks and digital transformation in quoting process of Life lines in Mexico, Colombia, Vietnam, Italy, Argentina, Spain and France.
They have also spoken at various forums on the Spanish agricultural insurance model in Spain and Mexico, the Brazilian reinsurance market 10 years after its opening, and have sponsored specialized professional events, such as meetings of the Latin American Association of Agricultural Insurance (ALASA) in Chile and Panama, the International Association of Agricultural Production Insurers (AIAG) in Poland, the Crop Insurance and Reinsurance Bureau (CIRB) in the USA, the Inter-European Reinsurance Meeting (ENTRE) in Spain, the Philippine General Insurance Summit in Manila, and the jubilee celebrations of the Netherlands Reinsurance Association (NRV).
Underwriting management and client services
Sharing knowledge with its clients continues to be an essential activity for MAPFRE RE. This is truly one of the reasons behind the decision to hold training days, including, in particular, a new edition of the MAPFRE RE International Forum in Madrid, with 17 guests invited from 16 different countries, or the collaboration with the National Institute of Insurance and Fasecolda, in Colombia, to present its international Senior Reinsurance Management program. In Beijing, days were organized on proportional reinsurance sessions were organized, attended by 44 professionals from 24 market companies, and various clients in Colombia, Argentina, Italy and Turkey received technical training on insurer management in the agricultural, Non-Life and/or Life lines.
In a constant bid to get to know and incorporate new ideas into the reinsurance practice, MAPFRE RE has signed up to the Blockchain Insurance Industry Initiative (B3i), which seeks to explore the potential of using Blockchain distributed registration technologies in the insurer industry and collaborates with corporate innovation teams in the group to support the development of other initiatives. Along these same lines, MAPFRE RE continues to support projects with qualified partners looking for innovative reinsurance solutions.
By the same token, MAPFRE RE has also launched new initiatives for the professional growth of its teams: a training program on team management and project leadership for those in managerial positions, set to involve more than 80 company executives; a global trainee program to bring young, new talent into the workforce; and technical training seminars for underwriters from all offices.
Information and technology systems
The requirements of the new international accounting standards - IFRS 17 - that should come into force in 2021, require work to be carried out on identifying the impact on, and adjustment necessary to the MAPFRE RE business and accounting systems. It is a very important change that will affect multiple processes and towards which MAPFRE RE continued to work in 2017.
During this year, the version of the Business Intelligence tool (Microstrategy) was also renewed, improving its performance and allowing the adoption of more complete solutions in new developments of information exploitation.
In 2017, MAPFRE RE incorporated the Corporate User Attention Service, as well as the Corporate Job Position Management, and virtually completed development of CRM tools for sales management and the new MAPFRE RE intranet, applying group standards while awaiting deployment in early 2018.

12 ANNUAL REPORT 2017
Social and environmental mattersPersonnel
The workforce in service at the close of the last two fiscal years has the following structure, classified according to professional category.
Category 2017 2016
Directors 2 2
Senior Managers 0 0
Managers 88 90
Technicians 236 212
Administrative Staff 60 46
TOTAL 386 350
The workforce objectives include the professional development of employees and the strengthening of their employability and well-being through the development of their skills and capacities. It is intended to achieve this in an environment of commitment and mutual respect, with no offensiveness, intimidation, harassment or discrimination whatsoever, and a workplace that guarantees safety and stability.
To this end, it has a Code of Ethics and Conduct, inspired by the Institutional and Business Principles, and which aims to reflect the corporate values and the basic principles that should guide the performance of the company and the people that comprise the same.
The Policy of Respect for people expressly states that respect for others should be a basic element of employee behavior. It thus rejects any manifestation of workplace harassment, and any other behavior that is violent or offensive to the rights and dignity of people, given that these situations contaminate the work environment and have negative effects on the health, well-being, confidence, dignity and performance of those who suffer it.
The Company encourages permanent over temporary contracts, seeking a stable environment and continuity in labor relations. The percentage of the Company’s fixed workforce and that of its subsidiaries in 2017 was 97.9 percent (97.7 percent in 2016).
During the fiscal year, development continued with the Global Disability Program, and at the year-end, there were 4 people with a disability on the workforce (the same as in 2016).
The Promotion, Selection and Mobility Policy aims to promote professional development opportunities to employees through programs and development plans, training itineraries and mobility between different areas and countries, in order
to increase employability, professional satisfaction and its commitment to the company.
In order to select the right people, there is a global procedure in place that guarantees objectivity, maximum rigor and non-discrimination in all processes. The selection tests used are homogeneous worldwide, aimed at choosing the most appropriate candidate for each job position. The number of selection processes carried out in 2017 was 59 (35 in 2016).
Moreover, in 2017, 609,599 euros was invested in workforce training (254,617 euros in 2016).
The compensation policy is based on the job position held by each employee: it is competitive with respect to the market; it guarantees internal fairness; it is flexible and adaptable to the different groups and circumstances of the market; and it is in line with the strategy.
The Policy on Health, Well-being and the Prevention of Occupational Risks establishes that the health, safety and well-being of workers are essential both for employees and their families, as well as for the productivity, competitiveness and sustainability of the business. In this respect, employees receive annual information and training on health and healthy lifestyles.
Environment
One of the initiatives that allows MAPFRE to generate loyalty in its stakeholders is the promotion of a sustainable environment in which to develop its business.
In 2017, MAPFRE continued to act to fulfill the commitments made in the Environmental Policy approved by the MAPFRE S.A. Board of Directors and revised in 2015 to incorporate new commitments, such as the preservation of biodiversity and the fight against climate change.
As regards Environmental Management, MAPFRE acts in accordance with the guidelines defined in the Integrated Environmental, Energy and Carbon Footprint Management System (hereinafter “SIGMAYE”), in line with ISO 14001, ISO 50001 and ISO 14064 international standards.
The transversal design and global nature of SIGMAYE enable both corporate and specific local objectives to be established, ensuring compliance with the applicable legislation in force and providing minimum mandatory criteria in countries where the legislation is less developed.
With respect to the carbon footprint, the expanded reach of UNE-EN-ISO 14064 continues to verify the carbon footprint inventories of companies in Spain, Puerto Rico, Colombia and Portugal.

13Consolidated Management Report
As regards mitigating and adapting to climate change, we have continued to implement the actions defined in the Strategic Plan for Energy Efficiency and Climate Change, with the objective of reducing Group emissions by 20 percent by 2020. Having reached this objective three years earlier than envisaged, we chose to strive toward more ambitious challenges, both in the medium and long-term all the way through to 2050, the year in which we hope to reach CO2 neutrality.
The Group’s actions in this matter have led, for a third consecutive year, to CDP (Driving Sustainable Economies) acknowledging MAPFRE as a global leader in the fight against climate change, including the Group in its Climate A List.
The eco-effiicency measures implemented include energy efficiency measures in buildings in relation to air conditioning (use of free cooling, technological renewal of equipment and adjustment of time and temperature settings), lighting (replacement of lamps with LED, installation of presence sensors and adjustment of times), and other users (technological renovation of facilities using energy efficiency criteria).
Operational control of water management comes through the installation of optimization measures in buildings (aerators, timers, sensors, dual flush systems, etc.) and the control of internal consumption via proprietary billing, in-house meters, leak detection and employee awareness.
As regards the preservation of biodiversity and adhering to the Biodiversity Pact launched by the Spanish Business and Biodiversity Initiative, MAPFRE has published its report on the 2013-2015 results, as have all the other signatory companies. It has also continued its work on protecting an endangered species and preserving its habitat, having this year chosen the turtle and the Mediterranean Sea.
Also, with respect to biodiversity protection, and as a part of the integration of the Environment into the business, the Group has joined the initiative led by the NGO OCEANA and backed by the United Nations for the protection of the oceans and, more specifically, to eliminate illegal fishing by not insuring these activities.
The controlling company and its subsidiaries do not have any work centers located in protected areas or in areas of high diversity outside protected areas.
Environmental, social and governance factors and risks
The Group takes responsibility for the impact of its business activity on the environment and society in general. Its social responsibility model and policy facilitate the integration of environmental, social and governance (ESG) aspects into its business.
Proper monitoring of the ESG aspects makes it possible for the organization to obtain additional information about these potential risks and gain better understanding of social movements and transformations and the expectations of its stakeholders (investors, clients, regulatory bodies, distributors, general public, employees, etc.).
By integrating the management of these risks with the more traditional risks inherent in the activity, we can develop and promote more responsible and sustainable businesses.
There are two policies applied by the Group in this area:
> Risk Management Policy, the objective of which is to establish general guidelines, basic principles and the general framework of action for risk management; to promote a solid culture and an effective system of risk management; to ensure that risk analysis forms part of the decision-making process; and to preserve the Group's solvency and financial strength.
> Compliance Function Policy, whose main objective is to minimize the likelihood of any legal or compliance risk materializing. To this end, it defines effective accident prevention and control mechanisms, encourages specialized staff training, and promotes an ethical and compliance culture across the organization.
Other informationFinancial Risks
MARKET AND INTEREST RATES RISKS
Fluctuations in market prices can reduce the value or income generated from the investment portfolio, and in turn, this can have a negative effect on the financial position.
The Company and its subsidiaries mitigate its exposure to these types of risks by means of a prudent investment policy characterized by a high proportion of investment-grade, fixed-income securities.

14 ANNUAL REPORT 2017
Most investments are fixed-income securities, accounting for 87.3 percent of the total financial investment portfolio in 2017 (87.6 percent in 2016).
Investments in equity securities and mutual funds have a limited weighting on the results, accounting for approximately 12.7 percent of total financial investments in 2017 (12.4 percent in 2016).
EXCHANGE RATE RISK
Fluctuations in the value of the euro compared with other currencies may, in the future, affect the value of the controlling Company’s assets and liabilities and, consequently, its shareholders’ equity, as well as its operating results and cash flow. Currency conversion differences registered led to the recognition of +2.7 million euros in 2017 (+13.6 million euros in 2016).
RECEIVABLES RISK
Investments returns are also sensitive to changes in general economic conditions, including changes in the general credit ratings of debt security issuers. Exposure to credit risk is mitigated by means of a policy based on the prudent selection of security issuers and counterparties based on their solvency, seeking a high degree of geographic correspondence between issuers of assets and commitments, maintaining a suitable level of diversification, and obtaining, where appropriate, guarantees, collateral and other hedges.
Fixed-income and variable-income investments are subject to limits by the issuer. The policy establishes limits according to the risk profile of the counterparty or of the investment instrument, as well as exposure limits related to the counterparty's rating.
LIQUIDITY RISK
The liquidity risk is mainly managed by maintaining sufficient cash balances to cover any contingency arising from commitments made to third parties. As of December 31, 2017, the balance of cash and other equivalent liquid assets was 200 million euros (140 million euros in 2016), equivalent to 5.80 percent of total investment and liquid funds (3.93 percent in 2016). Additionally, most of the fixed income investments are investment grade and traded on organized markets, providing great capacity to act in the event of potential liquidity crises.
Treasury Stock
The controlling Company does not own its own shares or participations or shares in MAPFRE S.A.; nor did it conduct any operations with such shares in 2017.
Research, Development and Innovation
Client orientation is one of the main axes of MAPFRE's Strategic Plan, which has identified innovation as one of the tools allowing it to offer insurance solutions and services focused on clients’ needs. Innovation in client-oriented products and services thus becomes an essential method by which to achieve the short, medium and long-term objectives.
In 2014, the MAPFRE Innovation Model was launched, designed to promote a culture of innovation throughout the organization and to respond to business challenges. To manage the Model, the Corporate Innovation Committee was established, made up of members of relevant innovation areas, and the Corporate Innovation Division was created, which will lead innovation in MAPFRE. The Innovation Model, at the service of both the local and global strategy, has become one of the key tools by which to achieve differentiation and the Group’s organic growth objectives.
Average provider payment period
The average payment period for service providers during the fiscal year was 6.72 days (8.09 days in fiscal year 2016).
Corporate aspects Significant corporate aspects
In fiscal year 2017, Eduardo Pérez de Lema, Ángel Alonso, Ricardo Blanco, Philippe Hebeisen and Mark Hews were reelected as directors of the controlling Company for a new four-year mandate.
Ángel Alonso tendered his resignation as director and, consequently, stood down from all his posts on the Board and Management Committee of the controlling Company, effective January 28, 2018, due to his having reached the maximum age permitted by the company’s articles of association. The Annual General Meeting, held as an extraordinary session on January 26, 2018, ratified the appointment of Ana Isabel Fernández as director of the controlling Company, effective January 29, 2018.

15Consolidated Management Report
Proposed Resolutions
1. To approve the individual annual accounts corresponding to the 2017 fiscal year, as well as the following proposal to use the results contained in the annual report:
Basis of distribution Amount in euros
Profit and loss 159,508,829.94
To retained earnings 528,979,393.27
TOTAL 688,488,223.21
Distribution Amount in euros
As dividends 103,290,427.24
To equalization reserve
To retained earnings 585,197,795.97
TOTAL 688,488,223.21
The proposal involves a total dividend distribution of 1.43 euros gross per share for share numbers 1 to 72,231,068 inclusive.
This dividend, for the gross amount of 1.43 euros per share, was anticipated in agreements of the Board of Directors that were adopted on June 30 and November 28, 2017.
2. To approve the consolidated annual accounts for fiscal year 2017.
3. To approve the management of the Board of Directors in fiscal year 2017.
4. To reelect the firm KPMG Auditores S.L. as auditors of the company’s accounts, both for the Individual Annual Accounts and, as applicable, for the Consolidated Accounts, if the company should be obliged to prepare such or decide to do so voluntarily, for a new three-year period, i.e. for fiscal years 2018, 2019 and 2020; this is without prejudice to the fact that the appointment may be revoked by the Annual General Meeting before the end of this period, if there is just cause to do so.
5. To reelect Pedro López Solanes as company director for the next four years. To appoint Katsuhiko Kaneyosi as new company director for the next four years, effective April 3, 2018.
6. To delegate broader powers to the Chairman of the Board of Directors and their Secretary so that either of them may proceed with the implementation of the resolutions adopted at the Annual General Meeting and make them public when necessary.
7. To thank those involved in managing the company for their loyal collaboration over the course of this fiscal year.
Significant subsequent events There have been no significant events after the year end that may affect the results or future evolution of the Company.
Outlook It is hoped that in 2018, pressure will continue in the sector to obtain positive technical results.
The substantial capitalization existing in the reinsurance sector has to date supported the impairment seen in profitability in later years. However, it cannot be hoped that this compensation will continue. The 2017 disasters - of which the final cost is not yet known, given the severity of the damages and impact in terms of interruption to business - have had a major impact on the accounts and balance sheets of a great many reinsurers and will increase pressure to recover acceptable levels of technical profitability.

16 ANNUAL REPORT 2017

17Consolidated Annual Accounts
Consolidated Annual
Accounts
3

18 ANNUAL REPORT 2017
A) Consolidated balance sheet as on December 31, 2017 and 2016ASSETS Notes 2017 2016
A) INTANGIBLE ASSETS 954 576
I. Goodwill
II. Other intangible assets 6.1 954 576
B) PROPERTY, PLANT AND EQUIPMENT 55,528 54,517
I. Property for own use 6.2 49,031 49,752
II. Other property, plant and equipment 6.2 6,497 4,765
C) INVESTMENTS 4,223,162 4,148,390
I. Property investments 6.2 6,191 6,375
II. Financial investments 3,250,443 3,424,694
1. Held-to-maturity portfolio
2. Available-for-sale portfolio 6.4 3,227,527 3,389,047
3. Trading portfolio 6.4 22,916 35,647
III. Equity-accounted investments 86,501
IV. Deposits established for accepted reinsurance 875,757 711,481
V. Other investments 4,270 5,840
D) PARTICIPATION OF REINSURANCE IN TECHNICAL PROVISIONS 6.9 1,476,022 755,923
E) DEFERRED TAX ASSETS 6.17
F) RECEIVABLES 6.5 337,849 305,972
I. Receivables on reinsurance operations 6.5 317,264 283,151
II. Tax receivables 6.5 11,217 17,087
1. Tax on profits receivable 4,534 8,142
2. Other tax receivables 6,683 8,945
III. Corporate and other receivables 6.5 9,368 5,734
G) CASH 6.7 199,774 140,022
H) ADJUSTMENTS FOR PREPAYMENT 6.15 155,090 173,501
I) OTHER ASSETS 933
TOTAL ASSETS 6,449,312 5,578,901(Figures in thousands of euros)

19Consolidated Annual Accounts
LIABILITIES AND EQUITY Notes 2017 2016
EQUITY 1,301,457 1,279,424
I. Paid-up capital 6.8 223,916 223,916
II. Share premium 6.8 220,565 220,565
III. Reserves 713,784 620,528
IV. Interim dividend 4.2 (103,290) (90,289)
V. Treasury stock
VI. Result attributable to controlling Company 162,655 186,074
VII. Other equity instruments
VIII. Revaluation adjustments 6.8 81,119 105,048
IX. Currency conversion differences 6.19 2,694 13,566
Equity attributable to the controlling Company’s shareholders 1,301,443 1,279,408
Non-controlling interests 14 16
B) SUBORDINATED LIABILITIES
C) TECHNICAL PROVISIONS 6.9 4,642,591 3,797,153
I. Provisions for unearned premiums and unexpired risks 6.9/7C 1,098,699 1,330,416
II. Provisions for Life insurance 6.9/7C 597,166 549,736
III. Provisions for outstanding claims 6.9/7C 2,946,726 1,917,001
IV. Provisions for profits and return premiums
D) PROVISIONS FOR RISKS AND EXPENSES 6.10 9,869 7,643
E) DEPOSITS RECEIVED ON CEDED AND RETROCEDED REINSURANCE
6.11 67,803 43,603
F) DEFERRED TAX LIABILITIES 6.17 9,056 24,627
G) DEBT 6.12 358,099 354,039
I Due on reinsurance operations 6.12/7C 299,790 298,286
II. Tax liabilities 6.12/6.17 21,569 21,204
1. Tax on profits to be paid 952 225
2. Other tax liabilities 20,617 20,979
III. Other debts 6.12 36,740 34,549
H) ADJUSTMENTS FOR PREPAYMENT 6.15 60,437 72,412
TOTAL LIABILITIES AND EQUITY 6,449,312 5,578,901(Figures in thousands of euros)
20 ANNUAL REPORT 2017
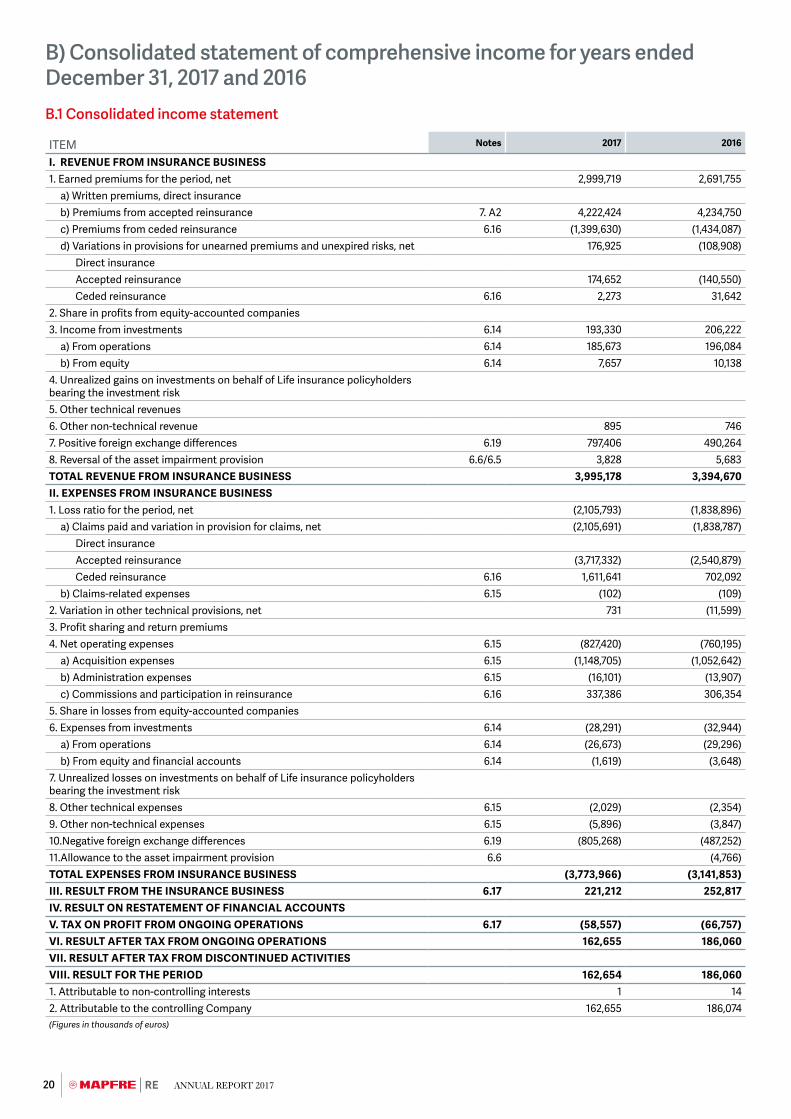
B) Consolidated statement of comprehensive income for years ended December 31, 2017 and 2016B.1 Consolidated income statement
ITEM Notes 2017 2016
I. REVENUE FROM INSURANCE BUSINESS1. Earned premiums for the period, net 2,999,719 2,691,755
a) Written premiums, direct insuranceb) Premiums from accepted reinsurance 7. A2 4,222,424 4,234,750c) Premiums from ceded reinsurance 6.16 (1,399,630) (1,434,087)d) Variations in provisions for unearned premiums and unexpired risks, net 176,925 (108,908)
Direct insuranceAccepted reinsurance 174,652 (140,550)Ceded reinsurance 6.16 2,273 31,642
2. Share in profits from equity-accounted companies3. Income from investments 6.14 193,330 206,222
a) From operations 6.14 185,673 196,084b) From equity 6.14 7,657 10,138
4. Unrealized gains on investments on behalf of Life insurance policyholders bearing the investment risk5. Other technical revenues6. Other non-technical revenue 895 7467. Positive foreign exchange differences 6.19 797,406 490,2648. Reversal of the asset impairment provision 6.6/6.5 3,828 5,683TOTAL REVENUE FROM INSURANCE BUSINESS 3,995,178 3,394,670II. EXPENSES FROM INSURANCE BUSINESS1. Loss ratio for the period, net (2,105,793) (1,838,896)
a) Claims paid and variation in provision for claims, net (2,105,691) (1,838,787)Direct insuranceAccepted reinsurance (3,717,332) (2,540,879)Ceded reinsurance 6.16 1,611,641 702,092
b) Claims-related expenses 6.15 (102) (109)2. Variation in other technical provisions, net 731 (11,599)3. Profit sharing and return premiums4. Net operating expenses 6.15 (827,420) (760,195)
a) Acquisition expenses 6.15 (1,148,705) (1,052,642)b) Administration expenses 6.15 (16,101) (13,907)c) Commissions and participation in reinsurance 6.16 337,386 306,354
5. Share in losses from equity-accounted companies6. Expenses from investments 6.14 (28,291) (32,944)
a) From operations 6.14 (26,673) (29,296)b) From equity and financial accounts 6.14 (1,619) (3,648)
7. Unrealized losses on investments on behalf of Life insurance policyholders bearing the investment risk8. Other technical expenses 6.15 (2,029) (2,354)9. Other non-technical expenses 6.15 (5,896) (3,847)10.Negative foreign exchange differences 6.19 (805,268) (487,252)11.Allowance to the asset impairment provision 6.6 (4,766)TOTAL EXPENSES FROM INSURANCE BUSINESS (3,773,966) (3,141,853)III. RESULT FROM THE INSURANCE BUSINESS 6.17 221,212 252,817IV. RESULT ON RESTATEMENT OF FINANCIAL ACCOUNTSV. TAX ON PROFIT FROM ONGOING OPERATIONS 6.17 (58,557) (66,757)VI. RESULT AFTER TAX FROM ONGOING OPERATIONS 162,655 186,060VII. RESULT AFTER TAX FROM DISCONTINUED ACTIVITIESVIII. RESULT FOR THE PERIOD 162,654 186,0601. Attributable to non-controlling interests 1 142. Attributable to the controlling Company 162,655 186,074(Figures in thousands of euros)

21Consolidated Annual Accounts
B.2 Consolidated statement of comprehensive income
ITEM
GROSS AMOUNT TAXON
PROFITS
ATTRIBUTABLE TO NON-CONTROLLING
INTERESTS
ATTRIBUTABLE TOCOMPANY
CONTROLLING
2017 2016 2017 2016 2017 2016 2017 2016
A) CONSOLIDATED RESULT FOR THE PERIOD
A.1) Ongoing operations 221,212 252,817 (58,557) (66,757) 1 14 162,655 186,074
A.2) Discontinued operations
B) OTHER RECOGNIZED REVENUE (EXPENSES)
(43,142) 9,463 8,340 611 (34,802) 10,074
B.1) Ongoing operations
1. Financial assets available for sale (31,820) (2,894) 7,891 357 (23,930) (2,537)
a) Valuation gains (losses) 5,995 32,194 (1,567) (8,415) 4,427 23,779
b) Amounts transferred to the income statement
(37,815) (35,088) 9,458 8,772 (28,357) (26,316)
c) Other reclassifications
2. Currency conversion differences (11,322) 12,357 449 254 (10,872) 12,611
a) Valuation gains (losses) (11,322) 12,357 449 254 (10,872) 12,611
b) Amounts transferred to the income statement
c) Other reclassifications
3. Shadow accounting
a) Valuation gains (losses)
b) Amounts transferred to the income statement
c) Other reclassifications
4. Equity-accounted entities
a) Valuation gains (losses)
b) Amounts transferred to the income statement
c) Other reclassifications
5. Other recognized revenue and expenses
B.2) Discontinued operations (Net of divestment)
TOTAL 178,070 262,280 (50,217) (66,146) 1 14 127,853 196,148(Figures in thousands of euros)
All of the items included in the other consolidated statement of comprehensive income may be reclassified to the consolidated income statement in line with EU-IFRS regulations.

22 ANNUAL REPORT 2017
C) Consolidated statement of changes in net equity as on December 31, 2017 and 2016
ITEM
NOTES EQUITY ATTRIBUTABLE TO CONTROLLING COMPANY'S SHAREHOLDERS NON-CONTROLLING
INTERESTS
TOTAL EQUITY
Paid-up capital Share premium Reserves Interim dividend Treasury stock Result attributable to the controlling
company
Other equity instruments
Valuation change adjustments
Currency conversion differences
BALANCE AS OF JANUARY 01, 2016 223,916 220,565 558,841 (90,289) 152,566 107,597 955 19 1,174,170
I. Changes in accounting policies
II. Correction of errors
ADJUSTED BALANCE AS OF January 01, 2016, UPDATED 223,916 220,565 558,841 (90,289) 152,566 107,597 955 19 1,174,170
CHANGES FOR 2016
I. Result recognized directly in equity
1. For revaluation of property, plant and equipment and intangible assets
2. For available-for-sale investments (2,537) (2,537)
3. For cash flow hedging
4. For currency conversion differences 12,611 12,611
5. For other results recognized directly in equity
Total result recognized directly in equity (2,537) 12,611 10,074
II. Other results for 2016 186,074 186,074
III. Distribution of result for 2015 62,277 90,289 (152,566)
IV. Interim dividends for 2016 (90,289) (90,289)
V. Capital increase
VI. Pending paid-up capital
VII. Capital decrease
VIII. Other increases
IX. Other decreases (590) (12) (3) (605)
TOTAL VARIATIONS IN 2016 61,687 33,508 (12) (3) 95,180
BALANCE AS OF December 31, 2016 223,916 220,565 620,528 (90,289) 186,074 105,048 13,566 16 1,279,424
I. Changes in accounting policies
II. Correction of errors
ADJUSTED BALANCE AS OF January 01, 2017, UPDATED 223,916 220,565 620,528 (90,289) 186,074 105,048 13,566 16 1,279,424
CHANGES FOR 2017
I. Result recognized directly in equity
1. For revaluation of property, plant and equipment and intangible assets
2. For available-for-sale investments (23,929) (23,929)
3. For cash flow hedging
4. For currency conversion differences (10,872) (10,872)
5. For other results recognized directly in equity
Total result recognized directly in equity (23,929) (10,872) (34,801)
II. Other results for 2017 162,655 162,655
III. Distribution of result for 2016 95,785 90,289 (186,074)
IV. Interim dividends for 2017 (103,290) (103,290)
V. Capital increase
VI. Pending paid-up capital
VII. Capital decrease
VIII. Other increases
IX. Other decreases (2,529) (2) (2,531)
TOTAL VARIATIONS IN 2017 93,256 (13,001) (23,419) (2) 56,834
BALANCE AS OF December 31, 2017 223,916 220,565 713,784 (103,290) 162,655 81,119 2,694 14 1,301,457 (Figures in thousands of euros)
The amounts in the "Other increases" and "Other decreases” items in the "Reserves" column are mostly due to the distribution of the result from previous years, and the transfers made between them.

23Consolidated Annual Accounts
C) Consolidated statement of changes in net equity as on December 31, 2017 and 2016
ITEM
NOTES EQUITY ATTRIBUTABLE TO CONTROLLING COMPANY'S SHAREHOLDERS NON-CONTROLLING
INTERESTS
TOTAL EQUITY
Paid-up capital Share premium Reserves Interim dividend Treasury stock Result attributable to the controlling
company
Other equity instruments
Valuation change adjustments
Currency conversion differences
BALANCE AS OF JANUARY 01, 2016 223,916 220,565 558,841 (90,289) 152,566 107,597 955 19 1,174,170
I. Changes in accounting policies
II. Correction of errors
ADJUSTED BALANCE AS OF January 01, 2016, UPDATED 223,916 220,565 558,841 (90,289) 152,566 107,597 955 19 1,174,170
CHANGES FOR 2016
I. Result recognized directly in equity
1. For revaluation of property, plant and equipment and intangible assets
2. For available-for-sale investments (2,537) (2,537)
3. For cash flow hedging
4. For currency conversion differences 12,611 12,611
5. For other results recognized directly in equity
Total result recognized directly in equity (2,537) 12,611 10,074
II. Other results for 2016 186,074 186,074
III. Distribution of result for 2015 62,277 90,289 (152,566)
IV. Interim dividends for 2016 (90,289) (90,289)
V. Capital increase
VI. Pending paid-up capital
VII. Capital decrease
VIII. Other increases
IX. Other decreases (590) (12) (3) (605)
TOTAL VARIATIONS IN 2016 61,687 33,508 (12) (3) 95,180
BALANCE AS OF December 31, 2016 223,916 220,565 620,528 (90,289) 186,074 105,048 13,566 16 1,279,424
I. Changes in accounting policies
II. Correction of errors
ADJUSTED BALANCE AS OF January 01, 2017, UPDATED 223,916 220,565 620,528 (90,289) 186,074 105,048 13,566 16 1,279,424
CHANGES FOR 2017
I. Result recognized directly in equity
1. For revaluation of property, plant and equipment and intangible assets
2. For available-for-sale investments (23,929) (23,929)
3. For cash flow hedging
4. For currency conversion differences (10,872) (10,872)
5. For other results recognized directly in equity
Total result recognized directly in equity (23,929) (10,872) (34,801)
II. Other results for 2017 162,655 162,655
III. Distribution of result for 2016 95,785 90,289 (186,074)
IV. Interim dividends for 2017 (103,290) (103,290)
V. Capital increase
VI. Pending paid-up capital
VII. Capital decrease
VIII. Other increases
IX. Other decreases (2,529) (2) (2,531)
TOTAL VARIATIONS IN 2017 93,256 (13,001) (23,419) (2) 56,834
BALANCE AS OF December 31, 2017 223,916 220,565 713,784 (103,290) 162,655 81,119 2,694 14 1,301,457 (Figures in thousands of euros)
The amounts in the "Other increases" and "Other decreases” items in the "Reserves" column are mostly due to the distribution of the result from previous years, and the transfers made between them.
24 ANNUAL REPORT 2017
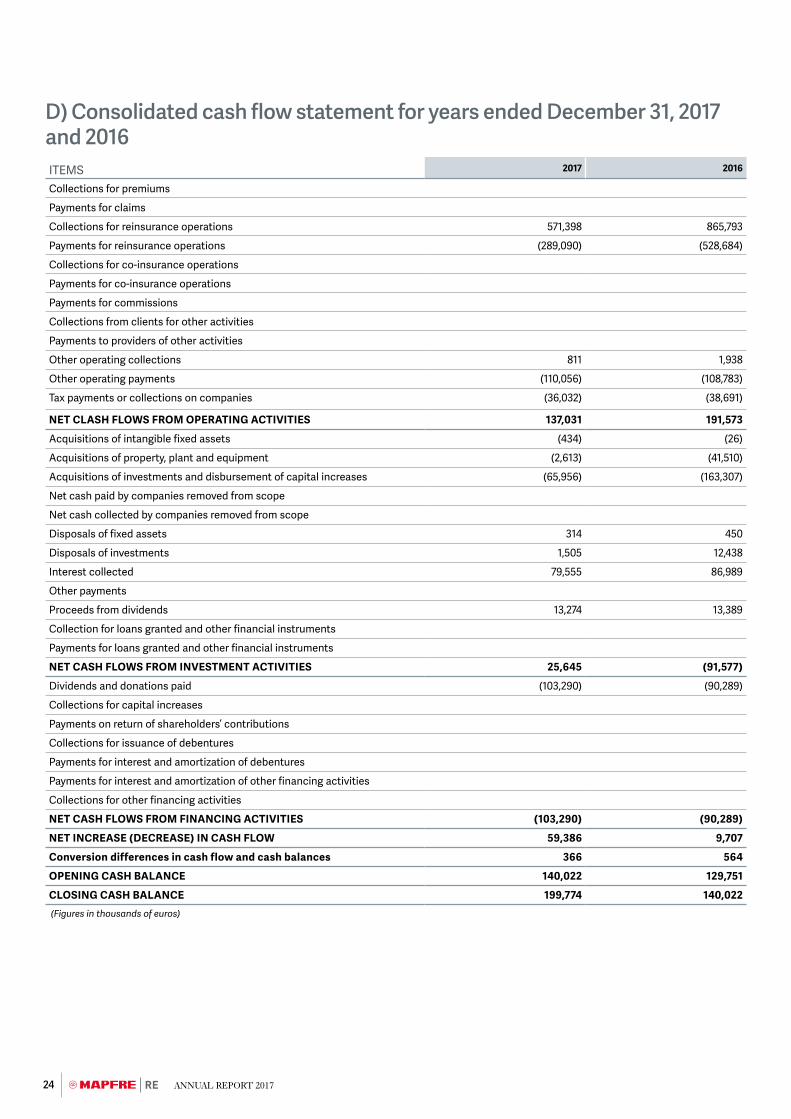
D) Consolidated cash flow statement for years ended December 31, 2017 and 2016ITEMS 2017 2016
Collections for premiums
Payments for claims
Collections for reinsurance operations 571,398 865,793
Payments for reinsurance operations (289,090) (528,684)
Collections for co-insurance operations
Payments for co-insurance operations
Payments for commissions
Collections from clients for other activities
Payments to providers of other activities
Other operating collections 811 1,938
Other operating payments (110,056) (108,783)
Tax payments or collections on companies (36,032) (38,691)
NET CLASH FLOWS FROM OPERATING ACTIVITIES 137,031 191,573
Acquisitions of intangible fixed assets (434) (26)
Acquisitions of property, plant and equipment (2,613) (41,510)
Acquisitions of investments and disbursement of capital increases (65,956) (163,307)
Net cash paid by companies removed from scope
Net cash collected by companies removed from scope
Disposals of fixed assets 314 450
Disposals of investments 1,505 12,438
Interest collected 79,555 86,989
Other payments
Proceeds from dividends 13,274 13,389
Collection for loans granted and other financial instruments
Payments for loans granted and other financial instruments
NET CASH FLOWS FROM INVESTMENT ACTIVITIES 25,645 (91,577)
Dividends and donations paid (103,290) (90,289)
Collections for capital increases
Payments on return of shareholders’ contributions
Collections for issuance of debentures
Payments for interest and amortization of debentures
Payments for interest and amortization of other financing activities
Collections for other financing activities
NET CASH FLOWS FROM FINANCING ACTIVITIES (103,290) (90,289)
NET INCREASE (DECREASE) IN CASH FLOW 59,386 9,707
Conversion differences in cash flow and cash balances 366 564
OPENING CASH BALANCE 140,022 129,751
CLOSING CASH BALANCE 199,774 140,022 (Figures in thousands of euros)

25Consolidated Annual Accounts
E) Financial information by segment – consolidated balance sheet as on December 31, 2017 and 2016
ASSETSLIFE REINSURANCE NON-LIFE REINSURANCE TOTAL
2017 2016 2017 2016 2017 2016
A) INTANGIBLE ASSETS 98 60 856 516 954 576
I. Goodwill
II. Other intangible assets 98 60 856 516 954 576
B) PROPERTY, PLANT AND EQUIPMENT 5,869 5,940 49,659 48,577 55,528 54,517
I. Property for own use 5,270 5,539 43,761 44,213 49,031 49,752
II. Other property, plant and equipment 599 401 5,898 4,364 6,497 4,765
C) INVESTMENTS 979,972 925,462 3,243,190 3,222,928 4,223,162 4,148,390
I. Property investments 1,748 1,772 4,443 4,603 6,191 6,375
II. Financial investments 483,878 507,453 2,766,565 2,917,241 3,250,443 3,424,694
1. Held-to-maturity portfolio
2. Available-for-sale portfolio 468,624 493,903 2,758,903 2,895,144 3,227,527 3,389,047
3. Trading portfolio 15,254 13,550 7,662 22,097 22,916 35,647
III. Equity-accounted investments 86,501 86,501
IV. Deposits established for accepted reinsurance 492,879 415,751 382,878 295,730 875,757 711,481
V. Other investments 1,467 486 2,803 5,354 4,270 5,840
D) PARTICIPATION OF REINSURANCE IN TECHNICAL PROVISIONS
21,269 26,204 1,454,753 729,719 1,476,022 755,923
E) DEFERRED TAX ASSETS
F) RECEIVABLES 41,761 38,930 296,088 267,042 337,849 305,972
I. Receivables on reinsurance operations 37,552 35,453 279,712 247,698 317,264 283,151
II. Tax receivables 3,258 2,782 7,959 14,305 11,217 17,087
III. Corporate and other receivables 951 695 8,417 5,039 9,368 5,734
G) CASH 20,458 14,797 179,316 125,225 199,774 140,022
H) ADJUSTMENTS FOR PREPAYMENT 2,353 2,737 152,737 170,764 155,090 173,501
I) OTHER ASSETS 873 60 933
J) NON-CURRENT ASSETS HELD FOR SALE AND FROM DISCONTINUED OPERATIONS
TOTAL ASSETS BY SEGMENT 1,072,653 1,014,130 5,376,659 4,564,771 6,449,312 5,578,901 (Figures in thousands of euros)

26 ANNUAL REPORT 2017
E) Financial information by segment – consolidated balance sheet as on December 31, 2017 and 2016
Liabilities and equityLIFE REINSURANCE NON-LIFE REINSURANCE TOTAL
2017 2016 2017 2016 2017 2016
EQUITY 166,052 174,386 1,135,405 1,105,038 1,301,457 1,279,424
I. Paid-up capital 22,919 23,284 200,997 200,632 223,916 223,916
II. Share premium 22,576 22,935 197,989 197,630 220,565 220,565
III. Reserves 101,559 99,234 612,225 521,294 713,784 620,528
IV. Interim dividend (8,315) (14,688) (94,975) (75,601) (103,290) (90,289)
V. Treasury stock
VI. Result for the period attributable to the controlling Company 14,076 23,163 148,579 162,911 162,655 186,074
VII. Other equity instruments
VIII. Revaluation adjustments 14,850 17,939 66,269 87,109 81,119 105,048
IX. Currency conversion differences (1,626) 2,503 4,320 11,063 2,694 13,566
Equity attributable to the controlling Company’s shareholders 166,039 174,370 1,135,404 1,105,038 1,301,443 1,279,408
Non-controlling interests 13 16 1 14 16
B) SUBORDINATED LIABILITIES
C) TECHNICAL PROVISIONS 856,201 788,022 3,786,390 3,009,131 4,642,591 3,797,153
I. Provisions for unearned premiums and unexpired risks 1,098,699 1,330,416 1,098,699 1,330,416
II. Provisions for Life insurance 597,166 549,736 597,166 549,736
III. Provisions for outstanding claims 259,035 238,286 2,687,691 1,678,715 2,946,726 1,917,001
IV. Other technical provisions
D) PROVISIONS FOR RISKS AND EXPENSES 1,010 795 8,859 6,848 9,869 7,643
E) DEPOSITS RECEIVED ON CEDED AND RETROCEDED REINSURANCE
4,841 4,912 62,962 38,691 67,803 43,603
F) DEFERRED TAX LIABILITIES 3,752 4,935 5,304 19,692 9,056 24,627
G) DEBT 40,789 41,077 317,311 312,962 358,099 354,039
I. Due on reinsurance operations 31,027 31,532 268,764 266,754 299,790 298,286
II. Tax liabilities 2,383 2,182 19,186 19,022 21,569 21,204
III. Other debts 7,379 7,363 29,361 27,186 36,740 34,549
H) ADJUSTMENTS FOR PREPAYMENT 7 3 60,429 72,409 60,437 72,412
I) LIABILITIES LINKED TO NON-CURRENT ASSETSHELD FOR SALE AND FROM DISCONTINUED OPERATIONS
TOTAL LIABILITIES AND EQUITY BY SEGMENT 1,072,653 1,014,130 5,376,659 4,564,771 6,449,312 5,578,901(Figures in thousands of euros)

27Consolidated Annual Accounts
E) Financial information by segment - consolidated income statement for years ended December 31, 2017 and 2016
LIFE REINSURANCE NON-LIFE REINSURANCE TOTAL
2017 2016 2017 2016 2017 2016
I. REVENUE FROM INSURANCE BUSINESS1. Earned premiums for the period, net 565,936 515,989 2,433,783 2,175,766 2,999,719 2,691,755
a) Written premiums, direct insuranceb) Premiums from accepted reinsurance 656,701 648,245 3,565,723 3,586,505 4,222,424 4,234,750 c) Premiums from ceded reinsurance (36,970) (40,410) (1,362,660) (1,393,677) (1,399,630) (1,434,087) d) Variations in provisions for unearned premiums and unexpired risks, net
(53,795) (91,846) 230,720 (17,062) 176,925 (108,908)
Direct insuranceAccepted reinsurance (52,388) (82,419) 227,040 (58,131) 174,652 (140,550) Ceded reinsurance (1,407) (9,427) 3,680 41,069 2,273 31,642
2. Share in profits from equity-accounted companies3. Income from investments 87,567 90,807 105,763 115,415 193,330 206,222
a) From operations 86,105 89,512 99,568 106,572 185,673 196,084 b) From equity 1,462 1,295 6,195 8,843 7,657 10,138
4. Unrealized gains on investments on behalf of Life insurance policyholders bearing the investment risk5. Other technical revenues6. Other non-technical revenue 61 19 833 727 895 746 7. Positive foreign exchange differences 110,753 77,760 686,653 412,504 797,406 490,264 8. Reversal of the asset impairment provision 18 3,810 5,683 3,828 5,683 TOTAL REVENUE FROM INSURANCE BUSINESS 764,334 684,575 3,230,843 2,710,095 3,995,177 3,394,670 II. EXPENSES FROM INSURANCE BUSINESS1. Incurred claims for the period, net (494,067) (425,214) (1,611,726) (1,413,682) (2,105,793) (1,838,896)
a) Claims paid and variation in provision for claims, net (494,055) (425,205) (1,611,636) (1,413,582) (2,105,691) (1,838,787) Direct insuranceAccepted reinsurance (515,993) (461,330) (3,201,340) (2,079,549) (3,717,332) (2,540,879) Ceded reinsurance 21,937 36,125 1,589,704 665,967 1,611,641 702,092
b) Claims-related expenses (12) (9) (90) (100) (102) (109) 2. Variation in other technical provisions, net 732 (11,599) 732 (11,599) 3. Profit sharing and return premiums4. Net operating expenses (132,076) (128,745) (695,344) (631,450) (827,420) (760,195)
a) Acquisition expenses (139,168) (137,436) (1,009,537) (915,206) (1,148,705) (1,052,642) b) Administration expenses (2,688) (2,001) (13,414) (11,906) (16,101) (13,907) c) Commissions and participation in reinsurance 9,780 10,692 327,606 295,662 337,386 306,354
5. Share in losses from equity-accounted companies6. Expenses from investments (6,439) (7,084) (21,853) (25,860) (28,291) (32,944)
a) From operations (6,160) (6,486) (20,512) (22,810) (26,673) (29,296) b) From equity and financial accounts (279) (598) (1,340) (3,050) (1,619) (3,648)
7. Unrealized losses on investments on behalf of Life insurance policyholders bearing the investment risk8. Other technical expenses (482) (540) (1,547) (1,814) (2,029) (2,354) 9. Other non-technical expenses (739) (346) (5,157) (3,501) (5,896) (3,847) 10.Negative foreign exchange differences (111,351) (75,878) (693,917) (411,374) (805,268) (487,252) 11.Allowance to the asset impairment provision (2) (4,764) (4,766) TOTAL EXPENSES FROM INSURANCE BUSINESS (744,422) (649,408) (3,029,544) (2,492,445) (3,773,966) (3,141,853) RESULT FROM THE INSURANCE BUSINESS 19,913 35,167 201,299 217,650 221,212 252,817 III. OTHER ACTIVITIESIV. RESULT BEFORE TAXES FROM ONGOING OPERATIONS 19,913 35,168 201,299 217,649 221,212 252,817 V. TAX ON PROFIT FROM ONGOING OPERATIONS (5,837) (12,019) (52,720) (54,738) (58,557) (66,757) VI. RESULT AFTER TAX FROM ONGOING OPERATIONS 14,076 23,149 148,579 162,911 162,655 186,060 VII. RESULT AFTER TAX FROM DISCONTINUED ACTIVITIESVIII. RESULT FOR THE PERIOD 14,075 23,149 148,579 162,911 162,654 186,060 1. Attributable to non-controlling interests 1 14 1 14 2. Attributable to the controlling Company 14,076 23,163 148,579 162,911 162,655 186,074 (Figures in thousands of euros)

28 ANNUAL REPORT 2017
F) Financial information by geographic area. Breakdown to December 31, 2017 and 2016GEOGRAPHIC AREA
Ordinary revenuesfrom external clients 2017
Ordinary revenuesfrom external clients 2016
Non-current assets 2017 Non-current assets 2016
SPAIN 663,164 665,802 53,046 48,170
UNITED STATES OF AMERICA 558,185 596,441 861 989
BRAZIL 143,224 149,112 7,789 6,588
MEXICO 100,790 113,201 365 394
VENEZUELA 541 5,489 310 342
COLOMBIA 74,644 103,225 146 174
ARGENTINA 95,162 106,438 6,794 12,513
TURKEY 134,033 157,621
CHILE 118,684 150,110 4,762 3,066
OTHER COUNTRIES 2,333,997 2,187,311 10,119 12,053
TOTAL 4,222,424 4,234,750 84,192 84,289(Figures in thousands of euros)
Non-current assets include other intangible fixed assets, property, plant and equipment, property investments, tax receivables, corporate receivables and other assets.
Accepted reinsurance premiums are considered as ordinary revenues.
No client contributes, on an individual basis, more than 10 percent of the Group’s ordinary revenues.
Consolidated financial statements1. General information on the company and its activities
MAPFRE RE, Compañía de Reaseguros S.A. (referred to from hereinafter as the controlling Company) is a reinsurance company, and the parent company of a number of subsidiaries engaged in reinsurance activities.
The controlling Company was incorporated in Spain, and its registered office is at Paseo de Recoletos no. 25, Madrid.
The controlling Company has central services located in Madrid and four subsidiaries, nine branches and seven representative offices with a direct presence in seventeen countries. Its scope of action includes Spain, European Union countries and other countries, mainly in Latin America. This scope of action encompasses all types of business and reinsurance lines.
The controlling Company is a subsidiary of MAPFRE S.A. and forms part of the MAPFRE Group, made up by MAPFRE S.A. and several companies operating in the insurance, financial, movable assets and services industries.
MAPFRE S.A. is a subsidiary of CARTERA MAPFRE, S.L., a single-member company (referred to hereinafter as CARTERA MAPFRE), which is wholly controlled by Fundación MAPFRE.
The consolidated annual accounts have been prepared by the Board of Directors on February 21, 2018. They are expected to be approved at the Annual General Meeting. Spanish regulations provide for the possibility of modifying the annual accounts in the event that these are not approved by the aforementioned governing body.

29Consolidated Annual Accounts
2. Basis of presentation of the consolidated annual accounts
2.1 BASIS OF PRESENTATION
The Group’s consolidated annual accounts have been prepared in accordance with the International Financial Reporting Standards adopted by the European Union (IFRS-EU), with all companies having implemented the required standardization adjustments for these purposes.
The consolidated annual accounts have been prepared on the basis of the cost model, except for financial assets available for sale, financial assets for trading and derivative instruments registered at their fair value.
There was no early application of the standards and interpretations which, having been approved by the European Commission, had not taken effect as of the closing date of the 2017 fiscal year. However, their early adoption would not have had any effect on the Group’s financial position and results.
2.2 FINANCIAL INFORMATION BY SEGMENT
The controlling Company voluntarily includes financial information by segment in Section E of the consolidated annual accounts. The main segments by line of business of the company are Life Reinsurance and Non-Life Reinsurance.
For the identification of the main segments, the main activities and insurance lines managed by the Group have been taken into consideration, as well as the qualitative thresholds established by regulations.
The Consolidated Management Report details additional information on business performance and characteristics.
2.3 FINANCIAL INFORMATION BY GEOGRAPHIC AREA
Section F) of the consolidated annual accounts provides additional financial information by geographic area.
The established geographic areas are: Spain, United States of America, Brazil, Mexico, Venezuela, Colombia, Argentina, Turkey, Chile and Other Countries.
2.4 CHANGES IN ACCOUNTING POLICIES, CHANGES IN ESTIMATES AND ERRORS
In the fiscal years 2017 and 2016, there were no changes in accounting policies, estimates or material errors that could have had an effect on the Group’s financial position or results.
2.5 COMPARISON OF THE INFORMATION
There is nothing which prevents the comparison of the consolidated annual accounts from the fiscal year with those of the previous fiscal year.
International standards that, having been approved by the European Commission and in force as of the close of the fiscal year, were applied in the preparation of the consolidated annual accounts.
As of the date on which the annual accounts for the fiscal year were prepared, the following should be highlighted:
> The adoption of IFRS-EU 15 “Revenue from contracts with customers”, which came into effect for fiscal years that begin after January 1, 2018, is not expected to have any material on the financial position and results of the Group.
> With regard to IFRS 16-EU “Leasing”, to be applied for fiscal years which begin after January 1, 2019, a new impact assessment on the financial statements for the first year of implementation has been conducted, based on current market conditions and lease contracts in force. The main impacts would be the following:
– Increase in assets and liabilities of approximately 3.9 million euros.
– Decrease in operating expenses and increase in financial expenses of (0.07) and 0.05 million euros respectively. The amount of financial expenses will be progressively reduced, using financial criteria, throughout the estimated period of the contracts.
– Increase in the result for the period attributable to the controlling company of 0.02 million euros. This amount will be fully compensated at the end of the estimated period of the contracts.
> The Group is analyzing the possible impact expected from IFRS 17 “Insurance contracts” applicable to fiscal years starting on or after January 01, 2021, which has been approved by the International Accounting Standards Board (IASB) and not yet adopted by the European Union; this is expected to be significant.
> As regards EU-IFRS 9 “Financial instruments” and the amendment to EU-IFRS 4 “Insurance contracts”, the impact of which is also expected to be significant, applicable to fiscal years starting on or after January 1, 2018, and considering the provisions of this latter standard, the Group has applied the optional temporary exemption from applying IFRS 9 for companies mainly offering insurance business. This temporary exemption can apply until the fiscal years starting on or after

30 ANNUAL REPORT 2017
January 1, 2021, the date on which it is expected that the new IFRS 17 “Insurance contracts” will come into force.
> Upon its coming into force, the Group will adopt the other applicable standards, amendments and interpretations. It is expected that their initial application will not have any significant impact on the Group’s financial position or results.
2.6 CHANGES IN THE CONSOLIDATION SCOPE
Annex 1 specifies the companies that were incorporated in fiscal years 2017 and 2016 into the consolidation scope, together with the equity data and results. Annex 1 also details the companies and changes made in the consolidation scope.
The global effect on the Group equity, financial position and results that can be consolidated in fiscal years 2017 and 2016 of other changes in the consolidation scope with respect to the previous fiscal year are described in the corresponding notes of the consolidated report.
2.7 ACCOUNTING JUDGMENTS AND ESTIMATES
In the preparation of the consolidated annual accounts under EU-IFRS, the controlling Company’s Board of Directors has made judgments and estimates based on assumptions about the future and uncertainties that basically refer to:
> Technical provisions (Note 6.9).
> Asset impairment (Notes 6.2, 6.4 and 6.5).
> The calculation of provisions for risks and expenses (Note 6.10).
> The actuarial calculation of post-employment remuneration commitments and liabilities (Note 6.18).
> The useful life of intangible assets and property, plant and equipment items (Notes 5.1 and 5.2).
> The fair value of certain non-listed assets (Note 6.4).
The estimates and assumptions used are reviewed regularly and are based on historical experience and on other factors that have been deemed more reasonable in each instance. If these reviews were to generate changes in estimates in a given period, their effect would be applied in that period and, if applicable, in subsequent periods.
3. Consolidation
3.1. SUBSIDIARY AND ASSOCIATED COMPANIES
The identification of subsidiaries and associated companies included in the consolidation, with specification of the consolidation method, are detailed in the acquisitions of controlled companies table, which forms part of the consolidated annual report as Annex 1.
Companies are configured as subsidiaries when the controlling Company holds a controlling interest over the investee company, and receives or has the right to variable returns, and the ability to influence said returns through the power that it exercises in said companies.
Dependent companies are consolidated starting from the date on which the Group obtains control and are excluded from the consolidation on the date on which this ceases.
Associated companies are companies in which the controlling Company exercises a significant influence, but which are neither subsidiaries nor joint ventures.
Significant influence is understood as the power to intervene in decisions on financial and operating policies of the investee company, but without controlling or jointly controlling these policies. Significant influence is presumed when, either directly or indirectly through its subsidiaries, at least 20 percent of the voting rights in the investee company are held.
The shares in associated companies are consolidated via the equity method, with net goodwill as of the acquisition date included in the equity value.
When the share of the Group in the losses of an associated company is equal to or greater than the book value of the share in said company, including any unsecured accounts receivable, the Group will not register additional losses, unless it has incurred obligations or made payments on behalf of the associated company.
To determine whether an investee company is a subsidiary or associate, the purpose and design of the investee company have been considered in order to determine the relevant activities, the way in which decisions are made on these activities, who has the current capacity to direct these activities and who receives their financial returns. The potential voting rights held and those that may be exercised as purchase options on shares, convertible debt instruments or other instruments providing the controlling Company the possibility of increasing their voting rights, have also been considered.

31Consolidated Annual Accounts
The financial statements of the subsidiaries and associated companies used for consolidation correspond to the fiscal year that ended on December 31, 2017 and 2016.
3.2. CONVERSION OF ANNUAL ACCOUNTS OF FOREIGN COMPANIES INCLUDED IN THE CONSOLIDATION SCOPE.
The Group's functional and operating currency is the euro. For this reason, the balances and operations of Group companies with a different functional currency are translated into euros using the closing exchange rate for account balances at the average exchange rate weighted by the volume of transactions. Reinsurance operations are converted at the exchange rate corresponding to the month of their accounting.
The exchange differences resulting from applying the above procedure, as well as those arising from the conversion of loans and other instruments into foreign currency to cover investments in overseas businesses, are presented as a separate component of the “Statement of recognized income and expense” section and are shown under equity in the “Currency conversion differences" account, deducting the part of the difference that corresponds to non-controlling interests.
Fair value adjustments of assets and liabilities which arose from the acquisition of Group companies whose operating currency is not the euro are treated as assets and liabilities of overseas business. As such, they are stated in the functional currency of the overseas business and converted at the closing exchange rate.
With the exception of reinsurance operations, all other transactions in foreign currencies are initially converted into euros at the exchange rate in force on the transaction date.
Adjustments to opening balance
The adjustments to opening balance columns in the different tables of the notes on the consolidated annual accounts include the variations that occurred as result of applying a different conversion exchange rate for data on overseas subsidiaries.
The variations in technical provisions in the consolidated income statement differ from those that are obtained from the difference in the consolidated balance sheet of the current and previous fiscal year as a result of applying a different conversion exchange rate in the case of overseas subsidiaries.
4. Earnings per share and dividends
4.1. EARNINGS PER SHARE
The basic earnings per share calculation, which coincides with diluted earnings per share, as no potential ordinary shares exist, is provided below:
2017 2016
Net profit attributable to the shareholders of the controlling Company (thousands of euros)
162,655 186,074
Average weighted number of outstanding ordinary shares (thousands of shares)
72,231 72,231
Basic earnings per share (euros) 2.25 2.58
4.2 DIVIDENDS
The breakdown of the dividends of the controlling Company in the last two fiscal years is as follows.
ITEMTOTAL DIVIDEND DIVIDEND PER SHARE
2017 2016 2017 2016
Interim dividend 103,290,427 90,288,835 1.43 1.25
TOTAL 103,290,427 90,288,835 1.43 1.25(Figures in Euros)
The total dividend for fiscal year 2017 was proposed by the Board of Directors and is pending approval at the Annual General Meeting.
The planned distribution of dividends complies with the requirements and limitations established by legal regulations and in the articles of association.

32 ANNUAL REPORT 2017
In fiscal year 2017, the controlling Company distributed two interim dividends equivalent to a total amount of 103,290,427 euros, which is recorded in equity under the heading "Interim dividend". The liquidity statements prepared by the Board of Directors for the distribution of the two interim dividends agreed on in 2017 are provided below.
ITEM Date of resolution: 6/30/2017 Date of resolution: 11/28/2017
Cash available on date of resolution 145,347 280,679
Increases in cash forecast within one year 300,000 300,000
(+) From expected current collection transactions 200,000 200,000
(+) From financial transactions 100,000 100,000
Decreases in cash forecast within one year (240,454) (362,841)
(-) From expected current payment transactions (100,000) (200,000)
(-) From expected financial transactions (100,000) (100,000)
(-) Due to payment of interim dividend (40,454) (62,841)
Cash available within one year 204,893 217,838 (Figures in thousands of euros)
5. Accounting policies
The accounting policies applied to the following entries are indicated below:
5.1 INTANGIBLE ASSETS
Other intangible assets
OTHER INTANGIBLE ASSETS FROM AN INDEPENDENT ACQUISITION
The intangible assets acquired by third parties in a market transaction are valued at cost. If their useful life is finite, they are amortized, and if their useful life is indefinite, the impairment of asset tests is undertaken at least once a year.
INTERNALLY GENERATED INTANGIBLE ASSETS
Investigation expenses are directly recognized in the consolidated income statement for the fiscal year in which they are incurred. Development expenses are registered as an asset when their probability, feasibility and future recoverability can be reasonably ensured. They are valued by the disbursements made.
The capitalized development expenses are amortized during the period in which revenues or yields are expected to be obtained, notwithstanding the valuation that would be made if an impairment were to occur.
AMORTIZATION OF INTANGIBLE ASSETS WITH A DEFINED USEFUL LIFE
Below, the useful life and depreciation ratios used for the main intangible assets, for which a linear method of amortization has been applied in all cases, are indicated as follows:
ITEM GROUPUseful life (years) Depreciation rate
(annual)
Computer applications
4 25%
The amortization of intangible assets with finite useful life has been registered in the "Depreciation provision" expenses account.
5.2 PROPERTY, PLANT AND EQUIPMENT AND PROPERTY INVESTMENTS
Property, plant and equipment and property investments are valued at their acquisition cost minus their cumulative depreciation and, if applicable, accumulated losses due to impairment.
Property investments are non-current property assets whose purpose is to obtain income, gains or both.
The costs following their acquisition are recognized as an asset only when it is probable that the future profits associated with them will be returned to the Group, and the cost of the item can be determined in a reliable way. All other expenses associated with maintenance and repairs are charged to the consolidated

33Consolidated Annual Accounts
income statement during the fiscal year in which they are incurred.
Depreciation of these items is calculated on a straight-line basis on the cost of the asset less its residual value and the value of land according to the following periods of useful life:
ITEM GROUPYears Annual
coefficient
Buildings and other structures 50-25 2%-4%
Transport items 6,25 16%
Furniture 10 10%
Fittings 20-10 5%-10%
Data processing equipment 4 25%
The residual value and the useful life of assets are reviewed and adjusted if necessary on the closing date of each fiscal year.
These assets are written off from the accounting when they are transferred or future profits derived from their continuous use is not expected to be obtained. The gains or losses resulting from writing the aforementioned items off are included on the consolidated income statement.
5.3 LEASING
Leasing in which the lessor maintains a significant part of the risks and benefits derived from ownership are classified as operational leases. Payments, net of any incentive received from the lessor, are charged to the consolidated income statement on a linear basis during the leasing period.
5.4 FINANCIAL INVESTMENTS
Recognition
Financial assets traded on secondary securities markets are generally recognized on the settlement date.
Classification
Financial investments are classified in the following portfolios:
AVAILABLE-FOR-SALE PORTFOLIO
This includes debt securities not classified under other portfolios and capital instruments of companies that are not subsidiaries or associates and are not included in the “Trading portfolio”.
TRADING PORTFOLIO
It includes original or acquired financial assets with the objective of realizing them in the short-term that are part of a portfolio of financial instruments identified and managed jointly, for which there is proof of recent actions to obtain gains in the short-term.
Derivative instruments not assigned to a coverage operation and hybrid financial assets completely assessed at their fair value also form part of this portfolio.
In hybrid financial assets that include, at the same time, a main contract and a financial derivative, both components are separated and treated independently for the purpose of classifying and valuing them. When segregation is not possible, they are measured at fair value.
Valuation
In their initial recognition on the balance sheet, all financial investments are recognized at the fair value of the remuneration provided plus, in the case of financial investments not classified in the “Trading portfolio”, the transaction costs that are directly attributable to their acquisition. The fair value is the price that would be received for the sale of a financial asset by means of an orderly transaction between participants on the market on the measurement date.
Thereafter, the financial investments are assessed at their fair value, without deducting any transaction costs which may be incurred in their sale or any other form of disposal, with the following exceptions: financial assets that are capital instruments whose fair value cannot be reliably estimated, as well as derivatives which have these instruments as underlying assets and are settled through the delivery of said assets, which are valued at cost.
The fair value assessments of the financial investments included in the available-for-sale portfolio and in the trading portfolio have been classified according to the levels of the variables used in their assessment:
> Level 1 Quote price: Unadjusted price quoted in active markets.
> Level 2 Observable data: Prices quoted in active markets for instruments similar to the one being assessed, or other assessment techniques in which all the significant variables are based on observable market data. The assessment is carried out via a model that discounts future cash flows, including the reimbursement value, using a yield curve with two main components:

34 ANNUAL REPORT 2017
1. Zero coupon swap curve of the currency of in which the issue is denominated, which is considered to be the best approximation to the risk-free interest rate.
2. Spread of the additional risk, which will be the spread added to or less the zero coupon swap curve that reflects the risks inherent to the issue measured, such as: Credit, Liquidity and Optionality Risk.
> Level 3 Other valuations: Specific variables for each case. For these purposes, it is possible to distinguish between:
– Equities, where in general the realizable value is estimated according to the individual characteristics of the asset.
– Fixed-income assets with complex future cash flow structures (interest rates linked to financial variables, with caps and/or floors) and one or more early amortizations, and in which the issuer has no similar issues on the market or any unquoted issues from an issuer with no similar issues. In these cases, the assets are usually assessed by requesting a benchmark valuation from third party.
Changes in the observable variables used in the aforementioned individual valuations would not materially alter the fair value obtained.
Impairment
The book value of the financial investments is corrected via a charge to the consolidated income statement when there is objective evidence that an event has occurred which entails a negative impact on its future cash flows, or in any other circumstance that would indicate not being able to recover the cost of investment of the financial instrument. The amount of losses due to impairment is equal to the difference between their book value and the current value of its future estimated cash flows.
For fixed-income securities in which there is a default on interest and/or principal, the potential loss is estimated according to the situation of the issuer. For all other fixed-income securities, an analysis is undertaken based on their credit rating and the degree of solvency of the issuers, proceeding to register the impairment if it is considered that the risk of default is likely.
For equity instruments, an individual analysis of the investments is undertaken to determine whether or not they are impaired. Furthermore, it is considered that there is a sign of impairment when the market value decreases over a prolonged period (18 months) or materially (40 percent) in terms of its cost.
The amount of estimated losses due to impairment is recognized in the consolidated income statement, also
including any reduction of the fair value of the investments previously recognized in "Revaluation adjustments". The reversal is recognized in the consolidated income statement, except for in the case of equity instruments. In this case, the valuation adjustment registered in previous fiscal years is not recognized in the income statement, but rather any increase in value is allocated directly to equity.
5.5 IMPAIRMENT OF OTHER ASSETS
At the end of each fiscal year, the Group evaluates whether there are any signs that the asset items may have depreciated. If such evidence exists, the recoverable value of the asset is estimated
For assets that are not in use conditions and intangible assets with an indefinite useful life, the recoverable value is estimated whether or not there are signs of impairment.
If the book value exceeds the recoverable amount, a loss is recognized for this excess, reducing the book value of the asset to its recoverable amount.
If there is an increase in the recoverable value of an asset other than goodwill, the loss due to the previously recognized impairment is reversed, increasing the book value of the asset to its recoverable value. This increase never exceeds the book value net of amortization that would be registered had an impairment loss not been recognized in previous years. The reversal is recognized in the consolidated income statement, unless the asset has already been revalued against “Revaluation adjustments”, in which case the reversal is treated as a revaluation increase. Following this reversal, the amortization cost is adjusted for subsequent periods.
5.6 RECEIVABLES
These assets are generally valued using the amortized cost, calculated according to the effective interest rate method, deducting, if applicable, the provisions for losses due to stated impairments of the value.
When there is objective evidence that a loss was incurred due to impairment, the corresponding provision has been constituted for the amount estimated not to be recoverable. This amount is equivalent to the difference between the book value of the asset and the current value of the future cash flows, discounted at the original effective interest rate of the financial asset, and the loss is recognized on the fiscal year consolidated income statement.
The Group calculates and provides the insolvency provision through an individualized system for monitoring balances with reinsurance companies. The basis of calculation are the balances pending collection with each reinsurance company and, depending on the corresponding time period, the

35Consolidated Annual Accounts
provision is 50 percent for six-month balances and 100 percent for balances due more than nine months ago. Similarly, the balances with reinsurance companies in the settlement process are taken into account. The impairment is recognized in the consolidated income statement.
5.7 CASH
Cash consists of cash (cash and demand bank deposits) and cash equivalents, which correspond to highly liquid short-term investments (maximum three months) that can be easily converted into fixed amounts of cash and have an insignificant risk of change in value.
5.8 ADJUSTMENTS FOR PREPAYMENT
The fees and other acquisition expenses corresponding to the accrued premiums that can be allocated to the period between the closing date and the end of coverage of the contracts are essentially included under the heading of the asset. The expenses allocated to the results correspond to those actually incurred in the period in accordance with the provisions in Note 5.9.B.1.
In parallel, the amounts of fees and other acquisition expenses for ceded reinsurance that must be allocated to the fiscal year or following fiscal years in accordance with the coverage period of the ceded policies are included under the heading of the liability.
5.9 REINSURANCE OPERATIONS
A) Premiums
ACCEPTED AND RETROCEDED REINSURANCE
These are booked according to the accounts received from the selling companies and, additionally, in retroceded reinsurance operations, consideration is given to the retrocession contracts underwritten.
B) Technical provisions
B.1) ACCEPTED REINSURANCE
> Provision for unearned premiumsProportional reinsuranceAccepted reinsurance operations are accounted for based on the accounts received from the ceding companies. If, when closing the accounting, the last account from the cedent is not available, the balance of the other received accounts is considered a provision for unearned premiums of non-closed accounts for the purpose of not recognizing results in the accounting of these accounts. If, exceptionally, these provisions of non-closed accounts were negatively affected
by the accounting of significant claims payments, as they are related to a certain loss which cannot be compensated by non-closed account transactions, the provision is adjusted by the corresponding amount.
When the last statement and report of pending claims is available, the provisions of non-closed accounts are paid, providing the provisions for unearned premiums according to the information sent by the cedent, repaying contract by contract.
If they are not available, the amount of the deposit of retained premiums for this item will be accounted for as the provision for unearned premiums. As a last resort, an overall premium prepayment method is used.
The acquisition expenses communicated by the cedents are subject to prepayment and are included under the "Adjustments for prepayment" heading of the asset in the consolidated balance sheet, with these expenses corresponding to those actually incurred in the period. When the cedents do not communicate the acquisition expense amounts, they are prepaid risk by risk for the proportional facultative reinsurance and overall for the rest of the proportional business.
Non-proportional reinsuranceThese are booked according to the accounts received from the cedent companies. The provision for non-consumed premiums is estimated by provisioning the premium booked and not earned, using the “pro rata temporis” method.
> Provision for unexpired risksThis is calculated by business line and supplements the provision for unearned premiums in the extent to which this is not sufficient to reflect the valuation of risks and expenses to be covered corresponding to the coverage period that has not elapsed as of the closing date.
> Provision for outstanding claimsProportional reinsuranceThese are provided for the amounts communicated by the cedent or, failing this, for the deposits retained, and include additional provisions for claims made that were not communicated, as well as for deviations of existing claims based on prior experience.
Non-proportional reinsuranceThese are provisioned for the amounts notified by the cedent, additionally estimating using actuarial methods, an “ultimate loss ratio” based on experience. The difference between claims made (paid and pending) notified by the cedent and the specified ultimate loss ratio, is included as a greater provision for claims made and not reported”.

36 ANNUAL REPORT 2017
According to actuarial and statistical estimates, the provision is calculated for known claim deviations.
B.2) Retroceded reinsurance
Retroceded reinsurance operations and their corresponding technical provisions are registered using the same criteria as those applied for accepted reinsurance, based on the underwritten retrocession contracts.
B.3) LIABILITY ADEQUACY TEST
The registered technical provisions are usually subject to a reasonableness test for the purpose of determining their sufficiency on the basis of projections of all future cash flows of current contracts. If, as a result of this test, it is noted that the provisions are insufficient, they are adjusted and charged to the result for the period.
C) Loss ratio
The claims corresponding to accepted reinsurance are booked according to the accounts received from the cedent companies, estimating the last cost expected in the event of non-proportional contracts.
Claims corresponding to ceded and retroceded reinsurance are registered according to the underwritten contracts and under the same criteria applied for accepted reinsurance.
D) Most significant assumptions and other sources for estimating uncertainties
For assets, liabilities, revenue and expenses derived from insurance contracts, as a general rule, the assumptions that served as a basis for issuing these contracts, and that are specified therein, are used.
The estimates and assumptions used are in general reviewed regularly and are based on historical experience and on other factors that have been deemed more reasonable. If these reviews lead to changes in estimates in a given period, their effect shall be applied during that period and, as the case may be, in subsequent periods.
The main assumption is based on the behavior and development of the claims, using their frequency and costs in recent fiscal years. Likewise, delays in paying claims and any other external factor that could affect the estimates are taken into account in the estimates, as well as assumptions on interest rates and foreign currency exchange rates.
For liabilities, the hypotheses are based on the best possible estimate at the time of contract issue, establishing, if there should be proven insufficiency, the necessary provisions to cover them.
In the calculation of the technical provisions, discount techniques are not used for the valuation of future cash flows.
There were no material changes made to the assumptions derived to assess the insurance contracts throughout the fiscal year.
E) Impairment
When there is objective evidence that a loss has been incurred due to impairment of the assets derived from reinsurance contracts, the general valuation criterion indicated in Note 5.6 Receivables is applied.
5.10 PROVISIONS FOR RISKS AND EXPENSES
These are recognized when there is a current obligation (either legal or implicit) as a result of a past event, and a reliable estimate of the obligation amount can be made.
If it is highly likely that part or all of a provision will be reimbursed, and the reimbursement is recognized as a separate asset.
5.11 DEBT
These are generally valued at the amortized cost, using the effective interest rate method.
For debts with a maturity exceeding one year and when the parties have not expressly agreed on the applicable interest rate, they are discounted by taking, as the implicit interest rate, the current market rate for public debt securities with the same or similar term as the maturity of the debt, notwithstanding the consideration of the corresponding risk premium.¬
5.12 GENERAL CRITERIA FOR REVENUE AND EXPENSES
The recognition of revenue and expenses is carried out on an accrual basis, according to which the revenue and expenses are allocated according to the actual flow of goods and services that they represent, regardless of the date of the monetary or financial flow derived from them.

37Consolidated Annual Accounts
5.13 EMPLOYEE REMUNERATION
Remuneration to employees can be short-term, post-employment benefits, compensation for termination, or other share-based medium or long-term remunerations and payments.
a. Short-term remuneration
These are accounted for according to the services provided by employees on an accrual basis.
b. Post-employment benefits
These consist of defined contribution and defined benefit plans, as well as Life insurance covering death between the age of 65 and 77 years.
DEFINED CONTRIBUTION PLANS
These are those in which the company involved makes predetermined contributions to a separate company (whether linked to the Group or external) and has no legal or implicit obligation to make any additional contributions in the event of an insufficiency of assets to honor the payment of benefits.
The amount of benefits to be received by employees is determined by the contributions made plus the yield obtained by the investments in which the fund was materialized.
DEFINED BENEFIT PLANS
These are post-employment benefit plans that differ from defined contribution plans.
The liability recognized in the balance sheet for defined benefit pension plans, registered under the "Provisions for risks and expenses” heading, is equal to the actual value of the defined benefits obligation on the balance sheet date minus, if applicable, the fair value of the assets set aside for the plan.
The defined benefits obligation is determined separately for each plan using the actuarial valuation method of the projected unit credit.
Actuarial losses and gains are registered as equity.
The obligations for defined benefit plans that remain on the balance sheet correspond exclusively to retired personnel.
c. Compensation for termination
This is recognized as a liability and expense when there is a demonstrable agreement to terminate the employment relationship prior to the normal date of retirement of the employee, or when there is an offer to encourage voluntary termination of the contracts.
d. Other share-based medium and long-term remuneration and payments
The accounting record for other long-term remunerations, separate from those described in the prior paragraphs and referring specifically to the years of service or time with the company bonus, follows the aforementioned principles. The only exception is the cost of past services, which is recognized immediately and recorded as an offsetting entry under the "Provisions for risks and expenses” heading, and actuarial gains and losses which are registered in the consolidated income statement.
INCENTIVE PLANS
In fiscal year 2016, a medium-term incentive plan was approved for certain members of MAPFRE’s executive team. The plan is not cumulative and is multi-year, commencing on January 1, 2016 and ending on March 31, 2019, with deferral in the payment of part of the incentives until the 2020-2022 period. The payment of incentives is subject to the fulfillment of certain corporate and specific objectives, as well as the continued employment of beneficiaries of the plan in the Group. This payment will be made partially in cash (50 percent) and partially through the delivery of shares in MAPFRE S.A. (50 percent) and is subject to decrease or retrieval clauses.
At the end of each fiscal year, the fulfillment of the objectives is evaluated, and the amount accrued is registered in the consolidated income statement, with payment to a liabilities account for the cash remuneration and an equity account for the part corresponding to equity instruments. The valuation of the incentive to be received in MAFPRE S.A. shares is conducted taking into account the fair value of the equity instruments allocated as of the date of their concession.
Each year, during the irrevocability period of the concession, the number of equity instruments included in the determination of the transaction amount is adjusted. Following the irrevocability period of the concession, additional adjustments will not be made.
Previously, there was a medium-term incentive plan approved for certain members of the Group's executive team. The plan was not cumulative and was multi-year, commencing on January 1, 2013 and ending on March 31, 2016, having been liquidated at close of fiscal year 2016.

38 ANNUAL REPORT 2017
In fiscal year 2017, the Group approved an incentive plan linked to the value of the MAPFRE S.A. share, with liquidation in cash, revocable, which was valued at the time of approval, according to an option valuation method. The assessed cost has been allocated as a personnel expense item in results during the employee's vesting period, while a liability in favor of the employee is recognized as an offsetting entry. At the end of each fiscal year, the liability is assessed at its fair value, and any change in valuation during the fiscal year is allocated to the consolidated income statement. At the end of fiscal year 2016, the share price was below the benchmark price, and for that reason no rights have been exercised and the plan has been terminated.
5.14 REVENUE AND EXPENSES FROM INVESTMENTS
They are classified between operations and equity depending on their origin, as they are allocated for covering technical provisions or for the materialization of shareholders' equity respectively.
Changes in fair value are registered according to the portfolio into which the financial investments are classified:
a) Trading portfolio
These are recorded directly in the consolidated income statement, distinguishing between the part attributable to returns — which is recorded as interest or, if applicable, as dividends — and the part that is registered as realized and unrealized results.
b) Available-for-sale portfolio
These are recognized directly in the company’s equity until it is written off of the balance sheet or impairment is recorded. In these cases, they are registered in the consolidated income statement.
In all cases, the interest from financial instruments is registered in the consolidated income statement by applying the effective interest rate method.
5.15 RECLASSIFICATION OF EXPENSES BY TYPE, DESTINATION AND ALLOCATION TO AREAS OF ACTIVITY
The criteria to follow for reclassifying expenses by destination are mainly based on the tasks performed by each employee, distributing their direct and indirect cost according to these tasks.
For expenses that are not directly or indirectly related to personnel, individual studies are conducted, allocating these expenses to the destination according to the task performed with said expenses.
The established destinations are as follows:
> Claims-related expenses: Proportionally to the average claims ratio.
> Investment-related expenses: Proportionally to the average technical provisions.
> Other technical expenses: Direct allocation.
> Other non-technical expenses: Direct allocation.
> Acquisition expenses: Proportionally to average premiums.
> Administration expenses: Proportionally to average premiums.
Expenses were allocated to the following segment according to the business from which they originated:
> Accepted Life reinsurance.
> Accepted Non-Life reinsurance.
5.16 TRANSACTIONS AND BALANCES IN FOREIGN CURRENCY
With the exception of reinsurance operations, transactions in foreign currencies are converted into each Group company's functional currency at the exchange rate in force on the transaction date.
Reinsurance operations in foreign currency are registered at the exchange rate established at the beginning of each month of the fiscal year. Subsequently, at the end of each month, they are all treated as if they were a single operation, being converted at the exchange rate in force at that time and recording the resulting difference in the consolidated income statement.
At the close of the fiscal year, the existing balances denominated in foreign currencies are converted at the exchange rate of the functional currency on that date, and all exchange differences are recorded in the consolidated income statement. The only exception is those which are directly allocated to “Currency conversion differences,” i.e. those arising from the monetary entries that form part of the net investment in a foreign business, and from the non-monetary entries assessed at fair value, where changes in valuation are directly recognized under equity.

39Consolidated Annual Accounts
5.17 TAX ON PROFITS
Tax on profits is treated as an expense in the fiscal year and is recorded as such in the consolidated income statement, including both the tax charge for the current tax and the effect corresponding to the movement in deferred tax.
In order to determine tax on profits, the balance sheet method is followed, whereby the corresponding assets and liabilities that are necessary for deferred tax are registered to correct the effect of temporary differences, which are the differences between the carrying amount of an asset or liability and which comprises their tax valuation.
Temporary differences may be "Taxable temporary differences", which result in higher tax payments in the future and which generally entail the recognition of a deferred tax liability; or "Deductible temporary differences", which result in lower tax payments in the future and, in the extent to which they are recoverable, the registration of a deferred tax asset.
Meanwhile, tax on profits related to items where modifications in their valuation are directly recognized in equity are not allocated to the consolidated income statement but to equity, and the changes in value of said items are recorded net of tax.
a) Recognition of deferred tax liabilities
The Group recognizes deferred tax liabilities in all cases except where:
> they arise from the initial recognition of goodwill or an asset or liability in a transaction that is not a business combination and on the date of the transaction, it does not affect the accounting result nor the tax basis;
> they correspond to differences connected with investments in subsidiaries, associates and joint ventures over which the Group has control at the time of reversal and it is unlikely that there will be any reversal in the foreseeable future.
b) Recognition of deferred tax assets
The Group recognizes deferred tax assets as long as:
> it is probable that there will be sufficient future tax benefits to allow for their compensation. However, assets that arise from the initial recognition of assets are not recognized, nor are liabilities in a transaction that is not a business combination and on the date of the transaction that does not affect the accounting result or the tax basis;
> they correspond to temporary taxable differences connected with investments in subsidiaries, associates and joint ventures to the extent that the temporary differences will be reversed in the foreseeable future and it is expected that future tax benefits will be generated to offset the differences;
c) Compensation and classification
The Group only offsets income tax assets and liabilities against current earnings if there is a legal right to them with regards to the tax authorities and it intends to liquidate the debt resulting for the net amount or realize the assets and liquidate the liabilities simultaneously.
d) Measurement of deferred tax assets and liabilities
Deferred tax assets and liabilities are measured by tax types as shall apply in the fiscal years in which it is hoped that the assets will be realized or liabilities paid.
The Group revises the book value of the deferred tax assets at the close of fiscal year and decides whether or not conditions are met to recognize any deferred tax assets that were not previously recognized.

40 ANNUAL REPORT 2017
6. Breakdown of the financial statements
6.1 INTANGIBLE ASSETS
The movement of this heading is detailed in the following tables:
2017
ITEMOpening balance
2017Adjustments to
opening balanceChanges in the
consolidation scope
Additions or provisions
Disposals or reductions
Closing balance 2017
COST
GOODWILL
OTHER INTANGIBLE ASSETS 7,491 (4) 787 8,274
Portfolio acquisition expenses
Computer applications 7,491 (4) 787 8,274
Other
TOTAL COST 7,491 (4) 787 8,274
CUMULATIVE DEPRECIATION
OTHER INTANGIBLE ASSETS (6,915) 4 (409) (7,320)
Portfolio acquisition expenses
Computer applications (6,915) 4 (409) (7,320)
Other
TOTAL CUMULATIVE DEPRECIATION (6,915) 4 (409) (7,320)
IMPAIRMENT
GOODWILL
OTHER INTANGIBLE ASSETS
Portfolio acquisition expenses
Computer applications
Other
TOTAL IMPAIRMENT
TOTAL GOODWILL
TOTAL OTHER INTANGIBLE ASSETS 576 378 954
TOTAL INTANGIBLE ASSETS 576 378 954(Figures in thousands of euros)

41Consolidated Annual Accounts
2016
ITEMOpening balance
2016Adjustments to
opening balanceChanges in the
consolidation scope
Additions or provisions
Disposals or reductions
Closing balance 2016
COST
GOODWILL
OTHER INTANGIBLE ASSETS 7,778 6 26 (319) 7,491
Portfolio acquisition expenses
Computer applications 7,778 6 26 (319) 7,491
Other
TOTAL COST 7,778 6 26 (319) 7,491
CUMULATIVE DEPRECIATION
OTHER INTANGIBLE ASSETS (6,744) (6) (484) 319 (6,915)
Portfolio acquisition expenses
Computer applications (6,744) (6) (484) 319 (6,915)
Other
TOTAL CUMULATIVE DEPRECIATION (6,744) (6) (484) 319 (6,915)
IMPAIRMENT
GOODWILL
OTHER INTANGIBLE ASSETS
Portfolio acquisition expenses
Computer applications
Other
TOTAL IMPAIRMENT
TOTAL GOODWILL
TOTAL OTHER INTANGIBLE ASSETS 1,034 (458) 576
TOTAL INTANGIBLE ASSETS 1,034 (458) 576(Figures in thousands of euros)
“Entries” in fiscal year 2017 mainly correspond to the development of own applications restricted to the adjustment of current systems to new accounting standards (IFRS 17) and “2016 quotes” in 2016.
Exits seen in fiscal year 2016 were fully-amortized intangible fixed assets.
The amortization of intangible assets with finite useful life has been registered in the "Depreciation provision" expenses account.
The cost of fully-amortized intangible fixed assets at the close of fiscal year 2017 came to 6,814,000 euros (5,750,000 euros at close of fiscal year 2016).

42 ANNUAL REPORT 2017
6.2 PROPERTY, PLANT AND EQUIPMENT AND PROPERTY INVESTMENT
Property, plant and equipment
The movement of this heading is detailed in the following tables:
2017
ITEM
Opening balance 2017
Adjustments to opening
balance
Changes in the
consolidation scope
Additions or provisions
Disposals or reductions
Closing balance 2017
Marketvalue
COST
PROPERTY FOR OWN USE 52,665 (215) 52,450 51,455
Land and natural resources 30,216 30,216 29,643
Buildings and other structures 22,449 (215) 22,234 21,812
OTHER PROPERTY, PLANT AND EQUIP-MENT
11,212 (106) 2,600 (259) 13,447 6,497
Vehicles 569 (10) 94 (110) 543 264
Furniture and fittings 5,778 (40) 1,818 (121) 7,435 3,594
Other property, plant and equipment 4,865 (56) 688 (28) 5,469 2,639
Advances and construction in progress
TOTAL COST 63,877 (321) 2,600 (259) 65,897 57,952
CUMULATIVE DEPRECIATION
PROPERTY FOR OWN USE (1,689) 28 (432) (102) (2,195)
OTHER PROPERTY, PLANT AND EQUIPMENT (6,447) 88 (915) 319 (6,950)
TOTAL CUMULATIVE DEPRECIATION (8,136) 116 (1,347) 217 (9,145)
IMPAIRMENT
PROPERTY FOR OWN USE (1,224) (1,224)
Land and natural resources
Buildings and other structures (1,224) (1,224)
OTHER PROPERTY, PLANT AND EQUIP-MENT
Vehicles
Furniture and fittings
Other property, plant and equipment
Advances and construction in progress
TOTAL IMPAIRMENT (1,224) (1,224)
TOTAL OWNED PROPERTY 49,752 (187) (432) (102) 49,031 51,455
TOTAL OTHER PROPERTY, PLANT AND EQUIPMENT
4,765 (18) 1,685 60 6,497 6,497
TOTAL PROPERTY, PLANT AND EQUIP-MENT
54,517 (205) 1,253 (42) 55,528 57,952
(Figures in thousands of euros)
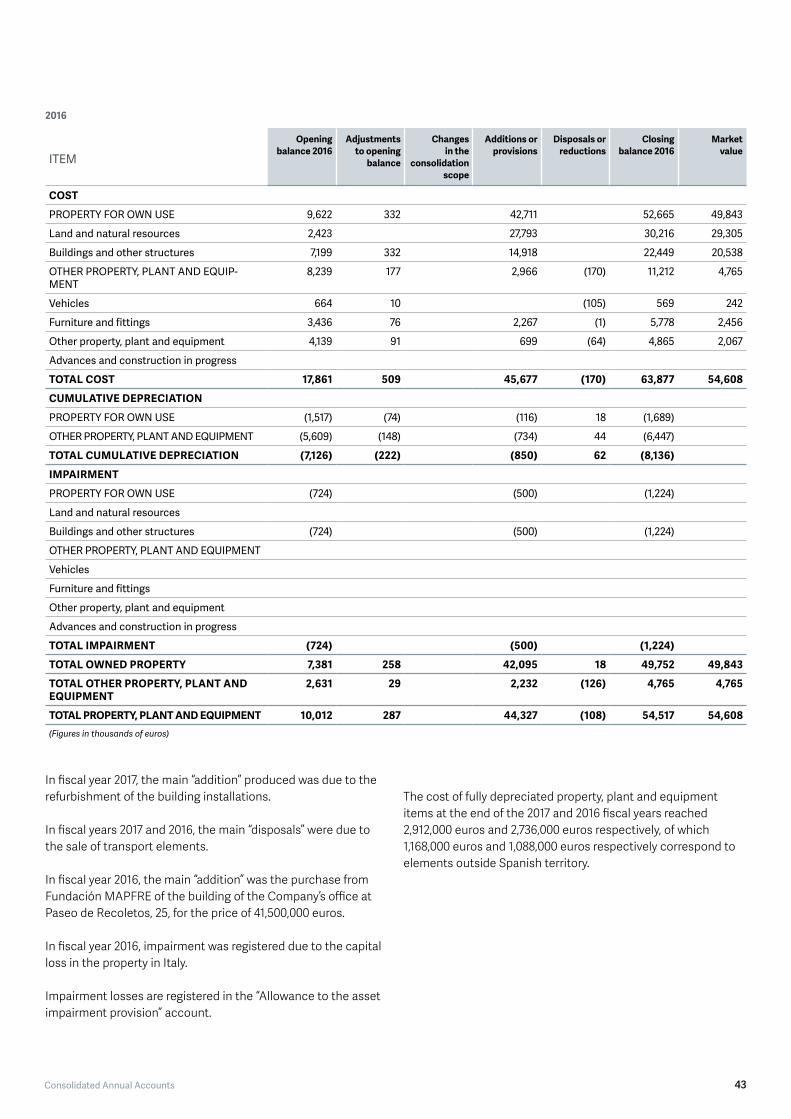
43Consolidated Annual Accounts
2016
ITEM
Opening balance 2016
Adjustments to opening
balance
Changes in the
consolidation scope
Additions or provisions
Disposals or reductions
Closing balance 2016
Marketvalue
COST
PROPERTY FOR OWN USE 9,622 332 42,711 52,665 49,843
Land and natural resources 2,423 27,793 30,216 29,305
Buildings and other structures 7,199 332 14,918 22,449 20,538
OTHER PROPERTY, PLANT AND EQUIP-MENT
8,239 177 2,966 (170) 11,212 4,765
Vehicles 664 10 (105) 569 242
Furniture and fittings 3,436 76 2,267 (1) 5,778 2,456
Other property, plant and equipment 4,139 91 699 (64) 4,865 2,067
Advances and construction in progress
TOTAL COST 17,861 509 45,677 (170) 63,877 54,608
CUMULATIVE DEPRECIATION
PROPERTY FOR OWN USE (1,517) (74) (116) 18 (1,689)
OTHER PROPERTY, PLANT AND EQUIPMENT (5,609) (148) (734) 44 (6,447)
TOTAL CUMULATIVE DEPRECIATION (7,126) (222) (850) 62 (8,136)
IMPAIRMENT
PROPERTY FOR OWN USE (724) (500) (1,224)
Land and natural resources
Buildings and other structures (724) (500) (1,224)
OTHER PROPERTY, PLANT AND EQUIPMENT
Vehicles
Furniture and fittings
Other property, plant and equipment
Advances and construction in progress
TOTAL IMPAIRMENT (724) (500) (1,224)
TOTAL OWNED PROPERTY 7,381 258 42,095 18 49,752 49,843
TOTAL OTHER PROPERTY, PLANT AND EQUIPMENT
2,631 29 2,232 (126) 4,765 4,765
TOTAL PROPERTY, PLANT AND EQUIPMENT 10,012 287 44,327 (108) 54,517 54,608(Figures in thousands of euros)
In fiscal year 2017, the main “addition” produced was due to the refurbishment of the building installations.
In fiscal years 2017 and 2016, the main “disposals” were due to the sale of transport elements.
In fiscal year 2016, the main “addition” was the purchase from Fundación MAPFRE of the building of the Company’s office at Paseo de Recoletos, 25, for the price of 41,500,000 euros.
In fiscal year 2016, impairment was registered due to the capital loss in the property in Italy.
Impairment losses are registered in the “Allowance to the asset impairment provision” account.
The cost of fully depreciated property, plant and equipment items at the end of the 2017 and 2016 fiscal years reached 2,912,000 euros and 2,736,000 euros respectively, of which 1,168,000 euros and 1,088,000 euros respectively correspond to elements outside Spanish territory.

44 ANNUAL REPORT 2017
Property Investment
The movement of this heading is detailed in the following tables:
2017
ITEMOpening
balance 2017Adjustments
to opening balance
Changes in the consolidation
scope
Additions or provisions
Disposals or reductions
Closing balance 2017
Marketvalue
COST
INVESTMENT IN PROPERTY 10,407 (65) 10,342 8,556
Land and natural resources 2,132 (26) 2,106 1,743
Buildings and other structures 8,275 (39) 8,236 6,813
OTHER PROPERTY INVESTMENTS
TOTAL COST 10,407 (65) 10,342 8,556
CUMULATIVE DEPRECIATION
INVESTMENT IN PROPERTY (4,032) 11 (164) 34 (4,151)
OTHER PROPERTY INVESTMENTS
TOTAL CUMULATIVE DEPRECIATION (4,032) 11 (164) 34 (4,151)
IMPAIRMENT
INVESTMENT IN PROPERTY
Land and natural resources
Buildings and other structures
OTHER PROPERTY INVESTMENTS
TOTAL IMPAIRMENT
TOTAL PROPERTY INVESTMENT 6,375 (54) (164) 34 6,191 8,556(Figures in thousands of euros)
2016
ITEM
Opening balance 2016
Adjustments to opening
balance
Changes in the
consolidation scope
Additions or provisions
Disposals or reductions
Closing balance 2016
Marketvalue
COST
INVESTMENT IN PROPERTY 8,972 156 1,279 10,407 7,832
Land and natural resources 1,715 34 384 2,133 2,620
Buildings and other structures 7,257 122 895 8,274 5,212
OTHER PROPERTY INVESTMENTS
TOTAL COST 8,972 156 1,279 10,407 7,832
CUMULATIVE DEPRECIATION
INVESTMENT IN PROPERTY (3,820) (309) (49) 146 (4,032)
OTHER PROPERTY INVESTMENTS
TOTAL CUMULATIVE DEPRECIATION (3,820) (309) (49) 146 (4,032)
IMPAIRMENT
INVESTMENT IN PROPERTY
Land and natural resources
Buildings and other structures
OTHER PROPERTY INVESTMENTS
TOTAL IMPAIRMENT
TOTAL PROPERTY INVESTMENT 5,152 (153) 1,230 146 6,375 7,832(Figures in thousands of euros)

45Consolidated Annual Accounts
The market value of property investments and property for own use basically correspond to the appraisal value determined by an independent appraisal company, depending on observable market variables (Level 2). The valuation methods generally used correspond to the cost method, comparison method, future rental income method and abbreviated residual method, depending on the characteristics of the property being appraised.
On the other hand, the majority of property are assets assigned to the technical provisions and appraisals are performed on a regular basis, as established by the regulatory bodies of the insurance activities, for a review of their valuation.
Property investment revenue and expenses is detailed in the following table:
ITEM
INVESTMENTS IN
OPERATION EQUITY TOTAL
2017 2016 2017 2016 2017 2016
Income from property investments
From rentals 537 477 14 1 551 478
Gains on disposals
TOTAL INCOME FROM INVESTMENT PROPERTY 537 477 14 1 551 478
Property investment expenses
Direct operating expenses (117) (62) (117) (62)
Other expenses (69) (37) (69) (37)
TOTAL EXPENSES FROM PROPERTY INVESTMENTS (186) (99) (186) (99)(Figures in thousands of euros)
6.3 LEASING
The Group has been the lessor of the following items through operating lease contracts:
ASSET TYPENET BOOK VALUE MAXIMUM TERM OF CONTRACTS MAXIMUM YEARS
ELAPSED
2017 2016 2017 2016 2017 2016
Belgium property 3.308 3.457 14 14 14 13
Chile property 1.619 1.639 1 1 Renewableannually
RenewableannuallyMansardas R-25 1.264 1.279 4 4
TOTAL 6.191 6.375(Figures in thousands of euros)

46 ANNUAL REPORT 2017
At close, minimum future collections to be received by way of operating leasing that cannot be canceled are as follows:
ITEMMinimum
collections 2017Minimum
collections 2016
Less than one year 655 959
More than one year but less than five 2,945 4,401
More than five years 1,506 3,026
Total 5,106 8,386(Figures in thousands of euros)
No contingent payments are registered as revenue in the 2017 and 2016 fiscal years.
The future minimum payments to be realized on operating leases that cannot be canceled as of December 31 are as follows:
ITEMMinimum
collections 2017Minimum
collections 2016
Less than one year 124 280
More than one year but less than five 4
More than five years 5
Total 133 280(Figures in thousands of euros)
The Group is, at present, the lessee of various floors of the building at number 14 calle Bárbara de Braganza, paying lease charges in 2017 of 193,000 euros (187,000 euros in 2016). In 2016, total payments made for lease charges came to 2,636,000 euros for the lease until November of the company offices that were thereafter purchased.
No contingent payments were registered as expenses in the fiscal years 2017 and 2016.
6.4 FINANCIAL INVESTMENTS
The breakdown of financial investments at close, is as follows:
ITEM BOOK VALUE
2017 2016
AVAILABLE-FOR-SALE PORTFOLIO
Shares 231,749 220,816
Fixed income 2,837,413 2,995,085
Mutual Funds 158,365 173,146
Other
TOTAL AVAILABLE-FOR-SALE PORTFOLIO
3,227,527 3,389,047
TRADING PORTFOLIO
Other investments
Shares 46 80
Fixed income 3,384
Mutual Funds 22,870 32,183
Hybrids
Deposits
Other
TOTAL TRADING PORTFOLIO 22,916 35,647
(Figures in thousands of euros)
The valuation process for financial assets is as follows:
a) When acquired, it is assigned to a specific portfolio (held-to-maturity, available for sale, or trading) depending on the characteristics of the liabilities to which it is going to be assigned, and on local and international accounting and insurance legislation.
b) The accounting nature of the portfolios dictates the type of valuation. For all assets, however, at least once a year, a market valuation is performed, using the valuation methods described above in Note 5.4 “Financial investments” (Level 1, Level 2 and Level 3).
c) The valuations are performed directly by the Group companies, although in some countries an independent financial institution conducts these valuations in line with the local regulations.
The valuation policy is decided by the Investment Committees and/or Risk Committees and is reviewed at least once a quarter.
Furthermore, the Executive Committee of MAPFRE S.A. regularly analyzes the value of all investments, and capital gains and losses.
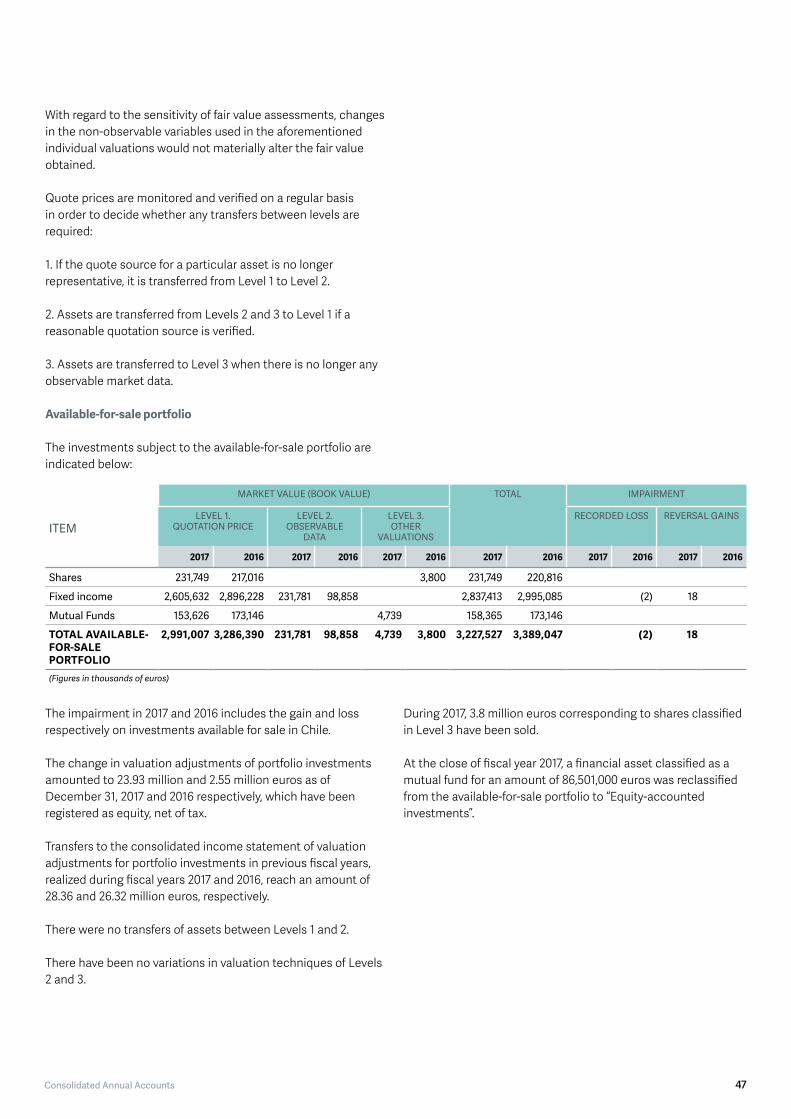
47Consolidated Annual Accounts
With regard to the sensitivity of fair value assessments, changes in the non-observable variables used in the aforementioned individual valuations would not materially alter the fair value obtained.
Quote prices are monitored and verified on a regular basis in order to decide whether any transfers between levels are required:
1. If the quote source for a particular asset is no longer representative, it is transferred from Level 1 to Level 2.
2. Assets are transferred from Levels 2 and 3 to Level 1 if a reasonable quotation source is verified.
3. Assets are transferred to Level 3 when there is no longer any observable market data.
Available-for-sale portfolio
The investments subject to the available-for-sale portfolio are indicated below:
ITEM
MARKET VALUE (BOOK VALUE) TOTAL IMPAIRMENT
LEVEL 1. QUOTATION PRICE
LEVEL 2. OBSERVABLE
DATA
LEVEL 3. OTHER
VALUATIONS
RECORDED LOSS REVERSAL GAINS
2017 2016 2017 2016 2017 2016 2017 2016 2017 2016 2017 2016
Shares 231,749 217,016 3,800 231,749 220,816
Fixed income 2,605,632 2,896,228 231,781 98,858 2,837,413 2,995,085 (2) 18
Mutual Funds 153,626 173,146 4,739 158,365 173,146
TOTAL AVAILABLE-FOR-SALE PORTFOLIO
2,991,007 3,286,390 231,781 98,858 4,739 3,800 3,227,527 3,389,047 (2) 18
(Figures in thousands of euros)
The impairment in 2017 and 2016 includes the gain and loss respectively on investments available for sale in Chile.
The change in valuation adjustments of portfolio investments amounted to 23.93 million and 2.55 million euros as of December 31, 2017 and 2016 respectively, which have been registered as equity, net of tax.
Transfers to the consolidated income statement of valuation adjustments for portfolio investments in previous fiscal years, realized during fiscal years 2017 and 2016, reach an amount of 28.36 and 26.32 million euros, respectively.
There were no transfers of assets between Levels 1 and 2.
There have been no variations in valuation techniques of Levels 2 and 3.
During 2017, 3.8 million euros corresponding to shares classified in Level 3 have been sold.
At the close of fiscal year 2017, a financial asset classified as a mutual fund for an amount of 86,501,000 euros was reclassified from the available-for-sale portfolio to “Equity-accounted investments”.

48 ANNUAL REPORT 2017
Trading portfolio
The investments subject to the trading portfolio are detailed below:
ITEM
MARKET VALUE (BOOK VALUE) TOTAL GAINS (LOSSES) ALLOCATED TO RESULTS
LEVEL 1. QUOTATION PRICE
LEVEL 2. OBSERVABLE
DATA
LEVEL 3. OTHER
VALUATIONS
UNREALIZED REALIZED
2017 2016 2017 2016 2017 2016 2017 2016 2017 2016 2017 2016
OTHER INVESTMENTS IN THE TRADING PORTFOLIO
Shares 46 80 46 80
Fixed income 3,384 3,384 351 25
Mutual Funds 22,870 32,183 22,870 32,183 (56)
Other
TOTAL OTHER INVESTMENTS
22,870 35,567 46 80 22,916 35,647 351 (31)
TOTAL TRADING PORTFOLIO
22,870 35,567 46 80 22,916 35,647 351 (31)
(Figures in thousands of euros)
The gains and losses of the trading portfolio are registered in the income statement, information on which is available in Note 6.14 “Revenue and expenses from investments”.
Note 7 “Risk management” details the maturity of fixed-income securities.
6.5 RECEIVABLES
The breakdown of the “Receivables” heading, as well as impairment losses and reversal gains registered in the last two fiscal years, is as follows:
ITEM
GROSS AMOUNT IMPAIRMENT NET BALANCE ON BALANCE
SHEET
IMPAIRMENT GUARANTEESRECEIVED
RECORDED LOSSES
REVERSAL GAINS
2017 2016 2017 2016 2017 2016 2017 2016 2017 2016 2017 2016
Receivables on reinsurance operations
324,128 293,825 (6,864) (10,674) 317,264 283,151 (4,766) 3,828 5,683
II. Tax receivables 11,217 17,087 11,217 17,087
III. Corporate and other receivables
9,368 5,734 9,368 5,734
TOTAL 344,713 316,646 (6,864) (10,674) 337,849 305,972 (4,766) 3,828 5,683(Figures in thousands of euros)
The balances included in the “Receivables” heading do not accrue interest, and their settlement is generally produced in the following fiscal year.
Outstanding balances arising from “Ceded, retroceded and accepted reinsurance operations” are included in the "Receivables on reinsurance operations" entry.
The calculation and, if applicable, recognition of impairments is performed as detailed in Note 5.6 "Receivables" in this annual report.

49Consolidated Annual Accounts
The breakdown of the section on “Corporate and other receivables” is as follows:
Corporate and other receivablesAMOUNT
2017 2016
Receivables for claims recovery 84
Balance receivables from personnel 1,454 1,703
Other debtors 7,914 3,947
Total 9,368 5,734(Figures in thousands of euros)
6.6 ASSET IMPAIRMENT
The impairment of assets in the last two fiscal years is detailed in the following tables:
2017
IMPAIRMENT IN
OPENING BALANCE
ADJUST-MENTS
TO OPENING BALANCE
CHANGESIN THE
CONSOL-IDATION SCOPE
REGISTERED IN RESULTS REGISTERED DIRECTLY INEQUITY
WRITE-OFF OF ASSET
CLOSING BALANCE
Increase Decrease Increase Decrease
INTANGIBLE ASSETS
I. Goodwill
II. Other intangible assets
PROPERTY, PLANT AND EQUIPMENT
1,224 1,224
I. Property for own use 1,224 1,224
II. Other property, plant and equipment
INVESTMENT 2,034 (2,016) (18)
I. Property investments
II. Financial investments 131 (113) (18)
- Held-to-maturity portfolio
- Available-for-sale portfolio 131 (113) (18)
- Trading portfolio
III. Investment recorded in accordance with equity method
1,903 (1,903)
IV. Deposits established for accepted reinsurance
V. Other investments
RECEIVABLES 10,674 (3,810) 6,864
I. Receivables on direct insurance and co-insurance operations
II. Receivables on reinsurance operations
10,674 (3,810)
III. Tax receivables
IV. Corporate and other receivables
V. Shareholders, called capital
OTHER ASSETS
TOTAL IMPAIRMENT 13,932 (2,016) (3,828) 8,088(Figures in thousands of euros)

50 ANNUAL REPORT 2017
2016
IMPAIRMENT IN
OPENING BALANCE
ADJUST-MENTS
TO OPENING BALANCE
CHANGESIN THE
CONSOL-IDATION SCOPE
REGISTERED IN RESULTS REGISTERED DIRECTLY IN
EQUITY
WRITE-OFF OF ASSET
CLOSING BALANCE
Increase Decrease Increase Decrease
INTANGIBLE ASSETS
I. Goodwill
II. Other intangible assets
PROPERTY, PLANT AND EQUIPMENT
724 500 1,224
I. Property for own use 724 500 1,224
II. Other property, plant and equipment
INVESTMENT 932 84 1,016 2 2,034
I. Property investments
II. Financial investments 59 5 65 2 131
- Held-to-maturity portfolio
- Available-for-sale portfolio 59 5 65 2 131
- Trading portfolio
III. Investment recorded in accordance with equity method
873 79 951 1,903
IV. Deposits established for accepted reinsurance
V. Other investments
RECEIVABLES 11,592 4,765 (5,683) 10,674
I. Receivables on direct insurance and co-insurance operations
II. Receivables on reinsurance operations
11,592 4,765 (5,683) 10,674
III. Tax receivables
IV. Corporate and other receivables
V. Shareholders, called capital
OTHER ASSETS
TOTAL IMPAIRMENT 13,248 84 1,016 5,267 (5,683) 13,932(Figures in thousands of euros)
6.7 CASH
There are no material non-cash transactions related to investment and financing activities that were excluded in the cash flow statement.
The cash balance breakdown for the last two fiscal years is as follows:
ITEM 2017 2016
Cash deposited in banks 145,480 98,302
Cash equivalents in banks 54,294 41,720
TOTAL 199,774 140,022(Figures in thousands of euros)
6.8 EQUITY
Share Capital:
The share capital is registered by the nominal value of disbursed shares, shares whose disbursement has been demanded.
The share capital of the controlling Company, as of December 31 in the last two fiscal years, is represented by 72,231,068 nominative shares, each with a nominal value of 3.10 euros, fully subscribed and disbursed. All shares carry the same voting and financial rights.
In their meeting held on March 3, 2015, the controlling Company's Board of Directors agreed to propose at the Annual General Meeting, in accordance with the provisions of Article 297.1b) of the Capital Companies Act, the option of increasing

51Consolidated Annual Accounts
the share capital once or several times to a maximum of 111,958,000 euros, equivalent to 50 percent of the current share capital, over the next five years from the date of this agreement.
MAPFRE S.A. holds 92.25 percent of the share capital as of December 31, 2017 and 2016.
The shares representing the share capital of the controlling Company are not admitted to official trading.
Revaluation adjustments:
This includes the equity reserves arising as a consequence of revenues and expenses recognized in each fiscal year which, in accordance with IFRS, must be directly recorded in the Group’s equity accounts.
The following table shows the nature of the "Revaluation adjustments" recorded under the “Equity” heading at the end of the last two fiscal years:
ItemAMOUNT
2017 2016
Fixed Income
Capital gains 64,433 84,215
Capital losses
Equities and Mutual Funds
Capital gains 16,686 20,833
Capital losses
Shadow accounting
Other adjustments
Total 81,119 105,048(Figures in thousands of euros)
Restrictions on the availability of reserves:
The “Reserves” heading includes the controlling Company's legal reserve, amounting to 44.8 million euros in the last two fiscal years, which may not be distributed to shareholders, except in the event of the controlling Company's liquidation, and may only be used to offset potential losses.
The same restriction applies to the legal reserves established by subsidiaries and reflected in their balance sheets.
There are no other restrictions on the availability of reserves for any material amount.
Capital Management:
Capital management is focused on its stability and the maintenance of suitable remunerations through strong levels
of solvency, financial flexibility, cash flow generation and the creation of shareholder value.
The capital managed corresponds to shareholders' equity that are admissible in accordance with current regulations and other management models applied.
In accordance with the Group’s risk appetite, which corresponds to the level of risk that the Group is willing to assume to attain its business objectives with no relevant deviations (including in adverse situations), each Business Unit adjusts its levels of risk tolerance based on the capital allocated.
MAPFRE has an internal capitalization and dividend policy that is designed to provide the Business Units with the necessary capital to cover the risks that have been assumed in a rational and objective way. The amount of dividends to be distributed is established based on the results budgets and estimates of shareholders' equity. In the case that the real performance differs from the estimates provided, the capital allocated is reviewed.
Shareholders’ remunerations are linked to the profits, solvency, liquidity and investment plans of the Group, as well as shareholders’ expectations.
As a general rule, the Board of Directors proposes at the Annual General Meeting a distribution of dividends of between 45 percent and 65 percent of the attributable result for the period in its consolidated income statement. Both the estimation of risks, and the allocation of capital to each of the Units, are detailed in Note 7 of the report titled “Risk management”.
Additionally, the items which form part of the Group’s available equity are in accordance with the requirements of current legislation.
The company belongs to a consolidated group of insurance companies headed up by MAPFRE S.A. This company is required to submit statistical and accounting information on solvency to the General Management of Insurance and Pension Funds for regulatory purposes.
In the field of supervision, the calculation of the Group’s solvency is carried out through a combination of the consolidation-based method, which is applied for all companies except for those domiciled in countries that are considered equivalent or provisionally equivalent, to which the deduction and aggregation method is applied. Similarly, those companies outside of the European Economic Area which have little material effects on the Group’s solvency are excluded from this calculation.

52 ANNUAL REPORT 2017
The companies included within the consolidation scope are detailed in Annex 1, indicating the methods used for their accounting integration and the calculation of solvency.
6.9 TECHNICAL PROVISIONS
1. Breakdown of the balance composition of technical provisions
The breakdown of the balance of each of the technical provisions shown is as follows:
ITEMACCEPTED REINSURANCE CEDED AND RETROCEDED REINSURANCE
2017 2016 2017 2016
1 - Provisions for Non-Life unearned premiums and unexpired risks
1,098,699 1,330,416 308,597 307,036
1.1 Provision for unearned premiums 1,098,699 1,330,416 308,597 307,036
1.2 Provision for unexpired risks
2 - Provisions for Life insurance 597,166 549,736 34,171 5,878
2.1 Provisions for unearned premiums and unexpired risks 511,117 457,687 4,668 5,878
2.1.1 Provisions for unearned premiums 511,117 457,687 4,668 5,878
2.1.2 Provisions for unexpired risks
2.2 Mathematical reserves 86,049 92,049 29,503
2.3 Provisions for share in profits
3 - Provisions for outstanding claims 2,946,726 1,917,001 1, 133,254 443,009
3.1 Pending settlement or payment 2,946,726 1,917,001 1,133,254 443,009
3.2 Claims incurred but not reported (IBNR)
3.3 For claim settlement internal expenses
4 - Other technical provisions
4.1 Burial
4.2 Other
TOTAL 4,642,591 3,797,153 1,476,022 755,923(Figures in thousands of euros)
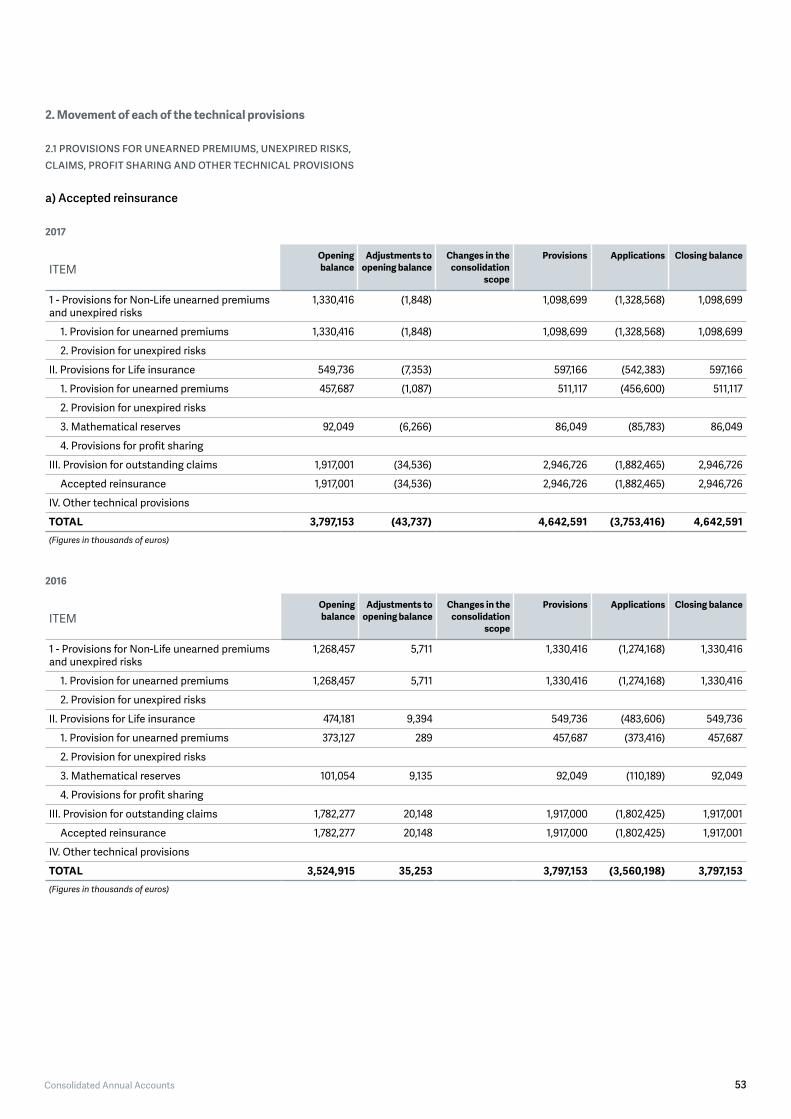
53Consolidated Annual Accounts
2. Movement of each of the technical provisions
2.1 PROVISIONS FOR UNEARNED PREMIUMS, UNEXPIRED RISKS, CLAIMS, PROFIT SHARING AND OTHER TECHNICAL PROVISIONS
a) Accepted reinsurance
2017
ITEMOpening balance
Adjustments toopening balance
Changes in the consolidation
scope
Provisions Applications Closing balance
1 - Provisions for Non-Life unearned premiums and unexpired risks
1,330,416 (1,848) 1,098,699 (1,328,568) 1,098,699
1. Provision for unearned premiums 1,330,416 (1,848) 1,098,699 (1,328,568) 1,098,699
2. Provision for unexpired risks
II. Provisions for Life insurance 549,736 (7,353) 597,166 (542,383) 597,166
1. Provision for unearned premiums 457,687 (1,087) 511,117 (456,600) 511,117
2. Provision for unexpired risks
3. Mathematical reserves 92,049 (6,266) 86,049 (85,783) 86,049
4. Provisions for profit sharing
III. Provision for outstanding claims 1,917,001 (34,536) 2,946,726 (1,882,465) 2,946,726
Accepted reinsurance 1,917,001 (34,536) 2,946,726 (1,882,465) 2,946,726
IV. Other technical provisions
TOTAL 3,797,153 (43,737) 4,642,591 (3,753,416) 4,642,591(Figures in thousands of euros)
2016
ITEMOpening balance
Adjustments toopening balance
Changes in the consolidation
scope
Provisions Applications Closing balance
1 - Provisions for Non-Life unearned premiums and unexpired risks
1,268,457 5,711 1,330,416 (1,274,168) 1,330,416
1. Provision for unearned premiums 1,268,457 5,711 1,330,416 (1,274,168) 1,330,416
2. Provision for unexpired risks
II. Provisions for Life insurance 474,181 9,394 549,736 (483,606) 549,736
1. Provision for unearned premiums 373,127 289 457,687 (373,416) 457,687
2. Provision for unexpired risks
3. Mathematical reserves 101,054 9,135 92,049 (110,189) 92,049
4. Provisions for profit sharing
III. Provision for outstanding claims 1,782,277 20,148 1,917,000 (1,802,425) 1,917,001
Accepted reinsurance 1,782,277 20,148 1,917,000 (1,802,425) 1,917,001
IV. Other technical provisions
TOTAL 3,524,915 35,253 3,797,153 (3,560,198) 3,797,153(Figures in thousands of euros)

54 ANNUAL REPORT 2017
b) Retroceded reinsurance
2017
ITEMOpening balance Adjustments to
opening balanceChanges in the
consolidation scope
Provisions Applications Closing balance
Provision for unearned premiums 307,036 (925) 308,597 (306,111) 308,597
Provision for Life insurance 5,878 198 4,668 (6,076) 4,668
Provision for outstanding claims 443,009 (3,884) 1,162,757 (439,125) 1,162,757
Other technical provisions
TOTAL 755,923 (4,611) 1,476,022 (751,312) 1,476,022 (Figures in thousands of euros)
2016
ITEMOpening balance Adjustments to
opening balanceChanges in the
consolidation scope
Provisions Applications Closing balance
Provision for unearned premiums 264,370 1,389 307,036 (265,759) 307,036
Provision for Life insurance 15,476 37 5,878 (15,513) 5,878
Provision for outstanding claims 384,607 10,500 443,009 (395,107) 443,009
Other technical provisions
TOTAL 664,453 11,926 755,923 (676,379) 755,923(Figures in thousands of euros)
2.2 MATHEMATICAL PROVISIONS
ITEMACCEPTED REINSURANCE
2017 2016
Mathematical provisions at the beginning of the fiscal year
97,254 101,054
Adjustments to opening balance (6,265) 9,135
Consolidation (reserve balance on consolidation date)
Premiums
Technical interest
Allocation of profit sharing
Payments / collection of claims
Reserve adequacy test
Shadow accounting adjustments (4,940) (18,140)
Other
Deconsolidation (reserve balance on deconsolidation date)
Mathematical provisions at the close of the fiscal year
86,049 92,049
(Figures in thousands of euros)
3. Other Information
3.1 PROVISION FOR UNEXPIRED RISKS
The provision for unexpired risks has been allocated by the Group insurance companies in accordance with the criteria explained in Note 5.9.
3.2 CLAIMS BY OCCURRENCE YEAR
No information regarding claims by occurrence year is provided for accepted reinsurance as, generally, ceding companies do not inform the Company of the occurrence date of the claims.
Using data from 2017 and 2016, a study has been conducted on the adequacy of technical provisions constituted as of the close of the aforementioned fiscal years. Said study was conducted by a specialized and reputable independent firm that has affirmed the adequacy of these technical provisions.

55Consolidated Annual Accounts
6.10 PROVISIONS FOR RISKS AND EXPENSES
The following tables detail the movements of provisions for risks and expenses in the last two fiscal years.
2017
ITEM
OPEN-ING
BALANCE
ADJUST-MENTS
TO OPENING BALANCE
CHANGESIN THE
CONSOL-IDATION SCOPE
INCREASE DECREASE CLOSING BALANCE
RECOGNIZEDREIMBURSEMENT
AMOUNT
MAXIMUMREVERSAL
PERIODAllocated Provisions
Increasedvalue on
discount
Provisionsapplied
Provisionsreversed
Provisions for employee incentives
2,807 (4) 2,803
Other provisions 4,836 3,781 (1,551) 7,066
TOTAL BOOK VALUE 7,643 3,781 (1,555) 9,869(Figures in thousands of euros)
2016
ITEM
OPEN-ING
BALANCE
ADJUST-MENTS
TO OPENING BALANCE
CHANGESIN THE
CONSOL-IDATION SCOPE
INCREASE DECREASE CLOSING BALANCE
RECOGNIZEDREIMBURSEMENT
AMOUNT
MAXIMUMREVERSAL
PERIODAllocated Provisions
Increasedvalue on
discount
Provisionsapplied
Provisionsreversed
Provisions for employee incentives
2,250 (78) 2,317 (1,682) 2,807
Other provisions 6,748 78 2,033 (4,023) 4,836
TOTAL BOOK VALUE 8,998 4,350 (5,705) 7,643(Figures in thousands of euros)
The “Provisions for Risks and Expenses” entry mainly includes: the defined benefits plans established for fiscal years 2017 and 2016 for the amount of 387,000 euros and 396,000 euros respectively, the medium-term incentive plan for 2017 and 2016 for the amount of 868,000 euros and 805,000 euros respectively, the fiscal years of service bonus for the amount of 1,070,000 euros and 977,000 euros respectively, and the Life insurance coverage for death between the age of 65 and 77 years for the amount of 483,000 euros (454,000 euros in 2016), scholarships for 207,000 euros (157,000 euros in 2016) and the provision for employee retirement for 2,208,000 euros in 2017.
6.11 DEPOSITS RECEIVED ON CEDED AND RETROCEDED REINSURANCE
Deposits on ceded and retroceded reinsurance represent guarantees provided to reinsurers based on reinsurance coverage contracts signed within normal business practices. These mostly accrue a payable interest average of 0.61 percent and the average renewal period is generally annual. The payment of the aforementioned interest is performed quarterly.
6.12 DEBT
The balances included in the “Due on reinsurance operations” and “Tax liabilities” and “Other debts” headings do not accrue payable interest, and generally they are paid in the following fiscal year.
6.13 GUARANTEE COMMITMENTS WITH THIRD PARTIES
The controlling Company has provided letters of credit in guarantee reserves for premiums and outstanding claims against official bodies amounting to 35.61 and 30.23 million euros in 2017 and 2016 respectively. Fixed-income securities have been pledged in favor of ceding companies through these letters of credit in the available-for-sale portfolio, amounting to 636.8 million and 628.9 million euros in fiscal years 2017 and 2016 respectively.

56 ANNUAL REPORT 2017
6.14 INCOME AND EXPENSES FROM INVESTMENTS
The breakdown of income and expenses from investments for fiscal years 2017 and 2016 is shown below:
Income from Investments
ITEM
REVENUES FROM INVESTMENTS FOR TOTAL
OPERATION EQUITY
2017 2016 2017 2016 2017 2016
INCOME FROM DIVIDENDS AND SIMILAR
Property investments: 551 477 551 477
- Rentals 551 477 551 477
Income from the held-to-maturity portfolio:
- Fixed income
- Other investments
Income from the available-for-sale portfolio 81,612 81,626 2,739 5,065 84,351 86,691
Income from the trading portfolio 3,330 3,330
Dividends of Group companies
Other financial returns 59,895 62,268 166 480 60,061 62,748
TOTAL INCOME 141,507 147,224 3,456 6,022 144,963 153,246
REALIZED AND UNREALIZED GAINS
Net realized gains: 44,166 48,860 4,201 4,116 48,367 52,976
Property investments
Held-to-maturity portfolio financial investments
Available-for-sale portfolio financial investments 43,848 48,835 4,160 4,116 48,008 52,951
Trading portfolio financial investments 318 25 33 351 25
Other 8 8
Net unrealized gains:
Increase in the fair value of the trading portfolio and derivative profits
Other
TOTAL GAINS 44,166 48,860 4,201 4,116 48,367 52,976
TOTAL INCOME FROM INVESTMENTS 185,673 196,084 7,657 10,138 193,330 206,222 (Figures in thousands of euros)

57Consolidated Annual Accounts
Expenses from Investments
ITEM
EXPENSES FROM INVESTMENTS FOR TOTAL
OPERATION EQUITY
2017 2016 2017 2016 2017 2016
FINANCIAL EXPENSES
Property investments: 186 400 186 400
- Direct operating expenses 186 400 186 400
- Other expenses
Expenses from held-to-maturity portfolio
- Fixed income
- Other investments
Expenses from available-for-sale portfolio 9,217 12,568 679 1,323 9,896 13,891
Expenses from trading portfolio
Other financial expenses 7,962 6,588 1,261 7,962 7,849
TOTAL EXPENSES 17,365 19,556 679 2,584 18,044 22,140
REALIZED AND UNREALIZED LOSSES
Net realized losses: 9,308 9,740 940 1,064 10,248 10,804
Property investments
Held-to-maturity portfolio financial investments
Available-for-sale portfolio financial investments 9,308 9,796 905 1,063 10,213 10,859
Trading portfolio financial investments (56) (56)
Other 35 1 35 1
Net unrealized losses:
Decrease in the fair value of the trading portfolio and derivative profits
Other
TOTAL LOSSES 9,308 9,740 940 1,064 10,248 10,804
TOTAL EXPENSES FROM INVESTMENTS 26,673 29,296 1,619 3,648 28,292 32,944(Figures in thousands of euros)
6.15 OPERATING EXPENSES
A breakdown of net operating expenses by destination and type for the last two fiscal years, is shown below.
Operating expenses by destination
ITEM 2017 2016
Claims-related Expenses (102) (109)
Acquisition Expenses (1,148,704) (1,052,642)
Administration Expenses (16,101) (13,907)
Expenses from Investments (28,292) (32,944)
Other Technical Expenses (2,029) (2,354)
Other Non-Technical Expenses (5,896) (3,847)
Operating Expenses from other activities
TOTAL (1,201,124) (1,105,803)(Figures in thousands of euros)

58 ANNUAL REPORT 2017
Operating expenses by type
ITEM 2017 2016
Commissions and other portfolio expenses
(1,115,104) (1,014,645)
Personnel expenses (36,608) (35,323)
External services (28,715) (26,193)
- Leases (premises and buildings) (1,698) (4,405)
- Repairs and upkeep (premises and buildings)
(1,575) (1,452)
- Leasing and repairs (computer equipment)
(18) (97)
- Leasing and repairs (computer applications)
(1,057) (996)
- Other services (computer applications)
(2,544) (1,568)
- Supplies (communications) (757) (744)
- Advertising and marketing (506) (553)
- Public relations (2,329) (2,207)
- Independent professional services (14,309) (10,569)
- Other services (3,922) (3,602)
Taxes 973 1,191
Financial expenses
Provision for amortization (1,344) (1,492)
Expenses allocated directly to destination (20,326) (29,341)
TOTAL (1,201,124) (1,105,803) (Figures in thousands of euros)
The income statement reflects expenses by destination, i.e., based on the function the expenses fulfill in the operational cycle of the insurance activity (claims-related expenses, to the acquisition of insurance contracts, to administration, to investments or to other technical items).
Expenses are initially registered according to their type and are reclassified according to their destination in those cases in which the two do not coincide. The reclassifications performed in the following headings are outlined below:
1) Claims-related expenses.
Includes expenses for personnel assigned to claims management, amortization and depreciation of fixed assets assigned to this activity, fees paid for claims management and expenses incurred for other services necessary for processing claims.
2) Net operating expenses.
This section includes:
> Acquisition expenses. This includes commissions, expenses for personnel assigned to production, amortization and depreciation of fixed assets assigned to this activity, expenses for analyzing and processing policy applications and formalizations, as well as advertising, publicity and commercial organization expenses directly related to the acquisition of insurance contracts.
The fees and other acquisition expenses corresponding to the earned premiums that can be allocated to the period between the closing date and the end of coverage of the contracts are essentially included under the "Adjustments for prepayment" heading of the asset. The expenses allocated to the results correspond to those actually incurred in the period in accordance with the provisions in Note 5.9.B.1.
In parallel, the amounts of fees and other acquisition expenses for ceded reinsurance that must be allocated to the fiscal year or following years in accordance with the coverage period of the ceded policies are included under the "Adjustments for prepayment" heading of the liability.
> Administration expenses. Primarily includes expenses for personnel assigned to these tasks, and amortization and depreciation of fixed assets assigned to this activity, as well as expenses derived from contentious matters related to premiums, and expenses for processing return premiums and ceded and accepted reinsurance.
> Commissions and participation in reinsurance. Includes compensation from reinsurers to the ceding companies for acquisition and administration expenses incurred by them, as well as their participation in the profits of the reinsurer.
3) Expenses from investments:
Includes expenses for personnel assigned to managing investments, provisions for amortization and depreciation of fixed assets assigned to this activity, and other internal and external expenses for managing investments, with external expenses including fees, commissions and brokerage fees accrued.
Expenses from investments are classified as being for operations or equity, depending on whether they derive from investments in which the technical provisions materialize (operating investments) or from investments in which the company’s equity materializes (equity investments).
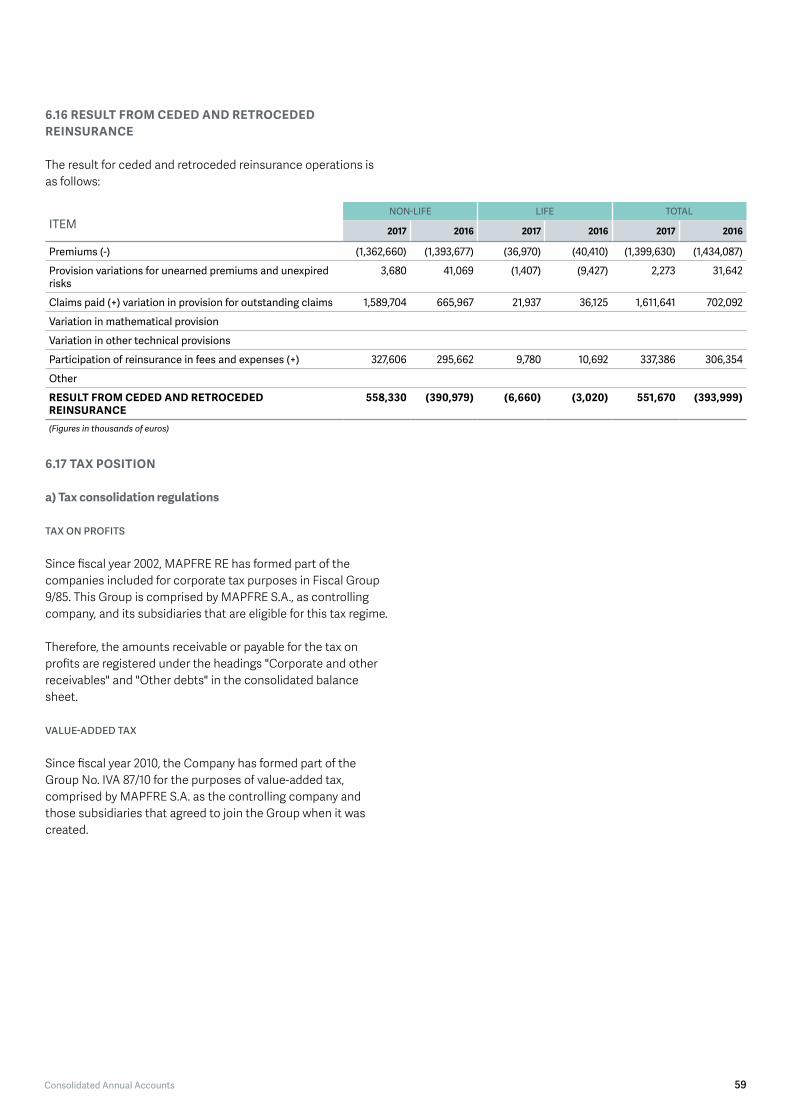
59Consolidated Annual Accounts
6.16 RESULT FROM CEDED AND RETROCEDED REINSURANCE
The result for ceded and retroceded reinsurance operations is as follows:
ITEMNON-LIFE LIFE TOTAL
2017 2016 2017 2016 2017 2016
Premiums (-) (1,362,660) (1,393,677) (36,970) (40,410) (1,399,630) (1,434,087)
Provision variations for unearned premiums and unexpired risks
3,680 41,069 (1,407) (9,427) 2,273 31,642
Claims paid (+) variation in provision for outstanding claims 1,589,704 665,967 21,937 36,125 1,611,641 702,092
Variation in mathematical provision
Variation in other technical provisions
Participation of reinsurance in fees and expenses (+) 327,606 295,662 9,780 10,692 337,386 306,354
Other
RESULT FROM CEDED AND RETROCEDED REINSURANCE
558,330 (390,979) (6,660) (3,020) 551,670 (393,999)
(Figures in thousands of euros)
6.17 TAX POSITION
a) Tax consolidation regulations
TAX ON PROFITS
Since fiscal year 2002, MAPFRE RE has formed part of the companies included for corporate tax purposes in Fiscal Group 9/85. This Group is comprised by MAPFRE S.A., as controlling company, and its subsidiaries that are eligible for this tax regime.
Therefore, the amounts receivable or payable for the tax on profits are registered under the headings "Corporate and other receivables" and "Other debts" in the consolidated balance sheet.
VALUE-ADDED TAX
Since fiscal year 2010, the Company has formed part of the Group No. IVA 87/10 for the purposes of value-added tax, comprised by MAPFRE S.A. as the controlling company and those subsidiaries that agreed to join the Group when it was created.

60 ANNUAL REPORT 2017
b) Components of tax on profits expenses and reconciliation of book results with the tax expense of ongoing activities.
Shown below for the fiscal years ending December 31, 2017 and 2016 are the main components of the tax on profit from ongoing operations, and the reconciliation between the tax on profits expenses and the product of multiplying the book results by the applicable tax rate.
The Group has reconciled the amounts by aggregating reconciliations made separately using the national rates of each country.
ITEMAMOUNT
2017 2016
Tax expense
Result before taxes from ongoing operations 221,212 252,817
25% of the result before taxes from ongoing operations (55,303) (63,204)
Tax incentive for the fiscal year 3,368 2,121
Tax effect of the permanent differences (4,909) (2,379)
Tax effect of tax rates other than 25% (1,713) (3,295)
Total expense from current tax originating in the fiscal year (58,557) (66,757)
Expense from current tax originating in previous fiscal years
Previously unrecognized credits on negative tax bases from prior periods, deductions pending appli-cation or temporary differences, using negative tax ba-ses, deductions pending application or tempo-rary differences
Total tax expense of ongoing operations (58,557) (66,757)
Tax on profits to be paid
Taxes withheld and payments on account 57,143 43,323
Temporary differences (21,264) (2,635)
Tax receivables and incentives applied, registered in previous fiscal years
Tax on profit from discontinued operations
Total (payable) or collectible (22,678) (26,069)(Figures in thousands of euros)
With respect to Spanish companies, the type of tax applicable in fiscal years 2017 and 2016 was 25 percent.
c) Deferred tax assets and liabilities
As of December 31, 2016 and 2015, deferred tax assets and liabilities are shown on the consolidated balance sheet for the net amount corresponding to each of the Group's taxpaying companies, and stand as follows:
ITEM 2017 2016
Deferred tax assets 28,557 28,704
Deferred tax liabilities (37,613) (53,331)
Asset (liability) net (9,056) (24,627)(Figures in thousands of euros)

61Consolidated Annual Accounts
The following tables show the detail of net deferred tax balance for 2017 and 2016, breaking down the amount of deferred tax by items charged or paid directly against equity in each of the fiscal years.
2017
ITEM
OPENING BALANCE
ADJUST-MENTS
TO OPENING BALANCE
CHANGESIN THE
CONSOL-IDATION SCOPE
ORIGINATING FROM WRITE-OFFS CLOSING BALANCE
Results Equity
- Valuation difference of financial investments
35,120 (800) 1,578 (9,469) 26,429
- Implicit derivatives
- Stabilization and catastrophe provision 10,426 (10,426)
- Portfolio acquisition expenses and other acquisition expenses
- Others (20,919) 1,261 2,285 (17,373)
TOTAL DEFERRED TAX 24,627 461 3,863 (19,895) 9,056 (Figures in thousands of euros)
2016
ITEM
OPENING BALANCE
ADJUST-MENTS
TO OPENING BALANCE
CHANGESIN THE
CONSOL-IDATION SCOPE
ORIGINATING FROM WRITE-OFFS CLOSING BALANCE
Results Equity
- Valuation difference of financial nvestments
34,589 100 (1,208) 7,752 (6,113) 35,120
- Implicit derivatives
- Stabilization and catastrophe provision 14,691 (4,265) 10,426
- Portfolio acquisition expenses and other acquisition expenses
- Others (18,211) (2,708) (20,919)
TOTAL DEFERRED TAX 31,069 100 (1,208) 5,044 (10,378) 24,627
(Figures in thousands of euros)
At the end of fiscal year 2016, deferred tax assets and liabilities maturing within 12 months amounted to 665,000 euros (365,000 euros in 2016).
d) Tax incentives
The breakdown of tax incentives of the fully consolidated companies for fiscal years 2017 and 2016 is as follows:
MODALITYYEAR
TO WHICHTHEY CORRESPOND
AMOUNT APPLIEDIN THE YEAR
AMOUNT PENDINGAPPLICATION
AMOUNT NOTRECORDED
TERM FORAPPLICATION
2017 2016 2017 2016 2017 2016 2017 2016
Double tax deduction 3,287 2,121
Decrease for capitalization reserves
Others 81
TOTAL 3,368 2,121(Figures in thousands of euros)

62 ANNUAL REPORT 2017
e) Verification by tax authorities
According to current legislation for Spanish companies, the statements made for the different taxes may not be considered final until they have been inspected by tax authorities or the expiration period of four years has elapsed.
On December 4, 2017, MAPFRE S.A., as controlling company of the Group for tax consolidation No. 9/85, was notified of the start of inspections on corporate tax for fiscal years 2013 to 2016. In the same way, as regards Value Added Tax, as controlling company of the Group with VAT No. 87/10, it was informed of the start of audits on all periods from January 2014 to December 2016. On this same date, MAPFRE RE was also notified of the start of inspection audits relating to Corporate Tax corresponding to fiscal years 2013-16, as well as withholdings and income on account on income from employment and economic activities corresponding to fiscal year 2014.
6.18 REMUNERATION TO EMPLOYEES AND ASSOCIATED LIABILITIES
1. Personnel expenses
The breakdown of personnel expenses in the last two fiscal years is shown in the following table.
ITEMAMOUNT
2017 2016
a) Short-term remuneration 33,183 31,737
a.1) Salaries 25,989 22,284
a.2) Social security 4,770 4,366
a.3) Other remuneration 2,424 5,087
b) Post-employment benefits 2,509 1,801
c) Compensation for termination 853 1,217
d) Other long-term remuneration 63 568
TOTAL 36,608 35,323(Figures in thousands of euros)
2. Allowances and other post-employment benefits
DEFINED BENEFIT PLANS
The main defined benefit plans are implemented through insurance policies, assessed in accordance with the provisions described in the accounting policies, and are those where the benefit is determined according to end salaries, with the benefit paid as an annuity, subject to review in line with the annual consumer price index (CPI).
Settlement of the current value of the obligationThe reconciliation of the current value of the obligation arising from defined benefit plans in the last two fiscal years is shown below:
ITEM 2017 2016
Current value of obligation as on January 1 396 419
Current year service costs
Interest cost 18 19
Contributions made by plan members
Actuarial losses and gains 6
Modifications due to exchange rate variations
Benefits paid (26) (26)
Cost of previous services
Other (7) (16)
Settlements
Current value of obligation as on December 31 387 396(Figures in thousands of euros)
The following table details the reconciliation of the opening and closing balance of the reimbursement rights corresponding to the aforementioned plans for the last two fiscal years.
ITEM 2017 2016
Reimbursement right value and assets allocated to the plan as on January 1
396 419
Expected return from allocated assets 18 19
Actuarial losses and gains 6
Modifications due to exchange rate variations
Employer contributions
Contributions made by plan members
Benefits paid (26) (26)
Settlements
Other items (7) (16)
Reimbursement right value and assets allocated to the plan as on December 31
387 396
(Figures in thousands of euros)

63Consolidated Annual Accounts
Amounts recognized in the consolidated income statementThe following table details the amounts recognized in the consolidated income statement for fiscal years 2017 and 2016.
ITEM 2017 2016
Current year's service costs
Interest cost 18 19
Expected return of assets allocated to the plan
Expected return of any right to reimbursement recognized as an asset
(18) (19)
Actuarial lessees and gains
Cost of previous services recognized in the fiscal year
Effect of any decrease or liquidation
Other items
TOTAL EXPENSE RECOGNIZED IN INCOME STATEMENT(Figures in thousands of euros)
The expected rate of return is determined based on the interest rate guaranteed in the affected insurance policies.
The real return of assets allocated to the plan (reimbursement rights), as well as the investments allocated to cover the mathematical provisions, amounted to 18,000 euros in 2017 and 19,000 euros in 2016.
The main actuarial assumptions used at the close of the last two years are the following: PERM/F-2000 mortality tables and annual CPI of 3 percent in both fiscal years, while the discount and expected rates of return on allocated assets are identical, as they involve products with matching cash flows.
In fiscal year 2017, contributions to defined benefit plans are not expected to be made, as described previously.
OTHER POST-EMPLOYMENT BENEFITS
In fiscal years 2017 and 2016, personnel expenses including the corresponding Life insurance expenses with coverage for death between the age of 65 and 77 years for an amount of 26,000 and 21,000 respectively.
OTHER SHARE-BASED MEDIUM AND LONG-TERM REMUNERATION AND PAYMENTS
The Board of Directors approved a medium-term incentive plan in 2016, which was valued and recognized in the income statement as per with the stipulations of Note “5.13 Employee remuneration”.
Personnel expenses derived from the plan have been registered in the corresponding income statement for the amount of 868,000 euros (805,000 euros in 2016), with the same amount appearing in liabilities. The number of benchmark shares taken into account for the purposes of calculating the remuneration has increased in 2017 to 311,246 (503,417 shares in 2016).
Additionally, in fiscal year 2016, as detailed in the valuation standards, the medium-term incentive plan 2013-2015 was liquidated.
As indicated in the valuation regulations “Employee remunerations”, the Company used to have an incentive plan indexed to MAPFRE S.A.’s share price, which was terminated in 2016.
The personnel expenses registered on the income statement for this item in 2016 deriving from this plan, came to (5,000) euros, registering the counter-entry in the liabilities.

64 ANNUAL REPORT 2017
NUMBER OF EMPLOYEES
The box below details the average and final number of employees in the last two fiscal years, classified by category, gender, and distributed by geographic area.
Average number of employees:
2017
COUNTRY
DIRECTORS SENIOR MANAGEMENT
POSITIONS
MANAGEMENT TECHNICIANS ADMINISTRATIVE TOTAL
Men Women Men Women Men Women Men Women Men Women Men Women
Spain 2 0 0 0 29 14 64 62 5 19 100 95
United States of America 0 0 0 0 1 2 3 6 0 0 4 8
Brazil 0 0 0 0 4 3 7 3 1 1 12 7
Chile 0 0 0 0 3 0 8 3 0 2 11 5
Rest of America 0 0 0 0 7 6 15 13 6 8 28 27
Europe 0 0 0 0 10 5 14 22 0 6 24 33
Philippines 0 0 0 0 1 0 0 5 1 1 2 6
Rest of Asia 0 0 0 0 2 0 1 2 0 1 3 3
TOTAL AVERAGE NUMBER OF EMPLOYEES
2 0 0 0 58 32 111 115 13 38 184 185
2016
COUNTRY
DIRECTORS SENIOR MANAGEMENT
POSITIONS
MANAGEMENT TECHNICIANS ADMINISTRATIVE TOTAL
Men Women Men Women Men Women Men Women Men Women Men Women
Spain 2 0 0 0 27 13 59 52 4 18 92 83
United States of America 0 0 0 0 1 2 2 6 0 1 3 9
Brazil 0 0 0 0 4 3 6 3 1 1 11 7
Chile 0 0 0 0 4 1 8 3 1 3 13 7
Rest of America 0 0 0 0 8 8 17 11 6 8 31 27
Europe 0 0 0 0 11 6 13 18 0 5 24 29
Philippines 0 0 0 0 1 0 0 5 1 1 2 6
Rest of Asia 0 0 0 0 2 0 1 2 0 1 3 3
TOTAL AVERAGE NUMBER OF EMPLOYEES
2 0 0 0 58 33 106 100 13 38 179 171

65Consolidated Annual Accounts
Number of employees at the end of the fiscal year:
2017
COUNTRY
DIRECTORS SENIOR MANAGEMENT
POSITIONS
MANAGEMENT TECHNICIANS ADMINISTRATIVE TOTAL
Men Women Men Women Men Women Men Women Men Women Men Women
Spain 2 0 0 0 28 12 66 66 9 21 105 99
United States of America 0 0 0 0 1 2 3 6 0 0 4 8
Brazil 0 0 0 0 4 3 8 3 1 1 13 7
Chile 0 0 0 0 2 1 8 3 0 2 10 6
Rest of America 0 0 0 0 7 9 13 14 7 8 27 31
Europe 0 0 0 0 10 5 15 22 0 7 25 34
Philippines 0 0 0 0 1 0 0 5 1 1 2 6
Rest of Asia 0 0 0 0 3 0 1 3 0 2 4 5
TOTAL AVERAGE NUMBER OF EMPLOYEES
2 0 0 0 56 32 114 122 18 42 190 196
2016
COUNTRY
DIRECTORS SENIOR MANAGEMENT
POSITIONS
MANAGEMENT TECHNICIANS ADMINISTRATIVE TOTAL
Men Women Men Women Men Women Men Women Men Women Men Women
Spain 2 0 0 0 28 14 60 55 3 17 93 86
United States of America 0 0 0 0 1 2 3 6 0 0 4 8
Brazil 0 0 0 0 4 3 6 3 1 1 11 7
Chile 0 0 0 0 4 1 8 3 0 2 12 6
Rest of America 0 0 0 0 7 8 16 11 5 9 28 28
Europe 0 0 0 0 10 5 12 21 1 4 23 30
Philippines 0 0 0 0 1 0 0 5 1 1 2 6
Rest of Asia 0 0 0 0 2 0 1 2 0 1 3 3
TOTAL AVERAGE NUMBER OF EMPLOYEES
2 0 0 0 57 33 106 106 11 35 176 174
Below, the number of employees in Spain with a disability equal to or greater than 33 percent is detailed, indicating the categories to which they belong.
ITEM 2017 2016
Management 2 2
Technicians 2 2
Administrative Staff
TOTAL 4 4

66 ANNUAL REPORT 2017
6.19 NET RESULTS FOR EXCHANGE DIFFERENCES
Positive foreign exchange differences, other than those arising from financial instruments assessed at fair value and allocated to the consolidated income statement, amounted to 797.41 million and 490.26 million euros in fiscal years 2017 and 2016 respectively.
Negative foreign exchange differences, other than those arising from financial instruments assessed at fair value, allocated to the consolidated income statement, amounted to 805.27 million and 487.25 million euros in fiscal years 2017 and 2016 respectively.
Below is the conciliation of exchange differences recognized as equity:
DESCRIPTIONAMOUNT
2017 2016
Foreign exchange difference at the beginning of the fiscal year
13,566 955
Net currency conversion differences of financial statements
(9,525) 13,373
Net foreign exchange differences on valuation of non-monetary items
(1,347) (762)
Foreign exchange differences at the end of the fiscal year
2,694 13,566
(Figures in thousands of euros)
The following table shows, as of December 31, 2017 and 2016, the net currency conversion differences arising from the translation into euros of the financial statements of those Group companies whose functional currency is not the euro:
OF FULLY CONSOLIDATED COMPANIES
FULLY CONSOLIDATED COMPANIES
GEOGRAPHIC AREA CURRENCY CONVERSION DIFFERENCES
POSITIVE NEGATIVE NET
2017 2016 2017 2016 2017 2016
MAPFRE RE CHILE CHILE 1,203 3,690 1,203 3,690
MAPFRE RE BRAZIL BRAZIL (19,690) (12,655) (19,690) (12,655)
CIAR BELGIUM 1,052 1,052
RMI UNITED STATES 2 5 2 5
MAPFRE RE SPAIN 20,127 22,526 20,127 22,526
TOTAL 22,384 26,221 (19,690) (12,655) 2,694 13,566(Figures in thousands of euros)

67Consolidated Annual Accounts
The directly recognized result in equity derived from the revaluation of non-monetary items in the last two fiscal years is indicated below.
FOREIGN EXCHANGE DIFFERENCES REGISTERED DIRECTLY IN EQUITY
COMPANY GEOGRAPHIC AREA CURRENCY CONVERSION DIFFERENCES
POSITIVE NEGATIVE NET
2017 2016 2017 2016 2017 2016
MAPFRE RE SPAIN 322 (1,025) (1,025) 322
TOTAL 322 (1,025) (1,025) 322
(Figures in thousands of euros)
6.20 CONTINGENT ASSETS AND LIABILITIES
As of the closing date of the annual accounts, there are contingent assets derived from the positive business performance of MAPFRE Reinsurance Corporation (M.R.C.), whose financial effect is estimated at 0.71 million US dollars (0.79 million in fiscal year 2016). In the sales contract of this company to MAPFRE USA, an adjustment in the price is contemplated after three years, extended to four years in July, 2015, depending on M.R.C.'s business performance. This adjustment would have a maximum limit of 3 million US dollars.
6.21 RELATED PARTY TRANSACTIONS
All related party transactions have been conducted under market conditions.
In addition to the transactions detailed in the rest of the Notes to the Consolidated Annual Accounts, below are the balances and transactions between Group companies.
Operations with Group companies
The operations conducted between Group companies, with a null effect on results because they have been eliminated in the consolidation process, are shown below:
ITEMEXPENSES INCOME
2017 2016 2017 2016
Services received/provided and other expenses/revenue 1,286 1,313 1,286 1,313
Expenses/income from property investments 63 63
Expenses/income from investments and financial accounts
Dividends distributed 6,625 2,313
TOTAL 1,349 1,313 7,974 3,626(Figures in thousands of euros)

68 ANNUAL REPORT 2017
The amounts included in the consolidated income statement as a result of transactions conducted during the fiscal year with higher consolidated groups are:
ITEMEXPENSES
2017 2016
Expenses and income from property investments
193 2,636
Expenses and income from investments and financial accounts
3,889 2,312
External services and other non-technical expenses/revenue
5,572 3,938
Dividends paid
TOTAL 9,654 8,886(Figures in thousands of euros)
Reinsurance operations
Reinsurance operations conducted between consolidated Group companies, which have been eliminated in the consolidation process, are detailed below:
ITEMEXPENSES REVENUE
2017 2016 2017 2016
Ceded/accepted premiums 7,573 8,242 (8,032) (8,338)
Claims 7,732 5,525 (9,659) (4,639)
Changes in technical provisions 190 19,633 1,819 (18,920)
Commissions (1,356) (1,402) 1,552 1,660
Other technical revenues and expenses
TOTAL 14,139 31,997 (14,320) (30,237)(Figures in thousands of euros)
Reinsurance operations with the higher consolidated Group (MAPFRE S.A.) are:
ITEM
REVENUE/EXPENSES
ACCEPTED REINSURANCE CEDED REINSURANCE
2017 2016 2017 2016
Premiums 1,864,280 1,931,554 (69,497) (116,923)
Claims (1,217,477) (958,616) 317,862 54,545
Commissions (551,165) (510,588) 16,182 23,174
TOTAL 95,638 462,350 264,547 (39,204)(Figures in thousands of euros)

69Consolidated Annual Accounts
The following table shows the balances with reinsurers and ceding companies, deposits constituted, and technical provisions on reinsurance operations with consolidated Group companies, all of which have been eliminated in the consolidation process, just as for those with the higher consolidated Group (MAPFRE S.A.):
ITEM
ELIMINATED BALANCES NON-ELIMINATED BALANCES
ACCEPTED REINSURANCE CEDED REINSURANCE ACCEPTED REINSURANCE CEDED REINSURANCE
2017 2016 2017 2016 2017 2016 2017 2016
Receivables and debt (2,862) (4) 49,009 57,064 (161,902) (160,744)
Deposits (11) (160) (11) (160) 95,470 77,844 220 265
Technical provisions (29,833) (30,882) (29,231) (30,395) (1,943,568) (1,123,933) 382,813 68,603
TOTAL (32,706) (31,046) (29,242) (30,555) (1,799,089) (989,025) 221,131 (91,876)(Figures in thousands of euros)
Remuneration of key managerial staff
The box below details remuneration for the last two fiscal years of the members of the Board of Directors.
ITEMAMOUNTS
2017 2016
Short-term remuneration
Salaries 682 899
Fixed remuneration 484 289
Travel, subsistence and accommodation allowances
Life insurance 22 19
Other items 34 4
Total 1,222 1,211(Figures in thousands of euros)
Of the amount reflected in the balances of fiscal year 2017, at the close of said fiscal year, 72,890 euros were pending payment, by way of variable remuneration.
The basic remuneration of the members of the Board of Directors consists of a fixed assignment of 45,000 euros (40,000 euros in 2016), which rises to 100,000 euros for Chairmen of the Board and 8,000 euros to members of its Steering Committees (6,000 euros in 2016).
Life insurance is also established in case of death, with an insured capital of 150,253 euros, as well as some benefits recognized for personnel, such as illness insurance.
Executive directors (meaning both executives of the Company and others) receive the remuneration established in their contracts, including fixed salary, variable incentives linked to results, Life and disability insurance, and other general benefits established for the Group’s personnel. They also receive certain
pension allowance in the event of retirement, externalized through a Life insurance policy. All of these payments are included in the compensation policy established by the Group for its senior executives, whether or not they are directors. By way of contribution towards the defined contribution plans, the fiscal year registered a cost of 131,190 euros in 2017 (124,000 euros in 2016). Executive directors do not receive the fixed remuneration established for external directors.
The years of service bonus has accrued expenses for the amount of 3,700 euros.
With regard to the medium-term incentive plan, a provision amounting to 31,520 euros has been granted, which will be paid depending on the fulfillment of objectives in the period established in the plan.
In relation with the Senior Management, below are details of the fiscal year remunerations;
ITEM 2017
No. of members of senior management 1
Salaries 172
Life insurance 1
Service bonus 1
Other items 22
TOTAL 197(Figures in thousands of euros)
Of the amount reflected in the balances of fiscal year 2017, at the close of said fiscal year, 12,620 euros were pending payment, by way of variable remuneration.

70 ANNUAL REPORT 2017
With regard to the new medium-term incentive plan, a provision amounting to 5,460 euros has been granted, which will be paid depending on the fulfillment of objectives in the period established in the plan.
Additionally, by way of contribution towards the defined contribution plans, in fiscal year 2017, a cost of 5,600 euros was registered.
In the last two fiscal years, the Company has not granted advances or credits to key management personnel.
The amount paid for professional liability insurance premiums due to damage caused reached 21,000 euros (23,000 euros in 2016).
Subsidies
In 2017 and 2016, a government subsidy was received for subsidized contracts (social security) and continuing education (Fundación Tripartita), attributed entirely to results for the period.
ITEMSUBSIDY
2017 2016
As on January 1
Received during the fiscal year 21 10
Transferred to results 21 10
As on December 31(Figures in thousands of euros)
There is no noncompliance with any of the conditions or contingencies associated with these subsidies.
Subsequent events
No material events took place after the fiscal year end.
7. Risk management
The MAPFRE RE, Compañía de Reaseguros, S.A. Board of Directors establishes the risk level which the Company is prepared to assume in order to attain its business objectives without any significant deviations, even in adverse situations. That level, which establishes limits and sub-limits by risk type, configures the Company's Risk Appetite.
The MAPFRE structure is based on Units and Companies with a high degree of autonomy in their management. In a complementary fashion to the Group structure, of which the Company is a member, there are various bodies for its individual governance. The Group's governance and management bodies approve the guidelines of the Units and Companies on risk
management and permanently supervise, through indicators and ratios, exposure to risk.
The Group Corporate Risk Management Area covers all significant aspects relating to risk management both for the Group and the separate legal companies belonging to the Group, setting out guidelines and reference criteria that are assumed by the risk areas of the individual companies, with all adjustments necessary.
The Governing Bodies regularly receive half-yearly information relating to the quantification of the main risks to which the Group is exposed and the capital resources available to cover them, as well as information relating to compliance with the established Risk Appetite limits.
Assigned capital is established in general based on estimates in accordance with the budgets for the coming year and is reviewed periodically throughout the fiscal year in line with the development of risks in order to ensure compliance with the established Risk Appetite limits.
These limits foresee that certain companies will require a higher level of capitalization, in relative terms, than the Group average, either because they operate in countries with different legal requirements, or because their activities are subject to more stringent financial solvency requirements than those of the other Group companies.
Exposure to the risk types relating to the company’s financial instruments and insurance contracts, as well as the processes and methods used for its measurement and management, are described in sections A), B), C) and D) of these notes.
A) INSURANCE RISK
1. Sensitivity to insurance risk
This sensitivity analysis measures the effect on capital fluctuations on the increase and decrease of the determining factors of insurance risk (number of insured risks, average premium value, frequency and cost of claims). One measure of the sensitivity to Non-Life insurance risk is the impact that a one percentage point change in the combined ratio would have on result for the period and consequently, on equity.

71Consolidated Annual Accounts
The following table shows this effect together with the volatility index of the ratio, calculated according to the standard deviation over a five-year time horizon.
ConceptoEFFECT ON THE RESULTS OF A VARIATION
OF 1% IN THE COMBINED RATIOVOLATILITY INDEX
OF THE COMBINED RATIO
2017 2016 2017 2016
Main activity outside Spain
Reinsurance 17,891 16,286 1.2 1.5(Figures in thousands of euros)
2. Concentrations of insurance risk
MAPFRE RE has a high degree of insurance risk diversification as it operates in virtually all insurance business lines in Spain and has an extensive presence in the international markets.
The Company applies a system of procedures and limits which enable the level of concentration of insurance risk to be controlled. It is standard practice to use reinsurance contracts to mitigate the insurance risk arising from the concentration or accumulation of guarantees exceeding the maximum acceptance levels.
2.A) PREMIUMS BY RISK
The following tables show the breakdown of accepted reinsurance written premiums classified by type of business underwritten for the last two fiscal years:
2017
ITEM
ACCEPTED REINSURANCE
LIFE NON-LIFE TOTAL
Catastrophic risk Other risks
Accepted reinsurance written premiums
656,701 409,486 3,156,237 4,222,424
(Figures in thousands of euros)
2016
ITEM
ACCEPTED REINSURANCE
LIFE NON-LIFE TOTAL
Catastrophic risk Other risks
Accepted reinsurance written premiums
648,245 477,757 3,108,748 4,234,750
(Figures in thousands of euros)

72 ANNUAL REPORT 2017
2.B) PREMIUMS BY OPERATING SEGMENT AND GEOGRAPHIC AREA
The following tables show the breakdown of accepted reinsurance written premiums by segment and geographic areas in the last two fiscal years:
2017
GEOGRAPHIC AREAREINSURANCE TOTAL
Life Non-Life
SPAIN 44,909 618,255 663,164
UNITED STATES OF AMERICA 8,078 550,107 558,185
BRAZIL 12,998 130,226 143,224
MEXICO 15,000 85,789 100,790
VENEZUELA 23 518 541
COLOMBIA 11,287 63,357 74,644
ARGENTINA 7,630 87,532 95,162
TURKEY 376 133,657 134,033
CHILE 29,322 89,363 118,684
OTHER COUNTRIES 527,078 1,806,919 2,333,997
TOTAL 656,701 3,565,723 4,222,424(Figures in thousands of euros)
2016
GEOGRAPHIC AREAREINSURANCE TOTAL
Life Non-Life
SPAIN 39,960 625,842 665,802
UNITED STATES OF AMERICA 7,243 589,199 596,441
BRAZIL 16,421 132,708 149,129
MEXICO 19,742 93,458 113,201
VENEZUELA 19 5,470 5,489
COLOMBIA 10,383 92,842 103,225
ARGENTINA 9,899 96,539 106,438
TURKEY 222 157,398 157,621
CHILE 41,519 108,591 150,109
OTHER COUNTRIES 502,837 1,684,458 2,187,295
TOTAL 648,245 3,586,505 4,234,750(Figures in thousands of euros)
2.C) PREMIUMS BY CURRENCY
The following table shows the breakdown of accepted reinsurance written premiums by currency in the last two fiscal years:
CURRENCYWRITTEN PREMIUMS
2017 2016
Euro 1,947,597 1,735,496
U.S. dollar 1,206,889 1,228,387
Mexican peso 57,066 69,775
Brazilian real 140,009 163,500
Turkish lira 123,626 149,617
Chilean peso 105,363 131,870
Venezuelan bolivar 3,034
Argentine peso 27,026 37,170
Colombian peso 71,409 89,116
Pound sterling 169,234 124,281
Canadian dollar 17,889 22,915
Philippine peso 12,682 14,274
Other currencies 343,634 465,315
TOTAL 4,222,424 4,234,750(Figures in thousands of euros)

73Consolidated Annual Accounts
B) CREDIT RISK
1. Credit risk arising from reinsurance contracts
The following table shows the breakdown of credits against reinsurers in the last two fiscal years:
ITEM
BOOK VALUE COMPANIES TOTAL
GROUP NON-GROUP
2017 2016 2017 2016 2017 2016
Provision for Life insurance 65 226 4,603 5,860 4,668 6,086
Provision for outstanding claims 370,120 38,602 877,181 404,408 1,247,301 443,010
Receivables on ceded and retroceded reinsurance operations
(6,695) 1,822 129,543 105,276 122,848 107,097
Due on ceded and retroceded reinsurance operations
(10,108) (14,736) (57,118) (55,601) (67,226) (70,338)
TOTAL NET POSITION 353,382 25,913 954,209 459,942 1,307,591 485,855(Figures in thousands of euros)
The following table shows the breakdown of credits against reinsurers based on the financial solvency margin:
LEVEL
BOOK VALUE
COMPANIES TOTAL
GROUP NON-GROUP
2017 2016 2017 2016 2017 2016
Maximum
Very high 50,156 668,816 200,905 718,972 200,905
High 304,344 33,560 271,594 223,621 575,938 257,181
Adequate (1,190) (7,647) 5,802 33,812 4,612 26,165
Weak 7,035 939 7,035 939
Not available 74 960 665 1,034 665
TOTAL 353,384 25,913 954,207 459,942 1,307,591 485,855(Figures in thousands of euros)
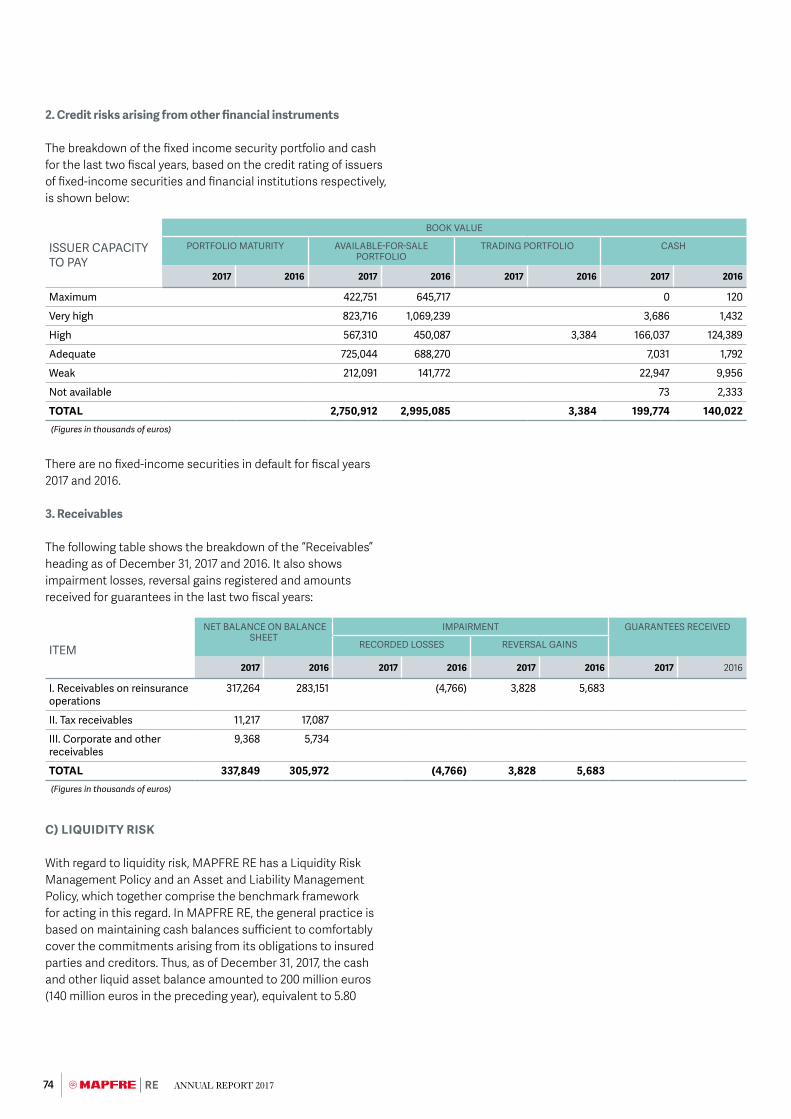
74 ANNUAL REPORT 2017
2. Credit risks arising from other financial instruments
The breakdown of the fixed income security portfolio and cash for the last two fiscal years, based on the credit rating of issuers of fixed-income securities and financial institutions respectively, is shown below:
ISSUER CAPACITY TO PAY
BOOK VALUE
PORTFOLIO MATURITY AVAILABLE-FOR-SALE PORTFOLIO
TRADING PORTFOLIO CASH
2017 2016 2017 2016 2017 2016 2017 2016
Maximum 422,751 645,717 0 120
Very high 823,716 1,069,239 3,686 1,432
High 567,310 450,087 3,384 166,037 124,389
Adequate 725,044 688,270 7,031 1,792
Weak 212,091 141,772 22,947 9,956
Not available 73 2,333
TOTAL 2,750,912 2,995,085 3,384 199,774 140,022 (Figures in thousands of euros)
There are no fixed-income securities in default for fiscal years 2017 and 2016.
3. Receivables
The following table shows the breakdown of the “Receivables” heading as of December 31, 2017 and 2016. It also shows impairment losses, reversal gains registered and amounts received for guarantees in the last two fiscal years:
ITEM
NET BALANCE ON BALANCESHEET
IMPAIRMENT GUARANTEES RECEIVED
RECORDED LOSSES REVERSAL GAINS
2017 2016 2017 2016 2017 2016 2017 2016
I. Receivables on reinsurance operations
317,264 283,151 (4,766) 3,828 5,683
II. Tax receivables 11,217 17,087
III. Corporate and other receivables
9,368 5,734
TOTAL 337,849 305,972 (4,766) 3,828 5,683 (Figures in thousands of euros)
C) LIQUIDITY RISK
With regard to liquidity risk, MAPFRE RE has a Liquidity Risk Management Policy and an Asset and Liability Management Policy, which together comprise the benchmark framework for acting in this regard. In MAPFRE RE, the general practice is based on maintaining cash balances sufficient to comfortably cover the commitments arising from its obligations to insured parties and creditors. Thus, as of December 31, 2017, the cash and other liquid asset balance amounted to 200 million euros (140 million euros in the preceding year), equivalent to 5.80

75Consolidated Annual Accounts
percent (3.93 percent in 2016) of total financial investments and cash.
Assets with maturities exceeding one year are detailed in the "Interest rate risk" section.
1. Liquidity risk arising from insurance contracts
The estimated disbursement schedule of insurance liabilities registered as of December 31, 2017 and 2016 is detailed below. These amounts have not been updated in the case of provisions for Life insurance:
2017
ITEMCASH OUTFLOWS ESTIMATED IN YEARS CLOSING
BALANCE1st Year 2nd Year 3rd Year 4th Year 5th Year 6th to 10th
YearSubsequent
years
Provision for unearned premiums 894,350 117,226 27,665 18,436 12,915 22,004 6,103 1,098,699
Provision for unexpired risks
Provisions for Life insurance 362,336 33,385 28,407 20,893 25,220 75,236 51,689 597,166
Provision for outstanding claims 1,542,882 683,004 214,465 97,389 76,668 228,082 104,236 2,946,726
Other technical provisions
Due on reinsurance operations 299,790 299,790
TOTAL 3,099,358 833,615 270,537 136,718 114,803 325,322 162,028 4,942,381(Figures in thousands of euros)
2016
ITEMCASH OUTFLOWS ESTIMATED IN YEARS CLOSING
BALANCE1st Year 2nd Year 3rd Year 4th Year 5th Year 6th to 10th
YearSubsequent
years
Provision for unearned premiums 1,075,834 145,403 35,489 22,718 16,361 27,051 7,560 1,330,416
Provision for unexpired risks
Provisions for Life insurance
Provision for outstanding claims 313,924 40,353 27,720 20,757 25,115 74,198 47,669 549,736
Other technical provisions 1,450,467 227,679 71,290 39,402 33,110 62,807 32,246 1,917,001
Due on reinsurance operations 298,286 298,286
TOTAL 3,138,511 413,435 134,499 82,877 74,586 164,056 87,475 4,095,439(Figures in thousands of euros)
D) MARKET RISK
MAPFRE RE’s Risk Management area conducts stress and sensitivity tests of the impact of market and financial variables on its solvency position.
The Group’s Investment Area regularly conducts analyses of the sensitivity of the investment portfolio's value to market risk.
Among others, the most common indicators are modified duration for fixed-income securities and VaR, or value at risk, for equity.

76 ANNUAL REPORT 2017
1. Interest rate risk
The following table details the material information of the last two fiscal years with regard to the level of interest rate risk exposure of the financial assets:
PORTFOLIO
AMOUNT OF ASSETS EXPOSED TO INTEREST RATE RISK AT FAIR VALUE
FIXED INTEREST RATE VARIABLE INTEREST RATE NOT EXPOSED TO RISK TOTAL
2017 2016 2017 2016 2017 2016 2017 2016
To maturity
Available for sale 2,883,016 3,096,661 199,263 71,570 231,749 220,816 3,314,028 3,389,047
Trading 14,381 6,867 23,794 1,668 11,853 22,916 35,647
Other investments 4,270 5,840 4,270 5,840
TOTAL 2,901,667 3,102,501 206,130 95,364 233,417 232,669 3,341,214 3,430,534(Figures in thousands of euros)
The following tables display the breakdown of financial investments by maturity, average interest rate and modified duration, for fiscal years 2017 and 2016:
December 31, 2017
ITEMFINAL
BALANCEMATURITY TO: INTEREST
RATE %
MODIFIED DURATION
%1 Year 2 YEars 3 Years 4 Years 5 Years Subsequent or without maturity
AVAILABLE-FOR-SALE PORTFOLIO
Fixed income 2,837,413 411,355 434,549 332,979 317,870 293,089 1,047,572 2% 4%
Other investments
TOTAL PORTFOLIO AVAILABLE FOR SALE
2,837,413 411,355 434,549 332,979 317,870 293,089 1,047,572 2% 4%
TRADING PORTFOLIO
Other
TOTAL TRADING PORTFOLIO(Figures in thousands of euros)
December 31, 2016
ITEMFINAL
BALANCEMATURITY TO: INTEREST
RATE %
MODIFIED DURATION
%1 Year 2 YEars 3 Years 4 Years 5 Years Subsequent or without maturity
AVAILABLE-FOR-SALE PORTFOLIO
Fixed income 2,995,085 403,220 342,228 485,952 323,015 291,431 1,149,239 2% 5%
Other investments
TOTAL PORTFOLIO AVAILABLE FOR SALE
2,995,085 403,220 342,228 485,952 323,015 291,431 1,149,239
TRADING PORTFOLIO
Other 3,384 3,384 1.4% 0.9%
TOTAL TRADING PORTFOLIO 3,384 3,384(Figures in thousands of euros)

77Consolidated Annual Accounts
Modified duration reflects the sensitivity of the value of the assets to movements in interest rates and represents an approximation of the percentage variation that the value of financial assets would experience for every percentage point (100 b.p.) of variation of interest rates.
The balances included in the "Receivables" heading of the balance sheet assets, and in the "Debts" heading of the balance sheet liabilities, do not accrue interest and, generally, their payment is produced in the following fiscal year.
2. Exchange rate risk
The following table details the breakdown of assets and liabilities regarding the currencies in which they were denominated at the end of the last two fiscal years.
CURRENCYASSETS LIABILITY TOTAL NET
2017 2016 2017 2016 2017 2016
Euro 3,100,321 3,077,078 1,966,282 1,923,724 1,134,039 1,153,354
U.S. dollar 2,102,886 1,455,059 1,852,148 1,039,519 250,737 415,540
Mexican peso 16,571 21,912 59,458 42,706 (42,887) (20,794)
Brazilian real 296,543 290,367 230,058 264,458 66,485 25,910
Turkish lira 92,773 75,750 100,588 127,783 (7,815) (52,033)
Chilean peso 198,312 26,902 197,097 102,602 1,215 (75,700)
Venezuelan bolivar 160 2,322 71 859 89 1,463
Argentine peso 30,458 48,086 18,295 25,272 12,163 22,814
Colombian peso 28,772 42,548 119,229 134,256 (90,457) (91,708)
Pound sterling 212,685 131,366 193,109 121,880 19,576 9,486
Canadian dollar 43,005 49,335 14,531 39,194 28,474 10,141
Philippine peso 15,447 15,891 12,273 18,330 3,174 (2,439)
Other currencies 311,379 342,285 384,716 458,894 (73,336) (116,610)
TOTAL 6,449,312 5,578,901 5,147,855 4,299,477 1,301,457 1,279,424
(Figures in thousands of euros)
The sensitivity of the Company's equity to changes in euro exchange rates against the different currencies in which assets are stated is determined by the net total amount shown in the previous table, having deducted the amount for the non-monetary items. Similarly, the effect of these exchange rate variations on future results of the Company is determined by the volume of earnings obtained in each currency. Appendix 1 provides a breakdown of the result obtained by each Group company, and the country in which its operations are located.

78 ANNUAL REPORT 2017
3. Stock market risk
The following table shows the book value of equities and mutual funds exposed to stock market risk and VaR or value at risk (maximum variation expected in a time horizon of one year and a confidence level of 99 percent) for the last two fiscal years:
PORTFOLIOBOOK VALUE VaR
2017 2016 2017 2016
Available for sale 145,248 220,816 111,762 122,680
Trading 16,046 11,854
TOTAL 161,294 232,670 111,762 122,680
(Figures in thousands of euros)
4. Property risk
As of December 31, 2017, the Company has, in its consolidated group, property assets representing approximately 1.60 percent of total investments and cash (1.49 percent as of December 31, 2016), of which approximately 1.42 percent corresponds to its own offices (1.40 percent as of December 31, 2016). This property serves the dual function of providing administrative and sales support, as well as generating investment income and diversifying investments. The following table details the breakdown of these property assets:
ITEMNET BOOK VALUE MARKET VALUE
2017 2016 2017 2016
Property investments 6,191 6,375 8,556 6,374
Property for own use 49,031 49,752 51,455 50,983
TOTAL 55,222 56,127 60,011 57,357 (Figures in thousands of euros)
Unrealized gains would offset a fall in the price of properties equivalent to approximately 1.35 percent of their market value as at close of fiscal year 2.017 (2.14 percent at close of fiscal year 2016).
5. Implementation of Internal Capital Models
MAPFRE RE undertook, during 2005, the implementation of an internal capital model which determines, through a stochastic process, the required solvency margin depending on the risks assumed by the company itself.
The proprietary internal capital model is based on the stochastic generation of projections of the company's fair value gains or losses from the simulation of 10,000 different scenarios, applied considering the nature of the premium portfolio, the composition of the company's investments and other assets. These scenarios are obtained by combining various financial and reinsurance business assumptions. From this, the probability distribution of results is determined, and the
financial capital required to ensure the company's solvency with a confidence interval of 99.6 percent in a time horizon of one year. Interim results obtained confirm the level of excellence in the capitalization of the company and are currently being contrasted with other methods for estimating solvency margins.

79Consolidated Annual Accounts
8. Other information
During the last two fiscal years, no conflicts of interest have been produced, either direct or indirect, between the directors or individuals associated with them and the Controlling company.
The Controlling company’s directors did not conduct any operation with the Company during the last two fiscal years, nor with any other Group company outside of the ordinary business of the companies or not conducted at arm’s length.
8.2. FEES EARNED BY AUDITORS
The annual statements of MAPFRE RE and the main companies of the Group correspond to the 2017 and 2016 fiscal years, and have been audited by the firm KPMG, with the exception of the subsidy domiciled in Chile, whose auditor is Ernst and Young.
The remunerations earned by the main auditor, KPMG, are detailed as follows, and are not considered to compromise its independence:
2017 2016
Audit services 208,823 174,738
Other verification services 94,304 44,170
Tax services 38,020 15,621
Other services 35,799
Total services main auditor 341,147 270,328(Figures in euros)
Fees for account audit services rendered by auditors other than the main auditor amounted to 21,644 euros in fiscal year 2017 (20,349 euros in 2016).
8.3 ENVIRONMENTAL INFORMATION
The Group companies do not have any environment-related item in the last two fiscal years that might be material or specifically included in these consolidated annual accounts.
8.4 PAYMENT DEFERRAL
The characteristics of payments made by the Spanish companies consolidated on a line-by-line basis to providers, in the two fiscal years 2017 and 2016, are:
ITEMDAYS
2017 2016
Average provider payment period
6.72 8.09
Ratio of paid operations 6.73 8.10
Ratio of operations pending payment
3.62 3.14
ItemAmount (thousands
of euros)Amount (thousands
of euros)
Total payments made 24,510 22,365
Total pending payments 112 174

80 ANNUAL REPORT 2017
Table of subsidiary and associated companies 2017 (appendix 1) Name Country Effective
tax rateACTIVITY % SHARE DATA AS OF CLOSE OF FISCAL YEAR 2017
Holder Share capital Assets Net equity Revenues Result for the fiscal year
Method or procedure of consolidation
CIAR INVESTMENTS 45 Rue de Trèves Brussels (Belgium)
34% Real Estate 9,831 9,121 642 143 A
MAPRE CHILE REASEGUROS S.A. Avda Apoquindo 4499-8º Santiago de Chile (Chile)
20% Holding MAPFRE RE 100.0000% 166,441 40,445 33,000 809 A
F. ALCORTA S.A. Bouchard 547 piso 14 Buenos Aires (Argentina)
35% Real Estate (in liquidation) MAPFRE RE 99.9985% C
MAPFRE RE DO BRASIL COMPAÑÍA DE REASEGUROS Rua Olimpiadas 242 5º Andar São Paulo (Brazil)
15% Reinsurance MAPFRE RE 99.9999% 218,690 44,341 75,339 8,761 A
MAPFRE RE COMPAÑÍA DE REASEGUROS ESCRITORIO DE REPRESENTAÇÃO NO BRASIL LTDA
Rua Olimpiadas 242 5º Andar São Paulo (Brazil)
15% Representation services MAPFRE RE 99.9999% 47 47 C
MAPFRE MANDATOS Y SERVICIOS S.A. Bouchard 547 piso 14 Buenos Aires (Argentina)
35% Services
MAPFRE REMAPFRE Argentina
95.0000% 5.0000%
20 20 (4) C
MAPFRE INTERNET S.A. (TECH) Ctra. de Pozuelo a Majadahonda no. 52 Madrid (Spain)
25% Computing MAPFRE RE 0.8002% 53,096 20,162 178,164 (1,778) C
VENEASISTENCIA C.A. Avda. Libertador Penthouse A y B Caracas (Venezuela)
34% Travel Assistance MAPFRE RE 0.0020% 549 325 193 (204) C
REINSURANCE MANAGEMENT INC. 100 Campus Drive 07932 New Jersey (USA)
35% Insurance and Reinsurance MAPFRE RE 100.0000% 950 17 A
CAJA REASEGURADORA DE CHILE Ava. Apoquindo 4499-8º Santiago de Chile (Chile)
20% Reinsurance MAPFRE Chile RE 99.8467% 131,214 8,700 29,994 182 A
INMOBILIARIA COSTA DE MONTEMAR, S.A. Ava. Apoquindo 4499-8º Santiago de Chile (Chile)
24% Real Estate MAPFRE Chile RE 31.4400% 1,091 B
C R ARGENTINA S.A Bouchard 547 piso 14 Buenos Aires (Argentina)
35% Services, Consulting MAPFRE Chile RE 99.9960% 1,204 912 A
MAPFRE EURO BONDS FUND Asset management MAPFRE RE 100.0000% 86,475 86,368 AD
MAPFRE MULTI ASSET STRATEGY Asset management MAPFRE RE 39.4160% 86,501 86,501 B
Figures in thousands of euros
Table of subsidiary and associated companies 2016 (appendix 1) Name Country Effective
tax rateACTIVITY % SHARE DATA AS OF CLOSE OF FISCAL YEAR 2017
Holder Share capital Assets Net equity Revenues Result for the fiscal year
Method or procedure of consolidation
CIAR INVESTMENTS 45 Rue de Trèves Brussels (Belgium)
34% Real Estate MAPFRE REMAPFRE Internacional
99.9900%0.0100%
9,744 8,998 573 26 A
MAPRE CHILE REASEGUROS S.A. Avda Apoquindo 4499-8º Santiago de Chile (Chile)
20% Holding MAPFRE RE 100.0000% 169,181 41,096 39,333 (8,072) A
F. ALCORTA S.A. Bouchard 547 piso 14 Buenos Aires (Argentina)
35% Real Estate (in liquidation) MAPFRE RE 99.9985% C
MAPFRE RE DO BRASIL COMPAÑÍA DE REASEGUROS Rua Olimpiadas 242 5º Andar São Paulo (Brazil)
15% Reinsurance MAPFRE RE 99.9999% 240,659 50,141 90,342 8,355 A
MAPFRE RE COMPAÑÍA DE REASEGUROS ESCRITORIO DE REPRESENTAÇÃO NO BRASIL LTDA
Rua Olimpiadas 242 5º Andar São Paulo (Brazil)
15% Representation services MAPFRE RE 99.9999% 47 47 C
MAPFRE MANDATOS Y SERVICIOS S.A. Bouchard 547 piso 14 Buenos Aires (Argentina)
35% Services
MAPFRE REMAPFRE Argentina
95.0000% 5.0000%
20 20 (4) C
MAPFRE INTERNET S.A. (TECH) Ctra. de Pozuelo a Majadahonda no. 52 Madrid (Spain)
25% Computing MAPFRE RE 0.8002% 63,395 1,221 26,033 108 C
VENEASISTENCIA C.A. Avda. Libertador Penthouse A y B Caracas (Venezuela)
34% Travel Assistance MAPFRE RE 0.0020% 920 655 463 (180) C
REINSURANCE MANAGEMENT INC. 100 Campus Drive 07932 New Jersey (USA)
35% Insurance and Reinsurance MAPFRE RE 100.0000% 1,049 20 A
CAJA REASEGURADORA DE CHILE Ava. Apoquindo 4499-8º Santiago de Chile (Chile)
20% Reinsurance MAPFRE Chile RE 99.8467% 135,971 10,117 36,350 (9,330) A
INMOBILIARIA COSTA DE MONTEMAR, S.A. Ava. Apoquindo 4499-8º Santiago de Chile (Chile)
24% Real Estate MAPFRE Chile RE 31.4400% 1,091 B
C R ARGENTINA S.A Bouchard 547 piso 14 Buenos Aires (Argentina)
35% Services, Consulting MAPFRE Chile RE 99.9960% 50 38 A
Figures in thousands of euros CONSOLIDATION METHOD OR PROCEDUREA. Subsidiaries consolidated by global integrationB. Associated and investee companies consolidated by the equity methodC. Associated and investee companies excluded from consolidationD. Companies incorporated into the consolidation scope in fiscal year 2017

81Consolidated Annual Accounts
Table of subsidiary and associated companies 2017 (appendix 1) Name Country Effective
tax rateACTIVITY % SHARE DATA AS OF CLOSE OF FISCAL YEAR 2017
Holder Share capital Assets Net equity Revenues Result for the fiscal year
Method or procedure of consolidation
CIAR INVESTMENTS 45 Rue de Trèves Brussels (Belgium)
34% Real Estate 9,831 9,121 642 143 A
MAPRE CHILE REASEGUROS S.A. Avda Apoquindo 4499-8º Santiago de Chile (Chile)
20% Holding MAPFRE RE 100.0000% 166,441 40,445 33,000 809 A
F. ALCORTA S.A. Bouchard 547 piso 14 Buenos Aires (Argentina)
35% Real Estate (in liquidation) MAPFRE RE 99.9985% C
MAPFRE RE DO BRASIL COMPAÑÍA DE REASEGUROS Rua Olimpiadas 242 5º Andar São Paulo (Brazil)
15% Reinsurance MAPFRE RE 99.9999% 218,690 44,341 75,339 8,761 A
MAPFRE RE COMPAÑÍA DE REASEGUROS ESCRITORIO DE REPRESENTAÇÃO NO BRASIL LTDA
Rua Olimpiadas 242 5º Andar São Paulo (Brazil)
15% Representation services MAPFRE RE 99.9999% 47 47 C
MAPFRE MANDATOS Y SERVICIOS S.A. Bouchard 547 piso 14 Buenos Aires (Argentina)
35% Services
MAPFRE REMAPFRE Argentina
95.0000% 5.0000%
20 20 (4) C
MAPFRE INTERNET S.A. (TECH) Ctra. de Pozuelo a Majadahonda no. 52 Madrid (Spain)
25% Computing MAPFRE RE 0.8002% 53,096 20,162 178,164 (1,778) C
VENEASISTENCIA C.A. Avda. Libertador Penthouse A y B Caracas (Venezuela)
34% Travel Assistance MAPFRE RE 0.0020% 549 325 193 (204) C
REINSURANCE MANAGEMENT INC. 100 Campus Drive 07932 New Jersey (USA)
35% Insurance and Reinsurance MAPFRE RE 100.0000% 950 17 A
CAJA REASEGURADORA DE CHILE Ava. Apoquindo 4499-8º Santiago de Chile (Chile)
20% Reinsurance MAPFRE Chile RE 99.8467% 131,214 8,700 29,994 182 A
INMOBILIARIA COSTA DE MONTEMAR, S.A. Ava. Apoquindo 4499-8º Santiago de Chile (Chile)
24% Real Estate MAPFRE Chile RE 31.4400% 1,091 B
C R ARGENTINA S.A Bouchard 547 piso 14 Buenos Aires (Argentina)
35% Services, Consulting MAPFRE Chile RE 99.9960% 1,204 912 A
MAPFRE EURO BONDS FUND Asset management MAPFRE RE 100.0000% 86,475 86,368 AD
MAPFRE MULTI ASSET STRATEGY Asset management MAPFRE RE 39.4160% 86,501 86,501 B
Figures in thousands of euros
Table of subsidiary and associated companies 2016 (appendix 1) Name Country Effective
tax rateACTIVITY % SHARE DATA AS OF CLOSE OF FISCAL YEAR 2017
Holder Share capital Assets Net equity Revenues Result for the fiscal year
Method or procedure of consolidation
CIAR INVESTMENTS 45 Rue de Trèves Brussels (Belgium)
34% Real Estate MAPFRE REMAPFRE Internacional
99.9900%0.0100%
9,744 8,998 573 26 A
MAPRE CHILE REASEGUROS S.A. Avda Apoquindo 4499-8º Santiago de Chile (Chile)
20% Holding MAPFRE RE 100.0000% 169,181 41,096 39,333 (8,072) A
F. ALCORTA S.A. Bouchard 547 piso 14 Buenos Aires (Argentina)
35% Real Estate (in liquidation) MAPFRE RE 99.9985% C
MAPFRE RE DO BRASIL COMPAÑÍA DE REASEGUROS Rua Olimpiadas 242 5º Andar São Paulo (Brazil)
15% Reinsurance MAPFRE RE 99.9999% 240,659 50,141 90,342 8,355 A
MAPFRE RE COMPAÑÍA DE REASEGUROS ESCRITORIO DE REPRESENTAÇÃO NO BRASIL LTDA
Rua Olimpiadas 242 5º Andar São Paulo (Brazil)
15% Representation services MAPFRE RE 99.9999% 47 47 C
MAPFRE MANDATOS Y SERVICIOS S.A. Bouchard 547 piso 14 Buenos Aires (Argentina)
35% Services
MAPFRE REMAPFRE Argentina
95.0000% 5.0000%
20 20 (4) C
MAPFRE INTERNET S.A. (TECH) Ctra. de Pozuelo a Majadahonda no. 52 Madrid (Spain)
25% Computing MAPFRE RE 0.8002% 63,395 1,221 26,033 108 C
VENEASISTENCIA C.A. Avda. Libertador Penthouse A y B Caracas (Venezuela)
34% Travel Assistance MAPFRE RE 0.0020% 920 655 463 (180) C
REINSURANCE MANAGEMENT INC. 100 Campus Drive 07932 New Jersey (USA)
35% Insurance and Reinsurance MAPFRE RE 100.0000% 1,049 20 A
CAJA REASEGURADORA DE CHILE Ava. Apoquindo 4499-8º Santiago de Chile (Chile)
20% Reinsurance MAPFRE Chile RE 99.8467% 135,971 10,117 36,350 (9,330) A
INMOBILIARIA COSTA DE MONTEMAR, S.A. Ava. Apoquindo 4499-8º Santiago de Chile (Chile)
24% Real Estate MAPFRE Chile RE 31.4400% 1,091 B
C R ARGENTINA S.A Bouchard 547 piso 14 Buenos Aires (Argentina)
35% Services, Consulting MAPFRE Chile RE 99.9960% 50 38 A
82 ANNUAL REPORT 2017

83
Audit report for the Annual
Consolidated Financial
Statements
4

84 ANNUAL REPORT 2017
85Audit report for the Annual Consolidated Financial Statements
KPMG Auditores S.L., sociedad española de responsabilidad limitada y firma miembro de la red KPMG de firmas independientes afiliadas a KPMG International Cooperative (“KPMG International”), sociedad suiza. Paseo de la Castellana, 259C – Torre de Cristal – 28046 Madrid
KPMG Auditores, S.L.Paseo de la Castellana, 259 28046 Madrid
Independent Auditor's Report on the Annual Accounts
Inscrita en el Registro Oficial de Auditores de Cuentas con el nº.S0702, y en el Registro de Sociedades del Instituto de Censores Jurados de Cuentas con el nº.10. Reg. Mer Madrid, T. 11.961, F. 90, Sec. 8, H. M -188.007, Inscrip. 9 N.I.F. B-78510153
(Translation from the original in Spanish. In the event of discrepancy, the Spanish-language version prevails.)
To the shareholders of Mapfre RE, Compañía de Reaseguros S.A.
REPORT ON THE CONSOLIDATED ANNUAL ACCOUNTS
Opinion _________________________________________________________________________________
We have audited the consolidated annual accounts of Mapfre RE, Compañía de Reaseguros S.A. (the "Parent") and subsidiaries (together the "Group”), which comprise the consolidated balance sheet at 31 December 2017, and the consolidated income statement, consolidated statement of recognised income and expense, consolidated statement of changes in equity and consolidated statement of cash flows for the year then ended, and consolidated notes.
In our opinion, the accompanying consolidated annual accounts give a true and fair view, in all material respects, of the consolidated equity and consolidated financial position of the Group at 31 December 2017 and of its consolidated financial performance and consolidated cash flows for the year then ended in accordance with International Financial Reporting Standards as adopted by the European Union (IFRS-EU) and other provisions of the financial reporting framework applicable in Spain.
Basis for Opinion ______________________________________________________________________
We conducted our audit in accordance with prevailing legislation regulating the audit of accounts in Spain. Our responsibilities under those standards are further described in the Auditor's Responsibilities for the Audit of the Consolidated Annual Accounts section of our report.
We are independent of the Group in accordance with the ethical requirements, including those regarding independence, that are relevant to our audit of the consolidated annual accounts in Spain pursuant to the legislation regulating the audit of accounts. We have not provided any non-audit services, nor have any situations or circumstances arisen which, under the aforementioned regulations, have affected the required independence such that this has been compromised.
We believe that the audit evidence we have obtained is sufficient and appropriate to provide a basis for our opinion.
Key Audit Matters _____________________________________________________________________
Key audit matters are those matters that, in our professional judgement, were of most significance in the audit of the consolidated annual accounts of the current period. These matters were addressed in the context of our audit of the consolidated annual accounts as a whole, and in forming our opinion thereon, and we do not provide a separate opinion on these matters.

86 ANNUAL REPORT 2017
2
Key Audit Matters _____________________________________________________________________
Valuation of technical provisions (Euros 4,642.6 million) See notes 5.9 and 6.9 to the consolidated annual accounts
Key audit matter How the matter was addressed in our audit
The Group recognises technical provisions for accepted reinsurance based on the accounts received from the ceding companies and the terms and conditions of the accepted reinsurance contracts.
Estimating these provisions is complex and requires actuarial methods and calculations based on judgement and significant assumptions.
These estimates include assumptions related to the amount of the expected settlement and historical payment patterns for accepted reinsurance claims. Due to their nature, there is a significant degree of uncertainty, and a change in assumptions could significantly impact the annual accounts.
Our audit procedures included testing the design, implementation and effectiveness of key controls established by the Company for estimating technical provisions, including controls on the definition of key assumptions and on the integrity and accuracy of the databases used when estimating these provisions.
Our substantive procedures on the technical provisions basically consisted of the following:
• Tests of the integrity and accuracy of the databases used to estimate technical provisions and from which the calculation assumptions were derived, based on a sample of accepted reinsurance contracts.
• Confirmation of balances pending settlement vis-à-vis accepted reinsurance companies at 31 December 2017, for a sample of contracts.
• Based on our knowledge and experience of the sector, assessment of the reasonableness of the actuarial models and the assumptions employed in calculating the provision for claims, comparing them to actuarial best practices, regulatory requirements, market scenarios and historical trends.
• Review and analysis of the assumptions derived by the Company, comparing the claims indicators or ratios used by the Company in its actuarial models with past experience, and assessing their reasonableness based on the latest information available.
We also assessed the adequacy of the information disclosed in the annual accounts on the provision for non-life insurance claims, considering the requirements of the Spanish General Chart of Accounts for Insurance Entities.

87Audit report for the Annual Consolidated Financial Statements
3
Other Information: Consolidated Directors’ Report ________________________________
Other information solely comprises the 2017 consolidated directors' report, the preparation of which is the responsibility of the Parent's Directors and which does not form an integral part of the consolidated annual accounts.
Our audit opinion on the consolidated annual accounts does not encompass the consolidated directors' report. Our responsibility as regards the content of the consolidated directors' report is defined in the legislation regulating the audit of accounts, which establishes two different levels:
a) A specific level applicable to the consolidated statement of non-financial information, which consists solely of verifying that this information has been provided in the consolidated directors' report, or where applicable, that the consolidated directors' report makes reference to the separate report on non-financial information, as provided for in legislation, and if not, to report on this matter.
b) A general level applicable to the rest of the information included in the consolidated directors' report, which consists of assessing and reporting on the consistency of this information with the consolidated annual accounts, based on knowledge of the Group obtained during the audit of the aforementioned accounts and without including any information other than that obtained as evidence during the audit. Also, assessing and reporting on whether the content and presentation of this part of the consolidated directors' report are in accordance with applicable legislation. If, based on the work we have performed, we conclude that there are material misstatements, we are required to report them.
Based on the work carried out, as described above, we have verified that the information mentioned in a) above has been provided in the consolidated directors' report and that the rest of the information contained in the consolidated directors' report is consistent with that disclosed in the consolidated annual accounts for 2017 and the content and presentation of the report are in accordance with applicable legislation.
Directors' Responsibility for the Consolidated Annual Accounts _________________
The Parent's Directors are responsible for the preparation of the accompanying consolidated annual accounts in such a way that they give a true and fair view of the consolidated equity, consolidated financial position and consolidated financial performance of the Group in accordance with IFRS-EU and other provisions of the financial reporting framework applicable to the Group in Spain, and for such internal control as they determine is necessary to enable the preparation of consolidated annual accounts that are free from material misstatement, whether due to fraud or error.
88 ANNUAL REPORT 2017
4
In preparing the consolidated annual accounts, the Parent's Directors are responsible for assessing the Group's ability to continue as a going concern, disclosing, as applicable, matters related to going concern and using the going concern basis of accounting unless the Directors either intend to liquidate the Group or to cease operations, or have no realistic alternative but to do so.
Auditor's Responsibilities for the Audit of the Consolidated Annual Accounts _
Our objectives are to obtain reasonable assurance about whether the consolidated annual accounts as a whole are free from material misstatement, whether due to fraud or error, and to issue an auditor's report that includes our opinion.
Reasonable assurance is a high level of assurance, but is not a guarantee that an audit conducted in accordance with prevailing legislation regulating the audit of accounts in Spain will always detect a material misstatement when it exists. Misstatements can arise from fraud or error and are considered material if, individually or in the aggregate, they could reasonably be expected to influence economic decisions of users taken on the basis of these consolidated annual accounts.
As part of an audit in accordance with prevailing legislation regulating the audit of accounts in Spain, we exercise professional judgement and maintain professional scepticism throughout the audit. We also:
— Identify and assess the risks of material misstatement of the consolidated annual accounts, whether due to fraud or error, design and perform audit procedures responsive to those risks, and obtain audit evidence that is sufficient and appropriate to provide a basis for our opinion. The risk of not detecting a material misstatement resulting from fraud is higher than for one resulting from error, as fraud may involve collusion, forgery, intentional omissions, misrepresentations, or the override of internal control.
— Obtain an understanding of internal control relevant to the audit in order to design audit procedures that are appropriate in the circumstances, but not for the purpose of expressing an opinion on the effectiveness of the Group's internal control.
— Evaluate the appropriateness of accounting policies used and the reasonableness of accounting estimates and related disclosures made by the Parent's Directors.
— Conclude on the appropriateness of the Parent's Directors' use of the going concern basis of accounting and, based on the audit evidence obtained, whether a material uncertainty exists related to events or conditions that may cast significant doubt on the Group's ability to continue as a going concern. If we conclude that a material uncertainty exists, we are required to draw attention in our auditor's report to the related disclosures in the consolidated annual accounts or, if such disclosures are inadequate, to modify our opinion. Our conclusions are based on the audit evidence obtained up to the date of our auditor's report. However, future events or conditions may cause the Group to cease to continue as a going concern.
— Evaluate the overall presentation, structure and content of the consolidated annual accounts, including the disclosures, and whether the consolidated annual accounts represent the underlying transactions and events in a manner that achieves a true and fair view.
— Obtain sufficient appropriate audit evidence regarding the financial information of the entities or business activities within the Group to express an opinion on the consolidated annual accounts. We are responsible for the direction, supervision and performance of the Group audit. We remain solely responsible for our audit opinion.
We communicate with those charged with governance of the Company regarding, among other matters, the planned scope and timing of the audit and significant audit findings, including any significant deficiencies in internal control that we identify during our audit.
89Audit report for the Annual Consolidated Financial Statements
5
We also provide those charged with governance of the Company with a statement that we have complied with the applicable ethical requirements, including those regarding independence, and to communicate with them all matters that may reasonably be thought to bear on our independence and, where applicable, related safeguards.
From the matters communicated to those charged with governance of the Company, we determine those that were of most significance in the audit of the consolidated annual accounts of the current period and which are therefore the key audit matters.
We describe these matters in our auditor’s report unless law or regulation precludes public disclosure about the matter.
REPORT ON OTHER LEGAL AND REGULATORY REQUIREMENTS
Additional Report Pursuant to Article 36 of Audit Law 22/2015 __________________
The opinion expressed in this report is consistent with our additional report dated 9 March 2018, issued pursuant to article 36 of Audit Law 22/2015.
Contract Period ________________________________________________________________________
We were appointed as auditor of Mapfre RE, Compañía de Reaseguros S.A. by the shareholders at the ordinary general meeting on 16 April 2015 for a period of three years, from the year commenced 1 January 2015.
(Signed on original in Spanish)
Antonio Lechuga On the Spanish Official Register of Auditors (“ROAC”) with No. 03811
9 March 2018
KPMG Auditores, S.L. On the Spanish Official Register of Auditors (“ROAC”) with No. S0702

90 ANNUAL REPORT 2017
Individual Management
Report
5

91Individual Management Report
Introduction MAPFRE RE, Compañía de Reaseguros S.A. (the “Company”) registered a very positive result in 2017, with an income and premium volume similar to 2016, despite the worsening of rates and conditions in the first half of the year, and the occurrence of various catastrophic events that had a severe impact on the global insurance and reinsurance industry in the second half of the fiscal year.
The net impact of natural disasters on the result has been very limited, thanks to the solidity of its risk management and the effectiveness of its financial protection.
The Company is a subsidiary of MAPFRE S.A., the company that deposits its Consolidated Annual Accounts, together with the Consolidated Report on Operations and the Integrated Report, which include the Group's non-financial information, with the Commercial Registry of Madrid.
Key figures Income Statement
Accounted accepted premiums were 4,149.22 million euros, an increase of 0.2 percent compared to those posted the previous year. Net premiums reached 2,757.5 million euros, which represents an increase of 1.3 percent compared to the previous year.
The combined ratio of the Life and Non-Life business was 97.8 percent (96.6 percent in 2016), including a 70.0 percent claims ratio, with commissions and other acquisition and management expenses amounting to 27.8 per cent.
The underwriting result amounted to 65.2 million euros (88.5 million euros in 2016). Net financial income reached a result of 154.2 million euros (164.9 million euros in 2016).
The profit and loss statement shows earnings before tax and non-controlling interests amounting to 213.1 million euros, a very positive result if we consider the competitive environment and the catastrophic events of the year. The result registered the previous year was 248.6 million euros. Net profit after tax and non-controlling interests came to 159.5 million euros, 14.4 percent below the 186.3 million euros registered the previous fiscal year.
Balance Sheet
Net equity amounted to 1,248.9 million euros.
Net technical provisions reached 2,976.5 million euros, representing 107.9 percent of net earned premiums.
Financial investments totaled 3,300.9 million euros. This figure is made up of financial assets held for trading reaching 8.4 million euros, financial Assets available for sale in the amount of 2,831.8 million euros, cash and other equivalent liquid assets reaching 191.4 million euros, while Participations in associated companies of the Group reached 269.3 million euros.
Total assets amounted to 6,153.6 million euros.
Main activities Commercial initiatives
MAPFRE RE has increased its operations to cover a total of 20 countries, opening a representative office in Tokyo in late 2017, which will allow it to consolidate the close relations with the Japanese market further, offering yet another example of the commitment made by MAPFRE RE to Asia, a continent in which it already has 5 offices.
In all geographic areas, commercial initiatives have been pursued to strengthen the relationship enjoyed by MAPFRE RE in its markets, with clients and brokers alike.
The Personal Area has held numerous meetings with clients and brokers on the range of Life reinsurance solutions offered by MAPFRE RE in accordance with the new solvency regulations, participating and speaking out in market events and academic forums on the selection of risks and digital transformation in quoting process of Life lines in Mexico, Colombia, Vietnam, Italy, Argentina, Spain and France.
They have also spoken at various forums on the Spanish agricultural insurance model in Spain and Mexico, the Brazilian reinsurance market 10 years after its opening, and have sponsored specialized professional events, such as meetings of the Latin American Association of Agricultural Insurance (ALASA) in Chile and Panama, the International Association of Agricultural Production Insurers (AIAG) in Poland, the Crop Insurance and Reinsurance Bureau (CIRB) in the USA, the Inter-European Reinsurance Meeting (ENTRE) in Spain, the Philippine General Insurance Summit in Manila, and the jubilee celebrations of the Netherlands Reinsurance Association (NRV).

92 ANNUAL REPORT 2017
Underwriting management and client services
Sharing knowledge with its clients continues to be an essential activity for MAPFRE RE. This is truly one of the reasons behind the decision to hold training days, including, in particular, a new edition of the MAPFRE RE International Forum in Madrid, with 17 guests invited from 16 different countries, or the collaboration with the National Institute of Insurance and Fasecolda, in Colombia, to present its international Senior Reinsurance Management program. In Beijing, days were organized on proportional reinsurance sessions were organized, attended by 44 professionals from 24 market companies, and various clients in Colombia, Argentina, Italy and Turkey received technical training on insurer management in the agricultural, Non-Life and/or Life lines.
In a constant bid to get to know and incorporate new ideas into the reinsurance practice, MAPFRE RE has signed up to the Blockchain Insurance Industry Initiative (B3i), which seeks to explore the potential of using Blockchain distributed registration technologies in the insurer industry and collaborates with corporate innovation teams in the group to support the development of other initiatives. Along these same lines, MAPFRE RE continues to support projects with qualified partners looking for innovative reinsurance solutions.
By the same token, MAPFRE RE has also launched new initiatives for the professional growth of its teams: a training program on team management and project leadership for those in managerial positions, set to involve more than 80 company executives; a global trainee program to bring young, new talent into the workforce; and technical training seminars for underwriters from all offices.
Information and technology systems
The requirements of the new international accounting standards - IFRS 17 - that should come into force in 2021, require work to be carried out on identifying the impact on, and adjustment necessary to the MAPFRE RE business and accounting systems. It is a very important change that will affect multiple processes and towards which MAPFRE RE continued to work in 2017.
During this year, the version of the Business Intelligence tool (Microstrategy) was also renewed, improving its performance and allowing the adoption of more complete solutions in new developments of information exploitation.
In 2017, MAPFRE RE incorporated the Corporate User Attention Service, as well as the Corporate Job Position Management, and virtually completed development of CRM tools for sales management and the new MAPFRE RE intranet, applying group standards while awaiting deployment in early 2018.
Subsidiaries and investee companies
MAPFRE RE DO BRASIL obtained revenue of 58.9 million euros and a result before tax of 13.1 million euros, with its shareholders’ equity reaching 44.3 million euros as of the end of the fiscal year. These results were achieved in a competitive environment hindered by low economic growth, although the local currency registered some recovery against the euro.
INVERSIONES IBÉRICAS and MAPFRE CHILE REASEGUROS obtained revenues of 32.4 million euros, a result before tax of 1.4 million euros, closing the fiscal year with shareholders’ equity of 51.7 million euros.
Social and environmental mattersPersonnel
The workforce in service at the close of the last two fiscal years has the following structure, classified according to professional category.
Category 2017 2016
Directors 2 2
Senior Managers 0 0
Managers 88 90
Technicians 236 212
Administrative Staff 60 46
TOTAL 386 350
The workforce objectives include the professional development of employees and the strengthening of their employability and well-being through the development of their skills and capacities. It is intended to achieve this in an environment of commitment and mutual respect, with no offensiveness, intimidation, harassment or discrimination whatsoever, and a workplace that guarantees safety and stability.
To this end, it has a Code of Ethics and Conduct, inspired by the Institutional and Business Principles, and which aims to reflect the corporate values and the basic principles that should guide the performance of the company and the people that comprise the same.
The Policy of Respect for people expressly states that respect for others should be a basic element of employee behavior. It thus rejects any manifestation of workplace harassment, and any other behavior that is violent or offensive to the rights and dignity of people, given that these situations contaminate the work environment and have negative effects on the health,

93Individual Management Report
well-being, confidence, dignity and performance of those who suffer it.
The Company encourages permanent over temporary contracts, seeking a stable environment and continuity in labor relations. The percentage of the Company’s fixed workforce and that of its subsidiaries in 2017 was 97.9 percent (97.7 percent in 2016).
During the fiscal year, development continued with the Global Disability Program, and at the year-end, there were 4 people with a disability on the workforce (the same as in 2016).
The Promotion, Selection and Mobility Policy aims to promote professional development opportunities to employees through programs and development plans, training itineraries and mobility between different areas and countries, in order to increase employability, professional satisfaction and its commitment to the company.
In order to select the right people, there is a global procedure in place that guarantees objectivity, maximum rigor and non-discrimination in all processes. The selection tests used are homogeneous worldwide, aimed at choosing the most appropriate candidate for each job position. The number of selection processes carried out in 2017 was 59 (35 in 2016).
The compensation policy is based on the job position held by each employee: it is competitive with respect to the market; it guarantees internal fairness; it is flexible and adaptable to the different groups and circumstances of the market; and it is in line with the strategy.
The Policy on Health, Well-being and the Prevention of Occupational Risks establishes that the health, safety and well-being of workers are essential both for employees and their families, as well as for the productivity, competitiveness and sustainability of the business. In this respect, employees receive annual information and training on health and healthy lifestyles.
Environment
One of the initiatives that allows MAPFRE to generate loyalty in its stakeholders is the promotion of a sustainable environment in which to develop its business.
In 2017, MAPFRE continued to act to fulfill the commitments made in the Environmental Policy approved by the MAPFRE S.A. Board of Directors and revised in 2015 to incorporate new commitments, such as the preservation of Biodiversity and the fight against climate change.
As regards Environmental Management, MAPFRE acts in accordance with the guidelines defined in the triple Integrated Environmental, Energy and Carbon Footprint Management
System (hereinafter “SIGMAYE”), in line with ISO 14001, ISO 50001 and ISO 14064 international standards.
The transversal design and global nature of SIGMAYE enable both corporate and specific local objectives to be established, ensuring compliance with the applicable legislation in force and providing minimum mandatory criteria in countries where the legislation is less developed.
With respect to the carbon footprint, the expanded reach of UNE-EN-ISO 14064 continues to verify the carbon footprint inventories of companies in Spain, Puerto Rico, Colombia and Portugal.
As regards mitigating and adapting to climate change, we have continued to implement the actions defined in the Strategic Plan for Energy Efficiency and Climate Change, with the objective of reducing Group emissions by 20 percent by 2020. Having reached this objective three years earlier than envisaged, we chose to strive toward more ambitious challenges, both in the medium and long-term all the way through to 2050, the year in which we hope to reach CO2 neutrality.
The Group’s actions in this matter have led, for a third consecutive year, to CDP (Driving Sustainable Economies) acknowledging MAPFRE as a global leader in the fight against climate change, including the Group in its Climate A List.
The eco-effiicency measures implemented include energy efficiency measures in buildings in relation to air conditioning (use of free cooling, technological renewal of equipment and adjustment of time and temperature settings), lighting (replacement of lamps with LED, installation of presence sensors and adjustment of times), and other users (technological renovation of facilities using energy efficiency criteria).
Operational control of water management comes through the installation of optimization measures in buildings (aerators, timers, sensors, dual flush systems, etc.) and the control of internal consumption via proprietary billing, in-house meters, leak detection and employee awareness.
As regards the preservation of biodiversity and adhering to the Biodiversity Pact launched by the Spanish Business and Biodiversity Initiative, MAPFRE has published its report on the 2013-2015 results, as have all the other signatory companies. It has also continued its work on protecting an endangered species and preserving its habitat, having this year chosen the turtle and the Mediterranean Sea.
Also, with respect to biodiversity protection, and as a part of the integration of the Environment into the business, the Group has joined the initiative led by the NGO OCEANA and backed by the United Nations for the protection of the oceans and, more specifically, to eliminate illegal fishing by not insuring these activities.

94 ANNUAL REPORT 2017
Environmental, social and governance factors and risks
The Group takes responsibility for the impact of its business activity on the environment and society in general. Its social responsibility model and policy facilitate the integration of environmental, social and governance (ESG) aspects into its business.
Proper monitoring of the ESG aspects makes it possible for the organization to obtain additional information about these potential risks and gain better understanding of social movements and transformations and the expectations of its stakeholders (investors, clients, regulatory bodies, distributors, general public, employees, etc.).
By integrating the management of these risks with the more traditional risks inherent in the activity, we can develop and promote more responsible and sustainable businesses.
There are two policies applied by the Group in this area:
> Risk Management Policy, the objective of which is to establish general guidelines, basic principles and the general framework of action for risk management; to promote a solid culture and an effective system of risk management; to ensure that risk analysis forms part of the decision-making process; and to preserve the Group's solvency and financial strength.
> Compliance Function Policy, whose main objective is to minimize the likelihood of any legal or compliance risk materializing. To this end, it defines effective accident prevention and control mechanisms, encourages specialized staff training, and promotes an ethical and compliance culture across the organization.
Other informationFinancial Risks
MARKET AND INTEREST RATES RISKS
Fluctuations in market prices can reduce the value or income generated from the investment portfolio, and in turn, this can have a negative effect on the financial position.
The Company and its subsidiaries mitigate its exposure to these types of risks by means of a prudent investment policy characterized by a high proportion of investment-grade, fixed-income securities.
Most investments are fixed-income securities, accounting for 87.3 percent of the total financial investment portfolio in 2017 (87.6 percent in 2016).
Investments in equity securities and mutual funds have a limited weighting on the results, accounting for approximately 12.7 percent of total financial investments in 2017 (12.4 percent in 2016).
EXCHANGE RATE RISK
Fluctuations in the value of the euro compared with other currencies may, in the future, affect the value of the controlling Company’s assets and liabilities and, consequently, its shareholders’ equity, as well as its operating results and cash flow. Currency conversion differences registered led to the recognition of +2.7 million euros in 2017 (+13.6 million euros in 2016).
RECEIVABLES RISK
Investments returns are also sensitive to changes in general economic conditions, including changes in the general credit ratings of debt security issuers. Exposure to credit risk is mitigated by means of a policy based on the prudent selection of security issuers and counterparties based on their solvency, seeking a high degree of geographic correspondence between issuers of assets and commitments, maintaining a suitable level of diversification, and obtaining, where appropriate, guarantees, collateral and other hedges.
Fixed-income and variable-income investments are subject to limits by the issuer. The policy establishes limits according to the risk profile of the counterparty or of the investment instrument, as well as exposure limits related to the counterparty's rating.

95Individual Management Report
LIQUIDITY RISK
The liquidity risk is mainly managed by maintaining sufficient cash balances to cover any contingency arising from commitments made to third parties. As of December 31, 2017, the balance of cash and other equivalent liquid assets was 200 million euros (140 million euros in 2016), equivalent to 5.80 percent of total investment and liquid funds (3.93 percent in 2016). Additionally, most of the fixed income investments are investment grade and traded on organized markets, providing great capacity to act in the event of potential liquidity crises.
Treasury Stock
The controlling Company does not own its own shares or participations or shares in MAPFRE S.A.; nor did it conduct any operations with such shares in 2017.
Research, Development and Innovation
Client orientation is one of the main axes of MAPFRE's Strategic Plan, which has identified innovation as one of the tools allowing it to offer insurance solutions and services focused on clients’ needs. Innovation in client-oriented products and services thus becomes an essential method by which to achieve the short, medium and long-term objectives.
In 2014, the MAPFRE Innovation Model was launched, designed to promote a culture of innovation throughout the organization and to respond to business challenges. To manage the Model, the Corporate Innovation Committee was established, made up of members of relevant innovation areas, and the Corporate Innovation Division was created, which will lead innovation in MAPFRE. The Innovation Model, at the service of both the local and global strategy, has become one of the key tools by which to achieve differentiation and the Group’s organic growth objectives.
Average Provider Payment Period
Average payment period for service providers during the fiscal year was 6.72 days (8.09 days in fiscal year 2016).
Corporate aspects In fiscal year 2017, Eduardo Pérez de Lema, Ángel Alonso, Ricardo Blanco, Philippe Hebeisen and Mark Hews were reelected as directors of the controlling Company for a new four-year mandate.
Ángel Alonso tendered his resignation as director and, consequently, stood down from all his posts on the Board and Management Committee of the controlling Company, effective January 28, 2018, due to his having reached the maximum age permitted by the company’s articles of association. The Annual General Meeting, held as an extraordinary session on January 26, 2018, ratified the appointment of Ana Isabel Fernández as director of the controlling Company, effective January 29, 2018.
Significant subsequent events There have been no significant events after the year end that may affect the results or future evolution of the Company.
Outlook It is hoped that in 2018, pressure will continue in the sector to obtain positive underwriting results.
The substantial capitalization existing in the reinsurance sector has to date supported the impairment seen in profitability in later years. However, it cannot be hoped that this compensation will continue. The 2017 disasters - of which the final cost is not yet known, given the severity of the damages and impact in terms of interruption to business - have had a major impact on the accounts and budgets of a great many reinsurers and will increase pressure to recover acceptable levels of technical profitability.

96 ANNUAL REPORT 2017

97Individual Annual Accounts
Individual Annual
Accounts
6

98 ANNUAL REPORT 2017
Balance sheet as on December 31, 2017 and 2016A) ASSETS Notes 2017 2016
A-1) Cash and equivalents 9 191,355 135,818A-2) Financial assets held for trading 9 8,490 24,581
I. Equity instruments 9 8,490 21,197II. Debt securities 3,384III. DerivativesIV. Other
A-3) Other financial assets at fair value with changes in gains and losses 9 46 80I. Equity instruments 9 46 80II. Debt securitiesIII. Hybrid instrumentsIV. Investments on behalf of Life insurance policyholders bearing the investment riskV. Other
A-4) Financial assets available for sale 9 2,831,780 3,101,890I. Equity instruments 9 347,268 393,962II. Debt securities 9 2,484,512 2,707,928III. Investments on behalf of Life insurance policyholders bearing the investment riskIV. Other
A-5) Loans and receivables 1,174,255 971,782I. Debt securitiesII. Loans
1. Advances on policies2. Loans to group companies and associates3. Loans to other related companies
III. Deposits with credit companies 9 2,284 4,783IV. Deposits established for accepted reinsurance 9 875,768 711,641V. Receivables on direct insurance operations
1. Policyholders2. Intermediaries
VI. Receivables on reinsurance operations 9 282,932 241,889VII. Receivables on co-insurance operationsVIII. Called capitalIX. Other receivables 13,271 13,469
1. Receivables with public authorities 5,479 8,2412. Remaining receivables 9 7,792 5,228
A-6) Investments held to maturityA-7) Hedging derivativesA-8) Participation of reinsurance in technical provisions 11 1,431,944 696,471
I. Provision for unearned premiums 298,641 293,697II. Provisions for Life insurance 4,666 5,877III. Provision for outstanding claims 1,128,637 396,897IV. Other technical provisions
A-9) Property, plant and equipment and property investments 36,420 35,465I. Property, plant and equipment 5 35,156 34,186II. Property investments 6 1,264 1,279
A-10) Intangible fixed assets 953 575I. GoodwillII. Financial rights derived from policy portfolios acquired from intermediaries III. Other intangible assets 7 953 575
A-11) Holdings in group, multi-group and associated companies 9 y Anexo 1 269,275 53,560I. Holdings in associated companies 9 200 200II. Holdings in multi-group companiesIII. Holdings in group companies 9 269,075 53,360
A-12) Tax assets 28,334 33,869I. Current tax assets 12 5,165II. Deferred tax assets 12 28,322 28,704
A-13) Other assets 180,735 203,523I. Assets and long-term reimbursement rights for personnel 1,454 1,404II. Anticipated commissions and other acquisition costsIII. Accruals 179,209 202,119IV. Remaining assets 72
A-14) Assets held for saleTOTAL ASSETS 6,153,587 5,257,614(Figures in thousands of euros)

99Individual Annual Accounts
LIABILITIES AND EQUITY Notes 2017 2016
A) LIABILITIESA-1) Financial liabilities held for trading
A-2) Other financial assets at fair value with changes in gains and losses
A-3) Debits and payables 392,223 367,587
I. Subordinated liabilities
II. Deposits received for ceded reinsurance 9 67,814 43,763
III. Debt for insurance operations
1. Debt with insured parties
2. Debt with intermediaries
3. Conditional debt
IV. Due on reinsurance operations 9 275,977 275,587
V. Debt on co-insurance operations
VI. Debentures and other negotiable securities
VII. Due to credit institutions
VIII. Debt for preparatory operations of insurance contracts
IX. Other payables: 48,432 48,237
1. Debt to public authorities 19,941 20,435
2. Other debts to group companies and associates 9 26,205 26,083
3. Remaining other debts 9 2,286 1,719
A-4) Hedging derivatives
A-5) Technical provisions 11 y 21 4,408,430 3,542,320
I. Provision for unearned premiums 1,070,396 1,298,201
II. Provision for unexpired risks
III. Provisions for Life insurance 505,743 452,482
1. Provision for unearned premiums 505,743 452,482
2. Provision for unexpired risks
3. Mathematical reserve
4. Provision for Life insurance when the policyholder bears the investment risk
IV. Provision for outstanding claims 2,832,291 1,791,637
V. Provision for profit sharing and return premiums
VI. Other technical provisions
A-6) Non-technical provisions 14 9,869 7,643
I. Provisions for taxes and other legal contingencies
II. Provision for pensions and similar obligations 14 2,803 2,807
III. Provision for payments through settlement agreements
IV. Other non-technical provisions 14 7,066 4,836
A-7) Tax liabilities 34,168 50,606
I. Current tax liabilities
II. Deferred tax liabilities 12 34,168 50,606
A-8) Remaining liabilities 59,989 71,656
I. Accruals 59,795 71,647
II. Liabilities for accounting mismatches
III. Commissions and other acquisition costs for ceded reinsurance
IV. Other liabilities 194 9
A-9) Liabilities linked to assets held for sale
TOTAL LIABILITIES 4,904,679 4,039,812

100 ANNUAL REPORT 2017
LIABILITIES AND EQUITY Notes 2017 2016
B) EQUITYB-1) Shareholders’ equity 1,176,302 1,120,078
I. Capital or mutual fund 10 223,916 223,916
1. Issued capital or mutual fund 223,916 223,916
2. (Uncalled capital)
II. Share premium 220,565 220,565
III. Reserves 147,027 147,020
1. Legal and statutory 10 44,783 44,783
2. Stabilization reserve 41,704
3. Other reserves 102,244 60,533
IV. (Treasury stock)
V. Results from previous fiscal years 528,575 432,549
1. Balance 3 528,979 432,953
2. (Negative results from previous fiscal years) (404) (404)
VI. Other contributions from shareholders and mutual societies
VII. Result for the period 3 159,509 186,317
VIII. (Interim dividend and stabilization reserve) 3 y 10 (103,290) (90,289)
IX. Other equity instruments
B-2) Revaluation adjustments: 9 72,606 97,724
I. Financial assets available for sale 73,418 97,189
II. Hedging operations
III. Currency conversion and exchange differences (812) 535
IV. Accounting mismatch corrections
V. Other adjustments
B-3) Subsidies, donations and endowments received
TOTAL EQUITY 1,248,908 1,217,802
TOTAL LIABILITIES AND EQUITY 6,153,587 5,257,614(Figures in thousands of euros)
Balance sheet as on December 31, 2017 and 2016 (continued)
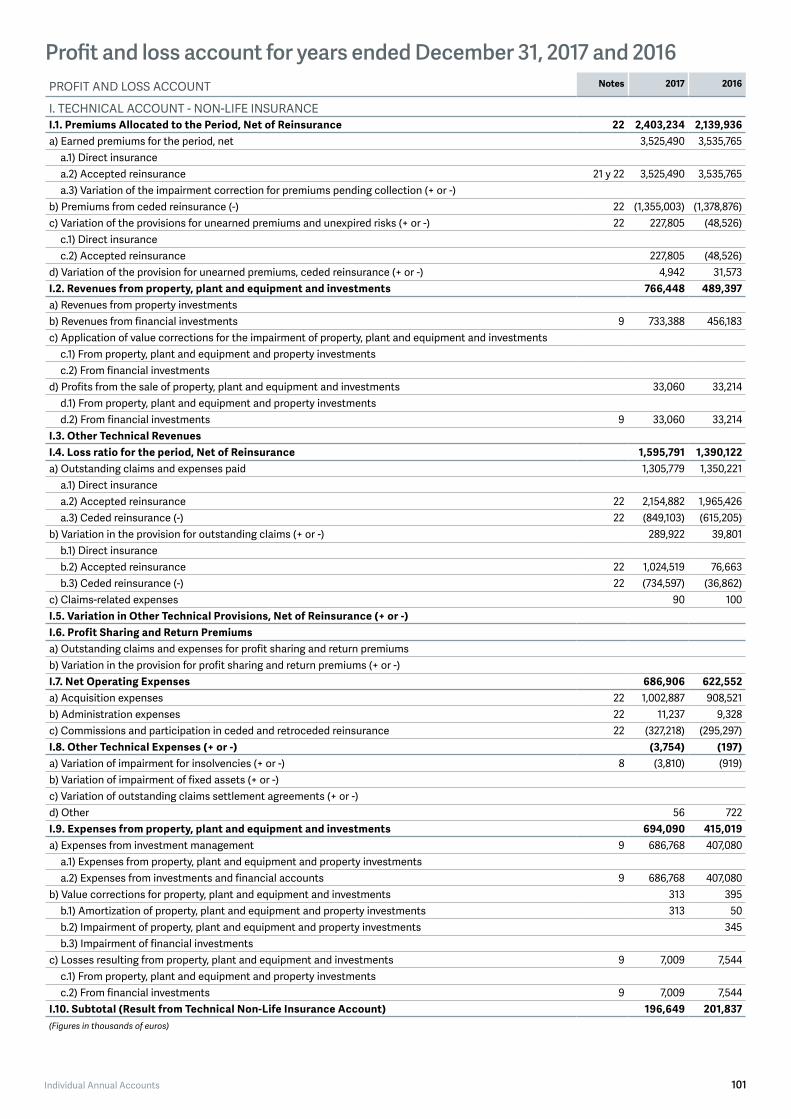
101Individual Annual Accounts
Profit and loss account for years ended December 31, 2017 and 2016PROFIT AND LOSS ACCOUNT Notes 2017 2016
I. TECHNICAL ACCOUNT - NON-LIFE INSURANCEI.1. Premiums Allocated to the Period, Net of Reinsurance 22 2,403,234 2,139,936a) Earned premiums for the period, net 3,525,490 3,535,765
a.1) Direct insurancea.2) Accepted reinsurance 21 y 22 3,525,490 3,535,765a.3) Variation of the impairment correction for premiums pending collection (+ or -)
b) Premiums from ceded reinsurance (-) 22 (1,355,003) (1,378,876)c) Variation of the provisions for unearned premiums and unexpired risks (+ or -) 22 227,805 (48,526)
c.1) Direct insurancec.2) Accepted reinsurance 227,805 (48,526)
d) Variation of the provision for unearned premiums, ceded reinsurance (+ or -) 4,942 31,573I.2. Revenues from property, plant and equipment and investments 766,448 489,397a) Revenues from property investmentsb) Revenues from financial investments 9 733,388 456,183c) Application of value corrections for the impairment of property, plant and equipment and investments
c.1) From property, plant and equipment and property investmentsc.2) From financial investments
d) Profits from the sale of property, plant and equipment and investments 33,060 33,214d.1) From property, plant and equipment and property investmentsd.2) From financial investments 9 33,060 33,214
I.3. Other Technical RevenuesI.4. Loss ratio for the period, Net of Reinsurance 1,595,791 1,390,122a) Outstanding claims and expenses paid 1,305,779 1,350,221
a.1) Direct insurancea.2) Accepted reinsurance 22 2,154,882 1,965,426a.3) Ceded reinsurance (-) 22 (849,103) (615,205)
b) Variation in the provision for outstanding claims (+ or -) 289,922 39,801b.1) Direct insuranceb.2) Accepted reinsurance 22 1,024,519 76,663b.3) Ceded reinsurance (-) 22 (734,597) (36,862)
c) Claims-related expenses 90 100I.5. Variation in Other Technical Provisions, Net of Reinsurance (+ or -)I.6. Profit Sharing and Return Premiumsa) Outstanding claims and expenses for profit sharing and return premiumsb) Variation in the provision for profit sharing and return premiums (+ or -)I.7. Net Operating Expenses 686,906 622,552a) Acquisition expenses 22 1,002,887 908,521b) Administration expenses 22 11,237 9,328c) Commissions and participation in ceded and retroceded reinsurance 22 (327,218) (295,297)I.8. Other Technical Expenses (+ or -) (3,754) (197)a) Variation of impairment for insolvencies (+ or -) 8 (3,810) (919)b) Variation of impairment of fixed assets (+ or -)c) Variation of outstanding claims settlement agreements (+ or -)d) Other 56 722I.9. Expenses from property, plant and equipment and investments 694,090 415,019a) Expenses from investment management 9 686,768 407,080
a.1) Expenses from property, plant and equipment and property investmentsa.2) Expenses from investments and financial accounts 9 686,768 407,080
b) Value corrections for property, plant and equipment and investments 313 395b.1) Amortization of property, plant and equipment and property investments 313 50b.2) Impairment of property, plant and equipment and property investments 345b.3) Impairment of financial investments
c) Losses resulting from property, plant and equipment and investments 9 7,009 7,544c.1) From property, plant and equipment and property investmentsc.2) From financial investments 9 7,009 7,544
I.10. Subtotal (Result from Technical Non-Life Insurance Account) 196,649 201,837(Figures in thousands of euros)

102 ANNUAL REPORT 2017
Profit and loss account for years ended December 31, 2017 and 2016 (continued)
PROFIT AND LOSS ACCOUNT Notes 2017 2016
II. TECHNICAL ACCOUNT - LIFE INSURANCEII.1. Premiums Allocated to the Period, Net of Reinsurance 22 532,544 475,744
a) Earned premiums 623,729 603,585
a.1) Direct insurance
a.2) Accepted reinsurance 21 y 22 623,729 603,585
a.3) Variation of the impairment correction for premiums pending collection (+ or -)
b) Premiums from ceded reinsurance (-) 22 (36,715) (37,921)
c) Variation of the provision for unearned premiums or unexpired risks (+ or -) (53,261) (80,356)
c.1) Direct insurance
c.2) Accepted reinsurance 22 (53,261) (80,356)
d) Variation of the provision for unearned premiums, ceded reinsurance (+ or -) 22 (1,209) (9,564)
II.2. Revenues from property, plant and equipment and investments 181,811 153,936
a) Revenues from property investments
b) Revenues from financial investments 8 170,705 144,237
c) Application of value corrections for the impairment of property, plant and equipment and investments
c.1) From property, plant and equipment and property investments
c.2) From financial investments
d) Profits from the sale of property, plant and equipment and investments 11,106 9,699
d.1) From property plant and equipment and property investments
d.2) From financial investments 8 11,106 9,699
II.3. Revenues from investments subject to insurance in which the policyholder bears the investment risk
II.4. Other Technical Revenues
II.5. Claims for the fiscal year, Net of Reinsurance 459,943 390,911
a) Outstanding claims and expenses paid 440,940 396,461
a.1) Direct insurance
a.2) Accepted reinsurance 22 464,561 421,191
a.3) Ceded reinsurance (-) 22 (23,621) (24,730)
b) Variation in the provision for outstanding claims (+ or -) 18,991 (5,559)
b.1) Direct insurance
b.2) Accepted reinsurance 22 16,134 1,921
b.3) Ceded reinsurance (-) 22 2,857 (7,480)
c) Claims-related expenses 12 9
II.6. Variation in Other Technical Provisions, Net of Reinsurance (+ or -)
a) Provisions for Life insurance
a.1) Direct insurance
a.2) Accepted reinsurance
a.3) Ceded reinsurance (-)
Provisions for Life insurance in which the policyholder bears the investment risk
b) Other technical provisions
II.7. Profit Sharing and Return Premiums
a) Outstanding claims and expenses for profit sharing and return premiums
b) Variation in the provision for profit sharing and return premiums (+ or -)
II.8. Net Operating Expenses 127,932 122,809
a) Acquisition expenses 22 135,811 132,392
b) Administration expenses 22 1,892 787
c) Commissions and holdings in ceded and retroceded reinsurance 22 (9,771) (10,370)

103Individual Annual Accounts
PROFIT AND LOSS ACCOUNT Notes 2017 2016
II.9. Other Technical Expenses 7 83
a) Variation of impairment for insolvencies (+ or -)
b) Variation of impairment of fixed assets (+ or -)
c) Other 7 83
II.10. Expenses for property, plant and equipment and investments 109,239 78,659
a) Management expenses from property, plant and equipment and investments 9 106,898 76,357
a.1) Expenses from property, plant and equipment and property investments
a.2) Expenses from investments and financial accounts 9 106,898 76,357
b) Value corrections for property, plant and equipment and investments 41 107
b.1) Amortization of property, plant and equipment and property investments 41 4
b.2) Impairment of property, plant and equipment and property investment 103
b.3) Impairment of financial investments
c) Losses resulting from property, plant and equipment and investments 9 2,300 2,195
c.1) From property, plant and equipment and property investments
c.2) From financial investments 9 2,300 2,195
II.11. Expenses from investments subject to insurance in which the policyholder bears the investment risk
II.12. Subtotal, (Results from the Life Insurance Technical Account) 17,234 37,218(Figures in thousands of euros)

104 ANNUAL REPORT 2017
Profit and loss account for years ended December 31, 2017 and 2016 (continued) PROFIT AND LOSS ACCOUNT Notes 2017 2016
III. NON-TECHNICAL ACCOUNTIII.1. Revenues from property, plant and equipment and investments 23,312 30,857
a) Revenues from property investments 14 1
b) Revenue from financial investments 9 19,097 26,742
c) Application of value corrections for the impairment of property, plant and equipment and investments
c.1) From property, plant and equipment and property investments
c.2) From financial investments
d) Profit from the sale of property, plant and equipment 4,201 4,114
d.1) From property plant and equipment and property investments 5 8
d.2) From financial investments 9 4,193 4,114
III.2. Expenses from property, plant and equipment and investments 19,176 18,158
a) Expenses from investment management 9 18,239 17,042
a.1) Expenses from investments and financial accounts 9 18,239 17,042
a.2) Material investment expenses
b) Value corrections for property, plant and equipment and investments 52
b.1) Amortization of property, plant and equipment and property investments
b.2) Impairment of property, plant and equipment and property investment 52
b.3) Impairment of financial investments
c) Losses resulting from property, plant and equipment and investments 937 1,064
c.1) From property, plant and equipment and property investments 34 1
c.2) From financial investments 9 903 1,063
III.3. Other Revenues 292 157
a) Revenues from pension fund management
b) Remaining revenues 292 157
III.4. Other expenses 5,228 3,329
a) Expenses from pension fund management
b) Remaining expenses 5,228 3,329
III.5. Subtotal, (Results from Non-Technical Account) (800) 9,527
III.6. Results before Tax (I.10 + II.12 + III.5) 213,083 248,582
III.7. Tax on profits 12 53,574 62,265
III.8. Results from ongoing operations (III.6 + III.7) 3 159,509 186,317
III.9. Results from discontinued operations, net of tax (+ or -)
III.10.Result for the Period (III.8 + III.9) 159,509 186,317(Figures in thousands of euros)

105Individual Annual Accounts
Statement of changes in net equity for years ended December 31, 2017 and 2016
A) Statements of recognized revenue and expenses
STATEMENT OF RECOGNIZED REVENUE AND EXPENSES 2017 2016
I. RESULT FOR THE PERIOD 159,509 186,317
II. OTHER RECOGNIZED REVENUE AND EXPENSES (25,118) (5,300)
II.1. Financial assets available for sale (31,650) (5,931)
Valuation gains and losses 6,164 29,157
Amounts transferred to the income statement (37,814) (35,088)
Other reclassifications
II.2. Cash flow hedging
Valuation gains and losses
Amounts transferred to the income statement
Amounts transferred to the initial value of hedged items
Other reclassifications
II.3. Hedging of overseas business net investments
Valuation gains and losses
Amounts transferred to the income statement
Other reclassifications
II.4. Currency conversion and exchange differences (1,796) (1,015)
Valuation gains and losses (1,796) (1,015)
Amounts transferred to the income statement
Other reclassifications
II.5. Accounting mismatch corrections
Valuation gains and losses
Amounts transferred to the income statement
Other reclassifications
II.6. Assets held for sale
Valuation gains and losses
Amounts transferred to the income statement
Other reclassifications
II.7. Actuarial gains / (losses) for long-term personnel remuneration
II.8. Other recognized revenue and expenses
II.9. Tax on profits 8,328 1,646
III. TOTAL RECOGNIZED REVENUE AND EXPENSES 134,391 181,017(Figures in thousands of euros)

106 ANNUAL REPORT 2017
Statement of changes in net equity for the fiscal year completed on December 31, 2017 and 2016.
B) Total statement of changes in net equity
ITEM
CAPITAL OR MUTUAL FUND SHARE PREMIUM
RESERVES (TREASURY STOCK AND OWN EQUITY
HOLDINGS)
RESULT FOR PREVIOUS
YEARS
OTHER SHARE-HOLDER CON-
TRIBUTIONS
RESULT FOR THE PERIOD
(DIVIDEND AND STABILIZATION
RESERVE)
OTHER EQUI-TY INSTRU-
MENTS
REVA-LUATION ADJUST-MENTS
SUBSIDIES, DONATIONS
AND ENDOW-MENTS RECEI-
VED
TOTAL
Issued Not issued
C. CLOSING BALANCE FOR 2015 223,916 220,565 161,178 400,148 146,757 (114,216) 103,024 1,141,372I. Revaluation adjustments 2016II. Adjustments for errors 2016
D. ADJUSTED OPENING BALANCE 2016 223,916 220,565 161,178 400,148 146,757 (114,216) 103,024 1,141,372I. Total recognized revenue and expenses 186,317 (5,300) 181,017II. Operations with shareholders or mutual societies. (90,289) (90,289)
1. Increases in capital or mutual fund. 2. ( - ) Reductions in capital or mutual fund. 3. Conversion of financial liabilities into equity (conversion of debentures, debt write-offs).4. ( - ) Distribution of dividends or active apportionments (note 3). (90,289) (90,289)4.bis ( - ) Distribution of earnings.5. Operations with treasury stock or own equity (net). 6. Increase (reduction) of equity resulting from a business combination. 7. Other operations with shareholders or mutual societies.
III. Other variations in equity (14,156) 32,401 (146,757) 114,216 (14,296)1. Payments based on equity instruments. 2. Transfers among equity items. 32,541 (146,757) 114,2163. Other variations (note 3) (14,156) (140) (14,296)
E. CLOSING BALANCE 2016 223,916 220,565 147,020 432,549 186,317 (90,289) 97,724 1,217,804
ITEM
CAPITAL OR MUTUAL FUND SHARE PREMIUM
RESERVES (TREASURY STOCK AND OWN EQUITY
HOLDINGS)
RESULT FOR PREVIOUS
YEARS
OTHER SHARE-HOLDER CON-
TRIBUTIONS
RESULT FOR THE PERIOD
(DIVIDEND AND STABILIZATION
RESERVE)
OTHER EQUI-TY INSTRU-
MENTS
REVA-LUATION ADJUST-MENTS
SUBSIDIES, DONATIONS
AND ENDOW-MENTS RECEI-
VED
TOTAL
Issued Not issued
C. CLOSING BALANCE FOR 2016 223,916 220,565 147,020 432,549 186,317 (90,289) 97,724 1,217,804I. Revaluation adjustments 2017II. Adjustments for errors 2017
D. ADJUSTED OPENING BALANCE 2017 223,916 220,565 147,020 432,549 186,317 (90,289) 97,724 1,217,804I. Total recognized revenue and expenses 159,509 (25,118) 134,390II. Operations with shareholders or mutual societies. (103,290) (103,290)
1. Increases in capital or mutual fund.2. ( - ) Reductions in capital or mutual fund.3. Conversion of financial liabilities into equity (conversion of debentures, debt write-offs).4. ( - ) Distribution of dividends or active apportionments (note 3). (103,290) (103,290)4.bis ( - ) Distribution of earnings.5. Operations with treasury stock or own equity (net).6. Increase (reduction) of equity resulting from a business combination.7. Other operations with shareholders or mutual societies.
III. Other variations in equity 7 96,026 (186,317) 90,289 51. Payments based on equity instruments.2. Transfers among equity items. 2 96,026 (186,317) 90,2893. Other variations (note 3) 5 5
E. CLOSING BALANCE 2017 223,916 220,565 147,027 528,575 159,509 (103,290) 72,606 1,248,908

107Individual Annual Accounts
Statement of changes in net equity for the fiscal year completed on December 31, 2017 and 2016.
B) Total statement of changes in net equity
ITEM
CAPITAL OR MUTUAL FUND SHARE PREMIUM
RESERVES (TREASURY STOCK AND OWN EQUITY
HOLDINGS)
RESULT FOR PREVIOUS
YEARS
OTHER SHARE-HOLDER CON-
TRIBUTIONS
RESULT FOR THE PERIOD
(DIVIDEND AND STABILIZATION
RESERVE)
OTHER EQUI-TY INSTRU-
MENTS
REVA-LUATION ADJUST-MENTS
SUBSIDIES, DONATIONS
AND ENDOW-MENTS RECEI-
VED
TOTAL
Issued Not issued
C. CLOSING BALANCE FOR 2015 223,916 220,565 161,178 400,148 146,757 (114,216) 103,024 1,141,372I. Revaluation adjustments 2016II. Adjustments for errors 2016
D. ADJUSTED OPENING BALANCE 2016 223,916 220,565 161,178 400,148 146,757 (114,216) 103,024 1,141,372I. Total recognized revenue and expenses 186,317 (5,300) 181,017II. Operations with shareholders or mutual societies. (90,289) (90,289)
1. Increases in capital or mutual fund. 2. ( - ) Reductions in capital or mutual fund. 3. Conversion of financial liabilities into equity (conversion of debentures, debt write-offs).4. ( - ) Distribution of dividends or active apportionments (note 3). (90,289) (90,289)4.bis ( - ) Distribution of earnings.5. Operations with treasury stock or own equity (net). 6. Increase (reduction) of equity resulting from a business combination. 7. Other operations with shareholders or mutual societies.
III. Other variations in equity (14,156) 32,401 (146,757) 114,216 (14,296)1. Payments based on equity instruments. 2. Transfers among equity items. 32,541 (146,757) 114,2163. Other variations (note 3) (14,156) (140) (14,296)
E. CLOSING BALANCE 2016 223,916 220,565 147,020 432,549 186,317 (90,289) 97,724 1,217,804
ITEM
CAPITAL OR MUTUAL FUND SHARE PREMIUM
RESERVES (TREASURY STOCK AND OWN EQUITY
HOLDINGS)
RESULT FOR PREVIOUS
YEARS
OTHER SHARE-HOLDER CON-
TRIBUTIONS
RESULT FOR THE PERIOD
(DIVIDEND AND STABILIZATION
RESERVE)
OTHER EQUI-TY INSTRU-
MENTS
REVA-LUATION ADJUST-MENTS
SUBSIDIES, DONATIONS
AND ENDOW-MENTS RECEI-
VED
TOTAL
Issued Not issued
C. CLOSING BALANCE FOR 2016 223,916 220,565 147,020 432,549 186,317 (90,289) 97,724 1,217,804I. Revaluation adjustments 2017II. Adjustments for errors 2017
D. ADJUSTED OPENING BALANCE 2017 223,916 220,565 147,020 432,549 186,317 (90,289) 97,724 1,217,804I. Total recognized revenue and expenses 159,509 (25,118) 134,390II. Operations with shareholders or mutual societies. (103,290) (103,290)
1. Increases in capital or mutual fund.2. ( - ) Reductions in capital or mutual fund.3. Conversion of financial liabilities into equity (conversion of debentures, debt write-offs).4. ( - ) Distribution of dividends or active apportionments (note 3). (103,290) (103,290)4.bis ( - ) Distribution of earnings.5. Operations with treasury stock or own equity (net).6. Increase (reduction) of equity resulting from a business combination.7. Other operations with shareholders or mutual societies.
III. Other variations in equity 7 96,026 (186,317) 90,289 51. Payments based on equity instruments.2. Transfers among equity items. 2 96,026 (186,317) 90,2893. Other variations (note 3) 5 5
E. CLOSING BALANCE 2017 223,916 220,565 147,027 528,575 159,509 (103,290) 72,606 1,248,908

108 ANNUAL REPORT 2017
Cash flow statement for years ended December 31, 2017 and 2016
CASH FLOW STATEMENT 2017 2016
A) CASH FLOW FROM OPERATING ACTIVITIES
A.1.) Insurance activity 167,857 229,871
1. Direct insurance, co-insurance and accepted reinsurance proceeds 379,370 629,448
2. Direct insurance, co-insurance and accepted reinsurance payments (111,304) (186,399)
3. Ceded reinsurance proceeds 136,127 139,948
4. Ceded reinsurance payments (136,210) (251,840)
5. Outstanding claims recovery
6. Payment of remuneration to intermediaries
7. Other operating proceeds
8. Other operating payments (100,126) (101,286)
9. Total cash proceeds from insurance activities (1 + 3 + 5 + 7) = I 515,497 769,396
10. Total cash payments from insurance activities (2 + 4 + 6 + 8) = II (299,718) (539,525)
A.2.) Other operating activities (31,396) (32,952)
1. Proceeds from pension fund management activities
2. Payments from pension fund management activities
3. Proceeds from other activities
4. Payments from other activities
5. Total cash proceeds from other operating activities (1 + 3) = III
6. Total cash payments from other operating activities (2 + 4) = IV
7. Proceeds and payments for tax on profits (V) (31,396) (32,952)
A.3.) Total net cash flow from operating activities (I - II + III - IV - V) 136,461 196,919
B) CASH FLOW FROM INVESTMENT ACTIVITIES
B.1) Proceeds from investment activities 2,420,904 1,993,627
1. Property, plant and equipment 314 131
2. Property investments 14
3. Intangible assets
4. Financial instruments 2,329,931 1,890,842
5. Holdings in group, multi-group and associated companies 44
6. Interest collected 77,545 86,989
7. Dividends collected 13,100 15,621
8. Business unit
9. Other receipts related to investment activities
10. Total cash proceeds from investment activities (1 + 2 + 3 + 4 + 5 + 6 + 7 + 8 + 9) = VI 2,420,904 1,993,627
B.2.) Payments from investment activities (2,398,538) (2,087,051)
1. Property, plant and equipment (2,149) (43,934)
2. Property investments
3. Intangible assets (434) (26)
4. Financial instruments (2,395,955) (2,042,881)
5. Holdings in group, multi-group and associated companies (210)
6. Business unit
7. Other payments related to investment activities
8. Total cash payments from investment activities (1 + 2 + 3 + 4 + 5 + 6 + 7) = VII (2,398,538) (2,087,051)
B.3.) Total cash flow from investment activities (VI + VII) 22,366 (93,424)

109Individual Annual Accounts
CASH FLOW STATEMENT 2017 2016
C) CASH FLOW FROM FINANCING ACTIVITIES
C.1) Proceeds from financing activities
1. Subordinated liabilities
2. Proceeds from issuing of equity instruments and capital increases
3. Active apportionments and contributions from shareholders or mutual societies
4. Proceeds from sale of treasury stock
5. Other proceeds related to financing activities
6. Total cash proceeds from financing activities (1 + 2 + 3 + 4 + 5) = VIII
C.2) Payments from financing activities (103,290) (90,289)
1. Dividends paid to shareholders (103,290) (90,289)
2. Interest paid
3. Subordinated liabilities
4. Payments on return of shareholders’ contributions
5. Passive apportionments and return of mutual societies’ contributions
6. Purchase of treasury stock
7. Other payments related to financing activities
8. Total cash payments from financing activities (1 + 2 + 3 + 4 + 5 + 6 + 7) = IX (103,290) (90,289)
C.3) Total net cash flow from financing activities (VIII + IX) (103,290) (90,289)
Effect of exchange rate variations (X) 1
Total increase / decrease in cash and cash equivalents (A.3 + B.3 + C.3 + - X) 55,537 13,207
Cash and cash equivalents at beginning of the period 135,818 122,611
Cash and cash equivalents at end of the period 191,355 135,818
1. Banks and savings banks 137,364 94,098
2. Other financial assets 53,991 41,720
3. Bank overdrafts repayable on sight
TOTAL 191,355 135,818(Figures in thousands of euros)

110 ANNUAL REPORT 2017
7
Companies making up the Reinsurance Unit
8
Offices, geographic distribution and supervisors
MAPFRE REPaseo de Recoletos, 2528004 Madrid SPAINTel. 34 91 581 1600Fax. 34 91 709 7461
MAPFRE RE do BrasilRua das Olimpiadas 242, 5ºVila OlimpiaSP 04551-000 São PauloBRAZILTel. 55 11 3040 1900Fax. 55 11 3040 1900
Caja Reaseguradora de ChileAvda. Apoquindo 4499 - 8ºLas CondesSantiago de ChileCHILETel. 56 2 338 1304Fax. 56 2 206 4063
BeijingIgnacio Rodríguez-ArtecheZhongyu Plaza, Suite 1809, A6 Gongti North RdChaoyang District, Beijing 100027CHINATel. 86 10 5975 2558Fax. 86 10 5975 2659
BogotaGuillermo EspinosaCalle 72 nº 10-07 Of. 502Bogota D.C.COLOMBIATel. 57 1 326 4626Fax. 57 1 326 4616
BrusselsPatrick Teles45 Rue de Trèves - P.O. Box 11040 BrusselsBELGIUMTel. 32 2 237 1011Fax. 32 2 230 6785
Buenos AiresMarcelo H. FourcadeTorre Bouchard Bouchard 547 – P. 14C1106 ABG Buenos AiresARGENTINATel. 54 11 4114 0800Fax. 54 11 4114 0899

111Companies and Offices
CaracasMariela SuárezCentro Comercial San IgnacioTorre Copérnico – P. 7 - Of. 701Los Chaguaramos1060 La Castellana, CaracasVENEZUELATel. 58 212 266 3777Fax. 58 212 262 2172
LabuanAndrés LorenzanaLevel 11B, Block4 Office Tower Financial Park Labuan ComplexJalan Merdeka, 87000 – LabuanMALAYSIA(Tel. see Singapore)
LisbonMaria João MatosRua Joshua Benoliel 6, 7° C1250-133 LisbonPORTUGALTel. 351 21 346 4187Fax. 351 21 346 4187
LondonJavier San BasilioDixon House – 1st. Floor1 Lloyd’s AvenueLondon EC3N 3DQUNITED KINGDOMTel. 44 207 283 7877Fax. 44 207 283 0301
ManilaMark D. Sun11th Floor, 6750 Office TowerAyala AvenueMakati City 1226 ManilaPHILIPPINESTel. 63 2 815 8286Fax. 63 2 817 3298
MexicoEduardo LópezPorfirio Díaz no. 102 - 201Col. NochebuenaMexico City 03270MEXICOTel. 52 55 5480 3870Fax. 52 55 5480 3871
MilanEdoardo RadaelliVia Privata Mangili 220121 MilanITALYTel. 39 02 655 4412Fax. 39 02 659 8201
MunichMark MeyerhoffAlter Hof 580331 Munich GERMANYTel. 49 89 1589222 05Fax. 49 89 1589222 22
New JerseyCarlos Sanzo100 Campus DriveFlorham Park NJ 07932-1006USATel. 1 973 443 0443Fax. 1 973 443 0443
ParisJean Pierre Aldon (Life)Patrick Teles (Non-Life)5 Avenue de l’Opera 3em75001 ParisFRANCETel. 33 1 80 48 3011Fax. 33 1 80 48 3010
Santiago de ChileMarcelo UlloaAvda. Apoquindo 4499-8°Las CondesSantiago de ChileCHILETel. 56 2 338 1304Fax. 56 2 206 4063
São PauloJavier Sanchez CeaRua das Olimpiadas 242, 5°Vila OlimpiaSP 04551-000 São PauloBRAZILTel. 55 11 3040 1900Fax. 55 11 3040 1940
SingaporeAndrés Lorenzana12 Marina View #24 – 02Asia Square Tower 2SINGAPORE 018961Tel. 65 8346 4340
TokyoJun Matsuoka 31F, Shiroyama Trust Tower 4-3-1, Toranomon, Minato-kuTokyo 105-6031JAPANTel. 81 3 6435 8420Fax. 81 3 6435 8421
TorontoAgent:Laurie La PalmeCassels Brock & Blackwell LLPSuite 1200 - 40 King Street WestToronto, Ontario M5H 3C2CANADATel. 1 416 869 5781

Paseo de Recoletos, 2528004 - MadridSPAINwww.mapfrere.com
Design and layouttaudesign.com
Print byMonterreina
DL: M-7101-2018

www.mapfrere.com
Annual report 2017
Annual report 2017
Ann
ual r
epor
t 201
7