Annual Report 2017 - Bendigo Bank · PDF fileDiamond Creek Community Bank®Branch ... The...
22
Valley Community Financial Services Limited ABN 86 092 399 730 Hurstbridge & Districts Community Bank®Branch Diamond Creek Community Bank®Branch Eltham & District Community Bank®Branch Doreen & Mernda Community Bank®Branch Kinglake branch Annual Report 2017
Transcript of Annual Report 2017 - Bendigo Bank · PDF fileDiamond Creek Community Bank®Branch ... The...

1 - Annual Report Valley Community Financial Services Limited
Valley Community FinancialServices LimitedABN 86 092 399 730
Hurstbridge & Districts Community Bank®BranchDiamond Creek Community Bank®BranchEltham & District Community Bank®BranchDoreen & Mernda Community Bank®BranchKinglake branch
Annual Report2017

2 - Annual Report Valley Community Financial Services Limited
Contents
Leadership Team
Leadership Team 1
Operation & Compliance Manager’s Report 2
Treasurer’s Report 3
Chairman’s Report 4 - 5
Directors’ Report 6 - 8
Auditor’s Independence Declaration 8
Financial Statements 9
Notes to the Financial Statements 9 - 19
Directors’ Declaration 20
Independent Auditor’s Report to the Members 20
Darren Gray, Business Development & Engagement Manager, Michael Maloney, Business Development Manager, and Jennifer Pearson, Mobile Relationship Manager. For the 2016/17 financial year, these three people wrote $41.8 million in business. We also have Tina Elmer our Operation & Compliance Manager, whose report can be found on page 2.
I am Darren Gray the Business Development & Engagement Manager based in Hurstbridge, servicing the northern side of the group including the Kinglake Ranges. I am a specialist in lending, both home and small business, and being mobile I find it very easy to meet my clients when and where is convenient.
With over 30 years’ banking experience, my customers enjoy the fact I not only help them with their immediate needs, but am seen as a Trusted Advisor.
My mobile number is 0417 167 390 and is on 24/7,
so call me anytime.
My name is Michael Maloney and I am the Business Development Manager who services all areas south of Diamond Creek including Research, Eltham and Lower Plenty. Our Group has in recent times responded to what the market wants with its conveniently located branches, improved E-banking services and now Mobile Lenders like myself. With over 30 years’ experience in banking and being mobile at all times, I make it easier for customers to get access to our products where ever they are located, day or night!
The results so far have been great and the more connected to our customers we become, the better they will get.
If you need me give me a call on 0413 932 771 anytime.
My name is Jennifer Pearson and I am the Mobile Relationship Manager attached to the Doreen & Mernda Community Bank® Branch. I have over 38 years’ experience in banking and have always been passionate about providing not only a professional and friendly banking experience to customers, but the benefit of my expertise in home lending.
The change of position from Branch Manager to Mobile Relationship Manager has now given me the opportunity to focus on our customer requirements and to be of service to customers when and where it suits them.
I can be contacted on 0425 711 236.
Michael MaloneyDarren Gray Jennifer Pearson
We would like to introduce to our Leadership Team.

3 - Annual Report Valley Community Financial Services Limited
On 1 July 2016 we started a new chapter at Valley Community Financial Services Limited. The new direction was a change in structure to be known as “business transformation” to take us into the future. A single company with five sites rather than five silos owned by one organisation. Sharing resources and taking advantage of opportunities as quickly as possible. A change such as this does not happen overnight. It takes a lot of hard work, cooperation and planning. To this end my role as Operations & Compliance Manager is an integral part to ensure it happens. My role is to create efficiencies within the group, control staffing levels, coach the leaders in the branches and ensure that each branch passes Compliance and Community Engagement.
What a transformation it has been. We have two Business Development Managers, Darren Gray and Michael Maloney, as well as a Mobile Relationship Manager, Jennifer Pearson. Being mobile and on the road, enables us to visit our customers at their convenience and take them off the market. Each branch has Leaders, developing their teams into a sales focused culture. Our products are wide and varied and deliver a good income stream to the company. The results that this transformation has had on our bottom line speaks for itself. Business size - core business in ‘0000. Table shows size of book in each site in core business areas:
Branches Deposits 2016
Deposits 2017
Growth Lending2016
Lending2017
Growth Growth%
Hurstbridge 122,665 133,306 10,641 94,359 105,324 10,965 9.95Diamond Creek 70,715 78,827 8,112 44,982 47,709 2,727 9.37Kinglake 13,231 18,136 4,905 24,818 24,673 -145 12.51Eltham 54,920 62,308 7,388 42,970 51,613 8,643 16.38Doreen/Mernda 32,416 28,673 -3,743 29,835 36,425 6,590 4.57
VCFS Ltd 2016 2017 Growth Growth %Deposits 293,947 321,250 27,303 94,359Lending 236,964 265,744 28,780 44,982
Total 530,911 586,994 56,083 10.56
This is an increase of $56 million from previous year.Each branch is measured on nine ‘Key Performance Indicators’ and each branch has its own target aligned to each KPI. KPI (100% YTD)Lending Three branches achieved Deposits Four branches achieved Footings Three branches achievedResi LoanSure One Branch achieved Doreen/MerndaConsumer LoanSure All Branches achieved in this areaGeneral Insurance All Branches achieved in this areaFinancial Planner Referrals One Branch achieved Doreen/MerndaBSSS YTD Two Branches achievedSandhurst YTD Four Branches achieved
The KPI’s are business as usual with branches being able to have control on the end results. With the correct holistic conversations, each branch can have positive effects on these. This has certainly happened this last year.
Financial Planning/Superannuation has produced some outstanding results this year. Financial Planning contributed $35,559 to the group’s bottom line. This is a 54% increase on last year’s revenue. Hurstbridge finished with the third highest revenue in Financial Planning in all our Vic/Tas branches.VALLEY GROUP
Jun 2016 Jun 2017 Change from 2016Hurstbridge $8,814 $14,349 +62.80%Diamond Creek $6,249 $9,173 +46.80%Doreen $3,352 $7,026 +109.60%Eltham $3,476 $3,332 -4.15%Kinglake $1,183 $1,679 +41.92%TOTAL REV $23,074 $35,559 54.10% $12,485
Outstanding results were also achieved as a group in our General Insurance and Consumer LoanSure KPI’s. General Insurance sales of 410 against a group target of 318 = 129% equating to income generated of $143,185 for the year. Compliance is another important area to ensure we have and are abiding by the controls in place against certain tasks to mitigate the risks should these not be adhered too, putting customers and us at risk. Staff work hard throughout the year to ensure their branches are compliant.
Results achieved this year:Diamond Creek Improvements requiredDoreen SatisfactoryEltham SatisfactoryHurstbridge SatisfactoryKinglake Improvements RequiredI am working towards having all branches sit at Satisfactory. Throughout this entire process, the staff have come together as ‘One Team’ working as a single team not only to achieve in their own sites but also to ensure they are all contributing to the group results. Staff have accepted that they will be required to move around the Group and use their skills where they are needed. This has happened on many occasions throughout the year. Part timers are also providing assistance outside their normal working hours in need.I would like to thank all the staff across the group for their patience and hard work throughout this transitioning process. We have overcome challenges along the way from which we have learned. Their dedication to continuing to provide excellent customer service and community engagement has certainly been reflected in our results year to date.Thank you to the Board of Directors for all your assistance throughout the year. I am looking forward to another more prosperous financial year ahead, working as ‘One Group’.
Operation & Compliance Manager’s ReportFor year ending June 30, 2017
Tina ElmerOperations & Compliance Manager

4 - Annual Report Valley Community Financial Services Limited
Business performance summary
Conditions in the wider economy continued to be flat during 2017. Record low interest rates persisted and fueled strong demand in the housing market. However, a new competitive product mix saw our banking book (footings) grow 11% over 2016. This volume growth combined with improved margins contributed to our revenue growing 9% over 2016.On the operational side of the business, the productivity focused organisational restructure that commenced in 2016 now has our cost to revenue ratio tracking in the right direction. In inflation adjusted terms operating expenditure remained at the 2016 level. Profitability as a result of these changes is improving at four of our five branches and the fifth branch is now tracking toward profitability.The tables below provide a snapshot of key data drawn from the financial report and indicators of the growing strength of our business.
Annual Report Valley Community Financial Services Limited 13
Financial year 2018 For the coming financial year, the company’s strategic objectives are to build the business and enhance shareholder value by:
• Leveraging our geographical reach, lower capital and operating costs; • Build the local business book through marketing that speaks to our communities; • Seeking asset investment opportunities that protect shareholder capital and facilitate future
business models; and • Using a plan-do-check-act approach to our performance.
Financial Year 2017 dividend The Board of Directors has declared a dividend of five cents per share payable in October 2017. The total cost of the dividend is $202,595. VCFSL policy requires that the Finance Committee provides Directors with assurances that all governance requirements for a dividend to be declared have been met. The three governance requirements which have been met are: • The Company Constitution; • Corporate Law; and • The Franchise Agreement.
The Board, having considered the strong 2017 result, determined that a dividend of five cents per share will maintain a balance between its three objectives and responsibilities in 2017:
• Maintaining financial stability by increasing long term Retained Earnings within the company by $419,627;
• Maintaining a significant contribution to the community by way of sponsorship spending of $247,513 ($100,000 - CDF); and
• Paying a shareholder return of $202,595 or 5 cents per share.
Phillip Burtt Treasurer
Treasurer’s report
I am pleased to present to you the audited financial report for the financial year ending 30 June 2017.
Business performance summary
Conditions in the wider economy continued to be flat during 2017. Record low interest rates persisted and fueled strong demand in the housing market. However, a new competitive product mix saw our banking book (footings) grow 11% over 2016. This volume growth combined with improved margins contributed to our revenue growing 9% over 2016. On the operational side of the business, the productivity focused organisational restructure that commenced in 2016 now has our cost to revenue ratio tracking in the right direction. In inflation adjusted terms operating expenditure remained at the 2016 level. Profitability as a result of these changes is improving at four of our five branches and the fifth branch is now tracking toward profitability. The tables below provide a snapshot of key data drawn from the financial report and indicators of the growing strength of our business.
KEY DATA
PERFORMANCE INDICATORS
17%
38%
1%
90%
9%
11%• 2017 $586.9m• 2016 $530.9m
FOOTINGS
• 2017 $1.746m• 2016 $1.268m
CASH &INVESTMENTS
• 2017 $2.923m• 2016 $2.504m
NET ASSET
•2017 $541.20k•2016 $285.54k
PROFIT AFTER TAX
•2017 $4.530m•2016 $4.159mREVENUE
•2017 $3.521m•2016 $3.491mEXPENSES
•2017 $247.50k•2016 $262.60k
COMMUNITY SPONSORSHIPS &
CDF
-
0.20
0.40
0.60
0.80
1.00
COST TO INCOME RATIO RETURN ON EQUITY2017 78% 34.53%2016 84% 26.65%2015 87% 21.70%
2017 2016 2015
02468
101214
2017
2016
2015
EARNINGSPER SHARE
(CENTS)13.36 7.05 5.69
SHAREHOLDER & COMMUNITY PARTICIPATION
2017 2016 2015DIVIDENDPAYOUTRATIO
0.20 0.18 0.24
DIVIDENDPER SHARE $0.05 $0.03 $0.03
$0.00$0.01$0.02$0.03$0.04$0.05$0.06
0.000.050.100.150.200.250.30
- 50.00
100.00 150.00 200.00 250.00 300.00
2017 2016 2015SPONSORSHIPS &
CEF247. 262. 174.
REVE
NUEG
ROW
TH &
COS
T M
ANAG
EMEN
TM
EASU
RE
RETURN ONINVESTM
ENT MEASURE
Financial year 2018For the coming financial year, the company’s strategic objectives are to build the business and enhance shareholder value by:
• Leveraging our geographical reach, lower capital and operating costs;
• Build the local business book through marketing that speaks to our communities;
• Seeking asset investment opportunities that protect shareholder capital and facilitate future business models; and
• Using a plan-do-check-act approach to our performance.
Financial Year 2017 dividendThe Board of Directors has declared a dividend of five cents per share payable in October 2017. The total cost of the dividend is $202,595. VCFSL policy requires that the Finance Committee provides Directors with assurances that all governance requirements for a dividend to be declared have been met.
The three governance requirements which have been met are:
• The Company Constitution;
• Corporate Law; and
• The Franchise Agreement.
The Board, having considered the strong 2017 result, determined that a dividend of five cents per share will maintain a balance between its three objectives and responsibilities in 2017:
• Maintaining financial stability by increasing long term Retained Earnings within the company by $419,627;
• Maintaining a significant contribution to the community by way of sponsorship spending of $247,513 ($100,000 - CDF); and
• Paying a shareholder return of $202,595 or 5 cents per share.
Treasurer’s report
I am pleased to present to you the audited financial report for the financial year ending 30 June 2017.
Business performance summary
Conditions in the wider economy continued to be flat during 2017. Record low interest rates persisted and fueled strong demand in the housing market. However, a new competitive product mix saw our banking book (footings) grow 11% over 2016. This volume growth combined with improved margins contributed to our revenue growing 9% over 2016. On the operational side of the business, the productivity focused organisational restructure that commenced in 2016 now has our cost to revenue ratio tracking in the right direction. In inflation adjusted terms operating expenditure remained at the 2016 level. Profitability as a result of these changes is improving at four of our five branches and the fifth branch is now tracking toward profitability. The tables below provide a snapshot of key data drawn from the financial report and indicators of the growing strength of our business.
KEY DATA
PERFORMANCE INDICATORS
17%
38%
1%
90%
9%
11%• 2017 $586.9m• 2016 $530.9m
FOOTINGS
• 2017 $1.746m• 2016 $1.268m
CASH &INVESTMENTS
• 2017 $2.923m• 2016 $2.504m
NET ASSET
•2017 $541.20k•2016 $285.54k
PROFIT AFTER TAX
•2017 $4.530m•2016 $4.159mREVENUE
•2017 $3.521m•2016 $3.491mEXPENSES
•2017 $247.50k•2016 $262.60k
COMMUNITY SPONSORSHIPS &
CDF
-
0.20
0.40
0.60
0.80
1.00
COST TO INCOME RATIO RETURN ON EQUITY2017 78% 34.53%2016 84% 26.65%2015 87% 21.70%
2017 2016 2015
02468
101214
2017
2016
2015
EARNINGSPER SHARE
(CENTS)13.36 7.05 5.69
SHAREHOLDER & COMMUNITY PARTICIPATION
2017 2016 2015DIVIDENDPAYOUTRATIO
0.20 0.18 0.24
DIVIDENDPER SHARE $0.05 $0.03 $0.03
$0.00$0.01$0.02$0.03$0.04$0.05$0.06
0.000.050.100.150.200.250.30
- 50.00
100.00 150.00 200.00 250.00 300.00
2017 2016 2015SPONSORSHIPS &
CEF247. 262. 174.
REVE
NUEG
ROW
TH &
COS
T M
ANAG
EMEN
TM
EASU
RE
RETURN ONINVESTM
ENT MEASURE
Phillip BurttTreasurer
Treasurer’s ReportFor year ending June 30, 2017

5 - Annual Report Valley Community Financial Services Limited
Chairman’s ReportFor year ending June 30, 2017
I’m very pleased to be able to report a strong result for the 2016/17 financial year.
In the six years to 2016 we have had to work very hard to grow our business in a period of great change and the aftermath of the global financial crisis.The company expanded rapidly opening three branches in the space of 18 months back in 2010. We had just committed to those openings when revenue margins were severely impacted as an outcome of the global financial crisis. The solution has always been to continue to grow our banking book to maintain profitability of our existing businesses and bring the new ones into profit.In 2016, I was able to report to you a profit in four of our five branches. In 2017, we have a profit still in four of our five branches but each of those four are better than the year before and the losses incurred at Doreen is substantially less than in previous years.The balance sheet in 2017 Annual Report is very strong. The company has achieved a profit of more than $1 million before income tax and community dividends. There is $1.9 million cash at bank providing excellent asset backing for our shareholders. We have retained earnings of over $400,000. We have also accumulated funds for future community benefit of $320,000 in the Community Enterprise FoundationTM. This provides us a tax-deductible vehicle to invest money until a suitable project comes along.In the 2016/17 financial year, the company provided nearly $250,000 to community projects and sponsorships. All of these contributions are used to develop partnerships and relationships with the community and provide an opportunity for us to promote our business and continue to grow.Our total banking book across the five branches grew by 10% during 2016/17 financial year.As I have spoken of in previous years, change to our revenue model is once again on the horizon. After a series of negotiations with the Bendigo and Adelaide Bank, the Board have now entered into a new franchise agreement for all five branches. We retain a very positive, strong and robust relationship with our franchisor the Bendigo and Adelaide Bank.The new agreement brings with it a total change to the revenue model which is forecast to impact in a downward way on our revenue of between $200,000 and $300,000 in the 2017/18 financial year. Once again, we continue to strive for record growth to maintain our revenue.On 1 July 2016, the company moved from the National Stock Exchange (NSX) to what is known as the Low Volume Market (LVM). The strategy is to develop a marketing campaign to promote the availability of shares for sale and identify potential purchasers. The LVM gives us a chance to introduce buyers and sellers who can then negotiate between themselves on the sale and purchase of shares in VCFSL. I’m pleased to report that 48,000 shares changed hands in the first year on the new platform. In the year ending 30 June 2016, no shares traded at all on the NSX. There are still shares available for those that are interested. You can list your shares for sale or provide an expression of interest to purchase by going online to our Hurstbridge & District Community Bank®
Branch website and follow the link. You can also contact our Company Secretary, Melissa Vickrage on 9438 3194 for more information or assistance.From 1 July 2016, we implemented our Business Transformation program. This change in the way we do business is designed to provide a more relevant service to our customers today and prepare us for change in banking services in the future. We now have two Business Development Managers and a Mobile Relationship
Manager. These three people have been provided a car and a laptop computer powered to connect to the Bendigo Bank systems. This enables them to go to the customer when and where the customer wants them. We are providing old-fashioned friendly service in a way that the modern customer wants that service. The following pages will introduce you to these people and I ask you not to hesitate to contact them if you need banking services or can refer a client to them.We have also appointed an Operations & Compliance Manager, Tina Elmer. Tina is responsible for the overall operations of our business bringing together five branches as one team instead of having five separate entities. Our group now works together as one sharing expertise, experience, staff and the workload to bring about more effective use of all of our resources. Tina is also responsible for branch compliance and sales training for our full suite of products.Our branch staff have undertaken and will continue to adapt to change attending regular training and up skilling to be able to best serve our business and communities. We have branch leaders who can provide regular lending services in store and attend to the daily operational matters of running a branch.In February this year, directors and our leadership group attended a Strategy Planning Weekend. Daryl Brooke one of our directors and well-recognised business mentor and Strategy Planning expert, facilitated the event. The group assembled Friday night ready to start early on the Saturday morning and wrapped it up by the end of the day. From that, a new strategy plan has been written and adopted by your Board. Once again, the plan is designed to ensure the company stays abreast of change and remains relevant to customer needs and community outcomes.The 2016/17 financial year has seen the continued evolution of the way we use our funds to provide for great community outcomes. In the early days, we undertook to fund total projects. As time went on we learned to use our funds as seed capital enabling community groups to seek funding from other sources. We experienced small sums granted towards much larger value projects. There have been $20,000 contributions turn into $130,000 projects. Last year $25,000 brought about new training nets for the Panton Hill Cricket Club, a project that cost over $120,000. Without our seed capital that project would have been a long time waiting before it happened.Bendigo and Adelaide Bank has developed a new platform to encourage local participation and stretch our funds further. It is a community funding model conducted online inviting community group members to donate to a project. Late last year we participated in our first Community Funding Program. Our first project was with the Kinglake West CFA. VCFSL committed to provide $5,000 towards a $12,000 project. The company’s commitment was conditional on the Kinglake West CFA raising $7,000 via the community funding platform. The project was to provide a slip on for first response vehicles in hard to get at areas.These funding programs are designed to be short and sharp. We set a four-week limit on the fundraising. VCFSL staff set up the platform, provide social media support and promote across our total network. The Kinglake West CFA managed to raise over $9,000 from the platform and VCFSL still provided the $5,000. This enabled the group to complete the project with a little in reserve. Since then we’ve completed other successful campaigns in the Diamond Creek Football Club lighting upgrade and have three more in the pipeline.Another terrific outcome for our local communities was the Diamond Creek Men’s Shed extension.

6 - Annual Report Valley Community Financial Services Limited
We partnered with the Diamond Creek Rotary to provide that vital seed capital to the group enabling them to go to local and state government to make the project happen. VCFSL contributed $10,000 and the Diamond Creek Rotary $25,000. We have been given considerable promotion with the men’s shed group and their families and several opportunities to address the group and attend their first day in the new shed. This gave us an opportunity to address not just the Diamond Creek Men’s Shed but also members of Eltham Men’s Shed and various visitors invited on the day. There will be another speaking opportunity to tell our story at the official opening later this year.
Once again, this year I want to acknowledge a terrific team of staff at VCFSL. Our staff have embraced massive change and been prepared to step up to new ways. They all attended a special staff dinner held at Bridges in Hurstbridge where we explained the changes and the reasons for them. Samuel Johnson from Love Your Sister (LYS banks with one of our branches) was engaged to speak to the group. Sam was funny and inspiring.We also have a team of three administration staff including two part-time and our full-time company secretary. They are just as motivated and dedicated to the growth and well-being of VCFSL as anyone. They regularly refer new business to our team. They are excellent ambassadors for our business. These three people arranged and attended the staff meeting.It was a whole company event including directors.
The results this year have been exemplary. Apart from the excellent growth in our banking book, staff grew other areas of the business in wealth, superannuation, and insurance products. Two of our branches were recognised for their efforts receiving awards at the annual regional awards night. Darren Gray our Business Development & Engagement Manager covering the northern side of our patch, received staff member of the 2016/17 financial year.We are lucky to have a highly motivated and dedicated staff. It’s a big thank you from me for all the effort.We also have a wonderful group of Directors. I’ve said before but still maintain that I’ve never met so many dedicated, intelligent and competent people in one place. The commitment required from a Director is substantial. There are community group meetings and functions to attend to. Each director sits on several committees which regularly meet outside of board meetings. We hold 11 Board meetings a year and one annual general meeting which is a big commitment alone.VCFSL Directors provide excellent leadership in managing our business, developing strategy plan, monitoring our plan and challenging the way we do things. They are all respectful and participate providing great value to the company. We regularly have firm, frank, and robust discussions but all respect the diversity of views around the table.
Barry HenwoodChairman

7 - Annual Report Valley Community Financial Services Limited
Director’s Report
DirectorsThe following persons were Directors of Valley Community Financial Services Limited during or since the end of the financial year up to the date of this report:
Barry HenwoodPosition: ChairProfessional qualifications: DipHort Sci, Grad Dip Acc.Experience and expertise: Newsagent and Licensed Post Office Operator. Barry has been in small business for over 30 years. He brings to the Board a demonstrated ability to run a business and a commitment to the local area in which he lives.Other current Directorships: NilFormer Directorships in last 3 years: NilSpecial responsibilities: Member of all Committees with the exception of the Audit Committee.
Malcolm Hackett OAMPosition: Deputy ChairProfessional qualifications: BA Dip. EdExperience and expertise: Malcolm worked in the Victorian Education Department as a teacher, education consultant and school administrator for 34 years. He retired in 2008 having completed his career as the Principal of Diamond Valley College. Malcolm contributes his analytical and management skills, and has broad knowledge of the rural and urban communities.Other current Directorships: Director and Trustee of the Strathewen Bushfire Relief Company Limited and Strathewen Bushfire Relief Trust.Former Directorships in last 3 years: Chair of Strathewen Community Renewal Association Director of Strathewen Bushfire Relief Trust Fund.Special responsibilities: Chair of Community Strengthening Committee, Chair of Policy & Procedures Committee, Member of the Strategy, Audit, Communications/IT, Executive, Business and Youth & Community Development Committees.
Phillip BurttPosition: TreasurerProfessional qualifications: -Experience and expertise: Phillip is a University Administrator and a QMS consultant. Phillip has worked at La Trobe University, Bundoora for 13 years. His last role at the University was the Deputy Director, Residential Services. In this position, he was responsible for a budget in excess of $18 million, 2,238 beds across 5 locations with 33 staff.Other current Directorships: Blackwood College Ltd.Former Directorships in last 3 years: NilSpecial responsibilities: Chair of Finance Committee, Member of Executive, Audit and Youth & Community Development Committees.
Daryl BrookePosition: DirectorProfessional qualifications: -Experience and expertise: Daryl owns and operates Daryl Brooke & Associates, a business development consultancy providing intensive business coaching services - strategic and marketing planning advice, business and organisational assessment and change management guidance.Other current Directorships: Director, Parcell-Brooke Pty Ltd.Former Directorships in last 3 years: NilSpecial responsibilities: Chair of Strategy Committee, Member of Finance, Marketing, Policy & Procedures, Audit and Youth & Community Development Committees.
Philip MarendazPosition: DirectorProfessional qualifications: FCPA, B.Comm, Grad Dip AccountingExperience and expertise: Philip’s professional career has been in accounting and
commercial management with major Australian public companies. He is a fellow of the Australian CPAs, a registered tax agent and runs his own accounting and business consulting practice based in Diamond Creek.Other current Directorships: Director, Marendaz Accountants & Business ConsultantsFormer Directorships in last 3 years: NilSpecial responsibilities: Member of Finance, Strategy and Youth & Community Development Committees.
Carol JenkinsonPosition: DirectorProfessional qualifications: -Experience and expertise: Carol’s background is travel and marketing and she is heavily involved in numerous community groups including Nillumbik Tourism Association, Hurstbridge Wattle Festival and School Councils for Diamond Valley College and Arthurs Creek Primary School.Other current Directorships: NilFormer Directorships in last 3 years: NilSpecial responsibilities: Chair of Marketing Committee, Member of Events, Policy & Procedures, Community Strengthening, Strategy, Communications IT and Youth & Community Development Committees.
Carole BuryPosition: DirectorProfessional qualifications: -Experience and expertise: Carole has worked as an Executive Assistant managing travel and logistics for multimillion dollar projects in the mining industry.Other current Directorships: NilFormer Directorships in last 3 years: NilSpecial responsibilities: Chair of Human Resources Committee, Chair of Events Committee and Chair of Audit Committee. Member of Executive Committee.
Rob CharlesworthPosition: DirectorProfessional qualifications: -Experience and expertise: Rob is currently the Government & Community Engagement Manager for Scouts Victoria. This involves project managing the implementation of Scouts Victoria’s growth Strategy. Rob has been involved with Scouts Victoria as a Volunteer Leader and employee for over 30 years.Other current Directorships: NilFormer Directorships in last 3 years: NilSpecial responsibilities: Chair of Youth & Community Development Committee, Member of Marketing and Community Strengthening Committees.
Michael McBrien (App 27/7/2016)Position: DirectorProfessional qualifications: -Experience and expertise: Michael has a Bachelor of Management and is the Project Manager for Total Communications Aust Pty Ltd where he manages accounts, projects and staff.Other current Directorships: NilFormer Directorships in last 3 years: NilSpecial responsibilities: Member of Human Resources Committee, Business and Audit Committee.
Gill Di Pasquale (App 24/8/2016)Position: DirectorProfessional qualifications: -Experience and expertise: Gill is the owner/director of Gigliola Boutique in Diamond Creek, a business which has been established for over 8 years. Gill’s
The Directors present their report of the company for the financial year ended 30 June 2017.

8 - Annual Report Valley Community Financial Services Limited
experience in retail management, business development, event planning and marketing will be beneficial to the Board. She is also an active member of the Diamond Creek Traders Association.Other current Directorships: NilFormer Directorships in last 3 years: NilSpecial responsibilities: Member of Marketing, Events, Communications IT and Business Committees
Greg Paull (App 28/9/2016)Position: DirectorProfessional qualifications: -Experience and expertise: Greg is a registered builder and a Director of Transform Homes, a local construction company. He is an active member of the Rotary Club of Diamond Creek where he was President from 2015 to 2016. Greg holds a Bachelor of Business (Accounting) and is also a CPA. Greg lives in Yarrambat and has previously lived and worked overseas in a number of roles.Other current Directorships: Director of Transform Homes Pty Ltd.Former Directorships in last 3 years: NilSpecial responsibilities: Member Finance and Business Committees.
No Directors have material interests in contracts or proposed contracts with the company.
Directors’ Meetings
Attendances by each Director during the year were as follows:
Board Meetings Audit Meetings
Director A B A B
Barry Henwood 12 11 N/A N/A
Malcolm Hackett, OAM 12 11 3 3
Phillip Burtt 12 11 3 2
Daryl Brooke 12 10 3 2
Philip Marendaz 12 7 N/A N/A
Carol Jenkinson 12 11 3 1
Carole Bury 12 11 3 2
Rob Charlesworth 12 11 N/A N/A
Michael McBrien (App 27/7/2016) 11 10 3 3
Gill Di Pasquale (App 24/8/2016) 10 8 N/A N/A
Greg Paull (App 28/9/2016) 8 8 N/A N/A
A - The number of meetings eligible to attend.B - The number of meetings attended.N/A - not a member of that committee.
Company SecretaryMelissa Vickrage has been the Company Secretary of Valley Community Financial Services Limited since 2013. Melissa’s qualifications and experience include having a strong legal background working for many years as Legal Assistant/Paralegal with a major Melbourne law firm. Melissa does not hold a Director position in the company and has been employed by the company since April 2010.
Principal activitiesThe principal activities of the company during the course of the financial year were in providing Community Bank® branch services under management rights to operate a franchised branch of Bendigo and Adelaide Bank Limited.There have been no significant changes in the nature of these activities during the year.
Review of operationsThe profit of the company for the financial year after provision for income tax was $541,184 (2016 profit: $285,540), which is a 90% increase as compared with the previous year, a direct result of strong revenue growth; an increase of $371k (8.9%) on last year. The senior management structure of the business was reorganised in July 2016 to enable greater focus on sales and better utilisation of operations staff. Three senior bankers were appointed to mobile banking roles with a clear business development focus. Tina Elmer was appointed as operations and compliance manager to manage staffing and banking compliance across all 5 branches.
DividendsDividends paid or declared since the start of the financial year.A fully franked final dividend of 3 cents per share was declared and paid for the year ended 30 June 2016 during the year for the 2017 financial year . No dividend has been declared or paid for the year ended 30 June 2017 as yet.
OptionsNo options over issued shares were granted during or since the end of the financial year and there were no options outstanding as at the date of this report.
Significant changes in the state of affairsNo significant changes in the company’s state of affairs occurred during the financial year.
Events subsequent to the end of the reporting periodNo matters or circumstances have arisen since the end of the financial year that significantly affect or may significantly affect the operations of the company, the results of those operations or the state of affairs of the company, in future financial years.
Likely developmentsThe company will continue its policy of providing banking services to the community.
Environmental regulationsThe company is not subject to any significant environmental regulation.
Indemnifying Officers or AuditorThe company has agreed to indemnify each Officer (Director, Secretary or employee) out of assets of the company to the relevant extent against any liability incurred by that person arising out of the discharge of their duties, except where the liability arises out of conduct involving dishonesty, negligence, breach of duty or the lack of good faith. The company also has Officers Insurance for the benefit of Officers of the company against any liability occurred by the Officer, which includes the Officer’s liability for legal costs, in or arising out of the conduct of the business of the company or in or arising out of the discharge of the Officer’s duties.Disclosure of the nature of the liability and the amount of the premium is prohibited by the confidentiality clause of the contract of insurance. The company has not provided any insurance for an Auditor of the company.
Proceedings on behalf of companyNo person has applied for leave of court to bring proceedings on behalf of the company or intervene in any proceedings to which the company is a party for the purpose of taking responsibility on behalf of the company for all or any part of those proceedings. The company was not a party to any such proceedings during the year.
Director’s Report (continued)

9 - Annual Report Valley Community Financial Services Limited
Auditor independence declarationA copy of the Auditor’s independence declaration as required under section 307C of the Corporations Act 2001 is set at page 8 of this financial report. No Officer of the company is or has been a partner of the Auditor of the company.
Non-audit servicesThe Board of Directors, in accordance with advice from the Audit Committee, are satisfied that the provision of non audit services during the year is compatible with the general standard of independence for Auditors imposed by the Corporations Act 2001. The Directors are satisfied that the services disclosed in Note 5 did not compromise the external Auditor’s independence for the following reasons:
• all non audit services are reviewed and approved by the Audit Committee prior to commencement to ensure they do not adversely affect the integrity and objectivity of the Auditor; and
• none of the services undermine the general principles relating to Auditor independence as set out in APES 110 Code of Ethics for Professional Accountants .
Signed in accordance with a resolution of the Board of Directors at Diamond Creek on 27 September 2017.
Barry HenwoodDirector
Director’s Report (continued)
Auditor’s Independence Declaration
10 - Annual Report Valley Community Financial Services Limited
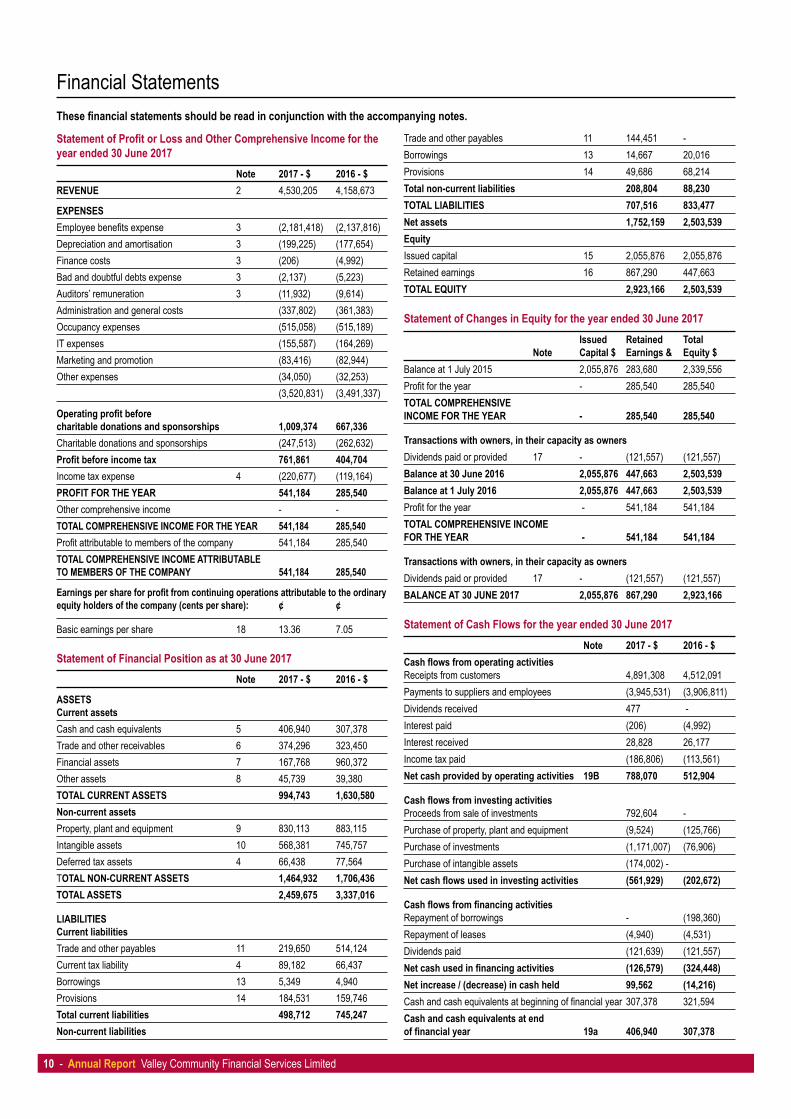
Financial Statements
Statement of Profit or Loss and Other Comprehensive Income for the year ended 30 June 2017 Note 2017 - $ 2016 - $REVENUE 2 4,530,205 4,158,673
EXPENSESEmployee benefits expense 3 (2,181,418) (2,137,816)Depreciation and amortisation 3 (199,225) (177,654)Finance costs 3 (206) (4,992)Bad and doubtful debts expense 3 (2,137) (5,223)Auditors’ remuneration 3 (11,932) (9,614)Administration and general costs (337,802) (361,383)Occupancy expenses (515,058) (515,189)IT expenses (155,587) (164,269)Marketing and promotion (83,416) (82,944)Other expenses (34,050) (32,253) (3,520,831) (3,491,337)
Operating profit before charitable donations and sponsorships 1,009,374 667,336Charitable donations and sponsorships (247,513) (262,632)Profit before income tax 761,861 404,704Income tax expense 4 (220,677) (119,164)PROFIT FOR THE YEAR 541,184 285,540Other comprehensive income - -TOTAL COMPREHENSIVE INCOME FOR THE YEAR 541,184 285,540Profit attributable to members of the company 541,184 285,540TOTAL COMPREHENSIVE INCOME ATTRIBUTABLE TO MEMBERS OF THE COMPANY 541,184 285,540
Earnings per share for profit from continuing operations attributable to the ordinary equity holders of the company (cents per share): ¢ ¢
Basic earnings per share 18 13.36 7.05
Statement of Financial Position as at 30 June 2017 Note 2017 - $ 2016 - $
ASSETSCurrent assetsCash and cash equivalents 5 406,940 307,378Trade and other receivables 6 374,296 323,450Financial assets 7 167,768 960,372Other assets 8 45,739 39,380TOTAL CURRENT ASSETS 994,743 1,630,580Non-current assetsProperty, plant and equipment 9 830,113 883,115Intangible assets 10 568,381 745,757Deferred tax assets 4 66,438 77,564TOTAL NON-CURRENT ASSETS 1,464,932 1,706,436TOTAL ASSETS 2,459,675 3,337,016
LIABILITIESCurrent liabilitiesTrade and other payables 11 219,650 514,124Current tax liability 4 89,182 66,437Borrowings 13 5,349 4,940Provisions 14 184,531 159,746Total current liabilities 498,712 745,247Non-current liabilities
Trade and other payables 11 144,451 -Borrowings 13 14,667 20,016Provisions 14 49,686 68,214Total non-current liabilities 208,804 88,230TOTAL LIABILITIES 707,516 833,477Net assets 1,752,159 2,503,539EquityIssued capital 15 2,055,876 2,055,876Retained earnings 16 867,290 447,663TOTAL EQUITY 2,923,166 2,503,539
Statement of Changes in Equity for the year ended 30 June 2017 Issued Retained Total Note Capital $ Earnings & Equity $Balance at 1 July 2015 2,055,876 283,680 2,339,556Profit for the year - 285,540 285,540TOTAL COMPREHENSIVE INCOME FOR THE YEAR - 285,540 285,540
Transactions with owners, in their capacity as ownersDividends paid or provided 17 - (121,557) (121,557)Balance at 30 June 2016 2,055,876 447,663 2,503,539Balance at 1 July 2016 2,055,876 447,663 2,503,539Profit for the year - 541,184 541,184TOTAL COMPREHENSIVE INCOME FOR THE YEAR - 541,184 541,184
Transactions with owners, in their capacity as ownersDividends paid or provided 17 - (121,557) (121,557)BALANCE AT 30 JUNE 2017 2,055,876 867,290 2,923,166
Statement of Cash Flows for the year ended 30 June 2017 Note 2017 - $ 2016 - $Cash flows from operating activitiesReceipts from customers 4,891,308 4,512,091Payments to suppliers and employees (3,945,531) (3,906,811)Dividends received 477 -Interest paid (206) (4,992)Interest received 28,828 26,177Income tax paid (186,806) (113,561)Net cash provided by operating activities 19B 788,070 512,904
Cash flows from investing activitiesProceeds from sale of investments 792,604 -Purchase of property, plant and equipment (9,524) (125,766)Purchase of investments (1,171,007) (76,906)Purchase of intangible assets (174,002) -Net cash flows used in investing activities (561,929) (202,672)
Cash flows from financing activitiesRepayment of borrowings - (198,360)Repayment of leases (4,940) (4,531)Dividends paid (121,639) (121,557)Net cash used in financing activities (126,579) (324,448)Net increase / (decrease) in cash held 99,562 (14,216)Cash and cash equivalents at beginning of financial year 307,378 321,594Cash and cash equivalents at end of financial year 19a 406,940 307,378
These financial statements should be read in conjunction with the accompanying notes.

11 - Annual Report Valley Community Financial Services Limited
Valley Community Financial Services Limited (‘the company’) is a company limited by shares, incorporated and domiciled in Australia.The financial statements were authorised for issue by the Directors on 30 August 2017.
1. Summary of significant accounting policies
(a) Basis of preparationThese general purpose financial statements have been prepared in accordance with the Corporations Act 2001, Australian Accounting Standards and Interpretations of the Australian Accounting Standards Board and International Financial Reporting Standards as issued by the International Accounting Standards Board. The company is a for profit entity for financial reporting purposes under Australian Accounting Standards. Material accounting policies adopted in the preparation of these financial statements are presented below and have been consistently applied unless stated otherwise.The financial statements, except for cash flow information, have been prepared on an accruals basis and are based on historical costs, modified, were applicable, by the measurement at fair value of selected non current assets, financial assets and financial liabilities.
Economic dependency
The company has entered into a franchise agreement with Bendigo and Adelaide Bank Limited that governs the management of the Community Bank® branches at Hurstbridge, Diamond Creek, Eltham, Doreen/Mernda and Kinglake.The branches operate as a franchise of Bendigo and Adelaide Bank Limited, using the name “Bendigo Bank”, the logo, and systems of operation of Bendigo and Adelaide Bank Limited. The company manages the Community Bank® branches on behalf of Bendigo and Adelaide Bank Limited, however all transactions with customers conducted through the Community Bank® branches are effectively conducted between the customers and Bendigo and Adelaide Bank Limited.All deposits are made with Bendigo and Adelaide Bank Limited, and all personal and investment products are products of Bendigo and Adelaide Bank Limited, with the company facilitating the provision of those products. All loans, leases or hire purchase transactions, issues of new credit or debit cards, temporary or bridging finance and any other transaction that involves creating a new debt, or increasing or changing the terms of an existing debt owed to Bendigo and Adelaide Bank Limited, must be approved by Bendigo and Adelaide Bank Limited. All credit transactions are made with Bendigo and Adelaide Bank Limited, and all credit products are products of Bendigo and Adelaide Bank Limited.Bendigo and Adelaide Bank Limited provides significant assistance in establishing and maintaining the Community Bank® branches franchise operations. It also continues to provide ongoing management and operational support, and other assistance and guidance in relation to all aspects of the franchise operation, including advice in relation to:
• Advice and assistance in relation to the design, layout and fit out of the Community Bank® branches;
• Training for the Branch Managers and other employees in banking, management systems and interface protocol;
• Methods and procedures for the sale of products and provision of services;• Security and cash logistic controls;• Calculation of company revenue and payment of many operating and
administrative expenses;• The formulation and implementation of advertising and promotional
programs; and• Sale techniques and proper customer relations.
(b) Impairment of assetsAt the end of each reporting period, the company assesses whether there is any indication that an asset may be impaired.The assessment will include the consideration of external and internal sources of information. If such an indication exists, an impairment test is carried out on the asset by comparing the recoverable amount of the asset, being the higher of the asset’s fair value less cost to sell and value in use, to the asset’s carrying amount. Any excess of the asset’s carrying amount over its recoverable amount is recognised immediately in profit or loss, unless the asset is carried at a revalued amount in accordance with another Standard. Any impairment loss of a revalued asset is treated as a revaluation decrease in accordance with that other Standard.
(c) Goods and services tax (GST)Revenues, expenses and assets are recognised net of the amount of GST, except where the amount of GST incurred is not recoverable from the Australian Taxation Office (ATO).Receivables and payables are stated inclusive of the amount of GST receivable or payable. The net amount of GST recoverable from, or payable to, the ATO is included with other receivables or payables in the statement of financial position.Cash flows are presented on a gross basis. The GST components of cash flows arising from investing or financing activities which are recoverable from, or payable to, the ATO are presented as operating cash flows included in receipts from customers or payments to suppliers.
(d) New and amended accounting policies adopted by the companyThere are no new and amended accounting policies that have been adopted by the company this financial year.
(e) Comparative figuresWhen required by Accounting Standards comparative figures have been adjusted to conform to changes in presentation for the current financial year.
(f) Critical accounting estimates and judgementsThe Directors evaluate estimates and judgements incorporated into the financial statements based on historical knowledge and best available current information. Estimates assume a reasonable expectation of future events and are based on current trends and economic data, obtained both externally and within the company. Estimates and judgements are reviewed on an ongoing basis. Revision to accounting estimates are recognised in the period in which the estimates are revised and in any future periods affected. The estimates and judgements that have a significant risk of causing material adjustments to the carrying values of assets and liabilities are as follows:
Estimation of useful lives of assets
The company determines the estimated useful lives and related depreciation and amortisation charges for its property, plant and equipment and intangible assets. The depreciation and amortisation charge will increase where useful lives are less than previously estimated lives.
Fair value assessment of non-current physical assets
The AASB 13 Fair Value standard requires fair value assessments that may involved both complex and significant judgement and experts. The value of land and buildings may be materially misstated and potential classification and disclosure risks may occur.
Employee benefits provision
Assumptions are required for wage growth and CPI movements. The likelihood of employees reaching unconditional service is estimated. The timing of when employee benefit obligations are to be settled is also estimated.
Income tax
The company is subject to income tax. Significant judgement is required in determining the deferred tax asset.Deferred tax assets are recognised only when it is considered sufficient future profits will be generated. The assumptions made regarding future profits is based on the company’s assessment of future cash flows.
Impairment
The company assesses impairment at the end of each reporting period by evaluating conditions and events specific to the company that may be indicative of impairment triggers. Recoverable amounts of relevant assets are reassessed using value in use calculations which incorporate various key assumptions.
(g) New accounting standards for application in future periodsThe AASB has issued a number of new and amended Accounting Standards and Interpretations that have mandatory application dates for future reporting periods, some of which are relevant to the company.The company has decided not to early adopt any of the new and amended pronouncements. The company’s assessment of the new and amended pronouncements that are relevant to the company but applicable in the future reporting periods is set below:
Notes to the Financial Statements for the year ended 30 June 2017These financial statements and notes represent those of Valley Community Financial Services Limited.

12 - Annual Report Valley Community Financial Services Limited
(i) AASB 9 Financial Instruments and associated Amending Standards (applicable for annual reporting periods beginning on or after 1 January 2018)AASB 9 introduces new requirements for the classification and measurement of financial assets and liabilities and includes a forward-looking ‘expected loss’ impairment model and a substantially-changed approach to hedge accounting.These requirements improve and simplify the approach for classification and measurement of financial assets compared with the requirements of AASB 139. The main changes are:
a) Financial assets that are debt instruments will be classified based on:(i) the objective of the company’s business model for managing the
financial assets; and(ii) the characteristics of the contractual cash flows.
b) Allows an irrevocable election on initial recognition to present gains and losses on investments in equity instruments that are not held for trading in other comprehensive income (instead of in profit or loss). Dividends in respect of these investments that are a return on investment can be recognised in profit or loss and there is no impairment or recycling on disposal of the instrument.
c) Introduces a ‘fair value through other comprehensive income’ measurement category for particular simple debt instruments.
d) Financial assets can be designated and measured at fair value through profit or loss at initial recognition if doing so eliminates or significantly reduces a measurement or recognition inconsistency that would arise from measuring assets or liabilities, or recognising the gains and losses on them, on different bases.
e) Where the fair value option is used for financial liabilities the change in fair value is to be accounted for asfollows:
• the change attributable to changes in credit risk are presented in Other Comprehensive Income (OCI)
• the remaining change is presented in profit or loss If this approach creates or enlarges an accounting mismatch in the profit or loss, the effect of the changes in credit risk are also presented in profit or loss.
Otherwise, the following requirements have generally been carried forward unchanged from AASB 139 into AASB 9:
• classification and measurement of financial liabilities; and• derecognition requirements for financial assets and liabilities
AASB 9 requirements regarding hedge accounting represent a substantial overhaul of hedge accounting that enable entities to better reflect their risk management activities in the financial statements.Furthermore, AASB 9 introduces a new impairment model based on expected credit losses. This model makes use of more forward-looking information and applies to all financial instruments that are subject to impairment accounting.When this standard is first adopted for the year ending 30 June 2019, there will be no material impact on the transactions and balances recognised in the financial statements.(ii) AASB 15: Revenue from Contracts with Customers (applicable for annual reporting periods commencing on or after 1 January 2018)When effective, this Standard will replace the current accounting requirements applicable to revenue with a single,principles-based model. Except for a limited number of exceptions, including leases, the new revenue model in AASB 15 will apply to all contracts with customers as well as non-monetary exchanges between entities in the same line of business to facilitate sales to customers and potential customers.The core principle of the Standard is that an entity will recognise revenue to depict the transfer of promised goods or services to customers in an amount that reflects the consideration to which the company expects to be entitled in exchange for the goods or services. To achieve this objective, AASB 15 provides the following five-step process:
• identify the contract(s) with customers;• identify the performance obligations in the contract(s);• determine the transaction price;• allocate the transaction price to the performance obligations in the
contract(s); and• recognise revenue when (or as) the performance obligations are satisfied.
This Standard will require retrospective restatement, as well as enhanced disclosure regarding revenue.When this Standard is first adopted for the year ending 30 June 2019, it is not expected that there will be a material impact on the transactions and balances recognised in the financial statements.(iii) AASB 16: Leases (applicable for annual reporting periods commencing on or after 1 January 2019).
AASB 16:
• replaces AASB 117 Leases and some lease-related Interpretations;• requires all leases to be accounted for ‘on-balance sheet’ by lessees,
other than short-term and low value asset leases;• provides new guidance on the application of the definition of lease and
on sale and lease back accounting;• largely retains the existing lessor accounting requirements in AASB 117;
and• requires new and different disclosures about leases.
The compny is yet to undertake a detailed assessment of the impact of AASB 16. However, based on the company’s preliminary assessment, the Standard is not expected to have a material impact on the transactions and balances recognised in the financial statements when it is first adopted for the year ending 30 June 2020.
2. RevenueRevenue arises from the rendering of services through the company’s franchise agreement with the Bendigo and Adelaide Bank Limited. The revenue recognised is measured by reference to the fair value of consideration received or receivable, excluding sales taxes, rebates, and trade discounts.The company applies the revenue recognition criteria set out below to each separately identifiable sales transaction in order to reflect the substance of the transaction.
Rendering of services
The company generates service commissions on a range of products issued by the Bendigo and Adelaide Bank Limited. The revenue includes upfront and trailing commissions, sales fees and margin fees.
Interest, distribution and other income
Interest income is recognised on an accrual basis using the effective interest rate method.Distribution and other revenue is recognised when the right to the income has been established.All revenue is stated net of the amount of goods and services tax (GST).
2017 - $ 2016 - $
REVENUEService commissions 4,494,810 4,132,496 4,494,810 4,132,496
OTHER REVENUEInterest received 28,828 26,177Distributions from investments 6,567 - 35,395 26,177TOTAL REVENUE 4,530,205 4,158,673
3. ExpensesOperating expenses
Operating expenses are recognised in profit or loss on an accurals basis, which is typically upon utilisation of the service or at the date upon which the company becomes liable.
Borrowing costs
Borrowing costs directly attributable to the acquisition, construction or production of a qualifying asset are capitalised during the period of time that is necessary to complete and prepare the asset for its intended use or sale.
Notes to the Financial Statements for the year ended 30 June 2017 (continued)

13 - Annual Report Valley Community Financial Services Limited
Other borrowing costs are expensed in the period in which they are incurred and reported in finance costs.
Depreciation
The depreciable amount of all fixed assets, is depreciated over the asset’s useful life to the company commencing from the time the asset is held ready for use. Leasehold improvements are depreciated over the shorter of either the unexpired period of the lease or the estimated useful lives of the improvements.The depreciation rates used for each class of depreciable asset are:
Class of asset Rate Method
Leasehold improvements 4-5% SL & DVPlant and equipment 25-75% SL & DVMotor vehicles 25% DV
SL = Straight lineDV = Diminishing value
Gains/losses upon disposal of non-current assets
Gains and losses on disposals are determined by comparing proceeds with the carrying amount. These gains and losses are recognised in profit or loss in the period in which they arise. When revalued assets are sold, amounts included in the revaluation surplus relating to that asset are transferred to retained earnings.
2017 - $ 2016 - $
Profit before income tax includes the following specific expenses:
Employee benefits expenseWages and salaries 1,795,768 1,721,585Superannuation costs 163,599 161,612Other costs 222,051 254,619
2,181,418 2,137,816
Depreciation and amortisationDepreciationLeasehold improvements 23,771 22,419Plant and equipment 23,865 27,649Motor vehicles 14,890 7,041
62,526 57,109
AmortisationFranchise fees 61,710 45,545Community Bank® Stadium naming rights 74,988 75,000 136,698 120,545
TOTAL DEPRECIATION AND AMORTISATION 199,224 177,654
Finance costsInterest paid 206 4,992
Bad and doubtful debts expenses 2,137 5,223
Auditors’ remunerationRemuneration of the Auditor, Richmond, Sinnott & Delahunty, for:Audit or review of the financial report 5,818 4,600Share registry services 6,114 5,014 11,932 9,614
4. Income tax
The income tax expense for the year comprises current income tax expense and deferred tax expense.Current income tax expense charged to profit or loss is the tax payable on taxable income. Current tax liabilities are measured at the amounts expected to be paid to the relevant taxation authority.Deferred income tax expense reflects movements in deferred tax asset and deferred tax liability balances during the year as well as unused tax losses.Deferred tax assets relating to temporary differences and unused tax losses are recognised only to the extent that it is probable that future taxable profit will be available against which the benefits of the deferred tax asset can be utilised.Deferred income tax assets and liabilities are calculated at the tax rates that are expected to apply to the period when the asset is realised or the liability is settled, and their measurement also reflects the manner in which management expects to recover or settle the carrying amount of the related asset or liability.
2017 - $ 2016 - $
a. The components of tax expense comprise:Current tax expense 209,551 149,617Deferred tax expense 11,126 (29,162)Over provision of prior years - (1,291)
220,677 119,164
b. Prima facie tax payableThe prima facie tax on profit from ordinary activities before income tax is reconciled to the income tax expense as follows:Prima facie tax on profit before income tax at 27.5% (2016: 30%) 209,512 121,411
Add tax effect of:Over provision of prior years - (1,291)Non-deductible expenses 11,165 (956)
Income tax attributable to the entity 220,677 119,164
The applicable weighted average effective tax rate is -28.97% -29.44%
c. Current tax liabilityCurrent tax relates to the following:Current tax liabilities
Opening balance 66,437 31,672Income tax paid (188,093) (113,562)Current tax 209,551 149,617Under / (over) provision prior years 1,287 (1,290) 89,182 66,437
d. Deferred tax assetDeferred tax relates to the following:Deferred tax assets balance comprises:
Intangible assets - 8,753Employee provisions 66,438 68,811 66,438 77,564
Net deferred tax asset 66,438 77,564
e. Deferred income tax (revenue)/expense included in income tax expense comprises:
Decrease / (increase) in deferred tax assets 11,126 (29,162) 11,126 (29,162)
Notes to the Financial Statements for the year ended 30 June 2017 (continued)

14 - Annual Report Valley Community Financial Services Limited
5. Cash and cash equivalents
Cash and cash equivalents include cash on hand, deposits available on demand with banks, other short-term highly liquid investments with original maturities of three months or less, and bank overdrafts. Bank overdrafts are reported within short-term borrowings in current liabilities in the statement of financial position.
2017 - $ 2016 - $
Cash at bank and on hand 406,940 307,378
406,940 307,378
The effective interest rate on short-term bank deposits was 0.2% (2016: 0.2%).
6. Trade and other receivables
Trade and other receivables are recognised initially at fair value and subsequently measured at amortised cost, less any provision for doubtful debts. Trade and other receivables are due for settlement usually no more than 30 days from the date of recognition.
Collectability of trade and other receivables is reviewed on an ongoing basis. Debts, which are known to be uncollectable, are written off. A provision for doubtful debts is established when there is objective evidence that the company will not be able to collect all amounts due according to the original terms of receivables. The amount of the provision is the difference between the assets carrying amount and the present value of estimated cash flows, discounted at the effective interest rate. The amount of the provision is recognised on profit or loss.
2017 - $ 2016 - $
Current
Trade receivables 374,296 323,450
374,296 323,450
Credit risk
The main source of credit risk relates to a concentration of trade receivables owing by Bendigo and Adelaide Bank Limited, which is the source of the majority of the company’s income.
The following table details the company’s trade and other receivables exposed to credit risk (prior to collateral and other credit enhancements) with ageing analysis and impairment provided for thereon. Amounts are considered as “past due” when the debt has not been settled, within the terms and conditions agreed between the company and the customer or counterparty to the transaction. Receivables that are past due are assessed for impairment by ascertaining solvency of the debtors and are provided for where there are specific circumstances indicating that the debt may not be fully repaid to the company.
The balances of receivables that remain within initial trade terms (as detailed in the table below) are considered to be high credit quality.
7. Financial assetsClassification of financial assets
The company classifies its financial assets in the following categories:• loans and receivables,• held to maturity investments, and• available for sale assets.
The classification depends on the purpose for which the investments were acquired. Management determines the classification of its investments at initial recognition and, in the case of assets classified as held-to-maturity, reevaluates this designation at the end of each reporting period.
Loans and receivables
This category is the most relevant to the company. Loans and receivables are non-derivative financial assets with fixed or determinable payments that are not quoted in an active market. They are included in current assets, except for those with maturities greater than 12 months after the period end, which are classified as noncurrent assets. Loans and receivables are included in trade and other receivables in the statement of financial position.
Held to maturity investments
The company classifies investments as held-to-maturity if:• they are non-derivative financial assets• they are quoted in an active market• they have fixed or determinable payments and fixed maturities• the company intends to, and is able to, hold them to maturity.
Held-to-maturity financial assets are included in non-current assets, except for those with maturities less than 12 months from the end of the reporting period, which would be classified as current assets.
Available for sale financial asset
Investments are designated as available-for-sale financial assets if they do not have fixed maturities and fixed or determinable payments, and management intends to hold them for the medium to long-term. Financial assets that are not classified into any of the other categories (at FVPL, loans and receivables or held-to-maturity investments) are also included in the available-for-sale category.The financial assets are presented as non-current assets unless they mature, or management intends to dispose of them within 12 months of the end of the reporting period.
Measurement of financial assets
At initial recognition, the company measures a financial asset at its fair value plus, in the case of a financial asset not at fair value through profit or loss, transaction costs that are directly attributable to the acquisition of the financial asset.Loans and receivables and held-to-maturity investments are subsequently carried at amortised cost using the effective interest method.Available-for-sale financial assets are subsequently carried at fair value. Gains or losses arising from changes in the fair value are recognised as follows:
• for monetary and non-monetary securities classified as available-for-sale – in other comprehensive income.
Amortised cost is calculated as the amount at which the financial asset or financial liability is measured at initial recognition less principal repayments and any reduction for impairment, and adjusted for any cumulative amortisation of the difference between that initial amount and the maturity amount calculated using the effective interest method.The effective interest method is used to allocate interest income or interest expense over the relevant period and is equivalent to the rate that discount estimated future cash payments or receipts over the expected life (or where this cannot be reliably predicted, the contractual term) of the financial instrument to the net carrying amount of the financial asset or financial liability. Revisions to expected future net cash flows will necessitate an adjustment to the carrying amount with a consequential recognition of an income or expense item in the profit or loss.
Notes to the Financial Statements for the year ended 30 June 2017 (continued)
Gross amount $
Not past due $
Past due but not impaired Past due and
impaired $< 30
days $31-60
days $> 60
days $2017 Trade receivables
374,296 374,296 - - - -
Total 374,296 374,296 - - - -2016 Trade receivables
323,450 323,450 - - - -
Total 323,450 323,450 - - - -

15 - Annual Report Valley Community Financial Services Limited
Impairment of financial assets
The company assesses at the end of each reporting period whether there is objective evidence that a financial asset or group of financial assets is impaired. A financial asset or a group of financial assets is impaired and impairment losses are incurred only if there is objective evidence of impairment as a result of one or more events that occurred after the initial recognition of the asset (a ‘loss event’) and that loss event (or events) has an impact on the estimated future cash flows of the financial asset or group of financial assets that can be reliably estimated. In the case of equity investments classified as available-for-sale, a significant or prolonged decline in the fair value of the security below its cost is considered an indicator that the assets are impaired.
Assets carried at amortised cost For loans and receivables, the amount of the loss is measured as the difference between the asset’s carrying amount and the present value of estimated future cash flows (excluding future credit losses that have not been incurred) discounted at the financial asset’s original effective interest rate. The carrying amount of the asset is reduced and the amount of the loss is recognised in profit or loss. If a loan or held-to-maturity investment has a variable interest rate, the discount rate for measuring any impairment loss is the current effective interest rate determined under the contract. As a practical expedient, the company may measure impairment on the basis of an instrument’s fair value using an observable market price.If, in a subsequent period, the amount of the impairment loss decreases and the decrease can be related objectively to an event occurring after the impairment was recognised (such as an improvement in the debtor’s credit rating), the reversal of the previously recognised impairment loss is recognised in profit or loss.
Assets classified as available for sale If there is objective evidence of impairment for available-for-sale financial assets, the cumulative loss – measured as the difference between the acquisition cost and the current fair value, less any impairment loss on that financial asset previously recognised in profit or loss – is removed from equity and recognised in profit or loss.Impairment losses on equity instruments that were recognised in profit or loss are not reversed through profit or loss in a subsequent period.If the fair value of a debt instrument classified as available-for-sale increases in a subsequent period and the increase can be objectively related to an event occurring after the impairment loss was recognised in profit or loss, the impairment loss is reversed through profit or loss.
Derecognition
Financial assets are derecognised when the contractual rights to receipt of cash flows expire or the asset is transferred to another party whereby the entity no longer has any significant continuing involvement in the risks and benefits associated with the asset. Financial liabilities are derecognised when the related obligations are discharged, cancelled or have expired. The difference between the carrying amount of the financial liability extinguished or transferred to another party and the fair value of consideration paid, including the transfer of noncash assets or liabilities assumed, is recognised in profit or loss.
2017 - $ 2016 - $
Held to maturity financial assets
Term deposits 167,768 960,372 167,768 960,372
Available for sale financial assets
Investments in managed funds 1,171,007 - 1,171,007 -
8. Other assetsOther assets represent items that will provide the entity with future economic benefits controlled by the company as a result of past transactions or other past events.
2017 - $ 2016 - $
Prepayments 39,649 39,380
Accrued income 6,090 - 45,739 39,380
9. Property, plant and equipment
Plant and equipment
Plant and equipment are carried at cost less accumulated depreciation and any accumulated impairment. In the event the carrying amount of plant and equipment is greater than the estimated recoverable amount, the carrying amount is written down immediately to the estimated recoverable amount and impairment losses are recognised in profit or loss. A formal assessment of recoverable amount is made when impairment indicators are present.The carrying amount of plant and equipment is reviewed annually by Directors to ensure it is not in excess of the recoverable amount of these assets. The recoverable amount is assessed on the basis of the expected net cash flows that will be received from the asset’s employment and subsequent disposal. The expected net cash flows have been discounted to their present values in determining recoverable amounts.Subsequent costs are included in the assets carrying amount or recognised as a separate asset, as appropriate, only when it is probable that future economic benefits associated with the item will flow to the company and the cost of the item can be measured reliably. All other repairs and maintenance are recognised as expenses in profit or loss during the financial period in which they are incurred.The assets’ residual values and useful lives are reviewed, and adjusted if appropriate, at the end of each reporting period.An asset’s carrying amount is written down immediately to its recoverable amount if the asset’s carrying amount is greater than its estimated recoverable amount.
2017 - $ 2016 - $
Leasehold improvements
At cost 863,918 863,918Less accumulated depreciation (175,542) (151,771) 688,376 712,147
Plant and equipment
At cost 573,685 564,161Less accumulated depreciation (476,618) (452,753) 97,067 111,408
Motor vehicles
At cost 70,330 70,330Less accumulated depreciation (25,660) (10,770) 44,670 59,560
Total property, plant and equipment 830,113 883,115
Movements in carrying amounts
Leasehold improvements
Balance at the beginning of the reporting period 712,147 660,258Additions - 74,308Depreciation expense (23,771) (22,419)Balance at the end of the reporting period 688,376 712,147
Plant and equipment
Balance at the beginning of the reporting period 111,408 130,975Additions 9,524 8,082Depreciation expense (23,865) (27,649)Balance at the end of the reporting period 97,067 111,408
Motor vehicles
Balance at the beginning of the reporting period 59,560 23,225Additions - 43,376
Notes to the Financial Statements for the year ended 30 June 2017 (continued)

16 - Annual Report Valley Community Financial Services Limited
Depreciation expense (14,890) (7,041)Balance at the end of the reporting period 44,670 59,560
Total property, plant and equipment
Balance at the beginning of the reporting period 8 83,115 814,458Additions 9,524 125,766Depreciation expense (62,526) (57,109)Balance at the end of the reporting period 830,113 883,115
10. Intangible assets
Franchise fees have been initially recorded at cost and amortised on a straight line basis at a rate of 20% per annum.Community Bank® Stadium naming rights have been initially recorded at cost and amortised on a straight line basis at a rate of 10% per annum. The current amortisation charges for intangible assets are included under depreciation and amortisation in the Statement of Profit or Loss and Other Comprehensive Income.
2017 - $ 2016 - $
Franchise fee
At cost 309,322 350,000Less accumulated amortisation (90,885) (29,175) 218,437 320,825Community Bank Stadium naming rightsAt cost 750,000 750,000Less accumulated amortisation (400,056) (325,068) 349,944 424,932TOTAL INTANGIBLE ASSETS 568,381 745,757
Movements in carrying amountsFranchise fee
Balance at the beginning of the reporting period 320,825 16,370Additions - 350,000Cost reduction (40,678) -Amortisation expense (61,710) (45,545)Balance at the end of the reporting period 218,437 320,825Community Bank Stadium naming rightsBalance at the beginning of the reporting period 424,932 499,932Amortisation expense (74,988) (75,000)Balance at the end of the reporting period 349,944 424,932
Total intangible assetsBalance at the beginning of the reporting period 745,757 516,302Additions - 350,000Cost reduction (40,678) -Amortisation expense (136,698) (120,545)Balance at the end of the reporting period 568,381 745,757
11. Trade and other payables
Trade and other payables represent the liabilities for goods and services received by the company that remain unpaid at the end of the reporting period. The balance is recognised as a current liability with the amounts normally paid within 30 days of recognition of the liability.
2017 - $ 2016 - $
CurrentUnsecured liabilities:
Trade creditors 90,765 111,938Accrued franchise fees - 350,000Other creditors and accruals 1 28,885 52,186 219,650 514,124
Non-currentUnsecured liabilities:
Other creditors and accruals 144,451 - 144,451 -
The average credit period on trade and other payables is one month.
12. Financial liabilities
Financial liabilities include trade payables, other creditors, loans from third parties and loans from or other amounts due to related entities. Financial liabilities are classified as current liabilities unless the company has an unconditional right to defer settlement of the liability for at least 12 months after the reporting period.Financial liabilities are initially measured at fair value plus transaction costs, except where the instrument is classified as “fair value through profit or loss”, in which case transaction costs are expensed to profit or loss immediately. Non-derivative financial liabilities other than financial guarantees are subsequently measured at amortised cost. Gains or losses are recognised in profit or loss through the amortisation process and when the financial liability is derecognised.
13. Borrowings
Finance Leases
Leases of fixed assets, where substantially all the risks and benefits incidental to the ownership of the asset - but not the legal ownership - are transferred to the company, are classified as finance leases.Finance leases are capitalised by recognising an asset and a liability at the lower of the amounts equal to the fair value of the leased property or the present value of the minimum lease payments, including any guaranteed residual values. Lease payments are allocated between the reduction of the lease liability and the lease interest expense for the period.Leased assets are depreciated on a straight-line basis over the shorter of their estimated useful lives or the lease term.Lease payments for operating leases, where substantially all the risks and benefits remain with the lessor, are recognised as expenses in the periods in which they are incurred.
2017 - $ 2016 - $
CurrentSecured liabilities
Finance leases 5,349 4,940 5,349 4,940
Non-currentSecured liabilities
Finance leases 14,667 20,016 14,667 20,016Total borrowings 20,016 24,956
(a) Lease liabilitiesLease liabilities are effectively secured as the rights to the leased assets revert to the lessor in the event of default.
Notes to the Financial Statements for the year ended 30 June 2017 (continued)

17 - Annual Report Valley Community Financial Services Limited
Notes to the Financial Statements for the year ended 30 June 2017 (continued)
14. Provisions
Short-term employee benefits
Provision is made for the company’s obligation for short-term employee benefits. Short-term employee benefits are benefits (other than termination benefits) that are expected to be settled wholly before 12 months after the end of the annual reporting period in which the employees render the related service, including wages, salaries and sick leave. Short-term employee benefits are measured at the (undiscounted) amounts expected to be paid when the obligation is settled.The liability for annual leave is recognised in the provision for employee benefits. All other short term employee benefit obligations are presented as payables.
Other long-term employee benefits
Provision is made for employees’ long service leave and annual leave entitlements not expected to be settled wholly within 12 months after the end of the annual reporting period in which the employees render the related service.Other long-term employee benefits are measured at the present value of the expected future payments to be made to employees. Expected future payments incorporate anticipated future wage and salary levels, durations of service and employee departures and are discounted at rates determined by reference to market yields at the end of the reporting period on government bonds that have maturity dates that approximate the terms of the obligations. Any remeasurement for changes in assumptions of obligations for other long-term employee benefits are recognised in profit or loss in the periods in which the changes occur.The company’s obligations for long-term employee benefits are presented as non-current provisions in its statement of financial position, except where the company does not have an unconditional right to defer settlement for at least 12 months after the end of the reporting period, in which case the obligations are presented as current provisions.
2017 - $ 2016 - $
Current
Employee benefits 184,531 159,746
Non-current
Employee benefits 49,686 68,214
TOTAL PROVISIONS 234,217 227,960
15. Share capital
Ordinary shares are classified as equity.Incremental costs directly attributable to the issue of new shares are shown in equity as a deduction from the proceeds.
2017 - $ 2016 - $
2,055,876 Ordinary shares fully paid 2,055,876 2,055,8763:1 Bonus shares issued for no consideration - -
2,055,876 2,055,876
Movements in share capital
Fully paid ordinary shares:At the beginning of the reporting period 4,051,890 4,051,890At the end of the reporting period 4,051,890 4,051,890
Ordinary shares participate in dividends and the proceeds on winding up of the company in proportion to the number of shares held. At the shareholders’ meetings each shareholder is entitled to one vote when a poll is called, or on a show of hands. The company does not have authorised capital or par value in respect of its issued shares. All issued shares are fully paid. All shares rank equally with regard to the company’s residual assets.
Capital management
The Board’s policy is to maintain a strong capital base so as to sustain future development of the company. The Board of Directors monitor the return on capital and
the level of dividends to shareholders. Capital is represented by total equity as recorded in the Statement of Financial Position.In accordance with the franchise agreement, in any 12 month period, the funds distributed to shareholders shall not exceed the Distribution Limit.
(i) the Distribution Limit is the greater of:
(a) 20% of the profit or funds of the company otherwise available for distribution to shareholders in that 12 month period; and
(b) subject to the availability of distributable profits, the Relevant Rate of Return multiplied by the average level of share capital of the Franchisee over that 12 month period; and
(ii) the Relevant Rate of Return is equal to the weighted average interest rate on 90 day bank bills over that 12 month period plus 5%.
The Board is managing the growth of the business in line with this requirement. There are no other externally imposed capital requirements, although the nature of the company is such that amounts will be paid in the form of charitable donations and sponsorship. Charitable donations and sponsorship paid can be seen in the Statement of Profit or Loss and Comprehensive Income.There were no changes in the company’s approach to capital management during the year.
16. Retained earnings -
2017 - $ 2016 - $
Balance at the beginning of the reporting period 447,663 283,680Profit/(loss) after income tax 541,184 285,540Dividends paid (121,557) (121,557)Balance at the end of the reporting period 867,290 447,663
17. Dividends paid or provided for on ordinary shares
2017 - $ 2016 - $
Dividends paid or provided for during the year
Interim and/or final fully franked ordinary dividend of 3 cents per share (2016: 3 cents) franked at the tax rate of 27.5% (2016: 30%). 121,557 121,557
A provision is made for the amount of any dividends declared, authorised and no longer payable at the discretion of the entity on or before the end of the financial year, but not distributed at balance date.
18. Earnings per share
Basic earnings per share
Basic earnings per share is calculated by dividing the profit or loss attributable to owners of the company, excluding any costs of servcing equity other than ordinary shares, by the weighted average number of ordinary shares outstanding during the year, adjsuted for bonus elements in ordinary shares issues during the year.
2017 - $ 2016 - $
Basic earnings per share (cents) 13.36 7.05
Earnings used in calculating basic earnings per share 541,184 285,540
Weighted average number of ordinary shares used in calculating basic earnings per share. 4,051,890 4,051,890
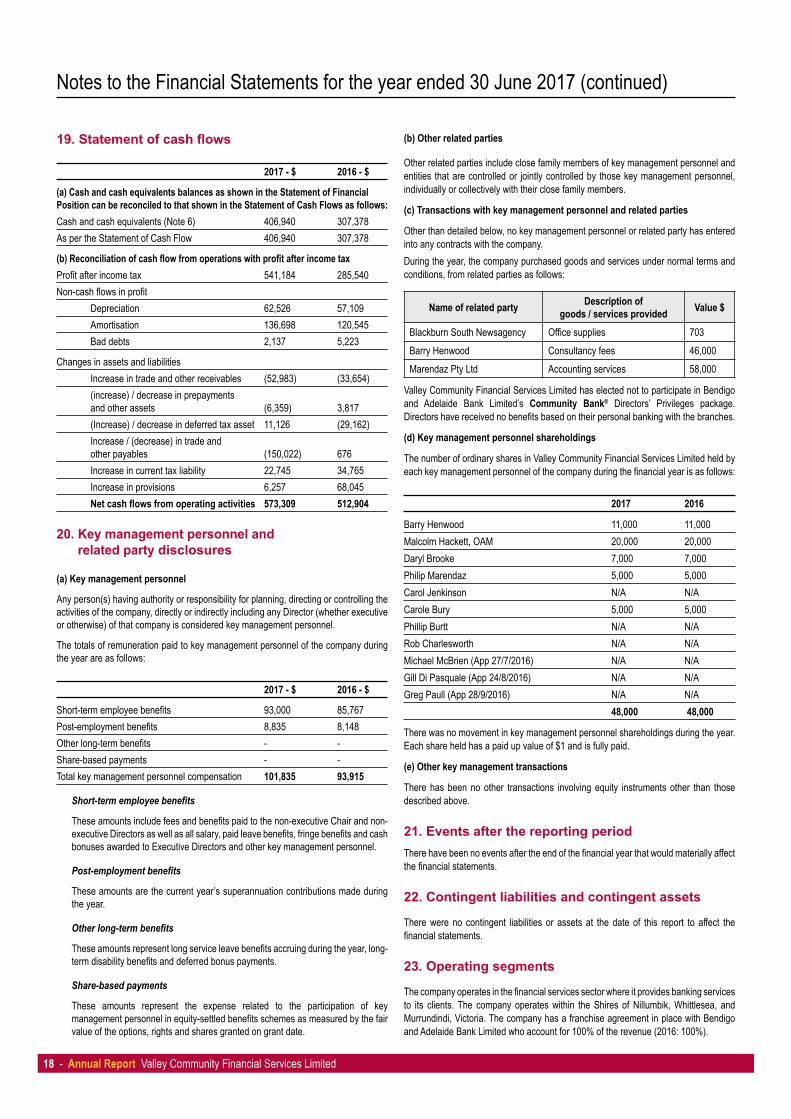
18 - Annual Report Valley Community Financial Services Limited
Notes to the Financial Statements for the year ended 30 June 2017 (continued)
19. Statement of cash flows
2017 - $ 2016 - $
(a) Cash and cash equivalents balances as shown in the Statement of Financial Position can be reconciled to that shown in the Statement of Cash Flows as follows:Cash and cash equivalents (Note 6) 406,940 307,378As per the Statement of Cash Flow 406,940 307,378
(b) Reconciliation of cash flow from operations with profit after income taxProfit after income tax 541,184 285,540Non-cash flows in profit
Depreciation 62,526 57,109Amortisation 136,698 120,545Bad debts 2,137 5,223
Changes in assets and liabilitiesIncrease in trade and other receivables (52,983) (33,654)(increase) / decrease in prepayments and other assets (6,359) 3,817(Increase) / decrease in deferred tax asset 11,126 (29,162)Increase / (decrease) in trade and other payables (150,022) 676Increase in current tax liability 22,745 34,765Increase in provisions 6,257 68,045Net cash flows from operating activities 573,309 512,904
20. Key management personnel and related party disclosures
(a) Key management personnel
Any person(s) having authority or responsibility for planning, directing or controlling the activities of the company, directly or indirectly including any Director (whether executive or otherwise) of that company is considered key management personnel.
The totals of remuneration paid to key management personnel of the company during the year are as follows:
2017 - $ 2016 - $
Short-term employee benefits 93,000 85,767Post-employment benefits 8,835 8,148Other long-term benefits - -Share-based payments - -Total key management personnel compensation 101,835 93,915
Short-term employee benefits
These amounts include fees and benefits paid to the non-executive Chair and non-executive Directors as well as all salary, paid leave benefits, fringe benefits and cash bonuses awarded to Executive Directors and other key management personnel.
Post-employment benefits
These amounts are the current year’s superannuation contributions made during the year.
Other long-term benefits
These amounts represent long service leave benefits accruing during the year, long-term disability benefits and deferred bonus payments.
Share-based payments
These amounts represent the expense related to the participation of key management personnel in equity-settled benefits schemes as measured by the fair value of the options, rights and shares granted on grant date.
(b) Other related parties
Other related parties include close family members of key management personnel and entities that are controlled or jointly controlled by those key management personnel, individually or collectively with their close family members.
(c) Transactions with key management personnel and related parties
Other than detailed below, no key management personnel or related party has entered into any contracts with the company.During the year, the company purchased goods and services under normal terms and conditions, from related parties as follows:
Name of related party Description of goods / services provided Value $
Blackburn South Newsagency Office supplies 703Barry Henwood Consultancy fees 46,000Marendaz Pty Ltd Accounting services 58,000
Valley Community Financial Services Limited has elected not to participate in Bendigo and Adelaide Bank Limited’s Community Bank® Directors’ Privileges package. Directors have received no benefits based on their personal banking with the branches.
(d) Key management personnel shareholdings
The number of ordinary shares in Valley Community Financial Services Limited held by each key management personnel of the company during the financial year is as follows:
2017 2016
Barry Henwood 11,000 11,000Malcolm Hackett, OAM 20,000 20,000Daryl Brooke 7,000 7,000Philip Marendaz 5,000 5,000Carol Jenkinson N/A N/ACarole Bury 5,000 5,000Phillip Burtt N/A N/ARob Charlesworth N/A N/AMichael McBrien (App 27/7/2016) N/A N/AGill Di Pasquale (App 24/8/2016) N/A N/AGreg Paull (App 28/9/2016) N/A N/A 48,000 48,000
There was no movement in key management personnel shareholdings during the year. Each share held has a paid up value of $1 and is fully paid.
(e) Other key management transactions
There has been no other transactions involving equity instruments other than those described above.
21. Events after the reporting periodThere have been no events after the end of the financial year that would materially affect the financial statements.
22. Contingent liabilities and contingent assets
There were no contingent liabilities or assets at the date of this report to affect the financial statements.
23. Operating segments
The company operates in the financial services sector where it provides banking services to its clients. The company operates within the Shires of Nillumbik, Whittlesea, and Murrundindi, Victoria. The company has a franchise agreement in place with Bendigo and Adelaide Bank Limited who account for 100% of the revenue (2016: 100%).

19 - Annual Report Valley Community Financial Services Limited
Notes to the Financial Statements for the year ended 30 June 2017 (continued)
24. CommitmentsOperating lease commitments
Non-cancellable operating leases contracted for but not capitalised in the Statement of Financial Position.
2017 - $ 2016 - $
Payable:no later than 12 months 355,291 355,017between 12 months and five years 728,240 1,007,493greater than five years 2,622 -
Minimum lease payments 1,086,153 1,362,510
The property leases are non-cancellable leases with a terms ranging between 4 and 5 years, with rent payable monthly in advance and with CPI increases each year.
Finance lease commitmentsFinance lease liabilities are payable exclusive of GST as follows:
2017 - $ 2016 - $
Payable:no later than 12 months 6,150 6,150between 12 months and five years 15,102 21,252
Minimum lease payments 21,252 27,402Less future interest charges (1,236) (2,446)Finance lease liability 20,016 24,956
Finance leases comprise leases of property, plant and equipment under normal commercial finance lease terms and conditions repayable over 5 years.
25. Company details
The registered office of the company is: 8B 75-77 Main Hurstbridge Road, Diamond Creek, 3089
The principle places of the business are:
808 Main Road, Hurstbridge, VIC 3099Shop 8, 75-77 Main Hurstbridge Road, Diamond Creek 3089
Shop 4, 1 Victoria Road, Kinglake 37631036 Main Road, Eltham, 3095
Shop 3, 101 Hazel Glen Drive, Doreen 3754
26. Financial risk management
Financial risk management policies
The Board of Directors has overall responsibility for the establishment and oversight of the risk management framework. The Board has established an Audit Committee which reports regularly to the Board. The Audit Committee is assisted in the area of risk management by an internal audit function.
Specific financial risk exposure and management
The main risks the company is exposed to through its financial instruments are credit risk, liquidity risk and market risk consisting of interest rate risk and other price risk. There have been no substantial changes in the types of risks the company is exposed to, how the risks arise, or the Board’s objectives, policies and processes for managing or measuring the risks from the previous period.The company’s financial instruments consist mainly of deposits with banks, short term investments, account receivables and payables, bank overdraft and loans. The totals for each category of financial instruments measured in accordance with AASB 139 Financial Instruments: Recognition and Measurement as detailed in the accounting policies are as follows:
Note 2017 - $ 2016 - $
Financial assetsCash and cash equivalents 5 406,940 307,378Trade and other receivables 6 374,296 323,450Financial assets 7 167,768 960,372TOTAL FINANCIAL ASSETS 949,004 1,591,200
Financial liabilitiesTrade and other payables 11 219,650 514,124Borrowings 13 20,016 24,956TOTAL FINANCIAL LIABILITIES 239,666 539,080
(a) Credit risk
Exposure to credit risk relating to financial assets arises from the potential non-performance by counterparties of contract obligations that could lead to a financial loss to the company.Credit risk is managed through maintaining procedures ensuring, to the extent possible, that clients and counterparties to transactions are of sound credit worthiness. Such monitoring is used in assessing receivables for impairment. Credit terms for normal fee income are generally 30 days from the date of invoice. For fees with longer settlements, terms are specified in the individual client contracts. In the case of loans advanced, the terms are specific to each loan.
Credit risk exposures
The maximum exposure to credit risk by class of recognised financial assets at the end of the reporting period is equivalent to the carrying amount and classification of those financial assets as presented in the table above.The company has significant concentrations of credit risk with Bendigo and Adelaide Bank Limited. The company’s exposure to credit risk is limited to Australia by geographic area.None of the assets of the company are past due (2016: nil past due) and based on historic default rates, the company believes that no impairment allowance is necessary in respect of assets not past due.The company limits its exposure to credit risk by only investing in liquid securities with Bendigo and Adelaide Bank Limited and therefore credit risk is considered minimal.

20 - Annual Report Valley Community Financial Services Limited
Notes to the Financial Statements for the year ended 30 June 2017 (continued)
(b) Liquidity risk
Liquidity risk is the risk that the company will not be able to meet its financial obligations as they fall due. The company ensures it will have enough liquidity to meet its liabilities when due under both normal and stressed conditions.Liquidity management is carried out within the guidelines set by the Board.Typically, the company maintains sufficient cash on hand to meet expected operational expenses, including the servicing of financial obligations. This excludes the potential impact of extreme circumstances that cannot reasonably be predicted, such as natural disasters.The table below reflects an undiscounted contractual maturity analysis for financial liabilities.Cash flows realised from financial assets reflect management’s expectation as to the timing of realisation. Actual timing may therefore differ from that disclosed. The timing of cash flows presented in the table to settle financial liabilities reflects the earliest contractual settlement dates and does not reflect management’s expectations that banking facilities will be rolled forward.
Financial liability and financial asset maturity analysis:
30 June 2017
Weighted average interest rate %
Total $ Within 1 year $
1 to 5 years $
Over 5 years $
Financial assetsCash and cash equivalents 0.20% 406,940 406,940 - -
Trade and other receivables -% 374,296 374,296 - -
Financial assets 2.24% 167,768 167,768 - -Total anticipated inflows 949,004 949,004 - -Financial liabilitiesTrade and other payables -% 219,650 219,650 - -
Borrowings 2.81% 20,016 5,349 14,667 -Total expected outflows 239,666 224,999 14,667 -Net inflow / (outflow) on financial instruments 709,338 724,005 (14,667) -
Financial assetsCash and cash equivalents 0.20% 307,378 307,378 - -
Trade and other receivables -% 323,450 323,450 - -
Financial assets 2.24% 960,372 960,372 - -
Total anticipated inflows 1,591,200 1,591,200 - -
Financial liabilities
Trade and other payables -% 514,124 514,124 - -
Borrowings 2.81% 24,956 4,940 20,016Total expected outflows 539,080 519,064 20,016 -Net inflow / (outflow) on financial instruments 1,052,120 1,072,136 (20,016) -
(c) Market risk
Market risk is the risk that changes in market prices, such as interest rates, will affect the company’s income or the value of its holdings of financial instruments. The objective of market risk management is to manage and control market risk exposures within acceptable parameters.
Exposure to interest rate risk arises on financial assets and financial liabilities recognised at the end of the reporting period whereby a future change in interest rates will affect future cash flows or the fair value of fixed rate financial instruments.The financial instruments that primarily expose the company to interest rate risk are borrowings, fixed interest securities, and cash and cash equivalents.
Sensitivity analysis
The following table illustrates sensitivities to the company’s exposures to changes in interest rates and equity prices. The table indicates the impact on how profit and equity values reported at the end of the reporting period would have been affected by changes in the relevant risk variable that management considers to be reasonably possible.These sensitivities assume that the movement in a particular variable is independent of other variables.
Year ended 30 June 2017 Profit - $ Equity - $
+/- 1% in interest rates (interest income) 5,747 5,747
+/- 1% in interest rates (interest expense) (200) (200)
5,547 5,547
Year ended 30 June 2016 Profit - $ Equity - $
+/- 1% in interest rates (interest income) 12,678 12,678
+/- 1% in interest rates (interest expense) (250) (250)
12,678 12,678There have been no changes in any of the methods or assumptions used to prepare the above sensitivity analysis from the prior year.The company has no exposure to fluctuations in foreign currency.
(d) Price risk
The company is not exposed to any material price risk.
Fair values
Fair value estimation
The fair values of financial assets and liabilities are presented in the following table and can be compared to their carrying amounts as presented in the statement of financial position.Differences between fair values and the carrying amounts of financial instruments with fixed interest rates are due to the change in discount rates being applied to the market since their initial recognition by the company.
2017 2016Carryingamount $
Fair value $
Carryingamount $
Fair value $
Financial assetsCash and cash equivalents (i) 406,940 406,940 307,378 307,378Trade and other receivables (i) 374,296 374,296 323,450 323,450Financial assets 167,768 167,768 960,372 960,372Total financial assets 949,004 949,004 1,591,200 1,591,200Financial liabilitiesTrade and other payables (i) 219,650 219,650 514,124 514,124Borrowings 20,016 20,016 24,956 24,956Total financial liabilities 239,666 239,666 539,080 539,080
(i) Cash and cash equivalents, trade and other receivables, and trade and other payables are short-term instruments in nature whose carrying amounts are equivalent to their fair values.

21 - Annual Report Valley Community Financial Services Limited
In accordance with a resolution of the Directors of Valley Community Financial Services Limited, the Directors of the company declare that:1. The financial statements and notes, as set out on pages 10 to 42 are in accordance
with the Corporations Act 2001 and:(i) comply with Australian Accounting Standards which, as stated in
accounting policy Note l(a} to the financial statements, constitutes compliance with International Financial Reporting Standards (IFRS); and
(ii) give a true and fair view of the company’s financial position as at 30 June 2017 and of the performance for the year ended on that date;
2. In the Directors’ opinion there are reasonable grounds to believe that the company will be able to pay its debts as and when they become due and payable.
3. The audited remuneration disclosures set out in the remuneration report section of the Directors’ report comply with Accounting Standard AAS8124 Related Party Disclosures and the Corporations Regulations 2001.
This resolution is made in accordance with a resolution of the Board of Directors
Barry HenwoodDirector
Signed at Diamond Creek on 27 September 2017.
Directors Declaration
Independent Auditor’s Report
Valley Community Financial Services Limited ABN: 86 092 399 730 | Financial Report For the year ended 30 June 2017

22 - Annual Report Valley Community Financial Services Limited
bendigobank.com.au
Hurstbridge & Districts Community Bank® Branch808 Main Road, Hurstbridge VIC 3099Phone: (03) 9718 0431 Fax: (03) 9718 0166www.bendigobank.com.au/hurstbridge
Diamond Creek Community Bank® BranchShop 8, 75 -77 Main Hurstbridge Road, Diamond Creek VIC 3089Phone: (03) 9438 4133 Fax: (03) 9438 6930www.bendigobank.com.au/diamond-creek
Eltham & District Community Bank® Branch1036 Main Road, Eltham VIC 3095Phone: (03) 9439 0188 Fax: (03) 9431 4667www.bendigobank.com.au/eltham
Doreen & Mernda Community Bank® BranchShop 3, 101 Hazel Glen Drive, Doreen VIC 3754Phone: (03) 9717 1433 Fax: (03) 9717 1468www.bendigobank.com.au/doreen-mernda
Kinglake branchShop 4, 1 Victoria Road, Kinglake VIC 3763Phone: (03) 5786 1656 Fax: (03) 5786 1859www.bendigobank.com.au/kinglake
Franchisee: Valley Community Financial Services LimitedShop 8b, 75 -77 Main Hurstbridge Road (PO Box 469), Diamond Creek VIC 3089Phone: (03) 9438 3194 Fax: (03) 9438 4960ABN: 86 092 399 730
www.valleyfinancial.com.au (BNPAR17003) (06/17)