Annual Report 2017 - sefa Annual Report_2017.pdf · Annual Report 2017 01 OVERVIEW Along the Growth...
140
Annual Report 2017 5 years of growing small enterprises
Transcript of Annual Report 2017 - sefa Annual Report_2017.pdf · Annual Report 2017 01 OVERVIEW Along the Growth...
1Annual Report 2017
Annual Report
2017
5 years of growing small enterprises

Reflecting on sefa’s 5 Years of Existence
"South Africa belongs to all its peoples.
Now, in 2030, our story keeps growing as if spring is always with us.
Once, we uttered the dream of a rainbow. Now we see it, living it. It does not curve over the sky.
It is refracted in each one of us at home, in the community, in the city, and across the land, in an abundance of colour.
When we see it in the faces of our children, we know: there will always be, for us, a worthy future."
National Development Plan vision for 2030

01Annual Report 2017
OVERVIEW
Along the Growth Path
Foreword by the Honourable Minister of Small Business Development
Overview
Group Structure
sefa's Strategy
Report on the Performance Against Predetermined Objectives
Enterprise Risk Management and Compliance
GOVERNANCE
Chairperson’s Statement
Board of Directors
Corporate Governance Report
Report of the Audit & Risk Committee
PERFORMANCE OUTLOOK
Chief Executive Officer’s Statement
Executive Management
Chief Financial Officer’s Statement
Wholesale Lending
Direct Lending
Post Investment Monitoring and Workout
Human Capital Management
Stakeholder Relations and Communication
Group and Company Annual Financial Statements
REFERENCE INFORMATION
List of Acronyms
sefa Offices
02
04
06
08
09
11
14
18
20
22
26
28
32
34
36
48
56
60
66
69
131
132
Investing in the growth and sustainabilityof SMMEs and Co-operatives
Small Enterprise Finance Agency02
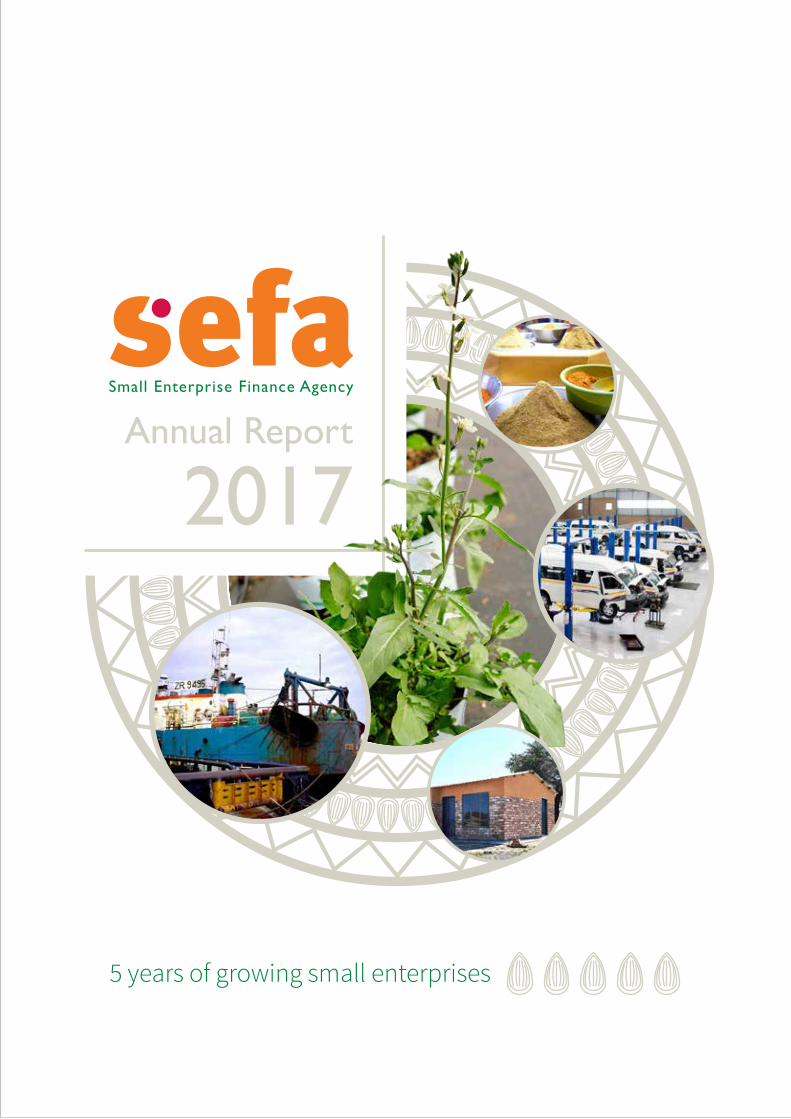
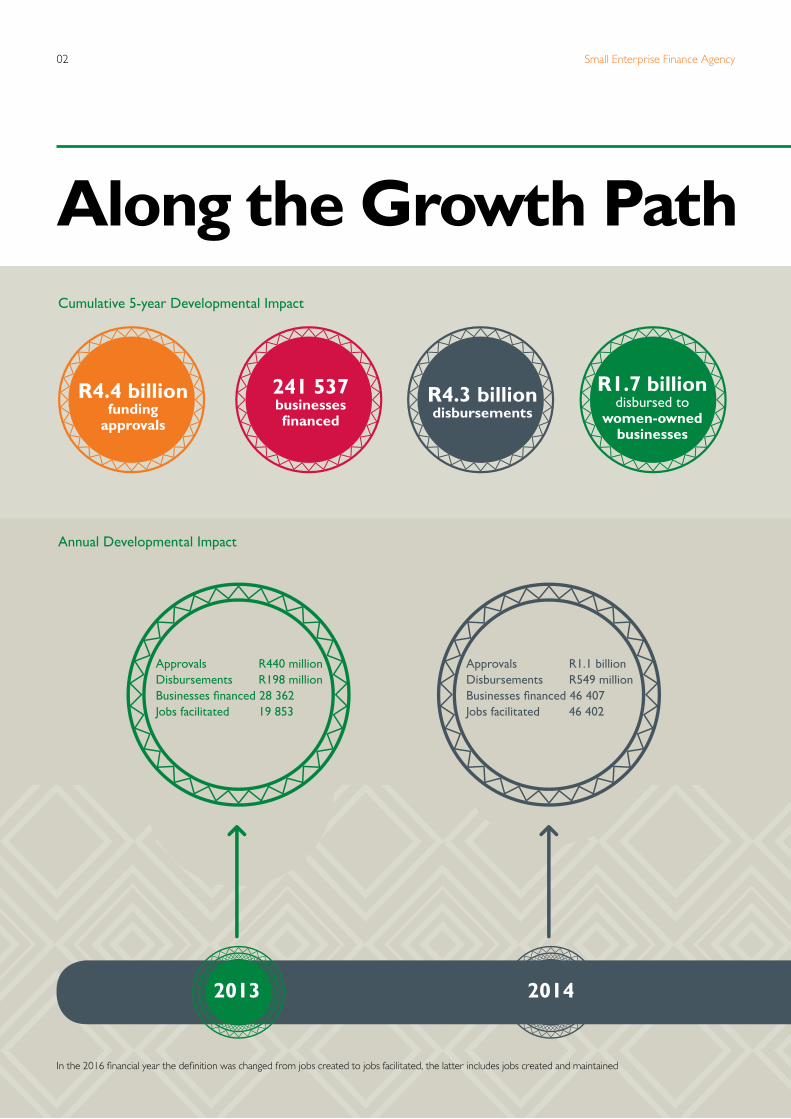
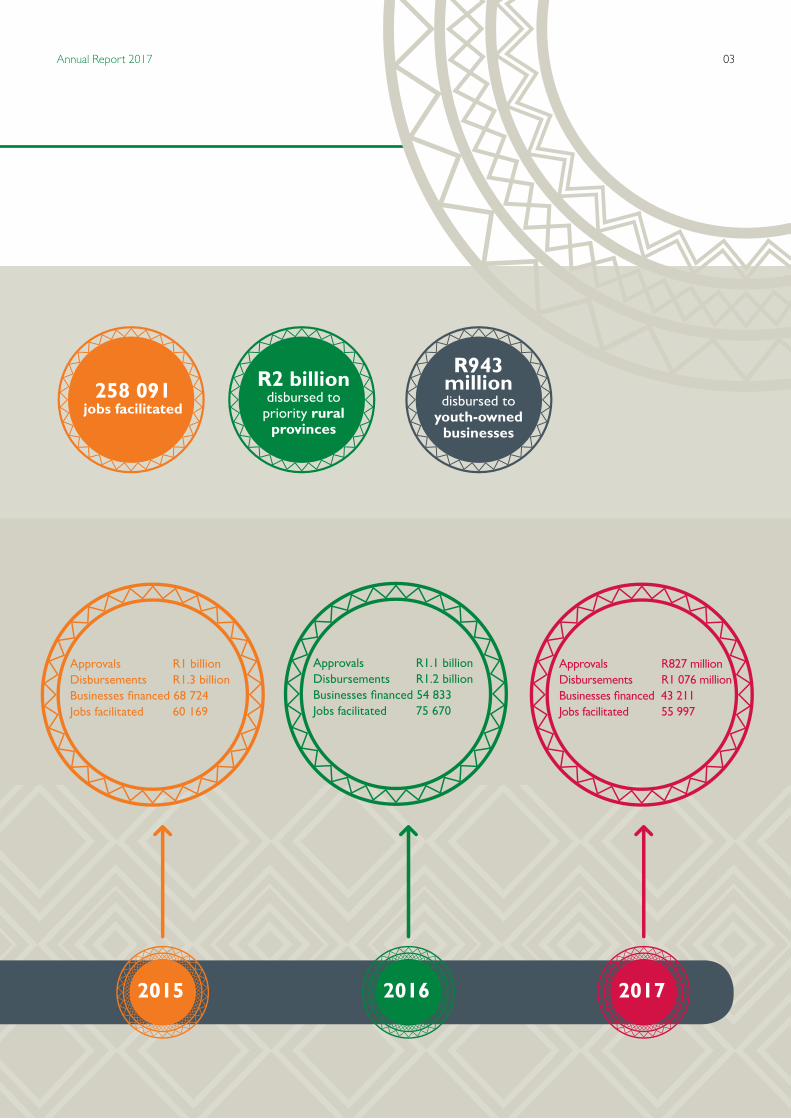
Along the Growth Path
Approvals R1.1 billionDisbursements R549 millionBusinesses financed 46 407Jobs facilitated 46 402
2014
Approvals R440 millionDisbursements R198 millionBusinesses financed 28 362Jobs facilitated 19 853
2013
Cumulative 5-year Developmental Impact
Annual Developmental Impact
R4.4 billion funding
approvals
241 537businesses financed
R1.7 billiondisbursed to
women-owned businesses
R4.3 billion disbursements
In the 2016 financial year the definition was changed from jobs created to jobs facilitated, the latter includes jobs created and maintained
03Annual Report 2017
Approvals R1 billionDisbursements R1.3 billionBusinesses financed 68 724Jobs facilitated 60 169
2015
Approvals R1.1 billionDisbursements R1.2 billionBusinesses financed 54 833Jobs facilitated 75 670
2016
Approvals R827 millionDisbursements R1 076 millionBusinesses financed 43 211Jobs facilitated 55 997
2017
258 091 jobs facilitated
R943 million disbursed to
youth-owned businesses
R2 billion disbursed to
priority rural provinces
Small Enterprise Finance Agency04
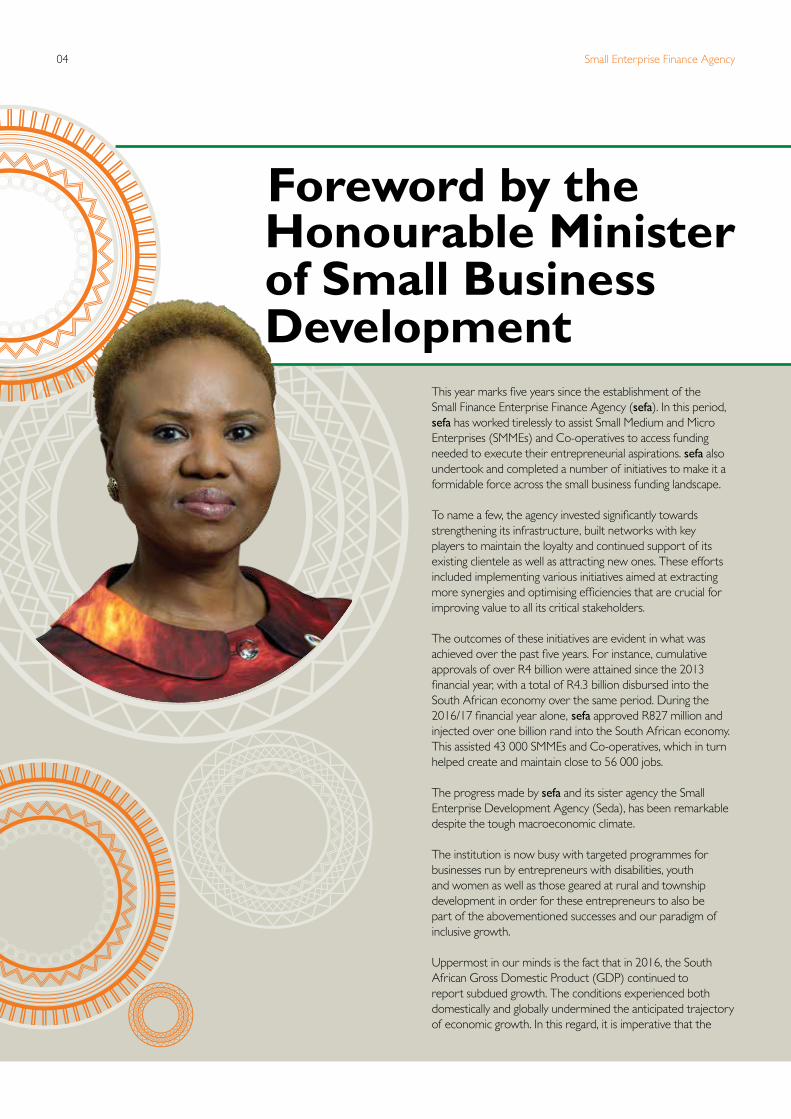
This year marks five years since the establishment of the Small Finance Enterprise Finance Agency (sefa). In this period, sefa has worked tirelessly to assist Small Medium and Micro Enterprises (SMMEs) and Co-operatives to access funding needed to execute their entrepreneurial aspirations. sefa also undertook and completed a number of initiatives to make it a formidable force across the small business funding landscape.
To name a few, the agency invested significantly towards strengthening its infrastructure, built networks with key players to maintain the loyalty and continued support of its existing clientele as well as attracting new ones. These efforts included implementing various initiatives aimed at extracting more synergies and optimising efficiencies that are crucial for improving value to all its critical stakeholders.
The outcomes of these initiatives are evident in what was achieved over the past five years. For instance, cumulative approvals of over R4 billion were attained since the 2013 financial year, with a total of R4.3 billion disbursed into the South African economy over the same period. During the 2016/17 financial year alone, sefa approved R827 million and injected over one billion rand into the South African economy. This assisted 43 000 SMMEs and Co-operatives, which in turn helped create and maintain close to 56 000 jobs.
The progress made by sefa and its sister agency the Small Enterprise Development Agency (Seda), has been remarkable despite the tough macroeconomic climate.
The institution is now busy with targeted programmes for businesses run by entrepreneurs with disabilities, youth and women as well as those geared at rural and township development in order for these entrepreneurs to also be part of the abovementioned successes and our paradigm of inclusive growth.
Uppermost in our minds is the fact that in 2016, the South African Gross Domestic Product (GDP) continued to report subdued growth. The conditions experienced both domestically and globally undermined the anticipated trajectory of economic growth. In this regard, it is imperative that the
Honourable Minister of Small Business Development
Foreword by the
05Annual Report 2017
economy be radically transformed to stimulate inclusive growth, create employment and maintain jobs, hence our aggressiveness in ensuring that sefa plays its expected role.
It needs no reminding that the National Development Plan (NDP) has identified the small business sector to create 90% of the 11 million jobs envisaged by 2030, which would address the inequality, poverty and unemployment running rampant. With this at the back of the mind, the Department of Small Business Development (DSBD) will continue to influence the policy environment to promote an inclusive growth strategy.
Furthermore, the department will strive for a coherent policy framework that promotes an enabling ecosystem for SMMEs and Co-operatives. This will further provide equitable access to responsive and targeted products and services that will enable the growth and development of small businesses and Co-operatives.
In addition, the DSBD will foster strong collaboration between its agencies to radically transform the small business sector and promote the growth of rural and township economies including the participation of youth, women and people with disabilities.
Overall, the start-up environment continues to show signs of weakness in the ecosystem by not being coherent despite the efforts by development institutions to provide financial and non-financial support. As a department, we are mindful of these challenges and plans are underway to ensure that the government’s commitment to place SMMEs and Co-operatives at the centre of economic growth and job generation remains at the forefront of our activities.
Engagements with the relevant stakeholders have commenced to ensure that initiatives such as the 30% set-aside government procurement spend to this sector becomes a reality. Moreover, there is a heightened need to offer practical entrepreneurship training to enable business owners to improve their chances of success. Once again, these initiatives will remain our key focus areas in the coming years.
sefa’s mainstream programmes continue to emphasise the importance of driving economic transformation by targeting
enterprises run by women, youth, black people, people with disabilities, and enterprises operating in rural communities and townships.
The department in collaboration with sefa, and other stakeholders will continue to work together to increase access to finance by SMMEs and Co-operatives. The 2017/18 financial year will mark the commencement of, among others, the European Union’s SMME support programme for South Africa, where sefa will receive a grant of €30 million for on-lending and €5 million for technical support to leverage public and private sector funding for SMMEs and Co-operatives.
Over the coming five years, sefa anticipates having a significant impact in terms of developmental outcomes of the sector it serves particularly as regards the transformation agenda indicators.
I wish to express my appreciation to the previous sefa Board of Directors, and extend a warm welcome to the new Board of Directors. I would also like to thank sefa’s Executive Management and staff for their dedication and continued commitment to provide support to small businesses and Co-operatives.
sefa’s initiatives are critical in ensuring that the marginalised small businesses and Co-operatives obtain the support they need but difficult to receive from other sources. The journey remains long as the majority of the target market remains unserved or underserved.
It is against this background that the DSBD remains resolute to lend policy development that is aimed at ensuring that sefa, among other implementing agencies, contributes sufficiently to this sector.
Lindiwe Zulu, MPHonourable Minister of Small Business Development
Honourable Minister of Small Business Development
Small Enterprise Finance Agency06
OverviewAbout sefasefa is a wholly owned subsidiary of the Industrial Development Corporation of South Africa Ltd (IDC) and was established on 1 April 2012 to contribute towards job creation and economic growth by providing financial and non-financial support to SMMEs and Co-operatives.
The agency derives its legislative mandate to be a catalyst of SMME and Co-operative enterprise development, growth and sustainability from the IDC Act of 1940 (amended in 2001).
The Department of Small Business Development is sefa’s executive authority.
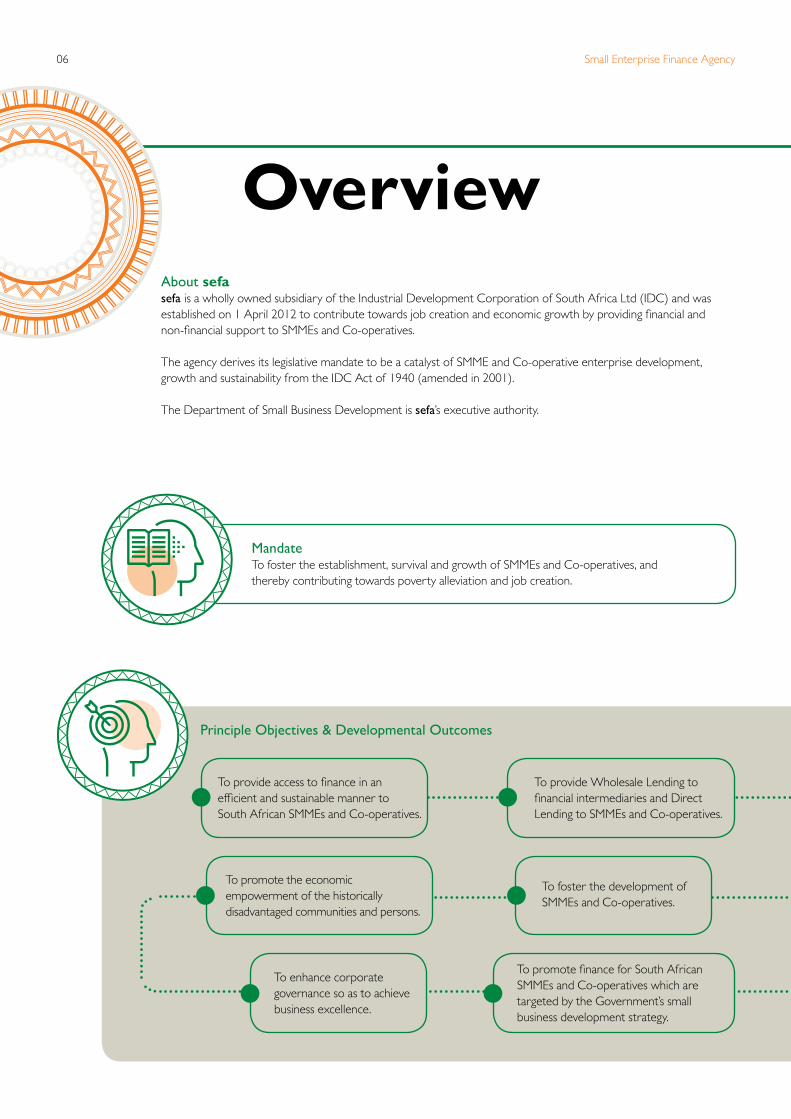
Principle Objectives & Developmental Outcomes
To provide access to finance in an efficient and sustainable manner to South African SMMEs and Co-operatives.
To promote the economic empowerment of the historically disadvantaged communities and persons.
To foster the development of SMMEs and Co-operatives.
To provide Wholesale Lending to financial intermediaries and Direct Lending to SMMEs and Co-operatives.
To enhance corporate governance so as to achieve business excellence.
To promote finance for South African SMMEs and Co-operatives which are targeted by the Government’s small business development strategy.
MandateTo foster the establishment, survival and growth of SMMEs and Co-operatives, andthereby contributing towards poverty alleviation and job creation.
07Annual Report 2017
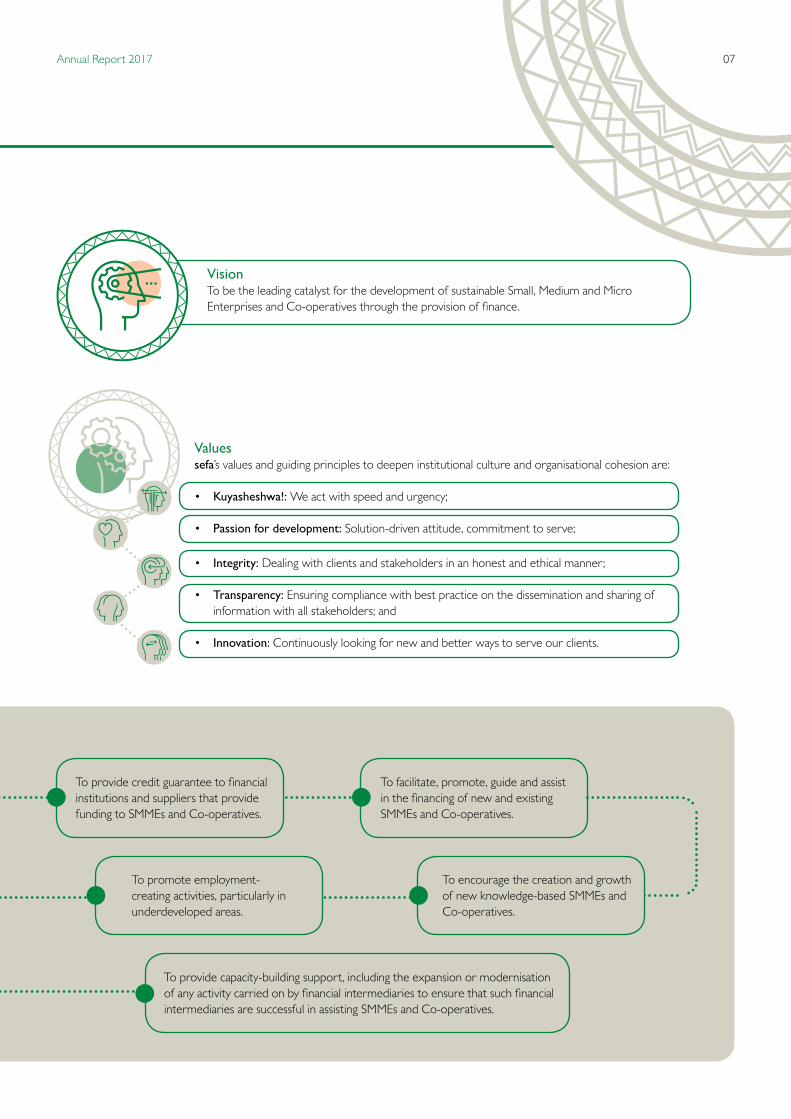
Valuessefa’s values and guiding principles to deepen institutional culture and organisational cohesion are:
• Kuyasheshwa!: We act with speed and urgency;
• Passion for development: Solution-driven attitude, commitment to serve;
• Integrity: Dealing with clients and stakeholders in an honest and ethical manner;
• Transparency: Ensuring compliance with best practice on the dissemination and sharing of information with all stakeholders; and
• Innovation: Continuously looking for new and better ways to serve our clients.
To promote employment-creating activities, particularly in underdeveloped areas.
To provide credit guarantee to financial institutions and suppliers that provide funding to SMMEs and Co-operatives.
To facilitate, promote, guide and assist in the financing of new and existing SMMEs and Co-operatives.
To encourage the creation and growth of new knowledge-based SMMEs and Co-operatives.
To provide capacity-building support, including the expansion or modernisation of any activity carried on by financial intermediaries to ensure that such financial intermediaries are successful in assisting SMMEs and Co-operatives.
VisionTo be the leading catalyst for the development of sustainable Small, Medium and Micro Enterprises and Co-operatives through the provision of finance.
Small Enterprise Finance Agency08
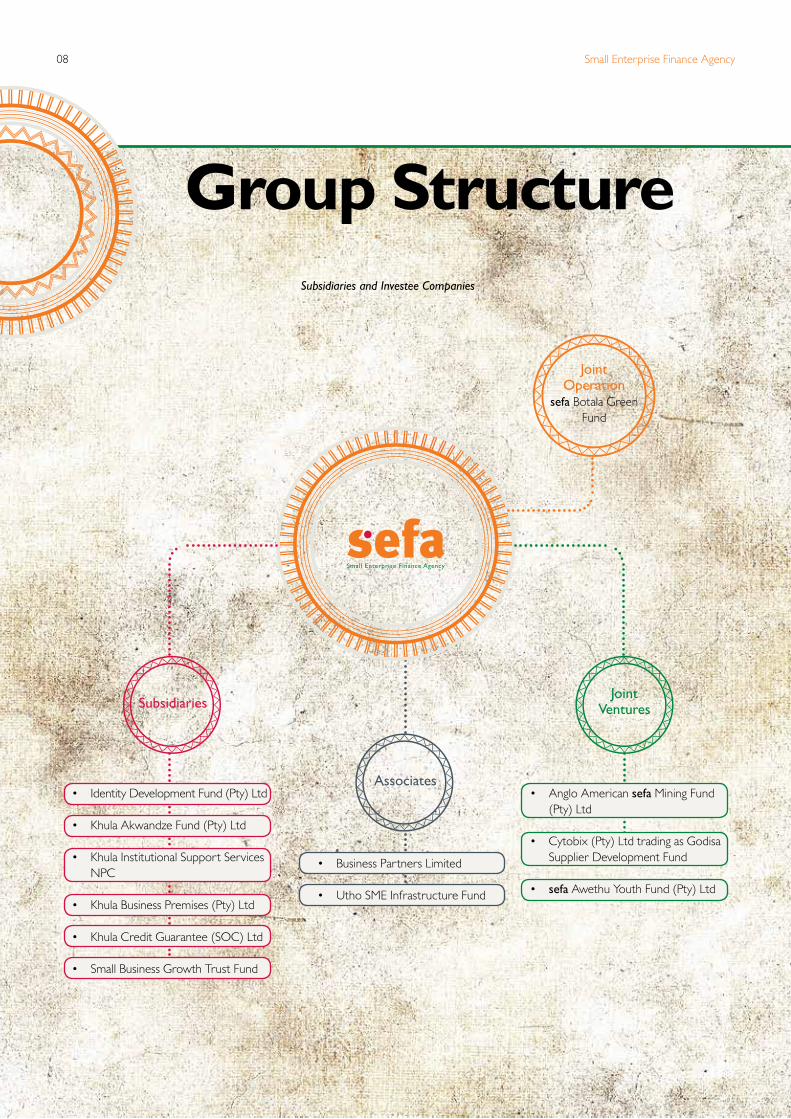
Group StructureSubsidiaries and Investee Companies
Joint Operation
sefa Botala Green Fund
Subsidiaries
Associates
Joint Ventures
• Identity Development Fund (Pty) Ltd
• Khula Akwandze Fund (Pty) Ltd
• Khula Institutional Support Services NPC
• Khula Business Premises (Pty) Ltd
• Khula Credit Guarantee (SOC) Ltd
• Small Business Growth Trust Fund
• Anglo American sefa Mining Fund (Pty) Ltd
• Cytobix (Pty) Ltd trading as Godisa Supplier Development Fund
• sefa Awethu Youth Fund (Pty) Ltd
• Business Partners Limited
• Utho SME Infrastructure Fund

09Annual Report 2017
sefa acknowledges the need for economic transformation to address the triple challenges of unemployment, poverty and inequality. It promotes and supports the development of SMMEs and Co-operatives as a vehicle to driving economic growth, employment, innovation and competitiveness.
sefa’s operating model, product portfolio and geographic footprint is strategically designed to increase access to finance for its target market.
Operating Modelsefa delivers its products and services through Direct Lending and Wholesale Lending programmes. Additionally, it offers various post investment support products, which have been devised to facilitate and unlock funding bottlenecks. Non-financial products mitigate the risk of defaulting loans and strengthen SMMEs and Co-operatives by enhancing operating capacity and sustainability.
sefa's Strategy
DIRECT LENDING • Asset Finance• Bridging Loans• Revolving Loans• Term Loans
WHOLESALE LENDING • Credit Guarantees• Equity• Revolving Loans• Structured Finance Solutions (SFSs)• Term Loans
OTHER SUPPORT SERVICES• Post-Loan Monitoring and
Mentoring• Workout and Restructuring• Business and Technical Support• Commercial and Industrial
Properties• Institutional Strengthening• Investee Companies Board
Representation• Fund Management Services
Product Portfolio
ClientsSMMEs and
Co-operatives
• Commercial Banks • Co-operative Financial Institutions (CFIs)• Microfinance Intermediaries (MFIs)• Retail Finance Intermediaries (RFIs)
• sefa Offices • sefa Co-locations • Strategic Partnerships
Distribution Channels
R500 – R5 MILLIONR50 000 – R5 MILLION
Distribution Channels and Products
Small Enterprise Finance Agency10
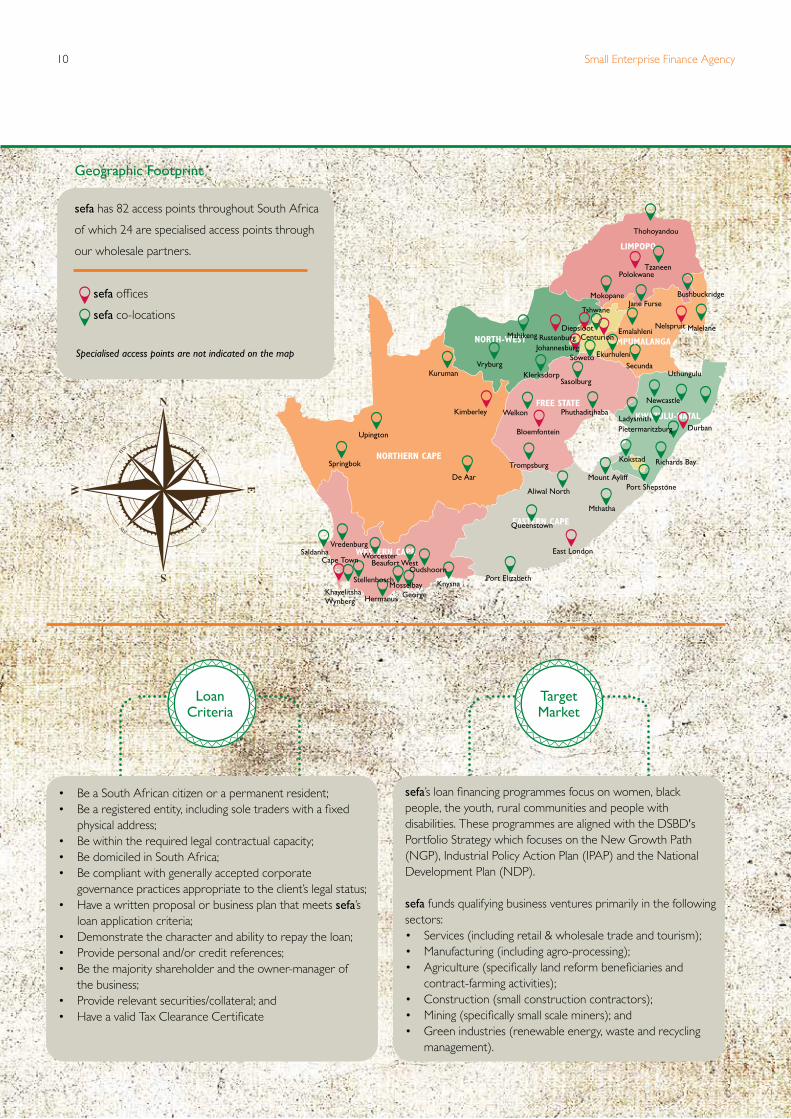
• Be a South African citizen or a permanent resident;• Be a registered entity, including sole traders with a fixed
physical address;• Be within the required legal contractual capacity;• Be domiciled in South Africa;• Be compliant with generally accepted corporate
governance practices appropriate to the client’s legal status;• Have a written proposal or business plan that meets sefa’s
loan application criteria;• Demonstrate the character and ability to repay the loan;• Provide personal and/or credit references;• Be the majority shareholder and the owner-manager of
the business;• Provide relevant securities/collateral; and• Have a valid Tax Clearance Certificate
sefa’s loan financing programmes focus on women, black people, the youth, rural communities and people with disabilities. These programmes are aligned with the DSBD's Portfolio Strategy which focuses on the New Growth Path (NGP), Industrial Policy Action Plan (IPAP) and the National Development Plan (NDP).
sefa funds qualifying business ventures primarily in the following sectors:• Services (including retail & wholesale trade and tourism);• Manufacturing (including agro-processing);• Agriculture (specifically land reform beneficiaries and
contract-farming activities);• Construction (small construction contractors);• Mining (specifically small scale miners); and• Green industries (renewable energy, waste and recycling
management).
Geographic Footprint
sefa has 82 access points throughout South Africa
of which 24 are specialised access points through
our wholesale partners.
sefa offices
sefa co-locations
Loan Criteria
TargetMarket
Thohoyandou
BushbuckridgeJane Furse
Mokopane
Malelane
MPUMALANGA
LIMPOPO
NORTH-WEST
FREE STATE
NORTHERN CAPE
EASTERN CAPE
KWAZULU-NATAL
WESTERN CAPE
NelspruitEmalahleni
SecundaEkurhuleniSoweto
SasolburgUthungulu
Newcastle
Durban
Richards BayKokstad
Port ShepstoneMount Ayliff
Mthatha
LadysmithPietermaritzburg
Phuthaditjhaba
Bloemfontein
Trompsburg
Aliwal North
De Aar
Springbok
Upington
Queenstown
East London
Port ElizabethKnysna
GeorgeHermanus
StellenboschMosselbay
OudshoornWestBeaufort
WorcesterVredenburg
Cape TownSaldanha
KhayelitshaWynberg
WelkonKimberley
Kuruman
Tshwane
TzaneenPolokwane
DiepslootRustenburgMahikeng
KlerksdorpVryburg
JohannesburgCenturion
Specialised access points are not indicated on the map

11Annual Report 2017
In a response to contribute to the reduction of poverty, inequality and unemployment eleven strategic objectives have been identified. A corporate balanced scorecard is used to measure the impact of implementing strategic objectives against the desired outcomes.
Customer Perspective
Increase access to credit and
finance
Consolidate Direct Lending
activities
Building sefa financial
sustainability
Development, optimisation and motivation of human capital
Build a high-performance organisation
Build strategic partnerships
Improved turnaround times for
applications
Build one sefa culture
Increase the uptake of the
credit guarantee scheme
Grow clientbase
People, Learning and Growth Perspective
Business Process Perspective
FinancialPerspective
Report on the Performance against Pre-determinedObjectives
Access to finance by SMMEs and Co-operatives and developmental impact
Improve turnaround times for loan applications
Development, optimisation and motivation of human capital
Building sefa's financial sustainability
Small Enterprise Finance Agency12
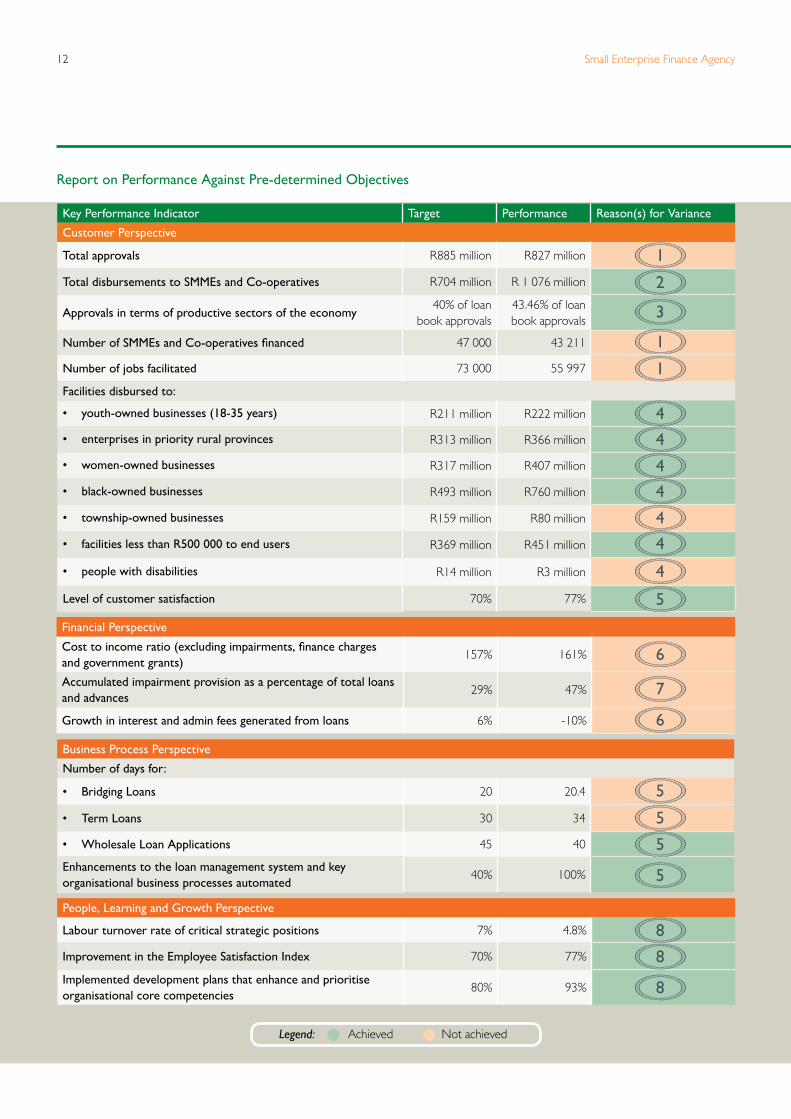
Key Performance Indicator Target Performance Reason(s) for Variance
Customer Perspective
Total approvals R885 million R827 million
Total disbursements to SMMEs and Co-operatives R704 million R 1 076 million
Approvals in terms of productive sectors of the economy40% of loan
book approvals43.46% of loan book approvals
Number of SMMEs and Co-operatives financed 47 000 43 211
Number of jobs facilitated 73 000 55 997
Facilities disbursed to:
• youth-owned businesses (18-35 years) R211 million R222 million
• enterprises in priority rural provinces R313 million R366 million
• women-owned businesses R317 million R407 million
• black-owned businesses R493 million R760 million
• township-owned businesses R159 million R80 million
• facilities less than R500 000 to end users R369 million R451 million
• people with disabilities R14 million R3 million
Level of customer satisfaction 70% 77%
Financial Perspective
Cost to income ratio (excluding impairments, finance charges and government grants)
157% 161%
Accumulated impairment provision as a percentage of total loans and advances
29% 47%
Growth in interest and admin fees generated from loans 6% -10%
Business Process Perspective
Number of days for:
• Bridging Loans 20 20.4
• Term Loans 30 34
• Wholesale Loan Applications 45 40
Enhancements to the loan management system and key organisational business processes automated
40% 100%
People, Learning and Growth Perspective
Labour turnover rate of critical strategic positions 7% 4.8%
Improvement in the Employee Satisfaction Index 70% 77%
Implemented development plans that enhance and prioritise organisational core competencies
80% 93%
Legend: Achieved Not achieved
1
1
1
6
6
2
3
4
4
4
4
4
4
4
5
5
5
5
5
8
8
8
7
Report on Performance Against Pre-determined Objectives
13Annual Report 2017
1) Total approval targets were not achieved due to the following underperforming facilities:
• Funding targets relating to Co-operative Financial Institutions for on-lending to individual members were not met due to a lack of viable loan applications being received. This facility has a limited market capacity that is sensitive to the macroeconomic environment.
• Indemnities issued under the Khula Credit Guarantee Scheme did not meet approval targets. This scheme has two distinctive products where one of the two products was subject to refinement during the year whilst the other continues the pilot phase of its implementation project.
Both of these facilities are focused at smaller loans which would finance a higher number of businesses and create jobs accordingly. The under achievement in the approvals of these two product lines extends to an under performance in the number of businesses financed as well as the number of jobs created.
2) The over performance of R372 million on disbursements relates to Wholesale Loans where revolving facilities are issued to financial intermediaries. These intermediaries would turn their loan book/ facility three to four times a year.
3) The strategic objective to build and maintain key partnerships contributed to more than 40% of approvals relating to productive sectors of the economy. Collaborations with strategic partners relating to focused areas expanded sefa's reach. Refer to the Wholesale Lending section for more information on such partnerships.
4) sefa remained focused on its mandate and the National Development Plan 2030 during the year and aligned its strategic objectives accordingly.
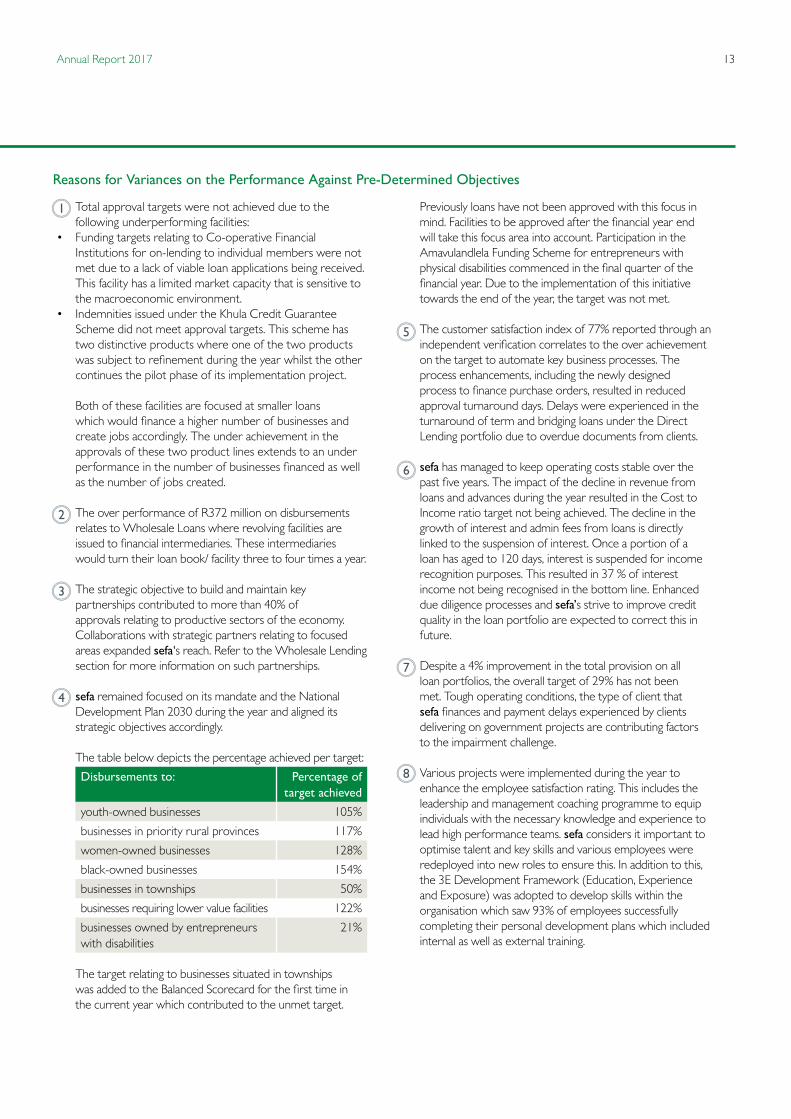
The table below depicts the percentage achieved per target:
Disbursements to: Percentage of target achieved
youth-owned businesses 105%
businesses in priority rural provinces 117%
women-owned businesses 128%
black-owned businesses 154%
businesses in townships 50%
businesses requiring lower value facilities 122%
businesses owned by entrepreneurs with disabilities
21%
The target relating to businesses situated in townships was added to the Balanced Scorecard for the first time in the current year which contributed to the unmet target.
Previously loans have not been approved with this focus in mind. Facilities to be approved after the financial year end will take this focus area into account. Participation in the Amavulandlela Funding Scheme for entrepreneurs with physical disabilities commenced in the final quarter of the financial year. Due to the implementation of this initiative towards the end of the year, the target was not met.
5) The customer satisfaction index of 77% reported through an independent verification correlates to the over achievement on the target to automate key business processes. The process enhancements, including the newly designed process to finance purchase orders, resulted in reduced approval turnaround days. Delays were experienced in the turnaround of term and bridging loans under the Direct Lending portfolio due to overdue documents from clients.
6) sefa has managed to keep operating costs stable over the past five years. The impact of the decline in revenue from loans and advances during the year resulted in the Cost to Income ratio target not being achieved. The decline in the growth of interest and admin fees from loans is directly linked to the suspension of interest. Once a portion of a loan has aged to 120 days, interest is suspended for income recognition purposes. This resulted in 37 % of interest income not being recognised in the bottom line. Enhanced due diligence processes and sefa’s strive to improve credit quality in the loan portfolio are expected to correct this in future.
7) Despite a 4% improvement in the total provision on all loan portfolios, the overall target of 29% has not been met. Tough operating conditions, the type of client that sefa finances and payment delays experienced by clients delivering on government projects are contributing factors to the impairment challenge.
8) Various projects were implemented during the year to enhance the employee satisfaction rating. This includes the leadership and management coaching programme to equip individuals with the necessary knowledge and experience to lead high performance teams. sefa considers it important to optimise talent and key skills and various employees were redeployed into new roles to ensure this. In addition to this, the 3E Development Framework (Education, Experience and Exposure) was adopted to develop skills within the organisation which saw 93% of employees successfully completing their personal development plans which included internal as well as external training.
1
5
7
3
2
6
8
4
Reasons for Variances on the Performance Against Pre-Determined Objectives

Small Enterprise Finance Agency14
Enterprise Risk Management (ERM) is a holistic, integrated approach to managing risk exposures strategically. The Committee of Sponsoring Organisations (COSO) defines ERM as: “A process, effected by the entity’s Board of Directors, management and other personnel, applied in strategy-setting across the enterprise, designed to identify potential events that may affect the entity, and manage risk to be within its risk appetite, to provide reasonable assurance regarding the achievement of entity objectives.”
sefa distinguishes between strategic risks and operational risks. Strategic risks are viewed as those inherent to sefa’s strategic intent and operating environment.
Context Mitigations
1. Risk of collections and high impairments
In consideration of sefa’s target market, it is paramount to have a higher risk tolerance than our commercial competitors.
• Daily monitoring of collections• Credit Bureau Listings
2. Internal and external fraud
The risk of fraud is inherent to providing financial assistance. Instances where external parties attempted to defraud sefa by presenting fraudulent purchase orders were identified during the year.
• Fraud and corruption prevention plan• Training and awareness sessions
3. Business disruption and system failure
sefa places significant reliance on electronic systems. Inability to access these systems will lead to loss of productivity which will be a critical hindrance to the attainment of sefa’s strategic imperatives.
• Comprehensive backups done daily• Warranty and maintenance of hardware
4. High business failure (Challenging economic operating environment for SMMEs and Co-operatives)
The constrained performance of the South African economy not only presents challenges for sefa but for the small business sector as a whole.
• Stringent portfolio monitoring• Business support and mentorship
5. Inability to scale up development impact and leverage funding
sefa faces limitations in timeously scaling up developmental impact in all identified areas.
• Creation of new partnerships• Utilisation of other partner’s infrastructure
6. Inadequate financial strength to meet sefa’s mandate
sefa’s financial sustainability is at risk if there is inadequate quality growth on the loan portfolio and the losses resulting from the high risk operating segment is not recovered.
• Grant funding• Investment Management Committee
7. Inadequate skills and competencies
The legacy aspect of merged entities continues to have a adverse impact on sefa skills and competencies.
• Performance Management Workshops• Ongoing training and development of investment officers
8. Non-compliance to applicable regulatory requirements
sefa strives to comply with all relevant legislation that is articulated in its risk universe. The introduction of new legislation might present an area of new risk to the organisation.
• Regulatory reporting• Ongoing compliance training
Enterprise Risk Management and Compliance
15Annual Report 2017
Context Mitigations
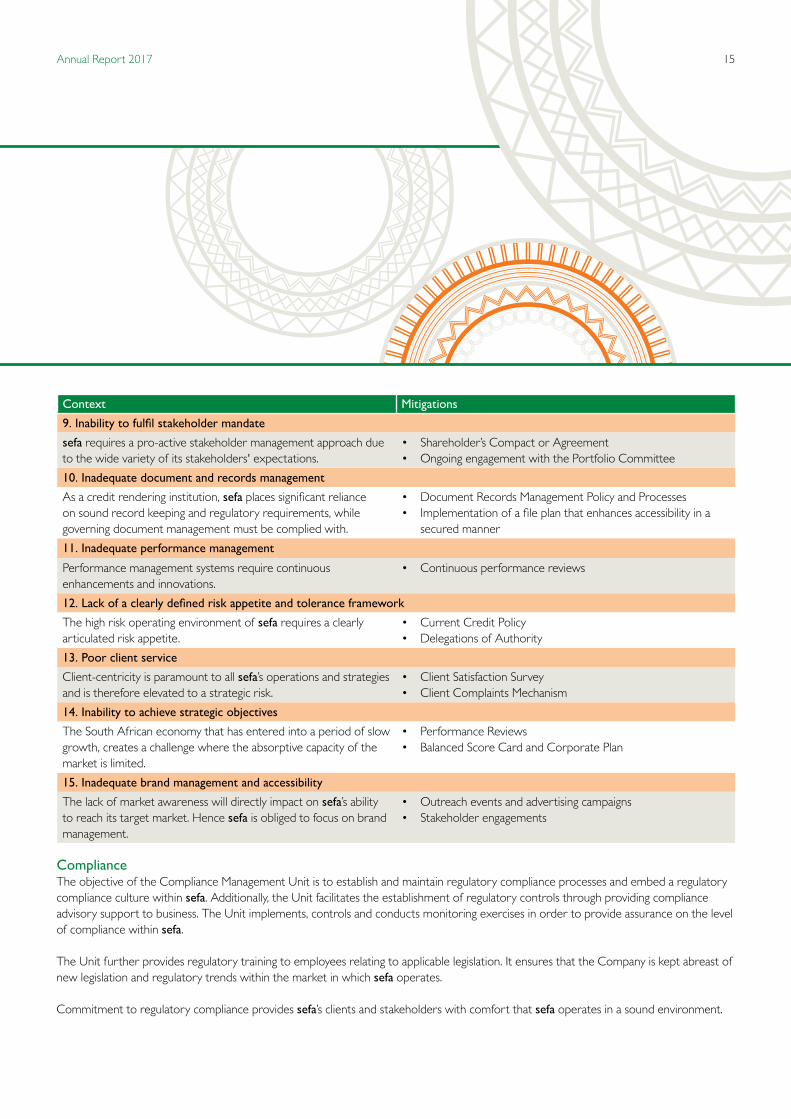
9. Inability to fulfil stakeholder mandate
sefa requires a pro-active stakeholder management approach due to the wide variety of its stakeholders' expectations.
• Shareholder’s Compact or Agreement• Ongoing engagement with the Portfolio Committee
10. Inadequate document and records management
As a credit rendering institution, sefa places significant reliance on sound record keeping and regulatory requirements, while governing document management must be complied with.
• Document Records Management Policy and Processes• Implementation of a file plan that enhances accessibility in a
secured manner
11. Inadequate performance management
Performance management systems require continuous enhancements and innovations.
• Continuous performance reviews
12. Lack of a clearly defined risk appetite and tolerance framework
The high risk operating environment of sefa requires a clearly articulated risk appetite.
• Current Credit Policy• Delegations of Authority
13. Poor client service
Client-centricity is paramount to all sefa’s operations and strategies and is therefore elevated to a strategic risk.
• Client Satisfaction Survey• Client Complaints Mechanism
14. Inability to achieve strategic objectives
The South African economy that has entered into a period of slow growth, creates a challenge where the absorptive capacity of the market is limited.
• Performance Reviews• Balanced Score Card and Corporate Plan
15. Inadequate brand management and accessibility
The lack of market awareness will directly impact on sefa’s ability to reach its target market. Hence sefa is obliged to focus on brand management.
• Outreach events and advertising campaigns• Stakeholder engagements
Compliance The objective of the Compliance Management Unit is to establish and maintain regulatory compliance processes and embed a regulatory compliance culture within sefa. Additionally, the Unit facilitates the establishment of regulatory controls through providing compliance advisory support to business. The Unit implements, controls and conducts monitoring exercises in order to provide assurance on the level of compliance within sefa.
The Unit further provides regulatory training to employees relating to applicable legislation. It ensures that the Company is kept abreast of new legislation and regulatory trends within the market in which sefa operates.
Commitment to regulatory compliance provides sefa’s clients and stakeholders with comfort that sefa operates in a sound environment.
Small Enterprise Finance Agency16
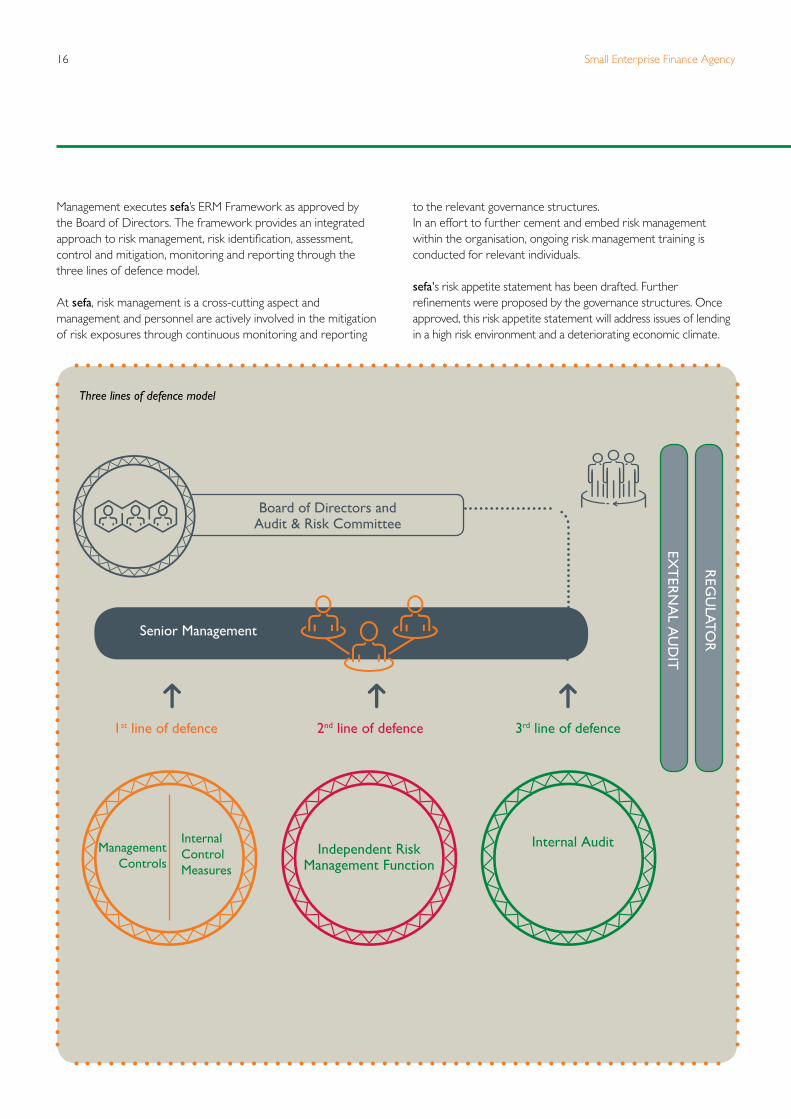
Management executes sefa’s ERM Framework as approved by the Board of Directors. The framework provides an integrated approach to risk management, risk identification, assessment, control and mitigation, monitoring and reporting through the three lines of defence model.
At sefa, risk management is a cross-cutting aspect and management and personnel are actively involved in the mitigation of risk exposures through continuous monitoring and reporting
to the relevant governance structures. In an effort to further cement and embed risk management within the organisation, ongoing risk management training is conducted for relevant individuals.
sefa's risk appetite statement has been drafted. Further refinements were proposed by the governance structures. Once approved, this risk appetite statement will address issues of lending in a high risk environment and a deteriorating economic climate.
Board of Directors and Audit & Risk Committee
1st line of defence 2nd line of defence
Independent Risk Management Function
Internal Control Measures
Management Controls
Senior Management
3rd line of defence
Internal Audit
EXT
ERN
AL A
UD
IT
REG
ULATO
R
Three lines of defence model
17Annual Report 2017
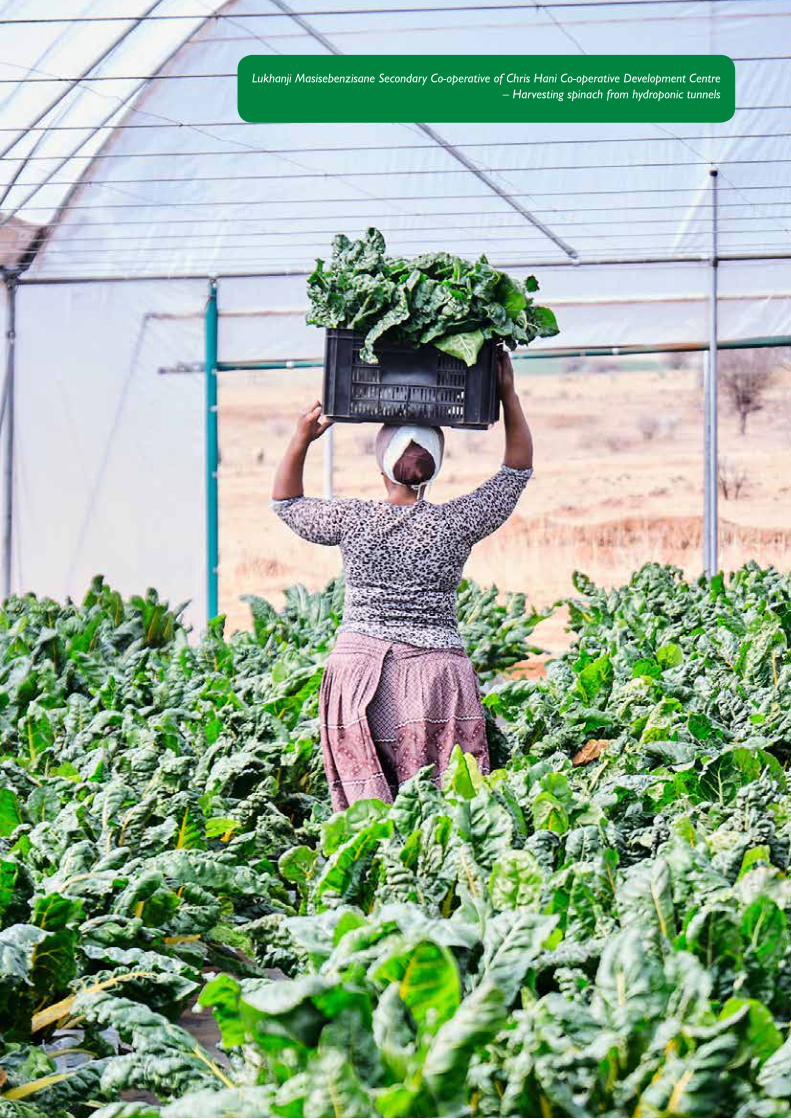
Lukhanji Masisebenzisane Secondary Co-operative of Chris Hani Co-operative Development Centre – Harvesting spinach from hydroponic tunnels

Small Enterprise Finance Agency18
It is an honour and privilege to be delivering this statement on behalf of the New Board that was inaugurated in November 2016. I am pleased to be issuing this statement at the time when the Board has settled and beginning to add strategic value at various levels within the sefa organisation. I thank my fellow Board Members for accepting the challenge to assist, drive and provide the necessary guidance to this growing organisation.
sefa's Operating Environment and StrategyThe subdued economic activity that resulted in the real gross domestic product growth of just 0.3% has negatively affected growth and business certainty. Undoubtedly, these conditions continued to weigh heavily on business and consumer confidence which resulted in undesirable trading conditions in the small business sector.
In an attempt to address these conditions, sefa embarked on targeted interventions aimed at mitigating market failures experienced by the small business sector. This process unearthed the development of a range of innovative loan product offerings geared at ensuring that sefa-funded businesses remain active. To this end, negotiated repayment arrangements were entered into with clients that were in good standing but struggling with the management of their cash flow cycles.
In addition, sefa assisted qualifying businesses to explore value chain opportunities in sectors such as construction, transport, agro-processing, manufacturing and green industries. This is acknowledging that sefa is a prominent player in building, growing and supporting the SMME and Co-operative sector. This we do by unlocking the latent potential in small businesses, thus enabling them to effectively participate in key sector value chains.
GovernanceThe Board is confident that sefa upholds high standards of corporate governance and complies with relevant legislation to ensure that its business is sustained. Governance processes are periodically reviewed in line with legislative and regulatory changes to ensure that these always reflect best practice.
HN Lupuwana-Pemba
Chairperson’sStatement
19Annual Report 2017
Internal skills levels are continuously assessed to ensure the achievement of the vision and strategies set by the Board of Directors and sefa’s mandate. sefa is committed to continuous up-skilling, especially in the Direct Lending and Innovative Product business areas. These skills are crucial to respond appropriately to the evolving needs of our target market.
In line with this, sefa’s Executive Authority the Department of Small Business Development, and its Shareholder the IDC will continue to provide constructive support and strategic direction to sefa.
The Board has delegated some of its functions to the following four Committees: The Audit & Risk Committee, Credit & Investment Committee, Human Capital & Remuneration Committee and Social & Ethics Committee. These Committees provide regular reports to the Board on their respective roles and responsibilities.
Strategic Performancesefa is entrusted with executing an important task of servicing and invariably developing a critical sector that is widely regarded as the backbone of the South African economy and to improving economic growth and addressing socio-economic challenges currently besetting South Africa.
The implementation of innovative interventions structured to address the needs of SMMEs and Co-operatives in remote areas and targeted sectors through strategic partnerships, have attracted unforeseen challenges. Subsequent lessons learnt from these challenges will be taken in consideration when new strategic partnerships are formed. Programmes rolled out under these partnerships will be subject to a pilot phase where challenges can pro-actively be identified and addressed.
To this end, let me reiterate that sefa will continue to grow its reach and coverage; and business performance whilst focusing on achieving high level of collections on loans and property rentals, low impairments and reduced operational costs as highlighted in the CEO’s statement. In this regard, the Board continues to deal with matters affecting sefa’s sustainability in the long term.
Outlook The sefa Board is charged with the responsibility of ensuring that management adheres to sound corporate governance standards, and we note that this continues to be achieved by the business.The sefa business system is carefully managed with strategic, business and risk matters being judiciously executed, monitored and evaluated.
However, the Board believes that management has to continue strengthening business processes and strategies as they respond to the growing execution challenges, compounded by slow economic recovery, recent downgrades and related business challenges. Particularly concerning is the weak and subdued outlook in the economic front, with a modest improvement anticipated in 2017 where real GDP growth is forecast to grow at a mere 1%. Against this backdrop, sefa is expected to continue to improve its performance, contain costs, grow its revenue and ensure business is supported by reliable information technology systems. In addition, sefa will stay focused on aligning its performance with government policy outcomes.
AppreciationOn behalf of the Board, I hereby convey my gratitude to the Honourable Minister Lindiwe Zulu for her constructive guidance and support. I am also grateful to our Shareholder, the IDC for its continued support. I also acknowledge the former Board of Directors, who steered this ship over the previous years until their retirement at the end of October 2016.
To my fellow Board Members, I express my appreciation for your resolute commitment and focus on sefa’s strategic priorities during these tough market and economic conditions. I also extend the Board’s unreserved appreciation to the CEO, Mr Thakhani Makhuvha and his executive team for the resilient performance during these challenging times.
HN Lupuwana-Pemba Board Chairperson
“sefa remains focused on pursuing beneficial partnerships that support its mandate so that it can impact positively on the lives of South Africans and broader beneficiaries of its services.”

Small Enterprise Finance Agency20
Board of Directors
ChairpersonHN Lupuwana-Pemba (48)Chairperson: Board of Directors• MBA (UP)• B Soc Sc (UCT)• Senior Executives Programme (IMD International-Switzerland)• Associate in Management (UCT)
Executive DirectorTR Makhuvha (48)Chief Executive Officer• MCom Financial Management (UJ)• BCompt (Hons) (UNISA)• BCom Accounting (UNIVEN)• Leadership Development Programme (GIBS)
Independent Non-Executive DirectorsNA Dlamini (44)Chairperson: Social & Ethics Committee• Bachelor of Law (UNISWA)• Certificate in Banking (UNISA)• B-BBEE Management Development Programme (UNISA)
C Groves (58) (Picture not available)Chairperson: Human Capital & Remuneration Committee• MBA (GSB-UCT) • Diploma in SME Management and Development (GIMI)• Leadership and Mentorship (UCT)
LB Mavundla (52)• Business Management (Cranefield College-UK)• Chamber Management (CIPE-USA)• Business Management and Development (Swedish Chamber)
K Molewa (36)• LLB Honours (Wits) • MCom (UCT)
CIC HCRC
ARC HCRC
CIC SEC
SEC
CIC SEC
CIC Credit & Investment Committee SEC Social & Ethics Committee
1
5
6
2
3
4
1 2 3 65
21Annual Report 2017
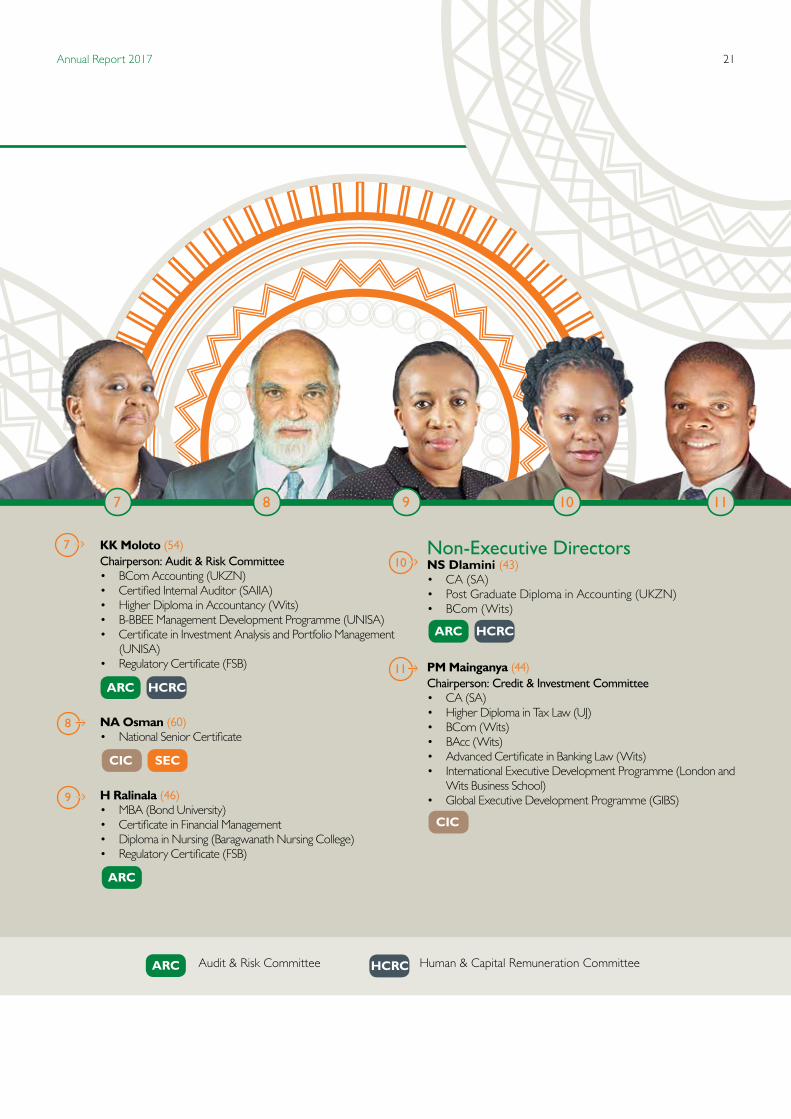
KK Moloto (54)Chairperson: Audit & Risk Committee• BCom Accounting (UKZN)• Certified Internal Auditor (SAIIA)• Higher Diploma in Accountancy (Wits)• B-BBEE Management Development Programme (UNISA)• Certificate in Investment Analysis and Portfolio Management
(UNISA)• Regulatory Certificate (FSB)
NA Osman (60) • National Senior Certificate
H Ralinala (46)• MBA (Bond University)• Certificate in Financial Management• Diploma in Nursing (Baragwanath Nursing College)• Regulatory Certificate (FSB)
Non-Executive DirectorsNS Dlamini (43)• CA (SA) • Post Graduate Diploma in Accounting (UKZN)• BCom (Wits)
PM Mainganya (44)Chairperson: Credit & Investment Committee• CA (SA)• Higher Diploma in Tax Law (UJ)• BCom (Wits)• BAcc (Wits)• Advanced Certificate in Banking Law (Wits)• International Executive Development Programme (London and
Wits Business School)• Global Executive Development Programme (GIBS)
CIC
ARC
ARC HCRC
ARC HCRC
CIC SEC
ARC Audit & Risk Committee HCRC Human & Capital Remuneration Committee
10
11
8
9
7
7 8 9 1110
Small Enterprise Finance Agency22
Corporate Governance Report
Governance The Board acknowledges its role in leading by example and setting the tone for ethical behaviour and compliance with best corporate governance practices. sefa continues to improve and strengthen the application of the recommended best governance practices, and is committed to principles of responsibility, fairness, accountability, and transparency. Awareness of the new King IV Report of Corporate Governance for South Africa 2016 (King IV) has been created organisation-wide. The roll-out of King IV application on sefa processes is underway.
Composition of the Board The Board comprises of eleven directors, eight of whom are Independent Non-Executive Directors and one Executive Director. The majority of the Directors were appointed by the Minister of Small Business Development. The Board is appointed for a three year term effective 1 October 2016.
The Role of the Board The Chairperson of the Board is an independent non-executive director who is appointed by the Minister of Small Business Development. The Chairperson leads the Board and ensures the effective discharge of its responsibilities. No individual director has unfettered powers in relation to decision making. The Chairperson presides over Board meetings and ensures parity of decision making.
The Board provides strategic leadership and guidance to the Company. The Board is ultimately responsible for governance and effective control of sefa. It is responsible for providing sound judgement in directing sefa to achieve its mandate and growth in the best interests of all its stakeholders. The Board functions in accordance with governance principles and ensures compliance with the PFMA, and the Companies Act 71 of 2008 (the Companies Act) and all applicable laws and regulations.
The Board fulfils inter alia, the following roles and functions: • Review and approve strategic plans, budgets and annual
performance plans as proposed by management; • Review and approve policies; • Review processes for the identification and management
of business risk and processes for compliance with key regulatory and legal requirements;
• Provide oversight on performance against targets and objectives;
• Reports to the Executive Authority and the Shareholder on the direction, governance and performance of the Company, including any matter that needs reporting or disclosure in terms of legal requirements.
Conflicts of Interest The Board applies the provisions of the Companies Act by disclosing, and avoiding conflicts of interests. Directors are required to declare their general interests annually and at each meeting in accordance with the Companies Act.
Board Induction To familiarise the newly appointed directors with sefa and its operations, and induction workshop was held on 21 November 2016.
Board Remuneration Non-Executive Directors remuneration is based on meetings attendance, and other ad hoc non-meeting duties performed on behalf of the Company, at the rate which has been approved by the Shareholder. No performance-based remuneration or retainer fees are paid to Directors.
Directors’ emoluments for the year under review are disclosed in the annual financial statements on page 126.
Board CommitteesThe Board has delegated certain of its functions to the committees set out below, whilst retaining its responsibility in relation to the delegated tasks. Committee members were nominated by the Board based on qualifications and expertise.
The composition of the Board Committees was reviewed and the following changes were made during November 2016:• The Audit & Enterprise Risk Committees were merged into
the Audit & Risk Committee;• The Wholesale Lending & Direct Lending Committees were
merged into the Credit & Investment Committee.
23Annual Report 2017
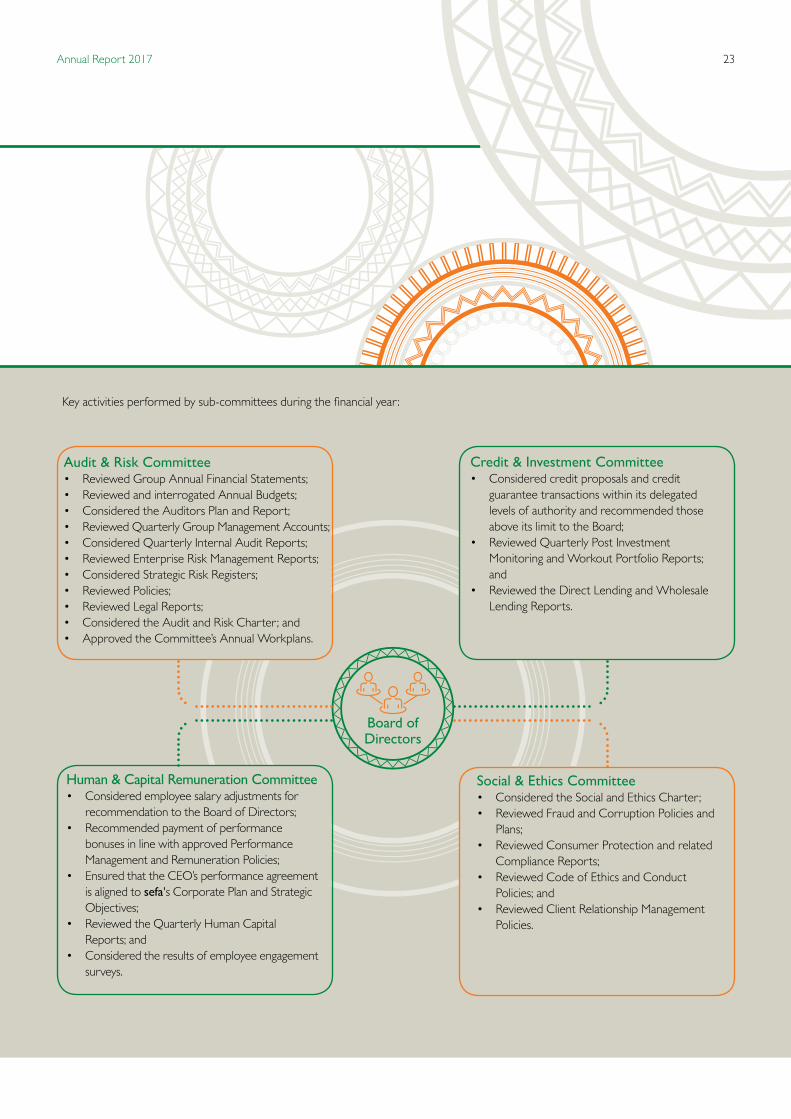
Key activities performed by sub-committees during the financial year:
Board of Directors
Audit & Risk Committee• Reviewed Group Annual Financial Statements;• Reviewed and interrogated Annual Budgets;• Considered the Auditors Plan and Report;• Reviewed Quarterly Group Management Accounts;• Considered Quarterly Internal Audit Reports;• Reviewed Enterprise Risk Management Reports;• Considered Strategic Risk Registers;• Reviewed Policies;• Reviewed Legal Reports;• Considered the Audit and Risk Charter; and• Approved the Committee’s Annual Workplans.
Human & Capital Remuneration Committee• Considered employee salary adjustments for
recommendation to the Board of Directors;• Recommended payment of performance
bonuses in line with approved Performance Management and Remuneration Policies;
• Ensured that the CEO’s performance agreement is aligned to sefa's Corporate Plan and Strategic Objectives;
• Reviewed the Quarterly Human Capital Reports; and
• Considered the results of employee engagement surveys.
Credit & Investment Committee• Considered credit proposals and credit
guarantee transactions within its delegated levels of authority and recommended those above its limit to the Board;
• Reviewed Quarterly Post Investment Monitoring and Workout Portfolio Reports; and
• Reviewed the Direct Lending and Wholesale Lending Reports.
Social & Ethics Committee• Considered the Social and Ethics Charter;• Reviewed Fraud and Corruption Policies and
Plans;• Reviewed Consumer Protection and related
Compliance Reports;• Reviewed Code of Ethics and Conduct
Policies; and• Reviewed Client Relationship Management
Policies.
Small Enterprise Finance Agency24
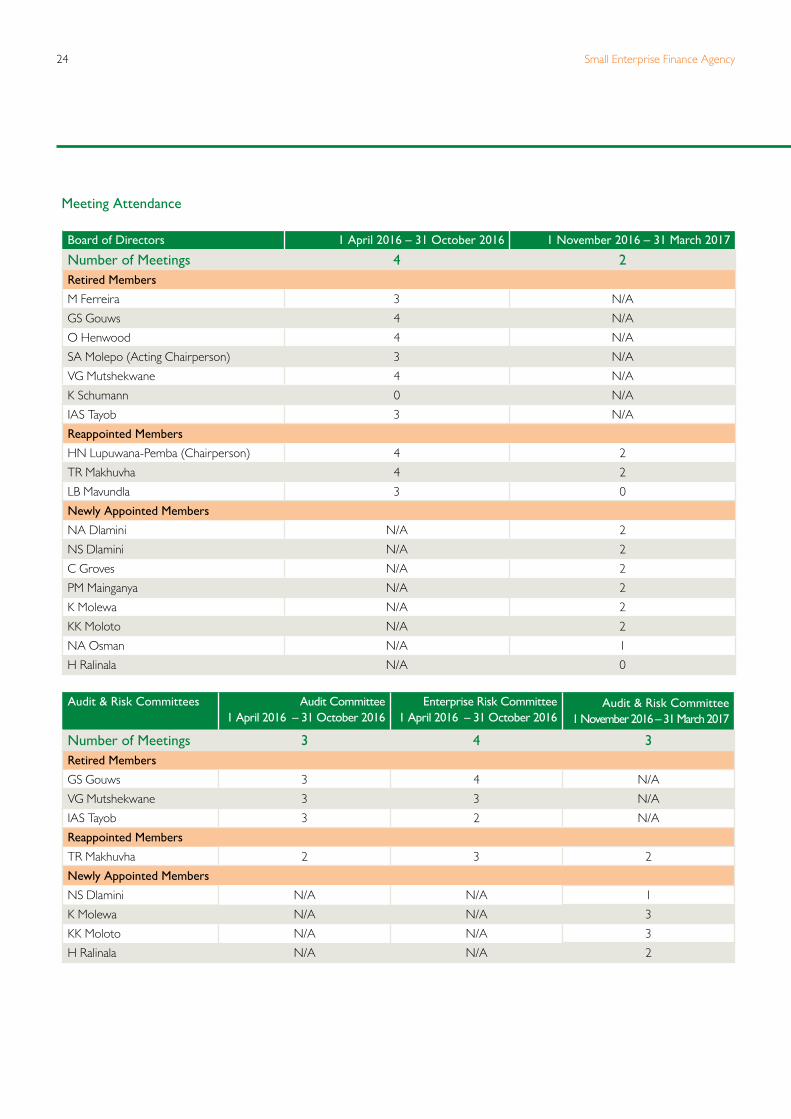
Meeting Attendance
Board of Directors 1 April 2016 – 31 October 2016 1 November 2016 – 31 March 2017
Number of Meetings 4 2Retired Members
M Ferreira 3 N/A
GS Gouws 4 N/A
O Henwood 4 N/A
SA Molepo (Acting Chairperson) 3 N/A
VG Mutshekwane 4 N/A
K Schumann 0 N/A
IAS Tayob 3 N/A
Reappointed Members
HN Lupuwana-Pemba (Chairperson) 4 2
TR Makhuvha 4 2
LB Mavundla 3 0
Newly Appointed Members
NA Dlamini N/A 2
NS Dlamini N/A 2
C Groves N/A 2
PM Mainganya N/A 2
K Molewa N/A 2
KK Moloto N/A 2
NA Osman N/A 1
H Ralinala N/A 0
Audit & Risk Committees Audit Committee 1 April 2016 – 31 October 2016
Enterprise Risk Committee 1 April 2016 – 31 October 2016
Audit & Risk Committee1 November 2016 – 31 March 2017
Number of Meetings 3 4 3Retired Members
GS Gouws 3 4 N/A
VG Mutshekwane 3 3 N/A
IAS Tayob 3 2 N/A
Reappointed Members
TR Makhuvha 2 3 2
Newly Appointed Members
NS Dlamini N/A N/A 1
K Molewa N/A N/A 3
KK Moloto N/A N/A 3
H Ralinala N/A N/A 2
25Annual Report 2017
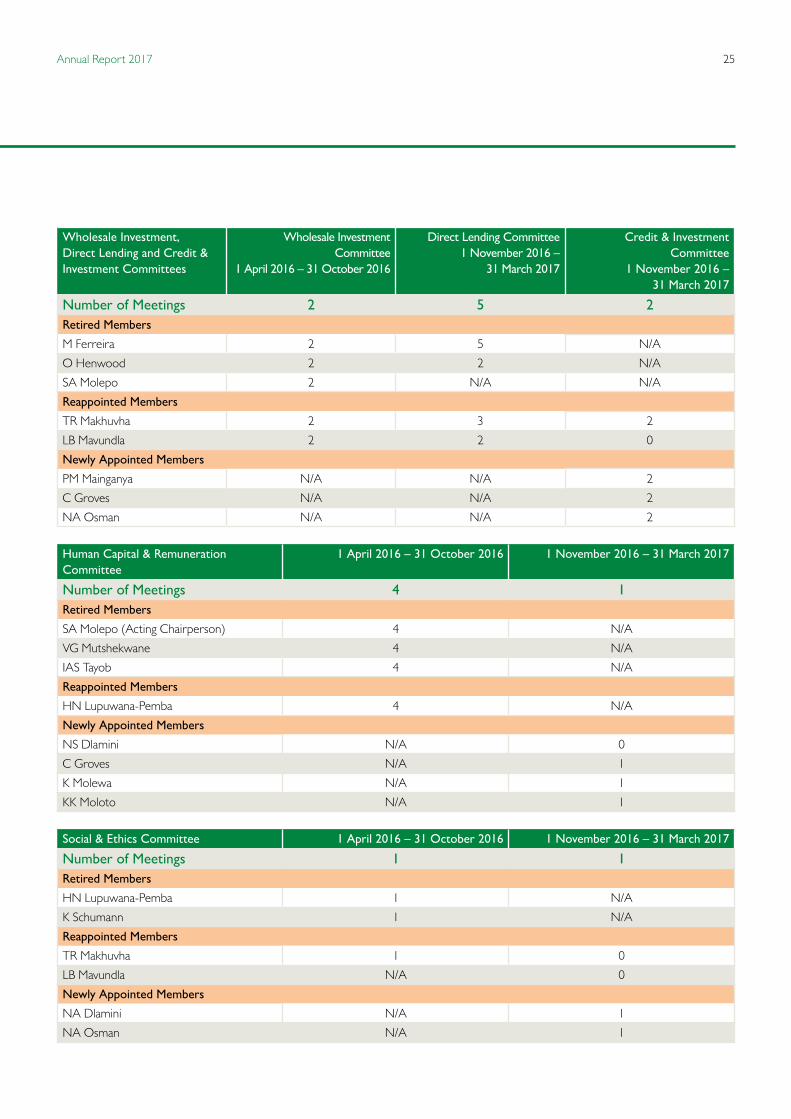
Wholesale Investment, Direct Lending and Credit & Investment Committees
Wholesale Investment Committee
1 April 2016 – 31 October 2016
Direct Lending Committee1 November 2016 –
31 March 2017
Credit & Investment Committee
1 November 2016 – 31 March 2017
Number of Meetings 2 5 2Retired Members
M Ferreira 2 5 N/A
O Henwood 2 2 N/A
SA Molepo 2 N/A N/A
Reappointed Members
TR Makhuvha 2 3 2
LB Mavundla 2 2 0
Newly Appointed Members
PM Mainganya N/A N/A 2
C Groves N/A N/A 2
NA Osman N/A N/A 2
Human Capital & Remuneration Committee
1 April 2016 – 31 October 2016 1 November 2016 – 31 March 2017
Number of Meetings 4 1Retired Members
SA Molepo (Acting Chairperson) 4 N/A
VG Mutshekwane 4 N/A
IAS Tayob 4 N/A
Reappointed Members
HN Lupuwana-Pemba 4 N/A
Newly Appointed Members
NS Dlamini N/A 0
C Groves N/A 1
K Molewa N/A 1
KK Moloto N/A 1
Social & Ethics Committee 1 April 2016 – 31 October 2016 1 November 2016 – 31 March 2017
Number of Meetings 1 1Retired Members
HN Lupuwana-Pemba 1 N/A
K Schumann 1 N/A
Reappointed Members
TR Makhuvha 1 0
LB Mavundla N/A 0
Newly Appointed Members
NA Dlamini N/A 1
NA Osman N/A 1

Small Enterprise Finance Agency26
The Audit & Risk Committee (ARC) has pleasure in submitting this report to the Shareholder as required by the Companies Act, 71 of 2008 (‘the Companies Act’), and as recommended by the King Report on Corporate Governance for South Africa (‘King IV’).
CompositionThe Board of Directors resolved to merge the Audit & Enterprise Risk Committees into the ARC. The Committee comprises of the following members: KK Moloto (Chairperson), NS Dlamini, K Molewa and H Ralinala.
The roles and responsibilities of the ARCThe ARC reports that it has complied with section 77 of the PFMA, and its responsibilities as contained in Treasury Regulation 3.1, the Companies Act, and the Short Term Insurance Act 53 of 1998 (STIA).
The ARC is satisfied that, during the year under review, it performed the functions required by law including those requirements as set out in Section 94 (7) of the Companies Act, Treasury Regulations 27.1.8 – 13, the PFMA, and the Short Term Insurance Act, 53 of 1998.
The ARC adopted a formal Charter which regulates its affairs, roles and responsibilities. It reports that it has discharged all its responsibilities as contained in the Charter.
These include inter alia:• Ensuring that the respective roles and functions of external
and internal audits are sufficiently clarified and coordinated and that the combined assurance received is appropriate in addressing all significant risks;
• Reviewing the effectiveness of the sefa Group systems of internal controls, policies, financial control and risk management systems, processes and procedures for detecting and preventing fraud;
• Reviewing and monitoring the effectiveness and performance of the internal audit function, its standing, staffing plans and audit plans to provide adequate support to enable the committee to meet its objectives;
• Ensuring that the scope of the internal audit function had no limitations imposed by management and that there was no impairment on its independence;
• Evaluating the independence, effectiveness and performance of the external auditors, and obtaining assurance from the auditors that adequate accounting records were being maintained and appropriate accounting principles were in place and had been consistently applied;
• Reviewing and approving the audit fee and fees in respect of any non-audit services, including the external audit plan;
• Reviewing the external auditor’s findings and reports submitted to management and the independence and objectivity of the external auditors;
• Reviewing the effectiveness of the finance function;
Report of the Audit & Risk Committee

27Annual Report 2017
• Reviewing the Annual Report, as well as Annual Financial Statements to ensure that they present a balanced, and true
position and performance of the Group;• Assisting the Board in its evaluation of the adequacy and
efficiency of the internal systems, accounting practices, information systems and auditing processes applied by the subsidiary short term insurer (Khula Credit Guarantee (SOC) Limited) in the day-to day management of its business;
• Assisting the Board in discharging its duties and responsibilities in respect of risk management; and
• Reviewing and advising on matters referred to the Committee by the Board.
Auditor Independence The ARC recognises the importance of maintaining the independence of both external and internal auditors and is satisfied that KPMG and the internal auditors are independent of management.
Financial ManagementThe ARC reviewed the annual financial statements of the Group and related information and it is satisfied that they comply with International Financial Reporting Standards (IFRS). In addition, the ARC has reviewed management’s assessment of going concern and recommended to the Board that the going concern concept be adopted by the Group.
ApprovalThe Committee recommended the approval of the annual financial statements to the Board of Directors.
On behalf of the ARC:
KK MolotoChairperson of the Audit & Risk Committee20 June 2017
Small Enterprise Finance Agency28
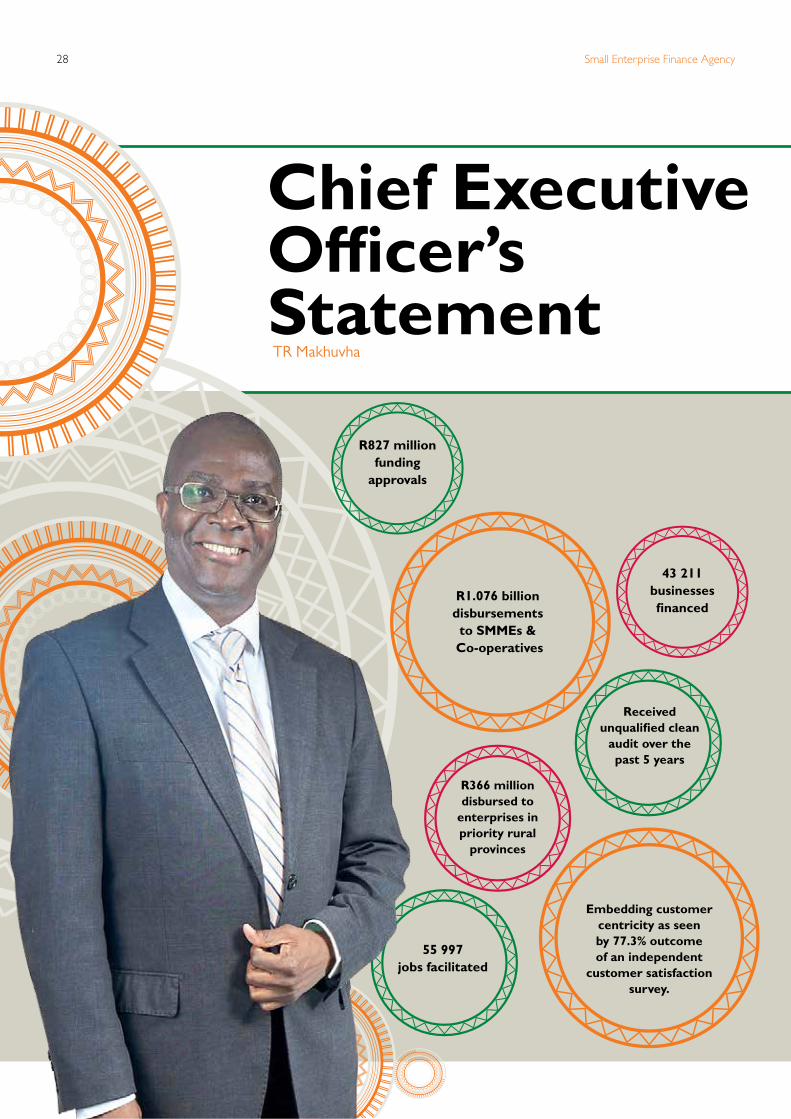
Chief Executive Officer’s StatementTR Makhuvha
R366 million disbursed to
enterprises in priority rural
provinces
Embedding customer centricity as seen by 77.3% outcome of an independent
customer satisfaction survey.
Received unqualified clean
audit over the past 5 years
R827 million funding
approvals
R1.076 billion disbursements to SMMEs &
Co-operatives
43 211businesses financed
55 997 jobs facilitated

29Annual Report 2017
sefa’s developmental impact has seen a significant growth since its establishment, with an injection of R822 million into the South African economy in the 2013/14 financial year, whilst a peak of R1.29 billion in disbursements was registered at the end of the 2014/15 financial year. During the year under review, disbursements reached R1.076 billion, relatively lower than R1.16 billion realised the year before. Nonetheless, sefa delivered on its mandate by achieving funding approvals to the value of R827 million, albeit at a lower level than R1.11 billion recorded in the previous year.
We are pleased that our funding support went a long way to enabling over 43 000 Small Micro and Medium Enterprises and Co-operatives realise their business dreams, thereby creating and preserving approximately 56 000 jobs. We anticipate that these performance levels could be sustained if the optimism demonstrated by South Africa’s key trading partners can be retained and domestically, the infrastructure investment continued.
In an attempt to contribute to the national policies such as the National Development Plan and Industrial Policy Action Plan, we approved R359 million in respect of the productive sectors of the economy. Furthermore, we are pleased to inform you that almost R366 million was disbursed to enterprises operating in the country’s priority provinces, R407 million shared by businesses run by women and just over R451 million was disbursed to entrepreneurs requiring less than R500 000.
Inherently, as an integral part of the recovery process, we are preparing our business capacity to ensure that we are ready to journey with SMMEs and Co-operatives to higher performance trajectories. We remain committed to growing the SMMEs and Co-operatives landscape by championing programmes that are aimed at building the capacity of all participants, especially those in the starting blocks.
In the pursuit of achieving the aforemention ideals, sefa, with the critical support from the Department of Small Business
Development, launched a scheme aimed at driving activity in developing and funding entrepreneurs with disabilities through a dedicated programme called Amavulandlela Funding Scheme towards the end of the financial year. The primary and overarching aim of this programme is to provide a focused financial support to this designated group that has been under-funded for many years. An initial injection of R30 million has been allocated to the Amavulandlela Funding Scheme and we expect to see more uptake of this scheme in the new financial year.
In addition, our offering and participation helped to facilitate faster turnaround times by recognising the challenges that most smaller entrepreneurs have to deal with. One of the products that focused on reducing turnaround times is the funding of purchase orders which has been initiated and is already enjoying acceptance by the market.
sefa continues to develop strategic partnerships with corporates and other financial institutions, in both the private and public sectors so as to increase its presence in underserved priority areas across the country. The case in point is the establishment of the Enterprise Supplier Development (ESD) partnerships with the private sector funders in order to assist the microenterprises without adequate collateral to access loans from the commercial banks.
Improved systems and monitoring disciplines remain critical for us to succeed in achieving our mandate. This includes the ability to measure more accurately the developmental impact in the various segments we are focused on. For instance, to achieve a better understanding on our impact in townships, we introduced an instrument that captures our support to enterprises operating in the townships. This added to existing indicators of our funding to productive sectors, priority rural areas and funding offered to entrepreneurs with disabilities.
I am pleased to report that sefa has consistently achieved an unqualified clean audit over the past five financial years.
“sefa has heeded the call to rise to the challenge of addressing market failures by financing SMMEs and Co-operatives that would not ordinarily obtain funding from commercial banks.”
Small Enterprise Finance Agency30
signature
Human Capital and Other Support FunctionsAs an organisation, we continue to invest in corporate-wide development and change management programs in our endeavour to build a performance driven organisation. I am comfortable to report on the positive outcome of how our clients view our services. We scored 77% on the annual client satisfaction survey which is independently conducted. We shall continue to make the necessary improvements on the concerns raised.
Risk and ComplianceGiven the inherent risks associated with the market we serve, we have an Enterprise Risk Management Framework in place to provide us with an integrated approach to manage risk. This Framework helps us to identify risks, assess, control, mitigate, monitor and provide reports regularly. Given the cross-cutting nature of the risks we face, both management and staff at large are constantly involved in mitigating risk exposures, monitor and report on a quarterly basis to relevant governance structures.
ChallengesDespite the achievements made, financing SMMEs and Co-operatives is marred with numerous challenges, with most stakeholders debating on the best approach to finance them so as to allow this sector to realise its potential.
sefa has heeded the call to rise to the challenge of addressing market failures by financing SMMEs and Co-operatives that would not ordinarily obtain funding from commercial banks. These are
businesses that are largely excluded due to their failure to meet certain loan criteria such as collateral, limited own contribution, business track-record, or having poor credit history. For instance, in our bid to close this gap and grant opportunity, we often waive the collateral requirements and find ourselves extending credit to entrepreneurs with adverse credit record provided that they have taken steps to rectify these negative records. Inadvertently, we often find ourselves having to spend added resources on account maintenance, collections improvements, and arresting the escalating impairments.
Impairment balances remain high despite the annual 4% improvement. We continued to intensify our collections strategy by establishing a dedicated Post Investment Monitoring & Restructuring (PIM) team over the reporting period.
In an endeavour to increase our services to SMMEs andCo-operatives, we are continuously introducing targeted programmes that are aimed at promoting the growth of enterprises run in the rural and township economies, as well as those encouraging higher participation of women, youth and people with disabilities.
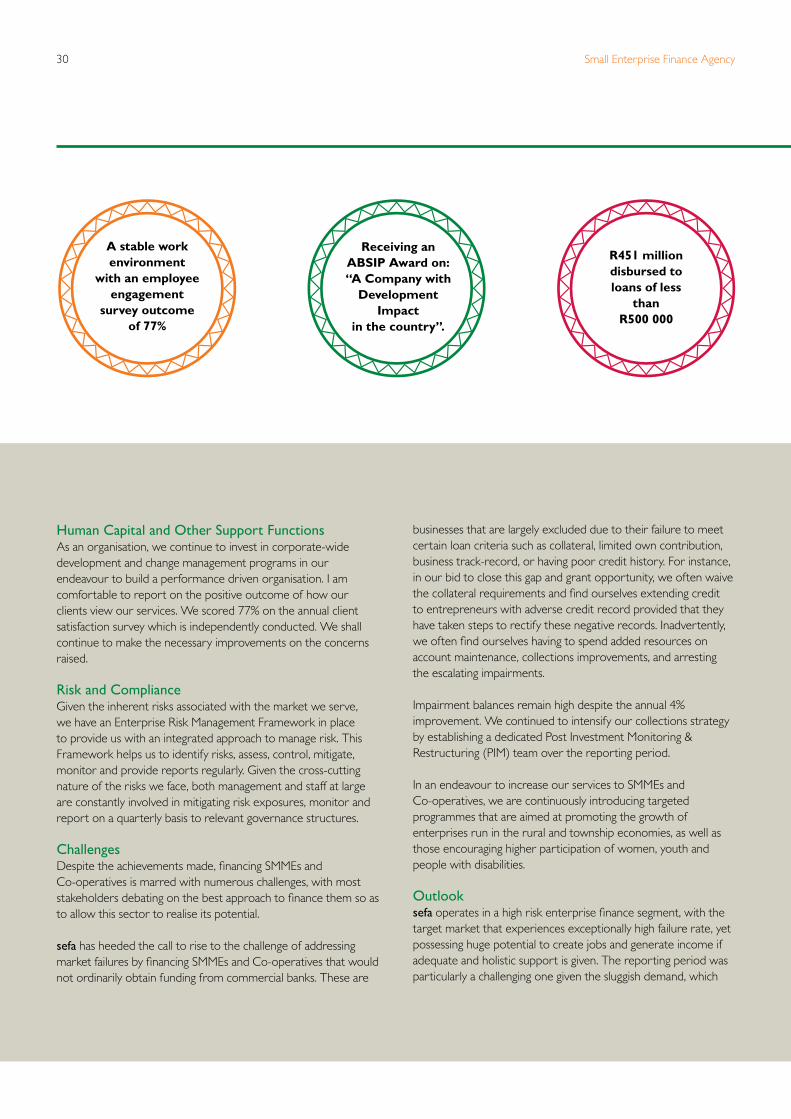
Outlooksefa operates in a high risk enterprise finance segment, with the target market that experiences exceptionally high failure rate, yet possessing huge potential to create jobs and generate income if adequate and holistic support is given. The reporting period was particularly a challenging one given the sluggish demand, which
A stable work environment
with an employee engagement
survey outcome of 77%
Receiving an ABSIP Award on: “A Company with
Development Impact
in the country”.
R451 million disbursed to loans of less
than R500 000
in turn resulted in our experiencing high impairments and low collections. In the 2017/18 financial year, our focus will be on the following:• Collaborative initiatives aimed at promoting investment in
loan distribution channels with a lower cost base. The case in point being strategic partnerships with banks and other commercial entities that have stronger balance sheets, lower operating costs and high development orientation;
• Efforts to leverage on grant funding. sefa is expecting the first tranche of the €30 million grant funding from the European Union SMME Support Programme;
• Focus on growing high quality investments with equally high developmental returns and credible risk mitigations;
• Diligent management of the sefa legacy properties portfolio. A great deal of work has been concluded such as identifying and classifying properties into viable and non-viable categories, and developing a corrective strategy. We will focus on implementing the strategy and ensuring that a turnaround is realised during 2017/18;
• Improving overall sustainability with clear focus on increasing revenues, collections improvement, impairments reduction and significant reduction in operational costs. These initiatives will include the implementation of an innovative approach to post investment management and workout and restructuring programmes; and
• To support SMMEs and Co-operatives to access the 30% set–aside on government procurement spend.
AcknowledgementsI hereby express my sincere gratitude to the Honourable Minister Lindiwe Zulu and the Department of Small Business Development for the continued support. With your guidance, we managed to assist more SMMEs and Co-operatives across the country.
I wish to thank the Chairperson of the Board, Ms Hlonela Lupuwana-Pemba and the entire Board of Directors for their support. My sincere appreciation goes to our Shareholder, the IDC, for the continuous assistance, since without your commitment, the milestones achieved in the year under review, would not have been possible. To my executive and the entire staff, a big thank you for the dedication and commitment in making a positive contribution to small business in South Africa.
TR MakhuvhaChief Executive Officer Date: 20 June 2017
31Annual Report 2017
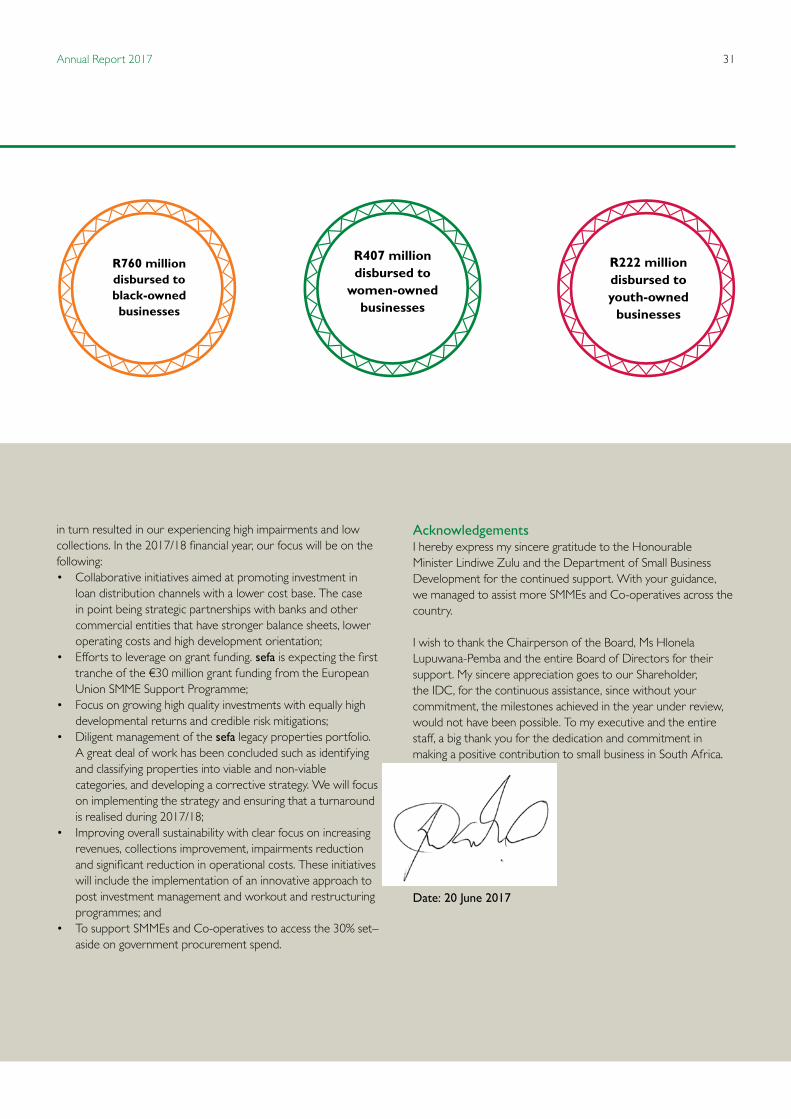
R407 million disbursed to
women-owned businesses
R222 million disbursed to youth-owned
businesses
R760 million disbursed to black-owned businesses
Small Enterprise Finance Agency32
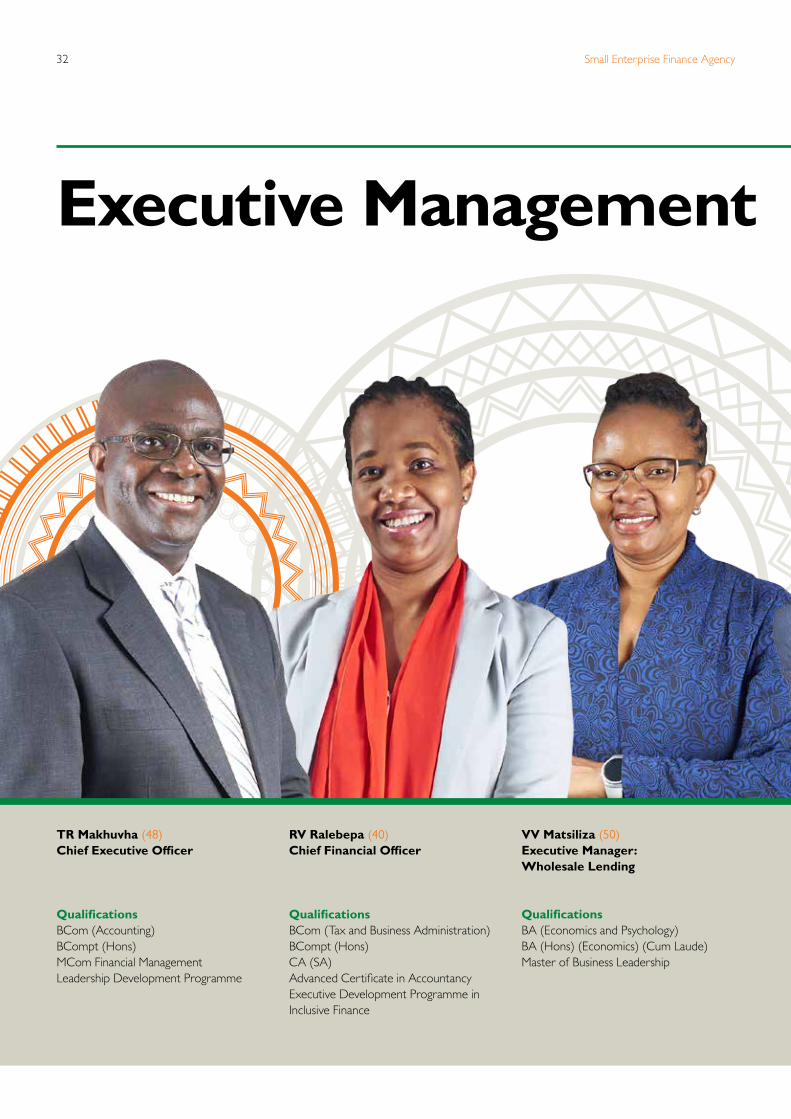
Executive Management
TR Makhuvha (48)Chief Executive Officer
QualificationsBCom (Accounting)BCompt (Hons)MCom Financial ManagementLeadership Development Programme
RV Ralebepa (40) Chief Financial Officer
QualificationsBCom (Tax and Business Administration)BCompt (Hons)CA (SA)Advanced Certificate in AccountancyExecutive Development Programme in Inclusive Finance
VV Matsiliza (50)Executive Manager:Wholesale Lending
QualificationsBA (Economics and Psychology)BA (Hons) (Economics) (Cum Laude)Master of Business Leadership
33Annual Report 2017
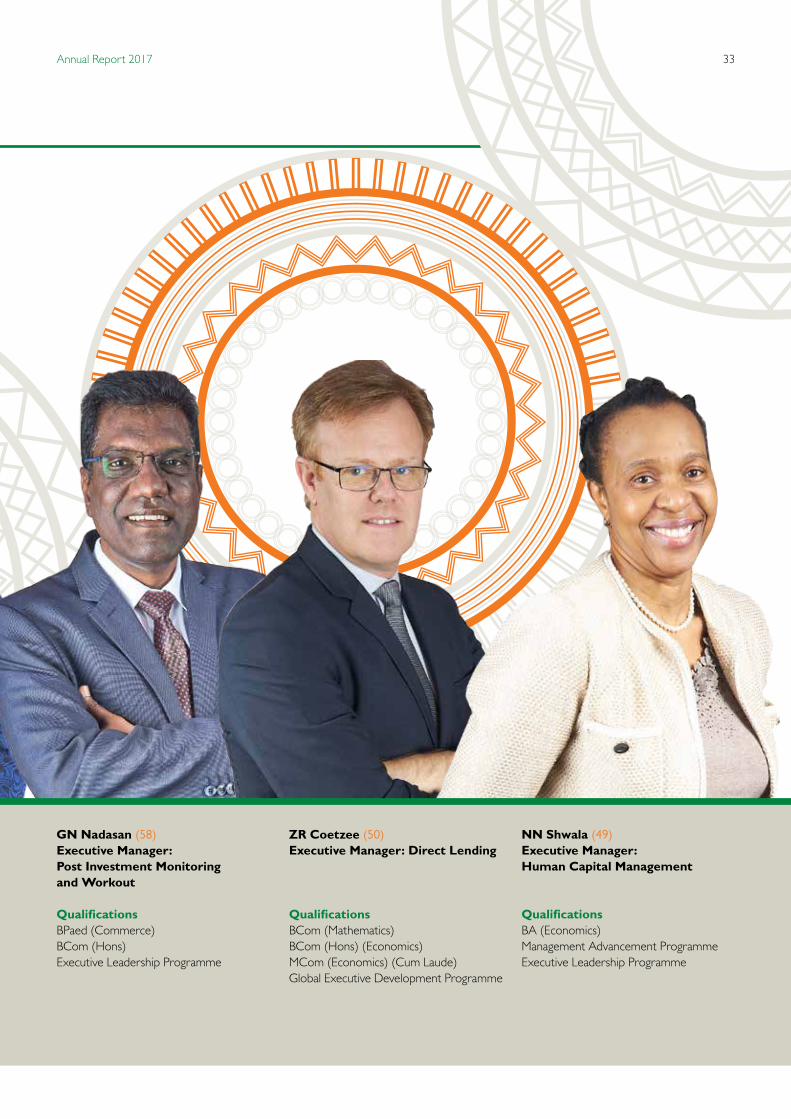
GN Nadasan (58)Executive Manager: Post Investment Monitoring and Workout
QualificationsBPaed (Commerce)BCom (Hons)Executive Leadership Programme
ZR Coetzee (50)Executive Manager: Direct Lending
QualificationsBCom (Mathematics)BCom (Hons) (Economics)MCom (Economics) (Cum Laude)Global Executive Development Programme
NN Shwala (49) Executive Manager: Human Capital Management
QualificationsBA (Economics)Management Advancement ProgrammeExecutive Leadership Programme
Small Enterprise Finance Agency34
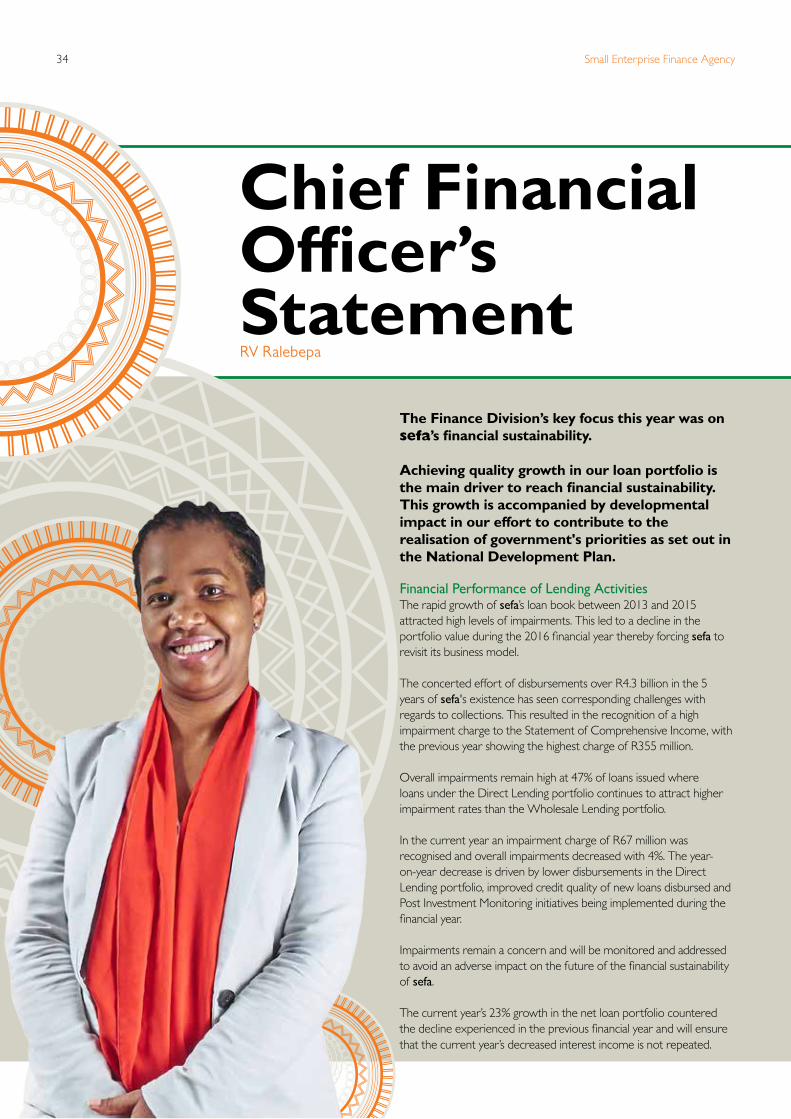
The Finance Division’s key focus this year was on sefa’s financial sustainability.
Achieving quality growth in our loan portfolio is the main driver to reach financial sustainability. This growth is accompanied by developmental impact in our effort to contribute to the realisation of government's priorities as set out in the National Development Plan.
Financial Performance of Lending ActivitiesThe rapid growth of sefa’s loan book between 2013 and 2015 attracted high levels of impairments. This led to a decline in the portfolio value during the 2016 financial year thereby forcing sefa to revisit its business model.
The concerted effort of disbursements over R4.3 billion in the 5 years of sefa's existence has seen corresponding challenges with regards to collections. This resulted in the recognition of a high impairment charge to the Statement of Comprehensive Income, with the previous year showing the highest charge of R355 million.
Overall impairments remain high at 47% of loans issued where loans under the Direct Lending portfolio continues to attract higher impairment rates than the Wholesale Lending portfolio.
In the current year an impairment charge of R67 million was recognised and overall impairments decreased with 4%. The year-on-year decrease is driven by lower disbursements in the Direct Lending portfolio, improved credit quality of new loans disbursed and Post Investment Monitoring initiatives being implemented during the financial year.
Impairments remain a concern and will be monitored and addressed to avoid an adverse impact on the future of the financial sustainability of sefa.
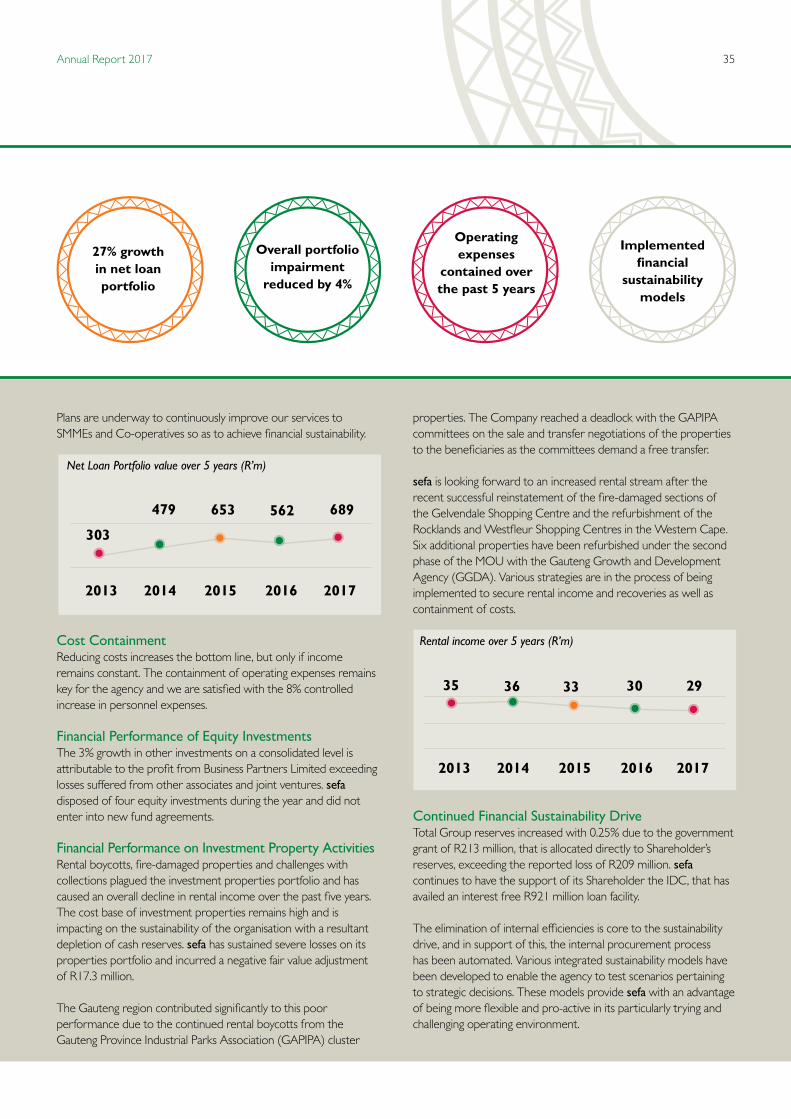
The current year’s 23% growth in the net loan portfolio countered the decline experienced in the previous financial year and will ensure that the current year’s decreased interest income is not repeated.
Chief Financial Officer’s StatementRV Ralebepa
35Annual Report 2017
2013
303
479 653 562 689
2014 2015 2016 2017
27% growth in net loan portfolio
Overall portfolio impairment
reduced by 4%
Implemented financial
sustainability models
2013
35 36
2014 2015 2016 2017
33 30 29
Plans are underway to continuously improve our services toSMMEs and Co-operatives so as to achieve financial sustainability.
Net Loan Portfolio value over 5 years (R’m)
Cost ContainmentReducing costs increases the bottom line, but only if income remains constant. The containment of operating expenses remains key for the agency and we are satisfied with the 8% controlled increase in personnel expenses.
Financial Performance of Equity InvestmentsThe 3% growth in other investments on a consolidated level is attributable to the profit from Business Partners Limited exceeding losses suffered from other associates and joint ventures. sefa disposed of four equity investments during the year and did not enter into new fund agreements.
Financial Performance on Investment Property ActivitiesRental boycotts, fire-damaged properties and challenges with collections plagued the investment properties portfolio and has caused an overall decline in rental income over the past five years. The cost base of investment properties remains high and is impacting on the sustainability of the organisation with a resultant depletion of cash reserves. sefa has sustained severe losses on its properties portfolio and incurred a negative fair value adjustment of R17.3 million.
The Gauteng region contributed significantly to this poor performance due to the continued rental boycotts from the Gauteng Province Industrial Parks Association (GAPIPA) cluster
properties. The Company reached a deadlock with the GAPIPA committees on the sale and transfer negotiations of the properties to the beneficiaries as the committees demand a free transfer.
sefa is looking forward to an increased rental stream after the recent successful reinstatement of the fire-damaged sections of the Gelvendale Shopping Centre and the refurbishment of the Rocklands and Westfleur Shopping Centres in the Western Cape. Six additional properties have been refurbished under the second phase of the MOU with the Gauteng Growth and Development Agency (GGDA). Various strategies are in the process of being implemented to secure rental income and recoveries as well ascontainment of costs.
Rental income over 5 years (R’m)
Continued Financial Sustainability DriveTotal Group reserves increased with 0.25% due to the government grant of R213 million, that is allocated directly to Shareholder’s reserves, exceeding the reported loss of R209 million. sefa continues to have the support of its Shareholder the IDC, that has availed an interest free R921 million loan facility.
The elimination of internal efficiencies is core to the sustainability drive, and in support of this, the internal procurement process has been automated. Various integrated sustainability models have been developed to enable the agency to test scenarios pertaining to strategic decisions. These models provide sefa with an advantage of being more flexible and pro-active in its particularly trying and challenging operating environment.
Operating expenses
contained over the past 5 years
Small Enterprise Finance Agency36
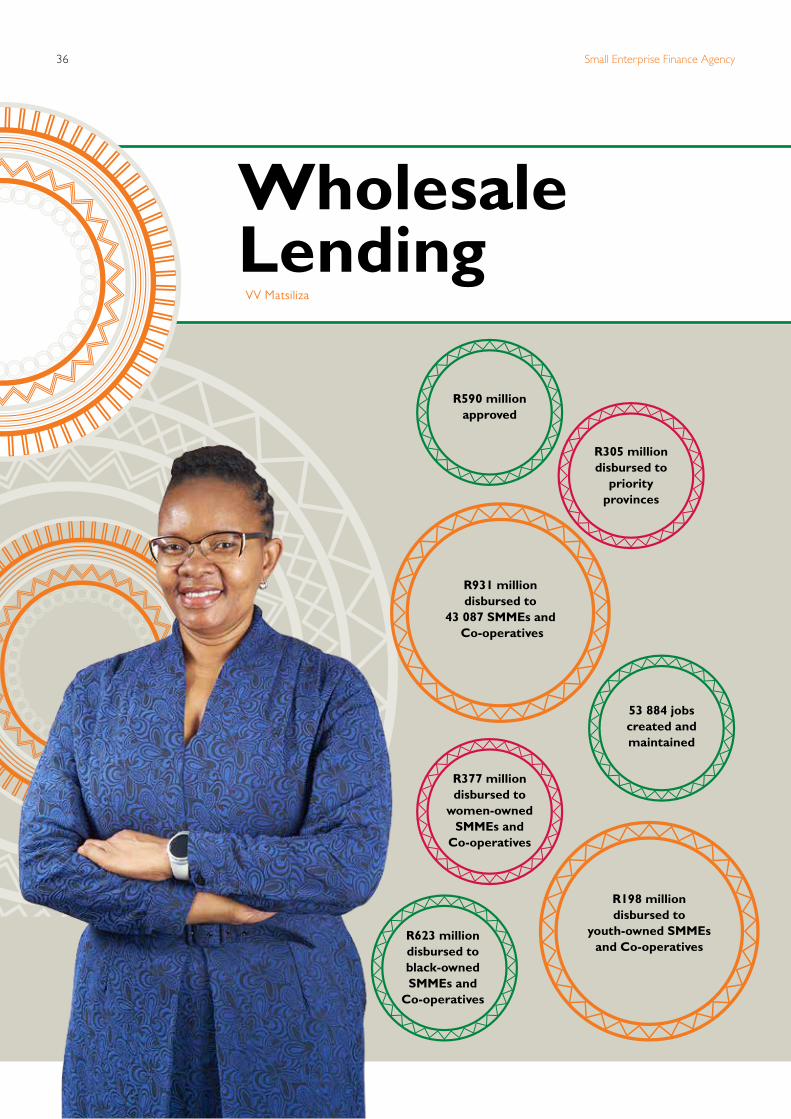
Wholesale Lending
R590 million approved
R931 million disbursed to
43 087 SMMEs and Co-operatives
R623 million disbursed to black-owned SMMEs and
Co-operatives
R377 million disbursed to
women-owned SMMEs and
Co-operatives
R305 million disbursed to
priority provinces
R198 million disbursed to
youth-owned SMMEs and Co-operatives
53 884 jobs created and maintained
VV Matsiliza

37Annual Report 2017
The Wholesale Lending Division consists of the Microfinance, Wholesale SME and Co-operatives Units. These Units also attend to the Land Reform Empowerment Facility (LREF) and the Khula Credit Guarantee Scheme. These Units largely work with intermediary institutions and strategic partners to provide credit to end users and to optimise developmental impact.
Intermediary institutions are funded by sefa through various debt instruments and/or equity which is used to on-lend to the end users. Strategic Partners, on the other hand, sign co-operation agreements with sefa to provide credit and/or technical support, market access, application due diligence service and post investment support to end users.
The Structured Finance Solutions is the only product where the Wholesale Lending Division lends directly to the end users. Loans under this product are grouped with Strategic Partners where sefa provides funding and the partner provides post investment non-financial services.
Wholesale Lending Approvals and Disbursements over 5 years The following approvals and disbursements graphs depict a five year trend of the support given to the division’s target market.
Approvals
MFIs0
50
100
150
200
250
300
350
400
450
500
SMMEs Credit IndemnityScheme
LREF Co-operatives
R m
illio
n
2012/13 2013/14 2014/15 2015/16 2016/17
80
111
4829
106
213
440
108
140
63
128
40
383
20
130
58
160
130
50
20

Small Enterprise Finance Agency38
The approvals graph depicts approvals to Intermediaries and excludes SFSs. Approvals under SFSs relating to Microfinance translates to 2015: R10.3 million, 2016: R68.8 million and 2017: R81.4 million.
Wholesale Lending disbursements are primarily a function of prior years’ approvals and are measured by the value of loans granted to the end users either directly or through intermediaries. Most Intermediaries get approvals for facilities that are disbursed over multiple years. In normal cases, growing intermediaries tend to drawdown higher amounts with each subsequent year. As is reflected in the disbursements graph, the Microfinance Unit shows steady growth in disbursements on an annual basis between 2013/14 and 2015/16. The decline in 2016/17 is due to disbursements standing over to the next financial year to some of the intermediaries.
The Land Reform Empowerment Facility which operates under a Non-profit Company funded by the Department of Rural Development and Land Reform, shows significant growth from 2013/14 to 2016/17. After a lull in 2014/15 and 2015/16, the Khula Credit Guarantee disbursements grew in 2016/17. Co-operative disbursements have also stabilised to about R56 million in 2016/17.
sefa’s activities are informed by the strategic objectives which includes the objective to increase access and provision of finance to SMMEs and Co-operatives.
The sub-programmes that increase access to finance to SMMEs and Co-operatives within the Wholesale Lending Division are:• Informal Sector and Microenterprise Finance (R500 up to R250 000 loans to end users);• Wholesale SME Lending (from R250 000 up to R5 million loans to end users, loan sizes are higher for fund management mandates);• Co-operative Enterprise Lending (R500 up to R5 million loans to end users); and • Credit Indemnity Scheme (from R50 000 up to R5 million loans to end users, loan sizes are higher for specialised sectors).
Disbursements
65
183
48
29109
209
140129
195
14
0 02
10
002
33
57
0
3646
57
2012/13 2013/14 2014/15 2015/16 2016/17
0
50
100
150
200
250
R m
illio
n
MFIs SMMEs Credit IndemnityScheme
LREF Co-operatives
37
2310

39Annual Report 2017
Informal Sector and Microenterprise FinanceThis sub-programme focused on implementation of targeted interventions to increase consistent access to credit by the informal sector and microenterprises.
Highlights
R29 million approved
R183 million disbursed to
informal and micro-enterprises
Technology at the Fresh Produce Markets The Wholesale Lending – Microfinance Unit made significant strides in harnessing technology for assessing and managing credit at two Fresh Produce Markets in 2016/17. The tripartite collaboration among sefa, The Fresh Produce Markets (FPMs), and Freshmark Systems (member of the MICROmega Holdings Group), saw the development of a technology lending platform, specially designed to assess, manage and report on credit applications and transactions for informal business buyers at the FPMs. The system, known as “sefaCredit”, was designed by sefa and developed by Freshmark Systems. It is a versatile system that is capable of processing large amounts of information. The system has been implemented at two FPMs, Durban and Mangaung.
The “sefaCredit” System went live at the Mangaung and Durban Fresh Produce Markets in September and October 2016, respectively. In the seven months to March 2017, the system processed in excess of 800 loans worth over R3 million. This technology platform has enabled sefa to
offer loans directly to informal businesses for the first time ever. Formerly, lending directly to informal businesses was considered a daunting task considering the cost of assessing numerous small loans. “sefaCredit” has made such assessment easy, fast and efficient.
It is envisaged that in the coming financial year, a number of enhancements will be made to the System. The enhancements will include the utilisation of smartphone technology to make credit applications as well as making loan repayments. Clients will be able to use an “App” to view the status of their loan and interact with sefa on any matters concerning the loan. sefa is excited to see this technology platform blossom.
During the same financial year, R21.4 million was approved for a partnership with Springs Fresh Produce Market. Plans are underway to adapt this System to support various other sefa programmes and projects that involve direct lending to end users.
Fresh Fruit and Vegetable from the Durban Fresh Produce Market

Small Enterprise Finance Agency40
Lessons Learned from Structured Finance Solutions (SFSs)The SFSs are new, tailored and innovative ways of servicing clients in different sectors that may not necessarily be reached by intermediaries and/or commercial banks. As a result, sefa has closely observed and assessed the performance of these SFSs and learned a number of lessons. Such lessons inform the way sefa structures its relationships and products to bring efficiencies and effectiveness.
Viable and Effective Public Private Partnerships EstablishedHuge strides were made in building solid Private-Public Partnerships (PPPs). In 2016/17, an R8.8 million youth employment programme through Coca Cola Beverages South Africa (CCBSA)’ Bizniz in A Box was launched. The first launch was in Welkom in the Free State, where an estimated 26 youths each received a loan of R80 000 to secure a containerized retail and services business. The collaboration with CCBSA ensures that the targeted youth are trained in business practices and receive on-going mentoring for a period of three years. An additional 50 youths from The Royal Bafokeng community will also benefit from the programme. Depending on the overall success of this initial facility, sefa and CCBSA may roll out the programme countrywide.
In answer to the need to dedicate focus to underserved priority provinces the Wholesale Lending – Microfinance unit targeted the Northern Cape, North West, Free State, Eastern Cape and KwaZulu-Natal for approval and implementation of development and finance solutions with strategic partners. sefa partnered with Siza Capital which in the 2016/17 financial year disbursed R12.8 million of its revolving facility to microenterprises participating in the Abengoa Supply Chain in Pofadder, Northern Cape.
A R24.5 million facility was approved for support of informal sector players in the Eastern Cape trained through a partnership with the Department of Small Business Development and Wholesale & Retail Seta. In the 2017/18 financial year approved projects will be implemented, expanded and replicated with existing strategic partners.
sefa and Microfinance Intermediaries reach microentrepreneurs in Rural Provinces sefa’s ability to lend directly to end users in the informal and microenterprise sector does not signal the end of its relationships with Microfinance Intermediaries (MFIs). Significant facilities have been approved for a number of MFIs across the country. Among these MFIs are: The Small Enterprise Foundation (SEF) and Phakamani Foundation (Phakamani) accessing revolving facilities of R30 million and R50 million respectively. These MFIs collaborate with sefa and other international and local funders to provide credit to informal businesses and microenterprises in a number of rural provinces of South Africa.
sefa and SEF established a strategic relationship in June 2005 when a facility of R9.6 million was approved. At the time, SEF had over 27 500 clients. Over the last 12 years, and after a number of approved facilities, SEF has grown its book to over R350 million with almost 157 000 clients. While it is not only sefa funding that has made SEF grow this significantly, it is nevertheless noteworthy that the size of the current facility is a revolving R30 million. Through the activities of SEF, sefa has a strong informal business and microenterprise footprint in Limpopo, Mpumalanga, Eastern Cape and the North West.
The strategic relationship between sefa and Phakamani was established September 2010, with a R3.5 million term loan. At the time Phakamani had only 915 active clients. In the short space of a little over six years, Phakamani has grown its client numbers to over 20 000 and has a revolving facility of R50 million with sefa. Its operations in Mpumalanga have made sefa a visible supplier of on-lending capital for the benefit of informal businesses and microenterprises. The current R50 million revolving facility will see Phakamani expand its credit offering in KwaZulu-Natal.
SA Taxi Development Finance (Pty) Ltd

41Annual Report 2017
Durban Fresh Produce Market ClientMr Isaac Siphiwe Sithole of KwaXimba, in Durban, has a fruit and vegetable business which he operates from a stall at the Berea rail station. Mr Sithole, a regular buyer at the Durban Fresh Produce Market qualified for a R2 000 loan in January 2017. He managed to improve his fruit and vegetable business by adding other items which were not in his selling basket. When visited by the sefa staff, he said, excitedly, “isefa ingenzele kahle kakhulu (sefa helped me tremendously)”. He went on to say, “ sefa did not only assist me with money to buy stock for my business, but also assisted me to manage my finances properly. I believe I received a business management course for free!”
The fruit and vegetable business is the only source of income for Mr Sithole and his family. His day always starts before dawn, stocking up at the market. He then rushes to his operating stall. He targets the passengers who commute to and from the Berea station.
Ms Thandi Violet TwalaWhen interviewed, Ms Twala was on her seventh loan cycle with the Phakamani Foundation. Her R8 000 loan facility is used to stock up on material that she uses to sew bed covers, curtains, and bathroom sets which she sells to make a living.
The programme hosted by the Phakamani Foundation has enabled Ms Twala to grow her business and keep greater levels of material which allows her to keep an increased variety of products and to secure discounts.
Being able to offer products that are in great demand to her customers has been life-changing to Ms Twala. She is now able to support a family of six with her increased income stream. With the heart of a true entrepreneur, Ms Twala is determined to continue growing her business through hard work and financial discipline. She is grateful to the Phakamani Foundation for offering her an opportunity to have a successful business and appreciates the financial assistance and on-going training and support.
Stories from Informal and Microenterprise end-usersStories from Informal and Microenterprise end-users
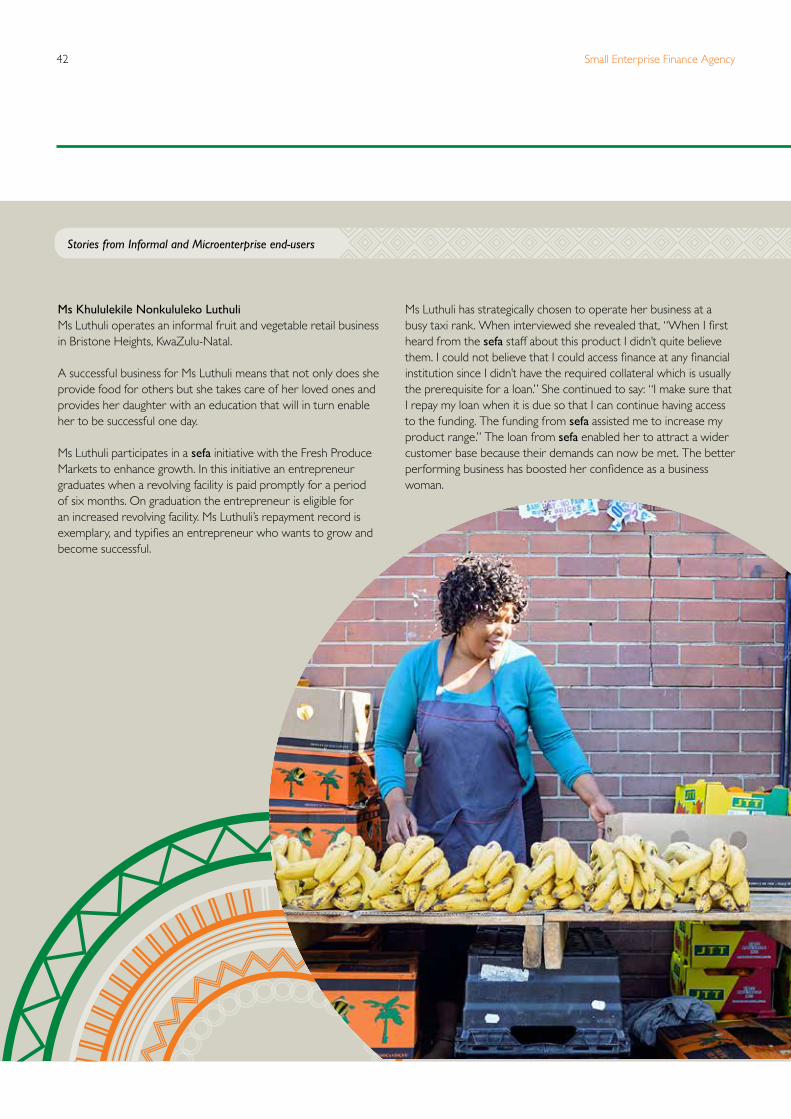
Small Enterprise Finance Agency42
Ms Khululekile Nonkululeko LuthuliMs Luthuli operates an informal fruit and vegetable retail business in Bristone Heights, KwaZulu-Natal.
A successful business for Ms Luthuli means that not only does she provide food for others but she takes care of her loved ones and provides her daughter with an education that will in turn enable her to be successful one day.
Ms Luthuli participates in a sefa initiative with the Fresh Produce Markets to enhance growth. In this initiative an entrepreneur graduates when a revolving facility is paid promptly for a period of six months. On graduation the entrepreneur is eligible for an increased revolving facility. Ms Luthuli’s repayment record is exemplary, and typifies an entrepreneur who wants to grow and become successful.
Ms Luthuli has strategically chosen to operate her business at a busy taxi rank. When interviewed she revealed that, “When I first heard from the sefa staff about this product I didn’t quite believe them. I could not believe that I could access finance at any financial institution since I didn’t have the required collateral which is usually the prerequisite for a loan.” She continued to say: “I make sure that I repay my loan when it is due so that I can continue having access to the funding. The funding from sefa assisted me to increase my product range.” The loan from sefa enabled her to attract a wider customer base because their demands can now be met. The better performing business has boosted her confidence as a business woman.
Stories from Informal and Microenterprise end-users
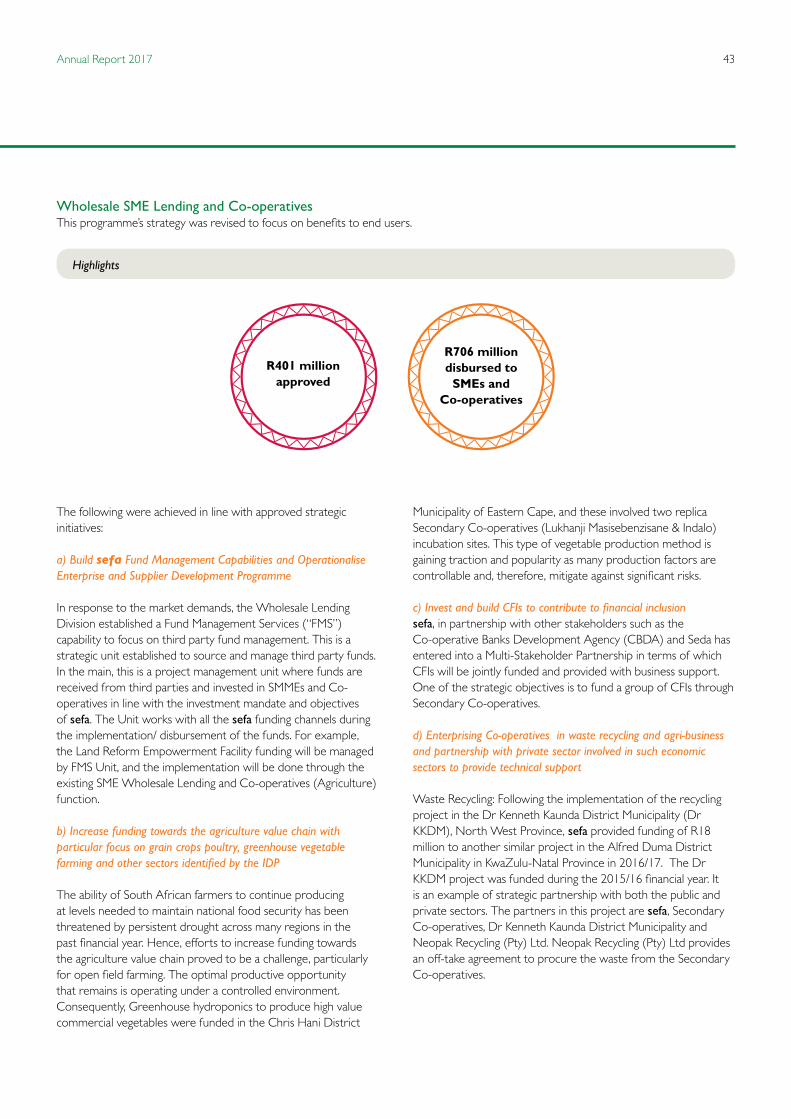
43Annual Report 2017
Wholesale SME Lending and Co-operativesThis programme’s strategy was revised to focus on benefits to end users.
Highlights
R401 million approved
R706 million disbursed to
SMEs and Co-operatives
The following were achieved in line with approved strategic initiatives:
a) Build sefa Fund Management Capabilities and Operationalise Enterprise and Supplier Development Programme
In response to the market demands, the Wholesale Lending Division established a Fund Management Services (“FMS”) capability to focus on third party fund management. This is a strategic unit established to source and manage third party funds. In the main, this is a project management unit where funds are received from third parties and invested in SMMEs and Co-operatives in line with the investment mandate and objectives of sefa. The Unit works with all the sefa funding channels during the implementation/ disbursement of the funds. For example, the Land Reform Empowerment Facility funding will be managed by FMS Unit, and the implementation will be done through the existing SME Wholesale Lending and Co-operatives (Agriculture) function.
b) Increase funding towards the agriculture value chain with particular focus on grain crops poultry, greenhouse vegetable farming and other sectors identified by the IDP
The ability of South African farmers to continue producing at levels needed to maintain national food security has been threatened by persistent drought across many regions in the past financial year. Hence, efforts to increase funding towards the agriculture value chain proved to be a challenge, particularly for open field farming. The optimal productive opportunity that remains is operating under a controlled environment. Consequently, Greenhouse hydroponics to produce high value commercial vegetables were funded in the Chris Hani District
Municipality of Eastern Cape, and these involved two replica Secondary Co-operatives (Lukhanji Masisebenzisane & Indalo) incubation sites. This type of vegetable production method is gaining traction and popularity as many production factors are controllable and, therefore, mitigate against significant risks.
c) Invest and build CFIs to contribute to financial inclusionsefa, in partnership with other stakeholders such as the Co-operative Banks Development Agency (CBDA) and Seda has entered into a Multi-Stakeholder Partnership in terms of which CFIs will be jointly funded and provided with business support. One of the strategic objectives is to fund a group of CFIs through Secondary Co-operatives.
d) Enterprising Co-operatives in waste recycling and agri-business and partnership with private sector involved in such economic sectors to provide technical support
Waste Recycling: Following the implementation of the recycling project in the Dr Kenneth Kaunda District Municipality (Dr KKDM), North West Province, sefa provided funding of R18 million to another similar project in the Alfred Duma District Municipality in KwaZulu-Natal Province in 2016/17. The Dr KKDM project was funded during the 2015/16 financial year. It is an example of strategic partnership with both the public and private sectors. The partners in this project are sefa, Secondary Co-operatives, Dr Kenneth Kaunda District Municipality and Neopak Recycling (Pty) Ltd. Neopak Recycling (Pty) Ltd provides an off-take agreement to procure the waste from the Secondary Co-operatives.
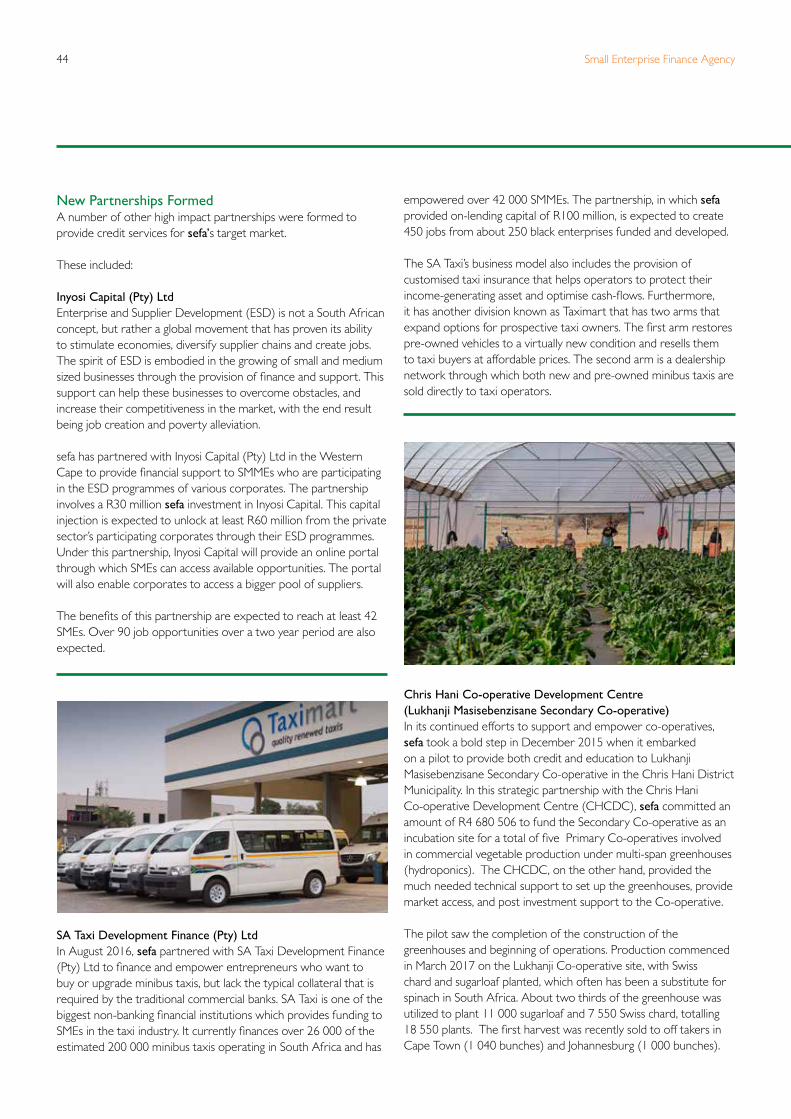
Small Enterprise Finance Agency44
New Partnerships Formed A number of other high impact partnerships were formed to provide credit services for sefa’s target market.
These included:
Inyosi Capital (Pty) LtdEnterprise and Supplier Development (ESD) is not a South African concept, but rather a global movement that has proven its ability to stimulate economies, diversify supplier chains and create jobs. The spirit of ESD is embodied in the growing of small and medium sized businesses through the provision of finance and support. This support can help these businesses to overcome obstacles, and increase their competitiveness in the market, with the end result being job creation and poverty alleviation.
sefa has partnered with Inyosi Capital (Pty) Ltd in the Western Cape to provide financial support to SMMEs who are participating in the ESD programmes of various corporates. The partnership involves a R30 million sefa investment in Inyosi Capital. This capital injection is expected to unlock at least R60 million from the private sector’s participating corporates through their ESD programmes. Under this partnership, Inyosi Capital will provide an online portal through which SMEs can access available opportunities. The portal will also enable corporates to access a bigger pool of suppliers.
The benefits of this partnership are expected to reach at least 42 SMEs. Over 90 job opportunities over a two year period are also expected.
SA Taxi Development Finance (Pty) LtdIn August 2016, sefa partnered with SA Taxi Development Finance (Pty) Ltd to finance and empower entrepreneurs who want to buy or upgrade minibus taxis, but lack the typical collateral that is required by the traditional commercial banks. SA Taxi is one of the biggest non-banking financial institutions which provides funding to SMEs in the taxi industry. It currently finances over 26 000 of the estimated 200 000 minibus taxis operating in South Africa and has
empowered over 42 000 SMMEs. The partnership, in which sefa provided on-lending capital of R100 million, is expected to create 450 jobs from about 250 black enterprises funded and developed.
The SA Taxi’s business model also includes the provision of customised taxi insurance that helps operators to protect their income-generating asset and optimise cash-flows. Furthermore, it has another division known as Taximart that has two arms that expand options for prospective taxi owners. The first arm restores pre-owned vehicles to a virtually new condition and resells them to taxi buyers at affordable prices. The second arm is a dealership network through which both new and pre-owned minibus taxis are sold directly to taxi operators.
Chris Hani Co-operative Development Centre (Lukhanji Masisebenzisane Secondary Co-operative) In its continued efforts to support and empower co-operatives, sefa took a bold step in December 2015 when it embarked on a pilot to provide both credit and education to Lukhanji Masisebenzisane Secondary Co-operative in the Chris Hani District Municipality. In this strategic partnership with the Chris Hani Co-operative Development Centre (CHCDC), sefa committed an amount of R4 680 506 to fund the Secondary Co-operative as an incubation site for a total of five Primary Co-operatives involved in commercial vegetable production under multi-span greenhouses (hydroponics). The CHCDC, on the other hand, provided the much needed technical support to set up the greenhouses, provide market access, and post investment support to the Co-operative.
The pilot saw the completion of the construction of the greenhouses and beginning of operations. Production commenced in March 2017 on the Lukhanji Co-operative site, with Swiss chard and sugarloaf planted, which often has been a substitute for spinach in South Africa. About two thirds of the greenhouse was utilized to plant 11 000 sugarloaf and 7 550 Swiss chard, totalling 18 550 plants. The first harvest was recently sold to off takers in Cape Town (1 040 bunches) and Johannesburg (1 000 bunches).
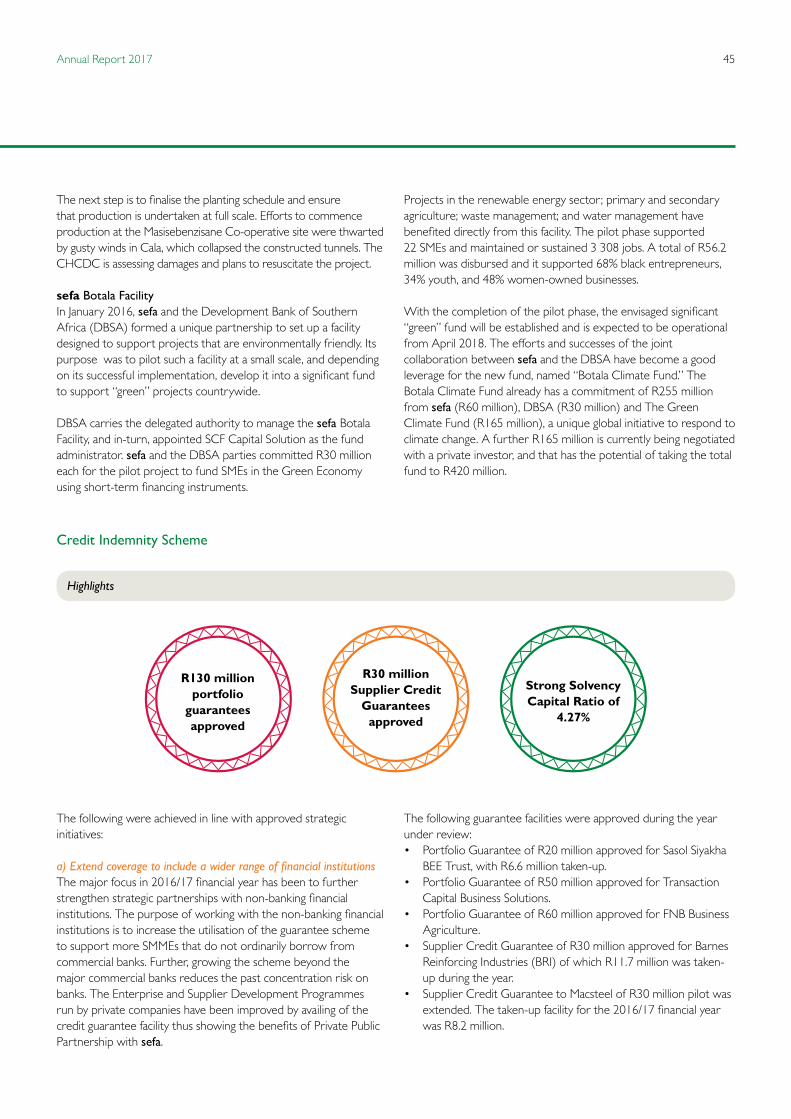
45Annual Report 2017
The next step is to finalise the planting schedule and ensure that production is undertaken at full scale. Efforts to commence production at the Masisebenzisane Co-operative site were thwarted by gusty winds in Cala, which collapsed the constructed tunnels. The CHCDC is assessing damages and plans to resuscitate the project.
sefa Botala FacilityIn January 2016, sefa and the Development Bank of Southern Africa (DBSA) formed a unique partnership to set up a facility designed to support projects that are environmentally friendly. Its purpose was to pilot such a facility at a small scale, and depending on its successful implementation, develop it into a significant fund to support “green” projects countrywide.
DBSA carries the delegated authority to manage the sefa Botala Facility, and in-turn, appointed SCF Capital Solution as the fund administrator. sefa and the DBSA parties committed R30 million each for the pilot project to fund SMEs in the Green Economy using short-term financing instruments.
Projects in the renewable energy sector; primary and secondary agriculture; waste management; and water management have benefited directly from this facility. The pilot phase supported 22 SMEs and maintained or sustained 3 308 jobs. A total of R56.2 million was disbursed and it supported 68% black entrepreneurs, 34% youth, and 48% women-owned businesses.
With the completion of the pilot phase, the envisaged significant “green” fund will be established and is expected to be operational from April 2018. The efforts and successes of the joint collaboration between sefa and the DBSA have become a good leverage for the new fund, named “Botala Climate Fund.” The Botala Climate Fund already has a commitment of R255 million from sefa (R60 million), DBSA (R30 million) and The Green Climate Fund (R165 million), a unique global initiative to respond to climate change. A further R165 million is currently being negotiated with a private investor, and that has the potential of taking the total fund to R420 million.
The following were achieved in line with approved strategic initiatives: a) Extend coverage to include a wider range of financial institutionsThe major focus in 2016/17 financial year has been to further strengthen strategic partnerships with non-banking financial institutions. The purpose of working with the non-banking financial institutions is to increase the utilisation of the guarantee scheme to support more SMMEs that do not ordinarily borrow from commercial banks. Further, growing the scheme beyond the major commercial banks reduces the past concentration risk on banks. The Enterprise and Supplier Development Programmes run by private companies have been improved by availing of the credit guarantee facility thus showing the benefits of Private Public Partnership with sefa.
The following guarantee facilities were approved during the year under review:• Portfolio Guarantee of R20 million approved for Sasol Siyakha
BEE Trust, with R6.6 million taken-up.• Portfolio Guarantee of R50 million approved for Transaction
Capital Business Solutions.• Portfolio Guarantee of R60 million approved for FNB Business
Agriculture. • Supplier Credit Guarantee of R30 million approved for Barnes
Reinforcing Industries (BRI) of which R11.7 million was taken-up during the year.
• Supplier Credit Guarantee to Macsteel of R30 million pilot was extended. The taken-up facility for the 2016/17 financial year was R8.2 million.
Credit Indemnity Scheme
Highlights
R130 million portfolio
guarantees approved
R30 million Supplier Credit
Guarantees approved
Strong Solvency Capital Ratio of
4.27%
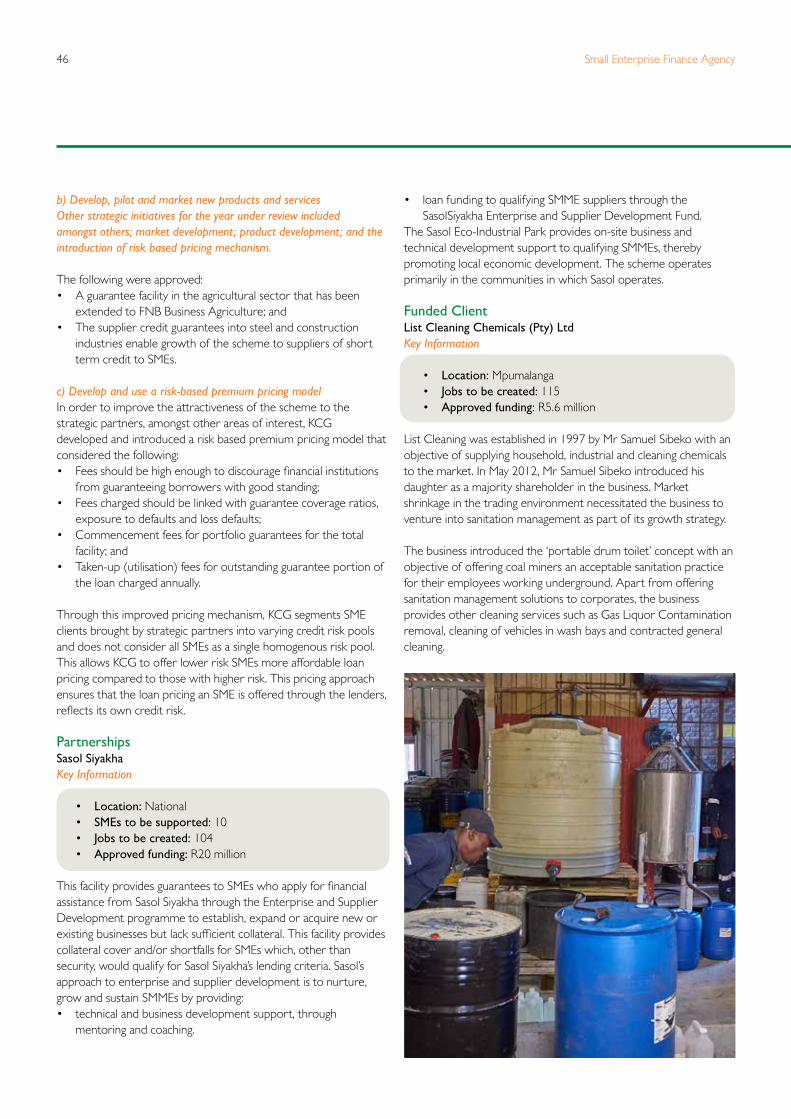
Small Enterprise Finance Agency46
b) Develop, pilot and market new products and services Other strategic initiatives for the year under review included amongst others; market development; product development; and the introduction of risk based pricing mechanism.
The following were approved:• A guarantee facility in the agricultural sector that has been
extended to FNB Business Agriculture; and • The supplier credit guarantees into steel and construction
industries enable growth of the scheme to suppliers of short term credit to SMEs.
c) Develop and use a risk-based premium pricing modelIn order to improve the attractiveness of the scheme to the strategic partners, amongst other areas of interest, KCG developed and introduced a risk based premium pricing model that considered the following:• Fees should be high enough to discourage financial institutions
from guaranteeing borrowers with good standing;• Fees charged should be linked with guarantee coverage ratios,
exposure to defaults and loss defaults;• Commencement fees for portfolio guarantees for the total
facility; and• Taken-up (utilisation) fees for outstanding guarantee portion of
the loan charged annually.
Through this improved pricing mechanism, KCG segments SME clients brought by strategic partners into varying credit risk pools and does not consider all SMEs as a single homogenous risk pool. This allows KCG to offer lower risk SMEs more affordable loan pricing compared to those with higher risk. This pricing approach ensures that the loan pricing an SME is offered through the lenders, reflects its own credit risk.
PartnershipsSasol SiyakhaKey Information
• Location: National• SMEs to be supported: 10• Jobs to be created: 104• Approved funding: R20 million
This facility provides guarantees to SMEs who apply for financial assistance from Sasol Siyakha through the Enterprise and Supplier Development programme to establish, expand or acquire new or existing businesses but lack sufficient collateral. This facility provides collateral cover and/or shortfalls for SMEs which, other than security, would qualify for Sasol Siyakha’s lending criteria. Sasol’s approach to enterprise and supplier development is to nurture, grow and sustain SMMEs by providing:• technical and business development support, through
mentoring and coaching.
• loan funding to qualifying SMME suppliers through the SasolSiyakha Enterprise and Supplier Development Fund.
The Sasol Eco-Industrial Park provides on-site business and technical development support to qualifying SMMEs, thereby promoting local economic development. The scheme operates primarily in the communities in which Sasol operates.
Funded ClientList Cleaning Chemicals (Pty) LtdKey Information
• Location: Mpumalanga• Jobs to be created: 115• Approved funding: R5.6 million
List Cleaning was established in 1997 by Mr Samuel Sibeko with an objective of supplying household, industrial and cleaning chemicals to the market. In May 2012, Mr Samuel Sibeko introduced his daughter as a majority shareholder in the business. Market shrinkage in the trading environment necessitated the business to venture into sanitation management as part of its growth strategy.
The business introduced the ‘portable drum toilet’ concept with an objective of offering coal miners an acceptable sanitation practice for their employees working underground. Apart from offering sanitation management solutions to corporates, the business provides other cleaning services such as Gas Liquor Contamination removal, cleaning of vehicles in wash bays and contracted general cleaning.

47Annual Report 2017
Transaction Capital Business SolutionsKey Information
• Location: National• SMEs to be supported: 160• Jobs to be created: 1 820 • Approved funding: R50 million
KCG provided a R50 million indemnity cover facility to Transaction Capital Business Solutions to service the SME market that lacks sufficient collateral to support lending applications. Furthermore, smaller and more recently established black-owned businesses usually have client concentration issues and/or provide products/services to the public sector. Transaction Capital Business Solutions sees a significant opportunity to assist black SMMEs with much needed purchase order finance. This in a milieu where there is a substantial focus on supplier development with very limited financial assistance being available.
Transaction Capital Business Solutions provides the following products:
• Invoice Discounting• Purchase Order Financing • Term Loan Finance• Property-backed Loan Finance
The KCG indemnity cover facility will assist Transaction Capital Business Solutions to provide more flexible financial assistance to the predominantly underserviced SME market, thereby helping these businesses to sustain themselves in the short term, grow and ultimately create more employment opportunities.
Supplier Credit Programme Key Information
• Location: National• SMEs to be supported: 89• Jobs to be created: 279• Approved funding: R60 million
The Supplier Credit Programme is an initiative by KCG to encourage suppliers of input goods to SMMEs, by indemnifying suppliers against possible default by the SMMEs. The scheme helps to increase access to credit to SMMEs especially those businesses that do not have access through traditional banking facilities. Furthermore, it addresses the marginalisation of informal sector businesses into the mainstream economy, and it reduces cost by shortening the supply chain.
Rope and net used for the local harvesting of seafood products – Riko Fishing
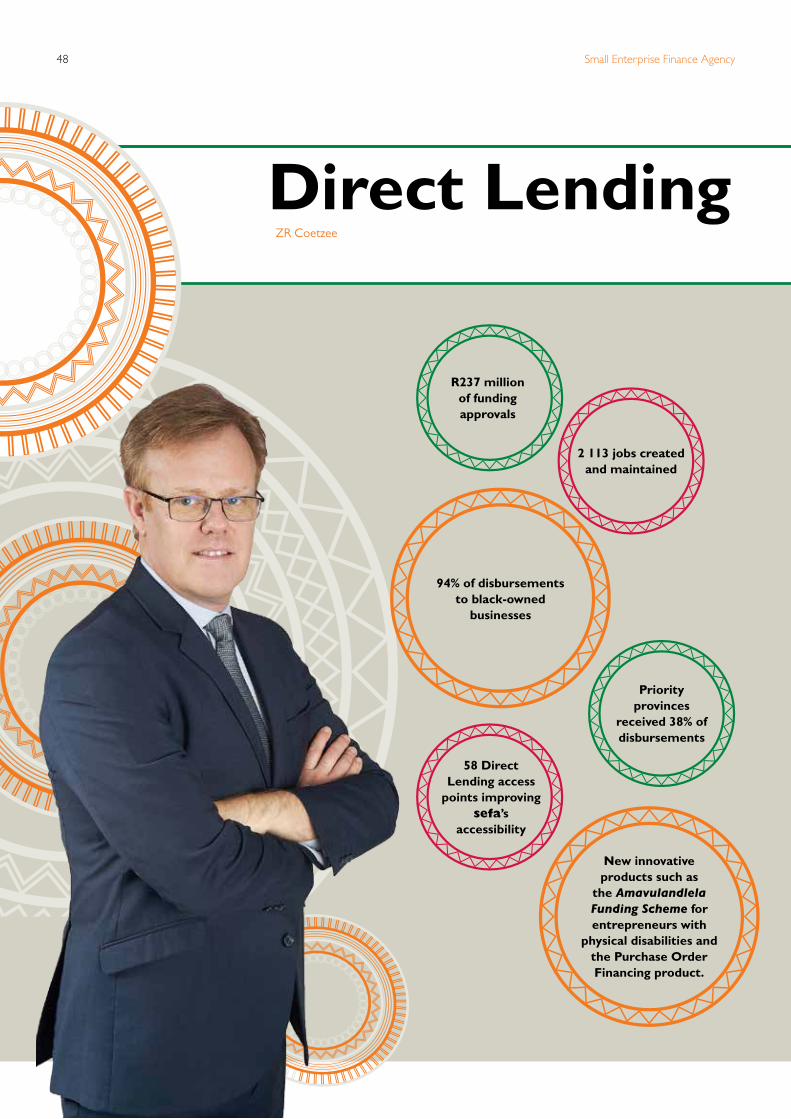
Small Enterprise Finance Agency48
Direct Lending
R237 million of funding approvals
2 113 jobs created and maintained
94% of disbursements to black-owned
businesses
Priority provinces
received 38% of disbursements
58 Direct Lending access
points improving sefa’s
accessibility
New innovative products such as
the Amavulandlela Funding Scheme for entrepreneurs with
physical disabilities and the Purchase Order Financing product.
ZR Coetzee
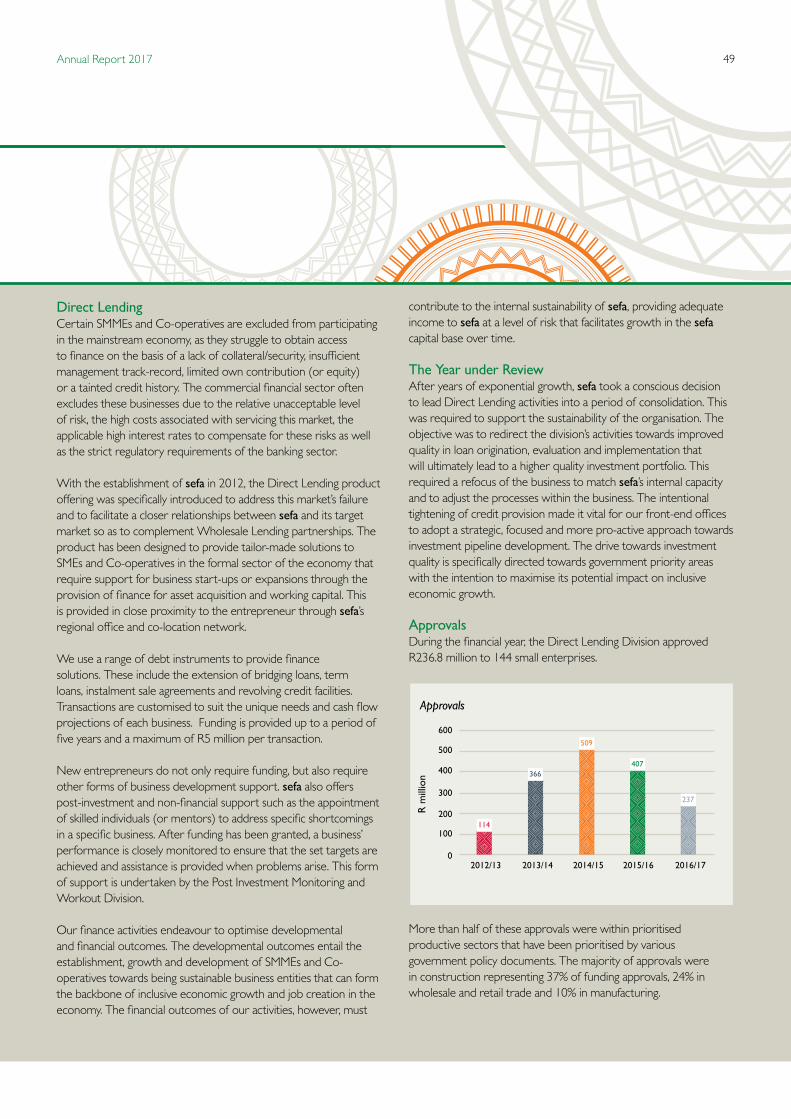
49Annual Report 2017
Direct Lending
Direct LendingCertain SMMEs and Co-operatives are excluded from participating in the mainstream economy, as they struggle to obtain access to finance on the basis of a lack of collateral/security, insufficient management track-record, limited own contribution (or equity) or a tainted credit history. The commercial financial sector often excludes these businesses due to the relative unacceptable level of risk, the high costs associated with servicing this market, the applicable high interest rates to compensate for these risks as well as the strict regulatory requirements of the banking sector.
With the establishment of sefa in 2012, the Direct Lending product offering was specifically introduced to address this market’s failure and to facilitate a closer relationships between sefa and its target market so as to complement Wholesale Lending partnerships. The product has been designed to provide tailor-made solutions to SMEs and Co-operatives in the formal sector of the economy that require support for business start-ups or expansions through the provision of finance for asset acquisition and working capital. This is provided in close proximity to the entrepreneur through sefa’s regional office and co-location network.
We use a range of debt instruments to provide finance solutions. These include the extension of bridging loans, term loans, instalment sale agreements and revolving credit facilities. Transactions are customised to suit the unique needs and cash flow projections of each business. Funding is provided up to a period of five years and a maximum of R5 million per transaction.
New entrepreneurs do not only require funding, but also require other forms of business development support. sefa also offers post-investment and non-financial support such as the appointment of skilled individuals (or mentors) to address specific shortcomings in a specific business. After funding has been granted, a business’ performance is closely monitored to ensure that the set targets are achieved and assistance is provided when problems arise. This form of support is undertaken by the Post Investment Monitoring and Workout Division.
Our finance activities endeavour to optimise developmental and financial outcomes. The developmental outcomes entail the establishment, growth and development of SMMEs and Co-operatives towards being sustainable business entities that can form the backbone of inclusive economic growth and job creation in the economy. The financial outcomes of our activities, however, must
contribute to the internal sustainability of sefa, providing adequate income to sefa at a level of risk that facilitates growth in the sefa capital base over time. The Year under ReviewAfter years of exponential growth, sefa took a conscious decision to lead Direct Lending activities into a period of consolidation. This was required to support the sustainability of the organisation. The objective was to redirect the division’s activities towards improved quality in loan origination, evaluation and implementation that will ultimately lead to a higher quality investment portfolio. This required a refocus of the business to match sefa’s internal capacity and to adjust the processes within the business. The intentional tightening of credit provision made it vital for our front-end offices to adopt a strategic, focused and more pro-active approach towards investment pipeline development. The drive towards investment quality is specifically directed towards government priority areas with the intention to maximise its potential impact on inclusive economic growth.
Approvals During the financial year, the Direct Lending Division approved R236.8 million to 144 small enterprises.
Approvals
More than half of these approvals were within prioritised productive sectors that have been prioritised by various government policy documents. The majority of approvals were in construction representing 37% of funding approvals, 24% in wholesale and retail trade and 10% in manufacturing.
114
366
509
407
237
0
100
200
2012/13 2013/14 2014/15 2015/16 2016/17
300
400
500
600
R m
illio
n
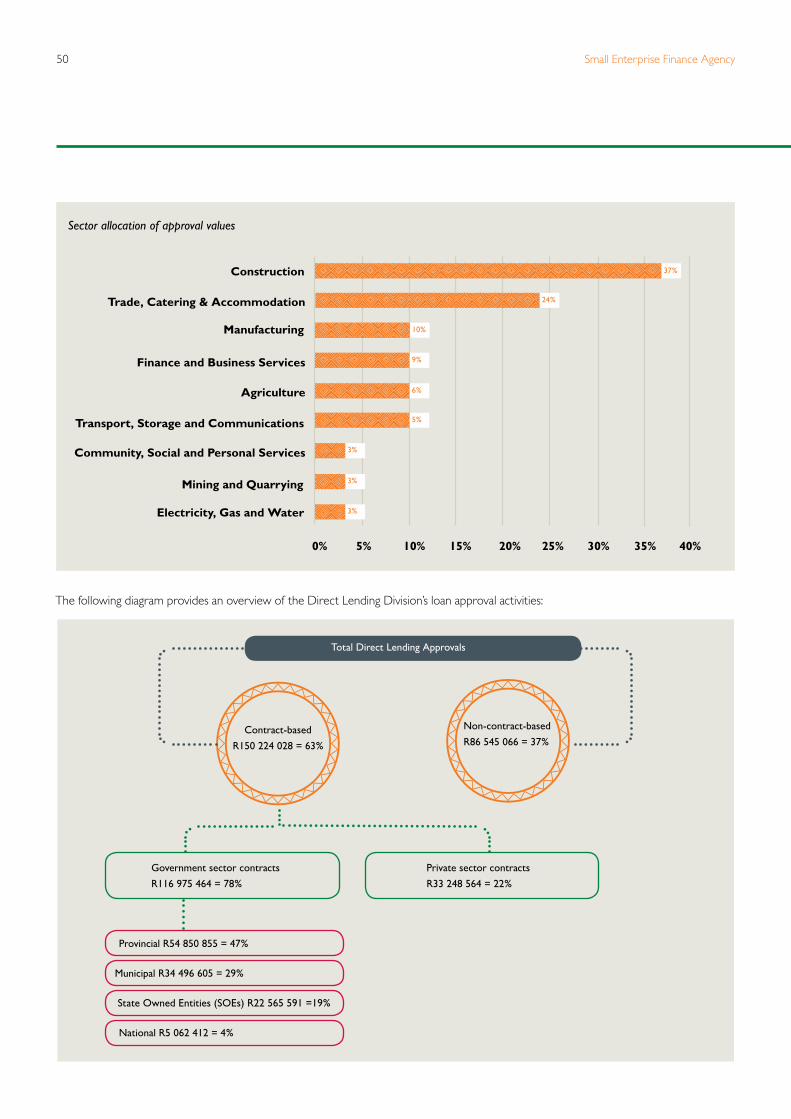
Small Enterprise Finance Agency50
Sector allocation of approval values
Construction
Trade, Catering & Accommodation
Finance and Business Services
Agriculture
Transport, Storage and Communications
Community, Social and Personal Services
Mining and Quarrying
Electricity, Gas and Water
0% 5% 10% 15% 20% 25% 30% 35% 40%
Manufacturing
37%
24%
10%
9%
6%
5%
3%
3%
3%
The following diagram provides an overview of the Direct Lending Division’s loan approval activities:
Contract-based
R150 224 028 = 63%
Government sector contracts
R116 975 464 = 78%
Provincial R54 850 855 = 47%
State Owned Entities (SOEs) R22 565 591 =19%
National R5 062 412 = 4%
Private sector contracts
R33 248 564 = 22%
Non-contract-based
R86 545 066 = 37%
Municipal R34 496 605 = 29%
Total Direct Lending Approvals
51Annual Report 2017
Contract-based finance dominated the lending activities of the Division with R117 million of loans approved to SMEs and Co-operatives that are involved in government's procurement. This was part of the Division’s strategic objectives to support the government procurement to small businesses. The majority of the Government-related contracts were from provincial departments, whilst R22 million went into businesses that have contracts with State Owned Enterprises.
The incorporation of SMEs and Co-operatives in the value chains traditionally dominated by a few large players have been part of the objectives of sefa. Finance was approved for SMEs and Co-operatives involved in the value chains of the following private sector companies: Afgri Limited; ArcelorMittal South Africa Limited; Esor Limited; IPC Beneficiation (Pty) Ltd; Maseve Platinum Mine (part of Platinum Group Metals Ltd); Matzikama Development Trust; Mr Price Group Ltd; Northam Platinum Limited; NTK Agriculture (part of VKB Beleggings (Pty) Ltd); OK Furniture (a division of Shoprite Checkers (Pty) Ltd); WHBO Construction (Pty) Ltd and Worley Parsons Limited.
Non-contract based finance contributed to 37% of the approval value. A large portion was channelled to lower risk franchise opportunities in the food service, fuel service stations and pharmacy franchises. In the unfranchised service industries, support was provided to tourism and hospitality businesses, debt collection services, automotive repair and maintenance, roadworthy testing stations, creative arts and printing as well as radiography and radiology services. Approvals in the productive sectors include poultry farming and marine fishing as well as manufacturing of furniture, jewellery, plastic products and clothing.
During the financial year under review, five National Gazelle obtained funding approvals to the value of R12 million. These are SMEs with high growth potential and who have been identified by a DSBD/Seda initiative for comprehensive support from the State.
DisbursementsThe Direct Lending Division disbursed R144.7 million for the year ending 31 March 2017. The Division only achieved 68% of its targeted baseline capital allocation. The relative low levels of disbursements can be attributed to the lower level of approvals and the tightening of credit with the consequent levying of conditions precedents which took longer to achieve. The Division achieved its targets relating to its support for black-owned businesses and the number of jobs created and maintained.
During the past financial year the Division focused on new innovative product offerings that are more suitable for its target market. Two areas of product innovation can be highlighted:
• The Amavulandlela Funding Scheme for Entrepreneurs with Physical Disabilities This is a R30 million special funding scheme earmarked to support entrepreneurs with physical
disabilities. It provides loans at concessionary rates and also provides pre- and post-investment business support. The scheme was launched in the third quarter of the financial year. Approvals under the scheme amounted to R9.3 million for two entities involved in the construction of low cost housing in Limpopo and North West.
• Purchase Order Financing Product (POP!) This product was launched in the last quarter of the financial year. A scorecard-based financing methodology is applicable to investments with the following elements: • Supply and delivery purchase orders; • No or very limited value addition (low execution risk); • Funding amount less or equal to R1 million; • Availability of a cession of proceeds; • Funding for less than six months; • All locally procured goods.
This customised product is intended to improve turnaround time and service offering for clients requiring non-complex bridging loans. The first approval was obtained in the first quarter of the 2017/18 financial year.
Improved accessibility through Co-locations Direct Lending made significant progress with the establishment of co-location points during the 2016/17 financial year. sefa embarked on a Geographic Expansion Plan in 2015/16, with the aim of having sefa access points in every district of South Africa. Different types of access points have been developed to ensure that sefa improves its accessibility in a cost-effective way. Each co-location point requires specific co-location arrangements and this is captured in a co-operation agreement with the other institution. The co-operation agreement is concluded on a regional level and captures aspects that deal with the day to day operations of the co-locations point. There are currently 58 sefa access points and these exclude specialised access points of sefa’s wholesale partners.
The year aheadThe key thrusts for the Direct Lending Programme for 2017/18 are as follows:• Pro-actively leverage partnerships within the SMME & Co-operative eco-system;• Further improvement of investment quality through enhanced
origination and better transaction assessment;• Focus on those market segments where sefa has a relative
strength in (contract-based finance as base-line business stream);
• Balancing the portfolio between businesses in the start-up phase and those in expansion/growth phase; and
• Improve efficiencies through increased focus, streamlining of processes, and the development of low-cost income generating products.
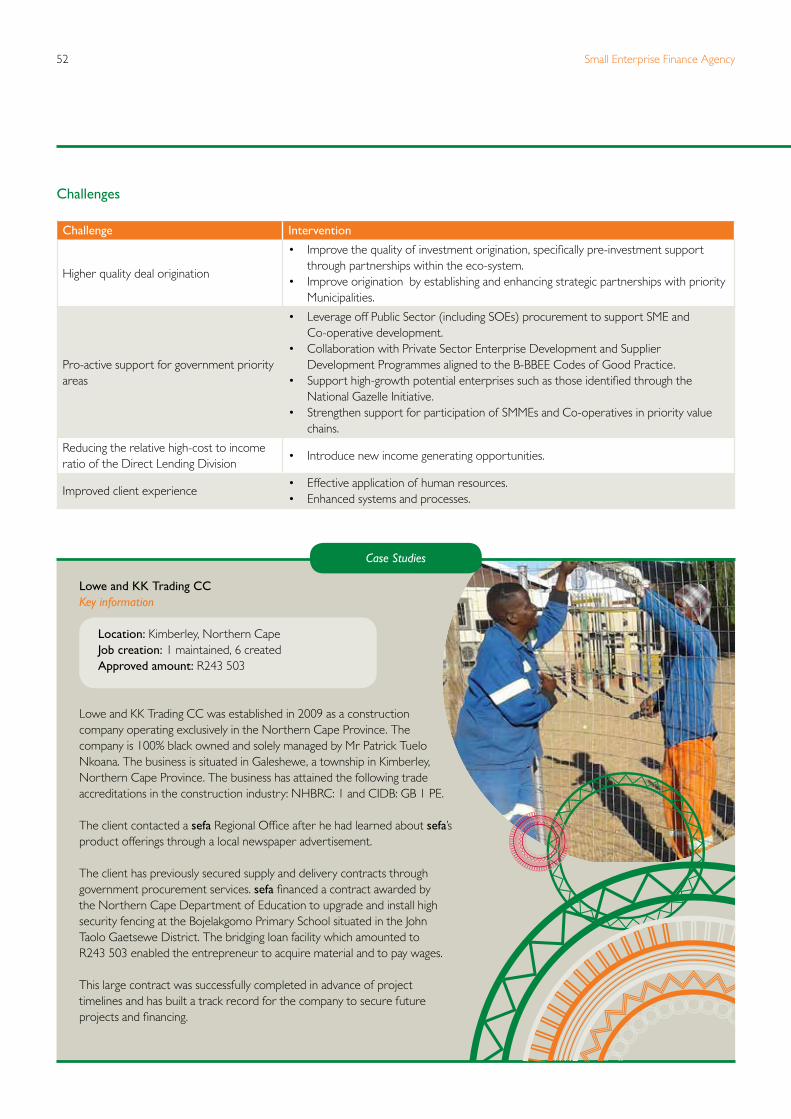
Small Enterprise Finance Agency52
Lowe and KK Trading CC Key information
Location: Kimberley, Northern Cape Job creation: 1 maintained, 6 createdApproved amount: R243 503
Lowe and KK Trading CC was established in 2009 as a construction company operating exclusively in the Northern Cape Province. The company is 100% black owned and solely managed by Mr Patrick Tuelo Nkoana. The business is situated in Galeshewe, a township in Kimberley, Northern Cape Province. The business has attained the following trade accreditations in the construction industry: NHBRC: 1 and CIDB: GB 1 PE.
The client contacted a sefa Regional Office after he had learned about sefa’s product offerings through a local newspaper advertisement.
The client has previously secured supply and delivery contracts through government procurement services. sefa financed a contract awarded by the Northern Cape Department of Education to upgrade and install high security fencing at the Bojelakgomo Primary School situated in the John Taolo Gaetsewe District. The bridging loan facility which amounted to R243 503 enabled the entrepreneur to acquire material and to pay wages.
This large contract was successfully completed in advance of project timelines and has built a track record for the company to secure future projects and financing.
Case Studies
Challenges
Challenge Intervention
Higher quality deal origination
• Improve the quality of investment origination, specifically pre-investment support through partnerships within the eco-system.
• Improve origination by establishing and enhancing strategic partnerships with priority Municipalities.
Pro-active support for government priority areas
• Leverage off Public Sector (including SOEs) procurement to support SME and Co-operative development.• Collaboration with Private Sector Enterprise Development and Supplier
Development Programmes aligned to the B-BBEE Codes of Good Practice.• Support high-growth potential enterprises such as those identified through the
National Gazelle Initiative.• Strengthen support for participation of SMMEs and Co-operatives in priority value
chains.
Reducing the relative high-cost to income ratio of the Direct Lending Division
• Introduce new income generating opportunities.
Improved client experience• Effective application of human resources.• Enhanced systems and processes.
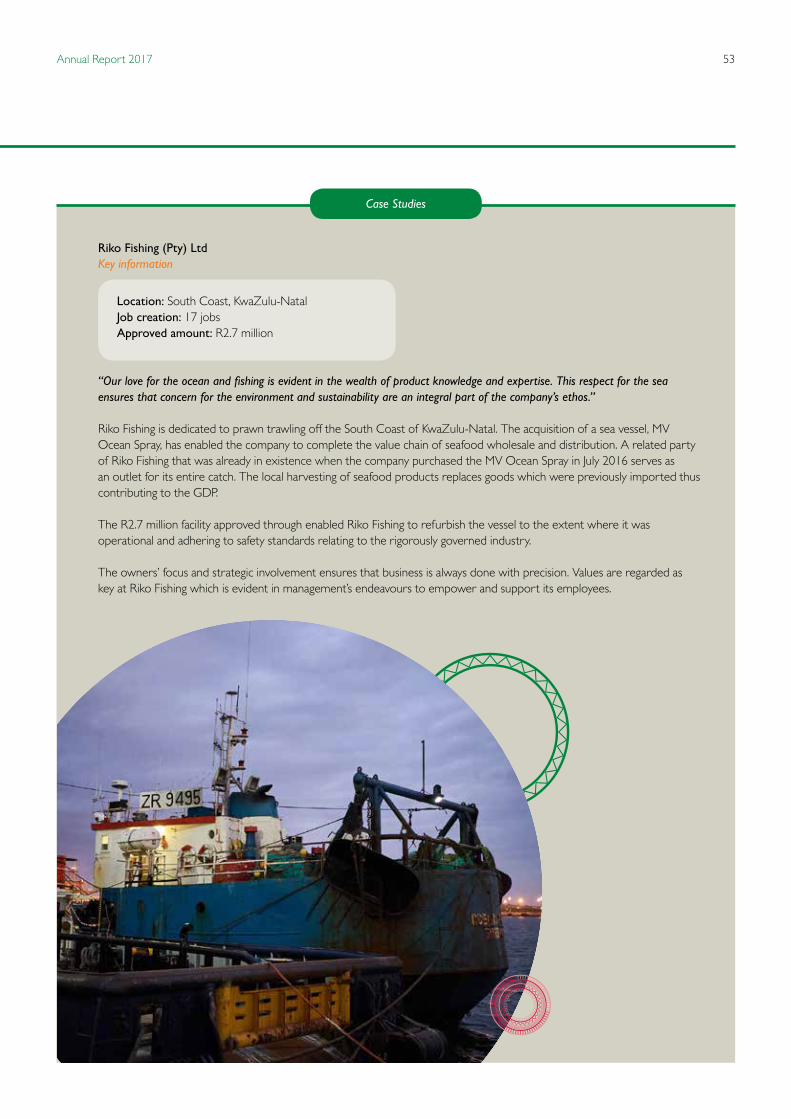
53Annual Report 2017
Case Studies
Riko Fishing (Pty) LtdKey information
Location: South Coast, KwaZulu-NatalJob creation: 17 jobsApproved amount: R2.7 million
“Our love for the ocean and fishing is evident in the wealth of product knowledge and expertise. This respect for the sea ensures that concern for the environment and sustainability are an integral part of the company’s ethos.”
Riko Fishing is dedicated to prawn trawling off the South Coast of KwaZulu-Natal. The acquisition of a sea vessel, MV Ocean Spray, has enabled the company to complete the value chain of seafood wholesale and distribution. A related party of Riko Fishing that was already in existence when the company purchased the MV Ocean Spray in July 2016 serves asan outlet for its entire catch. The local harvesting of seafood products replaces goods which were previously imported thus contributing to the GDP.
The R2.7 million facility approved through enabled Riko Fishing to refurbish the vessel to the extent where it was operational and adhering to safety standards relating to the rigorously governed industry.
The owners’ focus and strategic involvement ensures that business is always done with precision. Values are regarded as key at Riko Fishing which is evident in management’s endeavours to empower and support its employees.

Small Enterprise Finance Agency54
Case Studies
Mahlaku a Mosebo Contractors CCKey information
Location: Polokwane, LimpopoJob Creation: 110 JobsApproved amount: R4.3 million
Mahlaku a Mosebo Contractors CC is wholly owned by Ms Mokgadi Chaba a black woman with rheumatoid arthritis which has led to her physical disability. The Polokwane-based construction company commenced its operations which include building construction, civil works and mining related activities in the early 2000s.
The owner, Ms Chaba was born and bred in Limpopo province which gives her competitive advantage in her market space. Prior to venturing into entrepreneurship, Ms Chaba was a teacher – a profession she held for a period of 10 years since 1991. Her tenure as a teacher saw her furthering her studies and obtaining a Masters Degree in Curriculum Studies from the University of Venda. That is the drive and attitude that has seen her steering Mahlaku a Mosebo into the soaring heights it is today.
Life presented her with a setback when she was diagnosed with multiple joints rheumatoid arthritis ailment in 2001. However, the chronic and progressive disease which often causes deformation of joints did not get in her way of being a successful entrepreneur. Since inception, her business venture has successfully executed various building construction projects obtained from private and public institutions in and around Limpopo.
In 2016, Ms Chaba wanted to expand her multipronged business and needed funding. She approached the IDC’s office in Polokwane who redirected her to sefa. Mahlaku a Mosebo’s loan application of R4.3 million was approved to be repaid over a five month period with a two month capital and interest moratorium at an interest of 7% in 2016. The loan of which R1.5 million has been disbursed by year end, was granted at a reduced interest rate because this company is a beneficiary of the Amavulandlela Funding Scheme – a scheme specifically designed to support entrepreneurs with physical disabilities. The loan was used to purchase raw materials and the provision of working capital to service a contract awarded to Mahlaku a Mosebo by the Co-operative Governance, Human Settlements and Traditional Affairs (CoGHSTA) for the construction of low cost houses in Mogalakwena Municipality.
The project has immensely contributed to the livelihood of the poorest of the poor in the rural area of Mogalakwena with the employment creation and the provision of housing. The housing project created at least a total of 110 employment opportunities made up of 23 and 87 females and males respectively.
The establishment of a building construction business owned by Ms Chaba, has shown courage and determination in a male dominated industry in South Africa. sefa is proud to be associated with this close corporation.
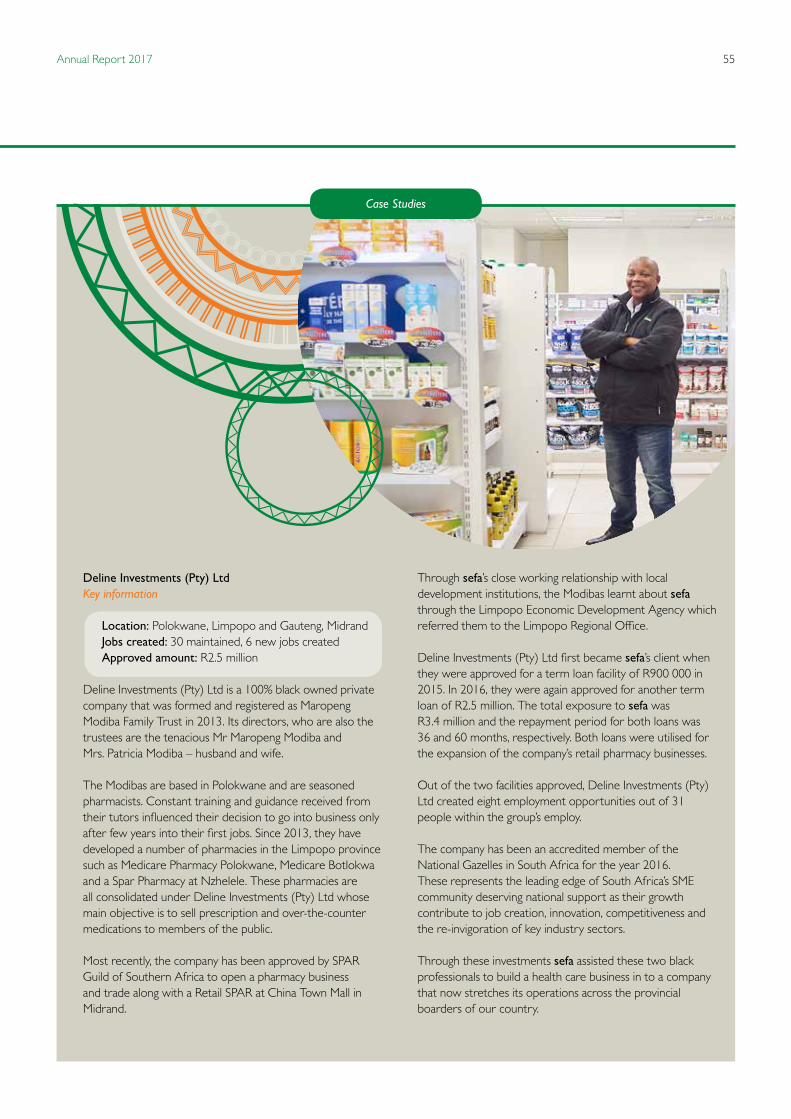
55Annual Report 2017
Case Studies
Deline Investments (Pty) LtdKey information
Location: Polokwane, Limpopo and Gauteng, MidrandJobs created: 30 maintained, 6 new jobs createdApproved amount: R2.5 million
Deline Investments (Pty) Ltd is a 100% black owned private company that was formed and registered as Maropeng Modiba Family Trust in 2013. Its directors, who are also the trustees are the tenacious Mr Maropeng Modiba and Mrs. Patricia Modiba – husband and wife.
The Modibas are based in Polokwane and are seasoned pharmacists. Constant training and guidance received from their tutors influenced their decision to go into business only after few years into their first jobs. Since 2013, they have developed a number of pharmacies in the Limpopo province such as Medicare Pharmacy Polokwane, Medicare Botlokwa and a Spar Pharmacy at Nzhelele. These pharmacies are all consolidated under Deline Investments (Pty) Ltd whose main objective is to sell prescription and over-the-counter medications to members of the public.
Most recently, the company has been approved by SPAR Guild of Southern Africa to open a pharmacy business and trade along with a Retail SPAR at China Town Mall in Midrand.
Through sefa’s close working relationship with local development institutions, the Modibas learnt about sefa through the Limpopo Economic Development Agency which referred them to the Limpopo Regional Office.
Deline Investments (Pty) Ltd first became sefa’s client when they were approved for a term loan facility of R900 000 in 2015. In 2016, they were again approved for another term loan of R2.5 million. The total exposure to sefa was R3.4 million and the repayment period for both loans was 36 and 60 months, respectively. Both loans were utilised for the expansion of the company’s retail pharmacy businesses.
Out of the two facilities approved, Deline Investments (Pty) Ltd created eight employment opportunities out of 31 people within the group’s employ.
The company has been an accredited member of the National Gazelles in South Africa for the year 2016. These represents the leading edge of South Africa’s SME community deserving national support as their growth contribute to job creation, innovation, competitiveness and the re-invigoration of key industry sectors.
Through these investments sefa assisted these two black professionals to build a health care business in to a company that now stretches its operations across the provincial boarders of our country.
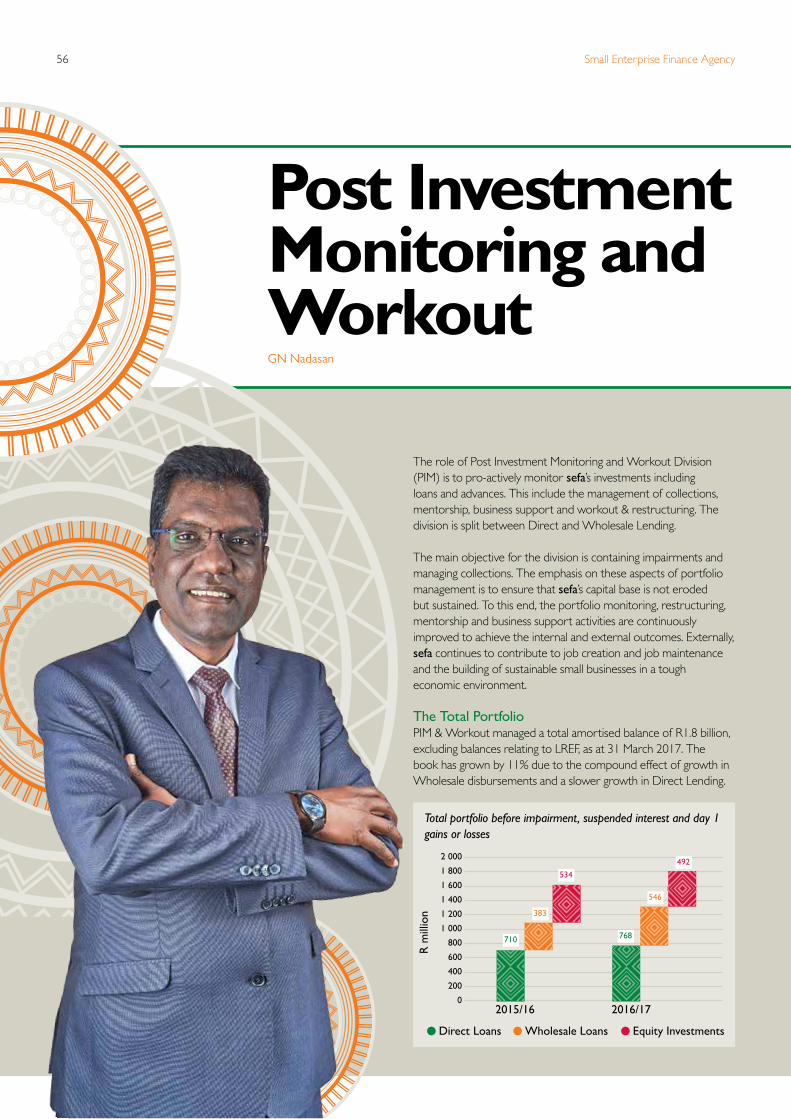
Small Enterprise Finance Agency56
Post Investment Monitoring and Workout
The role of Post Investment Monitoring and Workout Division (PIM) is to pro-actively monitor sefa’s investments including loans and advances. This include the management of collections, mentorship, business support and workout & restructuring. The division is split between Direct and Wholesale Lending.
The main objective for the division is containing impairments and managing collections. The emphasis on these aspects of portfolio management is to ensure that sefa’s capital base is not eroded but sustained. To this end, the portfolio monitoring, restructuring, mentorship and business support activities are continuously improved to achieve the internal and external outcomes. Externally, sefa continues to contribute to job creation and job maintenance and the building of sustainable small businesses in a tough economic environment.
The Total Portfolio PIM & Workout managed a total amortised balance of R1.8 billion, excluding balances relating to LREF, as at 31 March 2017. The book has grown by 11% due to the compound effect of growth in Wholesale disbursements and a slower growth in Direct Lending.
Total portfolio before impairment, suspended interest and day 1 gains or losses
GN Nadasan
R m
illio
n
2016/17
546
492
768
2015/16
383
534
710
2 000
1 800
1 600
1 400
1 200
1 000
800
600
400
200
0
Direct Loans Wholesale Loans Equity Investments

57Annual Report 2017
2015/16 2016/17
399
322
Total Collections PIM collected R322 million from loans and advances. This represents 81% of the expected collection. This was however 20% lower than the previous year due to a slower growth in the lending book as a result of the consolidation of the Direct Lending business.
Total Collections
The Portfolio - Wholesale Lending The Wholesale Lending portfolio comprises of Retail Finance Intermediaries, Equity Investments, Microfinance Institutions, Co-operative Financial Institutions and Enterprising Co-operatives and the Land Reform Empowerment Facility which is managed by sefa on behalf of the Department of Rural Development and Land Reform.
The Wholesale Lending portfolio graph depicts the balance per product type at year end.
Product Portfolio - Wholesale Lending Retail Financial IntermediariesThis loan portfolio increased by 36% year-on-year from R272 million to R371 million. The increase emanated from sefa’s disbursements of R140 million to intermediaries of which 54% went to existing intermediaries and 46% to new intermediaries namely: Royal Fields Finance (Pty) Ltd and SATaxi Development Finance (Pty) Ltd.
Equity InvestmentsThis portfolio reduced by 8% year-on-year from R534 million to R492 million. The reduction was as a result of the reflows of R28.1 million received from Anglo American sefa Mining Fund (Pty) Ltd and Khula Akwandze Fund (Pty) Ltd that are both in the disinvestment stage.
Microenterprise and Co-operative Loans This loan portfolio increased by 58% year-on-year from R111 million to R175 million. The growth was mainly due to disbursements to Siza Capital SA (Pty) Ltd, Phakamani Foundation, Small Enterprise Foundation and three enterprising co-operatives.
R m
illio
n
Post Investment Monitoring and Workout
R m
illio
n
Wholesale Lending Portfolio before impairment, suspended interest and day 1 gains or losses
2016/17
261
492 175
371
2015/16
159
534
111
272
600
500
400
300
200
100
0
MFIs and Co-operatives LREFRFIs Equity investments
LREF is managed on behalf of the Department of Rural Development and Land Reform and therefore it's loan balances are excluded from the results reported in sefa's annual financial statements.
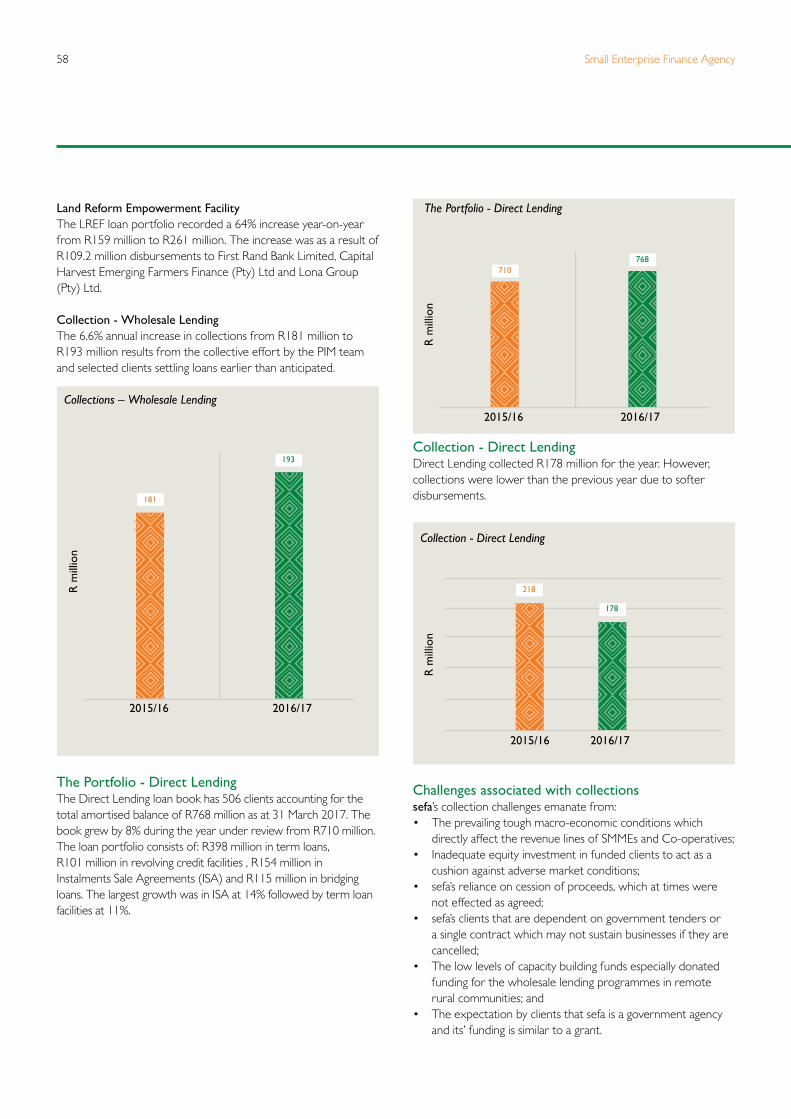
Small Enterprise Finance Agency58
2015/16 2016/17
218
178
R m
illio
n2015/16 2016/17
710768
2015/16 2016/17
181
193
Land Reform Empowerment Facility The LREF loan portfolio recorded a 64% increase year-on-year from R159 million to R261 million. The increase was as a result of R109.2 million disbursements to First Rand Bank Limited, Capital Harvest Emerging Farmers Finance (Pty) Ltd and Lona Group (Pty) Ltd.
Collection - Wholesale Lending The 6.6% annual increase in collections from R181 million to R193 million results from the collective effort by the PIM team and selected clients settling loans earlier than anticipated.
Collections – Wholesale Lending
The Portfolio - Direct LendingThe Direct Lending loan book has 506 clients accounting for the total amortised balance of R768 million as at 31 March 2017. The book grew by 8% during the year under review from R710 million. The loan portfolio consists of: R398 million in term loans, R101 million in revolving credit facilities , R154 million in Instalments Sale Agreements (ISA) and R115 million in bridging loans. The largest growth was in ISA at 14% followed by term loan facilities at 11%.
The Portfolio - Direct Lending
Collection - Direct LendingDirect Lending collected R178 million for the year. However, collections were lower than the previous year due to softer disbursements.
Collection - Direct Lending
Challenges associated with collectionssefa’s collection challenges emanate from: • The prevailing tough macro-economic conditions which
directly affect the revenue lines of SMMEs and Co-operatives;• Inadequate equity investment in funded clients to act as a
cushion against adverse market conditions; • sefa’s reliance on cession of proceeds, which at times were
not effected as agreed; • sefa’s clients that are dependent on government tenders or
a single contract which may not sustain businesses if they are cancelled;
• The low levels of capacity building funds especially donated funding for the wholesale lending programmes in remote rural communities; and
• The expectation by clients that sefa is a government agency and its’ funding is similar to a grant.
R m
illio
n
R m
illio
n
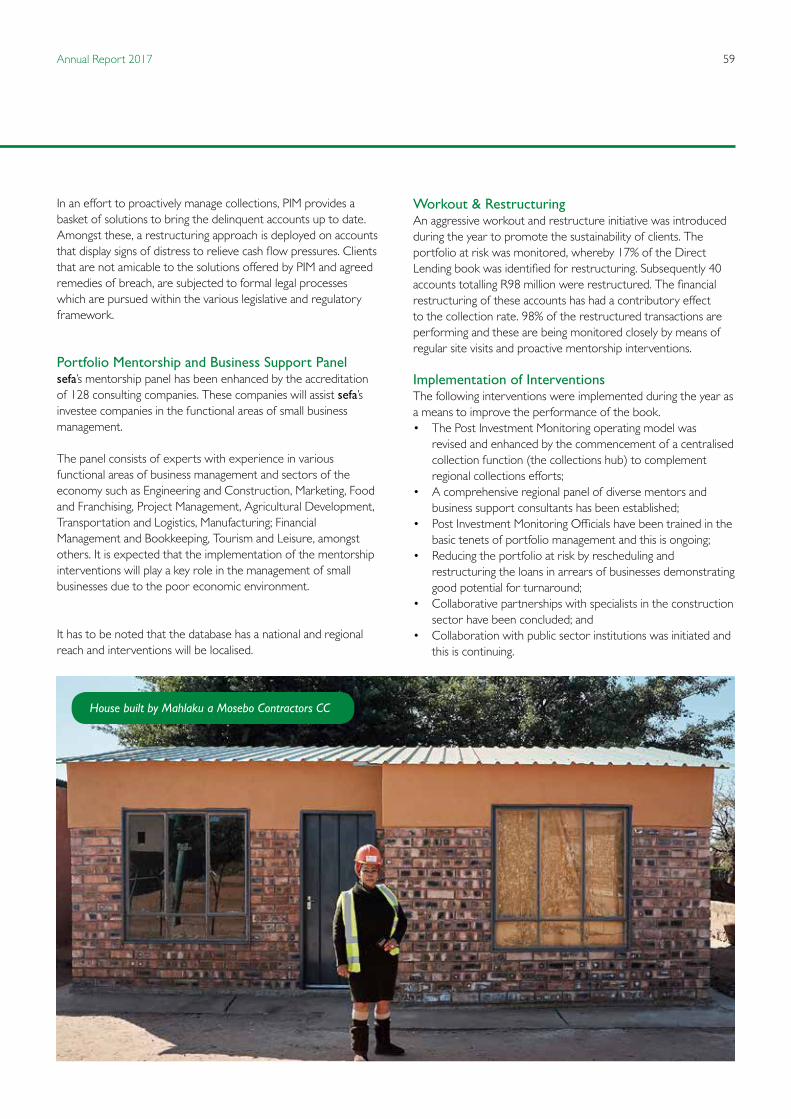
59Annual Report 2017
In an effort to proactively manage collections, PIM provides a basket of solutions to bring the delinquent accounts up to date. Amongst these, a restructuring approach is deployed on accounts that display signs of distress to relieve cash flow pressures. Clients that are not amicable to the solutions offered by PIM and agreed remedies of breach, are subjected to formal legal processes which are pursued within the various legislative and regulatory framework.
Portfolio Mentorship and Business Support Panelsefa’s mentorship panel has been enhanced by the accreditation of 128 consulting companies. These companies will assist sefa’s investee companies in the functional areas of small business management.
The panel consists of experts with experience in various functional areas of business management and sectors of the economy such as Engineering and Construction, Marketing, Food and Franchising, Project Management, Agricultural Development, Transportation and Logistics, Manufacturing; Financial Management and Bookkeeping, Tourism and Leisure, amongst others. It is expected that the implementation of the mentorship interventions will play a key role in the management of small businesses due to the poor economic environment.
It has to be noted that the database has a national and regional reach and interventions will be localised.
Workout & Restructuring An aggressive workout and restructure initiative was introduced during the year to promote the sustainability of clients. The portfolio at risk was monitored, whereby 17% of the Direct Lending book was identified for restructuring. Subsequently 40 accounts totalling R98 million were restructured. The financial restructuring of these accounts has had a contributory effect to the collection rate. 98% of the restructured transactions are performing and these are being monitored closely by means of regular site visits and proactive mentorship interventions.
Implementation of InterventionsThe following interventions were implemented during the year as a means to improve the performance of the book.• The Post Investment Monitoring operating model was
revised and enhanced by the commencement of a centralised collection function (the collections hub) to complement regional collections efforts;
• A comprehensive regional panel of diverse mentors and business support consultants has been established;
• Post Investment Monitoring Officials have been trained in the basic tenets of portfolio management and this is ongoing;
• Reducing the portfolio at risk by rescheduling and restructuring the loans in arrears of businesses demonstrating good potential for turnaround;
• Collaborative partnerships with specialists in the construction sector have been concluded; and
• Collaboration with public sector institutions was initiated and this is continuing.
House built by Mahlaku a Mosebo Contractors CC
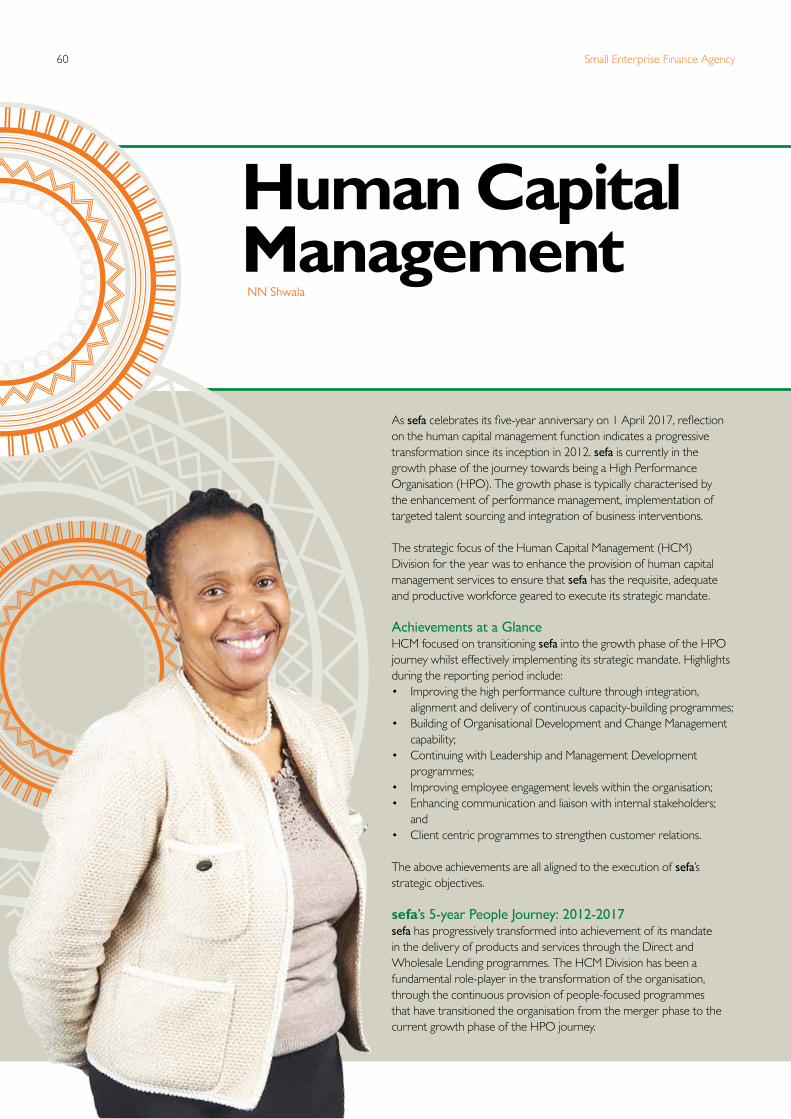
Small Enterprise Finance Agency60
Human Capital Management
As sefa celebrates its five-year anniversary on 1 April 2017, reflection on the human capital management function indicates a progressive transformation since its inception in 2012. sefa is currently in the growth phase of the journey towards being a High Performance Organisation (HPO). The growth phase is typically characterised by the enhancement of performance management, implementation of targeted talent sourcing and integration of business interventions.
The strategic focus of the Human Capital Management (HCM) Division for the year was to enhance the provision of human capital management services to ensure that sefa has the requisite, adequate and productive workforce geared to execute its strategic mandate.
Achievements at a GlanceHCM focused on transitioning sefa into the growth phase of the HPO journey whilst effectively implementing its strategic mandate. Highlights during the reporting period include:• Improving the high performance culture through integration,
alignment and delivery of continuous capacity-building programmes;• Building of Organisational Development and Change Management
capability;• Continuing with Leadership and Management Development
programmes;• Improving employee engagement levels within the organisation; • Enhancing communication and liaison with internal stakeholders;
and• Client centric programmes to strengthen customer relations.
The above achievements are all aligned to the execution of sefa’s strategic objectives.
sefa’s 5-year People Journey: 2012-2017sefa has progressively transformed into achievement of its mandate in the delivery of products and services through the Direct and Wholesale Lending programmes. The HCM Division has been a fundamental role-player in the transformation of the organisation, through the continuous provision of people-focused programmes that have transitioned the organisation from the merger phase to the current growth phase of the HPO journey.
NN Shwala
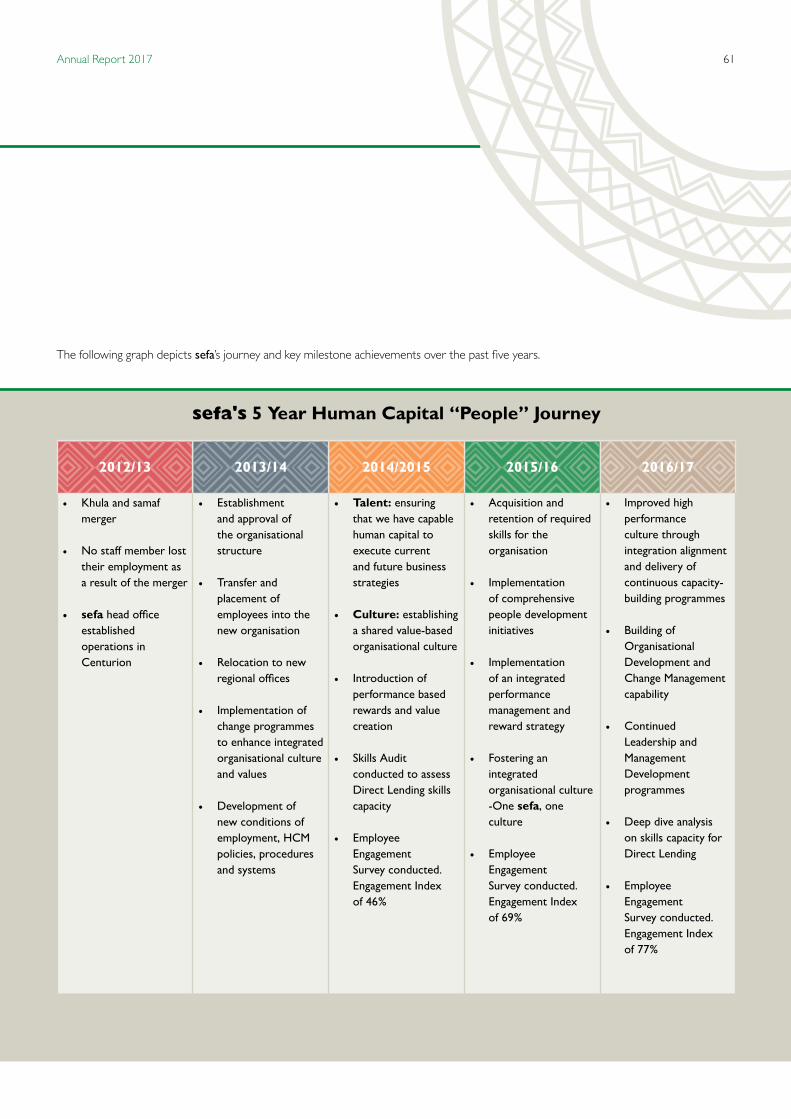
61Annual Report 2017
Human Capital Management
The following graph depicts sefa’s journey and key milestone achievements over the past five years.
sefa's 5 Year Human Capital “People” Journey
2012/13 2013/14 2014/2015 2015/16 2016/17
• Khula and samaf merger
• No staff member lost their employment as a result of the merger
• sefa head office established operations in Centurion
• Establishment and approval of the organisational structure
• Transfer and placement of employees into the new organisation
• Relocation to new regional offices
• Implementation of change programmes to enhance integrated organisational culture and values
• Development of new conditions of employment, HCM policies, procedures and systems
• Talent: ensuring that we have capable human capital to execute current and future business strategies
• Culture: establishing a shared value-based organisational culture
• Introduction of performance based rewards and value creation
• Skills Audit conducted to assess Direct Lending skills capacity
• Employee Engagement Survey conducted. Engagement Index of 46%
• Acquisition and retention of required skills for the organisation
• Implementation of comprehensive people development initiatives
• Implementation of an integrated performance management and reward strategy
• Fostering an integrated organisational culture -One sefa, one culture
• Employee Engagement Survey conducted. Engagement Index of 69%
• Improved high performance culture through integration alignment and delivery of continuous capacity- building programmes
• Building of Organisational Development and Change Management capability
• Continued Leadership and Management Development programmes
• Deep dive analysis on skills capacity for Direct Lending
• Employee Engagement Survey conducted. Engagement Index of 77%

Small Enterprise Finance Agency62
sefa’s HPO JourneyHPO is a concerted effort towards the continuous improvement of organisational performance. sefa’s journey towards the achievement of an HPO status started in 2014 and the goal is projected to be achieved in 2019.
The progressive HPO journey is characterised by three phases which are anchored by employee engagement and organisational capability:
The organisation is currently in the growth phase of the HPO journey. HCM’s strategic work plan for the period under review was geared at delivering interventions that are aimed at transition the organisation through the growth phase which is characterised by effective execution of interventions to enhance Talent Management, Culture Change and Employee Engagement.
Design “Back to Basics”• Define strategic drivers• Understand the clients• Define processes, systems• Define roles and responsibilities
3 key steps anchored by Employee Engagementand Organisational Capability Optimisation “Achievement”
• Enhancement Change Capability• Enhance Internal Communication• Optimisation of business processes and
harnessing of technology• Celebrate Success
Implementation “Growth”• Talent sourcing; right people in the right jobs
doing the right thing• Define the desired culture “What success will
look like”• Develop Talent and Succession Management
Plans• Enhance Performance and Employee Engagement
Phase 3
Em
ploy
ee S
atis
fact
ion
Organisational Capability
Phase 2
Phase 1
Talent / Workforce Alignment
• Post Merger (Hygiene) Issues• Development of Policies and
Procedures• Hiring of the Executive Team• Streamlining HCM Processes
(Performance Management, Employee Relations, Learning & Development)
Talent Management
• Competence: Right people hired and developed
• Culture and Commitment: Creating meaning at work
• Engagement of Value (Value Proposition)
High-Performance Organisation Index (HPOI)
• Focus on characteristics of being an HPO• Refine strategic leadership reporting• Employee engagement level above 80% • Greater standardisation to enhance
organisational performance• Adjust human capital in line with sefa's strategic
objective themes
Organisational Capability Improvement
Growth
Back to Basics
2012-2015 2012-2018 2018
Optimisation
Working towards being a High-Performance Organisation

63Annual Report 2017
Total Core Support
236
100%
61%
39%
144
92
The 2016/17 HCM Strategic Work Plan execution was centred on the enhancing process and system synergies towards the achievement of sefa’s strategic objectives. The key focus areas included the following:• Implementation of a comprehensive skills enhancement
approach to improve the sefa skills base.• Strengthening the awareness of sefa culture and core values
towards a high performance culture.• Implementation of organisational effectiveness interventions to
drive towards a high-performance organisation.• Optimisation of a harmonised working environment through
delivery of wellness, remuneration and employee relations programmes.
• Provision of an adequate, safe and secure employee working environment.
Talent Acquisition and Retentionsefa’s talent acquisition processes are aimed at ensuring that the right skills/talent is recruited in the right position at the right time. The core skills of the organisation are primarily within the finance field with specific focus on a deep understanding of due diligence and competencies to identify and analyse that the organisation is making correct investment decisions when it invests in small business. HCM continues to hire the best talent in the core and critical positions. Our retention strategies include promoting work-life balance for our employee's wellness and rewarding high performance.
HeadcountDuring the period under review, sefa maintained a headcount of 236 employees, including fixed-term contractors. The organisation continues to keep a flexible component of its workforce at a minimal alignment with the cost containment measures in support of the long-term financial sustainability of the agency.
The following graph depicts the sefa workforce profile comparison between the previous and the current reporting period.
An analysis of the staff profile reflects that 61% of the employees are in core functions and 39% are in support functions. Core business functions include Direct Lending, Wholesale Lending, Credit, Post Investment Monitoring and Workout.
Support business functions include: HCM & Facilities, Finance and Procurement, Strategy Planning & Reporting, Legal Services, Enterprise Risk Management, Compliance, Information Technology, Company Secretary, Marketing & Communications, and Internal Audit.
Headcount According to Staff Categories
Core Staff & Support Staff Comparison
The sefa employment equity metrics reflects that the organisation exceeded its target for African representation by 3%. There is a slight variance of 2% in the representation of Coloured and Indian employees.
020
40
60
80
100
120140
6
53
6
57
128
47
5
132
37
4
Executives Managers Professionals Administrators Support
White
Indian
Coloured
African
2015/16 2016/17 Target Actual0% 10% 20% 30% 40% 50% 60% 70% 80% 90%
8%
5%
7%
80%
8%
3%
4%
83%
Headcount Equity Representation

Small Enterprise Finance Agency64
Male Female
0
50
100
150
200
250
300
2015 2016 2017
80100
127139 144
92
Gender Representation Graph over a 3 year period
The graph reflecting the gender profile shows a steady increase in female representation.
Staff turnover on critical roles was at 6% against a target of 7% and the industry average is at 10%.
Implementation of a Comprehensive Skills Enhancement Approach The strategic focus for the growth phase of the HPO journey includes enhancement of skills and competencies. The HCM Division continues to implement people development interventions based in the organisations 3E Learning and Development Framework to ensure the organisational performance is improved through (Education, Experience and Exposure).
sefa’s focus has been on enhancement of the Formal Learning element as a result of the organisation’s skills legacy issues hence the Learning and Development budget utilisation focused primarily on strengthening the core skills to address identified gaps. The Division ensured that all learning interventions are aligned to the corporate plan and supported by Individual Development Plans and Performance Improvement Plans.
Comprehensive Learning SolutionsThe delivery of learning solutions continued to be strengthened during the period under review, as the HCM Division continued to leverage its partnerships with other Development Finance Institutions (DFIs) such as the IDC Academy and Business Partners as well as other Institutions of higher learning.
Talent development continued to play a pivotal role in the organisation, by promoting skills growth through the advancement of preferential Historically Disadvantaged Individuals (“HDI’s”) that is, black and female employees within limited financial resources without compromising quality. sefa improved on the learning interventions targeted at black employees from 57% in 2016 to 61% in 2017.
1.3% of staff costs budget, was allocated for skills development for 2016/17 with emphasis in the development of the following core skills:• Financial Analysis;• Financial Modelling;• Due Diligence;• Interpretation of Financial Statements; and• Credit Control and Collections.
The other training interventions offered were in the following areas:• Project management;• Leadership Coaching;• Information Technology;• Human Capital Management; and• Compliance and Governance.
Driving Values and Culture IntegrationValues and culture integration is a key component of the Growth Phase of the HPO journey. The one-sefa-one culture drive was continued with the following interventions being implemented:• CEO regional coffee sessions aimed at creating a platform
for employees to contribute towards the shaping and improvement of the organisational culture.
• Culture Change Project was initiated; culture and values workshops were commenced in an effort to create awareness on the sefa values and a high performance culture.
• The CEO shared strategic information on the performance of the organisation at the CEO’s Quarterly Forums.
Social Learning: Learning Networks, Communities of Practice, Mentoring and Coaching
Experiential Learning: New and Challenging WorkExperience, Reflective Projects and Assignments
Formal Learning: Structured Courses andProgrammes
EXPERIENCE
EDUCATION10%
70%
20%
EXPOSURE
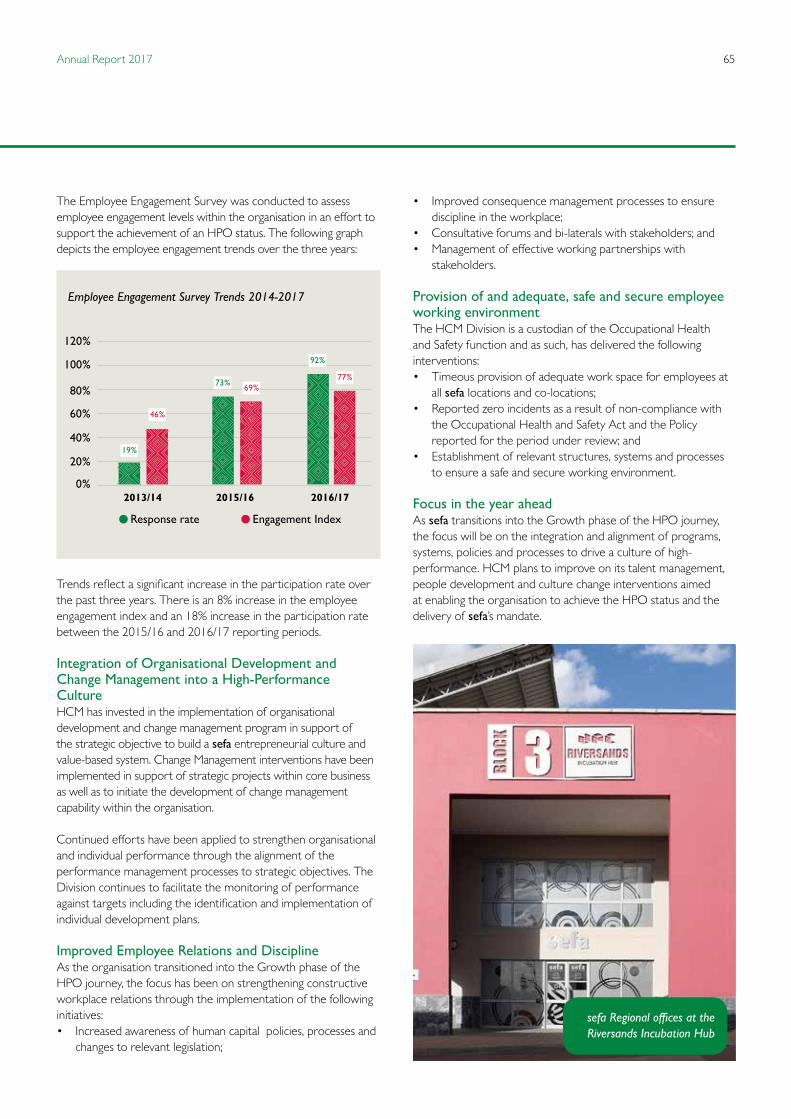
65Annual Report 2017
The Employee Engagement Survey was conducted to assess employee engagement levels within the organisation in an effort to support the achievement of an HPO status. The following graph depicts the employee engagement trends over the three years:
Employee Engagement Survey Trends 2014-2017
Trends reflect a significant increase in the participation rate over the past three years. There is an 8% increase in the employee engagement index and an 18% increase in the participation rate between the 2015/16 and 2016/17 reporting periods.
Integration of Organisational Development and Change Management into a High-Performance CultureHCM has invested in the implementation of organisational development and change management program in support of the strategic objective to build a sefa entrepreneurial culture and value-based system. Change Management interventions have been implemented in support of strategic projects within core business as well as to initiate the development of change management capability within the organisation.
Continued efforts have been applied to strengthen organisational and individual performance through the alignment of the performance management processes to strategic objectives. The Division continues to facilitate the monitoring of performance against targets including the identification and implementation of individual development plans.
Improved Employee Relations and DisciplineAs the organisation transitioned into the Growth phase of the HPO journey, the focus has been on strengthening constructive workplace relations through the implementation of the following initiatives:• Increased awareness of human capital policies, processes and
changes to relevant legislation;
• Improved consequence management processes to ensure discipline in the workplace;
• Consultative forums and bi-laterals with stakeholders; and• Management of effective working partnerships with
stakeholders.
Provision of and adequate, safe and secure employee working environmentThe HCM Division is a custodian of the Occupational Health and Safety function and as such, has delivered the following interventions:• Timeous provision of adequate work space for employees at
all sefa locations and co-locations;• Reported zero incidents as a result of non-compliance with
the Occupational Health and Safety Act and the Policy reported for the period under review; and
• Establishment of relevant structures, systems and processes to ensure a safe and secure working environment.
Focus in the year aheadAs sefa transitions into the Growth phase of the HPO journey, the focus will be on the integration and alignment of programs, systems, policies and processes to drive a culture of high-performance. HCM plans to improve on its talent management, people development and culture change interventions aimed at enabling the organisation to achieve the HPO status and the delivery of sefa’s mandate.
0%
20%
40%
60%
80%
100%
120%
19%
46%
73%
92%
77%69%
Response rate Engagement Index
2013/14 2015/16 2016/17
sefa Regional offices at the Riversands Incubation Hub
Small Enterprise Finance Agency66
Stakeholder Relations and Communication
Marketing and CommunicationsMarketing and Communications’ role is to support sefa to carry out its mandate. The Unit ensures that sefa is visible by consistently engaging with the stakeholders and running awareness campaigns about sefa’s offerings and success stories. This was done across South Africa through outreach programmes, marketing and publicity, particularly within its target market, namely, the SMMEs and Co-operatives.
Outreach Programmes 2016/17 financial yearMarketing and Communications worked very closely with the operations Divisions (Direct and Wholesale Lending) to assist them in marketing and publicising their products and thereby spreading their geographic footprint in South Africa.
During the year under review, sefa initiated and participated in a total of 223 outreach platforms across the country to market sefa products. Out of these, 26 were breakfast sessions with SMMEs and Co-operatives. The Division participated in 34 events where sefa either delivered presentations or exhibited its products. Regional Offices also embarked on a total of 163 events by either exhibiting or presenting sefa credentials.
Print and Electronic Media CommunicationAs part of publicity during the reporting period, sefa was featured in the media 95 times. The number of media appearances constituted community radio and print media, commercial and public print and radio as well as adverts placed across various media houses nationally.
Marketing and BrandingIn line with the agency’s corporate plan and its vision to maximise its impact within the small business and co-operative markets, a number of marketing activities which included the production
of marketing collaterals for all new sefa products such as the Amavulandlela Funding Scheme for entrepreneurs with physical disabilities and Fresh Produce Markets in Durban and Bloemfontein were designed. Collaterals were produced to reflect the spoken languages in both Free State and KwaZulu-Natal.
The Unit also responded to the ever changing needs of the clients by producing new product application forms for Direct and Wholesale Lending products.
Access to sefa productsDuring this period sefa was able to extend its footprint nationally through the opening of co-location points in key towns. For those areas where a sefa representative is not available daily, the Marketing and Communication Unit produced drop boxes wherein clients can deposit their application forms and enquiries. This was meant to support easy access to sefa products in key South African towns where new co-location offices were deployed.
sefa ClientsCustomer satisfaction is a key differentiator that helps organisations to attract new clients in line with sefa’s expansion growth. The Marketing and Communication Unit responded in the 2016/17 financial year by implementing client improvement projects which have seen the Division conducting bi-annual customer satisfactions surveys. According to the survey at least 77% of our clients are satisfied with sefa services. This is a step in the right direction as sefa puts customer service at the centre of its delivery model.
To pluck the gaps on customer service, the Unit also rolled out the Client Service Charter. The Charter gives a guide on how to improve client service for staff interfacing directly with clients.
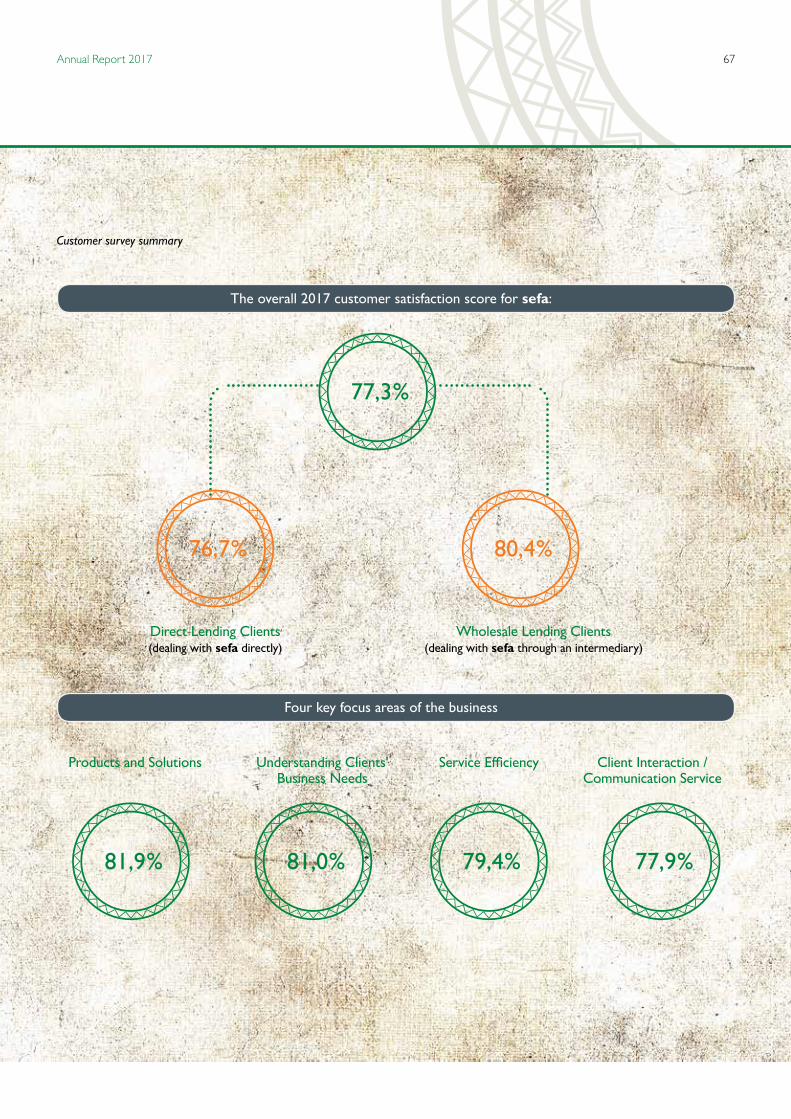
Stakeholder Relations and Communication
67Annual Report 2017
Customer survey summary
The overall 2017 customer satisfaction score for sefa:
Four key focus areas of the business
77,3%
81,9% 81,0% 79,4% 77,9%
76,7% 80,4%
Direct Lending Clients(dealing with sefa directly)
Products and Solutions Understanding Clients' Business Needs
Service Efficiency Client Interaction / Communication Service
Wholesale Lending Clients(dealing with sefa through an intermediary)

Small Enterprise Finance Agency68 Small Enterprise Finance Agency68Rocket Plantation at Lukhanji Masisebenzisane Secondary Co-operative ofChris Hani Co-operative Development Centre
69Annual Report 2017
Group and Company Annual Financial StatementsFor the Audited Year Ended 31 March 2017
69Annual Report 2017
Statement of Responsibility by the Board of Directors 70
Directors’ Report 71
Declaration by the Group Company Secretary 73
Independent Auditor’s Report 74
Statement of Financial Position 77
Statements of Profit or Loss and other Comprehensive Income 78
Statements of Changes In Equity 79
Statements of Cash Flows 80
Notes to the Financial Statements 81
The annual financial statements have been prepared under the supervision of the Group’s Chief Financial Officer, RV Ralebepa CA(SA). The financial statements have been audited in compliance with Section 30 of the Companies Act of South Africa.

Small Enterprise Finance Agency70
The Directors of sefa are responsible for the maintenance of adequate accounting records and preparation of the Group annual financial statements, together with related information.
These Group annual financial statements are prepared in accordance with International Financial Reporting Standards and applicable accounting policies as well as, the requirements of the Public Finance Management Act, Companies Act of South Africa.
In preparing the Group annual financial statements, the Directors should ensure that these fairly present the state of affairs of the Company, its financial results, its performance against pre-determined objectives and its financial position at the end of any given financial year.
The Directors acknowledge that they are ultimately responsible for the process of risk management and the systems of internal controls. Management assists the Directors to meet these responsibilities. Standards and systems of internal control are designed and implemented by management to provide reasonable assurance as to the integrity and reliability of the Group annual financial statements in accordance with IFRS and to adequately safeguard, verify and maintain accountability for assets. Accounting policies supported by judgements, estimates and assumptions which comply with IFRS are applied on a consistent and going concern basis. Systems of internal controls include the proper delegation of responsibilities within a clearly defined framework, effective accounting procedures and adequate segregation of duties.
Based on the information and explanations given by management, internal auditors and discussions held with external auditors on the results of their audits, the Directors are of the opinion that the internal financial controls are adequate and can be relied upon for preparing the financial statements, and accountability for assets and liabilities is maintained.
Nothing has come to the attention of the Directors indicating any breakdown in the functioning of these internal controls, which could result in material loss to the Company during the year under review, and until the date of this report. The Directors have a reasonable expectation that the Company and its subsidiaries have adequate resources to continue in operational existence for the foreseeable future. For this reason, the Directors continue to adopt a going concern approach in preparation of the financial statements.
The Group annual financial statements have been audited by the Company’s independent External Auditors, KPMG Inc., who have been given unrestricted access to all financial records and related information, including minutes of Shareholder, Board and Board Committee meetings. KPMG Inc.’s audit report is contained in this Annual Report on pages 74 to 76.
The Directors are of the opinion that the Group annual financial statements fairly present the financial position of sefa and the results of its operations and cash flow information as at 31 March 2017.
Against this background, the Directors of the Company accept responsibility for the Group annual financial statements which were approved by the Board of Directors on 20 June 2017 and are signed on its behalf by:
HN Lupuwana-PembaChairperson of the Board of DirectorsAuthorised Director
TR MakhuvhaChief Executive OfficerAuthorised Director
Statement of Responsibility by the Board of Directors for the year ended 31 March 2017

71Annual Report 2017
Directors’ Reportfor the year ended 31 March 2017
Introductionsefa is registered as a State Owned Company in terms of the Companies Act and is a Schedule 2 listed entity in terms of the PFMA and Treasury regulations. This report is presented in accordance with the provisions of the prescribed legislation and addresses the performance of sefa, as well as relevant statutory information requirements. The Board of Directors is the accounting authority as prescribed in the PFMA.
Nature of businesssefa is a DFI, which provides finance to SMMEs and Co-operatives directly through its branch network and indirectly through Financial Intermediaries and other suitable financial institutions. Finance is provided in the form of loans, equity capital and credit indemnities. The Group also owns a portfolio of business premises that are leased to commercial undertakings.
Fundingsefa’s capital funding requirements are sourced mainly from grants received from the Economic Development Department through sefa’s only Shareholder, the IDC. In addition to grants received, the IDC committed to funding in the amount of R921million (2016: R921million) should this be required in the future.
A grant of R213 million (2016: R406 million) was received from government to support sefa’s activities. The grant was paid to the IDC, which is conducting the required oversight over sefa’s operations, and was made available to sefa for operational purposes through a Shareholder’s loan.
Public Finance Management Actsefa’s Board of Directors is responsible for the development of the Company’s strategic direction. The Company’s strategy and business plan are captured in the Shareholder’s Compact which is agreed with the shareholder and forms the basis for the Company’s detailed action plans and on-going performance evaluation.
The responsibility for the day-to-day management of the Company vests in line management through a clearly defined organisational structure and through a formal Delegation of Authority.
sefa has a comprehensive system of internal controls, which is designed to ensure that the Company’s objectives are met, including the requirements of the Companies Act and the recommendations of King III. These systems and controls meet the requirements of the PFMA.
There are processes in place to ensure that where these controls fail, such failure is detected and corrected.
Short Term Insurance Actsefa’s wholly owned subsidiary KCG’s indemnity product is registered as an insurance product with the FSB and is regulated by the STIA. Quarterly and annual returns must be submitted to the FSB which may conduct compliance reviews.
Subsidiaries, Joint Ventures and AssociatesDetails of each trading subsidiary, joint venture and associate are set out in the notes to the financial statements.
DividendsNo dividends have been declared during the year and none is recommended (2016: Rnil).
Share capitalThe authorised and issued share capital remained unchanged during the year (2016: unchanged).
Materiality and significanceMateriality levels for reporting in terms of Section 55(2)(b)(i) of the PFMASection 55(2)(b)(i) of the PFMA states that the annual report and financial statements should include particulars of any material losses through criminal conduct and irregular expenditure and fruitless and wasteful expenditure that occurred during the financial year. The term material has not been defined in the Act. Significance levels detailed below were used for the purpose of determining materiality.
Significance levels related to Sections 51(1)(g) and 54(2) of the PFMASections 51(1)(g) and 54(2) of the PFMA read in conjunction with the related practice note requires the use of a significance framework.
Based on the guidelines in the practice note and after evaluating the total assets, total revenue and loss after tax for the sefa Group, a significance level of R46 million has been adopted.
Unauthorised, fruitless and wasteful and irregular expenditureUnauthorised expenditureNo expenditure was classified as unauthorised during the financial year (2016: Rnil).

Small Enterprise Finance Agency72
Fruitless and wasteful expenditureThe PFMA defines fruitless and wasteful expenditure as expenditure which was made in vain and would have been avoided had reasonable care been exercised.
Fruitless and wasteful expenditure amounted to Rnil (2016: R1 235).
Irregular expenditureIrregular expenditure signifies expenditure incurred without adhering to established rules, regulations, procedural
guidelines, policies, principles or practices that have been implemented to ensure compliance with the PFMA, relevant tender regulations as well as any other relevant procurement regulations.
Refer to note 35 for detailed information on irregular expenditure incurred.
DirectorsThe Directors in office during the financial year and up to the date of the approval of the annual financial statements were:
Non-Executive Directors that retired during the yearDirector Retirement date
M Ferreira 31 August 2016
GS Gouws 31 October 2016
O Henwood 31 October 2016
SA Molepo 30 September 2016
VG Mutshekwane 31 October 2016
K Schumann 30 April 2016
IAS Tayob 31 October 2016
Non-Executive Directors re-elected during the yearDirectorHN Lupuwana-Pemba
LB Mavundla
Newly appointed Non-Executive DirectorsDirector Appointment dateNA Dlamini 1 October 2016
NS Dlamini 1 October 2016
C Groves 1 October 2016
PM Mainganya 1 October 2016
K Molewa 1 October 2016
KK Moloto 1 October 2016
NA Osman 1 October 2016
H Ralinala 1 October 2016
Executive DirectorDirectorTR Makhuvha (Chief Executive Officer)
Post reporting date eventsThe Directors are not aware of any other matter or circumstance arising since the end of the financial year and 20 June 2017, not otherwise dealt with in the report that would affect the operations of the Company or the Group significantly.
Directors’ Report (continued)for the year ended 31 March 2017

73Annual Report 2017
In terms of section 88(2)(e) of the Companies Act No.71 of 2008, I, NB Mongali, in my capacity as Group Company Secretary, confirm that, to the best of my knowledge and belief, the Company has filed all required returns and notices with the Companies and Intellectual Property Commission, and that such returns appear to be true, correct and up-to-date.
NB MongaliGroup Company Secretary20 June 2017
Declaration by the Group Company Secretary for the year ended 31 March 2017
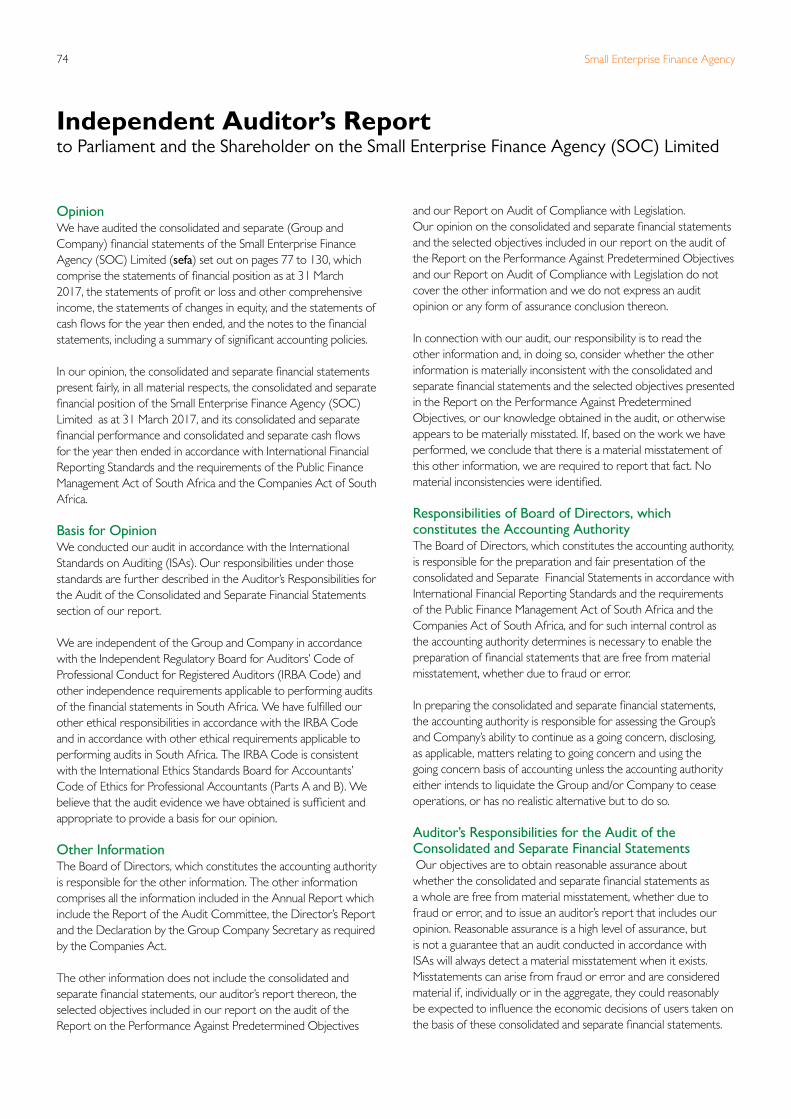
Small Enterprise Finance Agency74
OpinionWe have audited the consolidated and separate (Group and Company) financial statements of the Small Enterprise Finance Agency (SOC) Limited (sefa) set out on pages 77 to 130, which comprise the statements of financial position as at 31 March 2017, the statements of profit or loss and other comprehensive income, the statements of changes in equity, and the statements of cash flows for the year then ended, and the notes to the financial statements, including a summary of significant accounting policies.
In our opinion, the consolidated and separate financial statements present fairly, in all material respects, the consolidated and separate financial position of the Small Enterprise Finance Agency (SOC) Limited as at 31 March 2017, and its consolidated and separate financial performance and consolidated and separate cash flows for the year then ended in accordance with International Financial Reporting Standards and the requirements of the Public Finance Management Act of South Africa and the Companies Act of South Africa.
Basis for OpinionWe conducted our audit in accordance with the International Standards on Auditing (ISAs). Our responsibilities under those standards are further described in the Auditor’s Responsibilities for the Audit of the Consolidated and Separate Financial Statements section of our report.
We are independent of the Group and Company in accordance with the Independent Regulatory Board for Auditors’ Code of Professional Conduct for Registered Auditors (IRBA Code) and other independence requirements applicable to performing audits of the financial statements in South Africa. We have fulfilled our other ethical responsibilities in accordance with the IRBA Code and in accordance with other ethical requirements applicable to performing audits in South Africa. The IRBA Code is consistent with the International Ethics Standards Board for Accountants’ Code of Ethics for Professional Accountants (Parts A and B). We believe that the audit evidence we have obtained is sufficient and appropriate to provide a basis for our opinion.
Other InformationThe Board of Directors, which constitutes the accounting authority is responsible for the other information. The other information comprises all the information included in the Annual Report which include the Report of the Audit Committee, the Director’s Report and the Declaration by the Group Company Secretary as required by the Companies Act.
The other information does not include the consolidated and separate financial statements, our auditor’s report thereon, the selected objectives included in our report on the audit of the Report on the Performance Against Predetermined Objectives
and our Report on Audit of Compliance with Legislation.Our opinion on the consolidated and separate financial statements and the selected objectives included in our report on the audit of the Report on the Performance Against Predetermined Objectives and our Report on Audit of Compliance with Legislation do not cover the other information and we do not express an audit opinion or any form of assurance conclusion thereon.
In connection with our audit, our responsibility is to read the other information and, in doing so, consider whether the other information is materially inconsistent with the consolidated and separate financial statements and the selected objectives presented in the Report on the Performance Against Predetermined Objectives, or our knowledge obtained in the audit, or otherwise appears to be materially misstated. If, based on the work we have performed, we conclude that there is a material misstatement of this other information, we are required to report that fact. No material inconsistencies were identified.
Responsibilities of Board of Directors, which constitutes the Accounting AuthorityThe Board of Directors, which constitutes the accounting authority, is responsible for the preparation and fair presentation of the consolidated and Separate Financial Statements in accordance with International Financial Reporting Standards and the requirements of the Public Finance Management Act of South Africa and the Companies Act of South Africa, and for such internal control as the accounting authority determines is necessary to enable the preparation of financial statements that are free from material misstatement, whether due to fraud or error.
In preparing the consolidated and separate financial statements, the accounting authority is responsible for assessing the Group’s and Company’s ability to continue as a going concern, disclosing, as applicable, matters relating to going concern and using the going concern basis of accounting unless the accounting authority either intends to liquidate the Group and/or Company to cease operations, or has no realistic alternative but to do so.
Auditor’s Responsibilities for the Audit of the Consolidated and Separate Financial Statements Our objectives are to obtain reasonable assurance about whether the consolidated and separate financial statements as a whole are free from material misstatement, whether due to fraud or error, and to issue an auditor’s report that includes our opinion. Reasonable assurance is a high level of assurance, but is not a guarantee that an audit conducted in accordance with ISAs will always detect a material misstatement when it exists. Misstatements can arise from fraud or error and are considered material if, individually or in the aggregate, they could reasonably be expected to influence the economic decisions of users taken on the basis of these consolidated and separate financial statements.
Independent Auditor’s Reportto Parliament and the Shareholder on the Small Enterprise Finance Agency (SOC) Limited
75Annual Report 2017
As part of an audit in accordance with the ISAs, we exercise professional judgement and maintain professional scepticism throughout our audit of the consolidated and separate financial statements, and the procedures performed on reported performance information for selected objectives and on the Company’s compliance with respect to the selected subject matters. We also:• Identify and assess the risks of material misstatement of the
consolidated and separate financial statements, whether due to fraud or error, design and perform audit procedures responsive to those risks, and obtain audit evidence that is sufficient and appropriate to provide a basis for our opinion. The risk of not detecting a material misstatement resulting from fraud is higher than for one resulting from error, as fraud may involve collusion, forgery, intentional omissions, misrepresentations, or the override of internal control.
• Obtain an understanding of internal control relevant to the audit to design audit procedures that are appropriate in the circumstances, but not for the purpose of expressing an opinion on the effectiveness of the Group’s and Company’s internal control.
• Evaluate the appropriateness of accounting policies used and the reasonableness of accounting estimates and related disclosures made by the accounting authority.
• Conclude on the appropriateness of the accounting authority’s use of the going concern basis of accounting and based on the audit evidence obtained, whether a material uncertainty exists related to events or conditions that may cast significant doubt on the Group’s and the Company’s ability to continue as a going concern. If we conclude that a material uncertainty exists, we are required to draw attention in our auditor’s report to the related disclosures in the consolidated and separate financial statements or, if such disclosures are inadequate, to modify our opinion. Our conclusions are based on the audit evidence obtained up to the date of our auditor’s report. However, future events or conditions may cause the Group and/or the Company to cease to continue as a going concern.
• Evaluate the overall presentation, structure and content of the consolidated and separate financial statements, including the disclosures, and whether the consolidated and separate financial statements represent the underlying transactions and events in a manner that achieves fair presentation.
• Obtain sufficient appropriate audit evidence regarding the financial information of the entities or business activities within the Group to express an opinion on the consolidated financial statements. We are responsible for the direction, supervision and performance of the Group audit. We remain solely responsible for our audit opinion.
We communicate with the accounting authority regarding, among other matters, the planned scope and timing of the audit and significant audit findings, including any significant deficiencies in internal control that we identify during our audit.
We also provide the accounting authority with a statement that we have complied with relevant ethical requirements regarding independence, and communicate all relationships and other matters that may reasonably be thought to have a bearing on our independence, and where applicable, related safeguards.
Report on the Audit of the Report on the Performance Against Predetermined ObjectivesIntroduction and ScopeIn accordance with the Public Audit Act of South Africa and the general notice issued in terms thereof we have a responsibility to report material findings on the reported performance information against predetermined objectives for selected objectives presented in the Report on the Performance Against Predetermined Objectives. We performed procedures to identify findings but not to gather evidence to express assurance.
Our procedures address the reported performance information which must be based on the approved performance planning documents of the Group. We have not evaluated the completeness and appropriateness of the performance indicators established and included in the planning documents. Our procedures also did not extend to any disclosures or assertions relating to planned performance strategies and information in respect of future periods that may be included as part of the reported performance information. Accordingly our findings do not extend to these matters.
We evaluated the usefulness and reliability of the reported performance information in accordance with the criteria developed from the Performance Management and Reporting Framework, as defined in the general notice, for the following selected objectives presented in the Report on the Performance Against Predetermined Objectives of the Group for the year ended 31 March 2017:
Objectives Pages in the Report on the Performance Against Predetermined Objectives
Customer Perspective 12-13
Financial Perspective 12-13
We performed procedures to determine whether the reported performance information was properly presented and whether performance was consistent with the approved performance planning documents.
We performed further procedures to determine whether the indicators and related targets were measurable and relevant, and assessed the reliability of the reported performance information to determine whether it was valid, accurate and complete.
Independent Auditor’s Report (continued)to Parliament and the Shareholder on the Small Enterprise Finance Agency (SOC) Limited
Small Enterprise Finance Agency76
Independent Auditor’s Report (continued)to Parliament and the Shareholder on the Small Enterprise Finance Agency (SOC) Limited
We did not identify any material findings on the usefulness and reliability of the reported performance information for the above objectives.
Report on the Audit of Compliance with LegislationIntroduction and ScopeIn accordance with the Public Audit Act of South Africa and the general notice issued in terms thereof we have a responsibility to report material findings on the compliance of the Company with specific matters in key legislation. We performed procedures to identify findings but not to gather evidence to express assurance. We did not identify any instances of material non-compliance with specific matters in key legislation, as set out in the general notice issued in terms of the Public Audit Act of South Africa.
Internal Control DeficienciesWe considered internal control relevant to our audit of the consolidated and separate financial statements, the Report on the Performance Against Predetermined Objectives and compliance with legislation, however the objective is not to express any form of assurance thereon. We did not identify any significant deficiencies in internal control. We do not express an opinion on the effectiveness of the Group’s and Company’s internal control.
Other ReportsWe draw attention to the following engagements conducted by various parties that have or could potentially have an impact on the matters reported on the Group and Company’s financial performance and compliance related matters. The reports noted do not form part of our opinion on the financial statements or our findings on the reported performance information or compliance with legislation.
We were engaged to perform the following audit-related services:An agreed upon procedures engagement was performed on National Credit Act compliance. The procedures performed were to ensure compliance with the National Credit Act. The report covered the period 1 April 2012 to 31 March 2016, and was issued to sefa on 28 October 2016.
An agreed upon procedures engagement was performed on Investment Property. The procedures were performed solely to assist in the transfer of various investment properties. The report covered the period 17 February 2017 to 20 February 2017, and was issued to Khula Business Premises Proprietary Limited on 20 February 2017.
An agreed upon procedures engagement is being performed on Investment Property. The procedures will solely assist with the transfer of various investment properties. The report covered the period 11 April 2017 to 5 July 2017, and was issued to Khula Business Premises Proprietary Limited on 5 July 2017.
KPMG Inc.Registered Auditor
Per Thato MalakalakaChartered Accountant (SA)Registered AuditorDirector22 June 2017
KPMG HillsideCorner of the Hillside Street and Klarinet RoadLynnwoodPretoria0081
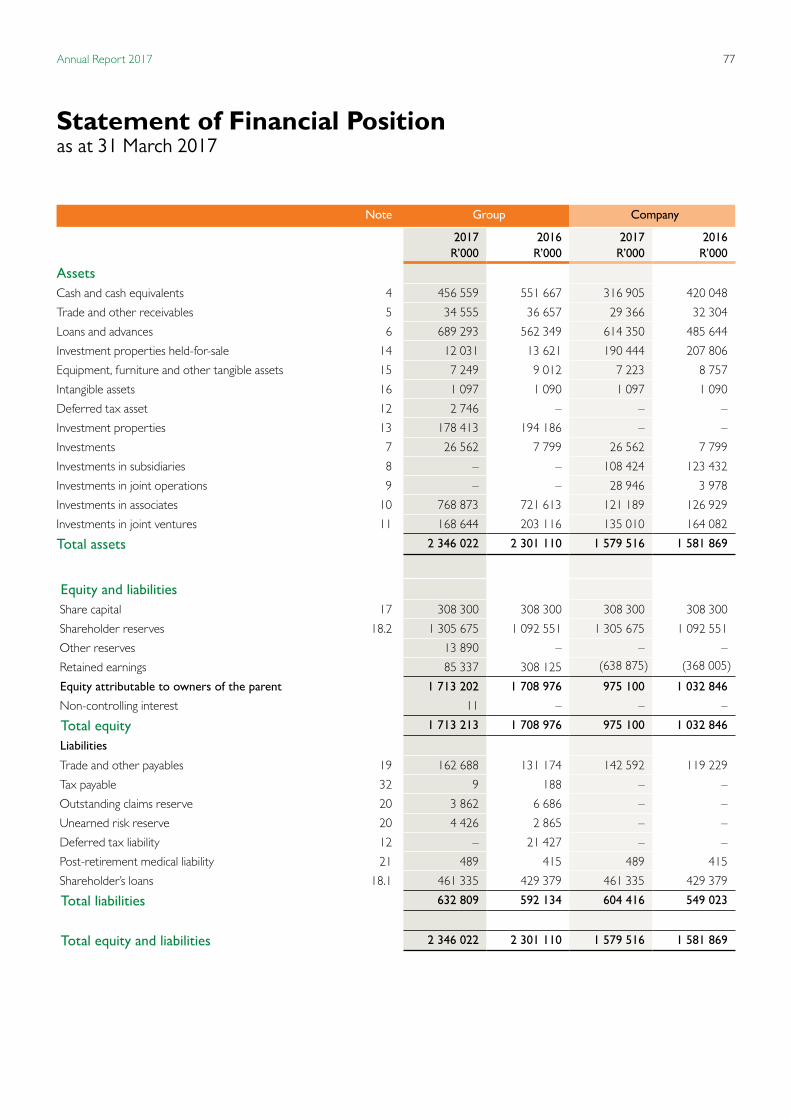
77Annual Report 2017
Statement of Financial Position as at 31 March 2017
Note Group Company
2017R’000
2016R’000
2017R’000
2016R’000
Assets Cash and cash equivalents 4 456 559 551 667 316 905 420 048
Trade and other receivables 5 34 555 36 657 29 366 32 304
Loans and advances 6 689 293 562 349 614 350 485 644
Investment properties held-for-sale 14 12 031 13 621 190 444 207 806
Equipment, furniture and other tangible assets 15 7 249 9 012 7 223 8 757
Intangible assets 16 1 097 1 090 1 097 1 090
Deferred tax asset 12 2 746 – – –
Investment properties 13 178 413 194 186 – –
Investments 7 26 562 7 799 26 562 7 799
Investments in subsidiaries 8 – – 108 424 123 432
Investments in joint operations 9 – – 28 946 3 978
Investments in associates 10 768 873 721 613 121 189 126 929
Investments in joint ventures 11 168 644 203 116 135 010 164 082
Total assets 2 346 022 2 301 110 1 579 516 1 581 869
Equity and liabilities Share capital 17 308 300 308 300 308 300 308 300
Shareholder reserves 18.2 1 305 675 1 092 551 1 305 675 1 092 551
Other reserves 13 890 – – –
Retained earnings 85 337 308 125 (638 875) (368 005)
Equity attributable to owners of the parent 1 713 202 1 708 976 975 100 1 032 846
Non-controlling interest 11 – – –
Total equity 1 713 213 1 708 976 975 100 1 032 846
Liabilities
Trade and other payables 19 162 688 131 174 142 592 119 229
Tax payable 32 9 188 – –
Outstanding claims reserve 20 3 862 6 686 – –
Unearned risk reserve 20 4 426 2 865 – –
Deferred tax liability 12 – 21 427 – –
Post-retirement medical liability 21 489 415 489 415
Shareholder’s loans 18.1 461 335 429 379 461 335 429 379
Total liabilities 632 809 592 134 604 416 549 023
Total equity and liabilities 2 346 022 2 301 110 1 579 516 1 581 869

Small Enterprise Finance Agency78
Statements of Profit or Loss and other Comprehensive Income for the year ended 31 March 2017
Note Group Company
2017R’000
2016R’000
2017R’000
2016R’000
Interest and dividend income 22 134 328 137 476 121 844 121 364
Fee income from loans and indemnities 23 7 212 12 927 5 984 12 173
Interest expense on Shareholder’s loan 18.1 (31 956) (29 751) (31 956) (29 751)
Net interest and dividend income 109 584 120 652 95 872 103 786
Movement on impairments on investments 27.2 (1 569) 17 645 (19 596) 31 255
Movement on bad debt provisions on loans 27.3 (66 525) (354 633) (61 674) (372 253)
Net interest and dividend income after impairments 41 490 (216 336) 14 602 (237 212)
Investment property rental income 29 391 29 580 29 389 29 580
Investment property expenses (85 733) (54 644) (85 733) (54 644)
Net fair value (loss)/gain on investment properties 25 (17 362) 39 842 (17 362) 39 842
(32 214) (201 558) (59 104) (222 434)
Other income 24 17 043 15 446 21 365 19 144
Personnel expenses (168 321) (155 802) (168 321) (155 592)
Other operating expenses (78 627) (83 692) (64 810) (66 544)
Operating loss 27 (262 119) (425 606) (270 870) (425 426)
Profit from equity accounted investments, net of tax 26 15 411 39 417 – –
Loss before tax (246 708) (386 189) (270 870) (425 426)
Income tax credit 28 23 932 7 756 – –
Net loss for the year (222 776) (378 433) (270 870) (425 426)
Other comprehensive income after tax:
Other comprehensive income from equity accounted investments
13 890 – – –
Other comprehensive income for the year 13 890 – – –
Total comprehensive income for the year (208 886) (378 433) (270 870) (425 426)
Loss and total comprehensive income attributable to:
Owners of the parent – income for the year (222 787) (378 433)
Owners of the parent – other comprehensive income 13 890 –
Non-controlling interest – loss for the year 11 –
Total comprehensive income for the year (208 886) (378 433)

79Annual Report 2017
Statements of Changes in Equity for the year ended 31 March 2017
Group Notes Share capitalRetained earnings
Shareholder reserves
Other reserves*
Non-controlling
interest Total
R’000 R’000 R’000 R’000 R’000 R’000
Balance as at 31 March 2015 308 300 686 557 686 154 – 5 662 1 686 673
Loss of subsidiary control – – – – (5 662) (5 662)
Advances received on Shareholder’s loan 18.2 – 406 397 – 406 397
Total comprehensive loss for the year – (378 433) – – (378 433)
Balance as at 31 March 2016 308 300 308 124 1 092 551 – – 1 708 975
Advances received on Shareholder’s loan 18.2 – 213 124 213 124
Other comprehensive income from equity accounted investments – – – 13 890 – 13 890
Total comprehensive loss for the year – (222 787) – 11 (222 776)
Balance as at 31 March 2017 308 300 85 337 1 305 675 13 890 11 1 713 213* Other reserves consists of fair value and other reserves recognised by Business Partners Limited
Company Notes Share capitalRetained earnings
Shareholder reserves
Other reserves*
Non-controlling
interest Total
R’000 R’000 R’000 R’000 R’000 R’000
Balance as at 31 March 2015 308 300 57 421 686 154 – – 1 051 875
Advances received on Shareholder’s loan 18.2 – – 406 397 – – 406 397
Total comprehensive loss for the year – (425 426) – – (425 426)
Balance as at 31 March 2016 308 300 (368 005) 1 092 551 – – 1 032 846
Advances received on Shareholder’s loan 18.2 – – 213 124 – – 213 124
Total comprehensive loss for the year – (270 870) – – (270 870)
Balance as at 31 March 2017 308 300 (638 875) 1 305 675 – – 975 100
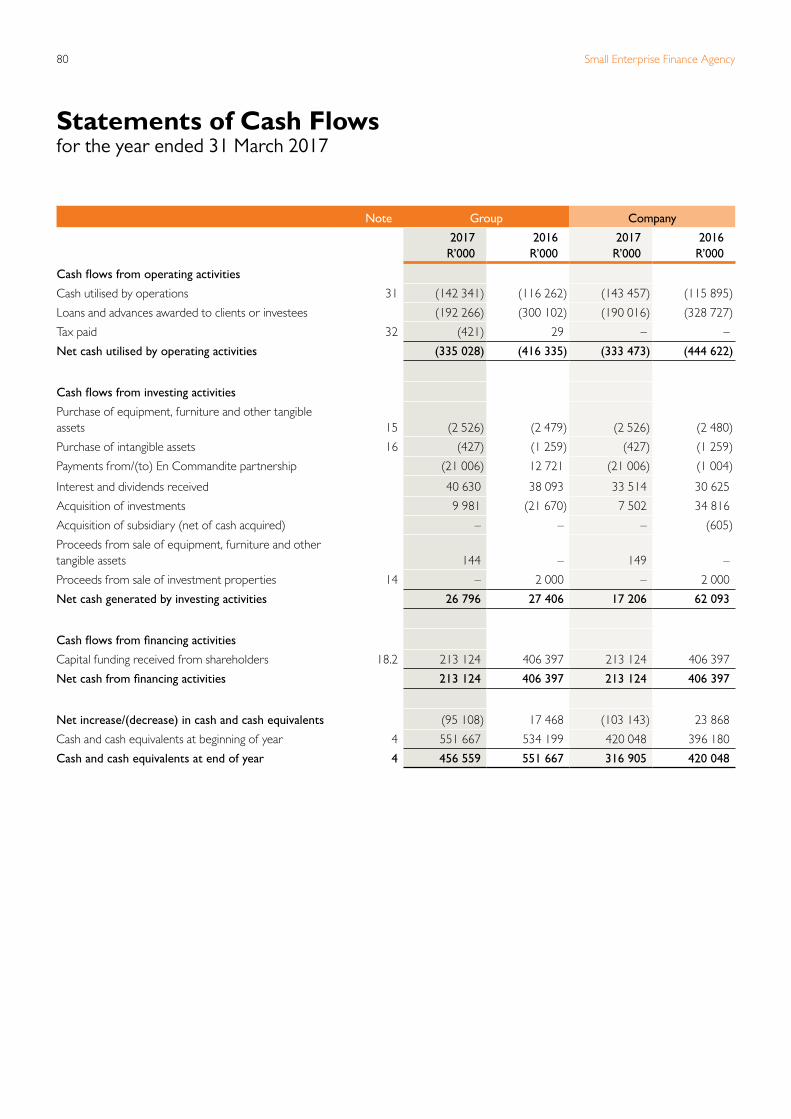
Small Enterprise Finance Agency80
Statements of Cash Flows for the year ended 31 March 2017
Note Group Company
2017R’000
2016R’000
2017R’000
2016R’000
Cash flows from operating activities
Cash utilised by operations 31 (142 341) (116 262) (143 457) (115 895)
Loans and advances awarded to clients or investees (192 266) (300 102) (190 016) (328 727)
Tax paid 32 (421) 29 – –
Net cash utilised by operating activities (335 028) (416 335) (333 473) (444 622)
Cash flows from investing activities
Purchase of equipment, furniture and other tangible assets 15 (2 526) (2 479) (2 526) (2 480)
Purchase of intangible assets 16 (427) (1 259) (427) (1 259)
Payments from/(to) En Commandite partnership (21 006) 12 721 (21 006) (1 004)
Interest and dividends received 40 630 38 093 33 514 30 625
Acquisition of investments 9 981 (21 670) 7 502 34 816
Acquisition of subsidiary (net of cash acquired) – – – (605)
Proceeds from sale of equipment, furniture and other tangible assets 144 – 149 –
Proceeds from sale of investment properties 14 – 2 000 – 2 000
Net cash generated by investing activities 26 796 27 406 17 206 62 093
Cash flows from financing activities
Capital funding received from shareholders 18.2 213 124 406 397 213 124 406 397
Net cash from financing activities 213 124 406 397 213 124 406 397
Net increase/(decrease) in cash and cash equivalents (95 108) 17 468 (103 143) 23 868
Cash and cash equivalents at beginning of year 4 551 667 534 199 420 048 396 180
Cash and cash equivalents at end of year 4 456 559 551 667 316 905 420 048

81Annual Report 2017
1. Accounting Policies1.1 Accounting policies The principle accounting policies applied in the
presentation of these annual financial statements are set out below and are consistent with those of the previous year, unless otherwise stated.
1.2 Statement of compliance and basis of preparation The annual financial statements have been prepared
in accordance with International Financial Reporting Standards and the requirements of Public Finance Management Act of South Africa and the Companies Act. The Group and Company financial statements are presented in South African Rand, which is the Company’s functional currency, rounded-off to the nearest thousand.
The financial statements have been prepared under the historical cost basis, except for the following material items in the statement of financial position:
• Investment properties are measured at fair value; • Investment properties held-for-sale are measured at
fair value. 1.3 New and amended statements adopted The Group has adopted the following new standards and
amendments applicable to financial years beginning on or after 1 January 2016:
• Disclosure Initiative (Amendments to IAS 7) The amendments provide for disclosures that enable
users of financial statements to evaluate changes in liabilities arising from financing activities, including both changes arising from cash flow and non-cash changes. This includes providing a reconciliation between the opening and closing balances for liabilities arising from financing activities.
• Recognition of Deferred Tax Assets for Unrealised Losses (Amendments to IAS 12)
The amendments provide additional guidance on the existence of deductible temporary differences, which depend solely on a comparison of the carrying amount of an asset and its tax base at the end of the reporting period, and is not affected by possible future changes in the carrying amount or expected manner of recovery of the asset.
The amendments also provide additional guidance on the methods used to calculate future taxable profit to establish whether a deferred tax asset can be recognised.
Guidance is provided where an entity may assume that it will recover an asset for more than its carrying amount,
provided that there is sufficient evidence that it is probable that the entity will achieve this.
The underlying principles for the recognition of deferred tax assets remains unchanged.
1.4 New and amended standards issued not yet effective
The following amended standards are not yet effective and have not been adopted by the Group:
Effective for financial years commencing after 1 January 2018
• IFRS 15 Revenue from Contracts with Customers The standard prescribes a single comprehensive
revenue recognition model for all contracts with customers to achieve greater consistency in the recognition and presentation of revenue. Revenue is recognised based on the satisfaction of performance obligations, which occurs when control of goods or services transfer to a customer.
This standard replaces IAS 11, ‘Construction Contracts’, IAS 18, ‘Revenue’, IFRIC 13, ‘Customer Loyalty Programmes’, IFRIC 15, ‘Agreements for the Construction of Real Estate’, IFRIC 18, ‘Transfer of Assets from Customers’ and SIC-31, ‘Revenue – Barter of Transactions Involving Advertising Services’.
This new standard will not have a significant impact on the Group and Company.
• IFRS 9 Financial Instruments On 24 July 2014, the IASB issued the final IFRS 9,
‘Financial Instruments’ Standard, which replaces earlier versions of IFRS 9 and completes the IASB’s project to replace IAS 39, ‘Financial Instruments: Recognition and Measurement’. The standard changes the measurement basis of financial assets to amortised cost, fair value through other comprehensive income or fair value through profit or loss.
Even though these measurement categories are similar to IAS 39, the criteria for classification into these categories are significantly different. This will not have a significant impact on the Group and Company.
In addition, the IFRS 9 impairment model has been changed from an ‘incurred loss’ model from IAS 39 to an ‘expected credit loss’ model, which may increase the provision for bad debts recognised in the Group and Company.
Notes to the Financial Statementsfor the year ended 31 March 2017
Small Enterprise Finance Agency82
The Company is in the process of developing a model to measure the impact of the changes in the standard.
Effective for financial years commencing after 1 January 2019 • IFRS 16 Leases IFRS 16 requires lessees to recognise assets and
liabilities arising from leases on the balance sheet.
Lessor accounting has not substantially changed in the new standard.
The model reflects that, at the start of a lease, the lessee obtains the right to use an asset for a period of time and has an obligation to pay for that right. A lessee measures lease liabilities at the present value of the future lease payments. The relating lease asset is initially measured at the same amount as lease liabilities and includes costs directly related to entering into the lease. Lease assets are amortised over the lease period. This approach will result in a more transparent representation of lessee’s assets and liabilities.
The IASB has exempted short-term leases (less than 12 months) or leases relating to low value assets (such as laptops and office furniture) from the new recognition model.
IFRS 16 supersedes IAS 17, ‘Leases’, IFRIC 4, ‘Determining whether an arrangement contains a Lease’, SIC 15, ‘Operating leases – Incentives’ and SIC 27, ‘Evaluating the substance of transactions involving the legal form of a lease’.
Based on the current lease contracts in the Company, the impact is not anticipated to be significant. The Group does not have any additional lease to the Company’s.
1.5 Consolidation1.5.1 Business combinations Group financial statements • Recognition and measurement The Group uses the acquisition method of
accounting to account for business combinations. The consideration transferred for the acquisition of a business is the fair values of the assets transferred, the liabilities incurred and the equity interests issued by the Group. The consideration transferred includes the fair value of any asset or liability resulting from a contingent consideration arrangement. Acquisition-related costs are expensed as and when incurred. Identifiable assets acquired and liabilities and contingent liabilities assumed in a business combination are measured initially at their fair values at the acquisition
date. Where applicable the Group measures any non-controlling interest in the acquiree either at fair value or at the non-controlling interest’s proportionate share of the acquiree’s net assets. Subsequently, the carrying amount of non-controlling interest is the amount of the interest at initial recognition plus the non-controlling interests’ share of the subsequent change in equity. Total comprehensive income is attributed to non-controlling interest. Accumulated losses attributed to non-controlling interest may not result in the non-controlling interest having a deficit balance.
The excess of the consideration transferred, the amount of any non-controlling interest in the acquiree and the acquisition-date fair value of any previous equity interest in the acquiree.
Over the fair value of the Group’s share of the identifiable net assets acquired is recorded as goodwill. In the event of this being less than the fair value of the net assets of the acquiree in the case of a bargain purchase, the difference is recognised directly in profit or loss.
• Derecognition When a parent loses control of a subsidiary; it stops
consolidating the subsidiary by derecognising the assets (including goodwill) and liabilities of the subsidiary and NCI in the subsidiary. As a consequence, the amount recognised in profit or loss on loss of control of a subsidiary is measured as the difference between:
The sum of : – the fair value of the consideration received, if any; – the fair value of any retained non-controlling
investment; – and the carrying amount of the NCI in the former subsidiary.
• The carrying amount of the former subsidiary’s net assets.
1.5.2 Investments in subsidiaries Subsidiaries are entities controlled by the Company.
Control exists when sefa is exposed to, or has the rights to, variable returns from its involvement with the entity and has the ability to affect those returns through its power over the entity. The financial statements of subsidiaries are included in the Group financial statements from the date that control commences until the date that control ceases.
Inter-company transactions, balances and unrealised gains on transactions between Group companies are eliminated on consolidation.
Notes to the Financial Statements (continued)for the year ended 31 March 2017
83Annual Report 2017
Notes to the Financial Statements (continued)for the year ended 31 March 2017
Unrealised losses are eliminated in the same way as unrealised gains, but only to the extent that there is no evidence of impairment.
Investments in subsidiaries in the Company’s financial
statements are carried at cost less impairment. 1.5.3 Transactions with non-controlling interests The Group accounts for transactions with non-controlling
interests as transactions with equity holders of the Group. For purchases from non-controlling interests, the difference between any consideration paid and the relevant share acquired of the carrying value of net assets of the subsidiary is recorded in equity. Gains or losses on disposals to non-controlling interests are also recorded in equity.
1.5.4 Interest in equity-accounted investees The Group’s interests in equity-accounted investees
comprise interests in associates and joint ventures.
Associates are all entities over which the Group has significant influence but not control or joint control, over the financial and operating policies. Joint ventures are those entities over whose activities the Group has joint control, whereby the Group has rights to the net assets of the arrangement, rather than rights to its assets and obligations for its liabilities.
Investments in associates and joint ventures are accounted for using the equity method of accounting and are initially recognised at cost, which includes transaction costs.
Subsequent to the initial recognition, the Group financial statements include the Group’s share of the profit or loss and OCI of equity-accounted investees, until the date on which significant influence or joint control ceases. The Group’s investment in equity-accounted investees
includes goodwill identified on acquisition. Any excess of the acquisition price over the acquired net asset value is not separately recognised as goodwill, but rather is included in the cost of the investment.
The cumulative post-acquisition movements are adjusted for against the carrying amount of the investment.
Distributions received from associates reduce the carrying amount of the investment. When the Group’s share of losses in an equity-accounted investee equals or exceeds its interest in the equity-accounted investee, including any other unsecured receivables, the Group does not recognise further losses, unless it has incurred legal or constructive obligations or made payments on behalf of the equity-accounted investee.
The equity interest in an equity accounted investee includes, for this purpose, the carrying amount of the investment under the equity method and other long term interests that, in substance, form part of the entity’s net investment in the associate or joint venture.
Unrealised gains and losses arising from transactions with
equity-accounted investments are eliminated against the investment to the extent of the Group’s interest in the investment. Unrealised losses are eliminated only to the extent that there is no evidence of impairment.
Investments in incorporated associates and joint ventures in the Company’s financial statements are carried at cost less impairment as per accounting policy 1.11 below.
1.6 Financial instruments1.6.1 Financial assets The Group’s financial assets fall into the loans and
receivables category.
Management determines the classification of its financial assets at initial recognition.
1.6.1.1 Loans and receivables Loans and receivables are non-derivative financial assets
with fixed or determinable payments that are not quoted in an active market. They arise when the Group provides money, goods or services directly to a debtor with no intention of trading the receivable.
• Initial recognition Loans and receivables are initially recognised at fair
value, which includes the consideration paid to clients as a disbursement plus any fees and other transaction costs.
• Subsequent measurement Loans and receivables are carried at amortised cost using
the effective interest method less impairment loss.
• Derecognition Loans and advances (or, where applicable, a part
of loans and advances) are derecognised when the contractual rights to receive cash flows from the financial assets have expired or where the Group has transferred substantially all the risks and rewards of ownership, without retaining control. Any interest in the transferred financial assets that is created or retained by the Group is recognised as a separate asset or liability.

Small Enterprise Finance Agency84
1.6.1.2 Investments Investments are non-derivative financial assets consisting of
equity investments where the Group does not control the entity to such an extent where consolidation is required. These investments do not have fixed or determinable payments and do not have a quoted market price in an active market. They arise when the Group invests in entities with no intention of trading the investment.
• Initial recognition Investments in equity assets are initially recognised at
fair value which includes the consideration paid for the investment plus any fees and other transaction costs.
• Subsequent measurement Subsequent to initial recognition investments in equity
assets are carried fair value less impairment loss. Where the fair value of an equity instrument cannot be measured reliably it should be measured at cost. Movement in the fair value movement is recognised in profit or loss.
• Derecognition – Investments in equity assets (or, where applicable, a
part of an investment) are derecognised when the contractual rights to receive cash flows from the financial assets have expired or where the Group has transferred substantially all the risks and rewards of ownership, without retaining control. Any interest in the transferred financial assets that is created or retained by the Group is recognised as a separate asset or liability.
1.6.2 Financial liabilities The Group’s financial liabilities fall into the other liabilities
category.
Management determines the classification of its financial liabilities at initial recognition.
Financial liabilities are all items that give rise to a contractual to deliver cash or another financial asset to another entity.
• Initial recognition Financial liabilities are initially recognised at fair value,
generally being their issue proceeds net of transaction costs incurred.
• Subsequent measurement Subsequent to initial recognition investments in
Financial liabilities are carried at amortised cost and interest is recognised over the period of the borrowing using the effective interest method.
• Derecognition A financial liability is derecognised when the obligation
under the liability is discharged, cancelled or expires. Where an existing financial liability is replaced by another from the same lender on substantially different terms, or the terms of an existing liability are substantially modified, such an exchange or modification is treated as a derecognition of the original liability and the recognition of a new liability, and the difference in the respective carrying amounts is recognised in profit or loss.
1.6.2.1 Indemnity contracts – classification Contracts under which the Group accepts significant
indemnity risk (insurance risk) from another party (the indemnity holder) by agreeing to compensate the indemnity holder or other beneficiary if a specified uncertain future event (the indemnified event) adversely effects the indemnity holder, are classified as indemnity contracts. Indemnity risk is a risk other than financial risk. Indemnity contracts may also transfer some financial risk.
Unearned risk provision Unearned risk provision consists of: • Provision for unearned premiums Unearned fees, which represents the proportion of
fees written in the current year which relate to risks that have not expired by the end of the financial year, are calculated on the 365th basis.
• Provision for unexpired risk Provision is made for unexpired risks where the
expected value of claims and expenses attributable to the unexpired periods of policies in force at the reporting date exceeds the unearned premium provision in relation to such policies. The provision for unexpired risks is calculated separately by reference to class of business that are managed together, after taking into account the relevant investment returns.
Outstanding claims provision Provision is made for the estimated final cost of all claims
that had not been settled on the reporting date, less amounts already paid based on calculations performed by independent actuaries. Claims and loss adjustment expenses are charged to profit or loss as incurred, based on the estimated liability for compensation owed to indemnity holders. The group’s own assessors individually assess claims. The claims reserve includes an estimated portion of the direct expenses of processing the claims. Provision is also made for claims arising from indemnified events that occurred before the close of the accounting period, but which had not been reported to the Group by that date, also referred to as incurred but not reported
Notes to the Financial Statements (continued)for the year ended 31 March 2017
85Annual Report 2017
provisions. Whilst the Directors consider that the gross reserve is fairly stated on the basis of the information currently available to them, the ultimate liability may vary as a result of subsequent information and events and may result in significant adjustments to the amounts provided. The methods used to calculate the reserve, and the estimates made, are reviewed regularly.
Claims incurred consist of claims and claims handling expenses paid during the financial year. The movement in the provision for outstanding claims is disclosed separately in the notes to the financial statements.
Receivables and payables related to indemnity contracts Receivables and payables are recognised when due. These
include amounts due to and from indemnity contract holders and are included under receivables and payables. If there is objective evidence that the indemnity receivable is impaired, the Group reduces the carrying amount of the premium receivable accordingly and recognises the impairment loss in profit or loss. The Group gathers the objective evidence that an indemnity receivable is impaired using the same process adopted for loans and receivables. The impairment loss is calculated under the same method used for loans and receivables.
Salvage reimbursement The indemnity contracts require the indemnified party
to make all reasonable efforts to recover as much of the loss as possible and to refund the Group its proportionate share of the claim recovered. Estimates of these salvage recoveries are included as an allowance in the measurement of the indemnity liability for claims. The allowance is the assessment of the Group’s share of the amount that can be recovered from the action against the liable third party.
Liability adequacy test At each reporting date, liability adequacy tests are
performed to ensure the adequacy of the contract liabilities. In performing these tests, current best estimates of future contractual cash flows and claims handling and administration expenses are used. Any deficiency is immediately charged to profit or loss by establishing a provision for losses arising from liability adequacy tests (the unexpired risk provision).
The ultimate liability arising from claims made under
indemnity contracts The estimation of the ultimate liability arising from claims
made under indemnity contracts is one of the Group’s most critical accounting estimates. Several sources of uncertainty have to be considered in estimating the liability that the Group will ultimately be exposed to for such claims. The risk environment can change quickly
and unexpectedly owing to a wide range of events or influences. The Group is constantly refining the tools with which it monitors and manages risk to place the Group in a position to assess risk situations appropriately, despite the greatly increased pace of change. The growing complexity and dynamism of the environment in which it operates means that there are natural limits, however. There can not ever be absolute security when it comes to identifying risks at an early stage, measuring them sufficiently, or correctly estimating their real hazard potential.
1.7 Share Capital Share capital consists of ordinary shares and is classified as
equity. Issued share capital are measured at the fair value of the proceeds received less any directly attributable issue costs. An amount equal to the par value of the shares issued is presented as share capital. Subsequent to initial recognition, equity is not re-measured.
1.8 Impairment of financial assets carried at
amortised cost The Group assesses whether there is objective evidence
that a financial asset or group of financial assets not carried at fair value is impaired at each reporting date. A financial asset or group of financial assets is impaired and impairment losses are incurred if, and only if, there is objective evidence of impairment as a result of one or more events that have occurred after the initial recognition of the asset and that loss event (or events) has an impact on the estimated future cash flows of the financial asset or group of financial assets that can be reliably estimated. Impairment losses are recognised in profit or loss and reflected in an allowance account against loans and advances.
Objective evidence that a financial asset or group of assets is impaired includes observable data that comes to the attention of the Group about the following loss events:
• Significant financial difficulty of the issuer or obligor; • A breach of contract, such as default of delinquency in
interest or principal payments; • The Group granting to the borrower, for economic
or legal reasons relating to the borrower’s; financial difficulty, a concession that the lender would not otherwise consider;
• It becoming probable that the borrower will enter bankruptcy or other financial re-organisation;
• The disappearance of an active market for that financial asset resulting in financial difficulties;
• Observable data indicating that there is a measurable decrease in the estimated future cash flows from a group of financial assets since the initial recognition of those assets, although the decrease cannot yet be identified with the individual financial assets in the group.
Notes to the Financial Statements (continued)for the year ended 31 March 2017

Small Enterprise Finance Agency86
The Group first assesses whether objective evidence of impairment exists individually for financial assets that are individually significant, referred to as specific impairments, and individually or collectively for financial assets that are not individually significant. If the Group determines that no objective evidence of impairment exists for an individually assessed financial asset, whether significant or not, it includes the asset in a group (portfolio) of financial assets with similar credit risk characteristics and collectively assesses them for impairment. Assets that are individually assessed for impairment and for which an impairment loss is, or continues to be, recognised are not included in a collective assessment of impairment.
The amount of specific impairments raised is the amount needed to reduce the carrying value of the asset to the present value of the expected ultimate cash flows, taking into consideration the financial status of the underlying client and any security in place for the recoverability of the financial asset.
The recoverable amount of the asset is calculated as the present value of estimated future cash flows, discounted at the original effective interest rate (i.e. the effective interest rate computed at initial recognition of the asset).
Impairment of equipment, furniture, other tangible assets and intangible assets The carrying amounts for the Group’s non-financial assets, other than deferred tax assets and investment properties are reviewed at each reporting date to determine whether there is any indication of impairment. If such indication exists, the asset’s recoverable amount is estimated.
The recoverable amount of non-financial assets is the greater of fair value less cost of disposal and its value in use. Fair value less cost of disposal is the amount obtainable from the sale of an asset or cash-generating unit in an orderly transaction between market participants at the measurement date, less the costs of disposal. In assessing value in use, the expected future cash flows from the asset are discounted to their present value using a pre-tax discount rate that reflects current market assessments of the time value of money and the risks specific to the asset. For an asset that does not generate largely independent cash inflows, the recoverable amount is determined for the cash-generating unit to which the asset belongs.
An impairment loss of assets carried at cost less any accumulated depreciation or amortisation is recognised immediately in profit or loss.
Impairment losses recognised in the prior periods are assessed at each reporting date for any indications that the loss has decreased or no longer exists.
An impairment loss is reversed if there has been a change in the estimates used to determine the recoverable amount and only to the extent that the asset’s carrying amount does not exceed the carrying amount that would have been determined, net of depreciation or amortisation, if no impairment loss had been recognised.
1.9 Intangible assets Intangible assets with finite useful lives are carried at
cost less accumulated amortisation and accumulated impairment losses.
Amortisation Amortisation is recognised in profit or loss on a straight-
line basis, based on the estimated useful lives of the underlying assets. Amortisation is calculated on the cost less any impairment and expected residual value. The estimated useful lives for the current and comparative periods are as follows:
Computer software 3 – 4 years Intellectual property 3 years
The residual values, useful lives and amortisation methods are re-assessed at each financial year-end and adjusted if appropriate, with the effect of any changes in estimate being accounted for on a prospective basis.
1.10 Goodwill All business combinations are accounted for by applying
the acquisition method. Goodwill acquired in a business combination is initially measured at cost, being the difference between the fair values of the consideration of the business combination over the interest the Company in the fair value of the net identifiable assets acquired.
The recoverable amount for goodwill is estimated at each reporting date. Impairment losses are recognised in profit or loss. Impairment losses relating to goodwill are not reversed.
Gain on bargain purchase arising on acquisition is recognised directly in profit or loss. Goodwill is subsequently stated at cost less any accumulated impairment losses. Goodwill that is allocated to cash-generating units is tested annually for impairment or more frequently if events or changes in circumstances indicate that it might be impaired.
Gains and losses on the disposal of an entity include the carrying amount of goodwill relating to the entity sold.
1.11 Investment property Investment property is property held to earn rental
income or for capital appreciation or for both.
Notes to the Financial Statements (continued)for the year ended 31 March 2017
87Annual Report 2017
Measurement • Initial recognition Investment property is measured initially at cost,
including transaction costs and directly attributable expenditure in preparing the asset for its intended use.
• Subsequent measurement Subsequently, all investment properties are measured
at fair value.
Valuation takes place annually, based on the aggregate of the net annual rental receivable from the properties, considering and analysing rentals received in similar properties in the neighbourhood, less associated costs (insurance, maintenance, repairs, and management fees). A capitalisation rate which reflects the specific risks inherent in the net cash flows is applied to the net annual rentals to arrive at the property valuations.
The fair value of undeveloped land held as investment property is based on comparative market prices after intensive market surveys.
Gains or losses arising from a change in fair value are recognised in profit or loss.
External, independent valuators having appropriate,
recognised professional qualifications and recent experience in the location and category of the property being valued, perform valuations on the portfolio every three years.
Gain or loss on the disposal of investment property (calculated as the difference between the net proceeds from disposal and the carrying amount of the item) is recognised in profit and loss.
1.12 Non-current assets held for sale Non-current assets, or disposal groups comprising assets
and liabilities, are classified as held-for-sale if it is highly probable that they will be recovered primarily through sale rather than through continuing use.
Measurement Immediately before classification as held-for-sale, the
measurement of the assets (and all assets and liabilities in a disposal group) is brought up-to-date in accordance with the applicable IFRS. Then, on initial classification as held-for-sale, the non-current assets and disposal groups are recognised at the lower of carrying amount and fair value less costs to sell. Any impairment loss on a disposal group is first allocated to goodwill and then to remaining assets and liabilities on a pro rata basis, except that no loss is allocated to inventories, financial assets, deferred tax
assets, employee benefit assets and investment property, which continue to be measured in accordance with the Group’s accounting policies.
Impairment losses on initial classification as held-for-sale or held-for-distribution and subsequent gains and losses on remeasurement are recognised in profit or loss.
Once classified as held-for-sale, intangible assets and property, plant and equipment are no longer amortised or depreciated, and any equity-accounted investee is no longer equity accounted.
Reclassification The non-current asset held-for-sale will be reclassified
immediately when there is a change in intention to sell. At that date, it will be measured at the lower of: its carrying amount before the asset was classified as held-for-sale, adjusted for any depreciation, amortisation or revaluations that would have been recognised had the asset not been classified as held-for-sale; and its recoverable amount at the date of the subsequent decision not to sell.
1.13 Equipment, furniture and other tangible assets Measurement All items of equipment, furniture and other tangible assets
recognised as assets, are initially measured at cost. Cost includes expenditures that are directly attributable to the acquisition of the asset. All items of equipment, furniture and other tangible assets are subsequently measured at cost less accumulated depreciation and any accumulated impairment losses.
Where parts of an item of equipment, furniture and other tangible assets have significantly different useful lives, they are accounted for as separate items of equipment, furniture and other tangible assets. Although individual components are accounted for separately, the financial statements continue to disclose a single asset.
Gains and losses on disposal of an asset are determined by comparing the proceeds from disposal with the carrying amount of the asset and are recognised in profit or loss.
Subsequent costs The Group recognises the cost of replacing part of such
an item of equipment, furniture and other tangible assets in the carrying amount of the item when that cost is incurred and if it is probable that future economic benefits will flow to the Group and the cost of the item can be measured reliably. The carrying amount of the part that is replaced is derecognised. All other costs are recognised in profit or loss as an expense as they are incurred.
Notes to the Financial Statements (continued)for the year ended 31 March 2017
Small Enterprise Finance Agency88
Depreciation Depreciation is recognised in profit or loss on a straight-
line basis, based on the estimated useful lives of the underlying assets. Depreciation is calculated on the cost less any impairment and expected residual value. The estimated useful lives for the current and comparative periods are as follows:
Computer equipment 3 – 5 years Office equipment 2 – 6 years Furniture and fittings 5 – 6 years Motor vehicles 4 – 5 years Leasehold improvements expected lease period
The residual values, useful lives and depreciation method are re-assessed at each financial year-end and adjusted if appropriate.
Derecognition The carrying amount of items of equipment, furniture
and other tangible assets are derecognised on disposal or when no future economic benefits are expected from their use or disposal.
Gains or losses arising from derecognition are determined as the difference between the net disposal proceeds and the carrying amount of the item of equipment, furniture and other tangible assets and included in profit or loss when the items are derecognised.
1.14 Leases Operating leases An operating lease is a lease other than a finance lease.
A lease is a finance lease if substantially all of the risks and rewards incidental to ownership of the leased asset are transferred from the lessor to the lessee by the agreement.
Operating leases – Group as lessee Lease payments arising from operating leases are
recognised in profit or loss on a straight-line basis over the lease term.
Lease incentives received are recognised in profit or loss as an integral part of the total lease expense.
Operating leases – Group as lessor Receipts in respect of operating leases are accounted for
as income on the straight-line basis over the period of the lease.
The assets subject to operating leases are presented in the statement of financial position according to the nature of the assets.
Determining whether an arrangement contains a lease
At inception of an arrangement, the Group determines whether such an arrangement is or contains a lease. A specific asset is the subject of a lease if fulfilment of the arrangement is dependent on the use of that specified asset. An arrangement conveys the right to use the asset if the arrangement conveys to the Group the right to control the use of the underlying asset.
At inception or upon re-assessment of the arrangement, the Group separates payments and other consideration required by such an arrangement into those for the lease and those for other elements on the basis of their relative fair values. If the Group concludes for a finance lease that it is impracticable to separate the payments reliably, an asset and a liability are recognised at an amount equal to the fair value of the underlying asset. Subsequently the liability is reduced as payments are made and an imputed finance charge on the liability is recognised using the Group’s incremental borrowing rate.
1.15 Cash and cash equivalents For the purpose of the cash flow statement, cash and cash
equivalents comprise cash on hand, deposits held on call with banks, and investments in money market instruments and bank overdrafts, all of which are available for use by the Group unless otherwise stated. Cash and cash equivalents are available within three months.
Cash and cash equivalents are carried at amortised cost in the statement of financial position.
1.16 Provisions A provision is a liability of uncertain timing or amount.
Provisions are recognised when the Group has a present obligation as a result of a past event and the amount can be reliably measured.
The amount of a provision is the present value of the expenditure expected to be required to settle the obligation. Provisions are determined by discounting the expected future cash flows at a pre-tax discount rate that reflects the current market assessments of the time value of money and the risks specific to the liability.
The unwinding of the discount is recognised as finance cost.
Where some or all of the expenditure required to settle a provision is expected to be reimbursed by another party, the reimbursement shall be recognised when, it is virtually certain that reimbursement will be received if the entity settles the obligation. The reimbursement shall be
Notes to the Financial Statements (continued)for the year ended 31 March 2017
89Annual Report 2017
treated as a separate asset. The amount recognised for the reimbursement shall not exceed the amount of the provision.
Provisions are not recognised for future operating losses. 1.17 Contingent liabilities and commitments Contingent liabilities A contingent liability is a possible obligation that arises
from past events and whose existence will be confirmed only by the occurrence or non-occurrence of one or more uncertain future events not wholly within the control of the Group.
Contingent liabilities are not recognised in the statement of financial position of the Group but is disclosed in the notes.
Commitments Items are classified as commitments where the Group has
committed itself to future transactions.
1.18 Taxation Income tax Income tax expenses comprises current and deferred tax.
It is recognised in profit or loss except to the extent that it relates to a business combination, or items recognised directly in other comprehensive income or equity.
Deferred tax Deferred tax is recognised in respect of all temporary
differences arising between the carrying amount of assets and liabilities in the financial statements and the corresponding tax basis used in the computation of taxable income.
Deferred tax assets are recognised to the extent that it is probable that future taxable profit will be available against unused tax deductions which can be utilised.
Deferred tax assets are reviewed at each reporting date and are reduced to the extent that it is no longer probable that the related tax will be realised.
Deferred tax is not recognised if the temporary differences arise from:
• the initial recognition of goodwill; • the initial recognition (other than in a business
combination) of other assets and liabilities in a transaction that affects neither taxable income nor accounting profit or loss.
Temporary differences relating to investments in associates, subsidiaries and joint ventures to the extent that it is probable that they will not reverse in the
foreseeable future and the timing of the reversal of the temporary difference is controlled.
Deferred tax is measured at the tax rates that are expected to be applied to temporary differences when they reverse, based on the laws that have been enacted or substantively enacted by the reporting date.
Deferred tax is charged or credited in profit or loss, except when it relates to items credited or charged to other comprehensive income or directly to equity, in which case the deferred tax is also recognised in other comprehensive income or equity.
Deferred tax assets and liabilities are offset if there is a legally enforceable right to offset current tax liabilities and assets, and they relate to income taxes levied by the same tax authority on the same taxable entity, or on different tax entities, but they intend to settle current tax liabilities and assets on a net basis or their tax assets and liabilities will be realised simultaneously.
The measurement of deferred tax reflects the tax
consequences that would follow from the manner in which the Group expects, at the reporting date, to recover or settle the carrying amount of its assets and liabilities. For this purpose, the carrying amount of Investment property measured at fair value is presumed to be recovered through sale, and the Group has not rebutted this presumption.
Current tax Current tax is the expected tax payable or receivable on
the taxable income or loss for the year. It is measured using tax rates enacted or substantively enacted at the reporting date. Current taxes are recognised as income or an expense and included in profit or loss for the period, except to the extent that the tax arises from a transaction or event which is recognised, in the same or a different period, in other comprehensive income or in equity.
Current tax also includes any adjustment to tax payable in respect of previous years when necessary.
The Group offsets current assets and current tax liabilities only when:
• the Group has a legally enforceable right to set off current tax assets against current tax liabilities;
• the Group intends to settle on a net basis, or to realise the asset and settle the liability simultaneously.
Notes to the Financial Statements (continued)for the year ended 31 March 2017

Small Enterprise Finance Agency90
1.19 Revenue Revenue comprises net invoiced indemnity premiums,
dividends, interest, rental income and management fee income, but excludes value-added-tax, and is measured at the fair value of the consideration received or receivable, net of returns and allowances, trade discounts and volume rebates.
Indemnity premiums Indemnity premiums earned is included in revenue and
comprise the premiums earned on active contracts. Premiums are earned and recognised as income from the date the risk attaches, over the indemnity period, based on the pattern of the risk underwritten.
Dividends Dividend income is recognised in profit or loss on the date
the Group’s right to receive payment is determined.
Interest Interest income is recognised in profit or loss using the
effective interest method. The effective interest rate is the rate that exactly discounts the estimated future cash payments and receipts through the expected life of the financial asset (or, where appropriate, a shorter period) to the carrying amount of the financial asset. The effective interest rate is established on initial recognition of the financial asset and is not revised subsequently.
Fees • Income earned on the execution of a significant
act is recognised when the significant act has been performed;
• Income earned from the provision of services is recognised as the service is rendered by reference to the stage of completion of the service.
Income that forms an integral part of the effective interest rate of a financial instrument is recognised as an adjustment to the effective interest rate and recorded in interest income.
Grants received from donors Donor funding is recognised at its fair value where there is
reasonable assurance that the funding will be received and the Group will comply with all attached conditions.
Funding relating to costs are deferred and recognised in profit or loss over the period necessary to match them with the costs for which they are intended to compensate and is included in Trade and other payables.
Government grants Government grants are not recognised until there is
reasonable assurance that the Group will comply with the conditions attaching to them and that the grants will be received.
Government grants are recognised in profit or loss on a systematic basis over the periods in which the Group recognises as expenses, the related costs for which the grants are intended to compensate. Government grants whose primary condition is that the Group should purchase, or otherwise acquire non-current assets are recognised as deferred revenue in the statement of financial position and transferred to profit or loss on a systematic and rational basis over the useful lives of the related assets.
Government grants that are receivable as compensation for expenses or losses already incurred or for the purpose of giving immediate financial support to the Group with no future related costs are recognised in profit or loss in the period in which they become receivable.
Rental See policy on leases. 1.20 Employee benefits Short term employee benefits Short-term employee benefit obligations are measured
on an undiscounted basis and are expensed as the related service is provided. A liability is recognised for the amount expected to be paid under short-term cash bonus plans if the Group has a present legal or constructive obligation to pay this amount as a result of past service provided by the employee, and the obligation can be estimated reliably.
Defined contribution plan The Group has a provident fund scheme which is a
defined contribution plan. A defined contribution plan is a pension plan under which the Group pays fixed contributions into a separate entity (a fund) and will have no legal or constructive obligation to pay further amounts. Contributions to defined contribution plans are recognised as an employee benefit expense in profit or loss in the year to which they relate.
1.21 Determination of fair values A number of the Group’s accounting policies and
disclosures require the determination of fair value, for both financial and non-financial assets and liabilities. Fair values have been determined for measurement and/or disclosure purposes based on the following methods.
When measuring the fair value of an asset or a liability, the Group uses market observable data as far as possible. Fair values are categorised into different levels in a fair
Notes to the Financial Statements (continued)for the year ended 31 March 2017
91Annual Report 2017
value hierarchy based on the inputs used in the valuation techniques as follows:
• Level 1: quoted prices (unadjusted) in active markets for identical assets or liabilities;
• Level 2: inputs other than quoted prices included in Level 1 that are observable for the asset or liability, either directly (i.e. as prices) or indirectly (i.e. derived from prices);
• Level 3: inputs for the asset or liability that are not based on observable market data (unobservable inputs).
If the inputs used to measure the fair value of an asset or liability might be categorised in different levels of the fair value hierarchy, then the fair value measurement is categorised in its entirety in the same level of the fair value hierarchy as the lowest level input that is significant to the entire measurement.
The Group recognises transfers between levels of the fair value hierarchy at the end of the reporting period during which the change has occurred. When applicable, further information about the assumptions made in determining fair values is disclosed in the notes specific to that asset or liability.
Investment property and investment property held-for-sale
Valuation methods and assumptions used in determining the fair value of investment property and investment property held-for-sale:
• Capitalisation method The sefa property portfolio is mostly made up of
Income-producing properties, with the result that the income capitalisation method has been adopted for the determination of value. The value of the property reflects the present value of the sum of the future benefits which an owner may expect to derive from the property. These benefits are expressed in monetary terms and are based upon the estimated rentals that such a property would fetch, i.e. the market-related rental between a willing landlord and tenant.
The usual property outgoings are deducted to achieve a net rental, which is then capitalised at a rate an investor would require receiving the income.
• Comparative method Of the entire portfolio, two properties are sectional
title in nature and one comprises of vacant land. These properties have been valued on the Direct Comparison Basis, as this is how they trade in the
open market. The method involves the identification of comparable properties sold in the area or in a comparable location within a reasonable time. The selected comparable properties are analysed and compared with the subject property.
Adjustments are then made to their values to reflect any differences that may exist. This method is based on the assumption that a purchaser will pay an amount equal to what others have paid or are willing to pay.
1.22 Critical accounting estimates and judgements Estimates and judgements are continually evaluated and
are based on historical experience and other factors, including expectations of future events that are believed to be reasonable under the circumstances.
The Group makes estimates and assumptions concerning
the future. The resulting accounting estimates will, by definition rarely equal the related actual results. The estimates and assumptions that have a significant risk of causing a material adjustment to the carrying amounts of assets and liabilities within the next financial year are outlined alongside:
• Income taxes Significant judgement is required in determining
the provision for income taxes. There are many transactions and calculations for which the ultimate tax determination is uncertain during the ordinary course of business. The Group recognises liabilities for anticipated tax audit issues based on estimates of whether additional taxes will be due. Where the final tax outcome of these matters is different from the amounts that were initially recorded, such differences will impact the income tax and deferred tax provisions in the period in which such determination is made.
• Deferred tax asset Deferred tax assets are recognised to the extent that it
is probable that taxable income will be available in the future against which it can be utilised.
Impairment of financial assets The Group follows the guidance of IAS 39: Financial
Instruments: Recognition and Measurement in assessing specific and collective impairment. The impairment method used depends on the nature of the asset. The following impairment methods are currently used by the Group:
• Loans and advances – Direct Lending: the repayment history and ageing of the receivable is used to determine the impairment in accordance with an impairment matrix;
Notes to the Financial Statements (continued)for the year ended 31 March 2017
Small Enterprise Finance Agency92
• Loans and advances – Wholesale Lending: available information is assessed for indications of impairment and a valuation is performed on the debtor’s ability to repay;
• Equity investments: available information is assessed for indications of impairment and a valuation is performed on the debtor’s ability to repay;
• Rental debtors: the repayment history and ageing of the receivable is used to determine the impairment in accordance with an impairment matrix.
The ultimate liability arising from claims made under indemnity contracts
The estimation of the ultimate liability arising from claims made under indemnity contracts is a critical accounting estimate. Several sources of uncertainty have to be considered in estimating the liability that the Group will ultimately be exposed to for such claims. The risk environment can change quickly and unexpectedly owing to a wide range of events or influences. The Group is constantly refining the tools with which it monitors and manages risk to place the Group in a position to assess risk situations appropriately, despite the greatly increased pace of change. The growing complexity and dynamism of the environment in which it operates means that there are natural limits. There cannot be absolute security when it comes to identifying risks at an early stage, measuring them sufficiently, or correctly estimating their real hazard potential.
Effective rate used in determining the fair value of the Shareholder’s loan
Judgements were applied in the determination of the effective interest rate used to discount the interest-free shareholder’s loan that is repayable after 10 years. sefa has never applied for external finance and therefore a market-related rate similar to the average rate at which the IDC borrows external funds was used.
1.23 Related parties Key management is defined as individuals with the
authority and responsibility for planning, directing and controlling the activities of the entity. All individuals from the level of executive management up to the Board of Directors are regarded as key management.
Close family members of key management personnel are considered to be those family members who may be expected to influence, or be influenced by key management individuals in their dealings with the entity.
Notes to the Financial Statements (continued)for the year ended 31 March 2017
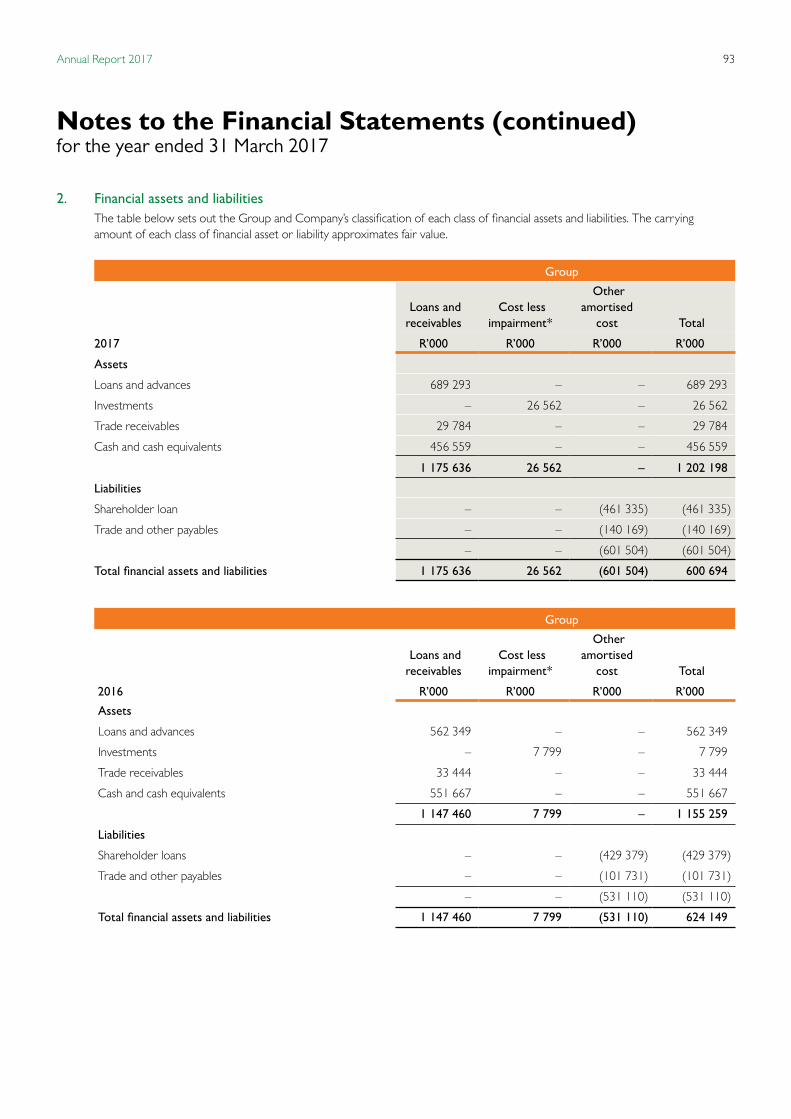
93Annual Report 2017
2. Financial assets and liabilities The table below sets out the Group and Company’s classification of each class of financial assets and liabilities. The carrying amount of each class of financial asset or liability approximates fair value.
Group
Loans and receivables
Cost less impairment*
Other amortised
cost Total
2017 R’000 R’000 R’000 R’000
Assets
Loans and advances 689 293 – – 689 293
Investments – 26 562 – 26 562
Trade receivables 29 784 – – 29 784
Cash and cash equivalents 456 559 – – 456 559
1 175 636 26 562 – 1 202 198
Liabilities
Shareholder loan – – (461 335) (461 335)
Trade and other payables – – (140 169) (140 169)
– – (601 504) (601 504)
Total financial assets and liabilities 1 175 636 26 562 (601 504) 600 694
Group
Loans and receivables
Cost less impairment*
Other amortised
cost Total
2016 R’000 R’000 R’000 R’000
Assets
Loans and advances 562 349 – – 562 349
Investments – 7 799 – 7 799
Trade receivables 33 444 – – 33 444
Cash and cash equivalents 551 667 – – 551 667
1 147 460 7 799 – 1 155 259
Liabilities
Shareholder loans – – (429 379) (429 379)
Trade and other payables – – (101 731) (101 731)
– – (531 110) (531 110)
Total financial assets and liabilities 1 147 460 7 799 (531 110) 624 149
Notes to the Financial Statements (continued)for the year ended 31 March 2017
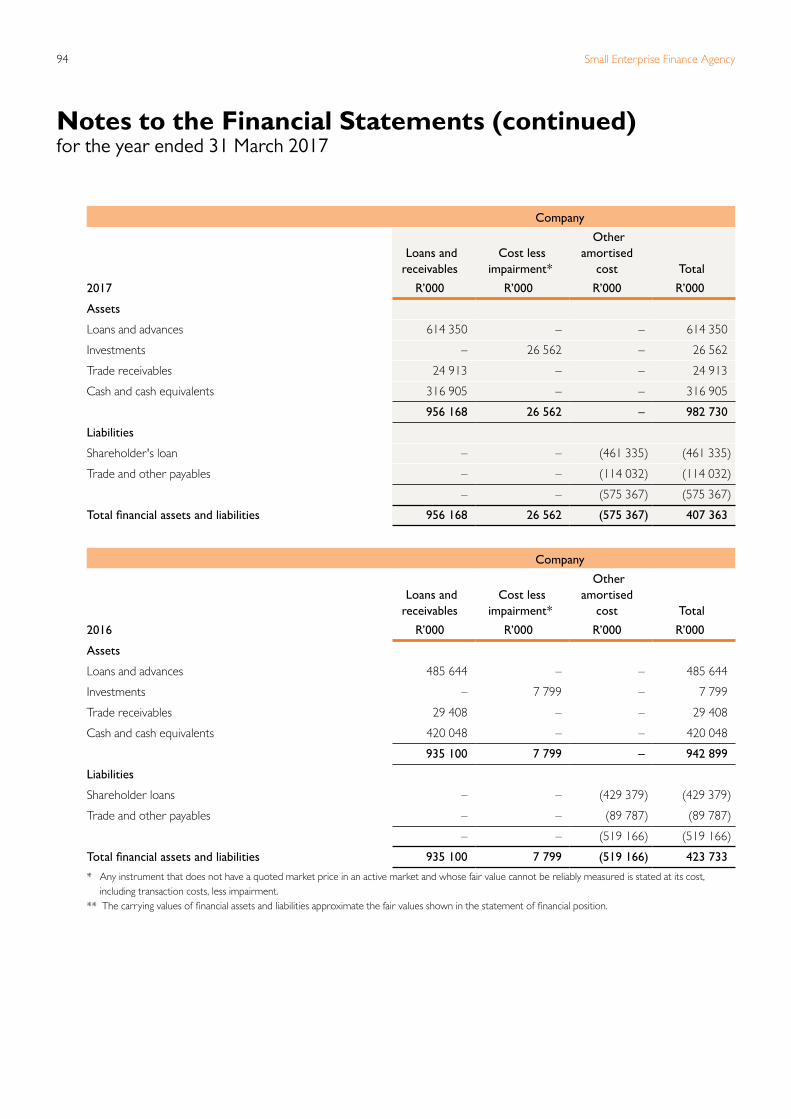
Small Enterprise Finance Agency94
Company
Loans and receivables
Cost lessimpairment*
Other amortised
cost Total
2017 R’000 R’000 R’000 R’000
Assets
Loans and advances 614 350 – – 614 350
Investments – 26 562 – 26 562
Trade receivables 24 913 – – 24 913
Cash and cash equivalents 316 905 – – 316 905
956 168 26 562 – 982 730
Liabilities
Shareholder's loan – – (461 335) (461 335)
Trade and other payables – – (114 032) (114 032)
– – (575 367) (575 367)
Total financial assets and liabilities 956 168 26 562 (575 367) 407 363
Company
Loans and receivables
Cost lessimpairment*
Other amortised
cost Total
2016 R’000 R’000 R’000 R’000
Assets
Loans and advances 485 644 – – 485 644
Investments – 7 799 – 7 799
Trade receivables 29 408 – – 29 408
Cash and cash equivalents 420 048 – – 420 048
935 100 7 799 – 942 899
Liabilities
Shareholder loans – – (429 379) (429 379)
Trade and other payables – – (89 787) (89 787)
– – (519 166) (519 166)
Total financial assets and liabilities 935 100 7 799 (519 166) 423 733
* Any instrument that does not have a quoted market price in an active market and whose fair value cannot be reliably measured is stated at its cost, including transaction costs, less impairment.
** The carrying values of financial assets and liabilities approximate the fair values shown in the statement of financial position.
Notes to the Financial Statements (continued)for the year ended 31 March 2017
95Annual Report 2017
3. Financial Risk Management of the Group and Company The Group and Company has exposure to the following
risks: • Operational risk; • Credit risk; • Liquidity risk; • Market risk; and • Indemnity risk. This note presents information about the Group’s exposure
to each of the above risks, the Group’s objectives, policies and processes for measuring and managing risk, and the Group’s management of capital. Further quantitative disclosures are included throughout these financial statements.
The Board of Directors has overall responsibility for the establishment and oversight of the Group’s risk management framework. The Board has established the Audit & Risk Committee, which is responsible for developing and monitoring the Group’s risk management policies. The Committee reports regularly to the Board of Directors on their activities.
The Group’s risk management policies are established to identify and analyse the risks faced by the Group, to set appropriate risk limits and controls, and to monitor risks and adherence to limits.
Risk management policies and systems are reviewed
regularly to reflect changes in market conditions and the Group’s activities. The Group, through its training and management standards and procedures, aims to develop a disciplined and constructive control environment in which all employees understand their roles and obligations.
The Audit & Risk Committee oversees how management monitors compliance with the Group’s risk management policies and procedures and review the adequacy of the risk management framework in relation to the risks faced by the Group. The Enterprise Risk Committee is assisted by the Internal Audit function which undertakes both regular and ad hoc reviews of risk management controls and procedures, the results of which are reported to the Audit & Risk Committee.
3.1 Operational risk Operational risk is the risk of direct or indirect loss
resulting from inadequate or failed internal processes, people and systems or from external events. It is associated with human error, system failures and inadequate procedures and controls. Operational risk also includes legal risk, which arises when a transaction proves unenforceable in law, but excludes strategic and reputational risk.
Management has identified the following risks as operational risks:
• Clients, products and business practices; • Execution, delivery and process management; • Employment practice and workplace safety; • External and internal fraud and theft; • Damage to physical assets; and • Business disruption and systems failure.
3.2 Liquidity risk Liquidity risk is a risk that the Group will not be able to meet
its financial obligations as they fall due. The Group’s approach to managing liquidity is to ensure, as far as possible, that it will always have sufficient liquidity to meet its liabilities when due, under both normal and stressed conditions, without incurring unacceptable losses or risk damage to the Group’s reputation.
Due to the nature of the business, the Group’s cash management process aims to maintain flexibility in funding by keeping committed credit lines available. Cash requirements and inflows are monitored by management to ensure that sufficient cash is available to meet all financial commitments including operational expenditure. Typically the Group ensures that it has sufficient cash on demand to meet expected operational expenses for a period of 60 days, including the servicing of financial obligations; this excludes the potential impact of extreme circumstances that cannot be reasonably predicted, such as natural disasters.
Notes to the Financial Statements (continued)for the year ended 31 March 2017
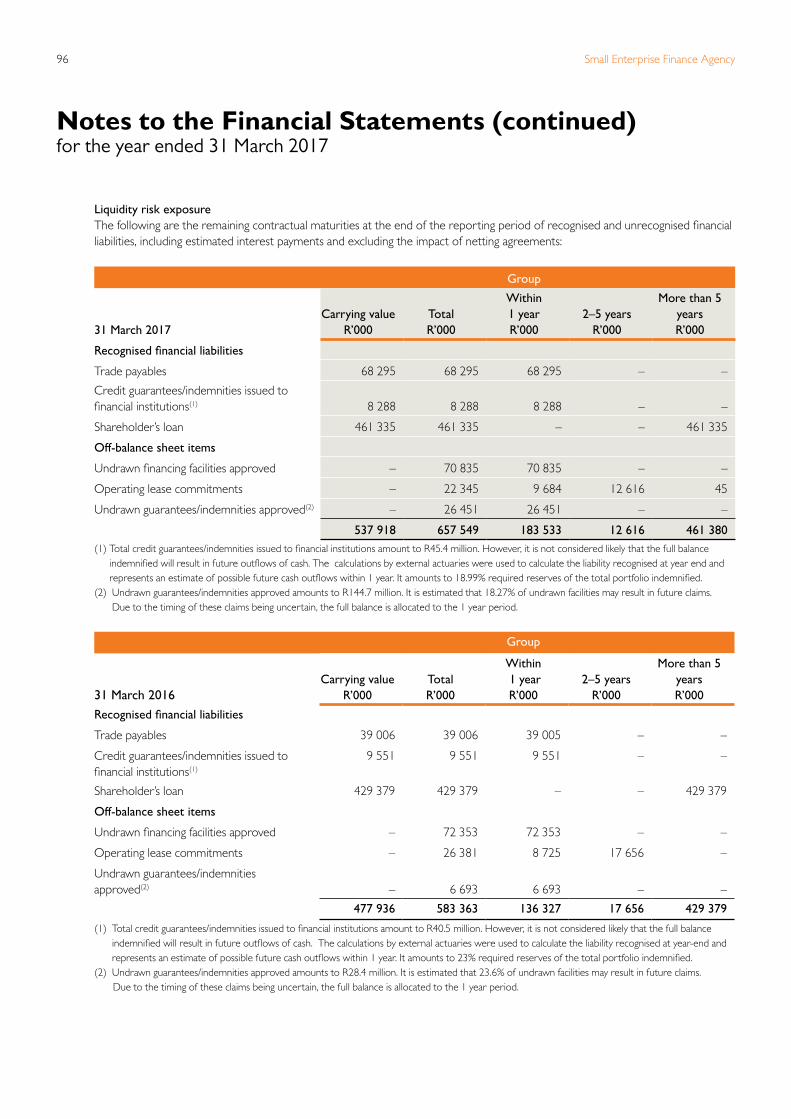
Small Enterprise Finance Agency96
Liquidity risk exposure The following are the remaining contractual maturities at the end of the reporting period of recognised and unrecognised financial
liabilities, including estimated interest payments and excluding the impact of netting agreements:
Group
31 March 2017Carrying value
R’000TotalR’000
Within 1 yearR’000
2–5 yearsR’000
More than 5 yearsR’000
Recognised financial liabilities
Trade payables 68 295 68 295 68 295 – –
Credit guarantees/indemnities issued to financial institutions(1) 8 288 8 288 8 288 – –
Shareholder’s loan 461 335 461 335 – – 461 335
Off-balance sheet items
Undrawn financing facilities approved – 70 835 70 835 – –
Operating lease commitments – 22 345 9 684 12 616 45
Undrawn guarantees/indemnities approved(2) – 26 451 26 451 – –
537 918 657 549 183 533 12 616 461 380 (1) Total credit guarantees/indemnities issued to financial institutions amount to R45.4 million. However, it is not considered likely that the full balance
indemnified will result in future outflows of cash. The calculations by external actuaries were used to calculate the liability recognised at year end and represents an estimate of possible future cash outflows within 1 year. It amounts to 18.99% required reserves of the total portfolio indemnified.
(2) Undrawn guarantees/indemnities approved amounts to R144.7 million. It is estimated that 18.27% of undrawn facilities may result in future claims. Due to the timing of these claims being uncertain, the full balance is allocated to the 1 year period.
Group
31 March 2016Carrying value
R’000TotalR’000
Within 1 yearR’000
2–5 yearsR’000
More than 5 yearsR’000
Recognised financial liabilities
Trade payables 39 006 39 006 39 005 – –
Credit guarantees/indemnities issued to financial institutions(1)
9 551 9 551 9 551 – –
Shareholder’s loan 429 379 429 379 – – 429 379
Off-balance sheet items
Undrawn financing facilities approved – 72 353 72 353 – –
Operating lease commitments – 26 381 8 725 17 656 –
Undrawn guarantees/indemnitiesapproved(2)
– 6 693 6 693 – –
477 936 583 363 136 327 17 656 429 379
(1) Total credit guarantees/indemnities issued to financial institutions amount to R40.5 million. However, it is not considered likely that the full balance indemnified will result in future outflows of cash. The calculations by external actuaries were used to calculate the liability recognised at year-end and represents an estimate of possible future cash outflows within 1 year. It amounts to 23% required reserves of the total portfolio indemnified.
(2) Undrawn guarantees/indemnities approved amounts to R28.4 million. It is estimated that 23.6% of undrawn facilities may result in future claims. Due to the timing of these claims being uncertain, the full balance is allocated to the 1 year period.
Notes to the Financial Statements (continued)for the year ended 31 March 2017
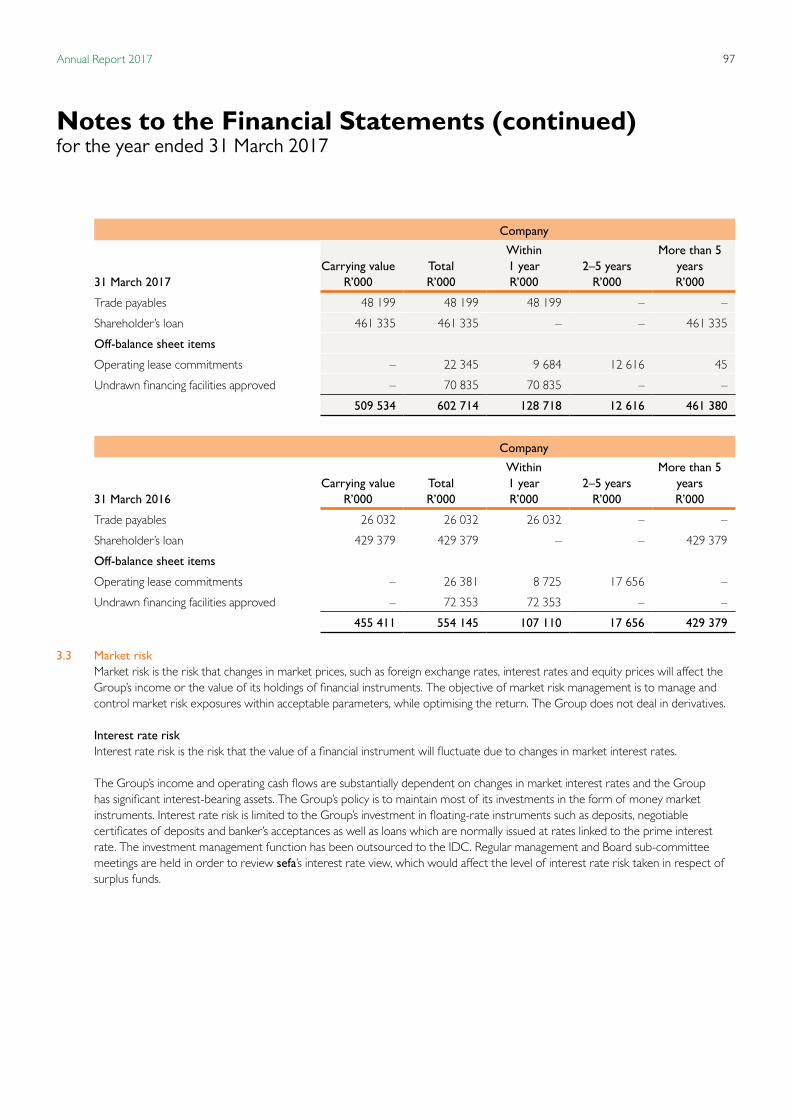
97Annual Report 2017
Company
31 March 2017Carrying value
R’000TotalR’000
Within 1 yearR’000
2–5 yearsR’000
More than 5 yearsR’000
Trade payables 48 199 48 199 48 199 – –
Shareholder’s loan 461 335 461 335 – – 461 335
Off-balance sheet items
Operating lease commitments – 22 345 9 684 12 616 45
Undrawn financing facilities approved – 70 835 70 835 – –
509 534 602 714 128 718 12 616 461 380
Company
31 March 2016 Carrying value
R’000TotalR’000
Within 1 yearR’000
2–5 yearsR’000
More than 5 yearsR’000
Trade payables 26 032 26 032 26 032 – –
Shareholder’s loan 429 379 429 379 – – 429 379
Off-balance sheet items
Operating lease commitments – 26 381 8 725 17 656 –
Undrawn financing facilities approved – 72 353 72 353 – –
455 411 554 145 107 110 17 656 429 379
3.3 Market risk Market risk is the risk that changes in market prices, such as foreign exchange rates, interest rates and equity prices will affect the
Group’s income or the value of its holdings of financial instruments. The objective of market risk management is to manage and control market risk exposures within acceptable parameters, while optimising the return. The Group does not deal in derivatives.
Interest rate risk Interest rate risk is the risk that the value of a financial instrument will fluctuate due to changes in market interest rates. The Group’s income and operating cash flows are substantially dependent on changes in market interest rates and the Group
has significant interest-bearing assets. The Group’s policy is to maintain most of its investments in the form of money market instruments. Interest rate risk is limited to the Group’s investment in floating-rate instruments such as deposits, negotiable certificates of deposits and banker’s acceptances as well as loans which are normally issued at rates linked to the prime interest rate. The investment management function has been outsourced to the IDC. Regular management and Board sub-committee meetings are held in order to review sefa’s interest rate view, which would affect the level of interest rate risk taken in respect of surplus funds.
Notes to the Financial Statements (continued)for the year ended 31 March 2017

Small Enterprise Finance Agency98
At the reporting date the interest rate profile of the Group’s interest-bearing financial instruments was:
Group Company
2017R’000
2016R’000
2017R’000
2016R’000
Variable rate instruments
Financial assets 1 802 726 1 213 634 1 569 071 1 043 136
Financial liabilities (9) (188) – –
Balance at end of the year 1 802 717 1 213 446 1 569 071 1 043 136
Cash flow sensitivity analysis for variable rate instruments
A change in 100 basis points in the interest rates at the reporting date would have increased/(decreased) equity and profit or loss by the amounts shown below. This analysis assumes that all other variables remain constant. The analysis was performed on the same basis for 2016.
100 basis points increase 18 027 12 134 15 691 10 431
100 basis points decrease (18 027) (12 134) (15 691) (10 431)
Fair values Fair values versus carrying amounts The fair value of financial assets and liabilities approximate the carrying amounts shown in the statement of financial position, due
to the following reasons: • The general short-term nature of financial assets; • Decreases in credit risk ratings result in impairments of loans; • Loans are issued at rates linked to the prime interest rate; • The Shareholder’s loan was initially recognised at fair value and the accumulated finance charges is based on market rates.
Money market investments are reflected as cash and cash equivalents.
Capital management The Board’s policy is to achieve a capital base that will ensure the long term sustainability of sefa and monitors progress towards
this goal so as to maintain shareholder, creditor and market confidence and to sustain future development of the business. The Board seeks to maintain a balance between sustainable returns and its developmental mandate. There were no changes in
the Group’s approach to capital management during the year. A subsidiary, KCG is subject to capital requirements imposed on it by the FSB in terms of STIA. Neither the Company nor any of its other subsidiaries are subject to externally imposed capital requirements.
The Group’s objectives when managing capital are: • To comply with capital requirements required for insurers as determined by the STIA; and • To safeguard the Group’s ability to continue as a going concern so that it can provide returns for the Shareholder and benefits
for other stakeholders. KCG submits quarterly and annual returns to the FSB in terms of STIA. The Company is required at all times to maintain a statutory
surplus asset ratio as defined in STIA. Adequate capital requirements were met throughout the year.
3.4 Indemnity risk Indemnity risk arises from normal operations of the Group, through credit indemnities provided by KCG through the following
two products: • Indemnifying financiers for defaults on outstanding loans to SMMEs and Co-operatives; and • Indemnifying suppliers for defaults on trade credit facilities.
Notes to the Financial Statements (continued)for the year ended 31 March 2017

99Annual Report 2017
The Board and the Executive Committee manage the indemnity risk according to the Group’s risk appetite. The risk under any one indemnity contract is the likelihood that the indemnified event will occur, and the uncertainty of the
amount of the resulting claims. For a portfolio of indemnity contracts where the theory of probability is applied to provisioning, the principle risk that the Group faces is that the actual claims and benefit payments will exceed the carrying amount of the indemnity liabilities. By the very nature of an indemnity contract, the risk is random and therefore unpredictable. Changing risk parameters and unforeseen factors, such as economical and geographical circumstances, may result in unexpectedly large claims. Indemnified events are random and from one year to the next and the actual number of claims will vary from the estimate established by means of statistical techniques.
Factors that aggravate indemnity risk include lack of risk diversification in terms of type and amount of risk and geographical location covered. Experience shows that the larger the portfolio of similar indemnity contracts, the smaller the relative variability of the expected outcome will be, therefore a more diversified portfolio is less likely to be affected across the board by a change in any subset of the portfolio. The Group only underwrites indemnity contracts in South Africa.
The Group does not have the right to re-price and change the conditional risks on renewal of individual indemnities.
The Group establishes a provision for claims using independent actuarial methods.
Limiting exposure to indemnity risk The Group limits its exposure to indemnity risk through setting a clearly defined underwriting strategy and adopting appropriate
risk assessment techniques. Each of these risk management aspects is dealt with below in more detail.
(i) Underwriting strategy and limits and policies for mitigating indemnity risk The Group’s underwriting strategy seeks diversity to ensure a balanced portfolio of indemnity risks. To this end the Group
underwrites a wide variety of risks spread across financial and commercial indemnity holders, which includes the underwriting of risks in niche markets with favourable claims expectations.
On an annual basis the Group prepares an underwriting budget that is based on the underwriting strategy to be followed in the next three years. The underwriting strategy is updated for changes in the underwriting results of the Group and the industry, the Group’s available risk capital, its developmental mandate as well as existing concentrations of indemnity risk.
(ii) Risk assessment The Group relies on a rigorous process followed by the indemnified parties before they propose and accept a specific indemnity
risk. Some of the factors considered during the underwriting stage include: • Past loss experience associated with the proposed risk; • Indemnifiable interest; • Probability of success; • Level of mitigation procedures adopted; • Location of the proposed risk; • Past and proposed rating terms of the risk; • Scope and terms of cover considered; • Results of surveys completed, where applicable; and • Possible variations that may be applied to the risks indemnified.
Concentration of indemnity risks The Group’s insurance portfolio consists of indemnity risks. The concentration of indemnity risks is managed by different levels
of diversification mainly through the financial institutions that are underwritten and the geographical areas in which the risks are situated, with single risks spread across all areas of the country.
Notes to the Financial Statements (continued)for the year ended 31 March 2017
Small Enterprise Finance Agency100
3.5 Credit risk Credit risk is the risk of financial loss to the Group if a customer or counter-party to a financial instrument fails to meet its contractual
obligations, and arises principally from the Group’s receivables from customers and investment securities. 3.5.1 Loans and advances and trade and other receivables The Group’s exposure to credit risk is influenced mainly by the individual characteristics of each customer. The demographics of
the Group’s customer base, including the default risk of the industry and the country, in which customers operate, is also taken into account. No significant percentage of the Group’s revenue can be contributed to transactions with one customer and there is no geographical concentration of credit risk.
Risk Management has established a credit policy under which each new customer is analysed individually for creditworthiness before the Group will transact with the customer. The Group’s review includes external ratings, when available, due diligence exercises and in some cases, bank references.
Loans and advances are subject to comprehensive and substantial security clauses to protect the Group in the event of non-payment.
All credit risk arises from normal operations of the Group, with the major credit risk arising from the Group’s receivables and loans and advances. The Credit & Investment Committee established by the Board of Directors review the Group’s loan portfolio on an on-going basis. All applications for credit are thoroughly scrutinised covering financial, technical and market risks. sefa, being a DFI, has a different risk profile compared to traditional commercial banks.
The Group establishes an allowance for impairment that represents its estimate of incurred losses in respect of receivables, loans and advances and investments. The main components of this allowance are a specific loss component that relates to individually significant exposures, and a collective loss component established for groups of similar assets in respect of losses that have been incurred but not yet identified. The collective loss allowance is determined based on historical data of payment for similar assets.
3.5.2 Investments The Group limits its exposure to credit risk in respect of its money market transactions by only investing in funds that have approved
high credit quality financial ratings and public sector institutions in accordance with predetermined limits approved by Executive Management and the Board. Money market investments are reflected as cash and cash equivalents.
Notes to the Financial Statements (continued)for the year ended 31 March 2017
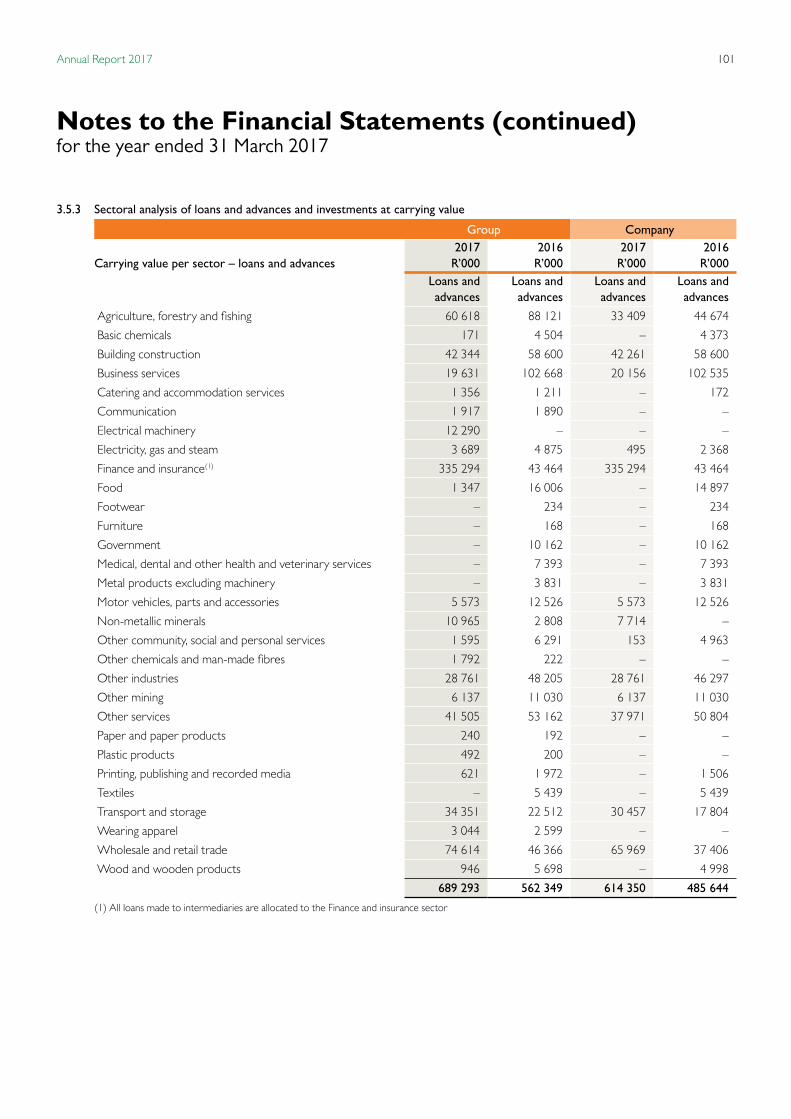
101Annual Report 2017
3.5.3 Sectoral analysis of loans and advances and investments at carrying value
Group Company
Carrying value per sector – loans and advances2017
R’0002016
R’0002017
R’0002016
R’000 Loans and
advances Loans and
advances Loans and
advances Loans and
advances
Agriculture, forestry and fishing 60 618 88 121 33 409 44 674
Basic chemicals 171 4 504 – 4 373
Building construction 42 344 58 600 42 261 58 600
Business services 19 631 102 668 20 156 102 535
Catering and accommodation services 1 356 1 211 – 172
Communication 1 917 1 890 – –
Electrical machinery 12 290 – – –
Electricity, gas and steam 3 689 4 875 495 2 368
Finance and insurance(1) 335 294 43 464 335 294 43 464
Food 1 347 16 006 – 14 897
Footwear – 234 – 234
Furniture – 168 – 168
Government – 10 162 – 10 162
Medical, dental and other health and veterinary services – 7 393 – 7 393
Metal products excluding machinery – 3 831 – 3 831
Motor vehicles, parts and accessories 5 573 12 526 5 573 12 526
Non-metallic minerals 10 965 2 808 7 714 –
Other community, social and personal services 1 595 6 291 153 4 963
Other chemicals and man-made fibres 1 792 222 – –
Other industries 28 761 48 205 28 761 46 297
Other mining 6 137 11 030 6 137 11 030
Other services 41 505 53 162 37 971 50 804
Paper and paper products 240 192 – –
Plastic products 492 200 – –
Printing, publishing and recorded media 621 1 972 – 1 506
Textiles – 5 439 – 5 439
Transport and storage 34 351 22 512 30 457 17 804
Wearing apparel 3 044 2 599 – –
Wholesale and retail trade 74 614 46 366 65 969 37 406
Wood and wooden products 946 5 698 – 4 998
689 293 562 349 614 350 485 644
(1) All loans made to intermediaries are allocated to the Finance and insurance sector
Notes to the Financial Statements (continued)for the year ended 31 March 2017

Small Enterprise Finance Agency102
The following investment in an En Commandite partnership is also allocated to the finance and insurance sector:
Group Company
Carrying value per sector – investments2017
R’0002016
R’0002017
R’0002016
R’000
Investments Investments Investments Investments
Finance and insurance 26 562 7 799 26 562 7 799
3.5.4 Credit risk exposure
The Group and Company is exposed to the following credit risk:
Group Company
2017R’000
2016R’000
2017R’000
2016R’000
Cash and cash equivalents 456 559 551 667 316 905 420 048
Trade receivables 71 528 62 816 66 339 58 463
Loans and advances 1 292 373 1 130 419 1 198 371 1 029 808
Investments 33 969 54 598 33 969 54 598
Total exposure 1 854 429 1 799 500 1 615 584 1 562 917
Allowance for impairment – trade receivables (36 973) (26 159) (36 973) (26 159)
Allowance for impairment – loans and advances (603 080) (568 070) (584 021) (544 164)
Allowance for impairment – investments (7 407) (46 799) (7 407) (46 799)
Carrying amount 1 206 969 1 158 472 987 183 945 795
Notes to the Financial Statements (continued)for the year ended 31 March 2017
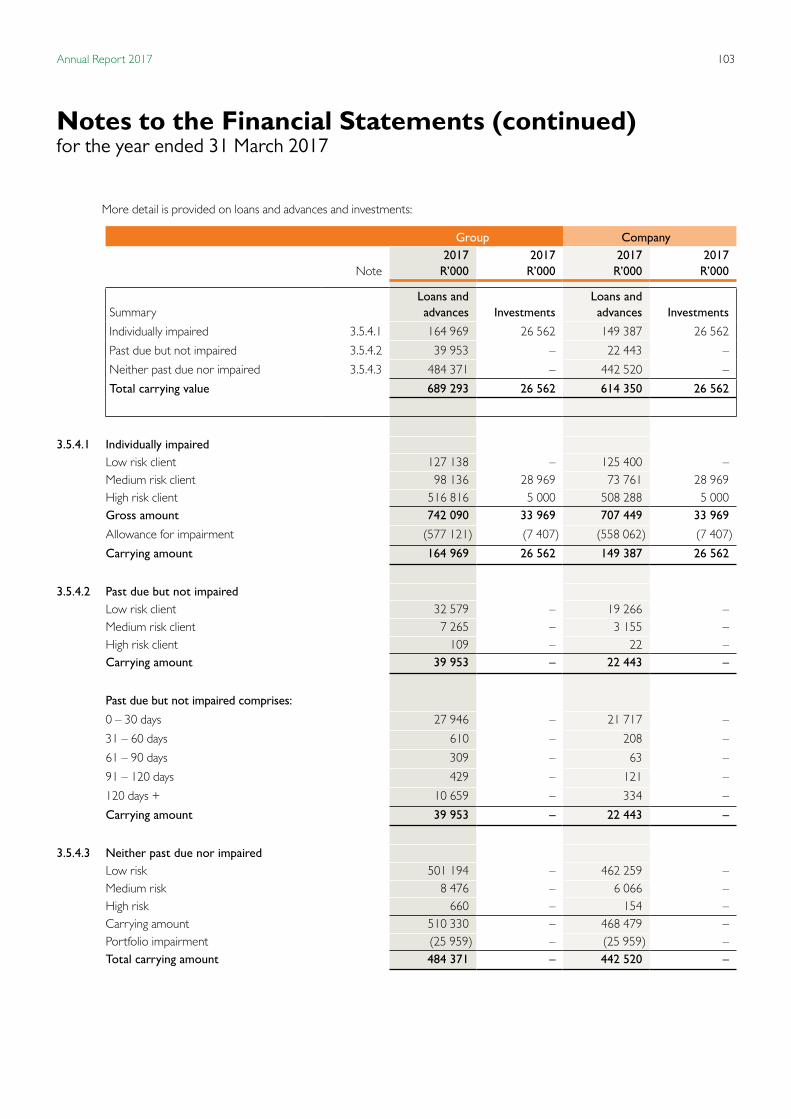
103Annual Report 2017
More detail is provided on loans and advances and investments:
Group Company
Note2017
R’0002017
R’0002017
R’0002017
R’000
Summary Loans and
advances Investments Loans and
advances Investments
Individually impaired 3.5.4.1 164 969 26 562 149 387 26 562
Past due but not impaired 3.5.4.2 39 953 – 22 443 –
Neither past due nor impaired 3.5.4.3 484 371 – 442 520 –
Total carrying value 689 293 26 562 614 350 26 562
3.5.4.1 Individually impairedLow risk client 127 138 – 125 400 – Medium risk client 98 136 28 969 73 761 28 969 High risk client 516 816 5 000 508 288 5 000 Gross amount 742 090 33 969 707 449 33 969
Allowance for impairment (577 121) (7 407) (558 062) (7 407)
Carrying amount 164 969 26 562 149 387 26 562
3.5.4.2 Past due but not impairedLow risk client 32 579 – 19 266 – Medium risk client 7 265 – 3 155 – High risk client 109 – 22 – Carrying amount 39 953 – 22 443 –
Past due but not impaired comprises:
0 – 30 days 27 946 – 21 717 –
31 – 60 days 610 – 208 –
61 – 90 days 309 – 63 –
91 – 120 days 429 – 121 –
120 days + 10 659 – 334 –
Carrying amount 39 953 – 22 443 –
3.5.4.3 Neither past due nor impairedLow risk 501 194 – 462 259 – Medium risk 8 476 – 6 066 – High risk 660 – 154 – Carrying amount 510 330 – 468 479 – Portfolio impairment (25 959) – (25 959) – Total carrying amount 484 371 – 442 520 –
Notes to the Financial Statements (continued)for the year ended 31 March 2017
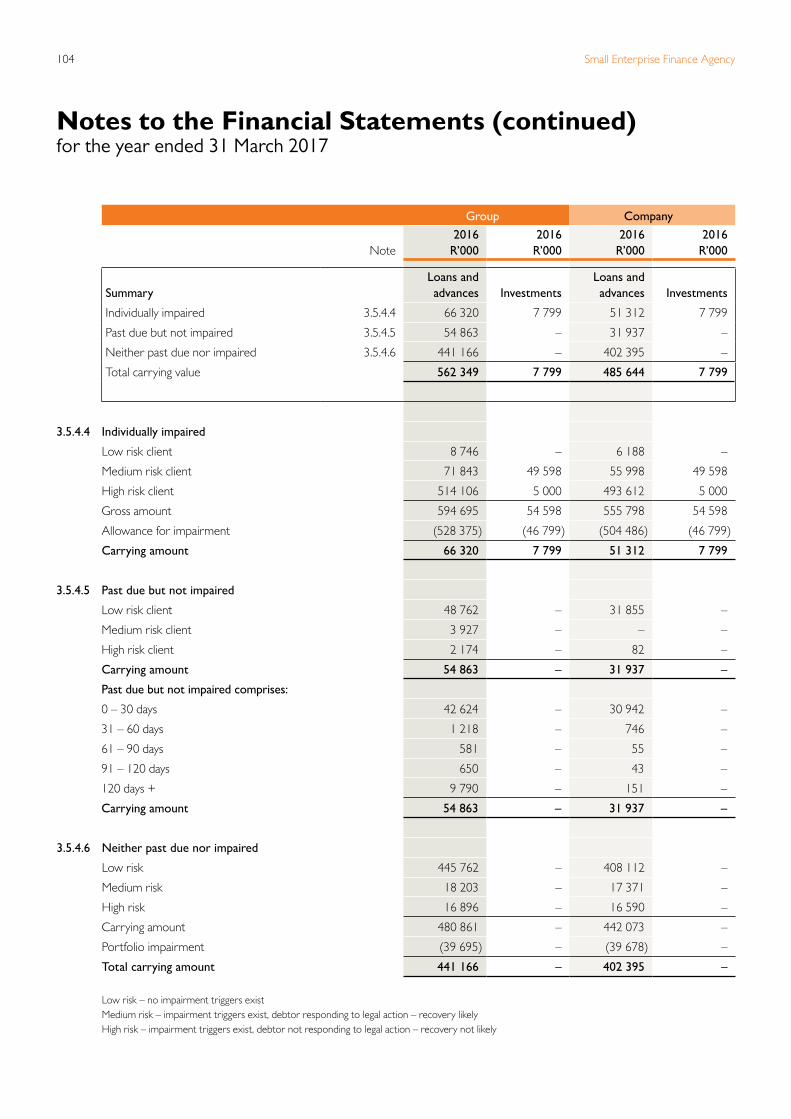
Small Enterprise Finance Agency104
Group Company
Note2016
R’0002016
R’0002016
R’0002016
R’000
Summary Loans and
advances Investments Loans and
advances Investments
Individually impaired 3.5.4.4 66 320 7 799 51 312 7 799
Past due but not impaired 3.5.4.5 54 863 – 31 937 –
Neither past due nor impaired 3.5.4.6 441 166 – 402 395 –
Total carrying value 562 349 7 799 485 644 7 799
3.5.4.4 Individually impaired
Low risk client 8 746 – 6 188 –
Medium risk client 71 843 49 598 55 998 49 598
High risk client 514 106 5 000 493 612 5 000
Gross amount 594 695 54 598 555 798 54 598
Allowance for impairment (528 375) (46 799) (504 486) (46 799)
Carrying amount 66 320 7 799 51 312 7 799
3.5.4.5 Past due but not impaired
Low risk client 48 762 – 31 855 –
Medium risk client 3 927 – – –
High risk client 2 174 – 82 –
Carrying amount 54 863 – 31 937 –
Past due but not impaired comprises:
0 – 30 days 42 624 – 30 942 –
31 – 60 days 1 218 – 746 –
61 – 90 days 581 – 55 –
91 – 120 days 650 – 43 –
120 days + 9 790 – 151 –
Carrying amount 54 863 – 31 937 –
3.5.4.6 Neither past due nor impaired
Low risk 445 762 – 408 112 –
Medium risk 18 203 – 17 371 –
High risk 16 896 – 16 590 –
Carrying amount 480 861 – 442 073 –
Portfolio impairment (39 695) – (39 678) –
Total carrying amount 441 166 – 402 395 – Low risk – no impairment triggers exist Medium risk – impairment triggers exist, debtor responding to legal action – recovery likely High risk – impairment triggers exist, debtor not responding to legal action – recovery not likely
Notes to the Financial Statements (continued)for the year ended 31 March 2017

105Annual Report 2017
Credit quality of loans neither past due nor impaired The Group has every reason to believe that the underlying debtors have the ability and intention to repay these loans and that the
likelihood of default is low. Collateral held Collateral ranges from cessions over moveable and immoveable assets to personal surety.
Due to the nature of the business of sefa, the value of collateral held is low compared to the carrying value of the related loans.
4. Cash and cash equivalents
Group Company
2017R’000
2016R’000
2017R’000
2016R’000
Cash in bank and in hand 187 633 149 571 139 214 109 463
Cash managed by Shareholder 268 926 402 096 177 691 310 585
456 559 551 667 316 905 420 048
Cash balances relating to donor funds managed on behalf of external parties (refer to note 19.3) 65 833 62 726 65 833 62 726
Cash and cash equivalents are all current assets. Cash balances managed by the IDC are immediately available as and when requested.
5. Trade and other receivables
Group Company
2017R’000
2016R’000
2017R’000
2016R’000
Trade receivables 10 881 13 650 6 010 9 614
Pre-payments 4 771 3 213 4 453 2 896
Rental debtors 47 677 39 745 47 677 39 745
Related party loans (refer to note 34) 7 553 5 000 7 553 5 000
Study loans 646 1 208 646 1 208
Trade and other receivables before bad debt provision 71 528 62 816 66 339 58 463
Bad debt provision on rental debtors (36 973) (26 159) (36 973) (26 159)
Closing carrying value 34 555 36 657 29 366 32 304
Trade and other receivables are current assets and not pledged as security.
Notes to the Financial Statements (continued)for the year ended 31 March 2017

Small Enterprise Finance Agency106
6. Loans and advances
Group Company
2017R’000
2016R’000
2017R’000
2016R’000
Loans and advances to clients 1 292 373 1 130 419 1 198 371 1 029 808
Impairments of loans and advances (603 080) (568 070) (584 021) (544 164)
689 293 562 349 614 350 485 644
Reconciliation of impairment of loans and advances Specific allowances for impairment
Balance as at 1 April 568 070 322 274 544 164 267 859
Impairment loss for the year:
• Reclassification from Investments – 17 754 – 24 680
• Charge for the year 65 686 379 314 61 673 372 252
• Recoveries – (6 679) – –
Write-offs (30 676) (144 593) (21 816) (120 627)
Closing balance 603 080 568 070 584 021 544 164
Maturity of loans and advances: • Due within one year 651 932 453 755 595 577 401 257
• Due after one year but within two years 251 957 303 055 232 257 278 627
• Due after two years but within three years 223 690 214 227 213 283 200 517
• Due after three years but within four years 109 672 123 154 104 626 116 405
• Due after four years but within five years 55 122 35 355 52 628 33 002
• Due after five years – 873 – –
• Impairment of loans and advances (603 080) (568 070) (584 021) (544 164)
689 293 562 349 614 350 485 644
Loans and advances consists of current and non-current assets, balances recoverable within 12 months are considered current.
Notes to the Financial Statements (continued)for the year ended 31 March 2017

107Annual Report 2017
7. Investments
Group Company
2017R’000
2016R’000
2017R’000
2016R’000
Unlisted equities 5 000 5 000 5 000 5 000
Investment in En Commandite partnership 28 969 49 598 28 969 49 598
33 969 54 598 33 969 54 598
Impairment of unlisted equities (5 000) (5 000) (5 000) (5 000)
Impairment of investment in En Commandite partnership (2 407) (41 799) (2 407) (41 799)
26 562 7 799 26 562 7 799
Specific allowances for impairment – Unlisted equities
Closing balance 5 000 5 000 5 000 5 000
Specific allowances for impairment – En Commandite partnership
Opening balance 41 799 41 244 41 799 41 244
Increase in impairment (39 392) 555 (39 392) 555
Closing balance 2 407 41 799 2 407 41 799
These investments do not have a quoted market price in an active market and their fair value cannot be reliably measured. They are therefore stated at cost, including transaction costs, less impairment. All investments are non-current assets.
Notes to the Financial Statements (continued)for the year ended 31 March 2017
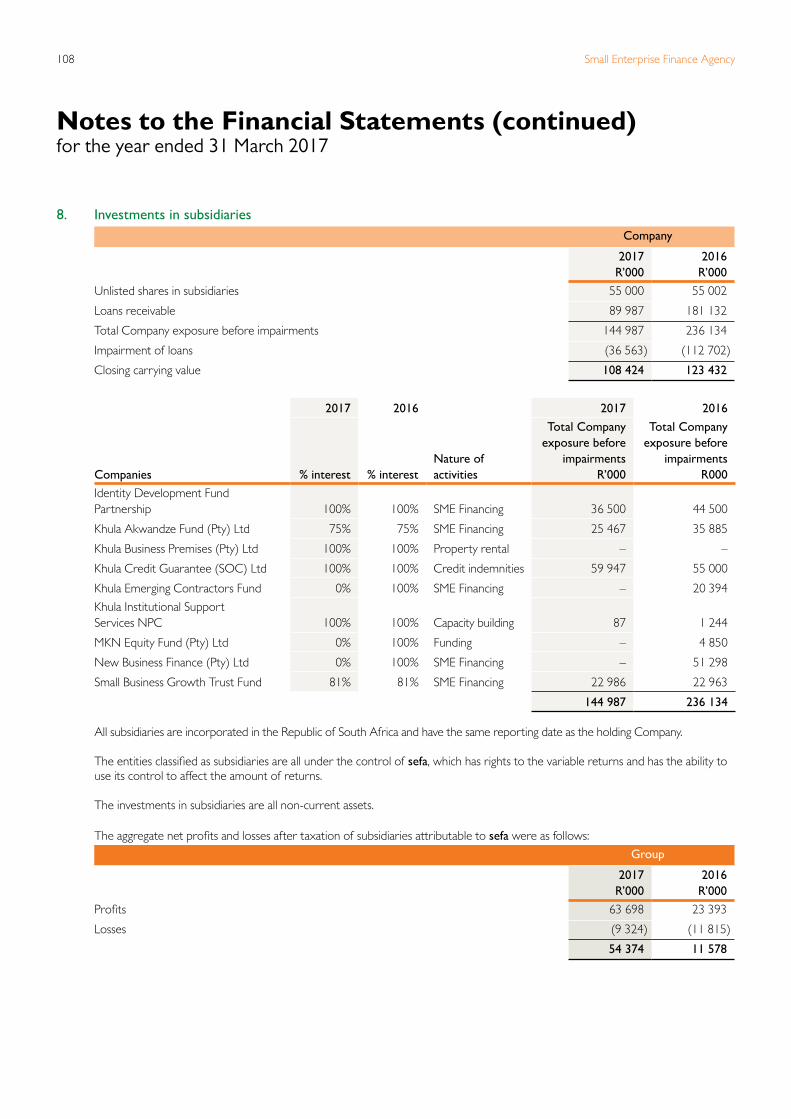
Small Enterprise Finance Agency108
8. Investments in subsidiaries Company
2017R’000
2016R’000
Unlisted shares in subsidiaries 55 000 55 002
Loans receivable 89 987 181 132
Total Company exposure before impairments 144 987 236 134
Impairment of loans (36 563) (112 702)
Closing carrying value 108 424 123 432
2017 2016 2017 2016
Companies % interest % interest Nature of activities
Total Company exposure before
impairmentsR’000
Total Company exposure before
impairmentsR000
Identity Development Fund Partnership 100% 100% SME Financing 36 500 44 500
Khula Akwandze Fund (Pty) Ltd 75% 75% SME Financing 25 467 35 885
Khula Business Premises (Pty) Ltd 100% 100% Property rental – –
Khula Credit Guarantee (SOC) Ltd 100% 100% Credit indemnities 59 947 55 000
Khula Emerging Contractors Fund 0% 100% SME Financing – 20 394 Khula Institutional Support Services NPC 100% 100% Capacity building 87 1 244
MKN Equity Fund (Pty) Ltd 0% 100% Funding – 4 850
New Business Finance (Pty) Ltd 0% 100% SME Financing – 51 298
Small Business Growth Trust Fund 81% 81% SME Financing 22 986 22 963
144 987 236 134
All subsidiaries are incorporated in the Republic of South Africa and have the same reporting date as the holding Company. The entities classified as subsidiaries are all under the control of sefa, which has rights to the variable returns and has the ability to
use its control to affect the amount of returns. The investments in subsidiaries are all non-current assets. The aggregate net profits and losses after taxation of subsidiaries attributable to sefa were as follows:
Group
2017R’000
2016R’000
Profits 63 698 23 393
Losses (9 324) (11 815)
54 374 11 578
Notes to the Financial Statements (continued)for the year ended 31 March 2017
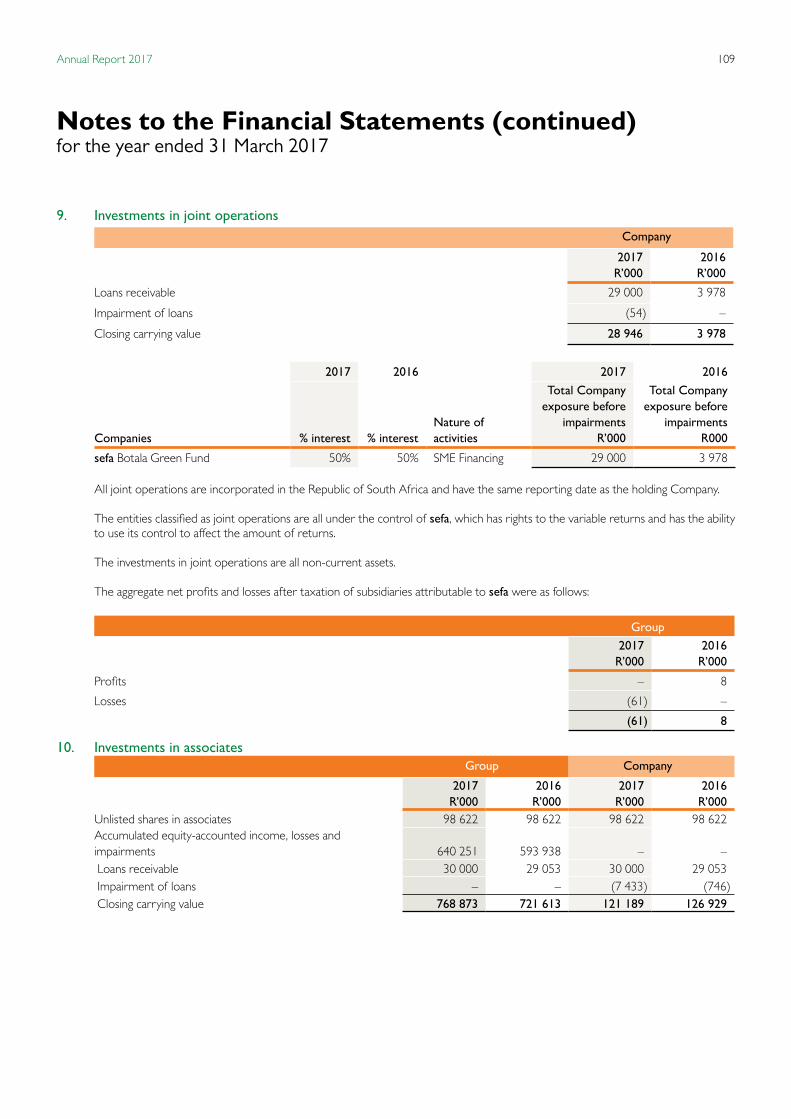
109Annual Report 2017
9. Investments in joint operations Company
2017R’000
2016R’000
Loans receivable 29 000 3 978
Impairment of loans (54) –
Closing carrying value 28 946 3 978
2017 2016 2017 2016
Companies % interest % interest Nature of activities
Total Company exposure before
impairmentsR’000
Total Company exposure before
impairmentsR000
sefa Botala Green Fund 50% 50% SME Financing 29 000 3 978 All joint operations are incorporated in the Republic of South Africa and have the same reporting date as the holding Company. The entities classified as joint operations are all under the control of sefa, which has rights to the variable returns and has the ability
to use its control to affect the amount of returns. The investments in joint operations are all non-current assets. The aggregate net profits and losses after taxation of subsidiaries attributable to sefa were as follows:
Group2017
R’0002016
R’000
Profits – 8
Losses (61) –
(61) 8
10. Investments in associatesGroup Company
2017R’000
2016R’000
2017R’000
2016R’000
Unlisted shares in associates 98 622 98 622 98 622 98 622 Accumulated equity-accounted income, losses and impairments 640 251 593 938 – – Loans receivable 30 000 29 053 30 000 29 053 Impairment of loans – – (7 433) (746) Closing carrying value 768 873 721 613 121 189 126 929
Notes to the Financial Statements (continued)for the year ended 31 March 2017
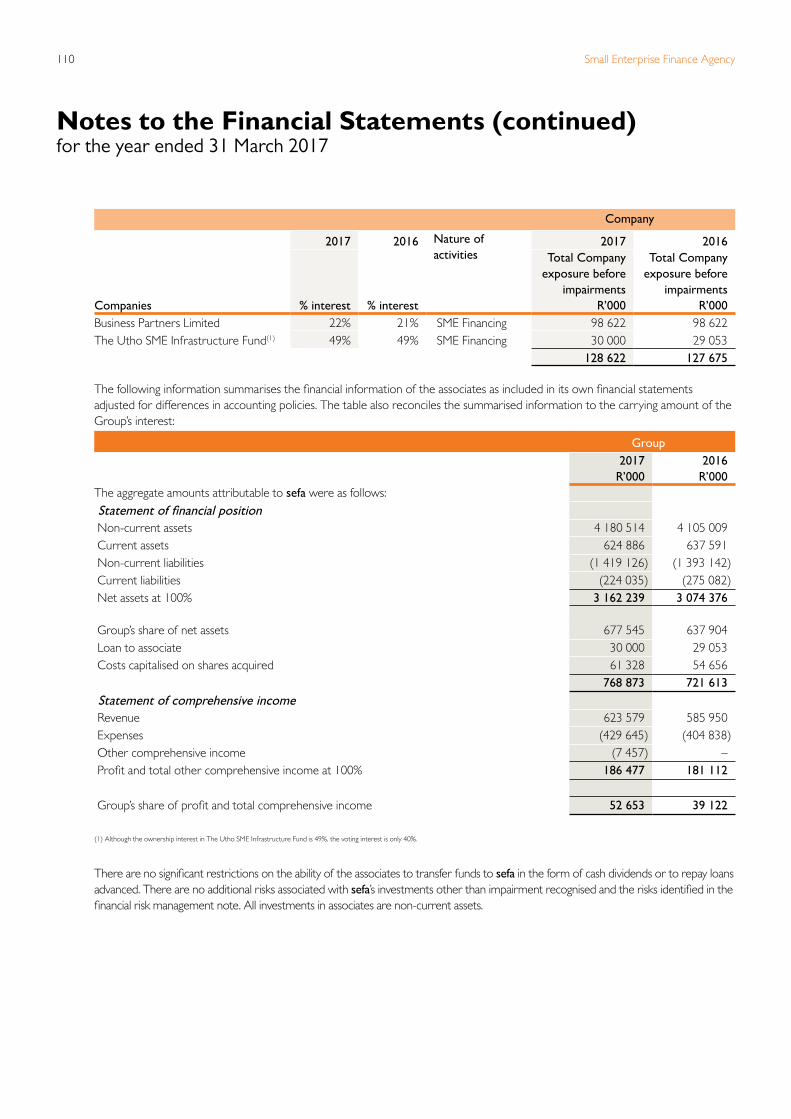
Small Enterprise Finance Agency110
Company
2017 2016 Nature of activities
2017 2016
Companies % interest % interest
Total Company exposure before
impairmentsR’000
Total Company exposure before
impairmentsR’000
Business Partners Limited 22% 21% SME Financing 98 622 98 622 The Utho SME Infrastructure Fund(1) 49% 49% SME Financing 30 000 29 053 128 622 127 675
The following information summarises the financial information of the associates as included in its own financial statements
adjusted for differences in accounting policies. The table also reconciles the summarised information to the carrying amount of the Group’s interest:
Group2017
R’0002016
R’000The aggregate amounts attributable to sefa were as follows: Statement of financial position Non-current assets 4 180 514 4 105 009 Current assets 624 886 637 591 Non-current liabilities (1 419 126) (1 393 142) Current liabilities (224 035) (275 082) Net assets at 100% 3 162 239 3 074 376
Group’s share of net assets 677 545 637 904 Loan to associate 30 000 29 053 Costs capitalised on shares acquired 61 328 54 656
768 873 721 613 Statement of comprehensive income Revenue 623 579 585 950 Expenses (429 645) (404 838) Other comprehensive income (7 457) – Profit and total other comprehensive income at 100% 186 477 181 112
Group’s share of profit and total comprehensive income 52 653 39 122
(1) Although the ownership interest in The Utho SME Infrastructure Fund is 49%, the voting interest is only 40%.
There are no significant restrictions on the ability of the associates to transfer funds to sefa in the form of cash dividends or to repay loans
advanced. There are no additional risks associated with sefa’s investments other than impairment recognised and the risks identified in the financial risk management note. All investments in associates are non-current assets.
Notes to the Financial Statements (continued)for the year ended 31 March 2017

111Annual Report 2017
11. Investments in joint ventures
Group Company2017
R’0002016
R’0002017
R’0002016
R’000Accumulated equity-accounted income, losses and impairments
13 321 36 673 – –
Loans receivable 155 323 166 443 155 323 166 443 Impairment of loans – – (20 313) (2 361)Closing carrying value 168 644 203 116 135 010 164 082
Investments in joint arrangements were assessed and it was concluded that these agreements should be classified as joint ventures. In performing the assessment, the Group considered the structure of the arrangements, the legal form of any separate vehicle, the contractual terms of the arrangements and other facts and circumstances.
2017 2016 2017 2016
Companies % interest % interest Nature of activities
Total exposureR’000
Total exposureR’000
Anglo American sefa Mining Fund (Pty) Ltd 50% 50%
Financing mining activities 76 287 90 708
Cytobix (Pty) Ltd trading as Godisa Supplier Development Fund 50% 50% SME Financing 20 524 19 023 sefa Awethu Youth Fund (Pty) Ltd 50% 50% SME Financing 58 512 56 712
155 323 166 443
Group2017
R’0002016
R’000The aggregate amounts attributable to sefa were as follows:
Statement of financial position Non-current assets 216 245 157 680
Current assets 118 596 119 544
Non-current liabilities (176 816) (137 022)
Current liabilities (131 382) (66 855)
Net assets at 100% 26 643 73 347
Group’s share of net assets 13 321 36 673
Loans to joint ventures 155 323 166 443
168 644 203 116
Statement of comprehensive income Revenue 19 085 32 088
Expenses (65 786) (31 870)
Loss and total other comprehensive income at 100% (46 701) 218
Group’s share of loss and total comprehensive loss (23 352) 295
There are no significant restrictions on the ability of the joint ventures to transfer funds to sefa in the form of cash dividends or to repay loans advanced. There are no additional risks associated with sefa’s investments other than impairment recognised and the risks identified in the financial risk management note. All investments in joint ventures are non-current assets.
Notes to the Financial Statements (continued)for the year ended 31 March 2017
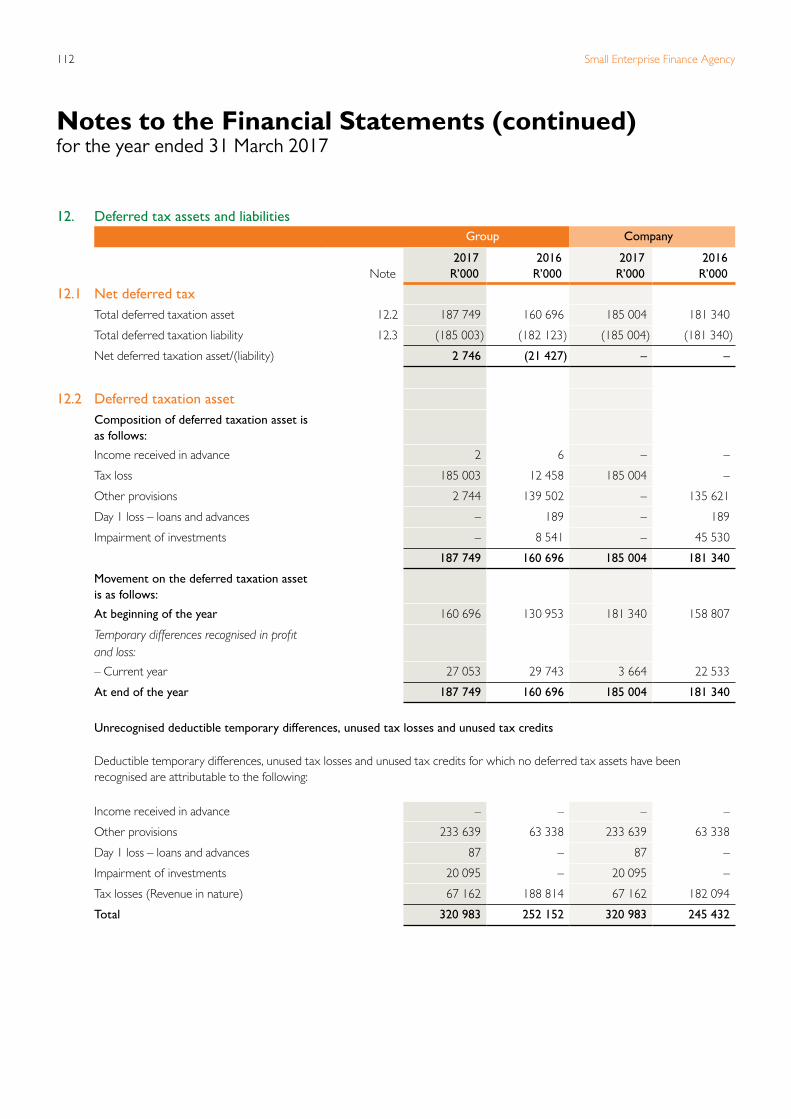
Small Enterprise Finance Agency112
12. Deferred tax assets and liabilitiesGroup Company
Note2017
R’0002016
R’0002017
R’0002016
R’000
12.1 Net deferred taxTotal deferred taxation asset 12.2 187 749 160 696 185 004 181 340
Total deferred taxation liability 12.3 (185 003) (182 123) (185 004) (181 340)
Net deferred taxation asset/(liability) 2 746 (21 427) – –
12.2 Deferred taxation asset Composition of deferred taxation asset is as follows:
Income received in advance 2 6 – –
Tax loss 185 003 12 458 185 004 –
Other provisions 2 744 139 502 – 135 621
Day 1 loss – loans and advances – 189 – 189
Impairment of investments – 8 541 – 45 530
187 749 160 696 185 004 181 340
Movement on the deferred taxation asset is as follows:
At beginning of the year 160 696 130 953 181 340 158 807
Temporary differences recognised in profit and loss: – Current year 27 053 29 743 3 664 22 533
At end of the year 187 749 160 696 185 004 181 340
Unrecognised deductible temporary differences, unused tax losses and unused tax credits
Deductible temporary differences, unused tax losses and unused tax credits for which no deferred tax assets have been recognised are attributable to the following:
Income received in advance – – – –
Other provisions 233 639 63 338 233 639 63 338
Day 1 loss – loans and advances 87 – 87 –
Impairment of investments 20 095 – 20 095 –
Tax losses (Revenue in nature) 67 162 188 814 67 162 182 094
Total 320 983 252 152 320 983 245 432
Notes to the Financial Statements (continued)for the year ended 31 March 2017
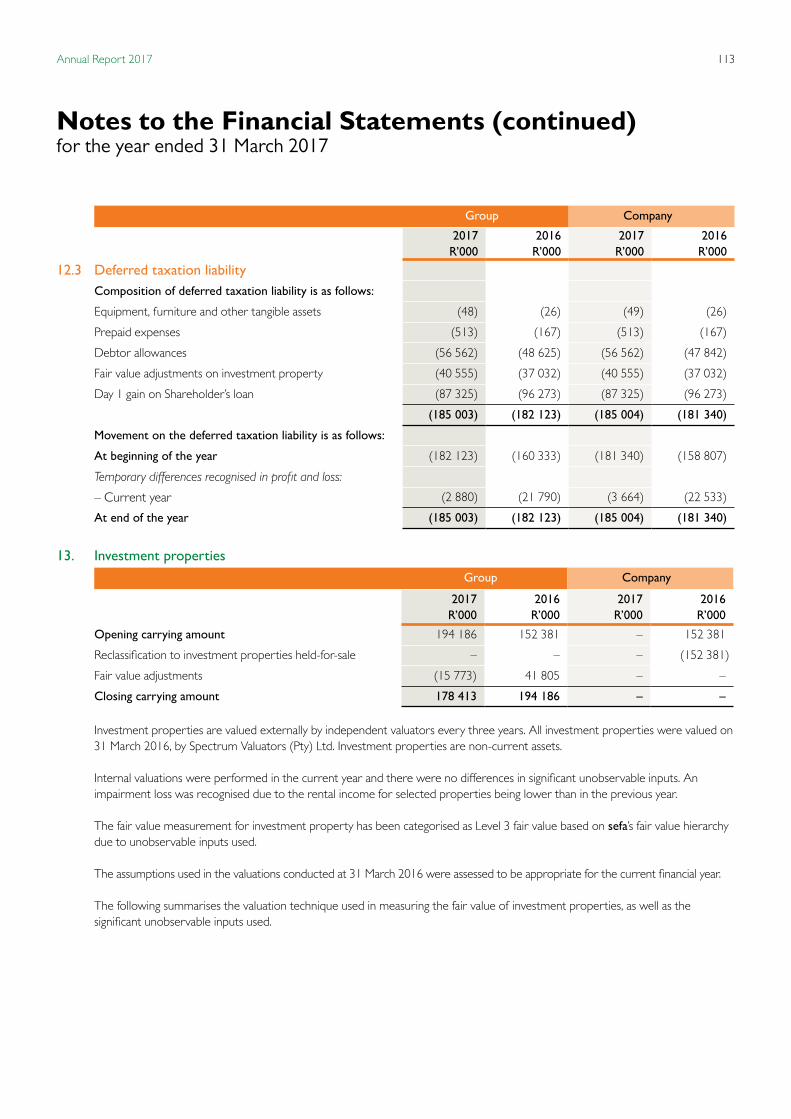
113Annual Report 2017
Group Company
2017R’000
2016R’000
2017R’000
2016R’000
12.3 Deferred taxation liabilityComposition of deferred taxation liability is as follows:
Equipment, furniture and other tangible assets (48) (26) (49) (26)
Prepaid expenses (513) (167) (513) (167)
Debtor allowances (56 562) (48 625) (56 562) (47 842)
Fair value adjustments on investment property (40 555) (37 032) (40 555) (37 032)
Day 1 gain on Shareholder’s loan (87 325) (96 273) (87 325) (96 273)
(185 003) (182 123) (185 004) (181 340)
Movement on the deferred taxation liability is as follows:
At beginning of the year (182 123) (160 333) (181 340) (158 807)
Temporary differences recognised in profit and loss:
– Current year (2 880) (21 790) (3 664) (22 533)
At end of the year (185 003) (182 123) (185 004) (181 340)
13. Investment propertiesGroup Company
2017R’000
2016R’000
2017R’000
2016R’000
Opening carrying amount 194 186 152 381 – 152 381
Reclassification to investment properties held-for-sale – – – (152 381)
Fair value adjustments (15 773) 41 805 – –
Closing carrying amount 178 413 194 186 – –
Investment properties are valued externally by independent valuators every three years. All investment properties were valued on 31 March 2016, by Spectrum Valuators (Pty) Ltd. Investment properties are non-current assets.
Internal valuations were performed in the current year and there were no differences in significant unobservable inputs. An
impairment loss was recognised due to the rental income for selected properties being lower than in the previous year. The fair value measurement for investment property has been categorised as Level 3 fair value based on sefa’s fair value hierarchy
due to unobservable inputs used.
The assumptions used in the valuations conducted at 31 March 2016 were assessed to be appropriate for the current financial year.
The following summarises the valuation technique used in measuring the fair value of investment properties, as well as the significant unobservable inputs used.
Notes to the Financial Statements (continued)for the year ended 31 March 2017

Small Enterprise Finance Agency114
Valuation technique Income capitalisation method and direct comparison basis: sefa’s property portfolio consists mainly of income producing
properties and this is the fundamental basis on which the valuation of investment properties is determined. Investment properties produce a perpetual income stream and the capitalisation of such net revenue flow is an accurate means of determining the value. Included in the portfolio, are two properties which are sectional title in nature and one comprises of vacant land. These properties have been valued on the direct comparison basis.
Significant unobservable inputs Highest Lowest Average
– Budgeted capital expenditure growth rate 33% 2% 11%
– Capitalisation percentage 16% 10% 13%
Inter-relationship between key unobservable inputs and fair value measurement The estimated fair value would increase/(decrease) if: – Budgeted capital expenditure growth were (lower)/higher – Capitalisation percentage were (decreased)/increased
14. Investment properties held-for-saleGroup Company
2017R’000
2016R’000
2017R’000
2016R’000
Opening carrying amount 13 621 17 420 207 806 17 420
Reclassification from investment properties – – – 152 381
Disposals at fair value – (2 000) – (2 000)
Fair value adjustment (1 590) (1 799) (17 362) 40 005
Closing carrying amount 12 031 13 621 190 444 207 806 Investment properties held-for-sale are valued on the same basis as the investment properties.
On 20 November 2013, the Board of Directors approved the sale of certain properties in the property portfolio, investment properties held-for-sale are current assets.
Additionally, in a Board Meeting held on 25 May 2015, it was resolved that all properties should be transferred to Khula Business Premises (Pty) Ltd, and thus all of the properties at a sefa Company level will need to be reclassified from investment properties to investment properties held for sale. The resolution has no impact on a sefa Group level due to Khula Business Premises (Pty) Ltd being a wholly-owned subsidiary.
Notes to the Financial Statements (continued)for the year ended 31 March 2017
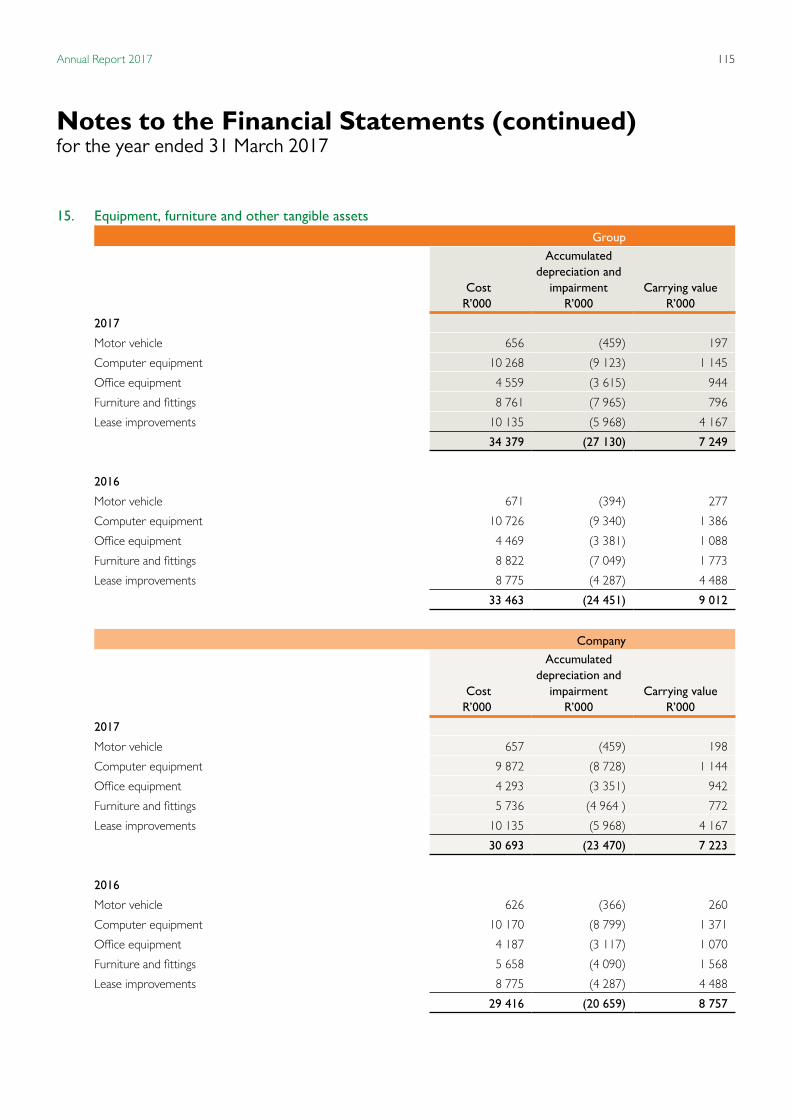
115Annual Report 2017
15. Equipment, furniture and other tangible assets Group
CostR’000
Accumulated depreciation and
impairmentR’000
Carrying valueR’000
2017
Motor vehicle 656 (459) 197
Computer equipment 10 268 (9 123) 1 145
Office equipment 4 559 (3 615) 944
Furniture and fittings 8 761 (7 965) 796
Lease improvements 10 135 (5 968) 4 167
34 379 (27 130) 7 249
2016
Motor vehicle 671 (394) 277
Computer equipment 10 726 (9 340) 1 386
Office equipment 4 469 (3 381) 1 088
Furniture and fittings 8 822 (7 049) 1 773
Lease improvements 8 775 (4 287) 4 488
33 463 (24 451) 9 012
Company
CostR’000
Accumulated depreciation and
impairmentR’000
Carrying valueR’000
2017
Motor vehicle 657 (459) 198
Computer equipment 9 872 (8 728) 1 144
Office equipment 4 293 (3 351) 942
Furniture and fittings 5 736 (4 964 ) 772
Lease improvements 10 135 (5 968) 4 167
30 693 (23 470) 7 223
2016
Motor vehicle 626 (366) 260
Computer equipment 10 170 (8 799) 1 371
Office equipment 4 187 (3 117) 1 070
Furniture and fittings 5 658 (4 090) 1 568
Lease improvements 8 775 (4 287) 4 488
29 416 (20 659) 8 757
Notes to the Financial Statements (continued)for the year ended 31 March 2017
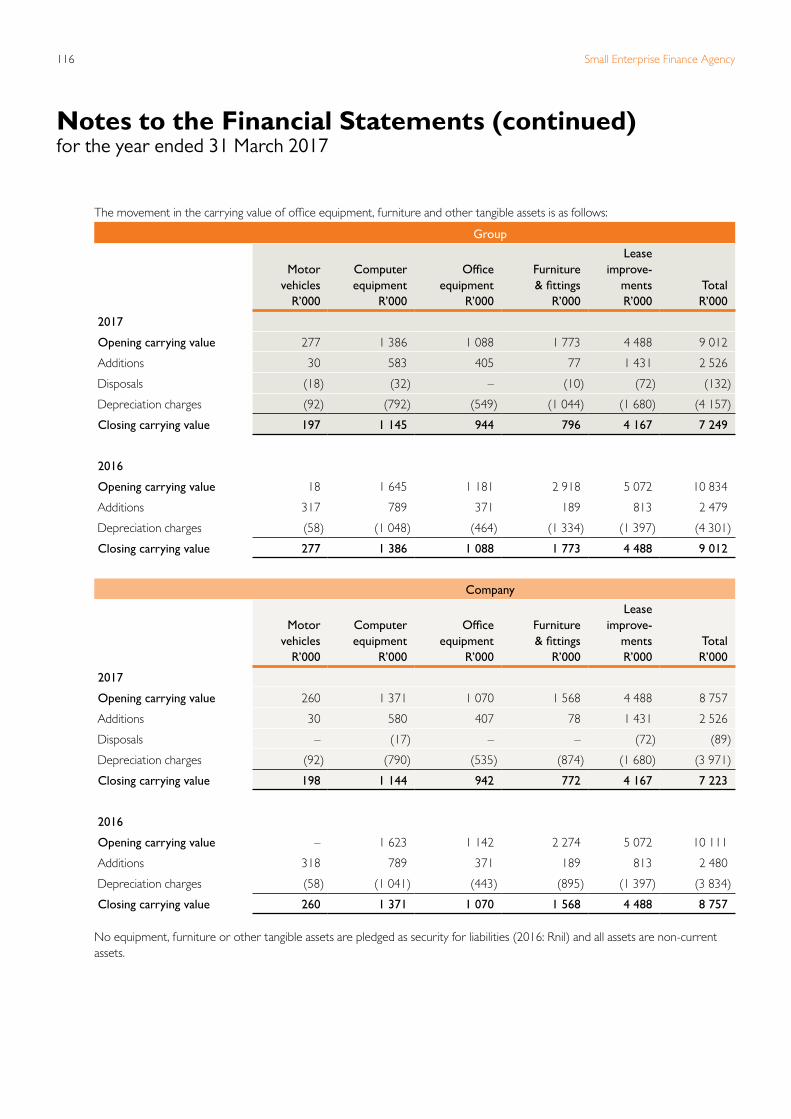
Small Enterprise Finance Agency116
The movement in the carrying value of office equipment, furniture and other tangible assets is as follows:
Group
Motor vehicles
R’000
Computer equipment
R’000
Office equipment
R’000
Furniture & fittings
R’000
Lease improve-
mentsR’000
TotalR’000
2017
Opening carrying value 277 1 386 1 088 1 773 4 488 9 012
Additions 30 583 405 77 1 431 2 526
Disposals (18) (32) – (10) (72) (132)
Depreciation charges (92) (792) (549) (1 044) (1 680) (4 157)
Closing carrying value 197 1 145 944 796 4 167 7 249
2016
Opening carrying value 18 1 645 1 181 2 918 5 072 10 834
Additions 317 789 371 189 813 2 479
Depreciation charges (58) (1 048) (464) (1 334) (1 397) (4 301)
Closing carrying value 277 1 386 1 088 1 773 4 488 9 012
Company
Motor vehicles
R’000
Computer equipment
R’000
Office equipment
R’000
Furniture & fittings
R’000
Lease improve-
mentsR’000
TotalR’000
2017
Opening carrying value 260 1 371 1 070 1 568 4 488 8 757
Additions 30 580 407 78 1 431 2 526
Disposals – (17) – – (72) (89)
Depreciation charges (92) (790) (535) (874) (1 680) (3 971)
Closing carrying value 198 1 144 942 772 4 167 7 223
2016
Opening carrying value – 1 623 1 142 2 274 5 072 10 111
Additions 318 789 371 189 813 2 480
Depreciation charges (58) (1 041) (443) (895) (1 397) (3 834)
Closing carrying value 260 1 371 1 070 1 568 4 488 8 757 No equipment, furniture or other tangible assets are pledged as security for liabilities (2016: Rnil) and all assets are non-current
assets.
Notes to the Financial Statements (continued)for the year ended 31 March 2017
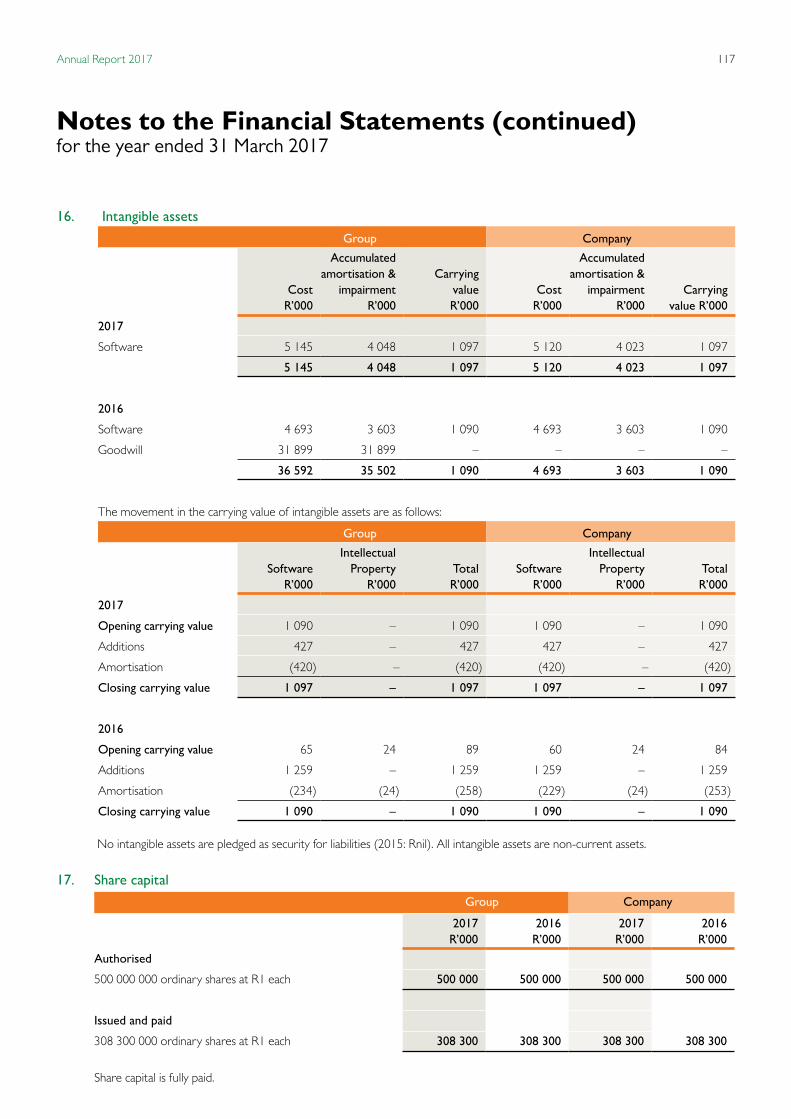
117Annual Report 2017
16. Intangible assets
Group Company
CostR’000
Accumulated amortisation &
impairmentR’000
Carrying valueR’000
CostR’000
Accumulated amortisation &
impairmentR’000
Carrying value R’000
2017
Software 5 145 4 048 1 097 5 120 4 023 1 097
5 145 4 048 1 097 5 120 4 023 1 097
2016
Software 4 693 3 603 1 090 4 693 3 603 1 090
Goodwill 31 899 31 899 – – – –
36 592 35 502 1 090 4 693 3 603 1 090
The movement in the carrying value of intangible assets are as follows:
Group Company
SoftwareR’000
IntellectualProperty
R’000Total R’000
SoftwareR’000
IntellectualProperty
R’000TotalR’000
2017
Opening carrying value 1 090 – 1 090 1 090 – 1 090
Additions 427 – 427 427 – 427
Amortisation (420) – (420) (420) – (420)
Closing carrying value 1 097 – 1 097 1 097 – 1 097
2016
Opening carrying value 65 24 89 60 24 84
Additions 1 259 – 1 259 1 259 – 1 259
Amortisation (234) (24) (258) (229) (24) (253)
Closing carrying value 1 090 – 1 090 1 090 – 1 090 No intangible assets are pledged as security for liabilities (2015: Rnil). All intangible assets are non-current assets.
17. Share capital Group Company
2017R’000
2016R’000
2017R’000
2016R’000
Authorised
500 000 000 ordinary shares at R1 each 500 000 500 000 500 000 500 000
Issued and paid
308 300 000 ordinary shares at R1 each 308 300 308 300 308 300 308 300
Share capital is fully paid.
Notes to the Financial Statements (continued)for the year ended 31 March 2017
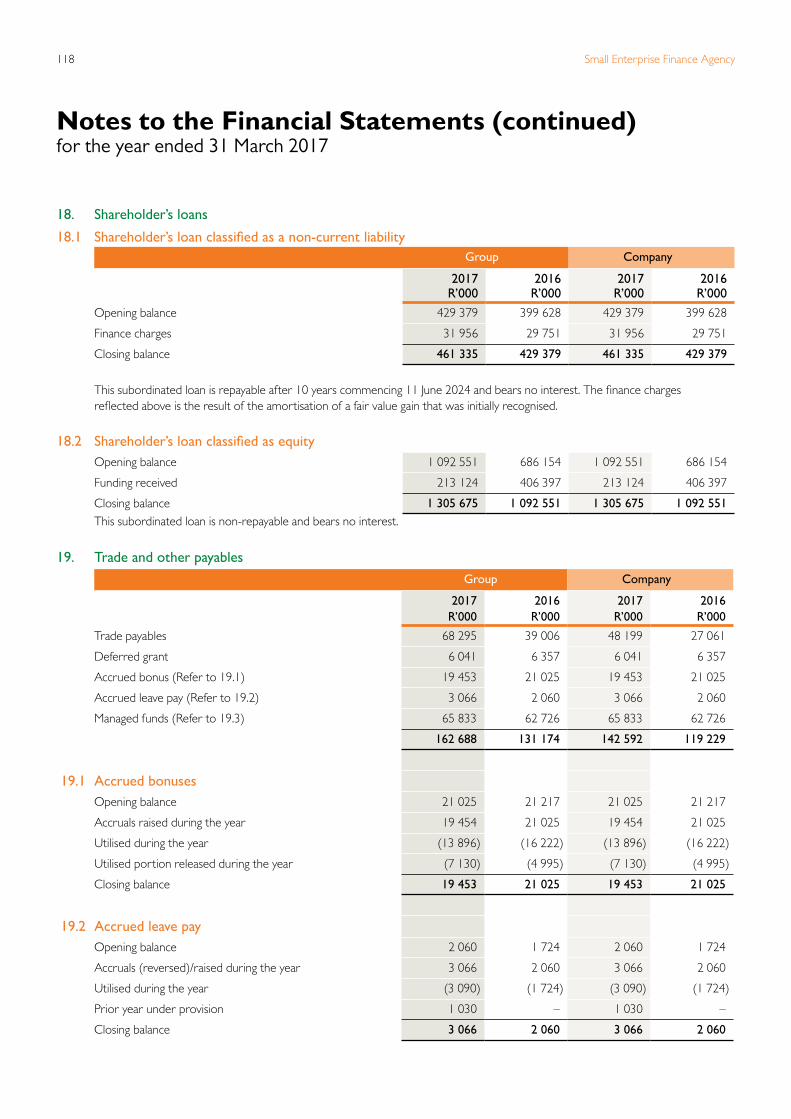
Small Enterprise Finance Agency118
18. Shareholder’s loans
18.1 Shareholder’s loan classified as a non-current liabilityGroup Company
2017R’000
2016R’000
2017R’000
2016R’000
Opening balance 429 379 399 628 429 379 399 628
Finance charges 31 956 29 751 31 956 29 751
Closing balance 461 335 429 379 461 335 429 379
This subordinated loan is repayable after 10 years commencing 11 June 2024 and bears no interest. The finance charges reflected above is the result of the amortisation of a fair value gain that was initially recognised.
18.2 Shareholder’s loan classified as equityOpening balance 1 092 551 686 154 1 092 551 686 154
Funding received 213 124 406 397 213 124 406 397
Closing balance 1 305 675 1 092 551 1 305 675 1 092 551 This subordinated loan is non-repayable and bears no interest.
19. Trade and other payables Group Company
2017R’000
2016R’000
2017R’000
2016R’000
Trade payables 68 295 39 006 48 199 27 061
Deferred grant 6 041 6 357 6 041 6 357
Accrued bonus (Refer to 19.1) 19 453 21 025 19 453 21 025
Accrued leave pay (Refer to 19.2) 3 066 2 060 3 066 2 060
Managed funds (Refer to 19.3) 65 833 62 726 65 833 62 726
162 688 131 174 142 592 119 229
19.1 Accrued bonuses
Opening balance 21 025 21 217 21 025 21 217
Accruals raised during the year 19 454 21 025 19 454 21 025
Utilised during the year (13 896) (16 222) (13 896) (16 222)
Utilised portion released during the year (7 130) (4 995) (7 130) (4 995)
Closing balance 19 453 21 025 19 453 21 025
19.2 Accrued leave pay
Opening balance 2 060 1 724 2 060 1 724
Accruals (reversed)/raised during the year 3 066 2 060 3 066 2 060
Utilised during the year (3 090) (1 724) (3 090) (1 724)
Prior year under provision 1 030 – 1 030 –
Closing balance 3 066 2 060 3 066 2 060
Notes to the Financial Statements (continued)for the year ended 31 March 2017
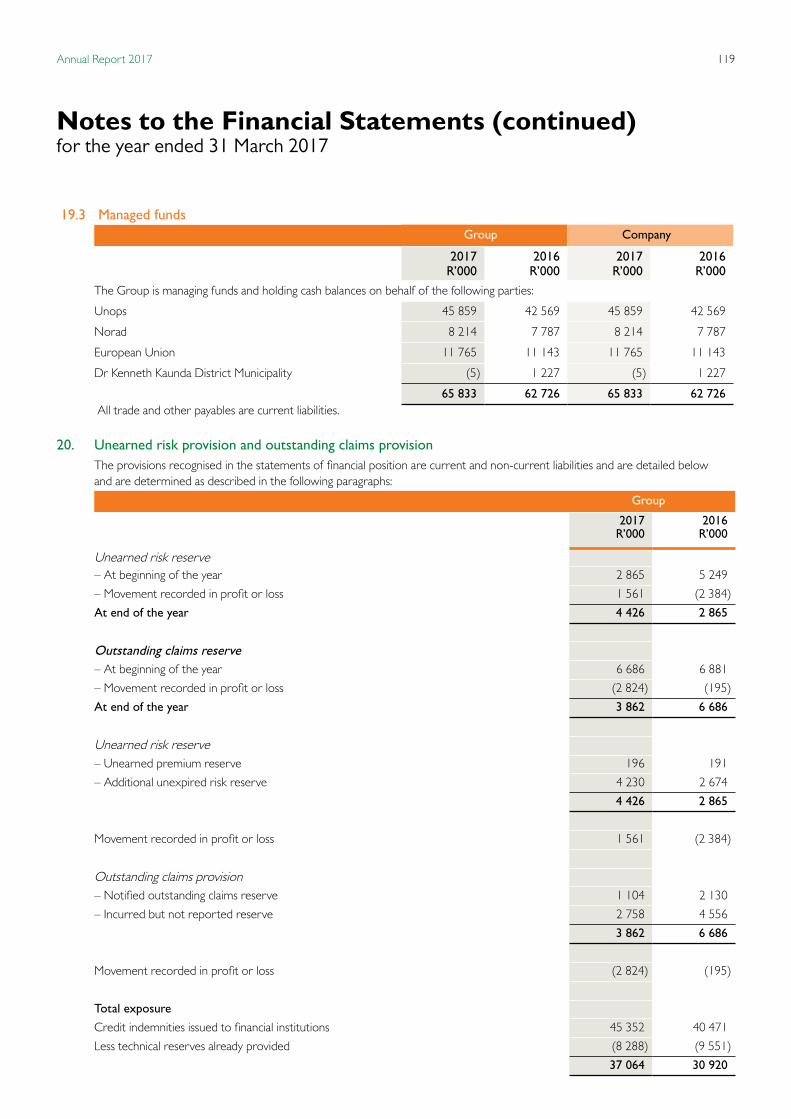
119Annual Report 2017
19.3 Managed funds Group Company
2017R’000
2016R’000
2017R’000
2016R’000
The Group is managing funds and holding cash balances on behalf of the following parties:
Unops 45 859 42 569 45 859 42 569
Norad 8 214 7 787 8 214 7 787
European Union 11 765 11 143 11 765 11 143
Dr Kenneth Kaunda District Municipality (5) 1 227 (5) 1 227
65 833 62 726 65 833 62 726 All trade and other payables are current liabilities.
20. Unearned risk provision and outstanding claims provision The provisions recognised in the statements of financial position are current and non-current liabilities and are detailed below and are determined as described in the following paragraphs:
Group
2017R’000
2016R’000
Unearned risk reserve – At beginning of the year 2 865 5 249
– Movement recorded in profit or loss 1 561 (2 384)
At end of the year 4 426 2 865
Outstanding claims reserve – At beginning of the year 6 686 6 881
– Movement recorded in profit or loss (2 824) (195)
At end of the year 3 862 6 686
Unearned risk reserve – Unearned premium reserve 196 191
– Additional unexpired risk reserve 4 230 2 674
4 426 2 865
Movement recorded in profit or loss 1 561 (2 384)
Outstanding claims provision – Notified outstanding claims reserve 1 104 2 130
– Incurred but not reported reserve 2 758 4 556
3 862 6 686
Movement recorded in profit or loss (2 824) (195)
Total exposure
Credit indemnities issued to financial institutions 45 352 40 471
Less technical reserves already provided (8 288) (9 551)
37 064 30 920
Notes to the Financial Statements (continued)for the year ended 31 March 2017

Small Enterprise Finance Agency120
The calculation of the reserves was performed by an independent actuarial consulting firm, Matlotlo Group Proprietary Limited.
The summary of the valuation method is as follows: The unearned premium reserve is calculated on a straight line basis, assuming indemnity premiums received are earned uniformly
over the 12 months for which they have been paid for. The Additional Unexpired Risk Reserve (“AURR”) is the additional reserve required should the net discounted value of the expected claims from active policies not be covered by the unearned premium reserve and the net present value of expected future indemnity fees. The AURR is held at a 75% sufficiency level as a result of simulating claims severity and frequency.
The Outstanding Claims Reserve (“OCR”) is in respect of those policies of KCG that may result in claims due to a claim event that has happened prior to the financial year end. For each policy, the OCR is determined as (probability of claiming) x (current indemnity) x (claim severity). The total OCR is raised at a 75% sufficiency level by simulating the claim severity.
All reserves have been calculated on a run-off basis (i.e. assuming KCG does not write new business) and allowance for claim handling expenses have been made.
The principal valuation assumptions are as follows:2017 2016
Average ultimate probability of claim 19% 27%Claim severity 81% 81%Claim expense rate 5% 5%Recovery rate 8% 8%Discount rates (per government bond yield curve) 7.08-10.02% 7.81 – 10.16%
The sensitivity of the total provisions to the key assumptions is as follows:
2017R’000
2016R’000
2017 %
2016 %
Probability of claim (+10%) 209 322 19% 27%Claim severity (+10%) 601 381 81% 81%Claim expense rate (+1%) 47 79 5% 5%Discount rates (+1%) (31) (23) 8% 8%
21. Post-retirement medical liability Group Company
2017R’000
2016R’000
2017R’000
2016R’000
Post-retirement medical liability 489 415 489 415 sefa provides a subsidy towards medical aid contributions payable to selected employees who retire in the employment of sefa.
Approximately 24 employees are eligible for the benefit. This subsidy is unfunded and is provided for based on actuarial valuations performed annually.
The value of this liability was determined by Matlotlo Group Proprietary Limited an independent actuarial consulting firm and is dependent, on amongst others, the demographic profile of employees, mortality, consumer price inflation and bond yields.
2017R’000
2016R’000
2017R’000
2016R’000
Analysis of the defined post retirement medical liability:Present value of unfunded obligations 489 415 489 415 Present value of obligations in excess of plan assets 489 415 489 415
Notes to the Financial Statements (continued)for the year ended 31 March 2017
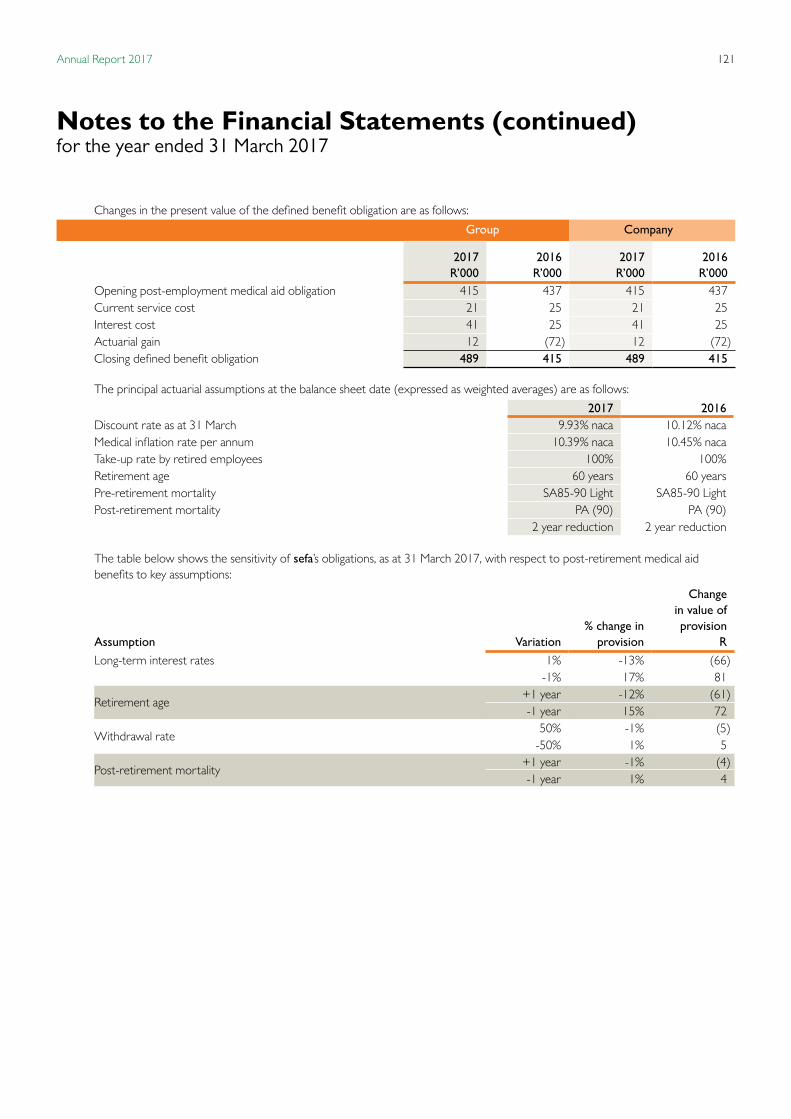
121Annual Report 2017
Changes in the present value of the defined benefit obligation are as follows:
Group Company
2017R’000
2016R’000
2017R’000
2016R’000
Opening post-employment medical aid obligation 415 437 415 437 Current service cost 21 25 21 25 Interest cost 41 25 41 25 Actuarial gain 12 (72) 12 (72)Closing defined benefit obligation 489 415 489 415
The principal actuarial assumptions at the balance sheet date (expressed as weighted averages) are as follows:
2017 2016Discount rate as at 31 March 9.93% naca 10.12% naca Medical inflation rate per annum 10.39% naca 10.45% naca Take-up rate by retired employees 100% 100%Retirement age 60 years 60 years Pre-retirement mortality SA85-90 Light SA85-90 Light Post-retirement mortality PA (90) PA (90)
2 year reduction 2 year reduction
The table below shows the sensitivity of sefa’s obligations, as at 31 March 2017, with respect to post-retirement medical aid benefits to key assumptions:
Assumption Variation % change in
provision
Change in value of provision
R
Long-term interest rates 1% -13% (66)-1% 17% 81
Retirement age+1 year -12% (61)-1 year 15% 72
Withdrawal rate50% -1% (5)
-50% 1% 5
Post-retirement mortality+1 year -1% (4)-1 year 1% 4
Notes to the Financial Statements (continued)for the year ended 31 March 2017
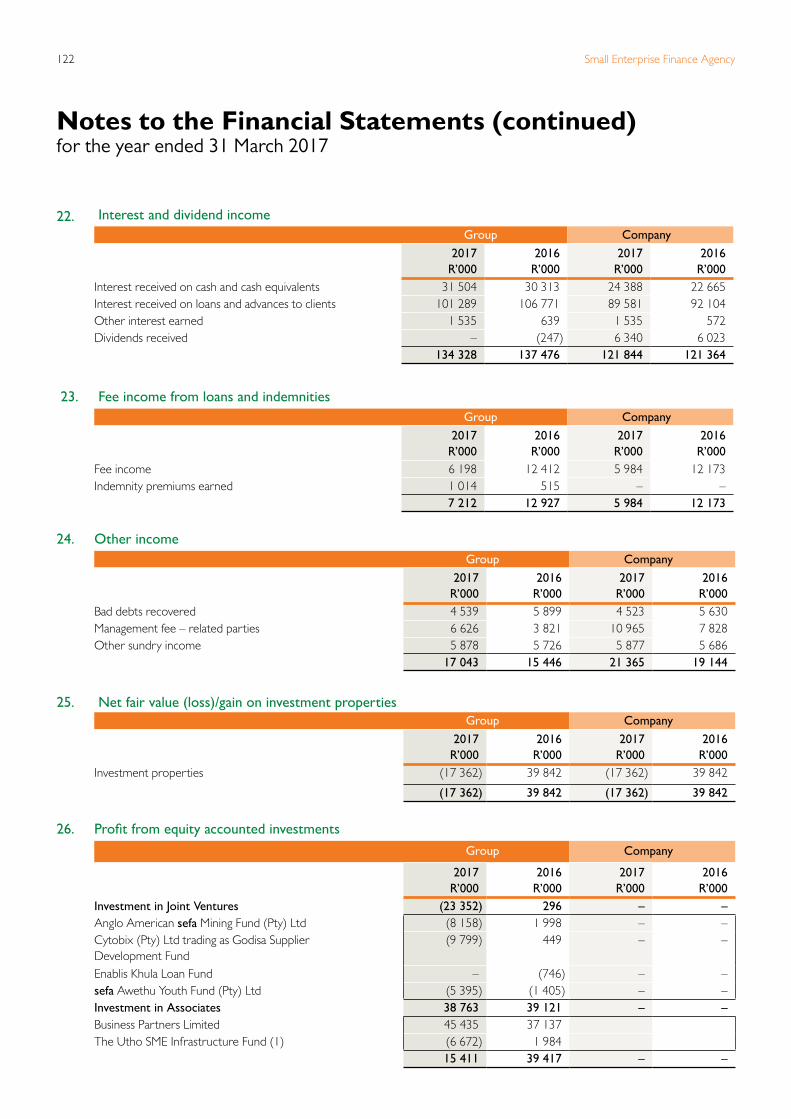
Small Enterprise Finance Agency122
22. Interest and dividend income Group Company
2017R’000
2016R’000
2017R’000
2016R’000
Interest received on cash and cash equivalents 31 504 30 313 24 388 22 665 Interest received on loans and advances to clients 101 289 106 771 89 581 92 104 Other interest earned 1 535 639 1 535 572 Dividends received – (247) 6 340 6 023
134 328 137 476 121 844 121 364
23. Fee income from loans and indemnities Group Company
2017R’000
2016R’000
2017R’000
2016R’000
Fee income 6 198 12 412 5 984 12 173 Indemnity premiums earned 1 014 515 – –
7 212 12 927 5 984 12 173
24. Other income Group Company
2017R’000
2016R’000
2017R’000
2016R’000
Bad debts recovered 4 539 5 899 4 523 5 630 Management fee – related parties 6 626 3 821 10 965 7 828 Other sundry income 5 878 5 726 5 877 5 686
17 043 15 446 21 365 19 144
25. Net fair value (loss)/gain on investment properties Group Company
2017R’000
2016R’000
2017R’000
2016R’000
Investment properties (17 362) 39 842 (17 362) 39 842
(17 362) 39 842 (17 362) 39 842
26. Profit from equity accounted investments Group Company
2017R’000
2016R’000
2017R’000
2016R’000
Investment in Joint Ventures (23 352) 296 – – Anglo American sefa Mining Fund (Pty) Ltd (8 158) 1 998 – – Cytobix (Pty) Ltd trading as Godisa Supplier Development Fund
(9 799) 449 – –
Enablis Khula Loan Fund – (746) – – sefa Awethu Youth Fund (Pty) Ltd (5 395) (1 405) – – Investment in Associates 38 763 39 121 – – Business Partners Limited 45 435 37 137 The Utho SME Infrastructure Fund (1) (6 672) 1 984
15 411 39 417 – –
Notes to the Financial Statements (continued)for the year ended 31 March 2017
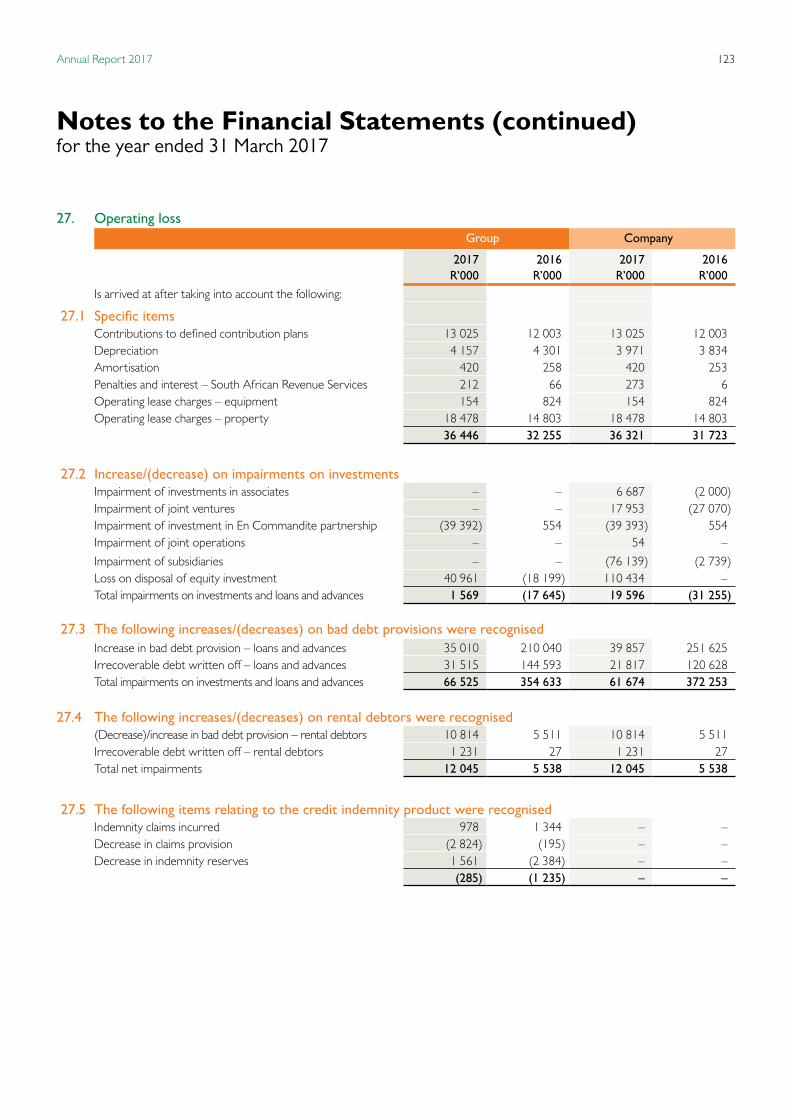
123Annual Report 2017
27. Operating loss Group Company
2017R’000
2016R’000
2017R’000
2016R’000
Is arrived at after taking into account the following:
27.1 Specific itemsContributions to defined contribution plans 13 025 12 003 13 025 12 003 Depreciation 4 157 4 301 3 971 3 834 Amortisation 420 258 420 253 Penalties and interest – South African Revenue Services 212 66 273 6 Operating lease charges – equipment 154 824 154 824 Operating lease charges – property 18 478 14 803 18 478 14 803
36 446 32 255 36 321 31 723
27.2 Increase/(decrease) on impairments on investmentsImpairment of investments in associates – – 6 687 (2 000)Impairment of joint ventures – – 17 953 (27 070)Impairment of investment in En Commandite partnership (39 392) 554 (39 393) 554 Impairment of joint operations – – 54 –
Impairment of subsidiaries – – (76 139) (2 739)Loss on disposal of equity investment 40 961 (18 199) 110 434 – Total impairments on investments and loans and advances 1 569 (17 645) 19 596 (31 255)
27.3 The following increases/(decreases) on bad debt provisions were recognisedIncrease in bad debt provision – loans and advances 35 010 210 040 39 857 251 625 Irrecoverable debt written off – loans and advances 31 515 144 593 21 817 120 628 Total impairments on investments and loans and advances 66 525 354 633 61 674 372 253
27.4 The following increases/(decreases) on rental debtors were recognised(Decrease)/increase in bad debt provision – rental debtors 10 814 5 511 10 814 5 511 Irrecoverable debt written off – rental debtors 1 231 27 1 231 27 Total net impairments 12 045 5 538 12 045 5 538
27.5 The following items relating to the credit indemnity product were recognisedIndemnity claims incurred 978 1 344 – – Decrease in claims provision (2 824) (195) – – Decrease in indemnity reserves 1 561 (2 384) – –
(285) (1 235) – –
Notes to the Financial Statements (continued)for the year ended 31 March 2017
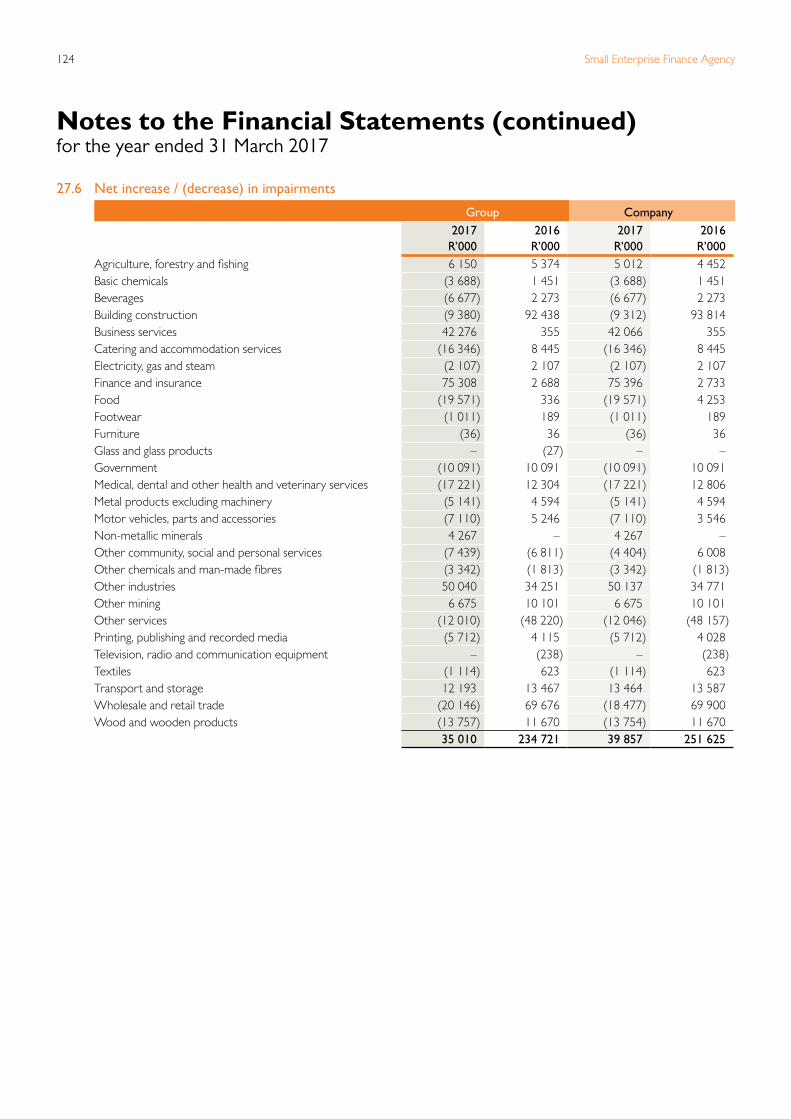
Small Enterprise Finance Agency124
2017R’000
2016R’000
2017R’000
2016R’000
Agriculture, forestry and fishing 6 150 5 374 5 012 4 452 Basic chemicals (3 688) 1 451 (3 688) 1 451 Beverages (6 677) 2 273 (6 677) 2 273 Building construction (9 380) 92 438 (9 312) 93 814 Business services 42 276 355 42 066 355 Catering and accommodation services (16 346) 8 445 (16 346) 8 445 Electricity, gas and steam (2 107) 2 107 (2 107) 2 107 Finance and insurance 75 308 2 688 75 396 2 733 Food (19 571) 336 (19 571) 4 253 Footwear (1 011) 189 (1 011) 189 Furniture (36) 36 (36) 36 Glass and glass products – (27) – – Government (10 091) 10 091 (10 091) 10 091 Medical, dental and other health and veterinary services (17 221) 12 304 (17 221) 12 806 Metal products excluding machinery (5 141) 4 594 (5 141) 4 594 Motor vehicles, parts and accessories (7 110) 5 246 (7 110) 3 546 Non-metallic minerals 4 267 – 4 267 – Other community, social and personal services (7 439) (6 811) (4 404) 6 008 Other chemicals and man-made fibres (3 342) (1 813) (3 342) (1 813)Other industries 50 040 34 251 50 137 34 771 Other mining 6 675 10 101 6 675 10 101 Other services (12 010) (48 220) (12 046) (48 157)Printing, publishing and recorded media (5 712) 4 115 (5 712) 4 028 Television, radio and communication equipment – (238) – (238)Textiles (1 114) 623 (1 114) 623 Transport and storage 12 193 13 467 13 464 13 587 Wholesale and retail trade (20 146) 69 676 (18 477) 69 900 Wood and wooden products (13 757) 11 670 (13 754) 11 670
35 010 234 721 39 857 251 625
Group Company
27.6 Net increase / (decrease) in impairments
Notes to the Financial Statements (continued)for the year ended 31 March 2017

125Annual Report 2017
27.7 Bad debts written off/(recovered) – Loans and advances
Group Company
2017R’000
2016R’000
2017R’000
2016R’000
Bad debts written off 31 515 144 593 21 816 120 627 Bad debts recovered (4 539) (5 899) (4 523) (5 630)
26 976 138 694 17 293 114 997 Per sector: Agriculture, forestry and fishing – 16 – – Building construction 3 945 22 990 4 014 22 990 Business services 7 340 – 7 340 – Catering and accommodation services 230 – 230 – Finance and insurance 15 302 53 952 – 35 243 Food (603) 9 192 (603) 7 645 Furniture 2 – 2 – Government – 470 – 470 Medical, dental and other health and veterinary services 643 1 227 643 1 227 Motor vehicles, parts and accessories (43) 979 (43) 979 Other community, social and personal services (4 264) 166 (271) 166 Other chemicals and man-made fibres 4 513 5 973 4 513 5 973 Other industries 1 370 8 760 1 370 6 404 Other services – 14 011 – 13 924 Plastic products – 32 – – Printing, publishing and recorded media – 1 316 – 366 Television, radio and communication equipment – 2 142 – 2 142 Textiles (2) 551 (2) 551 Transport and storage (27) 2 292 (3) 2 292 Wholesale and retail trade (1 430) 14 625 103 14 625
26 976 138 694 17 293 114 997 28. Income tax expense
Group Company
2017R’000
2016R’000
2017R’000
2016R’000
Current tax expense 242 196 – –
– Current year 242 196 – –
Deferred taxation (24 174) (7 952) – –
– Current year (24 174) (7 952) – –
Income tax expense (23 932) (7 756) – –
Reconciliation of taxation amount
Loss before taxation (246 708) (386 190) (270 870) (425 425)
Taxation at standard rate of 28% (2016: 28%) (69 078) (108 133) (75 844) (119 119)
Tax effect of permanent differences (1 233) (20 836) (1 025) (3 678)
Tax effect of deferred tax asset not recognised 47 974 122 438 76 869 122 797
Tax loss recognised (1 595) (1 225) – –
Taxation charged to statement of comprehensive income (23 932) (7 756) – –
Taxation expense relating to current year (23 932) (7 756) – –
Effective tax rate – based on current year taxation expense 9.70% 2.01% 0.00% 0.00%
Notes to the Financial Statements (continued)for the year ended 31 March 2017
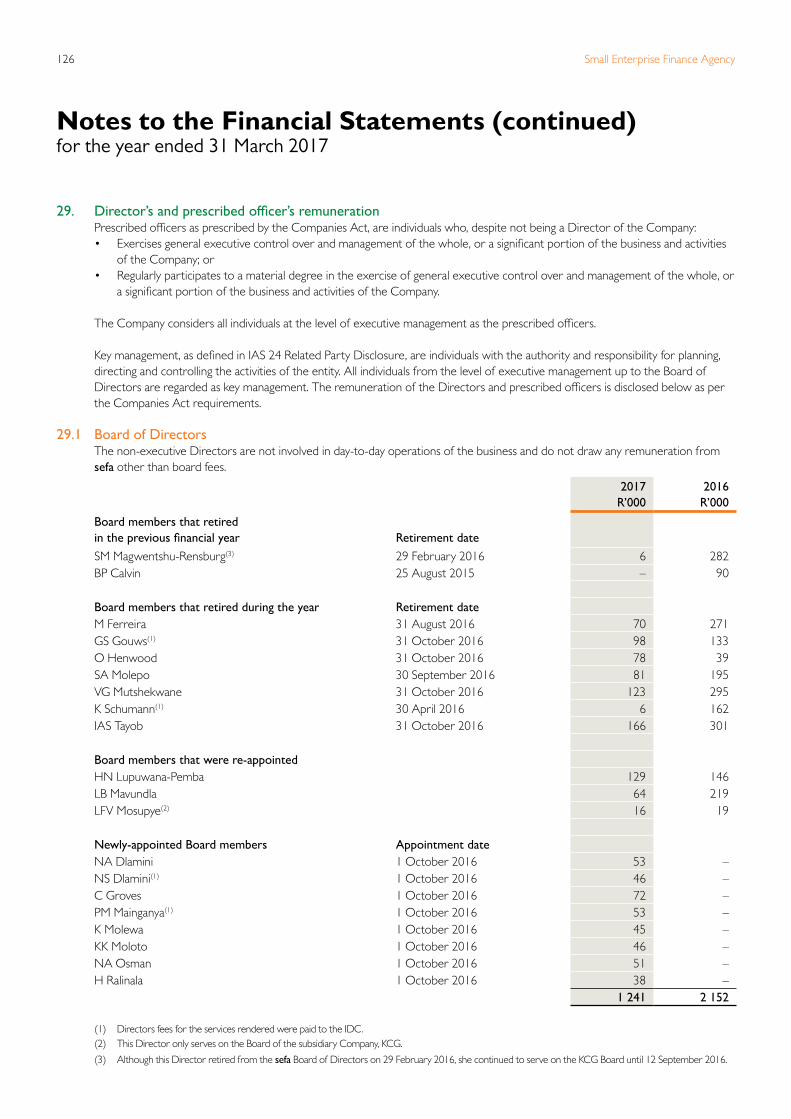
Small Enterprise Finance Agency126
29. Director’s and prescribed officer’s remuneration Prescribed officers as prescribed by the Companies Act, are individuals who, despite not being a Director of the Company: • Exercises general executive control over and management of the whole, or a significant portion of the business and activities
of the Company; or • Regularly participates to a material degree in the exercise of general executive control over and management of the whole, or
a significant portion of the business and activities of the Company.
The Company considers all individuals at the level of executive management as the prescribed officers.
Key management, as defined in IAS 24 Related Party Disclosure, are individuals with the authority and responsibility for planning, directing and controlling the activities of the entity. All individuals from the level of executive management up to the Board of Directors are regarded as key management. The remuneration of the Directors and prescribed officers is disclosed below as per the Companies Act requirements.
29.1 Board of Directors The non-executive Directors are not involved in day-to-day operations of the business and do not draw any remuneration from
sefa other than board fees.
2017R’000
2016R’000
Board members that retired in the previous financial year Retirement date
SM Magwentshu-Rensburg(3) 29 February 2016 6 282 BP Calvin 25 August 2015 – 90
Board members that retired during the year Retirement dateM Ferreira 31 August 2016 70 271 GS Gouws(1) 31 October 2016 98 133 O Henwood 31 October 2016 78 39 SA Molepo 30 September 2016 81 195 VG Mutshekwane 31 October 2016 123 295 K Schumann(1) 30 April 2016 6 162 IAS Tayob 31 October 2016 166 301
Board members that were re-appointedHN Lupuwana-Pemba 129 146 LB Mavundla 64 219 LFV Mosupye(2) 16 19
Newly-appointed Board members Appointment dateNA Dlamini 1 October 2016 53 – NS Dlamini(1) 1 October 2016 46 – C Groves 1 October 2016 72 – PM Mainganya(1) 1 October 2016 53 – K Molewa 1 October 2016 45 – KK Moloto 1 October 2016 46 – NA Osman 1 October 2016 51 – H Ralinala 1 October 2016 38 –
1 241 2 152
(1) Directors fees for the services rendered were paid to the IDC. (2) This Director only serves on the Board of the subsidiary Company, KCG.
(3) Although this Director retired from the sefa Board of Directors on 29 February 2016, she continued to serve on the KCG Board until 12 September 2016.
Notes to the Financial Statements (continued)for the year ended 31 March 2017
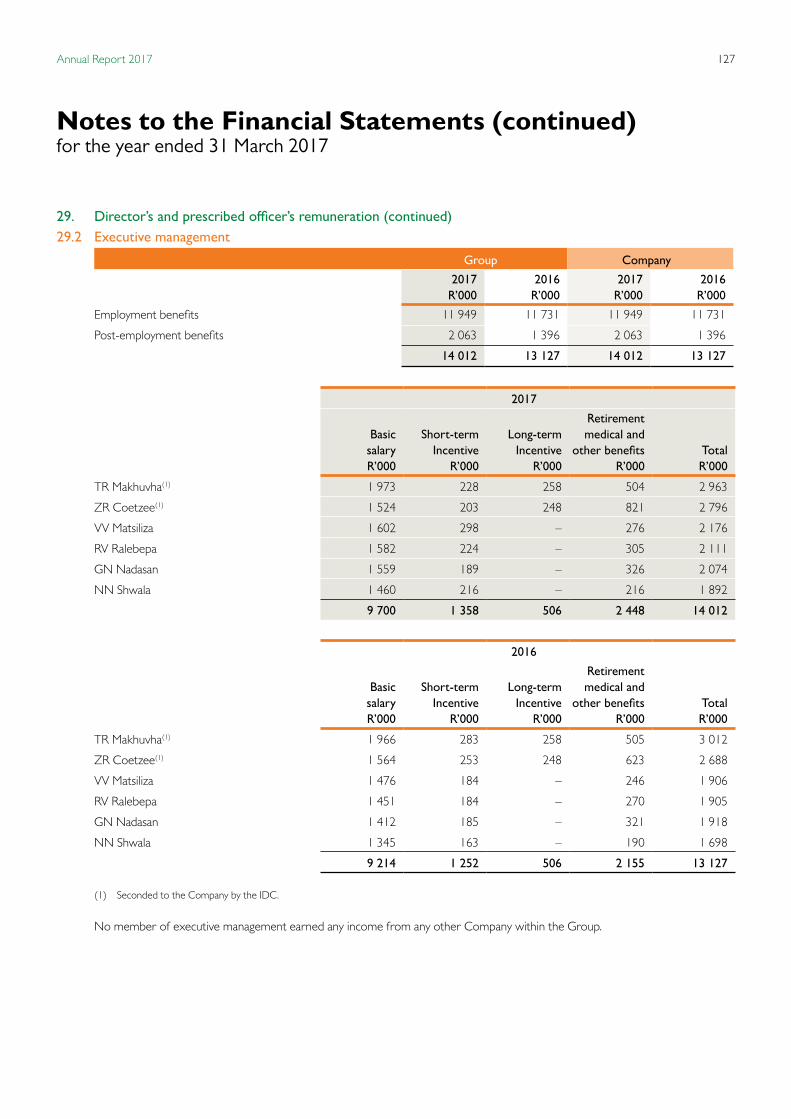
127Annual Report 2017
29. Director’s and prescribed officer’s remuneration (continued)29.2 Executive management
Group Company
2017R’000
2016R’000
2017R’000
2016R’000
Employment benefits 11 949 11 731 11 949 11 731
Post-employment benefits 2 063 1 396 2 063 1 396
14 012 13 127 14 012 13 127
2017
Basic salaryR’000
Short-term Incentive
R’000
Long-term Incentive
R’000
Retirement medical and
other benefitsR’000
TotalR’000
TR Makhuvha(1) 1 973 228 258 504 2 963
ZR Coetzee(1) 1 524 203 248 821 2 796
VV Matsiliza 1 602 298 – 276 2 176
RV Ralebepa 1 582 224 – 305 2 111
GN Nadasan 1 559 189 – 326 2 074
NN Shwala 1 460 216 – 216 1 892
9 700 1 358 506 2 448 14 012
2016
Basic salaryR’000
Short-term Incentive
R’000
Long-term Incentive
R’000
Retirement medical and
other benefitsR’000
TotalR’000
TR Makhuvha(1) 1 966 283 258 505 3 012
ZR Coetzee(1) 1 564 253 248 623 2 688
VV Matsiliza 1 476 184 – 246 1 906
RV Ralebepa 1 451 184 – 270 1 905
GN Nadasan 1 412 185 – 321 1 918
NN Shwala 1 345 163 – 190 1 698
9 214 1 252 506 2 155 13 127
(1) Seconded to the Company by the IDC.
No member of executive management earned any income from any other Company within the Group.
Notes to the Financial Statements (continued)for the year ended 31 March 2017
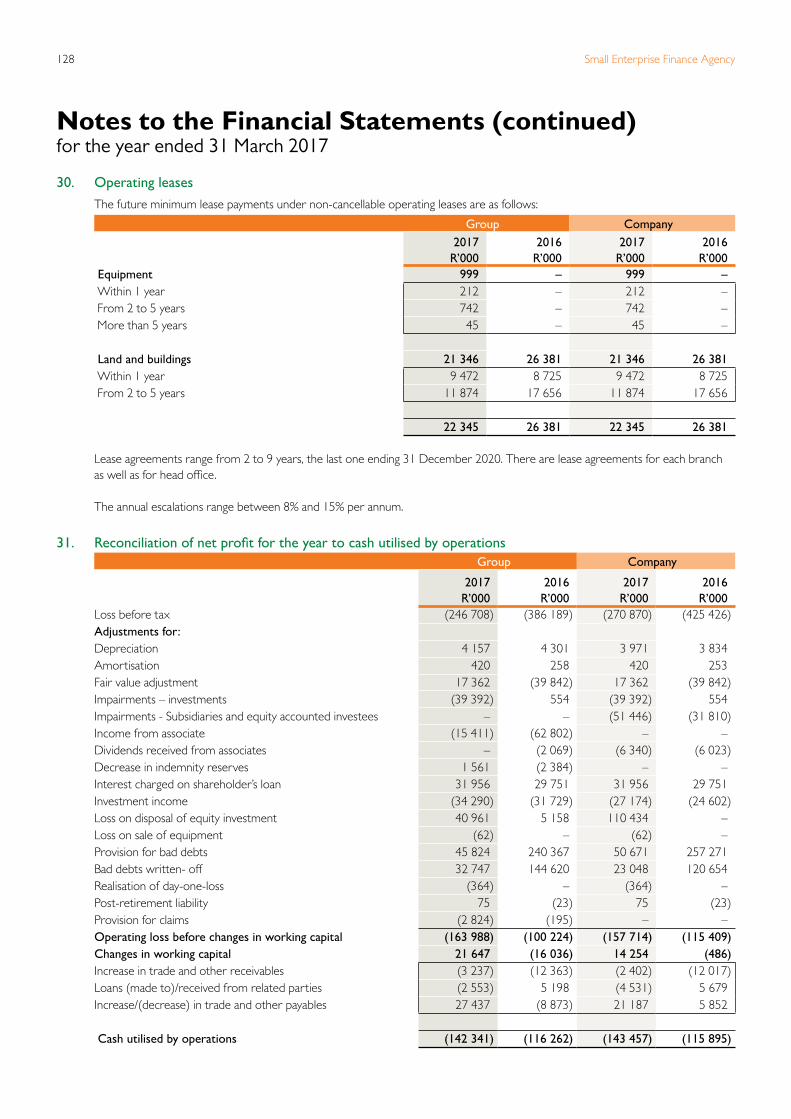
Small Enterprise Finance Agency128
30. Operating leasesThe future minimum lease payments under non-cancellable operating leases are as follows:
Group Company2017
R’0002016
R’0002017
R’0002016
R’000 Equipment 999 – 999 – Within 1 year 212 – 212 – From 2 to 5 years 742 – 742 – More than 5 years 45 – 45 –
Land and buildings 21 346 26 381 21 346 26 381 Within 1 year 9 472 8 725 9 472 8 725 From 2 to 5 years 11 874 17 656 11 874 17 656
22 345 26 381 22 345 26 381 Lease agreements range from 2 to 9 years, the last one ending 31 December 2020. There are lease agreements for each branch as well as for head office. The annual escalations range between 8% and 15% per annum.
31. Reconciliation of net profit for the year to cash utilised by operations Group Company
2017R’000
2016R’000
2017R’000
2016R’000
Loss before tax (246 708) (386 189) (270 870) (425 426)Adjustments for: Depreciation 4 157 4 301 3 971 3 834 Amortisation 420 258 420 253 Fair value adjustment 17 362 (39 842) 17 362 (39 842)Impairments – investments (39 392) 554 (39 392) 554 Impairments - Subsidiaries and equity accounted investees – – (51 446) (31 810)Income from associate (15 411) (62 802) – – Dividends received from associates – (2 069) (6 340) (6 023)Decrease in indemnity reserves 1 561 (2 384) – – Interest charged on shareholder’s loan 31 956 29 751 31 956 29 751 Investment income (34 290) (31 729) (27 174) (24 602)Loss on disposal of equity investment 40 961 5 158 110 434 – Loss on sale of equipment (62) – (62) – Provision for bad debts 45 824 240 367 50 671 257 271 Bad debts written- off 32 747 144 620 23 048 120 654 Realisation of day-one-loss (364) – (364) – Post-retirement liability 75 (23) 75 (23)Provision for claims (2 824) (195) – – Operating loss before changes in working capital (163 988) (100 224) (157 714) (115 409)Changes in working capital 21 647 (16 036) 14 254 (486)Increase in trade and other receivables (3 237) (12 363) (2 402) (12 017)Loans (made to)/received from related parties (2 553) 5 198 (4 531) 5 679 Increase/(decrease) in trade and other payables 27 437 (8 873) 21 187 5 852
Cash utilised by operations (142 341) (116 262) (143 457) (115 895)
Notes to the Financial Statements (continued)for the year ended 31 March 2017
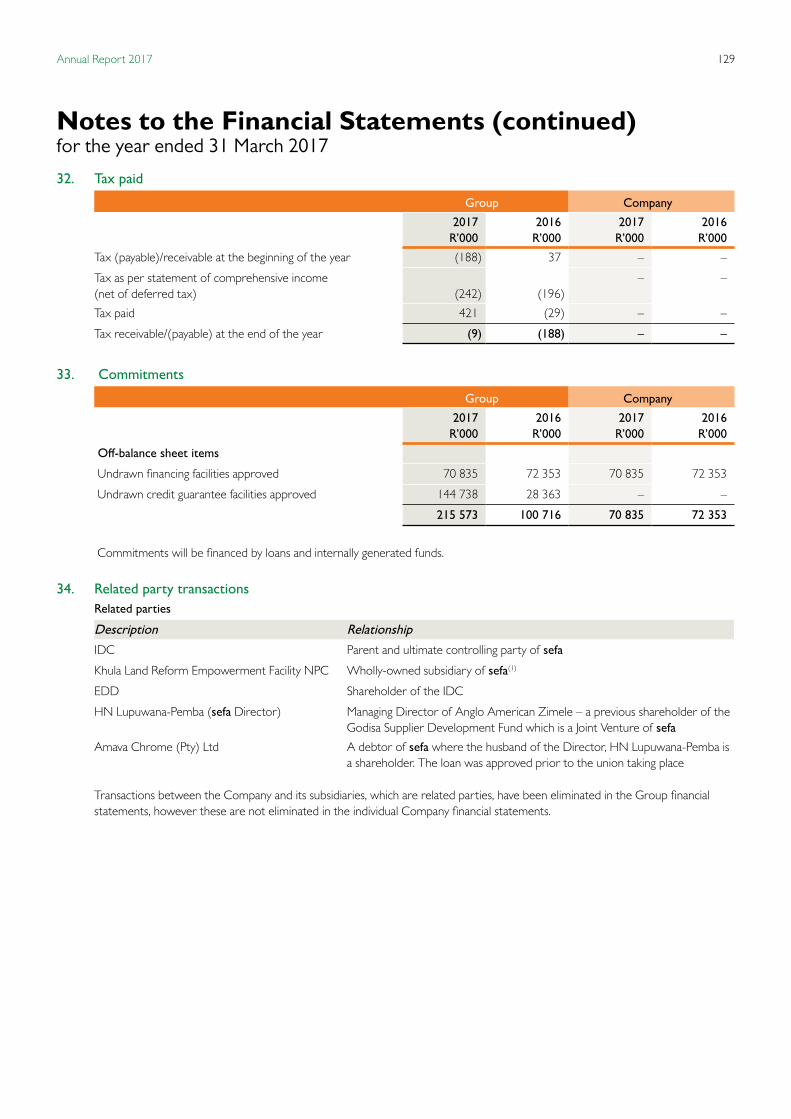
129Annual Report 2017
32. Tax paid
Group Company
2017R’000
2016R’000
2017R’000
2016R’000
Tax (payable)/receivable at the beginning of the year (188) 37 – –
Tax as per statement of comprehensive income (net of deferred tax) (242) (196)
– –
Tax paid 421 (29) – –
Tax receivable/(payable) at the end of the year (9) (188) – –
33. Commitments
Group Company
2017R’000
2016R’000
2017R’000
2016R’000
Off-balance sheet items Undrawn financing facilities approved 70 835 72 353 70 835 72 353
Undrawn credit guarantee facilities approved 144 738 28 363 – –
215 573 100 716 70 835 72 353
Commitments will be financed by loans and internally generated funds.
34. Related party transactions Related parties
Description Relationship
IDC Parent and ultimate controlling party of sefa
Khula Land Reform Empowerment Facility NPC Wholly-owned subsidiary of sefa(1)
EDD Shareholder of the IDC
HN Lupuwana-Pemba (sefa Director) Managing Director of Anglo American Zimele – a previous shareholder of the Godisa Supplier Development Fund which is a Joint Venture of sefa
Amava Chrome (Pty) Ltd A debtor of sefa where the husband of the Director, HN Lupuwana-Pemba is a shareholder. The loan was approved prior to the union taking place
Transactions between the Company and its subsidiaries, which are related parties, have been eliminated in the Group financial statements, however these are not eliminated in the individual Company financial statements.
Notes to the Financial Statements (continued)for the year ended 31 March 2017

Small Enterprise Finance Agency130
34. Related party transactions The following transactions were entered into with related parties:
Group Company
2017R’000
2016R’000
2017R’000
2016R’000
Rental income received from related parties
EDD 5 847 5 343 5 847 5 343
Investment income received from related parties
IDC 22 929 22 664 22 929 22 664
Management fees charged to related parties
Khula Land Reform Empowerment Facility(1) 10 965 7 828 10 965 7 828
Related party balances receivable/(payable)
Amava Chrome (Pty) Ltd – loan at cost(2) 2 334 – 2 334 –
Khula Land Reform Empowerment Facility(1) 7 553 5 000 7 553 5 000
New Business Finance (Pty) Ltd(3) – – – (1 977)
IDC – cash managed(3) 268 926 402 096 177 691 310 585
IDC – Shareholder’s loan (liability)(4) (461 335) (429 379) (461 335) (429 379)
IDC – Shareholder’s loan (equity)(4) (1 305 675) (1 092 551) (1 305 675) (1 092 551)
(1 488 197) (1 114 834) (1 579 432) (1 208 322)
Transactions with key management personnel No material contracts were entered into involving the interest of any Director or executive management member. All
compensation paid to key management is disclosed under note 29.
35. Unauthorised, fruitless and wasteful and irregular expenditure Unauthorised expenditure No expenditure was classified as unauthorised during the financial year (2016: Rnil).
Fruitless and wasteful expenditure The PFMA defines fruitless and wasteful expenditure as expenditure which was made in vain and would have been avoided had
reasonable care been exercised.
Fruitless and wasteful expenditure for the year amounted to Rnil (2016: R1,235).
Irregular expenditure Irregular expenditure signifies expenditure incurred without adhering to established rules, regulations, procedural guidelines,
policies, principles or practices that have been implemented to ensure compliance with the PFMA, relevant tender regulations as well as any other relevant procurement regulations.
2017R’000
2016R’000
Opening balance – –
Irregular expenditure for the year 161 2 981
Condoned or written off by accounting authority (161) (2 981)
Closing balance – –
(1) Registered as a non-profit Company. This Company has been exempted from consolidation as sefa is acting as an agent.
(2) This loan was issued prior to the matrimonial union between the Shareholder of the debtor and the Director.
The loan bears interest at 13.5% and is repayable over 60 months ending August 2018 and is secured as follows:
• Cession of lease agreement; • Cession of Director’s loan account;
• Personal suretyship; • Special notarial bond over moveable assets; • Cession of supplier agreement. 96% of the original facility amount has been repaid at financial
year end and 28% of the outstanding balance was overdue. (3) Any outstanding related party balances are unsecured and will be
settled in cash. No guarantees have been given or received. (4) Refer to note 18 for specific terms
Notes to the Financial Statements (continued)for the year ended 31 March 2017
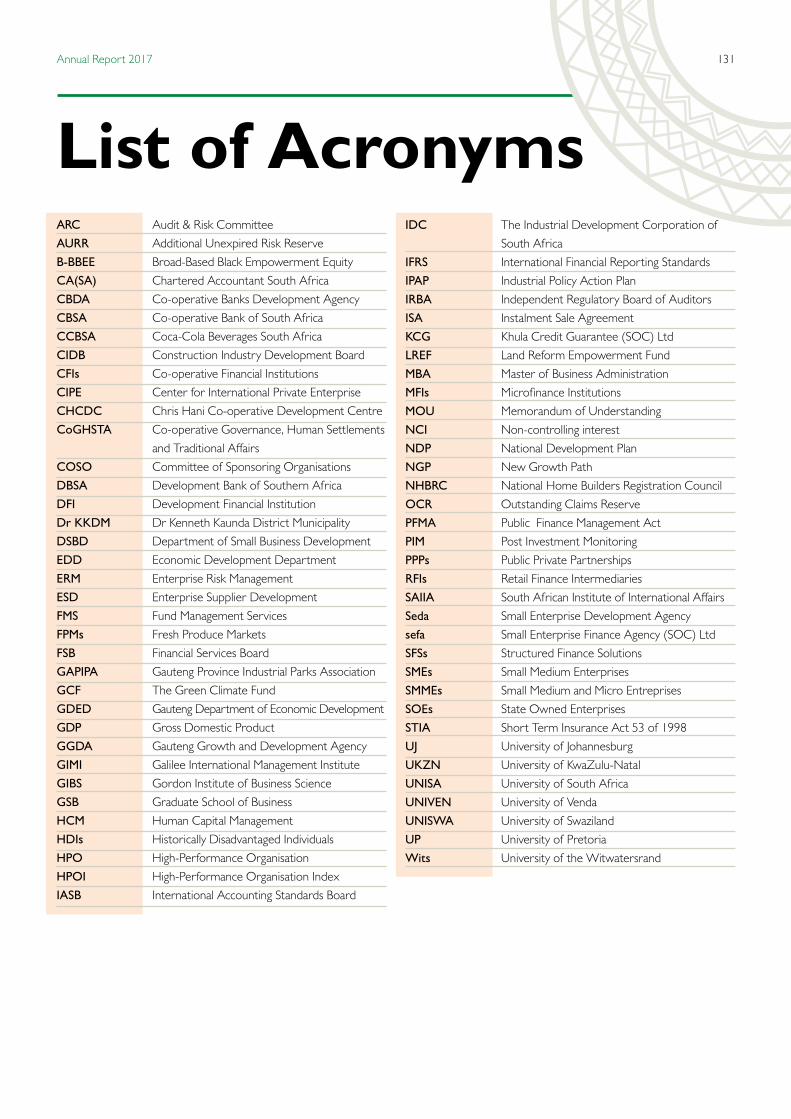
131Annual Report 2017
List of AcronymsARC Audit & Risk Committee
AURR Additional Unexpired Risk Reserve
B-BBEE Broad-Based Black Empowerment Equity
CA(SA) Chartered Accountant South Africa
CBDA Co-operative Banks Development Agency
CBSA Co-operative Bank of South Africa
CCBSA Coca-Cola Beverages South Africa
CIDB Construction Industry Development Board
CFIs Co-operative Financial Institutions
CIPE Center for International Private Enterprise
CHCDC Chris Hani Co-operative Development Centre
CoGHSTA Co-operative Governance, Human Settlements
and Traditional Affairs
COSO Committee of Sponsoring Organisations
DBSA Development Bank of Southern Africa
DFI Development Financial Institution
Dr KKDM Dr Kenneth Kaunda District Municipality
DSBD Department of Small Business Development
EDD Economic Development Department
ERM Enterprise Risk Management
ESD Enterprise Supplier Development
FMS Fund Management Services
FPMs Fresh Produce Markets
FSB Financial Services Board
GAPIPA Gauteng Province Industrial Parks Association
GCF The Green Climate Fund
GDED Gauteng Department of Economic Development
GDP Gross Domestic Product
GGDA Gauteng Growth and Development Agency
GIMI Galilee International Management Institute
GIBS Gordon Institute of Business Science
GSB Graduate School of Business
HCM Human Capital Management
HDIs Historically Disadvantaged Individuals
HPO High-Performance Organisation
HPOI High-Performance Organisation Index
IASB International Accounting Standards Board
IDC The Industrial Development Corporation of
South Africa
IFRS International Financial Reporting Standards
IPAP Industrial Policy Action Plan
IRBA Independent Regulatory Board of Auditors
ISA Instalment Sale Agreement
KCG Khula Credit Guarantee (SOC) Ltd
LREF Land Reform Empowerment Fund
MBA Master of Business Administration
MFIs Microfinance Institutions
MOU Memorandum of Understanding
NCI Non-controlling interest
NDP National Development Plan
NGP New Growth Path
NHBRC National Home Builders Registration Council
OCR Outstanding Claims Reserve
PFMA Public Finance Management Act
PIM Post Investment Monitoring
PPPs Public Private Partnerships
RFIs Retail Finance Intermediaries
SAIIA South African Institute of International Affairs
Seda Small Enterprise Development Agency
sefa Small Enterprise Finance Agency (SOC) Ltd
SFSs Structured Finance Solutions
SMEs Small Medium Enterprises
SMMEs Small Medium and Micro Entreprises
SOEs State Owned Enterprises
STIA Short Term Insurance Act 53 of 1998
UJ University of Johannesburg
UKZN University of KwaZulu-Natal
UNISA University of South Africa
UNIVEN University of Venda
UNISWA University of Swaziland
UP University of Pretoria
Wits University of the Witwatersrand

Small Enterprise Finance Agency132
sefa OfficesRegional Offices Contact ListRegional offices are open from 08h30 to 17h00 from Monday to Friday with the exception of Public Holidays. Clients wishing to participate in consultations at any of the co-locations are advised to secure an appointment with a sefa representative using the contact details provided below.
Regional Office Office Type Address Telephone Number Office Hours
Free State
sefa Regional Office
BloemfonteinOffice 4&5, Preller, Square, Graaf Reinet Street, Dan Pienaar, Bloemfontein, 9301
051 436 [email protected]
08h30 - 16h30Monday - Friday
Co-locations
WelkomOne Reinet Building, Reinet Street, Welkom, 9460
051 436 [email protected] 09h30 - 15h00
Trompsburg53 Voortrekker Street, Khoisan Building, Trompsburg, 9913
051 436 [email protected] 10h00 - 14h00
QwaqwaMampoi Road, Phuthaditjhaba, 9866
051 436 [email protected] 09h30 - 15h00
SasolburgEric Louw Street, Boiketlong, Zamdela, Sasolburg, 1939
051 436 [email protected] 09h30 - 13h00
KwaZulu-Natal
sefa Regional Office
Durban21st Floor, Office 2102, Durban Embassy Building, Anton Lembede Street, Durban, 4001
031 368 [email protected]
08h30 - 16h30Monday - Friday
Co-locations
Port Shepstone46 Bisset Street, Lot No 456, Port Shepstone,4240
031 368 [email protected] 08h30 - 17h00
Ladysmith93/94 Murchison Street, Ladysmith, 3370
031 368 [email protected] 08h30 - 17h00
Richards Bay Lot 611237 via Verbana, Veldenvlei, Richards Bay, 3900
031 368 [email protected] 08h30 - 17h00
Newcastle28 Scott Street, Newcastle, 2940
031 368 [email protected] 08h30 - 17h00
IDC Pietermarizburg1st Floor ABSA Building,15 Chatterton Rd, PMB, 3201
031 368 [email protected] 08h30 - 17h00
Gauteng
sefa Regional Office
Centurion (Head Office)Eco Fusion 5, Block D, 1004 Teak Close, Witch-Hazel Avenue, Eco Park, Centurion, 0157
012 748 [email protected]@sefa.org.za
08h30 - 17h00
Riversands (Diepsloot)Riversands Incubation Hub, 8 Incubation Drive, Riverside View, Ext. 15, Midrand, 2191
087 288 [email protected]
08h30 - 16h30Monday - Friday
Co-locations
TshwaneBlock C, 4th Floor, Old Mutual Building, 536 Frances Baard & Steve Biko Streets, Pretoria
012 441 [email protected]
08h30 - 16h30
Emfuleni5 Moshoeshoe Street, VUT Science & Technology Park, Sebokeng, 1983
012 748 [email protected],za 08h30 - 17h00
Sandton19 Fredman Drive, Sandown, Sandton, 2146
011 269 [email protected] 08h30 - 17h00
SowetoShop 368 Maponya Mall, Thusong Centre, Chris Hani Road (Old Potchefstroom Road), 1809
011 938 [email protected] 08h30 - 17h00
EkurhuleniEkurhuleni Business Facilitation Network, Cnr Voortrekker & Monument Road, Kempton Park, 1619
010 492 [email protected]
08h30 - 16h30Monday - Friday
Western Cape
sefa Regional Office
Cape Town9th Floor, 2 Long Street, Cape Town, 8001
021 418 [email protected]
08h30 - 16h30Monday - Friday
Co-locations
Bellville2nd Floor, Louwville Place, Vrede Street, Bellville, 7535
021 418 [email protected] 08h30 - 17h00
KhayelitshaKhayelitsha Training Centre Cnr Lwandile & Spine Road, Khayelitsha, 7784
021 418 [email protected] 08h30 - 17h00
MosselbayKKT Sentrum Nr. 7, Gericke Street, Voorbaai, Mossel Bay, 6506
021 418 [email protected] 08h30 - 17h00
KnysnaThesen House, 6 Long Street, Knysna, 6571
021 418 [email protected] 08h30 - 17h00
GeorgeEntrance A, 1st Floor Beacon Place, 125 Meade Street, George, 6530
044 803 [email protected] 08h30 - 16h30
Oudtshoorn70 Voortrekker Street, Oudtshoorn, 6625
044 803 [email protected] 08h30 - 17h00
Beaufort WestThusong Service Centre, 3 De Vries Street, Beaufort West, 6970
021 418 [email protected] 08h30 - 17h00
HermanusShop No 44, Gateway Centre, Hermanus, 7200
021 418 [email protected] 08h30 - 17h00
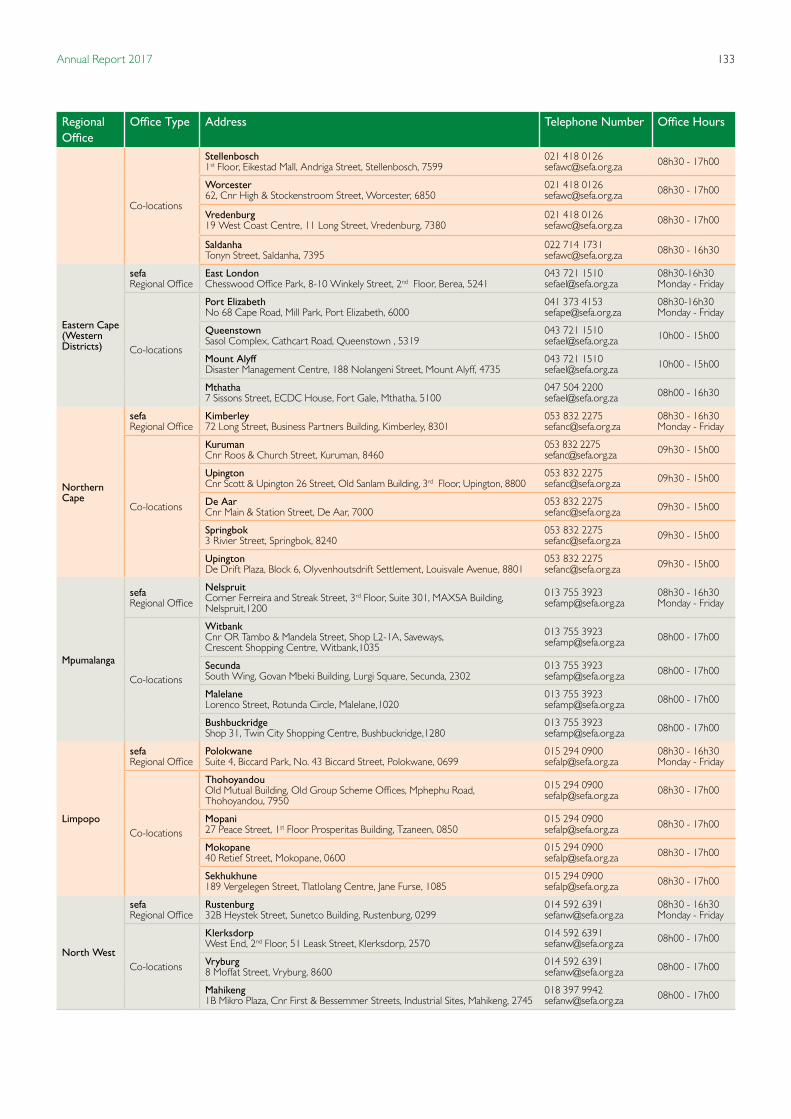
133Annual Report 2017
Regional Office
Office Type Address Telephone Number Office Hours
Co-locations
Stellenbosch1st Floor, Eikestad Mall, Andriga Street, Stellenbosch, 7599
021 418 [email protected] 08h30 - 17h00
Worcester62, Cnr High & Stockenstroom Street, Worcester, 6850
021 418 [email protected] 08h30 - 17h00
Vredenburg19 West Coast Centre, 11 Long Street, Vredenburg, 7380
021 418 [email protected] 08h30 - 17h00
SaldanhaTonyn Street, Saldanha, 7395
022 714 [email protected] 08h30 - 16h30
Eastern Cape (Western Districts)
sefa Regional Office
East LondonChesswood Office Park, 8-10 Winkely Street, 2nd Floor, Berea, 5241
043 721 [email protected]
08h30-16h30Monday - Friday
Co-locations
Port ElizabethNo 68 Cape Road, Mill Park, Port Elizabeth, 6000
041 373 [email protected]
08h30-16h30Monday - Friday
Queenstown Sasol Complex, Cathcart Road, Queenstown , 5319
043 721 [email protected] 10h00 - 15h00
Mount AlyffDisaster Management Centre, 188 Nolangeni Street, Mount Alyff, 4735
043 721 [email protected] 10h00 - 15h00
Mthatha 7 Sissons Street, ECDC House, Fort Gale, Mthatha, 5100
047 504 [email protected] 08h00 - 16h30
Northern Cape
sefa Regional Office
Kimberley72 Long Street, Business Partners Building, Kimberley, 8301
053 832 [email protected]
08h30 - 16h30Monday - Friday
Co-locations
KurumanCnr Roos & Church Street, Kuruman, 8460
053 832 [email protected] 09h30 - 15h00
UpingtonCnr Scott & Upington 26 Street, Old Sanlam Building, 3rd Floor, Upington, 8800
053 832 [email protected] 09h30 - 15h00
De AarCnr Main & Station Street, De Aar, 7000
053 832 [email protected] 09h30 - 15h00
Springbok3 Rivier Street, Springbok, 8240
053 832 [email protected] 09h30 - 15h00
UpingtonDe Drift Plaza, Block 6, Olyvenhoutsdrift Settlement, Louisvale Avenue, 8801
053 832 [email protected] 09h30 - 15h00
Mpumalanga
sefa Regional Office
NelspruitCorner Ferreira and Streak Street, 3rd Floor, Suite 301, MAXSA Building, Nelspruit,1200
013 755 [email protected]
08h30 - 16h30Monday - Friday
Co-locations
WitbankCnr OR Tambo & Mandela Street, Shop L2-1A, Saveways, Crescent Shopping Centre, Witbank,1035
013 755 [email protected] 08h00 - 17h00
SecundaSouth Wing, Govan Mbeki Building, Lurgi Square, Secunda, 2302
013 755 [email protected] 08h00 - 17h00
MalelaneLorenco Street, Rotunda Circle, Malelane,1020
013 755 [email protected] 08h00 - 17h00
BushbuckridgeShop 31, Twin City Shopping Centre, Bushbuckridge,1280
013 755 [email protected] 08h00 - 17h00
Limpopo
sefa Regional Office
PolokwaneSuite 4, Biccard Park, No. 43 Biccard Street, Polokwane, 0699
015 294 [email protected]
08h30 - 16h30Monday - Friday
Co-locations
ThohoyandouOld Mutual Building, Old Group Scheme Offices, Mphephu Road, Thohoyandou, 7950
015 294 [email protected] 08h30 - 17h00
Mopani27 Peace Street, 1st Floor Prosperitas Building, Tzaneen, 0850
015 294 [email protected] 08h30 - 17h00
Mokopane40 Retief Street, Mokopane, 0600
015 294 [email protected] 08h30 - 17h00
Sekhukhune189 Vergelegen Street, Tlatlolang Centre, Jane Furse, 1085
015 294 [email protected] 08h30 - 17h00
North West
sefa Regional Office
Rustenburg32B Heystek Street, Sunetco Building, Rustenburg, 0299
014 592 [email protected]
08h30 - 16h30Monday - Friday
Co-locations
KlerksdorpWest End, 2nd Floor, 51 Leask Street, Klerksdorp, 2570
014 592 [email protected] 08h00 - 17h00
Vryburg8 Moffat Street, Vryburg, 8600
014 592 [email protected] 08h00 - 17h00
Mahikeng1B Mikro Plaza, Cnr First & Bessemmer Streets, Industrial Sites, Mahikeng, 2745
018 397 [email protected] 08h00 - 17h00

Small Enterprise Finance Agency134
Notes

135Annual Report 2017
Notes

Small Enterprise Finance Agency136Victoria Street Market forms part of sefa's property portfolio

137Annual Report 2017
Small Enterprise Finance Agency138
Small Enterprise Finance Agency (SOC) LimitedCompany Registration Number: 1995/011258/06
Licensed Credit Provider: NCRCP 160
Eco Fusion 5, Block D, 1004 Teak Close, Witch-Hazel Avenue, Eco Park, Centurion, 0157
PO Box 11011, Zwartkop, 0051
Tel: +27 12 748 9600
[email protected]@sefa.org.za
www.sefa.org.za
Fraud Hotline Number: 0800 000 663 (Tip-offs Anonymous)