Annual Report 2017 - 2018 Piramal Glass Ceylon PLC€¦ · recognized by Ceylon Electricity Board...
69
Annual Report 2017 - 2018 Piramal Glass Ceylon PLC
Transcript of Annual Report 2017 - 2018 Piramal Glass Ceylon PLC€¦ · recognized by Ceylon Electricity Board...
Annual Report 2017 - 2018Piramal Glass Ceylon PLC
Corporate Information 2
Chairman’s Statement 3-4
Report on the Affairs of the Company 5-8
The Board of Directors 9-10
Corporate Governance - Compliance Table 11-12
Corporate Governance - Attendance of Directors’ at Meeting 13
Corporate Governance - Remuneration & Audit Committee Report 14
Corporate Governance - Related Party Transactions Review Committee Report 15
Material Foreseeable Risk Factors 16
Directors’ Responsibilities for the Preparation of the Financial Statements 17
Independent Auditors’ Report 20-23
StatementofProfitorLoss 24
Statement of Other Comprehensive Income 25
Statement of Financial Position 26
Statement of Changes in Equity 27
Statement of Cash Flows 28
Notes to the Financial Statements 29-60
Statement of Value Added 61
Shareholders’ and Investor Information 62-63
Ten Year Financial Review 64
Glossary of Financial Terminology 65
Notice of Meeting 66
Form of Proxy Enclosed
C O N T E N T S
Annual Report 2017/20182
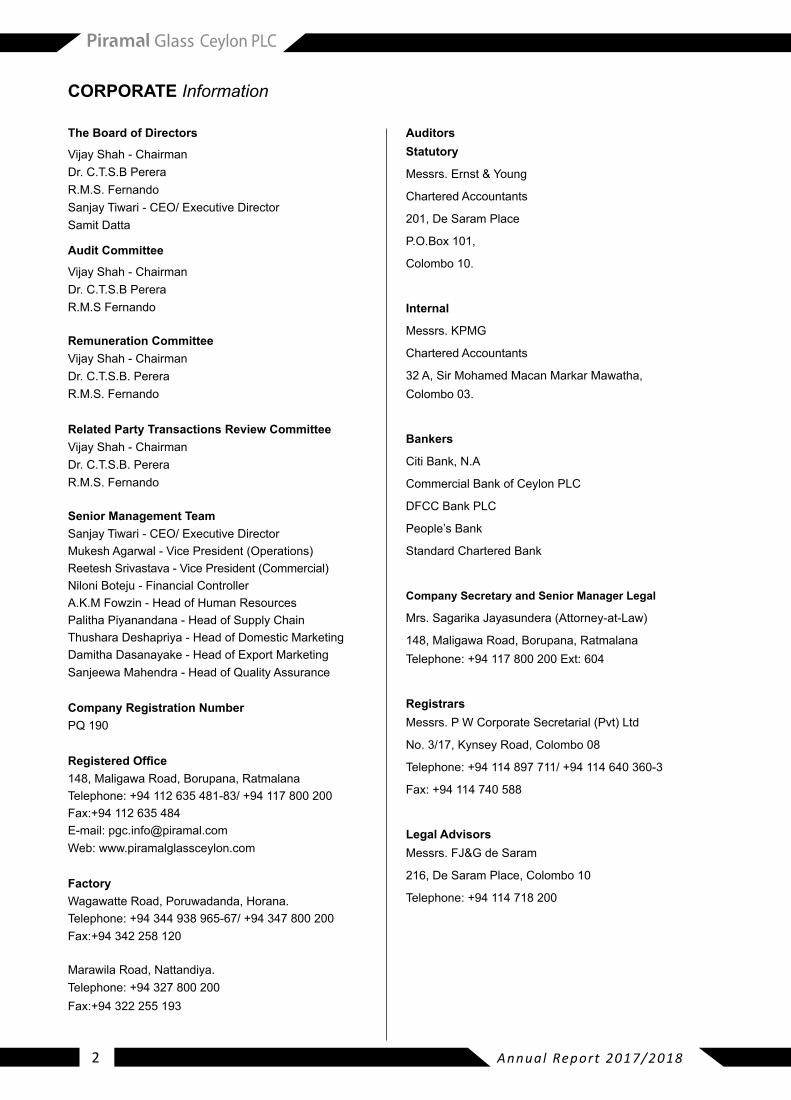
CORPORATE Information
The Board of Directors
Vijay Shah - Chairman Dr. C.T.S.B PereraR.M.S. FernandoSanjay Tiwari - CEO/ Executive DirectorSamit Datta
Audit Committee
Vijay Shah - Chairman Dr. C.T.S.B PereraR.M.S Fernando
Remuneration Committee Vijay Shah - ChairmanDr. C.T.S.B. PereraR.M.S. Fernando
Related Party Transactions Review CommitteeVijay Shah - ChairmanDr. C.T.S.B. PereraR.M.S. Fernando
Senior Management TeamSanjay Tiwari - CEO/ Executive DirectorMukesh Agarwal - Vice President (Operations)Reetesh Srivastava - Vice President (Commercial)Niloni Boteju - Financial ControllerA.K.M Fowzin - Head of Human Resources Palitha Piyanandana - Head of Supply Chain Thushara Deshapriya - Head of Domestic Marketing Damitha Dasanayake - Head of Export Marketing Sanjeewa Mahendra - Head of Quality Assurance
Company Registration Number PQ 190
Registered Office148, Maligawa Road, Borupana, Ratmalana Telephone: +94 112 635 481-83/ +94 117 800 200 Fax:+94 112 635 484E-mail: [email protected]: www.piramalglassceylon.com
FactoryWagawatte Road, Poruwadanda, Horana. Telephone: +94 344 938 965-67/ +94 347 800 200 Fax:+94 342 258 120
Marawila Road, Nattandiya. Telephone: +94 327 800 200 Fax:+94 322 255 193
Auditors Statutory
Messrs. Ernst & Young
Chartered Accountants
201, De Saram Place
P.O.Box 101,
Colombo 10.
Internal
Messrs. KPMG
Chartered Accountants
32 A, Sir Mohamed Macan Markar Mawatha, Colombo 03.
Bankers
Citi Bank, N.A
CommercialBankofCeylonPLC
DFCCBankPLC
People’s Bank
Standard Chartered Bank
Company Secretary and Senior Manager Legal
Mrs.SagarikaJayasundera(Attorney-at-Law)
148, Maligawa Road, Borupana, Ratmalana Telephone: +94 117 800 200 Ext: 604
RegistrarsMessrs.PWCorporateSecretarial(Pvt)Ltd
No. 3/17, Kynsey Road, Colombo 08
Telephone: +94 114 897 711/ +94 114 640 360-3
Fax: +94 114 740 588
Legal AdvisorsMessrs. FJ&G de Saram
216, De Saram Place, Colombo 10
Telephone: +94 114 718 200
Annual Report 2017/2018 3
Dear Shareholders,
Warm greetings to you all!
It is with great pleasure that I welcome you on behalf of the Board of Directors to the 63rd Annual General Meeting of Piramal Glass Ceylon PLC (PGC) andshare with you the successes and advancement we have made during the past year and our future aspirations as also the challenges.
F18 has been a very challenging year for Piramal Glass Ceylon. The relining & capacity enhancement completed in F17 stabilized during this year. The furnace operations has settled well and is performing asperexpectedefficienciesandwithintheoperationalparameters.Yetwewerenotabletoreapfullbenefitof the increased capacities due to the domestic market condition.
This total revenue in F18 is Rs. 6,816 million as against Rs.6,783 million of the previous year F17. The turnover was contributed by Rs. 4,680 Million from the Domestic Market & Rs.2,136 Million from the Export Market. These figures reflect a 77%growth in theExportMarket anda 16%degrowthin the domestic market as against the previous year.
The domestic market which normally takes over 75% of the capacity of the company witnessedconsiderable decline during the year which impacted the company’s revenue mix. The capacity utilization fordomesticmarketdroppedtolessthan70%,andthis was experienced in all segments of the market. This was mainly contributed by the introduction of new taxes & levies on the beverage & liquor segment ofthemarketasitmadethefinalproductsalotmoreexpensive. This resulted in the decline in consumer demandwhichultimatelyreflectedinthereductionofdomestic sales in food, beverage & liquor segments. This was further aggravated by the adverse weather conditions which effected the agro segment.
The management has tried its best to channel the extra capacity towards the export market to bridge the gap due to the loss of domestic volumes. The sale to USA, Canada, Australia and neighboring markets showed exceptional increase which partly helped to reduce the gap. PGC is focusing on developing these potential market to contract the incremental capacity added in the year F17.
TheexporttoUShasgrownbyover150%,Australiaby 72% and a six fold increase in the Canadianmarkets.The company is gaining entry into several new markets such as Malaysia, Africa and Vietnam. PGC also commenced export trading business to Myanmar which opened up a new dimension of international business for the company.
TheGrossProfitfortheyearimprovedfromRs.1,371MntoRs.1,422MnreflectingamarginalincreaseinGPmargins from20% to21%.Also, theOperatingProfitsincreasedfrom11%to13%fromRs.779Mnto Rs. 869 Mn.These results were achieved despite the high impact of depreciation and Interest on the investments made during the year. The depreciation increasedby31%fromRs.553MntoRs.722Mn.Theannualized impact of the interest on the long term loan of Rs. 3 Bn taken for the relining & upgradation ofthefacilityatHoranaisreflectedintheyearunderreview. The interest cost was Rs. 328 Mn as against Rs.176Mnofthepreviousyear.Theprofitabilitywasfurther affected by an increase in energy prices.
CHAIRMAN’S Statement
Annual Report 2017/20184
TheimpactofhighfurnaceoilpricesandfluctuatingLPGpricescontinuedduringtheperiodunderreview.TheyearendedwiththeProfitAfterTaxofRs.344Mn as against Rs. 485 Mn in the previous year.
Piramal Glass Ceylon made an entry towards the use of Renewable Energy with its investment of Rs. 350Mn in a 3MW Roof top Solar Power plant at its Glass plant at Horana. The company has been looking at an alternate source of energy which would be reliable, cost effective & environment friendly. This project was done under the initiative of the Sri Lanka Government together with the Ministryof Power & Renewable Energy’s ‘Soorya Bala Sangramaya (“Battle for Solar energy”) Programme to promote Solar Energy, with the plan of building solar power plants of 3,000 MW in the next ten years.
Piramal Glass 3 MW solar installation has been recognized by Ceylon Electricity Board as the largest solar roof top project completed in Sri Lanka.Thiscapacity isequivalent to15%of the totalelectricityconsumption at our manufacturing base, Horana .
We at Piramal Glass Ceylon believe this is our own little way of helping “Mother Earth” to preserve its Energy Resources and thereby help reduce the global warming.
LOOKING AHEAD
In continuation of our policy of distributing 50% ofoperatingdistributableprofits,theBoardofDirectorshas proposed a final dividend of 18% for the yearended 31st March 2018 for the approval of the shareholders.
With one of the most challenging years behind us we are looking forward with much expectations towards the new year expecting to reap the harvest of the in-roads that we have made in the new international markets, specially USA, Australia & Canada and the strategic initiatives taken in the domestic market.
The Company is also looking into further investment in a new Production line which would facilitate the requirements of the Export market. This would also help us to attain the maximum utilization of the production capacity.
APPRECIATION
The performance of our company, during the year, could not have been achieved without the untiring efforts, dedication and commitment of all our employees. I take this opportunity to express my gratitude to them. I also thank our valued customers fortheirunflinchingpatronageandsupport.
I also wish to convey my gratitude to the Board of Directors, for their valuable contribution and guidance during the past year. I also appreciate the management team for their valuable contribution during thefinancialyear. Iwould fail inmyduty if Ido not thank our shareholders, for the confidencereposed in us.
I also wish to thank Piramal Glass Corporate Team from India for the help and cooperation extended in managerial and operational aspects at all times to the operationshereinSriLanka.
I take this opportunity to thank the various departments oftheGovernmentofSriLanka,BoardofInvestment,Banks, other institutions and clients that extended assistance to Piramal Glass Ceylon. I thank you for your continued faith in us over the past years. We look forward to your support in the coming years too.
I would like to reiterate that our Company’s path to excellence is rooted in our core values of Knowledge, Action, Care and Impact which drive us towards creating long term value for all our stakeholders.
Vijay ShahChairman08th May 2018
CHAIRMAN’S Statement
Annual Report 2017/2018 5
REPORT ON THE AFFAIRS of the Company
TO THE SHAREHOLDERS
The Board of Directors have pleasure in presenting the 63rd Annual Report and the Audited Financial Statement of the Company for the year ended 31st March 2018.
REVIEW OF THE YEAR
The Chairman’s statement describes in brief of the Company’s affairs and the performance during the year and also mentions the events occurring after the reporting date.
PRINCIPAL ACTIVITY
Principal activity of the Company is the manufacturing and sale of Glass Containers.
TheCompany’sownershipofLandandBuildingareasfollows,
Extent Value (Gross) Buildings
(Acres) LKR Mn Nos.
Ratmalana -FreeholdLand 0.7 33.9 02
Nattandiya -FreeholdLand 54 99.0 05
Horana -LeaseholdLand 31 34.3 08
Nattandiya -LeaseholdLand 09 5.4 05
CURRENCY
AllfiguresappearingintheFinancialStatementsareinSriLankaRupeesanddenotedas”LKR”
FINANCIAL RESULTS 2018 2017
LKR 000' LKR 000'
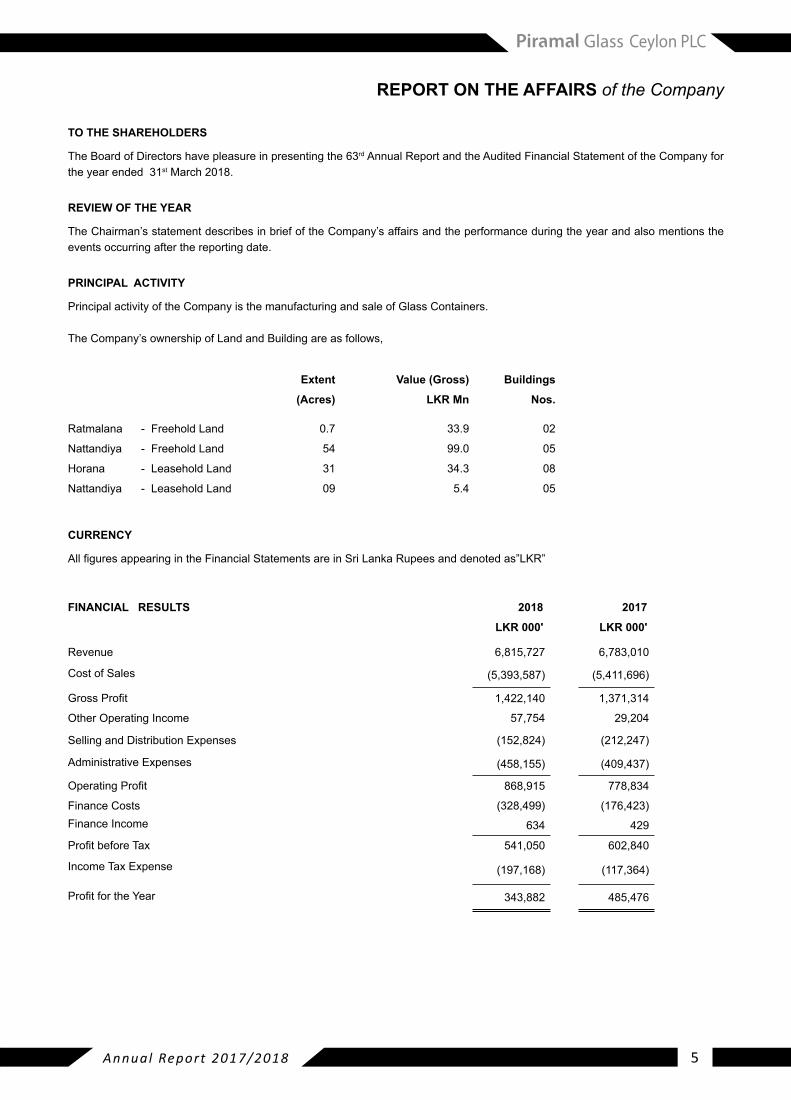
Revenue 6,815,727 6,783,010
Cost of Sales (5,393,587) (5,411,696)
GrossProfit 1,422,140 1,371,314
Other Operating Income 57,754 29,204
Selling and Distribution Expenses (152,824) (212,247)
Administrative Expenses (458,155) (409,437)
OperatingProfit 868,915 778,834
Finance Costs (328,499) (176,423)Finance Income 634 429
ProfitbeforeTax 541,050 602,840
Income Tax Expense (197,168) (117,364)
ProfitfortheYear 343,882 485,476
Annual Report 2017/20186
REPORT ON THE AFFAIRS of the Company
SALES HIGHLIGHTS
A total turnover of Rs. 6,816 was achieved in F18 as against Rs. 6,783 Million of F17.
TheDomesticmarketwasatRs.4,680MillionasagainstRs.5,574Millionofthepreviousyearwithadeclineof16%whichwasmainlycontributedbytheBeverage&Liquorindustry.
TheExportmarketgrowthwassignificantat77%fromRs.1,209MninF17toRs.2,136MillioninF18.TheExportstoUSA,CanadaandAustraliagrewsignificantlywhilstthecompanyenteredintoseveralnewmarketswhichincludeMalaysia,Africa,VietnamandMyanmar.
PRODUCTION HIGHLIGHTS
The furnace & the operation has settled well after the relining done last year. We are able to provide the high quality demanded by the export market with the new infrastructure now in place. Yet the capacity utilisation was restricted due to the decline in the domes-tic market & the available product portfolio. A total production of 75,932 tonnes were produced during the year as against 60,099 tonnes of the previous year. Several new initiatives were done in the production area with roof top solar power generation of 3MW taking the lead.
EMPLOYMENT 2018 2017
Total employment as at 31st March 443 425
CAPITAL EXPENDITURE AND INVESTMENTS
During the year the Company’scashoutflowonProperty,PlantandEquipmentwastotheaggregatevalueofLKR623,042,011/-(YearEnded31March2017LKR2,961,584,592/-)The capital commitments as at the reporting date are disclosed in Note 19.1 to the Financial Statements.
SHARE CAPITAL
TheStatedcapitalasattheendoftheyearwasLKR1,526,407,485/-,consistingof950,086,080numberofordinaryshares.
SHARE HOLDINGS 2018 2017
Registered Shareholders as at 31st March 12,428 12,989
The distribution of shares is indicated in page 62.
EVENTS OCCURRING AFTER THE REPORTING DATE
The events occurring after the reporting date are disclosed in Note 21 to the Financial Statements. No events have taken place since the Reporting date which would require any adjustments or disclosures other than the above.
THE BOARD OF DIRECTORS
Vijay Shah - ChairmanDr. C. T. S. B. PereraR. M. S. Fernando
Sanjay Tiwari - CEO / Executive Director
Samit Datta
Annual Report 2017/2018 7
APPOINTMENT OF NEW DIRECTORS
Newdirectorswerenotappointedduringthefinancialyear.
PERSONS WHO CEASED TO BE DIRECTORS
Nodirectorswereceasedfromtheboardduringthefinancialyear.
DIRECTORS’ INTEREST REGISTER
The Directors have made declarations as provided for in section 192 (2) of the Companies Act No. 7 of 2007. The related entries were made in the interest register during the year under review. The related party disclosures are referred to in Note 18.1 to the Financial Statements. The share ownership of directors is indicated below.
DIRECTORS’ SHAREHOLDINGS
The Directors’ and their spouse’s share holdings as at 31st March:
2018 2017
Dr. C. T. S. B. Perera 50,000 50,000Sanjay Tiwari (Jointly with Spouse) 100,000 100,000
DIRECTORS’ EMOLUMENTS
TheremunerationsandotherbenefitsmadetotheDirectorsduringtheyeararedisclosedinNote18.2
DONATIONS
The donations made by the company during the year are disclosed in Note 4.4.
AUDITORS
TheFinancialStatementshavebeenauditedbyMessrs.Ernst&Young,CharteredAccountantsofSriLanka,whohaveindicatedtheirwillingnesstocontinueinofficeandaresolutionrelatingtotheirreappointment,willbeproposedattheAnnualGeneralMeeting.
Fees paid/ provided as at 31st March 2018 2017
Audit Fees LKR838,284 LKR727,650
Taxation Services LKR403,613 LKR343,242
AsfarastheDirectorsareaware,theauditorsdonothaveanyotherrelationshipwiththeCompanyoranyofitsaffiliatecompany.
Sgd. Sanjay Tiwari Sgd. R.M.S. Fernando Sgd. Sagarika Jayasundera CEO / Executive Director Director Company Secretary
08th May 2018
REPORT ON THE AFFAIRS of the Company
Annual Report 2017/20188
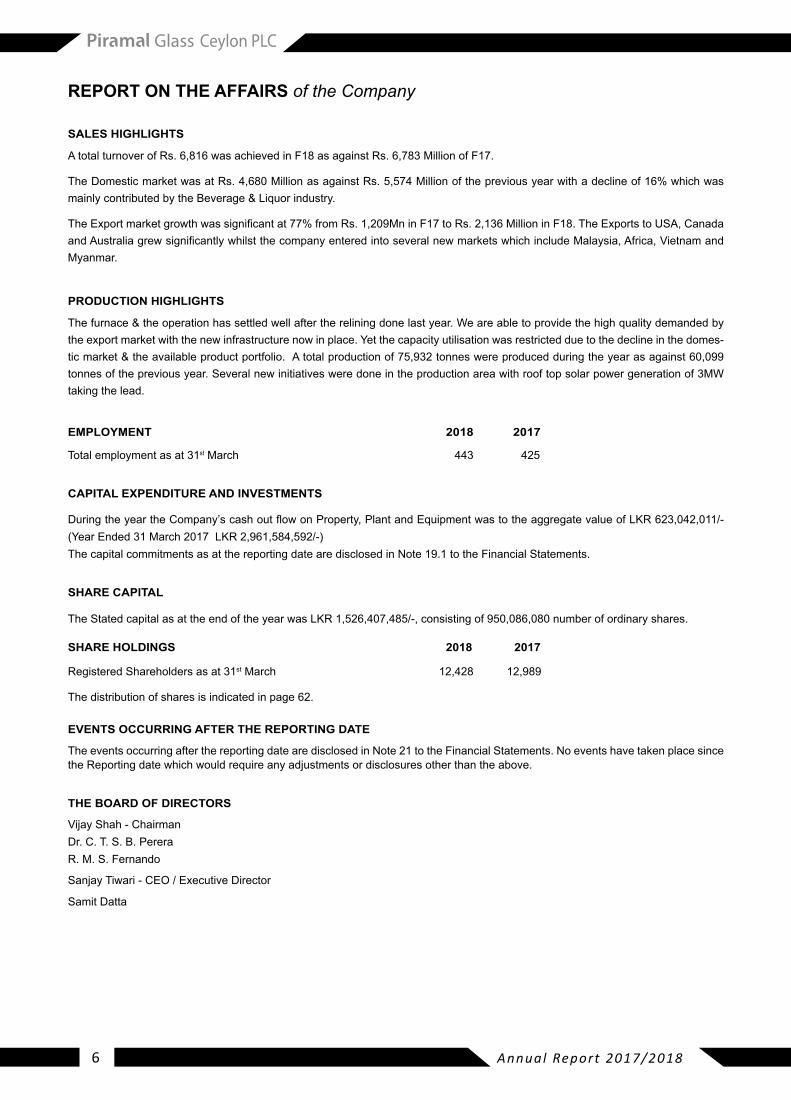
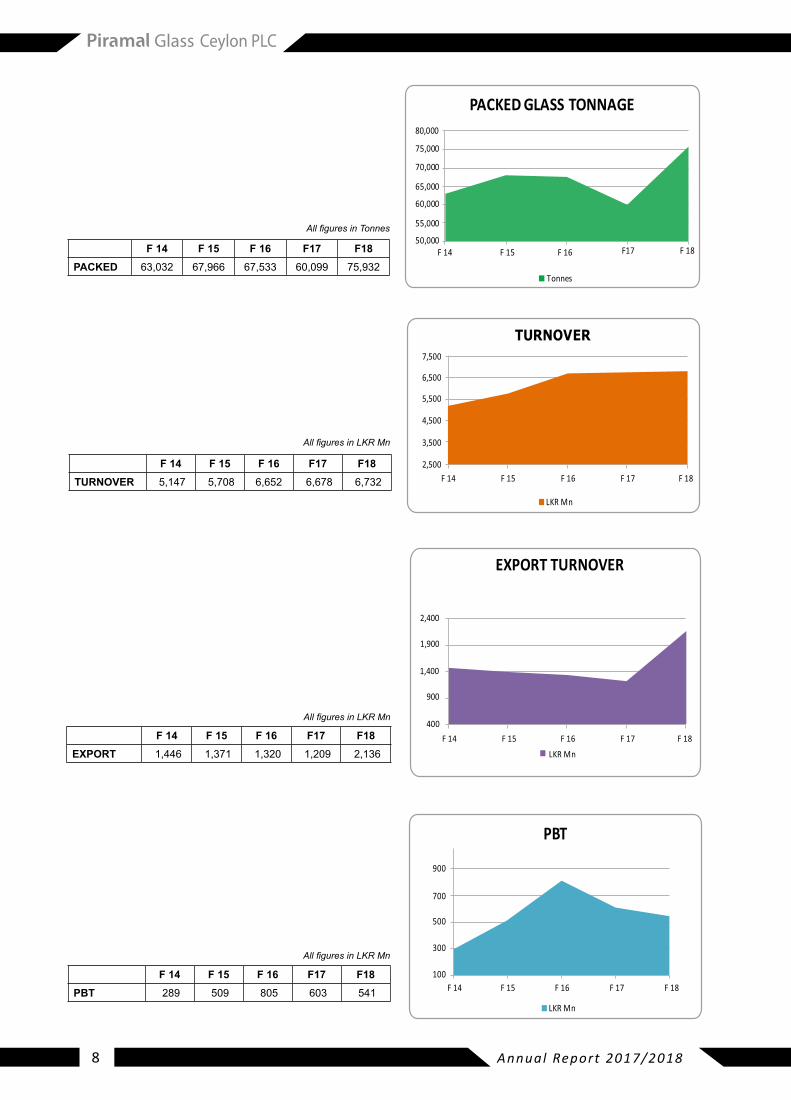
F 14 F 15 F 16 F17 F18PBT 289 509 805 603 541
F 14 F 15 F 16 F17 F18PACKED 63,032 67,966 67,533 60,099 75,932
F 14 F 15 F 16 F17 F18TURNOVER 5,147 5,708 6,652 6,678 6,732
F 14 F 15 F 16 F17 F18EXPORT 1,446 1,371 1,320 1,209 2,136
All figures in Tonnes
All figures in LKR Mn
All figures in LKR Mn
All figures in LKR Mn
TURNOVER
LKR Mn
100
300
500
700
900
PBT
LKR Mn
EXPORT TURNOVER
LKR Mn
50,000
55,000
60,000
65,000
70,000
75,000
80,000
F 14 F 15 F 16 F17 F 18
PACKED GLASS TONNAGE
Tonnes
2,500
3,500
4,500
5,500
6,500
7,500
F 14 F 15 F 16 F 17 F 18
400
900
1,400
1,900
2,400
F 14 F 15 F 16 F 17 F 18
F 14 F 15 F 16 F 17 F 18
Annual Report 2017/2018 9
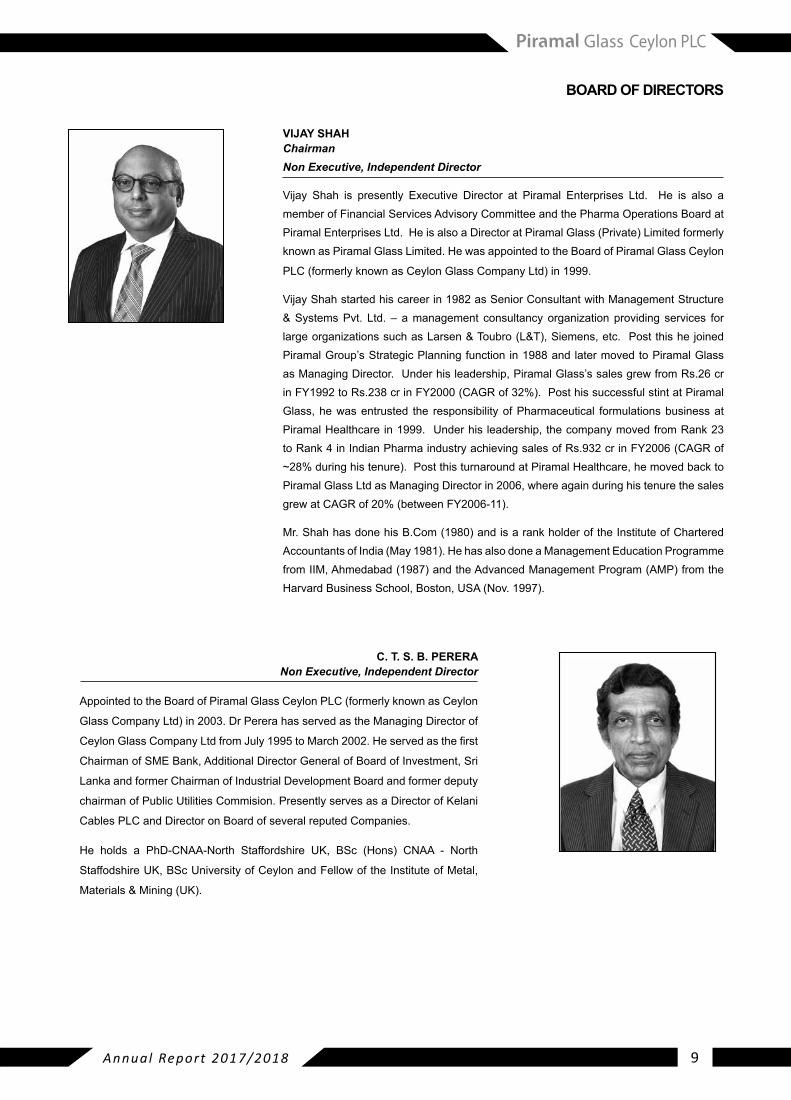
BOARD OF DIRECTORS
VIJAY SHAHChairmanNon Executive, Independent Director
Vijay Shah is presently Executive Director at Piramal Enterprises Ltd. He is also amember of Financial Services Advisory Committee and the Pharma Operations Board at PiramalEnterprisesLtd.HeisalsoaDirectoratPiramalGlass(Private)LimitedformerlyknownasPiramalGlassLimited.HewasappointedtotheBoardofPiramalGlassCeylon
PLC(formerlyknownasCeylonGlassCompanyLtd)in1999.
Vijay Shah started his career in 1982 as Senior Consultant with Management Structure &SystemsPvt. Ltd. –amanagement consultancyorganizationproviding services forlargeorganizationssuchasLarsen&Toubro(L&T),Siemens,etc.PostthishejoinedPiramal Group’s Strategic Planning function in 1988 and later moved to Piramal Glass as Managing Director. Under his leadership, Piramal Glass’s sales grew from Rs.26 cr inFY1992toRs.238crinFY2000(CAGRof32%).PosthissuccessfulstintatPiramalGlass, he was entrusted the responsibility of Pharmaceutical formulations business at Piramal Healthcare in 1999. Under his leadership, the company moved from Rank 23 to Rank 4 in Indian Pharma industry achieving sales of Rs.932 cr in FY2006 (CAGR of ~28%duringhistenure).PostthisturnaroundatPiramalHealthcare,hemovedbacktoPiramalGlassLtdasManagingDirectorin2006,whereagainduringhistenurethesalesgrewatCAGRof20%(betweenFY2006-11).
Mr. Shah has done his B.Com (1980) and is a rank holder of the Institute of Chartered Accountants of India (May 1981). He has also done a Management Education Programme from IIM, Ahmedabad (1987) and the Advanced Management Program (AMP) from the Harvard Business School, Boston, USA (Nov. 1997).
C. T. S. B. PERERA Non Executive, Independent Director
Appointed to the Board of PiramalGlassCeylonPLC(formerlyknownasCeylon
GlassCompanyLtd)in2003.DrPererahasservedastheManagingDirectorof
CeylonGlassCompanyLtdfromJuly1995toMarch2002.Heservedasthefirst
Chairman of SME Bank, Additional Director General of Board of Investment, Sri
LankaandformerChairmanofIndustrialDevelopmentBoardandformerdeputy
chairman of Public Utilities Commision. Presently serves as a Director of Kelani
CablesPLCandDirectoronBoardofseveralreputedCompanies.
He holds a PhD-CNAA-North Staffordshire UK, BSc (Hons) CNAA - North
Staffodshire UK, BSc University of Ceylon and Fellow of the Institute of Metal,
Materials & Mining (UK).

Annual Report 2017/201810
R. M. S. FERNANDONon Executive, Independent Director
AppointedtotheBoardofPiramalGlassCeylonPLC(FormerlyknownasCeylonGlassCompanyLtd)on8thOctober2007.
Mr. Fernando has worked at the DFCC Bank for 10 years and joined the National Development Bank in 1989 and was the CEO of the National Development Bank from 1989-2001. He also served as the Secretary to the Ministry of Investment Promotions, Industrial Policy, and Constitutional Affairs during 2002-2004. Mr. Fernando has been an international consultant and advisor to the World Bank and the Asian Development Bank.
He is a fellow of the Chartered Institute of Bankers, United Kingdom, Companion of the Chartered Institute of Management in UK and a fellow of the Chartered InstituteofManagementAccountantsinUK.HeholdsanhonoursdegreeinLawfromtheUniversityofColomboandisalsoanAttorney-at-Law.HeiscurrentlythechairmanofSriLankanAirlines.
SAMIT DATTANon Executive, Non Independent Director
Appointed to the Board of Piramal Glass Ceylon PLC (Formerly known as Ceylon GlassCompanyLtd)on28thApril2015.
Mr.SamitDattaisworkingwithPiramalGlass(Private)LtdformerlyknownasPiramalGlassLimitedsinceDecember2005andiscurrentlytheHeadofGlobalSupplyChainManagement,IT, Digital. He has recently taken charge of the Manufacturing Excellence program within Piramal Glass globally.
HehasworkedinvariouscapacitieshandlingStrategicPlanning,CorporateLogistics,GlobalSupply Chain Management, IT & Digital Transformation. He has over 23 years of experience in diverse industries including Consulting, Engineering, Automobile, Textiles, IT, Pharmaceuticals & Packaging.
He is holding BE (Hons) in Mechanical Engineering from NIT, Durgapur, India and a MBA in Manufacturing Management from SP Jain Institute of Management & Research, Mumbai, India.HehasalsocompletedaSeniorExecutiveLeadershipProgram(SELP-I)fromHarvardBusiness School in 2018.
SANJAY TIWARICEO/ Executive DirectorExecutive, Non Independent Director
Appointed to the Board of Piramal Glass Ceylon PLC (formerly known as Ceylon GlassCompany Ltd) in December 2005 as CEO and Executive Director. Since 1st June 2013, Mr.TiwarihasbeendesignatedastheChiefOperatingOfficerInPiramalGlass(Private)Ltdformerly known asPiramalGlass Limited, India to oversee the operations of thePlants inVadodara, Gujarat, India, in addition to existing responsibilities. Joined Piramal Group in June 2004asVicePresident-Finance&Commercial,headingAccounts,Finance,IT,LogisticsandSupplyChainofPiramalGlassLtdtillNov2005.BeforejoiningthePiramalGroupworkedwithZydusCadilaHealthcareLtdandTorrentGroupasCFOandGeneralManagerCommercialfor12years.DiversifiedexperienceinvariouspositionsindifferentIndustries-Textile,ColourChemicals, Cables, Pharmaceuticals, Bulk Drugs and Glass.
Mr.Tiwari,analuminiofLondonBusinessSchool,holdsaBachelorsDegree inCommercefrom India and is a fellow member of the Institute of Chartered Accountants of India. He has done Advance Financial Management & General Management from the Indian Institute of Management,Ahmedabad,India,andisqualifiedinExecutiveManagementfromtheUniversityofMichigan,USAandSeniorExecutiveManagementfromLondonBusinessSchool,UK.
MrTiwariiscurrentlythePresidentoftheSriLankaCeramicandGlassCouncil,theChairmanofCenterforTechnicalExcellenceinCeramics(CENTEC)andVicePresidentofIndoLankaChamberofCommerce,SriLanka.
Annual Report 2017/2018 11
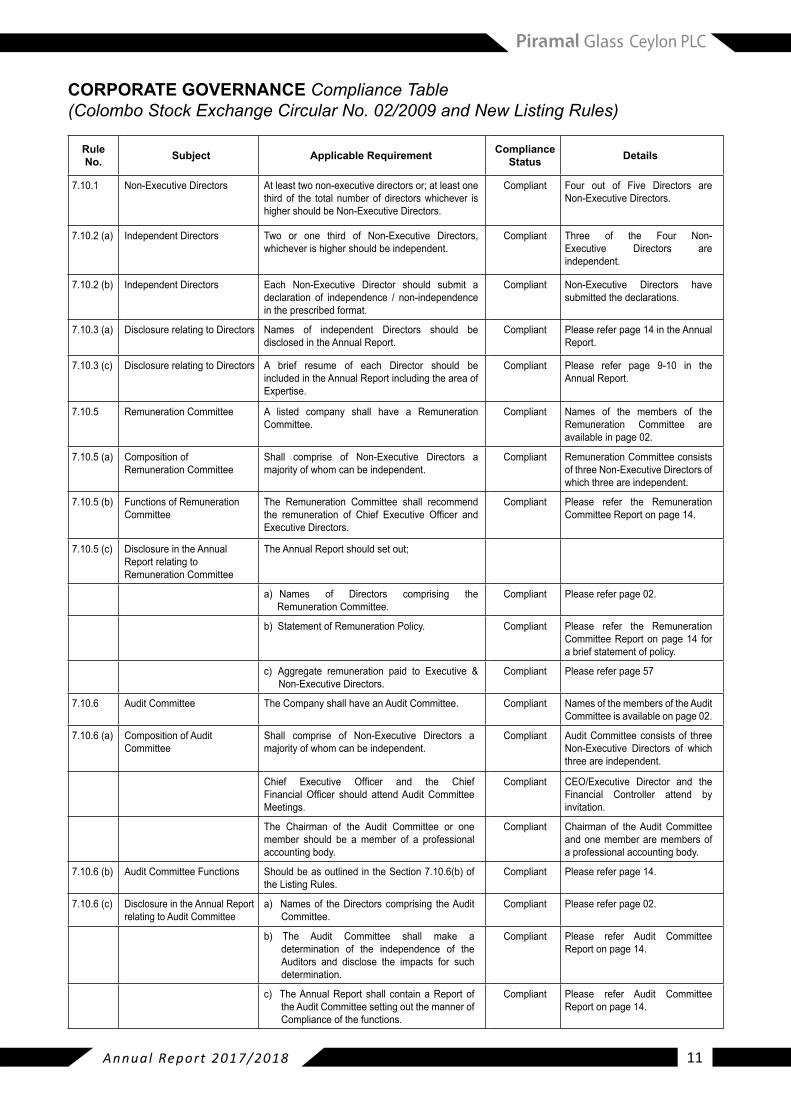
CORPORATE GOVERNANCE Compliance Table(Colombo Stock Exchange Circular No. 02/2009 and New Listing Rules)
Rule No. Subject Applicable Requirement Compliance
Status Details
7.10.1 Non-Executive Directors At least two non-executive directors or; at least one third of the total number of directors whichever is higher should be Non-Executive Directors.
Compliant Four out of Five Directors are Non-Executive Directors.
7.10.2 (a) Independent Directors Two or one third of Non-Executive Directors, whichever is higher should be independent.
Compliant Three of the Four Non- Executive Directors are independent.
7.10.2 (b) Independent Directors Each Non-Executive Director should submit a declaration of independence / non-independence in the prescribed format.
Compliant Non-Executive Directors have submitted the declarations.
7.10.3 (a) Disclosure relating to Directors Names of independent Directors should be disclosed in the Annual Report.
Compliant Please refer page 14 in the Annual Report.
7.10.3 (c) Disclosure relating to Directors A brief resume of each Director should be included in the Annual Report including the area of Expertise.
Compliant Please refer page 9-10 in the Annual Report.
7.10.5 Remuneration Committee A listed company shall have a Remuneration Committee.
Compliant Names of the members of the Remuneration Committee are available in page 02.
7.10.5 (a) Composition of Remuneration Committee
Shall comprise of Non-Executive Directors a majority of whom can be independent.
Compliant Remuneration Committee consists of three Non-Executive Directors of which three are independent.
7.10.5 (b) Functions of Remuneration Committee
The Remuneration Committee shall recommend the remuneration of Chief Executive Officer andExecutive Directors.
Compliant Please refer the Remuneration Committee Report on page 14.
7.10.5 (c) Disclosure in the Annual Report relating to Remuneration Committee
The Annual Report should set out;
a) Names of Directors comprising the Remuneration Committee.
Compliant Please refer page 02.
b) Statement of Remuneration Policy. Compliant Please refer the Remuneration Committee Report on page 14 for a brief statement of policy.
c) Aggregate remuneration paid to Executive & Non-Executive Directors.
Compliant Please refer page 57
7.10.6 Audit Committee The Company shall have an Audit Committee. Compliant Names of the members of the Audit Committee is available on page 02.
7.10.6 (a) Composition of Audit Committee
Shall comprise of Non-Executive Directors a majority of whom can be independent.
Compliant Audit Committee consists of three Non-Executive Directors of which three are independent.
Chief Executive Officer and the Chief Financial Officer should attendAudit CommitteeMeetings.
Compliant CEO/Executive Director and the Financial Controller attend by invitation.
The Chairman of the Audit Committee or one member should be a member of a professional accounting body.
Compliant Chairman of the Audit Committee and one member are members of a professional accounting body.
7.10.6 (b) Audit Committee Functions Should be as outlined in the Section 7.10.6(b) of the ListingRules.
Compliant Please refer page 14.
7.10.6 (c) Disclosure in the Annual Report relating to Audit Committee
a) Names of the Directors comprising the Audit Committee.
Compliant Please refer page 02.
b) The Audit Committee shall make a determination of the independence of the Auditors and disclose the impacts for such determination.
Compliant Please refer Audit Committee Report on page 14.
c) The Annual Report shall contain a Report of the Audit Committee setting out the manner of Compliance of the functions.
Compliant Please refer Audit Committee Report on page 14.
Annual Report 2017/201812
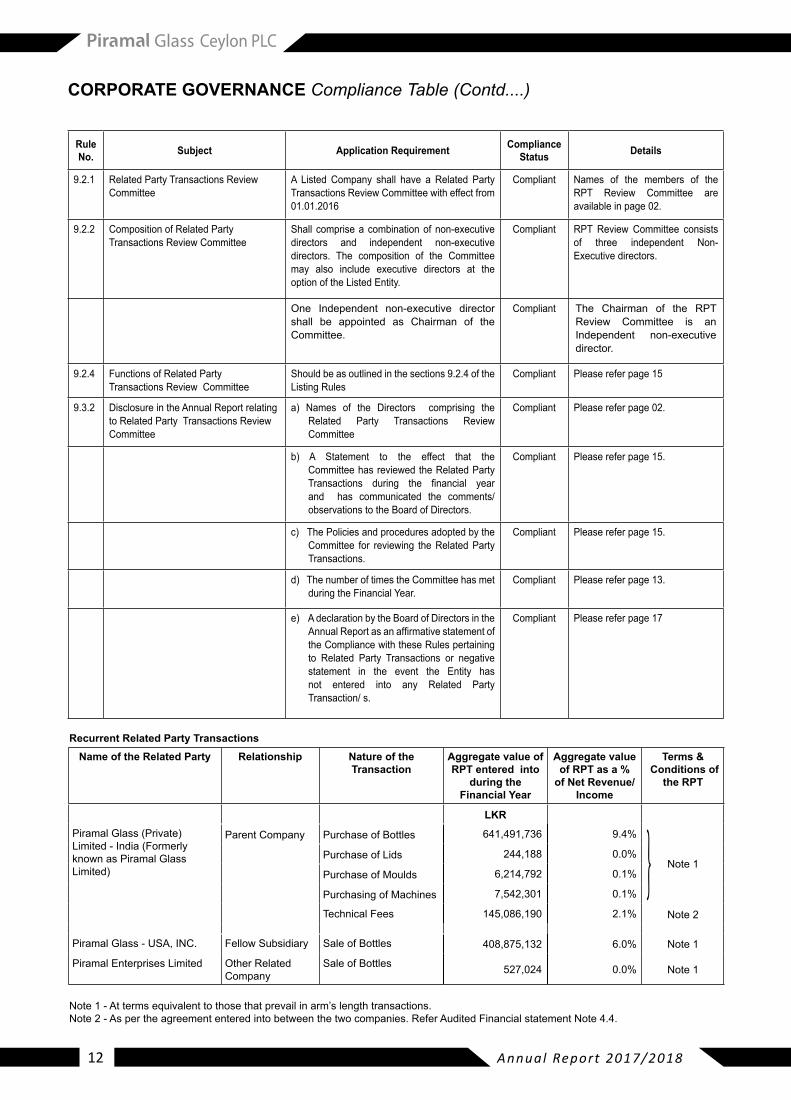
Rule No. Subject Application Requirement Compliance
Status Details
9.2.1 Related Party Transactions Review Committee
A Listed Company shall have a Related PartyTransactions Review Committee with effect from 01.01.2016
Compliant Names of the members of the RPT Review Committee are available in page 02.
9.2.2 Composition of Related Party Transactions Review Committee
Shall comprise a combination of non-executive directors and independent non-executive directors. The composition of the Committee may also include executive directors at the optionoftheListedEntity.
Compliant RPT Review Committee consists of three independent Non-Executive directors.
One Independent non-executive director shall be appointed as Chairman of the Committee.
Compliant The Chairman of the RPT Review Committee is an Independent non-executive director.
9.2.4 Functions of Related Party Transactions Review Committee
Should be as outlined in the sections 9.2.4 of the ListingRules
Compliant Please refer page 15
9.3.2 Disclosure in the Annual Report relating to Related Party Transactions Review Committee
a) Names of the Directors comprising the Related Party Transactions Review Committee
Compliant Please refer page 02.
b) A Statement to the effect that the Committee has reviewed the Related Party Transactions during the financial yearand has communicated the comments/ observations to the Board of Directors.
Compliant Please refer page 15.
c) The Policies and procedures adopted by the Committee for reviewing the Related Party Transactions.
Compliant Please refer page 15.
d) The number of times the Committee has met during the Financial Year.
Compliant Please refer page 13.
e) A declaration by the Board of Directors in the AnnualReportasanaffirmativestatementofthe Compliance with these Rules pertaining to Related Party Transactions or negative statement in the event the Entity has not entered into any Related Party Transaction/ s.
Compliant Please refer page 17
Recurrent Related Party TransactionsName of the Related Party Relationship Nature of the
TransactionAggregate value of RPT entered into
during the Financial Year
Aggregate value of RPT as a %
of Net Revenue/ Income
Terms & Conditions of
the RPT
LKRPiramal Glass (Private) Limited-India(Formerlyknown as Piramal Glass Limited)
Parent Company Purchase of Bottles 641,491,736 9.4%
Note 1 PurchaseofLids 244,188 0.0%
Purchase of Moulds 6,214,792 0.1%
Purchasing of Machines 7,542,301 0.1%
Technical Fees 145,086,190 2.1% Note 2
Piramal Glass - USA, INC. Fellow Subsidiary Sale of Bottles 408,875,132 6.0% Note 1
PiramalEnterprisesLimited Other Related Company
Sale of Bottles 527,024 0.0% Note 1
Note 1 - At terms equivalent to those that prevail in arm’s length transactions.Note 2 - As per the agreement entered into between the two companies. Refer Audited Financial statement Note 4.4.
CORPORATE GOVERNANCE Compliance Table (Contd....)
Annual Report 2017/2018 13
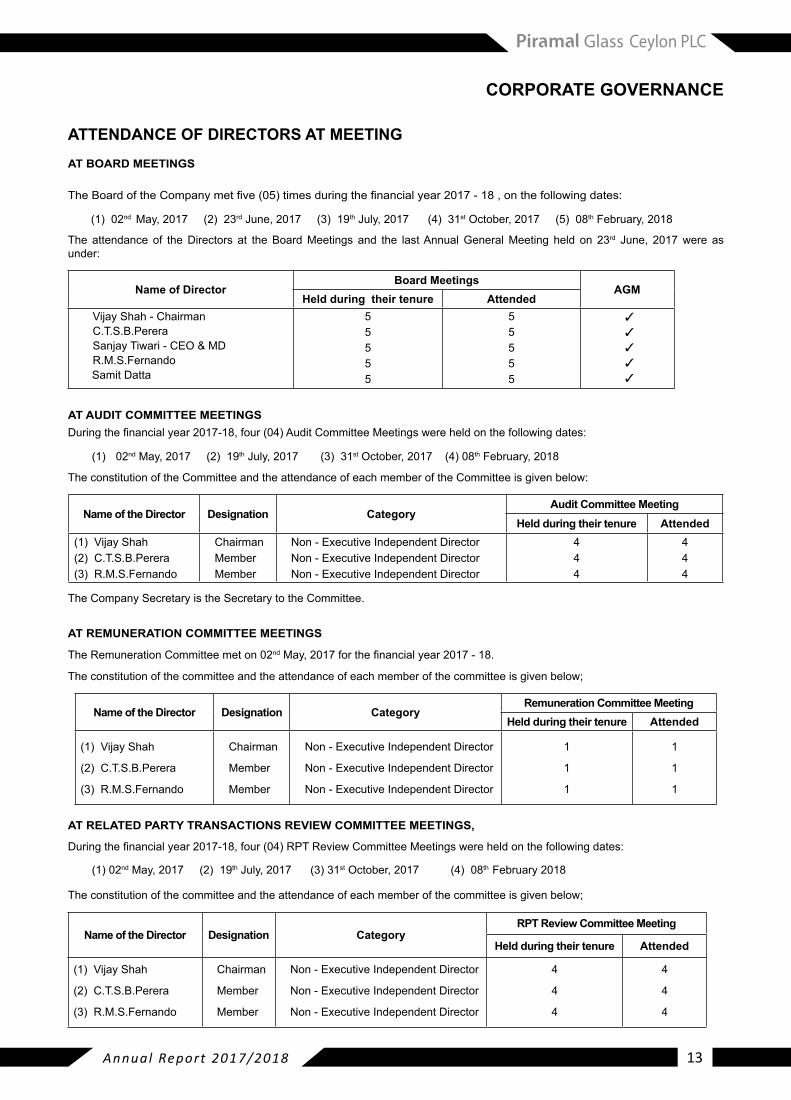
ATTENDANCE OF DIRECTORS AT MEETING
AT BOARD MEETINGS
TheBoardoftheCompanymetfive(05)timesduringthefinancialyear2017-18,onthefollowingdates:
(1) 02nd May, 2017 (2) 23rd June, 2017 (3) 19th July, 2017 (4) 31st October, 2017 (5) 08th February, 2018
The attendance of the Directors at the Board Meetings and the last Annual General Meeting held on 23rd June, 2017 were as under:
Name of DirectorBoard Meetings
AGMHeld during their tenure Attended
Vijay Shah - Chairman C.T.S.B.PereraSanjay Tiwari - CEO & MD R.M.S.FernandoSamit Datta
5 5 5 5 5
5 5 5 5 5
✓
✓
✓
✓
✓
AT AUDIT COMMITTEE MEETINGSDuringthefinancialyear2017-18,four(04)AuditCommitteeMeetingswereheldonthefollowingdates:
(1) 02nd May, 2017 (2) 19th July, 2017 (3) 31st October, 2017 (4) 08th February, 2018
The constitution of the Committee and the attendance of each member of the Committee is given below:
Name of the Director Designation CategoryAudit Committee Meeting
Held during their tenure Attended(1) Vijay Shah(2) C.T.S.B.Perera(3) R.M.S.Fernando
ChairmanMember Member
Non - Executive Independent Director Non - Executive Independent Director Non - Executive Independent Director
4 4 4
4 4 4
The Company Secretary is the Secretary to the Committee.
AT REMUNERATION COMMITTEE MEETINGS
The Remuneration Committee met on 02ndMay,2017forthefinancialyear2017-18.
The constitution of the committee and the attendance of each member of the committee is given below;
Name of the Director Designation CategoryRemuneration Committee Meeting
Held during their tenure Attended
(1) Vijay Shah
(2) C.T.S.B.Perera
(3) R.M.S.Fernando
Chairman
Member
Member
Non - Executive Independent Director
Non - Executive Independent Director
Non - Executive Independent Director
1
1
1
1
1
1
AT RELATED PARTY TRANSACTIONS REVIEW COMMITTEE MEETINGS,
Duringthefinancialyear2017-18,four(04)RPTReviewCommitteeMeetingswereheldonthefollowingdates:
(1) 02nd May, 2017 (2) 19th July, 2017 (3) 31st October, 2017 (4) 08th February 2018
The constitution of the committee and the attendance of each member of the committee is given below;
Name of the Director Designation CategoryRPT Review Committee Meeting
Held during their tenure Attended
(1) Vijay Shah
(2) C.T.S.B.Perera
(3) R.M.S.Fernando
Chairman
Member
Member
Non - Executive Independent Director
Non - Executive Independent Director
Non - Executive Independent Director
4
4
4
4
4
4
CORPORATE GOVERNANCE
Annual Report 2017/201814
REMUNERATION COMMITTEE REPORT
A Listed Company shall have a Remuneration Committee in conformity with the following requirements.
This committee shall comprise of a minimum of two independent non-executive directors (in instances where a company has only two directors on its Board); or Non-executive directors, a majority of whom shall be independent, whichever shall be higher. One non-executive director shall be appointed as Chairman of the Committee by the Board of Directors.
The Remuneration Committee is a sub-committee of the Board and the Company’s Remuneration Committee consists of three non-executive directors of which three are independent Directors.
The Remuneration Committee shall recommend the remuneration payabletotheExecutiveDirectorsandChiefExecutiveOfficerof the listed company and/or equivalent position thereof, to the board of the listed company, which will make the finaldetermination upon consideration of such recommendations.
The Committee has acted within the parameters set by its terms of reference.
The CEO/Executive Director attends the Committee meetings by invitation. However, he does not participate in any discussion pertaining to his remuneration.
The remuneration packages linked to the individual performances are aligned with the Company’s long-term strategy.
The Term “remuneration” shall make reference to cash and all non-cash benefits whatsoever received in considerationof employment with the listed company (excluding statutory entitlements such as Employees Provident Fund and Employees Trust Fund).
The aggregate remuneration paid to Executive and Non Executive Directors are disclosed in page 57. The members of the Remuneration Committee are disclosed in page 02.
Sgd. Vijay Shah Chairman
08th May 2018
INDEPENDENT DIRECTORS
The Independent directors are Dr.C.T.S.B. Perera, Mr.R.M.S.Fernando and Mr. Vijay Shah. The board is of the opinions that they are independent directors, notwithstanding the fact that they have been directors of the Company continuously for periods exceeding nine years. It has been so determined takingtoaccounttheexperiences,qualifications and the industry experiences they possess.
AUDIT COMMITTEE REPORT
A Listed Company shall have anAudit Committee. TheAuditCommittee is established for the purpose of assisting the Board infulfillingtheiroversightresponsibilitiesregardingtheintegrityofthe Financial Statements, risk management, internal control and compliance with legal & regulatory requirements, assessment of the independence and performance of the external auditors and internal audit function, make recommendations to the board pertaining to appointment, re-appointment and removal of external auditors and to approve the remuneration and terms of engagement of the external auditors.
The Audit Committee is formally constituted as a Sub-Committee of the Main Board, to which it is accountable.
Audit committee shall comprise of a minimum of two independent non-executive directors (in instances where a company has only two directors on its Board); or Non-executive directors, a majority of whom shall be independent, whichever shall be higher. One non-executive director shall be appointed as Chairman of the Committee by the Board of Directors.
The Company’s Audit Committee consists of three non-executive independent Directors. The members of the Audit Committee are disclosed in page 02.
Meetings of Audit CommitteeFour meetings were held during the year ended 31st March 2018. The Internal Auditors attended three of these meetings.
Internal Auditors
The internal audit function is outsourced to Messrs. KMPG Sri LankaafirmofCharteredAccountants.InternalAuditorsdirectlysubmitted theirfindings toAuditCommitteequarterlyand theirreports are made available to External Auditors.
External Auditors
The Audit committee reviews the independence and objectivity of the external auditors and conducts a formal review of effectiveness of the external audit process. The committee reviewed the non audit services and its impact on the independence of the external auditors. The Audit Committee has recommended to the Board of Directors that Messers Ernst & Young to be continued as the auditorsforthefinancialyearending31st March 2019.
Audit Committee PerformanceThe Annual Performance of Audit Committee was evaluated by other members of the Board of Directors and was deemed to be satisfactory.
Conclusion
The Audit Committee is satisfied that the effectiveness of theorganizational structure of the Company and of the implementation of the Company’s accounting policies and operational controls provide reasonable assurance that the affairs of the Company are managed in accordance with Company’s policies and that Company’s assets are properly accounted for and adequately safeguarded.
CORPORATE GOVERNANCE
Annual Report 2017/2018 15
RELATED PARTY TRANSACTIONS REVIEW COMMITTEE REPORT
AListedCompanyshallhaveaRelatedPartyTransactionsReviewCommitteeonamandatorybasiswitheffectfrom01st January 2016.The Rules relevanttoRPTReviewCommitteearestatedunder9.2oftheCSEListingRules.
The RPT Review Committee is established for the purpose of reviewing transfer of resources, services or obligations between related parties regardless of whether a price is charged.
Accordingtothesection9.3.2oftheListingRulestheListedEntityhastodisclosetheRelatedPartyTransactionsintheAnnualReportinthecaseofNon–recurrentRelatedPartyTransactions,ifaggregatevalueofthenon-recurrentRelatedPartyTransactionsexceeds10%oftheEquityor5%oftheTotalAssets,whicheverislower.InthecaseofRecurrentRelatedPartyTransactions,iftheaggregatevalueoftherecurrentRelatedPartyTransactionsexceeds10%ofthegrossrevenue/income(orequivalenttermintheIncomeStatementandintheCaseofgroupentityconsolidatedrevenue)aspertheLatestAuditedFinancialStatementstheListedEntity must disclose the aggregate value of the Related party Transactions entered into with the same Related Party. The formats aregivenintheListingRules.
The company has not entered into any Non-recurrent Related Party Transactions during the Financial year 2017-18. All the Recurrent Related Party Transactions entered by the company are disclosed in page 12 in the Annual Report.
The RPT Review Committee is a sub Committee of the Board and the Company’s RPT Review Committee shall comprise of a combination of non-executive directors and independent non-executive directors. The composition of the committee may also include executivedirectorsastheoptionoftheListedEntity.Oneindependentnon-executivedirectorshallbeappointedasChairmanofthecommittee.
The Company’s RPT Review Committee consists of three non-executive independent directors .The members of the RPT Review Committee are disclosed in page 02.
Meeting of the RPT Review Committee
The RPT Review Committee shall meet at least once a calendar quarter. The RPT Review Committee of the company has held four meetings for the quarter ended 31st March 2018.
TheRPTReviewCommitteehas reviewed theRelatedPartyTransactionsduring thefinancial yearandhascommunicated thecomments/ observations to the Board of Directors. The policies and Procedures adopted by the committee for reviewing the Related Party Transactions are set outasperthesection9.3.2(c)ofthenewListingRules.TheyareasFollows,
² A Comprehensive report is submitted by the CFO at the end of each quarter to the related party transaction review committee.
² The report consist of detailed information of sales, procurements and all other transactions that has occurred during the given period.
² The Parent Company - Piramal Glass (Private) Limited, India (PGPL), Piramal Glass USA (PG USA) and PiramalEnterprisesLimitedareconsideredasrelatedparties.PGUSAisa100%ownedsubsidiaryofPiramalGlass(Private)LimitedandPiramalEnterprisesLimitedisaotherrelatedpartycompany.
² The Activities and views of the committee have been communicated to the Board of Directors by tabling the minutes of the Committee Meetings.
Sgd. Vijay Shah Chairman
08th May 2018
CORPORATE GOVERNANCE
Annual Report 2017/201816
Risks are the uncertain events, which could have an adverse effect on the achievement of the organization’s operational and financial objectives. Risk Management is the practiceof managing the resources of the operation in such way to maintain an acceptable level of risk. The Board of Directors of the Company places special emphasis on the management of business risk, providing assurance that sound system of control are in place in order to manage and mitigate the potential impact of such risks.
PiramalGlassCeylonPLC,beingintheGlassManufacturingindustry is exposed to a multitude of risks.
Operational Risk
The Company has designed and implemented a sound system of internal control to prevent operational risks that may arise in day to day activities. The quality and effectiveness of such systems are subject to regular review by the Management and updated with appropriate changes where necessary to suit the changing business environment. Regular internal audits are carried out to ensure that these systems and procedures are being adhered to.
Credit Risk
Credit risk is the potential financial loss arising from the Company’s debtors defaulting or failing to pay for goods purchased from the Company within the agreed period. During the year Company was able to manage the Credit Risk whilst capitalizing the good long term relationship built up with the customers.
Liquidity Risk
Liquidity refers to theabilityoftheCompanytomeetfinancialobligations as they become due without affecting the normal operation. During the year under review Company has successfullymet itsallfinancialobligationswithoutaffectingits day to day operation.
Interest Rate Risk
The exposure to interest rate risk is managed successfully by negotiating better rates by offering sound security and making repayment of loans on time.
Legal Risk
Legalriskarisesfromlegalconsequencesofatransactionorany other legal implications which may result in unexpected losses to the Company. The Company has placed special emphasis on this and has set up of obtaining outside Experts’/ consultants’ opinion regularly.
Reputation Risk
In today’s environment, reputation has become an organization’s most valuable asset. The Company has recognized the need of maintaining good reputation and in order to protect itself ensure the compliance with all legal and statutory requirements and maintain high standard of ethics and increasing transparency.
Material Issues Pertaining to Employees and Industrial Relations Pertaining to the Entity (As per Rule No 7.6 (vii) of the Listing Rules of CSE)
There were no material issues pertaining to employees and industrial relations pertaining to the company that occurred during the year under review which needs to be disclosed.
MATERIAL foreseeable Risk Factors(As per Rule No 7.6 (VI) of the Listing Rules of the CSE)

Annual Report 2017/2018 17
The responsibilities of the Directors, in relation to the Financial Statements of Piramal Glass Ceylon PLC are set out in this Statement. The Auditors’ Report sets out the respective responsibilities of the Directors and the External Auditors relating to the Financial Statements and this statement provides additional information. The responsibilities of the Auditors, in relation to the Financial Statements, are set out in the Auditors’ Report on pages 20-23 of the Annual Report. The external auditors M/s Ernst & Young, appointed in accordance with the resolution passed at the last Annual General Meeting, were provided with every opportunity to undertake whatever inspections they consider appropriate to enable them to form their opinion onthefinancialstatements.
The directors are required by relevant statutory provisions to prepare Financial Statements for each financial year which give a true and fair view of the state of affairs of the company for that period. The Financial Statement for the year 2017/2018 prepared and presented in this Annual report have been prepared based on new Sri Lanka Accounting Standards (SLFRS) which came to effect from 01st January 2012, are in agreement with the underlying books of account and are in conformity with the requirements of the Sri Lanka Accounting Standards, Companies Act No. 7 of 2007, SriLankaAccountingandAuditingStandardsActNo.15of2000andtheNewListingRulesoftheColomboStockExchange.Theresponsibility of the Directors, in relation to the Financial Statements, is set out in the following statement.
Under section 151 (1) of the Companies Act No. 7 of 2007, the Directors of the Company have responsibilities for ensuring that the Company keeps proper books of account of all the transactions and prepares financial statements that give a true and fair viewof thestateofaffairsof theCompanyand theprofitor lossor incomeandexpenditure for theaccountingperiodending on that balance sheet date. The Directors consider that these Financial Statements have been prepared using appropriate accounting policies, applied consistently, and supported by reasonable and prudent judgments and estimates and is in compliance with applicable Sri Lanka Accounting Standards and provide the information required by the Companies Act, as relevant. Any change to accounting policies and reasons for such change, is disclosed in the “Notes to the Financial Statements”.
The Directors are responsible for keeping proper accounting records, and to take reasonable steps as far as practicable to ensure the accuracy and reliability of accounting records, to enable the preparation of financial statements. The Directors have general responsibilities to take reasonable steps to safeguard the assets of the Company and in this regard to give proper consideration to the establishment of appropriate internal control systems with a view of preventing and detecting fraud and other irregularities.
In discharging this responsibility the Directors have instituted a system of internal controls and a system for monitoring its effectiveness. The system of controls provide reasonable and not absolute assurance of safeguarding of Company’s assets,maintenanceofproperaccountingrecordsandthereliabilityoffinancialinformation.
The Board is fully committed to ensure the existence of an effective system of internal control and risk management within the Company and continuously reviews and evaluates the adequacy of and integrity of the systems.
The Directors confirm that the best of their knowledge, all statutory payments relating to employees and Government and other Statutory bodies that were due in respect of the company have been paid where relevant or provided for.
TheDirectors furtherconfirm that thecompany iscompliancewith theListingRulesPertaining toRelatedPartyTranslationsasmentionedinsection9.3.2oftheNewListingRules.ThecompanyhasnotenteredintoanyNon-recurrentRelatedPartyTransactionsduring the Financial year 2017-18. All the Recurrent Related Party Transactions entered by the company are disclosed in page 12 in the Annual Report.
The Directors believe, after reviewing the financial position and the cash flow of the Company, that the Company has adequate resources to continue in operation for the foreseeable future and therefore, these Financial Statements are prepared on a going concern basis.
The Directors are of the view that they have discharged the responsibilities as set out in this statement.
By order of the Board
SAGARIKA JAYASUNDERA CompanySecretary&SeniorManagerLegalPiramalGlassCeylonPLC
08th May 2018
DIRECTORS’ Responsibilities for the Preparation of Financial Statements

Annual get together
Supervisory Skill Development Workshop

CSR Project
Inter Company Cricket match
Rooftop Solar Power Generation Project Horana
Donation for flood at Horana
Annual Report 2017/201820
Annual Report 2017/2018 21
Annual Report 2017/201822
Annual Report 2017/2018 23
Annual Report 2017/201824
2018 2017Notes LKR LKR
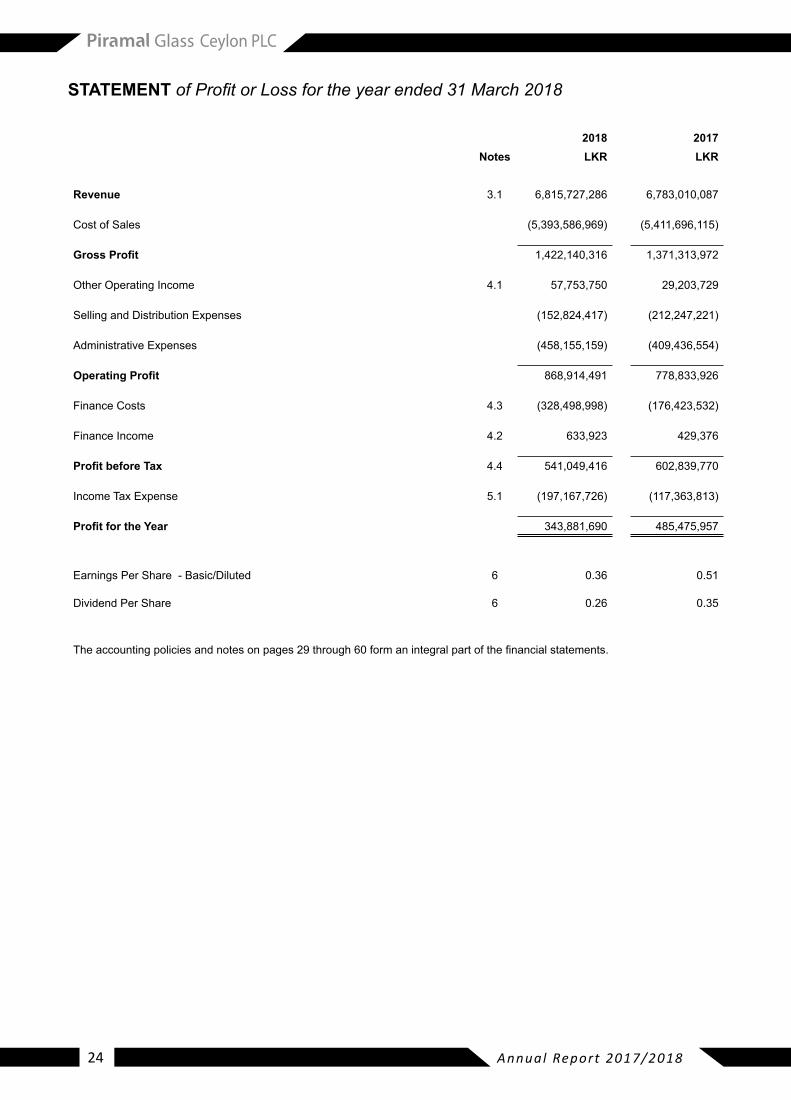
Revenue 3.1 6,815,727,286 6,783,010,087
Cost of Sales (5,393,586,969) (5,411,696,115)
Gross Profit 1,422,140,316 1,371,313,972
Other Operating Income 4.1 57,753,750 29,203,729
Selling and Distribution Expenses (152,824,417) (212,247,221)
Administrative Expenses (458,155,159) (409,436,554)
Operating Profit 868,914,491 778,833,926
Finance Costs 4.3 (328,498,998) (176,423,532)
Finance Income 4.2 633,923 429,376
Profit before Tax 4.4 541,049,416 602,839,770
Income Tax Expense 5.1 (197,167,726) (117,363,813)
Profit for the Year 343,881,690 485,475,957
Earnings Per Share - Basic/Diluted 6 0.36 0.51
Dividend Per Share 6 0.26 0.35
Theaccountingpoliciesandnotesonpages29through60formanintegralpartofthefinancialstatements.
STATEMENT of Profit or Loss for the year ended 31 March 2018
Annual Report 2017/2018 25
2018 2017Notes LKR LKR
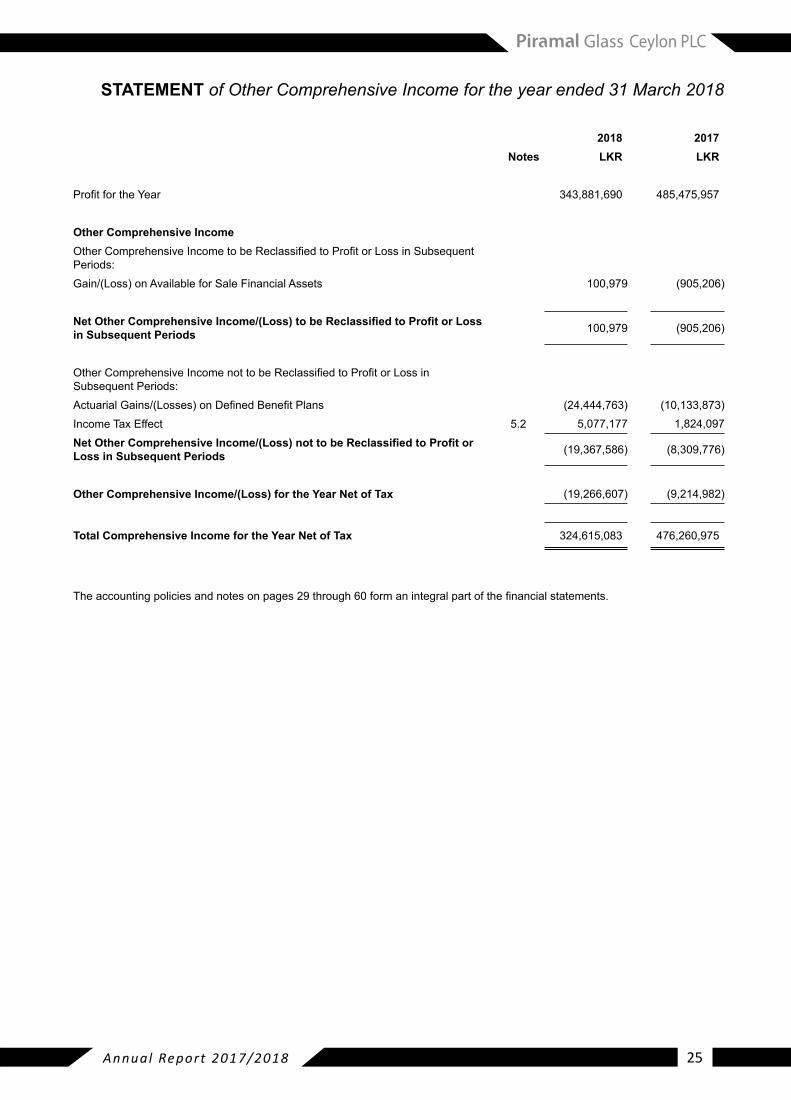
ProfitfortheYear 343,881,690 485,475,957
Other Comprehensive Income OtherComprehensiveIncometobeReclassifiedtoProfitorLossinSubsequentPeriods:Gain/(Loss)onAvailableforSaleFinancialAssets 100,979 (905,206)
Net Other Comprehensive Income/(Loss) to be Reclassified to Profit or Loss in Subsequent Periods 100,979 (905,206)
OtherComprehensiveIncomenottobeReclassifiedtoProfitorLossin Subsequent Periods:ActuarialGains/(Losses)onDefinedBenefitPlans (24,444,763) (10,133,873)Income Tax Effect 5.2 5,077,177 1,824,097 Net Other Comprehensive Income/(Loss) not to be Reclassified to Profit or Loss in Subsequent Periods (19,367,586) (8,309,776)
Other Comprehensive Income/(Loss) for the Year Net of Tax (19,266,607) (9,214,982)
Total Comprehensive Income for the Year Net of Tax 324,615,083 476,260,975
Theaccountingpoliciesandnotesonpages29through60formanintegralpartofthefinancialstatements.
STATEMENT of Other Comprehensive Income for the year ended 31 March 2018

Annual Report 2017/201826
STATEMENT of Financial Position as at 31 March 2018
2018 2017ASSETS Notes LKR LKR Non-Current AssetsProperty, Plant and Equipment 7 6,020,760,600 6,177,790,707 Prepaid lease rent 8 22,830,777 23,687,732 Available for Sale Investments 9.1 4,752,275 4,651,296 Other Receivables 11 2,091,667 3,451,243
6,050,435,320 6,209,580,978 Current AssetsInventories 10 1,686,376,741 1,445,845,147Trade and Other Receivables 11 1,513,405,957 1,097,884,692 Prepayments 7,334,717 6,702,597Income Tax Receivable 69,087,200 32,091,154 Cash and Short Term Deposits 12 121,953,785 273,599,499
3,398,158,399 2,856,123,089Total Assets 9,448,593,719 9,065,704,067
EQUITY AND LIABILITIESCapital and ReservesStated Capital 13 1,526,407,485 1,526,407,485 Reserves 14 105,023,477 129,467,811 Retained Earnings 2,632,841,074 2,555,349,350 Total Equity 4,264,272,036 4,211,224,646
Non-Current LiabilitiesInterestBearingLoansandBorrowings 9.2 1,990,750,000 2,719,151,788 DeferredTaxLiabilities 5.4 495,058,523 276,971,448 EmployeeBenefitLiability 15 175,563,223 142,441,079
2,661,371,747 3,138,564,315 Current Liabilities Trade and Other Payables 16 835,794,354 922,566,065Dividends payable 17 49,221,020 43,890,376 InterestBearingLoansandBorrowings 9.2 1,637,934,563 749,458,665
2,522,949,937 1,715,915,106 Total Equity and Liabilities 9,448,593,719 9,065,704,067
ThesefinancialstatementsareincompliancewiththerequirementsoftheCompaniesActNo.07of2007.
……………………………
Niloni BotejuFinancial Controller
TheBoardofDirectorsisresponsibleforthesefinancialstatements.SignedforandonbehalfoftheBoardby:
……………………………..Sanjay Tiwari
CEO/Executive Director
…………………………….. C.T.S.B. Perera
Director
08 May 2018Colombo
Theaccountingpoliciesandnotesonpages29through60formanintegralpartofthefinancialstatements.

Annual Report 2017/2018 27
Stated Capital
Revaluation Reserves
Retained Earnings
Available for Sale Reserve
Total
LKR LKR LKR LKR LKR
As at 01 April 2016 1,526,407,485 125,886,317 2,410,444,854 4,755,143 4,067,493,799
ProfitfortheYear - - 485,475,957 - 485,475,957
Revaluation Impact Eliminated on Disposal of Property, Plant and Equipment
- (268,443) 268,443 - -
Other Comprehensive Income - - (8,309,776) (905,206) (9,214,982)
Total Comprehensive Income - (268,443) 477,434,624 (905,206) 476,260,975
Dividends Paid - - (332,530,128) - (332,530,128)
As at 31 March 2017 1,526,407,485 125,617,874 2,555,349,350 3,849,937 4,211,224,646
ProfitfortheYear - - 343,881,690 - 343,881,690
Other Comprehensive Income - - (19,367,586) 100,979 (19,266,607)
Total Comprehensive Income - - 324,514,104 100,979 324,615,083
Deferred Tax Effect - (24,545,313) - - 24,545,313
Dividends Paid - - (247,022,381) - (247,022,381)
As at 31 March 2018 1,526,407,485 101,072,561 2,632,841,074 3,950,916 4,264,272,036
Theaccountingpoliciesandnotesonpages29through60formanintegralpartofthefinancialstatements.
STATEMENT of Changes in Equity for the year ended 31 March 2018
Annual Report 2017/201828
2018 2017Notes LKR LKR
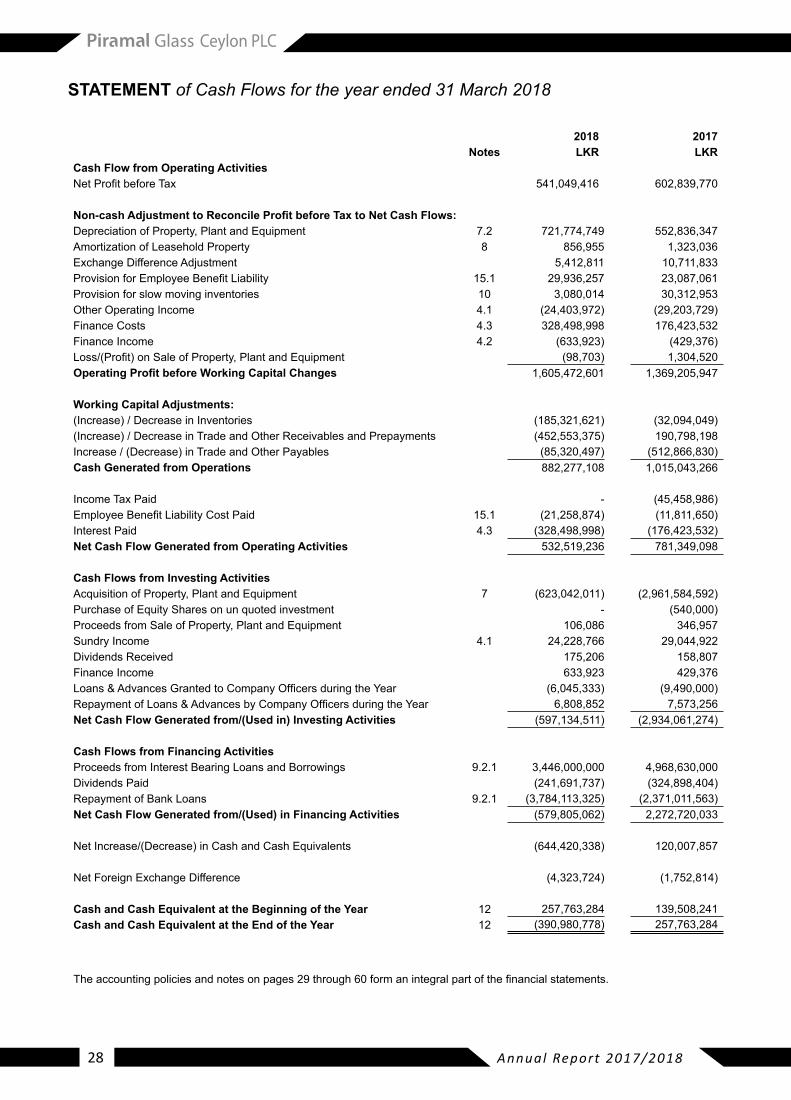
Cash Flow from Operating ActivitiesNetProfitbeforeTax 541,049,416 602,839,770
Non-cash Adjustment to Reconcile Profit before Tax to Net Cash Flows:Depreciation of Property, Plant and Equipment 7.2 721,774,749 552,836,347 AmortizationofLeaseholdProperty 8 856,955 1,323,036 Exchange Difference Adjustment 5,412,811 10,711,833 ProvisionforEmployeeBenefitLiability 15.1 29,936,257 23,087,061 Provision for slow moving inventories 10 3,080,014 30,312,953Other Operating Income 4.1 (24,403,972) (29,203,729)Finance Costs 4.3 328,498,998 176,423,532 Finance Income 4.2 (633,923) (429,376)Loss/(Profit)onSaleofProperty,PlantandEquipment (98,703) 1,304,520 Operating Profit before Working Capital Changes 1,605,472,601 1,369,205,947
Working Capital Adjustments:(Increase) / Decrease in Inventories (185,321,621) (32,094,049)(Increase) / Decrease in Trade and Other Receivables and Prepayments (452,553,375) 190,798,198 Increase / (Decrease) in Trade and Other Payables (85,320,497) (512,866,830)Cash Generated from Operations 882,277,108 1,015,043,266
Income Tax Paid - (45,458,986)EmployeeBenefitLiabilityCostPaid 15.1 (21,258,874) (11,811,650)Interest Paid 4.3 (328,498,998) (176,423,532)Net Cash Flow Generated from Operating Activities 532,519,236 781,349,098
Cash Flows from Investing ActivitiesAcquisition of Property, Plant and Equipment 7 (623,042,011) (2,961,584,592)Purchase of Equity Shares on un quoted investment - (540,000)Proceeds from Sale of Property, Plant and Equipment 106,086 346,957 Sundry Income 4.1 24,228,766 29,044,922 Dividends Received 175,206 158,807 Finance Income 633,923 429,376Loans&AdvancesGrantedtoCompanyOfficersduringtheYear (6,045,333) (9,490,000)RepaymentofLoans&AdvancesbyCompanyOfficersduringtheYear 6,808,852 7,573,256 Net Cash Flow Generated from/(Used in) Investing Activities (597,134,511) (2,934,061,274)
Cash Flows from Financing ActivitiesProceedsfromInterestBearingLoansandBorrowings 9.2.1 3,446,000,000 4,968,630,000Dividends Paid (241,691,737) (324,898,404)RepaymentofBankLoans 9.2.1 (3,784,113,325) (2,371,011,563)Net Cash Flow Generated from/(Used) in Financing Activities (579,805,062) 2,272,720,033
Net Increase/(Decrease) in Cash and Cash Equivalents (644,420,338) 120,007,857
Net Foreign Exchange Difference (4,323,724) (1,752,814)
Cash and Cash Equivalent at the Beginning of the Year 12 257,763,284 139,508,241Cash and Cash Equivalent at the End of the Year 12 (390,980,778) 257,763,284
Theaccountingpoliciesandnotesonpages29through60formanintegralpartofthefinancialstatements.
STATEMENT of Cash Flows for the year ended 31 March 2018
Annual Report 2017/2018 29
NOTES to the Financial Statement Year ended 31 March, 2018
1. CORPORATE INFORMATION
1.1 General
PiramalGlassCeylonPLC(“Company”)isapubliclimitedliabilityCompanyincorporatedanddomiciledinSriLankaandlistedintheColomboStockExchange.TheregisteredofficeoftheCompanyandprincipalplaceofbusinessislocated at No. 148, Maligawa Road, Borupana, Ratmalana and the production facility is located in Horana.
1.2 Principal Activities and Nature of Operations
During the year, the principal activity of the Company was the manufacturing and sale of glass bottles.
1.3 Parent Entity and Ultimate Parent Entity
TheCompany’sparentundertakingisPiramalGlassPrivateLimited(FormerlyknownasPiramalGlassLimited),which is incorporated in India.
1.4 Directors’ Responsibility Statement
The Board of Directors is responsible for Financial Statements of the company as per Sri Lanka Accounting Standards and the provisions of the Companies Act No 7 of 2007.
1.5 Date of Authorization for Issue
ThefinancialstatementsofPiramalGlassCeylonPLCfortheyearended31March2018wereauthorizedforissuein accordance with a resolution of the Board of Directors on 08 May 2018.
2. BASIS OF PREPARATION
2.1 Statement of Compliance
TheFinancialStatementsoftheCompany,whichcomprisetheStatementofFinancialPosition,StatementofProfitorLoss,StatementofComprehensiveIncome,StatementofChangesinEquity,StatementofCashFlowsandNotestotheFinancialStatementshavebeenpreparedandpresentedinaccordancewithSriLankaAccountingStandards(SLFRSsandLKASs)laiddownbytheInstituteofCharteredAccountantsofSriLankaandincompliancewiththerequirements of the Companies Act No 7 of 2007.
2.1.1 Basis of Measurement
The Financial Statements of the Company have been prepared on the historical cost basis, except for the following items in the Statement of Financial Position:
÷ Available for sale investments are measured at fair value
÷ TheliabilityforDefinedBenefitObligationsareactuariallyvaluedandrecognizedatthepresentvalue
2.1.2 Going Concern
TheDirectorshavemadeanassessmentoftheCompany’sabilitytocontinueasagoingconcernandaresatisfiedthat it has the resources to continue in business for the foreseeable future. Furthermore, Board is not aware of any materialuncertaintiesthatmaycastsignificantdoubtupontheCompany’sabilitytocontinueasagoingconcernandthey do not intend either to liquidate or to cease operations of the Company. Therefore, the Financial Statements continue to be prepared on the going concern basis.
2.2 Functional and Presentation Currency
TheFinancialStatementsarepresentedinSriLankaRupees,whichistheCompany’sfunctionalandpresentationcurrency. There was no change in the Company’s presentation and functional currency during the current year.
2.3 Comparative Information
The accounting policies have been consistently applied by the Company and, are consistent with those used in the previousyear.Previousyear’sfiguresandphraseshavebeenrearrangedwhenevernecessarytoconformtothecurrent presentation.
Annual Report 2017/201830
2.4 SIGNIFICANT ACCOUNTING JUDGMENTS, ESTIMATES AND ASSUMPTIONS
Estimates and Assumptions
ThepreparationofFinancialStatementsoftheCompanyinconformitywithSriLankaAccountingStandards,requiresthe management to make judgments, estimates and assumptions that affect the application of accounting policies and the reported amounts of assets, liabilities, income and expenses. Uncertainty about these assumptions and estimates could result in outcomes that require a material adjustment to the carrying amount of assets or liabilities affected in future periods.
Estimates and assumptions are reviewed on an ongoing basis. Revisions to accounting estimates are recognized in the period in which the estimate is revised and in any future periods affected.
Themostsignificantareasofestimation,uncertaintyandcriticaljudgmentsinapplyingaccountingpoliciesthathavemostsignificanteffectontheamountsrecognizedintheFinancialStatementsoftheCompanyareasfollows:
a) Employee Benefit Liability
Thecostaswellasthepresentvalueofdefinedbenefitplans-gratuityisdeterminedusingActuarialValuations.TheActuarial Valuation involves making assumptions about discount rates, future salary increases and other important relateddata.Duetothelongtermnatureofemployeebenefits,suchestimatesaresubjecttosignificantuncertainty.Further details of assumptions together with an analysis of their sensitivity as carried out by the management in relation to the above key assumptions and the results of the sensitivity analysis are given in Note 15.2 & 15.3.
(b) Transfer Pricing Regulation
The Company is subject to income taxes and other taxes including transfer pricing regulations. The management has taken steps to carry out the required study in respect of transfer pricing regulation and has accordingly used critical judgments and estimates in applying the regulations in aspects including but not limited to estimation of the respective arm’s length prices and selection of appropriate pricing mechanism. The current tax charge is subject to such judgments. Differences between estimated income tax charge and actual payable may arise as a result of management’s interpretation and application of transfer pricing regulation.
(c) Deferred Taxes
The Company is liable to Income Tax on the manufacturing operations from 9th December 2012. Significantjudgments were required to determine the taxable and deductible temporary differences which extend beyond the tax exemption period.
Accordingly, the Company recognized assets and liabilities for deferred taxes based on such estimates of tax consequencescommencingfrom9thDecember2012.Wherethefinaltaxoutcomeofthesemattersisdifferentfromthe amounts recorded, such differences will impact the income and deferred tax amounts in the period in which the determination is made.
Deferredtaxassetsarerecognizedinrespectoftaxlossestotheextentthatitisprobablethatfuturetaxableprofitswill be available against which such tax losses can be utilized. Judgement is required to determine the amount of deferredtaxassetsthatcanberecognized,baseduponthelikelytimingandleveloffuturetaxableprofits,togetherwith the future tax-planning strategies.
(d) Impairment losses on Trade & Other Receivables
TheCompanyreviewsitsindividuallysignificantReceivablesateachreportingdatetoassesswhetheranimpairmentlossshouldberecordedintheStatementofProfitorLoss.Inparticular,management’sjudgmentisrequiredintheestimationoftheamountandtimingoffuturecashflowswhendeterminingtheimpairmentloss.Theseestimatesare based on assumptions about a number of factors and actual results may differ, resulting in future changes to the impairment allowance.
Receivables thathavebeenassessed individuallyand foundnot tobe impairedandall individually insignificantReceivables are then assessed collectively, in groups of assets with similar risk characteristics, to determine whether provision should be made due to incurred loss events for which there is objective evidence, but the effects of which are not yet evident.
The impairment loss on Trade & Other Receivables is disclosed in Notes 2.5.8.2 and 11.2.
NOTES to the Financial Statements Year ended 31 March, 2018
Annual Report 2017/2018 31
(e) Useful Life-time of the Property, Plant and Equipment
As described in 2.5.4 below The Company review the residual values, useful lives and methods of depreciation of Property, Plant and Equipment at each reporting date. Judgment of the management is exercised in the estimation of these values, rates, methods and hence they are subject to uncertainty.
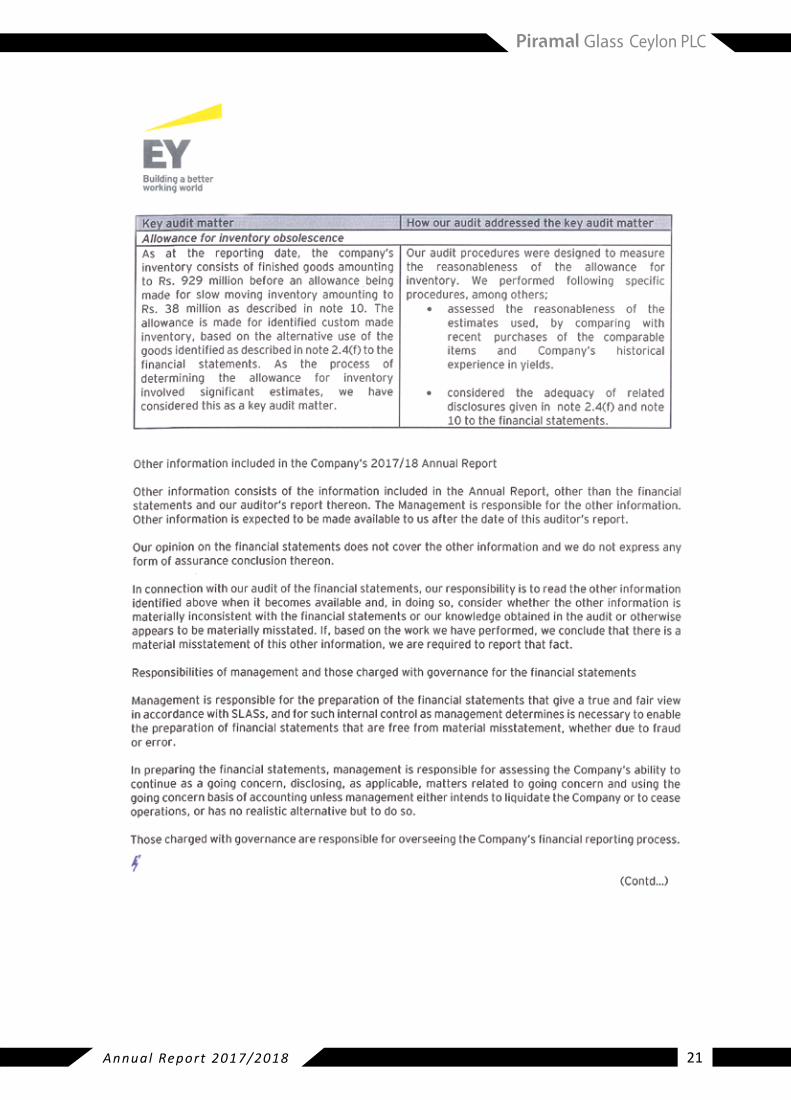
(f) Allowance for Slow moving inventories:
TheManagementofthecompanyhasidentifiedandallowanceforslowmovinginventoryasdisclosedinNote10tothefinancialstatementsbasedonthealternativeuseoftheinventory.Theavailablealternativeuseistoscrapthebottles and use it as cullets in producing new bottles. Recent bulk purchase prices for cullets which is in the range of Rs.2.50 to Rs.8.75 per kilogram and yield of cullet per used bottle which varies with the weight of the bottle had been used as a basis.
As Management uses present conditions and historical information as the a basis to determine the future recoverability, actualfuturelossesoninventoriescouldvaryfromtheallowancemadeinthesefinancialstatements.
2.5 SUMMARY OF SIGNIFICANT ACCOUNTING POLICIES
ThefollowingarethesignificantaccountingpoliciesappliedbytheCompanyinpreparingitsfinancialstatements.
2.5.1 Foreign Currency Translation
Transactions in foreign currencies are initially recorded by the Company at the functional currency spot rate at the datethetransactionfirstqualifiesforrecognition.Monetaryassetsandliabilitiesdenominatedinforeigncurrenciesare retranslated at the functional currency spot rate of exchange ruling at the reporting date. All differences are recognisedinprofitorloss.
Non-monetary items that are measured in terms of historical cost in a foreign currency are translated using the exchange rates as at the dates of the initial transactions. Non-monetary items measured at fair value in a foreign currency are translated using the exchange rates at the date when the fair value was determined.
2.5.2 Revenue Recognition
Revenue is recognized to theextent that it isprobable that theeconomicbenefitswillflow to theCompanyandthe revenue and associated costs incurred or to be incurred can be reliably measured, regardless of when the payment is being made. Revenue is measured at the fair value of the consideration received or receivable, net of tradediscountsandsalestaxes.Thefollowingspecificrecognitioncriteriaareusedforthepurposeofrecognitionofrevenue.
a) Sale of Goods
Revenuefromsaleofgoodsisrecognizedwhenthesignificantrisksandrewardsofownershipofthegoodshavepassed to the buyer, usually on delivery of the goods; with the Company not retaining neither continuing managerial involvement to the degree usually associated with ownership, nor effective control over the goods sold.
b) Interest Income
Interest is recognised on a time proportion basis that takes in to account the effective interest rate on asset.
c) Dividends
Revenue is recognized when the Company’s right to receive the payment is established, which is generally when shareholders approve the dividend.
d) Others
Other income is recognized on an accrual basis.
Net gains and losses on the disposal of property, plant & equipment have been accounted for in the income statement, having deducted from proceeds on disposal, the carrying amount of the assets and related selling expenses. On disposalof revaluedproperty,plantandequipmentbefore thedateof transition toSLFRS,amount remaining inrevaluation reserve relating to that asset is transferred directly to retained earnings.
NOTES to the Financial Statements Year ended 31 March, 2018
Annual Report 2017/201832
Gains and losses arising from incidental activities to main revenue generating activities and those arising from a group of similar transactions which are not material, are aggregated, reported and presented on a net basis.
2.5.3 Taxation
Current Income Tax
The provision for income tax is based on the elements of income and expenditure as reported in the financialstatements and computed in accordance with the provisions of the Inland Revenue Act No 10 of 2006 and the amendments there to.
Pursuant to agreement dated 19 July 2006 entered into with Board of Investment, the Company is exempted from income tax on the manufacturing operations for a period of 5 years from 10 December 2007. This exemption expired on 9 December 2012.
Upontheexpirationofabovetaxexemptionperiod,theCompany’sprofitsarisingfromManufacturingOperationsaretaxableataconcessionaryrateof10%foraperiodof2yearsandattherateof20%thereafter.
Current income tax assets and liabilities for the current and prior periods are measured at the amount expected to be recovered from or paid to the Commissioner General of Inland Revenue. The tax rates and tax laws used to compute the amount are those that are enacted or substantively enacted by the reporting date.
Current income tax relating to items recognized directly in equity is recognized in equity and not in the income statement. Management periodically evaluates positions taken in the tax returns with respect to situations in which applicable tax regulations are subject to interpretation and establishes provisions where appropriate.
Deferred Tax
Deferred tax is provided, using the liability method, on temporary differences at the reporting date between the tax basesofassetsandliabilitiesandtheircarryingamountsforfinancialreportingpurposesatthereportingdate.
Deferred tax liabilities are recognised for all taxable temporary differences, except, when the deferred income tax liability arises from the initial recognition of an asset or liability in a transaction that is not a business combination and, atthetimeofthetransaction,affectsneithertheaccountingprofitnortaxableprofitorloss.
Deferred income tax assets are recognised for all deductible temporary differences, carry-forward of unused tax assetsandunusedtaxlosses,totheextentthatitisprobablethattaxableprofitwillbeavailableagainstwhichthedeductible temporary differences, and the carry-forward of unused tax credits and unused tax losses can be utilised, except, when the deferred tax asset relating to the deductible temporary difference arises from the initial recognition of an asset or liability in a transaction that is not a business combination and, at the time of the transaction, affects neithertheaccountingprofitnortaxableprofitorloss.
The carrying amount of deferred tax assets is reviewed at each reporting date and reduced to the extent that it is no longerprobablethatsufficienttaxableprofitwillbeavailabletoallowallorpartofthedeferredtaxassettobeutilised.Unrecognised deferred tax assets are reassessed at each reporting date and are recognised to the extent that it has becomeprobablethatfuturetaxableprofitswillallowthedeferredtaxassettoberecovered.
Deferred tax assets and liabilities are measured at the tax rates that are expected to apply in the year when the asset is realised or the liability is settled, based on tax rates (and tax laws) that have been enacted or substantively enacted at the reporting date.
Deferredtaxrelatingtoitemsrecognizedoutsideprofitorlossisrecognizedoutsideprofitorloss.Deferredtaxitemsare recognized in correlation to the underlying transaction either in other comprehensive income or directly in equity.
Deferred tax assets and deferred tax liabilities are offset if a legally enforceable right exists to set off current tax assets against current income tax liabilities and the deferred taxes relate to the same taxable entity and the same taxation authority.
NOTES to the Financial Statements Year ended 31 March, 2018
Annual Report 2017/2018 33
2.5.4 Property, Plant and Equipment
Property, plant and equipment is stated at cost, excluding the costs of day to day servicing, less accumulated depreciation and accumulated impairment in value. Such cost includes the cost of replacing parts of the property, plant and equipment when that cost is incurred, if the recognition criteria are met.
Anitemofproperty,plantandequipmentisderecognizedupondisposalorwhennofutureeconomicbenefitsareexpected from its use or disposal. Any gain or loss arising on derecognition of the asset (calculated as the difference between the net disposal proceeds and the carrying amount of the asset) is included in the income statement in the year the asset is derecognized.
The asset’s residual values, useful lives and methods of depreciation are reviewed, and adjusted if appropriate, at eachfinancialyearend.
CapitalexpenditureincurredinrelationtofixedassetswhicharenotcompletedasattheReportingdateareshownas capital work-in-progress and is stated at cost. On completion, the related assets are transferred to property, plant and equipment. Depreciation on such assets commences when the assets are ready for their intended use.
2.5.5 Prepaid Lease Rent
Operating leases,where the lessoreffectively retainssubstantiallyallof the riskandbenefitsofownershipoverthetermoftheleaseareclassifiedasoperatingleases.OperatingleasepaymentsarerecognizedasanoperatingexpenseintheStatementofProfitorLossonastraight-linebasisovertheleaseterm.
2.5.6 Borrowing Costs
Borrowing costs are recognized as an expense in the year in which they are incurred, except to the extent where borrowing costs that are directly attributable to the acquisition, construction, or production of an asset that necessarily takes a substantial period of time to get ready for its intended use or sale, are capitalized as part of that asset. Borrowing costs consist of interest and other costs that an entity incurs in connection with the borrowing of funds.
The interest capitalized is calculated using Company’s weighted average cost of borrowing after adjusting for borrowingsassociatedwithspecificdevelopments.Whereborrowingsareassociatedwithspecificdevelopments,the amounts capitalized is the gross interest incurred on those borrowings less any investment income arising on their temporary investments. Interest is capitalized from the commencement of the development work until the dateofpracticalcompletion.Thecapitalizationoffinancecostsissuspendedifthereareprolongedperiodswhendevelopment activity is interrupted. Interest is also capitalized on the purchase cost of a site of property acquired specifically fordevelopment,butonlywhereactivitiesnecessary toprepare theasset for redevelopmentsare inprogress.
2.5.7 Intangible Assets
Computer Software
Acquired computer software licenses are capitalized on the basis of the costs incurred to acquire and bring to use thespecificsoftware.Thesecostsareamortizedovertheirestimatedusefullifeof8years.Costsassociatedwithmaintaining computer software programs are recognized as an expense when incurred.
Intangible assets acquired separately are measured on initial recognition at cost. Following initial recognition, intangible assets are carried at cost less any accumulated amortization and any accumulated impairment losses. Internally generated intangible assets, excluding capitalized development costs, are not capitalized and expenditure isreflectedintheincomestatementintheyearinwhichtheexpenditureisincurred.
Theusefullivesofintangibleassetsareassessedtobeeitherfiniteorinfinite.
Intangibleassetswithfinitelivesareamortizedovertheirusefuleconomiclivesandassessedforimpairmentwheneverthere is an indication that the intangible asset may be impaired. The amortization period and the amortization method foranintangibleassetwithafiniteusefullifearereviewedatleastattheendofeachreportingperiod.Changesintheexpectedusefullifeortheexpectedpatternofconsumptionoffutureeconomicbenefitsembodiedintheassetis accounted for by changing the amortization period or method, as appropriate, and are as changes in accounting estimates.
NOTES to the Financial Statements Year ended 31 March, 2018
Annual Report 2017/201834
Theamortizationexpenseonintangibleassetswithfinitelivesisrecognizedintheincomestatementintheexpensecategory consistentwith the function of the intangible assets. Intangible assetswith infinite useful lives are notamortized, but are tested for impairment annually, either individually or at the cash-generating unit level. The assessmentofindefinitelifeisreviewedannuallytodeterminewhethertheindefinitelifecontinuestobesupportable.Ifnot,thechangeinusefullifefromindefinitetofiniteismadeonaprospectivebasis.
Gains or losses arising from derecognition of an intangible asset are measured as the difference between the net disposal proceeds and the carrying amount of the asset and are recognized in the income statement when the asset is derecognized.
2.5.8 Financial Instruments - Initial Recognition and Subsequent Measurement
2.5.8.1 Financial Assets
Initial Recognition and Measurement
FinancialassetswithinthescopeofLKAS39areclassifiedasfinancialassetsatfairvaluethroughprofitorloss,loansandreceivables,held-to-maturityinvestments,available-for-salefinancialassets,orasderivativesdesignatedashedging instruments inaneffectivehedge, asappropriate.TheCompanydetermines the classificationof itsfinancialassetsatinitialrecognition.
Allfinancialassetsarerecognizedinitiallyatfairvalueplus,inthecaseofassetsnotatfairvaluethroughprofitorloss, directly attributable transaction costs.
Purchaseorsaleoffinancialassetsthatrequiredeliveryofassetswithinatimeframeestablishedbyregulationorconvention in the marketplace (regular way trades) are recognized on the trade date, i.e., the date that the Company commits to purchase or sell the asset.
TheCompany’sfinancialassetsincludetradeandotherreceivables,loansandotherreceivablesandquotedandnon-quoted equity instruments.
Subsequent Measurement
Thesubsequentmeasurementoffinancialassetsdependsontheirclassificationasdescribedbelow:
a) Financial Assets at Fair Value through Profit or Loss
Financial assetsat fair value throughprofit or loss includefinancial assetsheld for tradingandfinancial assetsdesignatedupon initial recognitionat fair value throughprofitor loss.Financialassetsareclassifiedasheld fortrading if they are acquired for the purpose of selling or repurchasing in the near term. This category includes derivativefinancialinstrumentsenteredintobytheCompanythatarenotdesignatedashedginginstrumentsinhedgerelationshipsasdefinedbyLKAS39.Derivatives,includingseparatedembeddedderivativesarealsoclassifiedasheld for trading unless they are designated as effective hedging instruments.
Financialassetsatfairvaluethroughprofitandlossarecarriedinthestatementoffinancialpositionatfairvaluewithchangesinfairvaluerecognizedinfinanceincomeorfinancecostsintheincomestatement.
TheCompanyhasnotdesignatedanyfinancialassetsuponinitialrecognitionasatfairvaluethroughprofitorloss.
b) Loans and Receivables
Loansandreceivablesarenon-derivativefinancialassetswithfixedordeterminablepaymentsthatarenotquotedinanactivemarket.Afterinitialmeasurement,suchfinancialassetsaresubsequentlymeasuredatamortizedcostusing the effective interest rate method (EIR), less impairment. Amortized cost is calculated by taking into account any discount or premium on acquisition and fees or costs that are an integral part of the EIR. The EIR amortization is includedinfinanceincomeintheincomestatement.Thelossesarisingfromimpairmentarerecognizedintheincome statement in selling and distribution expenses.
NOTES to the Financial Statements Year ended 31 March, 2018
Annual Report 2017/2018 35
c) Held-to-Maturity Investments
Non-derivativefinancialassetswithfixedordeterminablepaymentsandfixedmaturitiesareclassifiedasheld-to-maturity when the Company has the positive intention and ability to hold them to maturity. After initial measurement, held-to-maturity investments are measured at amortized cost using the effective interest method, less impairment. Amortized cost is calculated by taking into account any discount or premium on acquisition and fees or costs that are anintegralpartoftheEIR.TheEIRamortizationisincludedinfinanceincomeintheincomestatement.Thelossesarisingfromimpairmentarerecognizedintheincomestatementinfinancecosts.
The Company did not have any held-to-maturity investments during the years ended 31 March 2017 and 31 March 2018.
d) Available-for-Sale Financial Investments
Available-for-salefinancialinvestmentsincludeequityanddebtsecurities.Equityinvestmentsclassifiedasavailable-for-salearethose,whichareneitherclassifiedasheldfortradingnordesignatedatfairvaluethroughprofitorloss.Debtsecuritiesinthiscategoryarethosewhichareintendedtobeheldforanindefiniteperiodoftimeandwhichmaybe sold in response to needs for liquidity or in response to changes in the market conditions.
After initialmeasurement, available-for-sale financial investments are subsequentlymeasured at fair valuewithunrealized gains or losses recognized as other comprehensive income in the available-for-sale reserve until the investment is derecognized, at which time the cumulative gain or loss is recognized in other operating income, or determinedtobeimpaired,atwhichtimethecumulativelossisreclassifiedtotheincomestatementinfinancecostsand removed from the available-for-sale reserve.
Interest income on available-for-sale debt securities is calculated using the effective interest method and is recognized inprofitorloss.
TheCompanyevaluatesitsavailable-for-salefinancialassetstodeterminewhethertheabilityandintentiontosellthemintheneartermisstillappropriate.WhentheCompanyisunabletotradethesefinancialassetsduetoinactivemarketsandmanagement’s intentiontodososignificantlychanges intheforeseeablefuture, theCompanymayelecttoreclassifythesefinancialassetsinrarecircumstances.ReclassificationtoloansandreceivablesispermittedwhenthefinancialassetsmeetthedefinitionofloansandreceivablesandtheCompanyhastheintentionandabilitytoholdtheseassetsfortheforeseeablefutureoruntilmaturity.Reclassificationtotheheld-to-maturitycategoryispermittedonlywhentheentityhastheabilityandintentiontoholdthefinancialassetaccordingly.
Forafinancialassetreclassifiedoutoftheavailable-for-salecategory,anypreviousgainorlossonthatassetthathasbeenrecognizedinequityisamortizedtoprofitorlossovertheremaininglifeoftheinvestmentusingtheEIR.Anydifferencebetweenthenewamortizedcostandtheexpectedcashflowsisalsoamortizedovertheremaininglife of the asset using the EIR. If the asset is subsequently determined to be impaired, then the amount recorded in equityisreclassifiedtotheincomestatement.
Derecognition
Afinancialasset(or,whereapplicableapartofafinancialassetorpartofagroupofsimilarfinancialassets) isderecognized when:
÷ Therightstoreceivecashflowsfromtheassethaveexpired,
÷ TheCompanyhastransferreditsrightstoreceivecashflowsfromtheassetorhasassumedanobligationtopaythereceivedcashflowsinfullwithoutmaterialdelaytoathirdpartyundera‘pass-through’arrangement;and either (a) the Company has transferred substantially all the risks and rewards of the asset, or (b) the Company has neither transferred nor retained substantially all the risks and rewards of the asset, but has transferred control of the asset.
WhentheCompanyhastransferreditsrightstoreceivecashflowsfromanassetorhasenteredintoapass-througharrangement, and has neither transferred nor retained substantially all of the risks and rewards of the asset nor transferred control of it, the asset is recognized to the extent of the Company’s continuing involvement in it.
NOTES to the Financial Statements Year ended 31 March, 2018

Annual Report 2017/201836
In that case, the Company also recognizes an associated liability. The transferred asset and the associated liability aremeasuredonabasisthatreflectstherightsandobligationsthattheCompanyhasretained.
Continuing involvement that takes the form of a guarantee over the transferred asset is measured at the lower of the original carrying amount of the asset and the maximum amount of consideration that the Company could be required to repay.
2.5.8.2 Impairment of Financial Assets
TheCompanyassessesateachreportingdatewhetherthereisanyobjectiveevidencethatafinancialassetoragroupoffinancialassetsisimpaired.Afinancialassetoragroupoffinancialassetsisdeemedtobeimpairedif,andonly if, there is objective evidence of impairment as a result of one or more events that has occurred after the initial recognition of the asset (an incurred ‘loss event’) and that loss event has an impact on the estimated future cash flowsofthefinancialassetorthegroupoffinancialassetsthatcanbereliablyestimated.Evidenceofimpairmentmayincludeindicationsthatthedebtorsoragroupofdebtorsisexperiencingsignificantfinancialdifficulty,defaultordelinquency in interestorprincipalpayments, theprobability that theywill enterbankruptcyorotherfinancialreorganization and where observable data indicate that there is a measurable decrease in the estimated future cash flows,suchaschangesinarrearsoreconomicconditionsthatcorrelatewithdefaults.
a) Financial Assets Carried at Amortised Cost
Forfinancialassetscarriedatamortizedcost,theCompanyfirstassesseswhetherobjectiveevidenceofimpairmentexistsindividuallyforfinancialassetsthatareindividuallysignificant,orcollectivelyforfinancialassetsthatarenotindividuallysignificant.IftheCompanydeterminesthatnoobjectiveevidenceofimpairmentexistsforanindividuallyassessedfinancialasset,whethersignificantornot,itincludestheassetinagroupoffinancialassetswithsimilarcredit risk characteristics and collectively assesses them for impairment. Assets that are individually assessed for impairment and for which an impairment loss is, or continues to be, recognized are not included in a collective assessment of impairment.
If there is objective evidence that an impairment loss has been incurred, the amount of the loss is measured as thedifferencebetweentheassetscarryingamountandthepresentvalueofestimatedfuturecashflows(excludingfutureexpectedcreditlossesthathavenotyetbeenincurred).Thepresentvalueoftheestimatedfuturecashflowsarediscountedatthefinancialasset’soriginaleffectiveinterestrate.Ifaloanhasavariableinterestrate,thediscountrate for measuring any impairment loss is the current effective interest rate.
The carrying amount of the asset is reduced through the use of an allowance account and the amount of the loss is recognized in the income statement. Interest income continues to be accrued on the reduced carrying amount and is accruedusingtherateofinterestusedtodiscountthefuturecashflowsforthepurposeofmeasuringtheimpairmentloss.Theinterestincomeisrecordedaspartoffinanceincomeintheincomestatement.Loanstogetherwiththeassociated allowance are written off when there is no realistic prospect of future recovery and all collateral has been realized. If, in a subsequent year, the amount of the estimated impairment loss increases or decreases because of an event occurring after the impairment was recognized, the previously recognized impairment loss is increased or reducedbyadjustingtheallowanceaccount.Ifafuturewrite-offislaterrecovered,therecoveryiscreditedtofinancecosts in the income statement.
b) Available-for-Sale Financial Investments
Foravailable-for-salefinancialinvestments,theCompanyassessesateachreportingdatewhetherthereisobjectiveevidence that an investment or a group of investments is impaired.
Inthecaseofequityinvestmentsclassifiedasavailable-for-sale,objectiveevidencewouldincludeasignificantorprolongeddeclineinthefairvalueoftheinvestmentbelowitscost.‘Significant’isevaluatedagainsttheoriginalcostof the investment and ‘prolonged’ against the period in which the fair value has been below its original cost. Where there is evidence of impairment, the cumulative loss - measured as the difference between the acquisition cost and the current fair value, less any impairment loss on that investment previously recognized in the income statement - is removed from other comprehensive income and recognized in the income statement. Impairment losses on equity investments are not reversed through the income statement; increases in their fair value after impairments are recognized directly in other comprehensive income.
NOTES to the Financial Statements Year ended 31 March, 2018
Annual Report 2017/2018 37
Inthecaseofdebtinstrumentsclassifiedasavailable-for-sale,impairmentisassessedbasedonthesamecriteriaasfinancialassetscarriedatamortizedcost.However,theamountrecordedforimpairmentisthecumulativelossmeasured as the difference between the amortized cost and the current fair value, less any impairment loss on that investment previously recognized in the income statement.
Future interest income continues to be accrued based on the reduced carrying amount of the asset, using the rate of interestusedtodiscountthefuturecashflowsforthepurposeofmeasuringtheimpairmentloss.Theinterestincomeisrecordedaspartoffinanceincome.If,inasubsequentyear,thefairvalueofadebtinstrumentincreasesandtheincrease can be objectively related to an event occurring after the impairment loss was recognized in the income statement, the impairment loss is reversed through the income statement.
2.5.8.3 Financial Liabilities
Initial Recognition and Measurement
FinancialliabilitieswithinthescopeofLKAS39areclassifiedasfinancialliabilitiesatfairvaluethroughprofitorloss,loans and borrowings, or as derivatives designated as hedging instruments in an effective hedge, as appropriate. TheCompanydeterminestheclassificationofitsfinancialliabilitiesatinitialrecognition.
Allfinancialliabilitiesarerecognizedinitiallyatfairvalueand,inthecaseofloansandborrowings,carriedatamortizedcost. This includes directly attributable transaction costs.
TheCompany’sfinancialliabilitiesincludetradeandotherpayables,bankoverdraftsandloansandborrowings.
Subsequent Measurement
Themeasurementoffinancialliabilitiesdependsontheirclassificationasfollows:
a) Financial Liabilities at Fair Value through Profit or Loss
Financialliabilitiesatfairvaluethroughprofitorlossincludefinancialliabilitiesheld-for-tradingandfinancialliabilitiesdesignateduponinitialrecognitionasatfairvaluethroughprofitorloss.
Financialliabilitiesareclassifiedasheld-for-tradingiftheyareacquiredforthepurposeofsellinginthenearterm.This category includesderivative financial instrumentsentered intoby theCompany thatarenot designatedashedging instruments in hedge relationships as defined by LKAS 39. Separated embedded derivatives are alsoclassifiedasheld-for-tradingunlesstheyaredesignatedaseffectivehedginginstruments.
Gains or losses on liabilities held-for-trading are recognized in the income statement.
TheCompanyhasnotdesignatedanyfinancialliabilitiesuponinitialrecognitionasatfairvaluethroughprofitorloss.
b) Loans and Borrowings
After initial recognition, interest bearing loans and borrowings are subsequently measured at amortized cost using the effective interest rate method. Gains and losses are recognized in the income statement when the liabilities are derecognized as well as through the effective interest rate method (EIR) amortization process.
Amortized cost is calculated by taking into account any discount or premium on acquisition and fees or costs that is anintegralpartoftheEIR.TheEIRamortizationisincludedinfinancecostsintheincomestatement.
Derecognition
Afinancialliabilityisderecognizedwhentheobligationundertheliabilityisdischargedorcancelledorexpires.Whenanexistingfinancialliabilityisreplacedbyanotherfromthesamelenderonsubstantiallydifferentterms,orthetermsofanexistingliabilityaresubstantiallymodified,suchanexchangeormodificationistreatedasaderecognitionofthe original liability and the recognition of a new liability, and the difference in the respective carrying amounts is recognized in the income statement.
NOTES to the Financial Statements Year ended 31 March, 2018
Annual Report 2017/201838
2.5.8.4 Offsetting of Financial Instruments
Financialassetsandfinancialliabilitiesareoffsetwiththenetamountreportedinthestatementoffinancialpositiononly if there is a current enforceable legal right to offset the recognized amounts and intent to settle on a net basis, or to realize the assets and settle the liabilities simultaneously.
2.5.8.5 Fair Value of Financial Instruments
The fairvalueoffinancial instruments thatare traded inactivemarketsateach reportingdate isdeterminedbyreference to quoted market prices or dealer price quotations (bid price for long positions and ask price for short positions), without any deduction for transaction costs.
Forfinancial instrumentsnot traded inanactivemarket, the fairvalue isdeterminedusingappropriatevaluationtechniques. Such techniques may include:
÷ Using recent arm’s length market transactions;
÷ Reference to the current fair value of another instrument that is substantially the same;
÷ Adiscountedcashflowanalysisorothervaluationmodels.
AnanalysisoffairvaluesoffinancialinstrumentsandfurtherdetailsastohowtheyaremeasuredareprovidedinNote 9.6
2.5.9 Inventories
Inventories are valued at the lower of cost and net realizable value, after making due allowances for obsolete and slow moving items. Net realizable value is the price at which inventories can be sold in the ordinary course of business less the estimated cost of completion and the estimated cost necessary to make the sale.
The cost incurred in bringing inventories to its present location and conditions are accounted using the following cost formulae:-
Raw Materials - At actual cost on weighted average basis
Finished Goods & Work-in-Progress -
At the cost of direct materials, direct labour and an appropriate proportion of fixedandvariableproductionoverheadsbasedonnormaloperatingcapac-ity in producing each design.
Consumables & Spares - At actual cost on weighted average basis
Goods in Transit - At actual cost
2.5.10 Impairment of Non-Financial Assets
The Company assesses at each reporting date whether there is an indication that an asset may be impaired. If any indication exists, or when annual impairment testing for an asset is required, the Company estimates the asset’s recoverable amount. An asset’s recoverable amount is the higher of an asset’s or cash-generating unit’s (CGU) fair value less costs to sell and its value in use and is determined for an individual asset, unless the asset does notgeneratecashinflowsthatarelargelyindependentofthosefromotherassetsorgroupsofassets.Wherethecarrying amount of an asset or CGU exceeds its recoverable amount, the asset is considered impaired and is written downtoitsrecoverableamount.Inassessingvalueinuse,theestimatedfuturecashflowsarediscountedtotheirpresentvalueusingapre-taxdiscountrate thatreflectscurrentmarketassessmentsof thetimevalueofmoneyandtherisksspecifictotheasset.Indeterminingfairvaluelesscoststosell,recentmarkettransactionsaretakenintoaccount,ifavailable.Ifnosuchtransactionscanbeidentified,anappropriatevaluationmodelisused.Thesecalculations are corroborated by valuation multiples, quoted share prices for publicly traded subsidiaries or other available fair value indicators.
NOTES to the Financial Statements Year ended 31 March, 2018
Annual Report 2017/2018 39
The Company bases its impairment calculations on detailed budgets and forecasts which are prepared separately for each of the Company’s cash-generating units to which the individual assets are allocated. These budgets and forecasts are generally covering a period of three years. For longer periods, a long term growth rate is calculated and appliedtoprojectfuturecashflowsafterthethirdyear.
Impairment losses of continuing operations are recognized in the income statement in those expense categories consistent with the function of the impaired asset, except for a property previously revalued where the revaluation was taken to other comprehensive income. In this case, the impairment is also recognized in other comprehensive income up to the amount of any previous revaluation.
For assets excluding goodwill, an assessment is made at each reporting date as to whether there is any indication that previously recognized impairment losses may no longer exist or may have decreased. If such indication exists, the Company estimates the asset’s or cash-generating unit’s recoverable amount. A previously recognized impairment loss is reversed only if there has been a change in the assumptions used to determine the asset’s recoverable amount since the last impairment loss was recognized. The reversal is limited so that the carrying amount of the asset does not exceed its recoverable amount, nor exceed the carrying amount that would have been determined, net of depreciation, had no impairment loss been recognized for the asset in prior years. Such reversal is recognized in the income statement unless the asset is carried at a revalued amount, in which case the reversal is treated as a revaluation increase.
2.5.11 Cash and Short Term Deposits
Cashandshorttermdepositsaredefinedascashinhand,demanddepositsandshorttermhighlyliquidinvestments,readilyconvertibletoknownamountsofcashandsubjecttoinsignificantriskofchangesinvalue.
Forthepurposeofcashflowstatement,cashandshorttermdepositsconsistofcashinhandanddepositsinbanksnet of outstanding bank overdrafts. Investments with short maturities i.e. three months or less from the date of acquisition are also treated as cash equivalents.
2.5.12 Dividend Distributions
The Company recognizes a liability to make cash or non-cash distributions to owners of equity when the distribution is authorized and is no longer at the discretion of the Company. A corresponding amount is recognized directly in equity.
2.5.13 Provisions
Provisions are recognized when the Company has a present obligation (legal or constructive) as a result of a past event,whereitisprobablethatanoutflowofresourcesembodyingeconomicbenefitswillberequiredtosettletheobligation and a reliable estimate can be made of the amount of the obligation and a reliable estimate can be made of the amount of the obligation.
2.5.14 Employee Benefit Liability
a) Defined Benefit Plan - Gratuity
TheCompanymeasuresthepresentvalueofthepromisedretirementbenefitsofgratuityobligationwhichisadefinedbenefitplanwiththeadviceofanactuaryeveryfinancialyearusingProjectedUnitCreditMethodasrecommendedbyLKAS19–“Employeebenefits”.Thepresentvalueofthedefinedbenefitobligationisdeterminedbydiscountingtheestimatedfuturecashoutflowsusinginterestratesthataredenominatedinthecurrencyinwhichthebenefitswillbe paid, and that have terms to maturity approximating to the terms of the related liability. The present value of the definedbenefitobligationsdependsonanumberoffactorsthataredeterminedonanactuarialbasisusinganumberof assumptions.
KeyassumptionsusedindeterminingthedefinedretirementbenefitobligationsaregiveninNote15.Anychangesintheseassumptionswillimpactthecarryingamountofdefinedbenefitobligations.
Actuarial gains and losses are recognized in other comprehensive income (OCI) in the period in which it arises. The liability is not funded.
NOTES to the Financial Statements Year ended 31 March, 2018
Annual Report 2017/201840
b) Defined Contribution Plans - Employees’ Provident Fund & Employees’ Trust Fund
All employees who are eligible for Employees’ Provident Fund Contributions and Employees’ Trust Fund Contributions are covered by relevant contribution funds in line with respective statutes and regulations. The Company contributes 12% and 3% of gross emoluments of employees to Employees’ Provident Fund and Employees’ Trust Fundrespectively.
c) Lump-sum Payments to Employees
Provisionhasbeenmadeinthefinancialstatementsforlump-sumallowancespayabletoemployeesbythecollectiveagreement decided by the management.
2.6 EFFECT OF SRI LANKA ACCOUNTING STANDARDS ISSUED BUT NOT YET EFFECTIVE
Certain new accounting standards and amendments / improvements to existing standards have been published, that are not mandatory for 31 March 2018 reporting periods. None of those have been early adopted by the Company.
SLFRS 9 Financial Instruments
InDecember2014,theInstituteofCharteredAccountantofSriLankaissuedthefinalversionofSLFRS9FinancialInstrumentswhichreflectsallphasesofthefinancialinstrumentsprojectandreplacesLKRS39FinancialInstruments,RecognitionandMeasurement.Thestandardintroducesnewrequirementsforclassificationandmeasurementofimpairment,andhedgeaccounting.SLFRS9iseffectiveforannualperiodsbeginningonorafter1January2018,with early application permitted. Retrospective application is required. But comparative information is not compulsory. ManagementisyettoquantifythepossibleimpactfromSLFRS9.
SLFRS 15 Revenue from Contracts with Customers
The objective of this Standard is to establish the principles that an entity shall apply to report useful information to usersoffinancialstatementsaboutthenature,amount,timinganduncertaintyofrevenueandcashflowsarisingfrom a contract with a customer.
SLFRS 15 will become effective on 01 January 2018.Management is yet to quantify the possible impact from SLFRS15.
SLFRS 16- Leases
TheInstituteofCharteredAccountantofSriLankaissuedthenewstandardforaccountingforleases-SLFRS16Leases inJanuary2016.Thenewstandarddoesnot significantlychange theaccounting for leases for lessors.However, it does require lessees to recognise most leases on their balance sheets as lease liabilities, with the correspondingright-off-useassets.Lesseesmustapplyasinglemodelforallrecognisedleases,butwillhavetheoptionnottorecognise‘short-term’leasesandleasesof‘low-value’assets.Generally,theprofitorlossrecognitionpattern for recognised leaseswill be similar to today’s finance lease accounting,with interest and depreciationexpenserecognisedseparatelyinthestatementofprofitorloss.
SLFRS16iseffectiveforannualperiodsbeginningonorafter1January2019.Earlyapplicationispermitted,butnot before an entity applies IFRS 15. A lessee can choose to apply the standard using either a full retrospective or a modifiedretrospectiveapproach.Thestandard’stransitionprovisionspermitcertainreliefs.
ManagementisyettoquantifythepossibleimpactfromSLFRS16.
NOTES to the Financial Statements Year ended 31 March, 2018
Annual Report 2017/2018 41
NOTES to the Financial Statements year ended 31 March, 2018
3. SEGMENT INFORMATION
For management purposes, the Company is organized into business units based on its customer location and has two reportable segments, namely, local sales and export sales. Management monitors the operating results of its business units separately for the purpose of making decisions about resourceallocationandperformanceassessment.However,financing(includingfinancecostsandfinanceincome)andincome taxes are managed on a Company basis and are not allocated to operating segments.
3.1 Revenue 2018 2017LKR LKR
Net Revenue 6,731,705,151 6,677,640,752 Add : NBT on Sales 84,022,135 105,369,335 Gross Revenue 6,815,727,286 6,783,010,087
3.2 Sale of GoodsLocalSales - In House Production 3,951,546,141 3,403,407,402 - Trading 643,947,775 2,065,140,099 Total Local Sales 4,595,493,916 5,468,547,501 Export Sales - In House Production 1,860,134,361 1,201,091,553 - Trading 276,076,873 8,001,698 Total Export Sales 2,136,211,235 1,209,093,251
6,731,705,151 6,677,640,752
4. OTHER INCOME/EXPENSES2018 2017
4.1 Other Operating Income LKR LKR
Income from Investments - Quoted 175,206 158,807 Scrap Sales 24,228,766 29,044,922 Income from Solar Power Generation 33,349,778 -
57,753,750 29,203,729
4.2 Finance Income
Interest Income 151,874 15,174 InterestIncomeonLoansGiventoCompanyOfficers 482,049 414,202
633,923 429,376
4.3 Finance Costs
Interest Expense on Overdrafts 16,079,313 1,517,884 Interest Expense on Short Term Borrowings 42,991,193 21,963,987 InterestExpenseonLongTermBorrowings 269,428,491 152,941,662
328,498,998 176,423,532
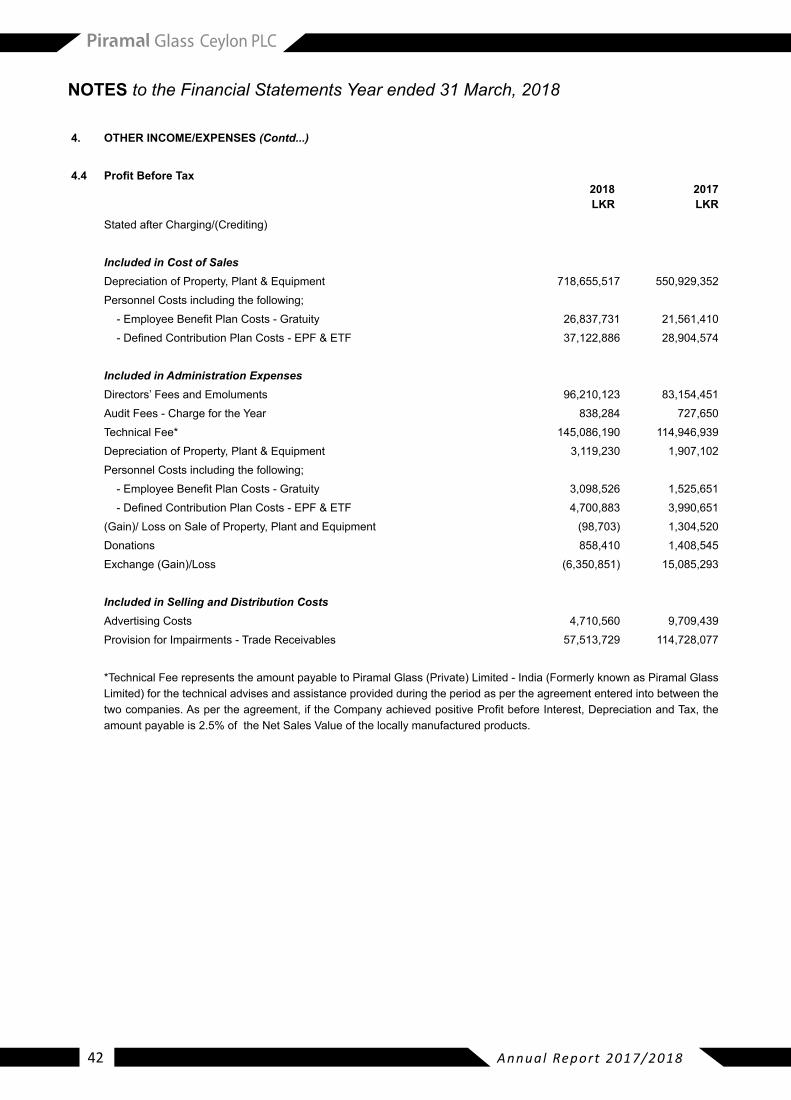
Annual Report 2017/201842
NOTES to the Financial Statements Year ended 31 March, 2018
4. OTHER INCOME/EXPENSES (Contd...)
4.4 Profit Before Tax2018 2017LKR LKR
Stated after Charging/(Crediting)
Included in Cost of SalesDepreciation of Property, Plant & Equipment 718,655,517 550,929,352 Personnel Costs including the following;-EmployeeBenefitPlanCosts-Gratuity 26,837,731 21,561,410 -DefinedContributionPlanCosts-EPF&ETF 37,122,886 28,904,574
Included in Administration ExpensesDirectors’ Fees and Emoluments 96,210,123 83,154,451 Audit Fees - Charge for the Year 838,284 727,650 Technical Fee* 145,086,190 114,946,939 Depreciation of Property, Plant & Equipment 3,119,230 1,907,102 Personnel Costs including the following;-EmployeeBenefitPlanCosts-Gratuity 3,098,526 1,525,651 -DefinedContributionPlanCosts-EPF&ETF 4,700,883 3,990,651 (Gain)/LossonSaleofProperty,PlantandEquipment (98,703) 1,304,520 Donations 858,410 1,408,545 Exchange(Gain)/Loss (6,350,851) 15,085,293
Included in Selling and Distribution CostsAdvertising Costs 4,710,560 9,709,439 Provision for Impairments - Trade Receivables 57,513,729 114,728,077
*TechnicalFeerepresentstheamountpayabletoPiramalGlass(Private)Limited-India(FormerlyknownasPiramalGlassLimited)forthetechnicaladvisesandassistanceprovidedduringtheperiodaspertheagreemententeredintobetweenthetwocompanies.Aspertheagreement,iftheCompanyachievedpositiveProfitbeforeInterest,DepreciationandTax,theamountpayableis2.5%oftheNetSalesValueofthelocallymanufacturedproducts.

Annual Report 2017/2018 43
5. INCOME TAX
The major components of income tax expense for the Years ended 31 March 2018 and 31 March 2017 are:
5.1 Statement of Profit & Loss 2018 2017LKR LKR
Current income tax:CurrentTaxExpenseonOtherIncomeandTradingProfitfortheYear 87,733 1,614,332 Under/(Over) Provision of Current Taxes in respect of Prior Year (1,538,946) (13,793,888)Deferred tax:Deferred Taxation Charge/(Reversal) 198,618,939 129,543,369 Income Tax Expense Reported in the Statement of Profit or Loss 197,167,726 117,363,813
5.2 Statement of Other Comprehensive Income
ActuarialGains/(Losses)onDefinedBenefitPlans (5,077,177) (1,824,097)Income Tax Charged Directly to Other Comprehensive Income (5,077,177) (1,824,097)
TheCompany’sprofitsarisingfromManufacturingOperationsaretaxableataconcessionaryrateofof20%andallotherprofitsandincomearetaxedattheStatutorytaxrate.
5.3 A Reconciliation between Tax Expense and the Product of Accounting Profit Multiplied by the Statutory Tax Rates for the Years Ended 31 March 2018 and 31 March 2017 are as follows:
2018 2017LKR LKR
AccountingProfitbeforeIncomeTax 541,049,416 602,839,770 Aggregate Disallowed Items 838,262,485 673,830,206 Aggregate Allowable Expenses (1,642,168,369) (1,433,562,077)Other Sources of Income (482,049) (8,869,953)ProfitsandIncomeExemptfromTax (151,874) (15,174)Taxable Profit/ (Loss) from Trade (263,490,391) (165,777,228)
Other Sources of Income 482,049 8,869,953 Less:QualifyingPaymentsandOtherAllowableDeductions (168,717) (3,104,483)Taxable Income 313,332 5,765,470
TaxableProfitsLiable@12% - - TaxableProfitsLiable@20% - - TaxableOtherSourcesofIncomeLiable@28% 313,332 5,765,470
StatutoryTaxRate-BusinessProfitonManufactured&Exports 12% 12%-BusinessProfitonManufactured&LocallySale 20% 20%-TradingProfitandothersourcesofIncome 28% 28%
Current Income Tax Expense 87,733 1,614,332
NOTES to the Financial Statements Year ended 31 March, 2018
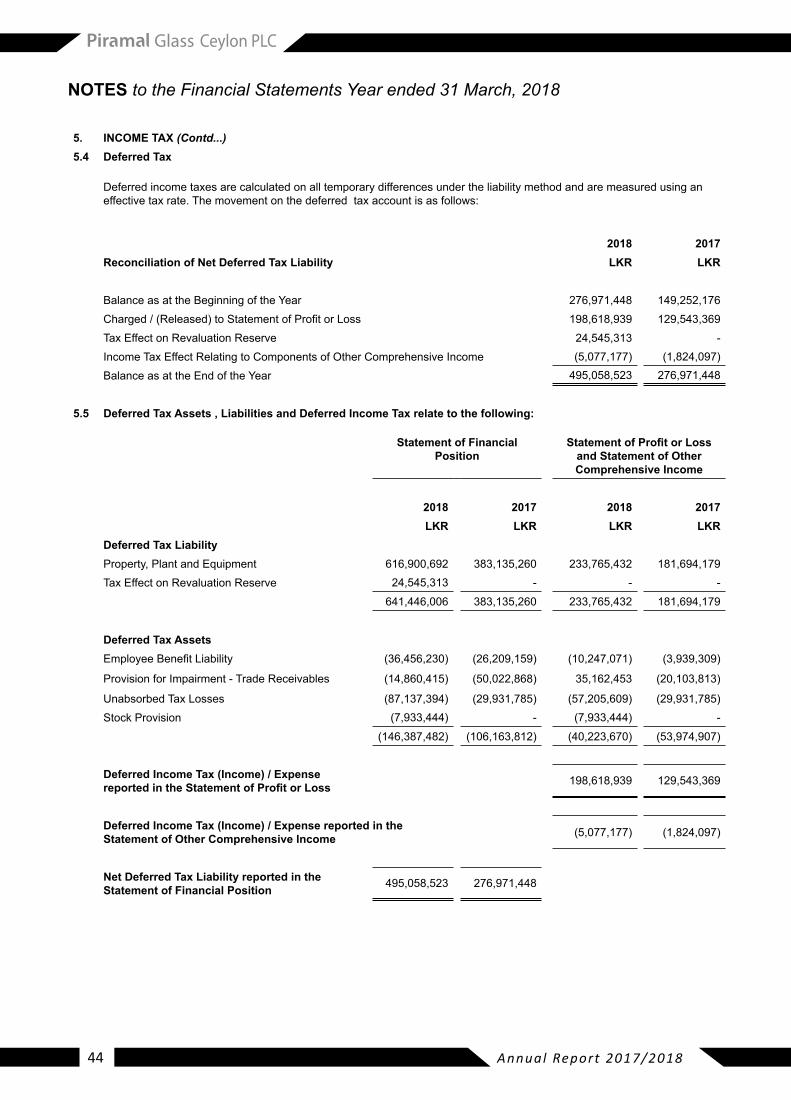
Annual Report 2017/201844
5. INCOME TAX (Contd...) 5.4 Deferred Tax
Deferred income taxes are calculated on all temporary differences under the liability method and are measured using an effective tax rate. The movement on the deferred tax account is as follows:
2018 2017Reconciliation of Net Deferred Tax Liability LKR LKR
Balance as at the Beginning of the Year 276,971,448 149,252,176 Charged/(Released)toStatementofProfitorLoss 198,618,939 129,543,369 Tax Effect on Revaluation Reserve 24,545,313 - Income Tax Effect Relating to Components of Other Comprehensive Income (5,077,177) (1,824,097)Balance as at the End of the Year 495,058,523 276,971,448
5.5 Deferred Tax Assets , Liabilities and Deferred Income Tax relate to the following:
Statement of Financial Position
Statement of Profit or Loss and Statement of Other Comprehensive Income
2018 2017 2018 2017LKR LKR LKR LKR
Deferred Tax LiabilityProperty, Plant and Equipment 616,900,692 383,135,260 233,765,432 181,694,179 Tax Effect on Revaluation Reserve 24,545,313 - - -
641,446,006 383,135,260 233,765,432 181,694,179
Deferred Tax Assets EmployeeBenefitLiability (36,456,230) (26,209,159) (10,247,071) (3,939,309)
Provision for Impairment - Trade Receivables (14,860,415) (50,022,868) 35,162,453 (20,103,813)
UnabsorbedTaxLosses (87,137,394) (29,931,785) (57,205,609) (29,931,785)Stock Provision (7,933,444) - (7,933,444) -
(146,387,482) (106,163,812) (40,223,670) (53,974,907)
Deferred Income Tax (Income) / Expense reported in the Statement of Profit or Loss 198,618,939 129,543,369
Deferred Income Tax (Income) / Expense reported in the Statement of Other Comprehensive Income (5,077,177) (1,824,097)
Net Deferred Tax Liability reported in the Statement of Financial Position 495,058,523 276,971,448
NOTES to the Financial Statements Year ended 31 March, 2018
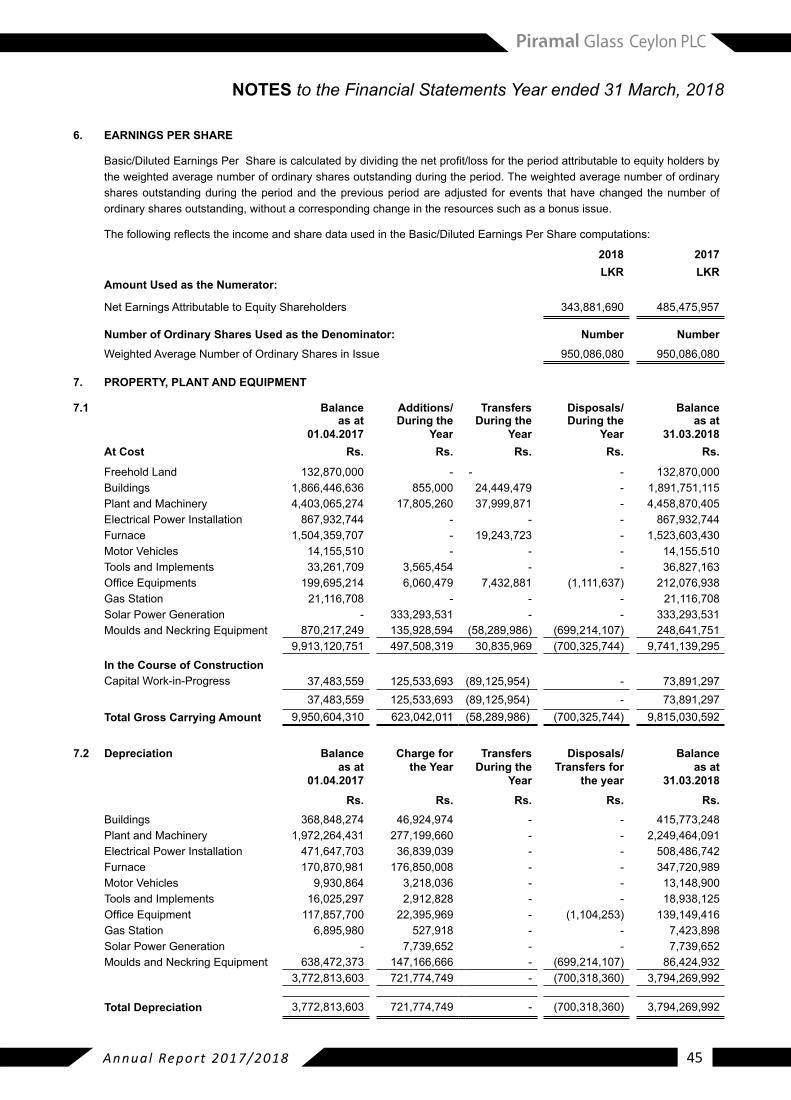
Annual Report 2017/2018 45
6. EARNINGS PER SHARE
Basic/DilutedEarningsPerShareiscalculatedbydividingthenetprofit/lossfortheperiodattributabletoequityholdersbythe weighted average number of ordinary shares outstanding during the period. The weighted average number of ordinary shares outstanding during the period and the previous period are adjusted for events that have changed the number of ordinary shares outstanding, without a corresponding change in the resources such as a bonus issue.
ThefollowingreflectstheincomeandsharedatausedintheBasic/DilutedEarningsPerSharecomputations:
2018 2017LKR LKR
Amount Used as the Numerator:
Net Earnings Attributable to Equity Shareholders 343,881,690 485,475,957
Number of Ordinary Shares Used as the Denominator: Number NumberWeighted Average Number of Ordinary Shares in Issue 950,086,080 950,086,080
7. PROPERTY, PLANT AND EQUIPMENT
7.1 Balance Additions/ Transfers Disposals/ Balance as at
01.04.2017 During the
Year During the
Year During the
Year as at
31.03.2018At Cost Rs. Rs. Rs. Rs. Rs.
FreeholdLand 132,870,000 - - - 132,870,000 Buildings 1,866,446,636 855,000 24,449,479 - 1,891,751,115 Plant and Machinery 4,403,065,274 17,805,260 37,999,871 - 4,458,870,405 Electrical Power Installation 867,932,744 - - - 867,932,744 Furnace 1,504,359,707 - 19,243,723 - 1,523,603,430 Motor Vehicles 14,155,510 - - - 14,155,510 Tools and Implements 33,261,709 3,565,454 - - 36,827,163 OfficeEquipments 199,695,214 6,060,479 7,432,881 (1,111,637) 212,076,938 Gas Station 21,116,708 - - - 21,116,708 Solar Power Generation - 333,293,531 - - 333,293,531 Moulds and Neckring Equipment 870,217,249 135,928,594 (58,289,986) (699,214,107) 248,641,751
9,913,120,751 497,508,319 30,835,969 (700,325,744) 9,741,139,295 In the Course of ConstructionCapital Work-in-Progress 37,483,559 125,533,693 (89,125,954) - 73,891,297
37,483,559 125,533,693 (89,125,954) - 73,891,297 Total Gross Carrying Amount 9,950,604,310 623,042,011 (58,289,986) (700,325,744) 9,815,030,592
7.2 Depreciation Balanceas at
01.04.2017
Charge for the Year
Transfers During the
Year
Disposals/ Transfers for
the year
Balance as at
31.03.2018
Rs. Rs. Rs. Rs. Rs. Buildings 368,848,274 46,924,974 - - 415,773,248 Plant and Machinery 1,972,264,431 277,199,660 - - 2,249,464,091 Electrical Power Installation 471,647,703 36,839,039 - - 508,486,742 Furnace 170,870,981 176,850,008 - - 347,720,989 Motor Vehicles 9,930,864 3,218,036 - - 13,148,900 Tools and Implements 16,025,297 2,912,828 - - 18,938,125 OfficeEquipment 117,857,700 22,395,969 - (1,104,253) 139,149,416 Gas Station 6,895,980 527,918 - - 7,423,898 Solar Power Generation - 7,739,652 - - 7,739,652 Moulds and Neckring Equipment 638,472,373 147,166,666 - (699,214,107) 86,424,932
3,772,813,603 721,774,749 - (700,318,360) 3,794,269,992
Total Depreciation 3,772,813,603 721,774,749 - (700,318,360) 3,794,269,992
NOTES to the Financial Statements Year ended 31 March, 2018
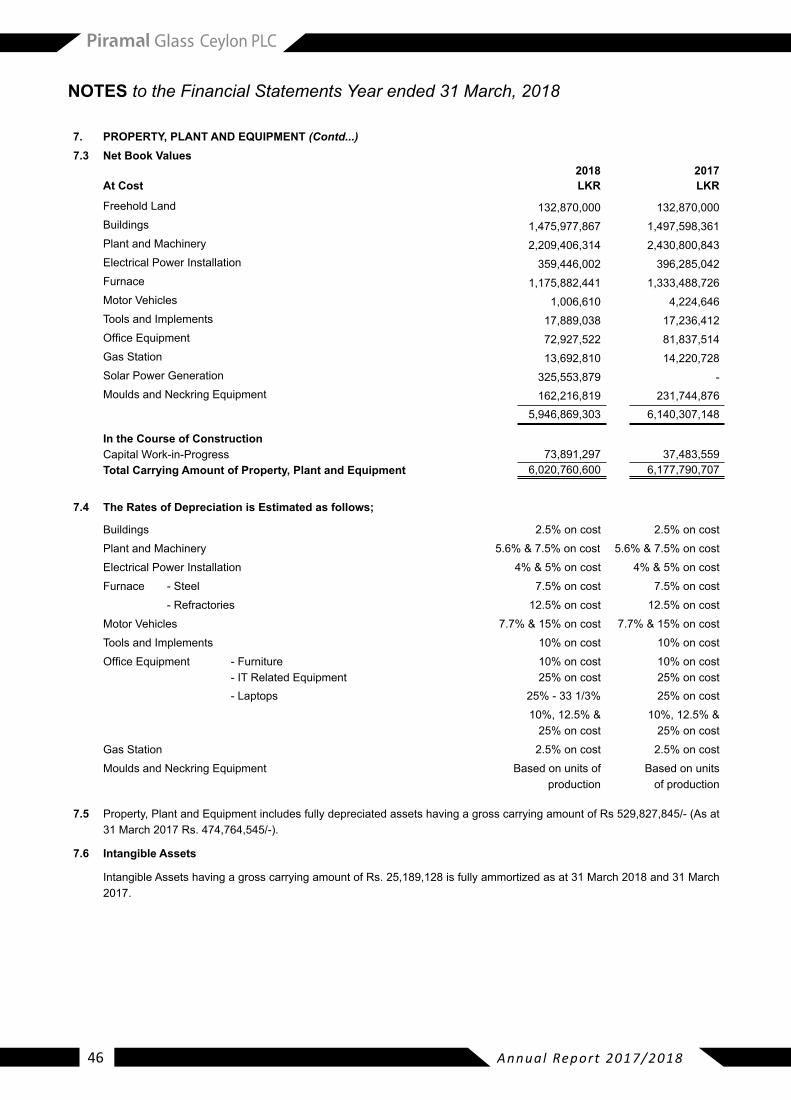
Annual Report 2017/201846
7. PROPERTY, PLANT AND EQUIPMENT (Contd...) 7.3 Net Book Values
2018 2017At Cost LKR LKR
FreeholdLand 132,870,000 132,870,000 Buildings 1,475,977,867 1,497,598,361 Plant and Machinery 2,209,406,314 2,430,800,843 Electrical Power Installation 359,446,002 396,285,042 Furnace 1,175,882,441 1,333,488,726 Motor Vehicles 1,006,610 4,224,646 Tools and Implements 17,889,038 17,236,412 OfficeEquipment 72,927,522 81,837,514 Gas Station 13,692,810 14,220,728 Solar Power Generation 325,553,879 - Moulds and Neckring Equipment 162,216,819 231,744,876
5,946,869,303 6,140,307,148
In the Course of ConstructionCapital Work-in-Progress 73,891,297 37,483,559 Total Carrying Amount of Property, Plant and Equipment 6,020,760,600 6,177,790,707
7.4 The Rates of Depreciation is Estimated as follows;
Buildings 2.5%oncost 2.5%oncostPlantandMachinery5.6%&7.5%oncost 5.6%&7.5%oncostElectricalPowerInstallation4%&5%oncost 4%&5%oncostFurnace - Steel 7.5%oncost 7.5%oncost - Refractories 12.5%oncost 12.5%oncostMotor Vehicles 7.7%&15%oncost 7.7%&15%oncostTools and Implements 10%oncost 10%oncostOfficeEquipment - Furniture
- IT Related Equipment10%oncost25%oncost
10%oncost25%oncost
-Laptops 25%-331/3% 25%oncost10%,12.5%&25%oncost
10%,12.5%&25%oncost
Gas Station 2.5%oncost 2.5%oncostMoulds and Neckring Equipment Based on units of
productionBased on units
of production
7.5 Property, Plant and Equipment includes fully depreciated assets having a gross carrying amount of Rs 529,827,845/- (As at 31 March 2017 Rs. 474,764,545/-).
7.6 Intangible Assets
Intangible Assets having a gross carrying amount of Rs. 25,189,128 is fully ammortized as at 31 March 2018 and 31 March 2017.
NOTES to the Financial Statements Year ended 31 March, 2018
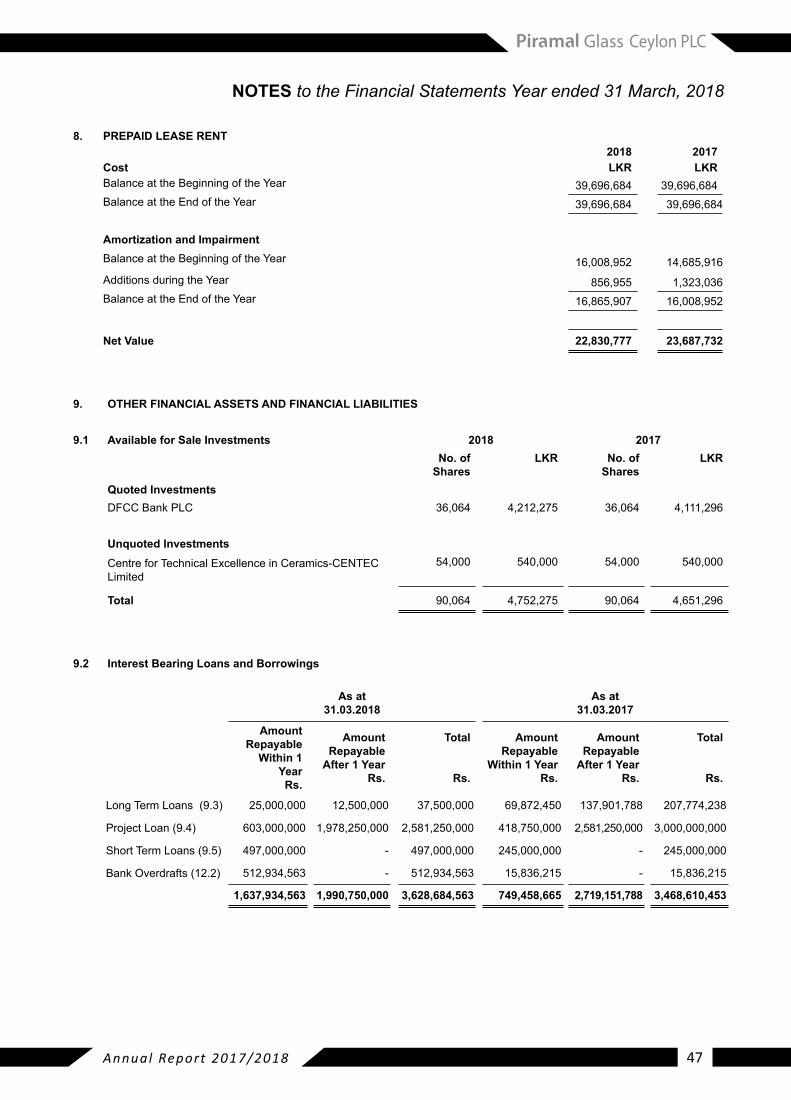
Annual Report 2017/2018 47
NOTES to the Financial Statements Year ended 31 March, 2018
9. OTHER FINANCIAL ASSETS AND FINANCIAL LIABILITIES
9.1 Available for Sale Investments 2018 2017No. of
SharesLKR No. of
SharesLKR
Quoted InvestmentsDFCCBankPLC 36,064 4,212,275 36,064 4,111,296
Unquoted InvestmentsCentre for Technical Excellence in Ceramics-CENTEC Limited
54,000 540,000 54,000 540,000
Total 90,064 4,752,275 90,064 4,651,296
9.2 Interest Bearing Loans and Borrowings
As at31.03.2018
As at31.03.2017
Amount Repayable
Within 1 Year
Rs.
Amount Repayable
After 1 Year Rs.
Total
Rs.
Amount Repayable
Within 1 YearRs.
Amount Repayable
After 1 Year Rs.
Total
Rs.
LongTermLoans(9.3) 25,000,000 12,500,000 37,500,000 69,872,450 137,901,788 207,774,238
ProjectLoan(9.4) 603,000,000 1,978,250,000 2,581,250,000 418,750,000 2,581,250,000 3,000,000,000
ShortTermLoans(9.5) 497,000,000 - 497,000,000 245,000,000 - 245,000,000
Bank Overdrafts (12.2) 512,934,563 - 512,934,563 15,836,215 - 15,836,215
1,637,934,563 1,990,750,000 3,628,684,563 749,458,665 2,719,151,788 3,468,610,453
8. PREPAID LEASE RENT2018 2017
Cost LKR LKR Balance at the Beginning of the Year 39,696,684 39,696,684 Balance at the End of the Year 39,696,684 39,696,684
Amortization and ImpairmentBalance at the Beginning of the Year 16,008,952 14,685,916 Additions during the Year 856,955 1,323,036 Balance at the End of the Year 16,865,907 16,008,952
Net Value 22,830,777 23,687,732
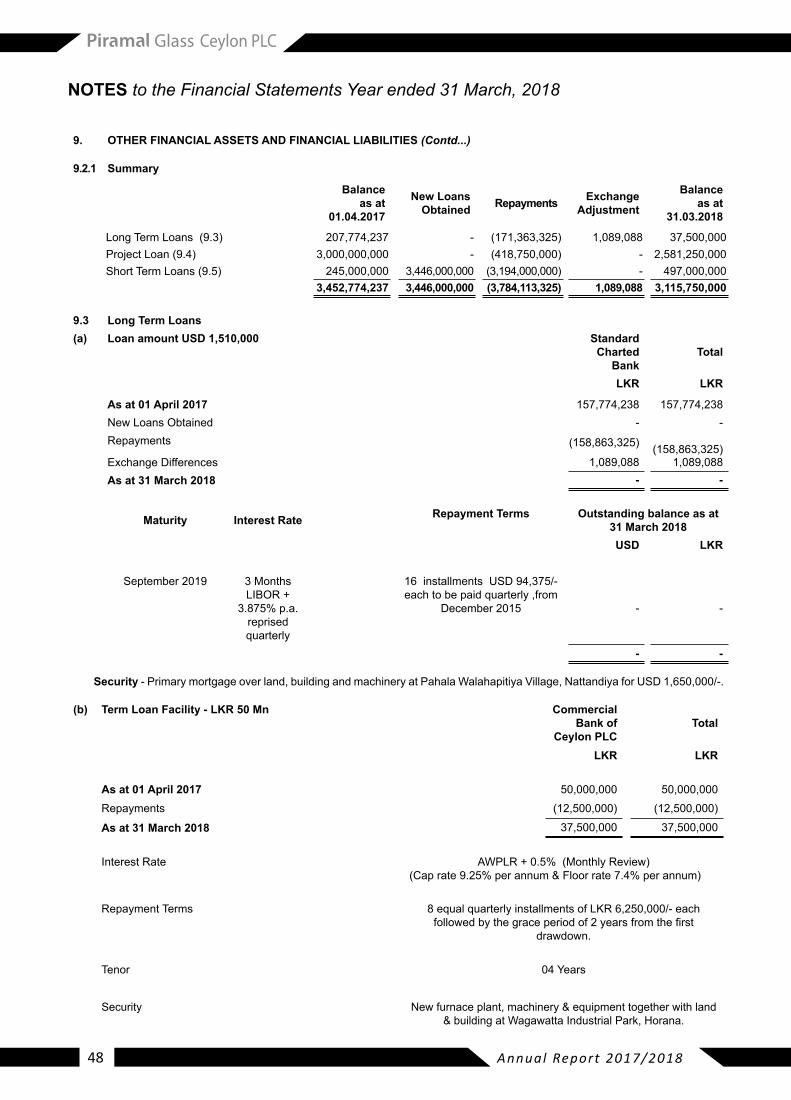
Annual Report 2017/201848
(b) Term Loan Facility - LKR 50 Mn Commercial Bank of
Ceylon PLC Total
LKR LKR
As at 01 April 2017 50,000,000 50,000,000 Repayments (12,500,000) (12,500,000)
As at 31 March 2018 37,500,000 37,500,000
Interest Rate AWPLR+0.5%(MonthlyReview)(Caprate9.25%perannum&Floorrate7.4%perannum)
Repayment Terms 8equalquarterlyinstallmentsofLKR6,250,000/-eachfollowedbythegraceperiodof2yearsfromthefirst
drawdown.
Tenor 04 Years
Security New furnace plant, machinery & equipment together with land & building at Wagawatta Industrial Park, Horana.
NOTES to the Financial Statements Year ended 31 March, 2018
9. OTHER FINANCIAL ASSETS AND FINANCIAL LIABILITIES (Contd...)
9.2.1 Summary
Balance as at
01.04.2017
New Loans Obtained Repayments Exchange
Adjustment
Balance as at
31.03.2018
LongTermLoans(9.3) 207,774,237 - (171,363,325) 1,089,088 37,500,000 ProjectLoan(9.4) 3,000,000,000 - (418,750,000) - 2,581,250,000 ShortTermLoans(9.5) 245,000,000 3,446,000,000 (3,194,000,000) - 497,000,000
3,452,774,237 3,446,000,000 (3,784,113,325) 1,089,088 3,115,750,000
9.3 Long Term Loans (a) Loan amount USD 1,510,000 Standard
Charted Bank
Total
LKR LKR
As at 01 April 2017 157,774,238 157,774,238 NewLoansObtained - - Repayments (158,863,325)
(158,863,325)Exchange Differences 1,089,088 1,089,088 As at 31 March 2018 - -
Maturity Interest Rate Repayment Terms Outstanding balance as at 31 March 2018USD LKR
September 2019 3 Months LIBOR+
3.875%p.a.reprised quarterly
16 installments USD 94,375/- each to be paid quarterly ,from
December 2015 - -
- - Security - Primary mortgage over land, building and machinery at Pahala Walahapitiya Village, Nattandiya for USD 1,650,000/-.
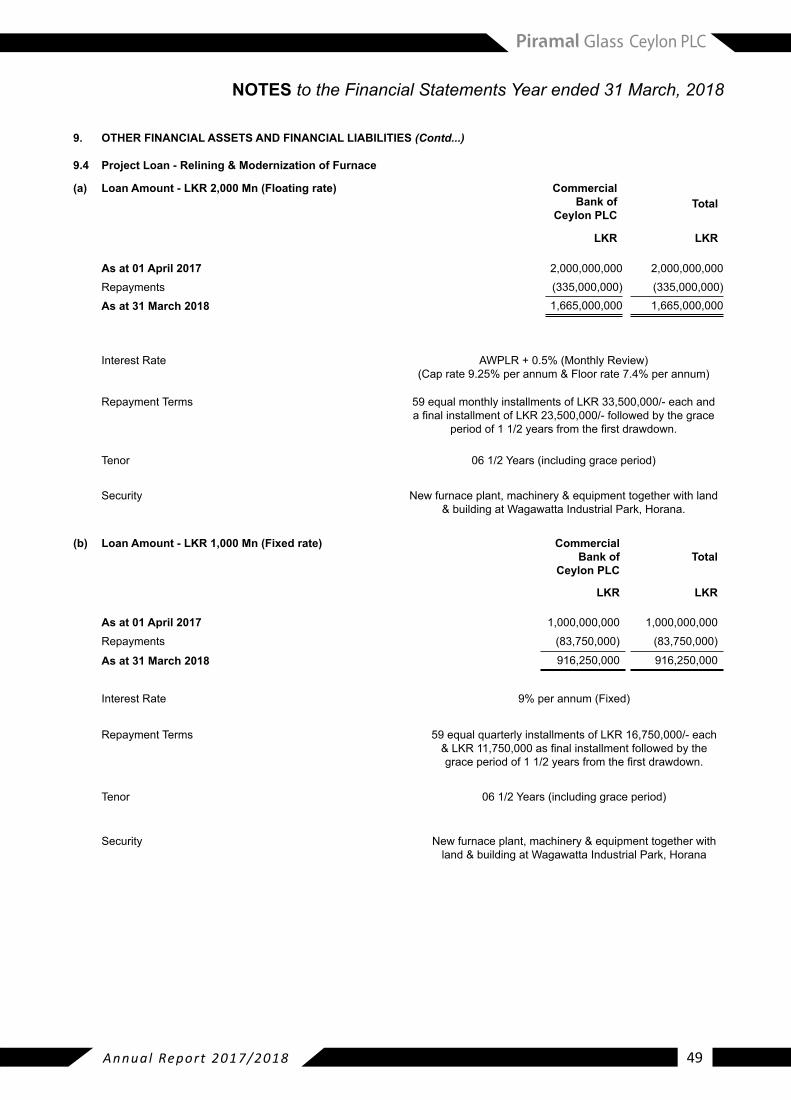
Annual Report 2017/2018 49
(b) Loan Amount - LKR 1,000 Mn (Fixed rate) Commercial Bank of
Ceylon PLC Total
LKR LKR
As at 01 April 2017 1,000,000,000 1,000,000,000 Repayments (83,750,000) (83,750,000)
As at 31 March 2018 916,250,000 916,250,000
Interest Rate 9%perannum(Fixed)
Repayment Terms 59equalquarterlyinstallmentsofLKR16,750,000/-each&LKR11,750,000asfinalinstallmentfollowedbythegraceperiodof11/2yearsfromthefirstdrawdown.
Tenor 06 1/2 Years (including grace period)
Security New furnace plant, machinery & equipment together with land & building at Wagawatta Industrial Park, Horana
NOTES to the Financial Statements Year ended 31 March, 2018
9. OTHER FINANCIAL ASSETS AND FINANCIAL LIABILITIES (Contd...)
9.4 Project Loan - Relining & Modernization of Furnace
(a) Loan Amount - LKR 2,000 Mn (Floating rate) Commercial Bank of
Ceylon PLC Total
LKR LKR
As at 01 April 2017 2,000,000,000 2,000,000,000 Repayments (335,000,000) (335,000,000)As at 31 March 2018 1,665,000,000 1,665,000,000
Interest Rate AWPLR+0.5%(MonthlyReview)(Caprate9.25%perannum&Floorrate7.4%perannum)
Repayment Terms 59equalmonthlyinstallmentsofLKR33,500,000/-eachandafinalinstallmentofLKR23,500,000/-followedbythegrace
periodof11/2yearsfromthefirstdrawdown.
Tenor 06 1/2 Years (including grace period)
Security New furnace plant, machinery & equipment together with land & building at Wagawatta Industrial Park, Horana.
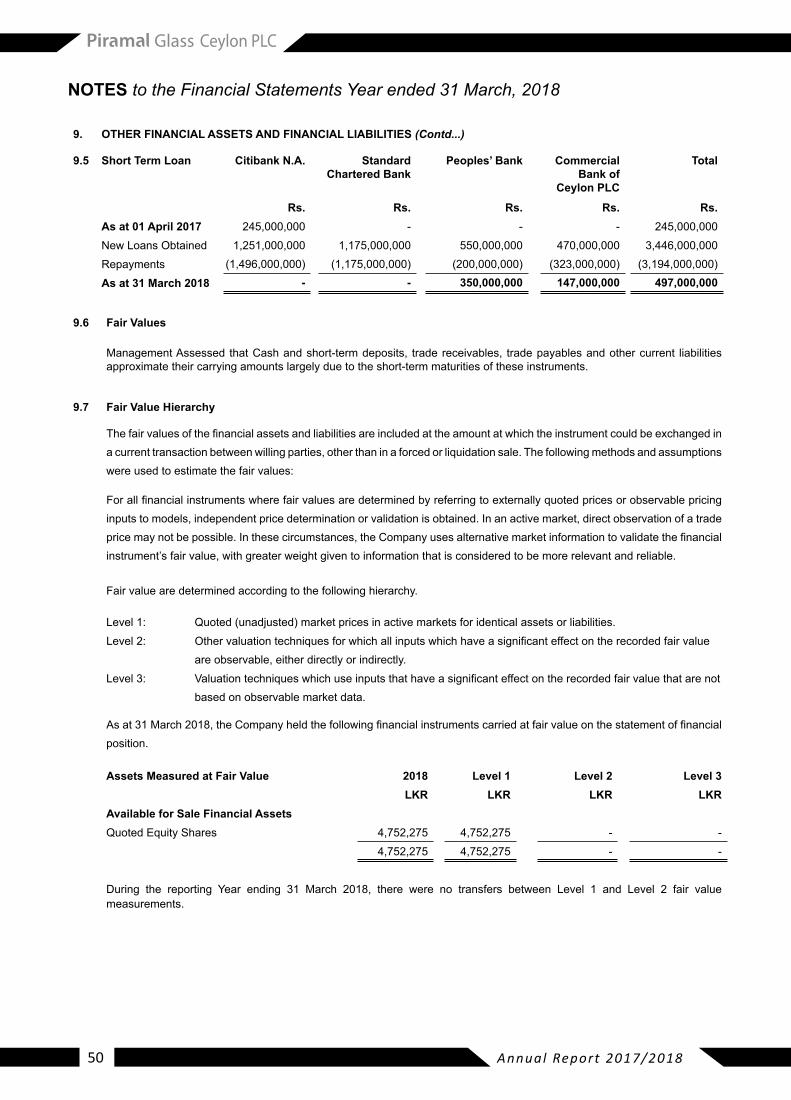
Annual Report 2017/201850
9.6 Fair Values
Management Assessed that Cash and short-term deposits, trade receivables, trade payables and other current liabilities approximate their carrying amounts largely due to the short-term maturities of these instruments.
9.7 Fair Value Hierarchy
Thefairvaluesofthefinancialassetsandliabilitiesareincludedattheamountatwhichtheinstrumentcouldbeexchangedina current transaction between willing parties, other than in a forced or liquidation sale. The following methods and assumptions were used to estimate the fair values:
Forallfinancialinstrumentswherefairvaluesaredeterminedbyreferringtoexternallyquotedpricesorobservablepricinginputs to models, independent price determination or validation is obtained. In an active market, direct observation of a trade pricemaynotbepossible.Inthesecircumstances,theCompanyusesalternativemarketinformationtovalidatethefinancialinstrument’s fair value, with greater weight given to information that is considered to be more relevant and reliable.
Fair value are determined according to the following hierarchy.
Level1: Quoted (unadjusted) market prices in active markets for identical assets or liabilities.Level2: Othervaluationtechniquesforwhichallinputswhichhaveasignificanteffectontherecordedfairvalue
are observable, either directly or indirectly.Level3: Valuationtechniqueswhichuseinputsthathaveasignificanteffectontherecordedfairvaluethatarenot
based on observable market data.
Asat31March2018,theCompanyheldthefollowingfinancialinstrumentscarriedatfairvalueonthestatementoffinancialposition.
Assets Measured at Fair Value 2018 Level 1 Level 2 Level 3LKR LKR LKR LKR
Available for Sale Financial AssetsQuoted Equity Shares 4,752,275 4,752,275 - -
4,752,275 4,752,275 - -
During the reporting Year ending 31 March 2018, there were no transfers between Level 1 and Level 2 fair value measurements.
NOTES to the Financial Statements Year ended 31 March, 2018
9. OTHER FINANCIAL ASSETS AND FINANCIAL LIABILITIES (Contd...)
9.5 Short Term Loan Citibank N.A. Standard Chartered Bank
Peoples’ Bank Commercial Bank of
Ceylon PLC
Total
Rs. Rs. Rs. Rs. Rs.As at 01 April 2017 245,000,000 - - - 245,000,000 NewLoansObtained 1,251,000,000 1,175,000,000 550,000,000 470,000,000 3,446,000,000 Repayments (1,496,000,000) (1,175,000,000) (200,000,000) (323,000,000) (3,194,000,000)As at 31 March 2018 - - 350,000,000 147,000,000 497,000,000
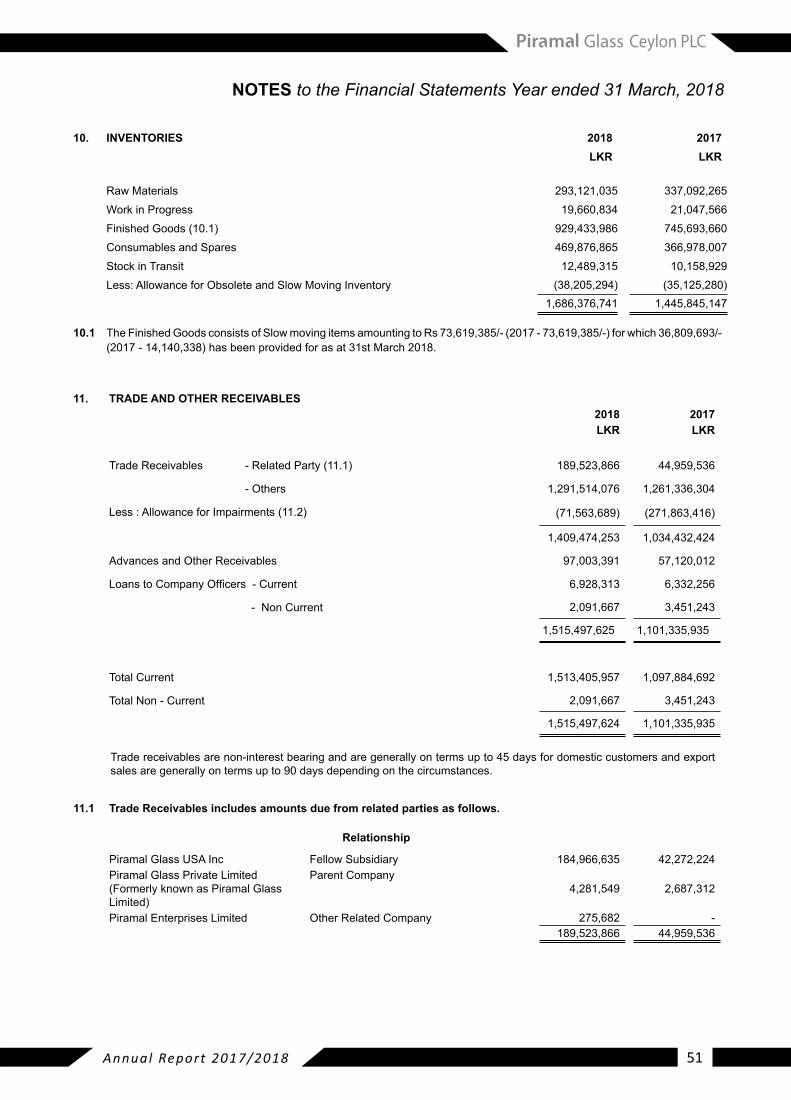
Annual Report 2017/2018 51
10. INVENTORIES 2018 2017LKR LKR
Raw Materials 293,121,035 337,092,265 Work in Progress 19,660,834 21,047,566 Finished Goods (10.1) 929,433,986 745,693,660 Consumables and Spares 469,876,865 366,978,007 Stock in Transit 12,489,315 10,158,929 Less:AllowanceforObsoleteandSlowMovingInventory (38,205,294) (35,125,280)
1,686,376,741 1,445,845,147
10.1 The Finished Goods consists of Slow moving items amounting to Rs 73,619,385/- (2017 - 73,619,385/-) for which 36,809,693/- (2017 - 14,140,338) has been provided for as at 31st March 2018.
11. TRADE AND OTHER RECEIVABLES2018 2017LKR LKR
Trade Receivables - Related Party (11.1) 189,523,866 44,959,536
- Others 1,291,514,076 1,261,336,304
Less:Allowance for Impairments (11.2) (71,563,689) (271,863,416)
1,409,474,253 1,034,432,424
Advances and Other Receivables 97,003,391 57,120,012
LoanstoCompanyOfficers-Current 6,928,313 6,332,256
- Non Current 2,091,667 3,451,243
1,515,497,625 1,101,335,935
Total Current 1,513,405,957 1,097,884,692
Total Non - Current 2,091,667 3,451,243
1,515,497,624 1,101,335,935
Trade receivables are non-interest bearing and are generally on terms up to 45 days for domestic customers and export sales are generally on terms up to 90 days depending on the circumstances.
11.1 Trade Receivables includes amounts due from related parties as follows.
Relationship
Piramal Glass USA Inc Fellow Subsidiary 184,966,635 42,272,224 PiramalGlassPrivateLimited(Formerly known as Piramal Glass Limited)
Parent Company 4,281,549 2,687,312
PiramalEnterprisesLimited Other Related Company 275,682 - 189,523,866 44,959,536
NOTES to the Financial Statements Year ended 31 March, 2018
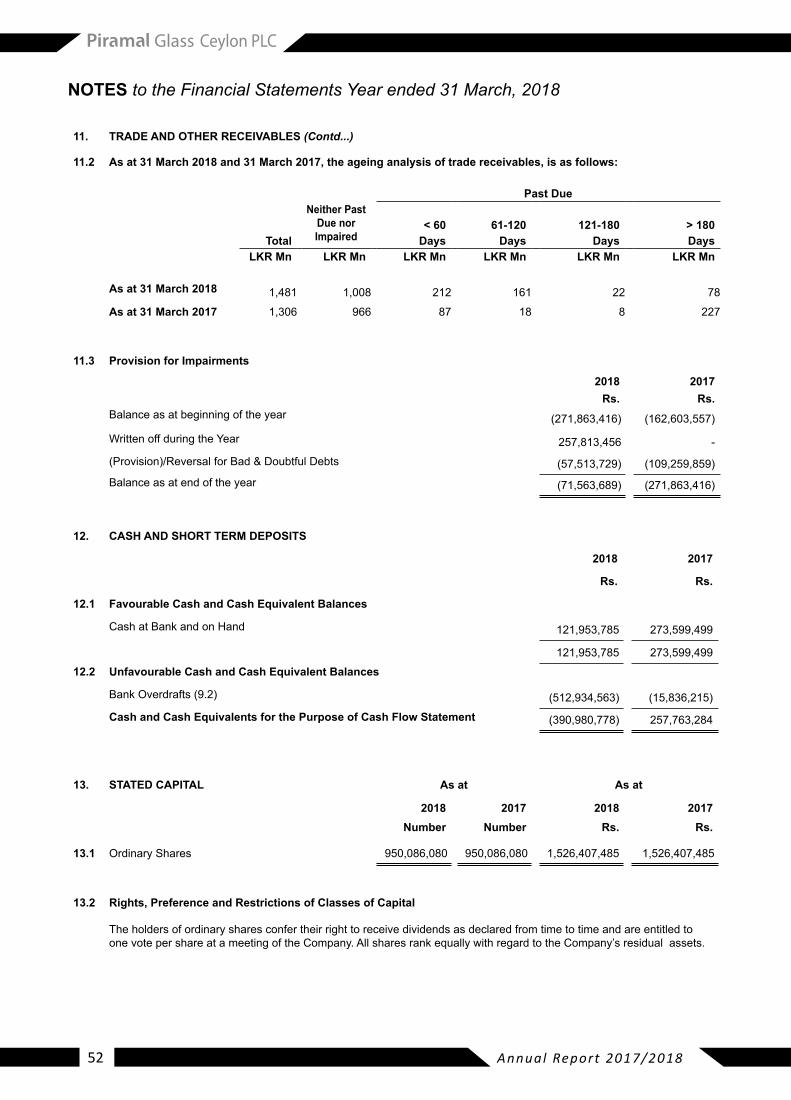
Annual Report 2017/201852
NOTES to the Financial Statements Year ended 31 March, 2018
12. CASH AND SHORT TERM DEPOSITS
2018 2017
Rs. Rs.
12.1 Favourable Cash and Cash Equivalent Balances
Cash at Bank and on Hand 121,953,785 273,599,499
121,953,785 273,599,499 12.2 Unfavourable Cash and Cash Equivalent Balances
Bank Overdrafts (9.2) (512,934,563) (15,836,215)
Cash and Cash Equivalents for the Purpose of Cash Flow Statement (390,980,778) 257,763,284
13. STATED CAPITAL As at As at
2018 2017 2018 2017Number Number Rs. Rs.
13.1 Ordinary Shares 950,086,080 950,086,080 1,526,407,485 1,526,407,485
13.2 Rights, Preference and Restrictions of Classes of Capital
The holders of ordinary shares confer their right to receive dividends as declared from time to time and are entitled to one vote per share at a meeting of the Company. All shares rank equally with regard to the Company’s residual assets.
11. TRADE AND OTHER RECEIVABLES (Contd...)
11.2 As at 31 March 2018 and 31 March 2017, the ageing analysis of trade receivables, is as follows:
Past DueNeither Past
Due nor Impaired
< 60 61-120 121-180 > 180Total Days Days Days Days
LKR Mn LKR Mn LKR Mn LKR Mn LKR Mn LKR Mn
As at 31 March 2018 1,481 1,008 212 161 22 78
As at 31 March 2017 1,306 966 87 18 8 227
11.3 Provision for Impairments
2018Rs.
2017Rs.
Balance as at beginning of the year (271,863,416) (162,603,557)
Written off during the Year 257,813,456 - (Provision)/Reversal for Bad & Doubtful Debts (57,513,729) (109,259,859)Balance as at end of the year (71,563,689) (271,863,416)
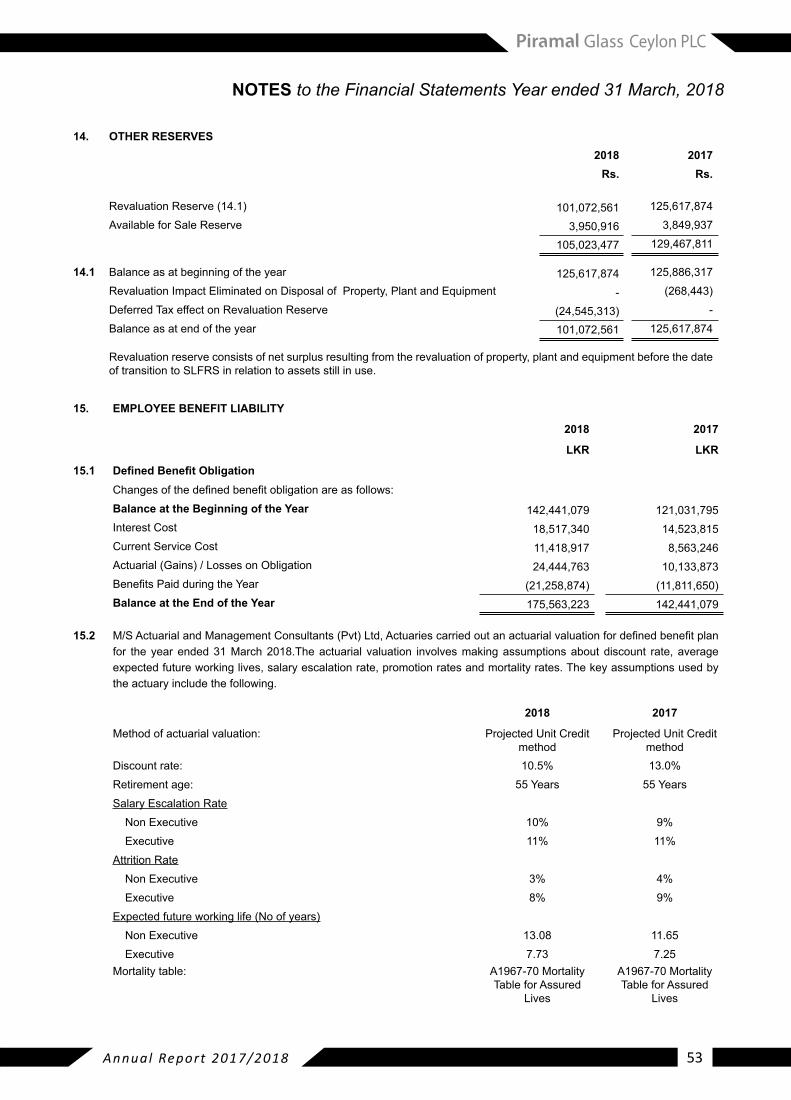
Annual Report 2017/2018 53
NOTES to the Financial Statements Year ended 31 March, 2018
15. EMPLOYEE BENEFIT LIABILITY
2018 2017
LKR LKR
15.1 Defined Benefit ObligationChangesofthedefinedbenefitobligationareasfollows:Balance at the Beginning of the Year 142,441,079 121,031,795 Interest Cost 18,517,340 14,523,815 Current Service Cost 11,418,917 8,563,246 Actuarial(Gains)/LossesonObligation 24,444,763 10,133,873 BenefitsPaidduringtheYear (21,258,874) (11,811,650)Balance at the End of the Year 175,563,223 142,441,079
15.2 M/SActuarialandManagementConsultants(Pvt)Ltd,Actuariescarriedoutanactuarialvaluationfordefinedbenefitplanfor the year ended 31 March 2018.The actuarial valuation involves making assumptions about discount rate, average expected future working lives, salary escalation rate, promotion rates and mortality rates. The key assumptions used by the actuary include the following.
2018 2017
Method of actuarial valuation: Projected Unit Credit method
Projected Unit Credit method
Discount rate: 10.5% 13.0%Retirement age: 55 Years 55 YearsSalary Escalation Rate Non Executive 10% 9% Executive 11% 11%
Attrition Rate Non Executive 3% 4% Executive 8% 9%
Expected future working life (No of years) Non Executive 13.08 11.65 Executive 7.73 7.25
Mortality table: A1967-70 Mortality Table for Assured
Lives
A1967-70 Mortality Table for Assured
Lives
14. OTHER RESERVES2018 2017
Rs. Rs.
Revaluation Reserve (14.1) 101,072,561 125,617,874 Available for Sale Reserve 3,950,916 3,849,937
105,023,477 129,467,811
14.1 Balance as at beginning of the year 125,617,874 125,886,317 Revaluation Impact Eliminated on Disposal of Property, Plant and Equipment - (268,443)Deferred Tax effect on Revaluation Reserve (24,545,313) - Balance as at end of the year 101,072,561 125,617,874
Revaluation reserve consists of net surplus resulting from the revaluation of property, plant and equipment before the date oftransitiontoSLFRSinrelationtoassetsstillinuse.
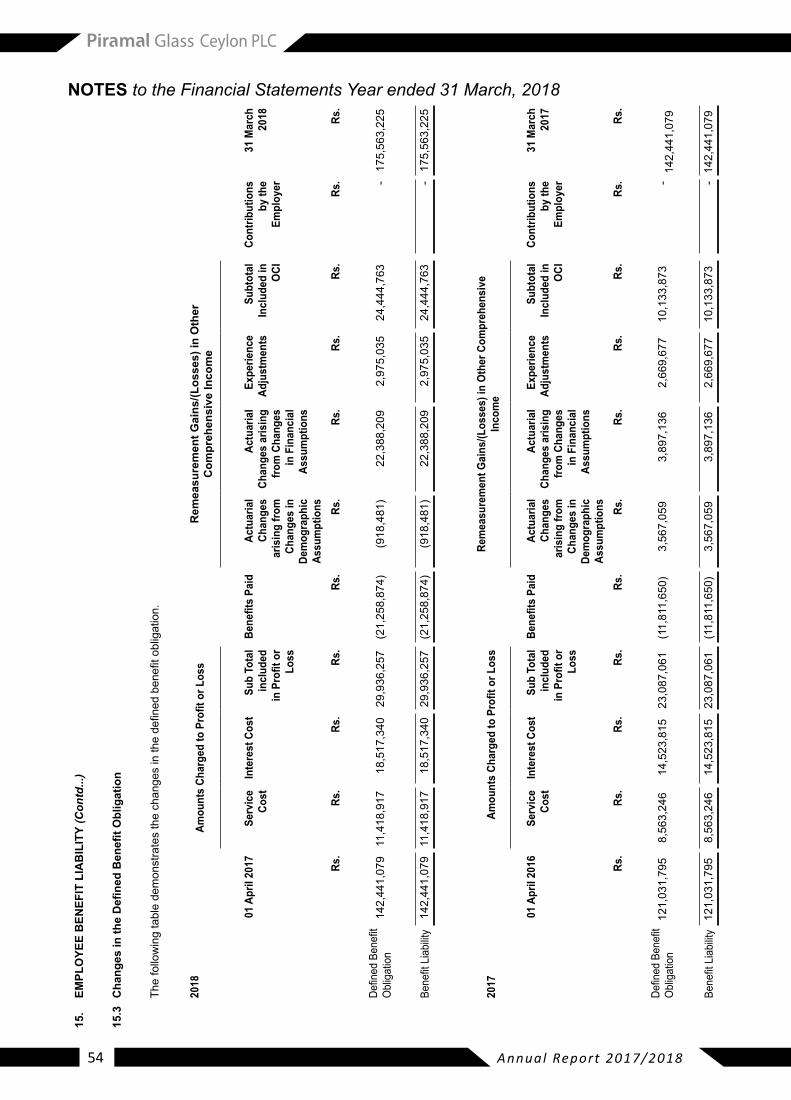
Annual Report 2017/201854
NOTES to the Financial Statements Year ended 31 March, 201815
.EM
PLO
YEE
BEN
EFIT
LIA
BIL
ITY
(Con
td...
)
15.3
Cha
nges
in th
e D
efine
d B
enefi
t Obl
igat
ion
Thefollowingtabledemonstratesthechangesinthedefinedbenefitobligation.
2018
Amou
nts
Char
ged
to P
rofit
or L
oss
Rem
easu
rem
ent G
ains
/(Los
ses)
in O
ther
C
ompr
ehen
sive
Inco
me
01 A
pril
2017
Serv
ice
Cost
Inte
rest
Cos
tSu
b To
tal
incl
uded
in
Pro
fit o
r Lo
ss
Bene
fits
Paid
Actu
aria
l Ch
ange
s ar
isin
g fro
m
Chan
ges
in
Dem
ogra
phic
As
sum
ptio
ns
Actu
aria
l Ch
ange
s ar
isin
g fro
m C
hang
es
in F
inan
cial
As
sum
ptio
ns
Expe
rienc
e Ad
just
men
tsSu
btot
al
Incl
uded
in
OCI
Cont
ribut
ions
by
the
Empl
oyer
31 M
arch
20
18
Rs.
Rs.
Rs.
Rs.
Rs.
Rs.
Rs.
Rs.
Rs.
Rs.
Rs.
DefinedBenefit
Obl
igat
ion
142
,441
,079
11
,418
,917
1
8,51
7,34
0 2
9,93
6,25
7 (2
1,25
8,87
4) (9
18,4
81)
22,
388,
209
2,9
75,0
35
24,
444,
763
- 1
75,5
63,2
25
BenefitLiability
142
,441
,079
11
,418
,917
1
8,51
7,34
0 2
9,93
6,25
7 (2
1,25
8,87
4) (9
18,4
81)
22,
388,
209
2,9
75,0
35
24,
444,
763
- 1
75,5
63,2
25
Rem
easu
rem
ent G
ains
/(Los
ses)
in O
ther
Com
preh
ensi
ve
Inco
me
2017
Amou
nts
Char
ged
to P
rofit
or L
oss
01 A
pril
2016
Serv
ice
Cost
Inte
rest
Cos
tSu
b To
tal
incl
uded
in
Pro
fit o
r Lo
ss
Bene
fits
Paid
Actu
aria
l Ch
ange
s ar
isin
g fro
m
Chan
ges
in
Dem
ogra
phic
As
sum
ptio
ns
Actu
aria
l Ch
ange
s ar
isin
g fro
m C
hang
es
in F
inan
cial
As
sum
ptio
ns
Expe
rienc
e Ad
just
men
tsSu
btot
al
Incl
uded
in
OCI
Cont
ribut
ions
by
the
Empl
oyer
31 M
arch
20
17
Rs.
Rs.
Rs.
Rs.
Rs.
Rs.
Rs.
Rs.
Rs.
Rs.
Rs.
DefinedBenefit
Obl
igat
ion
121
,031
,795
8
,563
,246
1
4,52
3,81
5 23
,087
,061
(1
1,81
1,65
0) 3
,567
,059
3
,897
,136
2
,669
,677
1
0,13
3,87
3 -
14
2,44
1,07
9
BenefitLiability
121
,031
,795
8
,563
,246
1
4,52
3,81
5 23
,087
,061
(1
1,81
1,65
0) 3
,567
,059
3
,897
,136
2
,669
,677
1
0,13
3,87
3 -
142,
441,
079
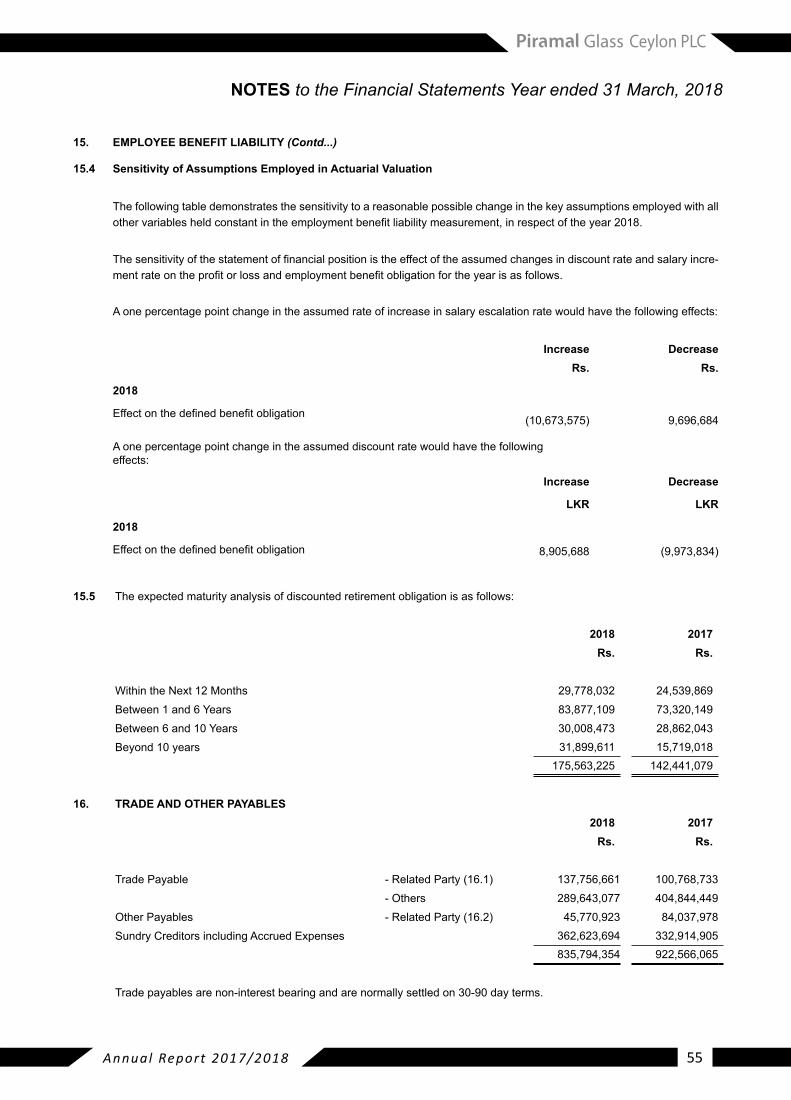
Annual Report 2017/2018 55
15. EMPLOYEE BENEFIT LIABILITY (Contd...)
15.4 Sensitivity of Assumptions Employed in Actuarial Valuation
The following table demonstrates the sensitivity to a reasonable possible change in the key assumptions employed with all othervariablesheldconstantintheemploymentbenefitliabilitymeasurement,inrespectoftheyear2018.
Thesensitivityofthestatementoffinancialpositionistheeffectoftheassumedchangesindiscountrateandsalaryincre-mentrateontheprofitorlossandemploymentbenefitobligationfortheyearisasfollows.
A one percentage point change in the assumed rate of increase in salary escalation rate would have the following effects:
Increase DecreaseRs. Rs.
2018
Effectonthedefinedbenefitobligation (10,673,575) 9,696,684
A one percentage point change in the assumed discount rate would have the following effects:
Increase Decrease
LKR LKR
2018
Effectonthedefinedbenefitobligation 8,905,688 (9,973,834)
15.5 The expected maturity analysis of discounted retirement obligation is as follows:
2018 2017Rs. Rs.
Within the Next 12 Months 29,778,032 24,539,869 Between 1 and 6 Years 83,877,109 73,320,149 Between 6 and 10 Years 30,008,473 28,862,043 Beyond 10 years 31,899,611 15,719,018
175,563,225 142,441,079
16. TRADE AND OTHER PAYABLES2018 2017
Rs. Rs.
Trade Payable - Related Party (16.1) 137,756,661 100,768,733 - Others 289,643,077 404,844,449 Other Payables - Related Party (16.2) 45,770,923 84,037,978 Sundry Creditors including Accrued Expenses 362,623,694 332,914,905
835,794,354 922,566,065
Trade payables are non-interest bearing and are normally settled on 30-90 day terms.
NOTES to the Financial Statements Year ended 31 March, 2018
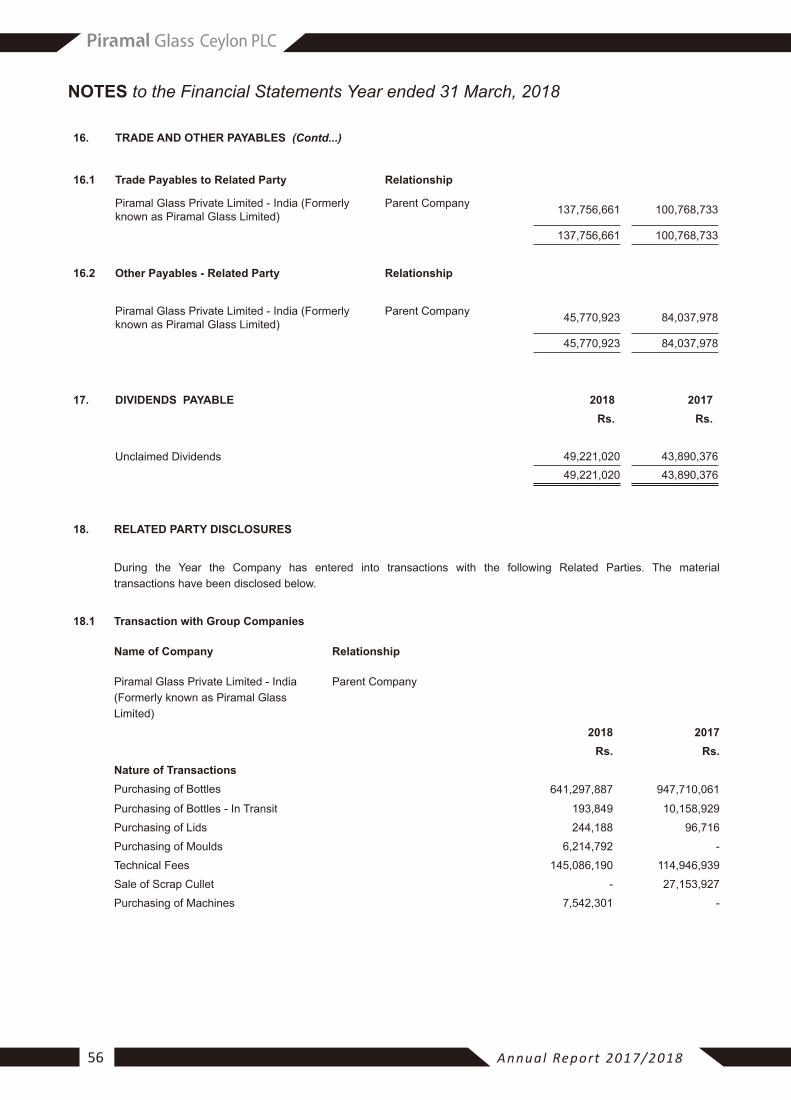
Annual Report 2017/201856
18. RELATED PARTY DISCLOSURES
During the Year the Company has entered into transactions with the following Related Parties. The material transactions have been disclosed below.
18.1 Transaction with Group Companies
Name of Company Relationship
Piramal Glass Private Limited - India (Formerly known as Piramal Glass Limited)
Parent Company
2018 2017 Rs. Rs.
Nature of TransactionsPurchasing of Bottles 641,297,887 947,710,061
Purchasing of Bottles - In Transit 193,849 10,158,929
Purchasing of Lids 244,188 96,716
Purchasing of Moulds 6,214,792 -
Technical Fees 145,086,190 114,946,939
Sale of Scrap Cullet - 27,153,927
Purchasing of Machines 7,542,301 -
16. TRADE AND OTHER PAYABLES (Contd...)
16.1 Trade Payables to Related Party Relationship
Piramal Glass Private Limited - India (Formerly known as Piramal Glass Limited)
Parent Company 137,756,661 100,768,733
137,756,661 100,768,733
16.2 Other Payables - Related Party Relationship
Piramal Glass Private Limited - India (Formerly known as Piramal Glass Limited)
Parent Company 45,770,923 84,037,978
45,770,923 84,037,978
17. DIVIDENDS PAYABLE 2018 2017Rs. Rs.
Unclaimed Dividends 49,221,020 43,890,376 49,221,020 43,890,376
NOTES to the Financial Statements Year ended 31 March, 2018

Annual Report 2017/2018 57
NOTES to the Financial Statements Year ended 31 March, 2018
18. RELATED PARTY DISCLOSURES (Contd…) 2018 2017 Rs. Rs.
Name of Company Relationship
Piramal Glass - USA, Inc. Fellow Subsidiary
Nature of TransactionSale of Bottles 408,875,132 157,913,121
Name of Company Relationship
Piramal Enterprises Limited Other Related Company
Nature of TransactionSale of Bottles 527,024 -
The amounts payable to the above related party as at 31 March 2018 and 31 March 2017 are disclosed in Notes 16.1 and 16.2 and amounts receivable from the above related parties as at 31 March 2018 and 31 March 2017 are disclosed in Note 11.1.
The sales to and purchases from related parties are made at terms equivalent to those that prevail in arm’s length transactions. Outstanding balances at the year end are unsecured and interest free.
18.2 Transactions with Directors/Key Management Personnel *2018 2017 Rs. Rs.
Short term Employee Benefi ts 96,210,123 83,154,451
Post - Employment Benefi ts - -
Other Long term Benefi ts - -
Termination Benefi ts - -Share Based Payments - -Total Compensation paid to Key Management Personnel 96,210,123 83,154,451
* Key Management personnel include the Board of Directors and the Chief Executive Offi cer of the Company.
19. COMMITMENTS AND CONTINGENCIES
19.1 Capital Expenditure CommitmentsThere are no capital expenditure commitments as at the reporting date.
19.2 Contingent Liabilities There are no signifi cant contingent liabilities as at the reporting date.

Annual Report 2017/201858
NOTES to the Financial Statements Year ended 31 March, 2018
22. FINANCIAL RISK MANAGEMENT OBJECTIVES AND POLICIES
22.1 IntroductionRisk is inherent in Company’s business activities, but is managed through a process of ongoing identification,measurement and monitoring, subject to risk limits and other controls. The Board of Directors of the Company places special consideration on the management of such risks. The Company is mainly exposed to;
a. Market riskb. Commodity price riskc. Interest rate riskd.. Exchange rate riske.Liquidityriskf. Equity price riskg. Credit risk
22.1.1 Market Risk
Marketriskistheriskthatthefairvalueoffuturecashflowsofafinancialinstrumentwillfluctuatebecauseofchangesinmarket prices. Market prices comprise four types of risk: interest rate risk, currency risk, commodity price risk and other price risk, such as equity price risk. Financial instruments affected by market risk include loans and borrowings, deposits, available-for-saleinvestmentsandderivativefinancialinstruments.
Financial risk management is carried out by Piramal Glass Ceylon Finance Division under policies approved by the Board which set out the principles and procedures with respect to risk tolerance, delegated authority levels, internal controls, management of foreign currency, interest rate and counterparty credit exposures and the reporting of exposures.
Theoverallriskmanagementprogramfocusesontheunpredictabilityoffinancialmarketsandseekstominimizepotentialadverseeffectsontheentity’sfinancialperformance.
22.1.2 Commodity Price Risk
TheEntityisaffectedbytheavailability&priceofcertaincommodities.ThemainimpactforPiramalGlassCeylonPLCisthrough energy & Imported Raw Material. The imported Raw material price risk is mitigated through long term agreements ¢ral purchasingdonebyPiramalGroupProcurementdivision.Theenergycost consistsofLPG,Furnaceoil&Electricity.
In managing the commodity price risk part of the cost increases are passed on to the customer through the annual price increases.
20. ASSETS PLEDGED
The Carrying value of property, plant and equipment pledged by the Company as security for facilities obtained from banks is as follows.
Nature of Assets Nature of Liability Carrying Value of Assets Pledged
2018 2017 Rs Mn. Rs Mn.
Immovable Properties First/Secondary Mortgage 4,998 5,559 forLoansandBorrowings
4,998 5,559
21. EVENTS OCCURRING AFTER THE REPORTING DATE
There have been no material events occurring after the reporting date that require adjustments to or disclosure in the financialstatements,excepttheBoardofDirectorsoftheCompanyhasproposedthefirstandfinaldividendofRs.0.18pershareforthefinancialyearended31March2018.
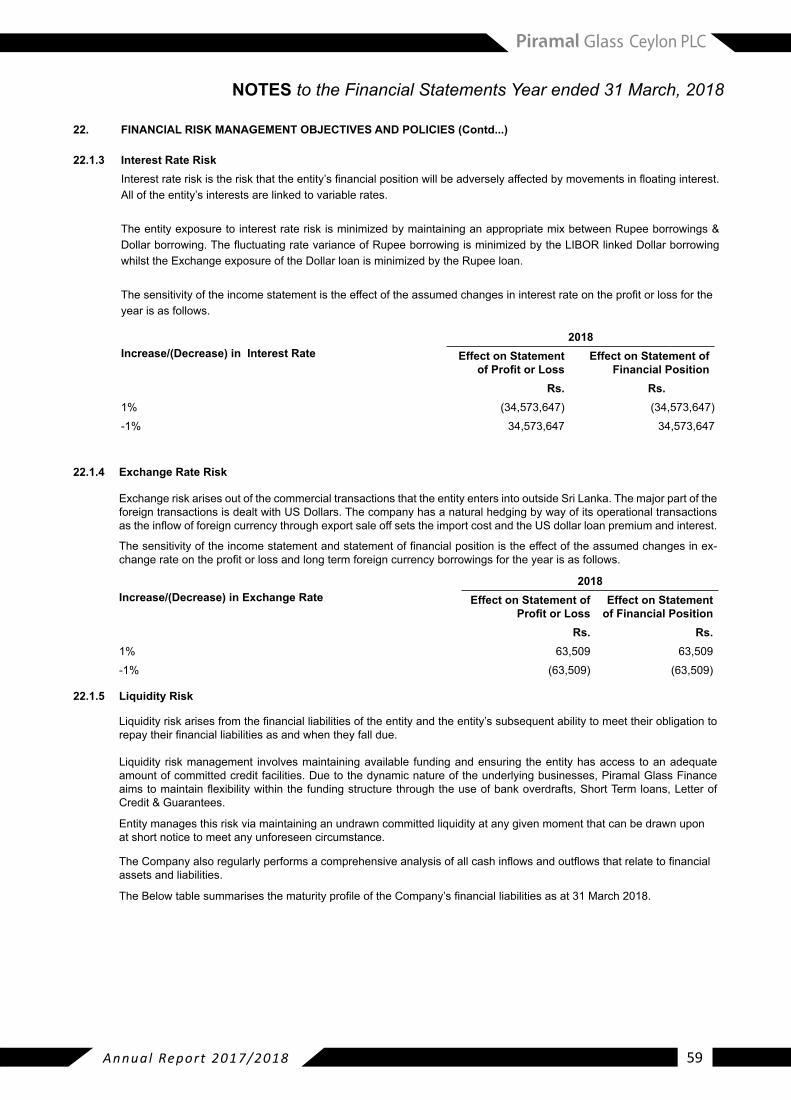
Annual Report 2017/2018 59
NOTES to the Financial Statements Year ended 31 March, 2018
22. FINANCIAL RISK MANAGEMENT OBJECTIVES AND POLICIES (Contd...)
22.1.3 Interest Rate RiskInterestrateriskistheriskthattheentity’sfinancialpositionwillbeadverselyaffectedbymovementsinfloatinginterest.All of the entity’s interests are linked to variable rates.
The entity exposure to interest rate risk is minimized by maintaining an appropriate mix between Rupee borrowings & Dollarborrowing.ThefluctuatingratevarianceofRupeeborrowingisminimizedbytheLIBORlinkedDollarborrowingwhilst the Exchange exposure of the Dollar loan is minimized by the Rupee loan.
Thesensitivityoftheincomestatementistheeffectoftheassumedchangesininterestrateontheprofitorlossfortheyear is as follows.
Increase/(Decrease) in Interest Rate2018
Effect on Statement of Profit or Loss
Effect on Statement of Financial Position
Rs. Rs.1% (34,573,647) (34,573,647)-1% 34,573,647 34,573,647
22.1.4 Exchange Rate Risk
ExchangeriskarisesoutofthecommercialtransactionsthattheentityentersintooutsideSriLanka.Themajorpartoftheforeign transactions is dealt with US Dollars. The company has a natural hedging by way of its operational transactions astheinflowofforeigncurrencythroughexportsaleoffsetstheimportcostandtheUSdollarloanpremiumandinterest.
Thesensitivityoftheincomestatementandstatementoffinancialpositionistheeffectoftheassumedchangesinex-changerateontheprofitorlossandlongtermforeigncurrencyborrowingsfortheyearisasfollows.
Increase/(Decrease) in Exchange Rate2018
Effect on Statement of Profit or Loss
Effect on Statement of Financial Position
Rs. Rs.1% 63,509 63,509 -1% (63,509) (63,509)
22.1.5 Liquidity Risk
Liquidityriskarisesfromthefinancialliabilitiesoftheentityandtheentity’ssubsequentabilitytomeettheirobligationtorepaytheirfinancialliabilitiesasandwhentheyfalldue.
Liquidity riskmanagement involvesmaintainingavailable fundingandensuring theentityhasaccess toanadequateamount of committed credit facilities. Due to the dynamic nature of the underlying businesses, Piramal Glass Finance aimstomaintainflexibilitywithinthefundingstructurethroughtheuseofbankoverdrafts,ShortTermloans,LetterofCredit & Guarantees.
Entity manages this risk via maintaining an undrawn committed liquidity at any given moment that can be drawn upon at short notice to meet any unforeseen circumstance.
TheCompanyalsoregularlyperformsacomprehensiveanalysisofallcashinflowsandoutflowsthatrelatetofinancialassets and liabilities.
TheBelowtablesummarisesthematurityprofileoftheCompany’sfinancialliabilitiesasat31March2018.
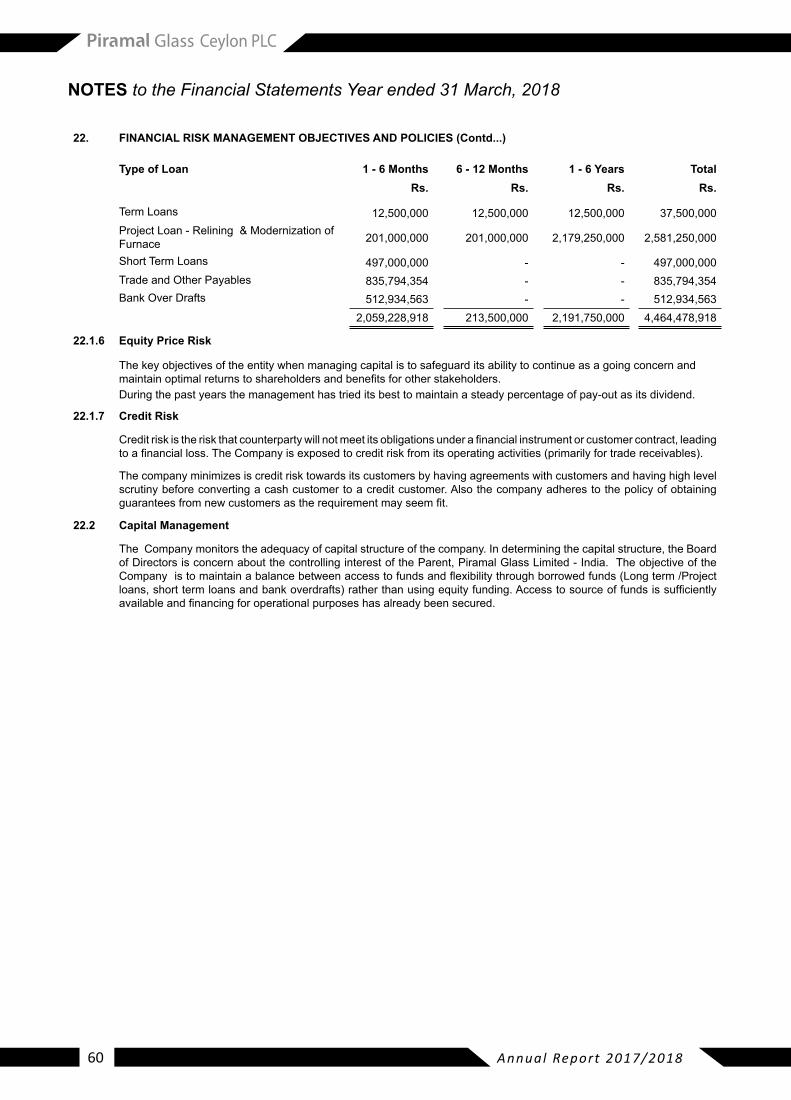
Annual Report 2017/201860
NOTES to the Financial Statements Year ended 31 March, 2018
22. FINANCIAL RISK MANAGEMENT OBJECTIVES AND POLICIES (Contd...)
Type of Loan 1 - 6 Months 6 - 12 Months 1 - 6 Years TotalRs. Rs. Rs. Rs.
TermLoans 12,500,000 12,500,000 12,500,000 37,500,000 ProjectLoan-Relining&ModernizationofFurnace 201,000,000 201,000,000 2,179,250,000 2,581,250,000
ShortTermLoans 497,000,000 - - 497,000,000 Trade and Other Payables 835,794,354 - - 835,794,354 Bank Over Drafts 512,934,563 - - 512,934,563
2,059,228,918 213,500,000 2,191,750,000 4,464,478,918
22.1.6 Equity Price Risk
The key objectives of the entity when managing capital is to safeguard its ability to continue as a going concern and maintainoptimalreturnstoshareholdersandbenefitsforotherstakeholders.During the past years the management has tried its best to maintain a steady percentage of pay-out as its dividend.
22.1.7 Credit Risk
Creditriskistheriskthatcounterpartywillnotmeetitsobligationsunderafinancialinstrumentorcustomercontract,leadingtoafinancialloss.TheCompanyisexposedtocreditriskfromitsoperatingactivities(primarilyfortradereceivables).
The company minimizes is credit risk towards its customers by having agreements with customers and having high level scrutiny before converting a cash customer to a credit customer. Also the company adheres to the policy of obtaining guaranteesfromnewcustomersastherequirementmayseemfit.
22.2 Capital Management
The Company monitors the adequacy of capital structure of the company. In determining the capital structure, the Board ofDirectorsisconcernaboutthecontrollinginterestoftheParent,PiramalGlassLimited-India.TheobjectiveoftheCompanyistomaintainabalancebetweenaccesstofundsandflexibilitythroughborrowedfunds(Longterm/Projectloans,shorttermloansandbankoverdrafts)ratherthanusingequityfunding.Accesstosourceoffundsissufficientlyavailableandfinancingforoperationalpurposeshasalreadybeensecured.
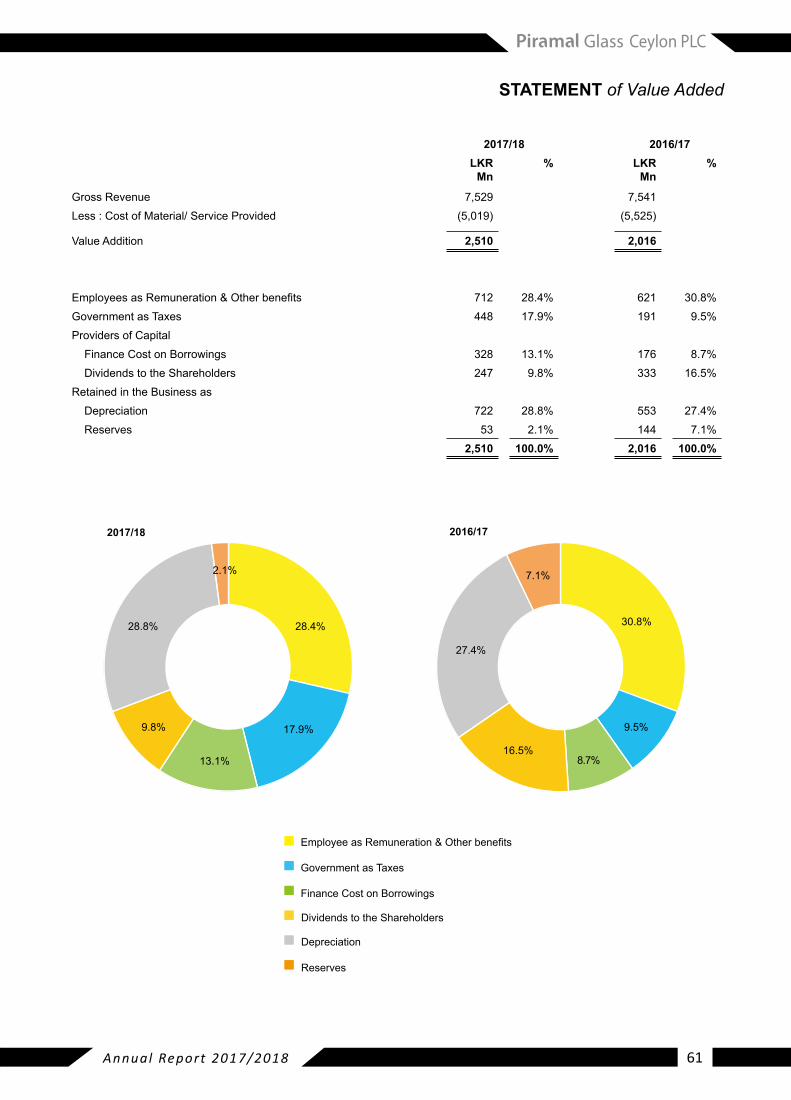
Annual Report 2017/2018 61
STATEMENT of Value Added
2017/18 2016/17
EmployeeasRemuneration&Otherbenefits
Government as Taxes
Finance Cost on Borrowings
Dividends to the Shareholders
Depreciation
Reserves
28.8%
2.1%
28.4% 30.8%
9.5%
8.7%16.5%
27.4%
7.1%
17.9%
13.1%
9.8%
2017/18 2016/17 LKR
Mn % LKR
Mn %
Gross Revenue 7,529 7,541 Less:CostofMaterial/ServiceProvided (5,019) (5,525)
Value Addition 2,510 2,016
EmployeesasRemuneration&Otherbenefits 712 28.4% 621 30.8%Government as Taxes 448 17.9% 191 9.5%Providers of Capital Finance Cost on Borrowings 328 13.1% 176 8.7% Dividends to the Shareholders 247 9.8% 333 16.5%Retained in the Business as Depreciation 722 28.8% 553 27.4% Reserves 53 2.1% 144 7.1%
2,510 100.0% 2,016 100.0%
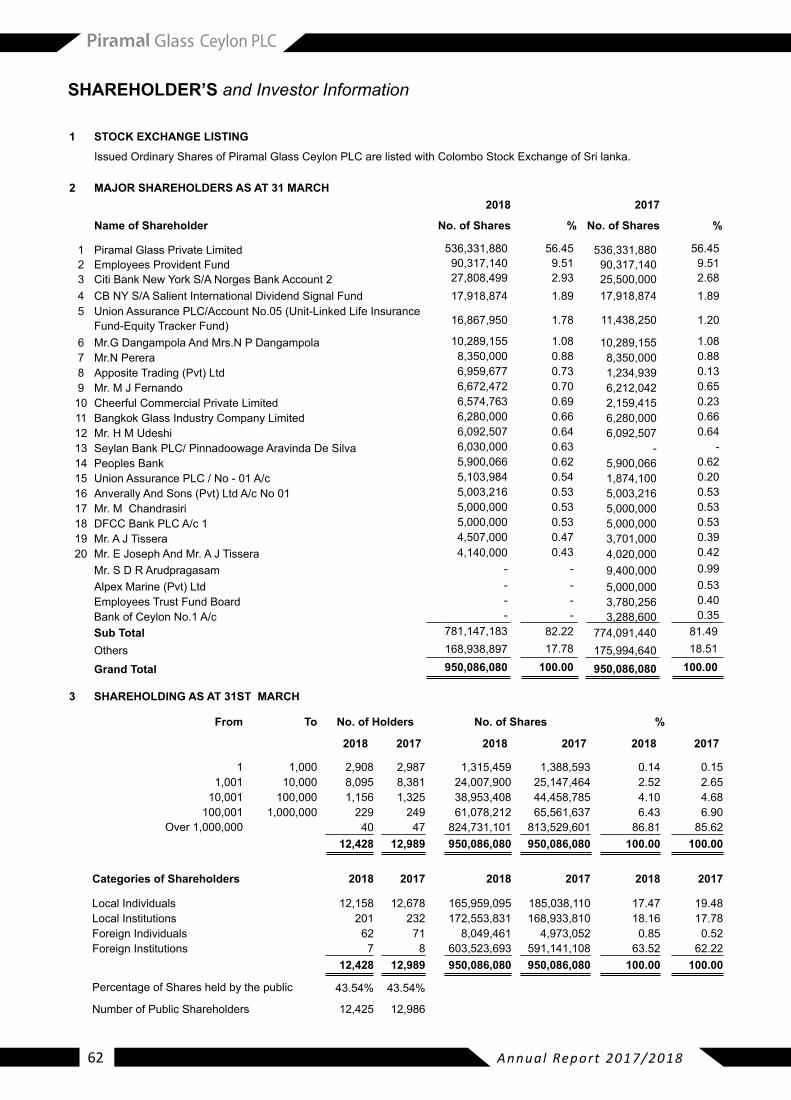
Annual Report 2017/201862
1 STOCK EXCHANGE LISTING
IssuedOrdinarySharesofPiramalGlassCeylonPLCarelistedwithColomboStockExchangeofSrilanka.
2 MAJOR SHAREHOLDERS AS AT 31 MARCH 2018 2017
Name of Shareholder No. of Shares % No. of Shares %
1 PiramalGlassPrivateLimited 536,331,880 56.45 536,331,880 56.452 Employees Provident Fund 90,317,140 9.51 90,317,140 9.513 Citi Bank New York S/A Norges Bank Account 2 27,808,499 2.93 25,500,000 2.684 CB NY S/A Salient International Dividend Signal Fund 17,918,874 1.89 17,918,874 1.895 UnionAssurancePLC/AccountNo.05(Unit-LinkedLifeInsurance
Fund-Equity Tracker Fund) 16,867,950 1.78 11,438,250 1.20
6 Mr.G Dangampola And Mrs.N P Dangampola 10,289,155 1.08 10,289,155 1.087 Mr.N Perera 8,350,000 0.88 8,350,000 0.888 AppositeTrading(Pvt)Ltd 6,959,677 0.73 1,234,939 0.139 Mr. M J Fernando 6,672,472 0.70 6,212,042 0.65
10 CheerfulCommercialPrivateLimited 6,574,763 0.69 2,159,415 0.2311 BangkokGlassIndustryCompanyLimited 6,280,000 0.66 6,280,000 0.6612 Mr. H M Udeshi 6,092,507 0.64 6,092,507 0.6413 SeylanBankPLC/PinnadoowageAravindaDeSilva 6,030,000 0.63 - - 14 Peoples Bank 5,900,066 0.62 5,900,066 0.6215 UnionAssurancePLC/No-01A/c 5,103,984 0.54 1,874,100 0.2016 AnverallyAndSons(Pvt)LtdA/cNo01 5,003,216 0.53 5,003,216 0.5317 Mr. M Chandrasiri 5,000,000 0.53 5,000,000 0.5318 DFCCBankPLCA/c1 5,000,000 0.53 5,000,000 0.5319 Mr. A J Tissera 4,507,000 0.47 3,701,000 0.3920 Mr. E Joseph And Mr. A J Tissera 4,140,000 0.43 4,020,000 0.42
Mr. S D R Arudpragasam - - 9,400,000 0.99AlpexMarine(Pvt)Ltd - - 5,000,000 0.53Employees Trust Fund Board - - 3,780,256 0.40Bank of Ceylon No.1 A/c - - 3,288,600 0.35Sub Total 781,147,183 82.22 774,091,440 81.49Others 168,938,897 17.78 175,994,640 18.51
Grand Total 950,086,080 100.00 950,086,080 100.00
3 SHAREHOLDING AS AT 31ST MARCH
From To No. of Holders No. of Shares %
2018 2017 2018 2017 2018 2017
1 1,000 2,908 2,987 1,315,459 1,388,593 0.14 0.151,001 10,000 8,095 8,381 24,007,900 25,147,464 2.52 2.65
10,001 100,000 1,156 1,325 38,953,408 44,458,785 4.10 4.68100,001 1,000,000 229 249 61,078,212 65,561,637 6.43 6.90
Over 1,000,000 40 47 824,731,101 813,529,601 86.81 85.6212,428 12,989 950,086,080 950,086,080 100.00 100.00
Categories of Shareholders 2018 2017 2018 2017 2018 2017
LocalIndividuals 12,158 12,678 165,959,095 185,038,110 17.47 19.48 LocalInstitutions 201 232 172,553,831 168,933,810 18.16 17.78 Foreign Individuals 62 71 8,049,461 4,973,052 0.85 0.52 Foreign Institutions 7 8 603,523,693 591,141,108 63.52 62.22
12,428 12,989 950,086,080 950,086,080 100.00 100.00
Percentage of Shares held by the public 43.54% 43.54%
Number of Public Shareholders 12,425 12,986
SHAREHOLDER’S and Investor Information
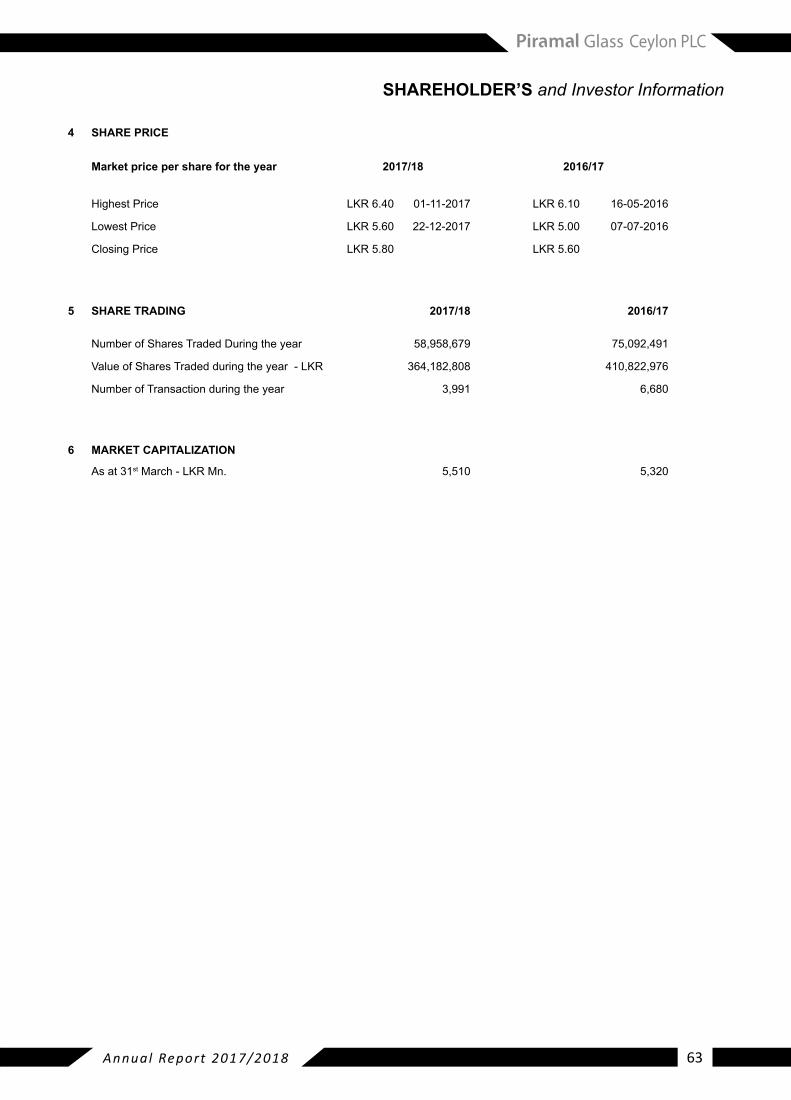
Annual Report 2017/2018 63
4 SHARE PRICE
Market price per share for the year 2017/18 2016/17
Highest Price LKR6.40 01-11-2017 LKR6.10 16-05-2016
LowestPrice LKR5.60 22-12-2017 LKR5.00 07-07-2016
Closing Price LKR5.80 LKR5.60
5 SHARE TRADING 2017/18 2016/17
Number of Shares Traded During the year 58,958,679 75,092,491
ValueofSharesTradedduringtheyear-LKR 364,182,808 410,822,976
Number of Transaction during the year 3,991 6,680
6 MARKET CAPITALIZATION
As at 31stMarch-LKRMn. 5,510 5,320
SHAREHOLDER’S and Investor Information
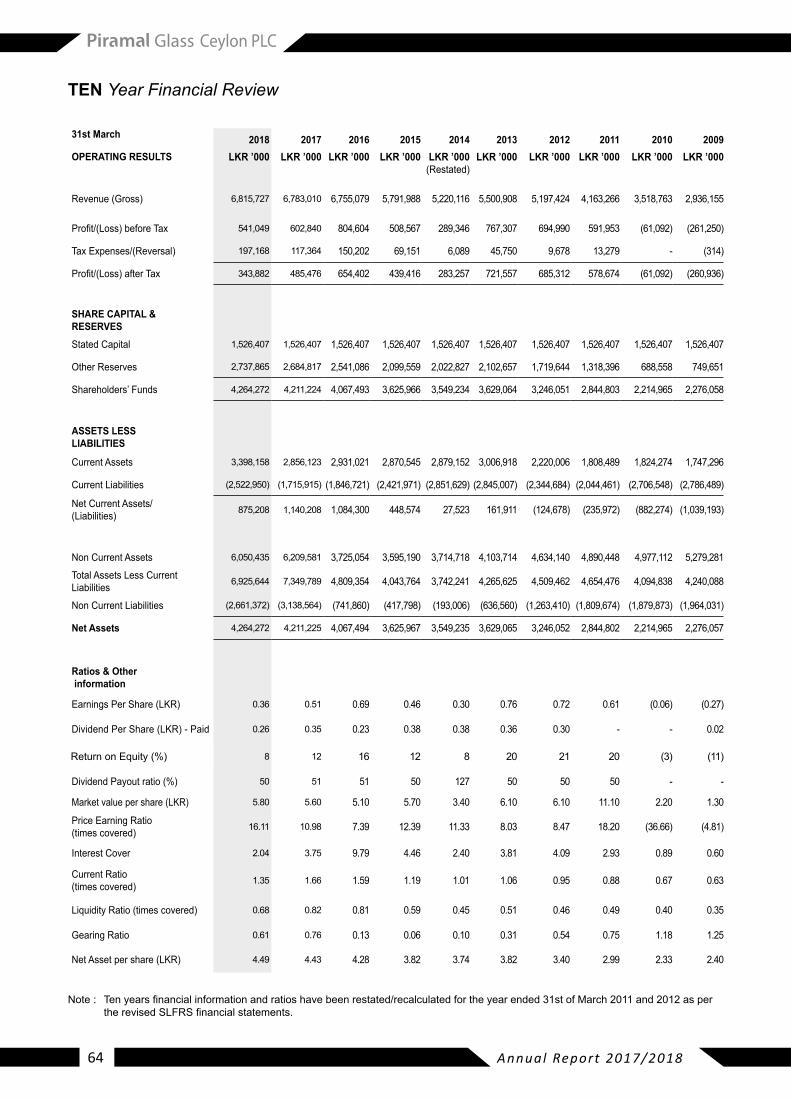
Annual Report 2017/201864
31st March 2018 2017 2016 2015 2014 2013 2012 2011 2010 2009OPERATING RESULTS LKR ’000 LKR ’000 LKR ’000 LKR ’000 LKR ’000
(Restated)LKR ’000 LKR ’000 LKR ’000 LKR ’000 LKR ’000
Revenue (Gross) 6,815,727 6,783,010 6,755,079 5,791,988 5,220,116 5,500,908 5,197,424 4,163,266 3,518,763 2,936,155
Profit/(Loss)beforeTax 541,049 602,840 804,604 508,567 289,346 767,307 694,990 591,953 (61,092) (261,250)
Tax Expenses/(Reversal) 197,168 117,364 150,202 69,151 6,089 45,750 9,678 13,279 - (314)
Profit/(Loss)afterTax 343,882 485,476 654,402 439,416 283,257 721,557 685,312 578,674 (61,092) (260,936)
SHARE CAPITAL & RESERVESStated Capital 1,526,407 1,526,407 1,526,407 1,526,407 1,526,407 1,526,407 1,526,407 1,526,407 1,526,407 1,526,407
Other Reserves 2,737,865 2,684,817 2,541,086 2,099,559 2,022,827 2,102,657 1,719,644 1,318,396 688,558 749,651
Shareholders’ Funds 4,264,272 4,211,224 4,067,493 3,625,966 3,549,234 3,629,064 3,246,051 2,844,803 2,214,965 2,276,058
ASSETS LESS LIABILITIES
Current Assets 3,398,158 2,856,123 2,931,021 2,870,545 2,879,152 3,006,918 2,220,006 1,808,489 1,824,274 1,747,296
CurrentLiabilities (2,522,950) (1,715,915) (1,846,721) (2,421,971) (2,851,629) (2,845,007) (2,344,684) (2,044,461) (2,706,548) (2,786,489)
Net Current Assets/ (Liabilities) 875,208 1,140,208 1,084,300 448,574 27,523 161,911 (124,678) (235,972) (882,274) (1,039,193)
Non Current Assets 6,050,435 6,209,581 3,725,054 3,595,190 3,714,718 4,103,714 4,634,140 4,890,448 4,977,112 5,279,281
TotalAssetsLessCurrentLiabilities 6,925,644 7,349,789 4,809,354 4,043,764 3,742,241 4,265,625 4,509,462 4,654,476 4,094,838 4,240,088
NonCurrentLiabilities (2,661,372) (3,138,564) (741,860) (417,798) (193,006) (636,560) (1,263,410) (1,809,674) (1,879,873) (1,964,031)
Net Assets 4,264,272 4,211,225 4,067,494 3,625,967 3,549,235 3,629,065 3,246,052 2,844,802 2,214,965 2,276,057
Ratios & Other information
EarningsPerShare(LKR) 0.36 0.51 0.69 0.46 0.30 0.76 0.72 0.61 (0.06) (0.27)
DividendPerShare(LKR)-Paid 0.26 0.35 0.23 0.38 0.38 0.36 0.30 - - 0.02
ReturnonEquity(%) 8 12 16 12 8 20 21 20 (3) (11)
DividendPayoutratio(%) 50 51 51 50 127 50 50 50 - -
Marketvaluepershare(LKR) 5.80 5.60 5.10 5.70 3.40 6.10 6.10 11.10 2.20 1.30
Price Earning Ratio (times covered) 16.11 10.98 7.39 12.39 11.33 8.03 8.47 18.20 (36.66) (4.81)
Interest Cover 2.04 3.75 9.79 4.46 2.40 3.81 4.09 2.93 0.89 0.60
Current Ratio (times covered) 1.35 1.66 1.59 1.19 1.01 1.06 0.95 0.88 0.67 0.63
LiquidityRatio(timescovered) 0.68 0.82 0.81 0.59 0.45 0.51 0.46 0.49 0.40 0.35
Gearing Ratio 0.61 0.76 0.13 0.06 0.10 0.31 0.54 0.75 1.18 1.25
NetAssetpershare(LKR) 4.49 4.43 4.28 3.82 3.74 3.82 3.40 2.99 2.33 2.40
TEN Year Financial Review
Note: Tenyearsfinancialinformationandratioshavebeenrestated/recalculatedfortheyearended31stofMarch2011and2012aspertherevisedSLFRSfinancialstatements.
Annual Report 2017/2018 65
Earnings/(Loss)Pershare : NetProfitAfterTaxation/NumberofShares
Dividend Per share : Dividends paid during the year/ Number of Shares
ReturnonEquity : Profit/(Loss)afterTax/Shareholders’Funds
DividendPayoutRatio : DeclaredorProposedDividendfortheyear/Profitaftertaxfortheyear
Price Earning Ratio : Market Value as at year end/ Earning Per Share
InterestCover : ProfitBeforeInterest/Interest
CurrentRatio : CurrentAsset/CurrentLiabilities
LiquidityRatio : (CurrentAsset-Stocks)/CurrentLiabilities
GearingRatio : TotalLongTermLoans/Shareholders’Fund
Net Asset per share : Shareholders’ Funds/ Number of Shares
GLOSSARY of Financial Terminology
Annual Report 2017/201866
NOTICE IS HEREBY GIVEN that the Sixty Third (63rd) Annual General meeting of the Company will be held on the 07th August 2018at10.00a.m.atHotelMountLavinia,100,HotelRoad,MountLaviniaforthefollowingpurposes.
1. To receive and consider the Annual Report of the Board and the Financial Statement of the Company for the year ended 31st March 2018, together with the Report of the Auditors thereon.
2. To re-appoint Messrs. Ernst & Young Chartered Accountants as Auditors of the Company until the next Annual General MeetingandtoauthorizetheDirectorstofixtheirremuneration.
3. To re-elect as a Director Mr. Samit Datta who retires by rotation in terms of Article 98 of the Articles of Association of the Company and being eligible has offered himself for re-election.
4. To re-elect as a director Mr.R.M.S.Fernando, who attained the age of 75 years on 29th September 2017 and retires pursuant to section 210 of the Companies Act. No.07 of 2007 and to resolve that the age limit of 70 years referred to in section 210 of the Companies Act No.07 of 2007 shall not be applicable to Mr. R.M.S.Fernando and that he shall accordingly be re-appointed.
5. To re-elect as a Director Dr. C.T.S.B.Perera who attained the age of 72 years on 16 th April 2017 and retires pursuant to section 210 of the companies Act No .07 of 2007 and to resolve that the age limit of 70 years referred to in section 210 of the Companies Act No. 07 of 2007 shall not be applicable to Dr. C.T.S.B.Perera and that he shall accordingly be re-appointed.
6. ToapproveanddeclareafinaldividendofLKR0.18pershareasauthorizedbythedirectors.
7. To approve the donations and contributions made by the directors during the year under review and to authorize the Board to determine donations and contributions for the ensuing year.
Note:
Any shareholder entitled to attend and vote is entitled to appoint a proxy to attend and vote instead of him.
A proxy need not to be a shareholder. Instruments appointing proxies must be lodged with the Company not less than 48 hours before the meeting.
By Ordered of the Board
Ms.Sagarika Jayasundera COMPANYSECRETARY&SENIORMANAGERLEGAL PIRAMALGLASSCEYLONPLC 148, Maligawa Road, Borupana, Rathmalana.
Colombo on this 08th May 2018
NOTICE of Meeting