ANNUAL REPORT 2016s2.q4cdn.com/889465930/files/doc_financials/annual/... · · 2017-03-28ANNUAL...
63
ANNUAL REPORT 2016
Transcript of ANNUAL REPORT 2016s2.q4cdn.com/889465930/files/doc_financials/annual/... · · 2017-03-28ANNUAL...

ANNUAL REPORT 2016

Contents
Letter from the Chief Executive Officer 4 Management’s Discussion and Analysis 6
Introduction 6 The Company 9 Operational Review 10 Summary of Investments 14 Financial Review 16 Results of Operations for the Year Ended December 31, 2016 20 Fourth Quarter Results 22 Summary of Quarterly Results 23 Liquidity, Capital Resources and Off-Balance Sheet Arrangements 24 Proposed Transactions 26 Transactions with Related Parties 26 Changes in Accounting Policies and Critical Accounting Estimates 26 Factors that May Affect Future Results 29 Controls and Procedures 29 Outlook 30 Financial Risk Management and Risk Factors 31
Financial Statements Independent Auditors Report FS 1-2 Consolidated Statements of Financial Position FS 3 Consolidated Statements of Loss FS 4 Consolidated Statements of Comprehensive Loss FS 5 Consolidated Statements of Changes in Equity FS 6 Consolidated Statements of Cash Flows FS 7 Notes to the Consolidated Financial Statements FS 8-24
Company Directory Back Cover

1
Crosswinds is a publicly traded private equity firm and asset manager targeting strategic and opportunistic investments in the financial services sector with a particular focus on the insurance industry. Crosswinds is in the business of developing unique opportunities and intelligently structuring investments to create and unlock synergistic value. Our disciplined approach to insurance investment structuring and asset management is designed to achieve long-term value creation for our shareholders.

2
Ø Strategic niche
We focus on investments in insurance, reinsurance and asset management, a valuable niche that is further leveraged through strategic partnerships with industry experts. Crosswinds is building a platform with a sourcing and structuring advantage to provide access to unique insurance venture opportunities.
Ø Long-Cycle Continuous Cash Flow Streams We are able to earn income and capital gains from our direct investments, as well as management fees from the money that we manage. This established business model provides diversified revenue and strong potential to generate shareholder value. We believe that artificial exit dates create subpar investment returns. We enter into investments with the view that our investments are worth owning for many years over a longer-term investment cycle.
Ø Platform For Future Growth Our investments are made as platforms for future growth both organically and through the development and implementation of complementary business segments.
Ø Skill and Experience With decades of shared experience among our executives and board members, we have the broad skill set and depth of experience to recognize and capitalize on unique opportunities.
Ø Managing Risk Our approach to risk management is based on intensive due diligence, creative deal structuring and the careful selection of investment partners and opportunities.
Ø Partnership-Based Approach Our partnership-based approach is core to our strategy. Developing relationships with strong industry partners will allow us to source and structure future accretive insurance investment opportunities.

3
Crosswinds is managed and stewarded by a skilled team, with
extensive investment banking and asset management experience. We focus our resources on niche, fragmented, and
complex opportunities in the insurance industry and we seek to actively structure our investments
to capitalize on identified synergies. Crosswinds is working to grow and expand its business across 3 key pillars:
Insurance! Reinsurance! Asset Management!

4
Letter from the Chief Executive Officer As we reflect back on 2016, it was a year spent finalizing the Crosswinds platform including adding a licensed and nominally capitalized resinsurer to its Florida based property and casualty homeowners insurance company, Monarch, and its asset management vehicle, Crosswinds AUM. We are active in the Florida market and are looking to grow our presence there. We have also been active developing liquidity options for our one remaining legacy asset, Salbro so we can narrow in on insurance and investing activities which represent the strategic focus of the company and its near-term growth. Monarch, as with all private equity investments, is subject to stages of development and growth. The best formulated plans never unfold in a linear manner but require constant revisiting, modification and improvement. The guarantee of strong returns is not possible without carefully building, monitoring and transparent reporting on progress. Crosswinds is patient but intends to be flexible and open to pursuing change as required to achieve our objectives and safeguard our capital. This is simply a function of the fact that capital demands a return. Too often the same investment mistake is made confusing being patient with patiently building value. Monarch is Crosswinds’ primary investment and it was profitable in 2016 with premiums growing strongly in the second half of the year. This is good news. However, growth in the near term is more challenging and by design to respond to market challenges and concentration of available business, we have stepped back on premium writing. In 2017 we face headwinds: pricing is unfavorable and there has been no regulatory or legislative response to the damaging effects of rising claims costs associated with assignment of benefits (AOB). Monarch does not want to be the taker of risks that are known to have artificially high loss rates attached to them. Actuarial reserves projections suggest that attritional losses will be unacceptably high. As I mentioned, we are patient and we will wait. While we recognize that Crosswinds cannot change how a USD$10 billion per year premium market in homeowners property and casualty insurance behaves, we can identify that there are required legislative and/or regulatory fixes needed for a statewide industry problem. If changes are not made, the private market will adjust and we expect that homeowner insurance premiums will rise and consumers will have fewer choices. Our intended approach is to avoid irrational behavior while seeking underwriting improvements that protect our investment. The best type of insurance market is one where insurers pay legitimate claims quickly and fairly and they equally push back against organized fraud. From our vantage point, much of the AOB activity is tantamount to organized fraud. It is not a question of an insureds proper assignment of a property right to fix a broken sink or toilet but rather a scheme to create an inflated claim and line the pockets of third party non-insureds. There is no legitimate reason for these third parties to enter into the insured to insurer relationship other than fraud. It sounds dire but it is not: it’s a tax on the consumer. Insurers will raise their rates. As we observe these developments, it is not lost upon us that eventually as prices rise, these AOB practices will be seen as unsustainable. Perhaps it will take longer than some would like but Floridians aren’t interested in paying more than required for homeowners insurance due to unscrupulous bad actors. At Crosswinds AUM, we profitably invested the Monarch float with a focus on low portfolio duration and high credit quality. We believe ultimately that higher interest rates will help us, as we have cash to deploy and are actively seeking to add to the portfolio. Part of Crosswinds’ initial attraction to the primary insurance business is equally going to be its biggest risk going forward. Attraction: slow to change; Risk: change is inevitable. The insurance industry has

5
been a slow embracer of technology. The industry does buy and use software tools improve certain functions but it has not to date fully harnessed its capacity to use, analyze and synthesize its own data. It buys stale industry data and tries to match proprietary data to industry wide data. It seems for many in the industry, rather than their own data working for them, they are working for the data. This lack of data management is allowing creative disruptive upstarts to gain market share in many areas including:
1) Distribution; 2) Underwriting Systems; 3) Claims Management; and 4) Risk Management.
We at Crosswinds are excited about these opportunities as they will permit small new players to build innovative models without the industry’s high-cost baggage. Both Monarch and Crosswinds Re are variable cost models. High fixed cost legacy models are hard to fix and disruptive to existing businesses. For 2017, we are not going to hope and pray AOB gets better. We will seek change to improve underwriting procedures to pre-identify the propensity and we will work with our partner to handle these types of claims aggressively. At the same time, we will assess the amount of rate required to stay ahead of the loss curve. On the reinsurance front, pricing is unfavorable and innovation is required. We get asked frequently why Crosswinds has established a reinsurer and why it would seek to “double” its risk by being exposed to both primary insurance and reinsurance. The simple answer is that that is not what we want to do nor what we are doing. In our model, we focus on each dollar of premium generated and its associated risk. Reinsurance is our offensive risk management tool that will allow us to originate premiums. Without a reinsurance vehicle, too many third parties will be taking those premiums and managing our risk. We don’t like that model. We want to control our likely outcomes. We will do so in a low cost and capital efficient manner. If reinsurance rates are insufficient to meet our risk adjusted return targets then we will invest our capital prudently and wait. As we look forward into 2017, we are focused on the following:
• continue to profitably improve the operating performance of Monarch; • activating Crosswinds Re for the 2017 Florida reinsurance renewal season; • raising private capital so we are ready to move on opportunities as they present themselves; • developing a strategy and opportunities in the InsurTech space; • focusing on subsidiary-level contributions to net income and cash flows to achieve sustainable
growing levels in 2018 and beyond. Sincerely, “Colin King” Colin King Chief Executive Officer
6
Management’s Discussion and Analysis Introduction This management’s discussion and analysis (“MD&A”) for Crosswinds Holdings Inc. (“Crosswinds” or the “Company”) includes information designed to help you understand management’s perspective of our audited consolidated financial statements and notes thereto for the year ended December 31, 2016 (“Financial Statements”). This commentary in this MD&A is presented as at December 31, 2016 and updated based on information available up to March 27, 2017.
We encourage you to read our audited consolidated financial statements and the related notes as you review this MD&A. You can find more information about Crosswinds, including our financial statements and our most recent annual information form dated as at March 27, 2017, on our website at www.crosswindsinc.com or on The System for Electronic Document Analysis and Retrieval (“SEDAR”) at www.sedar.com.
The Company’s common shares (“Shares”) are listed and traded on the Toronto Stock Exchange (“TSX”) under the symbol “CWI”.
Unless we have specified otherwise, all dollar amounts in this MD&A are in Canadian dollars. Certain amounts are shown in U.S. dollars (“USD”).
The USD to Canadian dollar closing exchange rate on December 31, 2016 was USD$1.00 = CDN $1.3427 and averaged USD$1.00 = CDN $1.3245 for the year ended December 31, 2016, based in each case on the Bank of Canada closing exchange rates for the applicable period. The Company reports its Financial Statements using accounting policies consistent with International Financial Reporting Standards (“IFRS”).
7
FINANCIAL HIGHLIGHTS FOR THE YEAR ENDED DECEMBER 31, 2016
§ Revenues of $434,570 compared to $595,075 for the same period in 2015; § Net gain from results of investments of $958,675 compared to $19,186 for the same period in 2015;
and § Net loss of $(824,822) or $(0.16) per Share attributable to Crosswinds’ shareholders compared to
net loss of $(1,906,850) or $(0.36) per Share attributable to Crosswinds’ shareholders for the same period in 2015.
FINANCIAL POSITION AS AT DECEMBER 31, 2016
§ Cash of $1,566,053 or $0.30 per Share; § Investment in Monarch of $18,269,925 or $3.44 per Share; § Investment in Salbro valued at $3,052,140 or $0.58 per Share; and § Net book value of $22,812,582 or $4.30 per Share2 of which $20,202,732 or $3.81 per Share2 is
attributable to the shareholders of Crosswinds. 2Net book value per share is a non-IFRS financial measure and is calculated as total shareholders’ equity under IFRS divided by the number of Shares outstanding at period-end. The Company has reported two net book value measures: one reflecting net book value on a consolidated basis including non-controlling interests with respect to the Company’s investment in Monarch and the other reflecting the net book value attributable solely to the Company’s shareholders without non-controlling interests. See the cautionary statement regarding use of non-IFRS financial measures on page 9 of this MD&A.
CAUTION REGARDING FORWARD-LOOKING INFORMATION
This MD&A contains information that is forward-looking and is subject to risks and uncertainties. Forward-looking information includes information concerning the Company’s possible or assumed future operations, financial performance, achievements, results, business strategy, plans, goals, and objectives. Often, but not always, forward-looking statements can be identified by the use of forward-looking words such as “will”, “expect”, “intend”, “plan”, “estimate”, “anticipate”, “believe”, “potential” or “continue”, similar words or words with similar connotation or the negative thereof. These statements are subject to known and unknown risks, uncertainties and other factors that could cause actual results to differ materially from anticipated future results, performance or achievements expressed or implied by such forward-looking statements. Forward-looking statements are not guarantees and there can be no assurance that the plans, intentions or expectations upon which these forward-looking statements are based will occur.
Factors which could cause actual results to differ materially from those set forth in the forward-looking statements include (but are not limited to): risks associated with general economic conditions; the Company’s dependence on management of portfolio companies and joint venture partners; the limited number and concentration of the Company’s investments; equity prices and credit spreads that could negatively impact the investment portfolio of our investee; heavy regulation of the insurance business and risk of changes in regulation which could reduce the profitability of investments and limit growth; concentration of credit risk; ability to maintain minimum capital and surplus requirements for insurance investments; performance of investments being impacted by business cycles in the property and
8
casualty insurance industry; ratings received by investees by insurance rating agencies and the ability of Monarch to maintain financial or claims paying ability ratings; cycles of insurance market and general economic conditions which can substantially influence Monarch and Monarch’s competitors premium rates and capacity to write new business; exposure to credit risk in the event reinsurers fail to make payments under reinsurance agreements or the insured or Monarch’s general managing agent failing to remit to Monarch premiums owed; timing of claims payments being sooner, or receipt of reinsurance payments being later than anticipated; occurrence of catastrophic events with frequency or severity exceeding our estimates; the Company’s dependence on key personnel and contractors; leverage of the businesses in which the Company invests; the market for the Company’s Shares, limited liquidity and volatility of the Company’s trading price; the trading price of the Company’s Shares relative to the net book value (net asset value); risks affecting the Company’s investments; the need for the Company to make follow-on investments in portfolio companies; use of investment proceeds; investments by the Company in illiquid securities including private issuers; joint investments with third parties; conflicts of interest; no guaranteed returns; risks associated with the implementation of our business, growth and investment strategies; availability and available terms of any required capital to implement corporate objectives and those of portfolio companies; availability and terms of any required financing; availability and timing for receipt of any required regulatory, shareholder or other approvals; the potential loss of investment in Shares; management of the future prospects of the Company; the availability of suitable acquisition opportunities; competition for investments; the Company’s limited operating history in certain segments where it invests; shifts in target exit dates and investment rates of return for investments; tax treatment; fluctuation of currency exchange; remaining eligibility and continued qualification for exchange listing on the stock exchange on which the Company’s Shares trade; changes in market variables including foreign exchange rates, and other risks detailed from time to time in the Company’s continuous disclosure documents.
The reader should not place undue reliance on forward-looking statements and information because they involve significant and diverse risks and uncertainties. By its nature, forward-looking information involves numerous assumptions, inherent risks and uncertainties, both general and specific, that contribute to the possibility that the predictions, forecasts, projections and various future events will not occur. Unless otherwise stated, all forward-looking statements speak only as of the date of this MD&A. The Company undertakes no obligation to update publicly or otherwise revise any forward-looking information whether as a result of new information, future events or other such factors which affect this information, except as required by law. These cautionary statements expressly qualify all forward-looking information in this MD&A.
CAUTIONARY STATEMENT REGARDING THE VALUATION OF INVESTMENT IN SALBRO
In the absence of an active market for its investment in Salbro, fair values for this investment are determined by management using the appropriate valuation methodologies after considering the history and nature of the business, operating results and financial conditions, outlook and prospects, general economic, industry and market conditions, capital market and transaction market conditions, contractual rights relating to the investment, public market comparables, private market transaction multiples and, where applicable, other pertinent considerations. The process of valuing investments for which no active market exists is inevitably based on inherent uncertainties and the resulting values may differ from values that would have been used had an active market existed. The amounts at which the Company's investments in private entities could be disposed of may differ from the fair value assigned and the differences could be material.

9
CAUTIONARY STATEMENT REGARDING USE OF NON-IFRS FINANCIAL MEASURES
This MD&A makes reference to the net book value per Share, both on a consolidated basis including non-controlling interests with respect to the Company’s investment in Monarch and on a non-consolidated basis attributable solely to the Company’s shareholders without non-controlling interests. These measures are non-IFRS financial measures. The Company calculates the net book values per Share as it believes it to be an important metric that shareholders use and frequently request and refer to because shareholders often view the Company as a holding company of investments. These non-IFRS financial measures do not have any standardized meaning prescribed by IFRS and therefore are unlikely to be comparable to a similar measure presented by other issuers. This classification is not an IFRS measure and should not be considered either in isolation of, or as a substitute for, a measure prepared in accordance with IFRS.
The Company The following provides a brief overview of the Company and its operations.
Crosswinds is a publicly traded private equity firm and asset manager targeting strategic and opportunistic investments in the financial services sector with a particular focus on the insurance industry. Crosswinds is working to develop a hybrid structure of traditional private equity and a holding company with a view to future flexibility to attract cost effective capital with which to execute its investment strategies, as further described herein. The Company has three key segments to its business which have been designed to work together to capture various components of the value chain of the insurance business: 1. Primary Insurance:
The Company’s investment in Monarch National Insurance Company (“Monarch Insurance”), a Florida-based property and casualty insurance carrier, represents its platform investment in the insurance sector. In the Company’s view, the insurance market in Florida is well positioned for consolidation and greater capital efficiency and presents a number of future opportunities.
In March 2015, the Company completed the formation of a joint venture, creating Monarch Insurance, together with Federated National Holding Company (“Federated National”), an insurance holding company (the “Monarch Joint Venture”). Transatlantic Reinsurance Company (“TransRe”) has a minority position in the Monarch Joint Venture. Monarch Insurance is licensed as an admitted carrier in the State of Florida. An admitted carrier is an insurance company that has received a license from the state department of insurance giving the company the authority to write specific lines of insurance in that state. These companies are also bound by rate and form regulations and are strictly regulated.
The Monarch Joint Venture includes the following entities: Monarch Delaware LLC (“Monarch Parent”), Monarch National Holding Company (“Monarch Holding”) and Monarch Insurance. Monarch Parent, Monarch Holding and Monarch Insurance are referred to collectively as the “Monarch Entities”. The Monarch Entities are a significant investee of the Company. Monarch Parent had an initial equity capitalization of USD $33million. Crosswinds’ economic interest in Monarch Parent is approximately

10
36.4% and Crosswinds controls 50% of the voting rights of Monarch Parent.
2. Reinsurance: The Company established and licensed Crosswinds Re, a specialty reinsurer in the Cayman Islands during 2016. Crosswinds Re has not commenced active business but expects to do so for wind season in Q2 of 2017.
Reinsurance is the highest cost of goods for the insurance industry. Crosswinds Re is expected to be additive to the Company’s primary insurance business and the Monarch Joint Venture, it is intended to profitably enhance the risk management of Monarch and forms an integral part of the Company’s future growth and acquisition strategies. The Company plans to use Crosswinds Re to provide servicing capabilities to the Company’s investees and to be a capital efficient and risk sensitive vehicle with portions of risk retention being redistributed through various channels such as insurance linked securities and retrocessional markets. Initially, Crosswinds Re intends to provide reinsurance to Monarch subject to market conditions and regulatory and other approvals. There can be no assurance that conditions will be favorable or that such approvals will be received. 3. Asset Management: The Company’s wholly-owned subsidiary, Crosswinds AUM LLC (“Crosswinds AUM”) conducts its asset management activities. Crosswinds AUM is a registered investment advisor with the United States Securities and Exchange Commission and manages the assets of the Monarch Entities. Subject to the receipt of any required approvals, Crosswinds AUM is expected to manage the assets of Crosswinds Re once it is further capitalized and active in its operations. The Monarch Entities are party to an Investment Management Agreement (the “Investment Agreement”) with Crosswinds AUM. Crosswinds AUM manages the Monarch Entities’ investment portfolio for an annual management fee calculated as 0.75% of assets under management up to $100 million; 0.50% of assets under management of more than $100 million but less than $200 million; and 0.30% of assets under management of more than $200 million.
4. Legacy: The Company continues to be invested in a legacy private equity investment in Salbro Bottle Inc. and related companies (collectively referred to as “Salbro”) and is actively seeking to monetize this position and focus on growing and expanding its core business segments described above. For a more comprehensive review of the Company and its operations, please refer to other sections of this MD&A including the “Outlook” section and the Company’s most recent annual information form as updated by periodic news releases, all available under the Company’s profile on SEDAR at www.sedar.com.
Operational Review Consolidated Performance Crosswinds achieved profitability in the fourth quarter of 2016. Although the Company’s largest investment, Monarch, has been operating in a challenging environment in Florida and has not grown at the rate initially expected by the Company, Monarch did achieve profitability throughout 2016.
11
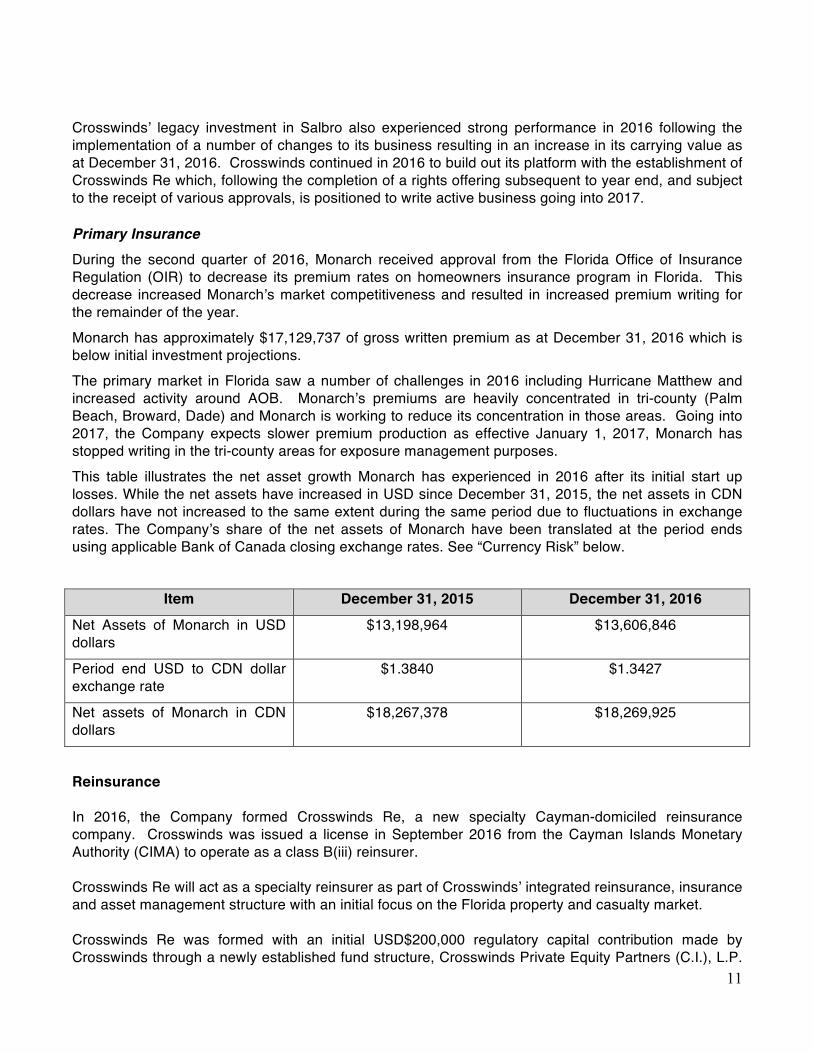
Crosswinds’ legacy investment in Salbro also experienced strong performance in 2016 following the implementation of a number of changes to its business resulting in an increase in its carrying value as at December 31, 2016. Crosswinds continued in 2016 to build out its platform with the establishment of Crosswinds Re which, following the completion of a rights offering subsequent to year end, and subject to the receipt of various approvals, is positioned to write active business going into 2017. Primary Insurance During the second quarter of 2016, Monarch received approval from the Florida Office of Insurance Regulation (OIR) to decrease its premium rates on homeowners insurance program in Florida. This decrease increased Monarch’s market competitiveness and resulted in increased premium writing for the remainder of the year. Monarch has approximately $17,129,737 of gross written premium as at December 31, 2016 which is below initial investment projections. The primary market in Florida saw a number of challenges in 2016 including Hurricane Matthew and increased activity around AOB. Monarch’s premiums are heavily concentrated in tri-county (Palm Beach, Broward, Dade) and Monarch is working to reduce its concentration in those areas. Going into 2017, the Company expects slower premium production as effective January 1, 2017, Monarch has stopped writing in the tri-county areas for exposure management purposes. This table illustrates the net asset growth Monarch has experienced in 2016 after its initial start up losses. While the net assets have increased in USD since December 31, 2015, the net assets in CDN dollars have not increased to the same extent during the same period due to fluctuations in exchange rates. The Company’s share of the net assets of Monarch have been translated at the period ends using applicable Bank of Canada closing exchange rates. See “Currency Risk” below.
Item December 31, 2015 December 31, 2016
Net Assets of Monarch in USD dollars
$13,198,964 $13,606,846
Period end USD to CDN dollar exchange rate
$1.3840 $1.3427
Net assets of Monarch in CDN dollars
$18,267,378 $18,269,925
Reinsurance In 2016, the Company formed Crosswinds Re, a new specialty Cayman-domiciled reinsurance company. Crosswinds was issued a license in September 2016 from the Cayman Islands Monetary Authority (CIMA) to operate as a class B(iii) reinsurer. Crosswinds Re will act as a specialty reinsurer as part of Crosswinds’ integrated reinsurance, insurance and asset management structure with an initial focus on the Florida property and casualty market. Crosswinds Re was formed with an initial USD$200,000 regulatory capital contribution made by Crosswinds through a newly established fund structure, Crosswinds Private Equity Partners (C.I.), L.P.

12
(the “Fund”). The Company is the sole initial limited partner of the Fund and its general partner, Crosswinds Private Equity Partners (C.I.), G.P. is also wholly-owned by Crosswinds. The Fund is intended to be a vehicle for raising additional capital in the future. Crosswinds intends to capitalize Crosswinds Re with approximately $4 million of the proceeds from its rights offering completed in February 2017 to be in a position to write business commencing in Q2 of 2017. Crosswinds Re’s ability to write business will be contingent on market conditions and regulatory and other approvals. Asset Management Crosswinds AUM continued during 2016 to manage the assets for the Monarch Entities. Crosswinds AUM expects to also manage assets for Crosswinds Re as it begins active business operations in 2017. Legacy The Company’s investment in Salbro performed well in 2016, realizing the benefit of a number of operational changes implemented following the repositioning of the investment in December 2015. Material and Significant Events in 2016 The following is a summary of the Company’s material and significant events in 2016, updated for any subsequent events to the date hereof.
13
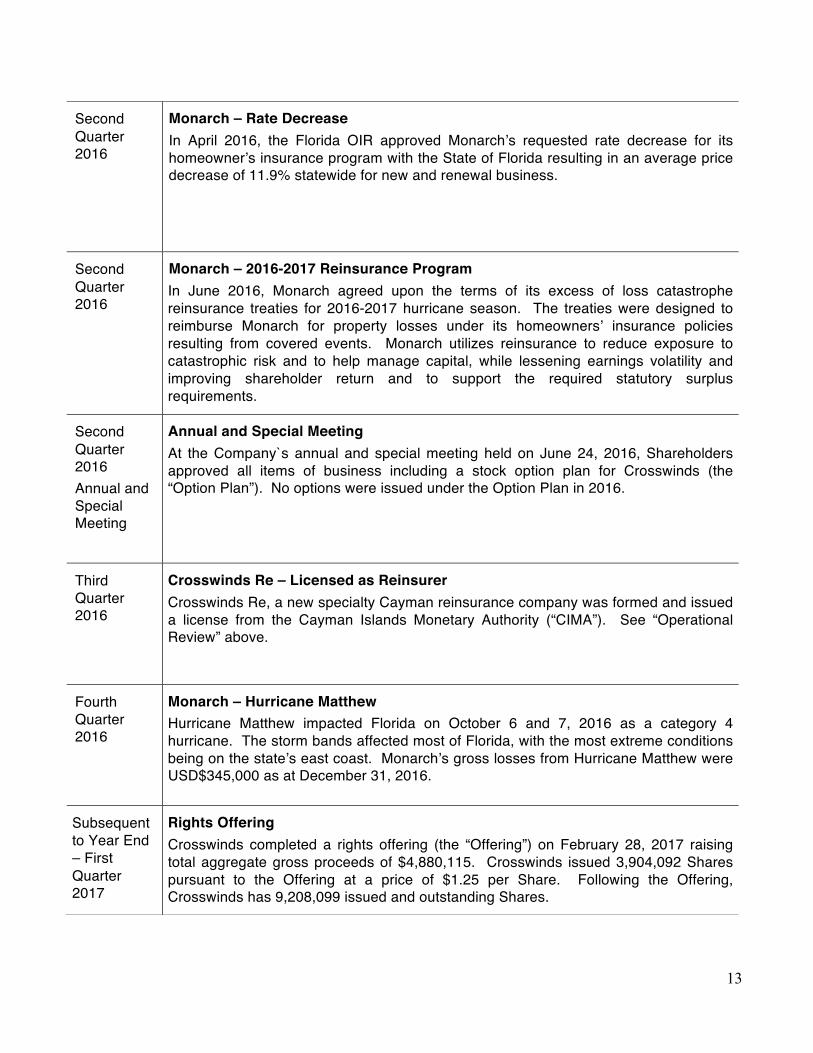
Second Quarter 2016
Monarch – Rate Decrease In April 2016, the Florida OIR approved Monarch’s requested rate decrease for its homeowner’s insurance program with the State of Florida resulting in an average price decrease of 11.9% statewide for new and renewal business.
Second Quarter 2016
Monarch – 2016-2017 Reinsurance Program In June 2016, Monarch agreed upon the terms of its excess of loss catastrophe reinsurance treaties for 2016-2017 hurricane season. The treaties were designed to reimburse Monarch for property losses under its homeowners’ insurance policies resulting from covered events. Monarch utilizes reinsurance to reduce exposure to catastrophic risk and to help manage capital, while lessening earnings volatility and improving shareholder return and to support the required statutory surplus requirements.
Second Quarter 2016 Annual and Special Meeting
Annual and Special Meeting At the Company`s annual and special meeting held on June 24, 2016, Shareholders approved all items of business including a stock option plan for Crosswinds (the “Option Plan”). No options were issued under the Option Plan in 2016.
Third Quarter 2016
Crosswinds Re – Licensed as Reinsurer Crosswinds Re, a new specialty Cayman reinsurance company was formed and issued a license from the Cayman Islands Monetary Authority (“CIMA”). See “Operational Review” above.
Fourth Quarter 2016
Monarch – Hurricane Matthew Hurricane Matthew impacted Florida on October 6 and 7, 2016 as a category 4 hurricane. The storm bands affected most of Florida, with the most extreme conditions being on the state’s east coast. Monarch’s gross losses from Hurricane Matthew were USD$345,000 as at December 31, 2016.
Subsequent to Year End – First Quarter 2017
Rights Offering Crosswinds completed a rights offering (the “Offering”) on February 28, 2017 raising total aggregate gross proceeds of $4,880,115. Crosswinds issued 3,904,092 Shares pursuant to the Offering at a price of $1.25 per Share. Following the Offering, Crosswinds has 9,208,099 issued and outstanding Shares.
14
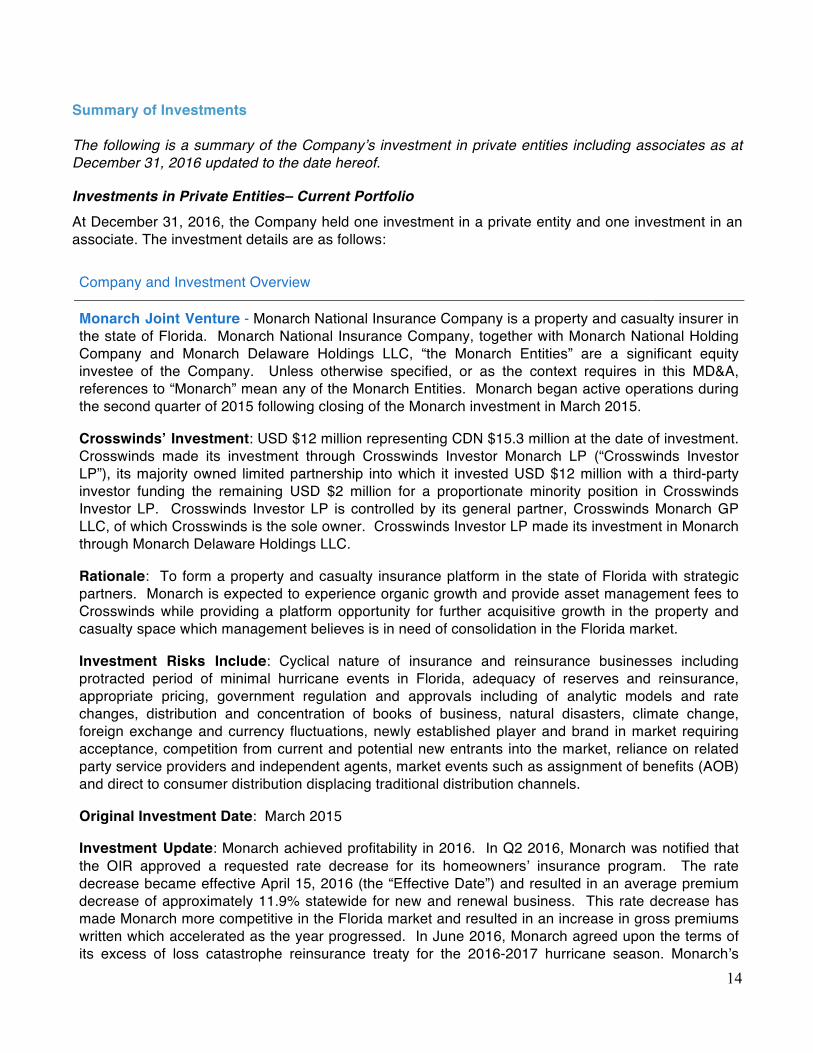
Summary of Investments The following is a summary of the Company’s investment in private entities including associates as at December 31, 2016 updated to the date hereof.
Investments in Private Entities– Current Portfolio At December 31, 2016, the Company held one investment in a private entity and one investment in an associate. The investment details are as follows:
Company and Investment Overview
Monarch Joint Venture - Monarch National Insurance Company is a property and casualty insurer in the state of Florida. Monarch National Insurance Company, together with Monarch National Holding Company and Monarch Delaware Holdings LLC, “the Monarch Entities” are a significant equity investee of the Company. Unless otherwise specified, or as the context requires in this MD&A, references to “Monarch” mean any of the Monarch Entities. Monarch began active operations during the second quarter of 2015 following closing of the Monarch investment in March 2015.
Crosswinds’ Investment: USD $12 million representing CDN $15.3 million at the date of investment. Crosswinds made its investment through Crosswinds Investor Monarch LP (“Crosswinds Investor LP”), its majority owned limited partnership into which it invested USD $12 million with a third-party investor funding the remaining USD $2 million for a proportionate minority position in Crosswinds Investor LP. Crosswinds Investor LP is controlled by its general partner, Crosswinds Monarch GP LLC, of which Crosswinds is the sole owner. Crosswinds Investor LP made its investment in Monarch through Monarch Delaware Holdings LLC.
Rationale: To form a property and casualty insurance platform in the state of Florida with strategic partners. Monarch is expected to experience organic growth and provide asset management fees to Crosswinds while providing a platform opportunity for further acquisitive growth in the property and casualty space which management believes is in need of consolidation in the Florida market.
Investment Risks Include: Cyclical nature of insurance and reinsurance businesses including protracted period of minimal hurricane events in Florida, adequacy of reserves and reinsurance, appropriate pricing, government regulation and approvals including of analytic models and rate changes, distribution and concentration of books of business, natural disasters, climate change, foreign exchange and currency fluctuations, newly established player and brand in market requiring acceptance, competition from current and potential new entrants into the market, reliance on related party service providers and independent agents, market events such as assignment of benefits (AOB) and direct to consumer distribution displacing traditional distribution channels.
Original Investment Date: March 2015
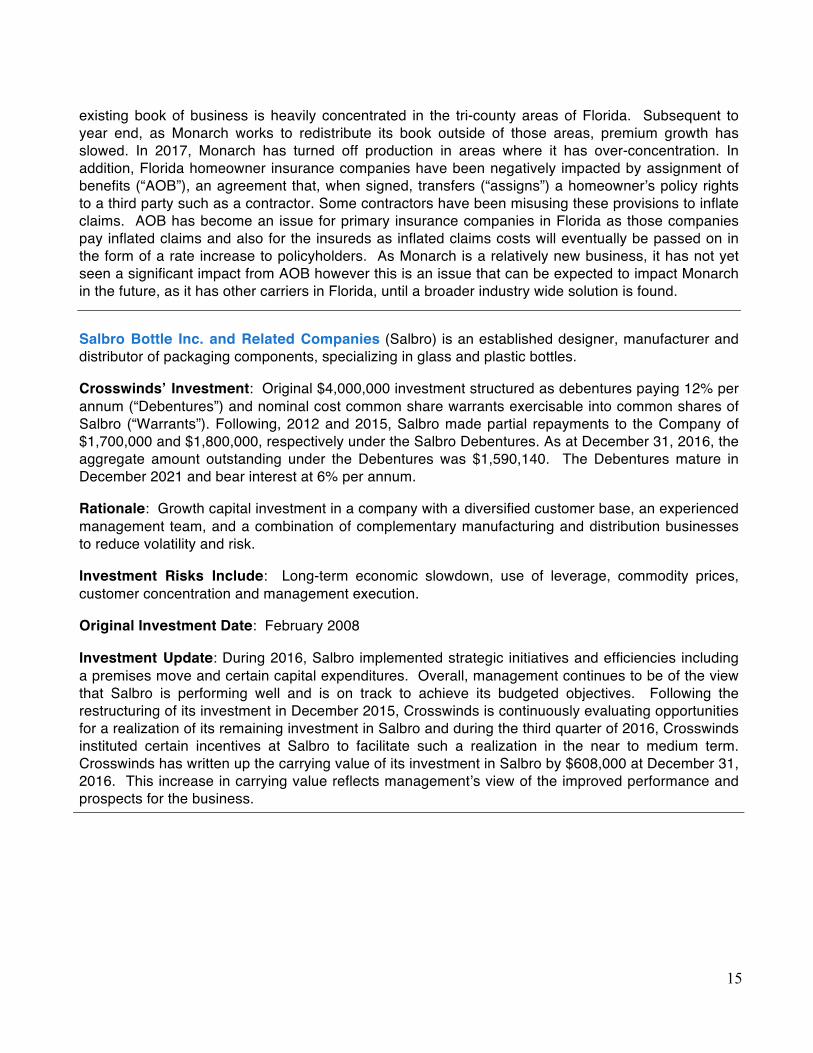
Investment Update: Monarch achieved profitability in 2016. In Q2 2016, Monarch was notified that the OIR approved a requested rate decrease for its homeowners’ insurance program. The rate decrease became effective April 15, 2016 (the “Effective Date”) and resulted in an average premium decrease of approximately 11.9% statewide for new and renewal business. This rate decrease has made Monarch more competitive in the Florida market and resulted in an increase in gross premiums written which accelerated as the year progressed. In June 2016, Monarch agreed upon the terms of its excess of loss catastrophe reinsurance treaty for the 2016-2017 hurricane season. Monarch’s
15
existing book of business is heavily concentrated in the tri-county areas of Florida. Subsequent to year end, as Monarch works to redistribute its book outside of those areas, premium growth has slowed. In 2017, Monarch has turned off production in areas where it has over-concentration. In addition, Florida homeowner insurance companies have been negatively impacted by assignment of benefits (“AOB”), an agreement that, when signed, transfers (“assigns”) a homeowner’s policy rights to a third party such as a contractor. Some contractors have been misusing these provisions to inflate claims. AOB has become an issue for primary insurance companies in Florida as those companies pay inflated claims and also for the insureds as inflated claims costs will eventually be passed on in the form of a rate increase to policyholders. As Monarch is a relatively new business, it has not yet seen a significant impact from AOB however this is an issue that can be expected to impact Monarch in the future, as it has other carriers in Florida, until a broader industry wide solution is found.
Salbro Bottle Inc. and Related Companies (Salbro) is an established designer, manufacturer and distributor of packaging components, specializing in glass and plastic bottles.
Crosswinds’ Investment: Original $4,000,000 investment structured as debentures paying 12% per annum (“Debentures”) and nominal cost common share warrants exercisable into common shares of Salbro (“Warrants”). Following, 2012 and 2015, Salbro made partial repayments to the Company of $1,700,000 and $1,800,000, respectively under the Salbro Debentures. As at December 31, 2016, the aggregate amount outstanding under the Debentures was $1,590,140. The Debentures mature in December 2021 and bear interest at 6% per annum.
Rationale: Growth capital investment in a company with a diversified customer base, an experienced management team, and a combination of complementary manufacturing and distribution businesses to reduce volatility and risk.
Investment Risks Include: Long-term economic slowdown, use of leverage, commodity prices, customer concentration and management execution.
Original Investment Date: February 2008
Investment Update: During 2016, Salbro implemented strategic initiatives and efficiencies including a premises move and certain capital expenditures. Overall, management continues to be of the view that Salbro is performing well and is on track to achieve its budgeted objectives. Following the restructuring of its investment in December 2015, Crosswinds is continuously evaluating opportunities for a realization of its remaining investment in Salbro and during the third quarter of 2016, Crosswinds instituted certain incentives at Salbro to facilitate such a realization in the near to medium term. Crosswinds has written up the carrying value of its investment in Salbro by $608,000 at December 31, 2016. This increase in carrying value reflects management’s view of the improved performance and prospects for the business.
16
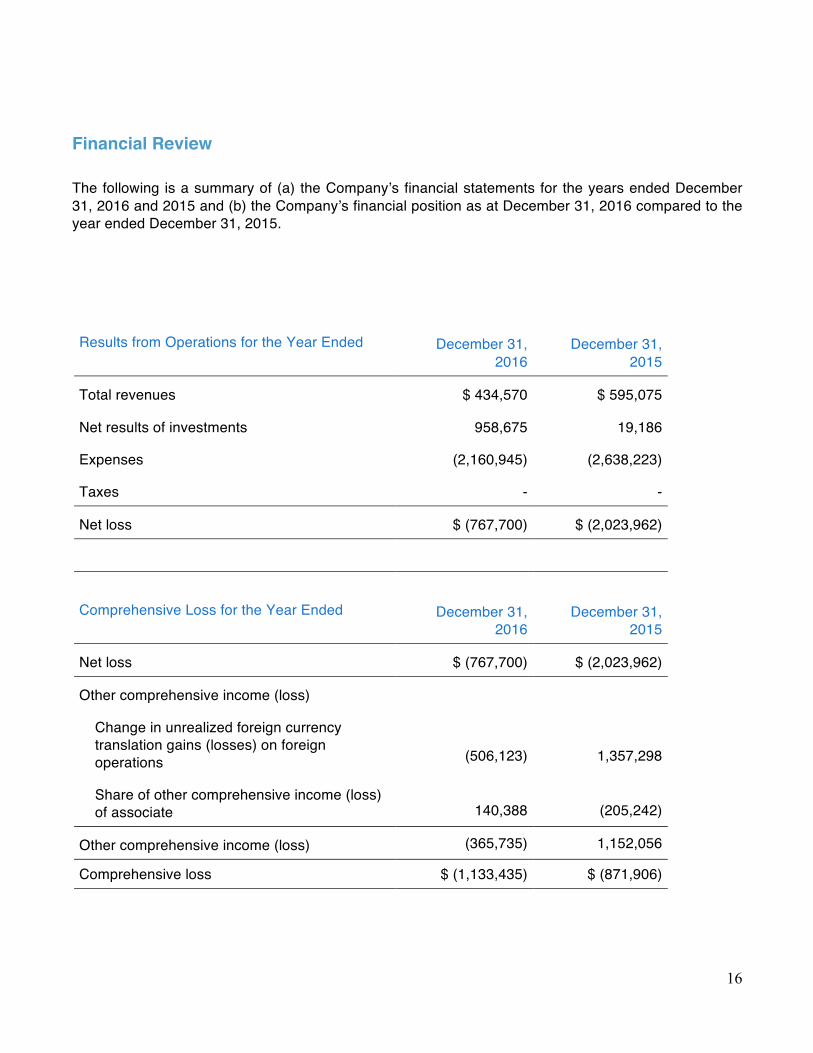
Financial Review The following is a summary of (a) the Company’s financial statements for the years ended December 31, 2016 and 2015 and (b) the Company’s financial position as at December 31, 2016 compared to the year ended December 31, 2015.
Results from Operations for the Year Ended
December 31, 2016
December 31, 2015
Total revenues $ 434,570 $ 595,075
Net results of investments 958,675 19,186
Expenses (2,160,945) (2,638,223)
Taxes - -
Net loss $ (767,700) $ (2,023,962)
Comprehensive Loss for the Year Ended
December 31, 2016
December 31,
2015
Net loss $ (767,700) $ (2,023,962)
Other comprehensive income (loss)
Change in unrealized foreign currency translation gains (losses) on foreign operations
(506,123)
1,357,298
Share of other comprehensive income (loss) of associate
140,388
(205,242)
Other comprehensive income (loss) (365,735) 1,152,056
Comprehensive loss $ (1,133,435) $ (871,906)

17
Earnings (loss) Per Share (EPS)
Loss per share $ (0.16) $ (0.36)
Financial Position as at Dec 31, 2016 Dec 31, 2015
Cash $1,566,053 $ 3,013,848
Total assets 23,089,935 23,970,024
Shareholders’ equity attributable to shareholders of Crosswinds 20,202,732 20,992,981
Number of shares outstanding 5,304,007 5,304,007
Net Book Value Per Share1
Net book value per Share1 $ 4.30 $ 4.45
Attributable to shareholders of Crosswinds Non-controlling interests
3.81 0.49
3.96 0.49
Closing market price on TSX $2.20 $ 5.44
Market price premium/(discount) to net book value attributable to shareholders of Crosswinds
(42.3) %
37.4%
1Net book value per Share is a non-IFRS financial measure and is calculated as total shareholders’ equity under IFRS divided by the number of Shares outstanding at period-end. The Company has reported two net book value measures: one reflecting net book value on a consolidated basis including non-controlling interests with respect to the Company’s investment in Monarch and the other reflecting the net book value attributable solely to the Company’s shareholders without non-controlling interests. See the cautionary statement regarding use of non-IFRS financial measures on page 9 of this MD&A.
Results of Operations Highlights The Company’s operating results reflect (i) revenue recognized primarily from the income generated from the Company’s investments in private entities including Monarch and related asset management activities; (ii) changes in the value of the Company’s assets; and (iii) the expenses required to deploy and manage the Company’s invested capital.
18
For the Year Ended
December 31, 2016 December 31, 2015
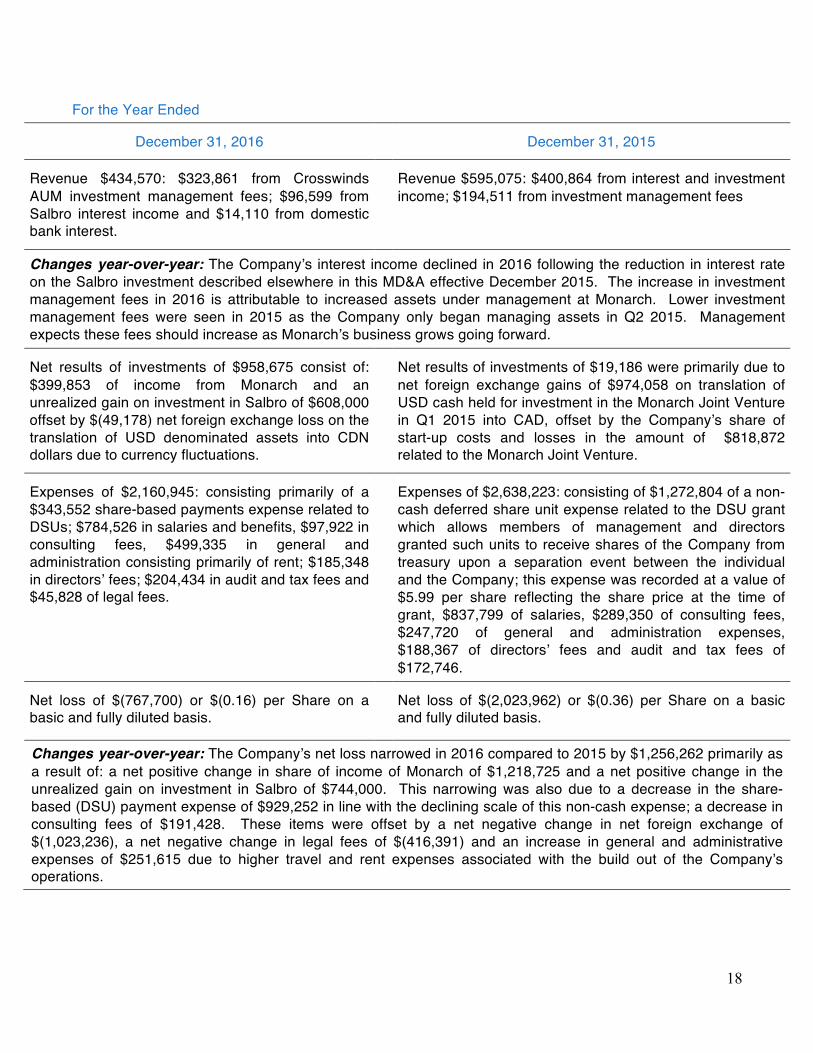
Revenue $434,570: $323,861 from Crosswinds AUM investment management fees; $96,599 from Salbro interest income and $14,110 from domestic bank interest.
Revenue $595,075: $400,864 from interest and investment income; $194,511 from investment management fees
Changes year-over-year: The Company’s interest income declined in 2016 following the reduction in interest rate on the Salbro investment described elsewhere in this MD&A effective December 2015. The increase in investment management fees in 2016 is attributable to increased assets under management at Monarch. Lower investment management fees were seen in 2015 as the Company only began managing assets in Q2 2015. Management expects these fees should increase as Monarch’s business grows going forward.
Net results of investments of $958,675 consist of: $399,853 of income from Monarch and an unrealized gain on investment in Salbro of $608,000 offset by $(49,178) net foreign exchange loss on the translation of USD denominated assets into CDN dollars due to currency fluctuations.
Net results of investments of $19,186 were primarily due to net foreign exchange gains of $974,058 on translation of USD cash held for investment in the Monarch Joint Venture in Q1 2015 into CAD, offset by the Company’s share of start-up costs and losses in the amount of $818,872 related to the Monarch Joint Venture.
Expenses of $2,160,945: consisting primarily of a $343,552 share-based payments expense related to DSUs; $784,526 in salaries and benefits, $97,922 in consulting fees, $499,335 in general and administration consisting primarily of rent; $185,348 in directors’ fees; $204,434 in audit and tax fees and $45,828 of legal fees.
Expenses of $2,638,223: consisting of $1,272,804 of a non-cash deferred share unit expense related to the DSU grant which allows members of management and directors granted such units to receive shares of the Company from treasury upon a separation event between the individual and the Company; this expense was recorded at a value of $5.99 per share reflecting the share price at the time of grant, $837,799 of salaries, $289,350 of consulting fees, $247,720 of general and administration expenses, $188,367 of directors’ fees and audit and tax fees of $172,746.
Net loss of $(767,700) or $(0.16) per Share on a basic and fully diluted basis.
Net loss of $(2,023,962) or $(0.36) per Share on a basic and fully diluted basis.
Changes year-over-year: The Company’s net loss narrowed in 2016 compared to 2015 by $1,256,262 primarily as a result of: a net positive change in share of income of Monarch of $1,218,725 and a net positive change in the unrealized gain on investment in Salbro of $744,000. This narrowing was also due to a decrease in the share-based (DSU) payment expense of $929,252 in line with the declining scale of this non-cash expense; a decrease in consulting fees of $191,428. These items were offset by a net negative change in net foreign exchange of $(1,023,236), a net negative change in legal fees of $(416,391) and an increase in general and administrative expenses of $251,615 due to higher travel and rent expenses associated with the build out of the Company’s operations.

19
Balance Sheet Highlights As at December 31, 2016, the Company’s assets consisted primarily of cash and its investments in Monarch and Salbro. The Company had working capital of $1,463,058 for commitments and general working capital purposes.
In March 2015, the Company, through Crosswinds Investor LP, invested USD $14,000,000 (USD $2,000,000 of which was funded by a third-party investor) in Monarch. In this MD&A, references to equity attributable to Crosswinds refers to the portion of the Monarch investment attributable to Crosswinds, which excludes the third-party investor’s minority interest. At the date of funding of the Monarch investment, the total commitment in CDN dollars was $17,876,600, $15,322,800 of which was funded by and attributable to the Company. The Company is subject to the risk of currency fluctuations. See “Risk Factors” below.
December 31, 2016 December 31, 2015
Total assets of $ 23,089,935 Total assets of $ 23,970,024
Changes: The decrease in assets from December 2015 to 2016 was driven by a decline in cash of $1,447,795 due to payment of corporate expenses offset by the increase in the unrealized gain on investment in Salbro of $574,044.
Equity attributable to shareholders of Crosswinds $ 20,202,732
Equity attributable to shareholders of Crosswinds $20,992,981
Changes: The decrease in equity attributable to shareholders of Crosswinds from December 2015 to 2016 of $790,249 is due to the comprehensive loss attributable to the shareholders of Crosswinds (including the unrealized foreign currency translation loss on the Company’s investment in Monarch) of $1,133,801 offset by an increase in contributed surplus of $343,552 as a result of the share-based payments expense for 2016 related to the issuance of DSUs.
The Company had no debt during any of the periods noted in the table above.
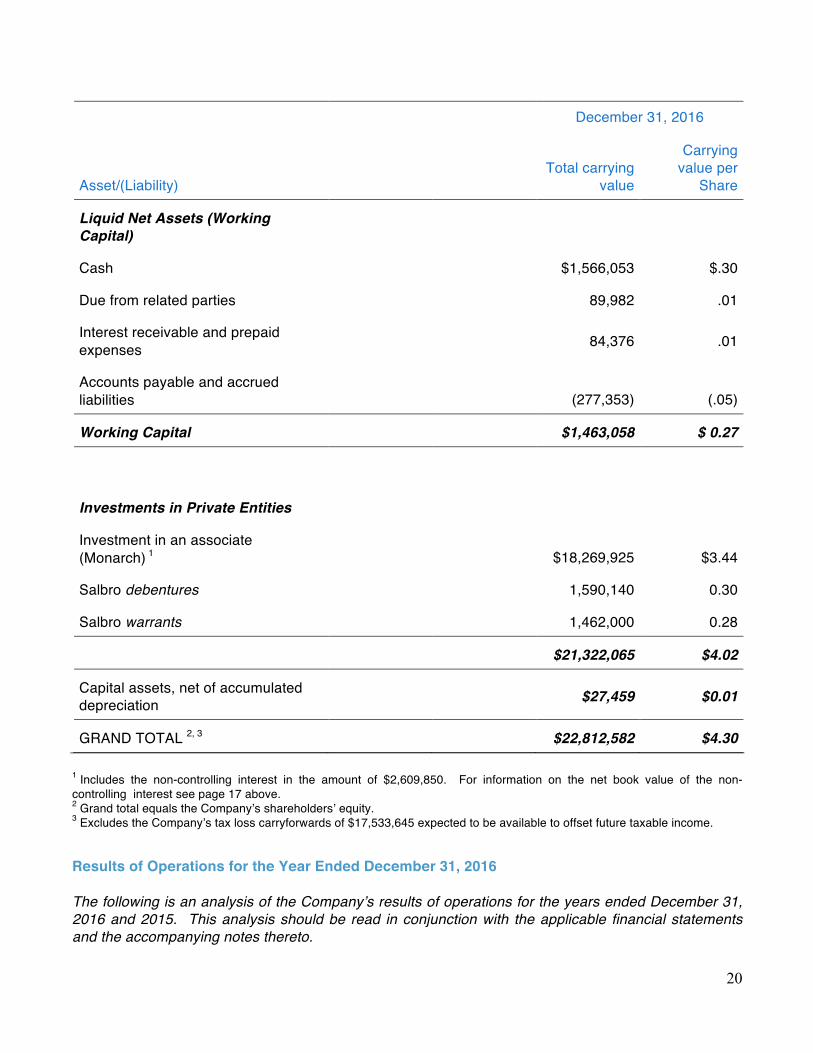
Carrying Value Set out below is the carrying value including carrying value per Share of each of the Company’s assets and liabilities as at December 31, 2016.
20
Asset/(Liability)
December 31, 2016
Total carrying
value
Carrying value per
Share
Liquid Net Assets (Working Capital)
Cash $1,566,053 $.30
Due from related parties 89,982 .01
Interest receivable and prepaid expenses
84,376 .01
Accounts payable and accrued liabilities
(277,353) (.05)
Working Capital $1,463,058 $ 0.27
Investments in Private Entities
Investment in an associate (Monarch) 1 $18,269,925 $3.44
Salbro debentures 1,590,140 0.30
Salbro warrants 1,462,000 0.28
$21,322,065 $4.02
Capital assets, net of accumulated depreciation
$27,459 $0.01
GRAND TOTAL 2, 3 $22,812,582 $4.30 1 Includes the non-controlling interest in the amount of $2,609,850. For information on the net book value of the non-controlling interest see page 17 above. 2 Grand total equals the Company’s shareholders’ equity. 3 Excludes the Company’s tax loss carryforwards of $17,533,645 expected to be available to offset future taxable income.
Results of Operations for the Year Ended December 31, 2016 The following is an analysis of the Company’s results of operations for the years ended December 31, 2016 and 2015. This analysis should be read in conjunction with the applicable financial statements and the accompanying notes thereto.
21
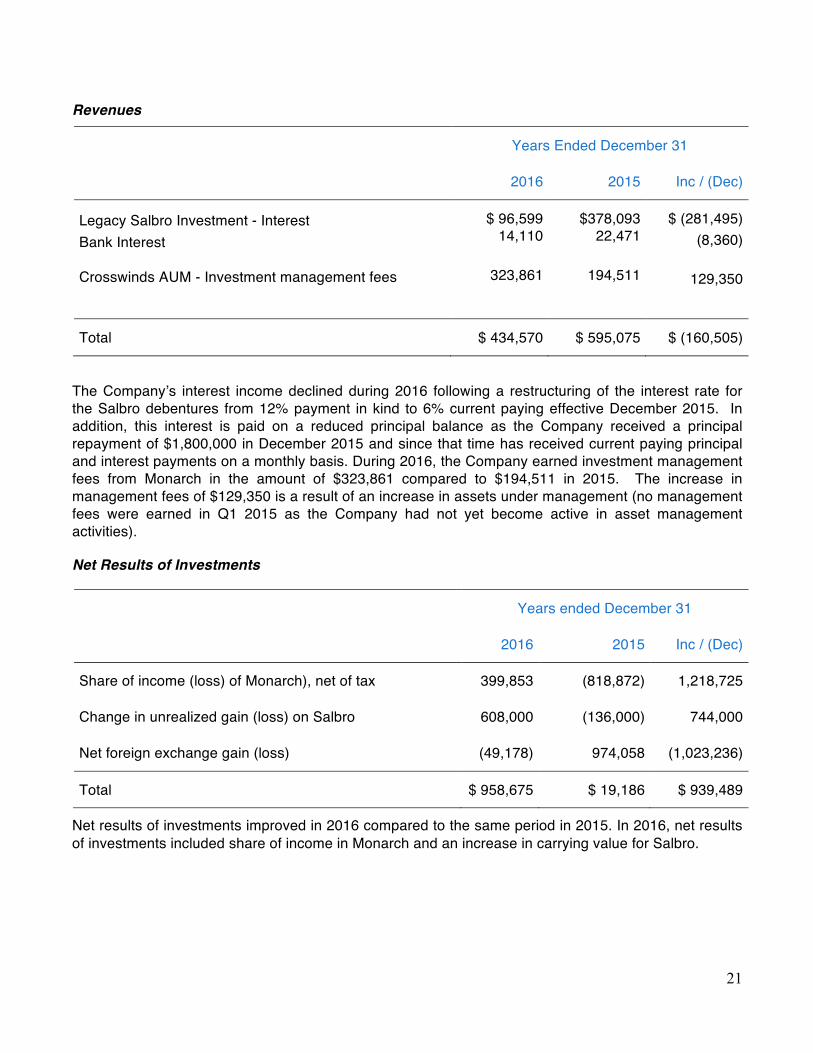
Revenues
Years Ended December 31
2016 2015 Inc / (Dec)
Legacy Salbro Investment - Interest Bank Interest Crosswinds AUM - Investment management fees
$ 96,599 14,110
323,861
$378,093 22,471
194,511
$ (281,495) (8,360)
129,350
Total $ 434,570 $ 595,075 $ (160,505)
The Company’s interest income declined during 2016 following a restructuring of the interest rate for the Salbro debentures from 12% payment in kind to 6% current paying effective December 2015. In addition, this interest is paid on a reduced principal balance as the Company received a principal repayment of $1,800,000 in December 2015 and since that time has received current paying principal and interest payments on a monthly basis. During 2016, the Company earned investment management fees from Monarch in the amount of $323,861 compared to $194,511 in 2015. The increase in management fees of $129,350 is a result of an increase in assets under management (no management fees were earned in Q1 2015 as the Company had not yet become active in asset management activities).
Net Results of Investments
Years ended December 31
2016 2015 Inc / (Dec)
Share of income (loss) of Monarch), net of tax 399,853 (818,872) 1,218,725
Change in unrealized gain (loss) on Salbro 608,000 (136,000) 744,000
Net foreign exchange gain (loss) (49,178) 974,058 (1,023,236)
Total $ 958,675 $ 19,186 $ 939,489
Net results of investments improved in 2016 compared to the same period in 2015. In 2016, net results of investments included share of income in Monarch and an increase in carrying value for Salbro.
22
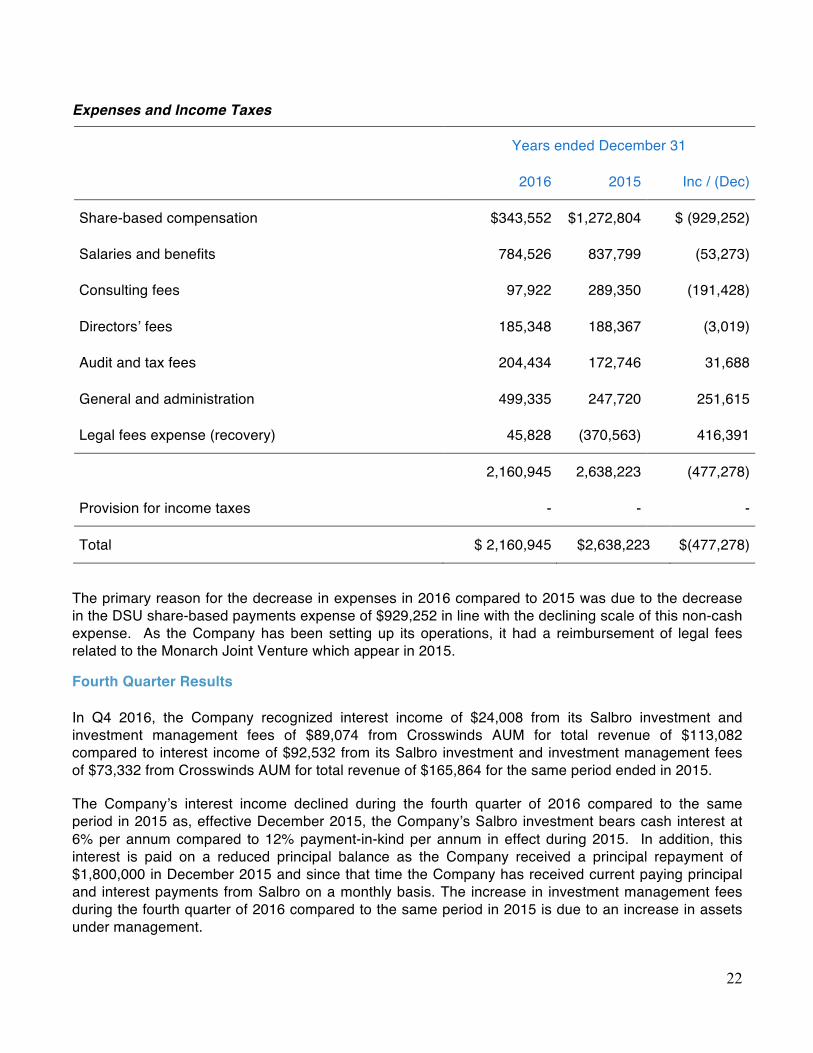
Expenses and Income Taxes
Years ended December 31
2016 2015 Inc / (Dec)
Share-based compensation $343,552 $1,272,804 $ (929,252)
Salaries and benefits 784,526 837,799 (53,273)
Consulting fees 97,922 289,350 (191,428)
Directors’ fees 185,348 188,367 (3,019)
Audit and tax fees 204,434 172,746 31,688
General and administration 499,335 247,720 251,615
Legal fees expense (recovery) 45,828 (370,563) 416,391
2,160,945 2,638,223 (477,278)
Provision for income taxes - - -
Total $ 2,160,945 $2,638,223 $(477,278)
The primary reason for the decrease in expenses in 2016 compared to 2015 was due to the decrease in the DSU share-based payments expense of $929,252 in line with the declining scale of this non-cash expense. As the Company has been setting up its operations, it had a reimbursement of legal fees related to the Monarch Joint Venture which appear in 2015.
Fourth Quarter Results In Q4 2016, the Company recognized interest income of $24,008 from its Salbro investment and investment management fees of $89,074 from Crosswinds AUM for total revenue of $113,082 compared to interest income of $92,532 from its Salbro investment and investment management fees of $73,332 from Crosswinds AUM for total revenue of $165,864 for the same period ended in 2015.
The Company’s interest income declined during the fourth quarter of 2016 compared to the same period in 2015 as, effective December 2015, the Company’s Salbro investment bears cash interest at 6% per annum compared to 12% payment-in-kind per annum in effect during 2015. In addition, this interest is paid on a reduced principal balance as the Company received a principal repayment of $1,800,000 in December 2015 and since that time the Company has received current paying principal and interest payments from Salbro on a monthly basis. The increase in investment management fees during the fourth quarter of 2016 compared to the same period in 2015 is due to an increase in assets under management.
23
The Company had a gain on results of investments of $698,905 for the fourth quarter 2016 compared to a loss of $235,047 in the corresponding period in 2015 primarily as a result of the increase in the fair value of the warrants in Salbro in the amount of $608,000. The Company’s operating expenses for the fourth quarter of 2016 were $194,423 lower than the same period in 2015 as a result of lower cash and non- cash compensation expense related to reduced short term incentive payments for executives compared to 2015 and the declining scale of previous DSU grants.
The Company recorded net income of $178,912 in the fourth quarter of 2016 compared to a net loss of $896,129 for the corresponding period in 2015. The increase in net income in Q4 2016 was largely impacted by the following three items: the increase in the fair value of the Salbro warrants in the amount of $608,000, the decrease in cash and non-cash compensation of $161,000 and the increase in share of income in the Monarch Joint Venture in the amount of $190,590.
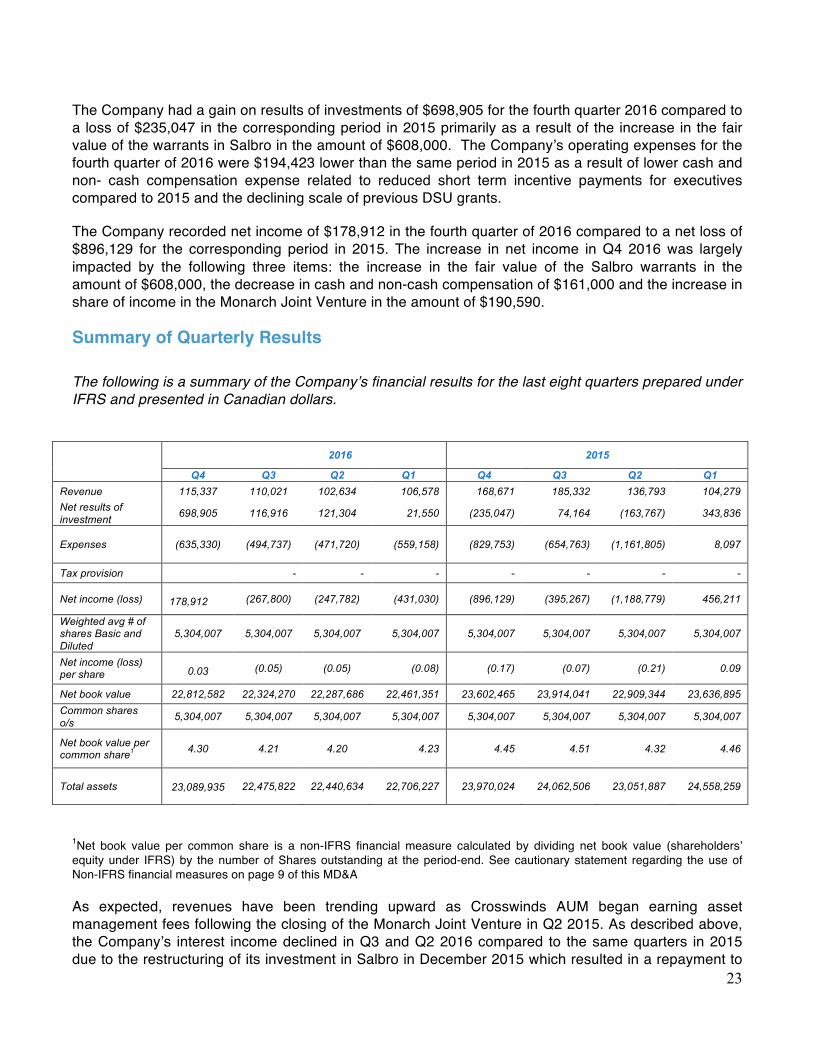
Summary of Quarterly Results The following is a summary of the Company’s financial results for the last eight quarters prepared under IFRS and presented in Canadian dollars.
2016 2015
Q4 Q3 Q2 Q1 Q4 Q3 Q2 Q1 Revenue 115,337 110,021 102,634 106,578 168,671 185,332 136,793 104,279 Net results of investment 698,905 116,916 121,304 21,550 (235,047) 74,164 (163,767) 343,836
Expenses
(635,330)
(494,737) (471,720) (559,158) (829,753) (654,763) (1,161,805) 8,097
Tax provision - - - - - - -
Net income (loss) 178,912 (267,800) (247,782) (431,030) (896,129) (395,267) (1,188,779) 456,211
Weighted avg # of shares Basic and Diluted
5,304,007 5,304,007 5,304,007 5,304,007 5,304,007 5,304,007 5,304,007 5,304,007
Net income (loss) per share
0.03 (0.05) (0.05) (0.08) (0.17) (0.07) (0.21) 0.09
Net book value 22,812,582 22,324,270 22,287,686 22,461,351 23,602,465 23,914,041 22,909,344 23,636,895 Common shares o/s 5,304,007 5,304,007 5,304,007 5,304,007 5,304,007 5,304,007 5,304,007 5,304,007
Net book value per common share1 4.30 4.21 4.20 4.23 4.45 4.51 4.32 4.46
Total assets
23,089,935 22,475,822 22,440,634 22,706,227 23,970,024 24,062,506 23,051,887 24,558,259
1Net book value per common share is a non-IFRS financial measure calculated by dividing net book value (shareholders’ equity under IFRS) by the number of Shares outstanding at the period-end. See cautionary statement regarding the use of Non-IFRS financial measures on page 9 of this MD&A
As expected, revenues have been trending upward as Crosswinds AUM began earning asset management fees following the closing of the Monarch Joint Venture in Q2 2015. As described above, the Company’s interest income declined in Q3 and Q2 2016 compared to the same quarters in 2015 due to the restructuring of its investment in Salbro in December 2015 which resulted in a repayment to

24
the Company of $1,800,000 and a reduction in interest rate on the remaining debenture amount outstanding from 12% to 6%.
Net results of investments vary on a quarter-to-quarter basis due to net foreign exchange gains related to USD denominated assets, realized gains or losses on investments and also due to unrealized gains or losses on investments being measured at fair value on the balance sheet.
During 2015, the Company’s results reflect a number of one-time expenses including foreign exchange fluctuations and start-up and other one-time costs related to the Monarch Joint Venture which have caused variability in the Company’s performance. The non-cash DSU grant also had an impact on the Company’s expenses on a declining scale basis in each of the quarters after Q1 2015. Foreign exchange fluctuations have also caused significant variation in reported performance for the Company as described herein.
Liquidity, Capital Resources and Off-Balance Sheet Arrangements The following is an analysis of the liquidity, capital resources and off-balance sheet arrangements of the Company and should be read in conjunction with the audited annual financial statements for the years ended December 31, 2016 and 2015 and the corresponding notes thereto.
Liquidity The Company had working capital of $1,463,058 at December 31, 2016 (December 31, 2015 - $2,837,878). The Company’s cash consists of deposits with chartered banks in Canada and the U.S.
The Company calculates its working capital as follows:
Working Capital December 31, 2016 December 31, 2015
Cash $1,566,053 $ 3,013,848
Due from related parties 89,982 77,578
Interest receivable and prepaid expenses
84,376 114,011
Accounts payable and accrued liabilities (277,353) (367,559)
Working capital $1,463,058 $ 2,837,878
Total per Share $ 0.29 $ 0.54
The Company worked on developing a strategy to generate liquidity in 2016 and as a part of that strategy completed a rights offering in the first quarter of 2017 raising gross proceeds of $4,880,115. See “Operational Review – Material and Significant Events – Rights Offering” above. The Company believes it now has sufficient working capital to support its near-term needs having monetized a portion of its Salbro investment in the amount of $1,800,000 at the end of 2015 and, subsequent to year end,

25
having raised funds in the rights offering. At year end, prior to the rights offering, the Company had sufficient funds for its near term needs but was constrained in its ability to begin active operations for Crosswinds Re. The Company is expending cash in excess of its revenues as it continues to build out its infrastructure. As the Company works to implement its planned growth activities, management expects it will need to raise new capital and continues to explore options to do so through additional private and/or public fund raising.
The Company established Crosswinds Re during the Q3 2016 and made a regulatory capital contribution through a newly established fund structure, Crosswinds Private Equity Partners (C.I.), L.P. (the “Fund”). Crosswinds is the sole initial limited partner of the Fund. The Fund’s general partner, Crosswinds Private Equity Partners (C.I.). G.P. is wholly-owned by Crosswinds. Crosswinds currently intends to use the Fund as a vehicle to raise additional capital for Crosswinds Re to execute its business plan of acting as a specialty reinsurer as part of Crosswinds’ integrated insurance, reinsurance and asset management structure with an initial focus on the Florida property and casualty insurance market. There can be no assurance that such funds will be available or if they are available that they will be available on commercially favorable terms.
There are contractual and legal restrictions on the ability of Monarch to transfer funds to its owners including Crosswinds. As Crosswinds regards Monarch as a long-term investment, this is not expected to have an impact on the Company’s short term liquidity. Our reinsurance subsidiary, Crosswinds Re, which is domiciled in Cayman Islands, is required by CIMA to maintain minimum capital levels. As of December 31, 2016, the capital maintained by Crosswinds Re was in excess of the regulatory capital requirement in Cayman Islands. USD $200,000 of the amount shown as cash in the table above is required to meet Crosswinds Re’s minimum capital requirements and as such is not accessible cash to Crosswinds for such time as Crosswinds desires to maintain its licensed reinsurance entity. The Company intends to invest approximately $4 million in Crosswinds Re from the proceeds of the rights offering completed subsequent to year end.
Capital Resources
At December 31, 2016, the Company had no long-term debt or capital lease obligations. The Company entered into a premises lease agreement in Q3 of 2015 for approximately 3,000 square feet of office space located at 14 Wall Street, New York, New York. The Company’s payment commitments under the premises lease are set out below:
Share Capital As at the date hereof, following completion of the Rights Offering, there are 9,208,099 Shares outstanding and as at December 31, 2016, there were 5,304,007 (2015 – 5,304,007) Shares were outstanding. The Company reported a net book value at December 31, 2016 of $22,812,582 (2015 – $23,602,465) or $4.30 per Share (2015 - $4.45) of which $20,202,732 (2015 – $20,992,981) or $3.81
Payments due by period
At December 31, 2016 TOTAL < 1 year 1-2 years 3-5 years after 5 years
Operating lease 785,722$ 197,199$ 202,661$ 385,862$ -$

26
per Share (2015 - $3.96) is attributable to shareholders of the Company1. See the cautionary statement regarding the use of non-IFRS financial measures on page 9 of this MD&A.
1 Net book value per share is a non-IFRS financial measure and is calculated as total shareholders’ equity under IFRS divided by the number of Shares outstanding at period-end. The Company has reported two net book value measures: one reflecting net book value on a consolidated basis including non-controlling interests with respect to the Company’s investment in the Monarch Joint Venture and the other reflecting the net book value attributable solely to the Company’s shareholders without non-controlling interests.
The Company has adopted an Option Plan which was approved by the Company’s shareholders on June 24, 2016. No options are outstanding under the Stock Option Plan as at December 31, 2016.
The Company also has a DSU Plan. On April 15, 2015, the Company issued an aggregate of 260,000 DSUs to certain of its directors and officers pursuant to the terms of the DSU Plan. As at December 31, 2016, all DSUs from this grant had vested. On November 17, 2016, the Company granted 34,332 units to certain directors as part of their annual retainer fees at a grant price of $2.81. At December 31, 2016, an aggregate of 11,444 DSUs had vested under this grant with the remaining 22,888 DSUs vesting in equal amounts in the first and second quarters of 2017.
The maximum number of Shares that can be issued on exercise of options granted under the Option Plan may not exceed 10% of the issued and outstanding Shares of the Company from time to time, less the number of Shares issued under all other security based compensation arrangements of the Company including the DSU Plan.
Off-Balance Sheet Arrangements Except as otherwise described herein, the Company currently has no off-balance sheet arrangements
Proposed Transactions The Company has no proposed asset or business acquisitions or dispositions at this time.
Transactions with Related Parties Investment Management Services Agreement In conjunction with the closing of the Monarch Joint Venture, Crosswinds AUM, entered into an investment management services agreement with Monarch. Under the agreement, Crosswinds AUM has agreed to act as investment advisor and to manage the assets of the Monarch entities for a management fee paid quarterly in arrears. For the year ended December 31, 2016, Crosswinds AUM earned investment management fee income in the amount of $323,861 (2015 - $ 194,511). As at December 31, 2016, $89,982 (2015 - $77,578) was still owed to the Company and was included in due from related parties on the consolidated statements of financial position.
Changes in Accounting Policies and Critical Accounting Estimates The Company’s financial statements have been prepared in accordance with IFRS.
27
Critical Accounting Estimates
In the application of the Company’s accounting policies, management is required to make judgments, estimates and assumptions about the carrying amounts of assets and liabilities that are not readily available from other sources. The estimates and associated assumptions are based on historical experience and other factors that are considered to be relevant. Actual results may differ from these estimates.
The estimates and underlying assumptions are reviewed on an ongoing basis. Revisions to accounting estimates are recognized in the period in which the estimate is revised if the revision affects only that period or in the period of the revision and future periods if the revision affects both current and future periods.
(a) Critical judgments in applying accounting policies The following are the critical judgments, apart from those involving estimations (see below), that management has made in the process of applying the Company’s accounting policies and that have the most significant effect on the amounts recognized in the Company’s financial statements for the year ended December 31, 2016. Functional currency The currency of the primary economic environment in which the Company operates is the Canadian dollar as this is the currency in which the Company measures its performance and also issues and purchases for cancellation its Shares. Interests in other entities
As part of its process in determining the classification of its interests in other entities, the Company applies judgment in interpreting these interests such as (i) the determination of the level of control or significant influence held by the Company; (ii) the applicability of relevant IFRS standards to the operations; (iii) the legal structure and contractual terms of the arrangement; and (iv) when relevant, other facts and circumstances. The Company has concluded that its investment in Monarch Parent represents an investment in an associate as described in IAS 28, “Investments in Associates and Joint Ventures”. All other interests in other entities have been determined to be subsidiaries as described in IFRS 10, “Consolidated Financial Statements”.
(b) Key sources of estimation uncertainty
The following are the key assumptions concerning the future, and other key sources of estimation uncertainty at the Company’s statements of financial position date reflected in the Company’s financial statements as at December 31, 2016, that have a significant risk of causing a material adjustment to the carrying amounts of assets and liabilities within the next financial year. Fair value of securities not quoted in an active market and over-the-counter derivative instruments. Management uses its judgment in selecting an appropriate valuation technique for financial
28
instruments that are not quoted in an active market. Valuation techniques commonly used by market practitioners are applied. For derivative financial instruments, assumptions are made based on quoted market rates adjusted for specific features of the instrument. Other financial instruments are valued using a discounted cash flow analysis based on assumptions supported, where possible, by observable market prices or rates. The estimation of fair value of unlisted shares includes some assumptions not supported by observable market prices or rates.
The Company’s critical accounting estimates are primarily limited to valuing its investments. The valuation methods and the techniques it employs in valuing its investments and the assumptions used are described below. Salbro Bottle Inc. and Related Companies (“Salbro”) The fair market value of Salbro was determined on a going concern basis under an income approach on the assumption that a hypothetical purchaser would acquire Salbro on the expectation of future earnings and cash flows. Specifically, the Company selected an EBITDA multiple method as the valuation methodology given that Salbro is a mature business and is expected to continue to operate as a going concern and historical EBITDA is a good approximation of expected profitability going forward. This valuation method estimates the net enterprise value by (i) performing an analysis of the maintainable EBITDA; (ii) applying an enterprise value/twelve-month trailing EBITDA multiple; and (iii) deducting any indebtedness. Where the Company uses a multiple of publicly traded companies or precedent transactions to derive an appropriate range of multiples it will apply, the multiples chosen are typically below the average comparables surveyed to recognize the Company’s minority equity position and the fact that Salbro is privately held. An EBITDA multiple of 8.5 was used to value Salbro as at December 31, 2016. Different assumptions were used to derive a range of valuations used to arrive at an estimate. A 1x change in the EBITDA multiple would have increased or decreased the value of the investment by approximately $262,000 at December 31, 2016. The carrying amount of the Salbro investment at December 31, 2016 was $3,052,140 (2015 - $2,478,096).
Recent accounting pronouncements
This section describes standards, amendments and interpretations that have been issued but are not yet effective for annual reporting periods ended December 31, 2016.
The International Accounting Standards Board (“IASB”) has issued the following new accounting pronouncements that will be applicable to the Company: IFRS 9 Financial Instruments
The standard was issued in its final version by the International Accounting Standards Board (“IASB”) in July 2014 bringing together the classification and measurement, impairment and hedge accounting phases of the IASB’s project to replace IAS 39, “Financial instruments: recognition and measurement” (“IAS 39”). The standard retains but simplifies the mixed measurement model and establishes two

29
primary measurement categories for financial assets: amortized cost and fair value. The mandatory effective date of IFRS 9 is for annual periods beginning on or after January 1, 2018, with early adoption permitted. The Company is assessing the impact of this standard.
IFRS 15 - Revenue from Contracts with Customers
This standard was issued by the IASB on May 28, 2014, and amended on April 12, 2016, and will replace IAS 18, “Revenue”, IAS 11 “Construction Contracts”, and related interpretations on revenue. IFRS 15 sets out the requirements for recognizing revenue that apply to all contracts with customers, except for contracts that are within the scope of the standards on leases, insurance contracts and financial instruments. IFRS 15 uses a control based approach to recognize revenue which is a change from the risk and reward approach under the current standard. Companies can elect to use either a full or modified retrospective approach when adopting this standard and it is effective for annual periods beginning on or after January 1, 2018 with early adoption permitted. The Company is assessing the impact of this standard.
IFRS 16 – Leases
The standard was issued by the IASB on January 13, 2016, and will replace IAS 17, “Leases”. IFRS 16 will bring most leases on-balance sheet for lessees under a single model, eliminating the distinction between operating and financing leases. Lessor accounting however remains largely unchanged and the distinction between operating and finance leases is retained. The new standard is effective for annual periods beginning on or after January 1, 2019 with early adoption permitted if IFRS 15 has also been applied. The Company is assessing the impact of this standard.
Factors that May Affect Future Results Future results of the Company will depend on the strategies it implements from time to time including the Company’s ability to execute on its intentions with respect to growth of its complementary business lines and the success of any capital raising activities. The Company will require additional capital to complete some of its initiatives including capitalizing on investment opportunities as they arise and its ability to raise that capital will depend among other things on general economic conditions. As the Company is working to develop additional lines of business, past performance should not generally be viewed as indicative of future results.
The Company continues to seek investment opportunities meeting the criteria set out elsewhere in this MD&A and its AIF. There can be no guarantee that any prospective initiatives or transactions described herein will be successfully executed and, if executed, yield satisfactory risk-adjusted returns. While seeking new investment opportunities, the Company’s revenues will be constrained.
Controls and Procedures Disclosure Controls and Procedures The Company’s controls and procedures are designed to provide reasonable assurance that information required to be disclosed by the Company in its corporate filings is recorded, processed, summarized and reported within the time periods specified under securities laws and include controls and procedures that are designed to ensure that information is accumulated and communicated to management including the Chief Executive Officer and Interim Chief Financial Officer (collectively, the Certifying Officers) to allow timely decisions regarding disclosure. As at December 31, 2016 the Certifying Officers evaluated the effectiveness of the Company’s disclosure controls and procedures as defined under National Instrument 52-109 – Certification of Disclosure in Issuer’s Annual and Interim

30
Filings. Based on that evaluation, the Certifying Officers concluded that the Company’s disclosure controls and procedures were appropriately designed as at December 31, 2016.
Consistent with the concept of reasonable assurance, the Company recognizes that the relative cost of maintaining these controls should not exceed their expected benefits. In addition, a control system, no matter how well conceived and operated can provide only reasonable, not absolute, assurance that its objectives are met. Due to inherent limitations in all such systems, no evaluations of controls can provide absolute assurance that all control issues, if any, within a company have been detected. As such, the Company’s disclosure controls and procedures can only provide reasonable, and not absolute, assurance that the objectives of such controls and procedures are met.
Internal Controls over Financial Reporting The Company’s internal controls over financial reporting are a process designed under the supervision of the Certifying Officers to provide reasonable assurance regarding the reliability of financial reporting and the preparation of financial statements for external purposes in accordance with IFRS. However, because of its inherent limitations, internal controls over financial reporting may not prevent or detect misstatements on a timely basis. The Certifying Officers evaluated the effectiveness of the Company’s internal controls over financial reporting as at December 31, 2016, based on the framework and criteria established in the Internal Control – Integrated Framework published by the Committee of Sponsoring Organizations of the Treadway Commission (COSO 2013 Framework). Based on that evaluation, the Certifying Officers concluded that the Company’s internal control over financial reporting was appropriately designed as at December 31, 2016. There were no material weaknesses that have been identified by the Certifying Officers as at December 31, 2016. There have been no changes during the year ended December 31, 2015 in the Company’s internal controls over financial reporting that have materially affected, or are reasonably likely to materially affect, the Company’s internal controls over financial reporting.
Consistent with the concept of reasonable assurance, the Company recognizes that the relative cost of maintaining these controls should not exceed their expected benefits. In addition, a control system, no matter how well conceived and operated can provide only reasonable, not absolute, assurance that its objectives are met. Due to inherent limitations in all such systems, no evaluations of controls can provide absolute assurance that all control issues, if any, within a company have been detected. As such, the Company’s internal controls over financial reporting can only provide reasonable, and not absolute, assurance that the objectives of such controls are met.
Outlook The Company has a number of initiatives it is targeting for advancement in 2017 and management views (i) Monarch Insurance company’s growth and earnings, (ii) increasing asset management fees, (iii) earnings from Crosswinds Re once actively writing business; and (iii) fees (if any) associated with any future fund vehicles as all being key to the Company’s near term future results. Monarch’s performance is an important component of the implementation of Crosswinds’ broader strategy integrating insurance, reinsurance and asset management and the related revenue to be generated by each component of that strategy. Increased market acceptance and premium growth in Monarch will be key to Crosswinds’ overall performance in the short term. After some initial benefit in premium writing following the rate decrease in April 2016, concentration of Monarch’s book of business has had a negative impact on premium writing and management currently expects slow organic growth for Monarch in 2017.
31
In order to fully execute its acquisition strategy and support the funding of its reinsurance entity, the Company will need to raise significant amounts of additional capital. The Company started this process with the Rights Offering raising approximately $4 million which it plans to deploy in 2017. The Company is exploring options to raise additional capital and/or create one or more private equity funds. Without such additional capital, the Company’s ability to expand its business and capitalize on identified opportunities will be constrained. Management believes that Crosswinds is well positioned for growth in Crosswinds Re in 2017, having raised funds for its initial capitalization which should enable it, subject to market conditions and other approvals, to write some business during wind season. Following completion of the Monarch Joint Venture, as the majority of the Company’s assets are valued in USD, the overall value of the Company expressed in Canadian dollars will fluctuate based on the relative value of the Canadian dollar to the USD. Results may vary substantially from year to year and quarter to quarter due to the stage of development of the Company’s business and its new investment activities.
Financial Risk Management and Risk Factors Financial Risk Management The Company’s business is affected by a number of economic factors, including changing economic environments, capital markets and interest rates. As a result, the Company faces various risk factors, inherent in its normal business activities. These risk factors and the management thereof are described below.
The Company attempts to manage the risks associated with its business and investment portfolio through planning, significant due diligence of investment opportunities, and active involvement in and monitoring of its investments.
Investments in private entities are less liquid than public securities as there is no readily available market in which to sell an investment. There is a possibility that when an investment is to be sold, the price received may not be equal to its intrinsic value or its fair value for financial reporting purposes.
The Company is exposed to a number of risks due to the nature of its activities. These risks include market risk (including currency risk, interest rate risk and price risk), credit risk and liquidity risk. The Company’s objective in managing these risks is the protection and enhancement of shareholder value.
The Company’s risk management policies are approved by the Board of Directors and seek to minimize the potential adverse effects of these risks on the Company’s financial performance. The risk management process is an ongoing process of identification, measurement, monitoring and controlling risk.
i. Risk management structure
The Board of Directors is ultimately responsible for the overall risk management within the Company. The Company uses different methods to measure and manage the various types of risk to which it is exposed; these methods are explained below.

32
ii. Risk mitigation
The Company’s AIF details its investment policy and guidelines that encompasses its overall investment strategy, its tolerance for risk and its general risk management philosophy; however the Company does hold investments in warrants which are considered a derivative instrument.
The Company does not generally use derivatives and other instruments for trading purposes or for risk management.
iii. Excessive risk concentration
A concentration of risk exists where: (i) positions in financial instruments are affected by changes in the same risk factor or group of correlated factors; and (ii) the exposure could, in the event of large but plausible adverse developments, result in significant losses.
Concentrations of liquidity risk may arise from the repayment terms of financial liabilities, sources of borrowing facilities or reliance on a particular market in which to realize liquid assets. Concentrations of foreign exchange risk may arise if the Company has a significant net open position in a single foreign currency, or aggregate net open positions in several currencies that tend to move together. Concentrations of counterparty risk may arise when a number of financial instruments or contracts are contracted with the same counterparty, or where a number of counterparties are engaged in similar business activities, or activities in the same geographic region, or have similar economic features that would cause their ability to meet contractual obligations to be similarly affected by changes in economic, political or other conditions.
The Company reviews its investment policies and risk management procedures in order to manage excessive concentration of risk. For a discussion of additional risk factors including liquidity risk, interest rate sensitivity, credit risk and foreign exchange risk, see “Risk Factors” below.
Risk Factors
Joint Venture Risks
There can be no assurance that the Monarch Joint Venture will be successful. The Monarch Joint Venture involves substantial risk. In addition, the Monarch Joint Venture will depend, among other things, on the management and operational expertise of the Monarch Joint Venture partners that is not under the Company’s direct control, and disputes may arise between the Company and the Monarch Joint Venture partners that may adversely affect the success of the Monarch Joint Venture. The Monarch Joint Venture may require additional capital subsequent to its initial capitalization. To the extent the Monarch Joint Venture is unable to fund its operating requirements or cover claims losses, the Monarch Joint Venture may need to raise additional funds through debt or equity financings that may be dilutive to the Company’s interest in the Monarch Joint Venture, or the Monarch Joint Venture may need to curtail its growth and reduce its assets. The Monarch Joint Venture’s additional capital needs will depend on the Monarch Joint Venture’s actual claims experience, especially for catastrophic events. If the Monarch Joint Venture cannot obtain adequate capital to the extent required on favorable terms or at all, the Monarch Joint Venture’s business, financial condition and results of operations could be adversely affected.
33
Liquidity Risk Liquidity risk is the risk that the Company may not be able to generate sufficient cash resources to settle its obligations in full as they fall due or can only do so on terms that are materially disadvantageous. The Company has made and intends to make investments in private entities which do not typically have an active market. Private investment transactions can be highly structured and the Company takes measures, where possible, to create defined liquidity events. However, such liquidity events are rarely expected in the first two or three years of making an investment and may not be realized as expected. The Company has sought to obtain regular cash flow from these investments through interest payments and/or management fees however these have in some circumstances been deferred. Interest rate sensitivity As at and during the year ended December 31, 2016, the Company did not have any significant exposure to interest rate risk as the Company intends to hold its debt instruments to maturity, and therefore, would not be impacted by changes in interest rates. Crosswinds AUM invests the assets of the Monarch Entities. Indirectly, through its investment in Monarch, the Company has exposure to primary fixed income assets for the Monarch Joint Venture, its premiums and reserves. The level of interest rates affects the financial performance of the Monarch Joint Venture. While the Monarch assets are held to maturity, Crosswinds will benefit or be negatively impacted by changes in interest rates.
Credit risk Credit risk refers to the risk that a counterparty will default on its contractual obligations resulting in financial loss to the Company. As at December 31, 2016, financial assets exposed to credit risk include debt instruments and derivatives as noted in the Company’s financial statements. The Company has adopted a policy of dealing with creditworthy counterparties and obtaining sufficient collateral where appropriate, as a means of mitigating the risk of financial loss from defaults. The Company’s exposure and the credit ratings of its counterparties are continuously monitored and the aggregate value of transactions concluded is spread among approved counterparties. All purchases and sales of listed securities are settled/paid for upon delivery using approved brokers. The delivery of securities sold is only made once payment has been received by the broker and payment is made on a purchase only after the securities have been received by the broker. The trade will fail if either party fails to meet its obligation. The credit risk on cash transactions and transactions involving derivative financial instruments is mitigated by transacting with counterparties that are regulated entities subject to prudent supervision, or with high credit-ratings assigned by international credit-rating agencies. As at December 31, 2016 and 2015, none of these financial assets was either impaired or past due but not impaired. The Company’s maximum exposure to credit risk arising from private equity investments is equal to the fair value of those investments. The Company also has credit exposure related to deposits placed with

34
Canadian and U.S. chartered banks in the amount of $1,566,053 as at December 31, 2016 (December 31, 2015 - $3,013,848). The banks at which the deposits are held have a senior debt rating of AA- from DBRS. The Monarch Joint Venture has indirect exposure to counterparty risk via reinsurance arrangements. The Board of Monarch oversees this risk structure. The Monarch Entities deal with A- or better rated A.M. Best Company reinsurers or counterparties who fully collateralize their exposures. Foreign Exchange Risk
The Company has significant exposure to foreign exchange risk as it has a substantial amount of its capital in USD in the Monarch Joint Venture. Its investee companies may also have exposure to sudden changes in foreign exchange rates.
Regulatory Risk
Crosswinds and its subsidiaries, affiliates and operating companies may be subject to extensive governmental regulations and oversight with respect to their business activities. The failure to comply with applicable regulations, obtain applicable regulatory approval or maintain those approvals so obtained may subject the applicable operating company to civil penalties, suspensions or withdrawal of any regulatory approval or consent obtained, injunctions, operating restrictions and criminal prosecutions and penalties, which could, individually or in the aggregate, have a material adverse effect on Crosswinds’ consolidated financial position. There can be no assurance that the Company will continue to meet the minimum and continued listing requirements of the TSX.
Concentration Risk
The Company participates in a limited number of investments and, as a consequence, the Company’s financial results may be substantially adversely affected by the unfavorable performance of a single investment. The Company has committed a substantial portion of its available resources to a single investment in the Monarch Joint Venture.
Shareholder Control
Some of the Company’s existing shareholders can exert control over and may not make decisions that are in the best interests of all shareholders. If certain shareholders act together, they may be able to exert a significant degree of influence over the Company’s management and affairs and over matters requiring shareholder approval, including the election of directors and approval of significant corporate transactions.
In addition, this concentration of ownership may facilitate or delay or prevent a change in control of the Company and might affect the market price of the Common Shares even when a change may or may not be in the best interests of all shareholders. The interests of this concentration of ownership may not always coincide with the Company’s interests of interests of other shareholders and accordingly they could cause the Company to enter into transactions or agreements that it would not otherwise consider.
Foreign Jurisdictions
The Company has made and is looking at commitments to do business in foreign jurisdictions which have different currencies and regulatory environments than the jurisdiction in which the Company currently operates. There may be currency and other risks associated with these activities.
35
Market Risk - Direct
Market risk includes exposure to fluctuations in the market value of the Company’s investments, currency rates and interest rates.
The Company currently has no direct exposure to market risk since the Company held no publicly traded investments as at December 31, 2016. The Company has exposure to foreign exchange risk. See “Foreign Exchange Risk” above.
Market Risk - Indirect The Company’s remaining private investment as at December 31, 2016, does not trade in an active marketplace and therefore values are not directly observable by market prices. Investments classified as “held-for-trading” are carried at fair values. Fair values are estimated based on financial figures (actual or forecast) obtained directly from the investee companies and market multiples (e.g. Revenues or EBITDA multiples) which are not directly observable but which can be estimated by considering public company multiples for companies in the same or similar businesses and, where information is known and believed to be reliable, multiples at which recent transactions in the industry occurred; and multiples at which the Company invested in the private entity, or for follow-on investments or financings. The resulting multiple is adjusted, if necessary, to take into account differences between the investee company and those the Company selected for comparisons and factors include public versus private company, company size, same versus similar business, as well as with respect to the sustainability of the investee company’s financial performance and current economic environment. Therefore, to the extent that fluctuations occur in stock markets (market risk), those fluctuations could indirectly influence multiples used by the Company in valuing its investments in private entities.
The Company’s investment in a private entity was comprised of one company in one industry as at December 31, 2016. As at December 31, 2016, the Salbro investment was carried at an aggregate fair value of $3,052,140 representing 13.2% of the Company’s assets. The Company believes the debt profile of the investee company to be, at a moderately high level and encourages and influences the investee to remain prudent with debt levels. Keeping prudent levels of debt is a method of managing the risk on the overall portfolio.
The Company’s investment in an associate, which operates in the property and casualty insurance business in Florida, at December 31, 2016 was $18,269,925 representing 79.1% of the Company’s assets. The insurance industry is inherently risky due to its cyclical nature. Monarch also owns an investment portfolio consisting primarily of bonds and as a result has market risks. See “interest rate sensitivity” above. The Company believes it has mitigated its risk in this business by partnering with an existing experienced insurance carrier. For general factors affecting the Company see the section entitled “Risk Factors” found in the Company’s AIF filed under the Company’s SEDAR profile at www.sedar.

CROSSWINDS HOLDINGS INC.
Consolidated Financial Statements For the years ended December 31, 2016 and 2015
Deloitte LLP Bay Adelaide East 22 Adelaide Street West Suite 200 Toronto ON M5H 0A9 Canada
Tel: 416-601-6150 Fax: 416-601-6610 www.deloitte.ca
Independent Auditor’s Report To the Shareholders of Crosswinds Holdings Inc.
We have audited the accompanying consolidated financial statements of Crosswinds Holdings Inc., which comprise the consolidated statements of financial position as at December 31, 2016 and December 31, 2015, and the consolidated statements of loss and comprehensive loss, consolidated statements of changes in equity and consolidated statements of cash flows for the years then ended, and a summary of significant accounting policies and other explanatory information.
Management's Responsibility for the Consolidated Financial Statements Management is responsible for the preparation and fair presentation of these consolidated financial statements in accordance with International Financial Reporting Standards and for such internal control as management determines is necessary to enable the preparation of consolidated financial statements that are free from material misstatement, whether due to fraud or error.
Auditor's Responsibility Our responsibility is to express an opinion on these consolidated financial statements based on our audits. We conducted our audits in accordance with Canadian generally accepted auditing standards.
Those standards require that we comply with ethical requirements and plan and perform the audit to obtain reasonable assurance about whether the consolidated financial statements are free from material misstatement.
An audit involves performing procedures to obtain audit evidence about the amounts and disclosures in the consolidated financial statements. The procedures selected depend on the auditor's judgment, including the assessment of the risks of material misstatement of the consolidated financial statements, whether due to fraud or error. In making those risk assessments, the auditor considers internal control relevant to the entity's preparation and fair presentation of the consolidated financial statements in order to design audit procedures that are appropriate in the circumstances, but not for the purpose of expressing an opinion on the effectiveness of the entity's internal control.
An audit also includes evaluating the appropriateness of accounting policies used and the reasonableness of accounting estimates made by management, as well as evaluating the overall presentation of the consolidated financial statements.
We believe that the audit evidence we have obtained in our audits is sufficient and appropriate to provide a basis for our audit opinion.
FS 1

FS 2
Opinion In our opinion, the consolidated financial statements present fairly, in all material respects, the financial position of Crosswinds Holdings Inc. as at December 31, 2016 and December 31, 2015 and its financial performance and its cash flows for the years then ended in accordance with International Financial Reporting Standards.
Chartered Professional Accountants Licensed Public Accountants March 27, 2017

FS 3
Crosswinds Holdings Inc. Consolidated Statements of Financial Position
(expressed in Canadian Dollars)
As at
AssetsCurrent assets
Cash 1,566,053$ 3,013,848$
Due from related parties (note 10) 89,982 77,578
Interest receivable and prepaid expenses 84,376 114,011
1,740,411 3,205,437
Non-current assets
Investment in an associate (note 7) 18,269,925 18,267,378
Investment in private entity (note 6) 3,052,140 2,478,096
Capital assets, net of accumulated depreciation 27,459 19,113
23,089,935$ 23,970,024$
Liabilities
Accounts payable and accrued liabilities 277,353$ 367,559$
277,353 367,559
Shareholders' equity
Share capital (note 8) 15,273,044 15,273,044 Contributed surplus 13,405,355 13,061,803
Deficit (9,145,948) (8,321,126)
Accumulated other comprehensive income 670,281 979,260
Total equity attributable to shareholders of Crosswinds 20,202,732 20,992,981 Non-controlling interests 2,609,850 2,609,484
22,812,582 23,602,465 23,089,935$ 23,970,024$
Commitment (note 12)
APPROVED ON BEHALF OF THE BOARD OF DIRECTORS
Robert Wolf J. Roy Pottle…………………..…… Director …………………..…… Director
The accompanying notes are an integral part of these consolidated financial statements.
December 31, 2016 December 31, 2015
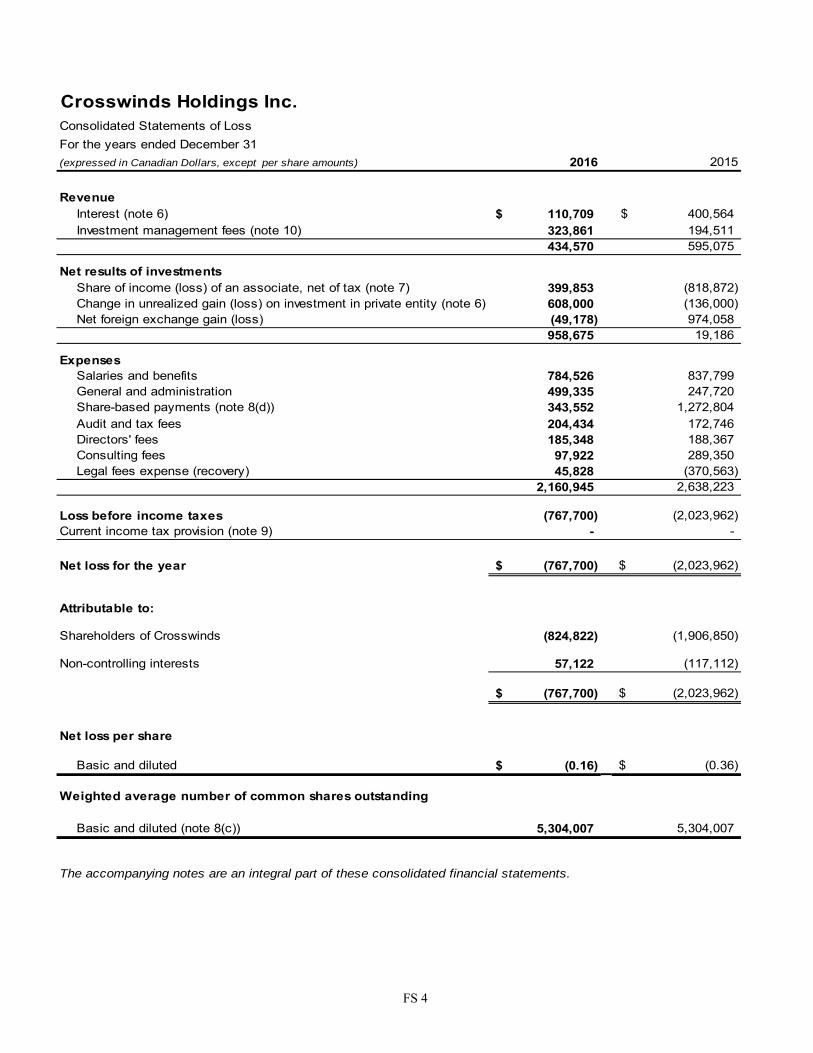
FS 4
Crosswinds Holdings Inc.Consolidated Statements of Loss
For the years ended December 31
(expressed in Canadian Dollars, except per share amounts) 2016 2015
RevenueInterest (note 6) 110,709$ 400,564$ Investment management fees (note 10) 323,861 194,511
434,570 595,075
Net results of investmentsShare of income (loss) of an associate, net of tax (note 7) 399,853 (818,872) Change in unrealized gain (loss) on investment in private entity (note 6) 608,000 (136,000) Net foreign exchange gain (loss) (49,178) 974,058
958,675 19,186
ExpensesSalaries and benefits 784,526 837,799 General and administration 499,335 247,720 Share-based payments (note 8(d)) 343,552 1,272,804 Audit and tax fees 204,434 172,746 Directors' fees 185,348 188,367 Consulting fees 97,922 289,350 Legal fees expense (recovery) 45,828 (370,563)
2,160,945 2,638,223
Loss before income taxes (767,700) (2,023,962) Current income tax provision (note 9) - -
Net loss for the year (767,700)$ (2,023,962)$
Attributable to:
Shareholders of Crosswinds (824,822) (1,906,850)
Non-controlling interests 57,122 (117,112)
(767,700)$ (2,023,962)$
Net loss per share
Basic and diluted (0.16)$ (0.36)$
Weighted average number of common shares outstanding
Basic and diluted (note 8(c)) 5,304,007 5,304,007
The accompanying notes are an integral part of these consolidated financial statements.

FS 5
Crosswinds Holdings Inc.Consolidated Statements of Comprehensive Loss
For the years ended December 31
(expressed in Canadian Dollars) 2016 2015
Net loss (767,700)$ (2,023,962)$
Other comprehensive income (loss)Change in unrealized foreign currency translation gains (losses) on foreign operations (506,123) 1,357,298 Share of other comprehensive income (loss) of an associate (note 7) 140,388 (205,242)
Other comprehensive income (loss) (365,735) 1,152,056 Comprehensive loss (1,133,435)$ (871,906)$
Attributable to:
Shareholders of Crosswinds (1,133,801) (927,589)
Non-contolling interests 366 55,683
(1,133,435)$ (871,906)$
The accompanying notes are an integral part of these consolidated financial statements.
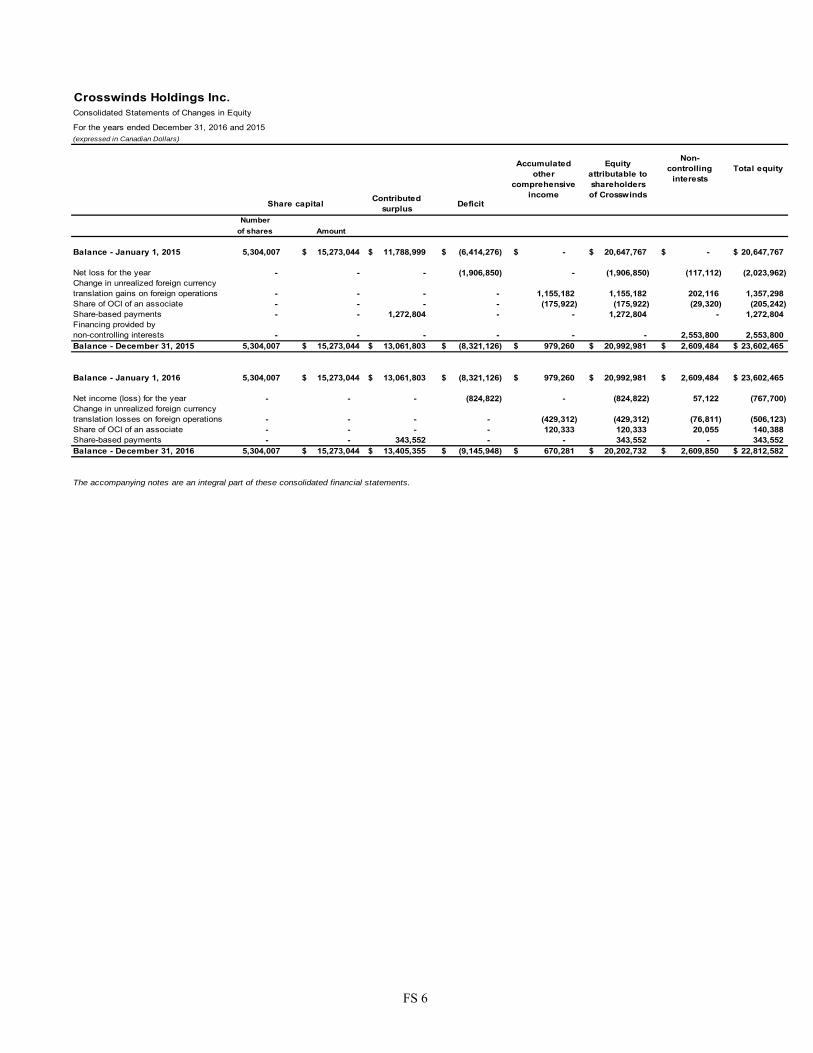
FS 6
Crosswinds Holdings Inc.Consolidated Statements of Changes in Equity
For the years ended December 31, 2016 and 2015
(expressed in Canadian Dollars)
Non-controlling
interestsTotal equity
Number
of shares Amount
Balance - January 1, 2015 5,304,007 15,273,044$ 11,788,999$ (6,414,276)$ -$ 20,647,767$ -$ 20,647,767$
Net loss for the year - - - (1,906,850) - (1,906,850) (117,112) (2,023,962) Change in unrealized foreign currencytranslation gains on foreign operations - - - - 1,155,182 1,155,182 202,116 1,357,298 Share of OCI of an associate - - - - (175,922) (175,922) (29,320) (205,242) Share-based payments - - 1,272,804 - - 1,272,804 - 1,272,804Financing provided by non-controlling interests - - - - - - 2,553,800 2,553,800Balance - December 31, 2015 5,304,007 15,273,044$ 13,061,803$ (8,321,126)$ 979,260$ 20,992,981$ 2,609,484$ 23,602,465$
Balance - January 1, 2016 5,304,007 15,273,044$ 13,061,803$ (8,321,126)$ 979,260$ 20,992,981$ 2,609,484$ 23,602,465$
Net income (loss) for the year - - - (824,822) - (824,822) 57,122 (767,700) Change in unrealized foreign currencytranslation losses on foreign operations - - - - (429,312) (429,312) (76,811) (506,123) Share of OCI of an associate - - - - 120,333 120,333 20,055 140,388 Share-based payments - - 343,552 - - 343,552 - 343,552Balance - December 31, 2016 5,304,007 15,273,044$ 13,405,355$ (9,145,948)$ 670,281$ 20,202,732$ 2,609,850$ 22,812,582$
The accompanying notes are an integral part of these consolidated financial statements.
Share capital Contributed
surplus
Equity attributable to shareholders of Crosswinds
Accumulated other
comprehensive income
Deficit
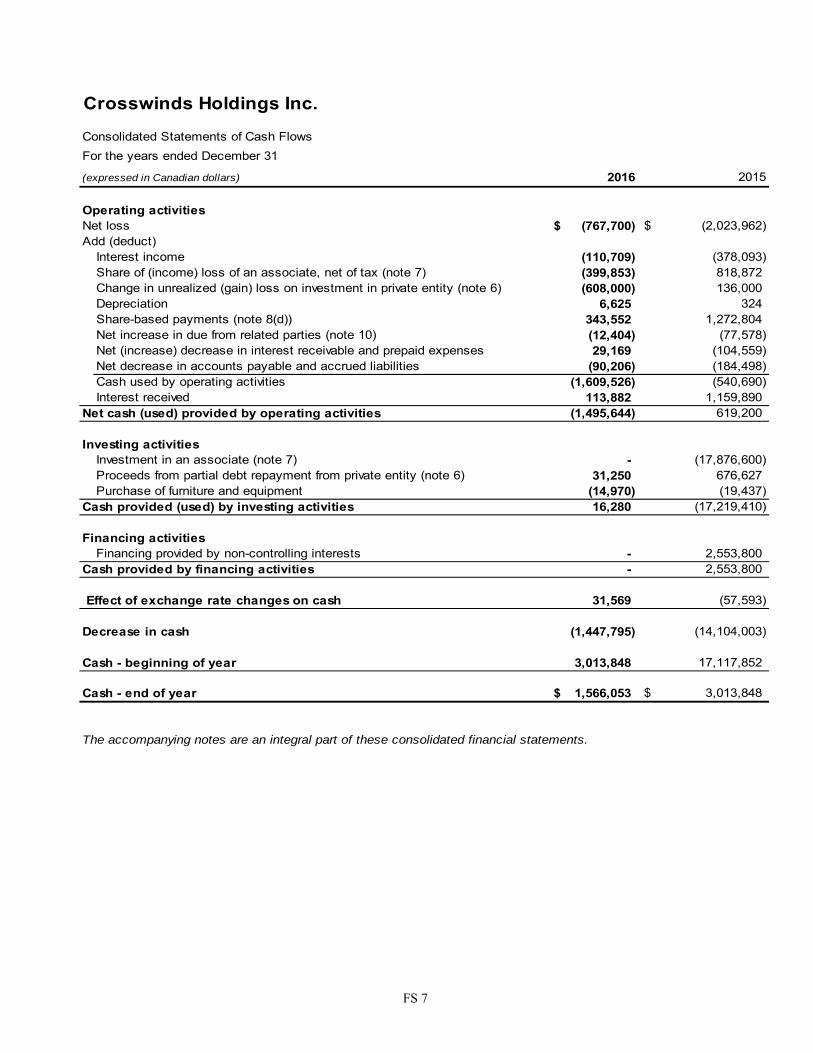
FS 7
Crosswinds Holdings Inc.
Consolidated Statements of Cash Flows
For the years ended December 31
(expressed in Canadian dollars) 2016 2015
Operating activitiesNet loss (767,700)$ (2,023,962)$ Add (deduct)
Interest income (110,709) (378,093) Share of (income) loss of an associate, net of tax (note 7) (399,853) 818,872 Change in unrealized (gain) loss on investment in private entity (note 6) (608,000) 136,000 Depreciation 6,625 324 Share-based payments (note 8(d)) 343,552 1,272,804 Net increase in due from related parties (note 10) (12,404) (77,578) Net (increase) decrease in interest receivable and prepaid expenses 29,169 (104,559) Net decrease in accounts payable and accrued liabilities (90,206) (184,498) Cash used by operating activities (1,609,526) (540,690) Interest received 113,882 1,159,890
Net cash (used) provided by operating activities (1,495,644) 619,200
Investing activitiesInvestment in an associate (note 7) - (17,876,600)Proceeds from partial debt repayment from private entity (note 6) 31,250 676,627 Purchase of furniture and equipment (14,970) (19,437)
Cash provided (used) by investing activities 16,280 (17,219,410)
Financing activitiesFinancing provided by non-controlling interests - 2,553,800
Cash provided by financing activities - 2,553,800
Effect of exchange rate changes on cash 31,569 (57,593)
Decrease in cash (1,447,795) (14,104,003)
Cash - beginning of year 3,013,848 17,117,852
Cash - end of year 1,566,053$ 3,013,848$
The accompanying notes are an integral part of these consolidated financial statements.

Crosswinds Holdings Inc. Notes to the Consolidated Financial Statements For the years ended December 31, 2016 and 2015 (Expressed in Canadian dollars except per share amounts or unless otherwise stated)
FS 8
1. Corporate information
Crosswinds Holdings Inc. (“Crosswinds” or the “Company”) is a publicly traded private equity firm. The Companyis incorporated under the Business Corporations Act (Alberta), with its head office at 365 Bay St., Suite 400,Toronto, Ontario M5H 2V1. The registered office of the Company is located at 3700 Canterra Tower, 400 ThirdAvenue SW, Calgary, Alberta T2P 4H2.
The Company’s common shares trade on the Toronto Stock Exchange (“TSX”) under the symbol “CWI”.
These consolidated financial statements of the Company for the year ended December 31, 2016 were approvedand authorized for issue by the Board of Directors of the Company on March 27, 2017.
2. Basis of presentation
The Company prepares its consolidated financial statements in accordance with International Financial ReportingStandards (“IFRS”). These consolidated financial statements have been prepared on a going concern basis, underthe historical cost convention, except for the investment in private entity which is presented at fair value asdescribed in note 6. The Company has consistently applied the accounting policies used in preparation of theseconsolidated financial statements throughout all the periods presented. Critical accounting judgments andestimates used by management in the preparation of these consolidated financial statements are presented innote 4.
3. Summary of significant accounting policies
The significant accounting policies used in the preparation of these consolidated financial statements are as follows:
(a) Principles of consolidation
These consolidated financial statements include the financial position, results of operations and cash flows of the Company, its subsidiaries and its interest in an associate. All intercompany balances, transactions, income and expenses, and profits or losses have been eliminated on consolidation.
The Company’s subsidiaries and interest in an associate are as follows:
Entity Relationship Geographic
location Equity interest Basis of accounting
Crosswinds AUM LLC Subsidiary USA 100% Full consolidation
Crosswinds Monarch GP LLC Subsidiary USA 100% Full consolidation
Crosswinds Re Subsidiary Cayman 100% Full consolidation
Crosswinds Private Equity Partners (C.I.), GP
Subsidiary Cayman 100% Full consolidation
Crosswinds Private Equity Partners (C.I.), LP
Subsidiary Cayman 100% Full consolidation
Crosswinds Investor Monarch LP Subsidiary USA 85.7% Full consolidation
Monarch Delaware Holdings LLC Associate USA 42.4% Equity method
Subsidiaries
Subsidiaries are entities over which the Company has control. Control is defined as when the Company is exposed or has rights to the variable returns from the subsidiary and has the ability to affect those returns through its power over the subsidiary. Power is defined as existing rights that give the Company the ability to direct the relevant activities of the subsidiary. Subsidiaries are fully consolidated from the date control is transferred to the Company and are de-consolidated from the date control ceases.

Crosswinds Holdings Inc. Notes to the Consolidated Financial Statements For the years ended December 31, 2016 and 2015 (Expressed in Canadian dollars except per share amounts or unless otherwise stated)
FS 9
Non-controlling interests
A non-controlling interest is initially recognized as the proportionate share of the identifiable net assets of the subsidiary on the date of its acquisition and is subsequently adjusted for the non-controlling interest’s share in changes of the acquired subsidiary’s earnings and capital. Effects of transactions with non-controlling interests are recorded in equity if there is no change in control.
Investments in associates
Investments in associates are accounted for using the equity method and are comprised of investments in corporations and limited partnerships where the Company has the ability to exercise significant influence but not control. Significant influence is generally presumed to exist when the Company owns, directly or indirectly, between 20% and 50% of the outstanding voting rights of the investee. Assessment of significant influence is based on the substance of the relationship between the Company and the investee and includes consideration of existing voting rights, potential voting rights that are currently exercisable and convertible (if applicable), voting power of other shareholders, corporate governance arrangements and participation in policy-making processes. These investments are reported in investments in associates on the consolidated statements of financial position, with the Company’s share of income (loss) and other comprehensive income (loss) of the associate reported in the corresponding line in the consolidated statements of loss and comprehensive loss. Foreign associates are translated in the same manner as foreign subsidiaries. When the Company’s share of losses in an associate equals or exceeds its investment in the associate, the Company does not record further losses unless it has incurred obligations on behalf of the associate.
Under the equity method of accounting, an investment in associate is initially recognized at cost and adjusted thereafter for the post-acquisition change in the Company’s share of net assets of the associate. Any excess of the cost of acquisition over the net fair value of the Company’s share of the identifiable assets, liabilities and contingent liabilities at the date of acquisition is recognized as goodwill, and is included in the carrying value of the associate. To the extent that the cost of acquisition is less than the fair value of the Company’s share of the associate’s identifiable net assets, the excess is recognized in the consolidated statements of loss and comprehensive loss. Any pre-existing interest in an associate is re-measured to fair value at the date significant influence is obtained and any resulting gain or loss is recognized in the consolidated statements of loss. In such instances the cost of the associate is measured as the sum of the fair value of the pre-existing interest and any additional consideration transferred at that date.
In determining the fair value of the Company’s share of an associate’s identifiable net assets at the acquisition date, considerable judgment may be required in interpreting market data used to develop such estimates. The Company makes assumptions primarily based on market conditions and applies valuation techniques such as discounted cash flow analysis, market capitalization and comparable company multiples and other methods commonly used by market participants to determine fair value. Where the Company is only able to identify the principal factors resulting in divergence between the fair value and reported carrying value of an associate’s net assets, the use of different assumptions and/or valuation methodologies by the Company may have a significant effect on the estimated fair value.
At each balance sheet date, and more frequently when conditions warrant, management assesses investments in associates for potential impairment. If management’s assessment indicates that there is objective evidence of impairment, the associate is written down to its recoverable amount, which is determined as the higher of its fair value less costs of disposal and its value in use. Previously recognized impairment losses are reversed when there is evidence that there has been a change in the estimates used to determine the associate’s recoverable amount since the recognition of the last impairment loss. The reversal is recognized in the consolidated statements of loss to the extent that the carrying value of the associate after reversal does not exceed the carrying value that would have been determined had no impairment loss been recognized in previous periods. Gains and losses realized on dispositions, impairment losses and reversal of impairments are recognized in net gains (losses) on investments in the consolidated statements of loss.
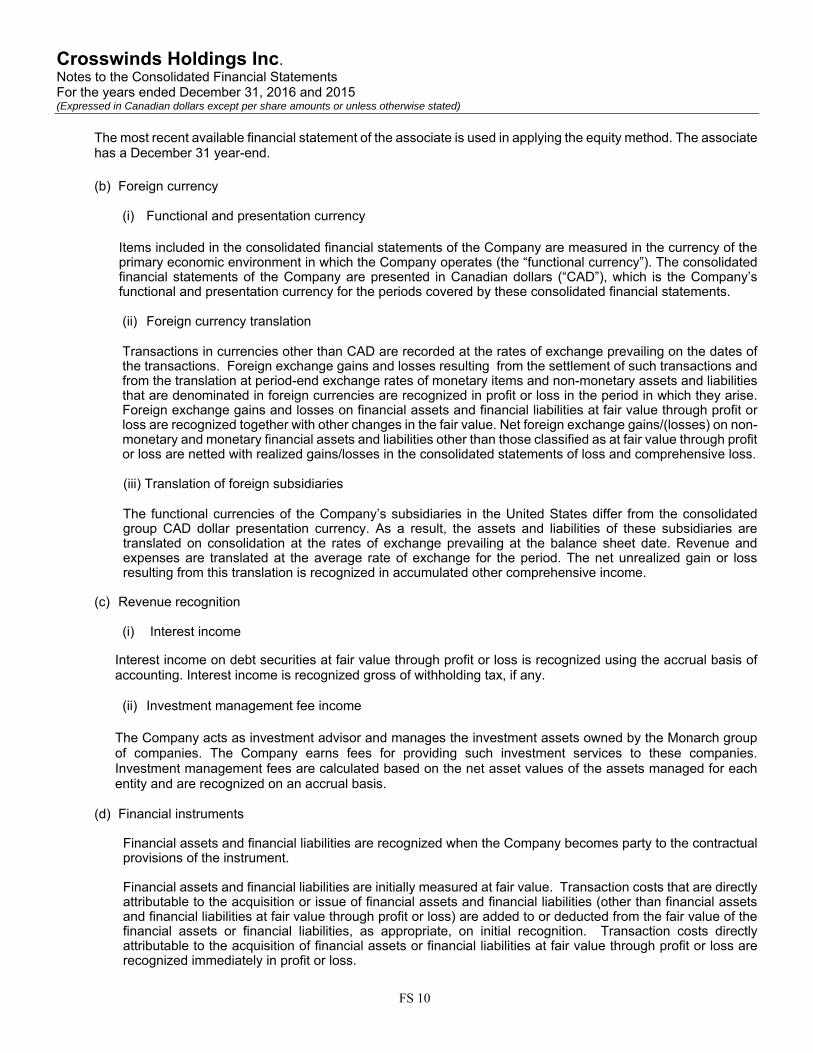
Crosswinds Holdings Inc. Notes to the Consolidated Financial Statements For the years ended December 31, 2016 and 2015 (Expressed in Canadian dollars except per share amounts or unless otherwise stated)
FS 10
The most recent available financial statement of the associate is used in applying the equity method. The associate has a December 31 year-end.
(b) Foreign currency
(i) Functional and presentation currency
Items included in the consolidated financial statements of the Company are measured in the currency of the primary economic environment in which the Company operates (the “functional currency”). The consolidated financial statements of the Company are presented in Canadian dollars (“CAD”), which is the Company’s functional and presentation currency for the periods covered by these consolidated financial statements.
(ii) Foreign currency translation
Transactions in currencies other than CAD are recorded at the rates of exchange prevailing on the dates of the transactions. Foreign exchange gains and losses resulting from the settlement of such transactions and from the translation at period-end exchange rates of monetary items and non-monetary assets and liabilities that are denominated in foreign currencies are recognized in profit or loss in the period in which they arise. Foreign exchange gains and losses on financial assets and financial liabilities at fair value through profit or loss are recognized together with other changes in the fair value. Net foreign exchange gains/(losses) on non-monetary and monetary financial assets and liabilities other than those classified as at fair value through profit or loss are netted with realized gains/losses in the consolidated statements of loss and comprehensive loss.
(iii) Translation of foreign subsidiaries
The functional currencies of the Company’s subsidiaries in the United States differ from the consolidated group CAD dollar presentation currency. As a result, the assets and liabilities of these subsidiaries are translated on consolidation at the rates of exchange prevailing at the balance sheet date. Revenue and expenses are translated at the average rate of exchange for the period. The net unrealized gain or loss resulting from this translation is recognized in accumulated other comprehensive income.
(c) Revenue recognition
(i) Interest income
Interest income on debt securities at fair value through profit or loss is recognized using the accrual basis of accounting. Interest income is recognized gross of withholding tax, if any.
(ii) Investment management fee income
The Company acts as investment advisor and manages the investment assets owned by the Monarch group of companies. The Company earns fees for providing such investment services to these companies. Investment management fees are calculated based on the net asset values of the assets managed for each entity and are recognized on an accrual basis.
(d) Financial instruments
Financial assets and financial liabilities are recognized when the Company becomes party to the contractualprovisions of the instrument.
Financial assets and financial liabilities are initially measured at fair value. Transaction costs that are directlyattributable to the acquisition or issue of financial assets and financial liabilities (other than financial assetsand financial liabilities at fair value through profit or loss) are added to or deducted from the fair value of thefinancial assets or financial liabilities, as appropriate, on initial recognition. Transaction costs directlyattributable to the acquisition of financial assets or financial liabilities at fair value through profit or loss arerecognized immediately in profit or loss.
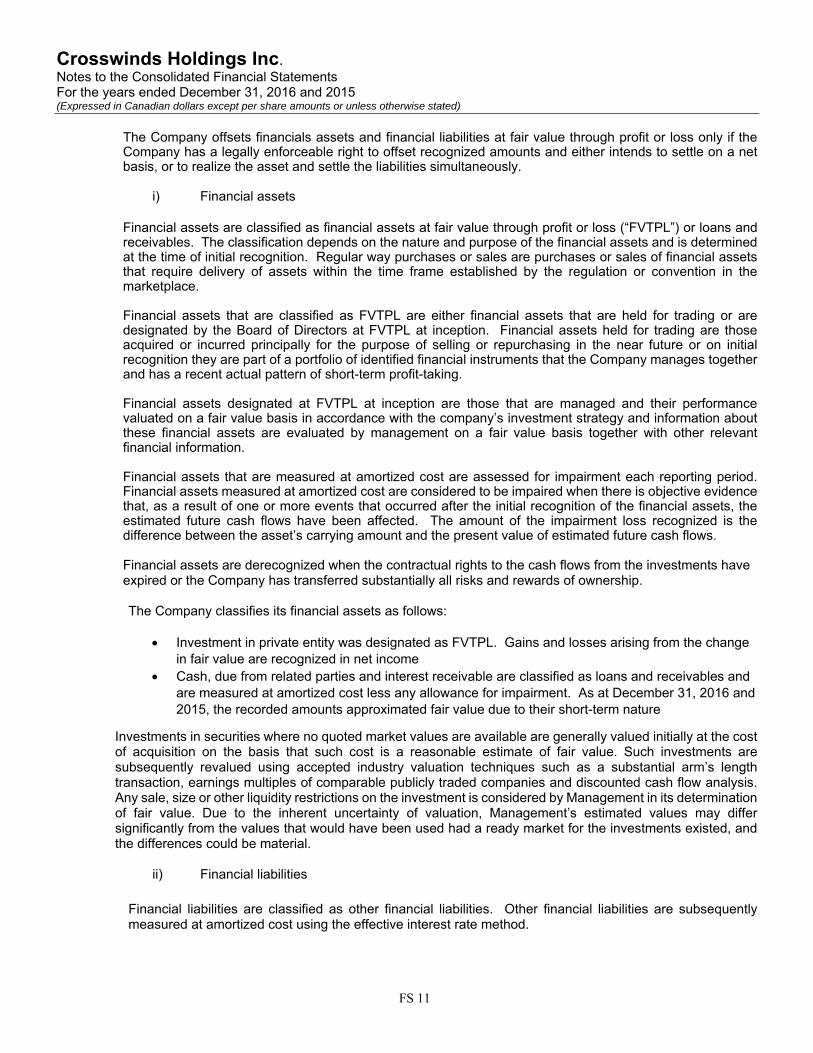
Crosswinds Holdings Inc. Notes to the Consolidated Financial Statements For the years ended December 31, 2016 and 2015 (Expressed in Canadian dollars except per share amounts or unless otherwise stated)
FS 11
The Company offsets financials assets and financial liabilities at fair value through profit or loss only if the Company has a legally enforceable right to offset recognized amounts and either intends to settle on a net basis, or to realize the asset and settle the liabilities simultaneously.
i) Financial assets
Financial assets are classified as financial assets at fair value through profit or loss (“FVTPL”) or loans and receivables. The classification depends on the nature and purpose of the financial assets and is determined at the time of initial recognition. Regular way purchases or sales are purchases or sales of financial assets that require delivery of assets within the time frame established by the regulation or convention in the marketplace.
Financial assets that are classified as FVTPL are either financial assets that are held for trading or are designated by the Board of Directors at FVTPL at inception. Financial assets held for trading are those acquired or incurred principally for the purpose of selling or repurchasing in the near future or on initial recognition they are part of a portfolio of identified financial instruments that the Company manages together and has a recent actual pattern of short-term profit-taking.
Financial assets designated at FVTPL at inception are those that are managed and their performance valuated on a fair value basis in accordance with the company’s investment strategy and information about these financial assets are evaluated by management on a fair value basis together with other relevant financial information.
Financial assets that are measured at amortized cost are assessed for impairment each reporting period. Financial assets measured at amortized cost are considered to be impaired when there is objective evidence that, as a result of one or more events that occurred after the initial recognition of the financial assets, the estimated future cash flows have been affected. The amount of the impairment loss recognized is the difference between the asset’s carrying amount and the present value of estimated future cash flows.
Financial assets are derecognized when the contractual rights to the cash flows from the investments have expired or the Company has transferred substantially all risks and rewards of ownership.
The Company classifies its financial assets as follows:
Investment in private entity was designated as FVTPL. Gains and losses arising from the changein fair value are recognized in net income
Cash, due from related parties and interest receivable are classified as loans and receivables andare measured at amortized cost less any allowance for impairment. As at December 31, 2016 and2015, the recorded amounts approximated fair value due to their short-term nature
Investments in securities where no quoted market values are available are generally valued initially at the cost of acquisition on the basis that such cost is a reasonable estimate of fair value. Such investments are subsequently revalued using accepted industry valuation techniques such as a substantial arm’s length transaction, earnings multiples of comparable publicly traded companies and discounted cash flow analysis. Any sale, size or other liquidity restrictions on the investment is considered by Management in its determination of fair value. Due to the inherent uncertainty of valuation, Management’s estimated values may differ significantly from the values that would have been used had a ready market for the investments existed, and the differences could be material.
ii) Financial liabilities
Financial liabilities are classified as other financial liabilities. Other financial liabilities are subsequently measured at amortized cost using the effective interest rate method.

Crosswinds Holdings Inc. Notes to the Consolidated Financial Statements For the years ended December 31, 2016 and 2015 (Expressed in Canadian dollars except per share amounts or unless otherwise stated)
FS 12
Financial liabilities are derecognized when, and only when, the Company’s obligations are discharged, cancelled or have expired. The difference between the carrying amount of the financial liabilities derecognized and the consideration paid and payable is recognized in profit or loss.
The Company classifies its accounts payable and accrued liabilities as other financial liabilities and measures these financial liabilities at amortized cost. As at December 31, 2016 and 2015 the recorded amounts approximated fair value due to their short-term nature.
(e) Cash
Cash includes cash in hand and deposits held at call with banks.
(f) Income taxes
The Company uses the liability method to provide for income taxes on all transactions recorded in the financial statements. The liability method requires that income taxes reflect the expected future tax consequences of temporary differences between the carrying amounts of assets and liabilities and their tax basis. Deferred income tax assets and liabilities are determined for each temporary difference and unused losses, as applicable, at substantively enacted tax rates expected to be in effect when the assets are realized or the liabilities are settled. A valuation allowance is established to reduce deferred income tax assets to the amount that is more likely than not to be realized.
Income from investments held by the Company may be subject to withholding taxes in jurisdictions other than that of the Company’s as imposed by the country of origin. Withholding taxes, if any, are shown in a separate item in the statements of income and comprehensive income.
(g) Income per share
Basic income per share is calculated using the weighted average number of shares outstanding for the year. The treasury stock method is used to determine diluted income per share.
(h) Comprehensive loss
Comprehensive loss consists of net loss and other comprehensive loss and includes all changes in total equity during a period, except for those resulting from investments by owners and distributions to owners. Unrealized foreign currency translation amounts arising from foreign subsidiaries and associates that do not have Canadian dollar functional currencies are recognized in other comprehensive loss and included in accumulated other comprehensive income until recycled to the consolidated statements of loss in the future. Upon disposal of the related associate or subsidiary those amounts are reclassified directly to deficit. Accumulated other comprehensive income (net of income taxes) is included on the consolidated statements of financial position as a component of common shareholders’ equity.
(i) Consolidated statements of cash flows
The Company’s consolidated statements of cash flows are prepared in accordance with the indirect method, classifying cash flows as cash flows from operating, investing and financing activities.
(j) Share-based awards
The Company has a deferred share unit plan for the Board of Directors and management of the Company and its subsidiaries with vesting periods as determined by the Board of Directors at the time of grant. The fair value of the deferred share awards is estimated on the date of grant based on the market price of the Company’s stock and is amortized to share-based payments expense over the related vesting period, with a corresponding increase to contributed surplus. When a deferred share award vests in instalments over the vesting period (graded vesting), each instalment is accounted for as a separate award and amortized to compensation expense accordingly.
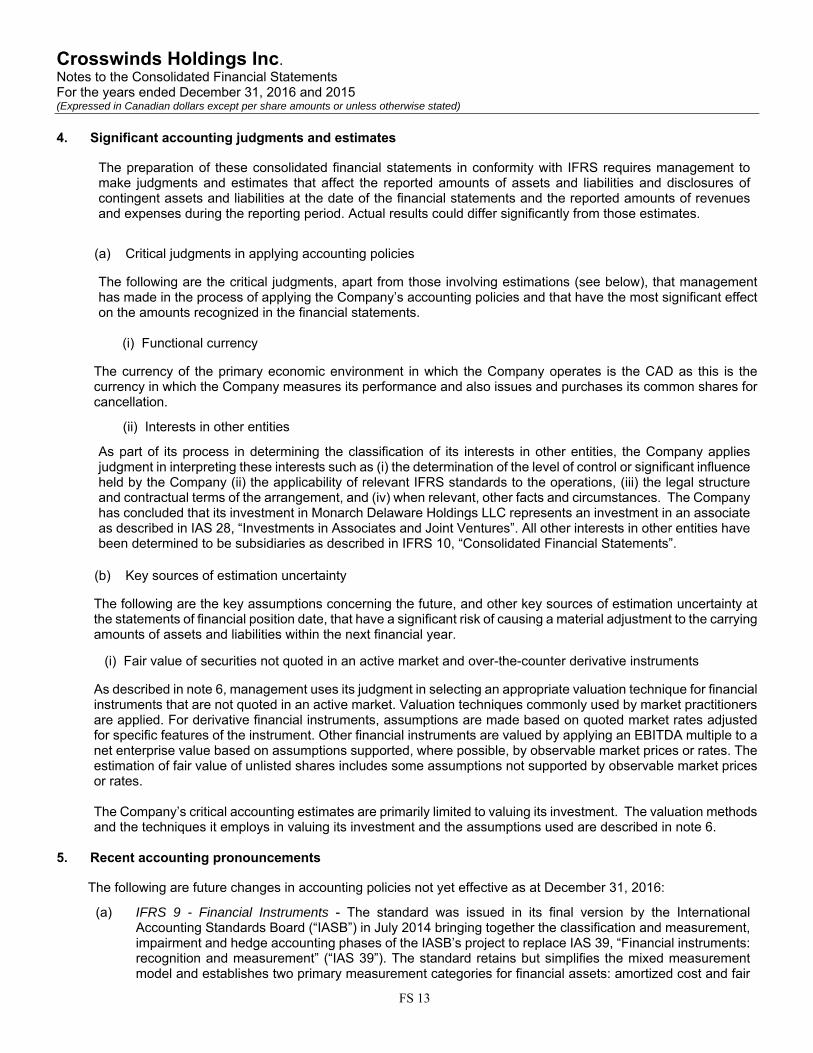
Crosswinds Holdings Inc. Notes to the Consolidated Financial Statements For the years ended December 31, 2016 and 2015 (Expressed in Canadian dollars except per share amounts or unless otherwise stated)
FS 13
4. Significant accounting judgments and estimates
The preparation of these consolidated financial statements in conformity with IFRS requires management tomake judgments and estimates that affect the reported amounts of assets and liabilities and disclosures of contingent assets and liabilities at the date of the financial statements and the reported amounts of revenues and expenses during the reporting period. Actual results could differ significantly from those estimates.
(a) Critical judgments in applying accounting policies
The following are the critical judgments, apart from those involving estimations (see below), that management has made in the process of applying the Company’s accounting policies and that have the most significant effect on the amounts recognized in the financial statements.
(i) Functional currency
The currency of the primary economic environment in which the Company operates is the CAD as this is the currency in which the Company measures its performance and also issues and purchases its common shares for cancellation.
(ii) Interests in other entities
As part of its process in determining the classification of its interests in other entities, the Company applies judgment in interpreting these interests such as (i) the determination of the level of control or significant influence held by the Company (ii) the applicability of relevant IFRS standards to the operations, (iii) the legal structure and contractual terms of the arrangement, and (iv) when relevant, other facts and circumstances. The Company has concluded that its investment in Monarch Delaware Holdings LLC represents an investment in an associate as described in IAS 28, “Investments in Associates and Joint Ventures”. All other interests in other entities have been determined to be subsidiaries as described in IFRS 10, “Consolidated Financial Statements”.
(b) Key sources of estimation uncertainty
The following are the key assumptions concerning the future, and other key sources of estimation uncertainty at the statements of financial position date, that have a significant risk of causing a material adjustment to the carrying amounts of assets and liabilities within the next financial year.
(i) Fair value of securities not quoted in an active market and over-the-counter derivative instruments
As described in note 6, management uses its judgment in selecting an appropriate valuation technique for financial instruments that are not quoted in an active market. Valuation techniques commonly used by market practitioners are applied. For derivative financial instruments, assumptions are made based on quoted market rates adjusted for specific features of the instrument. Other financial instruments are valued by applying an EBITDA multiple to a net enterprise value based on assumptions supported, where possible, by observable market prices or rates. The estimation of fair value of unlisted shares includes some assumptions not supported by observable market prices or rates.
The Company’s critical accounting estimates are primarily limited to valuing its investment. The valuation methods and the techniques it employs in valuing its investment and the assumptions used are described in note 6.
5. Recent accounting pronouncements
The following are future changes in accounting policies not yet effective as at December 31, 2016:
(a) IFRS 9 - Financial Instruments - The standard was issued in its final version by the InternationalAccounting Standards Board (“IASB”) in July 2014 bringing together the classification and measurement,impairment and hedge accounting phases of the IASB’s project to replace IAS 39, “Financial instruments:recognition and measurement” (“IAS 39”). The standard retains but simplifies the mixed measurementmodel and establishes two primary measurement categories for financial assets: amortized cost and fair

Crosswinds Holdings Inc. Notes to the Consolidated Financial Statements For the years ended December 31, 2016 and 2015 (Expressed in Canadian dollars except per share amounts or unless otherwise stated)
FS 14
value. The mandatory effective date of IFRS 9 is for annual periods beginning on or after January 1, 2018, with early adoption permitted. The Company is assessing the impact of this standard.
(b) IFRS 15 - Revenue from Contracts with Customers – This standard was issued by the IASB on May 28,2014, and amended on April 12, 2016, and will replace IAS 18, “Revenue”, IAS 11 “ConstructionContracts”, and related interpretations on revenue. IFRS 15 sets out the requirements for recognizingrevenue that apply to all contracts with customers, except for contracts that are within the scope of thestandards on leases, insurance contracts and financial instruments. IFRS 15 uses a control basedapproach to recognize revenue which is a change from the risk and reward approach under the currentstandard. Companies can elect to use either a full or modified retrospective approach when adopting thisstandard and it is effective for annual periods beginning on or after January 1, 2018 with early adoptionpermitted. The Company is assessing the impact of this standard.
(c) IFRS 16 – Leases – The standard was issued by the IASB on January 13, 2016, and will replace IAS 17,“Leases”. IFRS 16 will bring most leases on-balance sheet for lessees under a single model, eliminatingthe distinction between operating and financing leases. Lessor accounting however remains largelyunchanged and the distinction between operating and finance leases is retained. The new standard iseffective for annual periods beginning on or after January 1, 2019 with early adoption permitted if IFRS15 has also been applied. The Company is assessing the impact of this standard.
6. Investment in private entity
A summary of the face/contractual value, cost, fair value and unrealized gain on each of the Company’s financialinstruments as at December 31, 2016 and 2015 is presented below:
Face /Financial Maturity Contractual Fair UnrealizedInstrument Date Value Cost Value Gain
Salbro Bottle GroupDebentures December 31, 2021 1,590,140$ 1,590,140$ 1,590,140$ -$ Common share warrants n/a - 580,000 1,462,000 882,000
1,590,140$ 2,170,140$ 3,052,140$ 882,000$
Face /Financial Maturity Contractual Fair Unrealized
Instrument Date Value Cost Value Gain
Salbro Bottle GroupDebentures December 31, 2021 1,621,390$ 1,621,390$ 1,621,390$ -$ Accrued interest on debenture n/a 2,706 2,706 2,706 - Common share warrants n/a - 580,000 854,000 274,000
1,624,096$ 2,204,096$ 2,478,096$ 274,000$
December 31, 2015
December 31, 2016
Salbro Bottle Inc. and related companies (collectively “Salbro”)
Salbro is a manufacturer and distributor of packaging components, specializing in glass and plastic bottles.
In February 2008, the Company invested $3,600,000 in Salbro. The Company was issued (a) debentures paying 12% cash interest and (b) common share warrants providing the Company with a 12.5% equity interest in Salbro on a fully diluted basis.
In March 2009, the Company purchased $400,000 of additional 12% debentures at par plus accrued interest, increasing the total amount of debentures outstanding to $4,000,000.

Crosswinds Holdings Inc. Notes to the Consolidated Financial Statements For the years ended December 31, 2016 and 2015 (Expressed in Canadian dollars except per share amounts or unless otherwise stated)
FS 15
In August 2012, Salbro completed a refinancing resulting in a principal repayment to the Company of $1,700,000. In addition, the 12% debentures were amended such that interest was subsequently to be paid in kind instead of in cash.
On December 21, 2015, Salbro repaid $1,800,000 comprising a principal repayment of $676,627 and accrued interest of $1,123,373 owing under the Salbro debentures. As a condition to the repayment, certain terms of the Salbro debentures and common share warrants were amended, including the interest rate, maturity date, amortization schedule, return to cash interest payments and the percentage of warrants owned.
The Company became entitled to receive monthly principal and interest payments from Salbro commencing December 31, 2015 until maturity of the debentures, calculated at a revised interest rate of 6%. In addition, Salbro amalgamated its corporate entities and issued the Company 7.5% warrants in the newly amalgamated entity.
For the year ended December 31, 2016, interest income in the amount of $96,599 (2015 - $378,093) has been recorded in the consolidated statements of loss.
Fair value of private investment in Salbro
The fair value of financial assets that are not traded in an active market is determined by using the following valuation technique:
EBITDA Multiple
This valuation method estimates the net enterprise value by (i) performing an analysis of the maintainable EBITDA; (ii) applying an enterprise value/twelve-month trailing EBITDA multiple; and (iii) deducting any indebtedness.Where the Company uses a multiple of publicly traded companies or precedent transactions to derive anappropriate range of multiples it will apply, the multiples chosen are typically below the average comparablessurveyed to recognize the Company’s minority equity position and the fact that the investees are privately held.
Salbro
An EBITDA multiple of 8.5 was used to value Salbro as at December 31, 2016 (2015 – 8.5). Different assumptions were used to derive a range of valuations used to arrive at an estimate. A 1x change in the EBITDA multiple would increase or decrease the value of the investment by approximately $262,000 as at December 31, 2016 (2015 - $180,000).
The carrying amount of the Salbro investment at December 31, 2016 is $3,052,140 (2015 - $2,478,096).
Management has assessed and determined that using reasonable possible alternative assumptions would not result in significantly different fair values.
The following table provides an analysis of financial instruments that are measured subsequent to initial recognition at fair value, grouped into Levels 1 to 3 based on the degree to which the inputs to estimate the fair value are observable:
• Level 1 fair value measurements are those derived from quoted prices (unadjusted) in active markets for identicalassets or liabilities;
• Level 2 fair value measurements are those derived from inputs other than quoted prices included within Level 1that are observable for the asset or liability, either directly (i.e., as prices) or indirectly (i.e., derived from prices);and
• Level 3 fair value measurements are those derived from valuation techniques that include inputs for the asset orliability that are not based on observable market data (unobservable inputs).
The inputs are considered observable if they are developed using market data, such as publicly available information about actual events or transactions and the assumption that market participants would use such when pricing assets and/or liabilities.
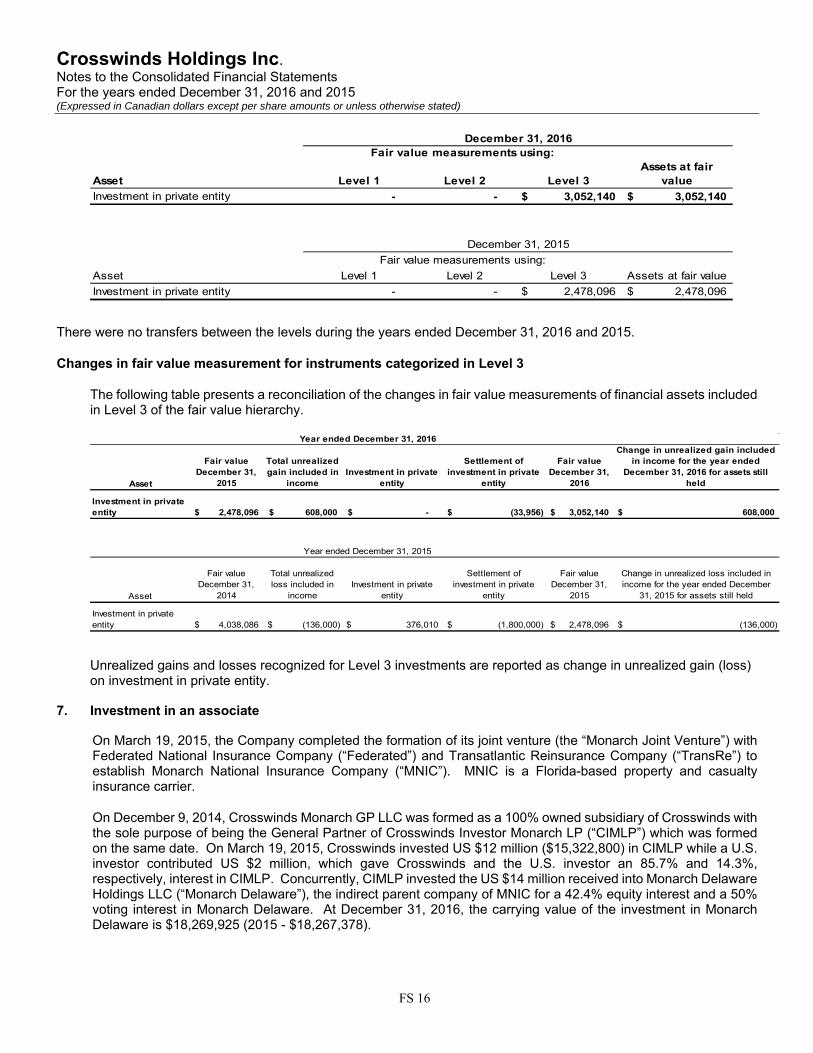
Crosswinds Holdings Inc. Notes to the Consolidated Financial Statements For the years ended December 31, 2016 and 2015 (Expressed in Canadian dollars except per share amounts or unless otherwise stated)
FS 16
Asset Level 1 Level 2 Level 3Assets at fair
value
Investment in private entity - - 3,052,140$ 3,052,140$
Asset Level 1 Level 2 Level 3 Assets at fair value
Investment in private entity - - 2,478,096$ 2,478,096$
December 31, 2016Fair value measurements using:
December 31, 2015
Fair value measurements using:
There were no transfers between the levels during the years ended December 31, 2016 and 2015.
Changes in fair value measurement for instruments categorized in Level 3
The following table presents a reconciliation of the changes in fair value measurements of financial assets included in Level 3 of the fair value hierarchy.
Asset
Fair value December 31,
2015
Total unrealized gain included in
incomeInvestment in private
entity
Settlement of investment in private
entity
Fair value December 31,
2016
Change in unrealized gain included in income for the year ended
December 31, 2016 for assets still held
Investment in private entity 2,478,096$ 608,000$ -$ (33,956)$ 3,052,140$ 608,000$
Asset
Fair value December 31,
2014
Total unrealized loss included in
incomeInvestment in private
entity
Settlement of investment in private
entity
Fair value December 31,
2015
Change in unrealized loss included in income for the year ended December
31, 2015 for assets still held
Investment in private entity 4,038,086$ (136,000)$ 376,010$ (1,800,000)$ 2,478,096$ (136,000)$
Year ended December 31, 2016
Year ended December 31, 2015
Unrealized gains and losses recognized for Level 3 investments are reported as change in unrealized gain (loss) on investment in private entity.
7. Investment in an associate
On March 19, 2015, the Company completed the formation of its joint venture (the “Monarch Joint Venture”) withFederated National Insurance Company (“Federated”) and Transatlantic Reinsurance Company (“TransRe”) toestablish Monarch National Insurance Company (“MNIC”). MNIC is a Florida-based property and casualtyinsurance carrier.
On December 9, 2014, Crosswinds Monarch GP LLC was formed as a 100% owned subsidiary of Crosswinds withthe sole purpose of being the General Partner of Crosswinds Investor Monarch LP (“CIMLP”) which was formedon the same date. On March 19, 2015, Crosswinds invested US $12 million ($15,322,800) in CIMLP while a U.S.investor contributed US $2 million, which gave Crosswinds and the U.S. investor an 85.7% and 14.3%,respectively, interest in CIMLP. Concurrently, CIMLP invested the US $14 million received into Monarch DelawareHoldings LLC (“Monarch Delaware”), the indirect parent company of MNIC for a 42.4% equity interest and a 50%voting interest in Monarch Delaware. At December 31, 2016, the carrying value of the investment in MonarchDelaware is $18,269,925 (2015 - $18,267,378).
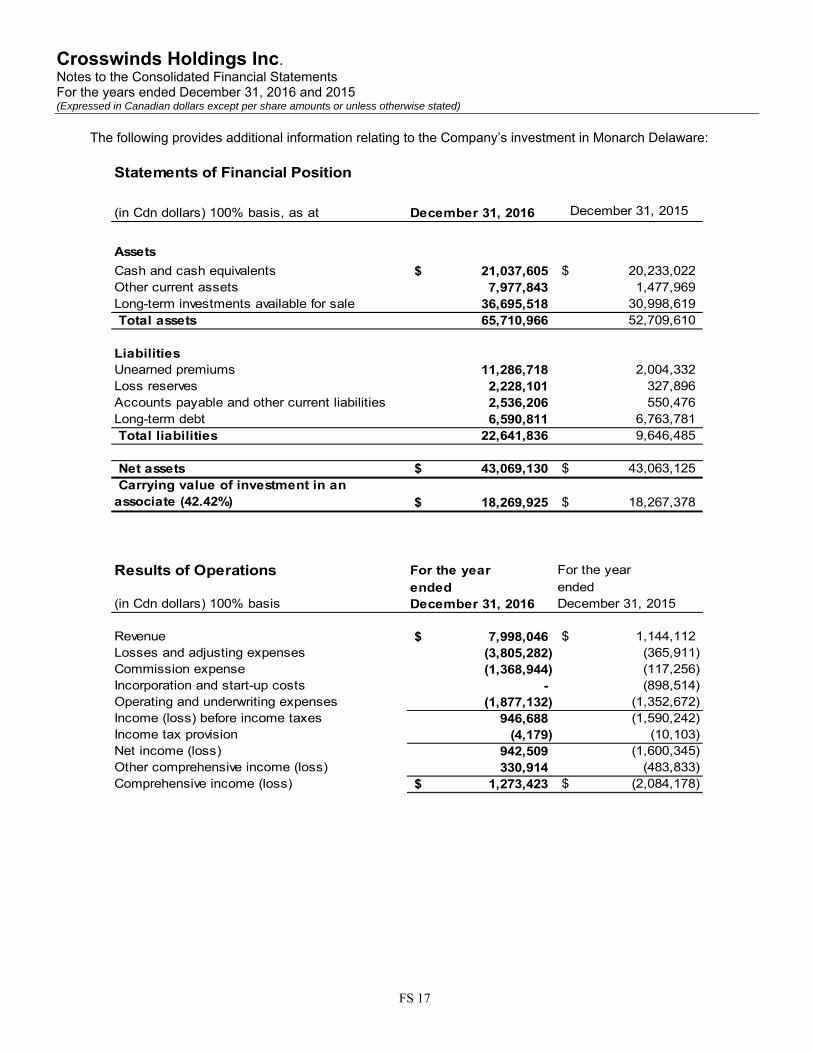
Crosswinds Holdings Inc. Notes to the Consolidated Financial Statements For the years ended December 31, 2016 and 2015 (Expressed in Canadian dollars except per share amounts or unless otherwise stated)
FS 17
The following provides additional information relating to the Company’s investment in Monarch Delaware:
Statements of Financial Position
(in Cdn dollars) 100% basis, as at December 31, 2016 December 31, 2015
Assets
Cash and cash equivalents 21,037,605$ 20,233,022$ Other current assets 7,977,843 1,477,969 Long-term investments available for sale 36,695,518 30,998,619 Total assets 65,710,966 52,709,610
LiabilitiesUnearned premiums 11,286,718 2,004,332 Loss reserves 2,228,101 327,896 Accounts payable and other current liabilities 2,536,206 550,476 Long-term debt 6,590,811 6,763,781 Total liabilities 22,641,836 9,646,485
Net assets 43,069,130$ 43,063,125$ Carrying value of investment in an associate (42.42%) 18,269,925$ 18,267,378$
Results of Operations For the year For the year
ended ended(in Cdn dollars) 100% basis December 31, 2016 December 31, 2015
Revenue 7,998,046$ 1,144,112$ Losses and adjusting expenses (3,805,282) (365,911) Commission expense (1,368,944) (117,256) Incorporation and start-up costs - (898,514)Operating and underwriting expenses (1,877,132) (1,352,672)Income (loss) before income taxes 946,688 (1,590,242) Income tax provision (4,179) (10,103) Net income (loss) 942,509 (1,600,345) Other comprehensive income (loss) 330,914 (483,833) Comprehensive income (loss) 1,273,423$ (2,084,178)$

Crosswinds Holdings Inc. Notes to the Consolidated Financial Statements For the years ended December 31, 2016 and 2015 (Expressed in Canadian dollars except per share amounts or unless otherwise stated)
FS 18
Reconciliation of Monarch Delaware’s comprehensive income (loss) to the share of income (loss) of an associate recognized in the consolidated statements of loss:
For the year For the year
ended ended(in Cdn dollars) 100% basis December 31, 2016 December 31, 2015
Comprehensive income (loss) 1,273,423$ (2,084,178)$ Underwriting fees charged to equity in thefinancial statements of associate - (330,047)Adjusted comprehensive income (loss) 1,273,423 (2,414,225)
Share of income (loss) of an associate, net of tax (42.42%) 399,853$ (818,872)$
Share of other comprehensive income (loss) of an associate, net of tax (42.42%) 140,388$ (205,242)$
Change in Investment in an Associate
Investment in an associate - December 31, 2015 18,267,378$ Increase in net assets of associatefor the year ended December 31, 2016 547,664 Unrealized foreign exchange losson opening balance (545,117) Investment in an associate - December 31, 2016 18,269,925$
8. Share capital
a) Authorized
The authorized share capital of the Company consists of an unlimited number of common shares and an unlimited number of Class A, Class B and Class C preference shares, issuable in series without nominal or par value.
b) Issued and outstanding
Number Amount Common shares
Balance December 31, 2015 and December 31, 2016 5,304,007 $ 15,273,044

Crosswinds Holdings Inc. Notes to the Consolidated Financial Statements For the years ended December 31, 2016 and 2015 (Expressed in Canadian dollars except per share amounts or unless otherwise stated)
FS 19
c) Weighted average basic and diluted number of common shares outstanding
For the years ended
December 31
2016 2015
Basic weighted average number of shares 5,304,007 5,304,007
Effect of dilutive deferred share units - -
Diluted weighted average number of shares 5,304,007 5,304,007
Diluted weighted average number of common shares for the year ended December 31, 2016 excludes 271,444 (2015 – 130,000) deferred share units that were anti-dilutive.
d) Deferred share units
Under the Company’s Deferred Share Unit Plan, units vested as set out in the chart below:
Number vested RemainingGrant Date in 2016 Price per DSU number to vest
April 15,2015 130,000 5.99$ Nil
November 17,2016 11,444 2.81$ 22,888
For the year ended December 31, 2016 the Company recorded a share-based payments expense of $343,552 (2015 - $1,272,804).
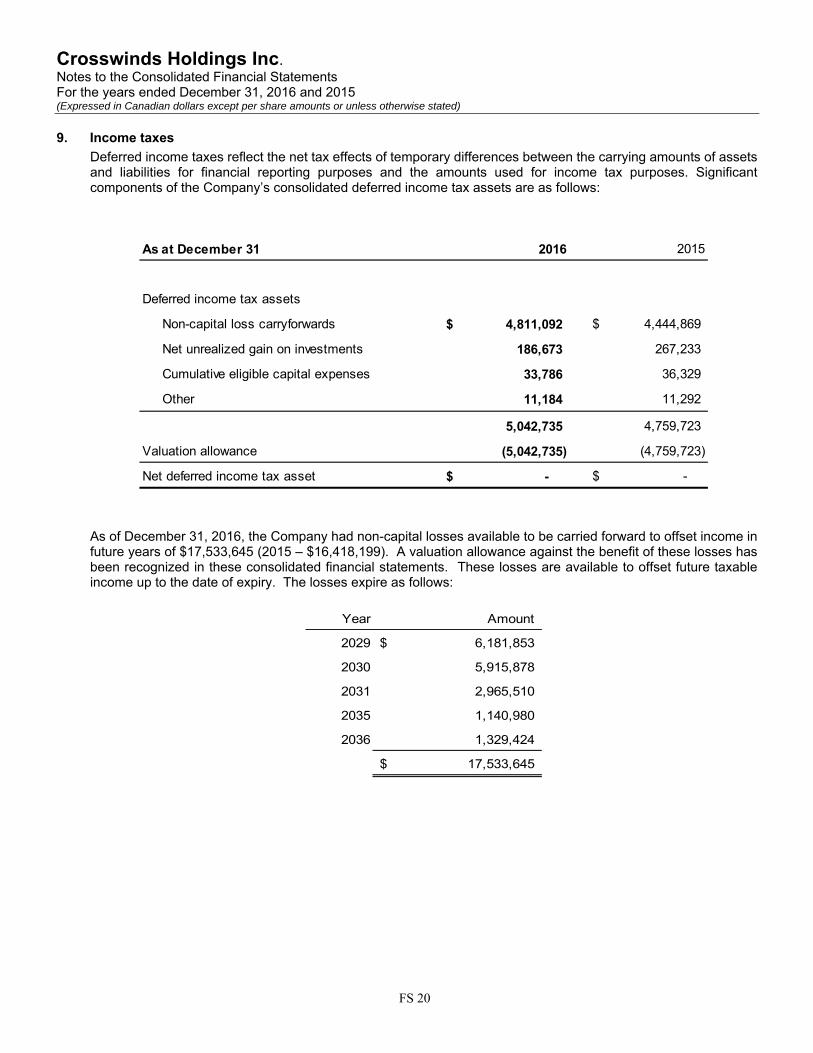
Crosswinds Holdings Inc. Notes to the Consolidated Financial Statements For the years ended December 31, 2016 and 2015 (Expressed in Canadian dollars except per share amounts or unless otherwise stated)
FS 20
9. Income taxes
Deferred income taxes reflect the net tax effects of temporary differences between the carrying amounts of assetsand liabilities for financial reporting purposes and the amounts used for income tax purposes. Significantcomponents of the Company’s consolidated deferred income tax assets are as follows:
As at December 31 2016 2015
Deferred income tax assets
Non-capital loss carryforwards 4,811,092$ 4,444,869$
Net unrealized gain on investments 186,673 267,233
Cumulative eligible capital expenses 33,786 36,329
Other 11,184 11,292
5,042,735 4,759,723
Valuation allowance (5,042,735) (4,759,723)
Net deferred income tax asset -$ -$
As of December 31, 2016, the Company had non-capital losses available to be carried forward to offset income in future years of $17,533,645 (2015 – $16,418,199). A valuation allowance against the benefit of these losses has been recognized in these consolidated financial statements. These losses are available to offset future taxable income up to the date of expiry. The losses expire as follows:
Year Amount
2029 6,181,853$
2030 5,915,878
2031 2,965,510
2035 1,140,980
2036 1,329,424
17,533,645$
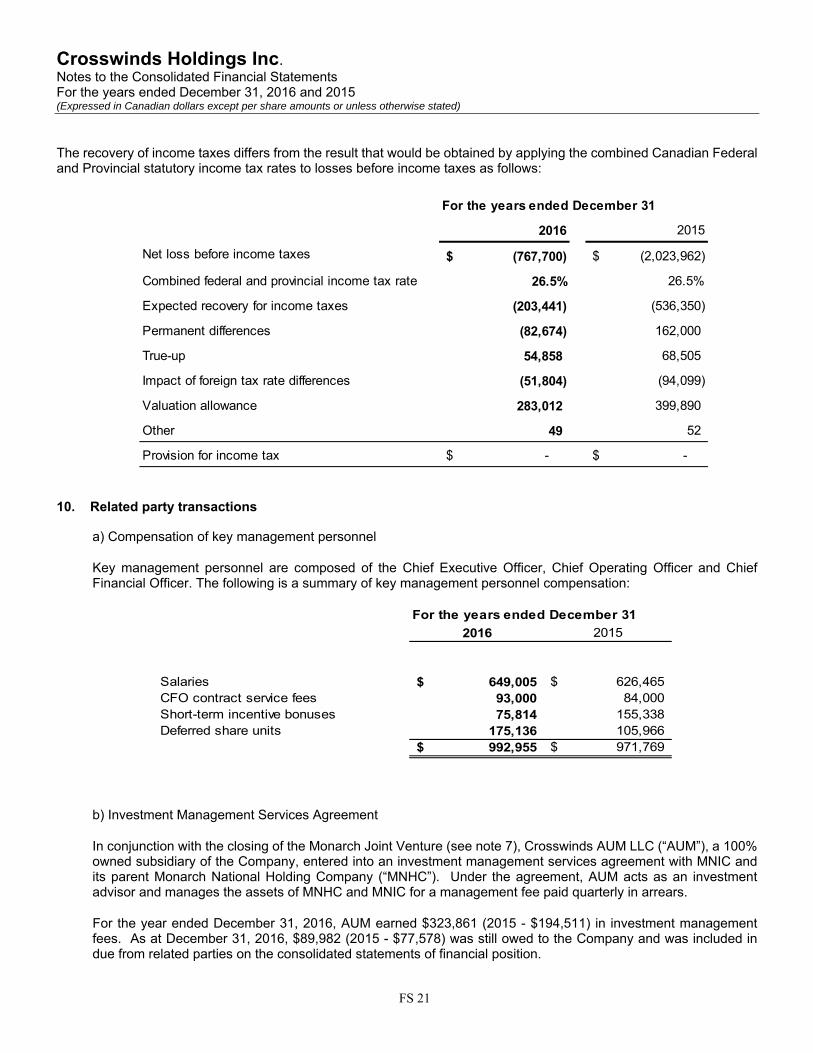
Crosswinds Holdings Inc. Notes to the Consolidated Financial Statements For the years ended December 31, 2016 and 2015 (Expressed in Canadian dollars except per share amounts or unless otherwise stated)
FS 21
The recovery of income taxes differs from the result that would be obtained by applying the combined Canadian Federal and Provincial statutory income tax rates to losses before income taxes as follows:
For the years ended December 31
2016 2015
Net loss before income taxes (767,700)$ (2,023,962)$
Combined federal and provincial income tax rate 26.5% 26.5%
Expected recovery for income taxes (203,441) (536,350)
Permanent differences (82,674) 162,000
True-up 54,858 68,505
Impact of foreign tax rate differences (51,804) (94,099)
Valuation allowance 283,012 399,890
Other 49 52
Provision for income tax -$ -$
10. Related party transactions
a) Compensation of key management personnel
Key management personnel are composed of the Chief Executive Officer, Chief Operating Officer and Chief Financial Officer. The following is a summary of key management personnel compensation:
For the years ended December 31
2016 2015
Salaries 649,005$ 626,465$ CFO contract service fees 93,000 84,000 Short-term incentive bonuses 75,814 155,338 Deferred share units 175,136 105,966
992,955$ 971,769$
b) Investment Management Services Agreement
In conjunction with the closing of the Monarch Joint Venture (see note 7), Crosswinds AUM LLC (“AUM”), a 100% owned subsidiary of the Company, entered into an investment management services agreement with MNIC and its parent Monarch National Holding Company (“MNHC”). Under the agreement, AUM acts as an investment advisor and manages the assets of MNHC and MNIC for a management fee paid quarterly in arrears.
For the year ended December 31, 2016, AUM earned $323,861 (2015 - $194,511) in investment management fees. As at December 31, 2016, $89,982 (2015 - $77,578) was still owed to the Company and was included in due from related parties on the consolidated statements of financial position.
Crosswinds Holdings Inc. Notes to the Consolidated Financial Statements For the years ended December 31, 2016 and 2015 (Expressed in Canadian dollars except per share amounts or unless otherwise stated)
FS 22
11. Financial risk management
The Company is exposed to a number of risks due to the nature of its activities. These risks include market risk(including currency risk, interest rate risk and price risk), credit risk and liquidity risk.
The Company’s risk management policies are approved by the Board of Directors and seek to minimize thepotential adverse effects of these risks on the Company’s financial performance. The risk management process isan ongoing process of identification, measurement, monitoring and controlling risk.
a) Risk management structure
The Board of Directors is ultimately responsible for the overall risk management within the Company but has delegated the responsibility for identifying and controlling risks to management.
The Company uses different methods to measure and manage the various types of risk to which it is exposed; these methods are explained below.
b) Risk mitigation
The Company does not use derivatives and other instruments for trading purposes or for risk management; however, the Company does hold investments in warrants which are considered a derivative instrument.
c) Excessive risk concentration
A concentration of risk exists where: (i) positions in financial instruments are affected by changes in the same risk factor or group of correlated factors; and (ii) the exposure could, in the event of large but plausible adverse developments, result in significant losses.
Concentrations of liquidity risk may arise from the repayment terms of financial liabilities, sources of borrowing facilities or reliance on a particular market to realize liquid assets. Concentrations of foreign exchange risk may arise if the Company has a significant net open position in a single foreign currency, or aggregate net open positions in several currencies that tend to move together. Concentrations of counterparty risk may arise when a number of financial instruments or contracts are contracted with the same counterparty, or where a number of counterparties are engaged in similar business activities, or activities in the same geographic region, or have similar economic features that would cause their ability to meet contractual obligations to be similarly affected by changes in economic, political or other conditions.
The Company has a concentration of foreign exchange risk due to its large holding in a U.S. dollar denominated investment - (see 11(g) below).
To manage the concentration of risk, the Company reviews its investment policies and risk management procedures regularly.
d) Liquidity Risk
Liquidity risk is the risk that the Company may not be able to generate sufficient cash resources to settle its obligations in full as they fall due or can only do so on terms that are materially disadvantageous.
The Company has made investments in private entities, including Monarch Delaware, which do not typically have an active market. Private investment transactions can be highly structured and the Company takes measures, where possible, to create defined liquidity events and, as part of its strategy, the Company has sought to create or accelerate such liquidity events. However, such liquidity events are rarely expected in the first two or three years of making an investment and may not be realized as expected. The Company seeks to obtain regular cash flow from these investments through interest payments and/or management fees.
All of the Company’s accounts payable and accrued liabilities are due within one year.
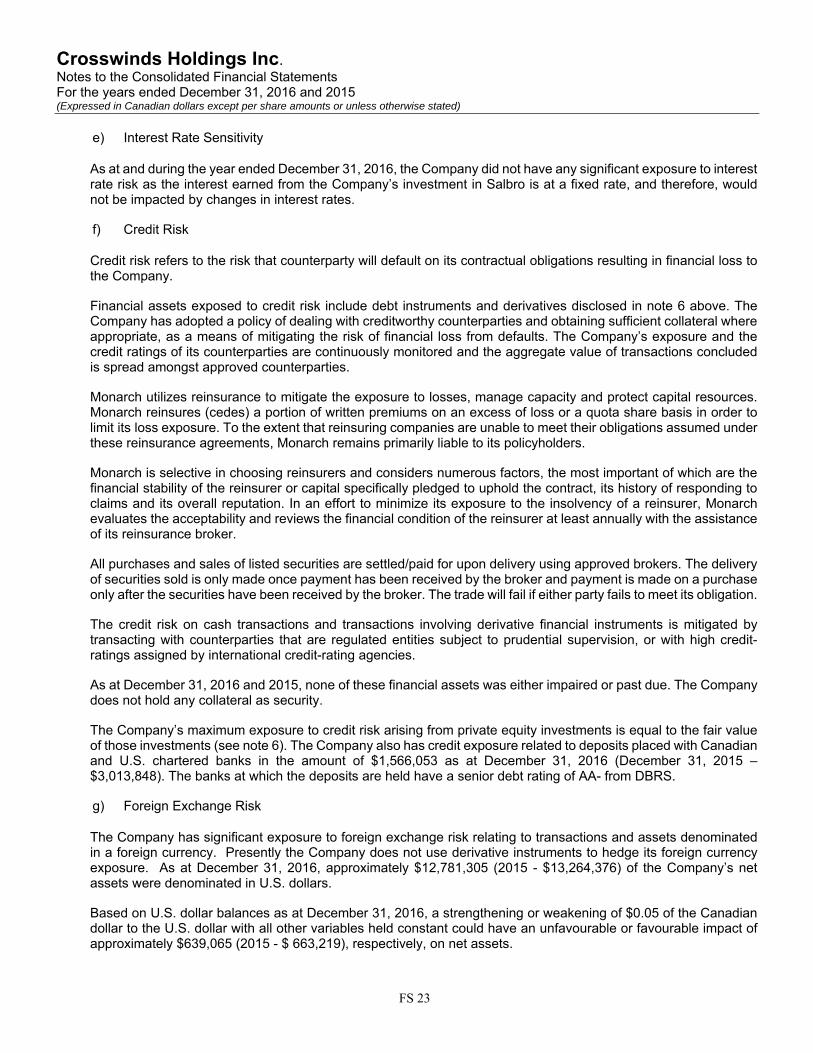
Crosswinds Holdings Inc. Notes to the Consolidated Financial Statements For the years ended December 31, 2016 and 2015 (Expressed in Canadian dollars except per share amounts or unless otherwise stated)
FS 23
e) Interest Rate Sensitivity
As at and during the year ended December 31, 2016, the Company did not have any significant exposure to interest rate risk as the interest earned from the Company’s investment in Salbro is at a fixed rate, and therefore, would not be impacted by changes in interest rates.
f) Credit Risk
Credit risk refers to the risk that counterparty will default on its contractual obligations resulting in financial loss to the Company.
Financial assets exposed to credit risk include debt instruments and derivatives disclosed in note 6 above. The Company has adopted a policy of dealing with creditworthy counterparties and obtaining sufficient collateral where appropriate, as a means of mitigating the risk of financial loss from defaults. The Company’s exposure and the credit ratings of its counterparties are continuously monitored and the aggregate value of transactions concluded is spread amongst approved counterparties.
Monarch utilizes reinsurance to mitigate the exposure to losses, manage capacity and protect capital resources. Monarch reinsures (cedes) a portion of written premiums on an excess of loss or a quota share basis in order to limit its loss exposure. To the extent that reinsuring companies are unable to meet their obligations assumed under these reinsurance agreements, Monarch remains primarily liable to its policyholders.
Monarch is selective in choosing reinsurers and considers numerous factors, the most important of which are the financial stability of the reinsurer or capital specifically pledged to uphold the contract, its history of responding to claims and its overall reputation. In an effort to minimize its exposure to the insolvency of a reinsurer, Monarch evaluates the acceptability and reviews the financial condition of the reinsurer at least annually with the assistance of its reinsurance broker.
All purchases and sales of listed securities are settled/paid for upon delivery using approved brokers. The delivery of securities sold is only made once payment has been received by the broker and payment is made on a purchase only after the securities have been received by the broker. The trade will fail if either party fails to meet its obligation.
The credit risk on cash transactions and transactions involving derivative financial instruments is mitigated by transacting with counterparties that are regulated entities subject to prudential supervision, or with high credit-ratings assigned by international credit-rating agencies.
As at December 31, 2016 and 2015, none of these financial assets was either impaired or past due. The Company does not hold any collateral as security.
The Company’s maximum exposure to credit risk arising from private equity investments is equal to the fair value of those investments (see note 6). The Company also has credit exposure related to deposits placed with Canadian and U.S. chartered banks in the amount of $1,566,053 as at December 31, 2016 (December 31, 2015 – $3,013,848). The banks at which the deposits are held have a senior debt rating of AA- from DBRS.
g) Foreign Exchange Risk
The Company has significant exposure to foreign exchange risk relating to transactions and assets denominated in a foreign currency. Presently the Company does not use derivative instruments to hedge its foreign currency exposure. As at December 31, 2016, approximately $12,781,305 (2015 - $13,264,376) of the Company’s net assets were denominated in U.S. dollars.
Based on U.S. dollar balances as at December 31, 2016, a strengthening or weakening of $0.05 of the Canadian dollar to the U.S. dollar with all other variables held constant could have an unfavourable or favourable impact of approximately $639,065 (2015 - $ 663,219), respectively, on net assets.
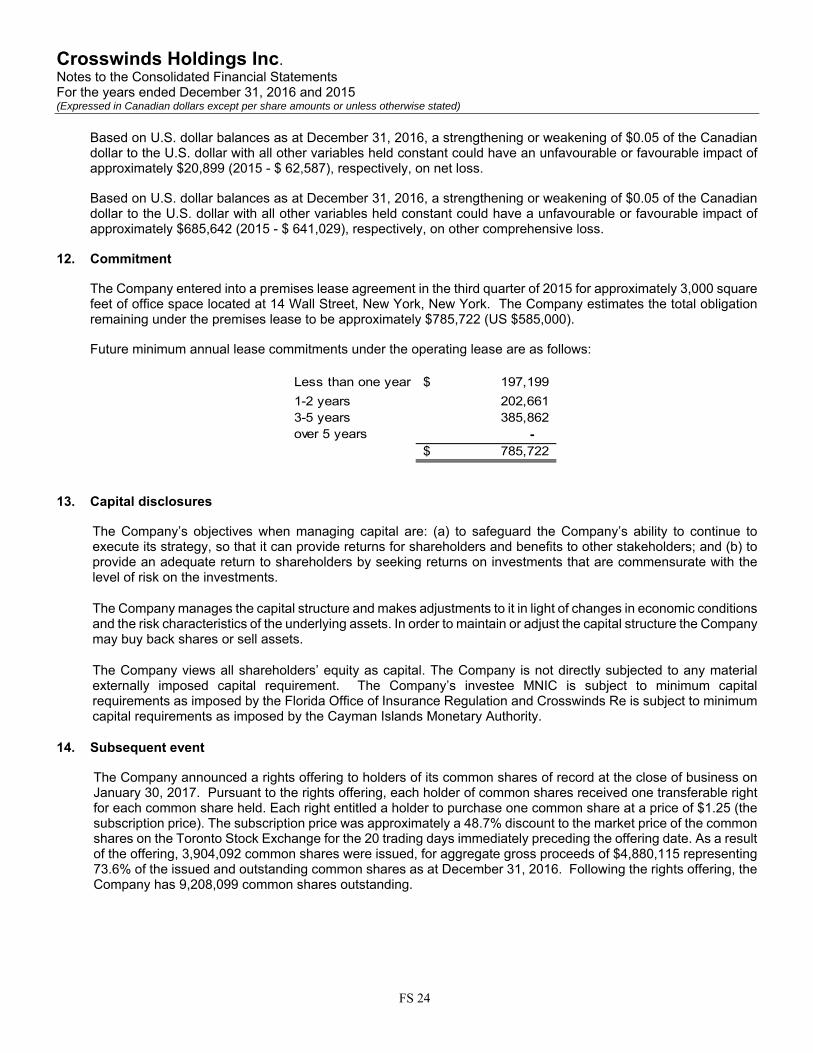
Crosswinds Holdings Inc. Notes to the Consolidated Financial Statements For the years ended December 31, 2016 and 2015 (Expressed in Canadian dollars except per share amounts or unless otherwise stated)
FS 24
Based on U.S. dollar balances as at December 31, 2016, a strengthening or weakening of $0.05 of the Canadian dollar to the U.S. dollar with all other variables held constant could have an unfavourable or favourable impact of approximately $20,899 (2015 - $ 62,587), respectively, on net loss.
Based on U.S. dollar balances as at December 31, 2016, a strengthening or weakening of $0.05 of the Canadian dollar to the U.S. dollar with all other variables held constant could have a unfavourable or favourable impact of approximately $685,642 (2015 - $ 641,029), respectively, on other comprehensive loss.
12. Commitment
The Company entered into a premises lease agreement in the third quarter of 2015 for approximately 3,000 squarefeet of office space located at 14 Wall Street, New York, New York. The Company estimates the total obligationremaining under the premises lease to be approximately $785,722 (US $585,000).
Future minimum annual lease commitments under the operating lease are as follows:
Less than one year 197,199$
1-2 years 202,661 3-5 years 385,862 over 5 years -
785,722$
13. Capital disclosures
The Company’s objectives when managing capital are: (a) to safeguard the Company’s ability to continue toexecute its strategy, so that it can provide returns for shareholders and benefits to other stakeholders; and (b) toprovide an adequate return to shareholders by seeking returns on investments that are commensurate with thelevel of risk on the investments.
The Company manages the capital structure and makes adjustments to it in light of changes in economic conditionsand the risk characteristics of the underlying assets. In order to maintain or adjust the capital structure the Companymay buy back shares or sell assets.
The Company views all shareholders’ equity as capital. The Company is not directly subjected to any materialexternally imposed capital requirement. The Company’s investee MNIC is subject to minimum capitalrequirements as imposed by the Florida Office of Insurance Regulation and Crosswinds Re is subject to minimumcapital requirements as imposed by the Cayman Islands Monetary Authority.
14. Subsequent event
The Company announced a rights offering to holders of its common shares of record at the close of business onJanuary 30, 2017. Pursuant to the rights offering, each holder of common shares received one transferable rightfor each common share held. Each right entitled a holder to purchase one common share at a price of $1.25 (thesubscription price). The subscription price was approximately a 48.7% discount to the market price of the commonshares on the Toronto Stock Exchange for the 20 trading days immediately preceding the offering date. As a resultof the offering, 3,904,092 common shares were issued, for aggregate gross proceeds of $4,880,115 representing73.6% of the issued and outstanding common shares as at December 31, 2016. Following the rights offering, theCompany has 9,208,099 common shares outstanding.
36
Board of Directors: J. Roy Pottle2 ChairmanBradd Gold3,6
Gaetano Muzio4,5
Robert Wolf1,4
Mark Gardhouse4
Thomas Cholnoky2,6
Colin KingOfficers: Colin King, Chief Executive Officer Susan McCormick, Interim Chief Financial Officer Helen Martin, Chief Operating Officer and Corporate Secretary
1Audit Committee Chairman 2 Audit Committee Member 3 Corporate Governance, Compensation and Nominating Committee Chairman 4 Corporate Governance, Compensation and Nominating Committee Member 5Risk Policy Committee Chairman 6Risk Policy Committee Member
Auditor: Deloitte LLP, Toronto, Ontario Transfer Agent: Computershare Investor Services Inc., Toronto, Ontario
Toronto 365 Bay St. Suite 400 Toronto, Ontario, M5H 2V1 Canada
New York 14 Wall Street Suite 5D New York, NY, 10004 United States
Phone: 800.439.5136 Phone: 212.521.1108 Web: crosswindsinc.com Email: [email protected]