ANNUAL REPORT 2016/17 - Virk
52
ANNUAL REPORT 2016/17 Turbinevej 10, 5500 Middelfart, Denmark · Telephone +45 88 61 88 61 · www.uni-tankers.com · Company reg. no. 12 56 07 96 Financial year: 1 May 2016 – 30 April 2017 The Annual Report was presented and adopted at the Company’s Annual General Meeting on 3 July 2017 Chairman of the meeting Michael Keldsen
Transcript of ANNUAL REPORT 2016/17 - Virk
ANNUAL REPORT 2016/17
Turbinevej 10, 5500 Middelfart, Denmark · Telephone +45 88 61 88 61 · www.uni-tankers.com · Company reg. no. 12 56 07 96
Financial year: 1 May 2016 – 30 April 2017
The Annual Report was presented and adopted at the Company’s Annual General Meeting on 3 July 2017
Chairman of the meeting Michael Keldsen

2016/17 IN BRIEF
FLEET OF 42 VESSELS AT YEAR-END TOTALLING 343,257 DWT
76 SHOREBASED EMPLOYEES AT YEAR-END
LOSS OFUSD 9 MILLION
REVENUE OFUSD 231.4 MILLION
SOLVENCY OF 32% AT YEAR-END
514 SEAFARERS
UNI-TANKERS A/S
2ANNUAL REPORT
2016/17 IN BRIEF

CONTENTS
Key fi gures and fi nancial ratios 4
Executive management 6
Management review 7
Highlights in 2016/17 7
Outlook for 2017/18 9
Risk management 10
Statutory statement on corporate social responsibility 11
Statutory statement regarding the under-represented gender 11
Board of Directors 12
Financials 16
Financial review 16
Cash fl ow and fi nancial resources 17
Income statement 1 May – 30 April 19
Balance sheet at 30 April 20
Statement of changes in equity 23
Cash fl ow statement 1 May – 30 April 24
Notes to the fi nancial statements 27
Accounting policies and defi nitions 37
Signatures 45
Management’s statement 45
Independent auditor’s report 46
Group Chart 49
Company information 50
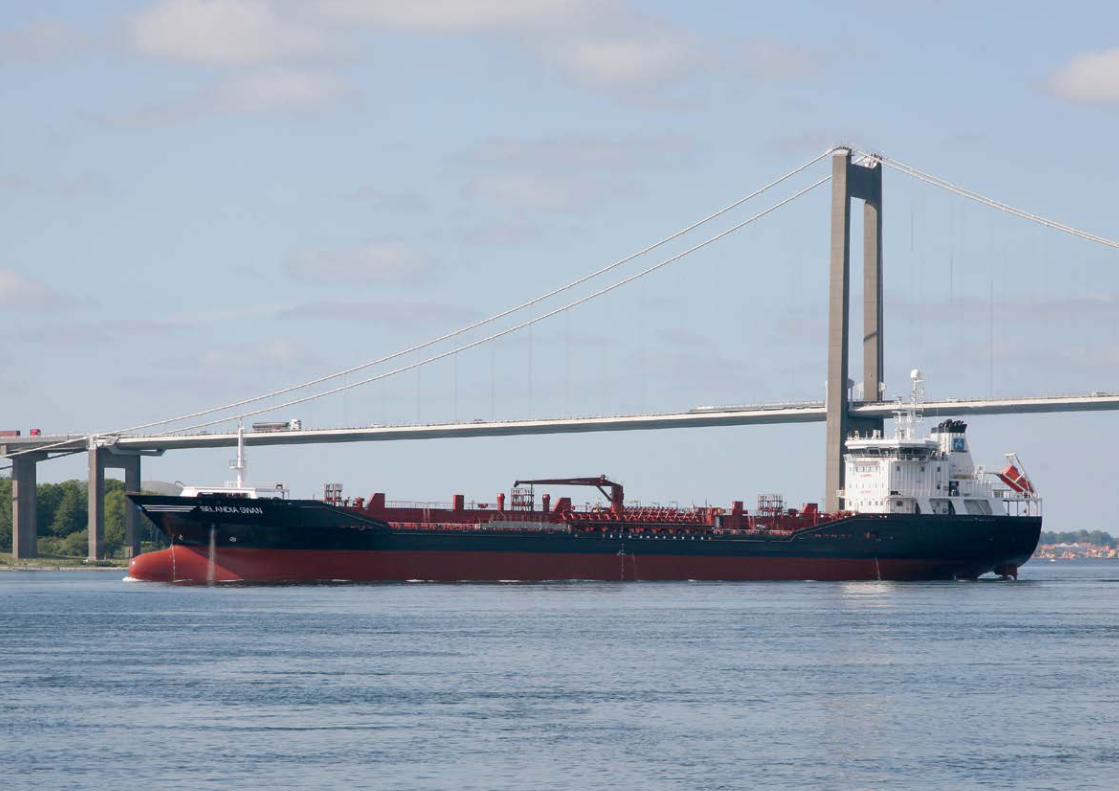
Uni-Tankers is a tanker shipping company trading worldwide in the intermediate and small tanker segment, carrying all kinds of liquid cargo – from refined oil products over fertilisers, vegetable oils and chemicals. The parent company, Uni-Tankers A/S, was established in 1995 and has since then with pride served the oil majors and other global customers.
Headquarters is domiciled in Middelfart, Denmark, and commercial activities are carried out under the Uni-Chartering brand, having local offices in Aalborg (Denmark), Nice (France), Istanbul (Turkey) and Houston (USA).
Uni-Tankers is controlled by the Middelfart based shipping conglomerate A/S United Shipping & Trading Company.
3ANNUAL REPORT
CONTENTS

KEY FIGURES AND FINANCIAL RATIOS
252
184
142.8
231
0
50
100
150
200
250
16/1712/13 15/1614/1513/14
Revenue
US
Dm
212.8
0
10
20
30
40
50
13/1412/13 16/1715/1614/15
Fleet of owned and time chartered vessels
Vess
els
27
35
42
50
42
32
5.3
9.27.6
33.5
16/1712/13 15/1614/1513/14
Solvency ratio %
Per
cent
0
10%
20%
30%
40%
76
Shorebased employeesGender split at year-end 2016/17
32% Female
68% Male
13.4
5.6
9.3
11.7
23.1
16/1712/13 15/1614/1513/140
5
10
15
20
25
Cash flow from operating activities
US
Dm
Shorebased employees
0
20
40
60
80
100
13/1412/13 16/17 15/1614/15
Em
ploy
ees
5360
70
8176
4ANNUAL REPORT
KEY FIGURES AND FINANCIAL RATIOS

USD ‘000 2016/17 2015/16 2014/15 2013/14 2012/13
Key fi guresIncome statementRevenue 231,387 251,968 212,770 183,971 142,773 Profi t before fi nancial income and expenses (4,760) 16,205 1,769 6,331 (38,376)Net fi nancials (5,544) (5,726) (7,387) (5,719) 1,789 Profi t before tax (10,304) 10,479 (5,618) 612 (36,587)Net profi t for the year (8,981) 12,137 (4,512) 1,534 (37,357)
Balance sheetBalance sheet total 259,308 276,226 263,668 266,264 258,093 Equity 82,914 92,651 20,074 24,578 13,591
Cash fl owsCash fl ows from: - operating activities 13,424 23,108 11,688 9,329 5,558 - investing activities (12,517) (14,173) (11,116) (19,141) (89,905)
hereof investment in property, plant and equipment and intangible assets
(12,537) (14,191) (11,135) (33,072) (89,955)
- fi nancing activities (8,000) 949 (900) 4,978 78,773 Change in cash and cash equivalents for the year (7,093) 9,883 (328) (4,834) (5,574)
Employees 595 592 567 569 472
Financial ratiosGross margin 27.5% 33.3% 30.0% 37.3% 31.7%Profi t margin (2.1%) 6.4% 0.8% 3.4% (26.9%)Return on equity (10.2%) 21.5% (20.2%) 8.0% (129.5%)Liquidity ratio 1.56 1.88 1.08 1.41 1.70Solvency ratio 32.0% 33.5% 7.6% 9.2% 5.3%
For defi nitions, see under accounting policies (page 43)
5ANNUAL REPORT
KEY FIGURES AND FINANCIAL RATIOS
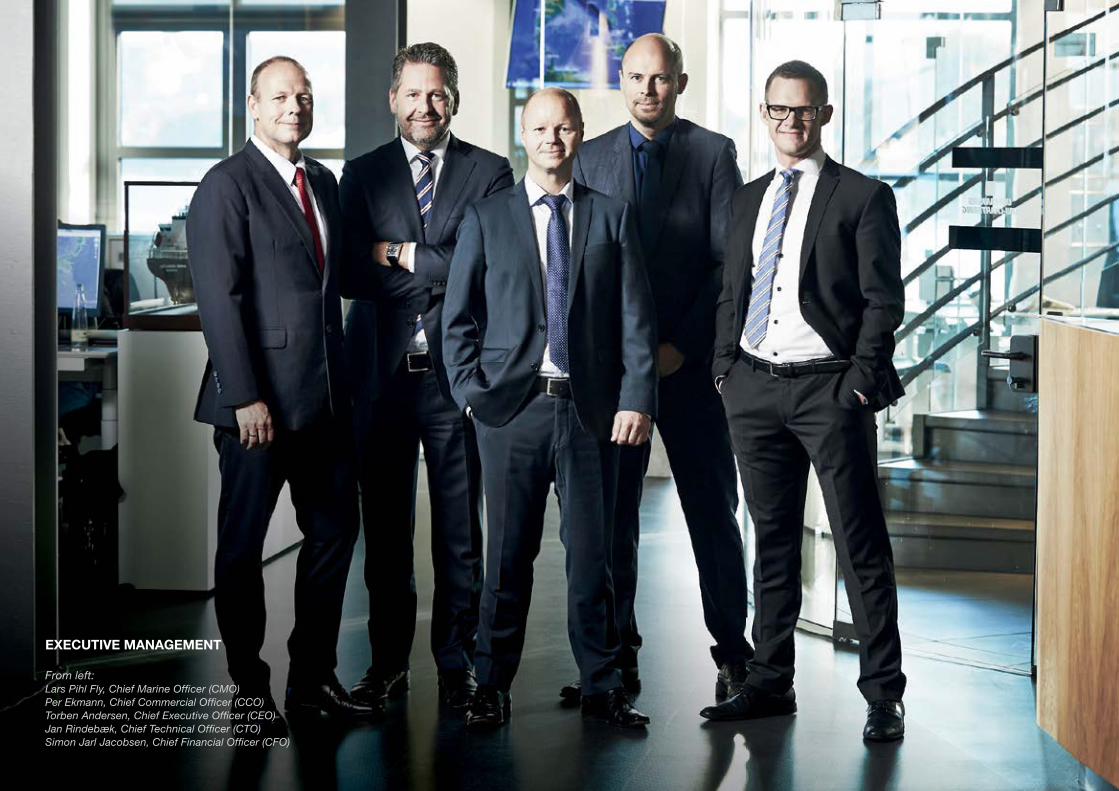
EXECUTIVE MANAGEMENT
From left: Lars Pihl Fly, Chief Marine Offi cer (CMO)Per Ekmann, Chief Commercial Offi cer (CCO) Torben Andersen, Chief Executive Offi cer (CEO)Jan Rindebæk, Chief Technical Offi cer (CTO)Simon Jarl Jacobsen, Chief Financial Offi cer (CFO)

HIGHLIGHTS IN 2016/17
After good activity and a decent result last year, the Group has seen strongly declining markets in 2016/17. The first few months continued with decent results, but since then it has been difficult to trade the vessels at profit making levels. Revenue declined approx. 8 percent and the net result for the year is a loss of USD 9 million. This result is disappoint-ing, and below the expectations prior to the beginning of the year.
There remains to be overcapacity of tonnage in our seg-ments, and especially in the larger segments, from which we have experienced higher competition than usual. Combined with political and geopolitical uncertainties, and a volatile oil price, this has put severe pressure on freight rates in all our core geographical markets. Though we have seen a slight
increase in the number of idle ships in the ports we call over the world, activity has been rather firm – both in the spot market, and on contract activity, which has increased over the year.
The declining freight rates have caused lower Time Charter Equivalent (TCE) earnings than last year. As an attempt to partly offset this negative effect, an extensive cost cutting program has been high on the agenda for 2016/17. The cost cutting program both covers overheads and operation of
the vessels, though it has been crucial to all initiatives that no savings would jeopardise the strict focus on safety and quality of our fleet. Nevertheless, the program has indicated extensive saving potentials, which for the main part, how-ever, will not have effect until the financial year 2017/18.
Our activity measured in ship days has increased by 5.9 percent up to 15,720 ship days in 2016/17. During the last months of the financial year, however, the TC fleet has been restructured to adapt to the current market conditions by replacing non-profitable vessels with smaller vessels that better match the core fleet profile. Thus, at the end of the financial year, the fleet counts 42 vessels (50 vessels) – 17 owned and 25 time chartered vessels. The 42 vessels have a total capacity of 343,257 DWT (451,168 DWT), and the average age is 8.71 years (7.85 years), placing our fleet among the youngest in our core markets.
As a consequence of the net decrease in our fleet, and of the cost cutting programs, we have adapted the organisa-tion to match the current situation, and decreased head-count of FTEs on shore from 81 at the beginning of the year to 76 by 30 April 2017.
During the financial year, the Group introduced a new stra-tegy, which will be the guidance for the years to come. With the new strategy, five must-win battles and several strate-gic projects supporting these must-win battles have been introduced, and the new strategy has brought all vessels, offices, and departments closer together, clearly working as one unit and towards the same goal: to become the no. 1 oil and chemical tanker operator in our core markets.
We believe that size is of high importance in our business area. Though we foresee that the main growth will be organic and via increase of our chartered fleet, we will openly evalu- ate every possibility to take active part in the prospected consolidation that is generally expected among shipowners
MANAGEMENT REVIEW
We believe that size is of high importance in our business area. Though we foresee that the main growth will be
organic and via increase of our chartered fleet, we will openly evaluate every possibility to take active part in the prospected consolidation that is generally expected among
shipowners and other participants in our core markets.
7ANNUAL REPORT
MANAGEMENT REVIEW
and other participants in our core markets. While growth is high on the agenda, basics of the strategy are: » Focus on core » Closer to customers » Operational excellence.
Focus on core is both a matter of focusing on the right vessels, and the core geographical markets. This strategic focus has lead us to a restructuring of our time chartered fl eet during the second half of the fi nancial year, and the fl eet is now balanced according to our strategy, and to best fi t our customers’ needs.
Closer to customers is another strategic focus area for the Group to be able to meet and exceed our customers’ needs today and tomorrow – and always be one step ahead. Sev-eral initiatives have been taken during the year to support this strategic focus. Among others, we have successfully
carried out road shows to meet with our customers both from a commercial and a vetting point of view – and we have opened temporary “pop-up offi ces” in main shipping hubs around the world, to be close to our customers even where
we do not currently have permanent offi ces. These initiatives have contributed to improving our commercial performance, substantiated in new time charters of two of our own ves-sels to oil majors. Besides, it has increased contract cov-erage both in terms of quantities and number of contracts and counterparts.
We are proud that our customers know us for our constant striving against top performance when it comes to safety, security, and reliability. Despite cost cuttings, we never compromise on quality or safety, and we will continue to be top-performing in order to meet up to the strictest demands of our primary customers, the major oil- and chemical com-panies.
Operational excellence is all about having our 590 dedicated employees on shore and on board our fl eet of currently 42 vessels work as effi cient as possible, always supported by
optimal procedures and processes. Another key to opera-tional excellence is effi cient use of IT systems. We have taken full advantage of the voyage management system that we implemented last year (IMOS), and we have put a lot of
Closer to customers is another strategic focus area for the Group to be able to meet and exceed our customers’ needs
today and tomorrow – and always be one step ahead.
8ANNUAL REPORT
MANAGEMENT REVIEW

effort into optimising the processes and integration between business-critical applications and thus improved effi ciency signifi cantly. During the year, we have also implemented a new Data warehouse and Business Intelligence system, enabling us to faster and more data-driven decision making. This work will continue through the coming year, after which the Company is expected to be best-in-class when it comes to intelligent IT-solutions.
Success, however, does not come alone from trimmed pro-cedures and an effective IT-platform – it takes good people. Therefore, another high focus area of the new strategy is devel-opment and training of our motivated and dedicated staff of employees. We pay great attention to being able to attract and retain the best employees – ashore as well as at sea. Among many other things, we participate in the worldwide “Great Place to Work” assessment program, in which we are proud to have been certifi ed among Denmark’s top companies within the ca tegory 50-499 employees. In this relation, we have taken many steps to creating world-class working conditions for our 76 shore based employees, and will continuously strive to main-tain the position as one of Denmark’s greatest places to work –
with same conditions for our foreign offi ces. We also value our approx. 500 seafarers, and our dedicated Crewing department has put a lot of efforts into arranging offi cer’s seminars for both our Senior Offi cers and Junior Offi cers. Moreover, we ensure that the vessels’ conditions for seafarers are always high stan-dard with regards to accommodation, food, internet access etc. Together with other Nordic shipowners we take part in running a Crewing Academy in the Philippines, and we also
take pride in having our own cadet program for Danish seafarers currently counting 8 cadets – taking our part of the responsibility that Denmark also in the future will be a proud shipping nation.
OUTLOOK FOR 2017/18
As a worldwide operator, the Group’s results are highly affected by the general development in the global economy, and the outlook for global economy and world trade remains to be volatile and uncertain. The imbalance between demand and supply due to overcapacity of vessels in the Group’s segments
As a worldwide operator, the Group’s results are highly affected by the general development in the global economy, and the outlook for global economy and world trade remains
to be volatile and uncertain.
9ANNUAL REPORT
MANAGEMENT REVIEW
further continue to bring a high degree of uncertainty to the expected forward-looking development – although in our core markets the imbalance seems to be decreasing, as only very few newbuilding orders are being placed with the yards. Also, the fl uctuations of oil price and the EUR/USD development may continue to have high impact on the expected results.
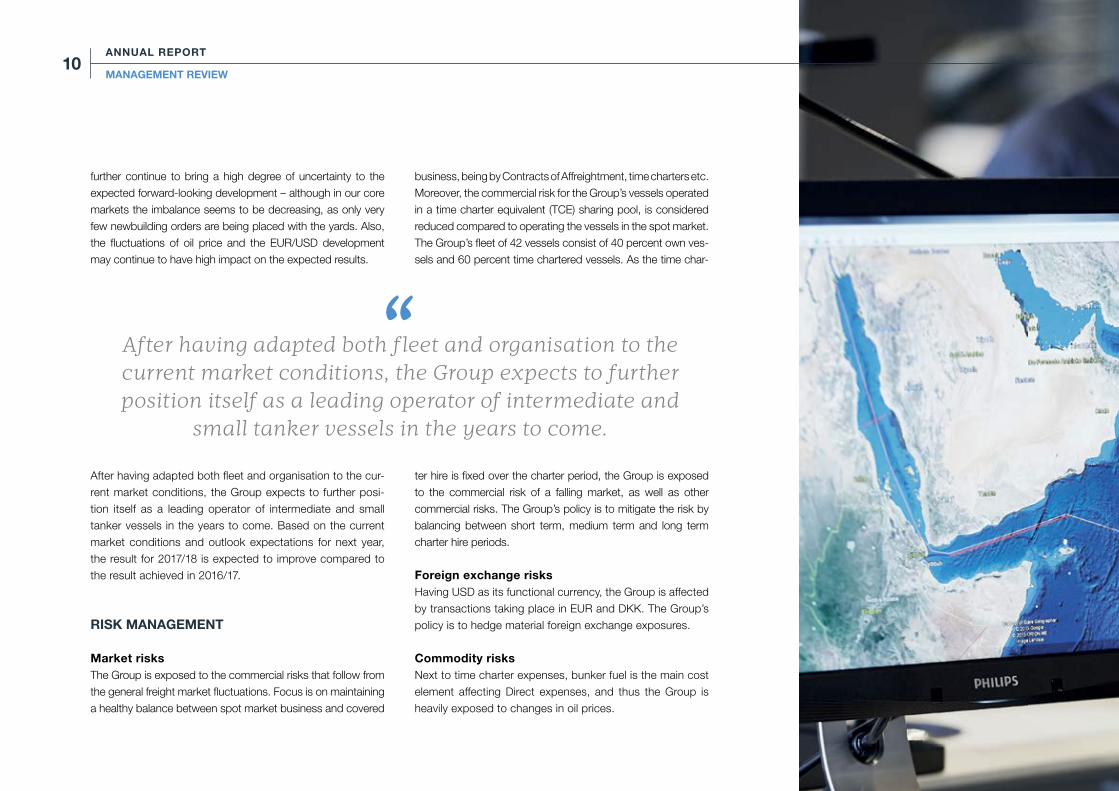
After having adapted both fl eet and organisation to the cur-rent market conditions, the Group expects to further posi-tion itself as a leading operator of intermediate and small tanker vessels in the years to come. Based on the current market conditions and outlook expectations for next year, the result for 2017/18 is expected to improve compared to the result achieved in 2016/17.
RISK MANAGEMENT
Market risksThe Group is exposed to the commercial risks that follow from the general freight market fl uctuations. Focus is on maintaining a healthy balance between spot market business and covered
business, being by Contracts of Affreightment, time charters etc. Moreover, the commercial risk for the Group’s vessels operated in a time charter equivalent (TCE) sharing pool, is considered reduced compared to operating the vessels in the spot market. The Group’s fl eet of 42 vessels consist of 40 percent own ves-sels and 60 percent time chartered vessels. As the time char-
ter hire is fi xed over the charter period, the Group is exposed to the commercial risk of a falling market, as well as other commercial risks. The Group’s policy is to mitigate the risk by balancing between short term, medium term and long term charter hire periods.
Foreign exchange risksHaving USD as its functional currency, the Group is affected by transactions taking place in EUR and DKK. The Group’s policy is to hedge material foreign exchange exposures.
Commodity risksNext to time charter expenses, bunker fuel is the main cost element affecting Direct expenses, and thus the Group is heavily exposed to changes in oil prices.
After having adapted both fleet and organisation to the current market conditions, the Group expects to further position itself as a leading operator of intermediate and
small tanker vessels in the years to come.
10ANNUAL REPORT
MANAGEMENT REVIEW
The Group targets to mitigate the risk by passing bunker price increases on to customers. In the spot market, the freight level is to the extent possible adjusted to refl ect the current bunker price level. When entering into Contracts of Affreightment with customers, the bunker price risk is either covered by including bunker price clauses indexing freight rates with current bunker price levels, or by hedging the exposure by use of fi nancial derivatives.
Counterparty riskThe Group is not exposed to any material risks relating to individual, large customers or business partners. The Group’s policy for assuming credit risks implies that all customers and business partners are subject to current credit rating.
It is the Group’s policy to require payment before or upon cargo release, while only customers with high credit rating and with whom the Group has a long lasting good relationship, are accepted to pay after cargo release. The Group has not suffered any material losses from defaulting customers in 2016/17.
STATUTORY STATEMENT ON CORPORATE SOCIAL RESPONSIBILITY IN ACCORDANCE WITH SECTION 99A OF THE DANISH FINANCIAL STATEMENTS ACT
The Group’s policies for corporate social responsibility are disclosed in the Financial Statements of the parent com-pany A/S United Shipping & Trading Company for 2016/17.
STATUTORY STATEMENT REGARDING THE UNDER-REPRESENTED GENDER IN ACCOR-DANCE WITH SECTION 99B OF THE DANISH FINANCIAL STATEMENTS ACT
Targets for the under-represented gender on the Board of DirectorsToday the percentage of female members of the board elected by the shareholder’s committee is 12.5%.Uni-Tankers A/S’s target for female members of the Board of Directors is 10-20% in 2018 and 35% in 2020, and as such the current level satisfi es the goal.
In an effort to maintain this position, Uni-Tankers A/S will ensure to have the under-represented gender on the list of candidates, however reserves the right to decide on the most qualifi ed candidate regardless of gender.
Policy for the under-represented gender at other management levelsThe policy of the Group is that the employees, irrespective of gender, must have equal career and management oppor-tunities, and that the Group will have an open-minded and unprejudiced culture in which the individual employee can make the best possible use of his or her skills irrespective of gender. The Group’s internal management training is open to anyone with the right skills, regardless of gender.
11ANNUAL REPORT
MANAGEMENT REVIEW
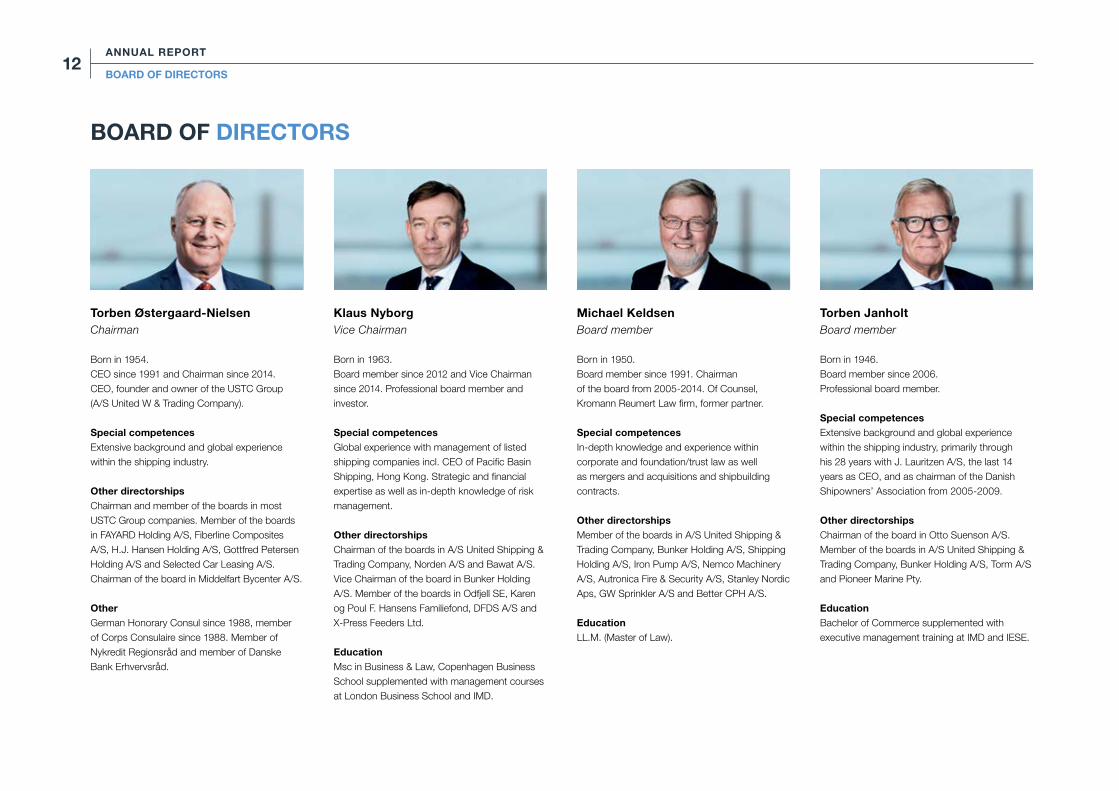
Torben Østergaard-NielsenChairman
Born in 1954.CEO since 1991 and Chairman since 2014. CEO, founder and owner of the USTC Group (A/S United W & Trading Company).
Special competencesExtensive background and global experience within the shipping industry.
Other directorshipsChairman and member of the boards in most USTC Group companies. Member of the boards in FAYARD Holding A/S, Fiberline Composites A/S, H.J. Hansen Holding A/S, Gottfred Petersen Holding A/S and Selected Car Leasing A/S. Chairman of the board in Middelfart Bycenter A/S.
OtherGerman Honorary Consul since 1988, member of Corps Consulaire since 1988. Member of Nykredit Regionsråd and member of Danske Bank Erhvervsråd.
Klaus NyborgVice Chairman
Born in 1963.Board member since 2012 and Vice Chairman since 2014. Professional board member and investor.
Special competencesGlobal experience with management of listed shipping companies incl. CEO of Pacific Basin Shipping, Hong Kong. Strategic and financial expertise as well as in-depth knowledge of risk management.
Other directorshipsChairman of the boards in A/S United Shipping & Trading Company, Norden A/S and Bawat A/S. Vice Chairman of the board in Bunker Holding A/S. Member of the boards in Odfjell SE, Karen og Poul F. Hansens Familiefond, DFDS A/S and X-Press Feeders Ltd.
EducationMsc in Business & Law, Copenhagen Business School supplemented with management courses at London Business School and IMD.
Michael KeldsenBoard member
Born in 1950.Board member since 1991. Chairman of the board from 2005-2014. Of Counsel, Kromann Reumert Law firm, former partner.
Special competencesIn-depth knowledge and experience within corporate and foundation/trust law as well as mergers and acquisitions and shipbuilding contracts.
Other directorshipsMember of the boards in A/S United Shipping & Trading Company, Bunker Holding A/S, Shipping Holding A/S, Iron Pump A/S, Nemco Machinery A/S, Autronica Fire & Security A/S, Stanley Nordic Aps, GW Sprinkler A/S and Better CPH A/S.
EducationLL.M. (Master of Law).
Torben JanholtBoard member
Born in 1946.Board member since 2006.Professional board member.
Special competencesExtensive background and global experience within the shipping industry, primarily through his 28 years with J. Lauritzen A/S, the last 14 years as CEO, and as chairman of the Danish Shipowners’ Association from 2005-2009.
Other directorshipsChairman of the board in Otto Suenson A/S. Member of the boards in A/S United Shipping & Trading Company, Bunker Holding A/S, Torm A/S and Pioneer Marine Pty.
EducationBachelor of Commerce supplemented with executive management training at IMD and IESE.
BOARD OF DIRECTORS
12ANNUAL REPORT
BOARD OF DIRECTORS

Peter FrederiksenBoard member
Born in 1963.Board member since 2012.Member of the Executive Board of Hamburg Süd (Sales & Marketing).
Special competencesExtensive experience within the shipping industry from leading global positions in liner shipping at A.P. Møller Mærsk for more than 25 years and Hamburg Süd for 9 years. Broad management and strategy skills as well as financial experience.
Other directorshipsChairman of the boards in Sund & Bælt Holding A/S, A/S Storebælt, A/S Øresund, Femern A/S and A/S Femern Landanlæg. Vice Chairman of Øresundsbro Konsortiet I/S. Member of the boards in A/S United Shipping & Trading Company and Bunker Holding A/S.
EducationShipping education at A.P. Møller Mærsk supplemented with management training at INSEAD and Cornell University.
Morten H. BuchgreitzBoard member
Born in 1967.Board member since 2014.Member of the Group Executive Management of DONG Energy A/S (Distribution and Customer Solutions).
Special competencesExtensive and in-depth knowledge and experience with economics and finance, including credit and risk management.
Other directorshipsChairman and member of the boards in several DONG Energy Group companies. Member of the boards in A/S United Shipping & Trading Company and Bunker Holding A/S.
EducationMSc in Business Administration and Computer Science.
Peter KorsholmBoard member
Born in 1971.Board member since 2014.Professional board member and investor.
Special competencesExtensive experience from private equity and developing international companies, as well as mergers & acquisitions, financing and management of financial risks.
Other directorshipsChairman of the boards in Lomax A/S, GDL Transport AB, DSVM Renovation A/S and Nymølle Stenindustrier A/S. Member of the boards in A/S United Shipping & Trading Company, Bunker Holding A/S, RebelPenguin ApS, DSV Miljø Holding A/S and certain subsidiaries. Bones Restauranter A/S and Dong Energy A/S.
Education
MBA from INSEAD, MSc from London School of
Economics. BA from University of Copenhagen.
Nina Østergaard BorrisBoard member
Born in 1983.Board member since 2014.Executive Assistant Bunker Holding A/S.
Special competencesCompany evaluations, mergers and acquisitions, financial due diligence business restructuring, reorganization, turnarounds.
EducationMaster degree in applied economics and finance (Cand.merc. AEF)
13ANNUAL REPORT
BOARD OF DIRECTORS


15ANNUAL REPORT
FINANCIAL REVIEW
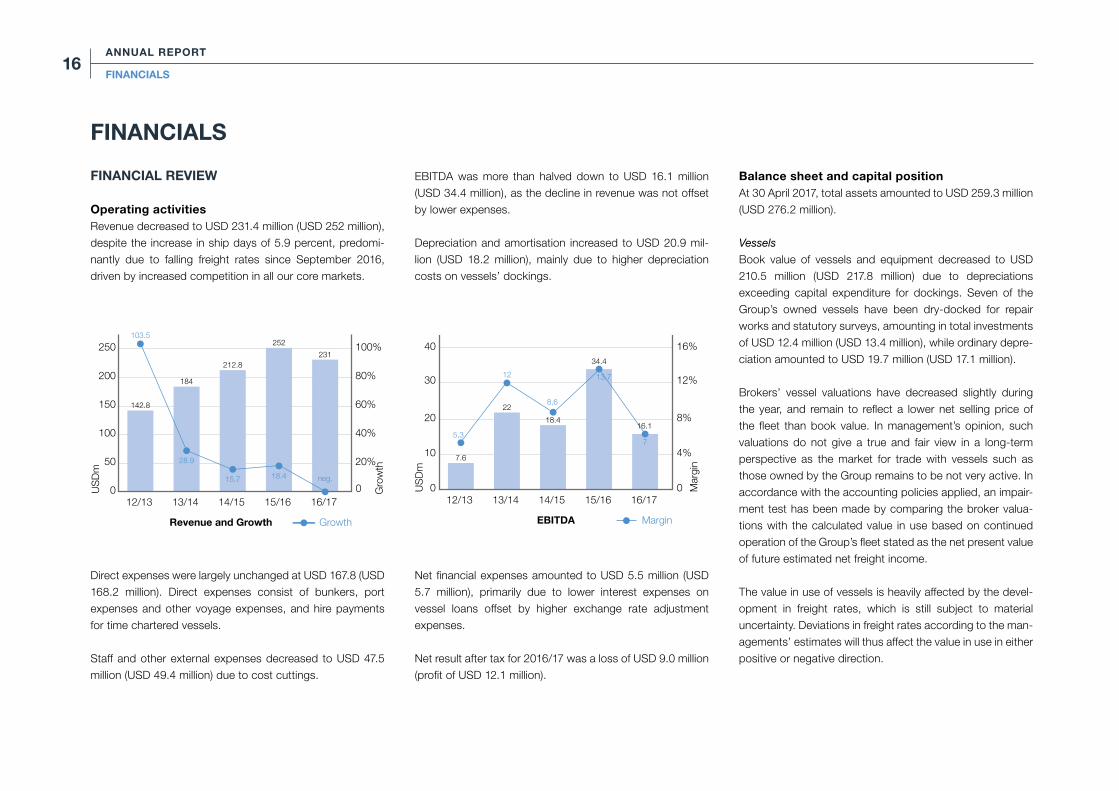
Operating activitiesRevenue decreased to USD 231.4 million (USD 252 million), despite the increase in ship days of 5.9 percent, predomi- nantly due to falling freight rates since September 2016, driven by increased competition in all our core markets.
Direct expenses were largely unchanged at USD 167.8 (USD 168.2 million). Direct expenses consist of bunkers, port expenses and other voyage expenses, and hire payments for time chartered vessels.
Staff and other external expenses decreased to USD 47.5 million (USD 49.4 million) due to cost cuttings.
EBITDA was more than halved down to USD 16.1 million (USD 34.4 million), as the decline in revenue was not offset by lower expenses.
Depreciation and amortisation increased to USD 20.9 mil-lion (USD 18.2 million), mainly due to higher depreciation costs on vessels’ dockings.
Net financial expenses amounted to USD 5.5 million (USD 5.7 million), primarily due to lower interest expenses on vessel loans offset by higher exchange rate adjustment expenses.
Net result after tax for 2016/17 was a loss of USD 9.0 million (profit of USD 12.1 million).
Balance sheet and capital positionAt 30 April 2017, total assets amounted to USD 259.3 million (USD 276.2 million).
Vessels
Book value of vessels and equipment decreased to USD 210.5 million (USD 217.8 million) due to depreciations exceeding capital expenditure for dockings. Seven of the Group’s owned vessels have been dry-docked for repair works and statutory surveys, amounting in total investments of USD 12.4 million (USD 13.4 million), while ordinary depre-ciation amounted to USD 19.7 million (USD 17.1 million).
Brokers’ vessel valuations have decreased slightly during the year, and remain to reflect a lower net selling price of the fleet than book value. In management’s opinion, such valuations do not give a true and fair view in a long-term perspective as the market for trade with vessels such as those owned by the Group remains to be not very active. In accordance with the accounting policies applied, an impair-ment test has been made by comparing the broker valua-tions with the calculated value in use based on continued operation of the Group’s fleet stated as the net present value of future estimated net freight income.
The value in use of vessels is heavily affected by the devel-opment in freight rates, which is still subject to material uncertainty. Deviations in freight rates according to the man-agements’ estimates will thus affect the value in use in either positive or negative direction.
EBITDA
US
Dm
0
10
20
30
40
Mar
gin
0
4%
8%
12%
16%
16/17
Margin
Growth
0
50
100
150
200
250
20%
40%
60%
80%
100%
16/17
Revenue and Growth
US
Dm
Gro
wth
0
231
7
12/13 14/1513/14
103.5
28.9
15.7
212.8
184
142.8
15/16
18.4 neg.
252
12/13 14/1513/14
7.6
22
18.4
5,3
12
8,6
15/16
34.4
13,7
16.1
EBITDA
US
Dm
0
10
20
30
40
Mar
gin
0
4%
8%
12%
16%
16/17
Margin
Growth
0
50
100
150
200
250
20%
40%
60%
80%
100%
16/17
Revenue and Growth
US
Dm
Gro
wth
0
231
7
12/13 14/1513/14
103.5
28.9
15.7
212.8
184
142.8
15/16
18.4 neg.
252
12/13 14/1513/14
7.6
22
18.4
5,3
12
8,6
15/16
34.4
13,7
16.1
FINANCIALS
16ANNUAL REPORT
FINANCIALS

Management have made their best estimate over develop-ment in freight rates etc., and consider the assumptions reasonable.
The impairment test has not resulted in need for write downs on the Group’s fleet.
Equity
At 30 April 2017, equity was USD 82.9 million (USD 92.7 million), decreased only by loss for the year of USD 9 million, exchange rate adjustments of USD 0.1 million, and adjust-ment of hedging instruments of USD 0.7 million. The sol-vency rate at 30 April 2017 is 32.0 percent (33.5 percent).
Debt to credit institutions
Total debt to credit institutions decreased to USD 155.2 mil-lion (USD 162.9 million) following ordinary loan prepayments.
CASH FLOW AND FINANCIAL RESOURCES
The Group’s cash flow from operating activities decreased to USD 13.4 million (USD 23.1 million) reflecting the lower EBITDA offset by a positive change in working capital of USD 2.5 million (negative USD 5.9 million).
Investing activities affected cash flows negatively by USD 12.5 million (USD 14.2 million), primarily comprising docking expenses and other investments in vessels.
Financing activities has a negative cash effect of USD 8 mil-lion (positive USD 0.9 million).
Cash and cash equivalents decreased by USD 7.1 million in 2016/17 to USD 13.3 million (USD 20.4 million).
The financing agreement with Danske Bank is effective until end of April 2021, and management considers the current capital resources and liquidity adequate for the continued operations and further development of the Group.
17ANNUAL REPORT
FINANCIALS


Group Parent Company
USD ‘000 Note 2016/17 2015/16 2016/17 2015/16
Revenue 1 231,387 251,968 27,004 26,469
Direct expenses 167,750 168,154 0 0Gross profi t 63,637 83,814 27,004 26,469
Staff expenses 2 28,686 31,368 23,695 24,164Other external expenses 18,816 18,011 3,081 2,498Profi t/loss before depreciation, etc. (EBITDA) 16,135 34,435 228 (193)
Depreciation and amortisation 7+8 20,895 18,230 508 400Profi t/loss before fi nancial income and expenses (4,760) 16,205 (280) (593)
Result in subsidiaries - - (10,055) 12,690Financial income 3 47 340 1,853 536Financial expenses 4 5,591 6,066 60 419Profi t/loss before tax (10,304) 10,479 (8,542) 12,214
Corporation tax 5 (1,323) (1,658) 439 77Net profi t/loss for the year (8,981) 12,137 (8,981) 12,137
Distribution of profi t/loss 6
INCOME STATEMENT 1 MAY - 30 APRIL
19ANNUAL REPORT
FINANCIALS

Group Parent Company
USD ‘000 Note 2017 2016 2017 2016
Goodwill 2,747 3,336 - -Software 811 1,104 793 1,077Intangible assets 7 3,558 4,440 793 1,077
Vessels and equipment 210,527 217,846 0 0Fixtures and fittings, tools and equipment 244 428 97 211Leasehold improvements 32 51 12 17Prepayments 57 57 57 57Property, plant and equipment 8 210,860 218,382 166 285
Investments in subsidiaries - - 15,745 57,656Fixed asset investments 9 0 0 15,745 57,656
Fixed assets 214,418 222,822 16,704 59,018
Inventory of fuel and lube oil 3,680 2,916 0 0Inventories 3,680 2,916 0 0
Trade receivables 11,352 13,150 0 0 Receivables from group enterprises 890 101 65,042 35,957Other receivables 1,629 2,562 720 702Corporation tax 10 6,017 4,873 0 0Prepayments 7,979 9,366 826 117Receivables 27,867 30,052 66,588 36,776
Cash and cash equivalents 13,343 20,436 5,795 10,143
Current assets 44,890 53,404 72,383 46,919
Total assets 259,308 276,226 89,087 105,937
BALANCE SHEET AT 30 APRIL
Assets
20ANNUAL REPORT
FINANCIALS
Group Parent Company
USD ‘000 Note 2017 2016 2017 2016
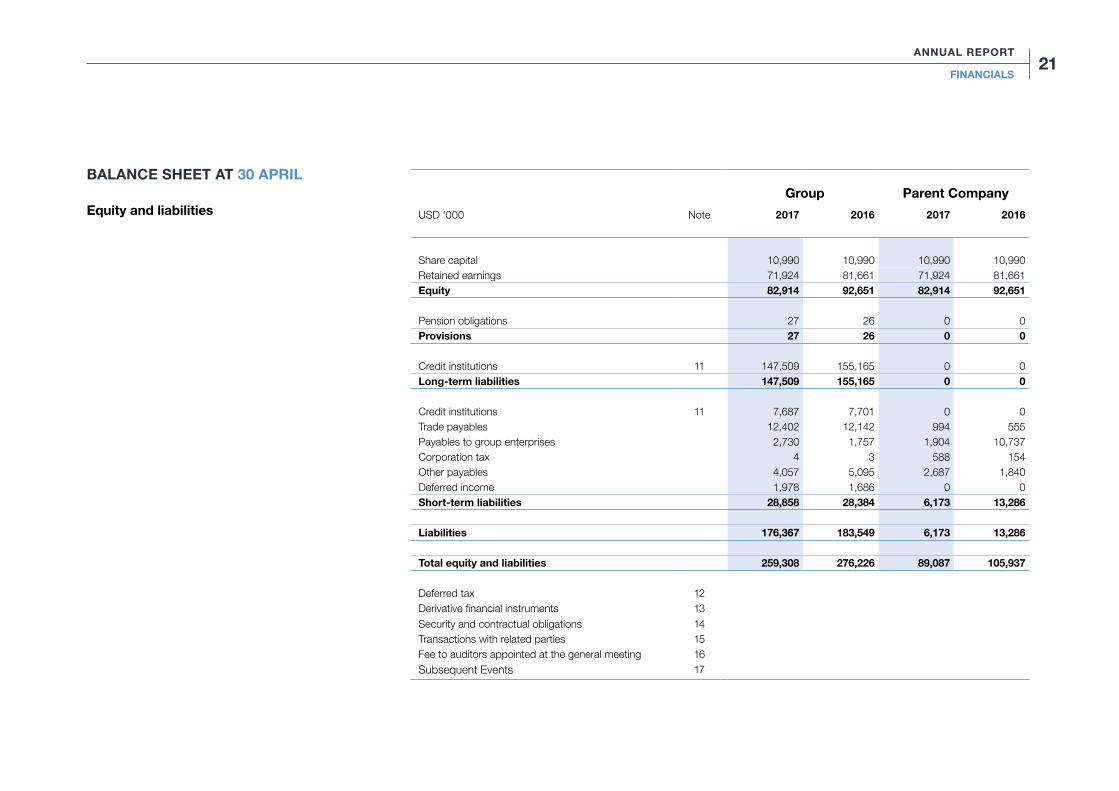
Share capital 10,990 10,990 10,990 10,990Retained earnings 71,924 81,661 71,924 81,661Equity 82,914 92,651 82,914 92,651
Pension obligations 27 26 0 0Provisions 27 26 0 0
Credit institutions 11 147,509 155,165 0 0Long-term liabilities 147,509 155,165 0 0
Credit institutions 11 7,687 7,701 0 0Trade payables 12,402 12,142 994 555Payables to group enterprises 2,730 1,757 1,904 10,737Corporation tax 4 3 588 154Other payables 4,057 5,095 2,687 1,840Deferred income 1,978 1,686 0 0Short-term liabilities 28,858 28,384 6,173 13,286
Liabilities 176,367 183,549 6,173 13,286
Total equity and liabilities 259,308 276,226 89,087 105,937
Deferred tax 12Derivative financial instruments 13Security and contractual obligations 14Transactions with related parties 15Fee to auditors appointed at the general meeting 16Subsequent Events 17
BALANCE SHEET AT 30 APRIL
Equity and liabilities
21ANNUAL REPORT
FINANCIALS


2016/17 Group Parent Company
USD ‘000Share
capitalRetainedearnings Total
Sharecapital
Retainedearnings Total
Equity at 1 May 10,990 81,661 92,651 10,990 81,661 92,651 Exchange rate adjustments 0 (57) (57) 0 (57) (57) Fair value adjustment of hedging instruments 0 (699) (699) 0 (699) (699)Net loss for the year 0 (8,981) (8,981) 0 (8,981) (8,981)
Equity at 30 April 10,990 71,924 82,914 10,990 71,924 82,914
2015/16 Group Parent Company
USD ‘000Share
capitalRetainedearnings Total
Sharecapital
Share premiumaccount
Retainedearnings Total
Equity at 1 May 5,993 14,081 20,074 5,993 0 8,435 14,428Change in accounting policies 0 0 0 0 0 5,646 5,646Adjusted equity at 1 May 5,993 14,081 20,074 5,993 0 14,081 20,074Conversion of debt 4,997 25,003 30,000 4,997 25,003 0 30,000Capital increase 0 30,000 30,000 0 30,000 0 30,000Transfer from share premium account 0 0 0 0 (55,003) 55,003 0Exchange rate adjustments 0 (17) (17) 0 0 (17) (17)Fair value adjustment of hedging instruments
0 457 457 0 0 457 457
Net profit for the year 0 12,137 12,137 0 0 12,137 12,137
Equity at 30 April 10,990 81,661 92,651 10,990 0 81,661 92,651
STATEMENT OF CHANGES IN EQUITY
23ANNUAL REPORT
FINANCIALS

Group
USD ‘000 2016/17 2015/16
Profit/loss for the year before tax (10,304) 10,479Reversal of depreciation, amortisation, profit from sale of assets, and exchange rate adjustments for the year
20,866 18,213
Amortisation of loan costs 328 347Changes in inventories (764) 1,194Changes in receivables 3,517 (5,881)Changes in trade payables and other debt, etc (212) (1,242)Pension obligations 1 8Cash flow from ordinary activities 13,432 23,118
Corporation tax paid (8) (10)Cash flow from operating activities 13,424 23,108
Purchase of property, plant and equipment (12,390) (13,548)Sale of property, plant and equipment 20 18Purchase of intangible assets (147) (643)Cash flow from investing activities (12,517) (14,173)
Capital increase 0 30,000Repayment/raising of loans from credit institutions (net) (8,000) (29,051)Cash flow from financing activities (8,000) 949
Changes in cash and cash equivalents (7,093) 9,883Cash and cash equivalents at 1 May 20,436 10,553Cash and cash equivalents at 30 April 13,343 20,436
CASH FLOW STATEMENT 1 MAY - 30 APRIL
24ANNUAL REPORT
FINANCIALS

25ANNUAL REPORT

1. Segment information
The Group’s activities are considered one segment.
2. Staff expenses Group Parent Company
USD ‘000 2016/17 2015/16 2016/17 2015/16
Rented crew 11,063 11,597 11,063 11,597Wages and salaries 9,903 12,399 5,935 5,814Pensions 770 460 542 246Social security expenses 637 516 264 243Other staff expenses 6,313 6,396 5,891 6,264
28,686 31,368 23,695 24,164
Average number of employees The figures include rented crew on vessels.
595 592 555 554
Salaries and remuneration to the Executives and Board of Directors
439 - 360 -
Staff expences include the salaries of crew in the Parent Company’s subsidiaries. These expences are reinvoiced to the ship owning companies and recognised as revenue.
With reference to the Danish Financial Statements Act section 98 B paragraph 3 comparative numbers for the remuneration of Directors is not disclosed.
NOTES TO THE FINANCIAL STATEMENTS
27ANNUAL REPORT
FINANCIALS

3. Financial income Group Parent Company
USD ‘000 2016/17 2015/16 2016/17 2015/16
Intercompany interest income 0 0 1,849 536Exchange rate adjustments 23 326 0 0Other financial income 24 14 4 0
47 340 1,853 536
4. Financial expenses Group Parent Company
USD ‘000 2016/17 2015/16 2016/17 2015/16
Intercompany interest expenses 0 0 40 278Exchange rate adjustments 660 87 17 53Other financial expenses 4,931 5,979 3 88
5,591 6,066 60 419
5. Corporation tax Group Parent Company
USD ‘000 2016/17 2015/16 2016/17 2015/16
Current tax for the year (1,323) (1,404) 439 76Adjustment of current tax re. previous years 0 (3,441) 0 1Adjustment of deferred tax re. previous years 0 3,187 0 0
(1,323) (1,658) 439 77
6. Distribution of profit/loss Group Parent Company
USD ‘000 2016/17 2015/16 2016/17 2015/16
Proposed distribution of profit/loss:Retained earnings (8,981) 12,137 (8,981) 12,137
(8,981) 12,137 (8,981) 12,137
NOTES TO THE FINANCIAL STATEMENTS
28ANNUAL REPORT
FINANCIALS
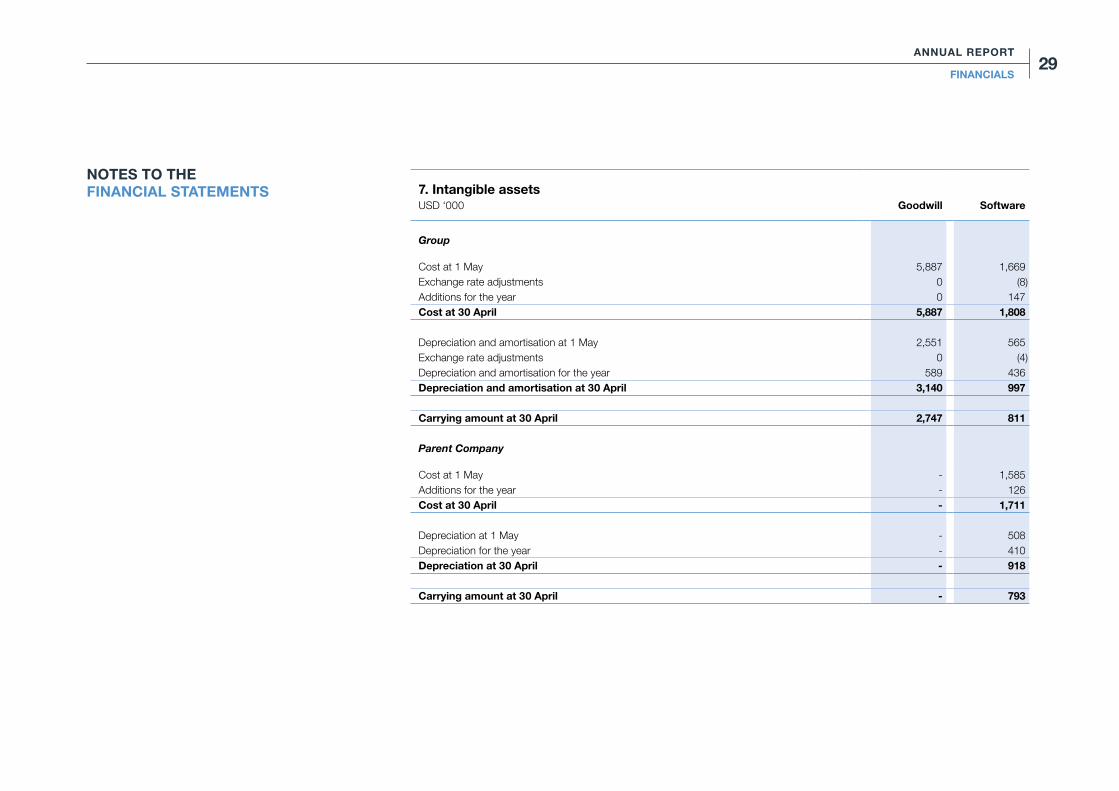
7. Intangible assetsUSD ‘000 Goodwill Software
Group
Cost at 1 May 5,887 1,669Exchange rate adjustments 0 (8)Additions for the year 0 147Cost at 30 April 5,887 1,808
Depreciation and amortisation at 1 May 2,551 565Exchange rate adjustments 0 (4)Depreciation and amortisation for the year 589 436Depreciation and amortisation at 30 April 3,140 997
Carrying amount at 30 April 2,747 811
Parent Company
Cost at 1 May - 1,585Additions for the year - 126Cost at 30 April - 1,711
Depreciation at 1 May - 508Depreciation for the year - 410Depreciation at 30 April - 918
Carrying amount at 30 April - 793
NOTES TO THE FINANCIAL STATEMENTS
29ANNUAL REPORT
FINANCIALS

8. Property, plant and equipmentVessels and
equipment
Fixtures and fittings, tools
and equipmentLeasehold
improvements PrepaymentsUSD ‘000
Group
Cost at 1 May 300,662 1,169 160 57 Exchange rate adjustments 0 (7) (13) 0 Additions for the year 12,373 16 1 0 Disposals for the year 9,044 20 0 0Cost at 30 April 303,991 1,158 148 57
Depreciation at 1 May 82,816 741 109 0Exchange rate adjustments 0 10 (6) 0Depreciation for the year 19,692 163 13 0Reversed depreciation on disposals for the year 9,044 0 0 0Depreciation at 30 April 93,464 914 116 0
Carrying amount at 30 April 210,527 244 32 57
Parent Company
Cost at 1 May 0 615 89 57Additions for the year 0 0 0 0Disposals for the year 0 (20) 0 0Cost at 30 April 0 595 89 57
Depreciation at 1 May 0 404 72 0Depreciation for the year 0 94 5 0Depreciation at 30 April 0 498 77 0
Carrying amount at 30 April 0 97 12 57
NOTES TO THE FINANCIAL STATEMENTS
30ANNUAL REPORT
FINANCIALS

9. Fixed asset investments Investments in subsidiariesUSD ‘000
Parent Company
Cost at 1 May 90,277Additions for the year 3,400Cost at 30 April 93,677
Value adjustments 1 May (32,621)Exchange rate adjustments (57)Net loss for the year (9,466)Dividend to the Parent Company (34,500)Fair value adjustment of hedging instruments for the year (699)Amortisation of goodwill (589)Value adjustments 30 April (77,932)
Carrying amount at 30 April 15,745
Remaining positive difference included in the above carrying amount 2,747
Investments in subsidiaries are specified as follows:
Name Place of reg. office Ownership share
Uni-Chartering A/S Middelfart 100%Uni-Chartering (Gibraltar) Ltd. Gibraltar 100%Uni-Chartering France EURL Nice 100%Uni-Tankers m/t "Jutlandia Swan" ApS Middelfart 100%Uni-Tankers m/t "Selandia Swan" ApS Middelfart 100%Uni-Tankers m/t "Fionia Swan" ApS Middelfart 100%Uni-Tankers m/t "Erria Swan" ApS Middelfart 100%Uni-Tankers m/t "Mona Swan" ApS Middelfart 100%Uni-Tankers m/t "Tasing Swan" ApS Middelfart 100%Uni-Tankers m/t "Boringia Swan" ApS Middelfart 100%Uni-Tankers m/t "Anhout Swan" ApS Middelfart 100%
NOTES TO THE FINANCIAL STATEMENTS
31ANNUAL REPORT
FINANCIALS

NOTES TO THE FINANCIAL STATEMENTS 9. Fixed asset investments (continued)
Name Place of reg. office Ownership share
Uni-Tankers m/t “Lessow Swan” ApS Middelfart 100%Uni-Tankers m/t “Falstria Swan” ApS Middelfart 100%Uni-Tankers m/t "Amak Swan" ApS Middelfart 100%Uni-Tankers m/t "Alsia Swan" ApS Middelfart 100%Uni-Tankers m/t "Samus Swan" ApS Middelfart 100%Uni-Tankers m/t "Feo Swan" ApS Middelfart 100%Uni-Tankers m/t "Lillo Swan" ApS Middelfart 100%Uni-Tankers m/t "Fenno Swan" ApS Middelfart 100%Uni-Tankers m/t "Endelo Swan" ApS Middelfart 100%
10. Corporation taxUSD ‘000 2016/17 2015/16
Group
Corporate tax, current year 1,144 4,873Corporate tax, joint taxation prior years 4,873 0
6,017 4,873
11. Credit institutions
Long-term part of installments falling due within 1 year are recognised as short-term liabilities in the balance sheet.
32ANNUAL REPORT
FINANCIALS

NOTES TO THE FINANCIAL STATEMENTS 12. Deferred tax
Tax on transitional balance and equalisation balance relating to vessels amounts to USD 3,104k.
13. Derivative financial instruments
The Group has entered into forward contracts to ensure future purchase of bunkers for servicing fixed freight contracts. In relation to trading prices at the balance date, the contracts have a negative fair value of USD 241k. Capital losses are recognized in equity. The contracts have a maturity of 2-27 months.
14. Security and contractual obligations
Group
Rental and lease obligationsThe Group has concluded contracts with the following obligations:
» Tenancy contracts with external parties with a total obligation of USD 22k
» Tenancy contracts with group enterprises with a total obligation of USD 1,390k
» Operating leases with a total obligation of USD 610k
» Time charter contracts with a total obligation of USD 42,468k.
USD ‘000Within 1 year
Between 1 and 5
yearsAfter
5 years
Tenancy contracts with external parties 22 0 0 Tenancy contracts with group enterprises 257 1,133 0 Operating leases 407 203 0 Time charter contracts 42,468 0 0
43,154 1,336 0
33ANNUAL REPORT
FINANCIALS
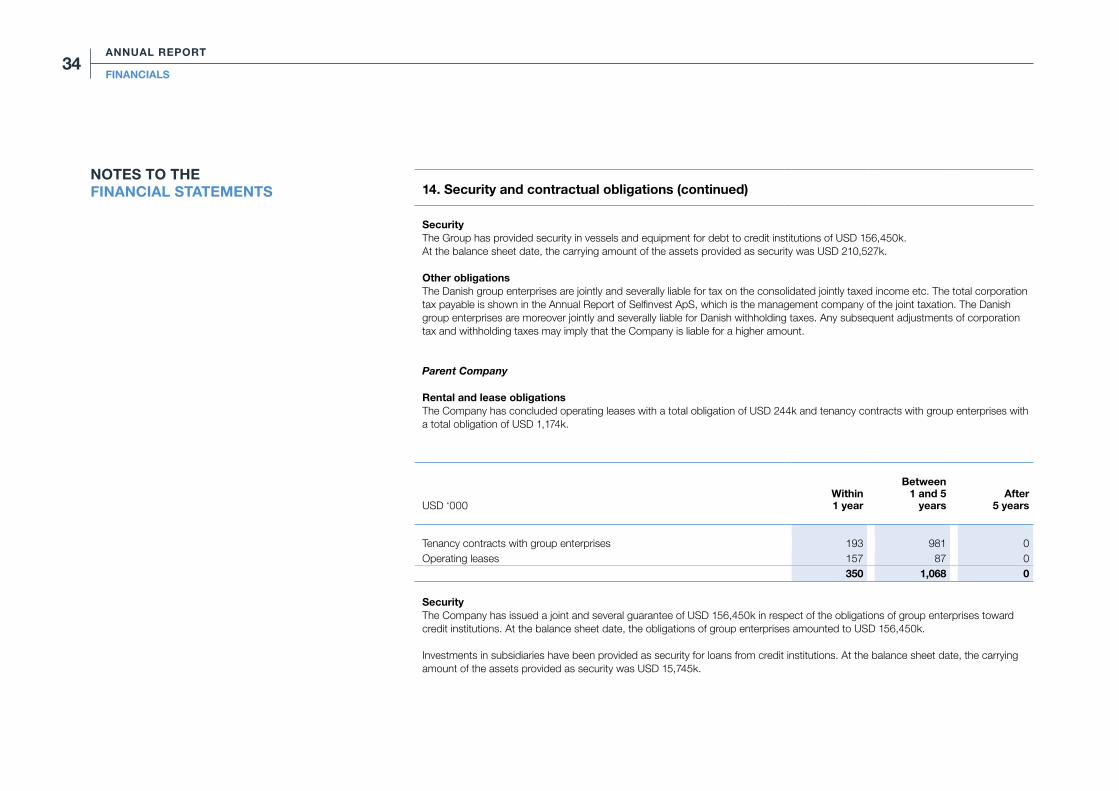
NOTES TO THE FINANCIAL STATEMENTS 14. Security and contractual obligations (continued)
Security The Group has provided security in vessels and equipment for debt to credit institutions of USD 156,450k. At the balance sheet date, the carrying amount of the assets provided as security was USD 210,527k. Other obligationsThe Danish group enterprises are jointly and severally liable for tax on the consolidated jointly taxed income etc. The total corporation tax payable is shown in the Annual Report of Selfinvest ApS, which is the management company of the joint taxation. The Danish group enterprises are moreover jointly and severally liable for Danish withholding taxes. Any subsequent adjustments of corporation tax and withholding taxes may imply that the Company is liable for a higher amount.
Parent Company
Rental and lease obligations The Company has concluded operating leases with a total obligation of USD 244k and tenancy contracts with group enterprises with a total obligation of USD 1,174k.
USD ‘000Within 1 year
Between 1 and 5
yearsAfter
5 years
Tenancy contracts with group enterprises 193 981 0 Operating leases 157 87 0
350 1,068 0
Security The Company has issued a joint and several guarantee of USD 156,450k in respect of the obligations of group enterprises toward credit institutions. At the balance sheet date, the obligations of group enterprises amounted to USD 156,450k.
Investments in subsidiaries have been provided as security for loans from credit institutions. At the balance sheet date, the carrying amount of the assets provided as security was USD 15,745k.
34ANNUAL REPORT
FINANCIALS
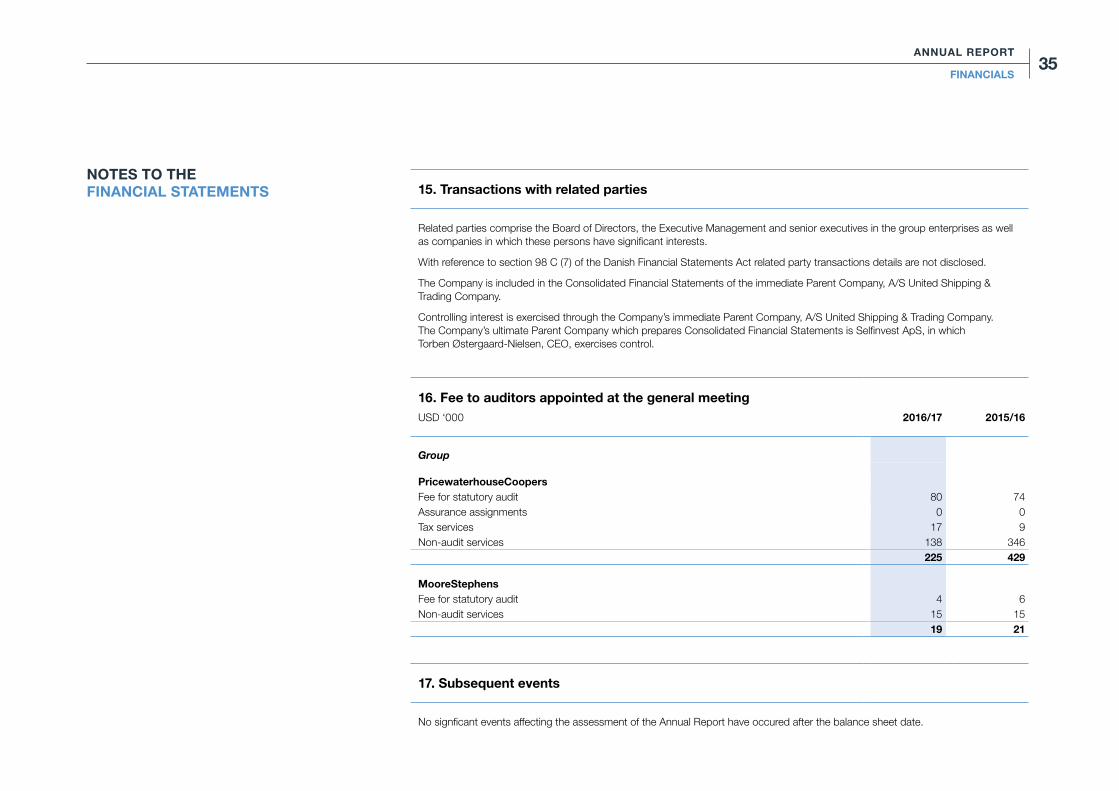
NOTES TO THE FINANCIAL STATEMENTS 15. Transactions with related parties
Related parties comprise the Board of Directors, the Executive Management and senior executives in the group enterprises as well as companies in which these persons have significant interests.
With reference to section 98 C (7) of the Danish Financial Statements Act related party transactions details are not disclosed.
The Company is included in the Consolidated Financial Statements of the immediate Parent Company, A/S United Shipping & Trading Company.
Controlling interest is exercised through the Company’s immediate Parent Company, A/S United Shipping & Trading Company. The Company’s ultimate Parent Company which prepares Consolidated Financial Statements is Selfinvest ApS, in which Torben Østergaard-Nielsen, CEO, exercises control.
16. Fee to auditors appointed at the general meetingUSD ‘000 2016/17 2015/16
Group
PricewaterhouseCoopersFee for statutory audit 80 74 Assurance assignments 0 0 Tax services 17 9 Non-audit services 138 346
225 429
MooreStephensFee for statutory audit 4 6 Non-audit services 15 15
19 21
17. Subsequent events
No signficant events affecting the assessment of the Annual Report have occured after the balance sheet date.
35ANNUAL REPORT
FINANCIALS

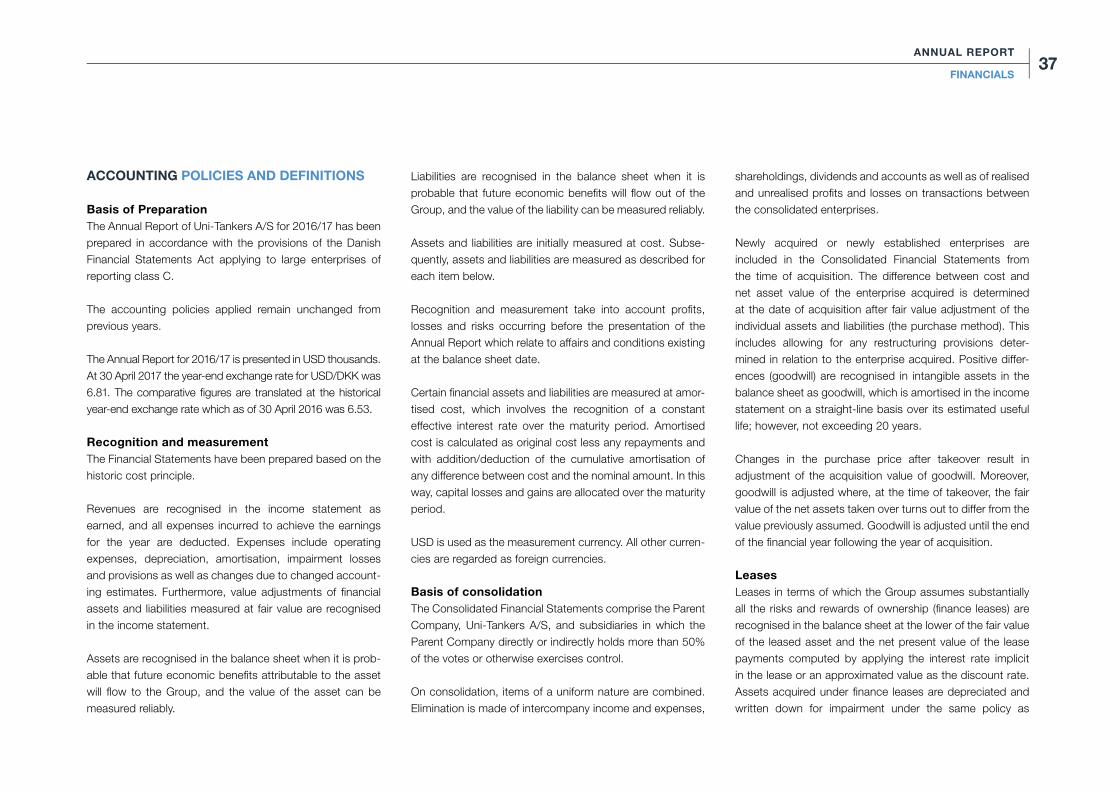
ACCOUNTING POLICIES AND DEFINITIONS
Basis of PreparationThe Annual Report of Uni-Tankers A/S for 2016/17 has been prepared in accordance with the provisions of the Danish Financial Statements Act applying to large enterprises of reporting class C.
The accounting policies applied remain unchanged from previous years.
The Annual Report for 2016/17 is presented in USD thousands. At 30 April 2017 the year-end exchange rate for USD/DKK was 6.81. The comparative fi gures are translated at the historical year-end exchange rate which as of 30 April 2016 was 6.53.
Recognition and measurementThe Financial Statements have been prepared based on the historic cost principle.
Revenues are recognised in the income statement as earned, and all expenses incurred to achieve the earnings for the year are deducted. Expenses include operating expenses, depreciation, amortisation, impairment losses and provisions as well as changes due to changed account-ing estimates. Furthermore, value adjustments of fi nancial assets and liabilities measured at fair value are recognised in the income statement.
Assets are recognised in the balance sheet when it is prob-able that future economic benefi ts attributable to the asset will fl ow to the Group, and the value of the asset can be measured reliably.
Liabilities are recognised in the balance sheet when it is probable that future economic benefi ts will fl ow out of the Group, and the value of the liability can be measured reliably.
Assets and liabilities are initially measured at cost. Subse-quently, assets and liabilities are measured as described for each item below.
Recognition and measurement take into account profi ts, losses and risks occurring before the presentation of the Annual Report which relate to affairs and conditions existing at the balance sheet date.
Certain fi nancial assets and liabilities are measured at amor-tised cost, which involves the recognition of a constant effective interest rate over the maturity period. Amortised cost is calculated as original cost less any repayments and with addition/deduction of the cumulative amortisation of any difference between cost and the nominal amount. In this way, capital losses and gains are allocated over the maturity period.
USD is used as the measurement currency. All other curren-cies are regarded as foreign currencies.
Basis of consolidationThe Consolidated Financial Statements comprise the Parent Company, Uni-Tankers A/S, and subsidiaries in which the Parent Company directly or indirectly holds more than 50% of the votes or otherwise exercises control.
On consolidation, items of a uniform nature are combined. Elimination is made of intercompany income and expenses,
shareholdings, dividends and accounts as well as of realised and unrealised profi ts and losses on transactions between the consolidated enterprises.
Newly acquired or newly established enterprises are included in the Consolidated Financial Statements from the time of acquisition. The difference between cost and net asset value of the enterprise acquired is determined at the date of acquisition after fair value adjustment of the individual assets and liabilities (the purchase method). This includes allowing for any restructuring provisions deter-mined in relation to the enterprise acquired. Positive differ-ences (goodwill) are recognised in intangible assets in the balance sheet as goodwill, which is amortised in the income statement on a straight-line basis over its estimated useful life; however, not exceeding 20 years.
Changes in the purchase price after takeover result in adjustment of the acquisition value of goodwill. Moreover, goodwill is adjusted where, at the time of takeover, the fair value of the net assets taken over turns out to differ from the value previously assumed. Goodwill is adjusted until the end of the fi nancial year following the year of acquisition.
LeasesLeases in terms of which the Group assumes substantially all the risks and rewards of ownership (fi nance leases) are recognised in the balance sheet at the lower of the fair value of the leased asset and the net present value of the lease payments computed by applying the interest rate implicit in the lease or an approximated value as the discount rate. Assets acquired under fi nance leases are depreciated and written down for impairment under the same policy as
37ANNUAL REPORT
FINANCIALS

determined for the other fixed assets of the Group. The remaining lease obligation is capitalised and recognised in the balance sheet under debt, and the interest element on the lease payments is charged over the lease term to the income statement.
All other leases are considered operating leases. Payments relating to operating leases are recognised in the income statement on a straight line basis over the lease period.
Translation policiesTransactions in foreign currencies are translated during the year at the exchange rates at the dates of transaction. Gains and losses arising due to differences between the transac-tion date rates and the rates at the dates of payment are recognised in financial income and expenses in the income statement.
Receivables, payables and other monetary items in foreign currencies are translated at the exchange rates at the bal-ance sheet date. Any differences between the exchange rates at the balance sheet date and the transaction date rates are recognised in financial income and expenses in the income statement; however, see the paragraph “Hedge accounting”.
Upon recognition of financial statements of foreign group enterprises and associates, income statement items are translated into Danish kroner at average exchange rates and balance sheet items are translated at the exchange rates at the balance sheet date. Exchange adjustments arising on this translation are recognised directly in equity.
Derivative financial instrumentsDerivative financial instruments are initially recognised in the balance sheet at cost and are subsequently remeasured at their fair values. Positive and negative fair values of deriva-tive financial instruments are recognised in “Other receiv-ables” and “Other payables”, respectively.
Changes in the fair values of derivative financial instruments are recognised in the income statement unless the deriva-tive financial instrument is designated and qualify as hedge accounting, see below.
Hedge accountingFair value hedges
Changes in the fair values of derivative financial instruments that are designated and qualify as fair value hedges of a recognised asset or a recognised liability are recognised in the income statement as are any changes in the fair value of the hedged asset or the hedged liability.
Hedges of future assets or liabilities
Changes in the fair values of derivative financial instruments that are designated and qualify as hedges of expected future transactions are recognised directly in retained earn-ings under equity. If the hedged transaction results in an asset or a liability, the amount is transferred from equity to the cost of the asset or the liability, respectively. If the hedged transaction results in an income or an expense, the amount is transferred from equity to the income statement in the period in which the hedged transaction is recognised. The amount is recognised in the same item as the hedged transaction.
38ANNUAL REPORT
FINANCIALS

Income StatementRevenue
Revenue is recognised in the income statement when the sale has been completed. This is considered the case when:
» delivery has been made before year end; » a binding sales agreement has been made; » the sales price has been determined; » payment has been received or may with reasonable
certainty be expected to be received.
Revenue is recognised exclusive of VAT and duties.
Revenue includes income from shipowning activities, which is cut off and recognised over the duration of the voyages.
Direct expenses
Direct expenses include bunkers and other voyage expenses, as well as charter hire expenses.
Other income/other expenses
Other income/other expenses includes profi t/loss from sales of assets.
Other external expenses
Other external expenses include expenses for the repair and maintenance of vessels as well as offi ce expenses etc.
Staff expenses
Staff expenses comprise wages and salaries as well as pay-roll expenses.
Income from investments in subsidiaries
The item “Income from investments in subsidiaries” in the income statement of the Parent Company includes the proportionate share of net profi t for the year less goodwill amortisation.
Financial income and expenses
Financial income and expenses comprise interest, fi nancial expenses in respect of fi nance leases, realised and unreal-ised exchange gains and losses and gains and losses on securities, amortisation of loan costs, as well as changes in the fair value of fi nancial instruments.
Tax on profi t/loss for the year
Tax for the year consists of current tax for the year and adjustment of deferred tax for the year. The tax attributable to the profi t for the year is recognised in the income state-ment, whereas the tax attributable to equity transactions is recognised directly in equity.
The Group’s current tax is computed according to the pro-visions of the Danish Tonnage Tax Act. On the basis of the Group’s planned shipowning activities, the Tonnage Tax Scheme does not imply recapture of depreciation, and therefore deferred tax for these companies is only disclosed in the note “Deferred tax”.
The Group is jointly taxed with Danish group enterprises. The tax effect of the joint taxation is allocated to enterprises showing profi ts or losses in proportion to their taxable incomes (full allocation with credit for tax losses). The jointly taxed enterprises have adopted the on-account taxation scheme.
39ANNUAL REPORT
FINANCIALS
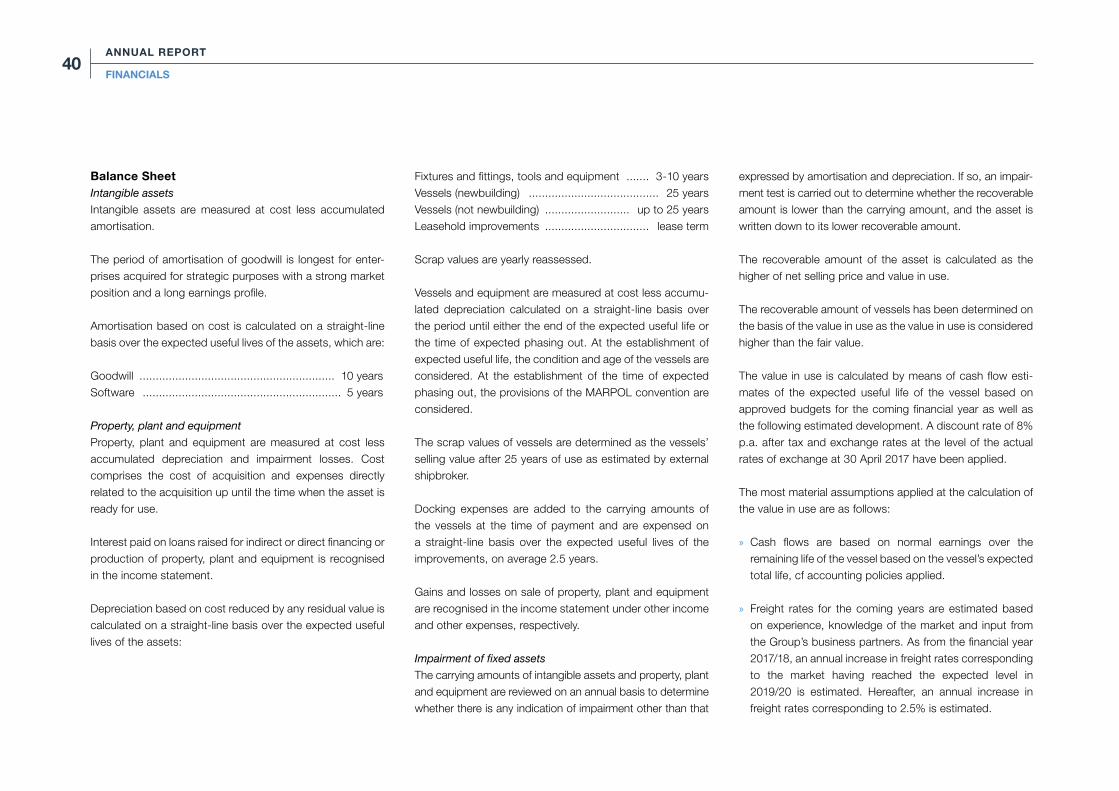
Balance SheetIntangible assets
Intangible assets are measured at cost less accumulated amortisation.
The period of amortisation of goodwill is longest for enter-prises acquired for strategic purposes with a strong market position and a long earnings profile.
Amortisation based on cost is calculated on a straight-line basis over the expected useful lives of the assets, which are:
Goodwill ............................................................ 10 yearsSoftware ............................................................. 5 years
Property, plant and equipment
Property, plant and equipment are measured at cost less accumulated depreciation and impairment losses. Cost comprises the cost of acquisition and expenses directly related to the acquisition up until the time when the asset is ready for use.
Interest paid on loans raised for indirect or direct financing or production of property, plant and equipment is recognised in the income statement.
Depreciation based on cost reduced by any residual value is calculated on a straight-line basis over the expected useful lives of the assets:
Fixtures and fittings, tools and equipment ....... 3-10 yearsVessels (newbuilding) ........................................ 25 yearsVessels (not newbuilding) .......................... up to 25 yearsLeasehold improvements ................................ lease term
Scrap values are yearly reassessed.
Vessels and equipment are measured at cost less accumu-lated depreciation calculated on a straight-line basis over the period until either the end of the expected useful life or the time of expected phasing out. At the establishment of expected useful life, the condition and age of the vessels are considered. At the establishment of the time of expected phasing out, the provisions of the MARPOL convention are considered.
The scrap values of vessels are determined as the vessels’ selling value after 25 years of use as estimated by external shipbroker.
Docking expenses are added to the carrying amounts of the vessels at the time of payment and are expensed on a straight-line basis over the expected useful lives of the improvements, on average 2.5 years.
Gains and losses on sale of property, plant and equipment are recognised in the income statement under other income and other expenses, respectively.
Impairment of fixed assets
The carrying amounts of intangible assets and property, plant and equipment are reviewed on an annual basis to determine whether there is any indication of impairment other than that
expressed by amortisation and depreciation. If so, an impair-ment test is carried out to determine whether the recoverable amount is lower than the carrying amount, and the asset is written down to its lower recoverable amount.
The recoverable amount of the asset is calculated as the higher of net selling price and value in use.
The recoverable amount of vessels has been determined on the basis of the value in use as the value in use is considered higher than the fair value.
The value in use is calculated by means of cash flow esti-mates of the expected useful life of the vessel based on approved budgets for the coming financial year as well as the following estimated development. A discount rate of 8% p.a. after tax and exchange rates at the level of the actual rates of exchange at 30 April 2017 have been applied.
The most material assumptions applied at the calculation of the value in use are as follows:
» Cash flows are based on normal earnings over the remaining life of the vessel based on the vessel’s expected total life, cf accounting policies applied.
» Freight rates for the coming years are estimated based on experience, knowledge of the market and input from the Group’s business partners. As from the financial year 2017/18, an annual increase in freight rates corresponding to the market having reached the expected level in 2019/20 is estimated. Hereafter, an annual increase in freight rates corresponding to 2.5% is estimated.
40ANNUAL REPORT
FINANCIALS

» Operating and administrative expenses are based on experience and expectation of the general development in expenses. As from 2018/19, expen ses are expected to increase by 2.5% annually.
» Docking expenses are estimated based on experi ence and already planned dockings. Docking expen ses are expected to increase by 2.5% annually.
Investments in subsidiaries
Investments in subsidiaries are recognised and measured under the equity method.
The item “Investments in subsidiaries” in the balance sheet of the Parent Company includes the proportionate owner-ship share of the net asset value of the enterprises calcu-lated under the accounting policies of the Parent Company, adjusted for unrealised intercompany profits or losses and with addition or deduction of goodwill.
The total net revaluation of investments in subsidiaries is transferred in the Parent Company upon distribution of profit to “Reserve for net revaluation under the equity method” under equity. The reserve is reduced by dividend distributed to the Parent Company and adjusted for other equity move-ments in the subsidiaries.
Subsidiaries with a negative net asset value are recognised at USD 0. Any legal or constructive obligation of the Parent Company to cover the negative balance of the enterprise is recognised in provisions.
Gains or losses on disposal or liquidation of subsidiaries are calculated as the difference between the sales sum or the liquidation amount and the carrying amount of net assets at the time of sale or liquidation, including unamortised good-will and expected sales or liquidation expenses. Gains or losses are recognised in the income statement.
Inventories
Inventories are measured at cost under the FIFO method. Inventories comprise bunkers and lubrication oil for own use.
The cost of inventories for which the fair values are effectively hedged by a financial transaction is adjusted for changes in the fair value of the hedged risk.
Receivables
Receivables are measured in the balance sheet at the lower of amortised cost and net realisable value, which cor-responds to nominal value less provisions for bad debts. Provisions for bad debts are determined on the basis of an individual assessment of each receivable.
Prepayments
Prepayments comprise prepaid expenses concerning rent, ensurance premiums, subscriptions and interest.
Provisions
Provisions are recognised when - in consequence of an event occurred before or on the balance sheet date – the Group has a legal or constructive obligation and it is prob-able that economic benefits must be given up to settle the obligation.
41ANNUAL REPORT
FINANCIALS

Deferred tax assets and liabilities
Deferred tax is recognised in respect of all temporary dif-ferences between the carrying amount and the tax base of assets and liabilities. However, deferred tax is not rec-ognised in respect of temporary differences concerning goodwill not deductible for tax purposes and own vessels under the Tonnage Tax Scheme.
Deferred tax is measured on the basis of the tax rules and tax rates that will be effective under the legislation at the balance sheet date when the deferred tax is expected to crystallise as current tax. In cases where the computa-tion of the tax base may be made according to alternative tax rules, deferred tax is measured on the basis of the intended use of the asset and settlement of the liability, respectively.
Deferred tax assets, including the tax base of tax loss car-ry-forwards, are measured at the value at which the asset is expected to be realised, either by elimination in tax on future earnings or by set-off against deferred tax liabilities.
Deferred tax assets and liabilities are offset within the same legal tax entity.
Current tax receivables and liabilities
Current tax receivables and liabilities are recognised in the balance sheet at the amount calculated on the basis of the expected taxable income for the year and adjusted for tax on taxable incomes for prior years. Tax receivables and lia-bilities are offset and presented as a net item if there is a legally enforceable right of set-off and an intention to settle on a net basis or simultaneously.
Financial debts
Fixed-interest loans from credit institutions are recognised initially at the proceeds received net of transaction expenses incurred. Subsequently, the loans are measured at amor-tised cost; the difference between the proceeds and the nominal value is recognised as an interest expense in the income statement over the loan period.
Other debts are measured at amortised cost, substan tially corresponding to nominal value.
Deferred income
Deferred income comprise payments recieved in respect of income in subsequent years.
Cash Flow StatementThe cash flow statement shows the Group’s cash flows for the year broken down by operating, investing and financing activities, changes for the year in cash and cash equivalents as well as the Group’s cash and cash equivalents at the beginning and end of the year.
No cash flow statement has been prepared for the Parent Company as the Parent Company cash flows are included in the Consolidated Cash Flow Statement.
Cash flows from operating activities
Cash flows from operating activities are calculated as the net profit/loss for the year adjusted for changes in working capital and non-cash operating items such as depreciation, amortisation and impairment losses, and provisions. Work-ing capital comprises current assets less short-term debt excluding items included in cash and cash equivalents.
42ANNUAL REPORT
FINANCIALS

Cash flows from investing activities
Cash flows from investing activities comprise cash flows from acquisitions and disposals of intangible assets, prop-erty, plant and equipment as well as fixed asset investments.
Cash flows from financing activities
Cash flows from financing activities comprise cash flows from the raising and repayment of short- and long-term debt as well as payment of dividend to shareholders.
The cash flow statement cannot be immediately derived from the published financial records.
Definition of financial ratios
Gross margin = Gross profit x 100 Revenue
Profit margin = Profit before financials x 100 Revenue
Return on equity = Net profit for the year x 100 Average equity
Liquidity ratio = Current assets Short-term debt
Solvency ratio = Equity at year end x 100 Total assets
43ANNUAL REPORT
FINANCIALS

MANAGEMENT’S STATEMENT
The Board of Directors and the Executive Board have today considered and adopted the Annual Report of Uni-Tankers A/S for the fi nancial year 1 May 2016 – 30 April 2017.
The Annual Report was prepared in accordance with the Danish Financial Statements Act.
In our opinion, the Parent Company Financial Statements and the Consolidated Financial Statements give a true and fair view of the fi nancial position of the Parent Company and the Group at 30 April 2017 and of the results of the Par-ent Company and Group operations and consolidated cash fl ows for 2016/17.
In our opinion, Management’s Review includes a true and fair account of the matters addressed in the Review.
We recommend that the Annual Report be adopted at the Annual General Meeting.
Middelfart, 3 July 2017
SIGNATURES
Chairman of the meeting
Torben Andersen
Executive Board
The Annual Report was presented and adopted at the Annual General Meeting of the Company on 3 July 2017.
Torben Østergaard-NielsenChairman
Klaus NyborgDeputy Chairman
Michael Keldsen
Torben Janholt Peter Frederiksen Nina Østergaard Borris
Morten Hultberg BuchgreitzPeter Korsholm
Board of Directors
45ANNUAL REPORT
SIGNATURES
INDEPENDENT AUDITOR’S REPORT
TO THE SHAREHOLDERS OF UNI-TANKERS A/S
OpinionIn our opinion, the Consolidated Financial Statements and the Parent Company Financial Statements give a true and fair view of the financial position of the Group and the Parent Company at 30 April 2017, and of the results of the Group’s and the Parent Company’s operations as well as the consol-idated cash flows for the financial year 1 May 2016 - 30 April 2017 in accordance with the Danish Financial Statements Act.
We have audited the Consolidated Financial Statements and the Parent Company Financial Statements of Uni- Tankers A/S for the financial year 1 May 2016 - 30 April 2017, which comprise income statement, balance sheet, statement of changes in equity and notes, including a summary of signifi-cant accounting policies, for both the Group and the Parent Company, as well as consolidated statement of cash flows (“financial statements”).
Basis for OpinionWe conducted our audit in accordance with International Standards on Auditing (ISAs) and the additional require-ments applicable in Denmark. Our responsibilities under those standards and requirements are further described in the Auditor’s Responsibilities for the Audit of the Finan-cial Statements section of our report. We are independent of the Group in accordance with the International Ethics Standards Board for Accountants’ Code of Ethics for Pro-
fessional Accountants (IESBA Code) and the additional requirements applicable in Denmark, and we have fulfilled our other ethi cal responsibilities in accordance with these requirements. We believe that the audit evidence we have obtained is sufficient and appropriate to provide a basis for our opinion.
Statement on Management’s ReviewManagement is responsible for Management’s Review.
Our opinion on the financial statements does not cover Management’s Review, and we do not express any form of assurance conclusion thereon.
In connection with our audit of the financial statements, our responsibility is to read Management’s Review and, in doing so, consider whether Management’s Review is materially inconsistent with the financial statements or our knowledge obtained during the audit, or otherwise appears to be mate-rially misstated.
Moreover, it is our responsibility to consider whether Mana-ge ment’s Review provides the information required under the Danish Financials Statements Act.
Based on the work we have performed, in our view, Man-agement’s Review is in accordance with the Consolidated Financial Statements and the Parent Company Financial Statements and has been prepared in accordance with the requirements of the Danish Financial Statement Act. We did not identify any material misstatement in Management’s Review.
Management’s Responsibilities for the Financial StatementsManagement is responsible for the preparation of Consoli-dated Financial Statements and Parent Company Financial Statements that give a true and fair view in accordance with the Danish Financial Statements Act, and for such internal control as Management determines is necessary to enable the preparation of financial statements that are free from material misstatement, whether due to fraud or error.
In preparing the financial statements, Management is responsible for assessing the Group’s and the Parent Com-pany’s ability to continue as a going concern, disclosing, as applicable, matters related to going concern and using the going concern basis of accounting in preparing the financial statements unless Management either intends to liquidate the Group or the Parent Company or to cease operations, or has no realistic alternative but to do so.
Auditor’s Responsibilities for the Audit of the Financial StatementsOur objectives are to obtain reasonable assurance about whether the financial statements as a whole are free from material misstatement, whether due to fraud or error, and to issue an auditor’s report that includes our opinion. Reason able assurance is a high level of assurance, but is not a guarantee that an audit conducted in accordance with ISAs and the additional requirements applicable in Denmark will always detect a material misstatement when it exists. Misstatements can arise from fraud or error and are considered material if, individually or in the aggregate, they could reason ably be expected to influence the eco-
46ANNUAL REPORT
SIGNATURES

Jan Bunk Harbo LarsenState Authorised Public Accountant
Carsten DahlState Authorised Public Accountant
Trekantområdet, 3 July 2017
PricewaterhouseCoopersStatsautoriseret Revisionspartnerselskab
Company reg. no.: 33 77 12 31
nomic decisions of users taken on the basis of these finan-cial statements.
As part of an audit conducted in accordance with ISAs and the additional requirements applicable in Denmark, we exer-cise professional judgment and maintain professional skep-ticism throughout the audit. We also:
» Identify and assess the risks of material misstatement of the financial statements, whether due to fraud or error, design and perform audit procedures responsive to those risks, and obtain audit evidence that is sufficient and appropriate to provide a basis for our opinion. The risk of not detecting a material misstatement resulting from fraud is higher than for one resulting from error as fraud may involve collusion, forgery, intentional omissions, misrepresentations, or the override of internal control.
» Obtain an understanding of internal control relevant to the audit in order to design audit procedures that are appropriate in the circumstances, but not for the purpose of expressing an opinion on the effectiveness of the Group’s and the Parent Company’s internal control.
» Evaluate the appropriateness of accounting policies used and the reasonableness of accounting estimates and related disclosures made by Management.
» Conclude on the appropriateness of Management’s use of the going concern basis of accounting in preparing the financial statements and, based on the audit evidence obtained, whether a material uncertainty exists related to
events or conditions that may cast significant doubt on the Group’s and the Parent Company’s ability to continue as a going concern. If we conclude that a material uncertainty exists, we are required to draw attention in our auditor’s report to the related disclosures in the financial statements or, if such disclosures are inadequate, to modify our opinion. Our conclusions are based on the audit evidence obtained up to the date of our auditor’s report. However, future events or conditions may cause the Group and the Parent Company to cease to continue as a going concern.
» Evaluate the overall presentation, structure and contents of the financial statements, including the disclosures, and whether the financial statements represent the underlying transactions and events in a manner that gives a true and fair view.
» Obtain sufficient appropriate audit evidence regarding the financial information of the entities or business activities within the Group to express an opinion on the Consolidated Financial Statements. We are responsible for the direction, supervision and performance of the group audit. We remain solely responsible for our audit opinion.
We communicate with those charged with governance regarding, among other matters, the planned scope and timing of the audit and significant audit findings, including any significant deficiencies in internal control that we identify during our audit.
47ANNUAL REPORT
SIGNATURES

48ANNUAL REPORT
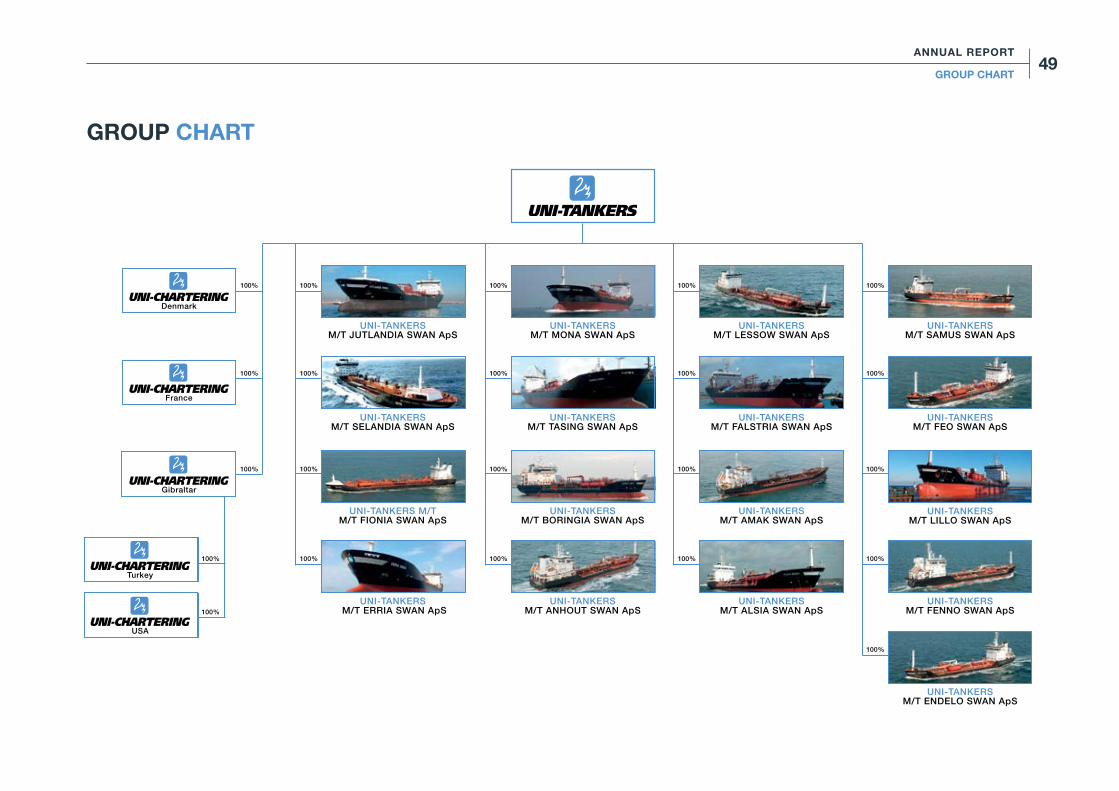
GROUP CHART
UNI-TANKERS M/T FALSTRIA SWAN ApS
UNI-TANKERS M/T SELANDIA SWAN ApS
UNI-TANKERS M/T AMAK SWAN ApS
UNI-TANKERS M/T M/T FIONIA SWAN ApS
UNI-TANKERSM/T ALSIA SWAN ApS
UNI-TANKERS M/T ERRIA SWAN ApS
UNI-TANKERS M/T SAMUS SWAN ApS
UNI-TANKERSM/T MONA SWAN ApS
UNI-TANKERSM/T LILLO SWAN ApS
UNI-TANKERS M/T TASING SWAN ApS
UNI-TANKERSM/T FENNO SWAN ApS
UNI-TANKERSM/T BORINGIA SWAN ApS
UNI-TANKERSM/T ENDELO SWAN ApS
UNI-TANKERSM/T LESSOW SWAN ApS
UNI-TANKERSM/T FEO SWAN ApS
UNI-TANKERSM/T ANHOUT SWAN ApS
UNI-TANKERS M/T JUTLANDIA SWAN ApS
Denmark
100% 100% 100% 100% 100%
100% 100% 100% 100% 100%
100% 100% 100% 100% 100%
100% 100% 100% 100%
100%
100%
100%
France
Gibraltar
Turkey
USA
49ANNUAL REPORT
GROUP CHART
Uni-Chartering A/S (Aalborg)Telephone:E-mail:Address:
+45 88 30 39 [email protected]Østre Havnegade 16DK-9000 Aalborg
Uni-Chartering – USA LLCTelephone:Facsimile:E-mail:Address:
+1 281 833 7271+1 281 833 [email protected] Gessner Road,Houston, TX 77024, USA
Uni-Chartering – TurkeyTelephone:Facsimile:E-mail:Address:
+90 216 302 5900+90 216 302 [email protected] Cad. Gokce Sok.Toksoy Apt.No: 10/17 - 1834728 Caddebostan, Istanbul, Turkey
Uni-Chartering – FranceTelephone:E-mail:Address:
+33 493 121 [email protected] ‘La Täne’609 Chemin de Pigranel06250 Mougins, France
COMPANY INFORMATION
Uni-Chartering A/STelephone:Facsimile:E-mail:Company reg. no.:Address:
Web:
+45 88 30 99 09+45 88 61 88 [email protected] 58 78 67Turbinevej 10DK-5500 Middelfartwww.uni-chartering.com
Uni-Tankers A/STelephone:Facsimile:E-mail:Company reg. no.:Address:
Web:
+45 88 61 88 61 +45 88 61 88 [email protected] 56 07 96Turbinevej 10DK-5500 Middelfartwww.uni-tankers.com
50ANNUAL REPORT
COMPANY INFORMATION

51ANNUAL REPORT
COMPANY INFORMATION

Turbinevej 10, 5500 Middelfart, Denmark · Telephone +45 88 61 88 61 · www.uni-tankers.com · Company reg. no. 12 56 07 96