![C LAUS B RABRAND S EMANTICS (Q1,’05) S EP 29, 2005 C LAUS B RABRAND © 2005, University of Aarhus [ brabrand@daimi.au.dk ] [ brabrand](https://static.fdocuments.us/doc/165x107/56649d5d5503460f94a3ca96/c-laus-b-rabrand-s-emantics-q105-s-ep-29-2005-c-laus-b-rabrand-2005.jpg)
Annual report 2016 - Microsoft Supermarked A/S Rosbjergvej 33 DK-8220 Brabrand Annual report 2016...
81
Dansk Supermarked A/S Rosbjergvej 33 DK-8220 Brabrand Annual report 2016 CVR no. 35 95 47 16 The Annual Report has been presented and approved on the company's annual general meeting at / 2017 Chair
Transcript of Annual report 2016 - Microsoft Supermarked A/S Rosbjergvej 33 DK-8220 Brabrand Annual report 2016...

Dansk Supermarked A/S
Rosbjergvej 33
DK-8220 Brabrand
Annual report
2016
CVR no. 35 95 47 16
The Annual Report has been presented and approved on the company's annual general
meeting at / 2017
Chair

Table of contents
Page
Management's review
Financial highlights for the Group 1
Management's review 2
Financial statements
Statements
Management's statement 4 Independent auditors' reports 5 Consolidated financial statements
Consolidated income statement 7 Consolidated statement of other comprehensive income 8 Consolidated statement of financial position 9 Consolidated cash flow statement 11 Consolidated statement of changes in equity 12 Notes to the consolidated financial statements 14 Parent company financial statements
Parent company income statement 52 Parent company statement of other comprehensive income 53 Parent company statement of financial position 54 Parent company cash flow statement 56 Parent company statement of changes in equity 57 Notes to the parent company financial statements 59
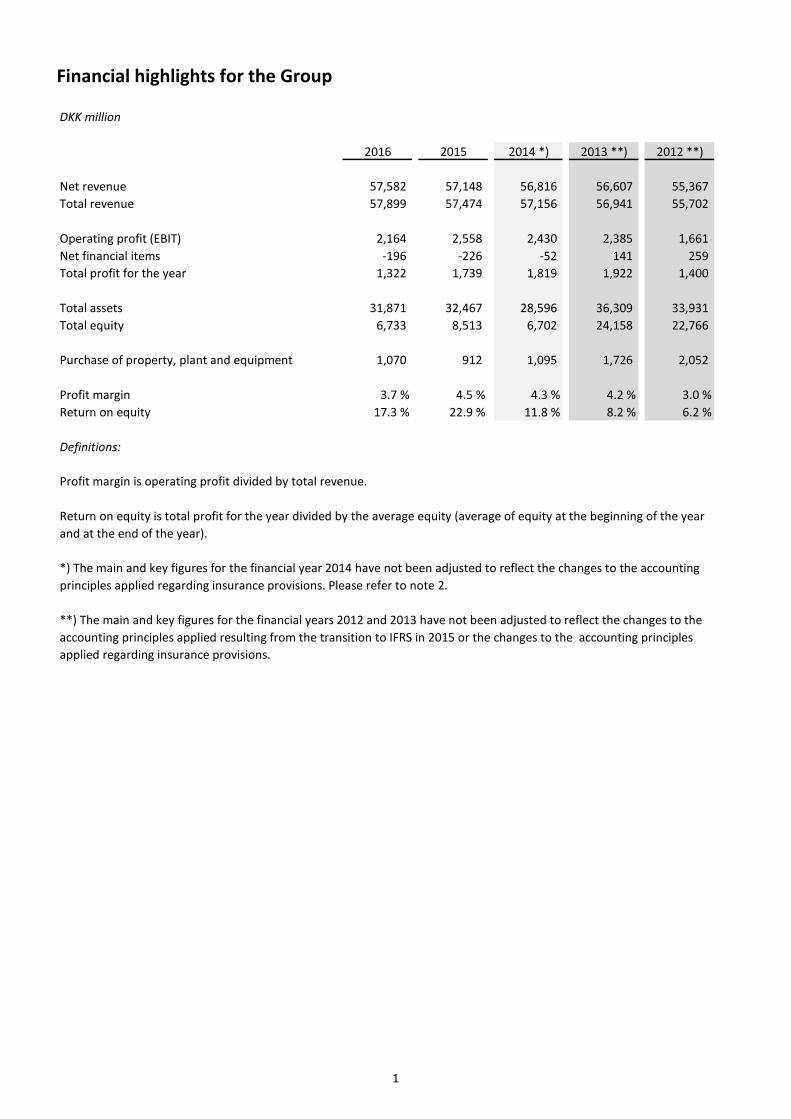
Financial highlights for the Group
DKK million
2016 2015 2014 *) 2013 **) 2012 **)
Net revenue 57,582 57,148 56,816 56,607 55,367 Total revenue 57,899 57,474 57,156 56,941 55,702
Operating profit (EBIT) 2,164 2,558 2,430 2,385 1,661 Net financial items -196 -226 -52 141 259 Total profit for the year 1,322 1,739 1,819 1,922 1,400
Total assets 31,871 32,467 28,596 36,309 33,931 Total equity 6,733 8,513 6,702 24,158 22,766
Purchase of property, plant and equipment 1,070 912 1,095 1,726 2,052
Profit margin 3.7 % 4.5 % 4.3 % 4.2 % 3.0 %Return on equity 17.3 % 22.9 % 11.8 % 8.2 % 6.2 %
Definitions:
Return on equity is total profit for the year divided by the average equity (average of equity at the beginning of the year and at the end of the year).
**) The main and key figures for the financial years 2012 and 2013 have not been adjusted to reflect the changes to the accounting principles applied resulting from the transition to IFRS in 2015 or the changes to the accounting principles applied regarding insurance provisions.
Profit margin is operating profit divided by total revenue.
*) The main and key figures for the financial year 2014 have not been adjusted to reflect the changes to the accounting principles applied regarding insurance provisions. Please refer to note 2.
1

Management's review
Primary business area
Dansk Supermarked Group operates retailing in Denmark through the physical stores Bilka, føtex, Netto and Salling and online with Bilka.dk, Salling.dk, føtex.dk and wupti.com. Furthermore the Group also operates franchises in Denmark including Starbucks and Carl’s Jr. In Germany, Poland and Sweden the Group operates through Netto. The parent company's activities include retailing in Denmark (Bilka, føtex and Netto). Development during the financial year
Market development
The Danish grocery market continued to grow at a slow rate in 2016. The market was characterised by strong competition and continued price sensitive consumers. The discount segment accounts for more than 40 % of the market for fast moving consumer goods in Denmark with several discount banners opening and refurbishing stores during the year. The discount segment is expected to continue its growth in the coming years, though at a significantly slower pace than earlier. New store openings will continue, but will be countered by other discounters closing unprofitable stores as was the case in both 2016 and the first months of 2017. The market for nonfood and textile was also characterized by limited growth. Volumes are continuously shifting towards online trade, a trend expected to continue in the coming years. Dansk Supermarked Group including food and non-food overall maintained its market share in Denmark despite fierce com-petition and grew sales in Denmark by 536 million. Structural development
In 2015 the acquisitions of online companies Wupti.com and iPosen.dk were conducted. Legal mergers with the companies took place in 2016 with Dansk Supermarked A/S as the continuing entity.
Result for the year
The annual report for Dansk Supermarked A/S is presented in accordance with the provisions of the International Financial Reporting Standards (IFRS). The total revenue for 2016 amounts to DKK 57,899 million, an increase of DKK 425 million compared to 2015. The expansion continued with the opening of 26 new stores. During the year Dansk Supermarked Group closed 20 stores and 26 døgnNetto stores were converted to Netto or føtex food stores. Profit before tax is DKK 1,763 million. In 2015 Profit before tax amounted to DKK 2,250 million. The result is in line with the expectations for the year. Cash flows from operating activities amount to DKK 4,434 million (DKK 3,420 million in 2015). Cash flows from investment ac-tivities were DKK -1,600 million (DKK -5,174 million in 2015 ) A part of investment activities is related to investments in secu-rities. In 2016 net investments in securities amount to DKK -414 million. In 2015 the net investments in securities amounted to DKK -3,847 million. Employees
As at 31 December 2016 the Dansk Supermarked Group employed 51,202 employees against 50,553 as at 31 December 2015. Converted into the average number of full time employees this equals 26,568 in 2016 (26,119 in 2015).
2

Management's review
Social responsibility and diversity in management
Dansk Supermarked Group considers social responsibility to be important for the Group. Regarding the efforts in 2016 we re-fer to our report on social responsibility in pursuance of sections 99a and 99b of the Danish Financial Statements Act. The re-port is available on: https://dscomprodstorage.blob.core.windows.net/media/29976/csr-report-2016.pdf
Particular risks
The Group’s financial risks include interest and exchange rate risks. The interest rate risk is related to the Group’s mortgage loans where the risk is hedged by interest rate swaps. The exchange rate risk primarily concerns purchase of goods in USD where the major part hereof is covered by short-term forward contracts. Expected development
The result before tax for 2017 is expected to be in line with 2016.
3

Management's statement
The Board of Directors and the Executive Board have today discussed and approved the annual report of Dansk Supermarked A/S for the financial year 1 January – 31 December 2016.
The annual report has been prepared in accordance with International Financial Reporting Standards (IFRS) as adopted by the EU and further Danish disclosure requirements according to the Danish Financial Statements Act.
It is our opinion that the consolidated financial statements and the parent company financial statements give a true and fair view of the Group's and the company's assets, liabilities and financial position at 31 December 2016 and of the results of the Group's and the company's operations and cash flows for the financial year 1 January – 31 December 2016.
Further, in our opinion, the Management's review gives a fair review of the development in the Group's and the company's operations and financial conditions, the results of the Group's and the company's operations, cash flows and financial position as well as a description of the most significant risks and uncertainty factors that the Group and the company faces. We recommend that the annual report be approved at the annual general meeting. Brabrand, 21 March 2017 Executive Board
Per Bank CEO Board of Directors
Nils S. Andersen Chairman Bjørn Gulden Margit Alexandra Sandersen Employee representative
Jens Bjerg Sørensen Freddy Mikael Sobin Kenneth Wedel Employee representative
Marianne Kirkegaard Knudsen Thomas Carsten Alexander Tochtermann
4

Independent auditors' reports
To the Shareholders of Dansk Supermarked A/S
We have audited the consolidated financial statements and the parent company financial statements of Dansk Supermarked A/S for the financial year 1 January – 31 December 2016, which comprise income statement, statement of comprehensive in-come, balance sheet, statement of changes in equity, statement of cash flow and notes, including a summary of significant accounting policies, for the group as well as for the parent company. The consolidated financial statements and the parent company financial statements are prepared in accordance with International Financial Reporting Standards as adopted by the EU and additional disclosure requirements in the Danish Financial Statements Act. In our opinion, the consolidated financial statements and the parent company financial statements give a true and fair view of the financial position of the Group and the parent company at 31 December 2016 and of the results of the Group's and the parent company's operations and cash flows for the financial year 1 January – 31 December 2016 in accordance with Interna-tional Financial Reporting Standards as adopted by the EU and additional disclosure requirements in the Danish Financial Statements Act. Basis for opinion
We conducted our audit in accordance with International Standards on Auditing (ISAs) and the additional requirements ap-plicable in Denmark. Our responsibilities under those standards and requirements are further described in the "Auditor's re-sponsibilities for the audit of the consolidated financial statements and the parent company financial statements" section of our report. We are independent of the Group in accordance with the International Ethics Standards Board for Accountants' Code of Ethics for Professional Accountants (IESBA Code) and the additional requirements applicable in Denmark, and we have fulfilled our other ethical responsibilities in accordance with these rules and requirements. We believe that the audit ev-idence we have obtained is sufficient and appropriate to provide a basis for our opinion. Statement on the Management's review
Management is responsible for the Management's review. Our opinion on the consolidated financial statements and the parent company financial statements does not cover the Man-agement's review, and we do not express any assurance conclusion thereon. In connection with our audit of the consolidated financial statements and the parent company financial statements, our re-sponsibility is to read the Management's review and, in doing so, consider whether the Management's review is materially inconsistent with the consolidated financial statements or the parent company financial statements, or our knowledge ob-tained during the audit, or otherwise appears to be materially misstated. Moreover, it is our responsibility to consider whether the Management's review provides the information required under the Danish Financial Statements Act. Based on the work we have performed, we concluded that the Management's review is in accordance with the consolidated financial statements and the parent company financial statements and has been prepared in accordance with the require-ments of the Danish Financial Statements Act. We did not identify any material misstatements of the Management's review. Management's responsibilities for the consolidated financial statements and the parent company financial statements
Management is responsible for the preparation of consolidated financial statements and parent company financial state-ments that give a true and fair view in accordance with International Financial Reporting Standards as adopted by the EU and additional disclosure requirements in the Danish Financial Statements Act, and for such internal control as Management de-termines is necessary to enable the preparation of consolidated financial statements and parent company financial state-ments that are free from material misstatement, whether due to fraud or error. In preparing the consolidated financial statements and the parent company financial statements, Management is responsible for assessing the Group's and the parent company's ability to continue as a going concern, disclosing, as applicable, matters related to going concern and using the going concern basis of accounting in preparing the consolidated financial statements and the parent company financial statements unless Management either intends to liquidate the Group or the company or to cease operations, or has no realistic alternative but to do so.
5

Independent auditors' reports
Auditor's responsibilities for the audit of the consolidated financial statements and the parent company financial state-
ments
Our objectives are to obtain reasonable assurance about whether the consolidated financial statements and the parent com-pany financial statements as a whole are free from material misstatement, whether due to fraud or error, and to issue an au-ditor's report that includes our opinion. Reasonable assurance is a high level of assurance, but is not a guarantee that an au-dit conducted in accordance with ISAs and the additional requirements applicable in Denmark will always detect a material misstatement when it exists. Misstatements can arise from fraud or error and are considered material if, individually or in the aggregate, they could reasonably be expected to influence the economic decisions of users taken on the basis of these con-solidated financial statements and parent company financial statements. As part of an audit conducted in accordance with ISAs and the additional requirements applicable in Denmark, we exercise professional judgment and maintain professional skepticism throughout the audit. We also: • Identify and assess the risks of material misstatement of the consolidated financial statements and the parent company financial statements, whether due to fraud or error, design and perform audit procedures responsive to those risks, and ob-tain audit evidence that is sufficient and appropriate to provide a basis for our opinion. The risk of not detecting a material misstatement resulting from fraud is higher than for one resulting from error as fraud may involve collusion, forgery, inten-tional omissions, misrepresentations, or the override of internal control.
• Obtain an understanding of internal control relevant to the audit in order to design audit procedures that are appropri-ate in the circumstances, but not for the purpose of expressing an opinion on the effectiveness of the Group's and the parent company's internal control.
• Evaluate the appropriateness of accounting policies used and the reasonableness of accounting estimates and related disclosures made by Management.
• Conclude on the appropriateness of Management's use of the going concern basis of accounting in preparing the consol-idated financial statements and the parent company financial statements and, based on the audit evidence obtained, wheth-er a material uncertainty exists related to events or conditions that may cast significant doubt on the Group's and the parent company's ability to continue as a going concern. If we conclude that a material uncertainty exists, we are required to draw attention in our auditor's report to the related disclosures in the consolidated financial statements and the parent company financial statements or, if such disclosures are in-adequate, to modify our opinion. Our conclusion is based on the audit evi-dence obtained up to the date of our auditor's report. However, future events or conditions may cause the Group and the company to cease to continue as a going concern.
• Evaluate the overall presentation, structure and contents of the consolidated financial statements and the parent com-pany financial statements, including the disclosures, and whether the consolidated financial statements and the parent com-pany financial statements represent the underlying transactions and events in a manner that gives a true and fair view.
• Obtain sufficient appropriate audit evidence regarding the financial information of the entities or business activities within the Group to express an opinion on the consolidated financial statements. We are responsible for the direction, su-pervision and performance of the group audit. We remain solely responsible for our audit opinion. We communicate with those charged with governance regarding, among other matters, the planned scope and timing of the audit and significant audit findings, including any significant deficiencies in internal control that we identify during our audit. Aarhus, 21 March 2017 ERNST & YOUNG Godkendt Revisionspartnerselskab CVR no. 30 70 02 28
Henrik Kronborg Iversen Morten Friis State Authorised Public Accountant State Authorised Public Accountant
6

Consolidated income statementDKK million
Notes 2016 2015
Net revenue 57,582 57,148 Other revenue 317 326
4 Total revenue 57,899 57,474 Cost of sales -42,589 -42,242
Gross profit 15,310 15,232 5 Staff expenses -6,892 -6,786 6 External expenses -5,412 -5,310
Depreciation, amortisation and impairment losses -929 -831 Net gain on disposal of investment property, property, plant and equipment and intangible assets 87 253
Operating profit (EBIT) 2,164 2,558 13 Share of profit/loss of joint ventures, net of tax -205 -82 7 Financial income 115 85 8 Financial expenses -311 -311
Profit before tax 1,763 2,250 9 Income tax -441 -511
Total profit for the year 1,322 1,739
The total profit for the year is attributable to shareholders of Dansk Supermarked A/S.
7

Consolidated statement of other comprehensive incomeDKK million
Notes 2016 2015
Profit for the year 1,322 1,739
Other comprehensive income, net of income tax:
Items that will not be reclassified to the consolidated income
statement:
9 Remeasurement of defined benefit plans -13 5
-13 5
Items that are or may be reclassified subsequently to the
consolidated income statement:
9 Exchange differences on translating foreign operations -229 51 9 Cash flow hedges, value adjustment for the year -211 -11 9 Cash flow hedges, reclassified to financial expenses 51 42
-389 82
Other comprehensive income for the year, net of income tax -402 87
Total comprehensive income for the year 920 1,826
The total comprehensive income for the year is attributable to shareholders of Dansk Supermarked A/S.
8

Consolidated statement of financial positionDKK million
Assets
Notes 2016 2015
Non-current assets
10 Intangible assets
Goodwill 309 310 Software 1,027 1,029 Software development in progress 145 158 Brands 65 73 Other intangible assets 9 8
Total intangible assets 1,555 1,578
11 Property, plant and equipment
Land and buildings 16,169 16,353 Fixtures and fittings, tools and equipment 1,702 1,517 Leasehold improvements 324 309 Assets under construction and prepayments 111 81
Total property, plant and equipment 18,306 18,260
12 Investment property 424 419
Financial assets
13 Investments in joint ventures 32 113 14 Other non-current financial assets - 12
Total financial assets 32 125
15 Deferred tax assets 186 246
Total non-current assets 20,503 20,628
Current assets
16 Inventories 4,727 4,969
Receivables
14 Trade receivables 204 111 Income tax receivables 20 65
14 Other receivables 500 495 Prepayments 71 140
14 Other current financial assets 5 30
Total receivables 800 841
14 Securities 4,718 4,304
14 Cash and short-term deposits 1,118 1,689
17 Assets classified as held for sale 5 36
Total current assets 11,368 11,839
Total assets 31,871 32,467
9

Consolidated statement of financial positionDKK million
Equity and liabilities
Notes 2016 2015
Equity
Share capital 524 524 Retained earnings 6,659 5,500 Cash flow hedge reserve -295 -135 Foreign currency translation reserve -305 -76 Proposed dividends 150 2,700
Total equity 6,733 8,513
Liabilities
Non-current liabilities
18 Pensions 291 286 15 Deferred tax liabilities 407 353 19 Provisions 143 164 14 Mortgage loans 12,362 12,999 14 Other non-current financial liabilities 309 395
Total non-current liabilities 13,512 14,197
Current liabilities
19 Provisions 59 40 14 Mortgage loans 126 95 14 Bank loans 1 104 14 Other current financial liabilities 404 171 14 Trade payables 8,755 7,209
Income tax payable 6 11 14 Other payables 2,251 2,103
Deferred income 24 24
Total current liabilities 11,626 9,757
Total liabilities 25,138 23,954
Total equity and liabilities 31,871 32,467
10
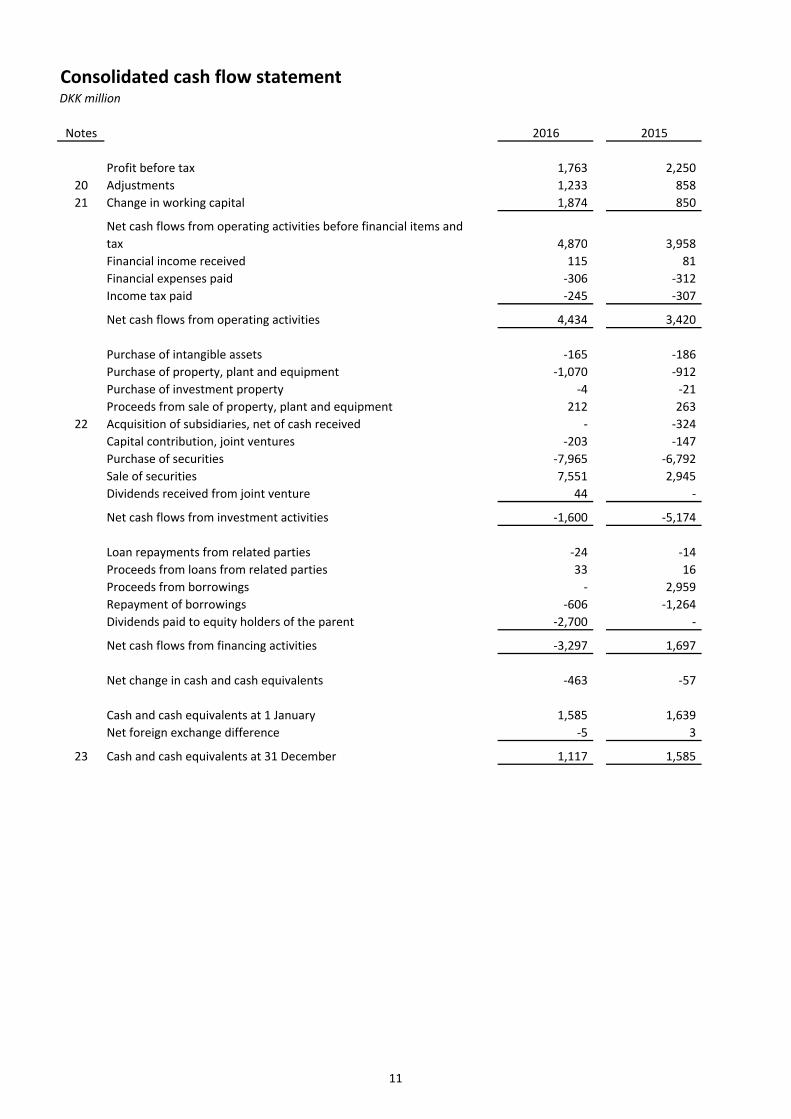
Consolidated cash flow statementDKK million
Notes 2016 2015
Profit before tax 1,763 2,250 20 Adjustments 1,233 858 21 Change in working capital 1,874 850
Net cash flows from operating activities before financial items and tax 4,870 3,958 Financial income received 115 81 Financial expenses paid -306 -312 Income tax paid -245 -307
Net cash flows from operating activities 4,434 3,420
Purchase of intangible assets -165 -186 Purchase of property, plant and equipment -1,070 -912 Purchase of investment property -4 -21 Proceeds from sale of property, plant and equipment 212 263
22 Acquisition of subsidiaries, net of cash received - -324 Capital contribution, joint ventures -203 -147 Purchase of securities -7,965 -6,792 Sale of securities 7,551 2,945 Dividends received from joint venture 44 -
Net cash flows from investment activities -1,600 -5,174
Loan repayments from related parties -24 -14 Proceeds from loans from related parties 33 16 Proceeds from borrowings - 2,959 Repayment of borrowings -606 -1,264 Dividends paid to equity holders of the parent -2,700 -
Net cash flows from financing activities -3,297 1,697
Net change in cash and cash equivalents -463 -57
Cash and cash equivalents at 1 January 1,585 1,639 Net foreign exchange difference -5 3
23 Cash and cash equivalents at 31 December 1,117 1,585
11
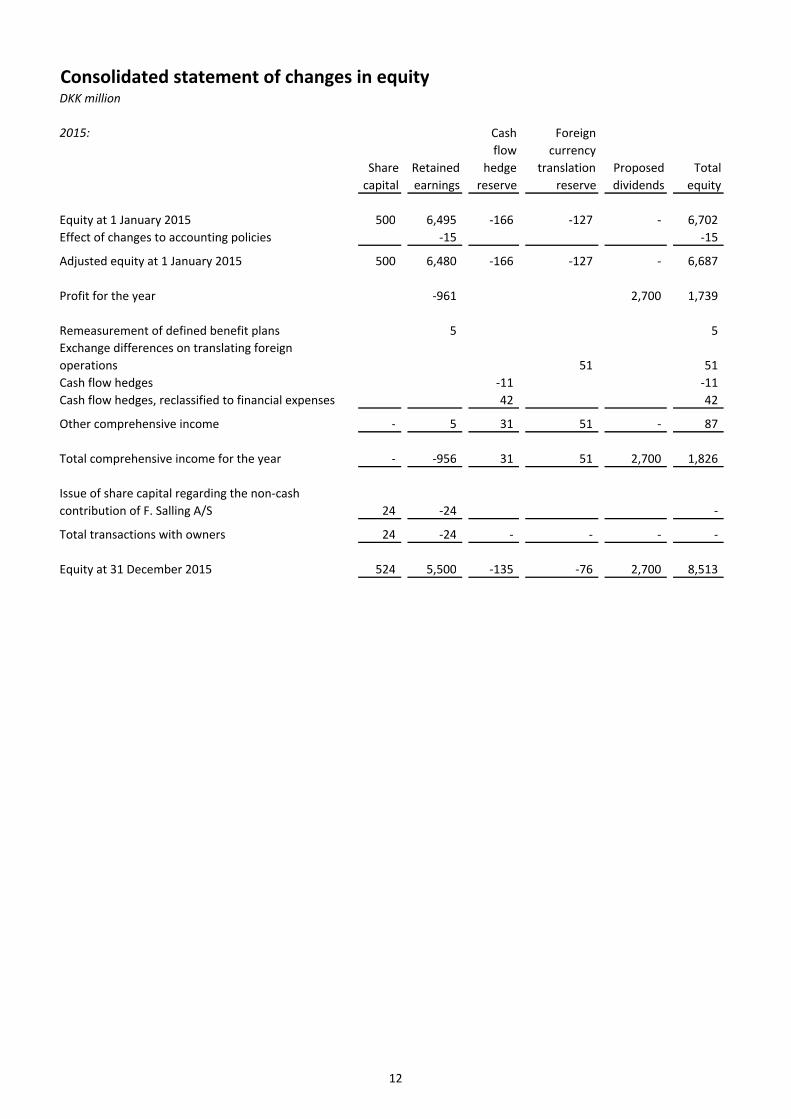
Consolidated statement of changes in equityDKK million
2015:
Share capital
Retained earnings
Cash flow
hedge reserve
Foreign currency
translation reserve
Proposed dividends
Total equity
Equity at 1 January 2015 500 6,495 -166 -127 - 6,702 Effect of changes to accounting policies -15 -15
Adjusted equity at 1 January 2015 500 6,480 -166 -127 - 6,687
Profit for the year -961 2,700 1,739
Remeasurement of defined benefit plans 5 5 Exchange differences on translating foreign operations 51 51 Cash flow hedges -11 -11 Cash flow hedges, reclassified to financial expenses 42 42
Other comprehensive income - 5 31 51 - 87
Total comprehensive income for the year - -956 31 51 2,700 1,826
Issue of share capital regarding the non-cash contribution of F. Salling A/S 24 -24 -
Total transactions with owners 24 -24 - - - -
Equity at 31 December 2015 524 5,500 -135 -76 2,700 8,513
12
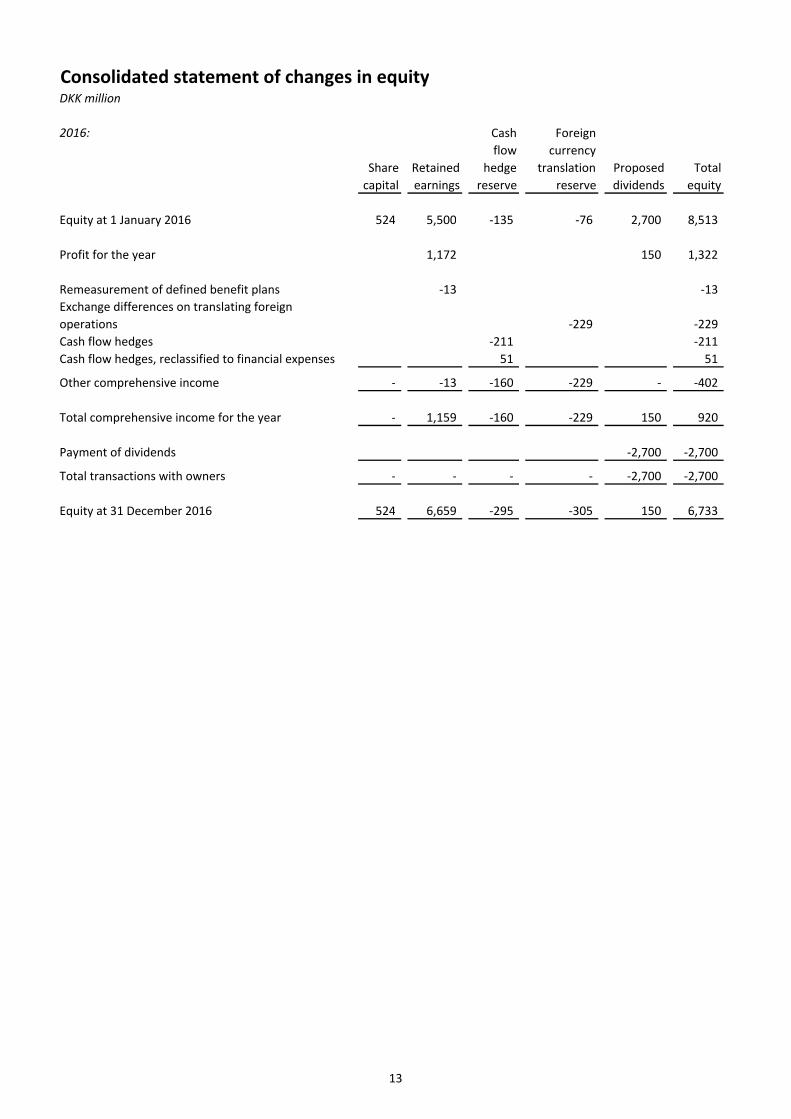
Consolidated statement of changes in equityDKK million
2016:
Share capital
Retained earnings
Cash flow
hedge reserve
Foreign currency
translation reserve
Proposed dividends
Total equity
Equity at 1 January 2016 524 5,500 -135 -76 2,700 8,513
Profit for the year 1,172 150 1,322
Remeasurement of defined benefit plans -13 -13 Exchange differences on translating foreign operations -229 -229 Cash flow hedges -211 -211 Cash flow hedges, reclassified to financial expenses 51 51
Other comprehensive income - -13 -160 -229 - -402
Total comprehensive income for the year - 1,159 -160 -229 150 920
Payment of dividends -2,700 -2,700
Total transactions with owners - - - - -2,700 -2,700
Equity at 31 December 2016 524 6,659 -295 -305 150 6,733
13
Summary of notes to the consolidated financial statements
1 General information2 Summary of significant accounting policies3 Significant accounting judgements, estimates and assumptions
Notes to the income statement
4 Total revenue5 Staff expenses6 External expenses7 Financial income8 Financial expenses9 Income tax
Notes to the balance sheet
10 Intangible assets11 Property, plant and equipment12 Investment property13 Investments in joint ventures14 Financial assets and financial liabilities15 Deferred tax16 Inventories17 Assets classified as held for sale18 Pensions19 Provisions
Notes to the cash flow statement
20 Adjustments 21 Change in working capital22 Acquisition of subsidiaries, net of cash received23 Cash and cash equivalents
Other notes
24 Contingent liabilities and other financial commitments25 Related party disclosures26 Business combinations27 Capital management28 Events after the reporting period29 Standards issued but not yet effective
14

Notes to the consolidated financial statementsDKK million
1 General information
2 Summary of significant accounting policies
Changes to accounting policies
The Danish Executive Order no. 560 of 1 June 2016 regarding the use of IFRSs for companies within the scope of the Danish Financial Statements Act has been implemented with effect as from 1 January 2016 resulting in the following change to recognition and measurement:
Development projects reserve: An amount equalling the amount being capitalised as development projects adjusted for the income tax effect must be recognised on an undistributable equity reserve in the separate parent company financial statements. The reserve cannot be used for dividends or for covering any deficits. When the development projects are sold or amortised the reserve is reduced accordingly by way of a transfer from the undistributable equity reserve to the distributable equity reserves. Thus, the undistributable equity reserve will not exceed the carrying amount of the development projects. Only amounts recognised as development projects as from 1 January 2016 are recognised on the undistributable equity reserve.
Dansk Supermarked Group's primary business area is retailing in Denmark through the physical stores Bilka, føtex, Netto and Salling and online with Bilka.dk, Salling.dk, føtex.dk, wupti.com and føtexdagligvarer.dk. Furthermore, the Group also operates franchises in Denmark including coffee shops Starbucks and the burger restaurants Carl’s Jr. In Germany, Poland and Sweden the subsidiaries in the Group operates through Netto. In UK Netto was reintroduced in 2014 through the establishment of a 50/50 joint venture with J Sainsbury PLC. During 2016 it was decided together with J Sainsbury plc. to end the joint venture as it has proven difficult to reach sufficient scale due to a lack of availability of appropriate sites.
Dansk Supermarked A/S is a public limited company with its registered office located at Rosbjergvej 33, 8220 Brabrand in Denmark.
The financial statements section of the annual report for the period 1 January – 31 December 2016 comprises the consolidated financial statements of Dansk Supermarked A/S and its subsidiaries (the Group) and the separate parent company financial statements.
The consolidated financial statements of Dansk Supermarked A/S and the separate parent company financial statements have been prepared in accordance with International Financial Reporting Standards (IFRS) as adopted by the EU and further Danish disclosure requirements for class C large enterprises.
In the financial year 2015, as at the 21 December 2015, the previous sister company F. Salling A/S became a subsidiary to Dansk Supermarked A/S by a non-cash contribution in which the share capital in Dansk Supermarked A/S was increased. The transaction was accounted for by the pooling of interests method in which comparative amounts were restated as if F. Salling A/S had always been a subsidiary.
A number of new, amended or revised International Financial Reporting Standards (including interpretations) issued by the International Accounting Standards Board and endorsed by the European Union have become effective on or after 1 January 2016. The Group has assessed the changes, and it has been concluded that the application of the changes has not had a material impact on the consolidated financial statements or the separate parent company financial statements in 2016, and no significant impact on future periods from the changes is expected.
15
Notes to the consolidated financial statementsDKK million
2 Summary of significant accounting policies - continued
Basis of preparation
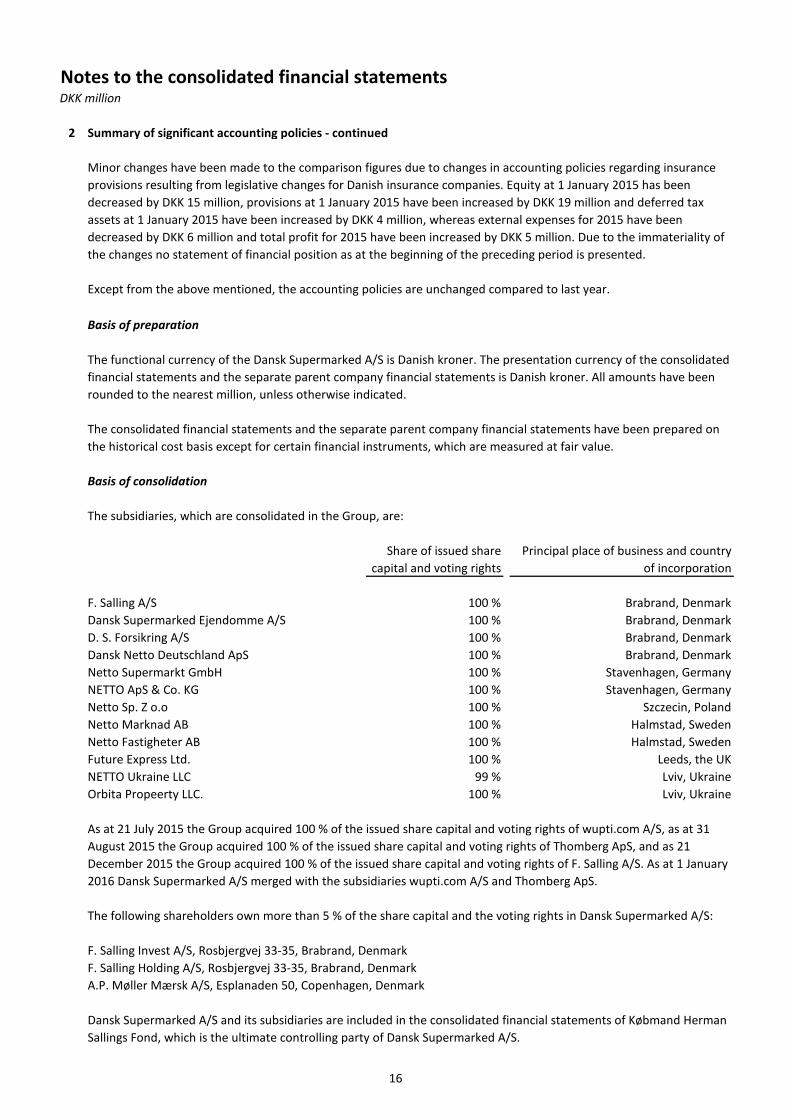
Basis of consolidation
F. Salling A/S 100 % Brabrand, DenmarkDansk Supermarked Ejendomme A/S 100 % Brabrand, DenmarkD. S. Forsikring A/S 100 % Brabrand, DenmarkDansk Netto Deutschland ApS 100 % Brabrand, DenmarkNetto Supermarkt GmbH 100 % Stavenhagen, GermanyNETTO ApS & Co. KG 100 % Stavenhagen, GermanyNetto Sp. Z o.o 100 % Szczecin, PolandNetto Marknad AB 100 % Halmstad, SwedenNetto Fastigheter AB 100 % Halmstad, SwedenFuture Express Ltd. 100 % Leeds, the UKNETTO Ukraine LLC 99 % Lviv, UkraineOrbita Propeerty LLC. 100 % Lviv, Ukraine
F. Salling Invest A/S, Rosbjergvej 33-35, Brabrand, DenmarkF. Salling Holding A/S, Rosbjergvej 33-35, Brabrand, DenmarkA.P. Møller Mærsk A/S, Esplanaden 50, Copenhagen, Denmark
The subsidiaries, which are consolidated in the Group, are:
Principal place of business and country of incorporation
The functional currency of the Dansk Supermarked A/S is Danish kroner. The presentation currency of the consolidated financial statements and the separate parent company financial statements is Danish kroner. All amounts have been rounded to the nearest million, unless otherwise indicated.
The consolidated financial statements and the separate parent company financial statements have been prepared on the historical cost basis except for certain financial instruments, which are measured at fair value.
Except from the above mentioned, the accounting policies are unchanged compared to last year.
Share of issued share capital and voting rights
Minor changes have been made to the comparison figures due to changes in accounting policies regarding insurance provisions resulting from legislative changes for Danish insurance companies. Equity at 1 January 2015 has been decreased by DKK 15 million, provisions at 1 January 2015 have been increased by DKK 19 million and deferred tax assets at 1 January 2015 have been increased by DKK 4 million, whereas external expenses for 2015 have been decreased by DKK 6 million and total profit for 2015 have been increased by DKK 5 million. Due to the immateriality of the changes no statement of financial position as at the beginning of the preceding period is presented.
As at 21 July 2015 the Group acquired 100 % of the issued share capital and voting rights of wupti.com A/S, as at 31 August 2015 the Group acquired 100 % of the issued share capital and voting rights of Thomberg ApS, and as 21 December 2015 the Group acquired 100 % of the issued share capital and voting rights of F. Salling A/S. As at 1 January 2016 Dansk Supermarked A/S merged with the subsidiaries wupti.com A/S and Thomberg ApS.
The following shareholders own more than 5 % of the share capital and the voting rights in Dansk Supermarked A/S:
Dansk Supermarked A/S and its subsidiaries are included in the consolidated financial statements of Købmand Herman Sallings Fond, which is the ultimate controlling party of Dansk Supermarked A/S.
16

Notes to the consolidated financial statementsDKK million
2 Summary of significant accounting policies - continued
Accounting policies, income statement
Revenue recognition
Cost of sales
Staff expenses
External expenses
Depreciation, amortisation and impairment losses
Government grants
Share of profit/loss of subsidiaries, net of tax
Staff expenses comprise wages and salaries, post-employment benefits as well as related expenses.
External expenses include direct and indirect costs related to rental and lease, franchise fees, operating expenses regarding investment properties, sales and distribution costs as well as office supplies, etc. Supplier discounts related to cost reimbursements are recognised as part of external expenses.
Depreciation, amortisation and impairment losses comprise depreciation on property, plant and equipment and investment property and amortisation of intangible assets, unless it is included in the carrying amount of another asset, as well as impairment losses.
Government grants are recognised where there is reasonable assurance that the grant will be received and all attached conditions will be complied with. When the grant relates to an expense item, it is recognised as a deduction of the related expense. When the grant relates to an asset, it is recognised as a deduction of the carrying amount of the asset, and is recognised in the income statement as a deduction of the related depreciation.
Investments in subsidiaries are measured in the parent company's statement of financial position using the equity method. The share of profit/loss of subsidiaries after elimination of unrealised gains and losses resulting from transactions between the parent company and the subsidiaries is recognised in the income statement.
Cost of sales comprises the costs incurred in generating revenue. Supplier discounts attributable to the purchase price of the sold articles are part of cost of sales.
Other revenue comprises rental revenue and revenue from other income sources e.g. sale of cardboard. Rental revenue arising from operating leases on buildings, investment properties and operating leases regarding in store rental is recognised on a straight-line basis over the lease terms, and is recognised in other revenue in the consolidated income statement.
Revenue is allocated between any customer loyalty programmes and the other components of the sale. The amount allocated to the customer loyalty programmes is deferred, and is recognised as revenue when the obligations to supply the discounted products are fulfilled or no longer probable.
Revenue is measured at the fair value of the consideration received or receivable taking into account the amount of any trade discounts, and excluding amounts collected on behalf of third parties such as sales taxes and value added taxes.
Revenue from the sale of goods is recognised when the significant risks and rewards of ownership of the goods have passed to the buyer, the revenue can be measured reliably, the consideration has been received or it is probable it will be received. Thus, revenue from the sale of goods is recognised at the point of sale in the store and for online purchases at collection in a store or a warehouse or delivery of goods.
In situations where Dansk Supermarked is acting as an agent the recognised revenue equals the amount of commission plus any other amounts received from the principal or other parties.
17
Notes to the consolidated financial statementsDKK million
2 Summary of significant accounting policies - continued
Share of profit/loss of joint ventures, net of tax
Financial income and expenses
Income tax
Accounting policies, statement of financial position
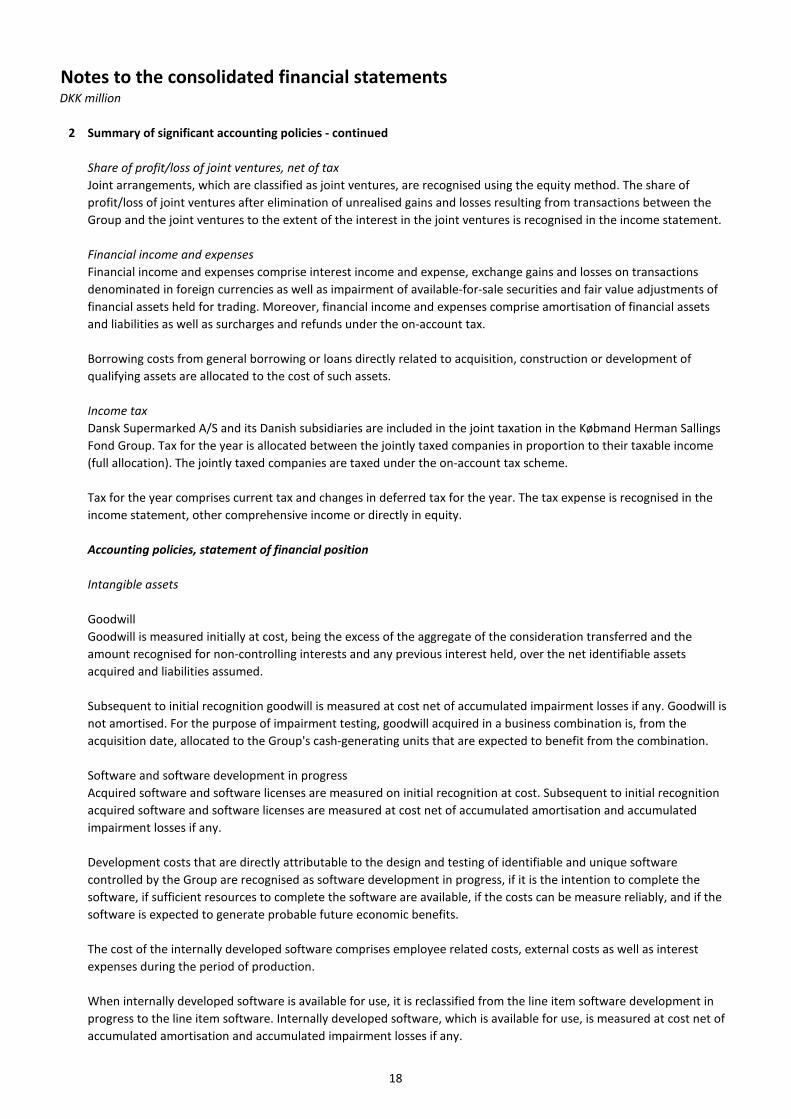
Intangible assets
Goodwill
Financial income and expenses comprise interest income and expense, exchange gains and losses on transactions denominated in foreign currencies as well as impairment of available-for-sale securities and fair value adjustments of financial assets held for trading. Moreover, financial income and expenses comprise amortisation of financial assets and liabilities as well as surcharges and refunds under the on-account tax.
Joint arrangements, which are classified as joint ventures, are recognised using the equity method. The share of profit/loss of joint ventures after elimination of unrealised gains and losses resulting from transactions between the Group and the joint ventures to the extent of the interest in the joint ventures is recognised in the income statement.
Tax for the year comprises current tax and changes in deferred tax for the year. The tax expense is recognised in the income statement, other comprehensive income or directly in equity.
Dansk Supermarked A/S and its Danish subsidiaries are included in the joint taxation in the Købmand Herman Sallings Fond Group. Tax for the year is allocated between the jointly taxed companies in proportion to their taxable income (full allocation). The jointly taxed companies are taxed under the on-account tax scheme.
Borrowing costs from general borrowing or loans directly related to acquisition, construction or development of qualifying assets are allocated to the cost of such assets.
Subsequent to initial recognition goodwill is measured at cost net of accumulated impairment losses if any. Goodwill is not amortised. For the purpose of impairment testing, goodwill acquired in a business combination is, from the acquisition date, allocated to the Group's cash-generating units that are expected to benefit from the combination.
The cost of the internally developed software comprises employee related costs, external costs as well as interest expenses during the period of production.
Software and software development in progressAcquired software and software licenses are measured on initial recognition at cost. Subsequent to initial recognition acquired software and software licenses are measured at cost net of accumulated amortisation and accumulated impairment losses if any.
Development costs that are directly attributable to the design and testing of identifiable and unique software controlled by the Group are recognised as software development in progress, if it is the intention to complete the software, if sufficient resources to complete the software are available, if the costs can be measure reliably, and if the software is expected to generate probable future economic benefits.
When internally developed software is available for use, it is reclassified from the line item software development in progress to the line item software. Internally developed software, which is available for use, is measured at cost net of accumulated amortisation and accumulated impairment losses if any.
Goodwill is measured initially at cost, being the excess of the aggregate of the consideration transferred and the amount recognised for non-controlling interests and any previous interest held, over the net identifiable assets acquired and liabilities assumed.
18
Notes to the consolidated financial statementsDKK million
2 Summary of significant accounting policies - continued
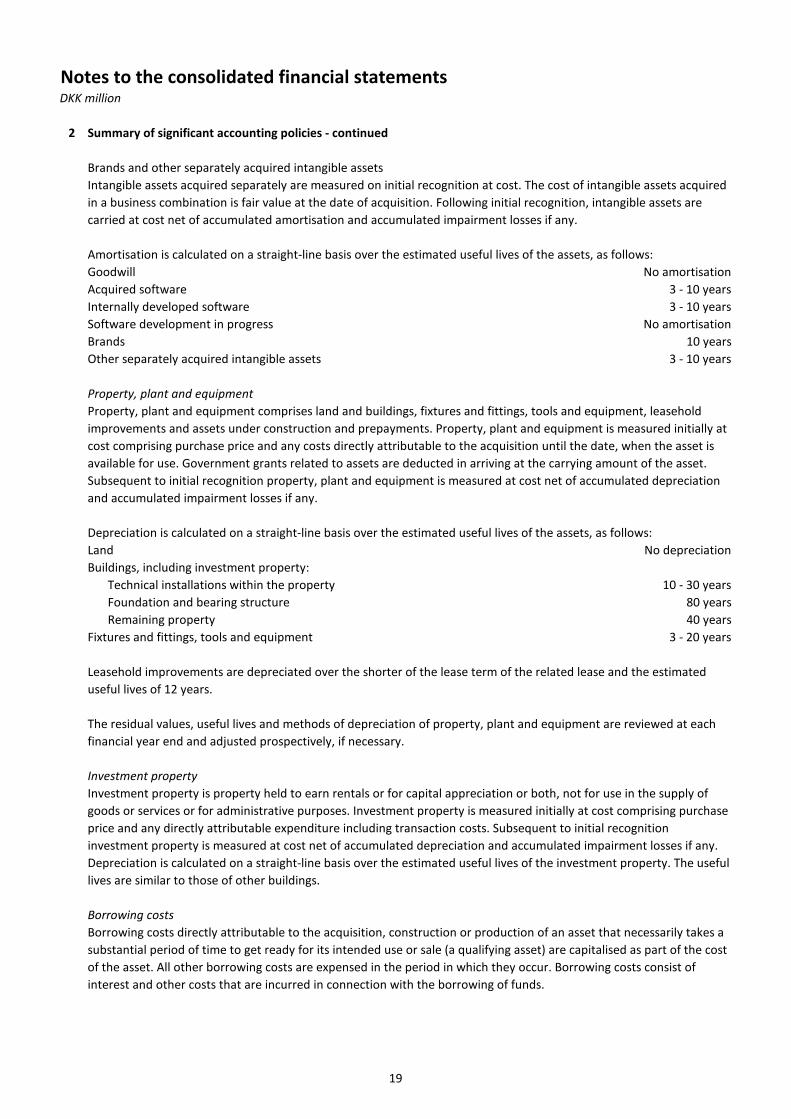
Brands and other separately acquired intangible assets
Goodwill No amortisationAcquired software 3 - 10 yearsInternally developed software 3 - 10 yearsSoftware development in progress No amortisationBrands 10 yearsOther separately acquired intangible assets 3 - 10 years
Property, plant and equipment
Land No depreciationBuildings, including investment property:
Technical installations within the property 10 - 30 yearsFoundation and bearing structure 80 yearsRemaining property 40 years
Fixtures and fittings, tools and equipment 3 - 20 years
Investment property
Borrowing costs
Leasehold improvements are depreciated over the shorter of the lease term of the related lease and the estimated useful lives of 12 years.
The residual values, useful lives and methods of depreciation of property, plant and equipment are reviewed at each financial year end and adjusted prospectively, if necessary.
Investment property is property held to earn rentals or for capital appreciation or both, not for use in the supply of goods or services or for administrative purposes. Investment property is measured initially at cost comprising purchase price and any directly attributable expenditure including transaction costs. Subsequent to initial recognition investment property is measured at cost net of accumulated depreciation and accumulated impairment losses if any. Depreciation is calculated on a straight-line basis over the estimated useful lives of the investment property. The useful lives are similar to those of other buildings.
Borrowing costs directly attributable to the acquisition, construction or production of an asset that necessarily takes a substantial period of time to get ready for its intended use or sale (a qualifying asset) are capitalised as part of the cost of the asset. All other borrowing costs are expensed in the period in which they occur. Borrowing costs consist of interest and other costs that are incurred in connection with the borrowing of funds.
Intangible assets acquired separately are measured on initial recognition at cost. The cost of intangible assets acquired in a business combination is fair value at the date of acquisition. Following initial recognition, intangible assets are carried at cost net of accumulated amortisation and accumulated impairment losses if any.
Amortisation is calculated on a straight-line basis over the estimated useful lives of the assets, as follows:
Property, plant and equipment comprises land and buildings, fixtures and fittings, tools and equipment, leasehold improvements and assets under construction and prepayments. Property, plant and equipment is measured initially at cost comprising purchase price and any costs directly attributable to the acquisition until the date, when the asset is available for use. Government grants related to assets are deducted in arriving at the carrying amount of the asset. Subsequent to initial recognition property, plant and equipment is measured at cost net of accumulated depreciation and accumulated impairment losses if any.
Depreciation is calculated on a straight-line basis over the estimated useful lives of the assets, as follows:
19

Notes to the consolidated financial statementsDKK million
2 Summary of significant accounting policies - continued
Investments in subsidiaries
Investments in joint ventures
Impairment testing of non-current assets
Non-current assets held for sale
Inventories
Trade receivables, securities and other financial assets
The Group classifies non-current assets as held for sale if their carrying amounts will be recovered principally through a sale transaction rather than through continuing use. Such non-current assets are measured at the lower of their carrying amount and fair value less costs to sell. The criteria for held for sale classification is regarded as met only when the sale is highly probable, the asset is available for immediate sale in its present condition and the sale is expected to occur within one year from the date of the classification. Non-current assets are not depreciated or amortised once classified as held for sale.
Financial assets are classified, at initial recognition, as financial assets at fair value through profit or loss, loans and receivables, held-to-maturity investments, available-for-sale financial assets, or as derivatives designated as hedging instruments in an effective hedge, as appropriate. All financial assets are recognised initially on the trading date at fair value plus, in the case of financial assets not recorded at fair value through profit or loss, transaction costs that are attributable to the acquisition of the financial asset.
Investments in joint ventures are measured in the statement of financial position using the equity method. The share of profit/loss of joint ventures, net of tax is recognised in the income statement.
Goodwill and software development in progress are tested annually. The carrying amount of other non-current assets is evaluated annually for indications of impairment.
If indications of impairment exist, tests are performed to determine whether recognition of impairment losses is necessary for individual assets as well as groups of assets. If the recoverable amount is lower than an asset's carrying amount, an impairment loss is recognised so that the carrying amount is reduced to the recoverable amount.
Net realisable value is the estimated selling price in the ordinary course of business less the estimated costs necessary to make the sale.
The recoverable amount is the higher value of an asset's net sales price and its value in use. The value in use is assessed as the present value of the expected net cash flow from utilisation of the asset or the group of assets and expected net cash flow from disposal of the asset or the group of assets after the end of the useful life.
Inventories are valued at the lower of calculated cost (weighted averages) and net realisable value.
Calculated cost comprises the purchase cost and other costs incurred in bringing the inventories to their present location and condition, which include cost of transportation from central warehouses to individual stores. Supplier discounts attributable to the articles in inventory reduce the calculated cost. Borrowing costs are not included in calculated cost.
Investments in subsidiaries are measured in the parent company's statement of financial position using the equity method. The share of profit/loss of subsidiaries, net of tax is recognised in the income statement.
20

Notes to the consolidated financial statementsDKK million
2 Summary of significant accounting policies - continued
Prepayments
Prepayments are measured at cost price.
Cash and short-term deposits
Equity - Development projects reserve
Pensions
Development projects reserve, which is recognised in the separate parent company financial statements, comprises an amount equalling the capitalised development projects excluding payments for separable assets e.g. software licenses, and adjusted for the income tax effect. The reserve is an undistributable equity reserve, and cannot be used for dividends or for covering any deficits. The reserve is reduced as the development projects are sold or amortised by way of a transfer from development projects reserve to the distributable equity reserves.
Subsequently financial assets at fair value through profit or loss are carried in the statement of financial position at fair value with net changes in fair value presented as finance costs (negative net changes in fair value) or finance income (positive net changes in fair value) in the income statement. Financial assets at fair value through profit or loss include financial assets held for trading and financial assets designated upon initial recognition at fair value through profit or loss. Financial assets are classified as held for trading if they are acquired for the purpose of selling or repurchasing in the near term. Derivatives, including separated embedded derivatives, are also classified as held for trading unless they are designated as effective hedging instruments.
Subsequently loans and receivables are measured at amortised cost less impairment. First it is assessed whether impairment exists individually for financial assets that are individually significant, or collectively for financial assets that are not individually significant. If it is determined that no objective evidence of impairment exists for an individually assessed financial asset, whether significant or not, the asset is included in a group of financial assets with similar credit risk characteristics and collectively assessed for impairment. Assets that are individually assessed for impairment and for which an impairment loss is, or continues to be, recognised are not included in a collective assessment of impairment. The amount of any impairment loss identified is measured as the difference between the asset's carrying amount and the present value of estimated future cash flows. The losses arising from impairment are recognised in an allowance account and in the income statement in finance costs for loans and in external expenses for receivables. This category is the most relevant to the Group. Loans and receivables are non-derivative financial assets with fixed or determinable payments that are not quoted in an active market. This category generally applies to trade and other receivables.
For defined benefit plans an annual actuarial calculation (Projected Unit Credit method) is made of the present value of future benefits under the defined benefit plan. The present value is determined on the basis of assumptions about the future development in variables such as salary levels, interest rates, inflation, retirement age and mortality. The actuarial present value is recognised in the statement of financial position under pension obligations. Pension costs for the year are recognised in the income statement based on actuarial estimates at the beginning of the year. Any difference between the calculated development in plan liabilities and realised amounts determined at year end constitutes actuarial gains or losses and is recognised in other comprehensive income.
Cash and short-term deposits in the statement of financial position comprise cash at banks and on hand and short-term deposits.
The Group has entered into defined contribution pension schemes and similar arrangements with the majority of the Group's employees. Contributions to defined contribution plans where the Group pays fixed pension payments to independent pension funds are recognised in the income statement in the period to which they relate, and any contributions outstanding are recognised in the statement of financial position as other payables.
21

Notes to the consolidated financial statementsDKK million
2 Summary of significant accounting policies - continued
Provisions
Loans, trade payables and other financial liabilities
Deferred income
Taxes
Financial liabilities are classified, at initial recognition, as financial liabilities at fair value through profit or loss, loans, borrowings and payables, or as derivatives designated as hedging instruments in an effective hedge, as appropriate. All financial liabilities are recognised initially at fair value and, in the case of loans, borrowings and payables, net of directly attributable transaction costs. The Group's financial liabilities include trade and other payables, loans and borrowings and derivative financial instruments.
Subsequently financial liabilities at fair value through profit or loss are carried in the statement of financial position at fair value with net changes in fair value presented as finance items in the income statement. Financial liabilities at fair value through profit or loss include financial liabilities held for trading and financial liabilities designated upon initial recognition as at fair value through profit or loss. Financial liabilities are classified as held for trading if they are incurred for the purpose of repurchasing in the near term. This category also includes derivative financial instruments entered into by the Group that are not designated as hedging instruments in hedge relationships. Separated embedded derivatives are also classified as held for trading unless they are designated as effective hedging instruments. The Group has not designated any financial liability as at fair value through profit or loss.
After initial recognition, interest-bearing loans, borrowings and payables are measured at amortised cost. Accordingly, any difference between the proceeds and the nominal value is recognised in the income statement as finance costs over the term of the loan. This category is most relevant to the Group. This category generally applies to interest-bearing loans, borrowings, payables and the capitalised residual lease obligation under finance leases.
A provision for onerous lease contracts is recognised when the expected benefits to be obtained by the Group from a contract are lower than the unavoidable costs of meeting its obligations under the contract.
Deferred income is measured at the consideration received or receivable.
Current income tax assets and liabilities are measured at the amount expected to be recovered from or paid to the taxation authorities. The tax rates and tax laws used to compute the amount are those that are enacted or substantively enacted at the reporting date. Current income tax relating to items recognised directly in equity is recognised in equity and not in the income statement or the statement of other comprehensive income.
Provisions are recognised when, as a result of past events, the Group has a legal or a constructive obligation and it is probable that there will be an outflow of resources embodying economic benefits to settle the obligation. The amount recognised as a provision is Management's best estimate of the expenses required to settle the obligation. On measurement of provisions, the costs required to settle the obligation are discounted if the effect is material to the measurement of the obligation.
Other provisions include among other things warranties, restructuring costs and jubilee benefits. Provisions for warranty-related costs are recognised upon a sale of a product for which the Group is liable for future warranty costs. Initial recognition is based on historical experience. The initial estimate of warranty-related costs is revised annually. Restructuring costs are recognised under liabilities when a detailed, formal restructuring plan has been announced to the parties affected no later than at the end of the reporting period.
Insurance provisions include the actuarial estimated costs expected to be paid by the Group for insured events existing at the reporting date and risk margin. The estimate includes amounts expected to be incurred for the settlement of the obligations. Discounting is performed based on an estimate of the expected payment period.
22

Notes to the consolidated financial statementsDKK million
2 Summary of significant accounting policies - continued
Accounting policies, cash flow statement
Accounting policies, other
Consolidated financial statements
Deferred tax is provided using the liability method on temporary differences between the tax bases of assets and liabilities and their carrying amounts for financial reporting purposes at the reporting date.
The consolidated financial statements comprise the parent company Dansk Supermarked A/S and the subsidiaries in which Dansk Supermarked A/S directly or indirectly exercises control. Dansk Supermarked A/S exercises control if Dansk Supermarked A/S is exposed to or has rights to variable returns arising from its involvement in a company and may affect these returns through its power over the company.
Cash flows in other currencies than the functional currency are translated using average exchange rates unless these deviate significantly from the rate at the transaction date.
Deferred tax liabilities are recognised for all taxable temporary differences, and deferred tax assets are recognised for all deductible temporary differences, the carry forward of unused tax credits and any unused tax losses. Deferred tax assets are recognised to the extent that it is probable that taxable profit will be available against which the deductible temporary differences, and the carry forward of unused tax credits and unused tax losses can be utilised. The carrying amount of deferred tax assets is reviewed at each reporting date and reduced to the extent that it is no longer probable that sufficient taxable profit will be available to allow all or part of the deferred tax asset to be utilised. Unrecognised deferred tax assets are re-assessed at each reporting date and are recognised to the extent that it has become probable that future taxable profits will allow the deferred tax asset to be recovered. Deferred tax assets and liabilities are measured at the tax rates that are expected to apply in the year when the asset is realised or the liability is settled, based on tax rates (and tax laws) that have been enacted or substantively enacted at the reporting date. Deferred tax relating to items recognised outside the income statement is recognised outside the income statement. Deferred tax items are recognised in correlation to the underlying transaction either in the statement of other comprehensive income or directly in equity.
The consolidated financial statements are prepared based on the accounts for the parent company and the subsidiaries and are a pooling of the accounting items of similar nature. On consolidation intra-group transactions are eliminated.
Cash flows from financing activities comprise changes in the size or composition of share capital and related costs as well as the raising of loans, repayment of interest-bearing debt, and payment of dividends to shareholders.
Cash flows from investing activities comprise payments in connection with acquisitions and disposals of businesses and of intangible assets, property, plant and equipment, investment property and other non-current assets as well as acquisition and disposal of securities not classified as cash and cash equivalents.
Cash flows from operating activities are calculated according to the indirect method as the profit before tax adjusted for non-cash operating items, changes in working capital, interest payments and income taxes paid.
The cash flow effect of acquisitions and disposals of enterprises is shown separately in cash flows from investing activities. Cash flows from acquired businesses are recognised in the cash flow statement from the date of acquisition. Cash flows from disposals of businesses are recognised up until the date of disposal.
The cash flow statement shows the cash flows from operating, investing and financing activities for the year, the year's changes in cash and cash equivalents as well as cash and cash equivalents at the beginning and end of the year.
23

Notes to the consolidated financial statementsDKK million
2 Summary of significant accounting policies - continued
Foreign currency translation
On initial recognition, foreign currency transactions are translated to the functional currency at the exchange rates at the transaction date. Foreign exchange differences arising between the exchange rates at the transaction date and at the date of payment are recognised in the income statement as finance income or finance costs.
Joint arrangements are activities or enterprises in which the Group exercises control through cooperation agreements with one or more parties. Joint control implies that decisions on relevant activities require unanimous consent of the parties sharing control over the arrangement. Joint arrangements are classified as joint ventures or joint operations. Joint operations are activities where the participants have direct rights over assets and are subject to direct liability, whereas joint ventures are activities where the participants solely have rights over the net assets.
For each of the enterprises in the Group, a functional currency is determined. The functional currency is the currency used in the primary financial environment in which the enterprise operates. Transactions denominated in other currencies than the functional currency are foreign currency transactions.
Receivables and payables and other monetary items denominated in foreign currencies are translated to the functional currency at the exchange rates at the reporting date. The difference between the exchange rates at the reporting date and at the date at which the receivable or payable arose or the rates in the latest annual report is recognised in profit or loss as finance income or finance costs.
Foreign consolidated enterprises' statements of financial position are translated to Danish kroner at the exchange rates at the reporting date, while the enterprises' income statements and the statement of other comprehensive income are translated to the average exchange rates.
Foreign exchange differences arising on translation of the opening equity of such foreign enterprises at the exchange rates at the reporting date and on translation of the income statements and the statement of other comprehensive income from the exchange rates at the transaction date to the exchange rates at the reporting date are recognised in other comprehensive income and in a separate translation reserve under equity.
Goodwill is initially measured at cost, being the excess of the aggregate of the consideration transferred and the amount recognised for non-controlling interests, and any previous interest held, over the net identifiable assets acquired and liabilities assumed. After initial recognition, goodwill is measured at cost less any accumulated impairment losses. For the purpose of impairment testing, goodwill acquired in a business combination is, from the acquisition date, allocated to each of the Group's cash-generating units that are expected to benefit from the combination, irrespective of whether other assets or liabilities of the acquiree are assigned to those units.
Business combinations of entities under common control are accounted for using the pooling of interests method, and the comparative figures are restated.
Business combinations are accounted for using the acquisition method, according to which the identifiable assets and liabilities acquired are measured at their fair values at the date of acquisition. If the business combination is achieved in stages, any previously held equity interest is remeasured at its acquisition date fair value and any resulting gain or loss is recognised in the income statement. Any contingent consideration to be transferred by the acquirer will be recognised at fair value at the acquisition date.
24
Notes to the consolidated financial statementsDKK million
2 Summary of significant accounting policies - continued
Derivative financial instruments
Fair value measurement
The Group determines whether transfers have occurred between levels in the hierarchy by re-assessing categorisation (based on the lowest level input that is significant to the fair value measurement as a whole) at the end of each reporting period.
The Group uses the fair value concept in connection with certain disclosure requirements and for recognition of some financial instruments. Fair value is defined as the price that would be received to sell an asset or paid to transfer a liability in an orderly transaction between market participants ("exit price").
Derivative financial instruments are initially recognised in the statement of financial position on the trading date at cost and are subsequently measured at fair value. Changes in the fair value of derivative financial instruments designated as and qualifying for recognition as a cash flow hedge are recognised in other comprehensive income, and are reclassified to the income statement in the periods when the hedged item affects the income statement. Changes in the fair value of other derivative financial instruments are recognised in the income statement. The positive and negative fair values of derivative financial instruments are included in other financial assets or other financial liabilities, respectively.
The fair value measurement is based on the primary market. If a primary market does not exist, the measurement is based on the most favourable market, which is the market that maximises the price of the asset or liability less transaction and transportation costs.
To the widest possible extent, the fair value measurement is based on market values in active markets (level 1) or alternatively on values derived from observable market information (level 2). If such observable information is not available or cannot be used without significant modifications, fair values are based on generally accepted valuation methods and reasonable estimates (level 3).
The fair value is a market-based and not an entity-specific valuation. The Group uses the assumptions that the market participants would use for the pricing of the asset or liability based on existing market conditions, including assumptions relating to risks. The Group's intention to own the asset or settle the liability is thus not taken into consideration when the fair value is determined.
25
Notes to the consolidated financial statementsDKK million
3 Significant accounting judgements, estimates and assumptions
Valuation of intangible assets, property, plant and equipment and investment property
Provisions have been made for onerous contracts, insurance, warranties, jubilee benefits and pending lawsuits. These provisions are Management's best estimates and the actual costs and timing of future cash flows are dependent on future events. Any difference between expectations and the actual future liability will be recognised in the period when information about the actual liability becomes available.
Depreciation and amortisation
Inventories
Provisions
In the process of applying the accounting policies, management has made the following judgements, estimates and assumptions, which have the most significant effect on the amounts recognised in the financial statements:
Intangible assets, property, plant and equipment and investment property are tested for impairment if there is an indication of impairment. For goodwill and intangible asset that are not yet in use annual impairment tests are carried out. An impairment loss is recognised if the recoverable amount of an asset is lower than the asset's carrying amount. The recoverable amount is the higher of fair value less costs of disposal and value in use. The fair value less costs of disposal calculation is based on available data from binding sales transactions, conducted at arm's length, for similar assets or observable market prices less incremental costs for disposing of the asset. The value in use calculation is based on a DCF model. The cash flows are derived from the long-term plans. The recoverable amount is sensitive to the discount rate used for the DCF model as well as the development in turnover and gross margins during the forecast period and the growth rate used for extrapolation purposes. For most intangible assets no fair value less costs of disposal exists. The key assumptions used to determine the recoverable amount are disclosed and further explained in the relevant notes.
The useful lives and residual values of intangible assets, property, plant and equipment and investment property are reviewed annually based on available information. If necessary they are adjusted prospectively. Changes to estimates of useful lives and residual values may affect the annual depreciation and amortisation and thereby the results for the year significantly.
Inventories are valued at the lower of calculated cost (weighted averages) and net realisable value. The calculated cost comprises supplier discounts. Supplier discounts are recognised when it is probable that the economic benefits associated with the transaction will flow to the Group. A specific assessment of the need for write-down for obsolescence of inventories is made based on the future sales potential.
The preparation of financial statements requires management to make judgements, estimates and assumptions that affect the reported amounts of revenues, expenses, assets and liabilities, and the accompanying disclosures, and the disclosure of contingent liabilities. Uncertainty about these assumptions and estimates could result in outcomes that require a material adjustment to the carrying amount of assets or liabilities affected in future periods.
26

Notes to the consolidated financial statementsDKK million
2016 2015
4 Total revenue
Revenue from the sale of goods 57,582 57,148
Total net revenue 57,582 57,148
Rental revenue, investment property 94 105 Other rental 137 150 Other revenue 86 71
Total other revenue 317 326
Total revenue 57,899 57,474
Geographical split
Denmark 40,771 40,235 Abroad 17,128 17,239
Total revenue 57,899 57,474
5 Staff expenses
Wages and salaries incl. termination benefits 6,118 6,037 Post-employment benefits – defined contribution plans 358 354 Post-employment benefits – defined benefit plans 3 3 Social security costs 413 392
Total staff expenses 6,892 6,786
Average number of full-time employees 26,568 26,119
6 External expenses
Fees paid to the auditors appointed at the annual general meeting:
Fee regarding statutory audit 2.4 2.8 Tax assistance 0.6 0.8 Assurance engagements 0.3 0.3 Other assistance 1.0 1.6
Total fee paid to the auditors appointed at the annual general meeting 4.3 5.5
7 Financial income
Interest income on loans and receivables 7 5 Net gain on derivatives not designated as hedges 17 - Net gain on financial instruments held for trading 57 20 Net foreign exchange gain 34 60
Total financial income 115 85
27
Notes to the consolidated financial statementsDKK million
2016 2015
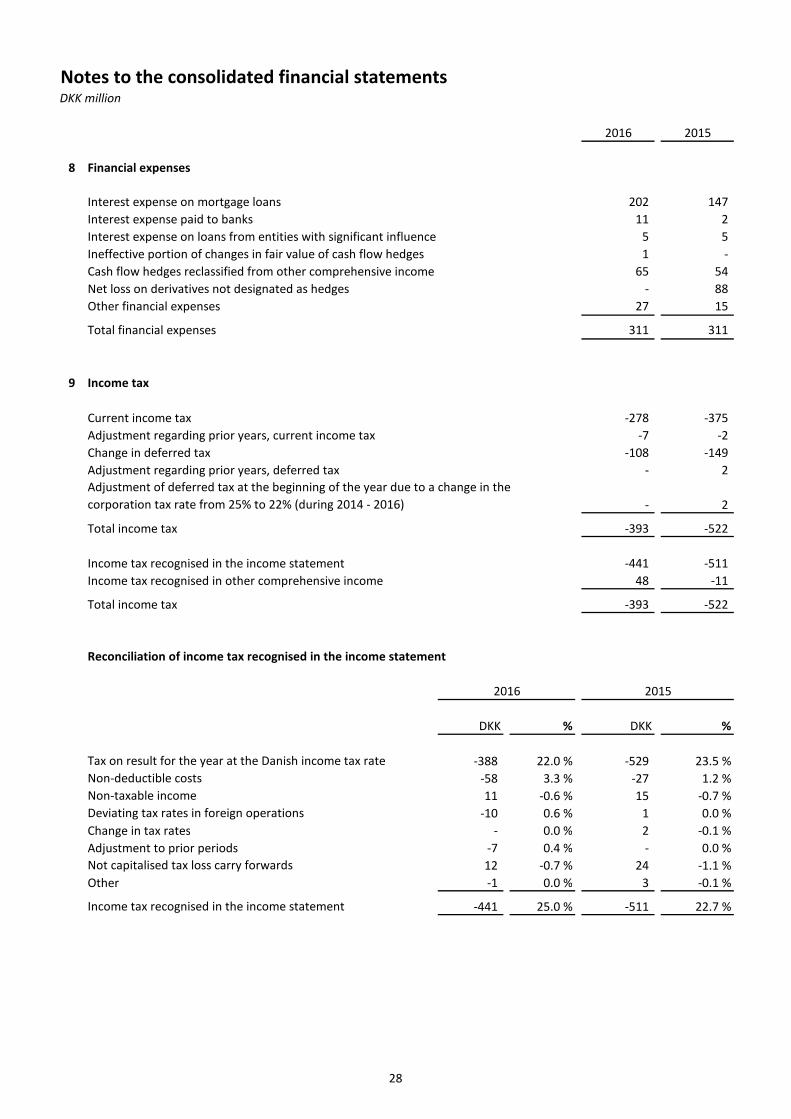
8 Financial expenses
Interest expense on mortgage loans 202 147 Interest expense paid to banks 11 2 Interest expense on loans from entities with significant influence 5 5
1 - 65 54
- 88 Other financial expenses 27 15
Total financial expenses 311 311
9 Income tax
Current income tax -278 -375 Adjustment regarding prior years, current income tax -7 -2 Change in deferred tax -108 -149 Adjustment regarding prior years, deferred tax - 2
- 2
Total income tax -393 -522
Income tax recognised in the income statement -441 -511 Income tax recognised in other comprehensive income 48 -11
Total income tax -393 -522
Reconciliation of income tax recognised in the income statement
DKK % DKK %
-388 22.0 % -529 23.5 %-58 3.3 % -27 1.2 %11 -0.6 % 15 -0.7 %
-10 0.6 % 1 0.0 %Change in tax rates - 0.0 % 2 -0.1 %Adjustment to prior periods -7 0.4 % - 0.0 %
12 -0.7 % 24 -1.1 %Other -1 0.0 % 3 -0.1 %
-441 25.0 % -511 22.7 %
Net loss on derivatives not designated as hedges
Ineffective portion of changes in fair value of cash flow hedges
Adjustment of deferred tax at the beginning of the year due to a change in the corporation tax rate from 25% to 22% (during 2014 - 2016)
Not capitalised tax loss carry forwards
Income tax recognised in the income statement
Tax on result for the year at the Danish income tax rate
2015
Deviating tax rates in foreign operations
Non-deductible costs
2016
Cash flow hedges reclassified from other comprehensive income
Non-taxable income
28

Notes to the consolidated financial statementsDKK million
9 Income tax - continued
Tax on other comprehensive income
Before tax Tax Net of tax Before tax Tax Net of tax
Remeasurement of defined benefit plans -17 4 -13 6 -1 5 Exchange differences on translating foreign operations -229 - -229 51 - 51 Cash flow hedges, value adjustment for the year -269 58 -211 -13 2 -11 Cash flow hedges, reclassified to financial expenses 65 -14 51 54 -12 42
-450 48 -402 98 -11 87
10 Intangible assets
2015:
Goodwill Software
Software develop-ment in
progress Brands
Other in- tangible
assets Total
CostBalance at 1 January 2015 58 1,446 28 - 10 1,542 Additions - - 184 - 2 186 Acquisitions through business combinations 252 24 - 76 - 352 Reclassifications - 58 -54 - - 4
Balance at 31 December 2015 310 1,528 158 76 12 2,084
Accumulated amortisation and impairment lossesBalance at 1 January 2015 - -357 - - -2 -359 Amortisation - -142 - -3 -2 -147
Balance at 31 December 2015 - -499 - -3 -4 -506
Carrying amount at 31 December 2015 310 1,029 158 73 8 1,578
2016 2015
29

Notes to the consolidated financial statementsDKK million
10 Intangible assets - continued
2016:
Goodwill Software
Software develop-ment in
progress Brands
Other in- tangible
assets Total
CostBalance at 1 January 2016 310 1,528 158 76 12 2,084 Additions - 26 135 - 4 165 Adjustments, acquisitions through business combinations -1 - - - - -1 Reclassifications - 141 -148 - - -7 Disposals - -14 - - - -14
Balance at 31 December 2016 309 1,681 145 76 16 2,227
Accumulated amortisation and impairment lossesBalance at 1 January 2016 - -499 - -3 -4 -506 Amortisation - -158 - -8 -3 -169 Disposals - 3 - - - 3
Balance at 31 December 2016 - -654 - -11 -7 -672
Carrying amount at 31 December 2016 309 1,027 145 65 9 1,555
Impairment losses during the year
Carrying amount of goodwill within the Group:
2016 2015 2016 2015 2016 2015
Goodwill 178 179 91 91 40 40
Goodwill
For impairment testing goodwill acquired through business combinations are allocated to the cash generating units that benefit from the synergies resulting from the acquisitions.
Danish retail activities
The recoverable amount of the goodwill related to e-commerce and the Danish retail activities has been determined based on a value in use calculation using cash flow projections from the financial five-year plan approved by management. The pre-tax discount rate applied to cash flow projections is 10 %, and cash flows beyond the five-year period are extrapolated using a 2 % growth rate which is the expected long-term inflation rate. As a result of the impairment test management did not identify any impairment losses regarding goodwill (DKK 0 in 2015).
e-commerce Other
The most significant goodwill amounts in the Group relate to the e-commerce and the Danish retail activities.
30

Notes to the consolidated financial statementsDKK million
10 Intangible assets - continued
11 Property, plant and equipment
The calculation of value in use is most sensitive to the following key assumptions: Development in turnover and gross margins during the forecast period and growth rates used to extrapolate cash flows beyond the forecast period, as well as the the discount rate used. Development in turnover and gross margins are based on expectations to an average growth for 2017 -2021 within e-commerce.
Discount rates represent the current market assessment of the risks, taking into consideration the time value of money and individual risks of the underlying assets that have not been incorporated in the cash flow estimates. The discount rate calculation is based on the specific circumstances of the Group and is derived from its weighted average cost of capital (WACC). The WACC takes into account both debt and equity. The cost of equity is derived from the expected return on investment by the Group's investors. The cost of debt is based on the interest-bearing borrowings the Group is obliged to service. The beta factors are evaluated annually based on publicly available market data. Adjustments to the discount rate are made to factor in the specific amount and timing of the future tax flows in order to reflect a pre-tax discount rate.
Increasing purchase prices would lead to a decline in gross margin. A decrease in gross margin of approximately 3 %-points would result in an impairment loss in the Dansk Supermarked Group in relation to e-commerce if cost within marketing, staff etc. could not be readjusted.
2015:
Land and buildings
Fixtures and fittings, tools
and equipment
Leasehold improve-
mentsAssets under construction Total
CostBalance at 1 January 2015 23,566 4,681 1,122 146 29,515 Foreign currency translation 67 14 6 - 87 Additions 53 445 45 369 912 Reclassifications 421 5 4 -434 -4 Disposals -52 -136 -32 - -220
Balance at 31 December 2015 24,055 5,009 1,145 81 30,290
Accumulated depreciation and impairment lossesBalance at 1 January 2015 -7,409 -3,296 -816 - -11,521 Foreign currency translation -10 -10 -4 - -24 Depreciation -302 -321 -37 - -660 Impairment losses recognised in the income statement -13 -1 -3 - -17 Disposals 32 136 24 - 192
Balance at 31 December 2015 -7,702 -3,492 -836 - -12,030
Carrying amount at 31 December 2015 16,353 1,517 309 81 18,260
Hereof finance leases - 5 - - 5
31
Notes to the consolidated financial statementsDKK million
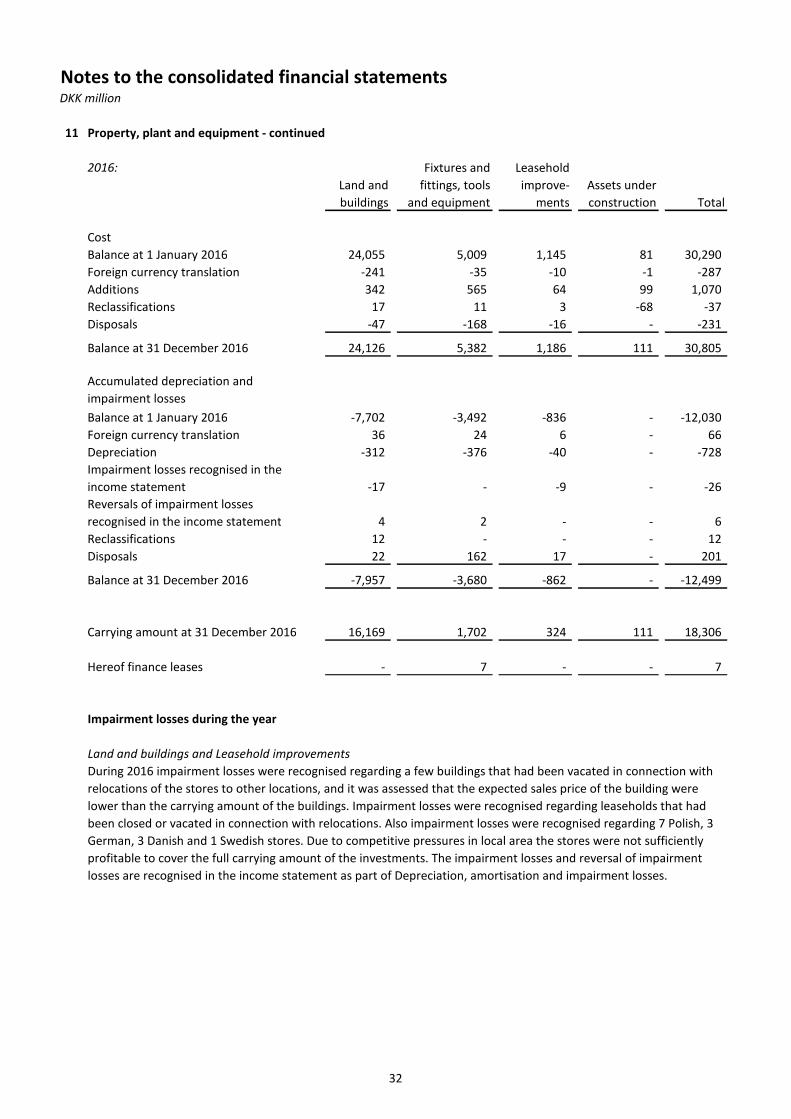
11 Property, plant and equipment - continued
Impairment losses during the year
Land and buildings and Leasehold improvements
During 2016 impairment losses were recognised regarding a few buildings that had been vacated in connection with relocations of the stores to other locations, and it was assessed that the expected sales price of the building were lower than the carrying amount of the buildings. Impairment losses were recognised regarding leaseholds that had been closed or vacated in connection with relocations. Also impairment losses were recognised regarding 7 Polish, 3 German, 3 Danish and 1 Swedish stores. Due to competitive pressures in local area the stores were not sufficiently profitable to cover the full carrying amount of the investments. The impairment losses and reversal of impairment losses are recognised in the income statement as part of Depreciation, amortisation and impairment losses.
2016:
Land and buildings
Fixtures and fittings, tools
and equipment
Leasehold improve-
mentsAssets under construction Total
CostBalance at 1 January 2016 24,055 5,009 1,145 81 30,290 Foreign currency translation -241 -35 -10 -1 -287 Additions 342 565 64 99 1,070 Reclassifications 17 11 3 -68 -37 Disposals -47 -168 -16 - -231
Balance at 31 December 2016 24,126 5,382 1,186 111 30,805
Accumulated depreciation and impairment lossesBalance at 1 January 2016 -7,702 -3,492 -836 - -12,030 Foreign currency translation 36 24 6 - 66 Depreciation -312 -376 -40 - -728 Impairment losses recognised in the income statement -17 - -9 - -26 Reversals of impairment losses recognised in the income statement 4 2 - - 6 Reclassifications 12 - - - 12 Disposals 22 162 17 - 201
Balance at 31 December 2016 -7,957 -3,680 -862 - -12,499
Carrying amount at 31 December 2016 16,169 1,702 324 111 18,306
Hereof finance leases - 7 - - 7
32

Notes to the consolidated financial statementsDKK million
2016 2015
12 Investment property
CostBalance at 1 January 1,324 1,477 Foreign currency translation -1 1 Additions 4 21 Reclassifications 43 - Reclassified as held for sale -22 -77 Disposals -26 -98
Balance at 31 December 1,322 1,324
Accumulated depreciation and impairment lossesBalance at 1 January -905 -988 Foreign currency translation 1 - Depreciation -9 -8 Reclassified as held for sale 16 41 Disposals 15 50 Impairment losses recognised in the income statement -3 - Reclassifications -13 -
Balance at 31 December -898 -905
Carrying amount at 31 December 424 419
Rental income from investment property 94 105 -31 -17
-3 -4
Profit arising from investment property 60 84
Direct operating expenses from investment that did not generate rental income
The estimated fair value of investment property amounted to DKK 1,610 million at 31 December 2016 (DKK 1,573 million at 31 December 2015). The fair value is not based on a valuation by an independent valuer.
Investment property comprises shopping centres and flats located adjacent to Dansk Supermarked's stores.
Direct operating expenses from investment that generated rental income
The fair value of the investment property falls within level 3 of the fair value hierarchy. The fair value is based on a rate of return compared with a price per square metre. The rate of return is based on experience with real estate deals.
33

Notes to the consolidated financial statementsDKK million
2016 2015
13 Investments in joint ventures
CostBalance at 1 January 221 74 Additions 203 147
Balance at 31 December 424 221
Value adjustmentsBalance at 1 January -108 -30 Dividends -44 - Foreign currency translation etc. -35 4 Result -205 -82
Balance at 31 December -392 -108
Carrying amount at 31 December 32 113
Specification of investments in joint ventures:
Netto UK Ltd. 50 %
14 Financial assets and financial liabilities
Financial assets comprise the following:
2016 2015 2016 2015
Cash flow hedges - 12 - 12
Other non-current financial assets - 12 - 12
Trade receivables 204 111 204 111
Other receivables 500 495 500 495
Receivables from entities with significant influence - 14 - 14 Receivables from joint ventures - 15 - 15 Derivatives not designated as hedges 5 1 5 1
Other current financial assets 5 30 5 30
Securities 4,718 4,304 4,718 4,304
Cash and short-term deposits 1,118 1,689 1,118 1,689
Wakefield, the UK
In 2014 Dansk Supermarked A/S and J Sainsbury plc formed a joint venture with the purpose of bringing the Netto brand back to the UK. During 2016 it was decided together with J Sainsbury plc. to end the joint venture as it proved difficult to reach sufficient scale due to a lack of availability of appropriate sites.
Carrying amount Fair value
Share of issued share capital and voting rights
Principal place of business and country of incorporation
34
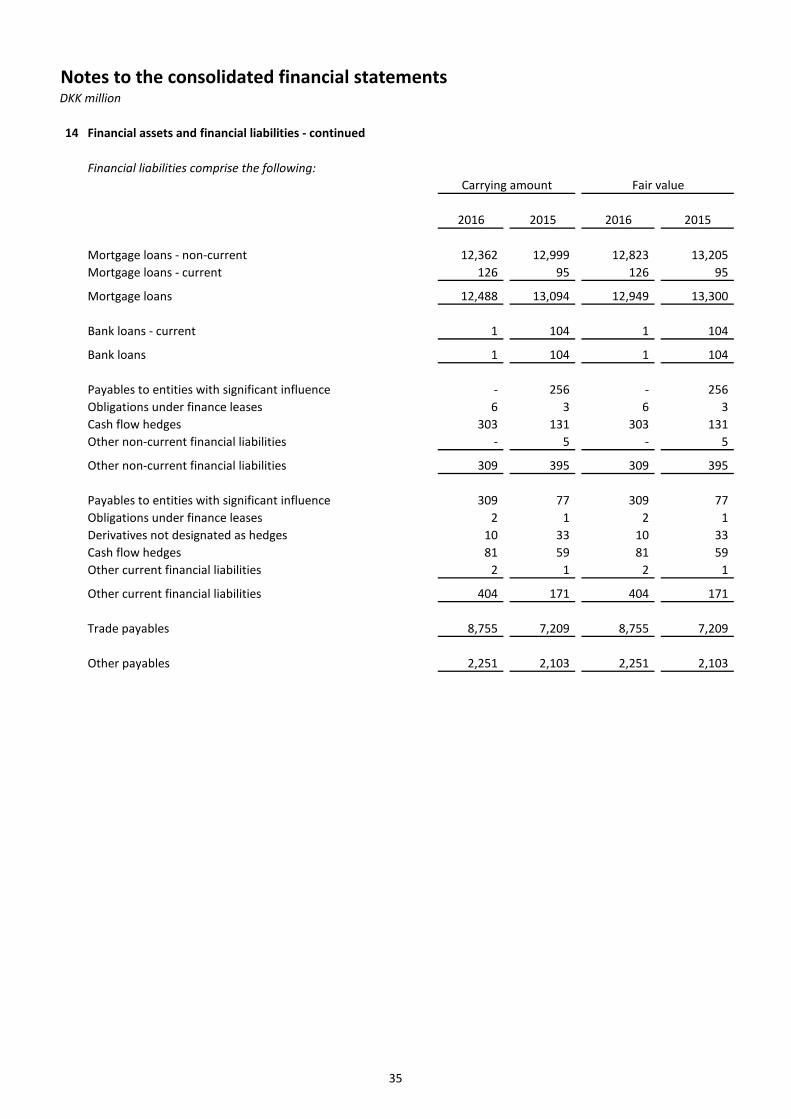
Notes to the consolidated financial statementsDKK million
14 Financial assets and financial liabilities - continued
Financial liabilities comprise the following:
2016 2015 2016 2015
Mortgage loans - non-current 12,362 12,999 12,823 13,205 Mortgage loans - current 126 95 126 95
Mortgage loans 12,488 13,094 12,949 13,300
Bank loans - current 1 104 1 104
Bank loans 1 104 1 104
Payables to entities with significant influence - 256 - 256 Obligations under finance leases 6 3 6 3 Cash flow hedges 303 131 303 131 Other non-current financial liabilities - 5 - 5
Other non-current financial liabilities 309 395 309 395
Payables to entities with significant influence 309 77 309 77 Obligations under finance leases 2 1 2 1 Derivatives not designated as hedges 10 33 10 33 Cash flow hedges 81 59 81 59 Other current financial liabilities 2 1 2 1
Other current financial liabilities 404 171 404 171
Trade payables 8,755 7,209 8,755 7,209
Other payables 2,251 2,103 2,251 2,103
Carrying amount Fair value
35

Notes to the consolidated financial statementsDKK million
2016 2015
14 Financial assets and financial liabilities - continued
Financial instruments by category:
Loans and receivables:
Trade receivables 204 111 Other receivables 500 495 Other financial assets excluding derivatives - 29 Cash and short-term deposits 1,118 1,689
Financial assets at fair value through profit or loss:
Derivatives not designated as hedges 5 1
Financial assets at fair value through profit or loss, held for trading:
Securities 4,718 4,304
Financial assets at fair value through other comprehensive income:
Cash flow hedges - 12
Financial liabilities measured at amortised cost:
Mortgage loans 12,488 13,094 Bank loans 1 104 Other financial liabilities excluding derivatives 319 343 Trade payables 8,755 7,209 Other payables 2,251 2,103
Financial liabilities at fair value through profit or loss:
Derivatives not designated as hedges 10 33
Financial liabilities at fair value through other comprehensive income:
Cash flow hedges 384 190
Hedge accounting:
The effective portion of the change in the fair value of the interest rate swaps is recognised in other comprehensive income, while any ineffective portion is recognised immediately in the income statement.
Cash flow hedging is used to ensure that part of the Group's interest rate risk exposure is at a fixed rate. This is achieved by using interest rate swaps to hedge some of the floating-rate mortgage loans.
The hedged cash flows are expected to occur and affect the income statement during the coming 30 years. During the coming year DKK -81 million is expected to affect profit or loss (DKK -59 million in 2015), during 1 - 5 years DKK -266 million is expected to affect profit or loss (DKK -161 million in 2015), and after 5 years DKK -35 million is expected to affect profit or loss (DKK 41 million in 2015).
It is assessed and documented on a continuous basis, whether the interest rate swaps are effective.
36

Notes to the consolidated financial statementsDKK million
14 Financial assets and financial liabilities - continued
Fair value:
Risks arising from financial instruments:
Currency risks:
The Group's main risks are market risks relating to fluctuations in foreign exchange rates and interest rates, liquidity risk relating to the availability of funds to support business needs and credit risk relating to the undesirable event of a default among the Group's financial counterparties. There has been no structural changes in the Group's risk exposure or risks compared to 2015. The policies for managing risk are explained below.
In accordance with policies, Group Treasury uses derivative financial instruments with the purpose of hedging exposures related to the Group's operations and its source of financing. It is the Group's policy to minimize the potential adverse impact on the Group's financial performance and protect the Group against negative impact of market risks. Group Treasury has primarily used forward contracts to hedge foreign exchange exposures and interest rate swaps to hedge interest rate exposures.
Treasury transactions and hedging activities are recognised in a Treasury management system with a high degree of system integration, control and automation of processes on treasury transactions. Operational risk on trading and settlement methods is minimizing financial counterparty risks.
Foreign currency risk is the risk that the fair value or future cash flows of an exposure will fluctuate because of changes in foreign exchange rates. The Group's exposure to the risk of changes in foreign exchange rate relates primarily to the Group's operating activities and the Group's net investments in foreign subsidiaries. The framework for hedging guidelines and risk mandate is covered by the FX risk management policy.
For cash and short-term deposits, trade receivables and payables, other receivables and payables and other short-term receivables and payables the carrying amount is a reasonable approximation of fair value, largely due to the short-term maturities of the financial instruments.
The overall framework for financial risk management is set out in Dansk Supermarked A/S' financial policy approved by the Board of Directors. The objective of the financial policy and the independent controls, that are established, is to minimize the potential adverse impact on the Group's financial performance. The financial policy is reviewed and updated on a regular basis. Dansk Supermarked A/S has a centralised management of financial risks undertaken by Group Treasury.
Cash flow hedges and other derivatives not defined as hedges are valued using valuation techniques, which are based on market observable inputs, and thereby fall within level 2 of the fair value hierarchy. The most frequent applied valuation technique for interest rate swaps, i.e. a fixed rate swapped for a floating rate, is determining the present value of the fixed leg and the floating leg using a relevant swap curve.
The fair value of securities is derived from quoted market prices in active markets, and falls within level 1 of the fair value hierarchy.
The fair value of mortgage loans is derived from quoted market prices in active markets, and falls within level 1 of the fair value hierarchy. Fair value of the remaining borrowing items falls within level 2 of the fair value hierarchy and is calculated on the basis of discounted interests and instalments.
37
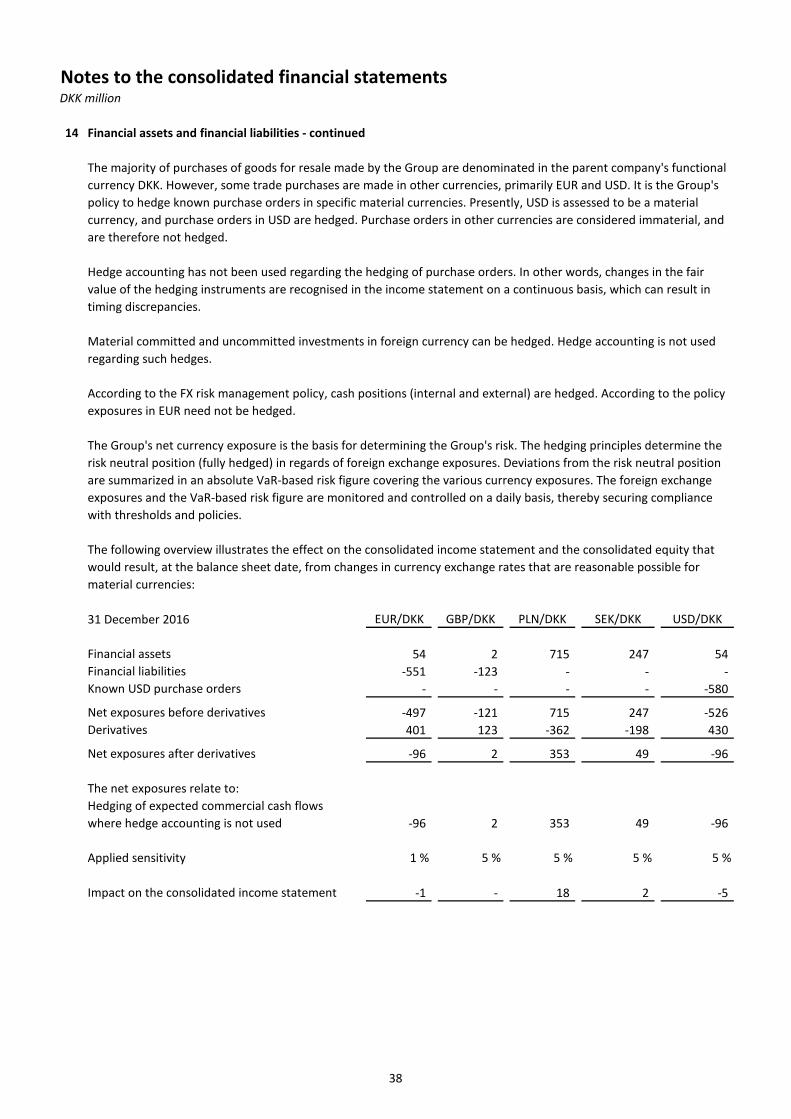
Notes to the consolidated financial statementsDKK million
14 Financial assets and financial liabilities - continued
31 December 2016 EUR/DKK GBP/DKK PLN/DKK SEK/DKK USD/DKK
Financial assets 54 2 715 247 54 Financial liabilities -551 -123 - - - Known USD purchase orders - - - - -580
Net exposures before derivatives -497 -121 715 247 -526 Derivatives 401 123 -362 -198 430
Net exposures after derivatives -96 2 353 49 -96
The net exposures relate to:
-96 2 353 49 -96
Applied sensitivity 1 % 5 % 5 % 5 % 5 %
Impact on the consolidated income statement -1 - 18 2 -5
Hedge accounting has not been used regarding the hedging of purchase orders. In other words, changes in the fair value of the hedging instruments are recognised in the income statement on a continuous basis, which can result in timing discrepancies.
Hedging of expected commercial cash flows where hedge accounting is not used
Material committed and uncommitted investments in foreign currency can be hedged. Hedge accounting is not used regarding such hedges.
The majority of purchases of goods for resale made by the Group are denominated in the parent company's functional currency DKK. However, some trade purchases are made in other currencies, primarily EUR and USD. It is the Group's policy to hedge known purchase orders in specific material currencies. Presently, USD is assessed to be a material currency, and purchase orders in USD are hedged. Purchase orders in other currencies are considered immaterial, and are therefore not hedged.
The Group's net currency exposure is the basis for determining the Group's risk. The hedging principles determine the risk neutral position (fully hedged) in regards of foreign exchange exposures. Deviations from the risk neutral position are summarized in an absolute VaR-based risk figure covering the various currency exposures. The foreign exchange exposures and the VaR-based risk figure are monitored and controlled on a daily basis, thereby securing compliance with thresholds and policies.
The following overview illustrates the effect on the consolidated income statement and the consolidated equity that would result, at the balance sheet date, from changes in currency exchange rates that are reasonable possible for material currencies:
According to the FX risk management policy, cash positions (internal and external) are hedged. According to the policy exposures in EUR need not be hedged.
38
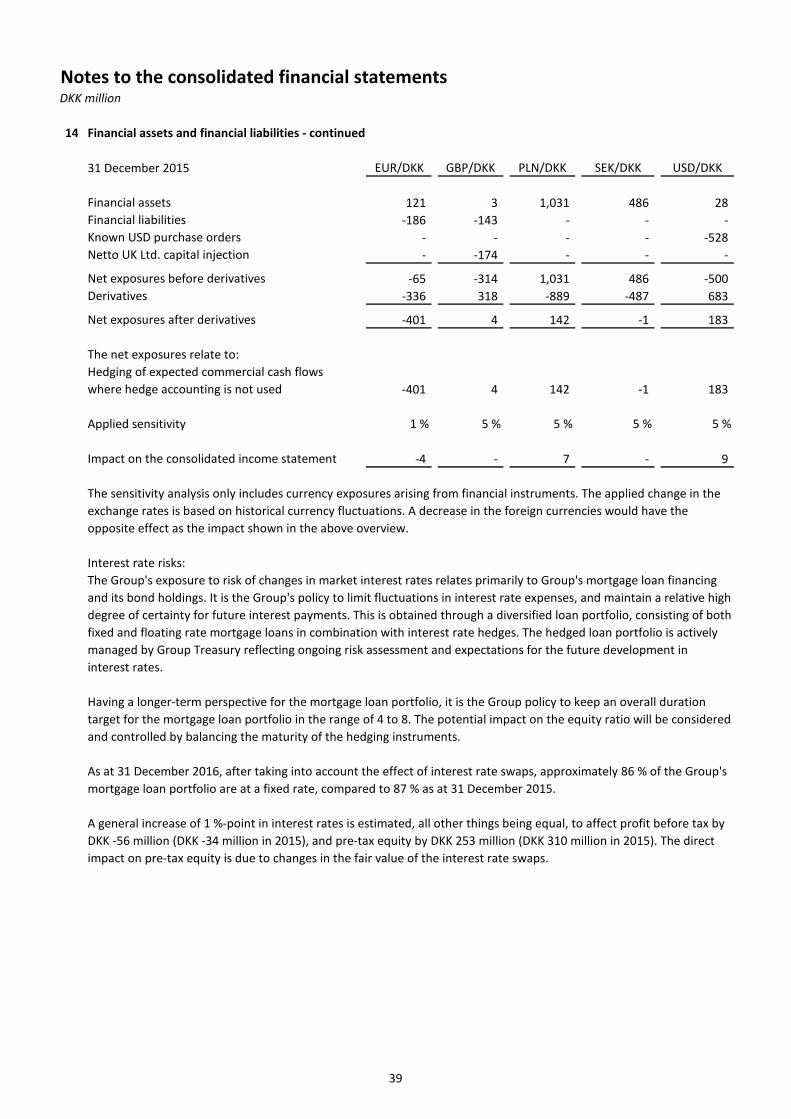
Notes to the consolidated financial statementsDKK million
14 Financial assets and financial liabilities - continued
31 December 2015 EUR/DKK GBP/DKK PLN/DKK SEK/DKK USD/DKK
Financial assets 121 3 1,031 486 28 Financial liabilities -186 -143 - - - Known USD purchase orders - - - - -528 Netto UK Ltd. capital injection - -174 - - -
Net exposures before derivatives -65 -314 1,031 486 -500 Derivatives -336 318 -889 -487 683
Net exposures after derivatives -401 4 142 -1 183
The net exposures relate to:
-401 4 142 -1 183
Applied sensitivity 1 % 5 % 5 % 5 % 5 %
Impact on the consolidated income statement -4 - 7 - 9
Interest rate risks:
Hedging of expected commercial cash flows where hedge accounting is not used
Having a longer-term perspective for the mortgage loan portfolio, it is the Group policy to keep an overall duration target for the mortgage loan portfolio in the range of 4 to 8. The potential impact on the equity ratio will be considered and controlled by balancing the maturity of the hedging instruments.
The sensitivity analysis only includes currency exposures arising from financial instruments. The applied change in the exchange rates is based on historical currency fluctuations. A decrease in the foreign currencies would have the opposite effect as the impact shown in the above overview.
A general increase of 1 %-point in interest rates is estimated, all other things being equal, to affect profit before tax by DKK -56 million (DKK -34 million in 2015), and pre-tax equity by DKK 253 million (DKK 310 million in 2015). The direct impact on pre-tax equity is due to changes in the fair value of the interest rate swaps.
As at 31 December 2016, after taking into account the effect of interest rate swaps, approximately 86 % of the Group's mortgage loan portfolio are at a fixed rate, compared to 87 % as at 31 December 2015.
The Group's exposure to risk of changes in market interest rates relates primarily to Group's mortgage loan financing and its bond holdings. It is the Group's policy to limit fluctuations in interest rate expenses, and maintain a relative high degree of certainty for future interest payments. This is obtained through a diversified loan portfolio, consisting of both fixed and floating rate mortgage loans in combination with interest rate hedges. The hedged loan portfolio is actively managed by Group Treasury reflecting ongoing risk assessment and expectations for the future development in interest rates.
39
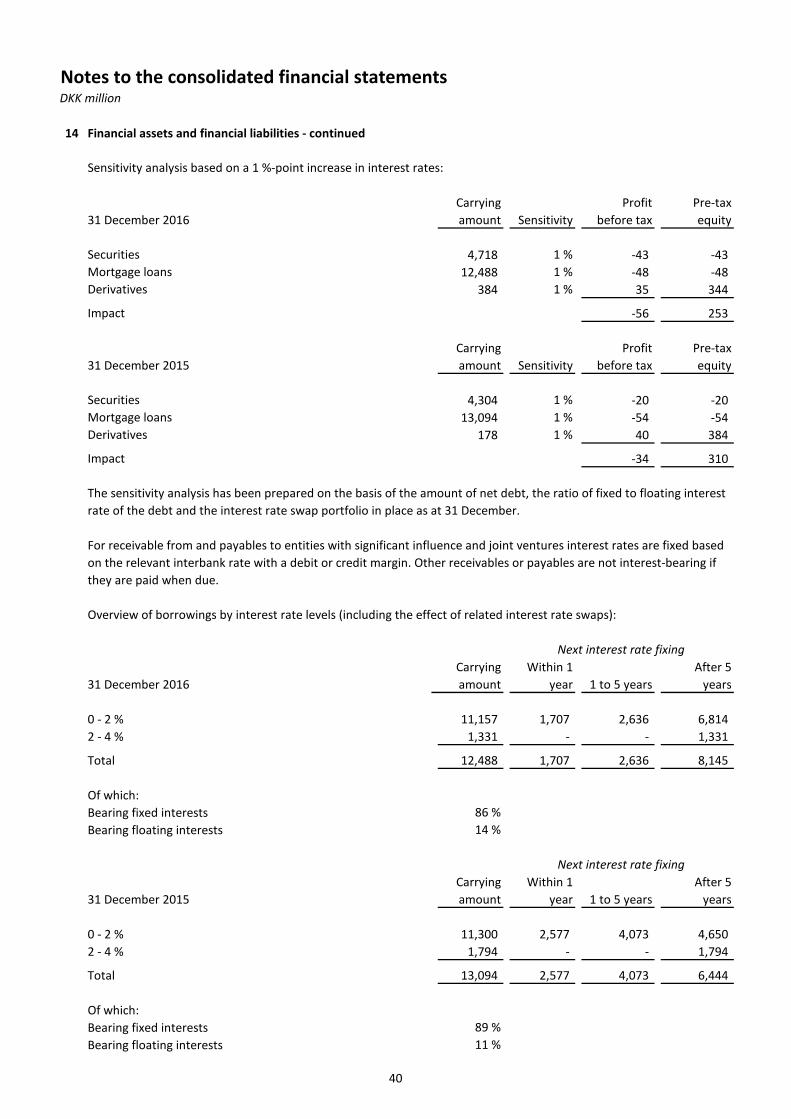
Notes to the consolidated financial statementsDKK million
14 Financial assets and financial liabilities - continued
Sensitivity analysis based on a 1 %-point increase in interest rates:
31 December 2016Carrying amount Sensitivity
Profit before tax
Pre-tax equity
Securities 4,718 1 % -43 -43 Mortgage loans 12,488 1 % -48 -48 Derivatives 384 1 % 35 344
Impact -56 253
31 December 2015Carrying amount Sensitivity
Profit before tax
Pre-tax equity
Securities 4,304 1 % -20 -20 Mortgage loans 13,094 1 % -54 -54 Derivatives 178 1 % 40 384
Impact -34 310
Overview of borrowings by interest rate levels (including the effect of related interest rate swaps):
31 December 2016Carrying amount
Within 1 year 1 to 5 years
After 5 years
0 - 2 % 11,157 1,707 2,636 6,814 2 - 4 % 1,331 - - 1,331
Total 12,488 1,707 2,636 8,145
Of which:Bearing fixed interests 86 %Bearing floating interests 14 %
31 December 2015Carrying amount
Within 1 year 1 to 5 years
After 5 years
0 - 2 % 11,300 2,577 4,073 4,650 2 - 4 % 1,794 - - 1,794
Total 13,094 2,577 4,073 6,444
Of which:Bearing fixed interests 89 %Bearing floating interests 11 %
For receivable from and payables to entities with significant influence and joint ventures interest rates are fixed based on the relevant interbank rate with a debit or credit margin. Other receivables or payables are not interest-bearing if they are paid when due.
Next interest rate fixing
Next interest rate fixing
The sensitivity analysis has been prepared on the basis of the amount of net debt, the ratio of fixed to floating interest rate of the debt and the interest rate swap portfolio in place as at 31 December.
40

Notes to the consolidated financial statementsDKK million
14 Financial assets and financial liabilities - continued
Liquidity risks:
31 December 2016Within 1
year 1 to 5 yearsAfter 5 years
Mortgage loans 312 1,253 14,178 Bank loans 1 - - Obligations under finance leases 3 6 - Trade and other payables 11,317 - -
83 374 204
Total 11,716 1,633 14,382
31 December 2015Within 1
year 1 to 5 yearsAfter 5 years
Mortgage loans 281 861 15,563 Bank loans 104 - - Obligations under finance leases 2 4 - Trade and other payables 9,390 267 -
63 323 218
Total 9,840 1,455 15,781
Credit risks:
The Group is exposed to credit risks from trade receivables, balances with banks in the form of deposits and other financial instruments. The majority of the Group's sales are made in cash, and therefore, the credit risks are very low. The Group reduces its credit risks with banks by only doing business with banks with high credit ratings. Moreover, excess liquidity is deposited with banks or placed in liquid government and mortgage bonds with a rating of minimum Aa2. The overall duration of Dansk Supermarked Group's bond portfolio will typically be low, currently 2.2.
Liquidity risk is the risk that the Group will not be able to settle its financial liabilities when they fall due.
The Group ensures liquidity through flexibility and diversification of borrowing, maturity and renegotiation time points, as well as counterparts. Flexibility in cash resources ensures that the Group can act appropriately in case of unforeseen changes in liquidity. The liquidity reserves consist of cash, securities and undrawn credit facilities. In both 2016 and 2015 the Group has had no breach of covenants or otherwise been close to breaking the agreed borrowing conditions during the year. The Group assesses the liquidity risk to be low.
The Group prepares credit ratings of customers and counterparties on a regular basis. Credit risks are managed on the basis of internal credit ratings and credit lines for customers and financial counterparties. The credit lines are determined on the basis of the customers' and counterparties' creditworthiness and local market risks.
Credit risk is the risk that a counterparty will not meet its obligations under a financial instrument leading to a financial loss. The Group is exposed to credit risk from its operating activities (primarily trade receivables) and from its financing activities, including deposits with banks and financial institutions, foreign exchange transactions and other financial instruments.
The overview below summarises the maturity profile of the Group's financial liabilities based on contractual undiscounted payments. The undiscounted cash flows differ from both the carrying value and the fair value. Floating rate interest is estimated using the prevailing rate at the balance sheet date.
Derivatives
Derivatives
41
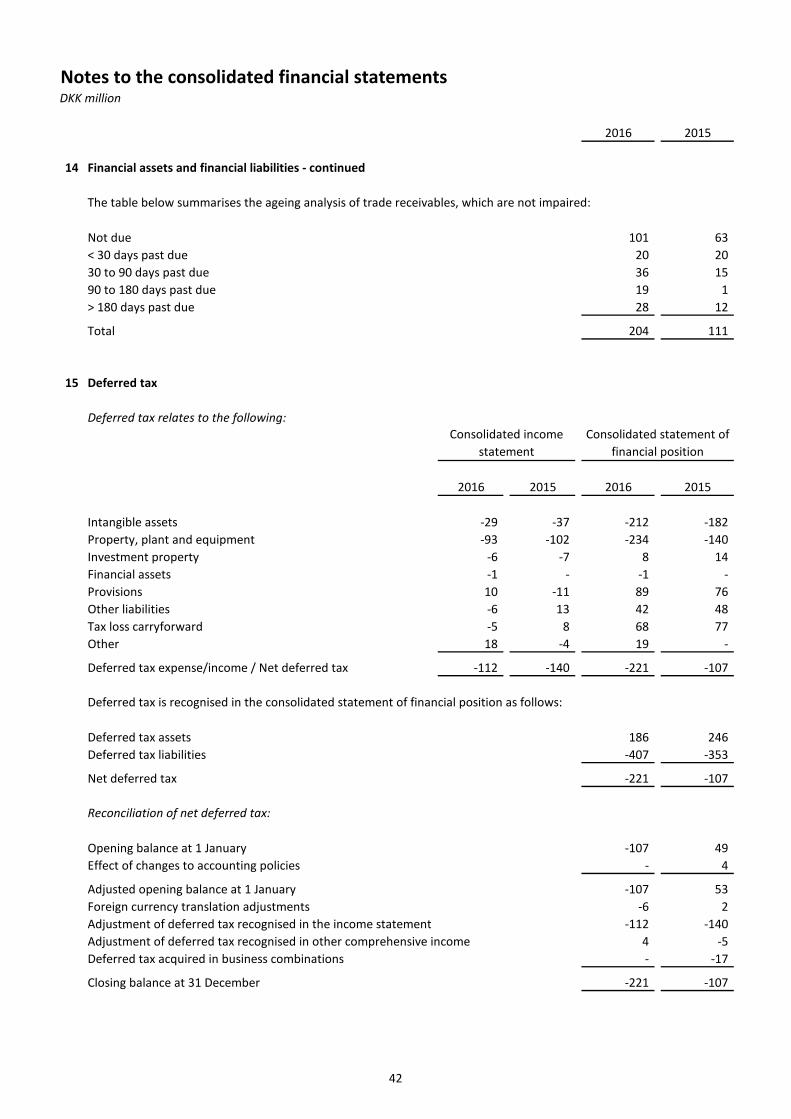
Notes to the consolidated financial statementsDKK million
2016 2015
14 Financial assets and financial liabilities - continued
Not due 101 63 < 30 days past due 20 20 30 to 90 days past due 36 15 90 to 180 days past due 19 1 > 180 days past due 28 12
Total 204 111
15 Deferred tax
Deferred tax relates to the following:
2016 2015 2016 2015
Intangible assets -29 -37 -212 -182 Property, plant and equipment -93 -102 -234 -140 Investment property -6 -7 8 14 Financial assets -1 - -1 - Provisions 10 -11 89 76 Other liabilities -6 13 42 48 Tax loss carryforward -5 8 68 77 Other 18 -4 19 -
Deferred tax expense/income / Net deferred tax -112 -140 -221 -107
Deferred tax is recognised in the consolidated statement of financial position as follows:
Deferred tax assets 186 246 Deferred tax liabilities -407 -353
Net deferred tax -221 -107
Reconciliation of net deferred tax:
Opening balance at 1 January -107 49 Effect of changes to accounting policies - 4
Adjusted opening balance at 1 January -107 53 Foreign currency translation adjustments -6 2 Adjustment of deferred tax recognised in the income statement -112 -140 Adjustment of deferred tax recognised in other comprehensive income 4 -5 Deferred tax acquired in business combinations - -17
Closing balance at 31 December -221 -107
Consolidated statement of financial position
The table below summarises the ageing analysis of trade receivables, which are not impaired:
Consolidated income statement
42
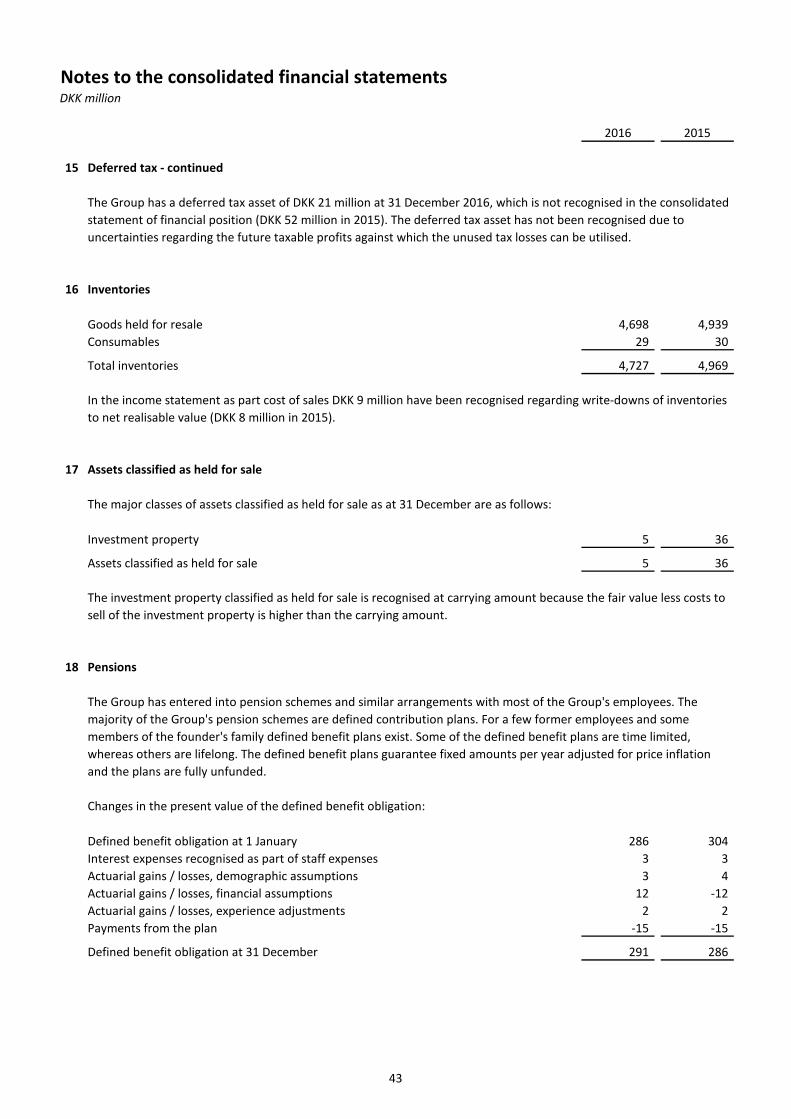
Notes to the consolidated financial statementsDKK million
2016 2015
15 Deferred tax - continued
16 Inventories
Goods held for resale 4,698 4,939 Consumables 29 30
Total inventories 4,727 4,969
17
Investment property 5 36
Assets classified as held for sale 5 36
18 Pensions
Changes in the present value of the defined benefit obligation:
Defined benefit obligation at 1 January 286 304 Interest expenses recognised as part of staff expenses 3 3 Actuarial gains / losses, demographic assumptions 3 4 Actuarial gains / losses, financial assumptions 12 -12 Actuarial gains / losses, experience adjustments 2 2 Payments from the plan -15 -15
Defined benefit obligation at 31 December 291 286
Assets classified as held for sale
The Group has a deferred tax asset of DKK 21 million at 31 December 2016, which is not recognised in the consolidated statement of financial position (DKK 52 million in 2015). The deferred tax asset has not been recognised due to uncertainties regarding the future taxable profits against which the unused tax losses can be utilised.
In the income statement as part cost of sales DKK 9 million have been recognised regarding write-downs of inventories to net realisable value (DKK 8 million in 2015).
The major classes of assets classified as held for sale as at 31 December are as follows:
The investment property classified as held for sale is recognised at carrying amount because the fair value less costs to sell of the investment property is higher than the carrying amount.
The Group has entered into pension schemes and similar arrangements with most of the Group's employees. The majority of the Group's pension schemes are defined contribution plans. For a few former employees and some members of the founder's family defined benefit plans exist. Some of the defined benefit plans are time limited, whereas others are lifelong. The defined benefit plans guarantee fixed amounts per year adjusted for price inflation and the plans are fully unfunded.
43
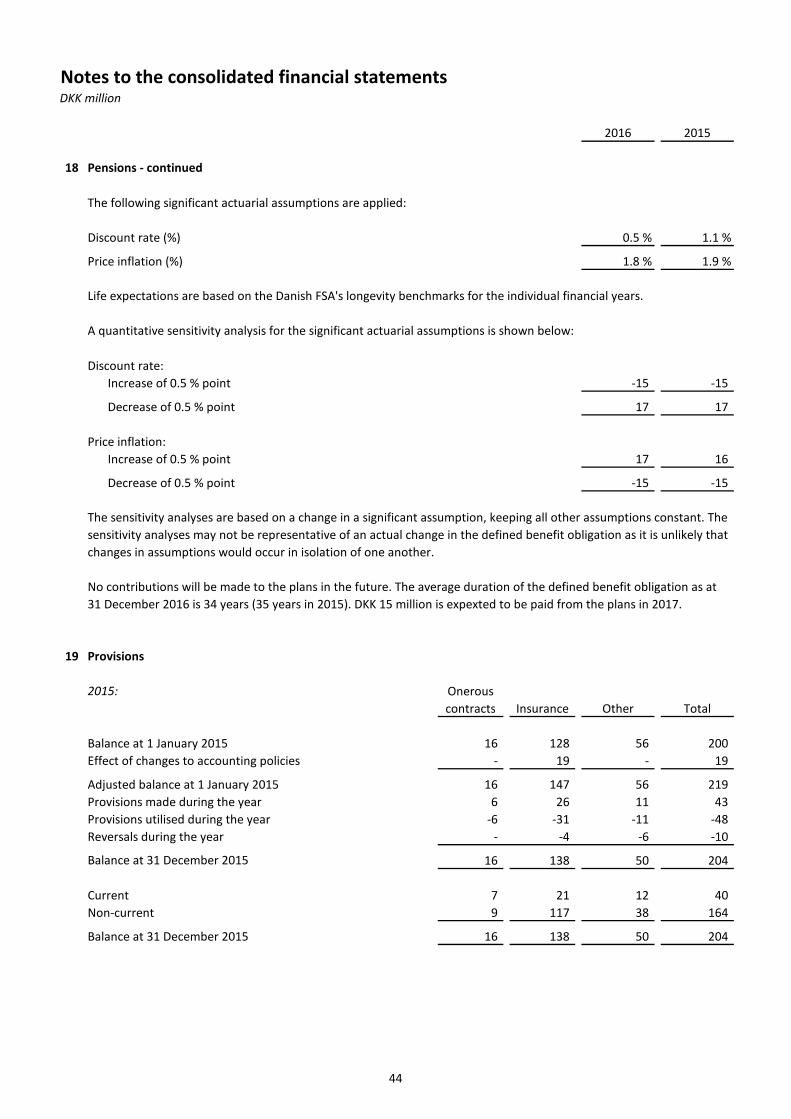
Notes to the consolidated financial statementsDKK million
2016 2015
18 Pensions - continued
The following significant actuarial assumptions are applied:
Discount rate (%) 0.5 % 1.1 %
Price inflation (%) 1.8 % 1.9 %
Discount rate:Increase of 0.5 % point -15 -15
Decrease of 0.5 % point 17 17
Price inflation:Increase of 0.5 % point 17 16
Decrease of 0.5 % point -15 -15
19 Provisions
2015: Onerous contracts Insurance Other Total
Balance at 1 January 2015 16 128 56 200 Effect of changes to accounting policies - 19 - 19
Adjusted balance at 1 January 2015 16 147 56 219 Provisions made during the year 6 26 11 43 Provisions utilised during the year -6 -31 -11 -48 Reversals during the year - -4 -6 -10
16 138 50 204
Current 7 21 12 40 Non-current 9 117 38 164
Balance at 31 December 2015 16 138 50 204
Balance at 31 December 2015
A quantitative sensitivity analysis for the significant actuarial assumptions is shown below:
The sensitivity analyses are based on a change in a significant assumption, keeping all other assumptions constant. The sensitivity analyses may not be representative of an actual change in the defined benefit obligation as it is unlikely that changes in assumptions would occur in isolation of one another.
No contributions will be made to the plans in the future. The average duration of the defined benefit obligation as at 31 December 2016 is 34 years (35 years in 2015). DKK 15 million is expexted to be paid from the plans in 2017.
Life expectations are based on the Danish FSA's longevity benchmarks for the individual financial years.
44
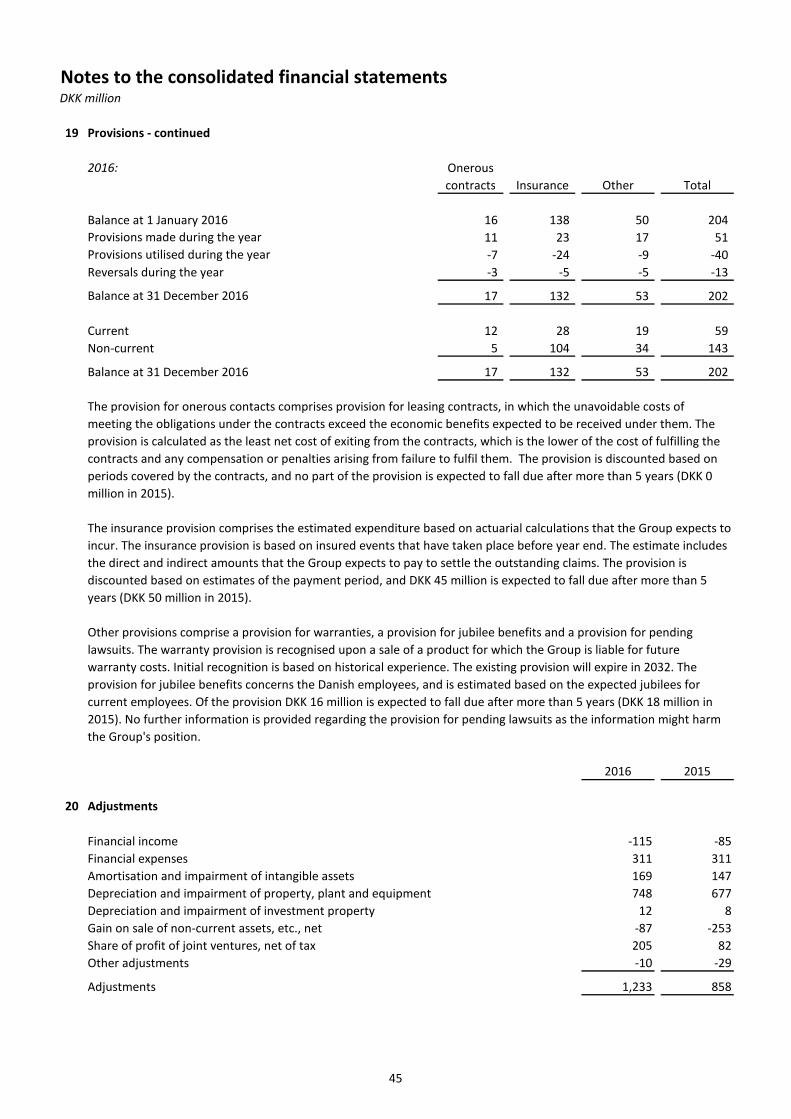
Notes to the consolidated financial statementsDKK million
19 Provisions - continued
2016: Onerous contracts Insurance Other Total
Balance at 1 January 2016 16 138 50 204 11 23 17 51 -7 -24 -9 -40
Reversals during the year -3 -5 -5 -13
17 132 53 202
Current 12 28 19 59 Non-current 5 104 34 143
Balance at 31 December 2016 17 132 53 202
2016 2015
20 Adjustments
Financial income -115 -85 Financial expenses 311 311 Amortisation and impairment of intangible assets 169 147 Depreciation and impairment of property, plant and equipment 748 677 Depreciation and impairment of investment property 12 8 Gain on sale of non-current assets, etc., net -87 -253 Share of profit of joint ventures, net of tax 205 82 Other adjustments -10 -29
Adjustments 1,233 858
The provision for onerous contacts comprises provision for leasing contracts, in which the unavoidable costs of meeting the obligations under the contracts exceed the economic benefits expected to be received under them. The provision is calculated as the least net cost of exiting from the contracts, which is the lower of the cost of fulfilling the contracts and any compensation or penalties arising from failure to fulfil them. The provision is discounted based on periods covered by the contracts, and no part of the provision is expected to fall due after more than 5 years (DKK 0 million in 2015).
The insurance provision comprises the estimated expenditure based on actuarial calculations that the Group expects to incur. The insurance provision is based on insured events that have taken place before year end. The estimate includes the direct and indirect amounts that the Group expects to pay to settle the outstanding claims. The provision is discounted based on estimates of the payment period, and DKK 45 million is expected to fall due after more than 5 years (DKK 50 million in 2015).
Other provisions comprise a provision for warranties, a provision for jubilee benefits and a provision for pending lawsuits. The warranty provision is recognised upon a sale of a product for which the Group is liable for future warranty costs. Initial recognition is based on historical experience. The existing provision will expire in 2032. The provision for jubilee benefits concerns the Danish employees, and is estimated based on the expected jubilees for current employees. Of the provision DKK 16 million is expected to fall due after more than 5 years (DKK 18 million in 2015). No further information is provided regarding the provision for pending lawsuits as the information might harm the Group's position.
Provisions made during the yearProvisions utilised during the year
Balance at 31 December 2016
45
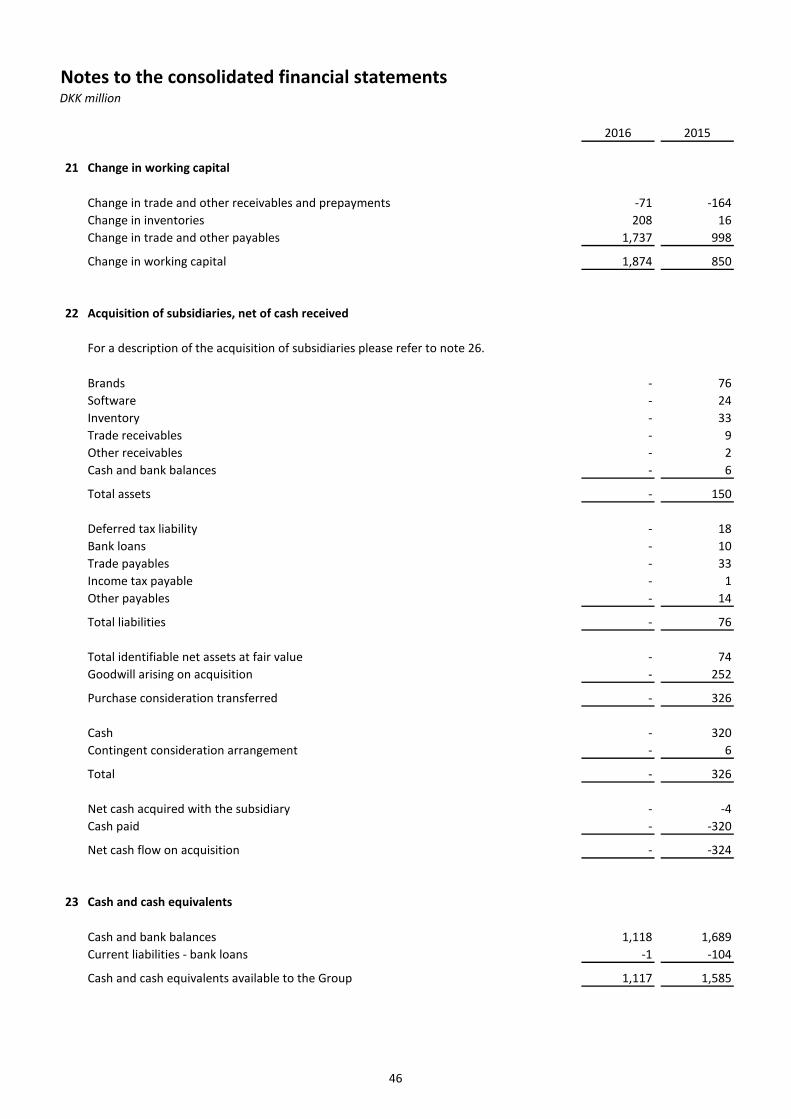
Notes to the consolidated financial statementsDKK million
2016 2015
21 Change in working capital
Change in trade and other receivables and prepayments -71 -164 Change in inventories 208 16 Change in trade and other payables 1,737 998
Change in working capital 1,874 850
22 Acquisition of subsidiaries, net of cash received
Brands - 76 Software - 24 Inventory - 33 Trade receivables - 9 Other receivables - 2 Cash and bank balances - 6
Total assets - 150
Deferred tax liability - 18 Bank loans - 10 Trade payables - 33 Income tax payable - 1 Other payables - 14
Total liabilities - 76
Total identifiable net assets at fair value - 74 Goodwill arising on acquisition - 252
Purchase consideration transferred - 326
Cash - 320 Contingent consideration arrangement - 6
Total - 326
Net cash acquired with the subsidiary - -4 Cash paid - -320
Net cash flow on acquisition - -324
23 Cash and cash equivalents
Cash and bank balances 1,118 1,689 Current liabilities - bank loans -1 -104
Cash and cash equivalents available to the Group 1,117 1,585
For a description of the acquisition of subsidiaries please refer to note 26.
46
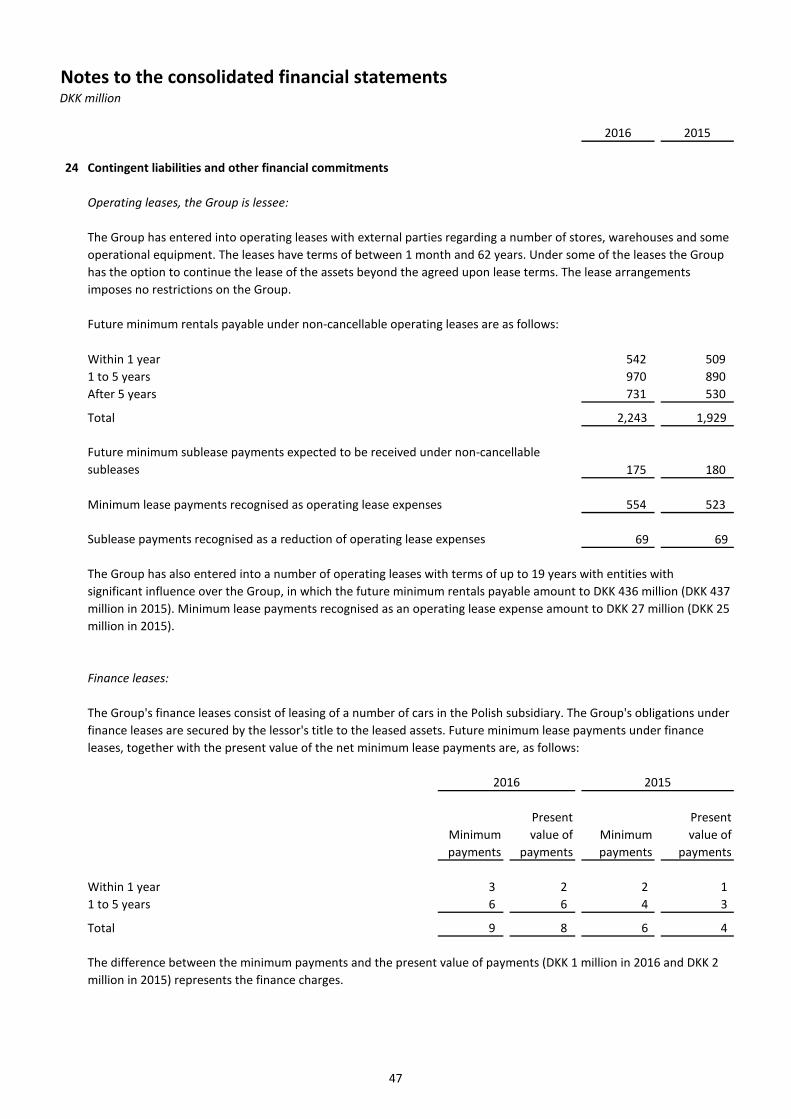
Notes to the consolidated financial statementsDKK million
2016 2015
24 Contingent liabilities and other financial commitments
Operating leases, the Group is lessee:
Within 1 year 542 509 1 to 5 years 970 890 After 5 years 731 530
Total 2,243 1,929
175 180
Minimum lease payments recognised as operating lease expenses 554 523
Sublease payments recognised as a reduction of operating lease expenses 69 69
Finance leases:
Minimum payments
Present value of
paymentsMinimum payments
Present value of
payments
Within 1 year 3 2 2 1 1 to 5 years 6 6 4 3
Total 9 8 6 4
The Group's finance leases consist of leasing of a number of cars in the Polish subsidiary. The Group's obligations under finance leases are secured by the lessor's title to the leased assets. Future minimum lease payments under finance leases, together with the present value of the net minimum lease payments are, as follows:
The difference between the minimum payments and the present value of payments (DKK 1 million in 2016 and DKK 2 million in 2015) represents the finance charges.
Future minimum rentals payable under non-cancellable operating leases are as follows:
Future minimum sublease payments expected to be received under non-cancellable subleases
The Group has entered into operating leases with external parties regarding a number of stores, warehouses and some operational equipment. The leases have terms of between 1 month and 62 years. Under some of the leases the Group has the option to continue the lease of the assets beyond the agreed upon lease terms. The lease arrangements imposes no restrictions on the Group.
The Group has also entered into a number of operating leases with terms of up to 19 years with entities with significant influence over the Group, in which the future minimum rentals payable amount to DKK 436 million (DKK 437 million in 2015). Minimum lease payments recognised as an operating lease expense amount to DKK 27 million (DKK 25 million in 2015).
2016 2015
47
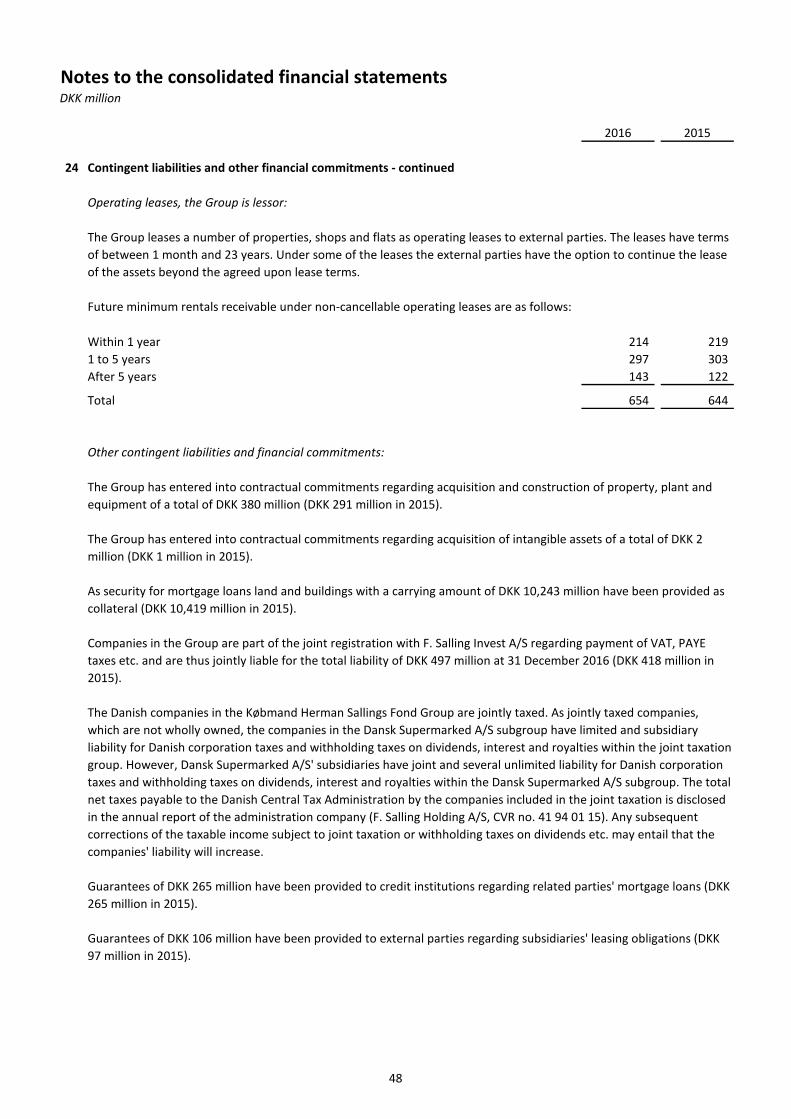
Notes to the consolidated financial statementsDKK million
2016 2015
24 Contingent liabilities and other financial commitments - continued
Operating leases, the Group is lessor:
Within 1 year 214 219 1 to 5 years 297 303 After 5 years 143 122
Total 654 644
Other contingent liabilities and financial commitments:
The Group leases a number of properties, shops and flats as operating leases to external parties. The leases have terms of between 1 month and 23 years. Under some of the leases the external parties have the option to continue the lease of the assets beyond the agreed upon lease terms.
Future minimum rentals receivable under non-cancellable operating leases are as follows:
The Group has entered into contractual commitments regarding acquisition of intangible assets of a total of DKK 2 million (DKK 1 million in 2015).
As security for mortgage loans land and buildings with a carrying amount of DKK 10,243 million have been provided as collateral (DKK 10,419 million in 2015).
Guarantees of DKK 106 million have been provided to external parties regarding subsidiaries' leasing obligations (DKK 97 million in 2015).
Guarantees of DKK 265 million have been provided to credit institutions regarding related parties' mortgage loans (DKK 265 million in 2015).
Companies in the Group are part of the joint registration with F. Salling Invest A/S regarding payment of VAT, PAYE taxes etc. and are thus jointly liable for the total liability of DKK 497 million at 31 December 2016 (DKK 418 million in 2015).
The Danish companies in the Købmand Herman Sallings Fond Group are jointly taxed. As jointly taxed companies, which are not wholly owned, the companies in the Dansk Supermarked A/S subgroup have limited and subsidiary liability for Danish corporation taxes and withholding taxes on dividends, interest and royalties within the joint taxation group. However, Dansk Supermarked A/S' subsidiaries have joint and several unlimited liability for Danish corporation taxes and withholding taxes on dividends, interest and royalties within the Dansk Supermarked A/S subgroup. The total net taxes payable to the Danish Central Tax Administration by the companies included in the joint taxation is disclosed in the annual report of the administration company (F. Salling Holding A/S, CVR no. 41 94 01 15). Any subsequent corrections of the taxable income subject to joint taxation or withholding taxes on dividends etc. may entail that the companies' liability will increase.
The Group has entered into contractual commitments regarding acquisition and construction of property, plant and equipment of a total of DKK 380 million (DKK 291 million in 2015).
48
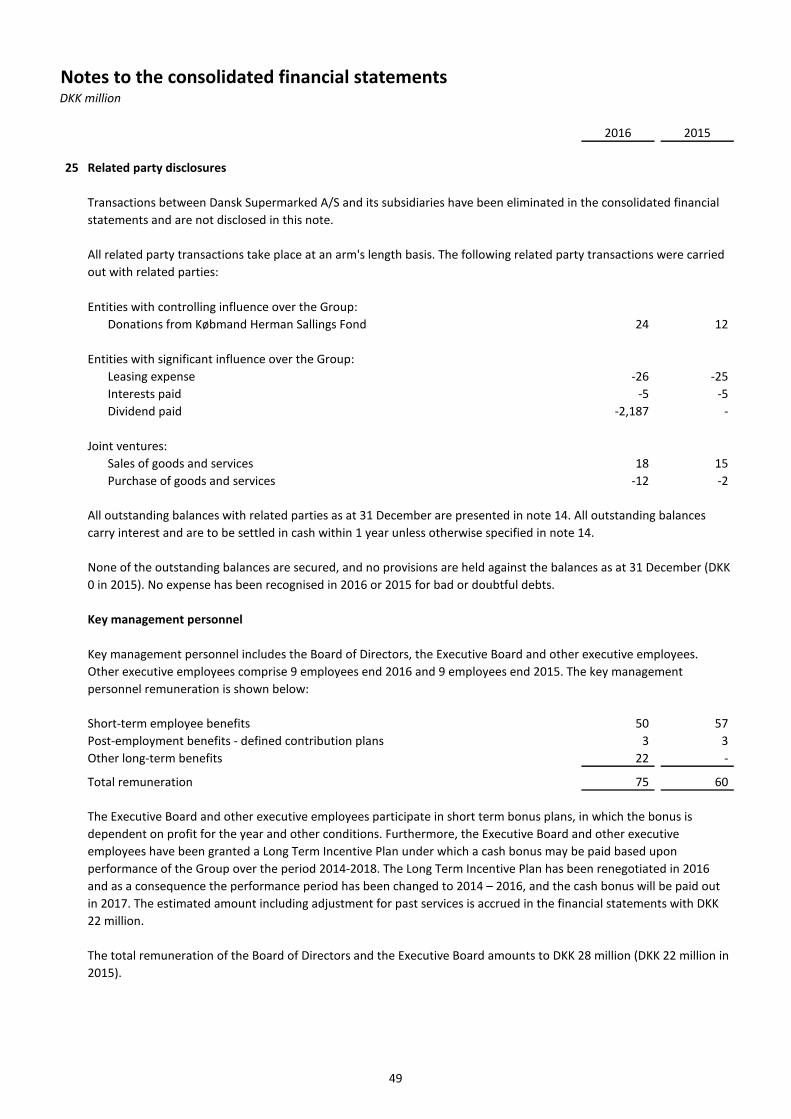
Notes to the consolidated financial statementsDKK million
2016 2015
25 Related party disclosures
Entities with controlling influence over the Group:Donations from Købmand Herman Sallings Fond 24 12
Entities with significant influence over the Group:Leasing expense -26 -25 Interests paid -5 -5 Dividend paid -2,187 -
Joint ventures:Sales of goods and services 18 15 Purchase of goods and services -12 -2
Key management personnel
Short-term employee benefits 50 57 Post-employment benefits - defined contribution plans 3 3 Other long-term benefits 22 -
Total remuneration 75 60
None of the outstanding balances are secured, and no provisions are held against the balances as at 31 December (DKK 0 in 2015). No expense has been recognised in 2016 or 2015 for bad or doubtful debts.
All related party transactions take place at an arm's length basis. The following related party transactions were carried out with related parties:
Key management personnel includes the Board of Directors, the Executive Board and other executive employees. Other executive employees comprise 9 employees end 2016 and 9 employees end 2015. The key management personnel remuneration is shown below:
All outstanding balances with related parties as at 31 December are presented in note 14. All outstanding balances carry interest and are to be settled in cash within 1 year unless otherwise specified in note 14.
Transactions between Dansk Supermarked A/S and its subsidiaries have been eliminated in the consolidated financial statements and are not disclosed in this note.
The total remuneration of the Board of Directors and the Executive Board amounts to DKK 28 million (DKK 22 million in 2015).
The Executive Board and other executive employees participate in short term bonus plans, in which the bonus is dependent on profit for the year and other conditions. Furthermore, the Executive Board and other executive employees have been granted a Long Term Incentive Plan under which a cash bonus may be paid based upon performance of the Group over the period 2014-2018. The Long Term Incentive Plan has been renegotiated in 2016 and as a consequence the performance period has been changed to 2014 – 2016, and the cash bonus will be paid out in 2017. The estimated amount including adjustment for past services is accrued in the financial statements with DKK 22 million.
49
Notes to the consolidated financial statementsDKK million
26 Business combinations
27 Capital management
28 Events after the reporting period
No subsequent events have occurred that affect the annual report for 2016.
During 2015 Dansk Supermarked A/S acquired controlling interests in 2 companies: wupti.com A/S and Thomberg ApS. Dansk Supermarked A/S acquired 100 % of the issued share capital and voting rights in the 2 companies. wupti.com A/S was acquired 21 July 2015 and Thomberg ApS was acquired 31 August 2015.
As at the 21 December 2015 the previous sister company F. Salling A/S became a subsidiary of Dansk Supermarked A/S by a non-cash contribution in which the share capital in Dansk Supermarked A/S was increased. The previous owners of F. Salling A/S, F. Salling Holding A/S and A.P. Møller Mærsk A/S, received the increased share capital in Dansk Supermarked A/S. The transaction was accounted for as a business combination between entities under common control and was recognised using the pooling of interests method. As a consequence the consolidated financial statements including all comparison figures are presented as if the entities had always been combined. All financial information for the period prior to the date of the combination was restated accordingly.
As at 1 January 2016 Dansk Supermarked A/S merged with the subsidiaries wupti.com A/S and Thomberg ApS.
The purchase consideration transferred consists partly of cash and partly of a contingent consideration (fair value at the acquisition date DKK 6 million). The contingent consideration is dependent on the revenue of the acquiree during 2016 - 2019 and on the continued employment of the founders of the acquiree in the same period. The payment, if any, of the contingent consideration will take place during 2017 - 2020.
wupti.com A/S is one of Denmark's largest online-shops for home electronics, and Dansk Supermarked Group intents to continue running wupti.com along side the Group's other online-activities. Thomberg ApS is the entrepreneurial company behind the home page Iposen.dk. The company is in the market for service providers of groceries. The Group has acquired the company in order to gain access to the fragmented municipal market, and in the future possibly also day-care facilities and schools. The goodwill recognised comprise the synergies from the business combinations. The goodwill is not expected to be deductible for income tax purposes.
The Group manages its capital structure and makes adjustments in light of changes in economic conditions and the requirements of the financial covenants. To maintain or adjust the capital structure, the Group may adjust the dividend payment to shareholders or issue new shares.
In order to achieve this overall objective, the Group's capital management, amongst other things, aims to ensure that it meets financial covenants attached to bank facilities. Breaches in meeting the financial covenants could permit the bank to call the bank facilities. There have been no breaches of the financial covenants in the current or previous periods.
No changes were made in the objectives, policies or processes for managing capital during the years ended 31 December 2016 and 2015.
The Group manages its capital to ensure that the entities in the Group will be able to continue as going concerns while maximising the return to the shareholders through the optimisation of the debt and equity balance. For the purpose of the Group's capital management, capital includes total equity.
50
Notes to the consolidated financial statementsDKK million
29 Standards issued but not yet effective
In May 2014 IFRS 15 Revenue from Contracts with Customers, in September 2015 amendments to IFRS 15: Effective date of IFRS 15 and in April 2016 Clarifications to IFRS 15 Revenue from Contracts with Customers were issued by the International Accounting Standards Board. The standard including amendments have been endorsed by the European Union, but the clarifications have yet to be endorsed. The standard establishes a five-step model to account for revenue arising from contracts with customers. Revenue has to be recognised at an amount that reflects the consideration to which an entity expects to be entitled in exchange for transferring goods or services to a customer. IFRS 15 is effective for annual periods beginning on or after 1 January 2018, with early adoption permitted. The Group plans to adopt the new standard on the required effective date. The Group has performed a preliminary assessment of the standard and a more detailed analysis is ongoing. Based on the preliminary assessment the Group expects no significant impact on its statement of financial position and equity of the standard due to the relatively uncomplex nature of the Group's revenue generating activities.
In January 2016 IFRS 16 Leases was issued by the International Accounting Standards Board. The standard has yet to be endorsed by the European Union. The standard sets out the principles for the recognition, measurement, presentation and disclosure of leases. The standard requires a lessee to recognise assets and liabilities for the rights and obligations created by all leases (with limited exceptions for short-term leases and leasing of assets with low value). IFRS 16 is effective for annual periods beginning on or after 1 January 2019, with early adoption permitted. The Group is currently assessing the impact of IFRS 16 and plans to adopt the new standard on the required effective date. The Group has determined that the standard will increase the total assets and liabilities significantly due to a considerable number of operating leases and also increase operating profit and financial expenses. Thus, the standard will affect the main and key figures of the Group. The Group has yet to determined the exact monetary effect.
The standards IFRS 9 Financial Instruments, Amendments to IFRS 10 and IAS 28: Sale or Contribution of Assets between an Investor and its Associate or Joint Venture, Amendments to IAS 12: Recognition of Deferred Tax Assets for Unrealised Losses, Amendments to IAS 7: Disclosure Initiative, Amendments to IFRS 2: Classification and Measurement of Share-based Payment Transactions, Amendments to IFRS 4: Applying IFRS 9 Financial Instruments with IFRS 4 Insurance Contracts, IFRIC Interpretation 22 Foreign Currency Transactions and Advance Consideration, Amendments to IAS 40: Transfers of Investment Property and Annual Improvements 2014-2016 Cycle have been issued, but are not yet effective. The Group plans to adopt the new standards on the required effective dates. Overall the Group expects no significant impact on its statement of financial position and equity of the standards.
51
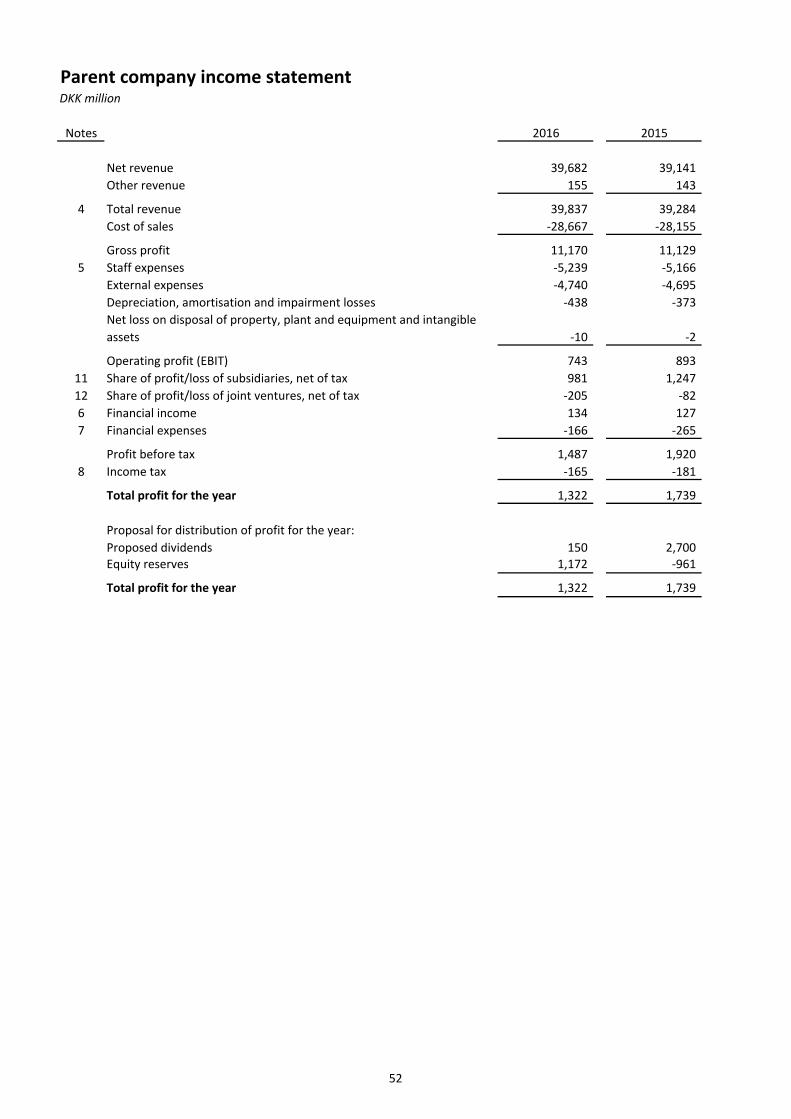
Parent company income statementDKK million
Notes 2016 2015
Net revenue 39,682 39,141 Other revenue 155 143
4 Total revenue 39,837 39,284 Cost of sales -28,667 -28,155
Gross profit 11,170 11,129 5 Staff expenses -5,239 -5,166
External expenses -4,740 -4,695 Depreciation, amortisation and impairment losses -438 -373 Net loss on disposal of property, plant and equipment and intangible assets -10 -2
Operating profit (EBIT) 743 893 11 Share of profit/loss of subsidiaries, net of tax 981 1,247 12 Share of profit/loss of joint ventures, net of tax -205 -82 6 Financial income 134 127 7 Financial expenses -166 -265
Profit before tax 1,487 1,920 8 Income tax -165 -181
Total profit for the year 1,322 1,739
Proposal for distribution of profit for the year:Proposed dividends 150 2,700 Equity reserves 1,172 -961
Total profit for the year 1,322 1,739
52
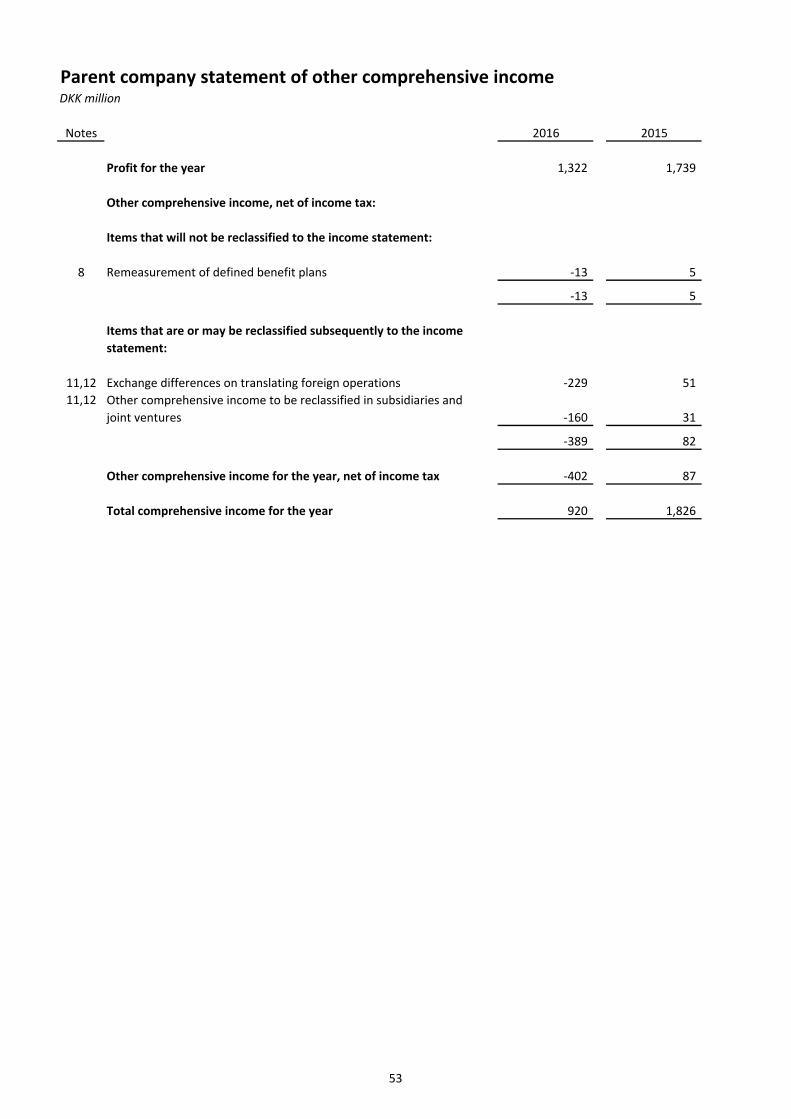
Parent company statement of other comprehensive incomeDKK million
Notes 2016 2015
Profit for the year 1,322 1,739
Other comprehensive income, net of income tax:
Items that will not be reclassified to the income statement:
8 Remeasurement of defined benefit plans -13 5
-13 5
Items that are or may be reclassified subsequently to the income
statement:
11,12 Exchange differences on translating foreign operations -229 51 11,12 Other comprehensive income to be reclassified in subsidiaries and
joint ventures -160 31
-389 82
Other comprehensive income for the year, net of income tax -402 87
Total comprehensive income for the year 920 1,826
53

Parent company statement of financial positionDKK million
Assets
Notes 2016 2015
Non-current assets
9 Intangible assets
Goodwill 270 270 Software 1,027 1,029 Software development in progress 145 158 Brands 65 73 Other intangible assets 5 7
Total intangible assets 1,512 1,537
10 Property, plant and equipment
Fixtures and fittings, tools and equipment 1,213 1,005 Leasehold improvements 127 116 Assets under construction and prepayments 6 17 - - Total property, plant and equipment 1,346 1,138
Financial assets
11 Investments in subsidiaries 13,741 13,114 12 Investments in joint ventures 32 113 13 Other non-current financial assets 303 143
Total financial assets 14,076 13,370
Total non-current assets 16,934 16,045
Current assets
14 Inventories 3,297 3,519
Receivables
13 Trade receivables 149 68 Income tax receivables - -
13 Other receivables 287 241 Prepayments 38 77
13 Other current financial assets 1,036 1,401
Total receivables 1,510 1,787
13 Securities 4,334 3,960
13 Cash and short-term deposits 788 1,457
Total current assets 9,929 10,723
Total assets 26,863 26,768
54

Parent company statement of financial positionDKK million
Equity and liabilities
Notes 2016 2015
15 Equity
Share capital 524 524 Reserve for net revaluation under the equity method 3,429 2,857 Foreign currency translation reserve -305 -76 Development projects reserve 126 - Retained earnings 2,809 2,508 Proposed dividends 150 2,700
Total equity 6,733 8,513
Liabilities
Non-current liabilities
16 Pensions 291 286 17 Deferred tax liabilities 166 153 18 Provisions 160 157 13 Other non-current financial liabilities 2,036 2,189
Total non-current liabilities 2,653 2,785
Current liabilities
18 Provisions 20 14 13 Other current financial liabilities 8,902 8,184 13 Trade payables 6,759 5,580
Income tax payable 24 - 13 Other payables 1,751 1,667
Deferred income 21 25
Total current liabilities 17,477 15,470
Total liabilities 20,130 18,255
Total equity and liabilities 26,863 26,768
55

Parent company cash flow statementDKK million
Notes 2016 2015
Profit before tax 1,487 1,920 19 Adjustments -324 -599 20 Change in working capital 1,393 802
Net cash flows from operating activities before financial items and tax 2,556 2,123 Financial income received 134 127 Financial expenses paid -166 -265 Income tax paid -123 -105
Net cash flows from operating activities 2,401 1,880
Purchase of intangible assets -162 -190 Purchase of property, plant and equipment -478 -275 Proceeds from sale of property, plant and equipment 7 - Acquisition of subsidiaries, net of cash received - -324 Capital contribution, joint ventures -203 -147 Dividends received from subsidiaries - 150 Purchase of securities -7,925 -6,536 Sale of securities 7,551 2,582 Dividends received from joint ventures 44 -
Net cash flows from investment activities -1,166 -4,740
Loan repayments from related parties 800 3,037 Repayment of borrowings to related parties -4 -10 Dividends paid -2,700 -
Net cash flows from financing activities -1,904 3,027
Net change in cash and cash equivalents -669 167
Cash and cash equivalents at 1 January 1,457 1,290
21 Cash and cash equivalents at 31 December 788 1,457
56
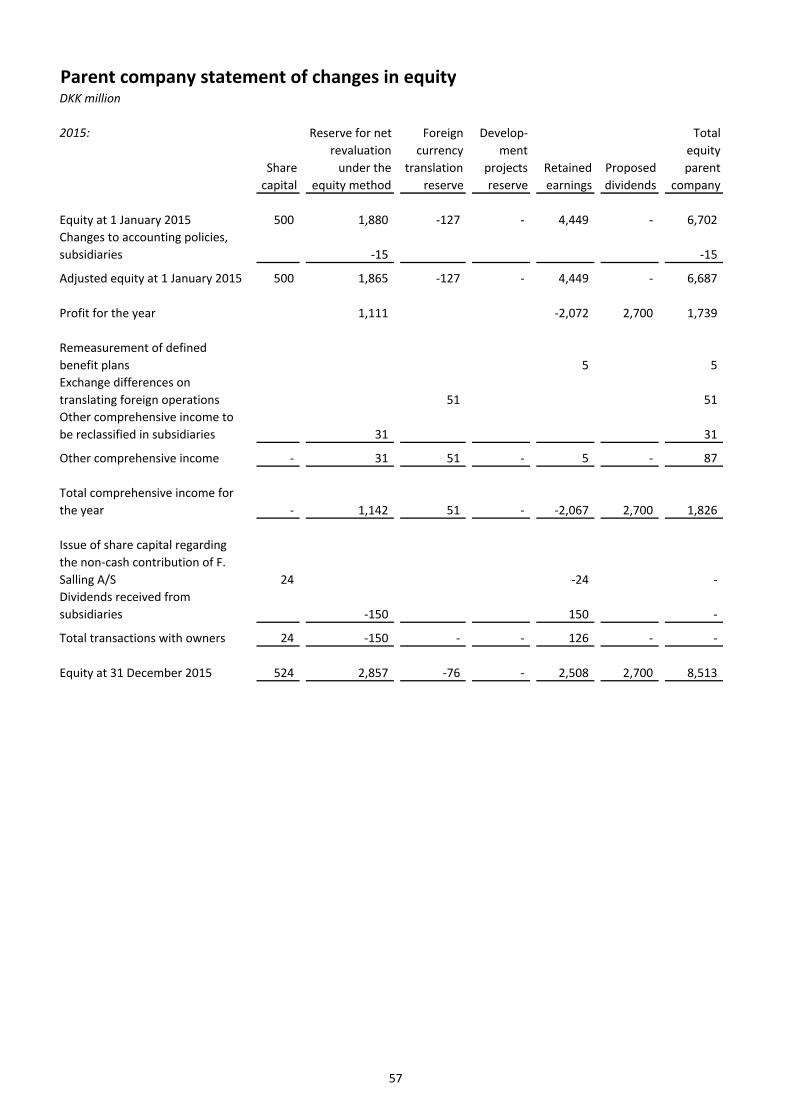
Parent company statement of changes in equityDKK million
2015:
Share capital
Reserve for net revaluation
under the equity method
Foreign currency
translation reserve
Develop-ment
projects reserve
Retained earnings
Proposed dividends
Total equity parent
company
Equity at 1 January 2015 500 1,880 -127 - 4,449 - 6,702 Changes to accounting policies, subsidiaries -15 -15
Adjusted equity at 1 January 2015 500 1,865 -127 - 4,449 - 6,687
Profit for the year 1,111 -2,072 2,700 1,739
Remeasurement of defined benefit plans 5 5 Exchange differences on translating foreign operations 51 51 Other comprehensive income to be reclassified in subsidiaries 31 31
Other comprehensive income - 31 51 - 5 - 87
Total comprehensive income for the year - 1,142 51 - -2,067 2,700 1,826
Issue of share capital regarding the non-cash contribution of F. Salling A/S 24 -24 - Dividends received from subsidiaries -150 150 -
Total transactions with owners 24 -150 - - 126 - -
Equity at 31 December 2015 524 2,857 -76 - 2,508 2,700 8,513
57
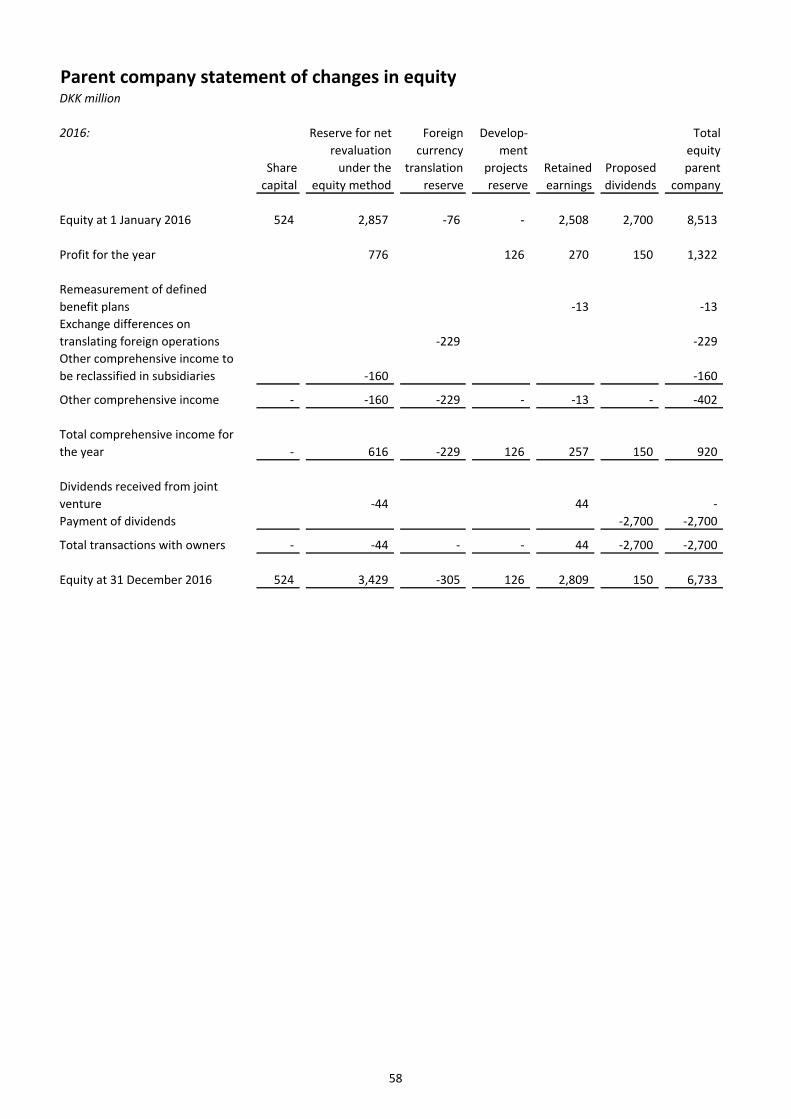
Parent company statement of changes in equityDKK million
2016:
Share capital
Reserve for net revaluation
under the equity method
Foreign currency
translation reserve
Develop-ment
projects reserve
Retained earnings
Proposed dividends
Total equity parent
company
Equity at 1 January 2016 524 2,857 -76 - 2,508 2,700 8,513
Profit for the year 776 126 270 150 1,322
Remeasurement of defined benefit plans -13 -13 Exchange differences on translating foreign operations -229 -229 Other comprehensive income to be reclassified in subsidiaries -160 -160
Other comprehensive income - -160 -229 - -13 - -402
Total comprehensive income for the year - 616 -229 126 257 150 920
Dividends received from joint venture -44 44 - Payment of dividends -2,700 -2,700
Total transactions with owners - -44 - - 44 -2,700 -2,700
Equity at 31 December 2016 524 3,429 -305 126 2,809 150 6,733
58

Summary of notes to the parent company financial statements
1 General information2 Summary of significant accounting policies3 Significant accounting judgements, estimates and assumptions
Notes to the income statement
4 Total revenue5 Staff expenses6 Financial income7 Financial expenses8 Income tax
Notes to the balance sheet
9 Intangible assets10 Property, plant and equipment11 Investments in subsidiaries12 Investments in joint ventures13 Financial assets and financial liabilities14 Inventories15 Equity16 Pensions17 Deferred tax18 Provisions
Notes to the cash flow statement
19 Adjustments 20 Change in working capital21 Cash and cash equivalents
Other notes
22 Contingent liabilities and other financial commitments23 Related party disclosures24 Business combinations25 Capital management26 Events after the reporting period27 Standards issued but not yet effective
59

Notes to the parent company financial statementsDKK million
1 General information
2 Summary of significant accounting policies
3 Significant accounting judgements, estimates and assumptions
Dansk Supermarked A/S' primary business area is retailing in Denmark through the physical stores Bilka, føtex and Netto and online with Bilka.dk, føtex.dk, wupti.com and føtexdagligvarer.dk. Furthermore Dansk Supermarked A/S also operates franchises in Denmark including coffee shops Starbucks and the burger restaurants Carl’s Jr.
Dansk Supermarked A/S also owns a number of subsidiaries in Denmark and abroad and a joint venture in the UK. During 2016 it was decided together with J Sainsbury plc. to end the joint venture in the UK as it proved difficult to reach sufficient scale due to a lack of availability of appropriate sites.
Dansk Supermarked A/S is a public limited company with its registered office located at Rosbjergvej 33, 8220 Brabrand in Denmark.
For a summary of significant accounting policies, please refer to note 2 in the notes to the consolidated financial statements.
As at the 21 December 2015 the previous sister company F. Salling A/S became a subsidiary to Dansk Supermarked A/S by a non-cash contribution in which the share capital in Dansk Supermarked A/S was increased. The transaction was accounted for by the pooling of interests method in which comparative amounts were restated as if F. Salling A/S had always been a subsidiary.
For a summary of significant accounting judgements, estimates and assumptions please refer to note 3 in the notes to the consolidated financial statements.
Minor changes have been made to the comparison figures due to changes in accounting policies regarding insurance provisions resulting from legislative changes for Danish insurance companies affecting the subsidiary, Dansk Supermarked Forsikring A/S. Equity at 1 January 2015 and investments in subsidiaries have been decreased by DKK 15 million, whereas share of profit/loss of subsidiaries, net of tax for 2015 have been increased by DKK 5 million. Due to the immateriality of the changes no statement of financial position as at the beginning of the preceding period is presented.
As at 1 January 2016 Dansk Supermarked A/S merged with the subsidiaries wupti.com A/S and Thomberg ApS. The mergers are business combinations between entities under common control and are recognised in the parent company's separate financial statements using the pooling of interests method. The subsidiaries wupti.com A/S and Thomberg ApS were acquired during 2015, and all comparison figures from the acquisition dates and going forward are restated.
60
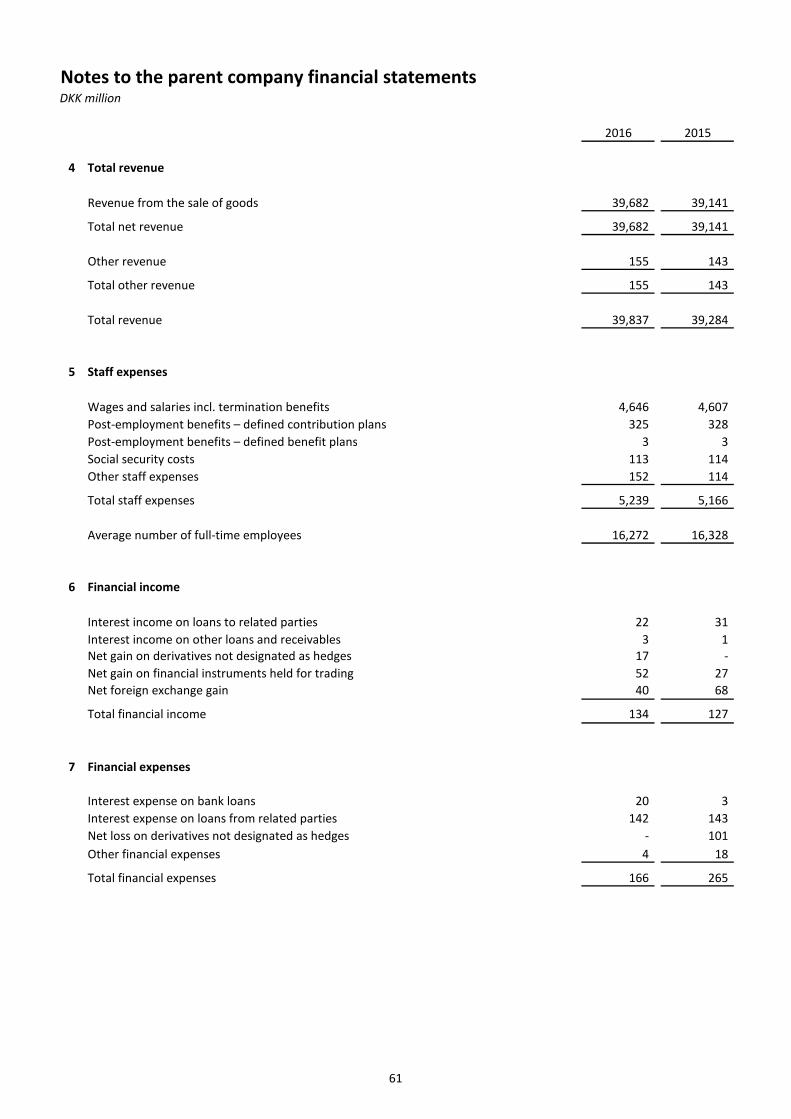
Notes to the parent company financial statementsDKK million
2016 2015
4 Total revenue
Revenue from the sale of goods 39,682 39,141
Total net revenue 39,682 39,141
Other revenue 155 143
Total other revenue 155 143
Total revenue 39,837 39,284
5 Staff expenses
Wages and salaries incl. termination benefits 4,646 4,607 Post-employment benefits – defined contribution plans 325 328 Post-employment benefits – defined benefit plans 3 3 Social security costs 113 114 Other staff expenses 152 114
Total staff expenses 5,239 5,166
Average number of full-time employees 16,272 16,328
6 Financial income
Interest income on loans to related parties 22 31 Interest income on other loans and receivables 3 1
17 - 52 27
Net foreign exchange gain 40 68
Total financial income 134 127
7 Financial expenses
Interest expense on bank loans 20 3 Interest expense on loans from related parties 142 143
- 101 Other financial expenses 4 18
Total financial expenses 166 265
Net gain on derivatives not designated as hedgesNet gain on financial instruments held for trading
Net loss on derivatives not designated as hedges
61
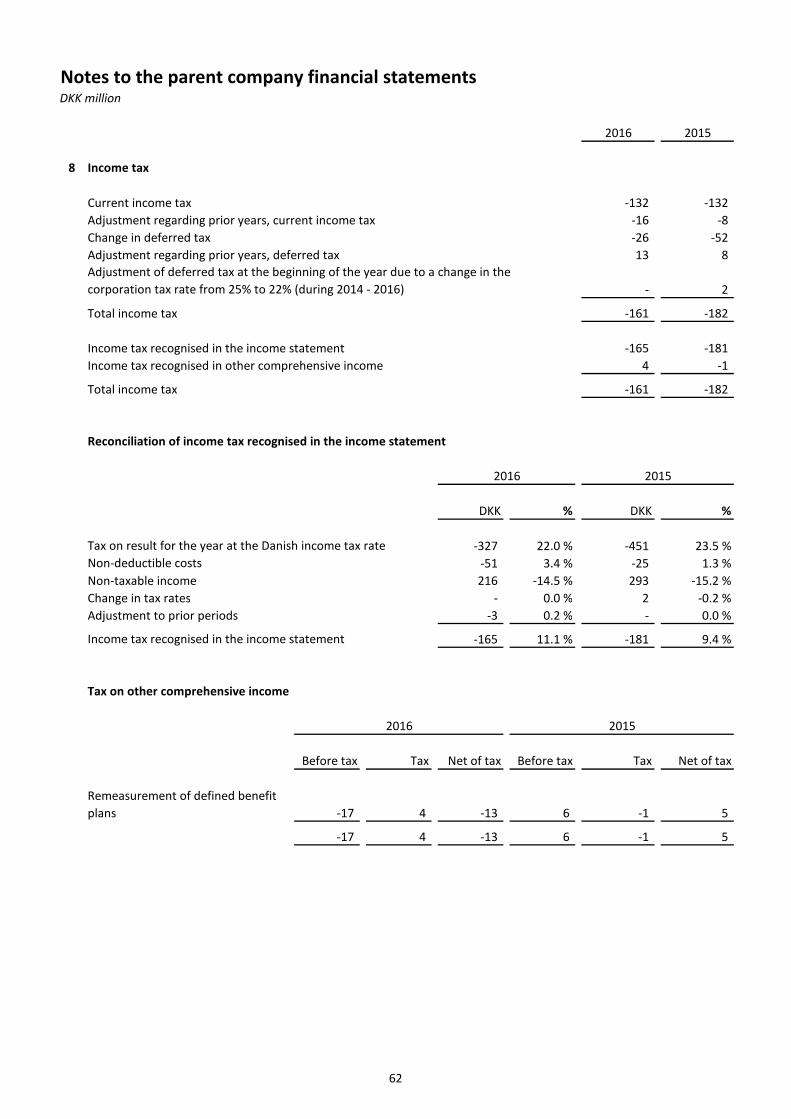
Notes to the parent company financial statementsDKK million
2016 2015
8 Income tax
Current income tax -132 -132 Adjustment regarding prior years, current income tax -16 -8 Change in deferred tax -26 -52 Adjustment regarding prior years, deferred tax 13 8
- 2
Total income tax -161 -182
Income tax recognised in the income statement -165 -181 Income tax recognised in other comprehensive income 4 -1
Total income tax -161 -182
Reconciliation of income tax recognised in the income statement
DKK % DKK %
-327 22.0 % -451 23.5 %-51 3.4 % -25 1.3 %
Non-taxable income 216 -14.5 % 293 -15.2 %Change in tax rates - 0.0 % 2 -0.2 %Adjustment to prior periods -3 0.2 % - 0.0 %
-165 11.1 % -181 9.4 %
Tax on other comprehensive income
Before tax Tax Net of tax Before tax Tax Net of tax
Remeasurement of defined benefit plans -17 4 -13 6 -1 5
-17 4 -13 6 -1 5
2016 2015
Adjustment of deferred tax at the beginning of the year due to a change in the corporation tax rate from 25% to 22% (during 2014 - 2016)
2016 2015
Tax on result for the year at the Danish income tax rateNon-deductible costs
Income tax recognised in the income statement
62
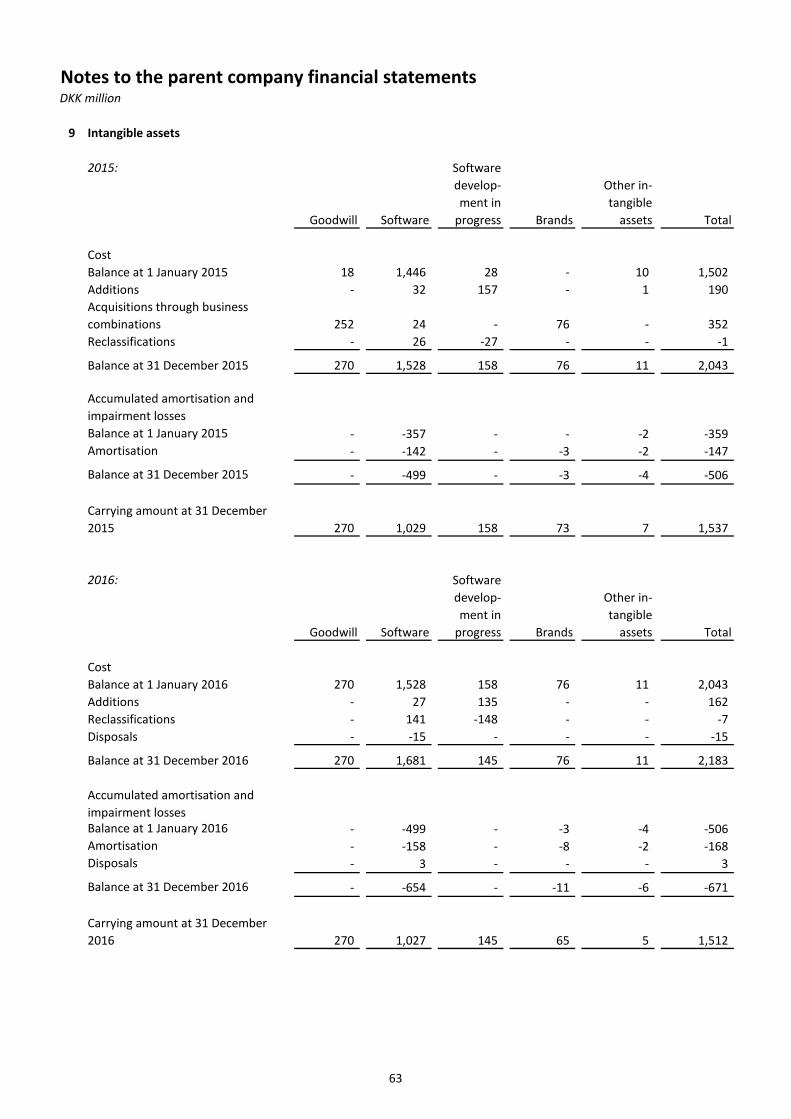
Notes to the parent company financial statementsDKK million
9 Intangible assets
2015:
Goodwill Software
Software develop-ment in
progress Brands
Other in- tangible
assets Total
CostBalance at 1 January 2015 18 1,446 28 - 10 1,502 Additions - 32 157 - 1 190 Acquisitions through business combinations 252 24 - 76 - 352 Reclassifications - 26 -27 - - -1
Balance at 31 December 2015 270 1,528 158 76 11 2,043
Accumulated amortisation and impairment lossesBalance at 1 January 2015 - -357 - - -2 -359 Amortisation - -142 - -3 -2 -147
Balance at 31 December 2015 - -499 - -3 -4 -506
Carrying amount at 31 December 2015 270 1,029 158 73 7 1,537
2016:
Goodwill Software
Software develop-ment in
progress Brands
Other in- tangible
assets Total
CostBalance at 1 January 2016 270 1,528 158 76 11 2,043 Additions - 27 135 - - 162 Reclassifications - 141 -148 - - -7 Disposals - -15 - - - -15
Balance at 31 December 2016 270 1,681 145 76 11 2,183
Accumulated amortisation and impairment lossesBalance at 1 January 2016 - -499 - -3 -4 -506 Amortisation - -158 - -8 -2 -168 Disposals - 3 - - - 3
Balance at 31 December 2016 - -654 - -11 -6 -671
Carrying amount at 31 December 2016 270 1,027 145 65 5 1,512
63

Notes to the parent company financial statementsDKK million
10 Property, plant and equipment
2015: Fixtures and fittings, tools
and equipment
Leasehold improve-
mentsAssets under construction Total
CostBalance at 1 January 2015 3,256 682 16 3,954 Additions 256 4 15 275 Reclassifications 9 6 -14 1 Disposals -86 -14 - -100
Balance at 31 December 2015 3,435 678 17 4,130
Accumulated depreciation and impairment lossesBalance at 1 January 2015 -2,308 -557 -2,865 Depreciation -208 -16 -224 Impairment losses recognised in the income statement -1 - -1 Disposals 87 11 98
Balance at 31 December 2015 -2,430 -562 - -2,992
Carrying amount at 31 December 2015 1,005 116 17 1,138
2016: Fixtures and fittings, tools
and equipment
Leasehold improve-
mentsAssets under construction Total
CostBalance at 1 January 2016 3,435 678 17 4,130 Additions 444 28 6 478 Reclassifications 23 - -17 6 Disposals -109 -10 - -119
Balance at 31 December 2016 3,793 696 6 4,495
Accumulated depreciation and impairment lossesBalance at 1 January 2016 -2,430 -562 -2,992 Depreciation -257 -16 -273 Reversals of impairment losses recognised in the income statement 2 - 2 Disposals 105 9 114
Balance at 31 December 2016 -2,580 -569 - -3,149
Carrying amount at 31 December 2016 1,213 127 6 1,346
64

Notes to the parent company financial statementsDKK million
2016 2015
11 Investments in subsidiaries
CostBalance at 1 January 10,225 10,171 Profit for the year, F. Salling A/S - 54
Balance at 31 December 10,225 10,225
Value adjustmentsBalance at 1 January 2,889 1,783 Changes to accounting policies, subsidiaries -15
Adjusted balance at 1 January 2,889 1,768 Dividends - -150 Foreign currency translation -194 47 Other comprehensive income for the year -160 31 Profit for the year 981 1,193
Balance at 31 December 3,516 2,889
Carrying amount at 31 December 13,741 13,114
12 Investments in joint ventures
CostBalance at 1 January 221 74 Additions 203 147
Balance at 31 December 424 221
Value adjustmentsBalance at 1 January -108 -30 Dividends -44 - Foreign currency translation -35 4 Profit for the year -205 -82
Balance at 31 December -392 -108
Carrying amount at 31 December 32 113
Specification of investments in joint ventures:
Netto UK Ltd. 50 %
For information about business combinations, please refer to note 24.
For a list of subsidiaries please refer to note 2 in the notes to the consolidated financial statements.
In 2014 Dansk Supermarked A/S and J Sainsbury plc formed a joint venture with the purpose of bringing the Netto brand back to the UK. During 2016 it was decided together with J Sainsbury plc. to end the joint venture as it proved difficult to reach sufficient scale due to a lack of availability of appropriate sites.
Share of issued share capital and voting rights
Principal place of business and country of incorporation
Wakefield, the UK
65

Notes to the parent company financial statementsDKK million
13 Financial assets and financial liabilities
Financial assets comprise the following:
2016 2015 2016 2015
Derivatives not designated as hedges 303 143 303 143
Other non-current financial assets 303 143 303 143
Trade receivables 149 68 149 68
Other receivables 287 241 287 241
Receivables from subsidiaries 949 1,321 949 1,321 Receivables from joint ventures - 15 - 15 Receivables from other related parties 1 5 1 5 Derivatives not designated as hedges 86 60 86 60
Other current financial assets 1,036 1,401 1,036 1,401
Securities 4,334 3,960 4,334 3,960
Cash and short-term deposits 788 1,457 788 1,457
Financial liabilities comprise the following:
2016 2015 2016 2015
Payables to entities with significant influence - 256 - 256 Payables to subsidiaries 1,733 1,785 1,733 1,785 Derivatives not designated as hedges 303 143 303 143 Other non-current financial liabilities - 5 - 5
Other non-current financial liabilities 2,036 2,189 2,036 2,189
Payables to entities with significant influence 308 - 308 - Payables to subsidiaries 8,501 8,092 8,501 8,092 Derivatives not designated as hedges 91 91 91 91 Other current financial liabilities 2 1 2 1
Other current financial liabilities 8,902 8,184 8,902 8,184
Trade payables 6,759 5,580 6,759 5,580
Other payables 1,751 1,667 1,751 1,667
Carrying amount Fair value
Carrying amount Fair value
66
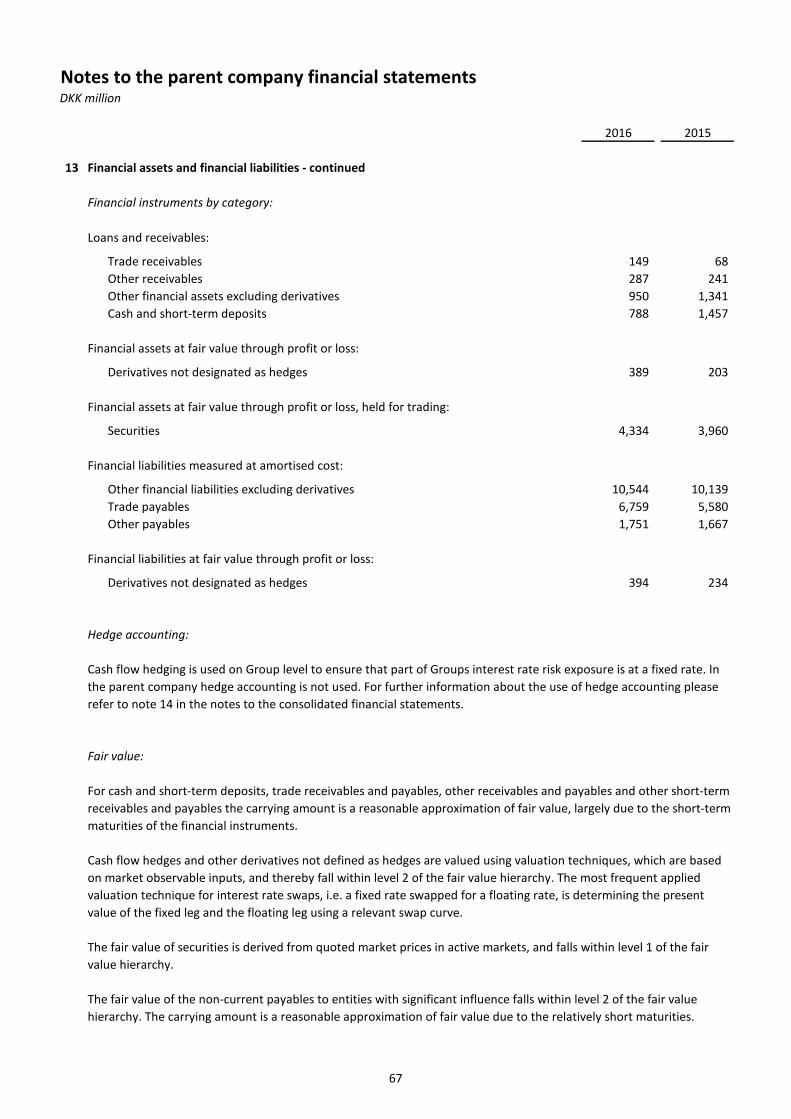
Notes to the parent company financial statementsDKK million
2016 2015
13 Financial assets and financial liabilities - continued
Financial instruments by category:
Loans and receivables:
Trade receivables 149 68 Other receivables 287 241 Other financial assets excluding derivatives 950 1,341 Cash and short-term deposits 788 1,457
Financial assets at fair value through profit or loss:
Derivatives not designated as hedges 389 203
Financial assets at fair value through profit or loss, held for trading:
Securities 4,334 3,960
Financial liabilities measured at amortised cost:
Other financial liabilities excluding derivatives 10,544 10,139 Trade payables 6,759 5,580 Other payables 1,751 1,667
Financial liabilities at fair value through profit or loss:
Derivatives not designated as hedges 394 234
Hedge accounting:
Fair value:
Cash flow hedging is used on Group level to ensure that part of Groups interest rate risk exposure is at a fixed rate. In the parent company hedge accounting is not used. For further information about the use of hedge accounting please refer to note 14 in the notes to the consolidated financial statements.
For cash and short-term deposits, trade receivables and payables, other receivables and payables and other short-term receivables and payables the carrying amount is a reasonable approximation of fair value, largely due to the short-term maturities of the financial instruments.
Cash flow hedges and other derivatives not defined as hedges are valued using valuation techniques, which are based on market observable inputs, and thereby fall within level 2 of the fair value hierarchy. The most frequent applied valuation technique for interest rate swaps, i.e. a fixed rate swapped for a floating rate, is determining the present value of the fixed leg and the floating leg using a relevant swap curve.
The fair value of securities is derived from quoted market prices in active markets, and falls within level 1 of the fair value hierarchy.
The fair value of the non-current payables to entities with significant influence falls within level 2 of the fair value hierarchy. The carrying amount is a reasonable approximation of fair value due to the relatively short maturities.
67

Notes to the parent company financial statementsDKK million
13 Financial assets and financial liabilities - continued
Risks arising from financial instruments:
Currency risks:
31 December 2016 EUR/DKK GBP/DKK PLN/DKK SEK/DKK USD/DKK
Financial assets 54 2 715 247 54 Financial liabilities -551 -123 - - - Known USD purchase orders - - - - -447
Net exposures before derivatives -497 -121 715 247 -393 Derivatives 401 123 -362 -198 430
Net exposures after derivatives -96 2 353 49 37
The net exposure relates to:
-96 2 353 49 37
Applied sensitivity 1 % 5 % 5 % 5 % 5 %
Impact on the income statement -1 - 18 2 2
The following overview illustrates the effect on the parent company income statement and the parent company's equity that would result, at the balance sheet date, from changes in currency exchange rates that are reasonable possible for material currencies:
Fair value of the remaining borrowing items falls within level 2 of the fair value hierarchy and is calculated on the basis of discounted interests and instalments.
Hedging of expected commercial cash flows where hedge accounting is not used
The parent company's main risks are market risks relating to fluctuations in foreign exchange rates and interest rates, liquidity risk relating to the availability of funds to support business needs and credit risk relating to the undesirable event of a default among the parent company's financial counterparties. There has been no structural changes in the risk exposure or risks compared to 2015.
For an in depth description of the policies for managing risks please refer to note 14 in the notes to the consolidated financial statements.
Foreign currency risk is the risk that the fair value or future cash flows of an exposure will fluctuate because of changes in foreign exchange rates. The parent company's exposure to the risk of changes in foreign exchange rate relates primarily to the operating activities and the net investments in foreign subsidiaries. The framework for hedging guidelines and risk mandate is covered by the FX risk management policy.
For a description of the FX risk management please refer to note 14 in the notes to the consolidated financial statements.
68
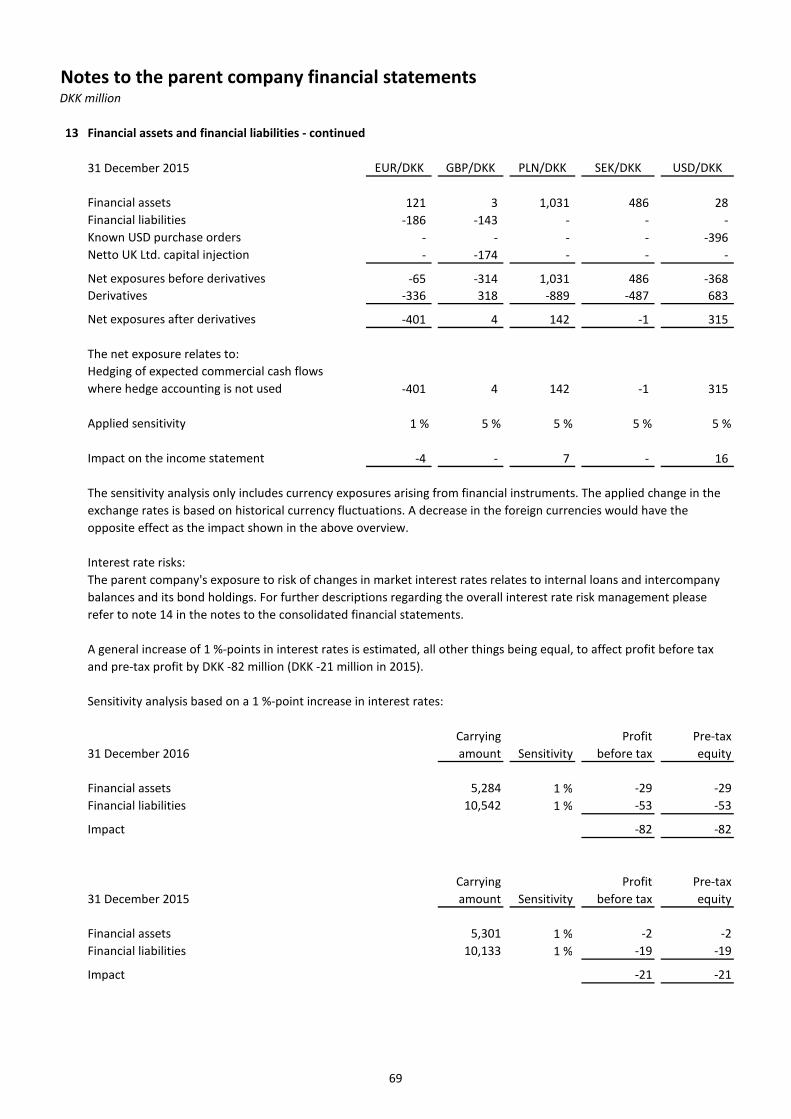
Notes to the parent company financial statementsDKK million
13 Financial assets and financial liabilities - continued
31 December 2015 EUR/DKK GBP/DKK PLN/DKK SEK/DKK USD/DKK
Financial assets 121 3 1,031 486 28 Financial liabilities -186 -143 - - - Known USD purchase orders - - - - -396 Netto UK Ltd. capital injection - -174 - - -
Net exposures before derivatives -65 -314 1,031 486 -368 Derivatives -336 318 -889 -487 683
Net exposures after derivatives -401 4 142 -1 315
The net exposure relates to:
-401 4 142 -1 315
Applied sensitivity 1 % 5 % 5 % 5 % 5 %
Impact on the income statement -4 - 7 - 16
Interest rate risks:
Sensitivity analysis based on a 1 %-point increase in interest rates:
31 December 2016Carrying amount Sensitivity
Profit before tax
Pre-tax equity
Financial assets 5,284 1 % -29 -29Financial liabilities 10,542 1 % -53 -53
Impact -82 -82
31 December 2015Carrying amount Sensitivity
Profit before tax
Pre-tax equity
Financial assets 5,301 1 % -2 -2Financial liabilities 10,133 1 % -19 -19
Impact -21 -21
The parent company's exposure to risk of changes in market interest rates relates to internal loans and intercompany balances and its bond holdings. For further descriptions regarding the overall interest rate risk management please refer to note 14 in the notes to the consolidated financial statements.
A general increase of 1 %-points in interest rates is estimated, all other things being equal, to affect profit before tax and pre-tax profit by DKK -82 million (DKK -21 million in 2015).
The sensitivity analysis only includes currency exposures arising from financial instruments. The applied change in the exchange rates is based on historical currency fluctuations. A decrease in the foreign currencies would have the opposite effect as the impact shown in the above overview.
Hedging of expected commercial cash flows where hedge accounting is not used
69
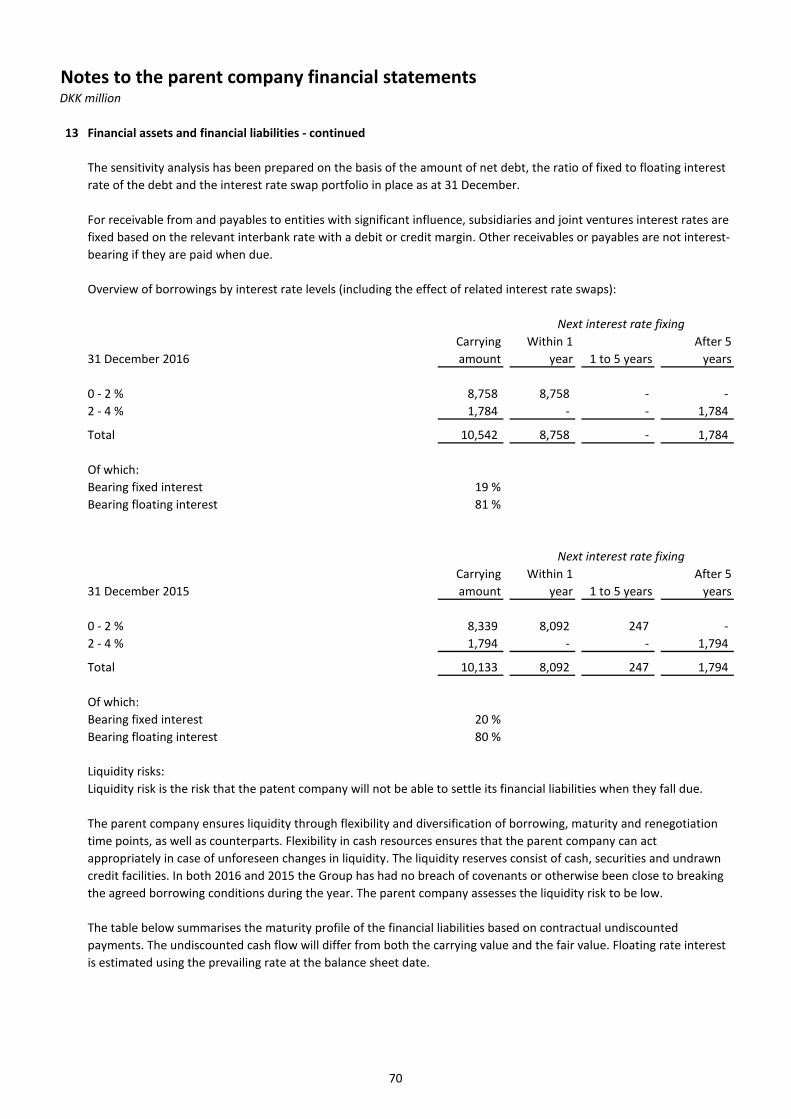
Notes to the parent company financial statementsDKK million
13 Financial assets and financial liabilities - continued
Overview of borrowings by interest rate levels (including the effect of related interest rate swaps):
31 December 2016Carrying amount
Within 1 year 1 to 5 years
After 5 years
0 - 2 % 8,758 8,758 - - 2 - 4 % 1,784 - - 1,784
Total 10,542 8,758 - 1,784
Of which:Bearing fixed interest 19 %Bearing floating interest 81 %
31 December 2015Carrying amount
Within 1 year 1 to 5 years
After 5 years
0 - 2 % 8,339 8,092 247 - 2 - 4 % 1,794 - - 1,794
Total 10,133 8,092 247 1,794
Of which:Bearing fixed interest 20 %Bearing floating interest 80 %
Liquidity risks:
Next interest rate fixing
The sensitivity analysis has been prepared on the basis of the amount of net debt, the ratio of fixed to floating interest rate of the debt and the interest rate swap portfolio in place as at 31 December.
Liquidity risk is the risk that the patent company will not be able to settle its financial liabilities when they fall due.
The parent company ensures liquidity through flexibility and diversification of borrowing, maturity and renegotiation time points, as well as counterparts. Flexibility in cash resources ensures that the parent company can act appropriately in case of unforeseen changes in liquidity. The liquidity reserves consist of cash, securities and undrawn credit facilities. In both 2016 and 2015 the Group has had no breach of covenants or otherwise been close to breaking the agreed borrowing conditions during the year. The parent company assesses the liquidity risk to be low.
For receivable from and payables to entities with significant influence, subsidiaries and joint ventures interest rates are fixed based on the relevant interbank rate with a debit or credit margin. Other receivables or payables are not interest-bearing if they are paid when due.
Next interest rate fixing
The table below summarises the maturity profile of the financial liabilities based on contractual undiscounted payments. The undiscounted cash flow will differ from both the carrying value and the fair value. Floating rate interest is estimated using the prevailing rate at the balance sheet date.
70

Notes to the parent company financial statementsDKK million
13 Financial assets and financial liabilities - continued
31 December 2016Within 1
year 1 to 5 yearsAfter 5 years
Trade and other payables 17,321 218 1,515 Derivatives 83 374 204
Total 17,404 592 1,719
31 December 2015Within 1
year 1 to 5 yearsAfter 5 years
Trade and other payables 15,340 300 1,746 Derivatives 63 334 267
Total 15,403 634 2,013
Credit risks:
2016 2015
Not due 70 40 < 30 days past due 14 9 30 to 90 days past due 28 11 90 to 180 days past due 15 - > 180 days past due 22 8
Total 149 68
Credit risk is the risk that a counterparty will not meet its obligations under a financial instrument leading to a financial loss or a counterparty not being able to meet any other obligations leading to a financial loss. The parent company is exposed to credit risk from its operating activities (primarily trade receivables) and from its financing activities, including deposits with banks and financial institutions, foreign exchange transactions and other financial instruments.
The parent company prepares credit ratings of financial counterparties on a regular basis. Credit risks are managed on the basis of internal credit ratings and credit lines for financial counterparties. The credit lines are determined on the basis of the counterparties' creditworthiness and local market risks.
The parent company is exposed to credit risks from trade receivables, balances with banks in the form of deposits and other financial instruments. The majority of the parent company's sales are made in cash, and therefore, the credit risks are very low. The parent company reduces its credit risks with banks by only doing business with banks with high credit ratings. Moreover, excess liquidity is deposited with banks or placed in liquid government and mortgage bonds with a rating of minimum Aa2. The overall duration of the bond portfolio will typically be low, currently 2.2.
The table below summarises the ageing analysis of trade receivables, which are not impaired:
71

Notes to the parent company financial statementsDKK million
2016 2015
14 Inventories
Goods held for resale 3,276 3,497 Consumables 21 22
Total inventories 3,297 3,519
15 Equity
Share capital:
1,048,223 shares of DKK 500 524 524
Total share capital 524 524
Retained earnings:
In the income statement as part of cost of sales DKK 8 million have been recognised regarding write-downs of inventories to net realisable value (DKK 6 million in 2015).
In 2015 an increase of equity of DKK 1,237 million took place, consisting of an increase of share capital of DKK 24 million and of share premium of DKK 1,213 million. As a consequence of recognising the non-cash contribution of F. Salling A/S using the pooling of interests method in the parent company's separate financial statements a reduction of the equity also took place in 2015, so that the net change of the equity equalled the net assets of F. Salling A/S at the point of the non-cash contribution (DKK 339 million). The changes are not visible on the parent company statement of changes in equity as the parent company equity is presented as if F. Salling A/S had always been a subsidiary of Dansk Supermarked A/S.
As at 31 December, the share capital, which consists of one share class, comprises:
There has been no changes to the share capital during 2012 - 2014 or in 2016. In 2015 48,223 new shares were issued to F. Salling Holding A/S and A.P. Møller Mærsk A/S in connection with the non-cash contribution of F. Salling A/S. All shares have been fully paid.
During the 2016 financial year a dividend of DKK 2,700 million has been paid (DKK 0 million in 2015). A dividend for the 2016 financial year of DKK 150 million is proposed. Payment of dividends to shareholders does not trigger taxes for the parent company.
72

Notes to the parent company financial statementsDKK million
2016 2015
16 Pensions
Changes in the present value of the defined benefit obligation:
Defined benefit obligation at 1 January 286 304 Interest expenses recognised as part of staff expenses 3 3 Actuarial gains / losses, demographic assumptions 3 4 Actuarial gains / losses, financial assumptions 12 -12 Actuarial gains / losses, experience adjustments 2 2 Payments from the plan -15 -15
Defined benefit obligation at 31 December 291 286
The following significant actuarial assumptions are applied:
Discount rate (%) 0.5 % 1.1 %
Price inflation (%) 1.8 % 1.9 %
Discount rate:Increase of 0.5 % point -15 -15
Decrease of 0.5 % point 17 17
Price inflation:Increase of 0.5 % point 17 16
Decrease of 0.5 % point -15 -15
The parent company has entered into pension schemes and similar arrangements with most of the parent company's employees. The majority of the parent company's pension schemes are defined contribution plans. For a few former employees and some members of the founder's family defined benefit plans exist. Some of the defined benefit plans are time limited, whereas others are lifelong. The defined benefit plans guarantee fixed amounts per year adjusted for price inflation and the plans are fully unfunded.
Life expectations are based on the Danish FSA's longevity benchmarks for the individual financial years.
A quantitative sensitivity analysis for the significant actuarial assumptions is shown below:
The sensitivity analyses are based on a change in a significant assumption, keeping all other assumptions constant. The sensitivity analyses may not be representative of an actual change in the defined benefit obligation as it is unlikely that changes in assumptions would occur in isolation of one another.
No contributions will be made to the plans in the future. The average duration of the defined benefit obligation as at 31 December 2016 is 34 years (35 years in 2015). DKK 15 million is expexted to be paid from the plans in 2017.
73

Notes to the parent company financial statementsDKK million
17 Deferred tax
Deferred tax relates to the following:
2016 2015 2016 2015
Intangible assets -3 13 276 279 Property, plant and equipment 20 26 -4 -24 Provisions 2 11 -64 -62 Other -2 -9 -42 -40
Deferred tax expense/income / Net deferred tax 17 41 166 153
Deferred tax is recognised in the parent company statement of financial position as follows:
Deferred tax liabilities 166 153
Net deferred tax 166 153
Reconciliation of net deferred tax:
Opening balance at 1 January 153 94 Adjustment of deferred tax recognised in the income statement 17 41 Adjustment of deferred tax recognised in other comprehensive income -4 1 Deferred tax acquired in business combinations - 17
Closing balance at 31 December 166 153
18 Provisions
2015: Onerous contracts Other Total
Balance at 1 January 2015 118 47 165 10 10 20 -3 -4 -7
Reversals during the year -1 -6 -7
124 47 171
Current 5 9 14 Non-current 119 38 157
Balance at 31 December 2015 124 47 171
Parent company income statement
Parent company statement of financial position
Provisions made during the yearProvisions utilised during the year
Balance at 31 December 2015
74
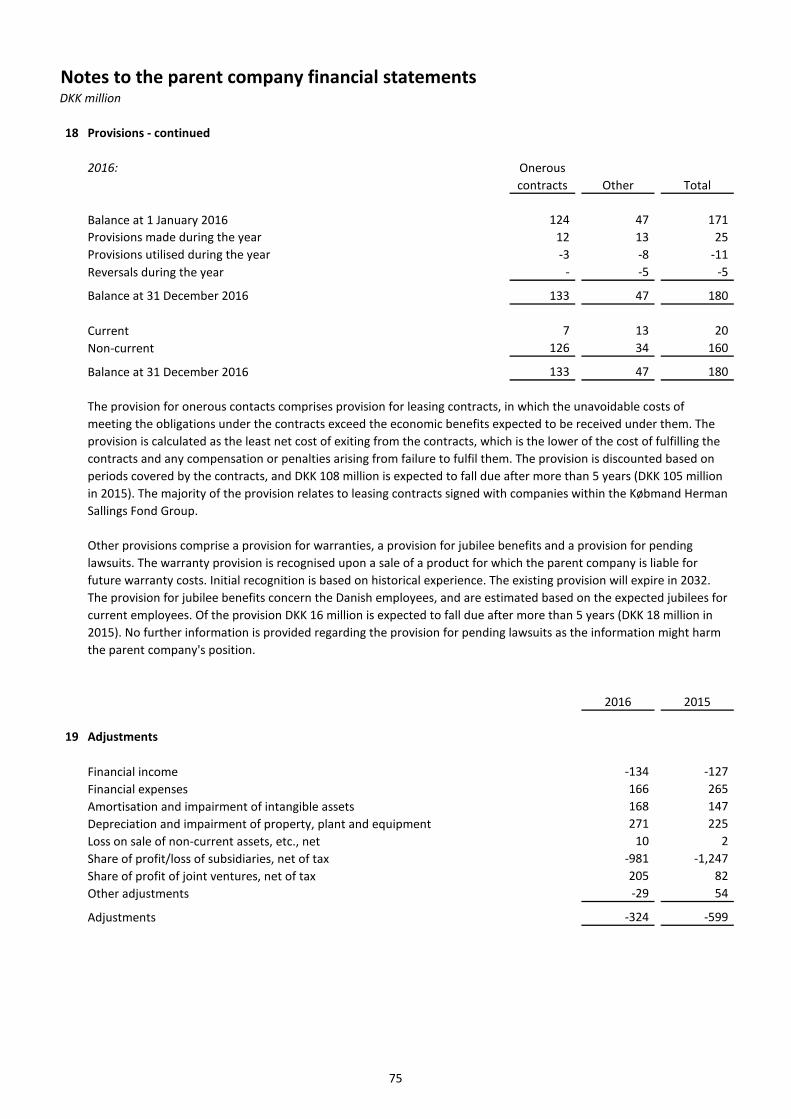
Notes to the parent company financial statementsDKK million
18 Provisions - continued
2016: Onerous contracts Other Total
Balance at 1 January 2016 124 47 171 12 13 25 -3 -8 -11
Reversals during the year - -5 -5
133 47 180
Current 7 13 20 Non-current 126 34 160
Balance at 31 December 2016 133 47 180
2016 2015
19 Adjustments
Financial income -134 -127 Financial expenses 166 265 Amortisation and impairment of intangible assets 168 147 Depreciation and impairment of property, plant and equipment 271 225 Loss on sale of non-current assets, etc., net 10 2 Share of profit/loss of subsidiaries, net of tax -981 -1,247 Share of profit of joint ventures, net of tax 205 82 Other adjustments -29 54
Adjustments -324 -599
Balance at 31 December 2016
The provision for onerous contacts comprises provision for leasing contracts, in which the unavoidable costs of meeting the obligations under the contracts exceed the economic benefits expected to be received under them. The provision is calculated as the least net cost of exiting from the contracts, which is the lower of the cost of fulfilling the contracts and any compensation or penalties arising from failure to fulfil them. The provision is discounted based on periods covered by the contracts, and DKK 108 million is expected to fall due after more than 5 years (DKK 105 million in 2015). The majority of the provision relates to leasing contracts signed with companies within the Købmand Herman Sallings Fond Group.
Other provisions comprise a provision for warranties, a provision for jubilee benefits and a provision for pending lawsuits. The warranty provision is recognised upon a sale of a product for which the parent company is liable for future warranty costs. Initial recognition is based on historical experience. The existing provision will expire in 2032. The provision for jubilee benefits concern the Danish employees, and are estimated based on the expected jubilees for current employees. Of the provision DKK 16 million is expected to fall due after more than 5 years (DKK 18 million in 2015). No further information is provided regarding the provision for pending lawsuits as the information might harm the parent company's position.
Provisions made during the yearProvisions utilised during the year
75

Notes to the parent company financial statementsDKK million
2016 2015
20 Change in working capital
Change in trade and other receivables and prepayments -88 -131 Change in inventories 222 65 Change in trade and other payables 1,259 868
Change in working capital 1,393 802
21 Cash and cash equivalents
Cash and bank balances 788 1,457
Cash and cash equivalents available to the parent company 788 1,457
22 Contingent liabilities and other financial commitments
Operating leases, the parent company is lessee:
Within 1 year 274 268 1 to 5 years 305 337 After 5 years 36 49
Total 615 654
5 13
Minimum lease payments recognised as operating lease expenses 276 281
Sublease payments recognised as a reduction of operating lease expenses 3 3
The parent company has also entered into a number of operating leases with terms of up to 20 years with companies within the Købmand Herman Sallings Fond Group, in which the future minimum rentals payable amount to DKK 16 billion (DKK 16 billion in 2015). Minimum lease payments recognised as an operating lease expense amount to DKK 1,232 million (DKK 1,176 million in 2015).
The parent company has entered into operating leases with external parties regarding a number of stores, warehouses and some operational equipment. The leases have terms of between 1 month and 13 years. Under some of the leases the parent company has the option to continue the lease of the assets beyond the agreed upon lease terms. The lease arrangements imposes no restrictions on the parent company.
Future minimum rentals payable under non-cancellable operating leases are as follows:
Future minimum sublease payments expected to be received under non-cancellable subleases
76
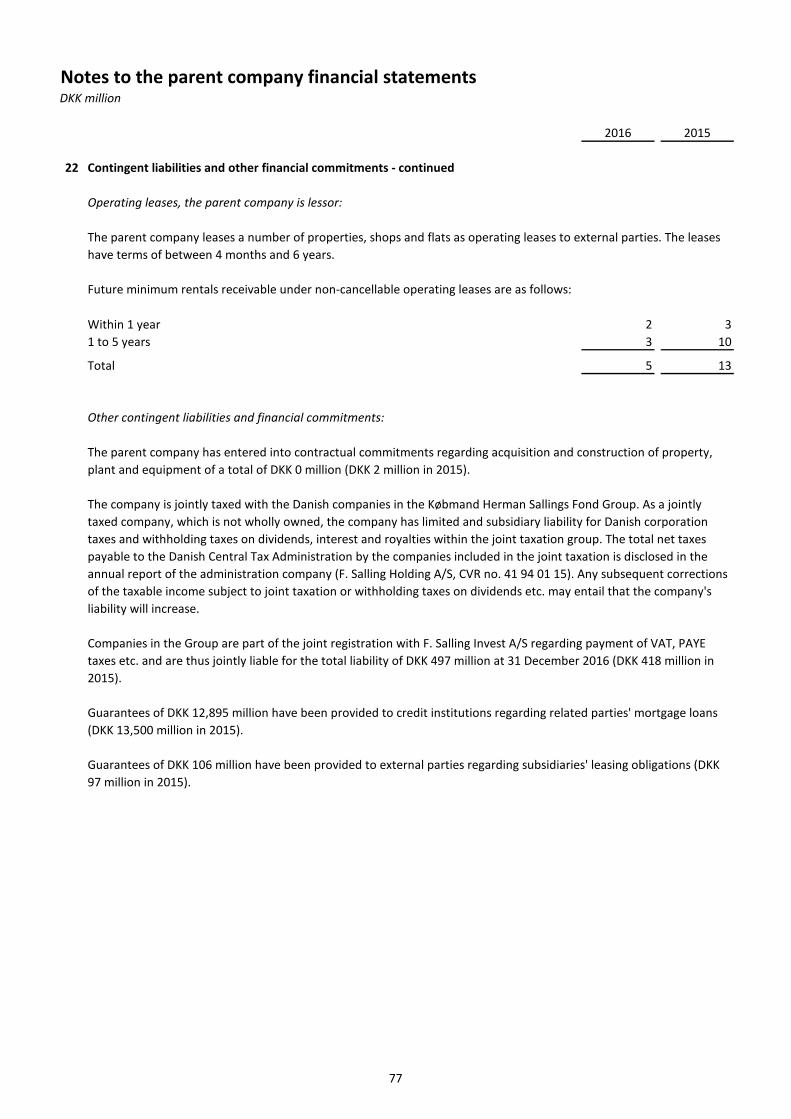
Notes to the parent company financial statementsDKK million
2016 2015
22 Contingent liabilities and other financial commitments - continued
Operating leases, the parent company is lessor:
Within 1 year 2 3 1 to 5 years 3 10
Total 5 13
Other contingent liabilities and financial commitments:
The company is jointly taxed with the Danish companies in the Købmand Herman Sallings Fond Group. As a jointly taxed company, which is not wholly owned, the company has limited and subsidiary liability for Danish corporation taxes and withholding taxes on dividends, interest and royalties within the joint taxation group. The total net taxes payable to the Danish Central Tax Administration by the companies included in the joint taxation is disclosed in the annual report of the administration company (F. Salling Holding A/S, CVR no. 41 94 01 15). Any subsequent corrections of the taxable income subject to joint taxation or withholding taxes on dividends etc. may entail that the company's liability will increase.
The parent company leases a number of properties, shops and flats as operating leases to external parties. The leases have terms of between 4 months and 6 years.
Future minimum rentals receivable under non-cancellable operating leases are as follows:
The parent company has entered into contractual commitments regarding acquisition and construction of property, plant and equipment of a total of DKK 0 million (DKK 2 million in 2015).
Companies in the Group are part of the joint registration with F. Salling Invest A/S regarding payment of VAT, PAYE taxes etc. and are thus jointly liable for the total liability of DKK 497 million at 31 December 2016 (DKK 418 million in 2015).
Guarantees of DKK 12,895 million have been provided to credit institutions regarding related parties' mortgage loans (DKK 13,500 million in 2015).
Guarantees of DKK 106 million have been provided to external parties regarding subsidiaries' leasing obligations (DKK 97 million in 2015).
77

Notes to the parent company financial statementsDKK million
2016 2015
23 Related party disclosures
Entities with controlling influence over the parent company:Donations from Købmand Herman Sallings Fond 15 12
Entities with significant influence over the parent company:Leasing expense -26 -25 Interests paid -5 -5 Dividend paid -2,187 -
Subsidiaries:Sales of goods and services 195 167 Purchase of goods and services -35 -26 Leasing expense -1,206 -1,151 Interests paid -115 -107 Dividend received - 150
Joint ventures:Sales of goods and services 18 15 Purchase of goods and services -12 -1 Dividend received 44 -
Key management personnel
24 Business combinations
As at 1 January 2016 Dansk Supermarked A/S merged with the subsidiaries wupti.com A/S and Thomberg ApS.
For a description of the business combinations during 2015 please refer to note 26 in the notes to the consolidated financial statements.
All outstanding balances with related parties as at 31 December are presented in note 13. All outstanding balances carry interest and are to be settled in cash within 1 year unless otherwise specified in note 13.
None of the outstanding balances are secured, and no provisions are held against the balances as at 31 December (DKK 0 in 2015). No expense has been recognised in 2016 or 2015 for bad or doubtful debts.
Any guarantees Dansk Supermarked A/S has provided for associates are listed in note 22.
For a description of the key management personnel and an overview of the key management personnel remuneration please refer to note 25 in the notes to the consolidated financial statements.
All related party transactions take place at an arm's length basis. The following related party transactions were carried out with related parties:
78
Notes to the parent company financial statementsDKK million
25 Capital management
26 Events after the reporting period
No subsequent events have occurred that affect the annual report for 2016.
27 Standards issued but not yet effective
For a description of standards issued but not yet effective please refer to note 29 in the notes to the consolidated financial statements.
For a description of the capital management please refer to note 27 in the notes to the consolidated financial statements.
79


![C LAUS B RABRAND © C ONCURRENCY (Q3,’06) J AN 19, 2006 C ONCURRENCY Claus Brabrand brabrand@daimi.au.dk [ brabrand/ ]brabrand](https://static.fdocuments.us/doc/165x107/56649d245503460f949fb1be/c-laus-b-rabrand-c-oncurrency-q306-j-an-19-2006-c-oncurrency-claus.jpg)
![C LAUS B RABRAND S EMANTICS (Q1,’05) S EP 22, 2005 C LAUS B RABRAND © 2005, University of Aarhus [ brabrand@daimi.au.dk ] [ brabrand](https://static.fdocuments.us/doc/165x107/56649d7f5503460f94a631c6/c-laus-b-rabrand-s-emantics-q105-s-ep-22-2005-c-laus-b-rabrand-2005.jpg)


![Claus Brabrand, ITU, Denmark Mar 04, 2008BLACK-BOX TESTING Black-Box Testing Claus Brabrand [ brabrand@itu.dk ] ( “FÅP”: First-year Project Course, ITU,](https://static.fdocuments.us/doc/165x107/56649d4a5503460f94a27e41/claus-brabrand-itu-denmark-mar-04-2008black-box-testing-black-box-testing.jpg)


![C LAUS B RABRAND S EMANTICS (Q1,’05) S EP 8, 2005 C LAUS B RABRAND © 2005, University of Aarhus [ brabrand@daimi.au.dk ] [ brabrand](https://static.fdocuments.us/doc/165x107/56649d375503460f94a10296/c-laus-b-rabrand-s-emantics-q105-s-ep-8-2005-c-laus-b-rabrand-2005.jpg)


![Claus Brabrand, ITU, Denmark Feb 02, 2010TESTING Førsteårsprojekt (F2010) Claus Brabrand [ brabrand@itu.dk ] IT University of Copenhagen.](https://static.fdocuments.us/doc/165x107/56649c785503460f9492d6d3/claus-brabrand-itu-denmark-feb-02-2010testing-forstearsprojekt-f2010.jpg)
![C LAUS B RABRAND C ONCURRENCY (Q3,’06) M AR 13, 2006 C LAUS B RABRAND © 2005, University of Aarhus [ brabrand@daimi.au.dk ] [ brabrand](https://static.fdocuments.us/doc/165x107/56649d545503460f94a303f1/c-laus-b-rabrand-c-oncurrency-q306-m-ar-13-2006-c-laus-b-rabrand-.jpg)
![[ 1 ] Claus Brabrand, ITU BANANA ALGEBRA March 28, 2009 ETAPS/LDTA, York Banana Algebra: Jacob Andersen [ jacand@cs.au.dk ] Aarhus University Claus Brabrand.](https://static.fdocuments.us/doc/165x107/551a8f4b550346761a8b574d/-1-claus-brabrand-itu-banana-algebra-march-28-2009-etapsldta-york-banana-algebra-jacob-andersen-jacandcsaudk-aarhus-university-claus-brabrand.jpg)