Annual Report 2016 - Bauer Group · BAUER Aktiengesellschaft Annual Report 2016 2 Milestones in the...
176
Annual Report 2016
Transcript of Annual Report 2016 - Bauer Group · BAUER Aktiengesellschaft Annual Report 2016 2 Milestones in the...

Annual Report 2016

The BAUER Group is a leading provider of services, equipment and products
related to ground and groundwater. With over 110 subsidiaries, Bauer operates
a worldwide network on all continents.
The operations of the Group are divided into three future-oriented segments with
high synergy potential: Construction, Equipment and Resources. The Construction
segment offers new and innovative specialist foundation engineering services
alongside the established ones, and carries out foundation and excavation work,
cut-off walls and ground improvements worldwide. Bauer is a world market leader
in the Equipment segment and provides a full range of equipment for specialist
foundation engineering as well as for the exploration, mining and extraction of
natural resources. In the Resources segment, Bauer focuses on highly innovative
products and services in the areas of water, environment and natural resources.
Bauer profits greatly from the collaboration between its three separate segments,
enabling the Group to position itself as an innovative, highly specialized provider
of products and services for demanding projects in specialist foundation enginee-
ring and related markets. Bauer therefore offers suitable solutions to the greatest
problems in the world, such as urbanization, the growing infrastructure needs,
the environment and water, oil and gas.
The BAUER Group was founded in 1790 and is based in Schrobenhausen, Bavaria.
In 2016, it employed some 10,800 people in around 70 countries and achieved total
Group revenues of EUR 1.6 billion. BAUER Aktiengesellschaft is listed in the Prime
Standard of the German stock market.

The Group at a glance
GROUP KEY FIGURES 2013 – 2016
IFRS in EUR million 2013 2014 2015 2016 Change
2015/2016
Total Group revenues 1,504.2 1,560.2 1,656.4 1,586.1 -4.2 %
of which Germany 410.4 440.2 473.7 481.0 1.6 %
International 1,093.8 1,120.0 1,182.7 1,105.1 -6.6 %
International in % 72.7 71.8 71.4 69.7 n/a
of which Construction 741.7 725.6 742.9 722.1 -2.8 %
Equipment 628.6 639.2 753.1 651.7 -13.5 %
Resources 188.9 252.8 221.6 264.7 19.5 %
Other/Consolidation -55.0 -57.4 -61.2 -52.4 n/a
Consolidated revenues 1,447.5 1,506.0 1,587.9 1,488.6 -6.3 %
Sales revenues 1,402.2 1,375.7 1,379.0 1,396.9 1.3 %
Order intake 1,484.5 1,521.1 1,811.4 1,598.6 -11.8 %
Order backlog 765.2 762.7 995.6 1,008.1 1.3 %
EBITDA 124.0 171.0 185.1 158.4 -14.4 %
EBITDA margin in % (of sales revenues) 8.8 12.4 13.4 11.3 n/a
EBIT 30.1 76.4 90.7 68.3 -24.7 %
EBIT margin in % (of sales revenues) 2.1 5.6 6.6 4.9 n/a
Earnings after tax -19.4 15.7 29.0 14.4 -50.3 %
Capital investment in property, plant and equipment 91.9 64.1 83.2 88.5 6.4 %
Equity 419.8 418.9 451.2 434.1 -3.8 %
Equity ratio in % 26.5 26.6 27.2 25.5 n/a
Net assets 1,585.8 1,575.1 1,656.9 1,701.4 2.7 %
Earnings per share -0.99 0.85 1.73 0.66 -61.8 %
Distribution 0.00 2.57 2.57 1.71 * -33.3 %
Dividend per share in EUR 0.00 0.15 0.15 0.10 * -33.3 %
Return on equity after tax in % -4.2 3.7 6.9 3.2 n/a
Employees (on average over the year) 10,264 10,405 10,738 10,771 0.3 %
of which Germany 4,144 4,158 4,166 4,064 -2.4 %
International 6,120 6,247 6,572 6,707 2.1 %
* Proposed; subject to the consent of the Annual General Meeting to be held on June 29, 2017
At variance with the consolidated revenues presented in the Group income statement, the total Group revenues
presented here include portions of revenues from associated companies as well as revenues of non-consolidated
subsidiaries and joint ventures.

DEVELOPMENT OF TOTAL GROUP REVENUES BY SEGMENT
in EUR million
2013 1,504
2014 1,560
2015 1,656
2016 1,586
GR
OU
P K
EY
FIG
UR
ES
AT
A G
LA
NC
E
>>>
CONSTRUCTION SEGMENT KEY FIGURES
in EUR '000 2015 2016 Change
Total Group revenues 742,862 722,103 -2.8 %
Sales revenues 650,762 614,456 -5.6 %
Order intake 878,436 716,316 -18.5 %
Order backlog 591,059 585,272 -1.0 %
EBIT 13,916 30,385 n/a
Earnings after tax -7,316 9,463 n/a
Employees (on average over the year) 6,243 6,412 2.7 %
EQUIPMENT SEGMENT KEY FIGURES
in EUR '000 2015 2016 Change
Total Group revenues 753,083 651,715 -13.5 %
Sales revenues 548,039 542,688 -1.0 %
Order intake 649,108 667,649 2.9 %
Order backlog 128,096 144,030 12.4 %
EBIT 99,441 36,984 -62.8 %
Earnings after tax 65,397 10,946 -83.3 %
Employees (on average over the year) 2,919 2,753 -5.7 %
RESOURCES SEGMENT KEY FIGURES
in EUR '000 2015 2016 Change
Total Group revenues 221,609 264,712 19.5 %
Sales revenues 179,319 238,199 32.8 %
Order intake 345,045 267,044 -22.6 %
Order backlog 276,463 278,795 0.8 %
EBIT -19,807 -3,229 n/a
Earnings after tax -29,398 -8,452 n/a
Employees (on average over the year) 1,276 1,282 0.5 %
Construction Equipment Resources

BAUER AktiengesellschaftAnnual Report 2016
2 Milestones in the Company's History
4 Pictures of 2016
6 Mission and Strategy
8 The World is our Market
10 Foreword
13 Combined Management Report
62 The Bauer Share
64 Corporate Governance Report
68 Report of the Supervisory Board
71 Balance sheet and income statement
of BAUER Aktiengesellschaft
in accordance with HGB
75 Consolidated financial statements
in accordance with IFRS
166 Assurance by the legal representatives
167 Audit opinion
168 Imprint

2
Milestones in the Company's History
1958
Invention of the injection anchor on the construction site
of the Bayrischer Rundfunk building in Munich
1969
First anchor drilling rig UBW 01
1972
Construction of the new head office administration block
1975
First contracts in Libya, Saudi Arabia and the United Arab
Emirates
1976
First heavy-duty rotary drilling rig BG 7
1984
Work complex West begins operations; manufacture and
deployment of the first trench cutter
1902
Drilling of an artesian well for Schrobenhausen railway
station
1928
Dipl.-Ing. Karl Bauer constructs the Schrobenhausen water
supply system; construction of wells and water pipes
throughout Bavaria
1948
First works on Wittelsbacherstrasse
1840
Copper cladding for the steeple roof of St. Jakob's church
in Schrobenhausen
1900
Start of well drilling by Andreas Bauer
1790
Sebastian Bauer acquires a coppersmith's shop in the
center of Schrobenhausen; in the 19th century, subsequent
Bauer generations were engaged in copper working,
primarily for breweries and domestic households
1956
Dr.-Ing. Karlheinz Bauer, a shareholder in the company
since 1952, becomes sole managing director; construction
of a first office building in Wittelsbacherstrasse
Dipl.-Ing. Karl Bauer (left) turned the company into
an industrial well builder known throughout Bavaria.
Dr.-Ing. Karlheinz Bauer (center) led the company onto
the international stage, taking it into the field of specialist
foundation engineering and launching equipment manu-
facturing operations. Prof. Dr. Dipl.-Kfm. Thomas Bauer
shaped the current global Group, with a network of
operations on every continent.
1790 – 1948 1956 – 1984

3MILESTONES IN THE COMPANY'S HISTORY
1986
Prof. Thomas Bauer becomes sole managing director
of BAUER Spezialtiefbau GmbH and drives forward the
international growth of the Group
1990
Founding of BAUER und MOURIK Umwelttechnik GmbH
and of SPESA Spezialbau und Sanierung GmbH
1992
Takeover of SCHACHTBAU NORDHAUSEN GmbH
2008
Expansion of machinery manufacturing capacities in Aresing
and Nordhausen as well as in Tianjin and Shanghai, China
2009
Largest investment program in the company's history com-
pleted: administration building in Schrobenhausen, Edelshausen
plant, machinery manufacturing plant in Conroe, Texas, USA
2011
The first deep drilling rig is sold to South America
2012
During the year, the Group's global workforce topped the
10,000 mark for the first time
2013
Bauma Innovation Prize for an underwater drilling technique
2014
Execution of the Schwarzkopf Tunnel bypass railway project
2015
Joint Venture in the field of deep drilling technology with
Schlumberger, the world's leading supplier of technology
and project management for oil and gas industry customers
2016
Start of drilling large diameter boreholes for the Kessler-
grube remediation project, the company's largest single
contract to date
1986 – 2007 2008 – 2016
1994
Founding of BAUER Aktiengesellschaft
2001
BAUER Maschinen GmbH becomes independent company
2002
Purchase of large machinery manufacturing facility in Aresing
2003 – 2005
Specialist companies in a variety of fields are acquired
and integrated into the BAUER Group
2006
BAUER AG is listed on the stock market
2007
Founding of BAUER Resources GmbH; market launch of
the three new segments: Construction, Equipment and
Resources

A successful home game:
BAUER Maschinen Group at the Bauma 2016
Every three years, the world’s largest construction machinery
fair opens its doors at the Munich exhibition center. With
580,000 visitors from 200 countries, an exhibition area
covering 605,000 square meters and more than 3,400 ex-
hibitors from the construction industry, new records were
broken.
Reducing noise emissions, saving energy, increasing safety
and productivity at the same time: the product range and
services are of the highest quality and are continuously
being perfected, in line with Bauer’s intention of decisively
shaping the topics of the future. At the Bauma 2016, the
BAUER Maschinen Group once again presented a large
number of ground-breaking innovations. A model of an
entire diaphragm wall construction site, a new generation
of ValueLine drilling rigs, a state-of-the-art piling rig as the
world's first of a kind, a Bauer Foundation Simulator – the
Bauer stand was brimming with highlights.
Successful Mine Rescue in China using Bauer
Technology
For 36 days, hundreds of rescue workers fought for the
lives of numerous buried miners in a gypsum mine in the
Shandong province of eastern China. On January 29, four
of them were eventually saved through a vertical emergency
shaft, not least thanks to the drilling rigs from BAUER
Maschinen Group that were in operation.
The most important system was a deep drilling rig which,
under the type designation PRAKLA RB-T 90, was designed
and built in Germany a few years ago for application in China
during mine collapses; six machines were delivered. The
concept was developed in the Bauer Equipment segment.
Two additional Bauer units were also in operation to drill the
emergency shaft, a BG 26 and a BG 38. With these, pre-
drilled holes were bored, before the RB-T 90 rig drilled down
more than 200 meters.
1 2
Pictures of 2016
2
11
2

Tunnel construction under the Suez Canal
The Suez Canal is the most frequented waterway in the
world. It connects the Mediterranean Sea to the Red Sea,
and is the shortest sea route between Asia and Europe.
Since August 2015, a second waterway, which is parallel to
the existing route, has been easing the traffic situation on
the 163-kilometer-long main canal.
To the north of the city of Ismailia, a new road tunnel is being
constructed, which will run underneath the Suez Canal
over an six-kilometer-long stretch. BAUER EGYPT S.A.E.
has been carrying out the necessary specialist foundation
works. For the ventilation system Bauer was constructing
four shafts with a depth of up to 85 meters and a diameter
of 21 meters using diaphragm wall technology; additionally,
Bauer was constructing a diaphragm wall around 110,000
square meters in size to serve as start and target shafts for
the tunnel boring machine. The scope of works also included
the construction of a soft gel blanket covering and anchor
works. A BAUER MC 128 and an MC 96 duty-cycle crane,
both equipped with a BC 40 cutter, were being used along
with two BAUER BG 28 drilling rigs.
First solar-powered water treatment plant for fluoride
removal
Happy faces of the residents of the small community of
Gbalo in the African nation of Ghana: the first solar-powered
water treatment plant for the removal of fluoride from drinking
water was recently put into operation here. BAUER Resources
Ghana Limited, a subsidiary of BAUER Resources GmbH,
planned and constructed the plant in cooperation with the
Deutsche Gesellschaft für Internationale Zusammenarbeit.
For more than a decade, the inhabitants of this region had
been forced to drink heavily fluoridated water from a borehole.
The result: Osteofluorosis and dental fluorosis – two diseases
that cause pain and damage to the bones and teeth. Thanks
to the water treatment plant, the fluoride content in the local
groundwater has reduced from more than 4 milligrams per
liter to less than 1.5 milligrams per liter. Around 2,000 liters of
purified water can be produced per hour.
3
4
3
1
4

6
Mission and Strategy
>>> Target: ~ 40 % of total Group revenues
>>> Market leader in specialist foundation engineering
machinery and equipment
>>> New products for mining, deep drilling
and offshore drilling
>>> 80 % of sales generated outside of Germany
>>> Multi-branding strategy
OUR MISSION
SERVICES, EQUIPMENT AND PRODUCTS DEALING
WITH GROUND AND GROUNDWATER
>>>
7MISSION AND STRATEGY
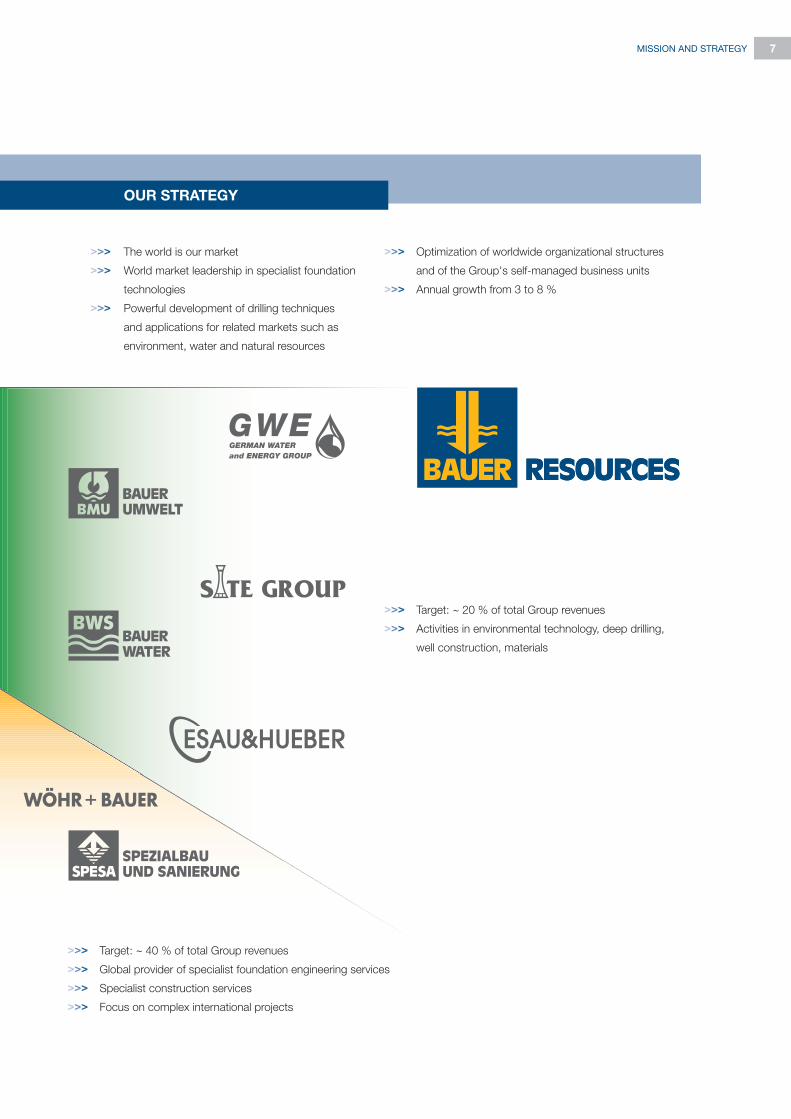
>>> The world is our market
>>> World market leadership in specialist foundation
technologies
>>> Powerful development of drilling techniques
and applications for related markets such as
environment, water and natural resources
>>> Target: ~ 20 % of total Group revenues
>>> Activities in environmental technology, deep drilling,
well construction, materials
>>> Target: ~ 40 % of total Group revenues
>>> Global provider of specialist foundation engineering services
>>> Specialist construction services
>>> Focus on complex international projects
>>> Optimization of worldwide organizational structures
and of the Group's self-managed business units
>>> Annual growth from 3 to 8 %
OUR STRATEGY

8
The World is our Market
OVER 110 GROUP COMPANIES
IN MORE THAN 70
COUNTRIES
EUR 1.6 BILLION TOTAL
GROUP REVENUES
10,771 EMPLOYEES FROM 80 NATIONS

9THE WORLD IS OUR MARKET
Construction
Equipment sales
Resources
Equipment production locations
25 PRODUCTION FACILITIES
and many other service centers and construction yards

10
Foreword
Dear Shareholders, Partners and Friends of our company,
Ladies and Gentlemen,
2016 was yet another difficult year. Our total Group revenues were EUR 1.6 billion and earnings after tax were EUR 14,4 million.
Earnings after tax were somewhat lower than projected in our last annual report, mainly because of poor contributions to
earnings by two of our construction subsidiaries in the Far East. However, we did start to make a turnaround in our business
operations.
Our construction companies in Hong Kong and Malaysia were one key reason for our lower earnings last year. In Malaysia,
the award of three large projects was delayed several times. As a result, we were not able to utilize our capacities for almost
six months. In Hong Kong, we did extensive preliminary work for a very large airport expansion project. In the end, the contract
was awarded to a competitor that had offered a much lower price. These two circumstances alone resulted in a loss that
caused earnings to fall below original projections.
Nevertheless, we have started to make a turnaround thanks to our many restructuring efforts in recent years and the improving
situation in the construction equipment market.
Our performance in the Construction segment was highly satisfactory, with the exception of the two regions mentioned above
and very few weak markets such as Angola and Russia. Construction markets worldwide are growing and demand for specialist
foundation engineering services is even increasing somewhat. Overall, we succeeded in generating a very good order backlog
that is evenly distributed across our regions. It was a good year for our business in Germany and our subsidiaries in Canada
and Egypt. Wöhr + Bauer GmbH, a participation in which we have reduced our shares, also made a good operating contribution
to earnings.
We are also seeing a positive trend once again in the Equipment segment. Growth in the core area of specialist foundation
equipment was up from last year, and our order backlog improved despite many deliveries at the end of the year. We are very
pleased with our stable sales performance during this period, especially considering the major turbulence in the market in recent
years – the global market for construction equipment contracted by 28 % between 2012 and 2015 – and the fact that our
Chinese competitors were operating with enormous surplus capacity. We are very confident that we will achieve adequate
growth in the future now that global construction markets are growing – meaning there is demand for equipment – and many
competitors in China have left the market.
Our joint venture with Schlumberger in deep drilling rigs is developing well, although not as quickly as originally planned. Its
development has been impeded by the price of oil, which has been low for several years.
Most of our restructuring measures in recent years were in the Resources segment. In 2016, our core operating companies
in Germany were combined into one company. This will expand our opportunities, especially for large-scale projects. The
environmental business is continuing to perform very well. Our subsidiaries in the water business still had to deal with former
projects, but their order situation is still good. We are very pleased to report that our Jordanian deep drilling company has
been awarded major projects after a long dry spell. We are confident that we will make this segment profitable again in the
next two years.
Overall, we can see that our measures of recent years are making an impact, resulting in much better performance in our core
operations in 2016 compared to the previous year. Nevertheless, we will continue to undertake many efforts to improve. Last
year we identified additional areas of focus for our earnings improvement program that we will continue to pursue intensively.
These include purchasing, value analyses, production and human resources.

11
In our technology development, we are primarily focused on the possibilities of digitalization for our business. Key topics include
'digital construction' and new functions for the equipment that we develop for customers. As always, the quality of our machines
has the highest priority. We are certain that quality has been a major factor in the stability of our sales in the Equipment segment,
especially given the challenges of recent years.
Despite the positive effects of our efforts, operating as an international company around the globe has not become easier.
"The world is our market" – and that market is currently anything but easy. The problems in the world increased rather than
decreased in 2016. These include the conflict between Russia and Ukraine, a weaker China, the Islamic State – the source
of terrorism and numerous refugee crises – and a growing rise in protectionism and nationalism. There is a risk that these
tendencies will become stronger, not only in the US, but also in certain countries in Europe.
As a result, on the one hand, we can be optimistic about the future because our many efforts are having an impact. At the
same time, instability in the world is preventing us from improving very quickly.
However, overall we are optimistic, and for 2017 we are expecting total Group revenues of about EUR 1.7 billion and earnings
after tax of approximately EUR 23 to 28 million.
I would like to express my sincere gratitude to all employees, shareholders, financial partners, customers and friends of the
company for their loyalty and outstanding teamwork. The last few years have been very challenging. We are certain that we
are on the right path to improving our results again. I would be delighted if you would join us on that path.
Kind regards,
Prof. Thomas Bauer
FOREWORD
Peter HingottProf. Thomas BauerHartmut Beutler


13
Combined Management Report
Hongkong & Shanghai Banking Corporation (HSBC) is building a new headquarters in Dubai. Bauer International FZE constructed
a secant bored pile wall with a depth of up to approx. 11 meters for the excavation pit. Several BG 28s were used.
The Group
Group structure
Corporate Governance and control system
Business Report
Macro-economic trend
A general view of our markets
Course of business
Construction segment
Equipment segment
Resources segment
Other / Consolidation segments
Earnings, financial and net asset position
Group earnings position
Group financial and net asset position
Financial statements of BAUER Aktiengesellschaft
Sustainability
Sustainability in the BAUER Group
Employees
Capital Investments
Research and Development
Health Safety Environment (HSE)
Quality
Legal disclosures
Remuneration Report
Statutory disclosures regarding takeovers
Risk and Opportunity Report
Risk Report
Opportunity Report
Forecast Report
15
15
15
17
17
18
20
22
24
26
28
32
32
34
38
40
40
40
41
42
44
44
45
45
47
51
51
56
59
I.
II.
III.
IV.
V.
VI.
VII.
VIII.


15
GROUP STRUCTURE
The BAUER Group is a leading provider of services, equipment
and products related to ground and groundwater. With over
110 subsidiaries, Bauer operates a worldwide network on
all continents. The operations of the Group are divided into
three future-oriented segments with high synergy potential:
Construction, Equipment and Resources.
The Construction segment applies all the established methods
and techniques of specialist foundation engineering all over
the world. These include creating complex excavation pits,
foundations for large infrastructure projects and buildings,
cut-off walls and ground improvements. Its specialist con-
struction unit also performs other construction services such
as civil engineering and remediation works.
Bauer is a world market leader in the Equipment segment and
provides a full range of equipment for specialist foundation
engineering as well as for the exploration, mining and extraction
of natural resources. Besides its registered office in Schroben-
hausen, the Equipment segment operates a worldwide distri-
bution network and additional production facilities in Germany,
China, Malaysia, Russia, Italy, Turkey, the USA among other
locations.
In the Resources segment, Bauer focuses on highly innovative
products and services in the areas of water, environment
and natural resources. BAUER Resources GmbH and its
subsidiaries operate as full-service providers with a focus on
environmental technology, water and natural resources for
industrial customers.
BAUER Aktiengesellschaft is the holding company of the Group
and is listed on the Frankfurt Stock Exchange. BAUER AG
provides central management and service functions for its
affiliates. These specifically include human resources, account-
ing, finance, legal and tax affairs, IT, facility management, and
health, safety and environment (HSE).
In the financial year gone by, there were no branch offices
in the Group that were important or essential for business
operations.
CORPORATE GOVERNANCE AND CONTROL SYSTEM
The principal task of the Management Board of BAUER AG
is the strategic management of a global group of companies.
As part of central strategies, goals and regulations, the main
companies in the three operating segments – BAUER Spezial-
tiefbau GmbH, BAUER Maschinen GmbH and BAUER Resour-
ces GmbH – develop their own detailed strategies which are
converged at holding company level and integrated into the
strategic corporate planning process.
The development and implementation of a self-managing
organizational structure with decentralized business units is
the primary characteristic of corporate governance within the
BAUER Group. The managers of the various Group com-
panies operate under their own responsibility, and are
provided with a large degree of independence within the
framework of the corporate strategy in determining how
their business units progress.
The autonomous management of the individual operating
business units is constrained by framework guidelines and
standards laid down by the Group and the individual sub-
sidiaries. The principles of proper conduct, including adherence
to our ethical and moral standards, are defined among other
instances by an ethics management and values program
covering all the companies of the BAUER Group, flanked by
corporate management guidelines and a code of conduct
imposed on our employees. The self-managing structure
is linked to a centralized system of risk management and
control, and to a central Group accounting function. Internal
auditing systems monitor compliance with laws and standards
across the Group.
The roles of the Management Board and Supervisory Board
and other aspects of corporate governance are set forth in
the Declaration on Corporate Governance on pages 64 to 67
of this Annual Report, which is published on the Internet at
http://www.bauer.de/ in the Investor Relations section under
Reports & Accounts.
Financial performance indicators
The trend in total Group revenues is used as the fundamental
and significant key financial performance indicator for the
Combined Management ReportI. THE GROUP
Funke Mediengruppe is building a new head offi ce in Essen. A BG 40 and a Klemm KR 806 rig were used to construct the bored
pile foundation and anchoring.

16COMBINED MANAGEMENT REPORTThe Group
grated in the course of internal Group management activities.
They primarily comprise balance sheet and income statement
figures and the indicators of capital structure, profitability and
liquidity derived from them.
Non-financial performance indicators
Many non-financial indicators of Group performance are
measured as part of a comprehensive reporting system,
although they have no individual material significance in
terms of internal controls and other respects. The reporting
on trends in those performance indicators in the Sustainability
section is primarily intended to convey an overall picture of
the operations of the BAUER Group.
The indicators included originate, among other sources, from
the human resources function, such as workforce numbers.
Indicators on further and advanced training as well as others
derived from the research and development field are also
reported.
management of the Group. The total Group revenues represent
the revenues of all the companies forming part of our Group.
The difference between the consolidated revenues and the
total Group revenues is derived from the revenues of the
associated companies, from our portion of revenues in
joint ventures, and from the revenues of non-consolidated
companies. The trend in total Group revenues and the con-
tributions to them by the various segments are depicted in
the Business Report.
Alongside total Group revenues, earnings before interest and
taxes (EBIT) and earnings after tax are used as key financial
performance indicators for internal management. The Business
Report details the trends in EBIT and earnings after tax as
well as trends in the various segments.
A wide range of other financial performance indicators, which
are of comparatively minor significance to the medium- and
long-term development of the Group, are collated and inte-
Bauer Umwelt conducted an extensive remediation project on the premises of TÜV Süd in Munich. In addition to the demolition of
existing buildings, the project included the excavation and disposal of 150,000 t of soil material.
>>>
17COMBINED MANAGEMENT REPORT
Business Report
as economic development, the size of the market or the
availability of labor.
The BAUER Group is no exception and must also reconsider
its own strategy. We need to reassess our presence in some
countries and strive to reduce risks. A few years ago, we were
still making efforts to be active everywhere in the world, but
this no longer applies without exception today.
Despite these developments, the world will continue to grow,
though not as strongly as it has been growing in recent years.
The major drivers of growth have lost their impact. In China,
prospects for growth are dim. India continues to develop very
slowly. Russia is in a crisis because of its conflicts with the
world and Brazil must once again try to free itself from a
deep recession. Other countries are now potential drivers
of the global economy. In addition to the US, these include
countries such as Indonesia and the Philippines as well as
Europe, which is slowly emerging from a very difficult period.
According to the major research institutes, the world will
continue to grow by about 3 %. This cannot happen unless
the construction markets lay the necessary foundations and
continue to grow themselves. As a result, growth of 3.5 to
4 % is predicted for the international construction markets.
Even better growth expectations beckon for companies in
the sector of specialist foundation engineering, since con-
struction is taking place in increasingly confined urban areas.
This calls for increasingly taller buildings, which in turn require
extensive foundation work. In addition, stationary and flowing
traffic must be ever-increasingly transferred below ground,
which also leads to growth in specialist foundation engineering.
Moreover, many buildings and infrastructural projects no longer
involve new construction but are converted or expanded
instead. The necessary preparatory ground works are greatly
increasing, since unusual types of construction are required
and the work has to be done in very confined conditions.
We can therefore anticipate a basically favorable trend that
is merely slowed down by the negative world events.
Although business has become much more difficult from a
global perspective, an international focus is the only alternative
for a specialist company like ours. This is because Germany
will not be able to maintain its leading position in today‘s
global economy forever. There are too many risks in the
German economy that can very quickly lead to downturns.
MACRO-ECONOMIC TRENDS
Although the global economy is still on a good course for
further growth, the general political conditions in the world
are becoming increasingly worse. In addition to ever-present
problems such as the many crises in the Middle East, religious
conflicts, the tensions between Russia and the West because
of Ukraine, the oil price crisis, the huge financial problems
of several European countries, Brexit, the refugee crisis in
Germany and Europe, terror attacks in major European cities,
and much more, a movement that had been almost presumed
dead has been revived and is now also a great threat to peace
and economic growth in the world: the return of nationalists
and protectionists. „America first“ is the motto of the new
president in the USA. Turkey and England are behaving simi-
larly. Autocracy, isolationism and xenophobia have become
socially acceptable once again. There is reason to fear that
the world is only at the beginning of a new trend and that this
could be a huge impediment to the development of the world
in the coming years.
Many of the drivers of global economic development in recent
decades will not be suppressed by new ideologies because
these growth drivers are the result of technological progress
rather than political will. High-speed communication and the
resulting availability of information at any place and any time,
the cheap and worldwide exchange of goods and services
as well as fast air travel to any corner of the world are enduring
drivers, which ultimately cannot be impeded by such ideologies.
Nevertheless, isolationism and autocratic tendencies will have
an impact and slow the development of the world economy.
Worst of all, however, are the ongoing threats to peace in the
world. Countries that increasingly isolate themselves from one
another are much more likely to resolve their conflicts through
acts of war. The huge increase in such conflicts in recent years
is clear evidence of this. Peace efforts have so far been unsuc-
cessful in nearly all conflicts. This has resulted in even further
isolation, which leads to more potential for conflict.
Last year, the term „deglobalization“ was increasingly used,
especially in the media. A few years ago, global companies
like us believed that internationalization and establishing a
presence in many countries is the best strategy, but this must
now be reconsidered. Today, when a company assesses a
country, it is much more important to consider the country‘s
political environment and stability rather than factors such
II. BUSINESS REPORT

18COMBINED MANAGEMENT REPORTBusiness Report
driven up primarily by low interest rates, but also by govern-
ment subsidies. The considerable additional housing needs
of refugees also play a significant role here. Public sector con-
struction is benefiting from a huge backlog of infrastructure
work, for which administrative budgets are now providing
considerably more funds. Last year, the increase in construction
volume in this area was still significantly hampered by a lack
of planning capacities and delays in approvals. A reversal of
this trend appears to have taken place in the last few months.
The pace of commercial construction will depend on the
development of the future outlook for the industry.
Europe
Construction markets in Western Europe will remain relatively
restrained in coming years. This is largely due to the fact that
the investment budgets of these countries remain low. However,
there are large infrastructure projects in some countries, such
as Switzerland or France with the metro ring around Paris.
Other major cities are also planning to upgrade their infra-
structure.
Smaller markets in Eastern Europe largely collapsed as a result
of the financial crisis. There have recently been signs of a slight
upturn, though at a very low level. Poland is investing heavily
in road construction.
The crisis embroiling Russia and Ukraine continues to impose
a serious burden on the development of both countries. Ukraine
is practically incapable of maintaining a construction sector
any longer – due to lack of funds. Although Russia is trying
to continue funding its building sector, the financial deficits
brought about by sanctions and the low oil price are forcing
the country to pursue a policy of extreme frugality. Commercial
construction has almost completely shut down. It can be
assumed that Russia will suffer from the consequences of
the crisis for years to come. Equipment sales have recovered
slightly, but will also remain at a low level.
Middle East & Central Asia
Intensive construction is still taking place in the oil- and gas-rich
countries of the Middle East, such as Saudi Arabia, Qatar
and the United Arab Emirates, but the consequences of the
budget shortage are already having a clear impact on new
projects. However, current construction on subway lines, rail-
way lines, stadiums and other large-scale projects is continuing.
However, if oil prices remain low for much longer, cost-cutting
These include too much dependence on the automotive
industry, the ongoing difficult situation for energy suppliers
and the continued volatility of the banks. Therefore, the
fundamentally correct approach is to have an international
focus and not be dependent on individual markets. The world
will continue to develop positively over the long term. As a
result, opportunities will continue to outweigh risks.
A GENERAL VIEW OF OUR MARKETS
The construction markets continue to show good growth:
The construction sector in particular benefits from an enormous
need to catch up with backlogs in the rising economic coun-
tries, but also in the established industrial nations. Constantly
increasing urbanization and growing infrastructural needs are
leading to increasingly large-scale building schemes, which
offer many interesting project opportunities to the construction
industry. The amount of construction undertaken in the
economically established countries was clearly inadequate
for many years. It is realized today that buildings too must
constantly be adapted to population needs and economic
requirements. This applies not only to traffic infrastructure
but also to residential and public buildings, dams or flood
protection facilities.
in % Revenues Order intake Employees
Residential construction 8.5 17.0 ---
Commercial construction 3.9 11.9 ---
Public construction 6.4 16.3 ---
Total 6.3 14.6 2.4
Source: Central Federation of the German Construction Industry
Construction statistics Germany – Change 2016/2015
The companies of the BAUER Group can read the general
trend from their very good order backlog, which is evenly
distributed over all regions of the world. Sales of construction
machinery are directly linked to the situation on construction
markets, so that favorable sales opportunities can be expected
in this sector too in coming years.
Besides the general trends, current developments and future
perspectives on construction markets in the various regions
around the world vary considerably:
Germany
The German construction market will continue to see positive
growth over the coming years. Residential construction is being

19COMBINED MANAGEMENT REPORT
Business Report
The construction sector in China remains at a high level, but
due to strong local competition and government regulations,
there are hardly any opportunities for foreign companies to
operate there. For the construction machinery market, the
existing excess capacity is the greatest influencing factor.
As a result, several years ago, local manufacturers totally
overestimated the potential for the future and built up exces-
sive capacity. With the end of the breakneck growth in con-
struction, sales of construction equipment in China have
declined by about 50 % over recent years. This has led to
a 28 % decline in the global market. This trend prompted
Chinese manufacturers to reduce their capacities significantly
last year. Nevertheless, it will take time for markets to find
their balance.
America
The US economy is returning to its role as the driver of global
growth. A very high level of backlog demand has arisen in many
infrastructure areas, due to a lack of adequate investment over
recent decades. We continue to expect major efforts over the
coming years to make good this deficit, providing a new boost
to the economy as a positive side effect. Overall, we regard
measures will have to be introduced, which would have the
largest impact on the construction industry. Construction
companies must prepare for this eventuality with preventative
measures.
The situation in Iraq and Syria remains extremely problematic.
The good news is that the Islamic State has been significantly
pushed back. However, it is still unclear whether a politically
stable situation will soon be reached and reconstruction work
will begin. The neighboring states such as Jordan and Leba-
non are also hamstrung by the situation, as a result of which
economic development has significantly abated there. In
Jordan, numerous international aid organizations are helping
to contain the refugee situation. It is expected that construction
projects will quickly begin again in a more consistently peaceful
environment. As a result, additional projects have been secured,
especially in the area of water utilities. Similarly, in Libya, the
situation has not yet stabilized to the extent that a new con-
struction market can develop.
In Egypt, the economy is developing in the face of an uncertain
future. The huge government spending of the recent years,
which can no longer be adequately covered by foreign aid, has
led to considerable problems for the government. The local
currency was severely devaluated at the end of 2016. However,
there are a number of large public construction projects in the
country, such as the Cairo Metro, that are heavily funded by
foreign financing. As a result of the weak currency, more
favorable construction projects are emerging in the private
sector.
Asia-Pacific, Far East and Australia
Construction markets in the Far East remain pleasingly stable.
Almost every country in the region is undertaking major infra-
structure projects. In Hong Kong, an airport expansion project
has resulted in good capacity utilization for the construction
companies involved. Several more construction phases will
follow in the coming years. The same applies to countries
such as Singapore and Malaysia, where new subway lines
and urban motorways are being built. Economies such as
Indonesia and the Philippines are also seeing healthy growth.
By contrast, the Australian economy is no longer developing
quite so positively. Construction activity has slowed down
somewhat.
Geographical breakdown of total Group revenues
in EUR million
Total 1,586
Germany 481 (30 %)
Africa 75 (5 %)
Americas 236 (15 %)
Asia-Pacific,
Far East & Australia
284 (18 %)
Middle East & Central Asia
197 (12 %)
Europe (other)
95 (6 %)
EU (excl. Germany) 218 (14 %)

20COMBINED MANAGEMENT REPORTBusiness Report
EUR 77.8 million. Total Group revenues were roughly on
par with the previous year if it were not for this effect. EBIT
was EUR 68.3 million (previous year: EUR 90.7 million). The
above-mentioned additional revenues also had an effect on
the previous year‘s EBIT figure. Earnings after tax were
EUR 14.4 million (previous year: EUR 29.0 million).
The BAUER Group was not able to fully meet its earnings
targets for 2016. Despite the fact that many subsidiaries
performed well and were within targets, it was not possible
to achieve the goals set for the Group due to weak markets
and other influencing factors. Our subsidiaries in Malaysia
and Hong Kong had the greatest negative impact on total
comprehensive income. For a long period, we were expecting
a major increase in new orders for which we had to reserve
considerable capacity. In Hong Kong, a very large special
contract for an airport project was awarded to a competitor
who had offered a much lower price. Expenses for a legal
dispute caused an additional burden. In Malaysia, the award
of three major projects was delayed further and further. As
a result, our capacities were not utilized for a long period of
time. Postponed orders are not uncommon in the construction
industry, but it is rare for them to occur on such a scale in a
single region. In total, this resulted in a loss of considerably
more than EUR 10 million. This alone explains the difference
between the original forecast and the final result. Capacities
in Malaysia are now fully utilized, as all expected contracts
were awarded.
The numerous other costs for restructuring measures as well
as for weak markets and business divisions had already been
well considered in our plans, given the upheaval in global
markets. Whereas companies such as our Resources subsi-
diary Esau & Hueber GmbH or our construction company
in Angola fell considerably below targets, construction com-
panies in Canada, Egypt and at Wöhr + Bauer GmbH
significantly exceeded targets.
the situation as stable and anticipate good opportunities
for further growth in both our Construction and Equipment
segments. The Canadian construction market is similarly
firm. Interesting projects frequently crop up in Central
America.
Africa
In Africa, active pursuit of new business is worthwhile even if
the overall economic level of these countries does not permit
a very great contribution to our total Group revenues. In recent
years, the demand for raw materials has declined significantly,
which is causing considerable problems in many African coun-
tries that are dependent on this business. In particular, the
low price of oil has driven countries like Angola and Nigeria
into an economic crisis. Hopes for positive trends on the
continent have unfortunately not been met.
The current problems in the world have sidelined major issues
for the future, such as the environment, demographic change
as well as energy and water. These issues are becoming im-
portant once again due to increasing social problems in many
countries, which are partly the cause of the refugee crisis. These
problems can only be resolved through greater efforts on the
part of construction industry.
These issues are opening up wide-ranging new opportunities
for us too. In operation for several years now, our Resources
segment is focused on matters relating to the environment,
water and natural resources. We have already successfully
handled projects in some countries around the world and
expect demand for these services to grow considerably.
COURSE OF BUSINESS
The BAUER Group achieved total Group revenues amoun-
ting to EUR 1,586.1 million during the 2016 financial year, 4.2 %
below the previous year‘s value of EUR 1,656.4 million. The
previous year‘s figure included revenues from the divestment
and revaluation of businesses of businesses amounting to
in EUR million ForecastsActual 2016
18.04.2016 03.11.2016
Total Group revenues ~ 1,650 < 1,650 1,586
EBIT ~ 75 ~ 65 68.3
Earnings after tax ~ 20- 25 ~ 10 - 15 14.4
Forecast/actual comparison 2016

21COMBINED MANAGEMENT REPORT
Business Report
backlog was taken off the books since this company is now
no longer included as associated company. This makes the
improvement over the previous year even clearer.
Summary
From an operational perspective, 2016 was significantly better
than the previous year. After realigning several business areas
and leaving several markets, we have initiated a turnaround
here, although we are still far from satisfied with our overall
result. By the end of the year, we once again managed to
achieve a good order backlog that is evenly distributed across
our regions. In addition, the market situation in the Equipment
segment has also eased. The final months of the year saw
a good increase in orders. Many changes in the Group have
significantly improved our foundations for growth, allowing us
to be optimistic about the future.
Once our original targets could no longer be met due to
these issues, in early November we had to lower the pro-
jected targets from the 2015 Annual Report to total Group
revenues of slightly below EUR 1.65 billion, EBIT of about
EUR 65 million and earnings after tax of approximately EUR
10 to 15 million. We had originally predicted total Group
revenues of about EUR 1.65 billion, EBIT of about EUR 75
million and earnings after tax of some EUR 20 to 25 million.
The order backlog of the Group also continued to develop
well and grew to EUR 1,008.1 million by the end of 2016, or
1.3 % above the previous year‘s figure of EUR 995.6 million.
All segments contributed to this increase, especially in the
fourth quarter, when we were awarded several new specialist
foundation engineering projects around the world. It should
be noted that due to the sale of shares in the real estate
company Wöhr + Bauer GmbH, a high double-digit order
Development of total Group revenues by segment
in EUR million (segments after deducting Other/Consolidation)
1,800
1,600
1,400
1,200
1,000
800
600
400
200
0
Resources
262
Equipment
615
Construction
international
493
Construction
Germany
216
2000 2001 2002 2003 2004 2005 2006 2007 2008 2009 2010 2011 2012 2013 2014 2015 2016
Total 1,586

22COMBINED MANAGEMENT REPORTBusiness Report
The German market performed particularly well in the financial
year gone by. Revenue surpassed expectations and earnings
were very positive thanks to good capacity utilization. In
Europe, we were able to increase our revenues, particularly
in England, Austria and Switzerland. The same applies to
Central America. Our subsidiaries in Egypt as well as Canada,
where capacities are being extremely well utilized in the Diavik
project, also performed well. The order situation was also
good at our companies in the Middle East – with the exception
of Saudi Arabia. The drop in the price of oil did not yet have
a serious impact on investments in construction. However,
we are continuing to monitor trends here very closely.
The strategic sale of 16.67 % of our shares in Wöhr + Bauer
GmbH, including the revaluation of the remaining 16.67 % of
our shares, yielded additional earnings of just over EUR 10
million for the segment. In the year under review, the company
generated operational earnings attributable to our share that
were almost as high as the income from the sale of the shares.
All earnings are included in other income due to the sale of
shares.
We had to accept negative performance in two markets of the
Far East. In Malaysia, the process of awarding contracts for
projects was delayed throughout the year, resulting in order
shortages with a corresponding financial impact. In Hong Kong,
we focused intensively on a large-scale airport expansion
project, but we ultimately were not awarded the contract. All
in all, this resulted in significant financial burdens. Although
our other subsidiaries in the region were well utilized overall,
this led to a substantial drop in the segment‘s performance.
CONSTRUCTION SEGMENT
in EUR '000 2015 2016 Change
Total Group revenues 742,862 722,103 -2.8 %
Sales revenues 650,762 614,456 -5.6 %
Order intake 878,436 716,316 -18.5 %
Order backlog 591,059 585,272 -1.0 %
EBIT 13,916 30,385 n/a
Earnings after tax -7,316 9,463 n/a
Employees (on average over the year) 6,243 6,412 2.7 %
General conditions
As a whole, construction markets worldwide continued to
grow in 2016. This growth is additionally propelled by the
great need for infrastructural works such as roads, bridges,
dams and energy supplies as well as increasing urbanization.
Since this construction must be carried out in increasingly
complex, troublesome circumstances, the need for specialist
foundation engineering services is also expanding, so that
we are acting in a market with a promising future.
In addition to Germany, the markets in Europe also performed
well overall, although individual development varied greatly.
Russia is still very weak, as are other countries in Eastern
Europe. The Far East declined somewhat in 2016, while the
Middle East continued to have a stable construction market.
On the whole, markets around the world are continuing to
make positive progress despite many uncertainties and crises.
Significant events
The Construction segment achieved total Group revenues
of EUR 722.1 million in the financial year 2016 at 2.8 % below
the previous year‘s level of EUR 742.9 million. EBIT was up
from EUR 13.9 million to EUR 30.4 million. Earnings after
tax were EUR 9.5 million – up from the previous year‘s
negative figure of EUR -7.3 million.
Our subsidiary in the USA had a decisive impact on the
negative results of the previous year. The completion of the
Center Hill Dam project created a considerable financial burden
and necessitated a realignment of the subsidiary. As a result,
performance in the USA remained below expectations in 2016.

23COMBINED MANAGEMENT REPORT
Business Report
Overall, we are expecting stable to good performance in
Germany and in Europe. We are expecting an improvement
in performance at our subsidiaries in America, especially
in the USA and Canada. We are predicting a decline in the
Middle East, whereas we expect significant growth in the Far
East thanks to our improved order situation.
In Hong Kong, we are expecting progress in a long-standing
legal dispute over the remaining payments for a construction
project. It will likely be concluded for the most part in 2017.
This should result in a reduction of outstanding receivables.
For 2017, we expect total Group revenues of the segment
to be somewhat below the previous year‘s figure due to the
de-consolidation of Wöhr + Bauer GmbH, but EBIT and
earnings after tax will be roughly the same as the previous
year.
The markets in Russia as well as Angola, which was affected
by the low oil price, were still weak. We have adjusted our
capacities in both countries to the changes in the market.
We provide civil engineering and remediation services in
Germany through SCHACHTBAU NORDHAUSEN GmbH
and SPESA Spezialbau und Sanierung GmbH. Due to a
lack of public contracts, business was rather sluggish and
unsatisfactory for us. There was a significant improvement
here in the last months of the year.
Order situation
Order intake was good in the financial year gone by and
totaled EUR 716.3 million (previous year: EUR 878.4 million).
The decrease is attributed to additional major projects received
in 2015, such as in Canada. A much more meaningful figure
is the order backlog, which fell by 1.0 % to EUR 585.3 million,
down slightly from the previous year (EUR 591.1 million). The
order backlog in specialist foundation engineering increased
considerably since the previously included order backlog of
Wöhr + Bauer GmbH is no longer included in the figures for
the 2016 financial year.
We succeeded in winning new orders in all regions of the
world. Along with many small and medium-sized building
sites, we were again able to add several major projects to
our backlog. Overall, the projects are currently well distributed
across the existing capacities in the individual regions. Our
subsidiary in Malaysia, which was affected by project post-
ponements during the year gone by, received expected
orders in the fourth quarter of 2016 and therefore has a high
order backlog once again.
Due to a record-level order backlog in specialist foundation
engineering and new opportunities around the world, we are
entering the current financial year on a very sound footing.
Outlook
Overall performance in the regions of the world remains
positive, despite all the existing political and economic distur-
bances. Our worldwide presence enables us to exploit oppor-
tunities in markets with good business conditions and com-
pensate for weaker markets. Our worldwide order backlog
remains at a high level.
Geographical breakdown of total Group revenues
Construction segment
in EUR million (after deduction of Consolidation)
Total 709
Germany 216 (30 %)
Africa 49 (7 %)
Americas 76 (11 %)
Asia-Pacific,
Far East & Australia
140 (20 %)
Middle East & Central Asia
108 (15 %)
Europe (other)
45 (6 %)
EU (excl. Germany) 75 (11 %)

24COMBINED MANAGEMENT REPORTBusiness Report
548.0 million to EUR 542.7 million. As a result of the joint
venture with Schlumberger, sales revenues in the deep drilling
rig business are no longer included in the figures for 2016,
unlike in the previous year. As a result, the figure for 2016 is
fully attributable to our core business in specialist foundation
equipment and reflects growth in that area. EBIT fell from
EUR 99.4 million to EUR 37.0 million. EBIT grew considerably
if the aforementioned effects of EUR 77.8 million are subtracted
from 2015. Earnings after tax fell from EUR 65.4 million to
EUR 10.9 million for the above reasons.
Considering the inconsistent and difficult market environment
described under ”General conditions”, the increase in sales and
earnings in core operations shows our strength in the market
for specialist foundation equipment and related products.
Sales performance was positive in German and European
markets as a whole and in the Asia-Pacific region. America
was on track and our sales were stable in China. Significant
declines were recorded in the Middle East and Africa. Australia,
Latin America, Russia and the neighboring countries of Eastern
Europe and Central Asia showed a slight upturn.
With respect to our subsidiaries and individual product groups,
sales of anchor drilling rigs and rotary drives were especially
good in the past financial year. Growth in our large-scale and
special equipment also had a positive impact on earnings. The
service and spare parts business has continued to develop into
an important area of activity. The production and distribution
organization in the Far East once more provided a good con-
tribution to the Group‘s revenues and earnings. On the other
hand, sales in well drilling rigs and mixing plants were weak,
partly because of weak raw material markets. A number of
EQUIPMENT SEGMENT
in EUR '000 2015 2016 Change
Total Group revenues 753,083 651,715 -13.5 %
Sales revenues 548,039 542,688 -1.0 %
Order intake 649,108 667,649 2.9 %
Order backlog 128,096 144,030 12.4 %
EBIT 99,441 36,984 -62.8 %
Earnings after tax 65,397 10,946 -83.3 %
Employees (on average over the year) 2,919 2,753 -5.7 %
General conditions
In 2016, the construction machinery markets continued to
perform very inconsistently but satisfactorily overall. Demand
increased considerably in Europe as well as in Russia, China
and India – although in these countries it started from a very
low level. The USA, Africa and especially Latin America and
the Middle East experienced downturns. The other countries
in Asia were also weaker than in 2015.
Changes in the competitive situation in the Chinese market
continued during the course of 2016. The large excess
production capacities of local competitors have decreased
further. In addition, several smaller competitors have left the
market. Significantly fewer drilling rig manufacturers from
China exhibited at Bauma in Munich in April and in Shanghai
in November 2016. We therefore expect the competitive
environment to normalize again in the coming years.
As in the previous year, weak raw material prices continued
to impact individual product groups in 2016. Demand for well
drilling rigs, which are also used for raw material exploration,
remained weak.
Significant events
In the financial year gone by, total Group revenues in the
Equipment segment fell by 13.5 %, from EUR 753.1 million
to EUR 651.7 million. It should be noted that in the previous
year, revenues from the divestment and revaluation of busi-
nesses totaling EUR 77.8 million were also included in the
total Group revenues, as were total revenues from the deep
drilling rig business, of which only 51 % were included after
it was integrated into the joint venture with Schlumberger
in 2016. Sales revenues fell slightly by 1.0 %, from EUR

25COMBINED MANAGEMENT REPORT
Business Report
and the Far East. In China, we anticipate a good development
of our business, while the normalization of market conditions
can be expected to continue. We expect weaker growth in
the Middle East, and the Russian market is expected to be
as difficult as it was in 2016.
We are expecting growth in our deep-drilling joint venture with
Schlumberger, which is reported using the equity method.
This will enable us to improve the utilization of our plant in
the USA, which market conditions for specialist foundation
engineering equipment did not permit over the last years.
For 2017, we expect slight gains in total Group revenues,
EBIT and earnings after taxes in this segment.
restructuring measures were implemented in this area last
year, resulting in good prospects for the future.
In the US, sales were roughly at projected levels. The plant in
Conroe, Texas, has been fully integrated into the joint venture
with Schlumberger for the production of deep drilling rigs. The
sales company for specialist foundation equipment relocated
to a new office nearby with storage space. Overall, the joint
venture got off to a slower start than expected last year, partly
due to the ongoing difficult environment related to the low
price of oil. Two rigs were completed and additional orders
were received. We expect good growth in this area in the
future with more opportunities for new contracts in the
coming years.
Last year, we implemented further minor restructuring and
adjustments, primarily at subsidiaries, that will help to further
improve competitiveness and our earnings situation.
Order situation
Despite fluctuations during the year, order intake was almost
exactly in line with the planned level at the end of the year and
increased from EUR 649.1 million to EUR 667.6 million. The
order backlog was EUR 144.0 million, 12.4 % above the
previous year (EUR 128.1 million).
Customers for specialist foundation engineering equipment
continue to order at relatively short notice. Only occasional
equipment orders for special projects are placed somewhat
longer ahead of time. This results in very swift deliveries to
customers, so that the order backlog lasts between two and
three months throughout the year. Although many machines
were delivered again at the end of 2016, the order backlog
in December was similar to the backlog during the course of
the year, thanks to good order intake recorded in the fourth
quarter. The joint venture also has a backlog of orders for the
construction of deep drilling rigs.
Outlook
The equipment business was affected by many economic
and political issues in 2016. We nevertheless expect growing
demand in the coming years as a result of the overall growth
of global construction markets. We see market conditions
ranging from stable to positive in Europe, the USA, Africa
Geographical breakdown of total Group revenues
Equipment segment
in EUR million (after deduction of Consolidation)
Total 615
Germany 164 (16 %)
Africa 20 (2 %)
Americas 172 (23 %)
Asia-Pacific,
Far East & Australia
154 (23 %)
Middle East & Central Asia
60 (7 %)
Europe (other)
39 (8 %)
EU (excl. Germany) 96 (21 %)

26COMBINED MANAGEMENT REPORTBusiness Report
and products were completed by the end of 2016. This allowed
us to start the current business year with a new structure and
focus on our core business operations. The most significant
change in 2016 was achieved by the merger of BAUER Um-
welt GmbH, BAUER Water GmbH and BAUER Resources
GmbH. BAUER Resources GmbH is now serving the markets
with its environment and water divisions. The new structure
gives us an advantage in the execution of large-scale projects
and the way we present ourselves to major customers, and
will also allow us to improve earnings.
Our environmental business, which has a very good order
backlog in stable markets, performed particularly well in the
financial year gone by. The large-scale project for Roche
Pharma AG in Grenzach-Wyhlen contributed greatly to the
increase in revenues in the segment. Our partnership in
Oman also made a good contribution to earnings.
The Site Group for Services and Well Drilling Ltd Co. in Jordan
was once again affected by the lack of deep drilling projects.
Low raw material prices and overcapacity continue to weigh
on the market. It was therefore gratifying that new major orders
were received in the middle of the financial year under review.
These will significantly improve the situation in 2017, but they
arrived too late to have a positive effect on 2016 earnings. As
a result, a significant loss had to be reported again. Our drilling
companies in Africa also secured too few orders because of
the market situation and also reported losses. We have with-
drawn from Ghana.
A difficult trend was shown above all by our subsidiaries in
the water business. The GWE Group, which was restructured
in the last two years, still recorded a loss as projected, but
General conditions
The Resources segment is focused on products and services
in three areas: water, environment and natural resources. In the
environmental area, the market performed well in the financial
year gone by. Germany is providing increased orders in the field
of remediation, such as land recycling, groundwater treatment,
or the disposal of contaminated soils and surfaces. There is
also great demand in the Middle East.
In the water area, there was also good demand for brewing
and beverage technology as well as water purification plants
in the past financial year. The market was relatively weak in
Europe and Africa in the area of well engineering materials.
The markets for deep drilling to exploit oil, gas, water and
natural resources still proved to be particularly difficult. Heavy
downward pressure on raw materials prices continued. As
a result, there were hardly any projects in the market. This
also resulted in significant excess capacity. This situation had
a strong impact on us once again last year, although new
orders in Jordan are providing us with better prospects for
the future.
Significant events
Total Group revenues in the Resources segment significantly
increased by 19.5 % from EUR 221.6 million in the previous
year to EUR 264.7 million. EBIT increased from EUR -19.8
million to EUR -3.2 million and earnings after tax were up
from EUR -29.4 million to EUR -8.5 million.
Once again, the Resources segment demanded a great deal
of effort from us. Restructuring processes that were launched
in the last two years and that involved a large number of areas
in EUR '000 2015 2016 Change
Total Group revenues 221,609 264,712 19.5 %
Sales revenues 179,319 238,199 32.8 %
Order intake 345,045 267,044 -22.6 %
Order backlog 276,463 278,795 0.8 %
EBIT -19,807 -3,229 n/a
Earnings after tax -29,398 -8,452 n/a
Employees (on average over the year) 1,276 1,282 0.5 %
RESOURCES SEGMENT

27
tunities in the market for the current year. The overall order
situation in the water business is also good and offers us
further opportunities for the future. Earnings should also
improve when former burdensome projects are completed.
The difficult market situation in the area of natural resources
with low raw material prices and surplus capacities will likely
continue. The new projects secured by the subsidiary in Jordan
should enable us to significantly reduce current losses.
For 2017, we expect a slight increase in the total Group
revenues and positive EBIT in the segment. We still expect
a small loss in earnings after tax.
COMBINED MANAGEMENT REPORTBusiness Report
also had to cope with a clearly declining market for well
engineering materials. Our subsidiaries that produce systems
for brewing and beverage technology as well as for water
treatment have a good workload with sufficient orders in
a stable market. However, last year, former projects were
a greater burden than expected, which meant that higher
losses were recorded.
The Resources segment also includes the mining division
of SCHACHTBAU NORDHAUSEN GmbH, which chiefly
performs restoration and safeguarding of mines. Thanks to
the continued good market in Germany, the division once
again made a positive contribution to earnings.
Order situation
Order intake in 2016 was EUR 267.0 million, down 22.6 %
from the previous year‘s figure of EUR 345.0 million. This is
attributed to the major project awarded in 2015 for the reme-
diation of the Kesslergrube landfill site in Grenzach-Wyhlen,
worth over EUR 100 million. The order backlog of EUR
278.8 million was 0.8 % higher than in the previous year
(EUR 276.5 million).
The environmental business, which secured further projects,
had an especially good order backlog. The subsidiaries that
produce water treatment plants and brewing and beverage
technology systems also gained new orders and therefore
had a good backlog. The marked increase in the order backlog
of our deep drilling subsidiary in Jordan, which once again
secured major projects, was pleasing. This allows for much
better capacity utilization at the subsidiary.
Outlook
In the Resources segment, many more efforts were made to
improve cost structures and competitiveness during the past
financial year. By reorganizing separate areas into the central
company BAUER Resources GmbH, we have established a
good footing that will benefit customers and markets in the
future.
The environmental business remains positive, with a very good
overall order situation and capacity utilization. The major Gren-
zach-Wyhlen project in Germany is expected to keep us busy
until as late as 2020. There are also numerous other oppor-
Geographical breakdown of total Group revenues
Resources segment
in EUR million (after deduction of Consolidation)
Total 262
Germany 167 (64 %)
Africa 11 (4 %)
Americas 18 (7 %)
Asia-Pacific,
Far East & Australia
1 (0 %)
Middle East & Central Asia
46 (18 %)
Europe (other)
3 (1 %)
EU (excl. Germany)
16 (6 %)

28COMBINED MANAGEMENT REPORTBusiness Report
Earnings after tax were EUR 4.8 million (previous year: EUR
6.8 million). The segment‘s revenues are generated mainly
by intra-group charges.
The Consolidation segment reflects the consolidation within
the Group. The negative EBIT of EUR -2.3 million (previous
year: EUR -7.4 million) largely matches the aforementioned
dividend payments by Group subsidiaries to BAUER AG.
Earnings after tax were EUR -2.4 million (previous year: EUR
-6.5 million).
OTHER / CONSOLIDATION SEGMENTS
The Other and Consolidation segments bundle the revenues
and earnings of the Group which cannot be allocated to the
operating segments. The Other segment essentially comprises
the revenues of the parent company BAUER AG itself, genera-
ted from a wide variety of administrative services provided to
Group subsidiaries.
The Other segment reports EBIT of EUR 6.5 million (previous
year: EUR 4.6 million). This includes EUR 4,5 million of dividend
payments by Group subsidiaries to the parent company.
The Dogern Aubecken, a water reservoir which contains more than 2 Mio m³ waters and serves to balance the river Rhine’s
water levels, is extensively rehabilitated. To ensure the long-term security of the dam structure, BAUER Spezialtiefbau GmbH
constructed a cut-off wall, having a thickness of 550 mm and a depth of up to 21 m, using the Mixed-in-Place method. An RG 25
was deployed for this project.
>>>

29COMBINED MANAGEMENT REPORT
Business Report
in EUR million 2015
Revenues
2016
Revenues
Share
Year 2016
Change against
previous year
Orders
in hand
Co
nstr
uc
tio
n
BAUER Spezialtiefbau GmbH (BST)
BST, Germany 125.6 137.3 8.7 % 9.3 % +
Subsidiaries, Germany 22.8 33.3 2.1 % 46.1 % •
BST, international 110.7 76.7 4.8 % -30.7 % •
Subsidiaries, international 543.0 494.5 31.2 % -8.9 % +
BST Group total 802.1 741.8 46.8 % -7.5 % +
SCHACHTBAU NORDHAUSEN GmbH
Subsidiaries (SBN) 64.0 64.1 4.0 % 0.2 % •
less intra-Group revenues and IFRS adjustments -123.2 -83.8 -5.3 %
Construction total 742.9 722.1 45.5 % -2.8 % +
Eq
uip
me
nt
BAUER Maschinen GmbH (BMA) 465.5 429.7 27.1 % -7.7 % •
Equipment subsidiaries 534.4 442.7 27.9 % -17.2 % •
BMA Group total 999.9 872.4 55.0 % -12.8 % •
SBN 45.7 38.1 2.4 % -16.6 % •
less intra-Group revenues and IFRS adjustments -292.5 -258.8 -16.3 %
Equipment total 753.1 651.7 41.1 % -13.5 % •
Re
so
urc
es
BAUER Resources GmbH (BRE) 17.4 123.6 7.8 % n/a +
Resources subsidiaries 196.8 129.1 8.1 % -34.3 % +
BRE Group total 214.2 252.7 15.9 % 18.0 % +
SBN 37.2 40.8 2.6 % 9.7 % +
less intra-Group revenues and IFRS adjustments -29.8 -28.8 -1.8 %
Resources total 221.6 264.7 16.7 % 19.4 % +
Oth
er
BAUER Aktiengesellschaft (BAG) 38.9 45.6 2.9 % 17.2 %
Other subsidiaries 2.6 3.0 0.2 % 15.4 %
Total Other/services 41.5 48.6 3.1 % 17.1 %
less intra-Group revenues and IFRS adjustments -102.7 -101.0 -6.4 %
Group total (including non-controlling interests) 1,656.4 1,586.1 100.0 % -4.2 % +
of which: Germany 473.7 481.0 30.3 % 1.6 %
International 1,182.7 1,105.1 69.7 % -6.6 %
Notes on the table: List also includes non-consolidated participations Evaluation of order backlog in relation to planned revenues:
-- weak; - slightly weak; • adequate; + well adequate; ++ very well adequate; Percentages and totals are calculated on the basis of unrounded starting values
Breakdown Germany/international according to country in
which accounting figures were allocated. For reasons of
complexity the figures are not absolutely precise.
Breakdown of total Group revenues by subsegment

30COMBINED MANAGEMENT REPORTBusiness Report
Breakdown of total Group revenues across the companies of the BAUER GroupShareholdings < 50 % are listed with their revenue share
in EUR million 2015 2016
BAUER Spezialtiefbau GmbH - Group
BAUER Spezialtiefbau GmbH, Schrobenhausen, Germany (BST) 236.3 214.0
Wöhr + Bauer GmbH, Munich, Germany - (sub-group consolidated financial statements) 19.9 29.8
BAUER Funderingstechniek B.V., Mijdrecht, Netherlands 4.6 5.2
BAUER Technologies Limited, Bishops Stortford, Great Britain 10.3 24.4
BAUER Spezialtiefbau Schweiz AG, Baden-Dättwil, Switzerland 9.2 24.7
BAUER Magyarország Speciális Mélyépítö Kft., Budapest, Hungary 9.7 9.7
BAUER ROMANIA S.R.L., Bucarest, Rumania 1.3 1.7
BAUER BULGARIA EOOD, Sofia, Bulgaria 3.9 1.7
BAUER SPEZIALTIEFBAU Gesellschaft m.b.H., Vienna, Austria 22.7 22.8
OOO BAUER Technologie, Moscow, Russian Federation 9.8 17.5
BAUER EGYPT S.A.E. Specialised Foundation Contractors, Cairo, Egypt 37.4 42.3
BAUER LEBANON FOUNDATION SPECIALIST S.a.r.l., Beirut, Lebanon 12.5 9.6
BAUER Georgia Foundation Specialists LCC, Batumi, Georgia 4.3 1.8
BAUER International FZE, Dubai, United Arab Emirates 34.8 32.5
BAUER Geotechnical Specialized Foundation LLC, Abu Dhabi, United Arab Emirates 34.0 34.8
BAUER International Qatar LLC, Doha, Qatar 34.5 25.6
Saudi BAUER Foundation Contractors Ltd., Jeddah, Saudi Arabia 24.0 12.9
BAUER (MALAYSIA) SDN. BHD., Petaling Jaya, Malaysia - (sub-group consolidated financial statements) 76.9 46.5
BAUER Hong Kong Limited, Hong Kong, People’s Republic of China 28.2 16.7
BAUER Vietnam Ltd., Ho Chi Minh City, Vietnam 6.0 10.2
BAUER Foundations Philippines, Inc., Quezon City, Philippines 22.8 15.6
P.T. BAUER Pratama Indonesia, Jakarta, Indonesia 12.7 17.2
Thai BAUER Co. Ltd., Bangkok, Thailand 18.1 22.1
BAUER Foundation Australia Pty Ltd., Brisbane, Australia 5.8 10.8
BAUER FOUNDATION CORP., Odessa, United States of America 55.3 17.1
BAUER Foundations Canada Inc., Calgary, Canada 26.3 35.2
BAUER FUNDACIONES PANAMÁ S.A., Panama City, Panama 10.5 11.7
BAUER Fundaciones America Latina S.A., Panama City, Panama 5.0 7.5
BAUER FUNDACIONES DOMINICANA, S.R.L, Santo Domingo, Dominican Republic 7.5 4.4
Other BST shareholdings 15.1 12.8
Joint ventures, Germany - (BST share only) 2.7 3.0
Intra-Group sales -111.3 -78.4
BST Group total 690.8 663.4
SCHACHTBAU NORDHAUSEN GmbH - Group
SCHACHTBAU NORDHAUSEN GmbH, Nordhausen, Germany (SBN) 82.8 70.6
SBN participations 41.8 47.5
Joint ventures SCHACHTBAU NORDHAUSEN GmbH - (SBN share only) 1.9 2.5
SPESA Spezialbau und Sanierung GmbH, Schrobenhausen, Germany 17.3 16.6
Joint ventures SPESA - (SPESA share only) 3.1 5.8
Intra-Group sales -57.4 -46.7
SBN Group total 89.5 96.3
BAUER Maschinen GmbH - Group
BAUER Maschinen GmbH, Schrobenhausen, Germany (BMA) 465.5 429.7
KLEMM Bohrtechnik GmbH, Drolshagen, Germany 46.5 46.0
EURODRILL GmbH, Drolshagen, Germany 13.0 16.2
RTG Rammtechnik GmbH, Schrobenhausen, Germany 33.9 31.0
PRAKLA Bohrtechnik GmbH, Peine, Germany 6.3 7.7
Compared to the breakdown of total Group revenues by segment, in the breakdown of total Group revenues by company the total of the individual groups is shown
after consolidation.

31COMBINED MANAGEMENT REPORT
Business Report
in EUR million 2015 2016
BAUER Maschinen GmbH - Group
Olbersdorfer Guß GmbH, Olbersdorf, Germany 7.0 6.6
SPANTEC Spann- & Ankertechnik GmbH, Schrobenhausen, Germany 16.6 8.1
BAUER Deep Drilling GmbH, Schrobenhausen, Germany 31.3 3.6
TracMec Srl, Mordano, Italy 13.0 11.1
BAUER EQUIPMENT UK LIMITED Rotherham, Great Britain 11.5 14.5
BAUER Macchine Italia Srl, Mordano, Italy 7.2 11.0
BAUER MASZYNY POLSKA Sp.z.o.o., Warsow, Poland 4.9 5.4
OOO BAUER Maschinen Russland, Moscow, Russian Federation 6.0 3.6
OOO BAUER Maschinen - Kurgan, Kurgan, Russian Federation 5.2 3.1
OOO BG-TOOLS-MSI, Lyubertsy, Russian Federation 1.6 1.7
BAUER Equipment Gulf FZE, Dubai, United Arab Emirates 9.9 7.0
BAUER Casings Makina Sanayi ve Ticaret Limited Sirketi, Ankara, Turkey 4.4 5.4
BAUER Equipment India Private Limited, Navi Mumbai, India 1.6 2.4
BAUER Technologies Far East Pte. Ltd., Singapore, Singapore - (sub-group consolidated financial statements) 135.2 122.8
NIPPON BAUER Y.K., Tokyo, Japan 5.9 10.2
BAUER Equipment Australia Pty. Ltd., Baulkham Hills, Australia 9.5 8.1
BAUER-Pileco Inc., Conroe, Texas, United States of America 98.0 92.4
BAUER Machinery USA Inc., Conroe, United States of America 45.0 0.5
BAUER Manufacturing Inc., Conroe, United States of America 16.9 21.2
Other BMA participations 4.0 3.1
Intra-Group sales -251.7 -223.7
BMA Group total 748.2 648.7
BAUER Resources GmbH - Group
BAUER Resources GmbH, Schrobenhausen, Germany (BRE) 17.4 123.6
GWE pumpenboese GmbH, Peine, Germany 49.1 38.5
BAUER Umwelt GmbH, Schrobenhausen, Germany (BMU) 56.6 -
BAUER Water GmbH, Oberndorf a.N., Germany 11.2 -
Esau & Hueber GmbH, Schrobenhausen, Germany 15.4 24.2
GWE POL-Bud Sp.z.o.o, Lodz, Poland 3.4 2.7
FORALITH Drilling Support AG, St. Gallen, Switzerland 2.1 1.7
GWE France S.A.S., Aspiran, France 1.3 1.7
GWE Budafilter Kft., Mezöfalva, Hungary 3.5 3.1
Bauer + Moosleitner Entsorgungstechnik GmbH, Salzburg, Austria 1.9 2.4
BAUER Resources GmbH / Jordan Ltd. Co., Amman, Jordan - (sub-group consolidated financial statements) 22.7 30.3
BAUER Nimr LLC, Maskat-Al Mina, Sultanate of Oman 7.4 8.7
BAUER Emirates Environment Technologies & Services LLC, Abu Dhabi, United Arab Emirates 4.2 2.0
BAUER Technologies South Africa (PTY) Ltd., Cape Town, South Africa -
(sub-group consolidated financial statements)3.0 2.5
BAUER Senegal SARL, Dakar, Senegal 2.5 2.5
BAUER Resources Maroc S.A.R.L., Kenitra, Morocco 1.5 2.5
GWE Tubomin S.A., City of Santiago, Chile 4.3 4.6
Other participations of BRE 4.3 1.5
Joint ventures BAUER Umwelt GmbH - (BMU share only) 2.4 0.2
Intra-Group sales -25.1 -22.6
BRE Group total 189.1 230.1
BAUER Aktiengesellschaft, Schrobenhausen, Germany (BAG) 38.9 45.6
Other participations of BAG 2.6 3.0
Intra-Group sales -102.7 -101.0
GROUP TOTAL 1,656.4 1,586.1

III. EARNINGS, FINANCIAL AND NET ASSET POSITION
on equity after tax was 3.2 % (previous year: 6.9 %). The
return on revenues after tax (relative to the consolidated
income statement revenues) decreased from 1.8 % to 1.0 %
year-on-year. The decline in return ratios is attributable to
the aforementioned additional earnings in the previous year.
According to our projections, they will increase again in the
current year.
There have been noticeable changes to individual income
statement items. This is essentially the result of the above-
mentioned additional income in the previous year.
The individual income statement items are summarized in the
following.
Consolidated revenues fell by 6.3 % against the previous
year (EUR 1,587.9 million) to EUR 1,488.6 million. Without
the above-mentioned additional earnings in the previous year,
the decline would be 1.4 %.
Sales revenues totaled EUR 1,396.9 million, up slightly by
1.3 % compared to the previous year (EUR 1,379.0 million).
Changes in inventories fell significantly by 47.0 % from
EUR 29.0 million to EUR 15.4 million.
Other capitalized goods and services for own account
dropped by 40.8 % from EUR 22.7 million to EUR 13.5 million
due to fewer investments in our own equipment in 2016.
Other income fell very significantly against the previous year,
from EUR 157.2 million to EUR 62.9 million. The largest change
is the decrease in income from de-consolidation by EUR 62.3
million to EUR 15.6 million. This was related to the joint venture
with Schlumberger as well as to SPANTEC Spann- und Anker-
technik GmbH in the previous year; and Wöhr + Bauer GmbH
in the financial year under review. Book profits from the disposal
of assets (EUR 4.6 million) fell by EUR 11.8 million. Other key
GROUP EARNINGS POSITION
The earnings position of the Group was characterized by an
upward trend in 2016, which represents a turnaround after
the very difficult recent years. On the other hand, there were
a few negative influences, especially at our subsidiaries in
Malaysia and Hong Kong, that had a negative impact on
our earnings, causing us to fall short of our targets in this
area. The sale of shares and the revaluation of the remaining
shares in the Wöhr + Bauer GmbH participation resulted in
slight additional gains as compared to operating income.
As a result of the sale of shares, Wöhr + Bauer GmbH‘s
earnings contributions of over EUR 10 million are included
in other income.
Although overall performance is more positive once again,
the earnings position of the company is still well below our
expectations. This was due to numerous ongoing distur-
bances in the world, which caused losses in some regions
and markets, thereby obscuring the good results in other
countries.
All these effects led to earnings after tax of EUR 14.4 million
(previous year: EUR 29.0 million). When figures are compared
to the previous year, it should be noted that in 2015 additional
earnings from the sale and revaluation of businesses totaling
EUR 77.8 million (at EBIT level) are attributable to the deep
drilling rig joint venture with Schlumberger and to the sale of
shares in another subsidiary.
EBIT fell from EUR 90.7 million to EUR 68.3 million due to
additional earnings in the previous year. EBITDA fell by 14.4 %
from EUR 185.1 million to EUR 158.4 million, representing
10.6 % (previous year: 11.7 %) of consolidated revenues.
The pre-tax return on equity as the ratio of pre-tax earnings
to equity (equity at the start of the period) fell significantly
compared to 2015 from 13.5 % to 5.3 % – in particular due
to the additional earnings in the previous year. The return
32COMBINED MANAGEMENT REPORTEarnings, fi nancial and net asset position
in EUR million Q1 2016 Q2 2016 Q3 2016 Q4 2016 Full year 2016
BAUER Group 383.217 373.758 389.300 439.854 1,586.129
Construction 159.872 171.991 184.494 205.746 722.103
Equipment 164.964 147.465 153.270 186.016 651.715
Resources 71.547 67.433 66.385 59.347 264.712
Other/Consolidation -13.166 -13.131 -14.849 -11.255 -52.401
Trend in total Group revenues by quarter

33COMBINED MANAGEMENT REPORT
Earnings, fi nancial and net asset position
year. We are striving to reduce personnel expenses further
through our cost-cutting program.
Other operating expenses fell by 11.6 % from EUR 274.2
million to EUR 242.5 million. The many individual components
of this item develop in very different ways depending on the
course of business and the mix of the order portfolio. This
item includes the realized and unrealized foreign currency
losses and losses from foreign exchange forward contracts
described under “Other income”, which contributed significantly
to a decrease in the item at EUR 25.9 million. Excluding
exchange-rate-driven cost changes, the decrease in other
operating expenses would be 2.7 %, which is greater than
in the consolidated revenues adjusted for the additional
earnings of the previous year.
Depreciation of fixed assets fell by 8.2 % to EUR 74.5
million.
Write-downs of inventories due to use reflect the use of
rental equipment made available to our customers. This equip-
ment does not form part of the fixed assets, but is recognized
under inventories. The reason for this approach is that most
of this equipment remains within the company only for a rela-
tively short time. The aim of the rental operation is to subse-
quently sell the equipment under a rental-purchase agreement.
As the equipment has to be financed correspondingly on the
Equity and Liabilities side of the balance sheet, its depreciation
forms part of the company’s EBITDA. As a consequence of
the changes in the market following the financial crisis, our
customers are increasingly entering into these rental trans-
actions. Depreciation due to use increased by 17.7 % to
EUR 15.5 million during the year under review.
Financial income rose from EUR 5.0 million to EUR 5.5
million. At EUR 46.8 million, financial expenses were up
from the previous year (EUR 42.0 million), although they
include EUR 4.2 million in impairment losses.
changes to this item related to realized and unrealized foreign
currency gains as well as gains from foreign exchange forward
contracts, which together fell by EUR 20.2 million to EUR 30.7
million compared to the previous year. Realized and unrealized
foreign currency gains and losses as well as gains and losses
from foreign exchange forward contracts result from our curren-
cy hedge management activities. Fluctuations in hedged and
unhedged currencies can cause the corresponding income
statement items to vary widely over the years depending on
trends. The unbalanced statement of exchange rate shifts
results from the situation that exchange rate hedging cannot
always be set exactly against the underlying transactions,
even though in operational reality they are aligned as closely
as possible to each other. The Group’s objective is to under-
take exchange rate hedging which rules out the possibility
of foreign currency gains or losses as far as possible. The
countering item in an amount of EUR 32,6 million (realized
and unrealized foreign currency losses and losses from foreign
exchange forward contracts) is entered under “Other operating
expenses”. The difference between the gains and losses
shows that we experienced overall foreign currency losses
of EUR 1.9 million in the year under review (previous year:
EUR 7.7 million in losses). The significant exchange rate
fluctuations during 2016 – with considerable positive and
negative effects depending on the currency – were the cause
of these results.
The cost of materials fell by 4.6 % to EUR 718.0 million in
the year under review. The decline is more pronounced than
the drop in consolidated revenues adjusted for additional
earnings of the previous year (-1.6 %). Costs of materials on
construction projects vary widely, so comparisons between
individual years are only possible to a very limited extent.
The reduction of personnel expenses by 1.7 % to EUR
369.7 million was roughly the same as of the consolidated
revenues adjusted for the additional earnings of the previous
in EUR million Q1 2016 Q2 2016 Q3 2016 Q4 2016 Full year 2016
BAUER Group 4.846 13.514 19.656 30.332 68.348
Construction 1.011 4.265 7.327 17.782 30.385
Equipment 5.904 7.464 9.422 14.194 36.984
Resources -1.592 1.511 3.500 -6.648 -3.229
Other/Consolidation -0.477 0.274 -0.593 5.004 4.208
EBIT trend by quarter

34COMBINED MANAGEMENT REPORTEarnings, fi nancial and net asset position
The net debt of our company increased slightly by 1.8 % in
the year under review. This is roughly at the level of 2013 and
only slightly higher than in previous years. However, total Group
revenues rose by 5.4 % in relation to 2013. In the coming years,
we will work intensively on reducing net debt in relation to net
assets. We must stress, however, that in view of the nature of
our business and the current economic climate, this will only
be possible to a certain extent. The reasons for the consider-
able rise over recent years following the financial crisis are
detailed below:
The level of the net debt in the Group is largely dependent
on the level of the working capital. The working capital of
our businesses is inevitably relatively high due to the nature
of our business model and the special market in which we
operate. Our construction projects run for only comparatively
short periods of time. As opposed to building construction
contractors, who work on longer-running projects, we rarely
receive advance payments for the construction project in
question meaning that it is very rare for us to generate a
positive cash flow over the term of the project. Short con-
struction contracts – the majority of our contracts – require
The share of the profit or loss of associated companies
accounted for using the equity method fell from EUR 2.7
million to EUR -3.0 million. The main reasons for this were
start-up losses in the joint venture with Schlumberger as
well as the fact that, before the sale of the shares in Wöhr
+ Bauer GmbH, the company incurred losses that were
significantly overcompensated by operating income from real
estate divestments. Our shareholding in Oman, SPANTEC
Spann- & und Ankertechnik GmbH, as well as the construction
joint ventures of the Group have contributed positively to
earnings. We expect this item to be positive again in the future.
Income tax expense of EUR 9.6 million was EUR 17.8 million
below the previous year’s level. The above-mentioned additional
earnings had significantly affected this figure in 2015. In the
current year, positive and negative influences have roughly
equaled out, resulting in a normal tax rate. In future, we expect
an income tax burden of between 30 % and 40 % once again.
Negative result contributions from subsidiaries in individual
countries only have the effect of reducing the tax burden on
the Group if it is possible to establish deferred tax assets on
the basis of positive tax-related earnings planning. In some
cases, this was not possible again last year. On the other
hand, corporate restructuring measures had positive effects
on taxes.
The earnings after tax attributable to BAUER AG share-
holders was EUR 11.3 million (previous year: EUR 29.7 million).
The earnings after tax attributable to non-controlling
interests was up from previous years at EUR 3.1 million (pre-
vious year: EUR -0.7 million). Fewer negative results were re-
corded in the current year as a result of restructuring measures.
In addition, very good earnings were achieved in Egypt.
GROUP FINANCIAL AND NET ASSET POSITION
The Group‘s net assets rose by 2.7 %, from EUR 1,656.9
million to EUR 1,701.4 million, mainly as a result of the increase
in receivables from construction contracts (PoC) and assets
held for sale. The equity ratio of 25.5 % was down from the
previous year (27.2 %). The equity ratio has fallen below 30 %
as a result of the losses of 2013 and burdens from the reva-
luation of provisions for pensions, necessitated by the low
interest rate, in recent years. We are once again aiming to
achieve a value in excess of 30 % in coming years. All invest-
ment and growth plans of the business are aligned to this target.
1 EUR corresponds to Average rate
2015
Average rate
2016
USD 1.1039 1.1040
GBP 0.7236 0.8227
RUB 68.6566 73.1804
CNY 6.9434 7.3488
Exchange rate trend 2016
financing across the Group’s many construction sites corre-
sponding to roughly three months’ sales of the Construction
segment. Consequently, projects are always billed after the
work has been completed.
The situation in the Equipment segment is similar. Production
lead times for our specialist machinery are around 12 months.
Since customers usually only order equipment once they have
an actual contract to fulfill, and so expect short delivery lead
times from us, we are forced to hold stocks of finished
machinery. Moreover, we have a very broad product range
and we need to stock spare parts for our customers world-
wide, leading to a corresponding increase in the need for
financing.

35COMBINED MANAGEMENT REPORT
Earnings, fi nancial and net asset position
for these loans. On the whole, we see a sufficient scope for
covering our liquidity requirements with credit lines that have
been approved but not yet utilized.
The syndicated loan, which was agreed upon in 2014, was
renewed for another three years in 2016. It has a volume of
EUR 430 million and extends until July 2019 with the option
of renewal.
In assessing the Assets side of the consolidated balance sheet,
it is important to note that this is composed of a construction
element (relating to the Construction and Resources segments)
and an equipment element (relating to machinery manufacturing
operations). Some specific items relate primarily to the con-
struction element, while others, in contrast, relate to the equip-
ment element. The main items of such kinds are listed in the
following:
• Within property, plant and equipment, about two thirds
of the land, land rights and buildings item relates to the
Equipment segment. On the other hand, about two thirds of
the technical equipment and machinery item is attributable
to the Construction segment.
• Some 40 % of the raw materials and supplies item is
linked to the machinery manufacturing operations of the
Equipment segment.
• More than 90 % of the work in progress and finished
goods and stock for trade item relates to the Equipment
segment, with a small percentage attributable to the Con-
struction and Resources segments. In the Equipment seg-
ment, it is essential to successful selling operations to
maintain stocks of rental equipment as part of current
assets, so that customers can try out the machinery before
making their final purchasing decision. Equipment can
also be drawn from the pool to cover short-term capacity
bottlenecks on construction sites. The machinery in pro-
duction at the balance sheet date also represents a sub-
stantial capital tie-up.
• Receivables from construction contracts (PoC) are
attributable to the Construction and Resources segments.
The trade receivables item is broken down roughly accor-
ding to the respective segments’ shares of total Group
revenues.
Nevertheless, we believe that the working capital of the BAUER
Group is still too high in relation to our business volumes. Our
levels of inventories, finished goods and receivables have in-
creased beyond the normal bounds. This is not good, but on
the other hand is explainable, because we are aware of the
reasons why it is so: they reflect market trends as well as a
number of special effects. Furthermore, substantial amounts
are imposing a burden, as claims in respect of supplementary
work on completed international construction projects are
having to be asserted by legal action. Even though the amounts
are recognized with due commercial caution in the accounts,
they are nevertheless imposing a burden in terms of the
indebtedness of the business.
We are aware that the Group’s higher financing requirements
place greater weight on the question of our self-financing
capabilities. Following the loss made in 2013, the equity ratio
has fallen too low, so it will have to be increased again in the
years ahead. It would be much higher if the hidden reserves
were included. Since changing over to IFRS we have used
the historical cost model to value land and buildings. With
a carrying amount for the land and buildings of EUR 177,8
million, there is a considerable reserve here.
The net debt to EBITDA and EBITDA to net interest coverage
ratios agreed with lenders as covenants have worsened since
the financial crisis, and especially as a result of the losses
incurred in the 2013 financial year. With a value of 4.27 in
2016, we were unable to fully meet the agreed Net Debt to
EBITDA ratio for our primary loans. An amicable solution has
already been found with all relevant financial partners for all
of the affected loans. We expect to meet the agreed ratios
once again in the 2017 financial year. The two other agreed
covenant ratios – EBITDA to net interest coverage and equity
ratio – are sufficiently within the agreed thresholds. In addition
to the syndicated loan, the Group has entered into covenants
for a number of long-term loans, which were valued as per
the 2016 year-end at EUR 193.5 million. The thresholds for
the ratio of net debt to EBITDA are between 3.75 and 5.0
2015 2016
Net debt/EBITDA 3.59 4.27
EBITDA/net interest coverage 4.99 4.24
Equity ratio in % 27.2 25.5
Covenants trend

36
• Trade receivables decreased by EUR 4.0 million to EUR
340.0 million.
• Other current financial assets decreased by EUR 10.5
million to EUR 18.4 million.
• Assets held for sale were EUR 19.6 million for the first time.
These assets are deep drilling rigs for oil and gas that belong
to our Resources subsidiary in Jordan. These rigs were put
up for sale following the strategic decision to abandon deep
drilling services for the oil and gas industry. The deep-drilling
joint venture with Schlumberger, formed in 2015, also played
a decisive role in this decision.
On the Equity and Liabilities side:
• Equity decreased by EUR 17.1 million to EUR 434.1 million.
Earnings after tax (EUR 14.4 million) contributed positively
to this change. The decrease was caused by changes in
currency rates (EUR 13.8 million), interest-related adjustment
of provisions for pensions, – balanced with the corresponding
deferred tax assets (EUR 9.1 million) – the market valuation
of derivative financial instruments (EUR 0.7 million), changes
in the basis of consolidation (EUR 2.2 million), dividend pay-
ments (EUR 3.2 million) and other changes (EUR 2.5 million).
• Non-controlling interests decreased by EUR 8.1 million to
EUR 4.3 million. This is mainly due to changes in currency
rates that have had an effect on the participation in Egypt.
These different weightings are barely relevant to inter-period
balance sheet comparisons when the rate of growth – either
positive or negative – of the business areas is roughly the same.
With regard to the items on the balance sheet, the following
material changes should be noted:
On the Assets side:
• The property, plant and equipment and investment
property item increased only slightly from EUR 404.4 million
to EUR 408.0 million.
• Participations rose from EUR 3.6 million to EUR 9.7 million.
This was mainly due to the revaluation of the remaining
16.67 % share in Wöhr + Bauer GmbH of EUR 8.5 million.
• Deferred tax assets increased by EUR 15.7 million to
EUR 42.9 million, which, at EUR 11.8 million, is mainly
attributable to the usability of tax losses carried forward.
• Inventories stood at EUR 447.3 million and remained at
the same level as the previous year (EUR 444.6 million).
• Receivables from construction contracts (PoC)
increased by EUR 25.3 million to EUR 154.8 million. This
is offset by a EUR 13.1 million increase in liabilities from
construction contracts (PoC) on the equity and liabilities
side. Changes in this item result from the percentage of
completion of our projects at the year-end closing date.
COMBINED MANAGEMENT REPORTEarnings, fi nancial and net asset position
Assets Equity and liabilities
Non-current assets
EUR 642.2 million (37.7 %)
(2015: EUR 618.2 million (37.3 %))
Current assets
EUR 1,025.8 million (60.3 %)
(2015: EUR 991.3 million (59.8 %))
Liquid funds
EUR 33.5 million (2.0 %)
(2015: EUR 47.4 million (2.9 %))
EUR 1,701.4 million EUR 1,701.4 million
Equity
EUR 434.1 million (25.5 %)
(2015: EUR 451.2 million (27.2 %))
Non-current debt
EUR 356.8 million (21.0 %)
(2015: EUR 533.9 million (32.2 %))
Current debt
EUR 910.5 million (53.5 %)
(2015: EUR 671.8 million (40.6 %))

37
The ratio of net assets to consolidated revenues increased
from 104.3 % to 114.3 %.
Net cash from operating activities shown in the cash flow
statement increased substantially from EUR 32.4 million to
EUR 124.9 million. The following factors contributed to this
change:
• The other non-cash transactions totaled EUR -23.8 million
(previous year: EUR -85.3 million).
• Trade receivables changed only slightly by EUR 0.5 million
(previous year: EUR -38.8 million).
• The increase in receivables from construction contracts
resulted in a capital tie-up of EUR 22.4 million (previous
year: EUR -13.9 million).
• The increase in inventories burdened the operating cash
flow to the tune of EUR 25,4 million.
• The other current and non-current liabilities changed by
EUR 25.2 million compared to the previous year.
Cash flow from investment activity totaled EUR -66.7 million
and was EUR 29.2 million higher than in the previous year,
mainly due to the decline in revenues from the sale of fixed
assets.
Cash flow from financing activities amounted to EUR -64.2
million. The main factors influencing this were loan repayments
amounting to EUR 256.9 million, interest payments of EUR
35.6 as well as new indebtedness to banks in the amount of
EUR 236.4 million.
The significant change in cash and cash equivalents is attri-
butable to exchange-rate effects of EUR -7.9 million, mainly
at the subsidiary in Egypt.
• The non-current portion of liabilities to banks
significantly decreased from EUR 376.6 million to EUR
176.8 million. The covenant (net debt to EBITDA) of the
syndicated loan and other long-term loans was exceeded
as of the balance sheet date. According to IFRS, these
loans must be transferred to current liabilities to banks.
As explained above, an amicable solution has already
been found with all relevant financial partners for all of the
affected loans. Therefore, this effect will be reversed again
in the first quarter of 2017.
• Long-term provisions for pensions increased by EUR
14.8 million to EUR 127.1 million. The increase is largely
due to the lower discount rate of 1.80 % (previous year:
2.35 %). This was supplemented by the annual contribution
from current pension commitments.
• The current portion of liabilities to banks increased
significantly from EUR 297.7 million to EUR 479.7 million.
This was due to the aforementioned transfer of liabilities
from long-term liabilities to banks as a result of the covenant
being exceeded. This effect will also be reversed again in
the first quarter of 2017. Financing decreased by EUR 17.8
million overall in terms of current and non-current debt to
banks.
• Liabilities from construction contracts (PoC) increased
by EUR 13.1 million to EUR 62.9 million. This is offset by the
above-mentioned increase in receivables from construction
contracts (PoC) on the assets side.
• Trade payables increased by EUR 17.9 million to EUR
202.9 million.
• Other current liabilities increased by EUR 17.2 million to
EUR 88.7 million. This was largely due to tax reasons and
customer down payments for equipment.
• Other current financial liabilities increased by EUR 8.2
million to EUR 20.3 million. This is mainly due to liabilities
from forward exchange contracts and liabilities to other
finance companies.
COMBINED MANAGEMENT REPORTEarnings, fi nancial and net asset position

38
The Group management report and the management report
of the parent company BAUER AG are combined. The balance
sheet and the income statement of BAUER AG (according to
the German Commercial Code, HGB) will thus be explained
at this point.
In 2016, BAUER AG reported a net loss for the year of EUR
1.4 million (previous year: EUR 25.2 million). In the previous
year, BAUER AG made EUR 29.7 million in shareholder con-
tributions to subsidiaries amounting as a result of extensive
restructuring measures in the Resources segment. Measures
of the same kind totaling EUR 7.0 million were carried out in
2016 and were the cause of the reported loss.
The following items in the balance sheet and income statement
changed significantly during the completed financial year com-
pared to the previous year:
Main changes to the balance sheet:
• Financial assets rose from EUR 116.7 million to EUR
129.3 million, largely due to the increase in shares in
affiliated companies. In the current year, BAUER AG
increased its shareholding in the subsidiaries BAUER
Spezialtiefbau GmbH, BAUER Maschinen GmbH, BAUER
Resources GmbH, SCHACHTBAU NORDHAUSEN GmbH
and SPESA Spezialbau und Sanierung GmbH from 99 %
to 100 %. Until now, the 1 % share was held by the Bauer
family because of historical tax-related reasons. In addition,
EUR 10.0 million was invested in the capital of BAUER
Resources GmbH.
• Receivables and other assets rose from EUR 198.7 million
to EUR 240.1 million. This was largely due to the increase
in receivables from affiliated companies amounting to EUR
40.9 million. In the 2016 financial year, for strategic reasons,
it was decided that the financing of operational subsidiaries
would be increasingly handled by BAUER AG instead of the
major parent companies of the segments.
• Equity decreased from EUR 133.5 million to EUR 129.5
million. This was caused by the net loss amounting to EUR
1.4 million and dividend payments in 2016 totaling EUR
2.6 million.
COMBINED MANAGEMENT REPORTFinancial Statements of BAUER Aktiengesellschaft
• Liabilities increased from EUR 184.2 million to EUR 248.5
million. The main factor responsible for this was growth in
liabilities to banks by EUR 98.8 million, due to the afore-
mentioned strategic expansion of BAUER AG‘s financing
activities for the Group. Liabilities to affiliated companies
declined by EUR 36.3 million. As of the balance sheet
date in the previous year, there were major loans that had
been granted by subsidiaries of BAUER AG due to the
fact that financing activities were still handled by the major
subsidiaries. This was not the case in 2016 as a result of
the new financing policy.
Main changes to the income statement:
• Sales revenues, primarily related to charging of adminis-
trative services to subsidiaries, increased by EUR 1.8 million
to EUR 33.8 million.
• Other operating expenses decreased by EUR 22.0 million
to EUR 20.7 million, but were still significantly higher than
business operations would warrant. The main reason for
this, both in 2015 and 2016, are the aforementioned expen-
ditures by BAUER AG for restructuring measures at the
subsidiaries in the Resources segment.
• As a result, operating result was again negative at EUR
-8.7 million (previous year: EUR -31.2 million).
• At EUR -1.4 million, net result for the year was also
negative (previous year: EUR -25.2 million). EUR 0.1 million
was withdrawn from other revenue reserves. Unappro-
priated net profit decreased from EUR 5.6 million to EUR
1.7 million
The payment of dividends to shareholders is based on the
unappropriated net profit of BAUER AG as the parent com-
pany, taking into account the Group’s consolidated earnings.
The dividend policy of BAUER AG is one of continuity, meaning
that in principle a dividend should be paid even in difficult
years, where financially justifiable. As the Group’s holding
company, BAUER AG is dependent on the earnings of its
subsidiaries, and additionally provides financing to them.
IV. FINANCIAL STATEMENTS OF BAUER AKTIENGESELLSCHAFT

39
year to 15.2 %. The reduction in the dividend also serves to
protect the Group‘s equity, which we intend to significantly
improve in the coming years.
As the Group’s holding company, BAUER AG receives
earnings in particular from its subsidiaries. In 2017, dividend
payments by the subsidiaries will be approximately the same
as in 2016, although no additional effects are expected at the
present time. Consequently, BAUER AG should once again
achieve a profit.
COMBINED MANAGEMENT REPORTFinancial Statements of BAUER Aktiengesellschaft
Although the earnings generated from the Group‘s operating
activities were clearly positive, we were unable to achieve the
targets originally set for 2016. As explained above, earnings
after tax in the Group were below expectations. We believe it
is appropriate to allow our shareholders to participate in this,
so we intend to pay a small dividend. The Management Board
will therefore encourage the Supervisory Board to propose a
dividend payment of EUR 0.10 (previous year: EUR 0.15) to
the shareholders at the Annual General Meeting. As a result,
the dividend quota has increased from 8.7 % in the previous
The soil was found to be severely contaminated on the premises of a former gas works in Hersbruck near Nuremberg. To protect
the groundwater, Bauer Umwelt drilled replacement bores. A total of approx. 8,000 m³ of soil material were disposed of.
>>>

40COMBINED MANAGEMENT REPORTSustainability
SUSTAINABILITY IN THE BAUER GROUP
The BAUER Group has summarized key areas of action, which
are also the central aspects of sustainability management,
under the maxim „BAUER‘s Triple A“: health, safety and
environment, quality and ethics as well as performance. The
slogan is based on the highest grade given by rating agencies
when evaluating the strength of a company. The ultimate
responsibility for the company‘s sustained development and
its focus on these issues lies with the Group Management
Board and the managing directors of the holding companies.
of restructuring. Individual construction projects can cause
major fluctuations at international locations.
By the nature of its operations, the workforce of the Con-
struction segment is subject to the greatest fluctuation,
depending on the number of major projects being handled in
specific countries. Consequently, the biggest growth was at
subsidiaries in Egypt (331 employees), Canada (51 employees)
and Qatar (44 employees). The number of employees in the US
decreased by 85 after completion of the large-scale Center
Hill Dam project and the realignment of the subsidiary. In
some countries, such as the Philippines, Indonesia and
Angola, fewer people were employed during the year under
review than in the previous year because of the weaker state
of the market. The large order backlog led to an overall increase
of employees in Construction and primarily involved personnel
recruited for specific projects.
The number of employees in the Equipment segment
decreased slightly. The main share of the decline is attributable
to the Far Eastern plants (46 employees), the termination of
activities in Botswana (30 employees) and our German
subsidiary in Peine (32 employees). One of our key goals
is to retain the loyalty of our core of long-term employees,
which we once more achieved successfully in the past year.
In the Resources segment, the number of employees was
reduced further in 2016 due to restructuring measures. This
mainly affected the German subsidiary for well engineering
materials in Peine (54 employees). In general, the number of
employees in the segment increased, which is largely attributed
12,000
10,000
8,000
6,000
4,000
2,000
0
Employees by segment
2013 2014 2015 2016
2,998 2,9362,919 2,753
1,449 1,4001,276 1,282
286 292300 32410,264 10,405
5,531 5,777 6,243 6,412
10,738 10,771
V. SUSTAINABILITY
EMPLOYEES
Any company that wants to enthuse customers all over
the world needs satisfied and committed employees. The
framework is a varied corporate culture which takes account
of different world views and perspectives, experience and
characteristics, and combines them under one roof. We are
proud of this variety and we are convinced that it represents
a significant competitive advantage.
Employee-related data
The companies of the BAUER Group employed an annual
average of 10,771 employees all over the world (previous
year: 10,738). They are divided up as follows:
• Construction segment: 6,412 employees
(previous year: 6,243)
• Equipment segment: 2,753 employees
(previous year: 2,919)
• Resources segment: 1,282 employees
(previous year: 1,276)
• Other segment: 324 employees
(previous year: 300)
The trend in personnel numbers within the Group was in
line with our expectations. Fluctuations at subsidiaries are
mainly at international locations but may also be the result Construction Equipment Resources Others

41COMBINED MANAGEMENT REPORT
Sustainability
562) internal and external seminars and external conferences
were attended.
Diversity
The employees of the BAUER Group literally come from all
over the world. Our staff included employees from 80 different
nations in 2016 – people from widely varying cultural and
ethnic groups who strive on every continent to achieve our
common goals. They shape our corporate culture with their
different outlooks and viewpoints, experiences and traits.
The promotion of diversity has therefore been firmly rooted
in our corporate goals for many years. We offer all persons
the same opportunities to contribute to the success of the
company, regardless on their origin, religion, age, gender or
sexual orientation.
In both the hiring and further development of our employees,
we attach great value to an assessment based exclusively on
their personality and qualification. Approximately 10 % of the
Group‘s employees were women in 2016, which essentially
reflects the technical nature of our business and the low
number of women applying for such careers.
CAPITAL INVESTMENTS
In view of the general economic situation, we kept our capital
investments in 2016 at a relatively low level compared with
previous years, roughly approximating the level of amortization.
This was made possible by the extensive investments devoted
to our plants in previous years. The pace of technological pro-
gress in our business has accelerated, however, so that any
to the mining division of SCHACHTBAU NORDHAUSEN
GmbH (63 employees), which has a good order situation.
In the Other segment, which mainly comprises BAUER AG,
there was a slight increase in employees, which is partly due
to the centralization of several functional areas of the sub-
sidiaries.
Training and education
Whether in the industrial, technical or commercial area – our
apprentices can expect to receive a varied education which is
practical and future-oriented. Year after year, we train numerous
young people in about 20 different professions. In 2016, we
trained 238 people (previous year: 245). And because we
know that our workforce is our greatest potential, continuing
education plays an important role with us, right from the
apprenticeship phase. The targeted qualification of our work-
force is becoming increasingly important at the same time.
After all, in view of digitization, the production processes in
our company are also becoming ever more complicated,
and the requirements on the functions of our machines are
growing more demanding.
BAUER Training Center GmbH represents a source of expert
advice for our employees, customers and partners as well as
external interested parties in all questions relating to further and
continuing education. Its guiding objective is to constantly
improve and professionalize its training and expand its scope
in response to demand. The budget of the BAUER Training
Center GmbH amounted to about EUR 2.6 million in 2016
(previous year: EUR 2.5 million). A total of 594 (previous year:
3,835 3,9484,050 4,216
240 248245 23810,264 10,405
10,738 10,771
6,189 6,209 6,443 6,317
12,000
10,000
8,000
6,000
4,000
2,000
02013 2014 2015 2016
Employees by employment type Employees by region
12,000
10,000
8,000
6,000
4,000
2,000
02013 2014 2015 2016
2,212 2,290 2,177 2,018
612 586 584 566
950 1,018 1,288 1,550
10,264 10,40510,738 10,771
4,144 4,158 4,166 4,064
762 752 685 712
1,584 1,601 1,838 1,861
Industrial Salaried staff Apprentices Germany Europe (other) Middle East & Central Asia
Far East & Australia Americas Africa

42
for specialist foundation engineering as well as the matching
drilling tools and add-on units. This is flanked by the new
development and optimization of construction site applications
and methods.
Research and development work in the BAUER Group is
organized on a decentralized basis. In companies belonging
to BAUER Maschinen GmbH, each major product group
has its own development unit that concentrates entirely on
the corresponding equipment, such as rotary or anchor drilling
rigs. Within BAUER Maschinen GmbH, the diversified product
range is divided into business areas that constantly develop
their equipment lines and ensure innovation in their area. The
central development department develops the technologies
and components of a machine that are used in several product
groups. Basic research work is also located in the central
development department. Development work in the BAUER
Maschinen GmbH subsidiaries is grouped into the system
described above.
Our construction areas also have their own development
capacities. In particular, BAUER Spezialtiefbau GmbH
maintains a department for construction technology which
develops new methods and conducts fundamental research.
To promote research that might be of Group-wide importan-
ce, internal and external orders for research work are placed
via the BAUER Forschungsgemeinschaft (research community).
Simple ideas sometimes give rise to outstanding new tech-
niques that help our companies to achieve technological
advances.
This type of overall organization for research and development
work has proven highly effective. Rapid decisions and great
flexibility allow all products to be kept at the cutting edge, while
new ideas and market requirements can be implemented
quickly.
Increasing digitalization, which affects both the equipment
and the construction segment, will be a central theme in our
development activities for the coming years. As part of our
„digital construction“ initiative, we are working intensively
on networking a wide range of construction site data and
various processes and applications with our central data-
bases in order to make workflows more efficient and ensure
future increase of our revenues will demand higher investments
once more.
In the Construction segment, further investments were made
in equipment to meet the market demand for ever more power-
ful machinery to handle specialist projects. For years now, we
have seen a trend toward increasingly large-scale international
infrastructure projects which foster growing demand for specia-
list foundation engineering works that can only be carried out
by ever-larger machinery. This demands higher individual invest-
ments, but also opens up new market opportunities for us.
We have also concentrated specifically on investments to
equip our construction sites with modern communications
technology.
In the Equipment segment, the investments were chiefly
channeled into modernizing the equipment available to the
production sites. Major investments in our plants and pro-
duction facilities are not necessary at this time.
Investments in the Resources segment in 2016 were also
at a low level. The investments went into the modernization
of existing production systems.
In the 2016 financial year, the BAUER Group invested a
total of EUR 95.8 million (previous year: EUR 91.0 million)
in intangible assets and property, plant and equipment. De-
preciation of fixed assets across the Group totaled EUR 74.5
million (previous year: EUR 81.1 million). Write-downs of inven-
tories due to use Group-wide totaled EUR 15.5 million (previous
year: EUR 13.2 million).
Additions to the property, plant and equipment assets of
BAUER AG in the 2016 financial year totaled EUR 3.6 million
(previous year: EUR 6.5 million), against depreciation of EUR
3.2 million (previous year: EUR 2.9 million).
We will again keep investments in balance with amortizations
in 2017.
RESEARCH AND DEVELOPMENT
The BAUER Group once again invested substantial sums in
developing new construction methods and machinery as well
as for research purposes in financial 2016. The accent here is
on the new and further development of different equipment
COMBINED MANAGEMENT REPORTSustainability

43COMBINED MANAGEMENT REPORT
Sustainability
Over the past several years, we have persistently worked
toward the goal of higher efficiency with a significant reduction
in fuel consumption. Many of our rigs, including the duty-cycle
crane series, are now equipped with the energy efficiency
package (EEP). The 100th machine with EEP was delivered
to our customers in 2016. With the optional EEP professional
package, energy efficiency can be increased even further.
Both packages together result in a reduction in fuel con-
sumption, by up to 30 % in comparison to predecessor
models, making it an investment that quickly pays off for
customers.
For many years now, our products and services have extended
well beyond the bounds of specialist foundation engineering.
The BAUER Group today is an equipment manufacturer and
service provider in all fields dealing with ground and ground-
water. Pursuing that strategy, many units within the Group have
been undertaking additional development work, such as to
design new pipes for underground engineering installations,
to advance water purification based on a wide variety of
methods, and to produce modern materials for use in geo-
technical applications. A state-of-the-art system of innovation
management is practiced with great intensity by all Group
units.
In the Equipment segment we invest a good 3.3 % (in-
cluding internal and project-related expenditure) of the
corresponding portion of total Group revenues in research
and development. A staff of 190 people are involved in this
field, as well as outside consulting engineers and interns.
Research and development activities are routinely reviewed
and maintained at a high level to keep pace with the ever
increasing rate of change in market demands.
that experience from past construction projects is available to
us all over the world. This will enable us to better assess the
challenges of future projects.
We are also developing new applications for our equipment
in order to ensure visually appealing data presentation and
widely available, efficient data management for our customers.
Applications for the tablet PC that is included in many Pre-
miumLine rigs were enhanced and web-based access to the
data was also expanded.
Assistance systems are increasingly being used in machines.
The adaptive speed assistant, which is used in kelly drilling,
was presented at Bauma 2016. This innovative technology
automatically determines the optimal winch speed when
extending or retracting the kelly bar. This increases drilling
performance, reduces wear and also prevents damage.
We successfully demonstrated our development achievements
in the areas of productivity, energy and noise with our machinery
exhibits at Bauma in Munich. Compared to the exhibits we
showed at Bauma 2013, our machines were 10 % more pro-
ductive, had a 20 % lower diesel consumption rate and caused
50 % less noise emissions. We have further intensified our
efforts to make improvements in these areas in recent years.
One example of reduced noise emissions is the soundproofed
SilentVibro vibrator from RTG Rammtechnik GmbH, which was
also presented at Bauma. The SilentVibro can significantly
reduce noise in the working area of the machine. This is
achievable with a variety of measures, such as soundproofing
of the spring yoke and encapsulation of the front area,
including the hydraulic motors.
2015 2016
Construction Equipment Resources BAUER
Group
Construction Equipment Resources BAUER
Group
Total Group revenues (in EUR million) 733.8 705.1 217.5 1,656.4 708.9 615.1 262.1 1,586.1
Expenses for R&D (in EUR million) 2.8 23.0 1.2 27.0 3.2 20.2 1.3 24.7
as % of total Group revenues 0.4 3.3 0.6 1.6 0.5 3.3 0.5 1.6
Group employees 6,243 2,919 1,276 10,738 6,412 2,753 1,282 10,771
R&D employees 39 186 12 237 41 190 13 244
Research and development in the BAUER Group

44
OHRIS, OHSAS 18001, AMS-Bau and SCC, we ensure that
our safety policies meet the requirements of the International
Labor Organization (ILO).
QUALITY
The quality of our products, services and equipment is the
most important differentiating criteria which sets our company
apart from its international competition. Not only does this
include product quality in the narrower sense, but also the
quality of the organization and procedures ranging from
procurement through to production and sale, followed by
customer service. Quality orientation in each of these sub-
processes determines how we act and is the driving force
for continuous improvement in our productive capacities.
A quality management system that is continuously monitored
by key performance indicators and audits ensures that the
most demanding quality requirements are met in our company.
It is based on the ISO 9001 international standard as well as
the relevant legal and industrial standards, and is aligned with
the requirements of our customers to a significant extent. The
findings from these audits and reviews are incorporated into
our regular training programs. By these means, we validate
the quality of our processes and create the basis for systematic,
continuous improvement.
Involving our employees is a basic prerequisite for achieving
the quality targets that we have defined for ourselves. This
is where our managers bear a particular responsibility, since
they set the example to promote quality awareness in our
company. In this way, we achieve a situation in which our
employees on all levels make quality their concern, and ulti-
mately put our quality management approach into practice
as part of their everyday working life.
Research and development expenditure in the Construction
segment is 0.5 % of total Group revenues, as well as in the
Resources segment. We are investing considerable further
resources to prepare and design construction sites. These
expenses are leading to a general increase in the expertise
base of the segments.
HEALTH SAFETY ENVIRONMENT (HSE)
The BAUER Group has firmly anchored health, safety & en-
vironment (HSE) as a central element of its business activity
throughout the entire value-added chain. In 2011, we intro-
duced global standards, thus creating a uniform HSE mana-
gement system for all companies of the BAUER Group. By
constantly reviewing our performance and comparing it
against our set goals and targets, we seek to continuously
improve our HSE system, and therefore to consistently
minimize our accident and damage rates.
For us, the health and safety of our employees takes top
priority. Our goal is to create a working environment which
not only protects against workplace-related dangers but
also reinforces their health resources and their performance
capabilities. Standards and guidelines for health and safety
in the BAUER Group are defined in cooperation with the
Managing Directors and the Management Board. In addition,
regular HSE training courses are held to reinforce the aware-
ness of the topic of health and safety throughout the company.
A program developed by the HSE department for carrying
out health and safety audits within the company also helps
the subsidiaries of the BAUER Group to build up their HSE
policy to the Group standard.
Regular reviews and audits confirm the consistent implemen-
tation of our safety standards. Through certifications such as
COMBINED MANAGEMENT REPORTSustainability

45COMBINED MANAGEMENT REPORT
Legal disclosures
the Management Board is limited by an individually defined
maximum bonus level. This maximum is the upper limit of
potential bonus payment in the normal course of business,
and is paid in full if all set goals are attained. If business
performance is exceptionally good, the said levels may be
surpassed by up to 1.8 times.
The short-term criteria applied in setting the variable re-
muneration elements are the performance of the respective
Management Board members in the past financial year and
the economic position of the Group in respect of attainment
of budget targets in the year under review, particularly the
attainment of earnings and revenue targets, taking into
account general economic trends.
The long-term criteria applied in setting the variable remune-
ration elements are the success and future prospects of the
Group and the performance of the Management Board in
respect of these criteria. This assessment judges the decision-
making of the Management Board in terms of sustainable
business development over the past three financial years and
the effects of this decision-making in achieving long-term
stability for the business. Criteria applied here are long-term
earnings and revenue prospects, sustainable personnel
development in accordance with the future prospects of
the Group, the development of the corporate culture, the
development of intra-group collaboration, the safeguarding
of corporate harmony, strategic market and product deve-
lopment, risk and security management, long-term financial
stability, and the quality of key financial indicators relative to
the prevailing economic conditions.
In assessing the appropriateness of the remuneration paid to
the Management Board, the variable remuneration is set and
compared in proportion to the fixed basic salary. Furthermore,
the fixed and variable portions respectively, and the overall
remuneration paid, are compared against the normal levels
of remuneration received by management board members of
other stock market quoted companies, and other companies
operating in the same sector, or companies similar in other
ways, in Germany (horizontal comparison). A vertical com-
parison is carried out on two levels: firstly, the salaries of the
Management Board members are compared against those
of the directors of the major BAUER Group subsidiaries;
secondly, they are assessed relative to salary grade A VIII
stipulated in the collective pay agreement applicable within
REMUNERATION REPORT
The Remuneration Report sets forth the system of remune-
ration paid to the members of the Management Board and
the total amounts paid to them, and explains the underlying
principles and amount with regard to the remuneration paid
to the Supervisory Board.
Remuneration of the Management Board
The Management Board of BAUER AG normally consists of
three members, but it temporarily had four members in the
year under review. Effective October 1, 2016, Mr. Peter Hingott,
who has held management roles in the Group for several years,
was appointed to the Management Board as a successor to
Mr. Heinz Kaltenecker, who left the Management Board as of
December 31, 2016. The Supervisory Board sets the overall
levels of remuneration paid to the individual members of the
Management Board, based on proposals submitted by the
Presidial and Personnel Committee. The plenary Supervisory
Board approves the remuneration system for the members
of the Management Board following prior consultations in the
Presidial and Personnel Committee.
The system of remuneration paid to the members of the
Management Board did not change from the previous year.
The overall levels of remuneration paid to the individual mem-
bers are set on the basis of a performance assessment. This
process assures that the overall remuneration is appropriate
to the duties and performance of the Management Board
member concerned and to the situation of the company. The
remuneration paid to each Management Board member is
composed of non-performance-related components, chiefly
a fixed basic salary, paid in equal monthly installments, and
a performance-related component in the form of a variable
annual bonus. This is set by the Supervisory Board on the
basis of short and long-term evaluation criteria, in which case
the short-term evaluation criteria are equally weighted with
the long-term ones when setting the variable remuneration.
The criteria for setting the fixed remuneration to members
of the Management Board are the assignment of duties, the
performance of the respective Management Board member,
the economic position of the Group and its profitability and
ongoing future prospects.
Maximum limits are imposed on the total remuneration
paid. The variable remuneration paid to each member of
VI. LEGAL DISCLOSURES

46COMBINED MANAGEMENT REPORTLegal disclosures
The contracts of Management Board members include
individual severance clauses regulating the specific terms
of premature termination, with settlements oriented to
the length of service of the Management Board member
concerned and gauged so as not to exceed the sum of
two years‘ remuneration for any one Management Board
member. No provisions for compensation in the event of
a takeover offer being made have been agreed with the
members of the Management Board.
Remuneration of the Supervisory Board
The Supervisory Board of BAUER AG comprises 12 members.
Calculation of the remuneration paid to the members of the
Supervisory Board is specified in detail in the Articles of Asso-
ciation of BAUER AG. Each member of the Supervisory Board
receives a basic annual fee of EUR 18 thousand, payable in
December of each financial year, plus reimbursement of out-
of-pocket expenses and any sales tax (VAT) liability incurred
in performing the duties of a Supervisory Board member.
The chairman of the Supervisory Board receives twice that
amount of remuneration, and the deputy chairman 1.5 times
the amount. The basic remuneration amounts are increased
by 10 % for each membership of a Supervisory Board com-
mittee, provided that the committee in question was convened
at least twice in the financial year. Membership of the Mediation
Committee is excluded from these remuneration provisions.
Changes to the Supervisory Board and/or its committees
are taken into account in the remuneration proportionate
to the respective member‘s time in office, and rounded up
or down to full months based on the standard commercial
rule. The members of the Supervisory Board receive no
performance-related pay.
The net remuneration paid to all the members of the Super-
visory Board in the 2016 financial year totaled EUR 261 thou-
sand (previous year: EUR 254 thousand).
Other
No loans or advances were paid to members of executive
bodies of the company in the year under review, nor were any
liabilities entered into in their favor. As a matter of principle,
no securities-oriented incentive systems exist for members
of the Management Board or Supervisory Board of BAUER
AG, or for Group employees in Germany. BAUER AG provides
D&O (directors and officers) group insurance cover in respect
of liability for economic loss to the members of executive
the Group within the industry-wide framework of salary and
training remuneration to salaried staff and foremen in the
construction sector.
The remuneration is further set so as to remain competitive
with that generally paid to highly qualified management staff
on the market as a whole.
The Annual General Meeting held on June 23, 2016 resolved
that the BAUER AG financial statements and the Group con-
solidated financial statements for the financial years 2016 to
2020 would contain no disclosures of the remuneration paid
to individual Management Board members, thereby applying
the legal authority assigned to it by section 286, subsection
5 and section 314, subsection 3 of the German Commercial
Code (HGB).
The total remuneration paid to members of the Management
Board (including roles on committees of subsidiaries) in the
year under review, excluding allocations to pension provisions,
was EUR 1,542 thousand (previous year: EUR 1,274 thousand).
Of that total, EUR 1,392 thousand (previous year: 1,124 thou-
sand) was not performance-related and EUR 150 thousand
(previous year: 150 thousand) was performance-based. The
total remuneration includes benefits in kind arising from the
private use of a company car and reimbursement of expenses
for each member of the Management Board, as well as
group accident insurance premiums and employer‘s liability
insurance association contributions. The increase in the
remuneration of the Management Board is attributable to
the fact that the total remuneration of all members of the
Management Board (including functions in committees of
subsidiaries) is reported for the whole year, even though
the Management Board had four members for only three
months, as Mr. Peter Hingott joined the Board on October 1,
2016 and Mr. Heinz Kaltenecker retired on December 31,
2016.
The company pension scheme for Management Board
members incurred pension service costs totaling EUR 137
thousand (previous year: 155 thousand). The baseline salary
defined for calculating retirement benefits is significantly lower
in all contracts than the basic salary. Calculated in accordance
with IAS 19, the defined benefit obligation entailed by all
pension commitments to members of the Management
Board at the year-end was EUR 6,485 thousand (previous
year: EUR 5,537 thousand).

47COMBINED MANAGEMENT REPORT
Legal disclosures
duties of the Management Board member either in relation to
time commitment or to remuneration received. No separate
remuneration is paid for the assumption of executive or
supervisory mandates on the boards of Group companies.
STATUTORY DISCLOSURES REGARDING TAKEOVERS
The following disclosures are made pursuant to section 315,
subsection 4 and section 289, subsection 4 of the German
Commercial Code (HGB) as per December 31, 2016.
Composition of subscribed capital
The subscribed capital (share capital) of BAUER AG remains
unchanged at EUR 73,001,420.45 and is divided into
17,131,000 no-nominal-value bearer shares, representing
a pro rata amount of approximately EUR 4.26 per share of
the total share capital. The company does not hold its own
shares. Each share entails equal rights, and entitles the holder
to one vote at the Annual General Meeting, with the exception
of share categories precluded from voting by law pursuant
to section 136 of the German Stock Corporation Act (AktG)
and section 28 of the German Securities Trading Act (WpHG).
bodies of BAUER AG and of all affiliates in Germany and
internationally in which a majority share is held. The D&O
policy includes an appropriate excess for the insured parties.
For the members of the Management Board, the minimum
excess stipulated by law of 10 % of the loss up to at least an
amount representing one and a half times the fixed annual
remuneration of the Management Board member concerned
was agreed in the D&O insurance policy in the year under
review.
The members of the Management Board are required to limit
the extent to which they take on Supervisory Board mandates
and other administrative or voluntary functions outside of the
company. The members of the Management Board may not,
without the consent of the Supervisory Board, carry out any
trade or business or conduct, on their own or a third-party‘s
account, any dealings in the sector in which the company
operates. Further, they may not, without the consent of the
Supervisory Board, become a management board member,
director or personally liable shareholder of any other trading
company. This ensures that no conflict arises with the assigned
Remuneration Supervisory Board (not including sales tax proportion and reimbursement of expenses)
in EUR ’000 2015 2016
Chairman
Dr. Klaus Reinhardt 38 40
Deputy Chairman
Robert Feiger 27 27
Shareholder representatives
Dr.-Ing. Johannes Bauer 20 20
Dipl.-Ing. (FH) Rainer Schuster 18 10
Dipl.-Ing. (FH) Elisabeth Teschemacher 18 20
Gerardus N. G. Wirken 20 20
Prof. Dr. Manfred Nussbaumer 20 20
Dipl.-Kffr. Andrea Teutenberg - 10
Employee representatives
Dipl.-Volkswirt Norbert Ewald 20 10
Dipl.-Kfm. (FH) Stefan Reindl 18 18
Regina Andel 18 18
Dipl.-Ing. Gerold Schwab 20 10
Reinhard Irrenhauser 18 19
Rainer Burg - 9
Maria Engfer-Kersten - 10
Total * 254 261
* rounded

48COMBINED MANAGEMENT REPORTLegal disclosures
been or are to be sold or issued in direct or corresponding
application of section 186, subsection 3, clause 4 AktG while
this authority is in place until such time as it is exercised,
pursuant to other authorities, excluding subscription rights,
are to be set off against the said 10 % limit;
• to compensate fractional amounts resulting during capital
increases in return for cash and/or non-cash contributions
due to the subscription ratio;
• to implement so-called scrip dividends where shareholders
are offered an option to pay in their dividend entitlement (in
full or part thereof) as non-cash contribution in return for the
issuance of new shares from the authorized capital 2016.
By resolution of the Ordinary Annual General Meeting held
on June 26, 2014, the company was authorized to acquire
treasury stock, over a limited period up to June 25, 2019,
representing up to a total of 10 % of the company‘s share
capital at the time the resolution was passed. The shares
shall be acquired at the discretion of the Management Board
by means of a public tender offer or by way of the stock
market. If the acquisition is effected by way of the stock
market, the acquisition price (excluding ancillary costs)
may be no more than 10 % above or 20 % below the price
determined by the opening auction on the trading day for
shares in the company in Xetra trading (or a comparable
successor system) on the Frankfurt Stock Exchange. If the
acquisition is effected by means of a public tender offer, the
purchase price or the limits of the purchase price span per
share (excluding ancillary costs) may be no more than 10 %
above or 20 % below the average of the closing prices per
share in the company in Xetra trading (or a comparable
successor system) on the three trading days prior to the day
of issue of the public tender offer. If not insignificant variations
of the decisive share price occur after the day of issue of the
public tender offer, the purchase price may be adjusted.
The Management Board shall be authorized to appropriate
shares in the company acquired pursuant to the above
authorizations for all legally admissible purposes. Consequently,
the acquired shares may also in particular be sold by means
other than by way of the stock market or by means of an
offer to the shareholders, if the shares are sold for cash at
a price (excluding ancillary costs) not materially below the
stock market price of shares of the company carrying the
Shares with special rights entailing supervisory powers were
not issued. Employees holding a capital share in BAUER AG
exercise their supervisory rights like other shareholders in
accordance with the statutory provisions and the Articles of
Association.
As in the previous year, 51.81 % of the shares were in free float.
The members of the Bauer family and the BAUER Stiftung,
Schrobenhausen, own a total of 8,256,246 no-nominal-
value shares in BAUER AG on the basis of a pool agree-
ment, representing a 48.19 % share in the company. The
pool agreement provisions include binding voting commit-
ments as well as restrictions on the transferability of pool
members‘ shares. No other direct or indirect holdings of
BAUER AG share capital exceeding 10 % of the voting rights
are known to the company.
Authority of the Management Board to issue or buy
back shares
Article 4, paragraph 4 of the company’s Articles of Association
states that the Management Board is authorized, with the
consent of the Supervisory Board, to increase the share
capital once or more than once up to June 22, 2021 by
up to a total of EUR 7.3 million by the issue of new no-
nominal-value bearer shares against cash and/or non-cash
contributions (2016 authorized capital). To that end, the
Management Board is authorized, with the consent of the
Supervisory Board, to exclude the legal subscription rights
of shareholders in the following cases:
• in the case of capital increases in return for non-cash
contributions, particularly for the purpose of acquiring
companies, parts of companies, investments in companies
and other assets or claims for the acquisition of assets,
including receivables from companies or their group
companies, or for the purpose of company mergers;
• in the event of capital increases against cash contributions
where the issue amount of the new shares issued is not
materially below the market price of the already quoted
shares at the time of definitive setting of the issue price
and the shares issued excluding shareholders‘ subscrip-
tion rights pursuant to section 186, subsection 3, clause
4 AktG do not in total exceed 10 % of the existing share
capital either at the time this authority takes effect or at
the time of exercising this authority. Shares which have

49COMBINED MANAGEMENT REPORT
Legal disclosures
majority of at least three quarters of the share capital repre-
sented at the vote. Pursuant to Article 12 of the Articles of
Association, the Supervisory Board is authorized to pass
amendments to the Articles of Association which relate only
to its wording. The Supervisory Board is further authorized to
adapt the wording of Article 4 of the Articles of Association
(amount and division of the share capital) following full or
partial execution of the increase in share capital or on expi-
ration of the authorization period according to the respective
utilization of the authorized capital.
Change of control
BAUER AG, together with other Group companies, has
concluded a syndicated loan agreement providing a credit
line of up to EUR 430 million; this contains provision for the
lender to terminate its loan commitments in the event of a
change of control or if control is gained by a third party. As
defined by this syndicated loan agreement, a change of control
is defined as a situation in which the total shareholding held by
the pooled members of the Bauer family directly amounts to
less than 40 % of the capital shares or voting rights in BAUER
AG. A third party gains control if, overall, more than 50 % of
the capital shares or voting rights in BAUER AG is held directly
or indirectly by one or more persons acting jointly (with the
exception of the pooled members of the Bauer family).
Furthermore, several long-term loans with balances totaling
EUR 149.6 million as per the balance sheet date, agreed by
BAUER AG together with other Group companies as the
borrower and guarantor, provide for a right of termination
for cause by the lender in the event of a change of control
in BAUER AG. A change of control is considered to have
taken place where a third party, not forming part of the circle
of existing main shareholders, directly or indirectly acquires
control of at least 30 % of voting shares or the majority of
outstanding share capital of BAUER AG. Any loaned amounts
would have to be repaid in the event of termination. The
terminated credit line would no longer be available for new
borrowing.
Additional short- and long-term loan agreements also exist
within the Group which provide for a right of termination for
cause, at market terms, in the event of a change of control.
BAUER AG has not made any agreements with the members
of the Management Board regarding provisions for compen-
sation in the event of a takeover offer.
same rights at the time of the sale in Xetra trading (or a
comparable successor system). The shares may also be sold
in return for non-cash payment, provided this is done for the
purpose of effecting company mergers or acquiring com-
panies, parts of companies, shareholdings in companies or
other assets. The aforementioned shares may be redeemed
without need of a further Annual General Meeting in order
to approve the redemption or its execution. With regard to
use of the bought-back shares, the authorization provides, in
specific cases, for legal rights of subscription of shareholders
to be excluded. The facility to acquire treasury stock has not
been utilized to date.
Appointment and termination of appointment of
Management Board members, amendments of the
Articles of Association
The appointment and termination of appointment of members
of the Management Board of BAUER AG is regulated by sec-
tions 84 and 85 of the German Stock Corporation Act (AktG)
and sections 30 ff. of the German Co-determination Act (Mit-
bestG) in conjunction with Articles 5 and 6 of the company‘s
Articles of Association. Pursuant to the company‘s Articles
of Association, the Management Board comprises at least
two persons, who are appointed by the Supervisory Board
for a maximum term of office of five years. After Mr. Heinz
Kaltenecker‘s departure from the Management Board at the
end of the financial year, the Management Board comprises
three members appointed by the Supervisory Board and
a Chairman of the Management Board, as well as a Labor
Director. It is permissible to re-appoint or extend the appoint-
ment of a member of the Management Board for a further
maximum term of office of five years. Any appointment or
re-appointment requires a decision by the Supervisory Board,
which may be taken no earlier than one year prior to the end
of the relevant term of office. The Supervisory Board may
rescind an appointment to the Management Board or an
appointment as chairman for good cause. The Presidial and
Personnel Committee of the Supervisory Board prepares
the Supervisory Board‘s decisions on the appointment and
termination of appointment of Management Board members
and concerns itself with the long-term planning of successor
members for appointment to the Management Board.
In accordance with section 119, subsection 1 clause 5 and
with section 179 AktG, the amendment of the Articles of
Association is passed by the Annual General Meeting with a


51COMBINED MANAGEMENT REPORT
Risk and Opportunity Report
BASIC PRINCIPLE OF RISK MANAGEMENT
As part of our business activities, we are exposed to risks that
are inseparably linked with our operations. Running a business
requires taking risks. True risks result from unforeseeable
events that can bring both hazards and opportunities along
with them. Therefore, at Bauer, risk management means not
just reducing the hazards but also knowing how to take
advantage of the opportunities. The goals of risk manage-
ment include safeguarding our business objectives, initiating
measures early on and reducing the costs of risk. Risk mana-
gement involves identifying, analyzing, evaluation and moni-
toring existing and anticipated risks along the entire value
chain and devising actions to deal with them. This involves
assessing external risks for our company as well as those
that arise internally. Our risk management is based on an
essentially risk-averse approach which aims to safeguard us
against impending risks rather than to grasp opportunities
for short-term gain. We never take risks that threaten the
existence of the company.
Risk management system
Our risk management system regulates the handling of risks
within the BAUER Group. It defines a uniform methodology
applicable to all segments and their member companies. It is
continually reviewed and adjusted as required.
Our risk management system is an integral element of our
overall management system and, like all our management
systems, serves as an instrument of value- and success-
oriented corporate governance. Audits routinely verify its
implementation and management reviews continuously im-
prove its efficacy. Furthermore, our auditors annually review
the extent to which our early risk-warning system is capable
of detecting existentially threatening risks in good time. The
process steps involved in risk management are: identification,
assessment, control of measures, and monitoring.
For the identification of risks, risk categories have been defined
and specific areas of risk have been assigned. This defines
areas of focus. Risk categories defined by the BAUER Group
are: strategic risks; market risks; financial market risks; political
and legal risks; organizational and governance risks; risks
arising from the value creation chain; and risks of the sup-
porting processes. These risks are grouped as latent risks
and managed in a unified process within the framework of
our risk management system. Conversely, project risks are
managed by an additional, independent process according
to their nature and significance.
The process of identifying and assessing latent risks is reviewed
biannually at working sessions of the relevant Group company
managements and is implemented jointly with departmental
and central function heads as well as individual specialists.
This process ensures that potential new and familiar risks and
opportunities are submitted for review at management level.
Structured risk identification is followed by risk assessment
based on a scale of relevance.
Relevant risks above a certain threshold value are quantified
based on scenarios. Planning risks are estimated on the basis
of empirical values, applying standard deviations. Risks from
within the subgroups are consolidated at Group level.
Following assessment, risk-specific management measures
are defined. Where possible and useful, we have taken out
appropriate insurance cover in respect of potential damage
and liability risk, in order to reduce our risk exposure and avoid,
or at least minimize, potential losses. Responsibility for moni-
toring the particular risks lies with the risk managers of the
operative areas.
The effects of individual risks are aggregated in the context of
corporate planning by means of risk simulation. This means
that the income statement for a given financial year is played
through several thousand times in independent simulations
based on random figures (Monte Carlo simulation).
Yearly reports are submitted to the Management Board and
Supervisory Board. To communicate acute risks, the routine
risk analysis is supplemented by immediate reporting. Our
risk management system covers both risks and opportunities.
Handling of project risks
Project risks are the principal performance risks, and thus
are an integral element in the work of the Construction and
Resources segments, wherever construction work or plant
VII. RISK AND OPPORTUNITY REPORT
RISK REPORT
Our customer Shikun & Binui carried out the diaphragm walling works for the construction of the metro in Tel Aviv. An MC 96
duty-cycle crane with a BC 35 trench cutter and an MC 64 duty-cycle crane with a BC 32 trench cutter were used.

52COMBINED MANAGEMENT REPORTRisk and Opportunity Report
assembly is carried out on the customer‘s premises. Asso-
ciated risks, such as in relation to the ground and resulting
from the individual character of each individual project –
including contract, timetable and damage risks – can thus
accumulate detrimentally in specific cases in such a way
that they may threaten the existence, if not of the Group as
a whole, at least potentially of smaller subsidiary companies.
In respect of all relevant projects above low threshold values,
prior to submission of quotes all conceivable risks and
opportunities are systematically identified, analyzed and
assessed, and appropriate measures are defined to minimize
risks and track opportunities. In ongoing projects, the risks
relating to continuous project controlling and project mana-
gement are analyzed; this means they are identified, evaluated
and have measures applied to them.
Each project is assigned to a risk class and organizationally
escalated according to its risk class, and is thus subject to
a strict approval process. Risk classification is based, firstly,
on defined checklists applying the K.O. principle, in order to
prevent inadvertent assignment to an inappropriately low risk
class. Secondly, it is based on potential harm identified in
relation to the project, with the worst-case outcome serving as
the decisive factor. The risk classes defined by this process
are taken into account at fixed cost surcharges to cover the
identified risks.
The system has been developed over a number of years across
the corporate units faced by the relevant project risks and
expanded to apply to the relevant operations.
Risks
In the following we set forth potential risks which may have a
significant impact on our financial and earnings position and
on our reputation, and assess the relevance to our business.
The breakdown follows the same risk categories as we apply
in our risk management system. The areas of risk are aggre-
gated. Unless otherwise specified, all risks set out in the
following relate to all our segments.
STRATEGIC RISKS
Segmental structure
We counter the strategic risks arising from the segmental
structure of the Group by dividing it internationally into separate
Construction, Equipment and Resources segments, thereby
pursuing the aim of greater independence from the economic
cycles of the construction industry.
The Equipment segment‘s move into deep drilling and the
manufacture of machinery for mining applications will further
reduce its dependence on the construction sector. We class
the risks associated with the structure of our business as
medium.
Brands, image, PR
The Bauer brand carries a cachet for purchasers, especially
in the Equipment segment, because it is known for high quality.
Negative influences on our image, whether due to publications
about accidents at work or quality and service defects for
example, can result in falling demand for our machines. In
some countries there is also a risk of counterfeiting, which
has an influence on the quality image of the Bauer brand.
We minimize this risk by, among other measures, our highly
developed quality and HSE management system. We regard
the risk of damage to our image as a moderate one.
MARKET RISKS
Selling market risks
It has always been one of our key strategic principles to
counter risks on our selling markets by means of a multi-
segment organization. Whereas our machinery manufacturing
business is still heavily influenced – if at a delay – by economic
trends in the construction sector, the establishment of the
Resources segment has enabled us to isolate part of our
Relevance Definition Identified risks
1 Insignificant to low risk Risks with this relevance are identified
in our business2 Medium risk
3 Significant risk
We do not see risks with this relevance
in our business4 Serious risk
5 Critical risk
Relevance scale of the BAUER Group

53COMBINED MANAGEMENT REPORT
Risk and Opportunity Report
it will restrict the purchasing power and investment appetite
of the oil producing countries in the Middle East and Russia.
If the oil price remains low for a long period, this could also
have a negative effect on demand for deep drilling rigs and
services for the oil industry, as well as on infrastructure
expenditure by oil-producing countries.
The Group Management Board and the directors of the three
operating segments routinely consider projections based on
specific scenarios to estimate the impact of any given market
development risks on the company in question and on the
Group as a whole. Any necessary and relevant measures
are derived from these analyses and implemented in full. The
risks to the market development are currently assessed to be
moderate.
FINANCIAL MARKET RISKS
Financial stability and liquidity
Several long-term loans are covered by covenants linked to
pre-determined financial variables. These are primarily the
ratio of net debt to EBITDA, the ratio of EBITDA to net interest
coverage, and the equity ratio.
In addition to the earnings situation of the Group as a whole,
higher financing requirements in particular may pose an in-
creased covenant risk. This applies, for example, to changes
in inventories in the Equipment segment. In order to reduce
that risk, active selling of surplus stocks is initiated and
production volumes are reduced as necessary. Both the
earnings situation and the debt situation will be improved
by combining measures such as the introduction of value
analysis methods as well as intensive working capital
reporting.
The risk of financial instability and supply shortages on
international financial markets was countered by renewing
a syndicated loan agreement. This agreement ensures the
medium-term liquidity supply for the Group of companies,
and is an important tool for countering turbulence in the
financial markets.
The risk in the area of „financial stability and liquidity“ is
classified as a medium risk.
Foreign exchange risks
Where possible and available, we counter foreign exchange
business from the effects of construction cycles much more
effectively. Our strategy of spreading business in each segment
across a large number of markets worldwide further reduces
the overall risk, so that no serious risk is posed to the Group as
a whole in the event of any weakening or collapse of individual
regional markets. Moreover, in the event of a regional market
downturn our network strategy in the Construction segment
enables us to relocate our capacities rapidly to another country
and continue operations at the new location. This strategy has
proven effective during various regional crisis situations in the
past, in which it cushioned negative impacts on the overall
result. Our Resources segment has also already expanded
on an international scale. We rate risks associated with our
selling markets as medium.
Competitive environment
In the Equipment segment especially, we operate in highly
competitive and price-sensitive markets. The repeated
stagnation of the Chinese construction market since 2012
has seen demand for new machinery decline, in some cases
disproportionately dramatically. The resultant overcapacity
in the country has placed prices and margins under heavy
pressure at times. A number of Chinese competitors have
already been forced out of market. We have implemented
intensive cost-cutting measures in order to lastingly improve
our competitiveness in China. For example, all production
was relocated to Tianjin. Furthermore, the after-sales service
has been expanded further in all markets as a stabilizing factor
for new business.
Despite the overcapacity and associated pressure on margins
in China, we were able to maintain our market position based
on the recognized high quality and still clear technical edge of
our machinery. This risk is still rated as low in the short term,
but medium in the medium term.
Risks of market development
High levels of public sector debt in the USA, as well as in some
EU member-states, significant interventions by some central
banks as well as uncertainty as to the stability of markets in
specific countries and the phases of significant downturn on
the market in China and the other BRIC nations influence our
appraisals of the macro-economic situation.
The significant drop in the oil price may well be easing pressure
on importing countries‘ balances of trade, but in the long term

54COMBINED MANAGEMENT REPORTRisk and Opportunity Report
Contract risks
Our Construction and Resources segments primarily provide
construction, drilling and environmental services. The under-
lying projects are almost always prototypes executed in each
case on the basis of customized contracts. The resultant
risks are subject to stringent management routines, and so
can be rated as low.
Current legal cases
Legal disputes arise almost exclusively from our provision of
services, in particular in the project business. Judicial disputes
exist with regard to clients, suppliers and business partners,
and in the majority of cases they relate to remuneration, claimed
deficiencies in performance, or delays in completing a project.
By their very nature, it is impossible to say for certain how the
court or arbitration proceedings we are involved in will turn out.
Nevertheless, following careful examination, we assume that
adequate provision has been made in the balance sheet for
all legal disputes.
VALUE CREATION RISKS
Research and development risks
As a technology leader, particularly in our Equipment segment,
we counter any possible weakening of our market position by
means of continuous research and development. Although the
booming markets in the Far East and the resultant new com-
petitors are sharpening the innovative pressures, we have to
date succeeded in maintaining the necessary edge as a tech-
nology leader.
Moreover, there is a risk of incurring additional costs in this
context due to development and design mistakes necessitating
modifications. This risk is minimized by a structured, multi-stage
product creation process.
Thanks to our great innovative strength and transparent product
creation process, we rate the risks in relation to research and
development as being currently medium.
Acquisition, sales and contract negotiations
The risks of miscalculating quotations and of warranting
technical characteristics which cannot be fulfilled are minimized
by the strict application of the dual-control principle, and can
basically be regarded as low.
risks by financing our international holdings in their respective
local currency. Transaction risks (foreign currency risks arising
from the current cash flow) are minimized in all business
divisions by means of suitable rate hedging instruments.
The remaining currency risks are evaluated as medium.
Participations, acquisitions, financial assets
The valuations of the shares in associated companies contain
goodwill items, the values of which are subject to the risk
from future company developments. Should these future
expectations fail to materialize, it may become necessary to
apply write-downs. We estimate that the risk of needing to
undertake a write-down on the goodwill is a moderate one.
POLITICAL AND LEGAL RISKS
Compliance
For the BAUER Group, acting responsibly and in keeping with
the law is a fundamental principle underpinning our commercial
success, the quality of our products and services and our
sustainable ongoing development. We place the utmost value
in upholding social conventions and in complying with appli-
cable laws and business standards, so as to minimize the risk
of non-compliance. For us, compliance means observing all
applicable laws, rules and regulations. Legally compliant, ethical
and socially sustainable action is the cornerstone of our values
management system. This will be applied to ensure staff are
aware of our fundamental values as soon as they are hired.
Special training courses enable them to extend their know-
ledge. A special software program ensures that we do not
do business with any companies cited on an EU or US
sanctions list.
In summary, we are of the opinion that our existing values
management system provides us with an efficient means of
keeping our compliance risk to a low level.
Political and legal environment
Ongoing political unrest in the Middle East is impeding willing-
ness to invest in the countries immediately affected, and often
beyond. Declining sales volumes in the Equipment segment
and a decline in revenues in the Construction and Resources
segments are the consequences. In some countries, there is
also a risk that the government will intervene more heavily in
company affairs. This in turn can lead to increased costs and
time investments.

55COMBINED MANAGEMENT REPORT
Risk and Opportunity Report
increasingly seeing parties resort to legal action when disputes
arise in relation to contract interpretation as well as additional
works and supplements. Clients‘ representatives are increas-
ingly rarely authorized to resolve conflicts by mutual consent.
As a result, final project settlement is increasingly being delayed
by legal action, and additional costs are being incurred. We
manage this risk by professional management of supplemental
requirements in the course of the construction project, and
based on full documentation of the work carried out. Despite
all efforts, the outcomes of some negotiations on supplemental
requirements pose a residual risk to the company. The risks
arising from supplemental requirements are rated as medium.
RISKS OF SUPPORTING PROCESSES
Information technology (IT)
Security to prevent data loss or unauthorized access, as
well as to safeguard system and data availability, is ensured
by means of state-of-the-art hardware and software and
building services technology, so IT risks are classed as low.
Quality risks
Great attention is paid to the quality of work done in all areas of
the business. This is safeguarded by employing well-trained
staff and by means of a long-established quality management
system which has been in place for many years. In the Equip-
ment segment, parts with poor quality are rejected through
systematic quality control upon goods receipt. Many of our
Group companies are certified, and are audited on a regular
basis. We therefore rate quality risks as low.
Accounting-related system of internal controls and
risk management
Consolidated accounting risks comprise risks in respect of
accounting, valuation and recognition. To counteract them,
the accounting functions of the parent company as well as
of BAUER Spezialtiefbau GmbH, BAUER Maschinen GmbH
and BAUER Resources GmbH are managed centrally at the
registered office in Schrobenhausen. This allows business
transactions to be handled in a standardized way.
The accounting functions for the other subsidiaries are usually
managed by decentralized in-house commercial departments.
Our subsidiaries are assisted by external accountants and
auditors as well as by the participation controllers of BAUER
Spezialtiefbau GmbH, BAUER Maschinen GmbH and BAUER
Resources GmbH, so as to ensure properly qualified financial
Materials management and procurement
Thanks to our long-standing and successful policy in our
machinery manufacturing operations of planning well ahead
to safeguard supplies of components which may be subject
to bottlenecks, and based on additional measures we have
taken and on our ability to have time-critical components
made within the Group in the event of a bottleneck, the risks
in terms of procurement currently remain classed as low. We
also estimate the reliance on subcontractors or individual
suppliers in our segments as a low risk.
Production and order fulfillment
Technical failures arising from design errors or miscalculations
of statics in the project business can result in significant delays,
both on the company‘s own construction projects and on our
customers‘ projects. In the BAUER Group, the risks resulting
from this represent an inherent component of our project busi-
ness. Consequently, designs and statics are predominantly
produced in our own design bureaus by experienced em-
ployees.
A further risk in order fulfillment is entailed by the selection and
application of drilling techniques. Misjudging ground conditions
can likewise result in increased risk costs. Disturbances to the
project timetable must be identified by the project manager and
communicated at an early stage. The management is aware
of these risks, and relies on experienced project and production
managers in all segments. In spite of all the precautions taken
when carrying out projects, there is still a risk of management
errors, which can drive up costs, especially in major projects.
All the listed risks are subjected to a threat and opportunity
analysis at project level in the Construction and Resources
segments.
Project risks are essentially the principal performance risks
in the Construction and Resources segments, especially as
each project has its own individual characteristics. Although
we work on the assumption that our projects are costed with
due diligence, the possibility cannot be definitively ruled out
that, on finally billing the customer, lower earnings will ultimately
be generated. As a result of the trend for projects to increase
in size and complexity, the resulting risks must be assessed
as medium.
Supplements and claims management
Especially in respect of complex construction works, we are

56COMBINED MANAGEMENT REPORTRisk and Opportunity Report
various business units as part of their duty of supervision. These
figures and information reports are regularly submitted to the
Management Board and the Supervisory Board of BAUER
AG from Group Accounting function on a monthly basis.
The IT systems employed in these procedures are protected by
appropriate security systems against unauthorized access and
data loss. Based on the systematic multi-segment structuring
of the Group‘s accounting process, with its redundant control
instances, we are able to classify the resultant risks as low.
OVERALL RISK
At present, no individual or aggregated risks can be detected
that could threaten the existence of the BAUER Group in the
2017 financial year. The management sees no change in the
overall risk situation, in view of future business prospects
among other factors.
OPPORTUNITY REPORT
The opportunities arising are classified in parallel with the
detailing of risks. In this context, too, the areas of opportunity
have been aggregated. Unless otherwise specified, all oppor-
tunities set out in the following relate to all our segments.
STRATEGIC OPPORTUNITIES
Over the years, the Group has built up expertise through
handling projects in areas associated with its core business,
and has developed synergy effects from this which today
shape the Resources segment.
These include the environmental technology business which
deals with treating contaminated ground and groundwater,
and has taken on an increasingly international character sin-
ce its beginnings more than 25 years ago. A similar business
grew out of the first use of specialist foundation engineering
equipment for diamond exploration. Today, bore holes are
dug for all kinds of natural resources. In the water business,
we also develop high-quality products for expanding wells
and for close-to-the-surface geothermal energy applications,
as well as for treating and purifying drinking water, process
water and industrial waste water.
reporting in accordance with the relevant national or interna-
tional accounting regulations. Furthermore, statements are
subjected to auditing in accordance with the relevant national
regulations.
In order to draw up the monthly Group reporting as well as
quarterly statements and the consolidated financial statements
according to international accountancy regulations (IFRS), the
subsidiaries use a uniform Group chart of accounts.
The individual financial statements are drawn up either based
on an accounting guideline applicable throughout the Group
or are applied to the regulations of the accounting guideline
in the course of adjustment entries by the corresponding
accountancy regulations under national law.
At the major Group companies, the success of each individual
department is mapped as a central management instrument
by means of an expense distribution sheet. This reveals any
non-conformance to annual budgets. At project level, a monthly
reconciliation is carried out to cross-check the actual figures
against the cost accounting and site management budgets.
Our judgment and experience tells us that self-monitoring
and establishing dual control principles are the effective
elements of our system of internal controls.
The individual Group companies and departments are
monitored and controlled on a monthly basis by the central
commercial departments in the respective segments and are
then reviewed by Group Accounting further reducing the
accounting, valuation and reporting risks.
The consolidated figures are in turn checked on a monthly
basis against the figures from the annual Group-wide
planning process and analyzed on the basis of Group key
performance indicators (KPIs). Any necessary correction of
non-conformance to plan is implemented promptly by the
managers of the units concerned.
The annual financial statements and the year-end consolidated
financial statements are audited by auditors in accordance
with the applicable legal requirements and standards, and
are reviewed by the Supervisory Boards established in the

57
In the Resources segment, we have succeeded in expanding
out of our traditional sphere of pollution remediation into indus-
trial process water treatment, and thus attracting customers
in the automotive, chemicals, oil and gas industries. The
demanding quality requirements combined with large quan-
tities of industrial process waters occurring in oil production,
against a background of ever more stringent environmental
standards, offer additional outstanding market opportunities
for our products and services.
VALUE CREATION OPPORTUNITIES
Development and innovation
Development and innovation are systematically integrated into
many standard processes within the Group. Their efficiency
is monitored as part of the quality management system. It
is also ensured that customers‘ wishes are understood as
being opportunities, and are translated into innovations for
our products and services in a timely manner. The capacities
of our engineering offices are systematically being strengthened
by resources from countries with high levels of education allied
to low labor costs, such as India.
Innovation is possible at practically every point within our
business processes. Our employees are best placed to know
where improvements are achievable in their particular sphere
of work. In order to collate and make use of the many good
suggestions which our employees submit, we have devised a
system for the unbureaucratic recording, evaluation, implemen-
tation and rewarding of their suggested improvements, which
has been in turn rewarded by a number of good ideas.
Project opportunities
Regardless of national and global market cycles, projects often
arise in otherwise weak markets which we as a corporation are
extremely well equipped to handle thanks to the mix of our
products and services portfolio. Examples of this are processes
for retrofitting of core seals in earthwork dams, or for the long-
term, environmentally compatible treatment and disposal of
industrial process water.
By merging these three areas into the Resources segment,
we are addressing some of the most important issues of
the 21st century. Moreover, Resources is less dependent
on the economic cycles of our traditional Construction and
Equipment segments.
In order to bring about the internationalization of the Resources
segment, we are utilizing the experience of our long-standing
organizational units in the other two segments.
In the event of a regional market downturn, our network
strategy in the Construction segment will enable us to relocate
our capacities rapidly to another country and continue oper-
ations at the new location. This leads to speed and cost
advantages in our project business.
MARKET OPPORTUNITIES
Constantly increasing urbanization and growing infrastructural
needs are leading to increasingly large-scale building schemes,
which offer many interesting project opportunities to the con-
struction industry – and especially the companies in the
specialist foundation engineering sector. The construction
sector in particular benefits from an enormous need to catch
up with backlogs in the rising economic countries, but also
in the established industrial nations. This applies not only to
traffic infrastructure but also to residential and public buildings,
dams or flood protection facilities. Moreover, building is taking
place in urban areas where space is increasingly at a premium.
This demands progressively higher buildings, which calls for
extensive foundation work. In addition, stationary and flowing
traffic must be ever-increasingly transferred below ground,
which also leads to growth in specialist foundation engineering.
Opportunities for deep drilling technology have increased further
through the establishment of a joint venture with Schlumberger
during the previous year. In the joint venture, a new generation
of highly modern deep drilling rigs for use with oil and gas drill-
ing rigs will be developed and constructed for Schlumberger
and third parties. Overall, we are convinced that deep drilling
technology will make an important positive contribution to our
earnings in future.
COMBINED MANAGEMENT REPORTRisk and Opportunity Report

58COMBINED MANAGEMENT REPORTRisk and Opportunity Report
by professional management of supplemental requirements
in the course of the construction project.
OVERALL OPPORTUNITIES
We are seeing a steady improvement in our opportunities
on global markets as our Resources segment becomes
increasingly well established. This is also being boosted by
new, innovative products. Our strategy of systematically
interlinking our mainly small and medium-sized globally
operating units to create efficient networks is enabling us
more and more effectively to generate speed and cost
benefits from the associated economies of scale. All in all,
we see the opportunities for our Group‘s worldwide business
increasing once again in 2017.
The resultant projects in some cases entail very large lot units.
When contracted, we are able to manage them successfully
by converging our global resources and based on our many
years of experience in handling large-scale projects.
Supplements and claims management
The assertion of requirements and supplements does not
only entail risks, but also the opportunity to achieve better
earnings than originally specified in the contract based on
changes to the ordered construction services or supple-
mental work ordered by the client. On projects involving high
potential for changes, this can result in a substantial impro-
vement in earnings. We attempt to exploit such opportunities
Ghelma AG installed piles with diameters up to 880 mm and depths of up to ten meters for the construction of a shipping pier on
Lake Thun, Switzerland. A BG 18 H was used on a pontoon.
>>>
59
during the past few years also meant that we had to cope
with economic problems in some of our markets and were
not able to compensate for individual problems. Substantial
expenditures for restructuring measures were also necessary.
In the Equipment segment, excess capacities resulted from
the enormous boom ahead of the financial market crisis. We
too invested in new plants before the crisis began. However,
our Chinese competitors completely misjudged the develop-
ment of demand for construction equipment, resulting in an
expansion of production capacity that could have satisfied
global demand many times over. For us, it was very challenging
to keep sales in the Equipment segment stable, but we
succeeded through much hard work. However, as a result,
we were unable to maintain earnings at our previous high
levels.
On the other hand, we can also list many positive aspects.
Despite these developments, we were able to build up an
excellent order backlog. Our business in oil and gas drilling
rigs is now on a promising path thanks to the joint venture
with Schlumberger. Despite the competitive situation described
above and the approximately 28 % decline in the global equip-
ment market from 2012 to 2015, we managed to keep our
sales nearly stable during this period. We consider it a great
success that we were able to increase sales in specialist
foundation engineering equipment in 2016. Our research
and development efforts ensure our leading position in this
market segment. We have better aligned our business to
completely new market conditions through many reorgani-
zation measures in recent years.
Business in our relatively new Resources segment is largely
back on a good path for the future. This applies to all activities
in the environmental area. Reorganization measures are be-
ginning to have an effect in the well engineering materials area.
Our companies in the water business were still burdened with
former projects that will not have a significant impact on the
future. After a long dry spell, we now have a good order
backlog in Jordan that will also help us to improve our well
drilling business.
Nevertheless, earnings in 2016 were lower than expected.
We will therefore continue to work intensively on improving
earnings. Whereas in recent years we concentrated on making
operational changes, last year we began to focus on further
areas. These include personnel as well as purchasing, pro-
As was already explained in the Business Report, the BAUER
Group operates in markets which display good underlying
growth rates. As a result of the enormous pent-up demand
for construction activities existing in the world, we are of the
opinion that this situation will not change over the coming years,
in spite of the turbulence that is affecting global markets.
Nevertheless, it will be necessary to respond to shifts in the
market focus by displaying great flexibility. For example, it is
to be expected that construction activities and, as a result,
demand for new machinery in the oil and gas-dependent
markets will decrease in the next few years. In established
industrial nations, both should increase as these countries
can now invest in new construction projects because their
financial position has improved again. Developing countries
will continue to show the greatest growth rates in construction
in the coming years so that they can reach their own goals.
These include countries such as Indonesia or the Philippines.
Our excellent order backlog at the end of 2016 indicates that
we are successfully exploiting the opportunities presented by
the markets. Furthermore, there are many interesting major
projects all over the world which will enable us to maintain
this high level. In the Construction and Resources segments,
we are able to achieve relatively high order backlogs as a result
of the longer project durations.
The order backlog in the Equipment segment is rather low,
however. This is not set to change in coming years. Equipment
customers interested in special construction machinery tend
only to order machines when they have a particular project to
carry out. The ongoing excess capacity in the market means
that there is still an inventory of finished equipment for sale.
Given the short order lead times, it is difficult to accomplish
equipment planning in line with future demand – above all
because components and parts have got to be ordered
several months ahead of production. We are responding to
this development with a corresponding platform strategy and
appropriate standardization measures, and in this way we are
attempting to make production more flexible and reduce the
inventory level. We expect this situation to continue to affect
our business.
The past few years have been very difficult for our Group.
We had to accept financial setbacks because of several
difficult projects in the construction and well drilling sectors.
The many political and economic disturbances in the world
COMBINED MANAGEMENT REPORTForecast Report
VIII. FORECAST REPORT

60COMBINED MANAGEMENT REPORTForecast Report
in EUR million Actual 2016 Forecast 2017
Total Group revenues 1,586 ~ 1,700
EBIT 68.3 ~ 75
Earnings after tax 14.4 ~ 23 - 28
Comparison: 2016 actual/2017 forecast
Of course, an opportunity can also arise if the ground has been
assessed too negatively prior to starting construction works.
Our construction sites can then also generate additional profit.
There is currently no need to change the Group‘s basic
strategic objective. The strategy comprising the Construction,
Equipment and Resources segments will continue to dictate
the direction of the Group over the coming years. We are not
planning any major acquisitions at present, as we are intending
to strengthen our capital base especially over the years ahead.
Based on the information available to us at the time of com-
pleting this report, we forecast that total Group revenues
for the 2017 financial year will be around EUR 1.7 billion. We
forecast earnings after tax of about EUR 23 to 28 million
and EBIT of about EUR 75 million.
We are continuing to plan for growth of between 3 % and 8 %
in total Group revenues for the coming years.
duction and measures to reduce working capital. We can still
see good opportunities for improvement in all areas. We are
very confident that we will achieve our goals thanks to the
improved market situation, the excellent efforts on the part
of our employees and the measures described above.
In addition, over the past few years, we succeeded in dealing
with a number of problems that arose from the numerous crises
and weak markets around the world. We also corrected some
of our own mistakes and misjudgments during this time. This
has allowed us to refocus our efforts on our core business
operations and achieve new success.
The possibilities offered by the digitalization of our products
and services are one special area of focus for the future. We
will continue to equip our machines with electronic systems
in order to ensure further economic advantages for ourselves
and our customers. The cross-linking of our own sites and
projects continues to be a top priority and „big data“ also
offers many new opportunities for our companies.
In view of these general conditions, it is our opinion that our
business model will prove robust in 2017 as well. In our
planning we have attempted to evaluate all known threats
and opportunities, thinking through both positive and negative
scenarios as well as possible. Overall, we are confident that
our planning for 2017 is realistic. This applies to all segments
as well as the Group as a whole. From an operational stand-
point, 2016 was already much better than the two previous
years, and we are once again experiencing a positive trend
that we will strengthen even further.
Nevertheless, we are obliged to point out that specialist foun-
dation engineering and our other businesses are exposed to
greater risk than the business activities undertaken by most
other companies. Our activity always contains a factor that
cannot be perfectly analyzed in advance – the subsoil or the
ground itself. Even after conducting extensive and detailed
preliminary ground surveys, some factors which were not
detectable will occur on a regular basis. They can impede
construction works in a wide variety of ways, and in some
cases also cause financial losses. We are continuously working
hard to optimize our approach to risk, so as to avoid the
issues that have impacted on us over recent years.
We still expect to make a loss in the first quarter, in line
with seasonal norms, though it will be balanced out over the
following quarters. The trend over the full year will thus be in
line with patterns in our business seen in earlier times. The
reason for this is that fewer machines can be invoiced at
the start of the year, because customers do not start buying
equipment until the construction season gets underway.
In the Construction segment, the winter period has a big
impact on a number of our markets.
Our balance sheet ratios have changed markedly over recent
years. This is illustrated most clearly by the increase in working
capital, which also resulted in a substantial increase in net debt.
This trend was largely attributable to the extremely competitive
environment in our Equipment segment, where inventories
increased significantly due to shorter lead times. We expect
to gradually improve our balance sheet ratios in the coming
years through our programs for reducing working capital.

61
be about 25 to 30 % of the reported earnings after tax. The
reduction in the dividend also serves to protect the Group‘s
equity, which we intend to significantly improve in the coming
years.
We do not see any existential risk or relevant risk to future
progress in our trading environment. However, the global
economy remains marked by great change, which may also
have a negative impact on our situation again. We should
point out that future forecasts are based on assumptions
and estimates made by the company management. Such
assumptions and estimates always entail a degree of un-
certainty and risk, which may mean that actual performance
differs from that forecast.
The improved performance of the markets should also support
these efforts. Over the coming years, we will be making great
efforts to increase our equity ratio back to more than 30 %.
Although the earnings generated from the Group‘s operating
activities were clearly positive, we were unable to achieve the
targets originally set for 2016. Nevertheless, we believe it is
appropriate to allow our shareholders to participate in this, so
we intend to pay a small dividend. The Management Board
will therefore encourage the Supervisory Board to propose a
dividend payment of EUR 0.10 (previous year: EUR 0.15) to
the shareholders at the Annual General Meeting. As a result,
the dividend quota has increased from 8.7 % in the previous
year to 15.2 %. In the medium term, the dividend quota should
COMBINED MANAGEMENT REPORTForecast Report
Schrobenhausen, March 31, 2017
BAUER Aktiengesellschaft
Prof. Thomas Bauer
Chairman of the Management Board
Dipl.-Betriebswirt (FH) Hartmut Beutler Peter Hingott

62
Uncertainty leaves its mark
Compared to the previous year, few crises were resolved in
2016, while new ones emerged. The political and economic
situation is marked by growing uncertainty.
Global economic growth has slowed. This is mainly due to
a decline in growth in the industrialized nations. Growth was
down from the previous year in the Eurozone, where it was
1.7 %, and the USA, which recorded 1.6 %. Russia, Brazil
and South America as a whole are still in a recession. As an
exception among the major industrialized nations, Germany
saw an improvement in growth, which reached 1.7 %.
Alongside unresolved hot spots such as Russia/Ukraine, a
continued slowdown in China and international terrorism, an
array of new uncertainties have also had a major impact on
growth. Great Britain voted for Brexit and US voters elected
Donald Trump, a nationalist and protectionist, as president.
Nationalists also could gain influence in Europe in the 2017
elections.
The only turnaround was in the price of oil. At the beginning
of 2016, oil prices were still below USD 30 per barrel, but
rose to more than USD 55 during the course of the year,
partly because OPEC agreed to decrease output.
There was also a turnaround in interest rates in the USA. The
Federal Reserve raised the prime rate slightly to 0.5 - 0.75 %.
In March 2017, the next increase came with 0.25 %. A similar
move by the ECB is not foreseeable at this time.
It remains unclear how the economy will perform given this
environment of growing political uncertainty.
Sharp drop in Bauer share price
The Bauer share price fell sharply in 2016. It was down 33.6 %
as of the end of the year, although the Dax (+11.6 %) and
SDAX (+6.5 %) indices were up.
The share price dropped from EUR 17.40 to EUR 13.13 in
the first few weeks of January and reached its lowest point
in the first half of the year by mid-February. After a temporary
recovery and reaching EUR 15.84 in early March, the share
price began to fall slowly but steadily.
It then plummeted from about EUR 14 to below EUR 12 in
June. This occurred during a period of continued selling
pressure, which lasted until the end of the year.
The share price remained relatively stable between EUR 12 and
EUR 13 until early November, when renewed pressure to sell
shares drove the price down to EUR 9.45, its lowest level in
the year, on 2 December.
After a slight recovery towards the end of the year, the stock
price closed out the year at EUR 11.40.
The Bauer Share
Performance of the Bauer Share
in % BAUER AG DAX MDAX SDAX
01.01.2016 01.04.2016 01.07.2016 01.10.2016 31.12.2016 31.03.2017
20
10
0
(10)
(20)
(30)
(40)
(50)

63
In early 2017, there was a quick and significant turnaround.
Selling pressure abated, and the share price rose to EUR
14.90 in just a few days of trading. Until the end of March,
the share price was volatile and finished out the first quarter
at EUR 14.25.
Communication and dialog with shareholders
Regular dialog with the capital market and shareholders is
the primary objective of our investor relations activities.
The Management Board engages with domestic and foreign
investors mainly at roadshows and capital market conferences.
Key destinations include Frankfurt, London, Helsinki, Copen-
hagen, Munich and New York.
As in the previous year, four analysts regularly reported on
Bauer shares in 2016. At the end of the year, three analysts
voted "hold" and one voted "buy". The average target share
price quoted was EUR 12.63.
Particularly our private shareholders used the Annual General
Meeting in June to obtain information from the Chairman of the
Board about the company's situation. Around 450 shareholders
and guests attended the meeting in Schrobenhausen in 2016.
Dividend policy
Our dividend strategy is fundamentally oriented to the
goals of providing shareholders with an appropriate and fair
participation in the success of the business, maintaining
continuity, and safeguarding the equity ratio.
We did not meet the goals were originally set for 2016.
Earnings after tax in the Group were below expectations.
As a result, we must continue to strike a careful balance
between continuity and shareholder participation on the one
hand, and safeguarding our equity ratio on the other.
The Management Board will therefore encourage the
Supervisory Board to propose a dividend payment of EUR
0.10 (previous year: EUR 0.15) to the shareholders at the
Annual General Meeting. As a result, the dividend quota has
increased from 8.7 % in the previous year to 15.2 %.
THE BAUER SHARE
ISIN / WKN DE0005168108 / 516810
Trading symbol B5A
Trading segment Frankfurt, Prime Standard
Share indexes CDAX, GEX, DAXPlus Family
Class of share No-nominal-value individual bearer shares
Share capital EUR 73,001,420.45
Number of shares 17,131,000
Shareholder structure Bauer family 48.19 %, free float 51.81 %
Share information
More information:
http://ir.bauer.de
* Proposed; subject to the consent of the Annual General Meeting on June 29, 2017
KEY FIGURES 2013 2014 2015 2016
Earnings per share (in EUR) -0.99 0.85 1.73 0.66
Dividend per share (in EUR) 0 0.15 0.15 0.10 *
Dividend total (in EUR ’000) 0 2,570 2,570 1,713 *
Year-end price (in EUR) 18.81 13.35 17.40 11.40
Annual high (in EUR) 23.05 20.04 19.20 17.16
Annual low (in EUR) 17.33 11.75 13.85 9.45
Market capitalization at year-end (in EUR ’000) 322,234 228,699 298,079 195,293
Average daily trading volume (units) 39,017 26,984 25,570 18,173

64
The Management Board, also on behalf of the Supervisory
Board, submits the following report in accordance with
Article 3.10 of the German Corporate Governance Code. The
Corporate Governance Report also includes the Declaration
on Corporate Governance pursuant to Articles 289a and 315
subsection 5 of the German Commercial Code (HGB), which
forms part of the Combined Management Report for the 2016
financial year.
Declaration of Conformity 2016
In the year under review, based on preliminary work by the
Presidial and Personnel Committee, the Management Board
and Supervisory Board reviewed the company's compliance
with the German Corporate Governance Code. On December
9, 2016 the Management Board and Supervisory Board
passed the following declaration of conformity:
„Since the last declaration in December 2015 the company
has complied with, and currently complies with, each of the
recommendations of the "Government Commission of the
German Corporate Governance Code" as published by the
German Federal Ministry of Justice in the official section of
the electronic version of the German Federal Gazette ("Bun-
desanzeiger"), with the following exceptions:
1. Contrary to Article 3.8 an excess of at least 10 percent of
the loss up to at least an amount representing one and a
half times the fixed annual remuneration of Management
Board and Supervisory Board members is not agreed for
D&O insurance for the Supervisory Board. As a result of
the moderate remuneration provisions for the Supervisory
Board in the Articles of Association, a corresponding
excess for the Supervisory Board is not approved. Even
without a corresponding excess, the Supervisory Board
members will perform their duties responsibly.
2. Contrary to Article 4.1.5 there is no appropriate inclusion
or participation of women arranged for in the filling of
management positions. In particular, the introduction of
a quota for women is not supported in order to ensure
equal opportunities. These positions should be filled
regardless of gender so that neither the female gender nor
the male gender is favoured or discriminated against. In
addition, a candidate should not suffer any disadvantage
on the grounds of racial or ethnic origin, religion or belief.
3. The individualized disclosures of the benefits, the remune-
ration and the pension benefits awarded to each member
of the Management Board are not individualized for each
member of the Management Board in the remuneration
report as the Annual General Meeting dated June 23, 2016
resolved on the omission of the disclosures according to
section 285, no. 9, letter a, sentences 5 to 8, section 315a
subsection 1 and section 314, subsection 1, no. 6, letter a,
sentences 5 to 8 of the German Commercial Code (HGB)
and therefore the disclosures required under Article 4.2.5
would contradict such shareholder resolution.
4. Contrary to Articles 5.1.2 and 5.4.1, no age limit for mem-
bers of the Management Board or Supervisory Board and
no time limit to the length of membership in the Supervisory
Board are specified. Expertise and performance as well as
independence cannot be determined on the basis of rigid
age limits or length of membership. Upon the appointment of
new Management Board and Supervisory Board members
or upon prolongation of their membership at the end of the
statutory term of office, the persons in the Supervisory Board
and the Annual General Meeting who bear responsibility
for selecting suitable members will take account of the
age and the independence of the chosen person when
reaching their decision, alongside assessing their skills.
5. Contrary to Article 7.1.2, the consolidated financial state-
ments at December 31, 2015 were made public within
109 days rather than 90 days of the end of the financial
year. As a result of the international structure of the Group,
the completion and consolidation of the separate financial
statements take a considerable amount of time. In the
interests of conscientious accounting processes, efforts
to improve the accounting procedures continue.
Furthermore, BAUER Aktiengesellschaft already conforms
largely to the additional suggestions of the German Govern-
ment Commission on the Corporate Governance Code.“
Roles of the Management Board and Supervisory
Board
German company law prescribes a dual system of manage-
ment for BAUER AG, characterized by a strict separation of
personnel between the Management Board as the executive
management body and the Supervisory Board as the super-
Corporate Governance ReportAND DECLARATION ON CORPORATE GOVERNANCE

65
and Group Management Report, as well as proposals for
the appropriation of net profit available for distribution. The
Chairman of the Supervisory Board coordinates the work of
the Supervisory Board, chairs its meetings and represents
the Supervisory Board externally. The Supervisory Board
regularly reviews the efficacy of its activities.
Composition of the Supervisory Board
Pursuant to the German Co-Determination Act, the Super-
visory Board of BAUER AG comprises 12 members, with
half of them being appointed by the employees and the
other half by the Annual General Meeting. The Supervisory
Board includes a sufficient number of independent members
who have no business or personal links to the company, to
its executive bodies, to any controlling shareholder or to any
company associated with any such shareholder which may
give grounds for a material and not merely temporary conflict
of interests. Moreover, all members of the Supervisory Board
are obligated to immediately disclose to the Supervisory Board
any conflicts of interest as and when they arise. No conflicts
of interest were disclosed to the Supervisory Board by any of
its members during the year under review.
The Supervisory Board of BAUER AG currently comprises four
women and eight men and therefore, since the re-elections
in June of the year under review, each half of the Supervisory
Board is comprised of at least 30 % women and at least
30 % men pursuant to Section 92 subsection 2 of the
German Stock Corporation Act.
The following objectives must be taken into account by the
Nominations Committee and by the Supervisory Board when
proposing candidates for election to the Supervisory Board
at the Annual General Meeting:
• The Supervisory Board shall be composed such that
its members collectively possess the necessary skills,
knowledge and professional experience to carry out its
assigned role in a correct and proper manner.
• The appointment of shareholders' representatives to the
Supervisory Board shall take due account of the Group's
fundamental character as a family business, giving due
consideration to the implications of that character in terms
of the corporate culture, whereby two members shall be
appointed from the Bauer family, provided the candidates
are suitable.
vising body. Moreover, the company's Articles of Association
and the rules of procedure governing the work of the Super-
visory Board and of the Management Board also lay down
the basic structures of their collaboration.
The Management Board is assigned independent responsibility
for managing the company. Notwithstanding the joint overall
responsibility of the Management Board, each member of
the Management Board acts on his or her own responsibility
within his or her assigned portfolio of functions. Measures
and transactions of a division of the Management Board
that are of extraordinary importance for the company or a
business unit, or which are associated with an extraordinary
financial risk, require the prior approval of the entire Manage-
ment Board. The Chairman of the Management Board
coordinates the work of the Management Board. The
Management Board members report on a regular basis to
the Chairman of the Management Board in respect of all
material matters and on the course of business within their
assigned functions. A member of the Management Board
has been appointed Labor Director, and is responsible to
an increased extent for human resources and social policy
topics in the company. The Management Board defines
the corporate strategy, agrees it in consultation with the
Supervisory Board, and ensures that it is implemented. The
Management Board provides the Supervisory Board and
its subcommittees information by way of monthly reports,
by conference calls and at routine meetings, as well as at
extraordinary meetings, in respect of all matters of relevance
to the company.
The Supervisory Board appoints the Management Board.
In doing so, it considers not only the relevant professional
qualification of its members but also – given the international
nature of the business – the diversity of its composition. The
Supervisory Board also sets the overall level of remuneration
paid to the Management Board, regularly reviews remuneration
levels, and specifies the remuneration paid to individual mem-
bers of the Management Board. It appoints, supervises and
advises the Management Board, and participates in decisions
of fundamental significance to the company. The company's
Articles of Association stipulate relevant transactions and
undertakings which require the consent of the Supervisory
Board. Duties of the Supervisory Board include reviewing
the annual financial statements of the company, the con-
solidated financial statements and the parent company
CORPORATE GOVERNANCE REPORT

66
the Supervisory Board. The chairmen of the various com-
mittees submit regular reports on their work to the plenary
Supervisory Board meetings.
The Presidial and Personnel Committee comprises the
Chairman of the Supervisory Board as well as one Supervisory
Board member elected by the shareholder representatives and
one by the employee representatives respectively. Its role
includes preparing the way for Supervisory Board decisions
relating to the setting of overall remuneration to individual
Management Board members and to the remuneration system
for the Management Board in general, as well as responsibility
for establishing, amending and terminating service contracts
with the members of the Management Board. It also discusses
corporate governance matters.
The Audit Committee comprises three members elected by
the Supervisory Board by a majority of the votes cast, with
two members proposed by the Supervisory Board members
of the shareholders and one member proposed by the Super-
visory Board member of the employees. The Chairman of
the Audit Committee is elected by the Supervisory Board
at the suggestion of the shareholders' representatives. The
Chairman of this committee is an independent member
of the Supervisory Board possesses specific knowledge
and experience in the application of accounting policies
and audit procedures, and is neither a former member of
the company's Management Board nor the Chairman of
the Supervisory Board. The role of the Audit Committee
is in particular to monitor accounting procedures and to
review the efficiency of the system of internal controls, the
risk management system and the internal auditing system
including compliance. The Audit Committee prepares the
proposal of the Supervisory Board to the Annual General
Meeting concerning the appointment of auditors, and assess
their independence. It undertakes a preliminary review of the
annual financial statements of the parent company and the
consolidated financial statements of the Group together with
the Combined Management Report, as well as preparing
the proposal on appropriation of unappropriated net profit
and consulting on the audit reports with the auditors. It also
reviews the half-year interim report and quarterly statements.
The Nominations Committee comprises three shareholder
representative members of the Supervisory Board. The
Chairman and the Deputy Chairman of the Nominations
• At least two of the shareholders' representatives on the
Supervisory Board shall have substantial experience in the
management of construction and/or construction machinery
manufacturing companies.
• At least one of the shareholders' representatives on the
Supervisory Board shall possess specialist skills and ex-
perience in the application of financial reporting standards
and the implementation of internal control procedures.
• The employees' representatives on the Supervisory Board
will be elected in accordance with the provisions of the
German Employees' Co-determination Act.
• The Supervisory Board shall include not more than four
members in total who have business or personal links
to BAUER AG, to its executive bodies, to any controlling
shareholder or to any company associated with any such
shareholder which may give grounds for a material and not
merely temporary conflict of interests.
• Supervisory Board posts shall, subject to provisions of the
applicable laws, be filled on merit, regardless of gender so
that neither men nor women are preferred or disadvantaged.
Moreover, when appointments are made to the Supervisory
Board, a candidate shall not be disadvantaged for reason of
race, ethnic origin, religion or world view.
According to the German Stock Corporation Act, the Super-
visory Board of BAUER AG must be comprised of at least
30 % women and at least 30 % men. During the re-elections
in the financial year under review, all legal requirements and
objectives were taken into account when candidates were
proposed for election to the Supervisory Board at the Annual
General Meeting, and no age limit or time limit to the length
of membership in the Supervisory Board was to be applied
in accordance with the exception published in the declaration
of conformity. The current composition of the Supervisory
Board fully meets the objectives of the Supervisory Board
and the legal requirements.
Composition and roles of the subcommittees
The Supervisory Board has established four standing
committees constituted from among its members. The
Supervisory Board subcommittees and their roles and
procedures are laid down in the rules of procedure governing
CORPORATE GOVERNANCE REPORT

67
framework guidelines and management principles applicable
for the Group as well as its basic values. A code of conduct
has also been published on the company's website to ensure
that all BAUER Group employees conduct themselves in
compliance with the rules.
An appropriate system of risk management and of internal
controls is established within the company. The essential
features of the control and risk management system are
set out in the Risk Report forming part of the Combined
Management Report. Internal auditing systems monitor
compliance with laws and standards across the Group.
The Management Board regularly updates the Supervisory
Board on existing risks and risk trends, as well as on internal
auditing procedures.
SHAREHOLDERS AND TRANSPARENCY
The company provides regular and timely information relating
to the position of the company and in respect of material
changes to the business. The company's website contains
comprehensive information. In addition, electronic distribution
systems and the German Federal Gazette ("Bundesanzeiger")
are used to ensure timely communication with our share-
holders and with the public at large.
The Annual General Meeting passed a resolution, with
the necessary three-quarters majority, stipulating that the
remuneration paid to members of the Management Board
shall not be disclosed individually. Consequently, as has
been the policy to date, only the remuneration paid to
the Management Board in total and the structure of the
remuneration system are disclosed in the Remuneration
Report on pages 45 to 47 of the company's Annual Report.
As of December 31, 2016, Members of the Management
Board at the year-end held 1,742,022 (previous year:
1,742,022) shares in the company, corresponding to 10.17 %
(previous year: 10.17 %) of the share capital of BAUER AG.
On the same date, members of the Supervisory Board held
a total of 1,297,151 (previous year: 1,310,531) Bauer shares,
corresponding to 7.57 % (previous year: 7.65 %) of the com-
pany's share capital. No company share option schemes
or similar stock incentive programs existed during the past
financial year.
Committee are proposed and elected by the Supervisory
Board members of the shareholders. The task of the
Nominations Committee is to submit to the Supervisory
Board proposals of suitable candidates to be put forward to
the Annual General Meeting for election to the Supervisory
Board.
The Mediation Committee, constituted pursuant to the
German Co-determination Act, comprises two shareholder
representative and two employee representative members
respectively. The Mediation Committee is only convened
if a proposed candidate for appointment as a member of
the Management Board has not obtained the majority vote
required by the German Co-determination Act.
In his report to the Annual General Meeting, the Chairman
of the Supervisory Board summarizes the work of the
Supervisory Board and its subcommittees over the past
financial year. The Report of the Supervisory Board for the
2016 financial year is published in the company's Annual
Report on pages 68 to 69. This report is thereby quoted
by way of reference.
Determination of the female quota in the Management
Board and executive levels
The Supervisory Board determined a female target quota of
0 % for the Management Board until June 30, 2017. This
target has been met by the current Management Board
structure. The Management Board specified a female target
quota of 22.2 % rounded in the top executive level beneath
the Management Board until June 30, 2017 and 27.3 %
rounded until June 30, 2017 for the second executive level
beneath the Management Board. These targets were also
met at the end of the reporting year.
Corporate Governance and Compliance
The company's system of corporate governance is based
on German law, specifically on legislation governing public
limited companies, corporate co-determination and capital
markets, as well as on the company's Articles of Associa-
tion. The company's Articles of Association are published
on the company website at www.bauer.de, in the "Investor
Relations" section under "Corporate Governance". The
Management Board employs the Corporate Management
Manual implemented throughout the Group as its central
instrument of management. This manual also stipulates the
CORPORATE GOVERNANCE REPORT

68
The Supervisory Board regularly monitored the work of the
Management Board during the 2016 financial year on the
basis of the detailed reports provided by the Management
Board in written and verbal form, and provided support in the
form of advice. The Management Board discharged its duties
to provide the Supervisory Board with regular, prompt and
comprehensive information about all questions of strategy,
planning, company development, risk development and
compliance that are relevant to the company and the Group.
Between the meetings, the Management Board submitted
monthly written reports on all important business transactions
and financial indicators of the Group and the company. The
Chairman of the Supervisory Board was also in regular contact
with the Management Board, and gathered information as
appropriate relating to the course of business and key trans-
actions.
There were no indications of conflicts of interest among
members of the Management Board or Supervisory Board
requiring immediate notification of the Supervisory Board and
disclosure to the Annual General Meeting.
Re-elections for the Supervisory Board were held in the
financial year under review. At the Annual General Meeting,
Mrs. Andrea Teutenberg was elected to succeed Mr. Rainer
Schuster as of June 23, 2016. As of the same date, employees
elected Mrs. Maria Engfer-Kersten and Mr. Rainer Burg to
the Supervisory Board, which requires employer/employee
participation on equal terms. They replaced Mr. Norbert Ewald
and Mr. Gerold Schwab.
Main focus of consultations in Supervisory Board
meetings
During the year under review, four regular plenary sessions
were also held in addition to a constituents meeting after
re-elections. With the exception of Mr. Ewald, who attended
half of the Supervisory Board meetings during his term in
office, all Supervisory Board members attended more than
half of the Supervisory Board meetings during their term.
Several times last year, the Supervisory Board discussed the
enforcement of supplementary claims for major projects and
the development of earnings in the segments and individual
subsidiaries. Current business performance, order backlog
development and developments in the markets in the
Construction, Equipment, and Resources segments were
discussed at all Supervisory Board meetings.
At the annual financial review meeting in April relating to the
annual parent company and consolidated financial statements
for the 2015 financial year, also attended by the auditors, a
detailed review was undertaken of the respective financial
statements and associated management and audit reports,
taking into due consideration the report from the Audit Com-
mittee, and the proposal of the Management Board with
regard to the appropriation of earnings. During this meeting,
the Supervisory Board discussed the call for bids for the
audit of financial statements, re-elections to the Supervisory
Board, the remuneration system, the remuneration of the
Management Board and the invitation to the Annual General
Meeting.
During the second session of the financial year, the Supervisory
Board focused on the extension of the syndicated loan and
corporate restructuring in the Group.
During the September session, Mr. Peter Hingott was ap-
pointed as a member of the Management Board and Group
restructuring, cost-cutting measures and medium-term con-
solidated balance sheet planning were discussed.
During the Supervisory Board session in December in the
year under review, an updated declaration of conformity
with the German Corporate Governance Code was passed,
corporate finances and measures for improving earnings
growth were discussed. The employee bonus framework as
well as the Labor Director appointment were also approved.
Other topics included a review of corporate planning, the
annual plan for 2017 and the corporate strategy.
Work carried out by the subcommittees
There are four committees of the Supervisory Board. The
Mediation Committee was not required to convene because
of its terms of reference. The chairpersons submitted regular
reports on the main content of the subcommittee meetings
to the plenary Supervisory Board meetings. None of the
Report of the Supervisory Board 2016

69
committee members attended only half or less than half
of the committee meetings during their term in office.
Three meetings of the Presidial and Personnel Committee were
convened. At those meetings, preparations were made for the
decision of the Supervisory Board relating to the setting of the
salaries and performance bonuses of the members of the
Management Board and to the structuring of its remuneration
system, as well as to the performance bonus framework.
These meetings also focused on the declaration of conformity
with the German Corporate Governance Code, the appoint-
ment of Mr. Peter Hingott to the Management Board and
succession planning for the Management Board.
The Nominations Committee held two meetings to find
candidates and prepare Supervisory Board nominations to
be presented at the Annual General Meeting.
The Audit Committee held three conference calls and three
meetings in the financial year. The committee reviewed the
audit of the quarterly statements, the half-year interim report
and, in the presence of the auditors, the audit of the annual
financial statements of the parent company and the consoli-
dated financial statements of the Group. It also scrutinized
the Management Board's proposal regarding the appropriation
of earnings as well as the call for bids for the audit of financial
statements. It also prepared the appointment of the auditor,
including a review of the examination of the auditor's impartiality,
and discussed corporate financing. In addition, a special
session was held to discuss project management for large-
scale projects, risk management and internal auditing
measures.
Auditing of 2016 annual and consolidated financial
statements
The annual financial statements of BAUER AG to December 31,
2016 and the consolidated financial statements of the Group,
as well as the Combined Management Report, including the
Group accounts, were audited by the auditors elected by the
Annual General Meeting and duly appointed by the Supervisory
Board, PricewaterhouseCoopers AG Wirtschaftsprüfungsge-
sellschaft, Stuttgart. The accounts were certified by the audi-
tors without reservation. The Audit Committee subjected the
audit documentation and reports to thorough scrutiny. The
Committee reported on its review to the Supervisory Board.
The auditors attended the meeting of the Audit Committee
as well as the annual financial review meeting of the plenary
Supervisory Board.
The audit documentation and reports from the auditors were
provided to all members of the Supervisory Board in good time
for scrutiny. The Supervisory Board duly noted and concurred
with the findings of the auditors' review of the parent company
and Group consolidated financial statements and the Combined
Management Report. On conclusion of the Supervisory Board's
review, no objections were raised. The annual financial state-
ments of BAUER AG and the consolidated financial statements
of the Group were approved by the Supervisory Board at its
financial review meeting on April 10, 2017. The annual financial
statements of BAUER AG were thereby confirmed. Following
prior consultations by the Audit Committee, the Supervisory
Board concurred with the proposal of the Management Board
regarding the appropriation of net profit available for distribution.
On behalf of the Supervisory Board, I would like to thank the
members of the Management Board, all the Group's employ-
ees and the employee representatives within all Group com-
panies for their great commitment throughout the past financial
year.
Schrobenhausen, April 2017
The Supervisory Board
Dr. Klaus Reinhardt
Chairman of the Supervisory Board
REPORT OF THE SUPERVISORY BOARD


71
CO
NS
OL
IDA
TE
D F
INA
NC
IAL
STA
TE
ME
NT
S2
01
6
Income statement of BAUER Aktiengesellschaft
Balance sheet of BAUER Aktiengesellschaft as at December 31, 2016
72
73
Balance sheet and income statement of BAUER Aktiengesellschaft in accordance with HGB (German Commercial Code)
A new residential and commercial building is being built in Wiesbaden. A BG 28 was used to construct a five-layer anchored
soldier pile wall and a contiguous pile wall in a tight urban space.

72
Income statement of BAUER Aktiengesellschaft
* The presentation and breakdown of the income statement have been adjusted to the regulations of the German Commercial Code (HGB) that were amended as a
result of the Accounting Directive Implementation Act (BilRUG); Prior-year fi gures have been changed accordingly
in EUR ’000 12M/2015 * 12M/2016
1. Sales revenues 32,065 33,824
2. Other capitalized goods and services for own account 0 0
3. Other operating income 5,013 6,651
37,078 40,475
4. Cost of materials -6,176 -7,265
5. Personnel expenses -16,553 -17,972
6. Amortization of intangible assets and depreciation of property,
plant and equipment -2,875 -3,169
7. Other operating expenses -42,714 -20,730
-68,318 -49,136
Operating result -31,240 -8,661
8. Income from investments 3,960 4,460
9. Other interest and similar income 9,949 11,772
10. Interest and similar expenses -6,988 -8,106
Financial result 6,921 8,126
Result from operating activities -24,319 -535
11. Income tax expense -826 -863
12. Other taxes -19 -38
13. Net loss for the period -25,164 -1,436
14. Profit carried forward 33,350 5,616
15. Withdrawals from other revenue reserves 0 103
16. Dividend payment -2,570 -2,570
17. Unappropriated net profit 5,616 1,713

73
CO
NS
OL
IDA
TE
D F
INA
NC
IAL
STA
TE
ME
NT
S2
01
6
Balance sheet of BAUER Aktiengesellschaft as at December 31, 2016
Assets
in EUR ’000 Dec. 31, 2015 Dec. 31, 2016
A. Fixed assets
I. Intangible assets 3,693 4,506
II. Property, plant and equipment 5,808 5,241
III. Financial assets 116,745 129,325
126,246 139,072
B. Current assets
I. Inventories
Raw materials and supplies 44 45
II. Receivables and other assets
(of which receivables from affiliated companies)
198,682
(197,556)
240,079
(238,487)
III. Cash at banks 273 6,923
198,999 247,047
C. Prepayments and deferred charges 1,061 940
D. Deferred tax assets 1,080 1,094
327,386 388,153
Equity and liabilities
in EUR ’000 Dec. 31, 2015 Dec. 31, 2016
A. Equity
I. Subscribed capital 73,001 73,001
II. Capital reserve 39,781 39,781
III. Revenue reserves 15,100 14,997
IV. Unappropriated net profit
(of which profit carried forward: EUR 5,616 thousand; previous year: EUR 33,350 thousand) 5,616 1,713
133,498 129,492
B. Provisions
(of which provisions for pensions)
9,662
(8,165)
10,177
(8,740)
C. Liabilities
(of which liabilities payable to affiliated companies)
184,226
(38,543)
248,484
(2,263)
327,386 388,153


75
CO
NS
OL
IDA
TE
D F
INA
NC
IAL
STA
TE
ME
NT
S2
01
6
Consolidated Financial Statements in accordance with IFRS
76 Consolidated Income Statement
76 Consolidated Statement of Comprehensive Income
77 Consolidated Cash Flow Statement
78 Consolidated Balance Sheet at December 31, 2016
80 Consolidated statement of changes in equity
81 Notes to the consolidated financial statements
81 General notes
106 Segment reporting
108 Explanatory notes to the income statement
113 Explanatory notes to the balance sheet
144 Other disclosures
162 List of shareholdings of the BAUER Group
166 Assurance by the legal representatives
167 Audit opinion
In the southern states of the USA, a Bauer Maschinen customer carried out ground improvements for the expansion of a large
industrial plant. A BG 30 was used to construct single mixing columns up to 2,400 mm in diameter using the SCM method.

76
Consolidated Income Statement and Statement of Comprehensive Income
Income Statement
in EUR ’000 Notes 12M/2015 12M/2016
1. Sales revenues (7) 1,378,991 1,396,881
2. Changes in inventories 28,994 15,359
3. Other capitalized goods and services for own account (8) 22,748 13,472
4. Other income (9) 157,213 62,864
Consolidated revenues 1,587,946 1,488,576
5. Cost of materials (10) -752,532 -717,992
6. Personnel expenses (11) -376,118 -369,700
7. Other operating expenses (12) -274,235 -242,495
Earnings before interest, tax, depreciation and amortization (EBITDA) 185,061 158,389
8. Depreciation and amortization
a) Depreciation of fixed assets (13) -81,143 -74,509
b) Write-downs of inventories due to use (14) -13,195 -15,532
Earnings before interest and tax (EBIT) 90,723 68,348
9. Financial income (15) 4,972 5,540
10. Financial expenses (16) -41,982 -46,824
11. Share of the profit or loss of associated companies accounted for using the equity method 2,672 -3,021
Earnings before tax (EBT) 56,385 24,043
12. Income tax expense (17) -27,393 -9,629
Earnings after tax 28,992 14,414
of which attributable to shareholders of BAUER AG 29,715 11,302
of which attributable to non-controlling interests -723 3,112
in EUR 12M/2015 12M/2016
Basic earnings per share (18) 1.73 0.66
Diluted earnings per share (18) 1.73 0.66
Average number of shares in circulation (basic) 17,131,000 17,131,000
Average number of shares in circulation (diluted) 17,131,000 17,131,000
Statement of Comprehensive Income
in EUR ’000 12M/2015 12M/2016
Earnings after tax 28,992 14,414
Income and expenses which will not be subsequently reclassified to profit and loss
Revaluation of commitments arising from employee benefits
after termination of employment 6,543 -12,736
Deferred taxes on that revaluation with no effect on profit and loss -1,819 3,605
Income and expenses which will be subsequently reclassified to profit and loss
Market valuation of derivative financial instruments 1,024 793
Included in profit and loss -834 -1,763
Deferred taxes on financial instruments with no effect on profit and loss -53 272
Exchange differences on translation of foreign subsidiaries 6,733 -13,770
Other comprehensive income 11,594 -23,599
Total comprehensive income 40,586 -9,185
of which attributable to shareholders of BAUER AG 40,891 -5,470
of which attributable to non-controlling interests -305 -3,715

77
CO
NS
OL
IDA
TE
D F
INA
NC
IAL
STA
TE
ME
NT
S2
01
6
Consolidated Cash Flow Statement
in EUR ’000 12M/2015 12M/2016
Cash flows from operational activity:
Earnings before tax 56,385 24,043
Depreciation of property, plant and equipment and intangible assets 81,143 74,509
Depreciation of financial assets 162 4,209
Write-downs of inventories due to use 13,195 15,532
Financial income -4,972 -5,540
Financial expenses 41,820 42,615
Other non-cash transactions and results of de-consolidations -85,281 -23,780
Dividends received 1,168 1,583
Income from the disposal of property, plant and equipment and intangible assets -15,371 -1,845
Income from associated companies accounted for using the equity method 2,672 -3,021
Change in provisions 1,474 -136
Change in trade receivables -38,763 489
Change in receivables from construction contracts 13,872 -22,373
Change in other assets and in prepayments and deferred charges 4,648 11,501
Change in inventories -38,028 -25,371
Change in trade payables 13,174 21,963
Change in liabilities from construction contracts 16,874 14,042
Change in other current and non-current liabilities -12,068 13,078
Cash and cash equivalents generated from day-to-day business operations 52,104 141,498
Income tax paid -19,679 -16,619
Net cash from operating activities 32,425 124,879
Cash flows from investment activity:
Acquisition of property, plant and equipment and intangible assets -82,027 -79,073
Proceeds from the sale of property, plant and equipment and intangible assets 53,803 12,521
Consolidation scope-related change in financial resources -9,268 -123
Net cash used in investing activities -37,492 -66,675
Cash flows from financing activity:
Raising of loans and liabilities to banks 213,371 236,373
Repayment of loans and liabilities to banks -159,173 -256,943
Repayment of liabilities from finance lease agreements -7,804 -8,555
Disbursements for the acquisition of additional shares in subsidiaries 610 0
Dividends paid -3,143 -3,174
Interest paid -38,593 -35,573
Interest received 3,851 3,700
Net cash used in financing activities 9,119 -64,172
Changes in liquid funds affecting payments 4,052 -5,968
Influence of exchange rate movements on cash 1,519 -7,975
Total change in liquid funds 5,571 -13,943
Cash and cash equivalents at beginning of reporting period 41,835 47,406
Cash and cash equivalents at end of reporting period 47,406 33,463
Change in cash and cash equivalents 5,571 -13,943

78
Consolidated Balance Sheet at December 31, 2016
Assets
in EUR ’000 Notes Dec. 31, 2015 Dec. 31, 2016
A. Non-current assets
I. Intangible assets (19)
1. Concessions, industrial property rights and similar rights and values
and licenses to such rights and values 9,350 8,857
2. Capitalized software costs 11 2
3. Capitalized development costs 18,094 16,781
27,455 25,640
II. Property, plant and equipment and investment property (19)
1. Land, land rights and buildings 184,232 177,818
2. Investment property 784 0
3. Technical equipment and machinery 187,313 189,383
4. Other equipment, factory and office equipment 26,365 25,955
5. Payments on account and assets in course of construction 5,662 14,821
404,356 407,977
III. Investments accounted for using the equity method (19) 132,553 129,252
IV. Participations (19) 3,613 9,730
V. Deferred tax assets (20) 27,190 42,907
VI. Other non-current assets (21) 7,722 8,256
VII. Other non-current financial assets (22) 15,355 18,412
618,244 642,174
B. Current assets
I. Inventories (23)
1. Raw materials and supplies 155,718 151,489
2. Finished goods and work in progress and stock for trade 288,911 295,837
444,629 447,326
II. Receivables and other assets (24)
1. Receivables from construction contracts (PoC) 129,478 154,802
2. Trade receivables 343,933 339,993
3. Receivables from enterprises in which the company has participating interests 3,272 6,473
4. Payments on account 5,364 3,870
5. Other current assets 33,381 30,574
6. Other current financial assets 28,901 18,364
544,329 554,076
III. Effective income tax refund claims 2,300 4,771
IV. Cash and cash equivalents (25) 47,406 33,463
V. Assets held for sale (26) 0 19,608
1,038,664 1,059,244
1,656,908 1,701,418

79
CO
NS
OL
IDA
TE
D F
INA
NC
IAL
STA
TE
ME
NT
S2
01
6
Equity and liabilities
in EUR ’000 Notes Dec. 31, 2015 Dec. 31, 2016
A. Equity (27)
I. Subscribed capital 73,001 73,001
II. Capital reserve 38,404 38,404
III. Other revenue reserves and unappropriated net profit 327,437 318,462
Equity of BAUER AG shareholders 438,842 429,867
IV. Non-controlling interests 12,368 4,264
451,210 434,131
B. Non-current debt (28)
I. Liabilities to banks 376,628 176,754
II. Liabilities from finance lease agreements 12,652 19,127
III. Provisions for pensions (29) 112,284 127,081
IV. Other non-current liabilities 7,262 7,556
V. Other non-current financial liabilities 4,414 3,983
VI. Deferred tax liabilities (20) 20,664 22,296
533,904 356,797
C. Current debt (30)
I. Liabilities
1. Liabilities to banks 297,677 479,746
2. Liabilities from finance lease agreements 8,945 10,460
3. Advances received for orders 10,392 13,893
4. Liabilities from construction contracts (PoC) 49,882 62,949
5. Trade payables 184,991 202,913
6. Liabilities to enterprises in which the company has participating interests 1,017 2,449
7. Other current liabilities 71,503 88,696
8. Other current financial liabilities 12,078 20,291
636,485 881,397
II. Provisions
1. Effective income tax obligations 16,955 11,213
2. Provisions (31) 16,113 15,373
3. Current portion of provisions for pensions (29) 2,241 2,507
35,309 29,093
671,794 910,490
1,656,908 1,701,418

80
Consolidated statement of changes in equity from January 1, 2015 to December 31, 2016
in EUR ’000Other revenue reserves and
unappropriated net profit
Subscribed
capital
Capital
reserve
Revenue
reserves
Foreign
currency
translation
Hedging
transactions
reserve
Non-
controlling
interests Total
As of Jan. 1, 2015 73,001 38,404 286,112 3,149 -1,358 19,617 418,925
Earnings after tax 0 0 29,715 0 0 -723 28,992
Exchange differences on
translation of foreign subsidiaries 0 0 0 6,359 0 374 6,733
Revaluation of commitments
arising from employee benefits after
termination of employment 0 0 6,487 0 0 56 6,543
Market valuation of derivative
financial instruments 0 0 0 0 186 4 190
Deferred taxes with no effect
on profit and loss 0 0 -1,804 0 -52 -16 -1,872
Total comprehensive income 0 0 34,398 6,359 134 -305 40,586
Changes in basis of consolidation 0 0 -3,253 0 0 -1,079 -4,332
Dividend payments 0 0 -2,570 0 0 -573 -3,143
Other changes 0 0 3,065 1,401 0 -5,292 -826
As at Dec. 31, 2015 73,001 38,404 317,752 10,909 -1,224 12,368 451,210
As of Jan. 1, 2016 73,001 38,404 317,752 10,909 -1,224 12,368 451,210
Earnings after tax 0 0 11,302 0 0 3,112 14,414
Exchange differences on
translation of foreign subsidiaries 0 0 0 -6,947 0 -6,823 -13,770
Revaluation of commitments
arising from employee benefits
after termination of employment 0 0 -12,731 0 0 -5 -12,736
Market valuation of
derivative financial instruments 0 0 0 0 -970 0 -970
Deferred taxes
with no effect on profit and loss 0 0 3,604 0 272 1 3,877
Total comprehensive income 0 0 2,175 -6,947 -698 -3,715 -9,185
Changes in scope of consolidation 0 0 -1,250 0 0 -988 -2,238
Dividend payments 0 0 -2,570 0 0 -604 -3,174
Other changes 0 0 315 0 0 -2,797 -2,482
As of Dec. 31, 2016 73,001 38,404 316,422 3,962 -1,922 4,264 434,131

81
CO
NS
OL
IDA
TE
D F
INA
NC
IAL
STA
TE
ME
NT
S2
01
6
Notes to the consolidated financial statementsGENERAL NOTES
GENERAL INFORMATION RELATING TO THE GROUP
BAUER Aktiengesellschaft, Schrobenhausen (referred to in the following as BAUER AG) is a stock corporation under German
law. Its registered office is at BAUER-Strasse in Schrobenhausen, and the company is entered in the Register of Companies
of Ingolstadt (HRB 101375).
The BAUER Group is a provider of services, equipment and products dealing with ground and groundwater. The Group markets
its products and services all over the world. The operations of the Group are divided into three segments: Construction, Equip-
ment and Resources.
BAUER AG is listed in the Prime Standard of the German stock market.
1. BASIS OF PREPARATION
The consolidated financial statements of BAUER AG were prepared applying section 315a of the German Commercial Code
(HGB) in accordance with International Financial Reporting Standards (IFRS), as applicable in the EU. The consolidated financial
statements were prepared on the basis of historical cost, limited by the market-value valuation of available-for-sale financial assets
and by the fair-value valuation of financial assets and liabilities (including derivative financial instruments) affecting net income.
The previous year's figures have been determined according to the same principles.
The BAUER Group's financial year is the calendar year.
The consolidated financial statements were prepared in euros. Unless otherwise specified, all amounts are quoted
in thousands of euros (EUR '000).
The income statement was prepared using the nature of expenses method and covers the period from January 1 to December 31.
2. BASIS OF CONSOLIDATION
The basis of consolidation includes BAUER AG and all major subsidiaries. Subsidiaries are all companies over which the parent
has control in terms of financial and corporate policy. This is routinely accompanied by a voting rights share of over 50 %. When
assessing whether control is exerted, the existence and effect of potential voting rights currently exercisable or convertible are
considered.
Subsidiaries are not consolidated if their business operations are dormant or minor and they are, individually and as a whole, of
minor importance for conveying a picture of the true and fair view of the net assets, financial and earnings situations as well as
the cash flows of the BAUER Group. They are recognized in the consolidated financial statements with their respective acquisition
costs, taking into account any necessary impairments and value recovery adjustments.
In 2016, 111 (previous year: 122) companies were consolidated into the Group’s annual financial statements in 2016. In the
financial year, 2 (previous year: 6) companies were included in the basis of consolidation for the first time. Since the beginning
of 2016, 12 (previous year: 4) companies were de-consolidated due to merger, sale and discontinuation of operations. This
was mainly due to the change in status of Wöhr + Bauer GmbH as a result of the disposal of a shareholding. Joint ventures
are not included in the number of consolidated companies due to the short-term nature of these projects.

82 NOTES ON THE CONSOLIDATED FINANCIAL STATEMENTS 2016
The following overview shows the number of subsidiaries by segment (without construction joint ventures):
If the quality assessment of a new subsidiary finds that the company is immaterial in terms of the operative segment or Group,
it may not be included in the consolidated financial statements.
Consequently, the non-inclusion of any one company must not result in material changes to the Group’s net asset, financial
and earnings position, nor must it mask any other materially relevant trends.
In a small number of cases, companies are fully consolidated into the financial statements of BAUER AG even though that
company holds less than 50 % of their voting rights. This is the result of state restrictions which stipulate that foreign investors
may not hold more than 50 % of the voting rights in domestic companies. In such cases BAUER AG makes use of so-called
agency constructions, whereby more than 50 % of the voting rights are commercially held in the company concerned, thus
allowing for full consolidation.
Subsidiaries are included in the consolidated financial statements (fully consolidated) from the point at which control, or the
option of control, is transferred to the Group. They are de-consolidated at the point when control ends. Companies of which
BAUER AG is able, directly or indirectly, to exercise a significant influence on the said companies’ financial and operating policy
decisions (associated companies) are consolidated according to the equity method. This related to 5 companies as of Dec-
ember 31, 2016 (previous year: 15). Joint ventures were likewise consolidated according to the equity method.
The main subgroups and companies included in the consolidated financial statements are listed in the Major Participations
section. The disclosures in accordance with Section 313, Subsection 2 HGB are grouped in a separate list of holdings. This
will be published as part of the Notes to the financial statements of BAUER Aktiengesellschaft in the electronic version of the
official Gazette Bundesanzeiger of the Federal Republic of Germany. Subsidiaries with differing balance sheet dates compile
interim financial statements as per the Group balance sheet date. BAUER Corporate Services Private Limited and BAUER Equip-
ment India Private Limited prepare their annual financial statements for March 31 due to local statutory requirements.
Main business Regis-
tered
office
Number of com-
panies with 100 %
share
Number of com-
panies with a share
less than 100 %
Number of
associated
companies
Number
of joint ventures
Total
Dec. 31
2015
Dec. 31
2016
Dec. 31
2015
Dec. 31
2016
Dec. 31
2015
Dec. 31
2016
Dec. 31
2015
Dec. 31
2016
Dec. 31
2015
Dec. 31
2016
Con-
struction
segment
Specialist
Foundation Engi-
neering, Project
Development
Global 28 34 8 4 12 1 0 1 48 40
Equipment
segment
Equipment
Manufacture
and Sales
Global 22 27 8 5 1 2 3 2 34 36
Resources
segment
Environment and
Environmental
Technology
Global 25 24 6 3 2 2 3 2 36 31
'Other'
segmentCentral services Global 4 4 0 0 0 0 0 0 4 4
Total 79 89 22 12 15 5 6 5 122 111

83NOTES ON THE CONSOLIDATED FINANCIAL STATEMENTS 2016
CO
NS
OL
IDA
TE
D F
INA
NC
IAL
STA
TE
ME
NT
S2
01
6
Application of section 264, subsection 3 of the German Commercial Code (HGB)
Section 264, subsection 3 of the German Commercial Code (HGB) has been
exercised for the following companies:
PRAKLA Bohrtechnik GmbH
KLEMM Bohrtechnik GmbH
EURODRILL GmbH
GWE pumpenboese GmbH
BAUER Resources GmbH
ESAU & HUEBER GmbH
Application of section 291, subsection 1 of the German Commercial Code (HGB)
BAUER Resources GmbH and PRAKLA Bohrtechnik GmbH have utilized the exemption option under section 291, subsection 1
of the German Commercial Code (HGB) and has not prepared a consolidated financial statement and management report.
Changes at subsidiaries
Construction segment
Changes in the percentage of group investment in associated companies
As per the agreement of December 14, 2016, BAUER Spezialtiefbau GmbH sold 16.67 % of its shares in Wöhr + Bauer GmbH
to Roeck Beteiligungs GmbH and Wöhr Beteiligungs GmbH.
BAUER Spezialtiefbau GmbH retained 33.33 % of its shares in Wöhr + BAUER GmbH. These shares were accounted for as
a share in an associated company. As per the agreement of December 14, 2016, BAUER Spezialtiefbau GmbH sold 16.67 %
of its shares to the other shareholders for EUR 8,500 thousand (payment received in December 2016). The Group’s remaining
16.67 % share, which had a fair value of EUR 8,500 thousand at the time of sale, was classified as a financial instrument in
the “Available-for-Sale” category. The fair value was determined using a discounted cash flow method and various multiple
methods. The estimated cash flows for the next 5 years as well as an interest rate of 11.98 % were used as a basis. Payment
flows for the 5-year period were extrapolated based on a constant annual growth rate of 1 %. Income was recorded in the
group income statement as a result of the sale and is allocated as follows:
in EUR ’000 2016
Sales revenues
Plus: fair value of remaining share (16.67 %)
8,500
8,500
Minus: carrying amount of the participation at the time of loss of controlling interest -1,428
Recognized income 15,572
Profit is recorded under other operating income.
The reported profit resulted in EUR 116 thousand in actual tax expenditures.
Equipment segment
In the fourth quarter of the 2016 financial year, BAUER Maszyny Polska Sp.z.o.o. was included in the Group financial statements
for the first time. The company was previously not consolidated owing to its minor importance.
BAUER DE-WET EQUIPMENT (PROPRIETARY) LIMITED was de-consolidated in the fourth quarter of 2016 due to cessation
of business operations.

84 NOTES ON THE CONSOLIDATED FINANCIAL STATEMENTS 2016
On December 12, 2016, BAUER Maschinen GmbH purchased the remaining 10 % of the shares in PRAKLA Bohrtechnik
GmbH. Shares with a value of EUR 400 thousand (share in the carrying amount of the net assets of PRAKLA Bohrtechnik
GmbH) were transferred to BAUER Maschinen GmbH in the process. On December 20, 2016, BAUER Maschinen GmbH
surrendered and transferred 85 % of its shares in KLEMM Bohrtechnik GmbH to PRAKLA Bohrtechnik GmbH by means of
a capital increase against non-cash contributions. BAUER Maschinen GmbH has retained 15 % of the shares in KLEMM
Bohrtechnik GmbH.
Resources segment
On June 29, 2016, BAUER Resources GmbH sold 100 % of the shares in HGC Hydro-Geo-Consult GmbH, Freiberg to G.E.O.S
Ingenieurgesellschaft mbH. The company was then de-consolidated.
The de-consolidation did not have a significant impact on the net asset, financial and earnings position of the BAUER Group.
As a result, disclosures in accordance IFRS 10 and IAS 7 were not made.
In the fourth quarter of the 2016 financial year, BAUER Resources Saudi LLC was included in the consolidated financial statement
for the first time. The company was previously not consolidated owing to its minor importance.
'Other' segment
As of August 24, 2016, BAUER Aktiengesellschaft acquired the remaining 1 % of the shares in BAUER Maschinen GmbH, BAUER
Spezialtiefbau GmbH, BAUER Resources GmbH, SCHACHTBAU NORDHAUSEN GmbH and SPESA Spezialbau und Sanierung
GmbH from BAUER Anteilspool GbR or BAUER Handelsgesellschaft. As a result, BAUER Aktiengesellschaft holds a 100 % share
in each of these companies as of August 24, 2016.
3. CONSOLIDATION POLICIES
The assets and liabilities of the German and foreign companies included in the consolidated financial statements are stated
according to the uniform accounting policies applicable throughout the BAUER Group. Mutual receivables and liabilities as
well as expenses and income between consolidated companies are eliminated. Consolidated inventories and fixed assets are
adjusted by existing intra-group balances. Consolidation affecting net income is subject to deferral of taxes, with deferred tax
assets and liabilities being offset against each other provided the payment period and tax creditor are the same. In respect of
subsidiaries consolidated for the first time, the identifiable assets, liabilities and contingent liabilities of the acquired companies
were recorded at their applicable fair values at the time of acquisition. Goodwill occurring on initial consolidation is capitalized
and subjected to a yearly impairment test; an excess of the net fair value of the acquired net assets over cost is recognized in
the income statement immediately at the time of initial consolidation in accordance with IFRS 3. Consolidation according to
the equity method is subject to the same principles. If the pro-rata loss in an associated company is equal to or greater than
the carrying amount of the participating interest, no further losses are recognized, unless a consolidated Group company has
entered into obligations or made payments on behalf of the associated company.
Non-controlling interests are a part of earnings and net assets which is not allocable to the Group. Earnings pertaining to these
interests are therefore recognized separately from the share in earnings allocable to the shareholders of the parent company in
the income statement. In the balance sheet, these earnings are recognized in equity, separately from the equity allocable to the
shareholders of the parent company. The acquisition of non-controlling interests and changes to the shareholding of the parent
company in a subsidiary which do not lead to a loss of control are reported as equity transactions in the balance sheet.

85NOTES ON THE CONSOLIDATED FINANCIAL STATEMENTS 2016
CO
NS
OL
IDA
TE
D F
INA
NC
IAL
STA
TE
ME
NT
S2
01
6
4. CRITICAL ACCOUNTING ESTIMATES AND JUDGMENTS
In the consolidated financial statements, assumptions and estimates must be made which influence the amounts and recogni-
tion of assets and liabilities, income and expenses recorded, as well as contingent liabilities. Assumptions and estimates are
primarily used for determining the useful life of fixed assets, discounted cash flows during impairment tests, and assessing the
feasibility of deferred tax assets, recoverability of receivables and the recognition of provisions for legal proceedings, pensions
and other benefit commitments, taxes, warranties and guaranties. The actual values may differ from the estimates made.
5. PRINCIPLE ACCOUNTING POLICIES
5.1. Changes in accounting policies
It was obligatory to apply the following standards and interpretations for the first time in the financial year:
Annual improvements to IFRS, cycle 2012 - 2014
The “Annual improvements to IFRS cycle 2012 - 2014” apply to the followings standards:
• IFRS 5 – Non-current Assets Held for Sale and Discontinued Operations
• IFRS 7 – Financial Instruments: Disclosures
• IAS 19 – Employee Benefits
• IAS 34 – Interim financial reporting
Details of the amendments:
• IFRS 5 – Non-cur rent Assets Held for Sale and Dis con tin ued Op er a tions:
This amendment clarifies that a direct reclassification from “held for sale” to “for distribution to owners” does not negate the
relevant classification, disclosure and measurement provisions of IFRS 5. The measurement provisions of IFRS 5.27-29,
which now also apply explicitly to assets (or disposal groups) previously classified as “for distribution to owners,” only
apply if the criteria for classification as “available for sale” or “for distribution to owners” are no longer met without directly
exchanging the two categories.
• IFRS 7 – Financial Instruments: Disclosures
According to IFRS 7.42C (c), the obligation of a divesting company to transfer payments received from divested financial
assets to the purchaser of the receivables does not constitute a continuing involvement as defined by the disclosure provisions
of IFRS 7.42E-H if the criteria for a forward contract as defined by IAS 39 are met. Until now, it was not clear what this means
for servicing agreements (payment and debt collections, etc.).
The IASB has now clarified that servicing agreements in which the divesting company still retains a share of the opportuni-
ties or risks arising from the performance of the divested receivables are grounds for continuing involvement under IFRS 7.
For example, withholding a servicing commitment until a servicing charge is paid may constitute a continuing involvement.
This is especially the case if the servicing fee depends on the amount of the payments received or the date of payment.
Similarly, a fixed servicing fee, which does not have to be paid in full due to payment problems with the transferred financial
assets, is presumed to constitute a continuing involvement for the purposes of disclosure requirements. This assessment is
valid regardless of whether the agreed servicing fee is considered reasonable compensation for the services to be rendered.

86 NOTES ON THE CONSOLIDATED FINANCIAL STATEMENTS 2016
Another clarification pertains to the application of amendments to IFRS 7: Financial Instruments: Disclosures – Offsetting
Financial Assets and Financial Liabilities. It is made clear that amendments to IFRS 7 do not result in any explicit disclosure
requirements for interim reports. Nevertheless, the additional disclosures must be provided in abridged interim financial
statements in accordance with IAS 34 if required by IAS 34 (e.g. because of the provision under IAS 34.15 et seq. that
requires disclosures of all events and transactions that are necessary for understanding the changes in the net asset, financial
and earnings position since the end of the last financial year).
• IAS 19 - Employee Benefits
The interest rate used for discounting performance-based pension obligations in accordance with IAS 19R.83 is determined
on the basis of market returns for premium corporate bonds as of the balance sheet date. In countries without a liquid market
for such corporate bonds, the market returns for government bonds applicable on the balance sheet date should instead
be used.
From the wording “in countries without a liquid market” it was partly deduced that the depth of a market in a currency zone
(e.g. Eurozone) could only be determined at the country level. In the new publication, the IASB clarifies that the depth of
the market for premium corporate bonds is to be assessed on a “currency basis,” in which case corporate bonds from the
entire Eurozone are included in the Eurozone. If a company decides that there is no liquid market for premium corporate
bonds on the basis of the currency zone, the company must switch to government bonds. Here too, the respective currency
zone must be used as a basis.
• IAS 34 – Interim Financial Reporting
IAS 34.16A requires certain disclosures in the notes to the interim report, as long as that they are not already provided
“elsewhere in the interim report.” The IASB now makes it clear that information “elsewhere in the interim report” may be
information that is either in another place in the interim report or in other documents referenced in the interim report. The
prerequisite for the latter, however, is that the other documents are accessible to the recipients of the interim report at the
same time and under the same conditions as the interim report itself.
The new regulations are to be applied on a prospective or retrospective basis, depending on the specific amendment.
The directive on the adoption of annual amendments of the IFRS by the EU (endorsement) was published in the Official
Journal of the EU on December 16, 2015.
Amendments to IFRS 10 – Consolidated Financial Statements, and IAS 28 – Investments in Associates
and Joint Ventures
The IASB published amendments to IFRS 10 and IAS 28 on September 11, 2014. These amendments eliminate an inconsistency
between the two standards. For example, IFRS 10 currently requires recognition of the full profit or loss resulting from the loss of
control over a subsidiary that becomes part of a joint venture or associated company. In contrast, IAS 28 requires that profits or
losses for non-financial assets invested in associated companies or joint ventures are recognized only in the amount of the shares
held by other investors.
According to recently published amendments, profits and losses of investors are to be recognized in the full amount whenever
the transaction (i.e. the transfer of a subsidiary into a joint venture or associated company with loss of control over the subsidiary)
affects a business as defined by IFRS 3 – Business Combinations. If this is not the case, and the transaction relates to assets
that are not a business operation, only the proportional profit (in the amount of the shares of other investors) must be recorded.

87NOTES ON THE CONSOLIDATED FINANCIAL STATEMENTS 2016
CO
NS
OL
IDA
TE
D F
INA
NC
IAL
STA
TE
ME
NT
S2
01
6
The amendments are to be applied on a prospective basis as of January 1, 2016. However, in December 2015, the IASB
postponed the mandatory initial adoption date of the amendments to a date yet to be determined.
The reason for the postponement of the initial adoption date was an unexpected conflict between the planned new provision
and the existing provision of IAS 28.32. Specifically, adoption of IAS 28.32 can mean that if a share in a former subsidiary is
retained, which represents grounds for significant influence or joint control, the pending proportional profit elimination must
be reversed against the carrying amount of the retained share. This is always the case if the costs of investing in the new
associated company or joint venture are less than the fair value of the proportional net assets of the company.
In addition to resolving this conflict, the IASB will decide on further necessary amendments to IAS 28 its more comprehensive
research project on the equity method. As a result, the IASB decided to make no changes to IAS 28 at this time, but rather
to postpone the adoption date of the amendments to IFRS 10 and IAS 28 until the research project on the equity method
has been completed. Nonetheless, it will still be possible to adopt the amendments on a voluntary basis. The amendments
cannot be used by IFRS-EU auditors at the present time because the EU has not yet endorsed the amendments.
Amendment to IFRS 11 – Joint Arrangements; Acquisitions of Interests in Joint Operations
The amendments to IFRS 11 clarify that acquisitions and additional acquisitions of interests in joint operations that constitute
a business as defined by IFRS 3 – “Business Combinations” are reported in accordance with the accounting rules for business
combinations in IFRS 3 and other applicable IFRS standards, provided they do not conflict with the provisions of IFRS 11. As
a consequence, the following applies in the amount of the interest in a joint operation:
• The identifiable assets and liabilities acquired are measured at the fair value at the time of the transaction; although if additional
interests are acquired while maintaining joint control, interests held up to this point are not re-measured;
• Any goodwill or deferred taxes arising from the first-time recognition of assets and liabilities must be recognized;
• The cash-generating unit to which the goodwill has been allocated must be subject to an impairment test as defined by IAS
36 – “Impairment of Assets” at least once a year and if indications of impairments exist;
• Transaction costs must be recognized in net income; and
• Disclosures regarding business combinations, as required by IFRS 3 and other standards, must be reported.
The amendments do not apply if the reporting company and the parties involved are under the joint control of one ultimate
controlling party.
The new regulations apply on a prospective basis for interests acquired in reporting periods beginning on or after January 1,
2016.
The directive on the adoption of the amendments to IFRS 11 by the EU (endorsement) was published in the Official Journal
of the EU on November 25, 2015.

88 NOTES ON THE CONSOLIDATED FINANCIAL STATEMENTS 2016
Amendments to IAS 16 – Property, Plant and Equipment and IAS 38 – Intangible assets – Clarification of Acceptable
Methods of Depreciation and Amortization
The aim of the amendments to IAS 16 and IAS 38 is to clarify which methods are appropriate for the depreciation of property,
plant and equipment and intangible assets.
In principle, property, plant and equipment and intangible assets must be depreciated in such a way as to reflect the consump-
tion of the company's expected future economic benefits embodied in the asset. In this regard, the IASB has now made it
clear that depreciation of property, plant and equipment based on sales revenues of the goods produced using these assets
does not constitute this method and is therefore not appropriate, since sales revenues depend not only on the consumption
of the asset, but also on other factors such as sales volume, price or inflation. This clarification is also included in IAS 38 for
the amortization of intangible assets with a limited useful life. However, the IASB has also included a rebuttable presumption in
this regard. As a result, revenue-based depreciation of intangible assets with a limited useful life is permitted in the following
two exceptional cases:
• The “value” of the asset can be expressed directly by the sales generated, or
• It can be shown that there is a strong correlation between the revenue generated and the value of the intangible asset.
The first case only applies if the predominant limiting factor in use of an intangible asset is a revenue threshold. Examples
cited include a concession for the exploitation of a gold mine that expires when certain sales revenues resulting from the sale
of the gold are reached, and the right to operate a toll road that expires when a certain toll revenue is reached.
The IASB explains that the basis for the determination of an appropriate depreciation method for intangible assets is always
the determination of the predominant limiting factor. For example, this factor could be a time limit on usage, a limit on the
number of units produced, or as in the above examples, a predetermined amount of revenue. However, the IASB also notes
that a different basis can be used provided that it better reflects the consumption of the intangible asset.
Furthermore, the IASB clarifies that a decline in the sales prices of goods and services produced with property, plant and
equipment as well as intangible assets can be indicative of their economic obsolescence and therefore indicative of a decline
in the economic benefits of assets necessary for production.
The directive on the adoption of the amendments by the EU (endorsement) was published in the Official Journal of the EU on
December 3, 2015.
Amendments to IAS 27 – Separate financial statements – Equity method in Separate Financial Statements
As a result of amendments to IAS 27, investments in subsidiaries, joint ventures and associated companies can also be
reported in IFRS separate financial statements using the equity method.
As a result, companies now have the following options for including such companies in separate financial statements:
• Recognition under amortized costs;
• Recognition as available-for-sale financial instruments pursuant to IAS 39 – Financial Instruments: Recognition and
Measurement or, in the future, pursuant to IFRS 9 – “Financial Instruments (pending EU endorsement) and
• Recognition using the equity method.

89NOTES ON THE CONSOLIDATED FINANCIAL STATEMENTS 2016
CO
NS
OL
IDA
TE
D F
INA
NC
IAL
STA
TE
ME
NT
S2
01
6
The directive on the adoption of the amendments by the EU (endorsement) was published in the Official Journal of the EU on
December 23, 2015.
Amendments to IAS 16 – Property, Plant and Equipment and IAS 41 – Agriculture – Agriculture: Bearer Plants
“Bearer plants” are classified as those that
• Are used in the production of agricultural produce,
• Are expected to bear produce for more than one period; and
• Have a remote likelihood of being sold as living plants or consumed as agricultural produce
Examples include grapevines, olive trees and tea or cotton plants.
The published amendments to IAS 16 and IAS 41 clarify that these plants, similar to self-constructed assets, are to be
recognized as acquisition or production costs until they reach maturity, and then reported using the cost or revaluation
model in accordance with IAS 16. Accounting in accordance with IAS 41 is no longer permitted.
Upon adoption of the amendment, the fair value of such plants may be recognized as a “deemed cost” under acquisition/
manufacturing costs.
The disclosures required under IAS 8.28(f) do not have to be provided for the current period.
The directive on the adoption of the amendments by the EU (endorsement) was published in the Official Journal of the EU on
November 24, 2015.
Amendments to IAS 1 – Presentation of Financial Statements as part of the Disclosure Initiative
The Amendment Standard, published at the end of 2014, implements the following proposals for amendments to IAS 1 as part
of the Disclosure Initiative.
Materiality and aggregation of items
Amendments to IAS 1 seek to place stronger emphasis on the concept of materiality in order to address practical application
problems. The aim of the clarifications is to minimize immaterial information in IFRS financial statements while encouraging
the reporting of relevant information.
With this aim in mind, the IASB clarifies that the concept of materiality applies to all parts of IFRS financial statements,
especially the notes. This will prevent irrelevant information from being moved from other parts of the financial statement to
the notes. Similarly, the IASB clarifies that immaterial information must not be presented separately, even when a specific
disclosure is required in an IFRS (for example, if the minimum line items necessary for the balance sheet must be presented).
However, it is also necessary to assess whether further information is required beyond the explicit disclosure requirements
so that the reader can gain a better understanding of the company's assets, financial and earnings position.
Furthermore, financial information should not be obscured by aggregating relevant and irrelevant information or by aggregating
material items that are dissimilar in character or function.
90 NOTES ON THE CONSOLIDATED FINANCIAL STATEMENTS 2016
Subtotals
According to IAS 1.55 and 1.85, additional subtotals must be presented in the balance sheet and the statement of comprehen-
sive income if such a disclosure is relevant to an understanding of the company's assets, financial situation or earnings position.
According to amendments IAS 1.55A and 1.85A, when an entity presents such subtotals, these subtotals must:
• Be comprised of line items made up of amounts recognized and measured in accordance with IFRS;
• Be presented and labeled in a clear and understandable manner;
• Be consistent from period to period;
• Not be displayed in the balance sheet and statement of comprehensive income with more prominence than the subtotals
and totals explicitly required in IFRS.
Structure of notes
IAS 1.114 states that “a company (...) must normally present notes in (...) [a specified] order that helps the reader to understand
the financial statement and compare it to those of other companies.” In order to counter the often widespread perception that
IAS 1.114 requires a certain structure for notes by using the word “normally”, the wording of IAS 1.114 has been adjusted and
alternatives have been added to the existing example for the structure of the notes. For example, notes could be structured
according to the relevance of individual information for gaining an understanding of the assets, financial and earnings position
of the company. Notes could also be structured according to objective factors, for example by cohesively presenting all infor-
mation related to assets that are measured at fair value. Furthermore, the amendment explicitly clarifies that companies should
consider the effects on the understandability and comparability of their IFRS financial statements when defining the order of
notes.
Disclosure of accounting methods
Regarding the obligation to disclose significant accounting policies and the resulting question of what constitutes “significant,”
the IASB has decided to delete the examples in IAS 1.120 and to include clarifications instead. According to these clarifications,
when determining which accounting policies to disclose, companies should consider the nature of their business and the policies
about which readers are likely to expect information.
Equity method
In addition to the aforementioned changes resulting from the Disclosure Initiative, provisions for the recognition of interest
in associated companies and joint ventures under other comprehensive income (OCI) in the statement of comprehensive
income have been added to IAS 1.82A. They clarify that the net income from associated companies and joint ventures has
to be reported as a stand-alone item in the statement of comprehensive income, disaggregated solely by whether or not
amounts will be reclassified (recycled) to the income statement at a future point in time. This change in the wording of IAS
1.82A makes it clear that the income from associated companies and joint ventures does not need to be broken down
according to the nature of the expenses or income.
The directive on the adoption of the amendments by the EU (endorsement) was published in the Official Journal of the EU
on December 19, 2015.
The following new accounting standard was adopted by the EU and was to be applied for the first time as of January 1,
2016:
Amendments to IFRS 10, IFRS 12, and IAS 28 – Investment Entities – Applying the consolidation exception
The Amendment Standard “Investment Entities – Applying the consolidation exception” addresses various questions
concerning the application of the exemption from consolidation requirements for investment companies.

91NOTES ON THE CONSOLIDATED FINANCIAL STATEMENTS 2016
CO
NS
OL
IDA
TE
D F
INA
NC
IAL
STA
TE
ME
NT
S2
01
6
Through various standards amendments, IASB clarifies that the exemption from the obligation to prepare consolidated
financial statements in accordance with IFRS 10.4(a) also applies to parent companies that are themselves subsidiaries of
an investment company. The IASB also clarifies that an investment company must recognize all subsidiaries that themselves
meet the criteria of an investment company at fair value This also applies if the subsidiaries provide investment services. In
addition, the IASB clarifies that a non-investment company that includes an investment company as an associate or joint
venture in the consolidated financial statement using the equity method may retain the fair value measurement of subsidiaries
applied by the associated company or joint venture. Herein the lies the difference between standard amendments recently
adopted and the draft published in June 2014, which allowed for retention of the fair value measurement only in the case
of an associate company. Unlike the draft, the Amendment Standard included an amendment to IFRS 12 – Disclosures on
Interests in Other Entities. It clarifies that investment companies that measure their subsidiaries at fair value fall within the
scope of IFRS 12.
The directive on the adoption of the amendments by the EU (endorsement) was published in the Official Journal of the EU
on September 23, 2016.
The effects of the amendments listed have no significant influence on the consolidated financial statements of BAUER AG.
The following new accounting standard has not yet been adopted by the EU and has not yet been applied:
IFRS 14: Regulatory Deferral Accounts
Under IFRS 14 – Regulatory Deferral Accounts, a company that is a first-time adopter of IFRS may, with certain restrictions,
continue to record regulatory deferral accounts that the company recorded in its financial statements using its previous accounting
methods. This applies to the first IFRS financial statements as well as subsequent financial statements. Regulatory deferral
accounts and amendments to them must be separately shown in the presentation of the financial situation and in the income
statement or other total comprehensive income. Furthermore, certain disclosures are required.
IFRS 14 was issued in January 2014 and applies to reporting periods beginning on or after January 1, 2016.
Moreover, the IASB and the IFRIC have adopted further standards, interpretations and amendments, as listed below, some
of which were not yet bindingly applicable, or had not yet been recognized by the EU, in financial year 2016. The BAUER Group
had not implemented early application of these standards by December 31, 2016.

92 NOTES ON THE CONSOLIDATED FINANCIAL STATEMENTS 2016
Initial application of the standards is planned as from the point they are recognized and adopted by the EU.
Standard/Interpretation/Amendment To be applied
as of
Adopted by the
EU
Amendment to IAS 7, disclosures in notes 2017 No
Amendment to IAS 12, recognition of deferred tax assets in unrealized losses 2017 No
Annual improvement of IFRS (cycle 2014 - 2016) 2017 No
Amendment to IFRS 2, clarifications regarding measurement and classification 2018 No
Amendment to IFRS 4, postponement of IFRS 9 and applying the overlay approach 2018 No
IFRS 9; Financial Instruments 2018 Yes
IFRS 15; Revenue from Contracts with Customers 2018 Yes
Clarification of IFRS 15; Revenue from Contracts with Customers 2018 No
IFRIC 22, Foreign-currency transactions and advance consideration 2018 No
Amendment to IAS 40 – Transfers of investment property 2018 No
IFRS 16, Leasing relationships 2019 No
IFRS 15 will replace the provisions of IAS 18 Revenue, as well as those of IAS 11 – Construction Contracts. The new standard
does not differentiate between different order and service types, but instead puts in place uniform criteria of when sales revenues
are to be realized in terms of time and period for a service provision. This is the case when the client attains the power of
disposition over the agreed goods and services and can capitalize on this. First-time adoption is mandatory for financial years
beginning on or after January 1, 2018, although earlier adoption is possible. BAUER AG will not avail itself of the right to adopt
the amendment earlier.
The potential effects of adopting IFRS 15 are currently being analyzed and the following issues have been identified:
• Multi-component transactions: Determine whether legally independent contracts are to be summarized in the balance sheet
• Reassess of revenue recognition, taking into account transfer of control
At the present time, we do not foresee significant changes in the presentation of revenues in the consolidated financial state-
ments of BAUER AG. The same applies to contract modifications, changes to the contract scope and/or price, including
supplements. These modifications may only be taken into account in the transaction price if variable revenue components
are highly probable, meaning that there will not be a significant reversal of these revenues in the future.
Based on current analyses, customer-specific construction contracts, which are currently accounted for using the percent-
age-of-completion method, will allow for period-based recognition of sales revenues in the future. Furthermore, changes in
reporting methods and additional disclosures in notes will be necessary. Once the exact consequences have been estab-
lished, the Management Board will decide whether the retrospective method or the cumulative effect method will be used.
IFRS 16 will replace IAS 17 – Leases, IFRIC 4 – Establishing if an agreement contains a leasing relationship, SIC 15 – Operating
leasing relationships – Incentives as well as SIC 27 – Assessment of the profitability of transactions in the legal form of leasing
relationships. The new standard does not undertake any classification in finance and operating leasing relationships for lessees,
instead basically all leasing relationships are included in the balance sheet in the form of usage rights and leasing liabilities.
There will be no major changes to lessor accounting compared to IAS 17. In contrast to IAS 17, IFRS 16 stipulates more extensive
details on the appendices.

93NOTES ON THE CONSOLIDATED FINANCIAL STATEMENTS 2016
CO
NS
OL
IDA
TE
D F
INA
NC
IAL
STA
TE
ME
NT
S2
01
6
Potential effects of the first-time adoption of IFRS 16 – Leasing Relationships are currently being analyzed It is to be expected
that the remaining minimum lease payments from operating lease relationships will result in further capitalization of rights of use
and the recognition of liabilities.
IFRS 9 – Financial Instruments changes the accounting rules for the classification and measurement of financial assets,
for impairment of financial assets and for hedge accounting. The adoption of IFRS 9 is expected to have an impact on the
classification and measurement of financial assets of the Group as a result of new measurement categories, but is unlikely
to have a material impact on the classification and measurement of financial liabilities. Although an in-depth assessment of
the impact is still pending, the introduction of the new valuation categories will result in changes with respect to interests
and other long-term financial assets currently measured at cost. They are to be recognized at fair value according to the
requirements for classification and measurement under IFRS 9. The revised regulations for reporting the impairment of
financial instruments will tend to result in an increase in provisioning through use of the expected loss model rather than the
incurred loss model currently in use. In terms of hedge accounting, there will be a wider range of designation options, more
complex valuation methods and simpler methods for verifying effectiveness. Although an in-depth assessment of the effects
are still pending, the existing hedge accounting methods are still permissible. On the other hand, changes are expected
in the area of effectiveness measurement. As a result, there will be no significant effects on hedge accounting. When the
BAUER Group adopts IFRS 9 for the first time, it plans to apply the modified retrospective method, according to which
cumulative effects of the changeover must be recorded in the opening balance sheet for 2018. In addition, much more
extensive disclosures in notes will be required.
BAUER AG does not expect any of the other standards to have any material impact on the consolidated financial statements.
5.2. Significant accounting policies
Foreign currency translation
Foreign currency transactions are translated in the financial statements of BAUER AG and the consolidated subsidiaries at
the rates applying on the dates of the transactions. The financial statements of the foreign companies belonging to the BAUER
Group are translated into euros according to the functional currency concept. Accordingly, assets and liabilities are translated
at the rate applying on the balance sheet date and the income statement items at the average rate. The resulting differences
from the currency translation are recorded as other income and recognized cumulatively in the provision for currency translation
losses stated under equity until the foreign operations are sold.

94 NOTES ON THE CONSOLIDATED FINANCIAL STATEMENTS 2016
1 EUR corresponds to Annual average value Balance sheet date value
2015 2016 2015 2016
Egypt EGP 8.5293 11.1682 8.4192 19.1589
Argentina ARS 10.4092 16.4949 14.1386 16.8235
Australia AUD 1.4787 1,4852 1.4894 1.4617
Bulgaria BGL 1.9558 1.9559 1.9558 1.9561
Chile CLP 727.6212 742.3758 772.0222 704.9368
China CNY 7.0724 7.3488 6.9434 7.3443
Georgia GEL 2.5284 2.6209 2.6140 2.8083
Ghana GHS 4.2281 4.4024 4.1725 4.5018
Great Britain GBP 0.7236 0.8227 0.7350 0.8581
Hong Kong HKD 8.5570 8.5683 8.4422 8.1945
India INR 70.9623 74.3119 72.3087 71.8220
Indonesia IDR 14,862.6723 14,707.1687 15,046.6072 14,192.1525
Japan JPY 133.5525 120.4284 131.1173 123.5816
Jordan JOD 0.7822 0.7823 0.7724 0.7498
Canada CAD 1.4239 1.4598 1.5125 1.4230
Qatar QAR 4.0194 4.0197 3.9659 3.8480
Lebanon LBP 1,665.1715 1,664.8954 1,642.5471 1,593.6847
Malaysia MYR 4.3409 4.5736 4.6730 4.7406
Morocco MAD 10.8081 10.8407 10.7831 10.6705
Mexico MXP 17.6440 20.6246 18.9240 21.8430
New Zealand NZD 1.5914 1.5819 1.5914 1.5169
Oman OMR 0.4250 0.4250 0.4193 0.4068
Panama PAB 1.1039 1.1040 1.0892 1.0568
Peru PEN 3.5349 3.7300 3.7081 3.5491
Philippines PHP 50.3376 52.5996 51.2554 52.5416
Poland PLN 4.1810 4.3638 4.2636 4.4180
Romania RON 4.4403 4.4947 4.5229 4.5427
Russia RUB 68.6566 73.1804 80.4168 64.7667
Saudi Arabia SAR 4.1416 4.1407 4.0886 3.9637
Sweden SEK 9.3339 9.4761 9.1831 9.5656
Switzerland CHF 1.0631 1.0894 1.0822 1.0754
Singapore SGD 1.5198 1.5245 1.5397 1.5265
South Africa ZAR 14.2607 16.0580 16.9831 14.4954
Taiwan TWD 35.0744 35.5641 35.8330 34.0622
Thailand THB 37.9774 38.9178 39.2530 37.8475
Turkey TRY 3.0361 3.3394 3.1815 3.7288
Hungary HUF 309.4268 311.4683 315.2762 310.1667
United Arab Emirates AED 4.0545 4.0549 4.0004 3.8815
United States of America USD 1.1039 1.1040 1.0892 1.0568
Vietnam VND 24,240.1659 24,695.6697 24,498.2509 24,048.4597
The following table shows the exchange rates applied for the currency translation:

95NOTES ON THE CONSOLIDATED FINANCIAL STATEMENTS 2016
CO
NS
OL
IDA
TE
D F
INA
NC
IAL
STA
TE
ME
NT
S2
01
6
Intangible assets
Intangible assets are capitalized at cost and amortized according to the straight-line method over the projected useful life of 3
to 10 years.
Assets which have an indefinite useful life, such as goodwill, are not subjected to scheduled amortization but are impairment
tested each year, or when relevant indications arise. The goodwill is the amount by which the acquisition cost of the acquisition
exceeds the fair value of the Group’s shares in the net assets of the acquired entity at the date of acquisition. Goodwill created
by acquisition is recognized under “Intangible assets”. Goodwill resulting from the acquisition of an associated company is
included in the carrying amount of investments in associated companies and consequently is not impairment-tested separately,
but within the overall carrying amount. The recognized goodwill undergoes an annual impairment test is recognized at cost
less accumulated write-downs. Write-ups are impermissible. Gains and losses from the sale of a company comprise the
carrying amount of goodwill allocated to the company to be disposed of.
Assets subject to scheduled depreciation or amortization are tested for impairment if any events or changes of circumstances
indicate that the carrying amount may no longer be achievable.
Impairment in the amount of the carrying amount exceeding the attainable amount is recognized. The attainable amount is the
higher amount of the applicable fair value of the asset less selling costs and the value in use. For the impairment test, assets
are grouped at the lowest level for which cash flows can be separately identified (cash-generating units). With the exception of
goodwill, a test is performed on each balance sheet date in respect of non-cash assets for which in the past an impairment was
recognized as to whether a value recovery adjustment is required.
Research and development costs are generally charged as expenditure in the financial year in which they occurred, in accordance
with IAS 38. Exceptions to this are certain development costs which are capitalized where it is probable that a future economic
benefit will be drawn from the development project and the costs incurred can be measured reliably. In addition, the following
criteria in accordance with IAS 38.57 must be met:
• Technical feasibility of completion of the intangible asset so that it will be available for use or sale
• Intention to complete the intangible asset and to use or sell it
• Ability to use or sell the intangible asset
• Evidence of how the intangible asset will generate probable future economic benefits
• The availability of adequate technical, financial and other resources to complete the development and to use or sell the
intangible asset
• The ability to measure reliably the expenditure attributable to the intangible asset during its development
The manufacturing cost includes all costs directly attributable to the development process as well as appropriate portions of
development-related overheads. The assets in development are subjected to an annual impairment test and valued at their
original cost less cumulative depreciation. Amortization is undertaken according to the straight-line method as from start of
production over the intended term of the developed models. The projected useful life is between 3 and 6 years. Impairment
losses on intangible assets are recognized to the higher of the value in use or net realizable value. If the preconditions for an
impairment no longer exist, reversals of impairment – except for goodwill – are undertaken.

96 NOTES TO THE CONSOLIDATED FINANCIAL STATEMENTS 2016
Property, plant and equipment
According to IAS 16, property, plant and equipment is valued at cost, less scheduled straight-line depreciation based on the
pro-rata temporis method, unless in exceptional cases some other method of depreciation more effectively reflects the usage.
The following table provides an overview of the useful lives:
Asset Economic life
Land Unlimited
Buildings and other structures 3 to 60 years
Technical equipment and machinery 3 to 21 years
Other equipment, factory and office equipment 2 to 21 years
Impairment losses on property, plant and equipment are recognized in accordance with IAS 36 where the value in use or fair
value less cost to sell of the asset concerned has fallen below the carrying amount. If the reasons for an impairment recognized in
previous years no longer exist, a corresponding reversal of impairment is applied.
Both impairment losses and scheduled depreciation are recognized under the “Depreciation of fixed assets” item. The level
of impairment losses is explained in accordance with IAS 36 under “Non-current assets”.
Leasing
The BAUER Group acts as both a lessee and a lessor. Leasing relationships are classified according to IAS 17 based on the
distribution of opportunity and risk between the lessor and lessee.
Leasing relationships in which most of the opportunity and risk linked to ownership of the leased item remains with the lessor
are classified as operating leases. Where the lessee has most of the opportunity and risk, the agreement is classified as a
finance lease.
a) Accounting for lessee transactions
Payments made in connection with an operating lease (net after taking into account incentive payments by the lessor) are
recognized in the income statement by straight-line depreciation over the term of the lease.
Assets from finance leases are capitalized at the start of the lease term at the lower of the fair value of the leased item and
the present value of the minimum lease payments. A leasing liability is recognized under “Current and non-current debt”.
Each lease installment is split into an interest and a repayment portion, so that the leasing liability is subject to a consistent
interest rate. The interest portion of the lease installment is recognized as affecting expenditure in the income statement. The
property, plant and equipment asset held under a finance lease is written down over the shorter of the economic life of the
asset or the lease term.
b) Accounting for lessor transactions
A lease is an agreement whereby the lessor assigns to the lessee the right to use an asset for a specific period of time against
a payment or series of payments.
Assets leased by the customer in the form of operating leases are assigned on the balance sheet according to their nature.
Income from leases is recognized by the straight-line method over the term of the agreement. In the BAUER Group, mainly
operating leases are entered into as the lessor.

97
CO
NS
OL
IDA
TE
D F
INA
NC
IAL
STA
TE
ME
NT
S2
01
6
NOTES TO THE CONSOLIDATED FINANCIAL STATEMENTS 2016
Government grants
Government grants for assets including non-monetary benefits at fair value are recognized on the balance sheet as accruals
on the Equity and Liabilities side (Investment allowance) or, on determining the carrying amount of the asset, are deducted
from the Assets side (Invest subsidy).
Business combinations
Acquisitions of subsidiaries are accounted for in accordance with IFRS 3 based on the acquisition method. The cost of the
acquisition corresponds to the fair value of the assets contributed, the equity instruments issued and the liabilities created
and/or transferred at the transaction date. Assets, liabilities and contingent liabilities identifiable in the course of a business
combination are measured on initial consolidation at their fair values at the acquisition date. The amount by which the acquisition
cost exceeds the Group’s share of the net assets measured at their fair value is stated as goodwill. The non-controlling interests
are valued either at cost (Partial Goodwill method) or at fair value (Full Goodwill method). The available option can be exercised
on a case-by-case basis. BAUER Group policy is to apply the Partial Goodwill method. If the acquisition cost is less than the net
assets of the acquired subsidiary measured at their fair value, the difference is recognized directly in the income statement.
Transaction costs directly linked to a business combination are recognized in the income statement. In the event of successive
acquisitions, the differences between the carrying amount and the applicable fair value of the shares previously held are
recognized as affecting net income at the time of acquisition. Existing contracts with the acquired entity at the time of
acquisition, except those under the terms of IAS 17 and IFRIC 4, are analyzed and reclassified where appropriate.
Borrowing costs
Borrowing costs linked directly to the acquisition, construction or production of qualifying assets in accordance with IAS 23
are included in the cost of the asset in question for the period until start of use of the asset. No borrowing costs were capitalized
in the financial year. Testing as to whether an asset is a qualifying asset is carried out according to internally stipulated materiality
limits for projects and installations. If the said materiality limits are exceeded, borrowing costs for qualified assets are capitalized.
Other financing costs are recognized as ongoing expenditure under “Financial expenses”.
Investment Property
Land and buildings maintained in order to generate rental income are accounted for at amortized cost in accordance with IAS
40, with the useful lives applied for depreciation (straight-line according to the pro rata temporis method) corresponding to
those of the property, plant and equipment used by the company itself. An evaluation by an independent expert to determine
the applicable fair value of the Investment Property was not undertaken. The measurement is derived from current market
prices for similar property. This method is part of level 2 of the fair value hierarchy stated in IFRS 13.
Investments accounted for using the equity method
Associated companies
According to IAS 28, an associated company is any entity over which the investor has significant influence, though not control.
This routinely means voting shares of between 20 and 50 %.
Shares in associated companies are valued at-equity and recognized initially at cost. The Group’s shares in associated companies
include the goodwill created by the acquisition (less cumulative impairment).

98 NOTES ON THE CONSOLIDATED FINANCIAL STATEMENTS 2016
The Group’s share in the profits and losses of associated companies is reported in the income statement as from the time of
acquisition. The shares in the other comprehensive income of the associated company are also reported proportionally in the
Group’s other income, broken down by amounts reclassified to the income statement in a later period and amounts that are not
reclassified. Cumulative changes after acquisition are set off against the carrying amount of the investment. If the Group’s share
in the losses of an associated company is equal to or more than the Group’s shareholding in the said associate, including other
unsecured claims, the Group recognizes no additional losses, unless it has entered into obligations or made payments on behalf
of the associated company.
Non-realized gains from transactions between Group companies and associated companies are eliminated according to the
Group’s share in the associated company. Non-realized losses are likewise eliminated, unless the transaction implies an impair-
ment of the transferred asset.
Joint ventures
Joint ventures are joint arrangements in which the parties exercise joint control and have claims to the net assets of the arrange-
ment. The contractually agreed joint control of the arrangement jointly manages the venture. This is only the case if decisions
regarding the material activities require the unanimous approval of the parties involved in the joint control.
Joint arrangements recognized at equity include joint ventures as well as the Arbeitsgemeinschaften (“ARGE”) consortia specific
to Germany, with there being a difference between ARGE consortia and umbrella ARGE consortia. Both consortia are subject
to the regulations of IFRS 11.
Assets are provided for and invoiced to ARGE provision consortia in the form of employees, material or equipment. The results
generated by the provision consortia are recognized in the balance sheet using the equity method, in accordance with IAS
28. They are recognized in the balance sheet as investments accounted for using the equity method and as income from
investments accounted for using the equity method in the income statement.
An umbrella consortium, on the other hand, is always recognized without any effect on profit and loss. The compensation claims
between umbrella consortium and customer are identical to the compensation claims between the individual consortia and
the umbrella consortium. The umbrella consortium transfers all payments received from the customer in full to the individual
consortia. BAUER as a partner in an umbrella consortium accounts for the assets at its disposal and the liabilities it itself
incurs, as well as its own expenditures, and recognizes the income from such activities on a pro-rata basis in its sales revenues.
Ongoing settlements from and to consortia are recognized in receivables or liabilities to joint ventures.
Joint operations
Joint operations are joint arrangements in which the parties assume joint control and hold rights in the assets as well as
obligations with regard to the liabilities of the arrangement. The contractually agreed joint control of the arrangement jointly
controls the arrangement. This is only the case if decisions regarding the material operations require the unanimous approval
of the parties involved in the joint control.
Any operations performed by the BAUER Group as part of a joint operation relating to its share in the joint operation are
recognized in the following items:
- Its assets, including its share in jointly held assets
- Its liabilities, including its share in jointly incurred liabilities

99NOTES ON THE CONSOLIDATED FINANCIAL STATEMENTS 2016
CO
NS
OL
IDA
TE
D F
INA
NC
IAL
STA
TE
ME
NT
S2
01
6
- Its income from the sale of its share in the products of the joint operation
- Its share in income from the sale of products or services by the joint operation, and
- Its expenses, including its share in any jointly incurred expenses
For transactions such as the acquisition of assets by a Group company, gains and losses are recognized in the amount of the
Group share of other joint operations only once the assets are sold to third parties.
Financial instruments
a) Primary financial instruments
In the BAUER Group, primary financial instruments are assigned as financial assets to the following categories:
• Loans and Receivables (LaR)
• Available-for-Sale (AfS)
The “Loans and Receivables” category includes current and non-current financial assets.
The “Available-for-Sale” category includes marketable securities as well as equity portions which are not consolidated or
not recognized by the equity method. For those equity portions there is no active market, and no fair value can be reliably
determined for them, so the shares are valued at cost. We have no intention of selling them. If there are objective indications
that an impairment has occurred in these equity instruments, the amount of the valuation allowance is calculated as the
difference between the carrying amount of the financial asset and the present value of the expected future cash flows that
are discounted taking into account an appropriate market return. Such value allowances may not be reversed.
Financial assets held for sale are non-derivative financial assets classified as available for sale and those not classified as
one of the other categories of financial assets stated. They are recognized at fair value both when initially entered and in the
subsequent periods.
Assets classified as held for sale are impairment-tested at each balance sheet date in relation to objective criteria (such as
significant financial difficulties of the debtor, high probability of insolvency proceedings being initiated against the debtor,
loss of an active market in the financial assets). Any impairment expenditure incurred because a fair value is less than the
carrying amount is recognized affecting net income. Where impairment of the fair values of assets held for sale was previously
stated not affecting net profit in the equity, it must be eliminated from the equity up to the amount of the measured impair-
ment and recognized in the income statement. If subsequent valuation reveals that the fair value has objectively increased
due to events occurring after entry, the impairment is reversed in the corresponding amount. Recovery in the value of debt
instruments is recognized in the income statement. Impairment affecting equity instruments held for sale and recognized at
cost must not be reversed.
Primary financial instruments as financial liabilities are assigned to the following category:
• Financial Liabilities Measured at Amortized Cost (FLAC) or Other Financial Liabilities
The “Financial Liabilities Measured at Amortized Cost” category includes liabilities to banks, trade payables as well as other
current and non-current debt and current and non-current financial liabilities.

100 NOTES TO THE CONSOLIDATED FINANCIAL STATEMENTS 2016
Receivables and liabilities in the “Financial Liabilities Measured at Amortized Cost” and “Loans and Receivables” categories
are initially recognized at the applicable fair value, including transaction costs directly attributable to acquisition of the financial
asset or incurring of the financial liability, and subsequently measured at amortized cost, applying the effective interest rate
method. The amortized cost of a financial asset or liability is calculated, applying the effective interest rate method, from the
historical cost less the repayments made, plus or less the cumulative amortization of any difference between the original
amount and the amount repayable at the final due date, and also less depreciation and impairment or plus appreciation
and value recovery adjustment.
In the case of current receivables and liabilities, the amortized cost always corresponds to the nominal amount, or the amount
repayable. Cash and cash equivalents comprise credit balances with banks as well as petty cash stocks, and are valued at
amortized cost.
In the case of financial assets or liabilities recognized in the income statement at fair value, the initial fair-value valuation excludes
the transaction costs. Financial liabilities are derecognized when they have been paid or the obligation has been extinguished.
Items are initially recorded on the performance date. In the case of financial assets, derecognition of potential default risks
is affected by value adjustments in separate valuation allowance accounts. Financial assets are derecognized if the rights
to payments from the financial assets have expired or been transferred, and the Group has essentially transferred all risks
and opportunities associated with ownership, or the essential opportunities and risks have neither been transferred nor
retained, but right of disposal has been transferred. If there are doubts as to the collectability of receivables, they are valued
at amortized cost less appropriate single valuation allowances or a flat-rate allowance. Impairment of trade receivables is
recognized when there are objective signs (such as disputed contract variations, missed payments or insolvencies) indicating
that the amounts due will not be collectable in full. The impairment is recognized in the income statement by way of a valuation
allowance account. They are derecognized at the same time as the corresponding impaired receivable. All other impairments
are written off directly and likewise recognized in the income statement. The fair value option provided by IAS 39 was not
exercised.
b) Derivative financial instruments
A derivative is a financial instrument or contract within the area of applicability of IAS 39, which cumulatively meets the
following criteria:
• which varies in value based on changes in a specific interest rate, price of a financial instrument, commodity price, exchange
rate, price or interest rate index, credit rating or credit index, or some similar variable, provided in the case of a non-financial
variable the variable is not specific to one party to the contract;
• which requires no payment in return for acquisition, or one which, compared to other forms of contract expected to react
similarly to changes in market conditions, is lower;
• which is settled at a later date.
In the BAUER Group, free-standing derivative financial instruments are assigned as financial assets to the following category:
• Financial Assets Held for Trading or “FAHfT”
Free-standing derivative financial instruments as financial liabilities are assigned to the following category:
• Financial Liabilities Held for Trading or “FLHfT”

101
CO
NS
OL
IDA
TE
D F
INA
NC
IAL
STA
TE
ME
NT
S2
01
6
NOTES TO THE CONSOLIDATED FINANCIAL STATEMENTS 2016
Changes in value of derivatives not forming part of a cash flow hedge are stated under other operating income or expenses in
the case of foreign exchange forward contracts or options or, in the case of interest-rate swaps, are recognized in the income
statement under financial expenses or income
The free-standing derivative financial instruments of the “Financial Assets Held for Trading” and “Financial Liabilities Held for
Trading” categories include fair values of interest rate swaps, foreign exchange options, cross-currency swaps and foreign
exchange forward contracts not included in hedge accounting or not meeting the hedge accounting conditions.
In the BAUER Group, derivative financial instruments (interest rate swaps, foreign exchange options, cross-currency swaps
and foreign exchange forward contracts) are entered into solely to hedge against interest rate and currency risks. No deals are
made without an underlying transaction.
In the case of derivatives included in hedge accounting, when hedging expected future transactions (cash flow hedges) the
effective portion of the gain or loss from a hedging instrument is initially recognized in the equity, taking into account deferred
taxes, and is only recognized in the income statement when the underlying hedged transaction is realized. The ineffective portion
of the hedge transaction is recognized in the income statement immediately. The derivative financial instruments are stated at their
fair values as assets or liabilities. Items are initially recorded on the trading date. In the 2016 financial year, hedge accounting
was used for cash flow hedges. The market values of the derivatives are calculated on the basis of the conditions prevailing
at the balance sheet date, such as interest or exchange rates, and applying recognized models, such as discount cash flow
or option price models. The fair values of the foreign exchange forward contracts are defined on the basis of current reference
prices, taking into account forward premiums and discounts. The fair values of the interest rate swaps are determined on the
basis of discounted future payment flows, applying the market interest rates applicable to the respective residual terms of the
derivatives.
Inventories
Inventories of finished goods and work in progress and stock for trade as well as raw materials and supplies are valued at
manufacturing cost or at the lower net realizable value on the balance sheet date in accordance with IAS 2.
The net realizable value is the estimated achievable selling price in the ordinary course of business less the estimated costs
through to completion and the estimated necessary selling costs.
Raw materials and supplies are valued mainly at floating average cost. Where the machinery and accessories classified as
finished goods and stock for trade and primarily held for sale, are hired out for a short period as a secondary sales promotion
measure, the following factors are considered in determining their net realizable values:
• Hire period
• Useful life of the machines
• Damage and inoperability
Where the net realizable value of previously written-down inventories has increased, corresponding value recovery adjust-
ments are made. The manufacturing cost includes all direct costs of the manufacturing process. The level of impairment
losses on inventories is explained in accordance with IAS 2 under “Inventories”.

102 NOTES ON THE CONSOLIDATED FINANCIAL STATEMENTS 2016
Construction contracts
Construction contracts are accounted for by the percentage of completion method in accordance with IAS 11. The sales are
recognized according to the progress of work based on the percentage of completion method. The applicable percentage
of completion is determined according to the costs incurred (cost-to-cost method). Where the cumulative return (contract
costs and pro-rata result) exceeds the payments on account in individual cases, the construction contracts are recognized as
assets under “Receivables from construction contracts (PoC)”. If a negative balance remains after deduction of the payments
on account, it is recognized as a liability under “Liabilities from construction contracts (PoC)”. Expected losses on a contract
are accounted for in full at the time they are identified, by adjustments to the valuation of any existing receivables or by the creation
of a provision. Construction contracts undertaken in joint ventures are valued according to the percentage of completion method.
Receivables from joint ventures also include the pro-rata result from the contract.
Receivables from joint ventures also include the pro-rata result from the contract. Expected losses are covered by write-downs or
liabilities as appropriate, and are taken into account in the contract result.
Cash and cash equivalents
Cash and cash equivalents comprise cash and sight deposits with an original term of no more than three months.
Assets classified as held for sale
Long-term assets held for sale and the associated liabilities are measured in accordance with IFRS 5 and reported separately
as current assets. Assets held for sale are assets that can be sold in their current state and are very likely to be sold. The sale
must be anticipated within one year from the date of reclassification. These may be individual assets, groups of assets (disposal
groups) or corporate assets (discontinued operations). Assets held for sale are no longer amortized, but are recognized at their
fair value less costs to sell, if this value is lower than the book value.
Deferred taxes
In accordance with IAS 12, deferred taxes are taken into account in respect of variations between the valuations of assets and
liabilities according to IFRS and their corresponding tax bases in the amount of the projected future tax charge or refund. In
addition, deferred tax assets are recognized for future advantages arising from tax losses carried forward, provided it is probable
that they will be realized.
Deferred taxes arising from temporary differences in connection with investments in subsidiaries and associated companies
are recognized, unless the date of reversal of the temporary differences can be determined by the Group and it is likely that
the temporary differences will not be reversed again in the foreseeable future because of this effect.
According to IAS 12.74, deferred tax assets and liabilities are to be offset if a legally enforceable right to set off current tax assets
against current tax liabilities exists. Offsetting should also be carried out if the deferred tax assets and liabilities relate to income
taxes levied by the same tax authority in respect of:
• either the same taxable entity or
• different taxable entities which intend either to settle current tax liabilities and assets on a net basis, or to realize the assets
and settle the liabilities simultaneously, in each future period in which significant amounts of deferred tax liabilities or assets
are expected to be settled or recovered.

103NOTES ON THE CONSOLIDATED FINANCIAL STATEMENTS 2016
CO
NS
OL
IDA
TE
D F
INA
NC
IAL
STA
TE
ME
NT
S2
01
6
The tax expenditure for the period comprises current and deferred taxes. Taxes are reported in the income statement, unless
they relate to items recognized directly in the equity or in the other comprehensive income. In this case; the taxes are likewise
recognized in the equity or in the other comprehensive income.
In Germany, deferred taxes are stated on the basis of corporation tax, the “solidarity surcharge” and trade tax, in a range of
26.90 to 32.14 % (previous year: 26.90 % and 31.69 %). Outside Germany, tax rates of between 0.00 % and 38.15 % are
applied (previous year: 0.00 % and 38.15 %).
Provisions
a) Provisions for pensions
The BAUER Group operates a number of provisions for pensions in Germany and internationally.
Typically, such plans define an amount of pension benefit which employees will receive on retirement and which is normally
dependent on one or more factors (such as age, years of service and salary).
The provisions for pensions on the balance sheet corresponds to the cash value of the defined benefit obligation (DBO) at the
balance sheet date, less the fair value of the plan assets. The DBO is calculated annually by an independent actuary applying
the projected unit credit method. The cash value of the DBO is calculated by discounting the expected future inflow of funds
at the interest rate of industrial bonds of the highest credit rating. The industrial bonds are denominated in the currency of the
disbursements, and have terms corresponding to the pension commitments. In countries where the market in such bonds is
insufficiently developed, government bonds are applied.
Actuarial gains and losses based on experience-related adjustments to actuarial assumptions are recognized in the “Other
comprehensive income” in the equity in the period in which they occur. Post-employment expenditure is recognized in staff
cost and the interest portion of the addition to provisions in financial expenses.
Under the contribution-based provisions for pensions, the entity concerned makes payments to pension institutions which are
stated in the personnel expenses.
b) Provisions for tax purposes
Tax provisions include liabilities from current income taxes. Income tax provisions are balanced against corresponding tax refund
claims, provided they arise in the same tax territory and are identical in nature and in terms of due date.
c) Other provisions
The other provisions are created in accordance with IAS 37 where a present obligation arises from a past event, a relevant claim is
more likely than unlikely, and the amount of the claim can be reliably estimated. The provisions are stated at their performance
amount, and are not netted against profit contributions. Long-term provisions are recognized at present value. Provisions are
created only for legal or constructive obligations to third parties.

104 NOTES ON THE CONSOLIDATED FINANCIAL STATEMENTS 2016
Income and expenses
Sales revenues and other incomes are realized in accordance with IAS 18 on performance of the supply or service or on transfer
of risk to the customer, as appropriate.
Dividend income is recognized at the date on which the right to receipt of payment is created. Dividends received are recognized
as income from operating investments under “Financial income”. Operating expenses are recognized as affecting net income
when the supply or service is claimed or at the time they are caused, as appropriate. Financial income and expenses are
recognized when incurred.
Income from service contracts is recognized according to the degree of completion.
6. SEGMENT REPORTING
Reporting on the segments of the BAUER Group was implemented in accordance with IFRS 8, as in the previous year. The
internal organizational and management structure and the internal system of reporting to the Management Board and Super-
visory Board dictate the segmentation employed by the BAUER Group.
The BAUER Group comprises the Construction, Equipment and Resources segments. Transactions between the segments
are conducted at market prices.
SCHACHTBAU NORDHAUSEN GmbH is the only Group company to operate in all three segments. The assets and liabilities
and income statement items of SCHACHTBAU NORDHAUSEN GmbH are assigned to the relevant segments.
Construction
The core business of the Construction segment is specialist foundation engineering. Complete excavation pits and foundation
works, often in difficult subgrade conditions, are carried out for major infrastructure projects and buildings. In order to offer
customers a full range of services, the companies of the BAUER Group additionally offer other construction services, often
involving a major specialist foundation engineering element. Examples of this include bridges, environmental engineering,
remediation and building renovation projects. The Construction segment is founded on the close interlinking of all construction
activities.
Equipment
In the Equipment segment, machinery for all specialist foundation engineering processes and for deep drilling is developed
and manufactured for worldwide distribution. The specialist foundation engineering equipment can be employed to produce
large-diameter and small-diameter bores for piles, diaphragm walls, anchors, injections and wells. The deep drilling equipment
can be employed to drill for geothermal energy, oil and gas. Equipment for ramming and ground improvement is also manu-
factured. The range is supplemented by a wide selection of add-on units and ancillary equipment, covering all the process-
es involved in specialist foundation engineering.
Resources
The Resources segment brings together all the Group companies providing products and services relating to the remediation
and extraction of natural resources essential to human life. They include environmental technology companies involved in the
treatment of ground and groundwater as well as companies involved in exploration drilling and mining of raw materials and
drilling of wells and geothermal energy sources. This segment also includes companies which manufacture and sell materials
for the engineering of bore holes, specifically for wells and geothermal energy sources.

105NOTES ON THE CONSOLIDATED FINANCIAL STATEMENTS 2016
CO
NS
OL
IDA
TE
D F
INA
NC
IAL
STA
TE
ME
NT
S2
01
6
Other
The Other segment comprises the central services (accounting, human resources, IT etc.) provided by BAUER AG to the
Group companies as well as other units not assignable to the separately listed segments, providing services such as in-house
and external education and training and centralized research and development.
Consolidation
The intersegmental consolidation effects are grouped here under Consolidation. This includes offsetting of intra-group sales
between the segments as well as income and expenses and interim results. The intersegmental consolidation effects are
adjusted within the respective segments.
The segment earnings after tax reflect the financial income and expenses as well as the net earnings of shares valued at-
equity and the income tax expenditure. The segments’ assets and liabilities incorporate all the assets and liabilities of the
Group. The non-current assets stated in the segment report by region comprise intangible assets, property, plant and
equipment and investment property.
Total Group revenues, consolidated revenues and sales revenues with third parties
The consolidated revenues reflect the performance of all the companies included in the basis of consolidation. The total Group
revenues represent the revenues of all the companies forming part of our Group. The difference between the consolidated
revenues and the total Group revenues is derived from the revenues of the associated companies, from our subcontractor
shares in joint ventures, and from the revenues of non-consolidated companies.
The sales revenues with third parties are allocated to the business segments according to the customer’s location. No one
customer accounts for more than 10 % of total sales.
No breakdown of sales revenues by product and service, or by groups of comparable products and services, was available as
per the balance sheet date.
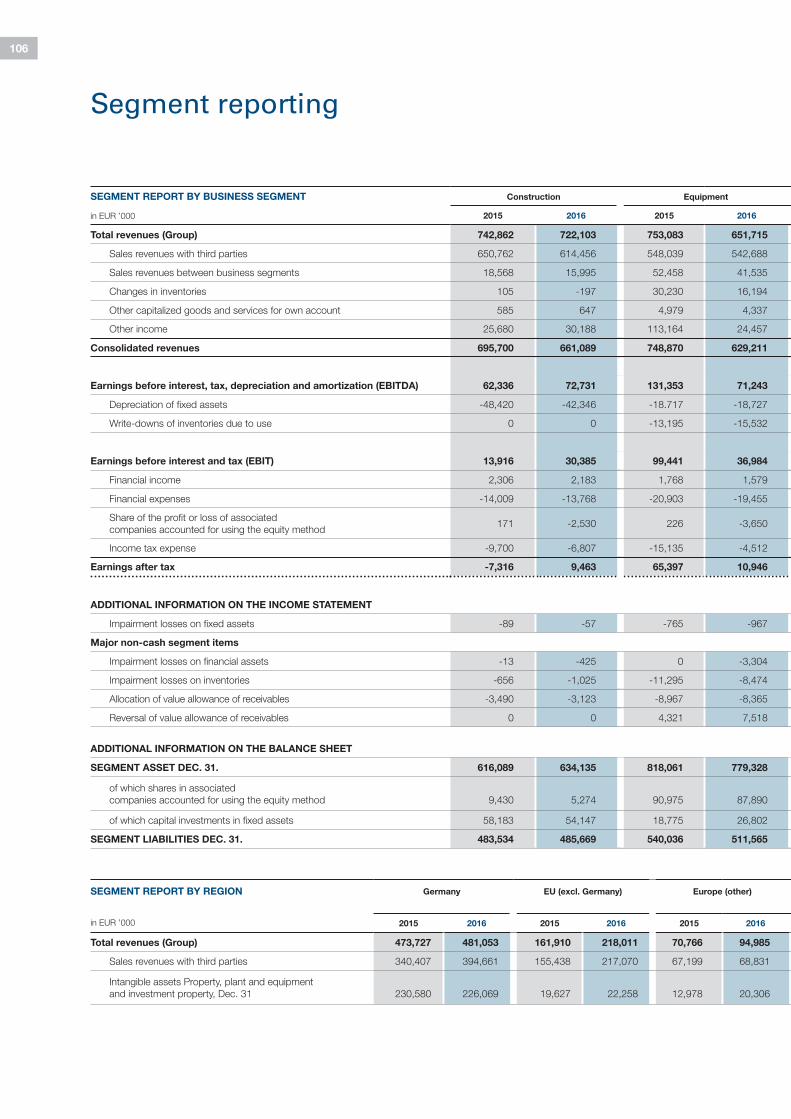
106
SEGMENT REPORT BY BUSINESS SEGMENT
in EUR ’000
Construction Equipment
2015 2016 2015 2016
Total revenues (Group) 742,862 722,103 753,083 651,715
Sales revenues with third parties 650,762 614,456 548,039 542,688
Sales revenues between business segments 18,568 15,995 52,458 41,535
Changes in inventories 105 -197 30,230 16,194
Other capitalized goods and services for own account 585 647 4,979 4,337
Other income 25,680 30,188 113,164 24,457
Consolidated revenues 695,700 661,089 748,870 629,211
Earnings before interest, tax, depreciation and amortization (EBITDA) 62,336 72,731 131,353 71,243
Depreciation of fixed assets -48,420 -42,346 -18.717 -18,727
Write-downs of inventories due to use 0 0 -13,195 -15,532
Earnings before interest and tax (EBIT) 13,916 30,385 99,441 36,984
Financial income 2,306 2,183 1,768 1,579
Financial expenses -14,009 -13,768 -20,903 -19,455
Share of the profit or loss of associated
companies accounted for using the equity method171 -2,530 226 -3,650
Income tax expense -9,700 -6,807 -15,135 -4,512
Earnings after tax -7,316 9,463 65,397 10,946
ADDITIONAL INFORMATION ON THE INCOME STATEMENT
Impairment losses on fixed assets -89 -57 -765 -967
Major non-cash segment items
Impairment losses on financial assets -13 -425 0 -3,304
Impairment losses on inventories -656 -1,025 -11,295 -8,474
Allocation of value allowance of receivables -3,490 -3,123 -8,967 -8,365
Reversal of value allowance of receivables 0 0 4,321 7,518
SEGMENT REPORT BY REGION
in EUR ’000
Germany EU (excl. Germany) Europe (other)
2015 2016 2015 2016 2015 2016
Total revenues (Group) 473,727 481,053 161,910 218,011 70,766 94,985
Sales revenues with third parties 340,407 394,661 155,438 217,070 67,199 68,831
Intangible assets Property, plant and equipment
and investment property, Dec. 31 230,580 226,069 19,627 22,258 12,978 20,306
Segment reporting
ADDITIONAL INFORMATION ON THE BALANCE SHEET
SEGMENT ASSET DEC. 31. 616,089 634,135 818,061 779,328
of which shares in associated
companies accounted for using the equity method 9,430 5,274 90,975 87,890
of which capital investments in fixed assets 58,183 54,147 18,775 26,802
SEGMENT LIABILITIES DEC. 31. 483,534 485,669 540,036 511,565

107NOTES ON THE CONSOLIDATED FINANCIAL STATEMENTS 2016
CO
NS
OL
IDA
TE
D F
INA
NC
IAL
STA
TE
ME
NT
S2
01
6
Resources Other Consolidation Group
2015 2016 2015 2016 2015 2016 2015 2016
221,609 264,712 41,492 48,590 -102,634 -100,991 1,656,412 1.586,129
179,319 238,199 871 1,538 1,378,991 1.396,881
2,756 2,562 32,425 37,556 -106,207 -97,648 0 0
-1,341 -638 0 0 0 0 28,994 15,359
839 526 0 0 16,345 7,962 22,748 13,472
18,753 5,391 6,987 7,996 -7,371 -5,168 157,213 62,864
200,326 246,040 40,283 47,090 -97,233 -94,854 1,587,946 1,488,576
-8,206 7,785 7,577 9,809 -7,999 -3,179 185,061 158,389
-11,601 -11,014 -3,011 -3,284 606 862 -81,143 -74,509
0 0 0 0 0 0 -13,195 -15,532
-19,807 -3,229 4,566 6,525 -7,393 -2,317 90,723 68,348
1,235 1,419 10,287 11,793 -10,624 -11,434 4,972 5,540
-11,206 -12,422 -6,488 -12,613 10,624 11,434 -41,982 -46,824
2,275 3,159 0 0 0 0 2,672 -3,021
-1,895 2,621 -1,537 -869 874 -62 -27,393 -9,629
-29,398 -8,452 6,828 4,836 -6,519 -2,379 28,992 14,414
-10 -44 0 0 0 0 -864 -1,068
-149 -480 0 0 0 0 -162 -4,209
-198 -85 0 0 0 0 -12,149 -9,584
-1,899 -14,286 0 0 0 0 -14,356 -25,774
562 639 0 0 0 0 4,883 8,157
Middle East
and Central Asia
Asia-Pacific, Far East
and Australia
Americas Africa Group
2015 2016 2015 2016 2015 2016 2015 2016 2015 2016
227,679 197,339 347,788 283,910 297,392 235,602 77,150 75,229 1,656,412 1,586,129
186,019 185,486 337,701 268,760 221,809 193,854 70,418 68,219 1,378,991 1,396,881
47,825 47,747 84,121 85,626 24,217 23,876 12,463 7,735 431,811 433,617
269,254 315,812 362,055 430,804 -408,551 -458,661 1,656,908 1.701.418
32,249 36,088 0 0 -101 0 132,553 129,252
8,823 11,761 6,522 3,736 -1,325 -652 90,978 95,794
237,562 286,531 201,241 268,743 -256,675 -285,221 1,205,698 1,267,287

108 NOTES ON THE CONSOLIDATED FINANCIAL STATEMENTS 2016
7. SALES REVENUES
The sales revenues generated in the amount of EUR 1,396,881 thousand (previous year: EUR 1,378,991 thousand) include
revenues arising from application of the percentage of completion method and revenues from the sale and hiring-out of equip-
ment and accessories.
The sales revenues from the application of the percentage of completion method amounted to EUR 714,983 thousand in the
financial year (previous year: EUR 697,066 thousand). Revenue from leased equipment and accessories amounted to EUR
21,898 thousand (previous year: EUR 20,170 thousand) in the financial year, sales revenues and reductions in income totaled
EUR 660,357 thousand (previous year: EUR 664,862 thousand).
With regard to the presentation and breakdown of sales revenues by operating segment and region, please refer to the notes
on segment reporting (see item 6).
Sales revenues provide only an incomplete picture of the performance in the financial year. Figures are therefore transferred to
total Group revenues in the following sections:
EXPLANATORY NOTES TO THE INCOME STATEMENT
in EUR ’000 2015 2016
Income from other capitalized goods and services for own account 22,748 13,472
in EUR ’000 2015 2016
Sales revenues 1,378,991 1,396,881
Changes in inventories 28,994 15,359
Other capitalized goods and services for own account 22,748 13,472
Other income 157,213 62,864
Consolidated revenues 1,587,946 1,488,576
Subcontractor share ARGEN 10,158 11,570
Revenues of associated companies and joint ventures 45,322 84,165
Revenues of non-consolidated companies 34,742 24,825
Intra-group revenues -21,756 -23,007
Total revenues (Group) 1,656,412 1,586,129
Sales revenues also include EUR 8,663 thousand in out-of-period income (previous year: EUR 3,724 thousand) resulting
from final invoice agreements in the Construction segment, where final invoices, for example, may include supplementary
items which have not yet been finally negotiated with the customer and ordered. These may prove uncertain. A revenue
correction is applied to these amounts. Should the uncertain amount turn out to be recoverable, the corresponding revenue
will be realized.
8. OTHER CAPITALIZED GOODS AND SERVICES FOR OWN ACCOUNT

109NOTES ON THE CONSOLIDATED FINANCIAL STATEMENTS 2016
CO
NS
OL
IDA
TE
D F
INA
NC
IAL
STA
TE
ME
NT
S2
01
6
in EUR ’000 2015 2016
Income from disposal of property, plant and equipment 16,411 4,567
Realized and unrealized currency gains and gains from foreign exchange forward contracts 50,827 30,674
Income from insurance refunds 1,434 1,652
Other income from rentals 263 290
Effects from de-consolidation and transitional consolidations 5,216 6,276
Other operating income 77,896 15,608
Total 10,382 10,073
Total 157,213 62,864
in EUR ’000 2015 2016
Expenses for raw materials and supplies and purchased goods 511,539 454,224
Expenses for purchased services 240,993 263,768
Total 752,532 717,992
in EUR ’000 2015 2016
Wages and salaries 317,893 311,463
Social security contributions 51,608 52,146
Expenses for retirement benefits 6,617 6,091
Total 376,118 369,700
9. OTHER INCOME
The realized and unrealized foreign currency gains as well as gains from foreign exchange forward contracts stated under
“Other income” totaling EUR 30,674 thousand (previous year: EUR 50,827 thousand) arose in connection with the global
currency hedging strategy and the underlying currency postings. In this context, the income is countered by realized and
unrealized foreign currency losses as well as losses from foreign exchange forward contracts totaling EUR 32,582 thousand
(previous year: EUR 58,501 thousand), stated under “Other operating expenses.”
Additionally, the other operating income mainly comprises income from benefits in money’s worth, other reimbursements
of expenditure as well as other income spread across the consolidated companies which is of minor importance in the
individual instances.
10. COST OF MATERIALS
11. PERSONNEL EXPENSES
The expenses for retirement benefits include the expenditure on benefits as well as the allocations to provisions for pensions
excluding the interest portion, which is stated under “Interest and similar expenses”.
The employer’s pension contributions in the financial year totaled EUR 21,406 thousand (previous year: EUR 21,758 thousand).
These are contribution-based schemes, as explained under 5.2 Significant accounting policies. Of that total, EUR 17,554 thousand
(previous year: EUR 16,995 thousand) relate to Germany and EUR 3,852 thousand (previous year: EUR 4,763 thousand) to
Group companies outside of Germany. The wages and salaries include severance payments in the amount of EUR 647 thousand
(previous year: EUR 1,560 thousand).

110 NOTES ON THE CONSOLIDATED FINANCIAL STATEMENTS 2016
12. OTHER OPERATING EXPENSES
The “Additional other operating expenses” mainly comprise allocations to and reversal of provisions affecting net income as well
as additional other operating expenses spread across the consolidated companies which are of minor importance in the individual
instances. The other employee-related expenses include education and training costs, grants and gifts, travel and relocation
expenses, and other project-specific personnel costs. Other operating expenses include income of EUR 15,156 thousand
(previous year: EUR 12,750 thousand) resulting from the reversal of provisions, impairment of receivables, derecognition of
liabilities and written-off receivables. Currency gains are countered by realized and unrealized foreign currency losses as well as
losses from foreign exchange forward contracts totaling EUR 32,582 thousand (previous year: EUR 58,501 thousand), stated
under “Other operating income.”
13. DEPRECIATION AND AMORTIZATION
Depreciation is as follows:
in EUR ’000 2015 2016
Losses from disposal of property, plant and equipment 1,042 2,723
Rents and leases 27,152 22,593
Energy, heating, water 6,385 4,711
Vehicle costs 7,646 6,363
Property, motor and transport insurance 10,411 9,657
Other operating expenses 35,604 28,391
Administrative expenses 40,619 42,829
Distribution costs 35,844 32,999
Other employee-related expenses 19,408 15,525
Realized and unrealized currency losses and losses from foreign exchange forward contracts 58,501 32,582
Income from impairment of receivables 9,424 17,609
Bank charges 2,732 3,714
Duties 2,028 2,663
Accrued expenses 1,394 6,725
Additional other operating expenses 16,045 13,411
Total 274,235 242,495
in EUR ’000 2015 2016
Amortization of intangible assets 10,143 8,209
Depreciation of property, plant and equipment 71,000 66,300
Total 81,143 74,509
Impairments of fixed assets are explained under item 19.2, Property, plant and equipment and investment property.
14. WRITE-DOWNS OF INVENTORIES DUE TO USE
Write-downs of inventories due to use in the financial year totaled EUR 15,532 thousand (previous year: EUR 13,195 thousand).
This related to write-downs of used machinery temporarily hired out to customers as sales promotion measures. Write-downs of
used machinery disposed of in the 2016 financial year are included in these figures.

111NOTES ON THE CONSOLIDATED FINANCIAL STATEMENTS 2016
CO
NS
OL
IDA
TE
D F
INA
NC
IAL
STA
TE
ME
NT
S2
01
6
FINANCIAL RESULT
15. FINANCIAL INCOME
The financial income is broken down as follows:
16. FINANCIAL EXPENSES
The financial expenses are broken down as follows:
The theoretical tax rate is 28.08 % (previous year: 28.08 %).
The interest from finance leases included under “Interest and similar expenses” in the financial year totaled EUR 877 thousand
(previous year: EUR 869 thousand). The financial result includes interest income from financial assets in an amount of EUR 3,418
thousand (previous year: EUR 3,762 thousand) and interest expenses from financial liabilities in an amount of EUR 35,545
thousand (previous year: EUR 35,779 thousand) which were not measured at fair value affecting profit and loss. Of the impairment
losses on financial assets of EUR 4,209 thousand (previous year: EUR 162 thousand), EUR 425 thousand (previous year: EUR
13 thousand) relates to the Construction segment, EUR 3,304 (previous year: EUR 0 thousand) to the Equipment segment and
EUR 480 thousand (previous year: EUR 149 thousand) to the Resources segment.
17. INCOME TAX EXPENSE
The income tax expense is broken down as follows:
in EUR ’000 2015 2016
Income from operating investments 59 280
Other interest and similar income 3,798 3,468
Income from changes in fair values of interest rate swaps 1,115 1,792
Total 4,972 5,540
in EUR ’000 2015 2016
Interest and similar expenses 36,486 36,036
Impairment losses on financial assets 162 4.209
Losses from changes in fair values of interest rate swaps 2,905 3,798
Interest portions of allocations to provisions for pensions and similar obligations 2,429 2,781
Total 41,982 46,824
in EUR ’000 2015 2016
Actual taxes 21,438 19,612
Deferred taxes 5,955 -9,983
Total 27,393 9,629

112 NOTES ON THE CONSOLIDATED FINANCIAL STATEMENTS 2016
The tax effects of the non-deductible expenses and tax-free earnings contain effects from transitional and de-consolidations
to the amount of EUR -1,982 thousand (previous year: EUR -12,153 thousand).
Internal disbursements result in taxation effects after December 31, 2016 totaling EUR 35 thousand (previous year: EUR 31
thousand).
18. EARNINGS PER SHARE
The earnings per share are calculated by dividing the earnings after tax attributable to the shareholders of BAUER AG by the
weighted average number of ordinary shares outstanding. Earnings per share amount to the following values:
Reconciliation from expected to actual income tax expenditure
The expected tax expenditure is below the recorded tax expenditure. The reasons for the difference between the expected and
recorded tax expenditure are as follows:
2015 2016
Earnings after tax attributable to the shareholders of BAUER AG, in EUR '000 29,715 11,302
Number of shares from Jan. 1 to Dec. 31 17,131,000 17,131,000
Weighted average number of shares in circulation in financial year (basic) 17,131,000 17,131,000
Weighted average number of shares in circulation in financial year (diluted) 17,131,000 17,131,000
Basic earnings per share in EUR 1.73 0.66
Diluted earnings per share in EUR 1.73 0.66
in EUR ’000 2015 2016
Earnings before tax (EBT) 56,385 24,043
Theoretical tax expenditure 28.08 % (previous year: 28.08 %) 15,833 6,751
Differences in tax rate 1,313 1,747
Taxation effects of non-deductible expenses and tax-free income -10,481 -1,190
Effects of variations in the tax calculation base 1,594 3,141
At-equity valuation of associated companies -750 848
Out-of-period tax payments/refunds for previous years 977 312
Effects of deferred tax assets in respect of losses carried forward and temporary differences 18,950 -1,941
Other -43 -39
Income tax expense 27,393 9,629

113NOTES ON THE CONSOLIDATED FINANCIAL STATEMENTS 2016
CO
NS
OL
IDA
TE
D F
INA
NC
IAL
STA
TE
ME
NT
S2
01
6
The breakdown of the fixed asset items summarized on the balance sheet and their development is presented in the fixed
asset movement schedule on the following pages.
NON-CURRENT ASSETS
19. FIXED ASSETS
19.1 Intangible assets
EXPLANATORY NOTES TO THE BALANCE SHEET
in EUR ’000
Licenses, software
and similar rights
and values Goodwill
Internally generated intangible assets
TotalCost of purchase/cost of manufacturing
Capitalized
software costs
Capitalized
development costs
Jan. 1, 2015 33,537 2,186 289 45,568 81,580
Change in basis of consolidation -443 0 0 -10,514 -10,957
Additions 3,019 0 0 4,792 7,811
Disposals 205 0 207 303 715
Transfers 1 0 0 0 1
Currency adjustment 309 0 0 -9 300
Dec. 31, 2015 36,218 2,186 82 39,534 78,020
in EUR ’000
Licenses, software
and similar rights
and values Goodwill
Internally generated intangible assets
TotalAccumulated depreciation
Capitalized
software costs
Capitalized
development costs
Jan. 1, 2015 23,381 2,186 250 21,323 47,140
Change in basis of consolidation -305 0 0 -6,038 -6,343
Additions 3,787 0 28 6,328 10,143
Disposals 189 0 207 165 561
Transfers 0 0 0 0 0
Currency adjustment 194 0 0 -8 186
Dec. 31, 2015 26,868 2,186 71 21,440 50,565
Carrying amount Dec. 31, 2015 9,350 0 11 18,094 27,455
in EUR ’000
Licenses, software
and similar rights
and values Goodwill
Internally generated intangible assets
TotalCost of purchase/cost of manufacturing
Capitalized
software costs
Capitalized
development costs
Jan. 1, 2016 36,218 2,186 82 39,534 78,020
Change in basis of consolidation -1,680 0 0 -170 -1,850
Additions 3,045 0 0 4,223 7,268
Disposals 172 0 42 934 1,148
Transfers 0 0 0 0 0
Currency adjustment 309 0 0 15 324
Dec. 31, 2016 37,720 2,186 40 42,668 82,614

114 NOTES ON THE CONSOLIDATED FINANCIAL STATEMENTS 2016
The changes to the basis of consolidation mainly comprise intangible assets from the de-consolidation of BAUER-DE WET
EQUIPMENT (PROPRIETARY) LIMITED with a carrying amount of EUR 354 thousand. In the previous year, the changes in the
basis of consolidation included BAUER Deep Drilling GmbH with a carrying amount of EUR 4,165 thousand.
Of the total research and development costs and patent costs incurred in 2016, EUR 4,401 thousand (previous year: EUR 4,936
thousand) met the capitalization criteria in accordance with IFRS. The following amounts were recognized in net income:
in EUR ’000Licenses, software
and similar rights
and values Goodwill
Internally generated intangible assets
TotalAccumulated depreciation
Capitalized
software costs
Capitalized
development costs
Jan. 1, 2016 26,868 2,186 71 21,440 50,565
Change in basis of consolidation -1,325 0 0 -151 -1,476
Additions 3,217 0 9 4,983 8,209
Disposals 118 0 42 392 552
Transfers 5 0 0 -5 0
Currency adjustment 216 0 0 12 228
Dec. 31, 2016 28,863 2,186 38 25,887 56,974
Carrying amount, Dec. 31, 2016 8,857 0 2 16,781 25,640
in EUR ’000 2015 2016
Research costs and non-capitalized development costs 19,470 17,137
Amortization of development costs and patents 6,528 5,162
Research and development costs recognized in net income 25,998 22,299

115NOTES ON THE CONSOLIDATED FINANCIAL STATEMENTS 2016
CO
NS
OL
IDA
TE
D F
INA
NC
IAL
STA
TE
ME
NT
S2
01
6
19.2 Property, plant and equipment and investment property
in EUR ’000
Land and
Buildings
Investment
Property
Technical
Equipment
Other
Equipment,
Factory and
Office Equipment
Payments on
account and
assets in course
of construction Total
Acquisition or
Manufacturing costs
Jan. 1, 2015 306,192 1,734 513,190 75,297 8,213 904,626
Change in basis of consolidation -28,058 0 -4,431 -407 -401 -33,297
Additions 4,499 15 59,539 11,083 8,031 83,167
Disposals 4,378 0 66,925 7,318 30 78,651
Transfers 4,794 0 4,766 146 -9,707 -1
Currency adjustment 3,994 0 17,562 1,392 -444 22,504
Dec. 31, 2015 287,043 1,749 523,701 80,193 5,662 898,348
in EUR ’000
Land and
Buildings
Investment
Property
Technical
Equipment
Other
Equipment,
Factory and
Office Equipment
Payments on
account and
assets in course
of construction TotalAccumulated depreciation
Jan. 1, 2015 99,616 930 306,981 50,190 0 457,717
Change in basis of consolidation -4,209 0 -3,359 -459 -64 -8,091
Additions 9,661 35 52,350 8,954 0 71,000
Disposals 2,745 0 29,002 5,846 0 37,593
Transfers 0 0 0 0 0 0
Currency adjustment 488 0 9,418 989 64 10,959
Dec. 31, 2015 102,811 965 336,388 53,828 0 493,992
Carrying amount Dec. 31, 2015 184,232 784 187,313 26,365 5,662 404,356
of which finance lease, carrying
amount Dec. 31, 2015 1,687 0 16,231 5,940 0 23,858
in EUR ’000
Land and
Buildings
Investment
Property
Technical
Equipment
Other
Equipment,
Factory and
Office Equipment
Payments on
account and
assets in course
of construction Total
Acquisition or
Manufacturing costs
Jan. 1, 2016 287,043 1,749 523,701 80,193 5,662 898,348
Change in basis of consolidation -1,310 0 1,419 -551 0 -442
Additions 3,357 0 59,042 9,769 16,358 88,526
Disposals 4,808 1,749 35,873 6,991 359 49,780
Transfers 1,540 0 4,692 647 -6,879 0
Currency adjustment -87 0 -8,302 -1,029 39 -9,379
Dec. 31, 2016 285,735 0 544,679 82,038 14,821 927,273

116 NOTES ON THE CONSOLIDATED FINANCIAL STATEMENTS 2016
Changes to the basis of consolidation in 2015 comprise disposals of property, plant and equipment from the de-consolidation
of BAUER Manufacturing LLC in the amount of EUR 26,271 thousand, SPANTEC Spann- & Ankertechnik GmbH in the amount
of EUR 425 thousand, and BAUER Deep Drilling GmbH in the amount of EUR 97 thousand, as well additions from the initial
consolidation of BAUER Equipment India Private Limited, BAUER Equipment Australien Pty. Ltd., BAUER Resources Maroc
S.A.R.L. and BAUER Resources Senegal SARL with an addition of property, plant and equipment totaling EUR 1,587 thousand.
Changes to the basis of consolidation in 2016 mainly comprise disposals of property, plant and equipment from the de-
consolidation of BAUER-DE WET EQUIPMENT (PROPRIETARY) LIMITED totaling EUR 1,586 thousand, HGC Hydro-Geo-Consult
GmbH totaling EUR 127 thousand as well as additions from the initial consolidation of BAUER Maszyny Polska Sp.z.o.o and
BAUER Resources Saudi LLC, with an addition of property, plant and equipment totaling EUR 1,993 thousand.
There are purchase options, which will be executed, for the majority of buildings and equipment subject to finance lease
contracts. The underlying interest rates of the contracts vary between 1.17 % and 7.75 % (previous year: 1.43 % and 7.50 %),
depending on the market and time of the conclusion of the contract. The lease payments due in the future and their present
values are stated in the following table:
Investment property was sold in the financial year at a price of EUR 800 thousand. It includes a hotel owned by SCHACHTBAU
NORDHAUSEN GmbH, leased to third parties. SCHACHTBAU NORDHAUSEN GmbH also has a contractual obligation to
maintain the property. An evaluation by an independent expert to determine the applicable fair value of the Investment Property
was not undertaken. The measurement is derived from current market prices for similar property. This method is part of level 2
of the fair value hierarchy stated in IFRS 13. The market value in the previous year was EUR 784 thousand.
No rental income (previous year: EUR 51 thousand) was generated in the reporting period, which is directly offset by operating
expenses in the amount of EUR 43 thousand (previous year: EUR 14 thousand).
in EUR ’000
Land and
Buildings
Investment
Property
Technical
Equipment
Other
Equipment,
Factory and
Office Equipment
Payments on
account and
assets in course
of construction TotalAccumulated depreciation
Jan. 1, 2016 102,811 965 336,388 53,828 0 493,992
Change in basis of consolidation -235 0 -83 -410 0 -728
Additions 8,453 32 49,211 8,604 0 66,300
Disposals 3,010 997 22,026 5,620 0 31,653
Transfers 0 0 -412 412 0 0
Currency adjustment -102 0 -7,782 -731 0 -8,615
Dec. 31, 2016 107,917 0 355,296 56,083 0 519,296
Carrying amount, Dec. 31, 2016 177,818 0 189,383 25,955 14,821 407,977
of which finance lease, carrying
amount Dec. 31, 2016 0 0 24,607 6,641 0 31,248
in EUR ’000 Remaining term 2015 Remaining term 2016
under 1 year 1 to 5 years over 5 years Total under 1 year 1 to 5 years over 5 years Total
Minimum lease payments 9,606 13,120 0 22,726 11,235 19,650 332 31,217
Interest portions 661 468 0 1,129 775 803 52 1,630
Present value 8,945 12,652 0 21,597 10,460 18,847 280 29,587

117NOTES ON THE CONSOLIDATED FINANCIAL STATEMENTS 2016
CO
NS
OL
IDA
TE
D F
INA
NC
IAL
STA
TE
ME
NT
S2
01
6
Items of property, plant and equipment have a carrying amount of EUR 92,104 thousand (previous year: EUR 112,090 thousand)
and are subject to encumbrances such as mortgages and chattel mortgages. There are also common restraints on disposal
on leased assets, which are attributable to the Group (finance lease) in accordance with IAS 17 and amount to EUR 31,247
thousand (previous year: EUR 23,858 thousand).
No borrowing costs were capitalized in the financial year (previous year: none). Fixed assets were impaired by a total of EUR
1,068 thousand (previous year: EUR 864 thousand) in the financial year. Of these impairments, EUR 57 thousand (previous
year: EUR 89 thousand) related to the Construction segment, EUR 967 thousand (previous year: EUR 765 thousand) to the
Equipment segment and EUR 44 thousand (previous year: EUR 10 thousand) to the Resources segment. Of the amount, EUR
947 thousand (previous year: EUR 768 thousand) pertained to intangible assets and EUR 121 thousand (previous year: EUR 96
thousand) to property, plant and equipment. The majority of impairments on intangible assets relates to capitalized develop-
ment costs in the amount of EUR 489 thousand at KLEMM Bohrtechnik GmbH and MAT Mischanlagentechnik, branch offices
of BAUER Maschinen GmbH, in the Equipment segment.
The expected market development for various internally developed devices was the key factor in this respect. Impairment
losses on property, plant and equipment pertain to technical equipment and machinery to the amount of EUR 94 thousand
and to company and office equipment to the amount of EUR 2 thousand. The impairments were applied on the basis of the
recoverable amount. For the capitalized development costs, this corresponded with the value in use. A discount rate of 7.00
% (previous year: 7.72 %) was applied in the financial year. The recoverable amount of other non-financial assets regularly
corresponded with the fair value less cost to sell. This method is part of level 1 of the fair value hierarchy stated in IFRS 13.
19.3 Investments recognized using the equity method
The balance sheet approaches of the joint ventures and associated companies developed as follows:
in EUR ’000 Dec. 31, 2015 Dec. 31, 2016
Shares in joint ventures accounted for using the equity method 94,232 92,489
Shares in associated companies accounted for using the equity method 38,321 36,763
Total 132,553 129,252
in EUR ’000 Associated Companies Joint ventures
Cost of purchase/cost of manufacturing 2015 2016 2015 2016
Jan. 1 40,916 40,506 4,175 94,232
Additions 0 3,800 90,863 235
Disposals 0 1,428 1,563 444
Profit/loss attributable 758 -2,347 757 -334
Dividend payments -1,168 -1,583 0 -1,200
Transfers 0 0 0 0
Currency adjustment 0 0 0 0
Dec. 31 40,506 38,948 94,232 92,489
The following table provides an overview of the changes in shares accounted for using the equity method:

118 NOTES ON THE CONSOLIDATED FINANCIAL STATEMENTS 2016
a) Joint ventures
The amounts stated in the financial information for joint ventures are recognized in the annual financial statements prepared in
accordance with local financial reporting standards, corrected by any adjustments to IFRS.
These are the material joint ventures:
Financial year 2015:
BALANCE SHEET
in EUR ’000
SPANTEC Spann-
& Ankertechnik GmbH
BAUER Manufacturing LLC BAUER Deep Drilling GmbH
2015 2016 2015 2016 2015 2016
Non-current assets 5,473 4,641 26,683 28,759 15,504 15,309
Current assets 8,246 9,013 42,037 68,891 52,799 56,108
of which cash and cash equivalents 4,299 1,115 24,676 15,287 34,172 31,416
Total assets 13,719 13,654 68,720 97,650 68,303 71,417
Non-current liabilities 153 0 16 42 495 716
of which non-current financial liabilities 0 0 16 42 23 0
Current liabilities 1,325 1,087 18,671 52,907 17,887 23,073
of which current financial liabilities 0 0 0 0 10 10
Total liabilities 1,478 1,087 18,687 52,949 18,382 23,789
Name Company's
activities
Registered office Capital
share
Valuation method
SPANTEC Spann- & Ankertechnik GmbH Production Schrobenhausen, Germany 40% At equity
BAUER Manufacturing LLC Production Conroe, USA 51% At equity
BAUER Deep Drilling GmbH Production Schrobenhausen, Germany 51% At equity
Name Company's
activities
Registered office Capital
share
Valuation method
SPANTEC Spann- & Ankertechnik GmbH Production Schrobenhausen, Germany 40% At equity
BAUER Manufacturing LLC Production Conroe, USA 51% At equity
BAUER Deep Drilling GmbH Production Schrobenhausen, Germany 51% At equity
Financial year 2016:
Summarized financial information on the material joint ventures (before consolidation):
in EUR ’000 Associated Companies Joint ventures
Accumulated depreciation 2015 2016 2015 2016
Jan. 1 2,185 2,185 0 0
Additions 0 0 0 0
Disposals 0 0 0 0
Transfers 0 0 0 0
Currency adjustment 0 0 0 0
Dec. 31 2,185 2,185 0 0
Carrying amount Dec. 31 38,321 36,763 94,232 92,489

119NOTES ON THE CONSOLIDATED FINANCIAL STATEMENTS 2016
CO
NS
OL
IDA
TE
D F
INA
NC
IAL
STA
TE
ME
NT
S2
01
6
BALANCE SHEET
in EUR ’000
Immaterial joint ventures
Dec. 31, 2015 Dec. 31, 2016
Non-current assets 986 1,246
Current assets 57,402 61,723
of which cash and cash equivalents 2,150 2,182
Total assets 58,388 62,969
Non-current liabilities 0 270
of which non-current financial liabilities 0 270
Current liabilities 52,460 54,478
of which current financial liabilities 29,662 33,530
Total liabilities 52,460 54,748
INCOME STATEMENT
in EUR ’000
SPANTEC Spann-
& Ankertechnik GmbH
BAUER Manufacturing LLC BAUER Deep Drilling GmbH
2015 2016 2015 2016 2015 2016
Sales revenues 5,854 20,467 511 19,111 245 2,333
Scheduled depreciation and amortization -105 -341 -51 -1,453 -81 -1,954
Earnings before interest and tax 1,825 2,079 -248 -7,058 -283 -3,780
Interest income 9 79 0 44 0 0
Interest expense -25 -7 -12 -2 0 -10
Income tax expense -469 -1,323 0 0 79 1,061
Earnings after tax 1,340 3,330 -260 -7,016 -204 -2,729
Other comprehensive income 0 0 0 0 -68 10
Total comprehensive income 1,340 0 -260 -7,016 -272 -2,719
Dividends distributed to the BAUER
Group 0 1,200 0 0 0 0
Non-current and current financial liabilities do not contain any trade payables and provisions.
The amounts stated in the financial information for joint ventures are recognized in the annual financial statements prepared
in accordance with local financial reporting standards, corrected by any adjustments to IFRS.
Summarized financial information on the immaterial joint ventures (before consolidation):

120 NOTES ON THE CONSOLIDATED FINANCIAL STATEMENTS 2016
Non-current and current financial liabilities do not contain any trade payables and provisions.
INCOME STATEMENT
in EUR ’000
Immaterial joint ventures
2015 2016
Sales revenues 64,418 87,315
Scheduled depreciation and amortization -2,141 -507
Earnings before interest and tax 1,884 4,070
Interest income 9 0
Interest expense -53 -53
Income tax expense -20 -34
Earnings after tax 1,820 3,983
Dividends distributed to the BAUER Group 0 0
Reconciliation to the summarized financial information on joint ventures
The proportional carrying amount of the joint ventures can be offset and reconciled as follows:
Financial year 2015:
in EUR ’000 SPANTEC Spann- &
Ankertechnik GmbH
BAUER
Manufacturing LLC
BAUER
Deep Drilling GmbH
Immaterial
joint ventures
Net assets of joint ventures 12,241 50,032 49,921 5,941
Share in joint ventures according
to investment quota 4,897 25,516 25,460 3,293
Goodwill and other adjustments 5,839 18,724 10,500 3
Carrying amount reported
in the balance sheet 10,736 44,240 35,960 3,296
in EUR ’000 SPANTEC Spann- &
Ankertechnik GmbH
BAUER
Manufacturing LLC
BAUER
Deep Drilling GmbH
Immaterial
joint ventures
Net assets of joint ventures 12,567 44,700 47,628 8,735
Share in joint ventures according
to investment quota 5,027 22,798 24,290 4,647
Goodwill and other adjustments 5,841 19,606 10,278 2
Carrying amount reported
in the balance sheet 10,868 42,404 34,568 4,649
Financial year 2016:

121NOTES ON THE CONSOLIDATED FINANCIAL STATEMENTS 2016
CO
NS
OL
IDA
TE
D F
INA
NC
IAL
STA
TE
ME
NT
S2
01
6
Fair values of material joint ventures:
Name Company’s
activities
Registered
office
Capital share
Wöhr + Bauer GmbH Project development Munich, Germany 33.33 %
NDH Entsorgungsbetreibergesellschaft mbH Disposal Bleicherode, Germany 25.00 %
TERRABAUER S. L.Specialist foundation
engineeringMadrid, Spain 30.00 %
BAUER Nimr LLCWater treatment
and soil remediation
Maskat, Al Mina,
Sultanate of Oman49.00 %
Name Company’s
activities
Registered
office
Capital share
NDH Entsorgungsbetreibergesellschaft mbH Disposal Bleicherode, Germany 25.00 %
TERRABAUER S. L.Specialist foundation
engineeringMadrid, Spain 30.00 %
BAUER Nimr LLCWater treatment
and soil remediation
Maskat, Al Mina,
Sultanate of Oman52.50 %
in EUR ‘000 Dec. 31, 2015 Dec. 31, 2016
SPANTEC Spann- & Ankertechnik GmbH 25,500 25,500
BAUER Manufacturing LLC 86,429 86,429
BAUER Deep Drilling GmbH 70,714 70,714
These Fair values are based on data of the financial year 2015.
We did not state the fair value of our immaterial joint ventures as there is no listed market price.
The risk arising from the joint and several liability in the case of a shareholder defaulting is secured by mutual guarantees issued
within the joint venture. There are no other obligations or material restrictions.
b) Associated companies
The amounts stated in the financial information for associated companies are recognized in the annual financial statements
prepared in accordance with local financial reporting standards, corrected by any adjustments to IFRS.
These are the material associated companies:
Financial year 2015:
Financial year 2016:
BAUER Nimr LLC is classified as an associated company despite having a majority of voting rights because it cannot assert
control over business and financial policy under the partnership agreement.

122 NOTES ON THE CONSOLIDATED FINANCIAL STATEMENTS 2016
Summarized financial information for all associated companies (amounts before consolidation):
BALANCE SHEET
in EUR ’000
Wöhr + Bauer GmbH NDH Entsorgungsbe-
treibergesellschaft mbH
TERRABAUER S. L. BAUER Nimr LLC
Dec. 31, 2015 Dec. 31, 2016 Dec. 31, 2015 Dec. 31, 2016 Dec. 31, 2015* Dec. 31, 2016 Dec. 31, 2015 Dec. 31, 2016
Non-current assets 56,795 - 17,040 15,731 - - 43,074 41,423
Current assets 101,161 - 28,532 30,640 - - 11,660 19,048
of which cash
and cash equivalents2,275 - 24,098 23,836 - - 2,013 9,400
Total assets 157,956 - 45,572 46,371 - - 54,734 60,471
Non-current liabilities 87,658 - 0 0 - - 36,563 34,570
of which non-current
financial liabilities 36,125 - 0 0 - - 22,146 34,167
Current liabilities 53,706 - 41,056 41,704 - - 8,560 7,979
of which current
financial liabilities 35,980 - 2,833 2,860 - - 2,845 3,161
Total liabilities 141,364 - 41,056 41,704 - - 45,123 42,549
* Financial information was unavailable on the balance sheet date
INCOME STATEMENT
in EUR ’000
Wöhr + Bauer GmbH NDH Entsorgungsbe-
treibergesellschaft mbH
TERRABAUER S. L. BAUER Nimr LLC
2015 2016 2015 2016 2015 * 2016 2015 2016
Sales revenues 17,217 - 22,951 21,162 - - 11,026 17,720
Scheduled depreciation
and amortization-1,924 - -3,223 -3114 - - -242 -423
Earnings before
interest and tax -2,700 - 1,451 1,222 - - 5,725 6,013
Interest income 2 - 52 14 - - 2,148 1,961
Interest expense -927 - -271 -404 - - -3,209 -2,872
Income tax expense 1,372 - -648 -315 - - -699 -722
Earnings after tax -2,322 - 584 517 - - 3,965 4,380
Earnings after tax
in proportion to sharp -774 - 146 129 - - 1,943 2,416
Other comprehensive income 0 - 0 0 - - 0 0
Total comprehensive income -2,322 - 584 517 - - 3,965 4,380
Dividends distributed to the
BAUER Group 100 - 247 146 - - 821 1,437
* Financial information was unavailable on the balance sheet date

123NOTES ON THE CONSOLIDATED FINANCIAL STATEMENTS 2016
CO
NS
OL
IDA
TE
D F
INA
NC
IAL
STA
TE
ME
NT
S2
01
6
Summarized financial information for associated companies, which are immaterial on their own (amounts before consolidation):
BALANCE SHEET
in EUR ’000
Immaterial associated companies
Dec. 31, 2015 Dec. 31, 2016
Non-current assets 51 55
Current assets 228 259
of which cash and cash equivalents 4 9
Total assets 279 314
Non-current liabilities 18 22
of which non-current financial liabilities 0 0
Current liabilities 130 125
of which current financial liabilities 0 0
Total liabilities 148 147
INCOME STATEMENT
in EUR ’000
Immaterial associated companies
Dec. 31, 2015 Dec. 31, 2016
Sales revenues 853 785
Scheduled depreciation and amortization -24 -25
Earnings before interest and tax 9 42
Interest income 0 0
Interest expense -2 -2
Income tax expense 0 -4
Earnings after tax 7 36
Earnings after tax for the period in proportion to share 2 11
Dividends distributed to the BAUER Group 0 0
Offsetting and reconciliation to the summarized financial information on associated companies
The proportional carrying amount of the associated companies can be offset and reconciled as follows:
Financial year 2015:
in EUR ’000 Wöhr + Bauer
GmbH
NDH Entsorgungsbe-
treibergesellschaft mbH
BAUER
Nimr LLC
Immaterial
associated companies
Net assets of associated companies 16,592 4,516 9,611 131
Share in associated companies
according to investment quota 5,530 1,129 4,710 39
Goodwill and other adjustments -17 0 16,904 1
Cash value of concession arrangement 0 0 8,162 0
Currency adjustment 0 0 1,863 0
Carrying amount reported
in the balance sheet 5,513 1,129 31,639 40

124 NOTES ON THE CONSOLIDATED FINANCIAL STATEMENTS 2016
Financial year 2016:
in EUR ’000 Participations
Cost of purchase/cost of manufacturing 2015 2016
Jan. 1 4,429 4,429
Additions 0 9,662
Disposals 0 11
Profit/loss attributable 0 0
Dividend payments 0 0
Transfers 0 -230
Currency adjustment 0 0
Dec. 31 4,429 13,850
in EUR ’000 Participations
Accumulated depreciation 2015 2016
Jan. 1 816 816
Additions 0 3,304
Disposals 0 0
Transfers 0 0
Currency adjustment 0 0
Dec. 31 816 4,120
Carrying amount Dec. 31 3,613 9,730
in EUR ’000 NDH Entsorgungsbe-
treibergesellschaft mbH
BAUER
Nimr LLC
Immaterial
joint ventures
Net assets of associated companies 4,667 17,922 167
Share in associated companies
according to investment quota 1,167 9,409 50
Goodwill and other adjustments -55 16,651 0
Cash value of concession arrangement 0 7,615 0
Currency adjustment 0 1,926 0
Carrying amount reported in the balance sheet 1,112 35,601 50
The other adjustments pertain to temporal differences in reporting.
There were no obligations and material restrictions or risks with regard to the shares in associated companies on the balance
sheet date.
19.4 Participations
The gain in investment impairments relates to equity interests for which there is no active market and which are categorized as
“available for sale.” In the financial year, investments in the amount of EUR 3,304 thousand (previous year: 0) were impaired.
The impairment loss resulted from the difference between the carrying amount of the investment and the present value of the
expected future cash flows.
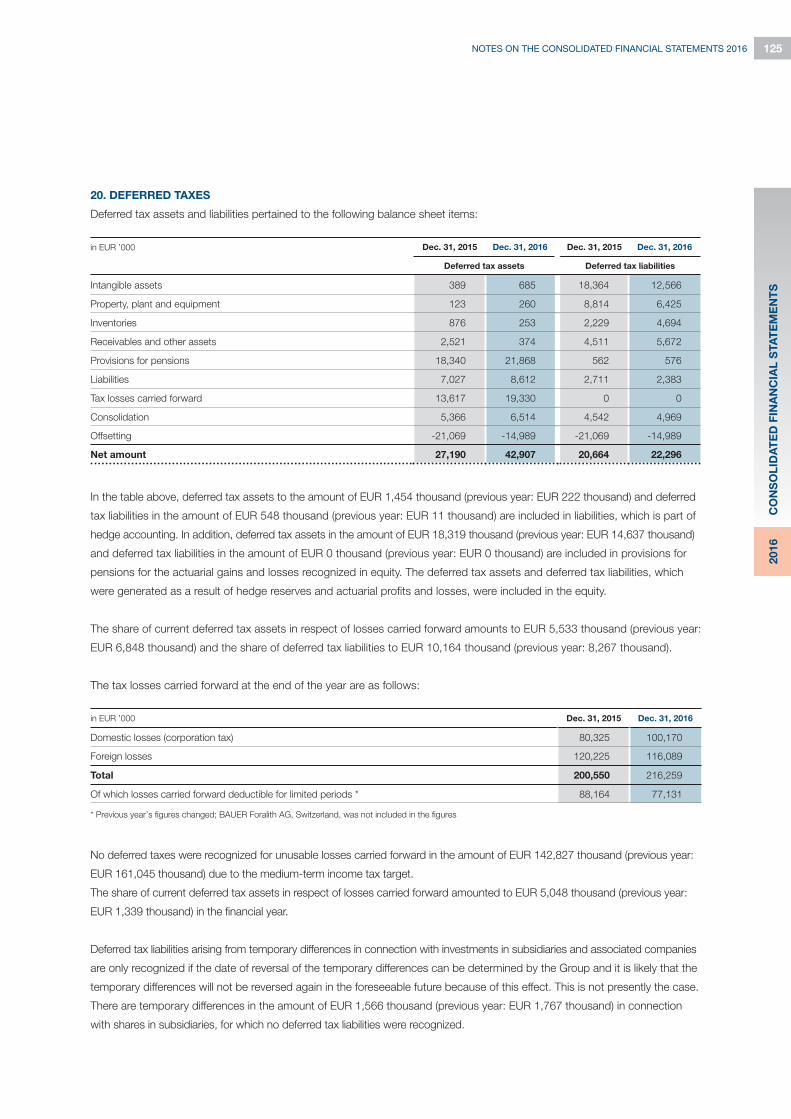
125NOTES ON THE CONSOLIDATED FINANCIAL STATEMENTS 2016
CO
NS
OL
IDA
TE
D F
INA
NC
IAL
STA
TE
ME
NT
S2
01
6
in EUR ’000 Dec. 31, 2015 Dec. 31, 2016
Domestic losses (corporation tax) 80,325 100,170
Foreign losses 120,225 116,089
Total 200,550 216,259
Of which losses carried forward deductible for limited periods * 88,164 77,131
20. DEFERRED TAXES
Deferred tax assets and liabilities pertained to the following balance sheet items:
in EUR ’000 Dec. 31, 2015 Dec. 31, 2016 Dec. 31, 2015 Dec. 31, 2016
Deferred tax assets Deferred tax liabilities
Intangible assets 389 685 18,364 12,566
Property, plant and equipment 123 260 8,814 6,425
Inventories 876 253 2,229 4,694
Receivables and other assets 2,521 374 4,511 5,672
Provisions for pensions 18,340 21,868 562 576
Liabilities 7,027 8,612 2,711 2,383
Tax losses carried forward 13,617 19,330 0 0
Consolidation 5,366 6,514 4,542 4,969
Offsetting -21,069 -14,989 -21,069 -14,989
Net amount 27,190 42,907 20,664 22,296
In the table above, deferred tax assets to the amount of EUR 1,454 thousand (previous year: EUR 222 thousand) and deferred
tax liabilities in the amount of EUR 548 thousand (previous year: EUR 11 thousand) are included in liabilities, which is part of
hedge accounting. In addition, deferred tax assets in the amount of EUR 18,319 thousand (previous year: EUR 14,637 thousand)
and deferred tax liabilities in the amount of EUR 0 thousand (previous year: EUR 0 thousand) are included in provisions for
pensions for the actuarial gains and losses recognized in equity. The deferred tax assets and deferred tax liabilities, which
were generated as a result of hedge reserves and actuarial profits and losses, were included in the equity.
The share of current deferred tax assets in respect of losses carried forward amounts to EUR 5,533 thousand (previous year:
EUR 6,848 thousand) and the share of deferred tax liabilities to EUR 10,164 thousand (previous year: 8,267 thousand).
The tax losses carried forward at the end of the year are as follows:
* Previous year’s fi gures changed; BAUER Foralith AG, Switzerland, was not included in the fi gures
No deferred taxes were recognized for unusable losses carried forward in the amount of EUR 142,827 thousand (previous year:
EUR 161,045 thousand) due to the medium-term income tax target.
The share of current deferred tax assets in respect of losses carried forward amounted to EUR 5,048 thousand (previous year:
EUR 1,339 thousand) in the financial year.
Deferred tax liabilities arising from temporary differences in connection with investments in subsidiaries and associated companies
are only recognized if the date of reversal of the temporary differences can be determined by the Group and it is likely that the
temporary differences will not be reversed again in the foreseeable future because of this effect. This is not presently the case.
There are temporary differences in the amount of EUR 1,566 thousand (previous year: EUR 1,767 thousand) in connection
with shares in subsidiaries, for which no deferred tax liabilities were recognized.

126 NOTES ON THE CONSOLIDATED FINANCIAL STATEMENTS 2016
21. OTHER NON-CURRENT ASSETS
The other non-current assets comprise the following items:
in EUR ’000 Dec. 31, 2015 Dec. 31, 2016
Claims from backup insurance 4,550 4,459
Sundry other non-current assets 3,172 3,797
Total 7,722 8,256
in EUR ’000 Remaining term Dec. 31, 2015 Remaining term Dec. 31, 2016
1 to 5 years over 5 years 1 to 5 years over 5 years
Sundry other non-current financial assets 1,565 10,550 3,403 11,288
Shares in non-consolidated subsidiaries 3,240 0 3,721 0
Total 4,805 10,550 7,124 11,288
The additional other non-current assets did not incur any interest in the financial and previous year.
They also include assets arising from continuing involvements totaling EUR 1,269 thousand (previous year: EUR 1,537 thousand).
As in the previous year, the other non-current assets were neither impaired nor overdue in the year under review.
Within BAUER Group, trade receivables and services in the amount of EUR 16,032 thousand (previous year: EUR 16,263
thousand) were sold to third parties within the scope of receivables sales agreements. Continuing involvement comprises the
maximum amount of the remaining risk, consisting of late payment and default risks, which the BAUER Group would have to
pay to the buyer.
The corresponding liability amounts to EUR 1,396 thousand (previous year: EUR 1,691 thousand), and is stated under “Other
non-current liabilities.” The difference reflects the fair value of the guarantees resulting from the remaining risk and the servicing,
and is recognized in net income.
22. OTHER NON-CURRENT FINANCIAL ASSETS
The other non-current financial assets comprise the following:
The additional other non-current assets contain receivables from derivatives and other non-current financial assets The derivatives
are presented in item 37 under “Other disclosures.” The item also contains a loan receivable from BAUER Nimr LLC in the amount
of EUR 10,874 thousand (previous year: EUR 10,550 thousand). As in the previous year, the other non-current financial assets
were neither impaired nor overdue in the year under review. Non-consolidated subsidiaries do not include non-listed companies
for which there is no active market. They are recognized as acquisitions costs. There were no disposals of non-listed companies
in the year under review nor in the previous year. Depreciation totaled EUR 905 thousand (previous year: EUR 162 thousand)
during the financial year.

127NOTES ON THE CONSOLIDATED FINANCIAL STATEMENTS 2016
CO
NS
OL
IDA
TE
D F
INA
NC
IAL
STA
TE
ME
NT
S2
01
6
CURRENT ASSETS
23. INVENTORIES
The inventories comprise the following items:
in EUR ’000 Dec. 31, 2015 Dec. 31, 2016
Raw materials and supplies 155,718 151,489
Finished goods and work in progress and stock for trade 288,911 295,837
Total 444,629 447,326
in EUR ’000 Dec. 31, 2015 Dec. 31, 2016
Write-downs of inventories due to use 13,195 15,532
Impairment losses on inventories 12,149 9.584
Total 25,344 25.116
Of the inventories, EUR 138,887 thousand (previous year: EUR 144,066 thousand) are stated at net realizable value. The
impairment losses on inventories against the net realizable value affecting net expenditure in the financial year totaled EUR 25,116
thousand (previous year: EUR 25,344 thousand).
They are divided up as follows:
The rate of hire during the financial year was higher than in the previous year. Write-downs of used machinery due to use therefore
increased from EUR 13,195 thousand to EUR 15,532 thousand. Inventory decreased at the end of the financial year due to
the sale of leased machines to consumers.
The impairment losses on inventories include both impairment losses on new and used machinery (stated under “Changes
in inventories”) and on warehouse inventories (stated under “Cost of materials”). Most of the impairment losses relate to the
machinery which was not hired out, and are attributable to the Equipment segment. The impairments were applied on the
basis of the recoverable amount. This regularly corresponded to the fair value less cost to sell. This method is part of level 1
of the fair value hierarchy stated in IFRS 13.
The finished goods and stock for trade include machinery and accessories produced internally by the Equipment segment
and intended primarily for sale.
We differentiate essentially between two forms of machinery and accessories (referred to in the following as “machinery”):
New machines
These are machines manufactured in the financial year or in earlier years which are available for sale but have not yet been
hired out. These machines are valued at manufacturing cost or at the lower net realizable value on the balance sheet date.
Used machines
Used machines are machines which are primarily up for sale and which have been temporarily hired out as a secondary
sales promotion measure during the financial year or in earlier years. New machines automatically become used machines
the first time they are hired out.
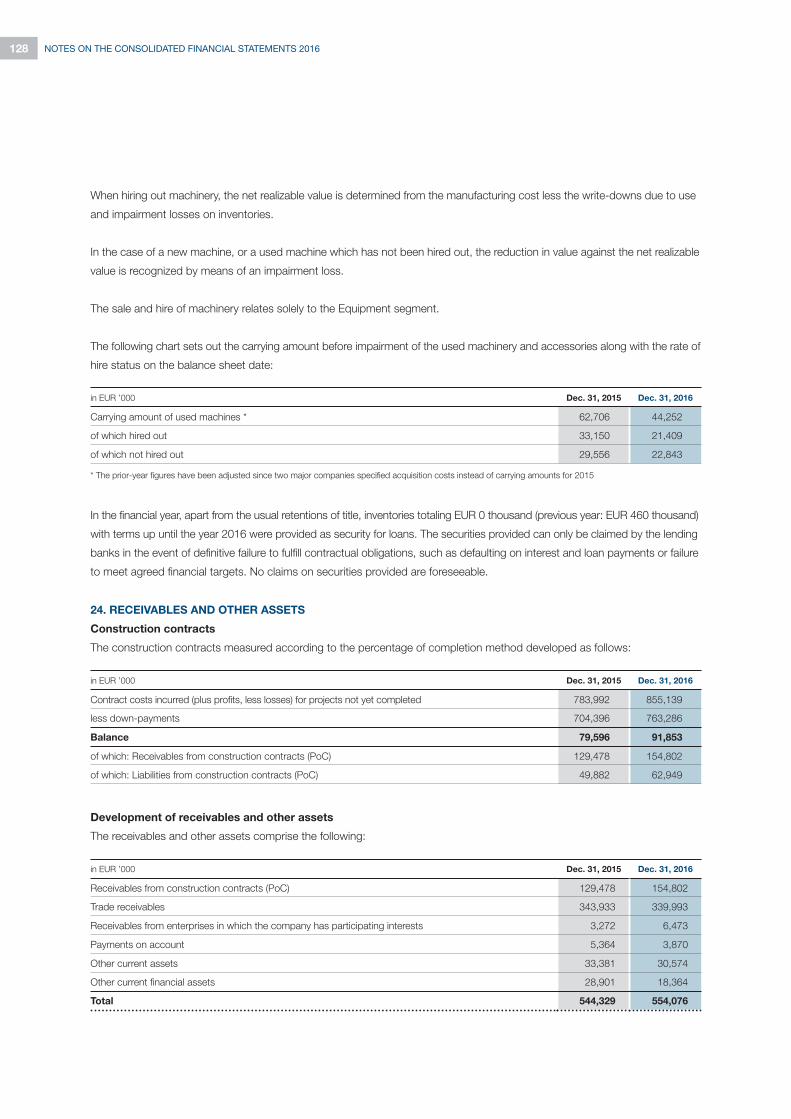
128 NOTES ON THE CONSOLIDATED FINANCIAL STATEMENTS 2016
When hiring out machinery, the net realizable value is determined from the manufacturing cost less the write-downs due to use
and impairment losses on inventories.
In the case of a new machine, or a used machine which has not been hired out, the reduction in value against the net realizable
value is recognized by means of an impairment loss.
The sale and hire of machinery relates solely to the Equipment segment.
The following chart sets out the carrying amount before impairment of the used machinery and accessories along with the rate of
hire status on the balance sheet date:
in EUR ’000 Dec. 31, 2015 Dec. 31, 2016
Carrying amount of used machines * 62,706 44,252
of which hired out 33,150 21,409
of which not hired out 29,556 22,843
in EUR ’000 Dec. 31, 2015 Dec. 31, 2016
Contract costs incurred (plus profits, less losses) for projects not yet completed 783,992 855,139
less down-payments 704,396 763,286
Balance 79,596 91,853
of which: Receivables from construction contracts (PoC) 129,478 154,802
of which: Liabilities from construction contracts (PoC) 49,882 62,949
in EUR ’000 Dec. 31, 2015 Dec. 31, 2016
Receivables from construction contracts (PoC) 129,478 154,802
Trade receivables 343,933 339,993
Receivables from enterprises in which the company has participating interests 3,272 6,473
Payments on account 5,364 3,870
Other current assets 33,381 30,574
Other current financial assets 28,901 18,364
Total 544,329 554,076
* The prior-year fi gures have been adjusted since two major companies specifi ed acquisition costs instead of carrying amounts for 2015
In the financial year, apart from the usual retentions of title, inventories totaling EUR 0 thousand (previous year: EUR 460 thousand)
with terms up until the year 2016 were provided as security for loans. The securities provided can only be claimed by the lending
banks in the event of definitive failure to fulfill contractual obligations, such as defaulting on interest and loan payments or failure
to meet agreed financial targets. No claims on securities provided are foreseeable.
24. RECEIVABLES AND OTHER ASSETS
Construction contracts
The construction contracts measured according to the percentage of completion method developed as follows:
Development of receivables and other assets
The receivables and other assets comprise the following:

129NOTES ON THE CONSOLIDATED FINANCIAL STATEMENTS 2016
CO
NS
OL
IDA
TE
D F
INA
NC
IAL
STA
TE
ME
NT
S2
01
6
The “Trade receivables” balance sheet item includes long-term receivables totaling EUR 5,942 thousand (previous year:
EUR 8,845 thousand).
The following table presents the changes in valuation allowances to current receivables:
in EUR ’000 Carrying amount
Dec. 31, 2015
Carrying amount
Dec. 31, 2016
Trade receivables (gross carrying amount) 358,443 352,013
Valuation allowance in respect of trade receivables 14,510 12,020
Trade receivables (net carrying amount)
of which neither impaired nor overdue at closing date
of which not impaired at closing date and overdue in the following time bands:
343,933
4,198
120,009
339,993
13,484
106,832
- less than 30 days 39,841 30,539
- between 30 and 60 days 11,737 8,116
- between 60 and 90 days 4,273 5,595
- more than 90 days 64,158 62,582
in EUR ’000 Dec. 31, 2015 * Dec. 31, 2016
Valuation allowance at start of financial year 9,671 14,510
Change in basis of consolidation 0 858
Currency adjustment 576 40
Allocation 10,764 9,886
Reversal 4,883 8,156
Consumption 1,618 5,117
Valuation allowance at end of financial year 14,510 12,020
* Previous year fi gures adjusted; correction valuation allowance of the construction segment
The valuation allowance for doubtful trade receivables of EUR 12,020 thousand (previous year: EUR 14,510 thousand) was
calculated taking into account individual risks and on the basis of past experience in relation to payment default. Value adjustments
were applied in respect of individual claims as well as on a portfolio flat-rate basis. The individual value adjustments were
translated into flat-rate percentages spread across the age structure of the receivables. The determination of valuation allowances
for uncertain receivables primarily bases on estimates and evaluations of individual claims, incorporating considerations of
the creditworthiness and late-payment record of the customer concerned as well as current economic trends and historical
experience in relation to default.
No receivables from construction contracts were impaired in the financial year (previous year: none).
The following table presents an analysis of the due dates of gross carrying amounts of trade receivables:
The above table includes trade receivables as well as receivables from joint ventures. With regard to the trade receivables which
were neither impaired nor delayed in payment, there were no indications at the balance sheet date that the debtors concerned
will not fulfill their payment obligations. Credit ratings are derived from an active system of claims management with reference to
the relevant credit history and from continuous monitoring of the creditworthiness of our customers based on information obtained
from both internal and external sources. Other current assets were neither impaired nor overdue in the year under review. Other
current assets mainly comprise miscellaneous tax refund claims and claims against employees and against welfare benefit funds
as well as accrued interest and insurance premiums and other prepayments and deferred charges.

130 NOTES ON THE CONSOLIDATED FINANCIAL STATEMENTS 2016
A total of EUR 87 thousand (previous year: EUR 83 thousand) monetary assets were deposited as collateral for potential future
warranties for construction activities. The current portion of the receivables from foreign exchange forward contracts included
in the current financial assets in the financial year totaled EUR 661 thousand (previous year: EUR 2,853 thousand).
In financial year 2016, total impairments amounted to EUR 25,774 thousand (previous year: EUR 14,356 thousand). Contained
in this are EUR 15,888 thousand (previous year: EUR 3,592 thousand) of impairments for uncollectable receivables.
25. CASH AND CASH EQUIVALENTS
The cash and cash equivalents totaling EUR 33,463 thousand (previous year: EUR 47,406 thousand) include credit balances
at banks and petty cash stocks.
26. ASSETS CLARIFIED FOR SALE
Assets held for sale amounted to EUR 19,608 thousand as of December 31, 2016 (previous year: 0). These include technical
equipment and machinery that are allocated to the Resources segment as well as accessories that can no longer be used
for future orders in the oil and gas sector. The sale is expected to be completed in the first half of 2017. The reclassification
of technical equipment and machinery to assets held for sale did not have any impact on the net assets, financial position or
earnings position.
27. SHAREHOLDERS’ EQUITY
The shareholder structure of BAUER AG is as follows:
in EUR ’000 Dec. 31, 2015 Dec. 31, 2016
% EUR '000 % EUR '000
Bauer family 48.19 35,182 48.19 35,182
Free float 51.81 37,819 51.81 37,819
Total 100.00 73,001 100.00 73,001
Please refer to the Notes to the Financial Statements of BAUER AG (published in the Federal Gazette (Bundesanzeiger)) on
December 31, 2016 for reports on the participations in BAUER AG.
Composition of subscribed capital
The subscribed capital (share capital) of BAUER AG amounts to EUR 73,001,420.45 and is divided into 17,131,000 no-nominal-
value bearer shares, representing a pro-rata amount of approximately EUR 4.26 per share of the total share capital. The shares
have no nominal value. Each share entails equal rights, and entitles the holder to one vote at the Annual General Meeting, with
the exception of share categories precluded from voting by law pursuant to section 136 of the German Stock Corporation Act
(AktG) and section 28 of the German Securities Trading Act (WpHG).
As in the previous year, 51.81 % of the shares were in free float. The members of the Bauer family and a charitable foundation own
a total of 8,256,246 no-nominal-value shares in BAUER AG on the basis of a pool agreement, representing a 48.19 % share in
the company. The pool agreement provisions include binding voting commitments as well as a right of pre-emption of pool
participants if any member of the pool sells shares to third parties. No other direct or indirect holdings of BAUER AG share
capital exceeding 10 % of the voting rights are known to the company.
None of the shareholders have special rights entailing controlling powers. Nor does any voting rights control exist on the part
of the employees holding shares in the capital.

131NOTES ON THE CONSOLIDATED FINANCIAL STATEMENTS 2016
CO
NS
OL
IDA
TE
D F
INA
NC
IAL
STA
TE
ME
NT
S2
01
6
Authority of the Management Board to issue or buy back shares
Section 4, subsection 4 of the company’s Articles of Association authorizes the Management Board, with the consent of the
Supervisory Board, to increase the share capital once or more than once up to June 22, 2021 by up to a total of EUR 7.3 million
by the issue of no-nominal-value shares against cash and/or non-cash contributions. To that end, the Management Board is
authorized, with the consent of the Supervisory Board, to exclude the legal subscription rights of shareholders in the following
cases:
• in the case of capital increases in return for non-cash contributions, particularly for the purpose of acquiring companies,
parts of companies, investments in companies and other assets or claims for the acquisition of assets, including receivables
from companies or their group companies, or for the purpose of company mergers;
• in the event of capital increases against cash contributions where the issue amount of the new shares issued is not materially
below the market price of the already quoted shares at the time of definitive setting of the issue price and the shares issued
excluding shareholders’ subscription rights pursuant to section 186, subsection 3, clause 4 AktG do not in total exceed 10 %
of the existing share capital either at the time this authority takes effect or at the time of exercising this authority. Shares which
have been or are to be sold or issued in direct or corresponding application of
section 186, subsection 3, clause 4 AktG while this authority is in place until such time as it is exercised, pursuant to other
authorities, excluding subscription rights, are to be set off against the said 10 % limit;
• to compensate fractional amounts resulting during capital increases in return for cash and/or non-cash contributions due to
the subscription ratio,
• to implement so-called scrip dividends where shareholders are offered an option to pay in their dividend entitlement (in full or
part thereof) as non-cash contribution in return for the issuance of new shares from the approved capital 2016.
The Supervisory Board is authorized to amend Article 4 of the Articles of Association accordingly following complete or partial
execution of the increase in share capital or on expiration of the period of authority.
By resolution of the Ordinary Annual General Meeting held on June 26, 2014, the company was authorized to acquire treasury
stock, over a limited period up to June 25, 2019, representing up to a total of 10 % of the company’s share capital at the time
the resolution was passed. The shares shall be acquired at the discretion of the Management Board by means of a public tender
offer or by way of the stock market. If the acquisition is effected by way of the stock market, the acquisition price (excluding
ancillary costs) may be no more than 10 % above or 20 % below the price determined by the opening auction on the trading
day for shares in the company in Xetra trading (or a comparable successor system) on the Frankfurt Stock Exchange. that if
the acquisition is effected by means of a public tender offer, the purchase price or the limits of the purchase price span per
share (excluding ancillary costs) may be no more than 10 % above or 20 % below the average of the closing prices per share
in the company in Xetra trading (or a comparable successor system) on the Frankfurt Stock Exchange on the three trading
days prior to the day of issue of the public tender offer. If not insignificant variations of the decisive share price occur after
the day of issue of the public tender offer, the purchase price may be adjusted.
The Management Board shall be authorized to appropriate shares in the company acquired pursuant to the above authorizations
for all legally admissible purposes. Consequently, the acquired shares may also in particular be sold by means other than by way
of the stock market or by means of an offer to the shareholders, if the shares are sold for cash at a price (excluding ancillary
costs) not materially below the stock market price of shares of the company carrying the same rights at the time of the sale in
Xetra trading (or a comparable successor system). The shares may also be transferred to third parties, provided this is done for
the purpose of acquiring companies, parts in companies or investments in companies or other assets or effecting company
mergers.

132 NOTES ON THE CONSOLIDATED FINANCIAL STATEMENTS 2016
The aforementioned shares may be withdrawn without need of a further resolution by the Annual General Meeting. With regard
to use of the bought-back shares, the authorization provides, in specific cases, for legal rights of subscription of shareholders
to be excluded. The facility to acquire treasury stock has not been utilized to date.
The remaining equity of the BAUER Group developed as follows:
in EUR ’000 Dec. 31, 2015 Dec. 31, 2016
I. Capital reserve 38,404 38,404
II. Other revenue reserves and unappropriated net profit 327,437 318,462
365,841 356,866
III. Non-controlling interests 12,368 4,264
Total 378,209 361,130
In the financial year a dividend of EUR 0.15 (previous year: EUR 0.15) per share was paid to the shareholders.
Capital reserve
The capital reserve essentially comprises amounts that exceeded the book value of the nominal value when shares were issued,
as well as expenses for the issue of shares.
Other revenue reserves and unappropriated net profit
Other revenue reserves and unappropriated net profit include past earnings of the companies included in the consolidated
financial statements, insofar as they were not distributed. In addition, revaluations of liabilities from benefits to employees after
termination of employment totaling EUR -66,042 thousand (previous year: EUR -53,311 thousand) and related deferred taxes
with no effect on profit and loss totaling EUR 18,568 thousand (previous year: EUR 14,964 thousand) were recognized in
Revenue reserves.
This line item also includes cumulative differences from the translation of financial statements for foreign subsidiaries with no
effect on profit and loss totaling EUR 3,962 thousand (previous year: EUR 10,909 thousand) and cumulative gains from the
switch to IFRS of EUR 10,387 thousand (previous year: EUR 10,387 thousand).
This line item also includes the cumulative effects of the valuation of derivative financial instruments not affecting profit and
loss (reserves from hedging transactions) totaling EUR -1,922 thousand (previous year: EUR -1,224 thousand). The hedging
transactions reserve includes the effective portion of the changes in the value of derivatives that were designated in a cash
flow hedge.

133
CO
NS
OL
IDA
TE
D F
INA
NC
IAL
STA
TE
ME
NT
S2
01
6
NOTES ON THE CONSOLIDATED FINANCIAL STATEMENTS 2016
in EUR ’000
Non-controlling interests
Dec. 31, 2015 Dec. 31, 2016
Group company
Share-
holding
in %
Sharehold-
ing in EUR
'000
Profit/loss
attributable
in EUR '000
Share-
holding
in %
Sharehold-
ing in
EUR '000
Profit/loss
attributable
in EUR '000
BAUER EGYPT S.A.E., Cairo, Egypt Various natural persons 44.25 13,068 2,584 44.25 7,312 3,371
BAUER Casings Makina Sanayi ve Ticaret
Limited Sirketi, Ankara, TurkeyEmiroglu Makina
40.00 1,278 303 40.00 1,328 358
Site Group for Services and Well Drilling Ltd.
Co., Amman, JordanOweis family
16.67 -7,218 -2,376 16.67 -8,693 -1,412
Individual immaterial subsidiaries with
non-controlling interests 5,240 -1,234 4,317 795
Total 12,368 -723 4,264 3,112
BALANCE SHEET
in EUR ’000
BAUER Casings BAUER EGYPT S.A.E. Site Group
Dec. 31, 2015 Dec. 31, 2016 Dec. 31, 2015 Dec. 31, 2016 Dec. 31, 2015 Dec. 31, 2016
Non-current assets 578 2,321 8,431 5,258 21,502 18,605
Current assets 3,078 3,516 31,267 18,794 73,318 82,733
Non-current liabilities 59 1,840 136 375 0 0
Current liabilities 401 670 10,031 6,948 96,225 103,249
INCOME STATEMENT
in EUR ’000
BAUER Casings BAUER EGYPT S.A.E. Site Group
2015 2016 2015 2016 2015 2016
Sales revenues 4,264 4,864 37,182 41,898 10,377 30,218
Earnings before interest and tax 949 1,189 7,291 9,963 -9,162 -2,174
Earnings before tax 950 1,120 8,075 10,759 -14,465 -8,032
Earnings after tax 759 895 5,841 7,618 -14,664 -8,486
Profit/loss attributable to non-controlling interests 303 358 2,584 3,371 -2,376 -1,412
Profit/loss attributable to shareholders of BAUER AG 456 537 3,257 4,247 -12,288 -7,074
Dividends distributed to non-controlling interest -87 -86 -446 -518 0 0
27.1 Non-controlling interests
a) Details on the not wholly owned subsidiaries in which material non-controlling interests are held
These are the material non-controlling interests of BAUER Group:
The previous year’s financial statements separately stated BAUER Maschinen GmbH, BAUER-DE WET EQUIPMENT
(PROPRIETARY) LIMITED and PRAKLA Bohrtechnik GmbH with a share in capital of EUR 1,010 thousand and a share in
earnings of EUR -1,410 thousand.
Below is the summarized financial information for each Group company with material non-controlling interests corresponding
to the amounts before Group-internal elimination:

134
b) Changes in shareholdings in the Group’s subsidiaries
On December 12, 2016, BAUER Maschinen GmbH purchased the remaining 10 % of the shares in PRAKLA Bohrtechnik GmbH.
As a result, the shares of BAUER Maschinen GmbH in PRAKLA Bohrtechnik GmbH are 100 %. Shares with a value of EUR 400
thousand (share in the carrying amount of the net assets of PRAKLA Bohrtechnik GmbH) were transferred to BAUER Maschinen
GmbH in the process. The transferred shares were included in Revenue reserves (after being offset with the amount by which
the non-controlling interests were adjusted) in the amount of EUR 69 thousand. On December 20, 2016, BAUER Maschinen
GmbH surrendered and transferred 85 % of its shares in KLEMM Bohrtechnik GmbH to PRAKLA Bohrtechnik GmbH by means
of a capital increase against non-cash contributions. BAUER Maschinen GmbH has retained 15 % of the shares in KLEMM
Bohrtechnik GmbH.
As of August 24, 2016, BAUER Aktiengesellschaft acquired the remaining 1 % of the shares in BAUER Maschinen GmbH, BAUER
Spezialtiefbau GmbH, BAUER Resources GmbH, SCHACHTBAU NORDHAUSEN GmbH and SPESA Spezialbau und Sanierung
GmbH from BAUER Anteilspool GbR or BAUER Handelsgesellschaft. This means that BAUER Aktiengesellschaft holds a 100 %
share in each of these companies as of August 24, 2016. Shares with a value of EUR 2,565 thousand (share in the carrying
amount of the net assets of the aforementioned companies) were transferred to BAUER Aktiengesellschaft in the process.
The transferred shares were included in Revenue reserves (after being offset with the amount by which the non-controlling
interests were adjusted) in the amount of EUR 249 thousand.
27.2 Additional disclosures regarding capital management
The object of Bauer’s capital management is to safeguard a strong financial profile. In particular, it aims to provide shareholders
with appropriate dividend payments and to safeguard servicing of capital on behalf of lenders. We also aim to provide ourselves
with adequate financial resources to sustain our growth strategy. The risk profile is actively managed and monitored. This is
focused primarily on key indicators such as the equity ratio, net debt and net result for the period for the period.
The key indicators are presented below:
NOTES ON THE CONSOLIDATED FINANCIAL STATEMENTS 2016
in EUR ’000 Dec. 31, 2015 Dec. 31, 2016
Equity 451,210 434,131
Equity ratio 27.23 % 25.52 %
Earnings after tax 28,992 14,414
Net debt 664,988 676,898
Financial indebtedness 712,394 710,361
Liquid funds 47,406 33,463
Net debt / EBITDA 3.59 4.27
EBITDA / net interest coverage 4.99 4.24
CASH FLOW STATEMENT
in EUR ’000
BAUER Casings BAUER EGYPT S.A.E. Site Group
2015 2016 2015 2016 2015 2016
Cash flow from operating activities 394 273 3,108 4,187 -25,176 -82
Cash flow from investing activities -155 -1,949 -7,429 -2,861 42,164 7,086
Cash flow from financing activities -343 1,651 -194 274 -16,170 -7,798
Influence of exchange rate movements on cash -27 -17 387 -8,855 42 37
Changes in cash and cash equivalents with
an effect on liquidity-131 -42 -4,128 -7,255 860 -757

135
CO
NS
OL
IDA
TE
D F
INA
NC
IAL
STA
TE
ME
NT
S2
01
6
NOTES ON THE CONSOLIDATED FINANCIAL STATEMENTS 2016
in EUR ’000 Remaining term Dec. 31, 2015 Remaining term Dec. 31, 2016
1 to 5 years over 5 years 1 to 5 years over 5 years
Liabilities to banks 363,166 13,462 164,286 12,468
Liabilities from finance lease agreements 12,652 0 19,127 0
Other non-current liabilities 7,262 0 7,556 0
Other non-current financial liabilities 4,414 0 3,983 0
Total 387,494 13,462 194,952 12,468
in EUR ’000 Fair value Interest rate margin
Dec. 31, 2015 Dec. 31, 2016 Dec. 31, 2015 Dec. 31, 2016
Liabilities to banks 384,999 228,690 0.50 - 11.2 % 0.50 - 11.2 %
Liabilities from finance lease agreements 12,652 19,127 1.43 - 7.50 % 1.17 - 7.75 %
Other non-current financial liabilities 4,409 3,983 3.5 - 12.5 % 3.97 - 7.93 %
Total 402,060 251,800 - -
Financial liabilities include long-term and short-term liabilities to banks, liabilities from finance lease agreements and other
financial liabilities. Net interest coverage includes the financial result, adjusted for income from operating investments.
As part of the capital management strategy covering the subsidiaries of the BAUER Group, it is ensured that member
companies are provided with an equity base in line with local requirements. Our aim in doing this is to provide the necessary
flexibility in terms of finance and liquidity. As of December 31, 2016, BAUER AG did not meet the agreed Net Debt / EBITDA
ratio for major loan agreements. As a result, some liability items could have become due under the terms of the contract and
are reported independently of the original contract period under current liabilities to credit institutions. The reclassification
amounted to EUR 180,375 thousand as of the reporting date. An amicable solution has already been found with all relevant
financial partners for all of the affected loans. At the end of the first quater 2017 the liabilities will be recognized as non-current
again. Please see the disclosures in the Group management report.
NON-CURRENT LIABILITIES
28. NON-CURRENT DEBT
The non-current portions of the liabilities comprise the following:
The other non-current debt include non-current portions of liabilities from obligations in respect of service anniversary payments
and liabilities from continuing involvements.
Other non-current financial liabilities mainly include the market value of the derivatives as well as other liabilities to financing
companies (see notes to the financial instruments in item 37).
29. PROVISIONS FOR PENSIONS
The BAUER Group operates a number of provisions for pensions in Germany and internationally. The provisions for pensions
of the companies in Schrobenhausen recognized on the consolidated balance sheet cover most (96 %) of the balance sheet
value. Those companies are governed by the occupational pension scheme of Bauer Spezialtiefbau GmbH constituted on
July 1, 1992 as amended by the in-company agreement dated November 18, 1998. In it, the company grants all employees
who joined by March 31, 1998 and their surviving dependents a retirement pension and invalidity benefit as well as a widow’s/
widower’s pension. Employees qualify for the retirement pension on reaching the standard retirement age, or on prior qualification
for a pension from the statutory pension fund. The pension payable amounts to 0.225 % of the employee’s pensionable earnings

136 NOTES ON THE CONSOLIDATED FINANCIAL STATEMENTS 2016
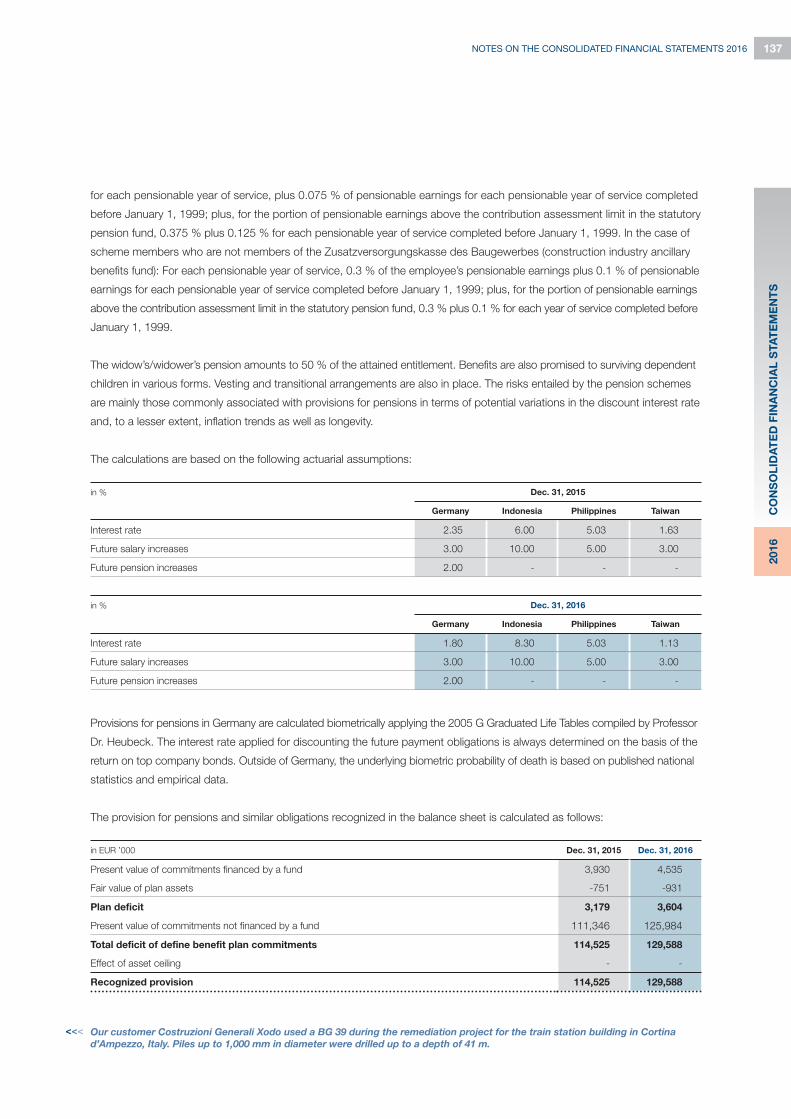
137NOTES ON THE CONSOLIDATED FINANCIAL STATEMENTS 2016
CO
NS
OL
IDA
TE
D F
INA
NC
IAL
STA
TE
ME
NT
S2
01
6
Our customer Costruzioni Generali Xodo used a BG 39 during the remediation project for the train station building in Cortina
d’Ampezzo, Italy. Piles up to 1,000 mm in diameter were drilled up to a depth of 41 m.
for each pensionable year of service, plus 0.075 % of pensionable earnings for each pensionable year of service completed
before January 1, 1999; plus, for the portion of pensionable earnings above the contribution assessment limit in the statutory
pension fund, 0.375 % plus 0.125 % for each pensionable year of service completed before January 1, 1999. In the case of
scheme members who are not members of the Zusatzversorgungskasse des Baugewerbes (construction industry ancillary
benefits fund): For each pensionable year of service, 0.3 % of the employee’s pensionable earnings plus 0.1 % of pensionable
earnings for each pensionable year of service completed before January 1, 1999; plus, for the portion of pensionable earnings
above the contribution assessment limit in the statutory pension fund, 0.3 % plus 0.1 % for each year of service completed before
January 1, 1999.
The widow’s/widower’s pension amounts to 50 % of the attained entitlement. Benefits are also promised to surviving dependent
children in various forms. Vesting and transitional arrangements are also in place. The risks entailed by the pension schemes
are mainly those commonly associated with provisions for pensions in terms of potential variations in the discount interest rate
and, to a lesser extent, inflation trends as well as longevity.
The calculations are based on the following actuarial assumptions:
in % Dec. 31, 2015
Germany Indonesia Philippines Taiwan
Interest rate 2.35 6.00 5.03 1.63
Future salary increases 3.00 10.00 5.00 3.00
Future pension increases 2.00 - - -
in % Dec. 31, 2016
Germany Indonesia Philippines Taiwan
Interest rate 1.80 8.30 5.03 1.13
Future salary increases 3.00 10.00 5.00 3.00
Future pension increases 2.00 - - -
in EUR ’000 Dec. 31, 2015 Dec. 31, 2016
Present value of commitments financed by a fund 3,930 4,535
Fair value of plan assets -751 -931
Plan deficit 3,179 3,604
Present value of commitments not financed by a fund 111,346 125,984
Total deficit of define benefit plan commitments 114,525 129,588
Effect of asset ceiling - -
Recognized provision 114,525 129,588
Provisions for pensions in Germany are calculated biometrically applying the 2005 G Graduated Life Tables compiled by Professor
Dr. Heubeck. The interest rate applied for discounting the future payment obligations is always determined on the basis of the
return on top company bonds. Outside of Germany, the underlying biometric probability of death is based on published national
statistics and empirical data.
The provision for pensions and similar obligations recognized in the balance sheet is calculated as follows:

138 NOTES ON THE CONSOLIDATED FINANCIAL STATEMENTS 2016
in EUR ’000 Present value
of commitment
Fair value of plan
assets Total
Effect of asset
ceiling Total
Date: Jan 1, 2015 119,161 -657 118,504 - 118,504
Current service costs 2,838 - 2,838 - 2,838
Interest expense/income 2,429 -37 2,392 - 2,392
Post-employment expenditure,
gains and losses from payment in lieu - - - - -
Total 124,428 -694 123,734 - 123,734
Revaluation:
Income from plan assets excluding
amounts contained in the above interest - 39 39 - 39
Actuarial gains and losses arising from
adjustments to demographic assumptions - - - - -
Actuarial gains and losses arising from
adjustments to financial assumptions -8,267 - -8,267 - -8,267
Empirical value-based adjustments 1,686 - 1,686 - 1,686
Changes in the effect of limitation of a defined
benefit plan on the asset ceiling, excluding amounts
contained in the interest - - - - -
Total -6,581 39 -6,542 - -6,542
Exchange rate movements 30 -6 24 - 24
Contributions:
Employer - -90 -90 - -90
Beneficiary employee - - - - -
Payments from the plan:
Ongoing payments - - - - -
Benefits (not fund-financed) -2,292 - -2,292 - -2,292
Other effects -309 - -309 - -309
Date: Dec. 31, 2015 115,276 -751 114,525 - 114,525
The defined benefit obligation and the plan assets developed as follows in the previous year:

139NOTES ON THE CONSOLIDATED FINANCIAL STATEMENTS 2016
CO
NS
OL
IDA
TE
D F
INA
NC
IAL
STA
TE
ME
NT
S2
01
6
in EUR ’000 Present value
of commitment
Fair value of plan
assets Total
Effect of asset
ceiling Total
Date: Jan 1, 2016 115,276 -751 114,525 - 114,525
Current service costs 2,531 - 2,531 - 2,531
Interest expense/income 2,781 -49 2,732 - 2,732
Post-employment expenditure,
gains and losses from payment in lieu - - - - -
Total 120,588 -800 119,788 - 119,788
Revaluation:
Income from plan assets excluding
amounts contained in the above interest - 2 2 - 2
Actuarial gains and losses arising from
adjustments to demographic assumptions - - - - -
Actuarial gains and losses arising from
adjustments to financial assumptions 12,919 - 12,919 - 12,919
Empirical value-based adjustments -648 - -648 - -648
Changes in the effect of limitation of a defined
benefit plan on the asset ceiling, excluding
amounts contained in the interest - - - - -
Total 12,271 2 12,273 - 12,273
Exchange rate movements 101 -31 70 - 70
Contributions:
Employer - -102 -102 - -102
Beneficiary employee - - - - -
Payments from the plan:
Ongoing payments - - - - -
Benefits (not fund-financed) -2,441 - -2,441 - -2,441
Other effects - - - - -
Date: December 31, 2016 130,519 -931 129,588 - 129,588
The defined benefit obligation and the plan assets developed as follows during the financial year:

140 NOTES ON THE CONSOLIDATED FINANCIAL STATEMENTS 2016
in EUR ’000 Dec. 31, 2015 Dec. 31, 2016
Qualifying insurance contracts 246 255
Money market fund and pension fund 466 633
Cash and cash equivalents 39 43
Total 751 931
in EUR ’000 Effect on commitment
Variation in
assumption
Increase in
assumption
Decrease in
assumption
Discount interest rate +/- 0.5 % 118,082 143,532
Future salary increases +/- 0.5 % 133,233 126,764
Future pension increase +/- 0.5 % 138,617 121,175
Increase
in assumption
by 1 year
Decrease
in assumption
by 1 year
Probability of death 136,796 124,128
in EUR ’000 Dec. 31, 2015
Germany Indonesia Philippines Taiwan Total
Present value of commitments 113,724 1,079 269 204 115,276
Fair value of plan assets -246 -466 0 -39 -751
Total 113,478 613 269 165 114,525
Effect of asset ceiling - - - - -
Total 113,478 613 269 165 114,525
The fair value of the plan assets can be allocated to the following categories:
No market price quotations exist for the qualifying insurance contracts.
The key actuarial assumptions applied in determining the defined benefit plan commitment are the discount interest rate, expected
salary increases and expected pension increases.
The sensitivity of the overall pension commitment to variations in the weighted primary assumptions is:
The above sensitivity analysis is based on a variation in one assumption while all other assumptions remain constant. It is unlikely
that this will occur in reality, and variations in some assumptions may correlate. The sensitivity for life expectancy is reached
using general (age-independent) factors for a reference person with a life expectancy of one year higher or one year lower. In
calculating the sensitivity of the defined benefit plan commitment to variations in actuarial assumptions, the same method was
applied as that used to measure the provisions for pensions on the balance sheet. The present value of the defined benefit
plan commitments was calculated by the Projected Unit Credit method as at the end of the reporting period.
The methods and categories of assumption applied in preparing the sensitivity analysis have not changed relative to the prior
period. The defined benefit plan commitments and plan assets by country are as follows:
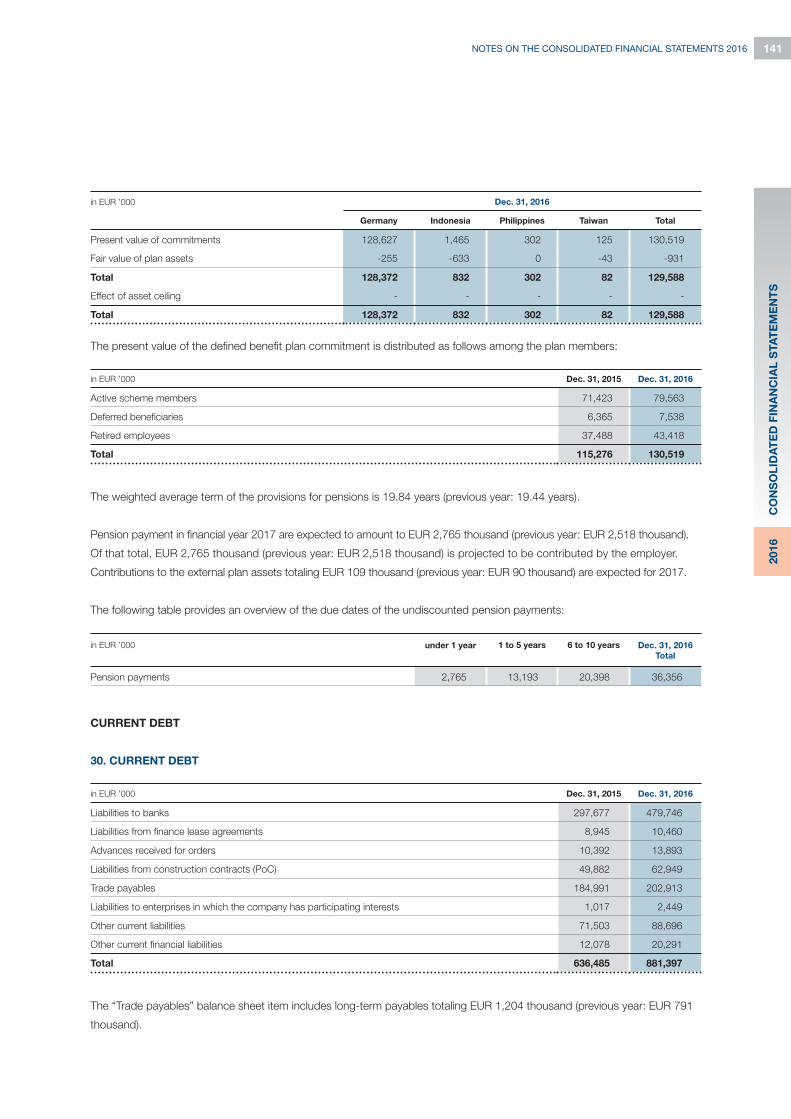
141NOTES ON THE CONSOLIDATED FINANCIAL STATEMENTS 2016
CO
NS
OL
IDA
TE
D F
INA
NC
IAL
STA
TE
ME
NT
S2
01
6
in EUR ’000 Dec. 31, 2016
Germany Indonesia Philippines Taiwan Total
Present value of commitments 128,627 1,465 302 125 130,519
Fair value of plan assets -255 -633 0 -43 -931
Total 128,372 832 302 82 129,588
Effect of asset ceiling - - - - -
Total 128,372 832 302 82 129,588
in EUR ’000 under 1 year 1 to 5 years 6 to 10 years Dec. 31, 2016
Total
Pension payments 2,765 13,193 20,398 36,356
in EUR ’000 Dec. 31, 2015 Dec. 31, 2016
Active scheme members 71,423 79,563
Deferred beneficiaries 6,365 7,538
Retired employees 37,488 43,418
Total 115,276 130,519
in EUR ’000 Dec. 31, 2015 Dec. 31, 2016
Liabilities to banks 297,677 479,746
Liabilities from finance lease agreements 8,945 10,460
Advances received for orders 10,392 13,893
Liabilities from construction contracts (PoC) 49,882 62,949
Trade payables 184,991 202,913
Liabilities to enterprises in which the company has participating interests 1,017 2,449
Other current liabilities 71,503 88,696
Other current financial liabilities 12,078 20,291
Total 636,485 881,397
The present value of the defined benefit plan commitment is distributed as follows among the plan members:
The weighted average term of the provisions for pensions is 19.84 years (previous year: 19.44 years).
Pension payment in financial year 2017 are expected to amount to EUR 2,765 thousand (previous year: EUR 2,518 thousand).
Of that total, EUR 2,765 thousand (previous year: EUR 2,518 thousand) is projected to be contributed by the employer.
Contributions to the external plan assets totaling EUR 109 thousand (previous year: EUR 90 thousand) are expected for 2017.
The following table provides an overview of the due dates of the undiscounted pension payments:
CURRENT DEBT
30. CURRENT DEBT
The “Trade payables” balance sheet item includes long-term payables totaling EUR 1,204 thousand (previous year: EUR 791
thousand).

142 NOTES ON THE CONSOLIDATED FINANCIAL STATEMENTS 2016
in EUR ’000 Dec. 31, 2015 Dec. 31, 2016
Date: Jan. 1 15,880 16,113
Change in basis of consolidation 0 0
Currency adjustment 185 40
Allocation 5,114 4,856
Reversal 3,127 3,194
Consumption 1,939 2,442
Date: Dec. 31 16,113 15,373
in EUR ’000 Dec. 31, 2015 Dec. 31, 2016
Risk from contract processing and warranties 14,763 14,375
Litigation 1,350 998
Total 16,113 15,373
The other current debt mainly comprise obligations in respect of outstanding invoices, flexitime and holiday credits, employer’s
liability insurance associations, the compensation levy for the shortfall in handicapped employees, performance bonuses as
well as other tax liabilities and liabilities in respect of social security.
The other current financial liabilities mainly comprise obligations to leasing and finance companies. The fair values virtually match
the carrying amounts. The interest rate margin on current debt to banks is 0.5 to 11.89 % (previous year: 0.75 to 11.20 %).
31. OTHER PROVISIONS
The other provisions have developed as follows in the financial year:
The other provisions comprise the following:
The provisions for risk from contract processing and warranties include all risks arising from carrying out specialist foundation
engineering work and from the sale of machinery, equipment and tools for specialist foundation engineering, with the associated
services. These primarily relate to warranty obligations and to other uncertain commitments. The risk from contract processing
and warranties is determined specific to project/construction site.
The provisions for risks arising from contract processing and warranties and provisions for litigation are predicted to be used
up during 2017. The provisions for litigation relate for the most part to provisions for legal disputes on supplementary receivables.

143NOTES ON THE CONSOLIDATED FINANCIAL STATEMENTS 2016
CO
NS
OL
IDA
TE
D F
INA
NC
IAL
STA
TE
ME
NT
S2
01
6
in EUR ’000 Dec. 31, 2015 Dec. 31, 2016
Liabilities from guarantees 112,035 52,428
in EUR ’000 Remaining term
under 1 year 1 to 5 years over 5 years
Dec. 31, 2015 Dec. 31, 2015 Dec. 31, 2015 Dec. 31, 2016 Dec. 31, 2015 Dec. 31, 2016
Minimum lease payments
from operating leases 9,784 8,990 12,636 10,824 303 1,313
Other financial obligations 13,385 9,481 7,225 5,539 6,435 4,026
32. CONTINGENT LIABILITIES
Contingent liabilities are liabilities not yet recognized in the financial statements, which are recognized in the amount of the
maximum possible exposure on the balance sheet date.
In the construction industry, it is common and essential practice to issue various guarantees to secure obligations arising from
construction contracts. These guarantees are usually issued by banks or credit insurance companies (guarantors), and essentially
guarantee quotations, contract performance, prepayments and warranty commitments. In the event of a guarantee being given,
the guarantors have a right of recourse against the Group. A risk of a guarantee being implemented exists only when the
underlying contractual obligations are not duly met.
The contingent liabilities were mainly in relation to the securing of contract performance, to warranty obligations and to advance
payments. Liabilities from guarantees exist to third parties. In addition, we are subject to joint and several liability in respect of all
joint ventures in which we participate.
Maturities of payments for liabilities are not expected.
33. OTHER FINANCIAL OBLIGATIONS
The operating leases relate mainly to mutual agreements about factory and office equipment, as well as to technical equipment
and machinery which were added in the financial year and are classified as operating leases. The BAUER Group is committed
to rental agreements of unlimited term totaling monthly EUR 506 thousand (previous year: EUR 1,342 thousand). The other
financial obligations mainly include limited-term property rentals and leases.
34. DISCONTINUED OPERATIONS
There are no plans to discontinue business operations under the terms of IFRS 5.
35. EVENTS AFTER THE BALANCE SHEET DATE
As of December 31, 2016, BAUER AG did not meet the agreed Net Debt / EBITDA ratio for major loan agreements. As a
result, some liability items could have become due under the terms of the contract and are reported independently of the
original contract period under current liabilities to credit institutions. The reclassification amounted to EUR 180,375 thousand
as of the reporting date. An amicable solution has already been found with all relevant financial partners for all of the affected
loans. At the end of the first quater 2017 the liabilities will be recognized as non-current again. In addition, no events subject
to mandatory reporting in accordance with IAS 10 or DRS 20 occurred after December 31, 2016.

144 NOTES ON THE CONSOLIDATED FINANCIAL STATEMENTS 2016
OTHER DISCLOSURES
36. CASH FLOW STATEMENT
The funds shown in the cash flow statement comprise only the cash and cash equivalents stated on the balance sheet. The
cash flow statement details payment flows, broken down by inflow and outflow of funds from operating activities and from
investing and financing activities.
The cash flow from operating activities is derived indirectly from the earnings before tax. The pre-tax profit is adjusted by
non-cash transactions. The cash flow from operating activities is produced taking account of the changes in working capital.
Investing activities include additions to property, plant and equipment and to financial assets and intangible assets, as well
as income from the sale of assets. Financing activities include outflows of cash and cash equivalents arising from dividend
payments as well as the change in other financial indebtedness.
The changes in balance sheet items applied for the preparation of the cash flow statement are not directly derivable from the
balance sheet, as the effects of currency translation and changes in the basis of consolidation, as well as the allocation and
elimination of value adjustments on trade receivables, do not affect payments and are stripped out.
37. FINANCIAL INSTRUMENTS
In its business operations and financing activities the BAUER Group is subject in particular to fluctuations in exchange rates
and interest rates. It is the company’s policy to exclude, or at least limit, these risks by entering into hedge transactions. All
hedging measures are controlled and executed centrally by BAUER AG. Application of the segregation-of-duties approach
ensures that there is an adequate split between the trading and execution functions. The segregation-of-duties approach
is implemented by spreading functions across the Management Board (financial reporting) and the corporate departments
(operational handling). All derivatives transactions are entered into only with banks of the highest possible credit rating.
MARKET RISKS
Foreign exchange rate risks
Foreign exchange rate risks under the terms of IFRS 7 are created by financial instruments which are denominated in a currency
different to the functional currency and are of a monetary nature. Exchange rate-related differences when converting financial
statements into the Group currency are ignored. All non-functional currencies in which the BAUER Group enters into financial
instruments are classed, as a matter of principle, as relevant risk variables.
The existing foreign exchange forward contracts and cross-currency swaps safeguard our currency hedging strategy. Within
the BAUER Group, the primary monetary financial instruments are either denominated directly in functional currency or are largely
transferred into the functional currency by means of derivatives. In view of the usually short-term maturity of the instruments
too, possible changes in exchange rates have only very minor effects on earnings or equity.
For the purposes of sensitivity analysis, foreign exchange rate risks arising from monetary financial instruments which were not
concluded in the functional currencies of the individual member companies of the BAUER Group are included in the analysis.

145NOTES ON THE CONSOLIDATED FINANCIAL STATEMENTS 2016
CO
NS
OL
IDA
TE
D F
INA
NC
IAL
STA
TE
ME
NT
S2
01
6
in EUR '000 on Dec. 31, 2015 USD AUD CAD
Overall effect of +10% on OCI 12,375 321 0
Overall effect of -10% on OCI -15,123 -392 0
Overall effect of +10% on income statement 2,632 0 -88
Overall effect of -10% on income statement -3,373 0 107
in EUR '000 on Dec. 31, 2016 USD AUD CAD
Overall effect of +10% on OCI 11,669 633 0
Overall effect of -10% on OCI -13,803 -759 0
Overall effect of +10% on income statement 2,436 0 -688
Overall effect of -10% on income statement -2,916 0 840
in EUR ’000 Dec. 31, 2015 Dec. 31, 2016
Overall effect of +100 base points on OCI 558 317
Overall effect of -100 base points on OCI -162 -33
Overall effect of +100 base points on income statement -82 -1,185
Overall effect of -100 base points on income statement -114 1,022
The sensitivity effects in 2016 primarily related to the US dollar, Australian dollar and Canadian dollar. The Russian ruble was
no longer listed due to insignificant sensitivity effects. No concentrations of risk exist.
Interest rate risks
The interest rate risk of the Group is based on financial liabilities with floating interest rates (as well as the short-term credit line).
The existing interest rate swaps serve to safeguard our financing and interest rate hedging strategy. Agreements exist in respect
of swaps from variable to fixed interest rates in order to exclude the risk of fluctuation in market interest rates. Changes in market
interest rates affect the interest results of variable-rate primary financial instruments of which the interest payments are not hedged
by derivatives, and consequently are included in the calculation of earnings-related sensitivity.
Changes in market interest rates of interest rate derivatives (interest rate swaps, interest rate/currency swaps) which are not
embedded in a hedging relationship pursuant to IAS 39 have effects on financial income and expenses (net valuation based
on adjustment of financial assets to applicable fair value) and so are included in the calculation of earnings-related sensitivity.
The effects of changes in market interest rates of interest rate derivatives to which hedge accounting is applied are recognized
in the OCI.
Quantification of risk of change in interest rate in case of interest rate shifts of +/- 100 base points:
Raw material risks
Raw material risks to which the BAUER Group is exposed in respect of availability and potential fluctuations in price on the
market are excluded, or limited, by means of supply promises and fixed pricing agreements entered into with suppliers prior to
execution of contracts. The raw material risk relates mainly to steel.
Quantification of foreign exchange risk in case of exchange rate shifts of +/- 10 %:

146 NOTES ON THE CONSOLIDATED FINANCIAL STATEMENTS 2016
in EUR ’000 Carrying amount
Dec. 31, 2015
Cash flow
2016
Cash flow 2017
to 2020
Cash flow 2021
et seq.
Liabilities to banks 674,305 314,778 380,250 14,641
Liabilities from finance lease agreements 21,597 9,570 13,165 0
Other liabilities 78,765 71,503 4,295 2,967
Other financial liabilities (excluding derivatives) 9,689 9,200 528 0
Liabilities from construction contracts (PoC) 49,882 49,882 0 0
Trade payables 184,991 184,200 791 0
Liabilities to enterprises in which the company has participating interests 1,017 1,017 0 0
in EUR ’000 Carrying amount,
Dec. 31, 2016
Cash flows
2017
Cash flows 2018
to 2021
Cash flow 2022
et seq.
Liabilities to banks 656,500 498,576 178,145 13,200
Liabilities from finance lease agreements 29,587 11,094 19,332 628
Other current liabilities 96,252 88,696 4,462 3,093
Other financial liabilities (excluding derivatives) 15,872 15,647 233 0
Liabilities from construction contracts (PoC) 62,949 62,949 0 0
Trade payables 202,913 201,709 1,202 2
Liabilities to enterprises in which the company has participating interests 2,449 2,450 0 0
Liquidity risks
The liquidity risk is managed by means of business planning, which ensures that the necessary funds to finance operating
activities and current and future capital investments are made available at the appropriate time, in the required currency,
and at optimum cost, in all Group companies. In liquidity risk management, the liquidity requirement arising from operating
activities, from investment activities and from other financial measures is determined in the form of a banking report and
a liquidity plan.
Liquidity is guaranteed at all times by means of a liquidity forecast focused on a fixed planning horizon and by unused lines
of credit and guarantee facilities.
The following tables present the contractually agreed and undiscounted interest payments and capital repayments in respect
of primary financial liabilities of the BAUER Group:
There were no instances of defaulting on interest payments or capital repayments in the period under review. In addition,
no concentrations of risk exist. It is not to be expected that liabilities arising from sureties (contingent liabilities) will result in
significant actual liabilities, and thus in significant cash flows, for which no provisions have yet been made.

147NOTES ON THE CONSOLIDATED FINANCIAL STATEMENTS 2016
CO
NS
OL
IDA
TE
D F
INA
NC
IAL
STA
TE
ME
NT
S2
01
6
in EUR '000 on Dec. 31, 2015 Carrying amount 2016 2017 to 2020 From 2021
Liabilities from foreign exchange forward contracts 3,375 -2,654 -2,188 0
Outflow of cash and cash equivalents - -74,496 -37,330 0
Inflow of cash and cash equivalents - 71,842 35,142 0
Liabilities from interest rate swaps 3,428 -1,714 -2,766 -1,505
Outflow of cash and cash equivalents - -1,714 -2,766 -1,505
Inflow of cash and cash equivalents - 0 0 0
in EUR '000 on Dec. 31, 2016 Carrying amount 2017 2018 to 2021 From 2022
Liabilities from foreign exchange forward contracts 5,314 -4,057 -1,400 0
Outflow of cash and cash equivalents - -141,639 -18,925 0
Inflow of cash and cash equivalents - 137,582 17,525 0
Liabilities from interest rate swaps 3,088 -1,158 -2,323 -1,373
Outflow of cash and cash equivalents - -1,158 -2,323 -1,373
Inflow of cash and cash equivalents - 0 0 0
To calculate the cash inflows from interest rate swaps the conditions as per December 31, 2016 were applied.
Risk of default
The risk of default is managed at Group level. Default risks arise from cash and cash equivalents, derivative financial instruments
and deposits at banks and financial service companies. Only banks and financial services companies with the highest possible
credit ratings are selected as partners. No credit limit was exceeded in the reporting period. The management expects no
defaults on the part of these business partners.
The risk of default on financial assets exists in terms of the risk of failure of a contract party and thus to a maximum in the amount
of the carrying amount of the exposure to the said party. A presentation of the carrying amounts and the resultant maximum risk
of default per category is given in the table starting on page 150. The risk arising from primary financial instruments is countered
by means of valuation allowances for bad debt, and in Germany also by means of credit insurance cover. As derivative financial
instruments are entered into only with banks with the highest possible credit ratings, and the risk management system sets limits
for each party, the actual risk of default is negligible. No concentrations of risk exist.
The due dates of derivative financial instruments based on outflow and inflow of cash and cash equivalents are as follows:

148 NOTES ON THE CONSOLIDATED FINANCIAL STATEMENTS 2016
in EUR ’000 Dec. 31, 2015 * Dec. 31, 2016
Loans and receivables * -8,431 -21,723
Financial liabilities measured at amortized cost -35,618 -30,785
Available-for-sale financial assets -162 -4,209
Held for trading -8,984 -7,424
Total -53,195 -64,141
in EUR ’000 Nominal volume Fair value
Dec. 31, 2015 Dec. 31, 2016 Dec. 31, 2015 Dec. 31, 2016
Positive Negative Positive Negative
Interest rate swaps
of which in hedge accounting 27,214 23,643 0 -336 0 -226
of which not in hedge accounting 102,150 54,950 0 -3,092 0 -2,862
Foreign exchange forward contracts
of which in hedge accounting 144,156 136,079 2,643 -1,633 371 -3,865
of which not in hedge accounting 70,848 71,876 809 -1,742 317 -1,449
Foreign exchange forward options
of which in hedge accounting 0 0 0 0 0 0
of which not in hedge accounting 0 5,000 0 0 349 0
Cross currency swaps
of which in hedge accounting 0 0 0 0 0 0
of which not in hedge accounting 1,841 1,105 108 0 100 0
Other disclosures relating to financial instruments
The Group has taken up loans with variable interest rates and hedged against its interest rate-related cash flow risk by means
of swaps. Such interest rate swaps have the commercial effect of converting variable-interest loans into fixed-interest loans. In
these interest rate swaps, the Group agrees with other parties to swap the difference between the fixed and variable interest
rates derived from the agreed nominal amounts at regular intervals.
The nominal volumes and market values of the derivative financial instruments are as follows:
Net result by valuation category
The following table sets out the net profits and losses (before tax) on financial instruments stated in the income statement, broken
down by valuation category as per IAS 39:
The net result of the “Loans and Receivables” category includes results from the creation and reversal of value adjustments in
respect of trade receivables, results from bank fees, impairments of uncollected receivables as well as interest income.
The net result of the “Financial Liabilities Measured at Amortized Cost” category includes the result from interest expenditure
to third parties, for current and non-current loans as well as guaranty commissions.
Net available for sale financial assets contain amortization on financial assets. Equity shares in companies are valued at cost
and are not included.
* Prior-year fi gures have been changed; the net results from impairments in the Construction segment have been removed

149NOTES ON THE CONSOLIDATED FINANCIAL STATEMENTS 2016
CO
NS
OL
IDA
TE
D F
INA
NC
IAL
STA
TE
ME
NT
S2
01
6
in EUR ’000 Dec. 31, 2015 Dec. 31, 2016
Impairment for Loans and Receivables -9,461 -17,605
Impairment for Avarlable for Sale Financial Assets -162 -4,209
Total -9,623 -21,814
The net result of the “Financial Assets and Liabilities Held for Trading” category includes results from foreign exchange forward
contracts and options, as well as results from changes to the fair values of interest rate swaps.
In the table below the included impairments are evident:
Carrying amounts and fair values
The fair value of a financial instrument is the consideration for which an asset might be exchanged, or a debt paid, between
informed, willing and mutually independent parties. Where financial instruments are quoted on an active market – such as
in particular shares held and bonds issued – the price quoted on the market in question is the fair value. If no active market
exists, the fair value is determined by financial valuation methods.
The fair values of foreign exchange forward contracts and cross-currency swaps are measured separately at their respective
forward prices and discounted to the reference date based on the corresponding interest rate curve. The market prices of
foreign exchange forward options are determined by recognized option models.
The fair values of the interest swaps correspond to the respective market value as determined by appropriate financial
valuation methods, such as by discounting expected future cash flows.
For cash and cash equivalents, current trade receivables and other current assets, current trade payables and other current
debt, owing to their short remaining terms the carrying amount should be adopted as a realistic estimate of the fair value.
The fair values of non-current financial assets and of other non-current financial liabilities correspond to the cash values of the
payment flows linked to the assets, taking into account the applicable interest rate parameters, which reflect changes in the
terms and expectations of the market and of the respective parties.
The fair values of financial instruments are determined on the basis of one of the methods set out on the three following levels:
• Level 1: Quoted prices (adopted unchanged) on active markets for identical assets and liabilities
• Level 2: Directly or indirectly observable input data for the asset or liability other than quoted prices as per level 1
• Level 3: Applied input data which does not originate from observable market data for measurement of the asset and liability
(non-observable input data)
There were no transfers between the levels during the year. If circumstances arise necessitating a reclassification, it is undertaken
at the end of the reporting period.

150 NOTES ON THE CONSOLIDATED FINANCIAL STATEMENTS 2016
in EUR ’000 Related amounts, which are
not offset in the balance sheet
Gross financial
assets recognized
Gross financial lia-
bilities offset on the
balance sheet
Net amount of
financial assets
recognized on the
balance sheet
Financial
instruments
Cash securities
received Net amount
Date: Dec. 31, 2015
Derivative financial assets 3,560 0 3,560 -1,662 - 1,898
Cash and cash equivalents 47,406 0 47,406 -4,000 - 43,406
Total 50,966 0 50,966 -5,662 - 45,304
Date: Dec. 31, 2016
Derivative financial assets 1,136 0 1,136 -438 - 698
Cash and cash equivalents 33,463 0 33,463 -2,416 - 31,047
Total 34,599 0 34,599 -2,854 - 31,745
Other disclosures relating to hedging transactions
In financial year 2016, changes in equity due to cash flow hedges in the amount of EUR -970 thousand (previous year: EUR
190 thousand) before taxes and in the amount of EUR -698 thousand (previous year: EUR 137 thousand) after taxes were
recognized as hedge reserve in equity without any effect on profit and loss. An amount of EUR 1,763 thousand (previous
year: EUR 834 thousand) was recognized in profit and loss from the hedge reserve created with no effect on net income in
the equity Fair value changes resulting from the derivative financial instruments held on December 31, 2016 were recognized
in equity (increase) in the amount of EUR 793 thousand (previous year: EUR 1,024 thousand). In addition, the changes in
deferred taxes in the amount of EUR 272 thousand (previous year: EUR -53 thousand) were recognized in equity (increase)
without any effect on profit and loss. Future transactions in foreign currencies secured by hedging and changes in market
interest rates are expected to be realized by 2020 at the latest. Gains and losses on future contracts in foreign currency and
interest rates at December 31, 2016 included in the hedge reserve in the OCI are recognized in the income statement in the
period in which the hedged planned transaction impacts on the income statement.
The prospective effectiveness is measured according to the Critical Term Match method and the retrospective effectiveness
according to the Dollar Offset method based on the Hypothetical Derivatives method.
Offsetting Financial Assets and Financial Liabilities
a) Financial assets
The following financial assets are subject to offsetting, enforceable master-netting arrangements or similar arrangements.

151NOTES ON THE CONSOLIDATED FINANCIAL STATEMENTS 2016
CO
NS
OL
IDA
TE
D F
INA
NC
IAL
STA
TE
ME
NT
S2
01
6
in EUR ’000 Related amounts, which are
not offset in the balance sheet
Gross financial
liabilities recognized
Gross amount of
financial assets
offset on the
balance sheet
Net financial liabil-
ities recognized on
the balance sheet
Financial
instruments
Cash
securities paid Net amount
Date: Dec. 31, 2015
Derivative financial liabilities 6,803 0 6,803 -1,662 - 5,141
Current-account overdrafts 216,891 0 216,891 -4,000 - 212,891
Total 223,694 0 223,694 -5,662 218,032
Date: Dec. 31, 2016
Derivative financial liabilities 8,402 0 8,402 -438 - 7,964
Current-account overdrafts 168,922 0 168,922 -2,416 - 166,506
Total 177,324 0 177,324 -2,854 174,470
b) Financial liabilities
The following financial liabilities are subject to offsetting, enforceable master-netting arrangements or similar arrangements.
The “Financial instruments” column lists the amounts which are subject to master-netting arrangements but are not netted
on the balance sheet because the preconditions for offsetting are not met. The “Cash securities received” column lists the
amounts of cash and financial instrument securities received relative to the sum total of assets and liabilities which do not
meet the criteria for netting on the balance sheet.

152 NOTES ON THE CONSOLIDATED FINANCIAL STATEMENTS 2016
in EUR ’000
Measurement benchmark Carrying amount Loans and receivables/
other financial liabilities
Dec. 31, 2015 Dec. 31, 2016 Dec. 31, 2015 Dec. 31, 2016
NON-CURRENT ASSETS
Participations at cost 3,613 9,730 0 0
Other non-current financial assets 15,355 18,412
at fair value 707 476 0 0
at amortized cost 11,408 14,215 11,408 14,215
at cost 3,240 3,721 0 0
CURRENT ASSETS
Receivables from construction contracts at amortized cost 129,478 154,802 129,478 154,802
Trade receivables at amortized cost 343,933 339,993 343,933 339,993
Receivables from enterprises
in which the company has participating interests at amortized cost 3,272 6,473 3,272 6,473
Other current financial assets 28,901 18,364
at fair value 2,853 661 0 0
at amortized cost 26,048 17,703 26,048 17,703
Cash and cash equivalents at amortized cost 47,406 33,463 47,406 33,463
Total financial assets 571,958 581,237 561,545 566,649
Within the Group, financial instruments are classified in the same way as the respective balance sheet items. No fair value was
stated for current financial instruments and financial instruments recognized at cost in accordance with IFRS 7.29.
The following table presents a progression of the classes to the categories of IAS 39 and the respective market values:

153NOTES ON THE CONSOLIDATED FINANCIAL STATEMENTS 2016
CO
NS
OL
IDA
TE
D F
INA
NC
IAL
STA
TE
ME
NT
S2
01
6
Balance sheet valuation as per IAS 39 Not allocated to any IAS 39 category
Measure-
ment level in
accordance
with
IFRS 13
Available
for Sale
Financial Assets and
Liabilities Held for Trading
Derivatives in hedge
accounting
Recognition in the balance
sheet in accordance with
IAS 17
Fair value
as per IFRS 7 and IFRS 13
Dec. 31, 2015 Dec. 31, 2016 Dec. 31, 2015 Dec. 31, 2016 Dec. 31, 2015 Dec. 31, 2016 Dec. 31, 2015 Dec. 31, 2016 Dec. 31, 2015 Dec. 31, 2016
3,613 9,730 0 0 0 0 0 0 n/a n/a n/a
0 0 108 450 599 26 0 0 707 476 2
0 0 0 0 0 0 0 0 9,960 13,198 3
3,240 3,721 0 0 0 0 0 0 n/a n/a n/a
0 0 0 0 0 0 0 0 n/a n/a n/a
0 0 0 0 0 0 0 0 n/a n/a n/a
0 0 0 0 0 0 0 0 n/a n/a n/a
0 0 809 317 2,044 344 0 0 2,853 661 2
0 0 0 0 0 0 0 0 n/a n/a n/a
0 0 0 0 0 0 0 0 n/a n/a n/a
6,853 13,451 917 767 2,643 370 0 0 13,520 14,335

154 NOTES ON THE CONSOLIDATED FINANCIAL STATEMENTS 2016
in EUR ’000
Measurement benchmark Carrying amount Loans and receivables/
other financial liabilities
Dec. 31, 2015 Dec. 31, 2016 Dec. 31, 2015 Dec. 31, 2016
NON-CURRENT LIABILITIES
Liabilities to banks at amortized cost 376,628 176,754 376,628 176,754
Liabilities from finance lease agreements at fair value 12,652 19,127 0 0
Other non-current financial liabilities 4,414 3,983
at fair value 3,925 3,758 0 0
at amortized cost 489 225 489 225
CURRENT DEBT
Liabilities to banks at amortized cost 297,677 479,746 297,677 479,746
Liabilities from finance lease agreements at fair value 8,945 10,460 0 0
Liabilities from construction contracts at amortized cost 49,882 62,949 49,882 62,949
Trade payables at amortized cost 184,991 202,913 184,991 202,913
Liabilities to enterprises
in which the company has participating interests at amortized cost 1,017 2,449 1,017 2,449
Other current financial liabilities 12,078 20,291
at fair value 2,878 4,644 0 0
at amortized cost 9,200 15,647 9,200 15,647
Total financial liabilities 948,284 978,672 919,884 940,683

155NOTES ON THE CONSOLIDATED FINANCIAL STATEMENTS 2016
CO
NS
OL
IDA
TE
D F
INA
NC
IAL
STA
TE
ME
NT
S2
01
6
Balance sheet valuation as per IAS 39 Not allocated to any IAS 39 category
Measure-
ment level in
accordance
with
IFRS 13
Available
for Sale
Financial Assets and
Liabilities Held for Trading
Derivatives in hedge
accounting
Recognition in the balance
sheet in accordance with
IAS 17
Fair value
as per IFRS 7 and IFRS 13
Dec. 31, 2015 Dec. 31, 2016 Dec. 31, 2015 Dec. 31, 2016 Dec. 31, 2015 Dec. 31, 2016 Dec. 31, 2015 Dec. 31, 2016 Dec. 31, 2015 Dec. 31, 2016
0 0 0 0 0 0 0 0 384,999 223,460 3
0 0 0 0 0 0 12,652 19,127 12,652 19,127 n/a
0 0 2,470 2,702 1,455 1,056 0 0 3,925 3,758 2
0 0 0 0 0 0 0 0 484 225 3
0 0 0 0 0 0 0 0 n/a n/a n/a
0 0 0 0 0 0 8,945 10,460 n/a n/a n/a
0 0 0 0 0 0 0 0 n/a n/a n/a
0 0 0 0 0 0 0 0 n/a n/a n/a
0 0 0 0 0 0 0 0 n/a n/a n/a
0 0 2,364 1,605 514 3,039 0 0 2,878 4,644 2
0 0 0 0 0 0 0 0 n/a n/a n/a
0 0 4,834 4,307 1,969 4,095 21,597 29,587 404,938 251,214

156 NOTES ON THE CONSOLIDATED FINANCIAL STATEMENTS 2016
38. EXECUTIVE BODIES
In the year under review the Supervisory Board comprised the following members:
Shareholder representatives
• Shareholder representatives
• Dr. Klaus Reinhardt, General (retd.), Starnberg, chairman
• Dr.-Ing. Johannes Bauer, Schrobenhausen
Civil engineer with BAUER Designware GmbH, Schrobenhausen
• Prof. Dr.-Ing. E.h. Manfred Nussbaumer M.Sc., retired civil engineer
Supervisory Board Leonhardt, Andrä and Partner Beratende Ingenieure VBI AG, Stuttgart, member
• Dipl.-Ing. (FH) Rainer Schuster, Haag an der Amper (until June 23, 2016), retired civil engineer
• Dipl.-Ing. (FH) Elisabeth Teschemacher, née Bauer, Schrobenhausen
Self-employed in real estate management, building rehabilitation and construction consulting
• Dipl.-Kffr. Andrea Teutenberg, Berlin (since 23 June, 2016) CEO of Orange 12 GmbH, Berlin
• Gerardus N. G. Wirken, Breda, Netherlands
Freelance consultant for strategy, managerial accounting and accounting,
Supervisory Board of Winters Bouw- en Ontwikkeling B.V., Breda, Netherlands, Chairman
Employee representatives
• Robert Feiger, Neusäss, Deputy Chairman
Chairman of the Federal Executive Committee of the IG Bauen-Agrar-Umwelt industrial trade union, Frankfurt am Main
Supervisory Board, Zusatzversorgungskasse des Baugewerbes AG, Wiesbaden, member
• Regina Andel, Ellrich
Chair of the Works Council, SCHACHTBAU NORDHAUSEN GmbH, Nordhausen
• Rainer Burg, Gerolsbach (since June 23, 2016)
Concrete technologist at BAUER Spezialtiefbau GmbH, Schrobenhausen
• Maria Engfer-Kersten, Hanover (since June 23, 2016)
Union secretary of IG BCE Industriegewerkschaft Bergbau, Chemie, Energie, Hanover
• Dipl.-Volkswirt Norbert Ewald, Bad Vilbel (until June 23, 2016)
Member of the Management Board at Zusatzversorgungskasse des Steinmetz- und Steinbildhauerhandwerks VVaG,
Wiesbaden
• Reinhard Irrenhauser, Schrobenhausen
Works Council Chairman at BAUER Maschinen GmbH, Schrobenhausen, Supervisory Board of BAUER Maschinen GmbH,
Schrobenhausen
• Dipl.-Kfm. (FH) Stefan Reindl, Schrobenhausen
Human Resources Director of BAUER Aktiengesellschaft, Schrobenhausen
Advisory Board, BAUER Training Center GmbH, Schrobenhausen, Chairman
• Dipl.-Ing. Gerold Schwab, Kernen (until June 23, 2016)
Civil Engineer in the Technical Division of BAUER Spezialtiefbau GmbH, Schrobenhausen

157NOTES ON THE CONSOLIDATED FINANCIAL STATEMENTS 2016
CO
NS
OL
IDA
TE
D F
INA
NC
IAL
STA
TE
ME
NT
S2
01
6
Management Board
• Prof. Dr.-Ing. E.h. Dipl.-Kfm. Thomas Bauer, Schrobenhausen, Chairman
Functions: Participations, IT, core process management, HSE, quality management, Supervisory Board of BAUER Spezial-
tiefbau GmbH, Schrobenhausen, Chairman
Supervisory Board of BAUER Maschinen GmbH, Schrobenhausen, Chairman of Supervisory Board of SCHACHTBAU
NORDHAUSEN GmbH, Nordhausen, Chairman of Supervisory Board of BAUER Resources GmbH, Schrobenhausen,
Chairman of Supervisory Board of BAUER EGYPT S.A.E., Cairo, Chairman
Administrative Board, Maurer SE, Munich, member (since Nov 21, 2016)
• Dipl.-Betriebswirt (FH) Hartmut Beutler, Schrobenhausen
Functions: Finance, legal and insurance, corporation communications, facility management, media design,
Supervisory Board of Raiffeisenbank Schrobenhausen e.G., Schrobenhausen, Chairman
Supervisory Board, BAUER Resources GmbH, Schrobenhausen, member
Supervisory Board, SCHACHTBAU NORDHAUSEN GmbH, Nordhausen, Deputy Chairman (since Jan 12, 2017)
• Dipl.-Ing. Heinz Kaltenecker, Schrobenhausen (until Dec 31, 2016)
Supervisory Board of BAUER Resources GmbH, Schrobenhausen, Chairman (until Dec 5, 2016) of Supervisory Board
of BAUER Spezialtiefbau GmbH, Schrobenhausen, Deputy Chairman (until Dec 31, 2016) of Supervisory Board, BAUER
Maschinen GmbH, Schrobenhausen, Deputy Chairman (until Dec 31, 2016)
Supervisory Board, SCHACHTBAU NORDHAUSEN GmbH, Nordhausen, Deputy Chairman (until Dec 31, 2016)
• Peter Hingott, Schrobenhausen (since Oct 1, 2016)
Functions: Participations, Accounting, Human Resources, Corporate Purchasing
Supervisory Board of BAUER Spezialtiefbau GmbH, Schrobenhausen, member (since Jan 12, 2017), Supervisory Board
of BAUER Maschinen GmbH, Schrobenhausen, member (since Jan 12, 2017) Administrative Board, BAUER Emirates
Environment Technologies & Services LLC, Abu Dhabi, Supervisory Board member, BAUER Nimr LLC, Maskat/Oman,
Chairman
Administrative Board, BAUER Resources GmbH / Jordan Ltd. Co., Amman, Jordan, Chairman of Administrative Board, Site
Group for Services and Well Drilling Ltd. Co., Amman, Jordan, Administrative Board, BAUER Resources Chile Limitada,
Santiago de Chile/Chile, Chairman
The total remuneration paid to members of the Management Board in the year under review, excluding allocations to pension
provisions, was EUR 1,542 thousand (previous year: EUR 1,274 thousand). Of that total, EUR 1,392 thousand (previous year:
EUR 1,124 thousand) was not performance-related and EUR 150 thousand (previous year: EUR 150 thousand) was performance-
related. The total remuneration includes benefits in kind arising from the private use of a company car and reimbursement of
travel expenses for each member of the Management Board, as well as pro-rata group accident insurance premiums and
employer’s liability insurance association contributions. The increase in the remuneration of the Management Board is attributable
to the fact that the total remuneration of all members of the Management Board (including functions in committees of subsidiaries)
is reported for the whole year, even though the Management Board had four members for only three months, as Mr. Peter Hingott
joined the Board on October 1, 2016 and Mr. Heinz Kaltenecker retired on December 31, 2016. The company pension scheme
for Management Board members incurred pension service costs totaling EUR 137 thousand (previous year: EUR 155 thousand).
The pensionable earnings serving as the basis for calculating pension levels are significantly lower than the basic salary in all
contracts. Calculated in accordance with IAS 19, the defined benefit obligation entailed by all pension commitments to members
of the Management Board at the year-end was EUR 6,485 thousand (previous year: EUR 5,537 thousand). Former members
of the management bodies of the parent company received total remuneration of EUR 0 thousand (previous year: 0) in return
for duties performed on behalf of the parent company.

158 NOTES ON THE CONSOLIDATED FINANCIAL STATEMENTS 2016
in EUR ’000 2015 2016
Chairman
Dr. Klaus Reinhardt 38 40
Deputy Chairman
Robert Feiger 27 27
Shareholder representatives
Dr.-Ing. Johannes Bauer 20 20
Dipl.-Ing. (FH) Rainer Schuster 18 10
Dipl.-Ing. (FH) Elisabeth Teschemacher 18 20
Gerardus N. G. Wirken 20 20
Prof. Dr. Manfred Nussbaumer 20 20
Dipl.-Kffr. Andrea Teutenberg - 10
Employee representatives
Dipl.-Volkswirt Norbert Ewald 20 10
Dipl.-Kfm. (FH) Stefan Reindl 18 18
Regina Andel 18 18
Dipl.-Ing. Gerold Schwab 20 10
Reinhard Irrenhauser 18 19
Rainer Burg - 9
Maria Engfer-Kersten - 10
Total * 254 261
* rounded
The remuneration paid to the Supervisory Board for the 2016 financial year totaled EUR 261 thousand (previous year: 254
thousand) and was distributed as follows:
39. RELATED PARTY DISCLOSURES
Related parties under the terms of IAS 24 are parties that the reporting enterprise has the ability to control or exercise significant
influence over, or parties that have the ability to control or exercise significant influence over the reporting enterprise.
Transactions with related parties are defined as the transfer of resources, services or obligations between the reporting entity and
a related party, regardless of whether an invoice is issued in respect of the transaction or not.
Members of the Management Board of BAUER AG are members of Supervisory Boards and Management Boards of other
companies with which BAUER AG maintains relations in the course of its ordinary business operations. Related persons
received pensions totaling EUR 85 thousand (previous year: EUR 55 thousand) in respect of former employment within the
BAUER Group. The members of the Supervisory Board, by virtue of their role as employees, received remuneration totaling
EUR 482 thousand (previous year: EUR 483 thousand). Lease and service contracts and contracts of employment (except
for the remuneration to members of the Management Board disclosed) exist with members of the Management Board,
including close family, in respect of which remuneration to an amount of EUR 833 thousand (previous year: EUR 1,032
thousand) was paid.

159NOTES ON THE CONSOLIDATED FINANCIAL STATEMENTS 2016
CO
NS
OL
IDA
TE
D F
INA
NC
IAL
STA
TE
ME
NT
S2
01
6
in EUR ’000 Associated companies Non-consolidated companies Joint ventures
2015 2016 2015 2016 2015 2016
Income 7,325 4,483 20,620 4,137 10,834 23,801
Purchased services 1,389 2,435 2,558 5,524 0 5,041
Receivables and
other assets (Dec. 31) 794 479 12,490 8,956 35,751 35,086
Liabilities (Dec. 31) 701 131 3,859 1,706 1,102 5,737
Valuation allowance of receivables 0 0 1,927 145 22,887 22,624
Expenditure for uncollectable
and uncertain receivables 328 0 1,088 145 6,314 3,343
ProjectCompany's activities
Registered officeShareholding
Barangaroo Project Specialist foundation engineering Sydney, Australia 50 %
Deep-Bauer Foundation Inc. Specialist foundation engineering Calgary, Canada 44 %
ProjectCompany's activities
Registered officeShareholding
Barangaroo Project Specialist foundation engineering Sydney, Australia 50 %
Deep-Bauer Foundation Inc. Specialist foundation engineering Calgary, Canada 44 %
Loan commitments to the BAUER Foundation existed totaling EUR 1,000 thousand (previous year: EUR 1,000 thousand), for
which interest amounting to EUR 55 thousand (previous year: EUR 55 thousand) was paid.
At the end of the financial year no loan commitments existed to shareholders of BAUER AG.
The key relationships between fully consolidated Group companies and related parties are set out in the following table:
The purchased services essentially comprise all expenses incurred with related parties during the financial year.
Transactions with related parties are conducted at standard market terms.
The receivables and other assets include uncollectable receivables as well as financial assets in respect of related parties.
40. JOINT OPERATIONS
The material joint ventures are listed below:
Financial year 2015:
Financial year 2016:

160 NOTES ON THE CONSOLIDATED FINANCIAL STATEMENTS 2016
in EUR ’000 2015 2016
Fees for auditing services 723 740
Fees for other certification 14 18
Fees for tax advice 75 118
Fees for other services 79 10
Total 891 886
in EUR ’000 2015 2016
Fees for auditing services 39 49
Fees for other certification 2 2
Fees for tax advice 7 5
Fees for other services 0 0
Total 48 56
2015 2016
Salaried staff 4,050 4,216
Germany 2,001 1,986
International 2,049 2,230
Industrial & trades 6,443 6,317
Germany 1,920 1,840
International 4,523 4,477
Apprentices 245 238
Total number of employees 10,738 10,771
41. FEES AND SERVICES OF THE AUDITORS
The fee paid to the auditors and recorded as expenditure in the financial year is broken down as follows:
PricewaterhouseCoopers AG:
In addition, Roland Jehle GmbH Wirtschaftsprüfungsgesellschaft Steuerberatungsgesellschaft was engaged to audit the
major German capital corporations included in the Group's consolidated financial statements.
The fees for this recognized in the financial year are broken down in accordance with Section 285, Paragraph 17 and Section
314, Subsection 1, Paragraph 9 HGB as follows:
42. DECLARATION OF CONFORMITY TO THE GERMAN CORPORATE GOVERNANCE CODE
The management Board and Supervisory Board of BAUER AG issued the Declaration of conformity prescribed by Paragraph
161 AktG on December 9, 2016 and made it permanently available for shareholders at www.bauer.de.
43. AVERAGE NUMBER OF EMPLOYEES
44. AUTHORIZATION FOR ISSUE OF THE CONSOLIDATED FINANCIAL STATEMENTS
The Management Board has submitted the consolidated financial statements to the Supervisory Board for authorization for
issue (the Supervisory Board meeting is scheduled for April 10, 2017).

161NOTES ON THE CONSOLIDATED FINANCIAL STATEMENTS 2016
CO
NS
OL
IDA
TE
D F
INA
NC
IAL
STA
TE
ME
NT
S2
01
6
45. PROPOSAL ON APPROPRIATION OF UNAPPROPRIATED NET PROFIT
The Management Board and Supervisory Board of BAUER AG propose to resolve to distribute a dividend of EUR 0.10
per dividend-bearing share to the shareholders from unappropriated net profit in financial year 2016 in the amount of
EUR 1,713,100.00. At 17,131,000 dividend-bearing no-nominal-value shares, this corresponds to a dividend of EUR
1,713,100.00. Any partial amount relating to non-dividend-bearing no-nominal-value shares will also be carried forward to
new account.
Schrobenhausen, March 31, 2017
The Management Board
Prof. Thomas Bauer Dipl.-Betriebswirt (FH) Hartmut Beutler Peter Hingott
Chairman of the Management Board

162
List of shareholdings of the BAUER Group pursuant to Section 313 of the German Commercial Code (HGB) as of December 31, 2016NAME AND REGISTERED OFFICE OF COMPANY Currency Capital share
in %
1. Fully consolidated companies
BAUER Aktiengesellschaft EUR
A. Germany
BAUER Spezialtiefbau GmbH, Schrobenhausen, Germany EUR 100.00
BAUER Maschinen GmbH, Schrobenhausen, Germany EUR 100.00
SCHACHTBAU NORDHAUSEN GmbH, Nordhausen, Germany EUR 100.00
SPESA Spezialbau und Sanierung GmbH, Schrobenhausen, Germany EUR 100.00
BAUER Resources GmbH, Schrobenhausen, Germany EUR 100.00
BAUER Training Center GmbH, Schrobenhausen, Germany EUR 100.00
BAUER Designware GmbH, Schrobenhausen, Germany EUR 100.00
KLEMM Bohrtechnik GmbH, Drolshagen, Germany EUR 100.00
EURODRILL GmbH, Drolshagen, Germany EUR 100.00
WW Beteiligung GmbH, Schrobenhausen, Germany EUR 100.00
RTG Rammtechnik GmbH, Schrobenhausen, Germany EUR 100.00
PRAKLA Bohrtechnik GmbH, Peine, Germany EUR 100.00
Olbersdorfer Guß GmbH, Olbersdorf, Germany EUR 75.00
Schachtbau Nordhausen Bau GmbH, Nordhausen, Germany EUR 100.00
SCHACHTBAU NORDHAUSEN Stahlbau GmbH, Nordhausen, Germany EUR 100.00
MMG Mitteldeutsche MONTAN GmbH, Nordhausen, Germany EUR 100.00
PURE Umwelttechnik GmbH, Schrobenhausen, Germany EUR 100.00
BAUER Foralith GmbH, Schrobenhausen, Germany EUR 100.00
GWE pumpenboese GmbH, Peine, Germany EUR 100.00
Esau & Hueber GmbH, Schrobenhausen, Germany EUR 100.00
B. EU excluding Germany
GWE Budafilter Kft., Mezöfalva, Hungary HUF 100.00
BAUER Ambiente S.r.l., Milan, Italy EUR 100.00
BAUER SPEZIALTIEFBAU Gesellschaft m.b.H., Vienna, Austria EUR 100.00
BAUER Technologies Limited, Bishops Stortford, Great Britain GBP 100.00
BAUER RENEWABLES LIMITED, Bishops Stortford, Great Britain GBP 100.00
BAUER EQUIPMENT UK LIMITED, Rotherham, Great Britain GBP 100.00
BAUER Magyarország Speciális Mélyépítö Kft., Budapest, Hungary HUF 100.00
BAUER ROMANIA S.R.L., Bucharest, Rumania RON 100.00
BAUER BULGARIA EOOD, Sofia, Bulgaria BGN 100.00
BAUER Funderingstechniek B.V., Mijdrecht, Netherlands EUR 100.00
BAUER Maszyny Polska Sp.z.o.o., Warsaw, Poland PLN 100.00
BAUER Foundations (IRL) Ltd., Bishops Stortford, Great Britain EUR 100.00
GWE France S.A.S., Aspiran, France EUR 100.00
TracMec Srl, Mordano, Italy EUR 100.00
BAUER Macchine Italia Srl, Mordano, Italy EUR 100.00
FAMBO Sweden AB, Eslöv, Sweden SEK 100.00
GWE POL-Bud Sp.z.o.o, Lodz, Poland PLN 100.00

163NOTES ON THE CONSOLIDATED FINANCIAL STATEMENTS 2016
CO
NS
OL
IDA
TE
D F
INA
NC
IAL
STA
TE
ME
NT
S2
01
6
NAME AND REGISTERED OFFICE OF COMPANY Currency Capital share
in %
Continued: B. EU excluding Germany
BAUER RESOURCES SPAIN S.A., Leganes, Spain EUR 100.00
BAUER Resources UK Ltd., Beverley, Great Britain GBP 100.00
C. Europe (other)
BAUER Spezialtiefbau Schweiz AG, Baden-Dättwil, Switzerland CHF 100.00
FORALITH Drilling Support AG, St. Gallen, Switzerland CHF 100.00
OOO BAUER Maschinen - Kurgan, Kurgan, Russian Federation RUB 65.00
OOO BAUER Maschinen SPb, St. Petersburg, Russian Federation RUB 100.00
OOO BG-TOOLS-MSI, Ljuberzy, Russian Federation RUB 55.00
OOO BAUER Maschinen Russia, Moscow, Russian Federation RUB 100.00
OOO BAUER Technologie, Moscow, Russian Federation RUB 100.00
BAUER Georgia Foundation Specialists LCC, Tbilisi, Georgia GEL 100.00
D. Middle East & Central Asia
Saudi BAUER Foundation Contractors Ltd., Jeddah, Saudi Arabia SAR 100.00
BAUER LEBANON FOUNDATION SPECIALISTS S.a.r.l., Beirut, Lebanon USD 100.00
BAUER International FZE, Dubai, United Arab Emirates AED 100.00
BAUER International Qatar LLC, Doha, Qatar QAR 49.00 *
BAUER Equipment Gulf FZE, Dubai, United Arab Emirates AED 100.00
BAUER Emirates Environment Technologies & Services LLC, Abu Dhabi, United Arab Emirates AED 49.00 *
BAUER Resources GmbH / Jordan Ltd. Co., Amman, Jordan -
(sub-group consolidated financial statements)USD 100.00
Site Group for Services and Well Drilling Ltd. Co., Amman, Jordan USD 83.33
Site Group for Services and Well Drilling Ltd. Co., Ramallah, Palestine USD 100.00
Site Drilling Ltd. Co., Limassol, Cyprus USD 100.00
BAUER Casings Makina Sanayi ve Ticaret Limited Sirketi, Ankara, Turkey TRY 60.00
BAUER Corporate Services Private Limited, Mumbai, India INR 100.00
BAUER Geotechnical Specialized Foundation LLC, Abu Dhabi, United Arab Emirates AED 100.00
BAUER Equipment India Private Limited, Navi Mumbai, India INR 100.00
E. Asia-Pacific, Far East and Australia
BAUER (MALAYSIA) SDN. BHD. - (subsidiary consolidated financial statements),
Petaling Jaya, Malaysia MYR 100.00
BAUER Foundations Australia Pty Ltd, Brisbane, Australia AUD 100.00
P.T. BAUER Pratama Indonesia, Jakarta, Indonesia IDR 100.00
BAUER Services Singapore Pte Ltd, Singapore EUR 100.00
BAUER Hong Kong Limited, Hong Kong, People’s Republic of China HKD 100.00
BAUER Vietnam Ltd., Ho Chi Minh City, Vietnam VND 100.00
BAUER Foundations Philippines, Inc., Quezon City, Philippines PHP 100.00
BAUER Technologies Far East Pte. Ltd. - (subsidiary consolidated financial statements), Singapore EUR 100.00
BAUER EQUIPMENT SOUTH ASIA PTE. LTD., Singapore EUR 100.00
BAUER Technologies Taiwan Ltd., Taipei, Taiwan TWD 99.88
BAUER Tianjin Technologies Co. Ltd., Tianjin, People's Republic of China CNY 100.00
BAUER Equipment Hong Kong Ltd., Hong Kong, People's Republic of China EUR 100.00

164 NOTES ON THE CONSOLIDATED FINANCIAL STATEMENTS 2016
NAME AND REGISTERED OFFICE OF COMPANY Currency Capital share
in %
Continued: E. Asia-Pacific, Far East and Australia
BAUER Equipment (Malaysia) Sdn. Bhd., Shah Alam, Malaysia MYR 100.00
Shanghai BAUER Technologies Co. Ltd., Shanghai, People's Republic of China CNY 100.00
BAUER Equipment (Shanghai) Co. Ltd., Shanghai, People's Republic of China CNY 100.00
NIPPON BAUER Y.K., Tokyo, Japan JPY 100.00
Inner City (Thailand) Company Limited, Bangkok, Thailand THB 49.00 *
Thai BAUER Co. Ltd., Bangkok, Thailand THB 73.99
BAUER Equipment Australia Pty. Ltd., Baulkham Hills, Australia AUD 100.00
F. Americas
BAUER FUNDACIONES PANAMÁ S.A., Panama City, Panama USD 100.00
BAUER MEXICO, S.A. DE C.V., Mexico City, Mexico MXP 100.00
BAUER Resources Canada Ltd., Edmonton, Canada CAD 100.00
BAUER Foundations Canada Inc., Calgary, Canada CAD 100.00
BAUER FOUNDATION CORP., Odessa, Florida, United States of America USD 100.00
BAUER Resources Chile Limitada - (subsidiary consolidated financial statements),
Santiago de Chile, Chile CLP 100.00
GWE Tubomin S.A., Santiago de Chile, Chile CLP 60.00
BAUER Machinery USA Inc., Conroe, United States of America USD 100.00
BAUER-Pileco Inc., Woodlands, United States of America USD 100.00
G. Africa
BAUER EGYPT S.A.E. Specialised Foundation Contractors, Cairo, Egypt EGP 55.75
BAUER Technologies South Africa (PTY) Ltd. (subsidiary consolidated financial statements),
Midrand, South Africa ZAR 100.00
MINERAL BULK SAMPLING NAMIBIA (PTY) LTD, Windhoek, Namibia NAD 100.00
MINERAL BULK SAMPLING SOUTH AFRICA (PTY) LTD, Midrand, South Africa ZAR 100.00
BAUER RESOURCES GHANA LIMITED, Accra, Ghana GHS 100.00
BAUER Resources Maroc S.A.R.L., Kenitra, Morocco MAD 100.00
BAUER Resources Senegal SARL, Dakar, Senegal XOF 100.00
2. Companies in the expanded basis of consolidation
A. Germany
Harz Hotel Grimmelallee Nordhausen Beteiligungsgesellschaft mbH, Nordhausen, Germany EUR 100.00
Schacht- und Bergbau Spezialgesellschaft mbH, Mülheim an der Ruhr, Germany EUR 50.00
pumpenboese Beteiligungs- und Verwaltungs GmbH, Peine, Germany EUR 100.00
B. International
First Asian Limited, Hong Kong, People’s Republic of China HKD 100.00
BAUER Ukraine TOV, Kiev, Ukraine UAH 100.00
BAUER Angola Lda., Luanda, Angola AOA 100.00
BAUER Specialized Foundation Contractor India Pvt. Ltd., New Delhi, India INR 100.00
BAUER Fondations Spéciales EURL, Algiers, Algeria DZD 100.00
BAUER Leasing Services LLC, Odessa, United States of America USD 100.00
BAUER Cimentaciones Costa Rica S.A., Alajuela, Costa Rica CRC 100.00
BAUER Engineering International Ltd., Dubai, United Arab Emirates AED 100.00

165NOTES ON THE CONSOLIDATED FINANCIAL STATEMENTS 2016
CO
NS
OL
IDA
TE
D F
INA
NC
IAL
STA
TE
ME
NT
S2
01
6
NAME AND REGISTERED OFFICE OF COMPANY Currency Capital share
in %
Continued: B. International
BAUER Libyan Egyptian Specialized Corporate for Technical Engineering Works, Tripoli, Libya LYD 36.00
BAUER FUNDACIONES DOMINICANA, S.R.L., Santo Domingo, Dominican Republic DOP 100.00
TOO BAUER KASACHSTAN, Almaty, Kazakhstan KZT 100.00
BAUER Fundaciones Colombia S.A.S., Bogota, Colombia COP 100.00
BAUER Fundaciones America Latina S.A., Panama City, Panama USD 100.00
BAUER Iraq for Construction Contracting LLC, Baghdad, Iraq IQD 100.00
BAUER Special Foundations FZE, Dubai, United Arab Emirates AED 100.00
BAUER Maschinen Ukraine TOV, Kiev, Ukraine UAH 100.00
BRASBAUER Equipamentos de Perfuração Ltda., Sao Paulo, Brazil BRL 60.00
BAUER Equipamentos do Brasil – Comércio e Importacao Ltda., Sao Paulo, Brazil BRL 100.00
BAUER Equipamientos de Panama S.A., Panama City, Panama PAB 100.00
BAUER Maschinen Canada Ltd., Acheson, Canada CAD 100.00
BAUER Parts HUB (Singapore) Pte. Ltd., Singapore EUR 100.00
BAUER Machines SAS, Strasbourg, France EUR 100.00
OOO TRAKMECHANIKA, Yaroslavl, Russian Federation RUB 100.00
GERMAN WATER & ENERGY PAKISTAN (PRIVATE) LIMITED, Islamabad, Pakistan PKR 100.00
GWE Togo S.A., Lomé, Togo XOF 97.90
BAUER Resources Saudi LLC, Al Khobar, Saudi Arabia SAR 100.00
3. Associated companies and joint ventures
A. Germany
TMG Tiefbaumaterial GmbH, Emmering, Germany EUR 50.00
NDH Entsorgungsbetreibergesellschaft mbH, Bleicherode, Germany EUR 25.00
Grunau und Schröder Maschinentechnik GmbH, Drolshagen, Germany EUR 30.00
SPANTEC Spann- & Ankertechnik GmbH, Schrobenhausen, Germany EUR 40.00
BAUER Deep Drilling GmbH, Schrobenhausen, Germany EUR 51.00
B. International
TERRABAUER S. L., Madrid, Spain EUR 30.00
Bauer + Moosleitner Entsorgungstechnik GmbH, Salzburg, Austria EUR 50.00
BAUER Nimr LLC, Maskat - Al Mina, Sultanate of Oman OMR 52.50
BAUER Manufacturing LLC, Conroe, United States of America USD 51.00
TOO SCHACHTBAU Kazakhstan, Almaty, Kazakhstan KZT 50.00
4. Enterprises in which the company has participating interests
A. Germany
Wöhr + Bauer GmbH, Munich, Germany EUR 16.65
Nordhäuser Bauprüfinstitut GmbH, Nordhausen, Germany EUR 20.00
Stadtmarketing Schrobenhausen e.G., Schrobenhausen, Germany EUR 4.13
B. International
OAO Mostostrojindustria, Moscow, Russian Federation RUB 15.00
* Commercial ownership is 100 %
The complete list of shareholdings in accordance with section 313 of the German Commercial Code (HGB) is published in the
electronic version of the official Gazette Bundesanzeiger of the Federal Republic of Germany.

166
Assurance by the legal representatives
We hereby assure that, to the best of our knowledge, the consolidated financial statements give a true and fair view of the net
assets, financial position and earnings of the company in accordance with the accounting principles applicable to financial
reporting, and that the Combined Management Report depicts the course of business, including the earnings and overall
situation of the Group, in such a way that a true and fair view is conveyed and the material opportunities and risks of the
foreseeable development of the Group are set out.
Schrobenhausen, March 31, 2017
The Management Board
Prof. Thomas Bauer Dipl.-Betriebswirt (FH) Hartmut Beutler Peter Hingott
Chairman of the Management Board

167
CO
NS
OL
IDA
TE
D F
INA
NC
IAL
STA
TE
ME
NT
S2
01
6C
ON
SO
LID
AT
ED
FIN
AN
CIA
L S
TA
TE
ME
NT
S2
01
6
Audit opinion
“We have audited the consolidated financial statements prepared by BAUER Aktiengesellschaft, Schrobenhausen, comprising
the balance sheet, the income statement and statement of comprehensive income, statement of changes in equity, cash
flow statement and the notes to the consolidated financial statements, together with the Group management report for
the financial year from January 1 to December 31, 2016. The preparation of the consolidated financial statements and the
Group management report in accordance with the IFRS, as adopted by the EU, and the additional requirements of German
commercial law pursuant to § (Article) 315a, Abs. (paragraph) 1 HGB (“Handelsgesetzbuch”: German Commercial Code) are
the responsibility of the parent company’s Management Board. Our responsibility is to express an opinion on the consolidated
financial statements and the Group management report, based on our audit.
We conducted our audit of the consolidated financial statements in accordance with § 317 HGB and the generally accepted
German standards for the audit of financial statements promulgated by the Institut der Wirtschaftsprüfer (Institute of Public
Auditors in Germany) (IDW). Those standards require that we plan and perform the audit such that misstatements materially
affecting the presentation of the net assets, financial position and results of operations in the consolidated financial statements in
accordance with the applicable financial reporting framework and in the Group management report are detected with reasonable
assurance. Knowledge of the business activities and the economic and legal environment of the Group and expectations as to
possible misstatements are taken into account in the determination of audit procedures. The effectiveness of the accounting-
related internal control system and the evidence supporting the disclosures in the consolidated financial statements and the
Group management report are examined primarily on a test basis within the framework of the audit. The audit includes assessing
the annual financial statements of those entities included in consolidation, the determination of the entities to be included in
consolidation, the accounting and consolidation policies used and significant estimates made by the company’s Management
Board, as well as evaluating the overall presentation of the consolidated financial statements and the Group management
report. We believe that our audit provides a reasonable basis for our opinion.
Our audit has not led to any reservations.
In our opinion, based on the findings of our audit, the consolidated financial statements comply with the IFRS as adopted by
the EU and the additional requirements of German commercial law pursuant to Paragraph 315a, Sub-paragraph 1 HGB, and
give a true and fair view of the net assets, financial position and results of operations of the Group in accordance with these
requirements. The Group management report is consistent with the consolidated financial statements, complies with the law,
and as a whole provides a suitable view of the Group’s position, and suitably presents the opportunities and risks of future
development.”
Stuttgart, March 31, 2017
PricewaterhouseCoopers GmbH
Wirtschaftsprüfungsgesellschaft (auditing firm)
Klaus Neubarth ppa. Bernd Adamaszek
Auditor Auditor

168
IMPRINT
Published by
BAUER Aktiengesellschaft
BAUER-Strasse 1
86529 Schrobenhausen, Germany
www.bauer.de
Photos
BAUER Group
Press photo Roche (p. 3)
Contact
Investor Relations
BAUER Aktiengesellschaft
BAUER-Strasse 1
86529 Schrobenhausen, Germany
Tel.: +49 8252 97-1218
Fax: +49 8252 97-2900
Registered place of business
86529 Schrobenhausen, Germany
Registered at the District Court of
Ingolstadt under HRB 101375
Mayer & Söhne Druck- und Medien-
gruppe GmbH & Co. KG,
Aichach
http://ir.bauer.de
This Annual Report is published in
German and English.
168

>>>
GR
OU
P K
EY
FIG
UR
ES
: IN
CO
ME
STA
TE
ME
NT
AN
D B
AL
AN
CE
SH
EE
T
Construction Equipment Resources
The Resources segment is focused on
products and services in the areas of water,
environment and natural resources. BAUER
Resources GmbH is the holding company,
under the umbrella of which the subsidiaries
operate as full-service providers. The com-
petence centers of Industrial Waste Water
Treatment, Automation, Remediation & Waste
Treatment, Drilling Technologies, Water Well
Design & Construction and Constructed
Wetlands pool their expertise and support
the subsidiaries in carrying out projects.
BAUER Spezialtiefbau GmbH, the original
parent company of the BAUER Group, has
been a major driving force in the development
of specialist foundation engineering, and
carries out projects all over the world. Bauer
Spezialtiefbau is organized on a regional basis
in Germany, and operates on all the world's
continents with over 50 subsidiaries and
branch offices. Market trends have meant that
most of the company’s revenues are now gen-
erated outside of Germany. Bauer has major
subsidiaries and branch offices in the United
Arab Emirates, Malaysia, Egypt and the USA
among other locations. Bauer Spezialtiefbau
has built up networks in numerous regions
across the world, enabling it to acquire and
execute contracts both in the countries in
which it is represented and in neighbouring
countries, using its own machinery and in-
house engineering consultancy. In addition to
the predominant field of specialist foundation
engineering, Group companies SCHACHTBAU
NORDHAUSEN GmbH, SPESA Spezialbau
und Sanierung GmbH and Wöhr + Bauer
GmbH also carry out general construction ac-
tivities such as civil engineering, environmental
engineering and project development.
The BAUER Maschinen Group is the world
market leader in the development and man-
ufacture of specialist foundation engineering
equipment. BAUER Maschinen GmbH – the
holding company for a number of subsidiaries
– designs and builds heavy-duty drilling rigs,
trench cutters, grab systems, vibrators and
deep drilling rigs, as well as the related tool-
ing, at its plants in Schrobenhausen, Aresing
and Edelshausen. The company also operates
manufacturing facilities in the USA, Russia,
China, Malaysia, Italy, Singapore and Turkey.
It is supplied with components from within the
BAUER Group by Schachtbau Nordhausen
and Olbersdorfer Guß. The BAUER Maschinen
Group operates a global sales and service
network.
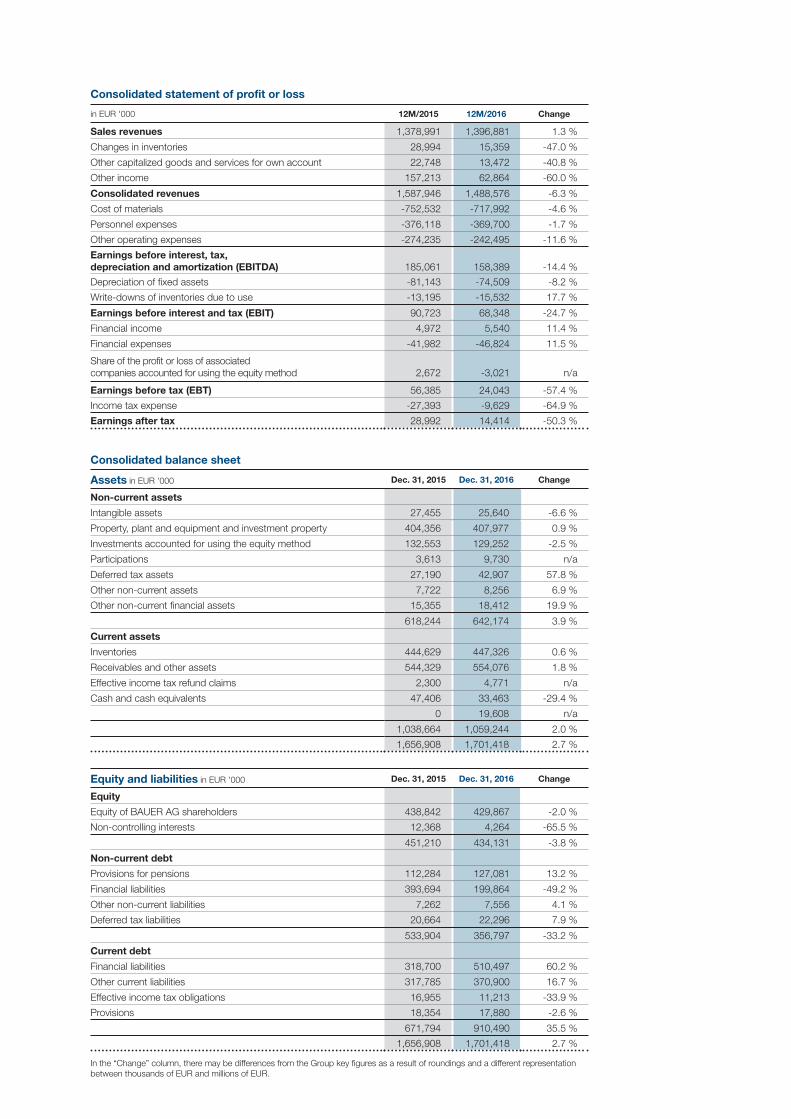
Consolidated statement of profit or loss
in EUR '000 12M/2015 12M/2016 Change
Sales revenues 1,378,991 1,396,881 1.3 %
Changes in inventories 28,994 15,359 -47.0 %
Other capitalized goods and services for own account 22,748 13,472 -40.8 %
Other income 157,213 62,864 -60.0 %
Consolidated revenues 1,587,946 1,488,576 -6.3 %
Cost of materials -752,532 -717,992 -4.6 %
Personnel expenses -376,118 -369,700 -1.7 %
Other operating expenses -274,235 -242,495 -11.6 %
Earnings before interest, tax,
depreciation and amortization (EBITDA) 185,061 158,389 -14.4 %
Depreciation of fixed assets -81,143 -74,509 -8.2 %
Write-downs of inventories due to use -13,195 -15,532 17.7 %
Earnings before interest and tax (EBIT) 90,723 68,348 -24.7 %
Financial income 4,972 5,540 11.4 %
Financial expenses -41,982 -46,824 11.5 %
Share of the profit or loss of associated
companies accounted for using the equity method 2,672 -3,021 n/a
Earnings before tax (EBT) 56,385 24,043 -57.4 %
Income tax expense -27,393 -9,629 -64.9 %
Earnings after tax 28,992 14,414 -50.3 %
Consolidated balance sheet
Assets in EUR '000 Dec. 31, 2015 Dec. 31, 2016 Change
Non-current assets
Intangible assets 27,455 25,640 -6.6 %
Property, plant and equipment and investment property 404,356 407,977 0.9 %
Investments accounted for using the equity method 132,553 129,252 -2.5 %
Participations 3,613 9,730 n/a
Deferred tax assets 27,190 42,907 57.8 %
Other non-current assets 7,722 8,256 6.9 %
Other non-current financial assets 15,355 18,412 19.9 %
618,244 642,174 3.9 %
Current assets
Inventories 444,629 447,326 0.6 %
Receivables and other assets 544,329 554,076 1.8 %
Effective income tax refund claims 2,300 4,771 n/a
Cash and cash equivalents 47,406 33,463 -29.4 %
0 19,608 n/a
1,038,664 1,059,244 2.0 %
1,656,908 1,701,418 2.7 %
Equity and liabilities in EUR '000 Dec. 31, 2015 Dec. 31, 2016 Change
Equity
Equity of BAUER AG shareholders 438,842 429,867 -2.0 %
Non-controlling interests 12,368 4,264 -65.5 %
451,210 434,131 -3.8 %
Non-current debt
Provisions for pensions 112,284 127,081 13.2 %
Financial liabilities 393,694 199,864 -49.2 %
Other non-current liabilities 7,262 7,556 4.1 %
Deferred tax liabilities 20,664 22,296 7.9 %
533,904 356,797 -33.2 %
Current debt
Financial liabilities 318,700 510,497 60.2 %
Other current liabilities 317,785 370,900 16.7 %
Effective income tax obligations 16,955 11,213 -33.9 %
Provisions 18,354 17,880 -2.6 %
671,794 910,490 35.5 %
1,656,908 1,701,418 2.7 %
In the “Change” column, there may be differences from the Group key figures as a result of roundings and a different representation
between thousands of EUR and millions of EUR.

April 13, 2017 Publication Annual Report 2016
Annual Press Conference
Analysts‘ Conference
May 15, 2017 Quarterly Statement Q1 2017
June 29, 2017 Annual General Meeting
August 11, 2017 Half-Year Interim Report to June 30, 2017
November 14, 2017 Quarterly Statement 9M/Q3 2017
Financial calendar 2017

BAUER AktiengesellschaftBAUER-Strasse 1
86529 Schrobenhausen, Germanywww.bauer.de