
Annual Report 2016-17 - Parliament of NSW · WaterNSW Annual Report 2016-17 . We are pleased to...
126
Annual Report 2016-17
Transcript of Annual Report 2016-17 - Parliament of NSW · WaterNSW Annual Report 2016-17 . We are pleased to...

Annual Report 2016-17

The Hon. Dominic Perrottet MP Treasurer and Minister for Industrial Relations GPO Box 5341 Sydney NSW 2001
The Hon. Victor Dominello MP Minister for Finance, Services and Property GPO Box 5341 Sydney NSW 2001
Dear Shareholders
WaterNSW Annual Report 2016-17
We are pleased to submit the WaterNSW Annual Report 2016-17 for presentation to the Parliament of New South Wales.
The report has been prepared in accordance with the Annual Report (Statutory Bodies) Act 1984, the State Owned Corporations Act 1989, the Government Sector Employment Act 2013, the Public Finance and Audit Act 1983 and the Public Finance and Audit Regulation 2010.
Yours sincerely
Anne McDonald David Harris Chair Chief Executive Officer
PO Box 398, Parramatta NSW 2124 Level 14, 169 Macquarie Street
Parramatta NSW 2150 www.waternsw.com.au
ABN 21 147 934 787
pfs
David Signature
pfs
Stamp

Table of Contents
A message from our Chair and Chief Executive 4
About WaterNSW 5
Area of Operations 7
Highlights 8
Water Sales and Storage Levels 13
Financial Performance 14
Audited Financial Statements 15
Appendix 1 – Corporate Governance 94
Appendix 2 – People and Culture 99
Appendix 3 – Legislative Framework and Compliance 102
Appendix 4 – Access to Information 109
Appendix 5 – Customer Response 114
Appendix 6 – Financial Performance 115
Appendix 7 – Risk Management and Insurance 120
Contact Information 126
3
A message from our Chair and Chief Executive In 2016-17 WaterNSW continued our transformative
journey to place customers at the heart of our business. On 1 July we welcomed 207 staff and all customer facing functions for surface and groundwater from DPI Water, marking Stage 2 of the NSW Government’s Bulk Water Reform Program. This established WaterNSW as a ‘one stop shop’ for all NSW rural water customers across both surface and ground water operations. We are proud of the operational efficiencies delivered under the Bulk Water Reform Program. These efficiencies have resulted in lower bills for our customers: from 1 July 2016, WaterNSW contributed $10 of a $100 bill reduction of typical Sydney Water customers; and from 1 July 2017, our rural customers have benefited from bill reductions of more than 10%. In 2016-17, WaterNSW invested $63 million to improve the availability of water resources that are essential for the people of NSW. Our expertise in delivering infrastructure solutions has been recognised by the NSW Government, who have selected WaterNSW to deliver key infrastructure projects including the Broken Hill Pipeline, and the technical investigations to inform Government’s final business case for raising Warragamba Dam to address flood risk in the Hawkesbury-Nepean valley. WaterNSW is in a strong financial position, reporting a net profit after tax of $100 million. This result was achieved in an environment of falling prices and operating efficiencies, and will see $38.2 million returned to our shareholders in dividends. On behalf of the Board, we would like to thank our employees for their dedication and commitment to delivering our essential services to all of our customers and stakeholders across NSW.
Anne McDonald Chair
David Harris Chief Executive
4
About WaterNSW Who we are WaterNSW is a State-Owned Corporation established under the Water
NSW Act 2014 and operates under an Operating Licence issued and monitored by the Independent Pricing and Regulatory Tribunal (IPART). We are NSW’s bulk water supplier, river operator and one stop shop
for licensing, water trades and water information. We supply two thirds of water used in NSW from our 42 dams, rivers
and pipelines to regional towns, irrigators, Sydney Water Corporation and local water utilities.
We own and operate the largest surface and groundwater monitoring network in the southern hemisphere and build, maintain and operate essential infrastructure.
What we do Our purpose is to improve the availability of water that is essential for our customers and the communities of NSW. We achieve our purpose through four key activities: being the State’s bulk water supplier and river operator; providing water entitlement and allocation holders and the community
as a whole with “one stop shop” licensing, water trade services, information on surface and groundwater quantity and water quality;
protection of the Greater Sydney drinking water catchment to ensure safe water is supplied to Sydney Water for treatment and distribution to its customers; and
planning, developing, owning and operating infrastructure to increase the reliability and security of water supplies.
Working in partnership
NSW Health regulates WaterNSW actions and activities related to the supply of bulk water to Sydney Water and our other customers within the Greater Sydney drinking water catchment. This ensures we protect the health of declared drinking water catchments that supply among the highest quality water in the world. WaterNSW works closely and collaboratively with the Department of Primary Industries (DPI) Water, a NSW Government department that is the State’s water resource regulator. DPI Water is responsible for the long term regulation of the State’s water resources.
5

Our unique expertise
In addition to expertise that supports and enables us to efficiently and effectively carry out our four key activities, WaterNSW has developed unique and specialist in-house expertise in two areas: through scientific research, understanding the causes of water quality
events and being able to predict those events in advance to enable appropriate operational responses; and
developing water system operational tools and bespoke customer information applications using data from our surface and groundwater monitoring network.
Our values
Think Customer In every decision we make, we consider the benefit to our customers Drive Change We are open to change and always improve the way we do things Deliver Excellence We take pride in individual and corporate excellence Value Our People We keep people safe, treat them with dignity and respect and we are committed to growing our people Own It We do what we say we will do and we take ownership of our actions Achieve Together We support each other and work together as one team
6

Area of Operations
Greater Sydney
Key Facts and Figures Customers Regulated ~12,000 licences Groundwater ~10,000 licences Unregulated ~15,000 licences Operations 42 dams 280 weirs 30 regulated rivers over 7,000 km 14 regulated valleys
7
Highlights For our customers
Lower Prices The Independent Pricing and Regulatory Tribunal (IPART) determination for Rural Valley customers from July 2017 to June 2021 will result in lower prices. Usage charges will fall in all 13 Rural Valleys, with fixed charges falling in eight valleys. IPART confirmed that this lower cost based is a result of WaterNSW’s streamlined operations combined with innovation and rigorous scrutiny of all spending. This positive outcome builds on the savings delivered to Greater Sydney customers from 1 July 2016, when price reductions contributed $10 of a $100 bill reduction of typical Sydney Water customers.
Improved Service We launched Project Skyline, our flagship corporate program to ensure customers and communities are at the heart of all our business decisions. We challenge our employees to realign their daily actions with our Corporate Values, including ‘Think Customer’.
Greater Choice WaterNSW introduced a number of new information services to allow customers to choose how they receive important information, data and insights. We continue to increase customer choice and ‘opt in’ subscriptions for water market / system notifications and publications that already include IVT Trade Notifications, Algae Alerts and Weekly Water Availability Reports.
Protecting the Sydney Drinking Water Catchment WaterNSW committed $4.8 million to a new long-term program to reduce risks to water quality from grazing and erosion impacts in the Greater Sydney Drinking Water Catchment. With our project delivery partners and individual landholders also contributing, the on-ground improvements will help tackle one of the greatest risks to water quality in the catchment.
8
For our customers
Minimising Impacts of Flood During September and October some of our customers and their communities across multiple valleys experienced some of the worst floods in the last 100 years. WaterNSW worked closely with the Bureau of Meteorology, NSW State Emergency Service, local councils and other stakeholders in accordance with established rules and protocols throughout the rainfall events to minimise the impact of flooding on our customers and communities. An independent review of flood impacts in the Lachlan Valley found that the well-trained flood operations teams had operated Wyangala Dam to deliver significant mitigation outcomes.
Investment in Assets In 2016-17, $63 million was invested in assets by WaterNSW including delivery of a number of projects: completion of major renewal works at Berembed Weir ahead of
schedule to improve the safety and reliability of its operation; substantial completion of the dam safety upgrade works at Wyangala
Dam; and substantial completion of a project to refurbish the Prospect Dam
Outlet works.
Additionally progress was made against a number of multi-year projects: the contract to upgrade the reliability of electrical infrastructure of the
Metropolitan Dams has been awarded; a project to upgrade the reliability and efficiency of the Burrawang
Pump Station is 50% complete; the contract for the post tensioning works at Keepit Dam has been
awarded; and the second stage of major renewal and refurbishment works on the
Upper Canal progressed to the concept design stage.
9

Reliable Water We continue to deliver our core product – water – to the highest standards: 100% of water deliveries were made in the quantities and time required; 100% of water delivered to Sydney Water met the quality standards
specified in the Raw Water Supply Agreement; 100% of water supplied for treatment complied with health guidelines; operational losses in Rural Valleys of 3.5% were lower than the target of
5%; and 99.9% of environmental flow requirements were delivered.
Planning for the Future Our assets are long-lived assets, and WaterNSW takes a long term view to demonstrate that our capital and operational investment decisions are prudent and efficient. In 2016-17 we updated our 20 Year Infrastructure Strategy, identifying infrastructure solutions based on multi-criteria assessment to address identified opportunities to improve Levels of Service in each valley. WaterNSW is also undertaking a number of feasibility studies on behalf of the NSW Government, including: water security options in the Lachlan Valley to address water security
issues identified in the NSW State Infrastructure Strategy update, 2014;
A new or augmented Dungowan Dam, exploring options to secure long term water security and flood management benefits for the regional city of Tamworth;
Mole River Valley, exploring options to improve long term water secuirty and availability to water users in the Border Rivers catchment; and
Preliminary hydrological modelling and engineering investigations to develop projects that efficiently deliver increased and sustainable water security improvements for the Upper Hunter, Gwydir and Macquarie Valleys; with financial support from the NSW State Infrastructure Strategy Priority Catchments Program.
10
For our shareholder
Water Reform On 1 July 2016 all customer facing functions, operational functions, and the management of surface and groundwater transferred from DPI Water to WaterNSW. This successful execution of the NSW Government’s Bulk Water Reform Program positions WaterNSW as the single point of contact for customers to manage their business, while delivering operating efficiencies for our shareholders.
Water Security WaterNSW has been directed by the NSW Government to secure Broken Hill’s drinking water security through the construction, ownership and operation of a 270km pipeline from the River Murray at Wentworth to Essential Water’s water treatment plant in Broken Hill. Project completion is anticipated in December 2018.
Financial Performance Higher regulated water sales combined with lower operating expenditure have resulted in a net profit after tax of $100 million, $43 million higher than budget.
11
For our organisation
Safety First Safety remains our highest priority. During 2016-17, we continued to embed contemporary Work Health and Safety (WHS) procedures across all worksites, along with the rollout of behavioural safety and leadership training.
Single Operating Licence From 1 July 2017 a new, single WaterNSW Operating Licence 2017-22 will replace the State Water and Sydney Catchment Authority operating licences. The single operating licence delivers greater clarity and transparency for customers and the community on our functions and performance and the opportunity to reduce costs through operational and administrative efficiencies.
Quality Systems Our asset management, environmental management, information
security management and work health and safety systems have been certified to global standards.
We commenced a project to consolidate our information management systems into a single, contemporary system which will be completed in 2017-18.
Sydney Office Consolidation We consolidated our three Sydney offices into a single location at 169 Macquarie Street Parramatta (1PSQ), bringing together around 300 employees and situating us next to our biggest customer, Sydney Water.
12

Water Sales and Storage Levels Water sales (GL)
Water sales have been strong this year. In Greater Sydney increased demand
from a hot and dry summer saw strong sales flow through to autumn months.
In Rural Valleys, a significantly wet start to the year increased water availability. Combined with dry weather from January 2017, this resulted in higher water sales than previous years.
Water storage levels (GL)
3,7762,904
5,119
516
526
557
0
1,000
2,000
3,000
4,000
5,000
6,000
2014-15 2015-16 2016-17
Rural Greater Sydney
-
500
1,000
1,500
2,000
2,500
3,000
June 16 June 17
Greater Sydney
-
5,000
10,000
15,000
20,000
June 16 June 17
Rural
-
1,000
2,000
3,000
4,000
June 16 June 17
Northern Valleys
-
1,000
2,000
3,000
4,000
June 16 June 17
Central Valleys
-
2,500
5,000
7,500
10,000
12,500
June 16 June 17
Southern Valleys
-
250
500
750
1,000
1,250
June 16 June 17
Coastal Valleys
13
Financial Performance
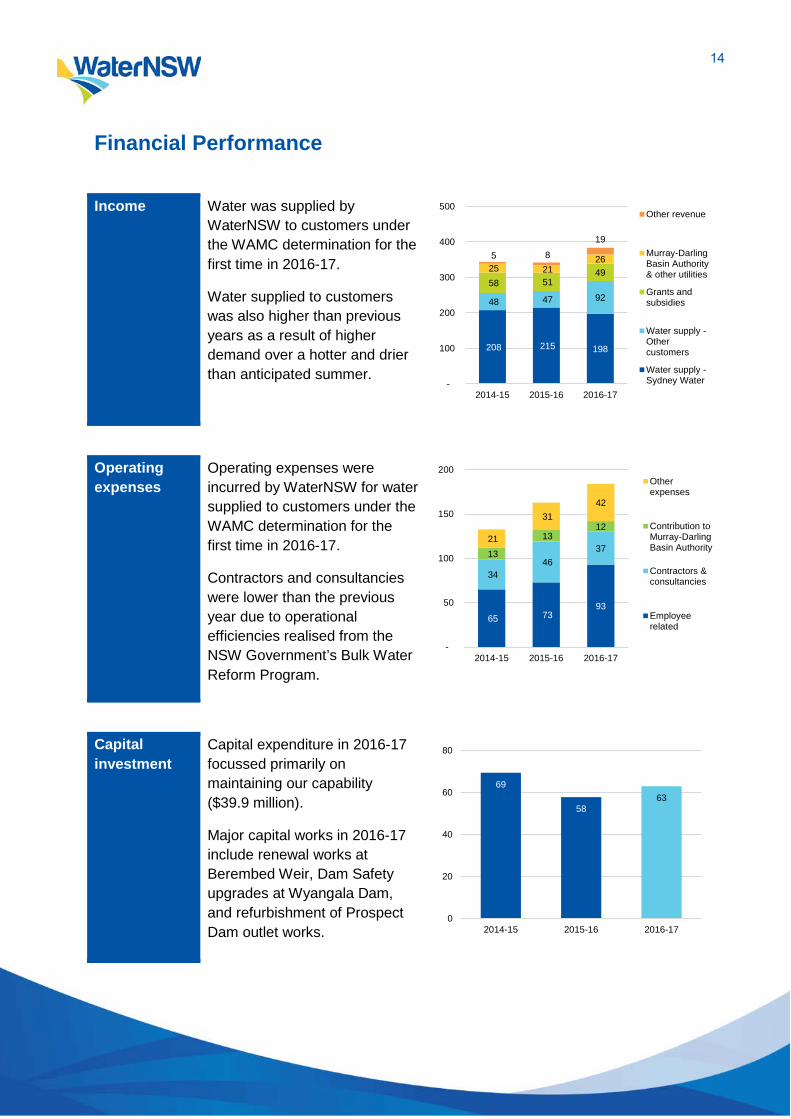
Income Water was supplied by WaterNSW to customers under the WAMC determination for the first time in 2016-17.
Water supplied to customers was also higher than previous years as a result of higher demand over a hotter and drier than anticipated summer.
Operating expenses
Operating expenses were incurred by WaterNSW for water supplied to customers under the WAMC determination for the first time in 2016-17.
Contractors and consultancies were lower than the previous year due to operational efficiencies realised from the NSW Government’s Bulk Water Reform Program.
Capital investment
Capital expenditure in 2016-17 focussed primarily on maintaining our capability ($39.9 million).
Major capital works in 2016-17 include renewal works at Berembed Weir, Dam Safety upgrades at Wyangala Dam, and refurbishment of Prospect Dam outlet works.
208 215 198
48 47 9258 51
4925 21 265 8 19
-
100
200
300
400
500
2014-15 2015-16 2016-17
Other revenue
Murray-DarlingBasin Authority& other utilities
Grants andsubsidies
Water supply -Othercustomers
Water supply -Sydney Water
65 73 93
34 46
3713
13 12
21
31 42
-
50
100
150
200
2014-15 2015-16 2016-17
Otherexpenses
Contribution toMurray-DarlingBasin Authority
Contractors &consultancies
Employeerelated
69
5863
0
20
40
60
80
2014-15 2015-16 2016-17
14
Audited Financial Statements
15
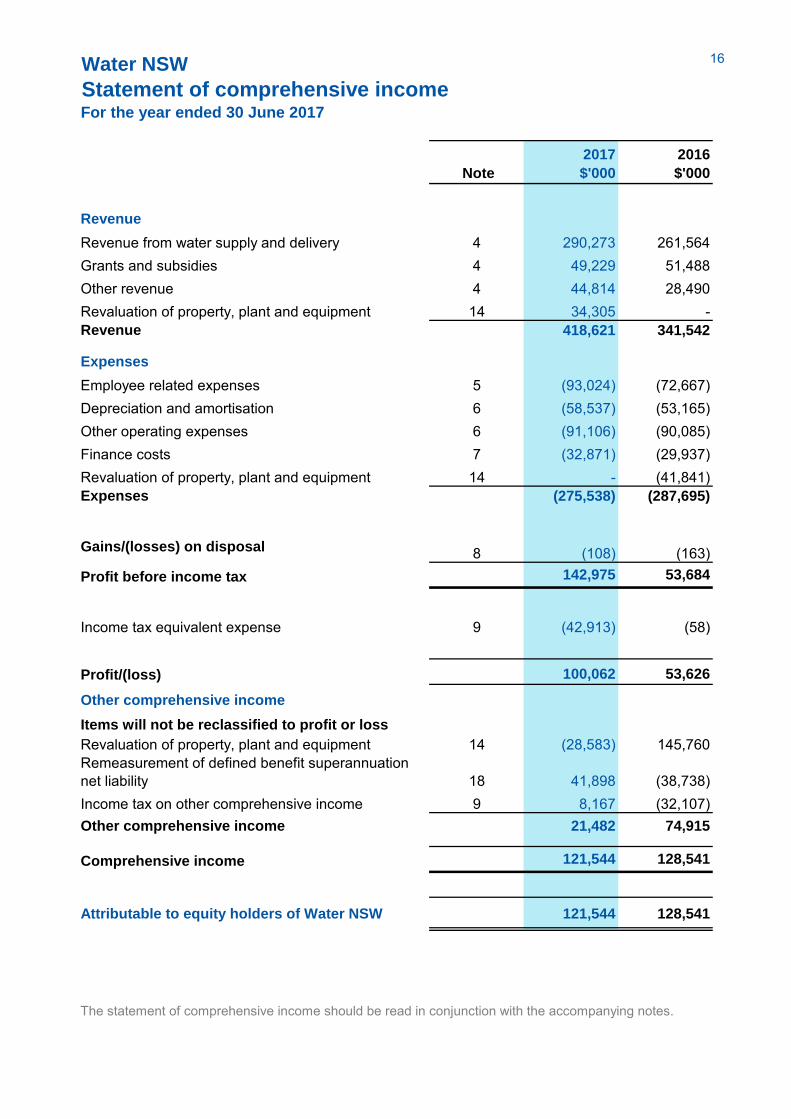
Water NSW
Statement of comprehensive income For the year ended 30 June 2017
Note
2017
$'000
2016
$'000
Revenue
Revenue from water supply and delivery 4 290,273 261,564Grants and subsidies 4 49,229 51,488Other revenue 4 44,814 28,490Revaluation of property, plant and equipment 14 34,305 -Revenue 418,621 341,542
Expenses
Employee related expenses 5 (93,024) (72,667)Depreciation and amortisation 6 (58,537) (53,165)Other operating expenses 6 (91,106) (90,085)Finance costs 7 (32,871) (29,937)Revaluation of property, plant and equipment 14 - (41,841)Expenses (275,538) (287,695)
Gains/(losses) on disposal 8 (108) (163)Profit before income tax 142,975 53,684
Income tax equivalent expense 9 (42,913) (58)
Profit/(loss) 100,062 53,626
Other comprehensive income
Items will not be reclassified to profit or loss
Revaluation of property, plant and equipment 14 (28,583) 145,760Remeasurement of defined benefit superannuation net liability 18 41,898 (38,738)Income tax on other comprehensive income 9 8,167 (32,107)Other comprehensive income 21,482 74,915
Comprehensive income 121,544 128,541
Attributable to equity holders of Water NSW 121,544 128,541
The statement of comprehensive income should be read in conjunction with the accompanying notes.
16

Water NSW
Statement of financial positionAs at 30 June 2017
Note
2017
$'000
2016
$'000
ASSETS
Current assets
Cash and cash equivalents 10 189,218 194,698Trade and other receivables 11 83,439 39,925Other non-financial assets 12 9,005 2,676Current assets 281,662 237,299
Non-current assets
Other non-financial assets 12 238 458Intangible assets 13 12,280 13,970Property, plant and equipment 14 2,268,519 2,258,425Non-current assets 2,281,037 2,272,853
ASSETS 2,562,699 2,510,152
LIABILITIES
Current liabilities
Trade and other payables 15 51,531 60,937Other liabilities 16 34,073 45,896Borrowings 17 51,422 36,380Current tax liabilities 9 12,697 -Provisions 18 82,091 89,730Current liabilities 231,814 232,943
Non-current liabilities
Borrowings 17 614,384 621,896Other liabilities 16 99,375 105,788Provisions 18 129,595 140,001Deferred tax liabilities 9 163,552 148,256Non-current liabilities 1,006,906 1,015,941
LIABILITIES 1,238,720 1,248,884
NET ASSETS 1,323,979 1,261,268
EQUITY
Contributed equity 1,042,883 1,063,516Retained earnings 122,861 19,508Asset revaluation reserve 158,235 178,244EQUITY 1,323,979 1,261,268
The statement of financial position should be read in conjunction with the accompanying notes.
17

Water NSW
Statement of changes in equity
Note
2017
$'000
2016
$'000
2017
$'000
2016
$'000
2017
$'000
2016
$'000
2017
$'000
2016
$'000
Balance at beginning of the period 1,063,516 1,063,516 19,508 54,998 178,244 74,813 1,261,268 1,193,327
Comprehensive income
Profit for the period - - 100,062 53,626 - - 100,062 53,626
Revaluation of property, plant and equipment 14 - - - - (28,583) 145,760 (28,583) 145,760Remeasurement of defined benefit superannuation liability 18 - - 41,898 (38,738) - 41,898 (38,738)
Income tax on other comprehensive income 9 - (407) 11,621 8,574 (43,728) 8,167 (32,107)
Adjustments (1,399) 1,399 - -
Comprehensive income for the year - - 141,553 25,110 (20,009) 103,431 121,544 128,541
Transactions with owners in their capacity as
owners
Increase (decrease) in net assets from equity transfers - NSW Department of Industry 20 (20,633) - - - - - (20,633) -Dividend paid or provided for 18 - - (38,200) (60,600) - (38,200) (60,600)Transactions with owners in their capacity as
owners(20,633) - (38,200) (60,600) - - (58,833) (60,600)
Balance at the end of the period 1,042,883 1,063,516 122,861 19,508 158,235 178,244 1,323,979 1,261,268
The statement of changes in equity should be read in conjunction with the accompanying notes.
Retained earnings Asset revaluation reserve Total equity
For the year ended 30 June 2017
Contributed equity
18
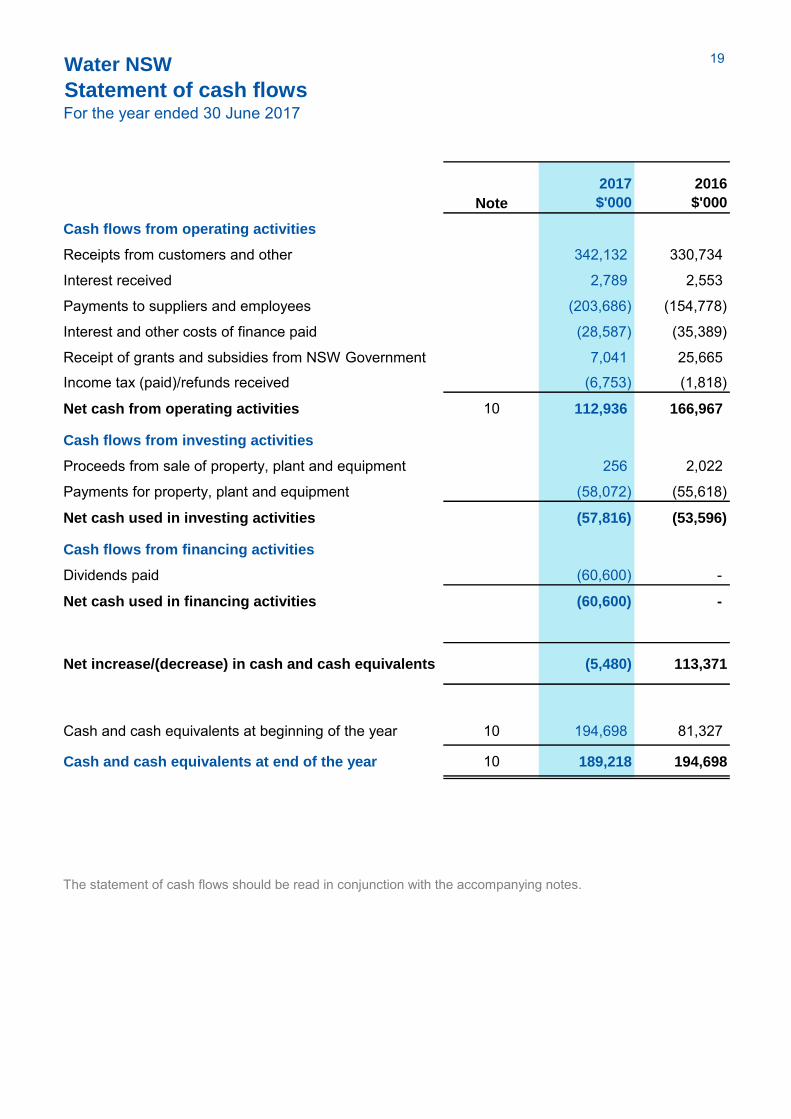
Water NSW
Statement of cash flows For the year ended 30 June 2017
Note
2017
$'000
2016
$'000
Cash flows from operating activities
Receipts from customers and other 342,132 330,734
Interest received 2,789 2,553
Payments to suppliers and employees (203,686) (154,778)
Interest and other costs of finance paid (28,587) (35,389)
Receipt of grants and subsidies from NSW Government 7,041 25,665
Income tax (paid)/refunds received (6,753) (1,818)
Net cash from operating activities 10 112,936 166,967
Cash flows from investing activities
Proceeds from sale of property, plant and equipment 256 2,022
Payments for property, plant and equipment (58,072) (55,618)
Net cash used in investing activities (57,816) (53,596)
Cash flows from financing activities
Dividends paid (60,600) -
Net cash used in financing activities (60,600) -
Net increase/(decrease) in cash and cash equivalents (5,480) 113,371
Cash and cash equivalents at beginning of the year 10 194,698 81,327
Cash and cash equivalents at end of the year 10 189,218 194,698
The statement of cash flows should be read in conjunction with the accompanying notes.
19

Water NSW
Notes to the financial statements For the year ended 30 June 2017
1 Corporate information
Water NSW is a statutory State Owned Corporation domiciled in Australia and constituted under the Water NSW Act 2014 (the Act). The Act facilitated the transfer of assets, rights and liabilities of the Sydney Catchment Authority (SCA) to Water NSW effective 1 January 2015. Water NSW’s ultimate parent is the NSW Government. The financial results, financial position and cash flows are consolidated as part of the NSW Total State Sector Accounts. The principal objectives of Water NSW as defined in the Act are:
to capture, store and release water in an efficient, safe and financially responsible manner;
to supply water in compliance with appropriate standards of quality; to ensure that declared catchment areas and water management works in such areas
are managed and protected so as to promote water quality, the protection of public health and public safety, and the protection of the environment;
to provide for the planning, design, modelling and construction of water storages and other water management works; and
to maintain and operate the works of Water NSW efficiently and economically and in accordance with sound commercial principles.
Water NSW operates under the commercial disciplines of the NSW Government’s Commercial Policy Framework and accordingly the directors have determined that Water NSW is a for-profit entity for financial reporting purposes. Water NSW financial statements for the year ended 30 June 2017 were authorised for issue in accordance with a resolution of the board of directors on 27 September 2017. The significant accounting policies that have been adopted in the preparation of the financial statements are detailed below. 2 Summary of significant accounting policies
(a) Basis of preparation
The financial statements are general purpose financial statements that have been prepared on a going concern basis in accordance with:
applicable Australian Accounting Standards (AAS) (which include Australian Accounting Interpretations);
applicable International Financial Reporting Standards; Financial Reporting Directions mandated by the Treasurer; and the requirements of the Part 3 of the Public Finance and Audit Act 1983, the associated
requirements of the Public Finance and Audit Regulation 2015 and the State Owned Corporations Act 1989.
In preparing these financial statements, the accounting policies described below are based on the requirements applicable to for-profit entities in these mandatory and statutory requirements.
20
tes to the financial statements
For the year ended 30 June 2017
Property, plant and equipment, investment property, assets (or disposal groups) held for sale and financial assets at 'fair value through profit or loss' and available for sale are measured at fair value. Other financial statement items are prepared in accordance with the historical cost convention except where specified otherwise. The financial statements are presented in Australian dollars and all values are rounded to the nearest thousand dollars ($’000). The accounting policies set out below have been consistently applied by Water NSW to all periods presented in the financial statements. Judgements, key assumptions and estimations that management has made in the preparation of the financial statements are disclosed in the relevant notes to the financial statements. Judgements and estimates made by management in the application of Australian Accounting Standards that have significant effect on the financial statements are included in the following notes:
Note 9 – Deferred tax assets and deferred tax liabilities; Note 14 – Fair value of property, plant and equipment; Note 18 – Employee benefits and other provisions, including defined benefit superannuation
obligations; and Note 20 – Equity transfer following administrative restructure at fair value.
(b) Comparative information
Where relevant, comparative amounts are restated to conform to the current reporting period’s presentation. This could arise as a result of the requirements of new or revised Australian Accounting Standards and Australian Accounting Interpretations, a voluntary change in accounting policy or a reclassification of items presented. Where this occurs, the nature, amount and reason for the reclassification is included in the notes to the financial statements. (c) Revenue
Water NSW recognises revenue from the rendering of water delivery services when it is probable that economic benefits will flow to Water NSW and the revenue can be reliably measured. Revenue is measured at the fair value of consideration received or receivable. Water supply revenue
Water NSW provides water services to its customers under the conditions of their licences. Revenue from rendering of these services comprises both fixed and variable charges. The fixed component is charged according to each licence entitlement, whereas the variable component is charged according to actual consumption and use by the licence holder. The variable usage charges are recognised when the services are provided. Government grants and subsidies revenue
Water NSW receives Government funding for agreed activities and for past and future capital investment.
21
tes to the financial statements
For the year ended 30 June 2017
Grants and subsidies that are receivable for expenses incurred or revenue foregone are recognised as revenue in profit or loss on a systematic basis over the periods for which the grant or subsidy is to apply. Income for government funded projects is recognised once all attached conditions of the funding agreement have been satisfied. Funds received in advance or in excess of funding agreements are held as a liability. For funding received relating to the construction of capital assets, the total grant amount received is treated as deferred revenue until the asset to which it relates is complete. Upon completion of the asset the deferred revenue is then recognised in profit or loss on a systematic basis over the useful life of the asset. Interest revenue
Interest revenue is recognised using the effective interest method as set out in AASB 139 ‘Financial Instruments: Recognition and Measurement’. Rental income
Rental income from leased properties is recognised on a straight line basis over the term of the lease. Incentives granted over leased properties are recognised as an integral part of the total rent income. Rendering of other services
Service revenue is recognised on an accrual basis and in accordance with the substance of the agreement covering such transactions. Disposal of property, plant and equipment
Gains or losses on disposals are determined by comparing proceeds with the asset’s carrying amount. The net gain or loss on the disposal of assets is included in profit or loss. Where an asset that has been previously revalued is disposed, any balance remaining in the asset revaluation reserve in respect of that asset is transferred to retained earnings.
(d) Expenses
Expenses are recognised in profit or loss when incurred. Expenses include items that are incurred in the course of ordinary activities as well as various losses that arise from either disposal of property plant and equipment, impairment of assets or the re-measurement to fair value of some items as at reporting date that are required to be recognised in the profit or loss as per relevant applicable Australian Accounting Standards and Australian Accounting Interpretations. Depreciation of property, plant and equipment
Depreciation is provided for on a straight-line basis for all depreciable assets so as to write off the depreciable amount of each asset as it is consumed over its useful life to the entity.
22
tes to the financial statements
For the year ended 30 June 2017
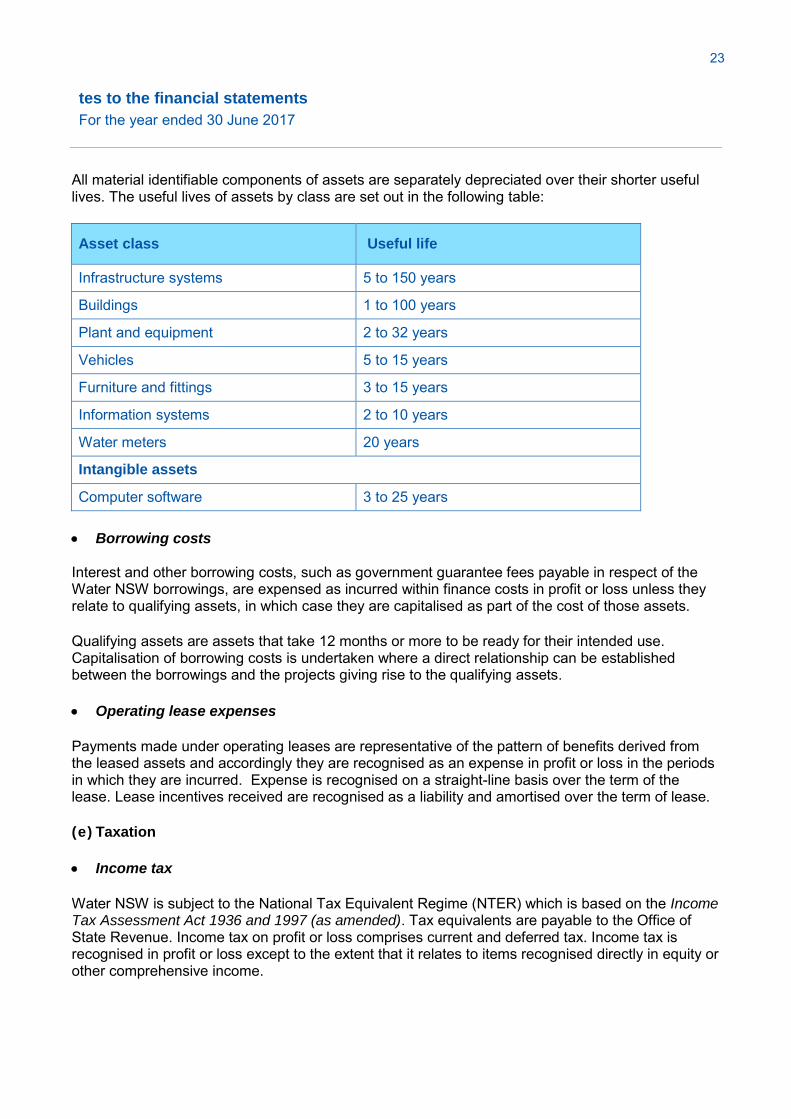
All material identifiable components of assets are separately depreciated over their shorter useful lives. The useful lives of assets by class are set out in the following table:
Asset class Useful life
Infrastructure systems 5 to 150 years
Buildings 1 to 100 years
Plant and equipment 2 to 32 years
Vehicles 5 to 15 years
Furniture and fittings 3 to 15 years
Information systems 2 to 10 years
Water meters 20 years
Intangible assets
Computer software 3 to 25 years
Borrowing costs
Interest and other borrowing costs, such as government guarantee fees payable in respect of the Water NSW borrowings, are expensed as incurred within finance costs in profit or loss unless they relate to qualifying assets, in which case they are capitalised as part of the cost of those assets. Qualifying assets are assets that take 12 months or more to be ready for their intended use. Capitalisation of borrowing costs is undertaken where a direct relationship can be established between the borrowings and the projects giving rise to the qualifying assets. Operating lease expenses
Payments made under operating leases are representative of the pattern of benefits derived from the leased assets and accordingly they are recognised as an expense in profit or loss in the periods in which they are incurred. Expense is recognised on a straight-line basis over the term of the lease. Lease incentives received are recognised as a liability and amortised over the term of lease. (e) Taxation
Income tax
Water NSW is subject to the National Tax Equivalent Regime (NTER) which is based on the Income Tax Assessment Act 1936 and 1997 (as amended). Tax equivalents are payable to the Office of State Revenue. Income tax on profit or loss comprises current and deferred tax. Income tax is recognised in profit or loss except to the extent that it relates to items recognised directly in equity or other comprehensive income.
23
tes to the financial statements
For the year ended 30 June 2017
Current tax is the expected tax payable or receivable on the taxable income for the year and any adjustment to tax payable or receivable in respect of previous years. It is measured using tax rates enacted or substantively enacted at the reporting date. Deferred tax is recognised in respect of temporary differences between the carrying amounts of assets and liabilities for financial reporting purposes and the amounts used for taxation purposes. The amount of deferred tax provided is based on the expected manner of realisation or settlement of the carrying amount of assets and liabilities, using tax rates enacted or substantively enacted at the reporting date. Deferred tax assets and liabilities are offset where there is a legally enforceable right to offset current tax liabilities and assets, and they relate to income taxes levied by the same authority on the same taxable entity. A deferred tax asset is recognised only to the extent that it is probable that future taxable profits will be available against which the asset can be utilised. Deferred tax assets are reduced to the extent that it is no longer probable that the related tax benefit will be realised. Goods and services tax Revenue, expenses and assets are recognised net of the amount of associated Goods and Services Tax (GST), except where the amount of GST incurred is not recoverable from the Australian Taxation Office (the ATO). In these circumstances, the GST is recognised as part of the cost of acquisition or as part of the expense. Receivables and payables are stated with the amount of GST included. The net amount of GST recoverable from or payable to the ATO is included as a current asset or current liability in the statement of financial position. Cash flows are included in the statement of cash flows on a gross basis. The GST components of cash flows from investing and financing activities recoverable from or payable to the ATO are classified as cash flows from operating activities. Where applicable, commitments are disclosed inclusive of GST. (f) Cash and cash equivalents
Cash and cash equivalents includes cash on hand, deposits at call and other short-term, highly liquid investments which are readily convertible to known amounts of cash and which are subject to insignificant risk associated with changes in value. (g) Trade and other receivables
Trade and other receivables represent amounts that are receivable by Water NSW for providing services to customers prior to the end of the reporting period and that are yet to be collected. Trade and other receivables due within 12 months of the reporting date are recognised initially and subsequently carried at original invoice amount, which is their fair value, less any impairment losses recognised by way of an allowance for impairment that represents specific amounts considered to
24
tes to the financial statements
For the year ended 30 June 2017
be either doubtful or uncollectible. Subsequent measurement is at amortised cost using the effective interest method, less an allowance for any impairment of receivables. The recoverability of trade receivables is regularly reviewed throughout the reporting period. The allowance for impairment is recognised when collection of the full amount invoiced is considered to be no longer probable after due consideration of factors such as the length of time in excess of the due date, financial difficulties of the debtor, past recoverability experience and prevailing economic conditions. All of these factors are considered to be objective evidence of impairment. Known bad debts are written off against the allowance as and when identified. (h) Property, plant and equipment
Acquisition of property, plant and equipment
All items of property, plant and equipment are initially recognised at the cost of acquisition. Cost is the amount of cash and cash equivalents paid or the fair value or other consideration given to acquire the asset at the time of its acquisition or construction or, where applicable, the amount attributed to that asset when initially recognised in accordance with the requirements of other Australian Accounting Standards (AAS). Fair value is the price that would be received to sell an asset in an orderly transaction between market participants at measurement date. Assets acquired at no cost, or for nominal consideration, are initially recognised at fair value at the date of acquisition (see also assets transferred as a result of an equity transfer - Note 20). Where payment for an asset is deferred beyond normal credit terms its cost is the cash price equivalent. Capitalisation thresholds
Following thresholds are applied for capitalisation: ₋ Information systems - $1,000; ₋ Other plant and equipment - $5,000; and ₋ Infrastructure - $10,000.
In the case of system asset categories that work together to form an entire network all expenditures are capitalised regardless of cost. In respect of system assets constructed by Water NSW for its own use, cost includes:
₋ materials used in construction; ₋ direct labour; ₋ contractors’ services; ₋ major inspection costs; ₋ an estimate, where relevant, of the costs of dismantling, decommissioning and removing
the asset and restoring the site on which it is located; and ₋ an appropriate proportion of overheads.
Borrowing costs are also capitalised to the cost of constructed system assets where applicable. Construction costs are capitalised initially as work in progress. The costs are subsequently reclassified as completed assets when construction has ended and the asset becomes operational and available for use in the manner intended by management.
25
tes to the financial statements
For the year ended 30 June 2017
Subsequent expenditure on property, plant and equipment
Subsequent expenditure is included in the asset's carrying amount or recognised as a separate asset, as appropriate, only when it is probable that future economic benefits associated with the item will flow to Water NSW and the cost of the item can be measured reliably. The carrying amount of any component accounted for as a separate asset is derecognised when replaced. All other repairs and maintenance are charged to profit or loss during the reporting period in which they are incurred. Major inspection costs The cost of the inspection is capitalised as part of the cost of the asset if it is probable that future economic benefits will flow to Water NSW and the cost can be measured reliably. Any inspection cost so capitalised is recognised as a component asset and depreciated over the period of time until the next inspection. When each major inspection cost is capitalised, any remaining cost or estimated cost of the previous inspection is de-recognised. Restoration costs
The present value of the expected cost for the restoration or cost of dismantling of an asset after its use is included in the cost of the respective asset if the recognition criteria for a provision are met.
Maintenance
Day-to-day servicing costs or maintenance are charged as expenses as incurred, except where they relate to the replacement of a part or component of an asset, in which case the costs are capitalised and depreciated. Asset valuations
Following initial recognition, each class of property, plant and equipment is stated in the statement of financial position at fair value less any subsequent accumulated depreciation and accumulated impairment losses. Fair value of property, plant and equipment is based on a market participants’ perspective, using valuation techniques (market approach, cost approach, income approach) that maximises relevant observable inputs and minimises unobservable inputs. In determining the most appropriate measure of fair value for its assets, Water NSW considers a number of factors such as the principal (or most advantageous) market in which an orderly transaction would take place for the asset, the highest and best use of the asset and whether the asset is used in combination with other assets or on a stand-alone basis, and the assumptions that a market participant would use when pricing the asset. When transactions are not directly observable in a market, which is the case with the vast majority of Water NSW property, plant and equipment assets, fair value is determined for each asset class using one of three valuation techniques permitted under Australian Accounting Standard AASB 13 ‘Fair Value Measurement’:
26
tes to the financial statements
For the year ended 30 June 2017
₋ Market approach - fair value is determined using prices and other relevant information generated by market transactions involving identical or comparable assets or groups of assets;
₋ Income approach - fair value is determined by converting future cash flows to a single current (i.e. discounted) amount; or
₋ Cost approach - fair value is determined by calculating the current replacement cost of an asset, which represents the amount that would be required currently to replace the service capacity of an asset.
The relevant valuation technique adopted by Water NSW as the most appropriate for each class of asset is described below. For some classes of assets, re-measurement to fair value is undertaken by way of an asset revaluation. Valuations are performed with sufficient regularity to ensure that the carrying amount prior to any impairment adjustments does not differ materially from the asset’s fair value at the reporting date. Treasury Policy Paper TPP 14-01 ‘Valuation of Physical Non-Current Assets’ requires comprehensive revaluation of all classes of property, plant and equipment at least every five years and at least every three years for land and buildings and interim revaluations to be conducted between comprehensive revaluations, where cumulative changes to indicators/indices suggest fair value may differ materially from carrying value. Comprehensive revaluations and interim formal revaluations must be conducted using external professionally qualified valuers to either to conduct the revaluation or to review the revaluation. For each class of property, plant and equipment subject to valuation, revaluation increments are recognised in other comprehensive income and credited to an asset revaluation reserve within equity in the statement of financial position. Where a revaluation decrement or an impairment loss reverses a revaluation increment previously credited to, and which is still in the balance of the asset revaluation reserve, the revaluation decrement or impairment loss is debited to that reserve. In other cases, the decrement or impairment loss is recognised as an expense in profit or loss.However, to the extent that an impairment loss on the same revalued asset was previously recognised in profit or loss, a reversal of that impairment loss is also recognised in profit or loss Revaluation increments and decrements are offset against one another on an ‘individual asset’ basis for revaluation purposes as follows:
₋ In respect of the class of system assets Water NSW considers the unit of measure for an ‘individual asset’ in its single cash generating unit to be the entire system asset network.
₋ In respect of Water NSW market land and buildings, the ‘individual asset’ is considered to be each individual land parcel together with any building improvements on the land parcel.
Upon disposal of assets or asset components that have been revalued, any asset revaluation reserve balance relating to the particular asset or asset component being disposed is transferred to retained earnings.
27

tes to the financial statements
For the year ended 30 June 2017
System assets
System assets are those infrastructure assets that deliver water distribution services to customers and end users. Due to the specialised nature of this class of assets where there is generally no active market, the fair value is determined using the income approach by discounting the future cash flows expected to be generated from the use of these assets under the price-regulated environment in which Water NSW operates as a for-profit entity (Note 14). The future cash flows generated from the use of the assets under this price-regulated environment are considered to be the primary factor that a market participant would consider when pricing these assets. Water NSW aligns its approach to determining the future cash flows with the pricing methodology applied by its regulator, the Independent Pricing and Regulatory Tribunal (IPART). In addition to the cash flows for regulated assets under this approach, Water NSW’s fair value calculations also include estimated cash flows from non-regulated assets, which are not included in IPART’s methodology. System assets are assessed as an integrated network because of the interdependent nature of their operations, and they are grouped at a cash generating unit level because the IPART pricing methodology assesses future cash flows at that level. This is considered to be more relevant to a market participant than the estimated depreciated current replacement cost of these assets. As IPART’s methodology assesses the total fair value of all the Water NSW regulated assets, the asset values of non-regulated assets are added in order to determine the total fair value of all assets. The fair value of system assets is then derived by deducting the fair value of other classes of assets (that are shown separately) from the total fair value of all assets.
Market land and buildings
Market land and buildings are valued by independent registered valuers on a three yearly cycle, unless market conditions necessitate an earlier valuation to be undertaken, using the market approach to determine fair value under Australian Accounting Standard AASB 13 ‘Fair Value Measurement’. Land is stated in the statement of financial position at market value and buildings are stated at market value less accumulated depreciation. Leasehold properties are stated at market value less accumulated amortisation. When these assets are revalued, any accumulated depreciation or amortisation is netted against the gross carrying amount and the resulting balance is then increased or decreased by the revaluation increments or decrements. Other asset classes forming property, plant and equipment
Property, plant and equipment asset classes other than system assets, market land and buildings and leasehold properties, such as plant and equipment and computer equipment, are recognised initially at the cost of acquisition. These assets are not revalued as it is considered that their depreciated historical cost is an acceptable surrogate for their fair value if a market approach was applied under Australian Accounting Standard AASB 13 ‘Fair Value Measurement’. (i) Intangible assets
Intangible assets are identifiable non-monetary assets without physical substance. Intangible assets are only recognised if it is probable that future economic benefits will flow to the entity and the cost of the asset can be reliably measured. Intangible assets are capitalised initially at cost. Costs
28

tes to the financial statements
For the year ended 30 June 2017
incurred on incomplete intangible assets that are being progressively acquired, such as software, are recognised as acquisitions in progress at the reporting date. These assets are reclassified as completed intangible assets when the assets are fully acquired and are operational or available for use. Following initial recognition the cost approach is applied as it is considered that there is no active market that can be referenced for performing revaluations to a market-based fair value. All research costs are expensed. Development costs are only capitalised when certain criteria are met. The useful lives of intangible assets are assessed to be either finite or indefinite. Where intangible assets are determined to have finite lives, they are amortised on a straight-line basis and the expense is recognised as part of the depreciation and amortisation line item in profit or loss. These assets are recognised in the statement of financial position at cost less accumulated amortisation and accumulated impairment losses, where applicable. Where intangible assets are determined to have indefinite lives they are not amortised. These assets are recognised in the statement of financial position at cost less accumulated impairment, where applicable. Easements over property and the Instrument of Delegation for foreshore lands are typical assets that come under this category. (j) Impairment of assets
At the end of each reporting period Water NSW assesses impairment by evaluation of conditions and events that may be indicative of impairment triggers. The assessment will include considering external sources of information and internal sources of information. If such an indication exists, an impairment test is carried out on the asset by comparing the recoverable amount of the asset, being the higher of the asset's fair value less costs to sell and value in use to the asset's carrying amount. An impairment loss is recognised whenever the carrying amount of an asset or its cash-generating unit exceeds its recoverable amount. Impairment losses are recognised as an expense in profit or loss, unless an asset has previously been revalued through the asset revaluation reserve, in which case the impairment loss is recognised as a reversal to the extent of that previous revaluation through the statement of other comprehensive income, with any excess recognised in profit or loss. Impairment losses recognised in respect of a cash generating unit are allocated to reduce the carrying amount of the assets in the unit on a pro rata basis. Intangible assets are tested for impairment where an indicator of impairment exists. If the recoverable amount is less than its carrying amount, the carrying amount is reduced to recoverable amount and the reduction is recognised as an impairment loss.
Property plant and equipment fair value is defined consistently with AASB 13 ‘Fair Value Measurement’. The only difference between an asset's fair value and its fair value less costs of disposal are the direct incremental costs attributable to the disposal of the asset.
29
tes to the financial statements
For the year ended 30 June 2017
(k) Financial assets
All financial assets, except those measured at fair value through profit and loss, are subject to an annual review for impairment. An allowance for impairment is established when there is objective evidence that the entity will not be able to collect all amounts due. Previous impairment losses are reversed through profit or loss during the year if there is objective evidence supporting the reversal. (l) Trade and other payables
Trade and other payables represent liabilities for goods and services provided to Water NSW and other amounts that remain unpaid at reporting date. They are recognised initially at fair value, usually based on the transaction cost or face value. Subsequent measurement is at amortised cost using the effective interest method. Short-term payables with no stated interest rate are measured at the original invoice amount where the effect of discounting is immaterial. (m) Borrowings
Interest-bearing borrowings obtained by Water NSW from the NSW Treasury Corporation are recognised initially at the fair value of the consideration received, which incorporates any transaction costs associated with the borrowing. Subsequent to initial recognition, interest-bearing borrowings are stated at amortised cost using the effective interest method. Amortised cost is calculated by taking into account any differences between the initial fair value and the final redemption value of borrowings, such as discounts and premiums. These differences are amortised to profit or loss as part of the finance costs over the period of the loan on an effective interest basis. Gains or losses are recognised in profit or loss when liabilities are derecognised, such as through a debt restructuring or early repayment of debt, as well as through the amortisation process. Where there is an unconditional right to defer settlement of the borrowings for at least 12 months after the reporting date and management intends to defer the settlement, the borrowings are recognised as a non-current liability. All other borrowings are recognised as a current liability. Under the Debt Management Facility, Water NSW is able to rollover its maturing debt to any term offered by its lender (T-Corp), provided the total capital value of the debt remains within limits approved under the Public Authorities (Financial Arrangements) Act 1987 (Refer Note 24 c). Water NSW also pays a Government Guarantee Fee to NSW Treasury to have its loans guaranteed by the State. (n) Provisions
Provisions are liabilities of uncertain timing or amount. A provision exists when there is a present legal or constructive obligation as a result of a past event; it is probable that an outflow of resources will be required to settle the obligation; and a reliable estimate can be made of the amount of the obligation. If the obligation is to be settled greater than 12 months after the reporting date and the effect is material, the estimate of the provision is discounted using a pre-tax rate that reflects current market assessments of the time value of money and the risks specific to the liability. If the obligation is due
30

tes to the financial statements
For the year ended 30 June 2017
to be settled less than 12 months after the reporting date, the provision is stated at the best estimate available and is not discounted. When some or all of a provision is expected to be reimbursed from a third party, the reimbursement receivable is recognised as an asset only when the reimbursement is virtually certain. The expense relating to any provision is presented in profit or loss net of any reimbursement. A provision is classified as a current liability if Water NSW does not have an unconditional right to defer settlement of the liability for at least 12 months after the reporting date. Provisions recognised in the statement of financial position comprise some employee benefits and other provisions. These are described below. Employee benefits
Short term employee benefits Short term employee benefits are employee benefits (other than termination benefits) that are expected to be settled wholly within 12 months after the end of the annual reporting period in which the employees render the related service. They include wages and salaries and sick leave. All short term employee benefits that are payable at the reporting date are measured on an undiscounted basis at the nominal amount expected to be paid. Expenses for wages and salaries are recognised on an accrual basis as services are rendered by employees. Expenses for sick leave, which is non-vesting, are recognised when the absences occur. Liabilities for wages and salaries are included within trade and other payables.
Long term employee benefits Long term employee benefits are all employee benefits other than short term employee benefits, post-employment benefits and termination benefits. In the case of the Water NSW, this refers specifically to employee benefits for long service leave and annual leave. The liabilities for long service leave and annual leave at the reporting date represent the present value of the future benefits that employees have earned in return for their service in the current and prior reporting periods, less the fair value of any related assets (where applicable) at that date. The liability is required to be measured at present value in accordance with AASB 119 ‘Employee Benefits’. Recreation leave The liability for annual leave benefits is actuarially calculated to determine the present value of the future benefit that employees have earned in return for their service up to the reporting date. Recreation leave, which is not expected to be settled wholly within 12 months after the end of the annual reporting period in which the employees render the related service is required to be measured at present value in accordance with AASB 119 ‘Employee Benefits’. The discount rate used is the yield at the reporting date on Government bonds that have maturity dates approximating to the terms of the annual leave obligations. If benefits are expected to be settled wholly within 12 months of the end of the reporting period, then they are measured at the undiscounted amount of the benefit.
31
tes to the financial statements
For the year ended 30 June 2017
Long service leave The present value of the future benefit related to long service leave is calculated using an actuarial valuation method called the projected unit credit method. This method sees each period of service as giving rise to an additional unit of benefit entitlement and measures each unit separately to build up the final obligation. Consideration is given to expected wages and salary levels, experience of employee departures and periods of service. The discount rate used is the yield at the reporting date on Government bonds that have maturity dates approximating to the terms of the long service leave obligations. Unconditional entitlements to long service leave benefits are classified as current liabilities in the statement of financial position, while conditional and pre-conditional entitlements are classified as non-current liabilities as they do not fall due for settlement at the reporting date. Liabilities for annual leave are classified as current liabilities in the statement of financial position regardless of when they are expected to be settled as these liabilities have fallen due for settlement at the reporting date. Termination benefits Termination benefits are employee benefits payable as a result of an employee's decision to accept voluntary redundancy in exchange for those benefits. The liability for redundancy benefits for specific employees is measured at the non-discounted calculated entitlement that will be paid to those employees. The liability for redundancy benefits for employees that are subject to a restructuring program is recognised when a detailed formal plan for the restructuring exists and when a valid expectation in those affected has been raised.
Other provisions Unused non-vesting sick leave does not give rise to a liability as it is considered improbable that sick leave taken in the future will be greater than the benefits accrued in the future. The outstanding amounts of payroll tax, workers compensation insurance premium and fringe benefit tax, which are consequential to employment, are recognised as liabilities and expenses where the employee benefits to which they relate have also been recognised. Post-employment benefits Post-employment benefits are employee benefits (other than termination benefits and short-term employee benefits) that are payable after the completion of employment. In the case of the Water NSW, this refers specifically to benefits provided to employees and former employees through superannuation schemes. Superannuation schemes are classified as either defined contribution or defined benefit. Defined contribution superannuation schemes Water NSW contributes to the First State Superannuation Scheme, a defined contribution scheme in the NSW public sector, as well as other private schemes to a lesser extent. Contributions to these schemes are recognised as an expense in profit or loss as incurred. The liability recognised at the reporting date represents the contributions to be paid to these schemes in the following month. Contributions to defined contribution superannuation schemes are recognised as an expense in the periods during which services are rendered by employees.
32
tes to the financial statements
For the year ended 30 June 2017
Defined benefit superannuation schemes Water NSW contributes to three defined benefit superannuation schemes in the NSW Public Sector Pooled Fund. These are: State Superannuation Scheme (SSS), State Authorities Superannuation Scheme (SASS) and State Authorities Non-contributory Superannuation Scheme (SANCS). The net obligation in respect of defined benefits plans is calculated separately for each plan by estimating the amount of future benefit that employees have earned in the current and prior periods, discounting that amount and deducting the fair value of any plan assets. The benefit is also adjusted for any asset ceiling i.e. the present value of economic benefits available as refunds from the plan or reductions in future contributions to the plan. The calculation of defined benefit obligations is performed by a qualified actuary using the projected unit cost method. Remeasurement of the net defined benefit liability, which comprise actuarial gains or losses, the return on plan assets (excluding interest) and the effect of the asset ceiling (if any, excluding interest) are recognised immediately in the statement of the comprehensive income. The net interest expense (income) on the net defined benefit liability (asset) for the period is determined by applying the discount rate used to measure the defined benefit obligation at the beginning of the annual period to the then net defined benefit liability (asset), taking into account any changes in the net defined benefit liability (asset) during the period as a result of contributions and benefit payments. Net interest expense and other expenses related to defined benefit plans are recognised in profit or loss. When the benefits of the plan are changed or when a plan is curtailed, the resulting change in benefit that relates to past service or the gain or loss on curtailment is recognised immediately in profit or loss. The gains and losses on the settlement of a defined benefit plan are recognised when the settlement occurs. AASB 119 ‘Employee Benefits’ does not specify whether the current and non-current portions of the liability be disclosed because at times the distinction can be arbitrary. Management has determined that the liability be disclosed as non-current as this best reflects when the liability will most likely be settled. Assumptions underlying defined benefit superannuation expenses and liabilities are disclosed in Note 18(a). (o) Restorations Restoration costs in respect of leased premises are those costs that Water NSW must incur under the terms of the lease to restore the relevant leased premises back to their original state at the end of the lease term. Provisions are recognised at the inception of a lease when such restoration is a condition of the lease. Unwinding of the discount is recognised as a finance cost in profit or loss. The restoration costs are separately capitalised against assets that have been acquired as part of leasing the premises, such as fitouts.
(p) Deferred Government grants
Government grants are recognised at fair value where there is reasonable assurance that the grant will be received and all grant conditions will be met. Grants relating to expense items are recognised
33
tes to the financial statements
For the year ended 30 June 2017
as income over the periods necessary to match the grant to the costs they are compensating. Grants relating to assets are credited to deferred income at fair value and are credited to income over the expected useful life of the asset on a straight line basis. That portion of deferred government grants received in relation to capital expenditure that relates to useful life in excess of 12 months is treated as a non-current liability. (q) Leases
A distinction is made between finance leases which effectively transfer from the lessor to the lessee substantially all the risks and benefits incidental to ownership of the leased assets, and operating leases under which the lessor does not transfer substantially all the risks and benefits. Where a non-current asset is acquired by means of a finance lease, at the commencement of the lease term, the asset is recognised at its fair value or, if lower, the present value of the minimum lease payments, at the inception of the lease. The corresponding liability is established at the same amount. Lease payments are subsequently allocated between the principal component and the interest expense. Minimum lease payments made under finance leases are apportioned between the finance expense and the reduction of the outstanding liability. The finance expense is allocated to each period during the lease term so as to produce a constant periodic rate of interest on the remaining balance of the liability. (r) Financial guarantees
A financial guarantee contract is a contract that requires the issuer to make specified payments to reimburse the holder for a loss it incurs because a specified debtor fails to make payment when due in accordance with the original or modified terms of a debt instrument. Financial guarantee contracts are recognised as a liability at the time the guarantee is issued and initially recognised at fair value plus, in the case of financial guarantees not at fair value through profit or loss, directly attributable transaction costs, where material. After initial recognition, the liability is measured at the higher of the amount determined in accordance with AASB 137 ‘Provisions, Contingent Liabilities and Contingent Assets’ and the amount initially recognised, less accumulated amortisation, where appropriate. Water NSW has reviewed its financial guarantees and determined that there is no material liability to be recognised for financial guarantee contracts as at 30 June 2017 and as at 30 June 2016. However, refer to Note 21 regarding disclosures on contingent liabilities (s) Administered activities
Water NSW administers, but does not control, certain activities on behalf of the Department of Industry, Skills and Regional Development. Water NSW is accountable for the transactions relating to those administered activities but does not have the discretion to deploy the resources for the achievement of the entity’s own objectives. Transactions and balances relating to the administered activities are not recognised as the entity’s income, expenses, assets and liabilities, but are disclosed in the accompanying schedules as 'Administered Income', 'Administered Expenses', 'Administered Assets' and 'Administered Liabilities'. The accrual basis of accounting and applicable accounting standards have been adopted.
34
tes to the financial statements
For the year ended 30 June 2017
(t) Dividend
The targeted dividend is agreed by the Board of Water NSW and the relevant Ministers in May of each financial year. This process establishes a present obligation for the future payment of a dividend. Accordingly, a provision for the full amount of the dividend is recognised in the statement of financial position. The provision for dividend is calculated in accordance with requirements of TPP 14-04 Financial Distribution Policy for Government Businesses. The dividend payable in relation to the 2016-17 financial year has been calculated based on a fixed dollar amount agreed with shareholders. (u) Equity transfers
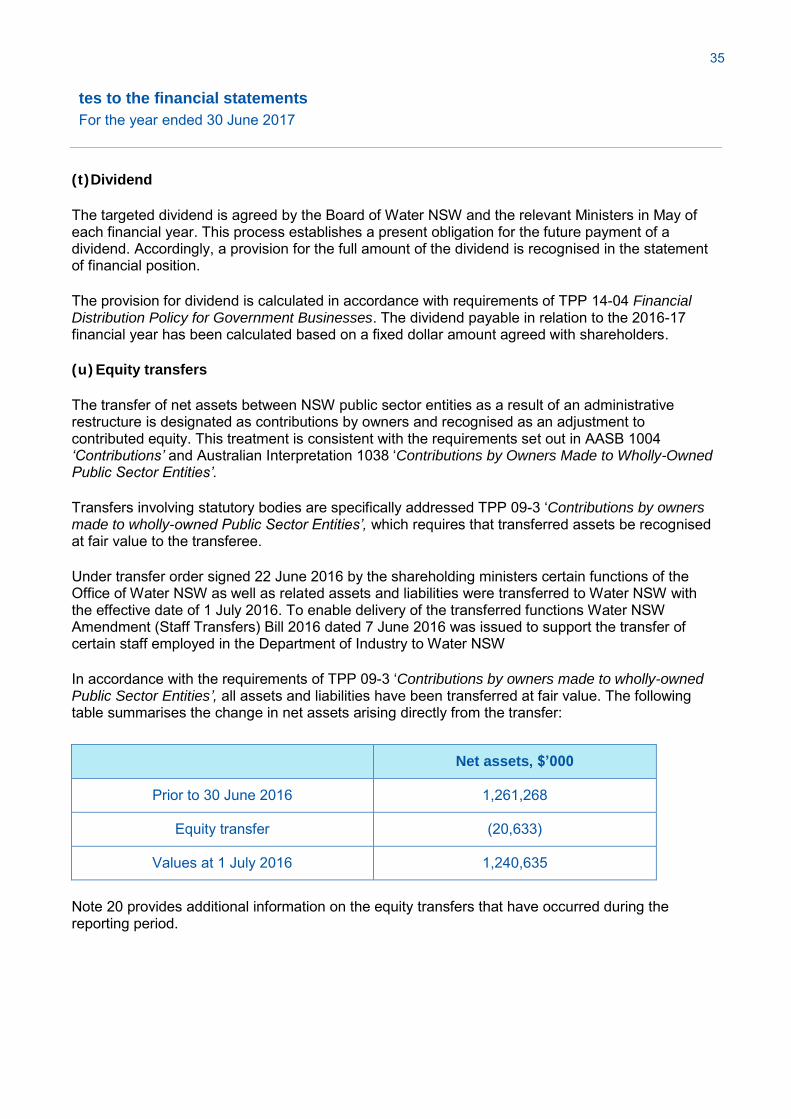
The transfer of net assets between NSW public sector entities as a result of an administrative restructure is designated as contributions by owners and recognised as an adjustment to contributed equity. This treatment is consistent with the requirements set out in AASB 1004 ‘Contributions’ and Australian Interpretation 1038 ‘Contributions by Owners Made to Wholly-Owned Public Sector Entities’.
Transfers involving statutory bodies are specifically addressed TPP 09-3 ‘Contributions by owners made to wholly-owned Public Sector Entities’, which requires that transferred assets be recognised at fair value to the transferee. Under transfer order signed 22 June 2016 by the shareholding ministers certain functions of the Office of Water NSW as well as related assets and liabilities were transferred to Water NSW with the effective date of 1 July 2016. To enable delivery of the transferred functions Water NSW Amendment (Staff Transfers) Bill 2016 dated 7 June 2016 was issued to support the transfer of certain staff employed in the Department of Industry to Water NSW In accordance with the requirements of TPP 09-3 ‘Contributions by owners made to wholly-owned Public Sector Entities’, all assets and liabilities have been transferred at fair value. The following table summarises the change in net assets arising directly from the transfer: Net assets, $’000
Prior to 30 June 2016 1,261,268
Equity transfer (20,633)
Values at 1 July 2016 1,240,635
Note 20 provides additional information on the equity transfers that have occurred during the reporting period.
35
tes to the financial statements
For the year ended 30 June 2017
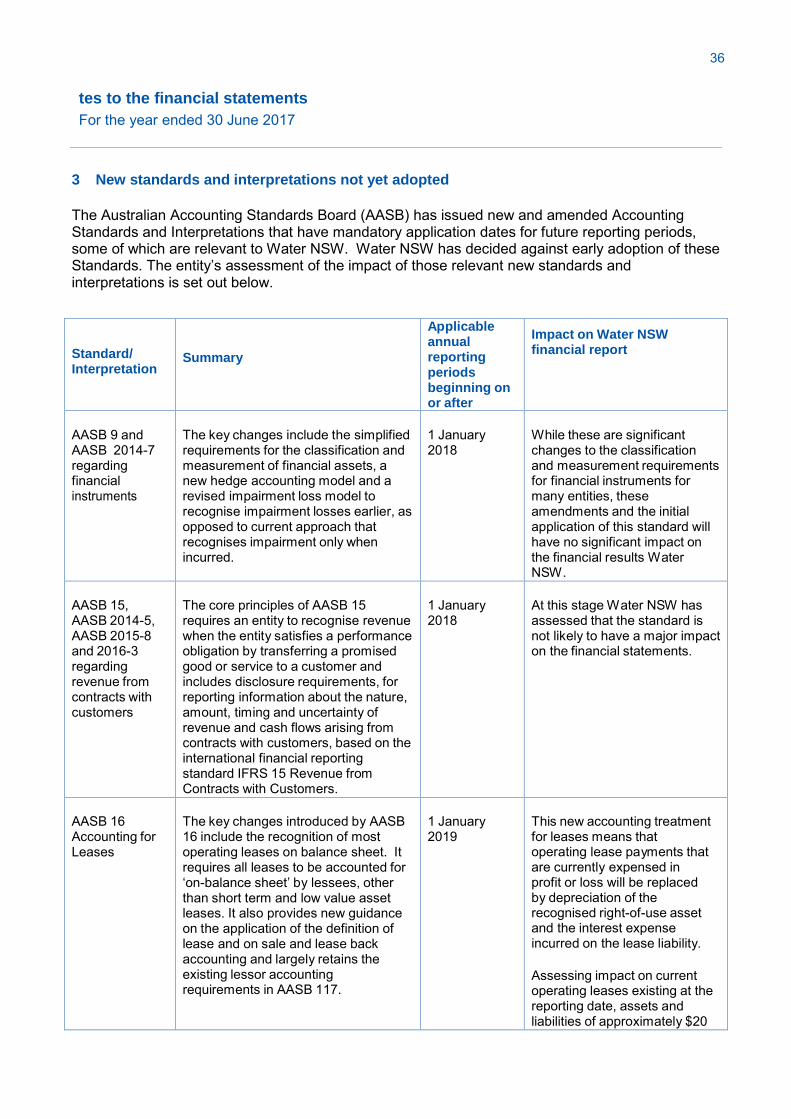
3 New standards and interpretations not yet adopted
The Australian Accounting Standards Board (AASB) has issued new and amended Accounting Standards and Interpretations that have mandatory application dates for future reporting periods, some of which are relevant to Water NSW. Water NSW has decided against early adoption of these Standards. The entity’s assessment of the impact of those relevant new standards and interpretations is set out below.
Standard/ Interpretation
Summary
Applicable annual reporting periods beginning on or after
Impact on Water NSW financial report
AASB 9 and AASB 2014-7 regarding financial instruments
The key changes include the simplified requirements for the classification and measurement of financial assets, a new hedge accounting model and a revised impairment loss model to recognise impairment losses earlier, as opposed to current approach that recognises impairment only when incurred.
1 January 2018
While these are significant changes to the classification and measurement requirements for financial instruments for many entities, these amendments and the initial application of this standard will have no significant impact on the financial results Water NSW.
AASB 15, AASB 2014-5, AASB 2015-8 and 2016-3 regarding revenue from contracts with customers
The core principles of AASB 15 requires an entity to recognise revenue when the entity satisfies a performance obligation by transferring a promised good or service to a customer and includes disclosure requirements, for reporting information about the nature, amount, timing and uncertainty of revenue and cash flows arising from contracts with customers, based on the international financial reporting standard IFRS 15 Revenue from Contracts with Customers.
1 January 2018
At this stage Water NSW has assessed that the standard is not likely to have a major impact on the financial statements.
AASB 16 Accounting for Leases
The key changes introduced by AASB 16 include the recognition of most operating leases on balance sheet. It requires all leases to be accounted for ‘on-balance sheet’ by lessees, other than short term and low value asset leases. It also provides new guidance on the application of the definition of lease and on sale and lease back accounting and largely retains the existing lessor accounting requirements in AASB 117.
1 January 2019
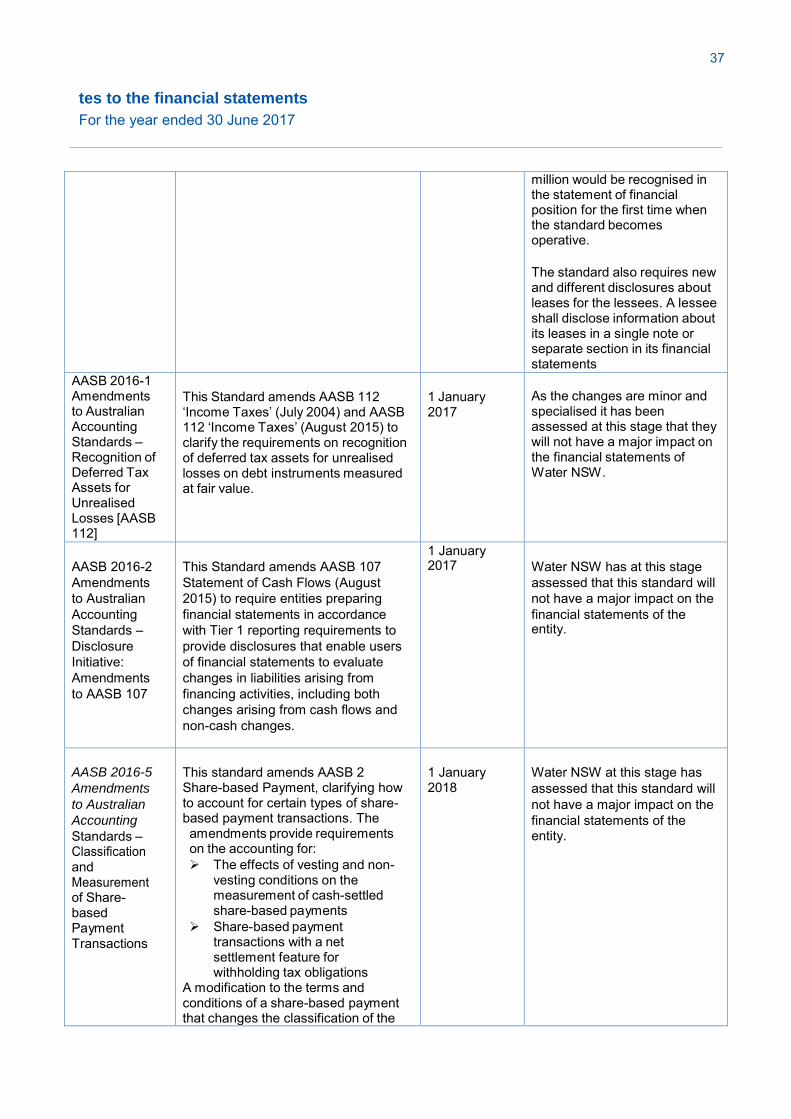
This new accounting treatment for leases means that operating lease payments that are currently expensed in profit or loss will be replaced by depreciation of the recognised right-of-use asset and the interest expense incurred on the lease liability. Assessing impact on current operating leases existing at the reporting date, assets and liabilities of approximately $20
36
tes to the financial statements
For the year ended 30 June 2017
million would be recognised in the statement of financial position for the first time when the standard becomes operative. The standard also requires new and different disclosures about leases for the lessees. A lessee shall disclose information about its leases in a single note or separate section in its financial statements
AASB 2016-1 Amendments to Australian Accounting Standards – Recognition of Deferred Tax Assets for Unrealised Losses [AASB 112]
This Standard amends AASB 112 ‘Income Taxes’ (July 2004) and AASB 112 ‘Income Taxes’ (August 2015) to clarify the requirements on recognition of deferred tax assets for unrealised losses on debt instruments measured at fair value.
1 January 2017
As the changes are minor and specialised it has been assessed at this stage that they will not have a major impact on the financial statements of Water NSW.
AASB 2016-2 Amendments to Australian Accounting Standards – Disclosure Initiative: Amendments to AASB 107
This Standard amends AASB 107 Statement of Cash Flows (August 2015) to require entities preparing financial statements in accordance with Tier 1 reporting requirements to provide disclosures that enable users of financial statements to evaluate changes in liabilities arising from financing activities, including both changes arising from cash flows and non-cash changes.
1 January 2017
Water NSW has at this stage assessed that this standard will not have a major impact on the financial statements of the entity.
AASB 2016-5
Amendments
to Australian
Accounting
Standards – Classification and Measurement of Share- based Payment Transactions
This standard amends AASB 2 Share-based Payment, clarifying how to account for certain types of share- based payment transactions. The amendments provide requirements on the accounting for: The effects of vesting and non-
vesting conditions on the measurement of cash-settled share-based payments
Share-based payment transactions with a net settlement feature for withholding tax obligations
A modification to the terms and conditions of a share-based payment that changes the classification of the
1 January 2018
Water NSW at this stage has assessed that this standard will not have a major impact on the financial statements of the entity.
37
tes to the financial statements
For the year ended 30 June 2017
transaction from cash-settled to equity- settled
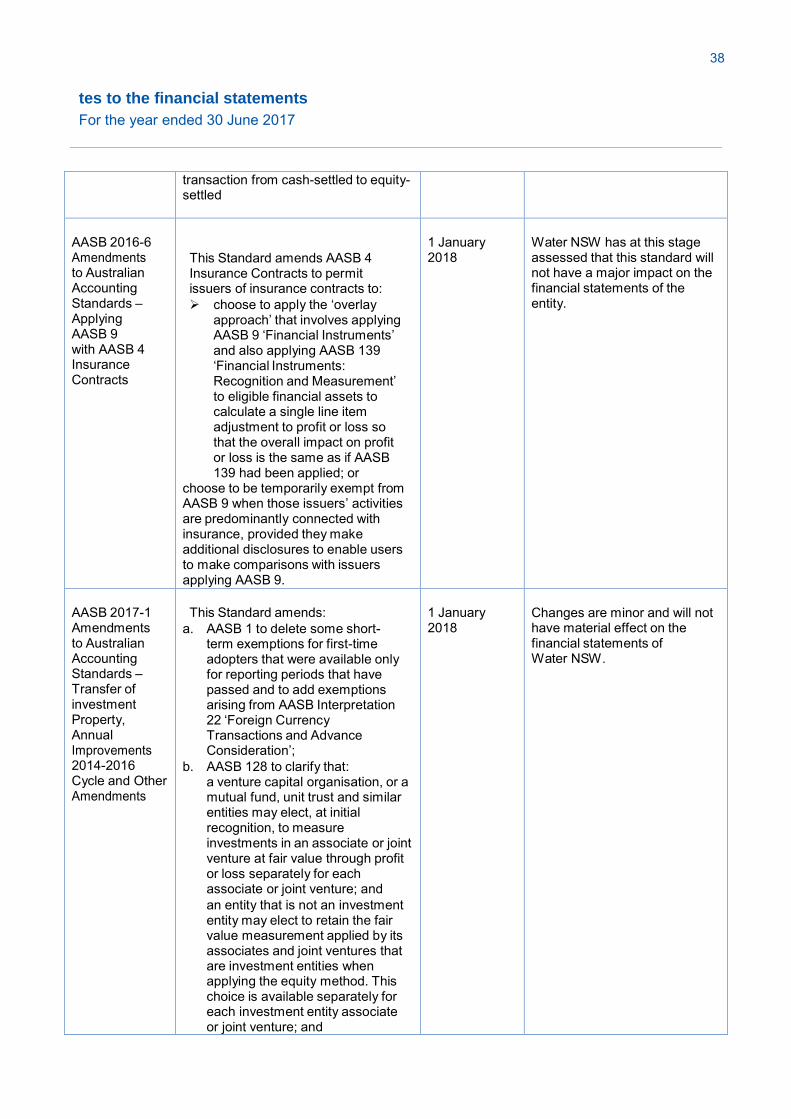
AASB 2016-6 Amendments to Australian Accounting Standards – Applying AASB 9 with AASB 4 Insurance Contracts
This Standard amends AASB 4 Insurance Contracts to permit issuers of insurance contracts to: choose to apply the ‘overlay
approach’ that involves applying AASB 9 ‘Financial Instruments’ and also applying AASB 139 ‘Financial Instruments: Recognition and Measurement’ to eligible financial assets to calculate a single line item adjustment to profit or loss so that the overall impact on profit or loss is the same as if AASB 139 had been applied; or
choose to be temporarily exempt from AASB 9 when those issuers’ activities are predominantly connected with insurance, provided they make additional disclosures to enable users to make comparisons with issuers applying AASB 9.
1 January 2018
Water NSW has at this stage assessed that this standard will not have a major impact on the financial statements of the entity.
AASB 2017-1 Amendments to Australian Accounting Standards – Transfer of investment Property, Annual Improvements 2014-2016 Cycle and Other Amendments
This Standard amends:
a. AASB 1 to delete some short- term exemptions for first-time adopters that were available only for reporting periods that have passed and to add exemptions arising from AASB Interpretation 22 ‘Foreign Currency Transactions and Advance Consideration’;
b. AASB 128 to clarify that: a venture capital organisation, or a mutual fund, unit trust and similar entities may elect, at initial recognition, to measure investments in an associate or joint venture at fair value through profit or loss separately for each associate or joint venture; and an entity that is not an investment entity may elect to retain the fair value measurement applied by its associates and joint ventures that are investment entities when applying the equity method. This choice is available separately for each investment entity associate or joint venture; and
1 January 2018
Changes are minor and will not have material effect on the financial statements of Water NSW.
38
tes to the financial statements
For the year ended 30 June 2017
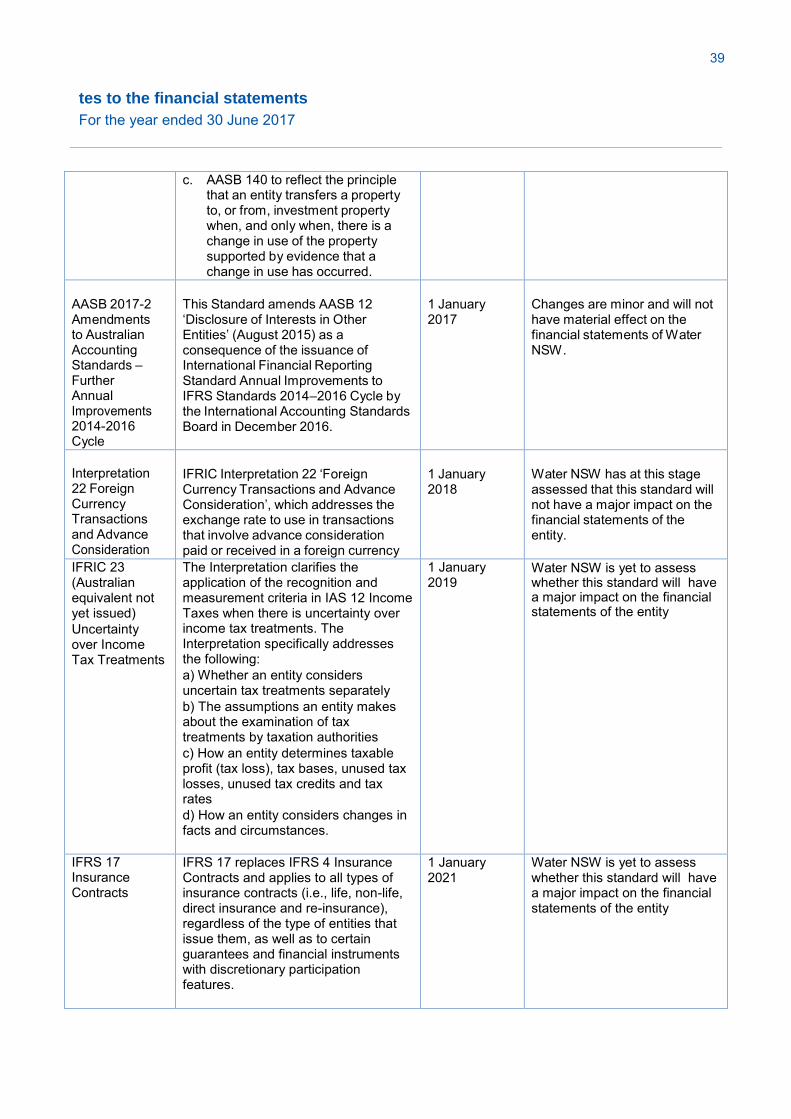
c. AASB 140 to reflect the principle that an entity transfers a property to, or from, investment property when, and only when, there is a change in use of the property supported by evidence that a change in use has occurred.
AASB 2017-2 Amendments to Australian Accounting Standards – Further Annual Improvements 2014-2016 Cycle
This Standard amends AASB 12 ‘Disclosure of Interests in Other Entities’ (August 2015) as a consequence of the issuance of International Financial Reporting Standard Annual Improvements to IFRS Standards 2014–2016 Cycle by the International Accounting Standards Board in December 2016.
1 January 2017
Changes are minor and will not have material effect on the financial statements of Water NSW.
Interpretation 22 Foreign Currency Transactions and Advance Consideration
IFRIC Interpretation 22 ‘Foreign Currency Transactions and Advance Consideration’, which addresses the exchange rate to use in transactions that involve advance consideration paid or received in a foreign currency
1 January 2018
Water NSW has at this stage assessed that this standard will not have a major impact on the financial statements of the entity.
IFRIC 23 (Australian equivalent not yet issued) Uncertainty over Income Tax Treatments
The Interpretation clarifies the application of the recognition and measurement criteria in IAS 12 Income Taxes when there is uncertainty over income tax treatments. The Interpretation specifically addresses the following: a) Whether an entity considers uncertain tax treatments separately b) The assumptions an entity makes about the examination of tax treatments by taxation authorities c) How an entity determines taxable profit (tax loss), tax bases, unused tax losses, unused tax credits and tax rates d) How an entity considers changes in facts and circumstances.
1 January 2019
Water NSW is yet to assess whether this standard will have a major impact on the financial statements of the entity
IFRS 17 Insurance Contracts
IFRS 17 replaces IFRS 4 Insurance Contracts and applies to all types of insurance contracts (i.e., life, non-life, direct insurance and re-insurance), regardless of the type of entities that issue them, as well as to certain guarantees and financial instruments with discretionary participation features.
1 January 2021
Water NSW is yet to assess whether this standard will have a major impact on the financial statements of the entity
39
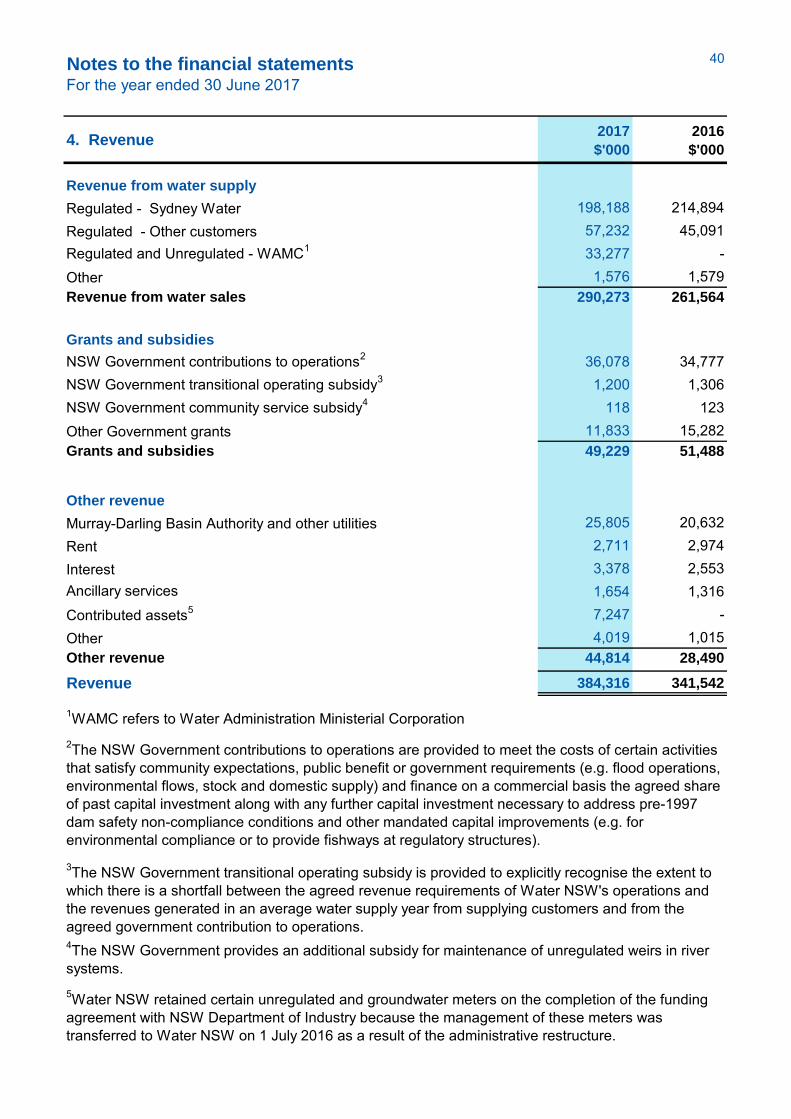
Notes to the financial statementsFor the year ended 30 June 2017
4. Revenue
2017
$'000
2016
$'000
Revenue from water supply
Regulated - Sydney Water 198,188 214,894Regulated - Other customers 57,232 45,091Regulated and Unregulated - WAMC1 33,277 -Other 1,576 1,579Revenue from water sales 290,273 261,564
Grants and subsidies
NSW Government contributions to operations2 36,078 34,777NSW Government transitional operating subsidy3 1,200 1,306NSW Government community service subsidy4 118 123Other Government grants 11,833 15,282Grants and subsidies 49,229 51,488
Other revenue
Murray-Darling Basin Authority and other utilities 25,805 20,632Rent 2,711 2,974Interest 3,378 2,553Ancillary services 1,654 1,316Contributed assets5 7,247 -Other 4,019 1,015Other revenue 44,814 28,490
Revenue 384,316 341,542
1WAMC refers to Water Administration Ministerial Corporation
3The NSW Government transitional operating subsidy is provided to explicitly recognise the extent to which there is a shortfall between the agreed revenue requirements of Water NSW's operations and the revenues generated in an average water supply year from supplying customers and from the agreed government contribution to operations.
5Water NSW retained certain unregulated and groundwater meters on the completion of the funding agreement with NSW Department of Industry because the management of these meters was transferred to Water NSW on 1 July 2016 as a result of the administrative restructure.
2The NSW Government contributions to operations are provided to meet the costs of certain activities that satisfy community expectations, public benefit or government requirements (e.g. flood operations, environmental flows, stock and domestic supply) and finance on a commercial basis the agreed share of past capital investment along with any further capital investment necessary to address pre-1997 dam safety non-compliance conditions and other mandated capital improvements (e.g. for environmental compliance or to provide fishways at regulatory structures).
4The NSW Government provides an additional subsidy for maintenance of unregulated weirs in river systems.
40
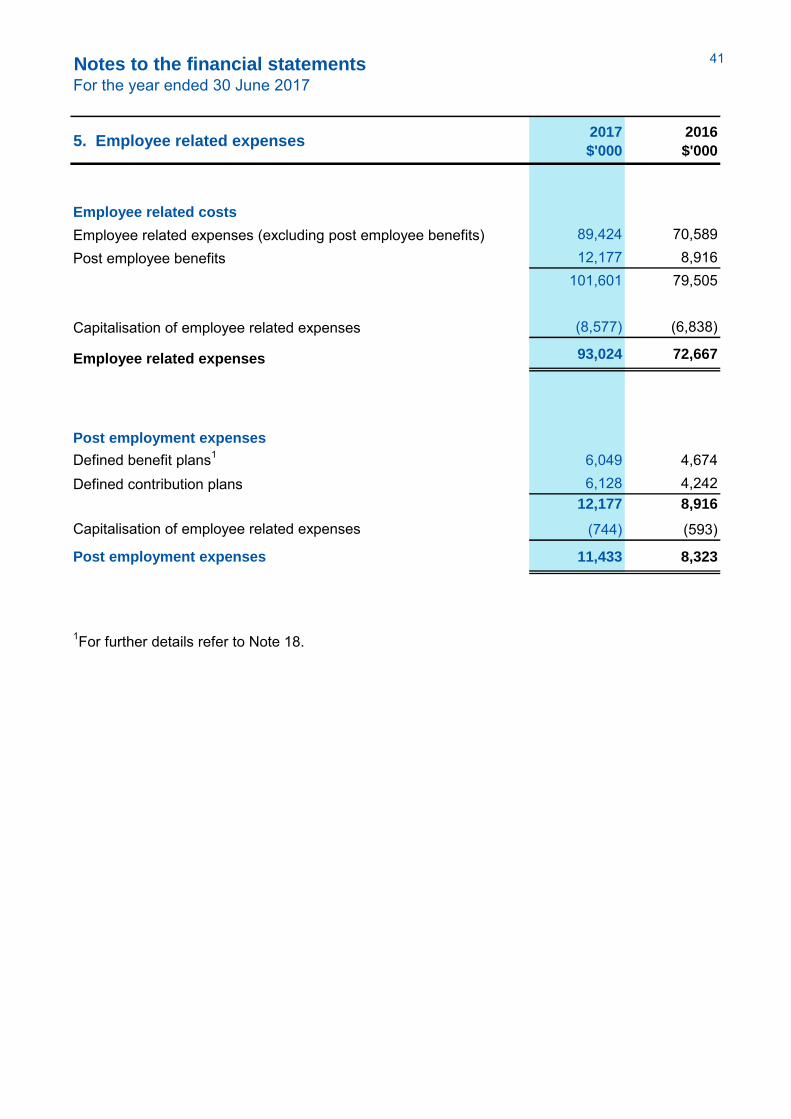
Notes to the financial statementsFor the year ended 30 June 2017
5. Employee related expenses
2017
$'000
2016
$'000
Employee related costs
Employee related expenses (excluding post employee benefits) 89,424 70,589Post employee benefits 12,177 8,916
101,601 79,505
Capitalisation of employee related expenses (8,577) (6,838)
Employee related expenses 93,024 72,667
Post employment expenses
Defined benefit plans1 6,049 4,674Defined contribution plans 6,128 4,242
12,177 8,916
Capitalisation of employee related expenses (744) (593)
Post employment expenses 11,433 8,323
1For further details refer to Note 18.
41

Notes to the financial statementsFor the year ended 30 June 2017
6. Operating expenses
2017
$'000
2016
$'000
Operating expenses
Contractors and consultancies 37,107 46,217Contribution to MDBA expenses1 12,100 13,400Electricity and other energy expenses 1,708 1,624Operating lease expenses 6,084 4,225Data management expenses 3,223 2,802Licence fees 3,366 3,310Materials, plant and equipment 4,730 2,994Property 3,305 5,337Transport and travel 5,767 3,620Insurance 4,297 3,995Other expenses from ordinary activities 9,403 2,560Impairment - Receivables 16 -
Operating expenses 91,106 90,085
Depreciation and amortisation
Depreciation 55,782 50,207Amortisation 2,755 2,958Depreciation and amortisation 58,537 53,165
Operating expenses 149,643 143,250
Reconciliation of total maintenance expenses
Employee-related maintenance expenses 8,408 8,788Contracted labour and other (non-employee related) expenses 18,581 19,864
Total maintenance expenses 26,989 28,652
1Contribution to MDBA expenses refers to a proportion of revenue from water charges to bulk water customers located within the area of operations of the MDBA, which is passed on to NSW Treasury to help meet the NSW Government's obligations under the Murray-Darling Basin Agreement to directly fund a proportion of the operating costs and States' share of capital costs of the MDBA.
NSW Treasury Policy TPP06-6 'Capitalisation of Expenditure on Property, Plant and Equipment'
requires the total maintenance expense to be dissected into employee related maintenance and other maintenance.
42
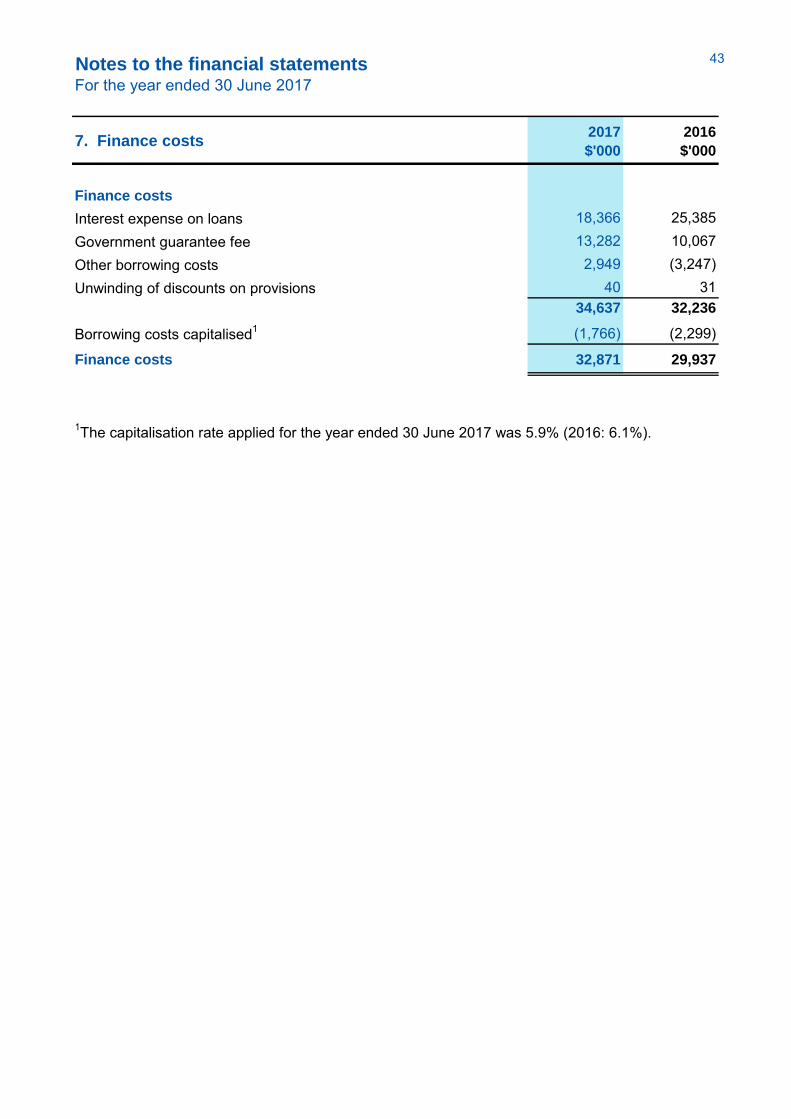
Notes to the financial statementsFor the year ended 30 June 2017
7. Finance costs
2017
$'000
2016
$'000
Finance costs
Interest expense on loans 18,366 25,385Government guarantee fee 13,282 10,067Other borrowing costs 2,949 (3,247)Unwinding of discounts on provisions 40 31
34,637 32,236
Borrowing costs capitalised1 (1,766) (2,299)
Finance costs 32,871 29,937
1The capitalisation rate applied for the year ended 30 June 2017 was 5.9% (2016: 6.1%).
43
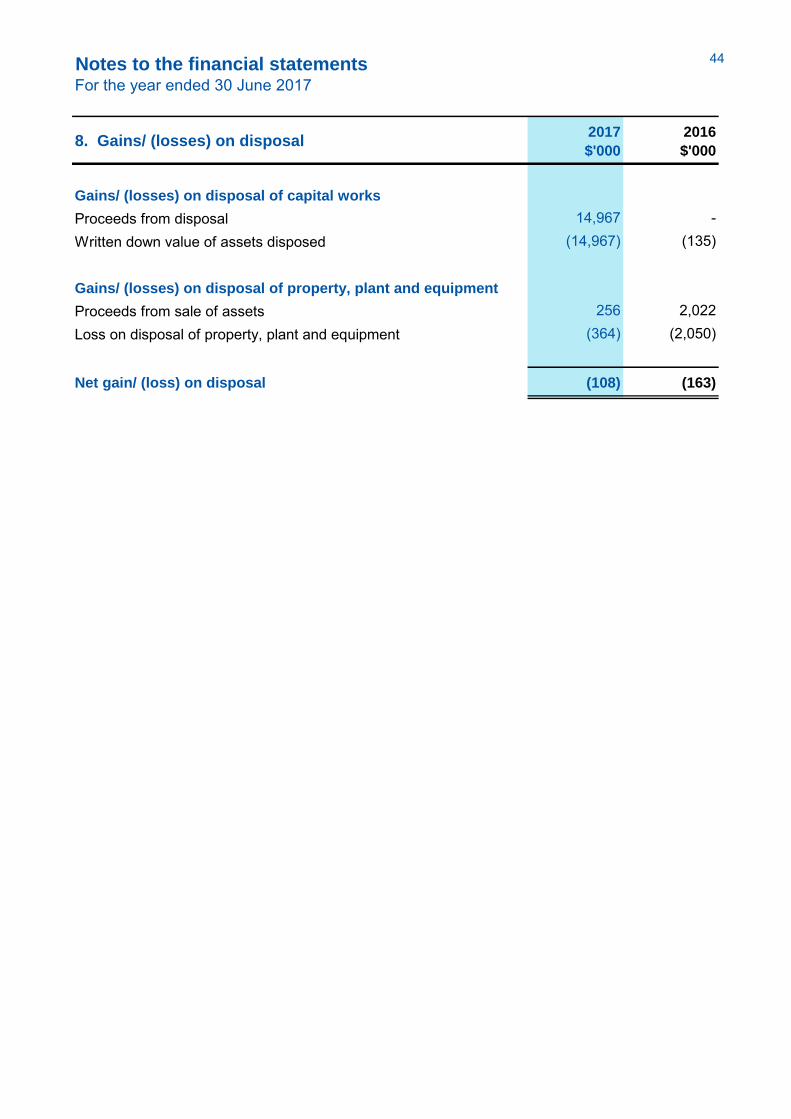
Notes to the financial statementsFor the year ended 30 June 2017
8. Gains/ (losses) on disposal
2017
$'000
2016
$'000
Gains/ (losses) on disposal of capital works
Proceeds from disposal 14,967 -Written down value of assets disposed (14,967) (135)
Gains/ (losses) on disposal of property, plant and equipment
Proceeds from sale of assets 256 2,022Loss on disposal of property, plant and equipment (364) (2,050)
Net gain/ (loss) on disposal (108) (163)
44
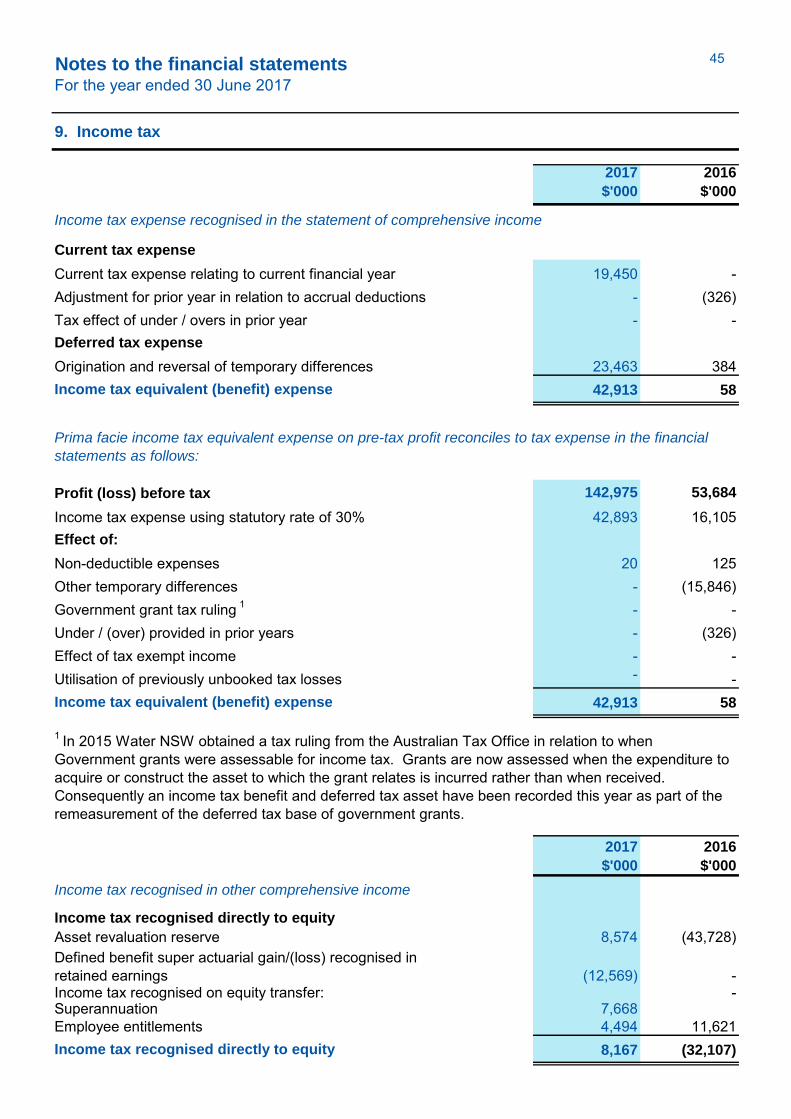
Notes to the financial statementsFor the year ended 30 June 2017
9. Income tax
2017
$'000
2016
$'000
Current tax expense
Current tax expense relating to current financial year 19,450 -Adjustment for prior year in relation to accrual deductions - (326)Tax effect of under / overs in prior year - -Deferred tax expense
Origination and reversal of temporary differences 23,463 38442,913 58
Profit (loss) before tax 142,975 53,684
Income tax expense using statutory rate of 30% 42,893 16,105Effect of:
Non-deductible expenses 20 125Other temporary differences - (15,846)Government grant tax ruling 1 - -Under / (over) provided in prior years - (326)Effect of tax exempt income - -Utilisation of previously unbooked tax losses - -
42,913 58
2017
$'000
2016
$'000
Income tax recognised in other comprehensive income
Income tax recognised directly to equity
Asset revaluation reserve 8,574 (43,728)
(12,569) --
Superannuation 7,668Employee entitlements 4,494 11,621
8,167 (32,107)
Income tax expense recognised in the statement of comprehensive income
Income tax equivalent (benefit) expense
Income tax equivalent (benefit) expense
1 In 2015 Water NSW obtained a tax ruling from the Australian Tax Office in relation to when Government grants were assessable for income tax. Grants are now assessed when the expenditure to acquire or construct the asset to which the grant relates is incurred rather than when received. Consequently an income tax benefit and deferred tax asset have been recorded this year as part of the remeasurement of the deferred tax base of government grants.
Prima facie income tax equivalent expense on pre-tax profit reconciles to tax expense in the financial
statements as follows:
Defined benefit super actuarial gain/(loss) recognised in retained earnings
Income tax recognised directly to equity
Income tax recognised on equity transfer:
45
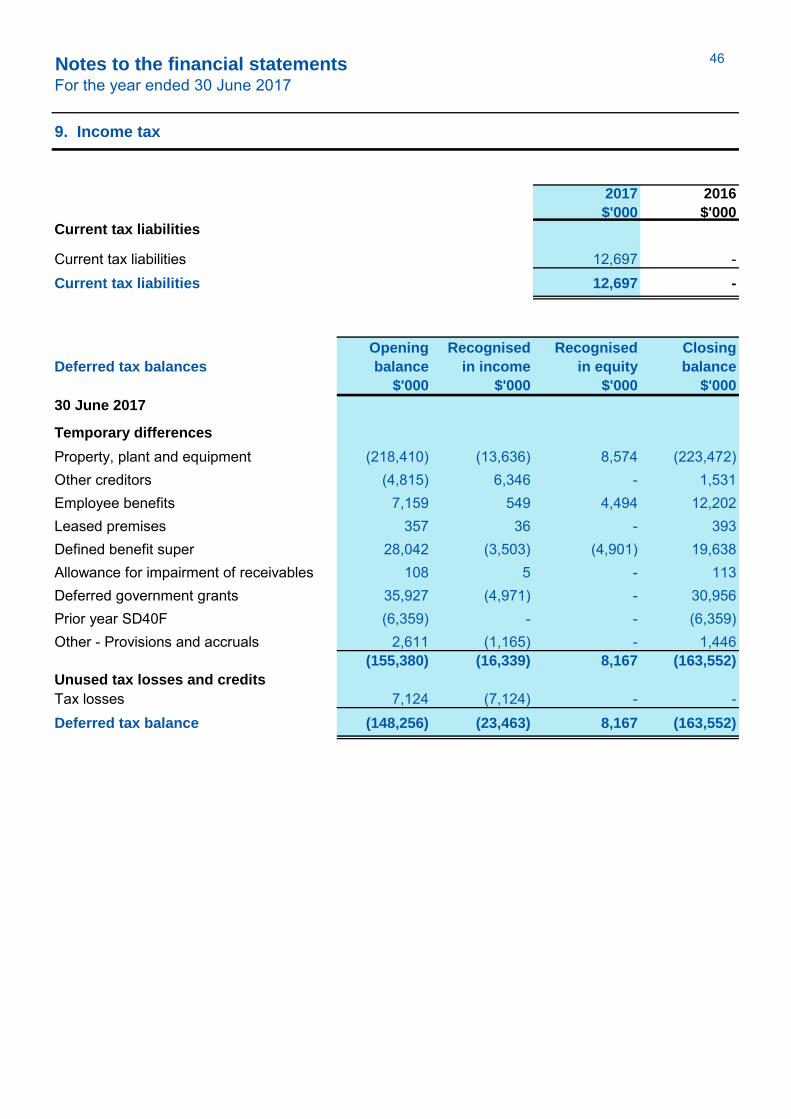
Notes to the financial statementsFor the year ended 30 June 2017
9. Income tax
2017
$'000
2016
$'000 Current tax liabilities
Current tax liabilities 12,697 -Current tax liabilities 12,697 -
Deferred tax balances
Opening
balance
$'000
Recognised
in income
$'000
Recognised
in equity
$'000
Closing
balance
$'000
30 June 2017
Temporary differences
Property, plant and equipment (218,410) (13,636) 8,574 (223,472)Other creditors (4,815) 6,346 - 1,531Employee benefits 7,159 549 4,494 12,202Leased premises 357 36 - 393Defined benefit super 28,042 (3,503) (4,901) 19,638Allowance for impairment of receivables 108 5 - 113Deferred government grants 35,927 (4,971) - 30,956Prior year SD40F (6,359) - - (6,359)Other - Provisions and accruals 2,611 (1,165) - 1,446
(155,380) (16,339) 8,167 (163,552)
Unused tax losses and credits
Tax losses 7,124 (7,124) - -Deferred tax balance (148,256) (23,463) 8,167 (163,552)
46
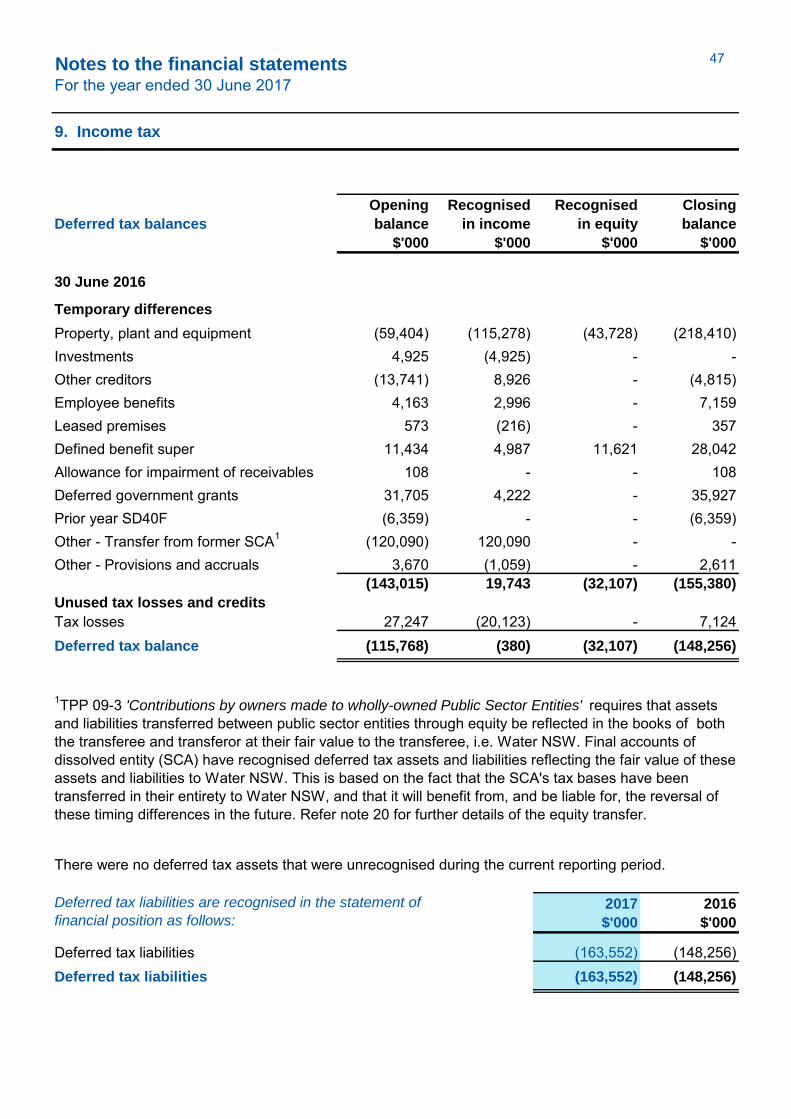
Notes to the financial statementsFor the year ended 30 June 2017
9. Income tax
Deferred tax balances
Opening
balance
$'000
Recognised
in income
$'000
Recognised
in equity
$'000
Closing
balance
$'000
30 June 2016
Temporary differences
Property, plant and equipment (59,404) (115,278) (43,728) (218,410)Investments 4,925 (4,925) - -Other creditors (13,741) 8,926 - (4,815)Employee benefits 4,163 2,996 - 7,159Leased premises 573 (216) - 357Defined benefit super 11,434 4,987 11,621 28,042Allowance for impairment of receivables 108 - - 108Deferred government grants 31,705 4,222 - 35,927Prior year SD40F (6,359) - - (6,359)Other - Transfer from former SCA1 (120,090) 120,090 - -Other - Provisions and accruals 3,670 (1,059) - 2,611
(143,015) 19,743 (32,107) (155,380)
Unused tax losses and credits
Tax losses 27,247 (20,123) - 7,124Deferred tax balance (115,768) (380) (32,107) (148,256)
2017
$'000
2016
$'000
Deferred tax liabilities (163,552) (148,256)Deferred tax liabilities (163,552) (148,256)
Deferred tax liabilities are recognised in the statement of
financial position as follows:
There were no deferred tax assets that were unrecognised during the current reporting period.
1TPP 09-3 'Contributions by owners made to wholly-owned Public Sector Entities' requires that assets and liabilities transferred between public sector entities through equity be reflected in the books of both the transferee and transferor at their fair value to the transferee, i.e. Water NSW. Final accounts of dissolved entity (SCA) have recognised deferred tax assets and liabilities reflecting the fair value of these assets and liabilities to Water NSW. This is based on the fact that the SCA's tax bases have been transferred in their entirety to Water NSW, and that it will benefit from, and be liable for, the reversal of these timing differences in the future. Refer note 20 for further details of the equity transfer.
47

Notes to the financial statementsFor the year ended 30 June 2017
10. Cash and cash equivalents
2017
$'000
2016
$'000
Cash and cash equivalents
Cash at bank and on hand 47,209 66,941Short-term deposits 115,000 -NSW Treasury Corporation Hour Glass (Cash) Facility 27,009 127,757
Cash and cash equivalents 189,218 194,698
Closing cash per statement of cash flows 189,218 194,698
Reconciliation of profit after tax to net cash from operating
activities in the statement of cash flows
Profit (loss) after tax 100,062 53,626
Depreciation, amortisation and fair value adjustment through profit and loss 24,232 95,006 Contributed assets (7,247) - Loss on disposal of property, plant and equipment 108 29 Superannuation movements direct to equity 41,898 (38,738) Income tax movements direct to equity 8,167 (32,107) Capitalised borrowing costs disclosed as operating cash flow (1,766) (2,299) Capital work in progress written off - 135 Trade and other receivables (28,536) 7,263 Other assets (6,110) 3,519 Trade and other payables 5,755 13,116 Other costs of finance 2,799 (3,247) Other liabilities (18,236) 10,286 Provisions (36,183) 30,035 Income tax assets and liabilities 27,993 30,343
Net cash from operating activities 112,936 166,967
Cash and cash equivalents recognised within the statement of financial position is reconciled to cash in the statement of cash flows as follows:
Refer to Note 24 for details regarding credit risk, liquidity risk and market risk arising from financial instruments.
48
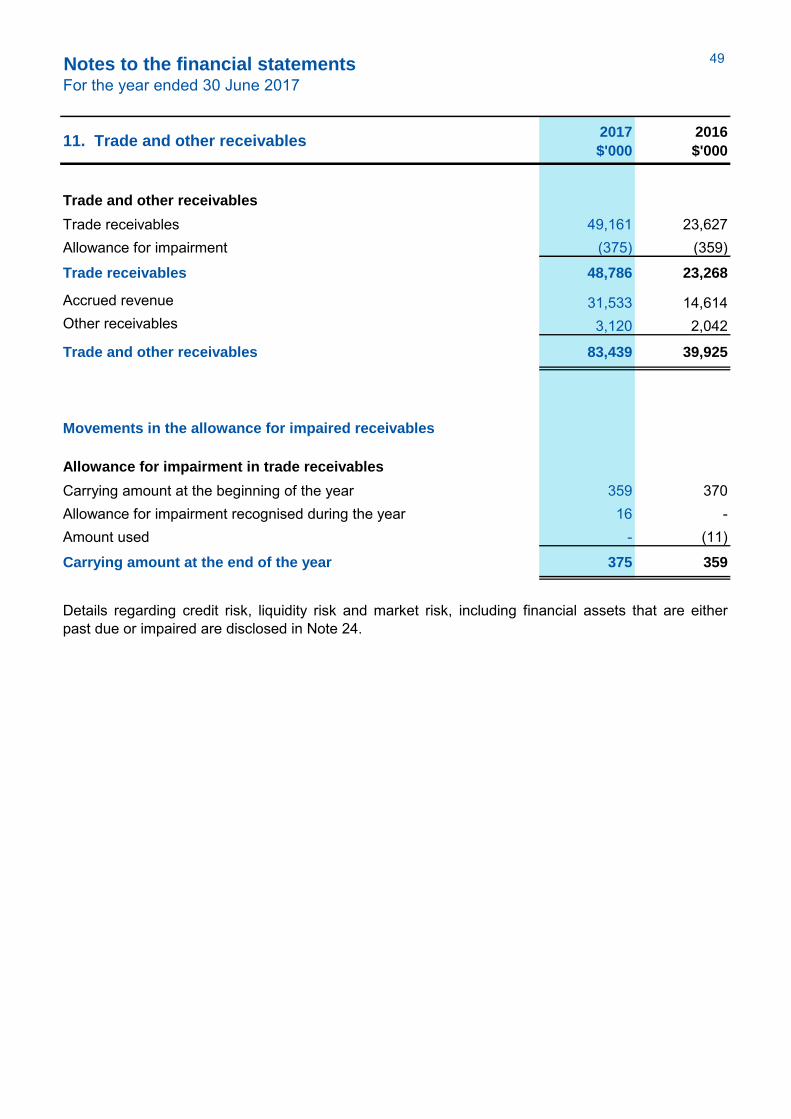
Notes to the financial statementsFor the year ended 30 June 2017
11. Trade and other receivables
2017
$'000
2016
$'000
Trade and other receivables
Trade receivables 49,161 23,627Allowance for impairment (375) (359)
Trade receivables 48,786 23,268
Accrued revenue 31,533 14,614Other receivables 3,120 2,042
Trade and other receivables 83,439 39,925
Movements in the allowance for impaired receivables
Allowance for impairment in trade receivables
Carrying amount at the beginning of the year 359 370Allowance for impairment recognised during the year 16 -Amount used - (11)
Carrying amount at the end of the year 375 359
Details regarding credit risk, liquidity risk and market risk, including financial assets that are eitherpast due or impaired are disclosed in Note 24.
49
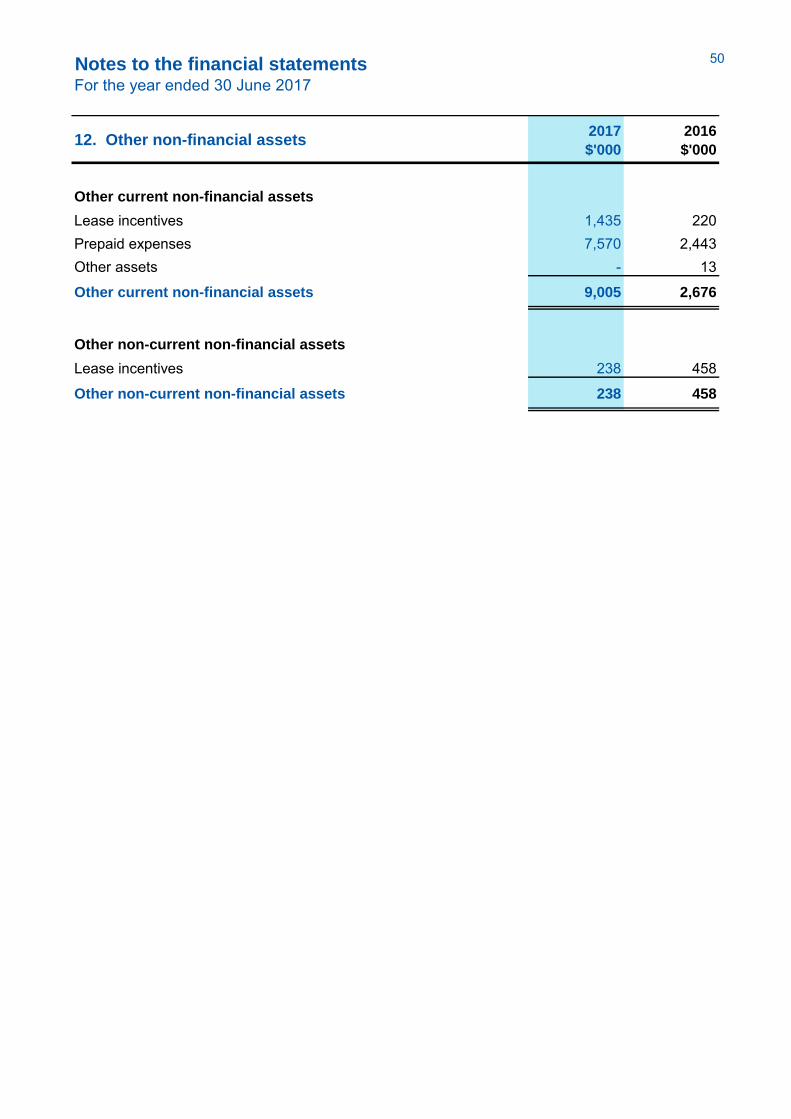
Notes to the financial statementsFor the year ended 30 June 2017
12. Other non-financial assets
2017
$'000
2016
$'000
Other current non-financial assets
Lease incentives 1,435 220Prepaid expenses 7,570 2,443Other assets - 13
Other current non-financial assets 9,005 2,676
Other non-current non-financial assets
Lease incentives 238 458
Other non-current non-financial assets 238 458
50
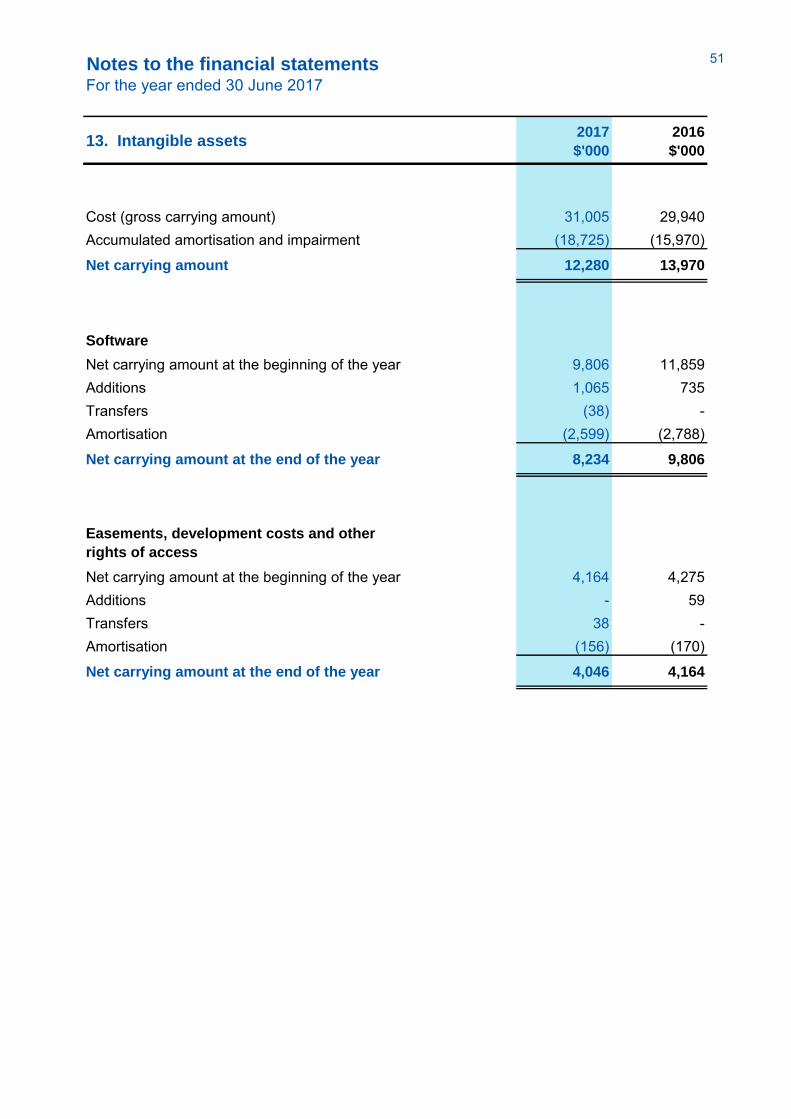
Notes to the financial statementsFor the year ended 30 June 2017
13. Intangible assets
2017
$'000
2016
$'000
Cost (gross carrying amount) 31,005 29,940Accumulated amortisation and impairment (18,725) (15,970)
Net carrying amount 12,280 13,970
Software
Net carrying amount at the beginning of the year 9,806 11,859Additions 1,065 735Transfers (38) -Amortisation (2,599) (2,788)
Net carrying amount at the end of the year 8,234 9,806
Easements, development costs and other
rights of access
Net carrying amount at the beginning of the year 4,164 4,275Additions - 59Transfers 38 -Amortisation (156) (170)
Net carrying amount at the end of the year 4,046 4,164
51

Notes to the financial statementsFor the year ended 30 June 2017
14. Property, plant and equipment
30 June 2017 Work in
progress Infrastructure
Water
meters Buildings
System
land
Market
land
Plant &
equipment
Motor
vehicles
Furniture
& fitouts
Information
systems Total
$'000 $'000 $'000 $'000 $'000 $'000 $'000 $'000 $'000 $'000 $'000
At 1 July 2016 - Fair value
Gross carrying amount 123,351 1,854,762 18,330 42,686 - 184,096 36,917 11,665 4,871 11,344 2,288,022Accumulated depreciation and impairment - - - - - - (15,662) (3,560) (2,004) (8,371) (29,597)Carrying value at the beginning of the
period 123,351 1,854,762 18,330 42,686 - 184,096 21,255 8,105 2,867 2,973 2,258,425
At 30 June 2017 - Fair value
Gross carrying amount 103,005 1,867,674 36,218 39,829 157,406 31,361 37,753 11,930 6,007 12,873 2,304,056Accumulated depreciation and impairment - - - - - - (18,582) (4,707) (2,545) (9,703) (35,537)
Carrying value at the end of the period 103,005 1,867,674 36,218 39,829 157,406 31,361 19,171 7,223 3,462 3,170 2,268,519
At 30 June 2017
Carrying value at the beginning of the year 123,351 1,854,762 18,330 42,686 - 184,096 21,255 8,105 2,867 2,973 2,258,425Assets recognised on equity transfer - 3,453 1,258 - - - 199 17 - - 4,927Additions 63,252 54,247 16,501 179 812 - 684 686 1,124 1,705 139,190Disposals - (92) - - - - (4) (264) - (5) (365)Depreciation - (44,681) (2,898) (1,887) - - (2,963) (1,321) (529) (1,503) (55,782)Revaluation gain/loss recognised in other comprehensive income - (45,445) 568 (1,307) 6,793 10,808 - - - - (28,583)Revaluation gain/loss in profit or loss - 45,430 2,459 158 (5,013) (8,729) - - - - 34,305WIP written off (14,967) - - - - - - - - - (14,967)Transfers and reclassifications (68,631) - - - 154,814 (154,814) - - - - (68,631)Carrying value at the end of the
period103,005 1,867,674 36,218 39,829 157,406 31,361 19,171 7,223 3,462 3,170 2,268,519
SYSTEM ASSETS
52
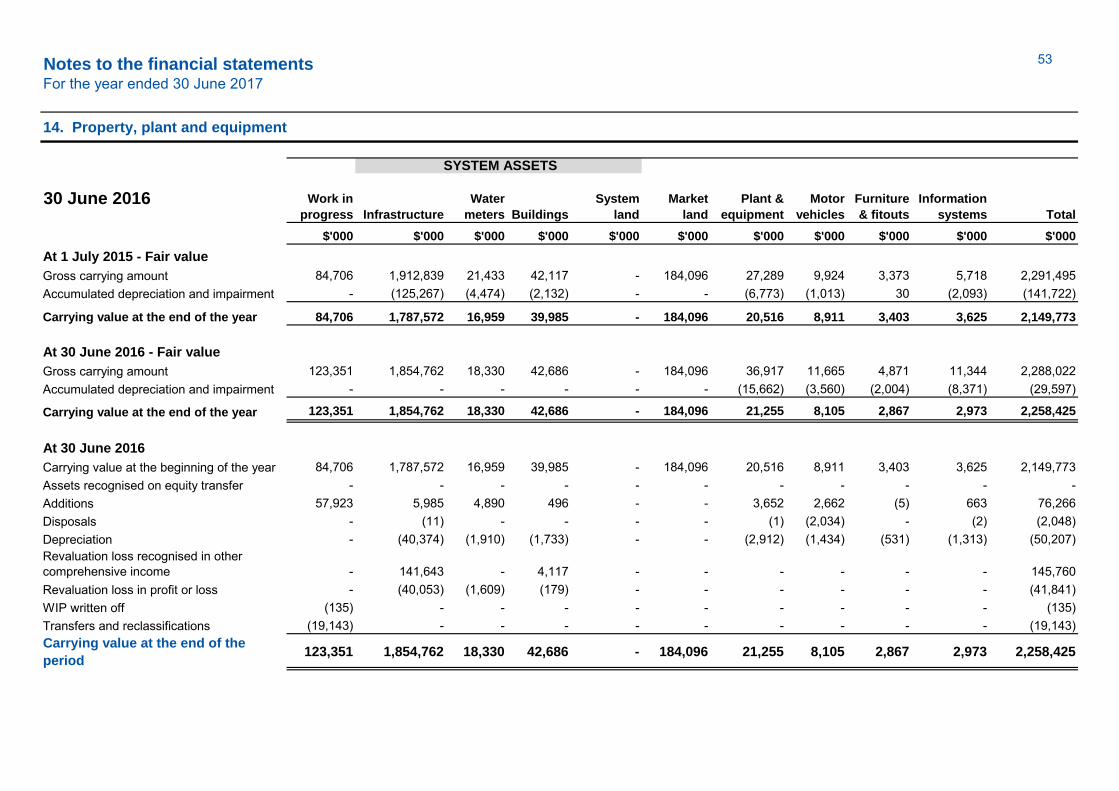
Notes to the financial statementsFor the year ended 30 June 2017
14. Property, plant and equipment
30 June 2016 Work in
progress Infrastructure
Water
meters Buildings
System
land
Market
land
Plant &
equipment
Motor
vehicles
Furniture
& fitouts
Information
systems Total
$'000 $'000 $'000 $'000 $'000 $'000 $'000 $'000 $'000 $'000 $'000
At 1 July 2015 - Fair value
Gross carrying amount 84,706 1,912,839 21,433 42,117 - 184,096 27,289 9,924 3,373 5,718 2,291,495Accumulated depreciation and impairment - (125,267) (4,474) (2,132) - - (6,773) (1,013) 30 (2,093) (141,722)
Carrying value at the end of the year 84,706 1,787,572 16,959 39,985 - 184,096 20,516 8,911 3,403 3,625 2,149,773
At 30 June 2016 - Fair value
Gross carrying amount 123,351 1,854,762 18,330 42,686 - 184,096 36,917 11,665 4,871 11,344 2,288,022Accumulated depreciation and impairment - - - - - - (15,662) (3,560) (2,004) (8,371) (29,597)
Carrying value at the end of the year 123,351 1,854,762 18,330 42,686 - 184,096 21,255 8,105 2,867 2,973 2,258,425
1,854,762 18,330
At 30 June 2016
Carrying value at the beginning of the year 84,706 1,787,572 16,959 39,985 - 184,096 20,516 8,911 3,403 3,625 2,149,773Assets recognised on equity transfer - - - - - - - - - - -Additions 57,923 5,985 4,890 496 - - 3,652 2,662 (5) 663 76,266Disposals - (11) - - - - (1) (2,034) - (2) (2,048)Depreciation - (40,374) (1,910) (1,733) - - (2,912) (1,434) (531) (1,313) (50,207)Revaluation loss recognised in other comprehensive income - 141,643 - 4,117 - - - - - - 145,760Revaluation loss in profit or loss - (40,053) (1,609) (179) - - - - - - (41,841)WIP written off (135) - - - - - - - - - (135)Transfers and reclassifications (19,143) - - - - - - - - - (19,143)Carrying value at the end of the
period123,351 1,854,762 18,330 42,686 - 184,096 21,255 8,105 2,867 2,973 2,258,425
SYSTEM ASSETS
53
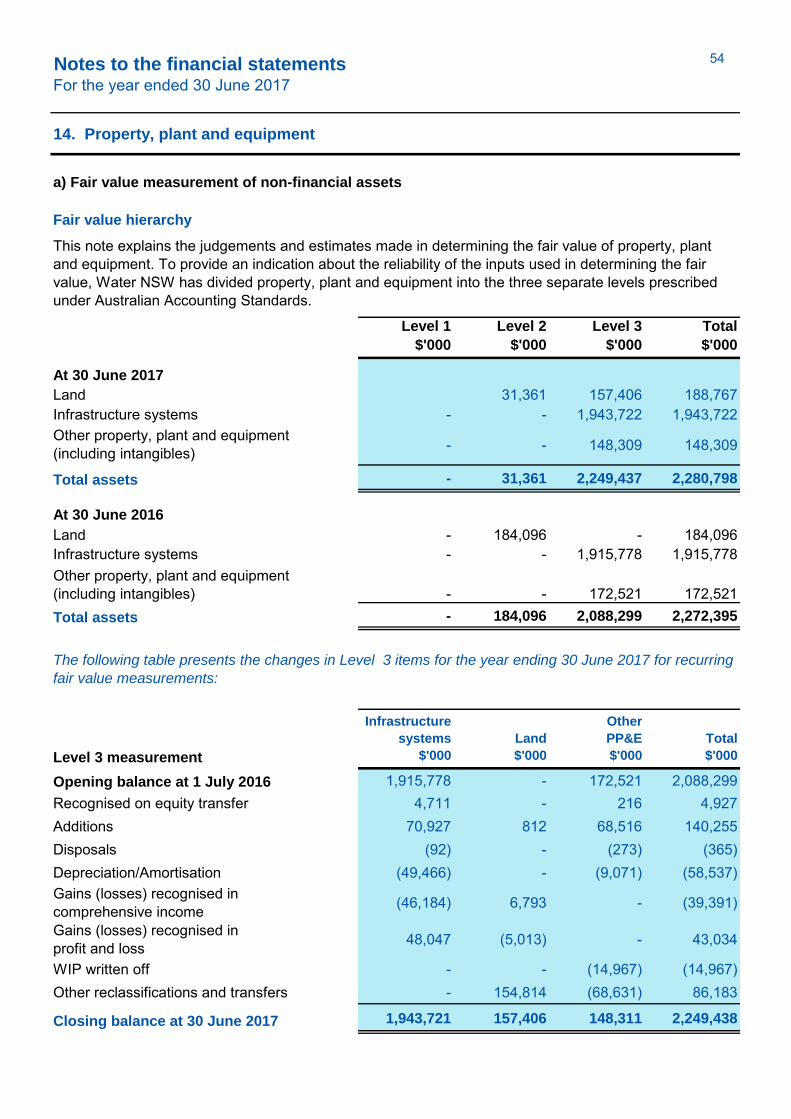
Notes to the financial statementsFor the year ended 30 June 2017
14. Property, plant and equipment
a) Fair value measurement of non-financial assets
Level 1
$'000
Level 2
$'000
Level 3
$'000
Total
$'000
At 30 June 2017
Land 31,361 157,406 188,767Infrastructure systems - - 1,943,722 1,943,722
- - 148,309 148,309
Total assets - 31,361 2,249,437 2,280,798
At 30 June 2016
Land - 184,096 - 184,096Infrastructure systems - - 1,915,778 1,915,778
- - 172,521 172,521Total assets - 184,096 2,088,299 2,272,395
Level 3 measurement
Infrastructure
systems
$'000
Land
$'000
Other
PP&E
$'000
Total
$'000
Opening balance at 1 July 2016 1,915,778 - 172,521 2,088,299Recognised on equity transfer 4,711 - 216 4,927Additions 70,927 812 68,516 140,255Disposals (92) - (273) (365)Depreciation/Amortisation (49,466) - (9,071) (58,537)Gains (losses) recognised in comprehensive income (46,184) 6,793 - (39,391)
Gains (losses) recognised in profit and loss 48,047 (5,013) - 43,034
WIP written off - - (14,967) (14,967)Other reclassifications and transfers - 154,814 (68,631) 86,183
Closing balance at 30 June 2017 1,943,721 157,406 148,311 2,249,438
The following table presents the changes in Level 3 items for the year ending 30 June 2017 for recurring
fair value measurements:
Fair value hierarchy
This note explains the judgements and estimates made in determining the fair value of property, plant and equipment. To provide an indication about the reliability of the inputs used in determining the fair value, Water NSW has divided property, plant and equipment into the three separate levels prescribed under Australian Accounting Standards.
Other property, plant and equipment (including intangibles)
Other property, plant and equipment (including intangibles)
54
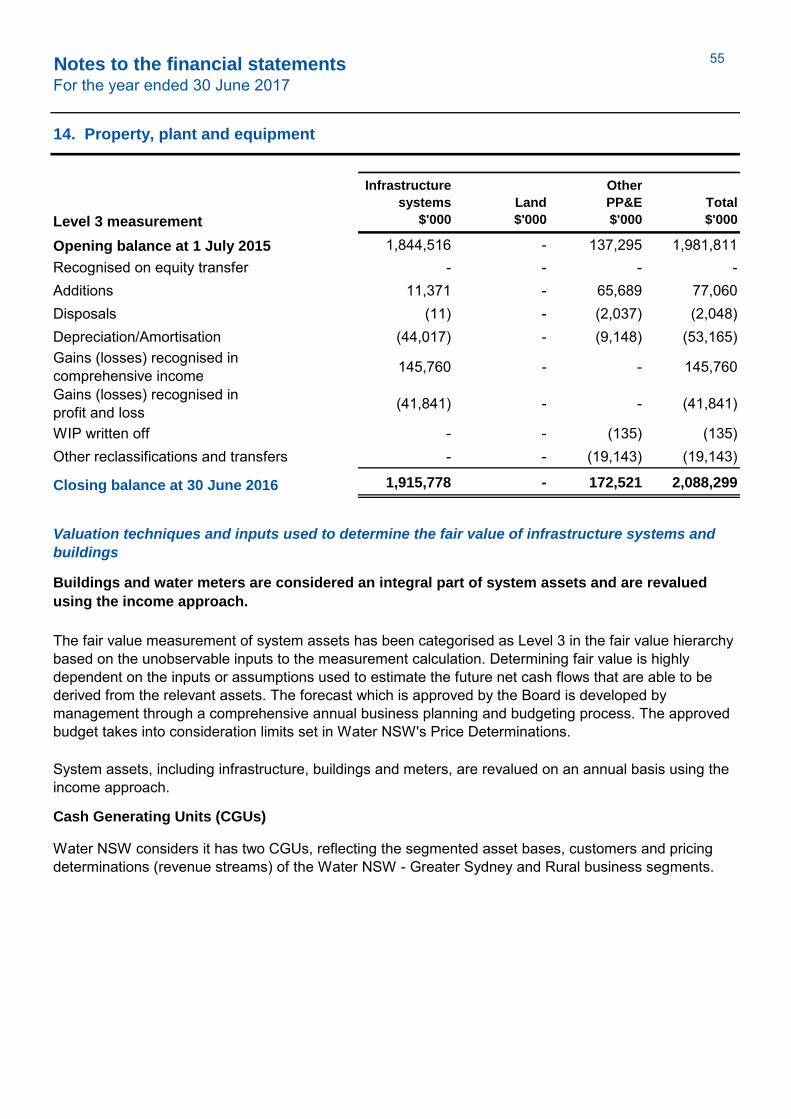
Notes to the financial statementsFor the year ended 30 June 2017
14. Property, plant and equipment
Level 3 measurement
Infrastructure
systems
$'000
Land
$'000
Other
PP&E
$'000
Total
$'000
Opening balance at 1 July 2015 1,844,516 - 137,295 1,981,811Recognised on equity transfer - - - -Additions 11,371 - 65,689 77,060Disposals (11) - (2,037) (2,048)Depreciation/Amortisation (44,017) - (9,148) (53,165)Gains (losses) recognised in comprehensive income 145,760 - - 145,760
Gains (losses) recognised in profit and loss (41,841) - - (41,841)
WIP written off - - (135) (135)Other reclassifications and transfers - - (19,143) (19,143)
Closing balance at 30 June 2016 1,915,778 - 172,521 2,088,299
Cash Generating Units (CGUs)
Water NSW considers it has two CGUs, reflecting the segmented asset bases, customers and pricing determinations (revenue streams) of the Water NSW - Greater Sydney and Rural business segments.
Valuation techniques and inputs used to determine the fair value of infrastructure systems and
buildings
Buildings and water meters are considered an integral part of system assets and are revalued
using the income approach.
The fair value measurement of system assets has been categorised as Level 3 in the fair value hierarchy based on the unobservable inputs to the measurement calculation. Determining fair value is highly dependent on the inputs or assumptions used to estimate the future net cash flows that are able to be derived from the relevant assets. The forecast which is approved by the Board is developed by management through a comprehensive annual business planning and budgeting process. The approved budget takes into consideration limits set in Water NSW's Price Determinations.
System assets, including infrastructure, buildings and meters, are revalued on an annual basis using the income approach.
55
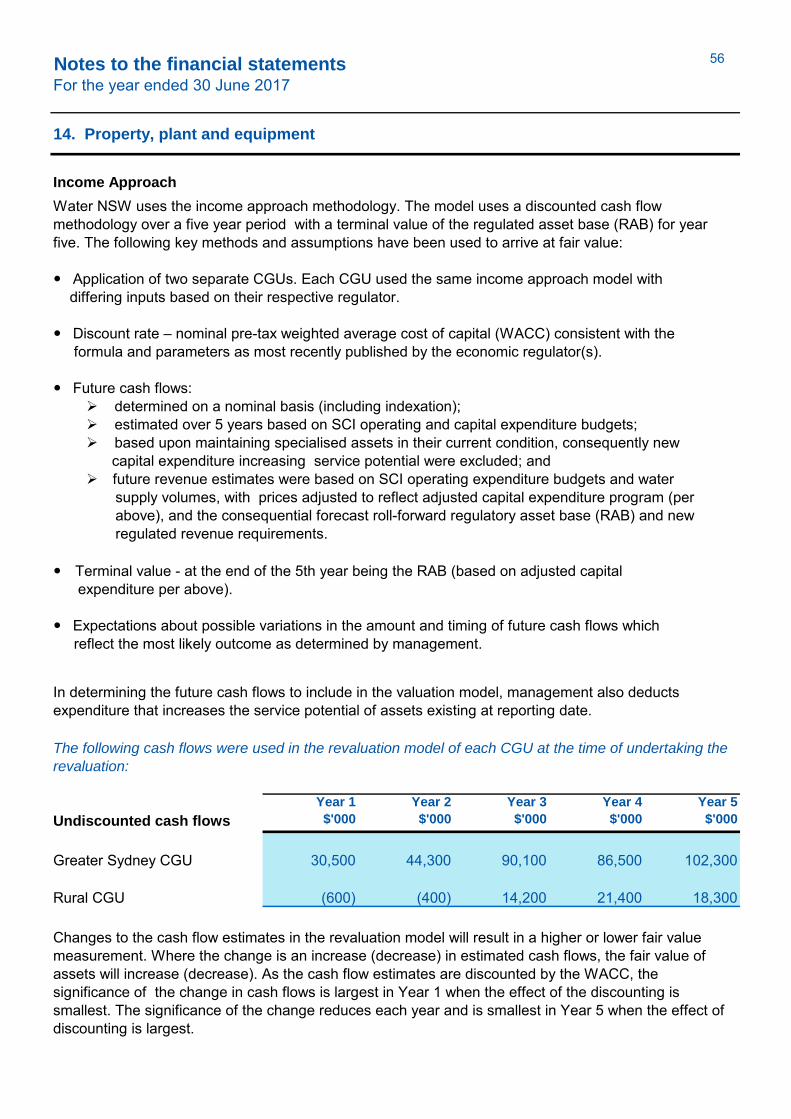
Notes to the financial statementsFor the year ended 30 June 2017
14. Property, plant and equipment
Income Approach
Undiscounted cash flows
Year 1
$'000
Year 2
$'000
Year 3
$'000
Year 4
$'000
Year 5
$'000
Greater Sydney CGU 30,500 44,300 90,100 86,500 102,300
Rural CGU (600) (400) 14,200 21,400 18,300
Changes to the cash flow estimates in the revaluation model will result in a higher or lower fair value measurement. Where the change is an increase (decrease) in estimated cash flows, the fair value of assets will increase (decrease). As the cash flow estimates are discounted by the WACC, the significance of the change in cash flows is largest in Year 1 when the effect of the discounting is smallest. The significance of the change reduces each year and is smallest in Year 5 when the effect of discounting is largest.
The following cash flows were used in the revaluation model of each CGU at the time of undertaking the
revaluation:
In determining the future cash flows to include in the valuation model, management also deducts expenditure that increases the service potential of assets existing at reporting date.
Water NSW uses the income approach methodology. The model uses a discounted cash flow methodology over a five year period with a terminal value of the regulated asset base (RAB) for year five. The following key methods and assumptions have been used to arrive at fair value:
Application of two separate CGUs. Each CGU used the same income approach model with differing inputs based on their respective regulator.
Discount rate – nominal pre-tax weighted average cost of capital (WACC) consistent with the formula and parameters as most recently published by the economic regulator(s).
Future cash flows: determined on a nominal basis (including indexation); estimated over 5 years based on SCI operating and capital expenditure budgets; based upon maintaining specialised assets in their current condition, consequently new capital expenditure increasing service potential were excluded; and future revenue estimates were based on SCI operating expenditure budgets and water supply volumes, with prices adjusted to reflect adjusted capital expenditure program (per above), and the consequential forecast roll-forward regulatory asset base (RAB) and new regulated revenue requirements. Terminal value - at the end of the 5th year being the RAB (based on adjusted capital expenditure per above).
Expectations about possible variations in the amount and timing of future cash flows which reflect the most likely outcome as determined by management.
56
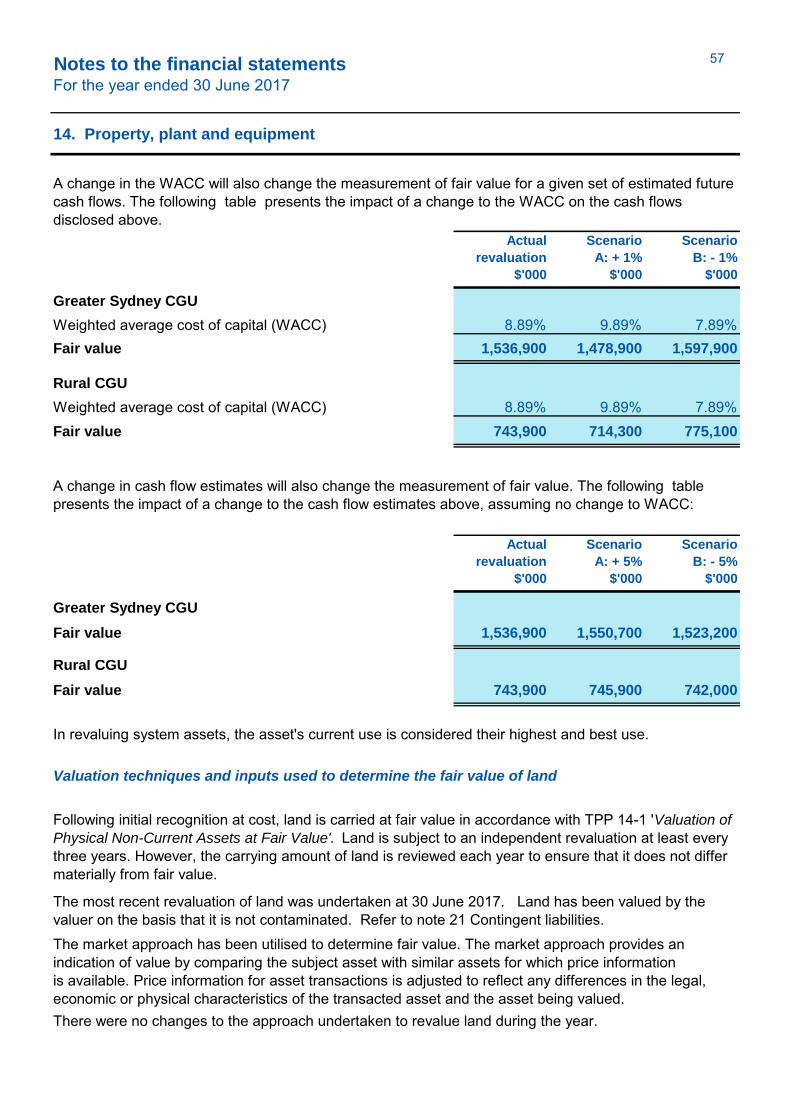
Notes to the financial statementsFor the year ended 30 June 2017
14. Property, plant and equipment
Actual
revaluation
$'000
Scenario
A: + 1%
$'000
Scenario
B: - 1%
$'000
Greater Sydney CGU
Weighted average cost of capital (WACC) 8.89% 9.89% 7.89%Fair value 1,536,900 1,478,900 1,597,900
Rural CGU
Weighted average cost of capital (WACC) 8.89% 9.89% 7.89%Fair value 743,900 714,300 775,100
Actual
revaluation
$'000
Scenario
A: + 5%
$'000
Scenario
B: - 5%
$'000
Greater Sydney CGU
Fair value 1,536,900 1,550,700 1,523,200
Rural CGU
Fair value 743,900 745,900 742,000
In revaluing system assets, the asset's current use is considered their highest and best use.
There were no changes to the approach undertaken to revalue land during the year.
Following initial recognition at cost, land is carried at fair value in accordance with TPP 14-1 'Valuation of
Physical Non-Current Assets at Fair Value'. Land is subject to an independent revaluation at least every three years. However, the carrying amount of land is reviewed each year to ensure that it does not differ materially from fair value.
A change in the WACC will also change the measurement of fair value for a given set of estimated future cash flows. The following table presents the impact of a change to the WACC on the cash flows disclosed above.
The most recent revaluation of land was undertaken at 30 June 2017. Land has been valued by the valuer on the basis that it is not contaminated. Refer to note 21 Contingent liabilities.The market approach has been utilised to determine fair value. The market approach provides an indication of value by comparing the subject asset with similar assets for which price informationis available. Price information for asset transactions is adjusted to reflect any differences in the legal, economic or physical characteristics of the transacted asset and the asset being valued.
Valuation techniques and inputs used to determine the fair value of land
A change in cash flow estimates will also change the measurement of fair value. The following table presents the impact of a change to the cash flow estimates above, assuming no change to WACC:
57

Notes to the financial statementsFor the year ended 30 June 2017
14. Property, plant and equipment
Scenario B:
$'000
Scenario C:
$'000
Scenario
D:
$'000
Scenario
E:
$'000
% change 1% -1% 5% -5%
Increase(decrease in fair value) 158,980 155,832 165,276 149,536
% of Total fair value of property, plant and equipment 7% 7% 7% 7%
Other property, plant and equipment is valued at fair value in accordance with Australian Accounting Standards and guidance within TPP 14-1 'Valuation of Physical Non-Current Assets at Fair Value' . For non-specialised assets, TPP 14-1 'Valuation of Physical Non-Current Assets at Fair Value ' allows for recognition at depreciated historical cost as an acceptable surrogate for fair value. Depreciated historical cost is considered an appropriate surrogate because any difference between fair value and depreciated historical cost is unlikely to be material. Further, the benefit of ascertaining a more accurate estimate of fair value does not justify the additional costs of obtaining it.
In revaluing other property, plant and equipment, the assets current use is considered their highest and best use.There were no changes to the valuation technique adopted for other property, plant and equipment during the year.
The impact on total land assets caused by movements in the value the land are as follows:
The sensitivity analysis indicates that movements up or down in value per hectare would have an immaterial impact on the overall valuation of the land. The valuation indicates that any movement of this magnitude is unlikely.
Valuation techniques and inputs used to determine other property, plant and equipment
The significant unobservable inputs used in the fair value measurement of the land assets relate to the professional judgement utilised to adjust market prices and other relevant information generated by market transactions to arrive at fair value. The use of a significantly higher (lower) transaction would result in a significantly higher (lower) fair value measurement.
58

Notes to the financial statementsFor the year ended 30 June 2017
14. Property, plant and equipment
b) Asset values measured at historical cost
Historical
Cost
$'000
Fair
Value
$'000
Historical
Cost
$'000
Fair
Value
$'000
Work in progress 103,005 103,005 123,351 123,351Infrastructure systems 1,346,698 1,867,674 1,304,943 1,854,762Water meters 55,425 36,218 30,647 18,330
Buildings 26,457 39,829 26,957 42,686Land 118,384 188,767 117,572 184,096Plant and equipment 19,171 19,171 21,255 21,255Motor vehicles 7,223 7,223 8,105 8,105Furniture and fit outs 3,462 3,462 2,867 2,867Information systems 3,170 3,170 2,973 2,973Carrying value at historical cost 1,682,995 2,268,519 1,638,670 2,258,425
2017 2016
59
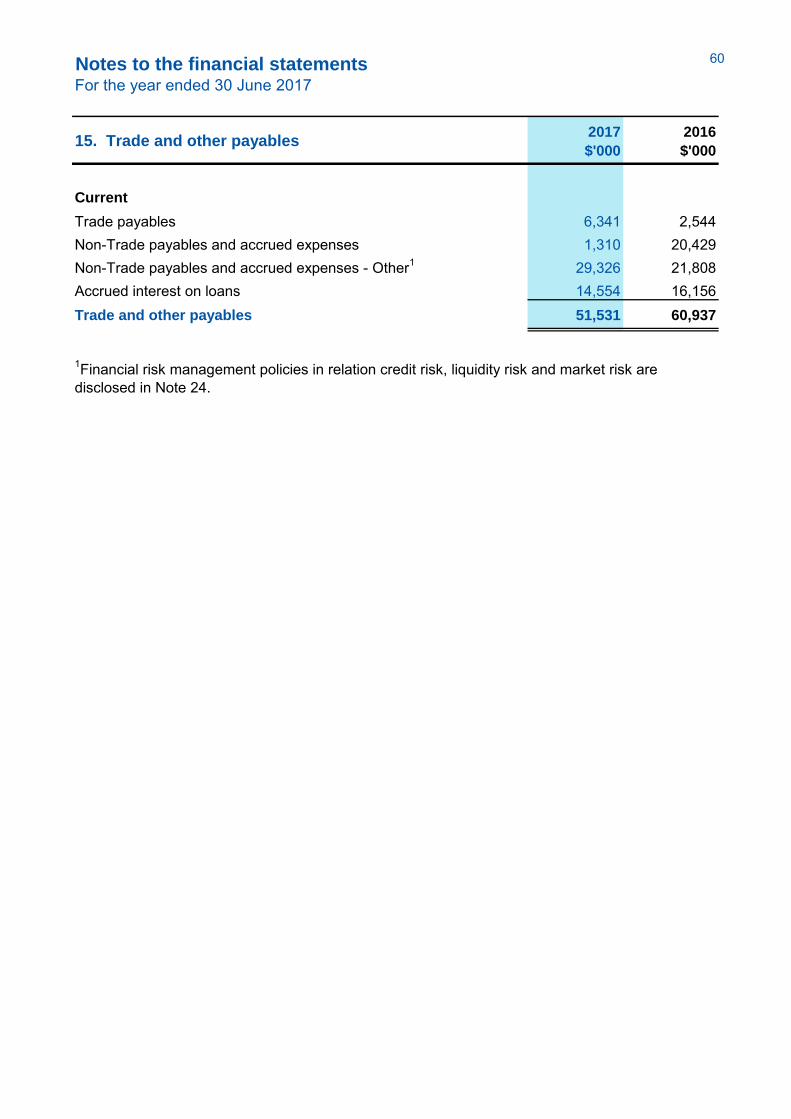
Notes to the financial statementsFor the year ended 30 June 2017
15. Trade and other payables
2017
$'000
2016
$'000
Current
Trade payables 6,341 2,544Non-Trade payables and accrued expenses 1,310 20,429Non-Trade payables and accrued expenses - Other1 29,326 21,808Accrued interest on loans 14,554 16,156Trade and other payables 51,531 60,937
1Financial risk management policies in relation credit risk, liquidity risk and market risk are disclosed in Note 24.
60
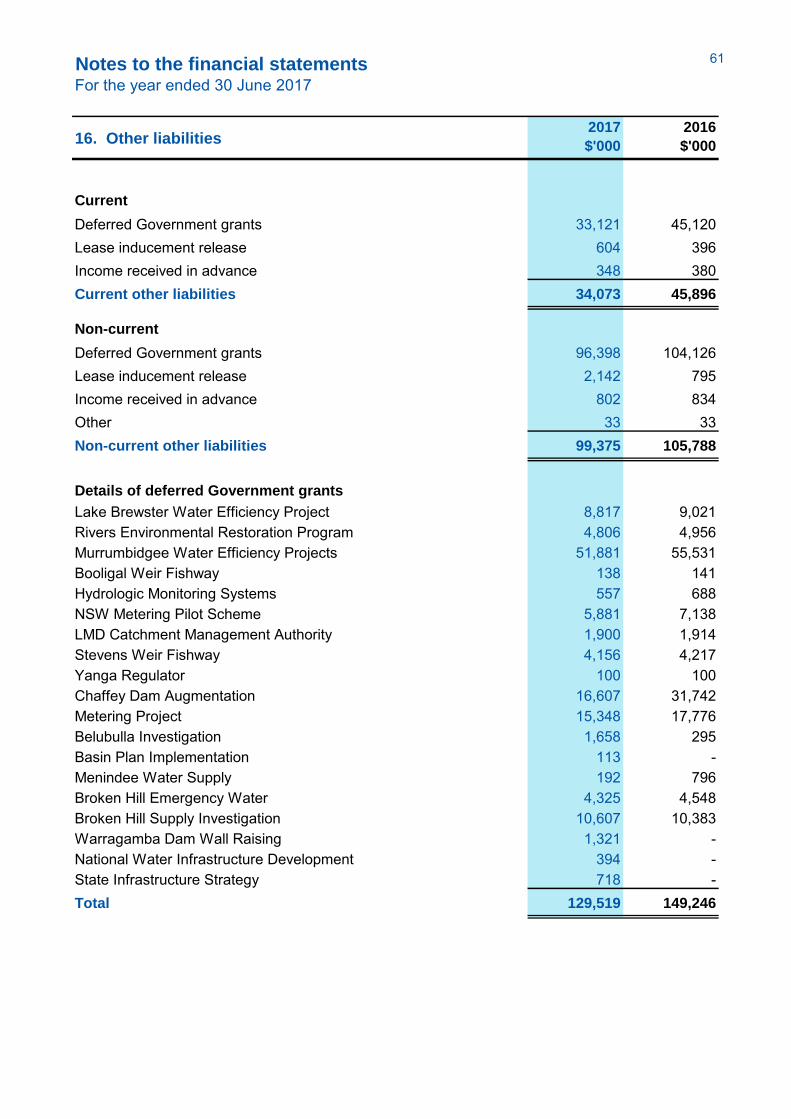
Notes to the financial statementsFor the year ended 30 June 2017
16. Other liabilities
2017
$'000
2016
$'000
Current
Deferred Government grants 33,121 45,120Lease inducement release 604 396Income received in advance 348 380Current other liabilities 34,073 45,896
Non-current
Deferred Government grants 96,398 104,126Lease inducement release 2,142 795Income received in advance 802 834Other1 33 33Non-current other liabilities 99,375 105,788
Details of deferred Government grants
Lake Brewster Water Efficiency Project 8,817 9,021Rivers Environmental Restoration Program 4,806 4,956Murrumbidgee Water Efficiency Projects 51,881 55,531Booligal Weir Fishway 138 141Hydrologic Monitoring Systems 557 688NSW Metering Pilot Scheme 5,881 7,138LMD Catchment Management Authority 1,900 1,914Stevens Weir Fishway 4,156 4,217Yanga Regulator 100 100Chaffey Dam Augmentation 16,607 31,742Metering Project 15,348 17,776Belubulla Investigation 1,658 295Basin Plan Implementation 113 -Menindee Water Supply 192 796Broken Hill Emergency Water 4,325 4,548Broken Hill Supply Investigation 10,607 10,383Warragamba Dam Wall Raising 1,321 -National Water Infrastructure Development 394 -State Infrastructure Strategy 718 -Total 129,519 149,246
61
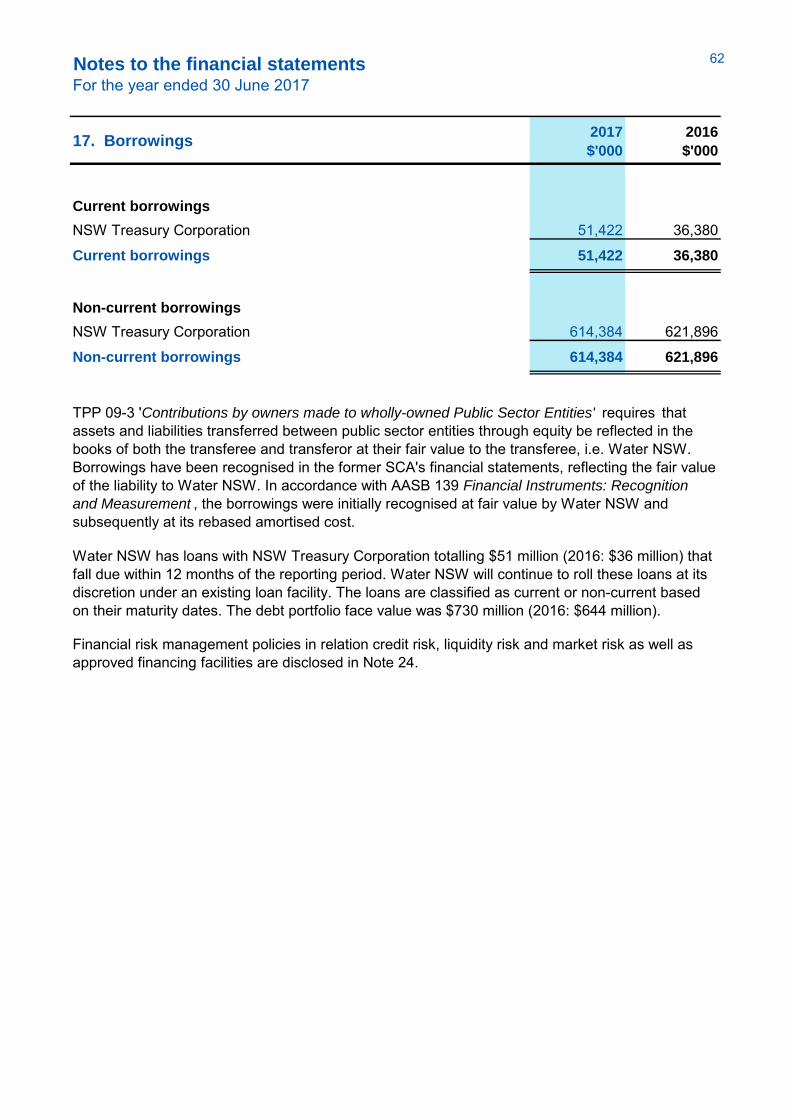
Notes to the financial statementsFor the year ended 30 June 2017
17. Borrowings
2017
$'000
2016
$'000
Current borrowings
NSW Treasury Corporation 51,422 36,380
Current borrowings 51,422 36,380
Non-current borrowings
NSW Treasury Corporation 614,384 621,896
Non-current borrowings 614,384 621,896
TPP 09-3 'Contributions by owners made to wholly-owned Public Sector Entities' requires that assets and liabilities transferred between public sector entities through equity be reflected in the books of both the transferee and transferor at their fair value to the transferee, i.e. Water NSW. Borrowings have been recognised in the former SCA's financial statements, reflecting the fair value of the liability to Water NSW. In accordance with AASB 139 Financial Instruments: Recognition
and Measurement , the borrowings were initially recognised at fair value by Water NSW and subsequently at its rebased amortised cost.
Water NSW has loans with NSW Treasury Corporation totalling $51 million (2016: $36 million) that fall due within 12 months of the reporting period. Water NSW will continue to roll these loans at its discretion under an existing loan facility. The loans are classified as current or non-current based on their maturity dates. The debt portfolio face value was $730 million (2016: $644 million).
Financial risk management policies in relation credit risk, liquidity risk and market risk as well as approved financing facilities are disclosed in Note 24.
62
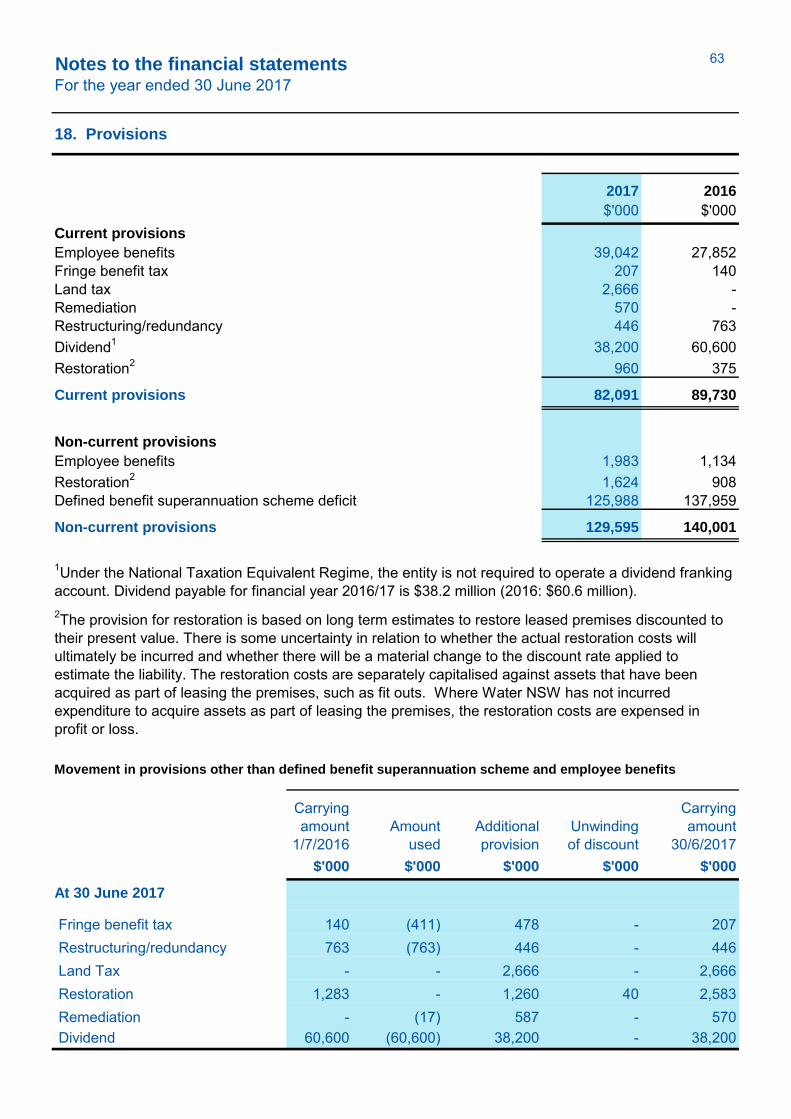
Notes to the financial statementsFor the year ended 30 June 2017
18. Provisions
2017 2016
$'000 $'000 Current provisions
Employee benefits 39,042 27,852Fringe benefit tax 207 140Land tax 2,666 -Remediation 570 -Restructuring/redundancy 446 763Dividend1 38,200 60,600Restoration2 960 375
Current provisions 82,091 89,730
Non-current provisions
Employee benefits 1,983 1,134Restoration2 1,624 908Defined benefit superannuation scheme deficit 125,988 137,959
Non-current provisions 129,595 140,001
Carrying amount
1/7/2016 Amount
used Additional
provision Unwinding
of discount
Carrying amount
30/6/2017 $'000 $'000 $'000 $'000 $'000
At 30 June 2017
Fringe benefit tax 140 (411) 478 - 207 Restructuring/redundancy 763 (763) 446 - 446 Land Tax - - 2,666 - 2,666 Restoration 1,283 - 1,260 40 2,583 Remediation - (17) 587 - 570 Dividend 60,600 (60,600) 38,200 - 38,200
1Under the National Taxation Equivalent Regime, the entity is not required to operate a dividend franking account. Dividend payable for financial year 2016/17 is $38.2 million (2016: $60.6 million).
Movement in provisions other than defined benefit superannuation scheme and employee benefits
2The provision for restoration is based on long term estimates to restore leased premises discounted to their present value. There is some uncertainty in relation to whether the actual restoration costs will ultimately be incurred and whether there will be a material change to the discount rate applied to estimate the liability. The restoration costs are separately capitalised against assets that have been acquired as part of leasing the premises, such as fit outs. Where Water NSW has not incurred expenditure to acquire assets as part of leasing the premises, the restoration costs are expensed in profit or loss.
63
Notes to the financial statementsFor the year ended 30 June 2017
18. Provisions
Nature of the benefits provided by the fund
Description of the regulatory framework
Description of other entities' responsibilities for the governance of the fund
(a) Defined benefit superannuation schemes
The Pooled Fund holds in trust the investments of the closed NSW public sector superannuation schemes: State Authorities Superannuation Scheme (SASS); State Superannuation Scheme (SSS); State Authorities Non-Contributory Superannuation Scheme (SANCS)
These schemes are all defined benefit schemes – at least a component of the final benefit is derived from a multiple of member salary and years of membership. Members receive lump sum or pension benefits on retirement, death, disablement and withdrawal. All the Schemes are closed to new members.
The schemes in the Pooled Fund are established and governed by the following NSW legislation: Superannuation Act 1916 , State Authorities Superannuation Act 1987 , State Authorities Non-
Contributory Superannuation Scheme Act 1987 , and their associated regulations.
Under a Heads of Government agreement, the New South Wales Government undertakes to ensure that the Pooled Fund will conform with the principles of the Commonwealth’s retirement incomes policy relating to preservation, vesting and reporting to members and that members’ benefits are adequately protected.
The New South Wales Government prudentially monitors and audits the Pooled Fund and the Trustee Board activities in a manner consistent with the prudential controls of the SIS legislation. These provisions are in addition to other legislative obligations on the Trustee Board and internal processes that monitor the Trustee Board’s adherence to the principles of the Commonwealth’s retirement incomes policy.
The Fund's Trustee is responsible for the governance of the Fund. The Trustee has a legal obligation to act solely in the best interests of fund beneficiaries. The Trustee has the following roles: Administration of the fund and payment to the beneficiaries from fund assets when required in accordance with the fund rules; Management and investment of the fund assets; and Compliance with other applicable regulations.
64
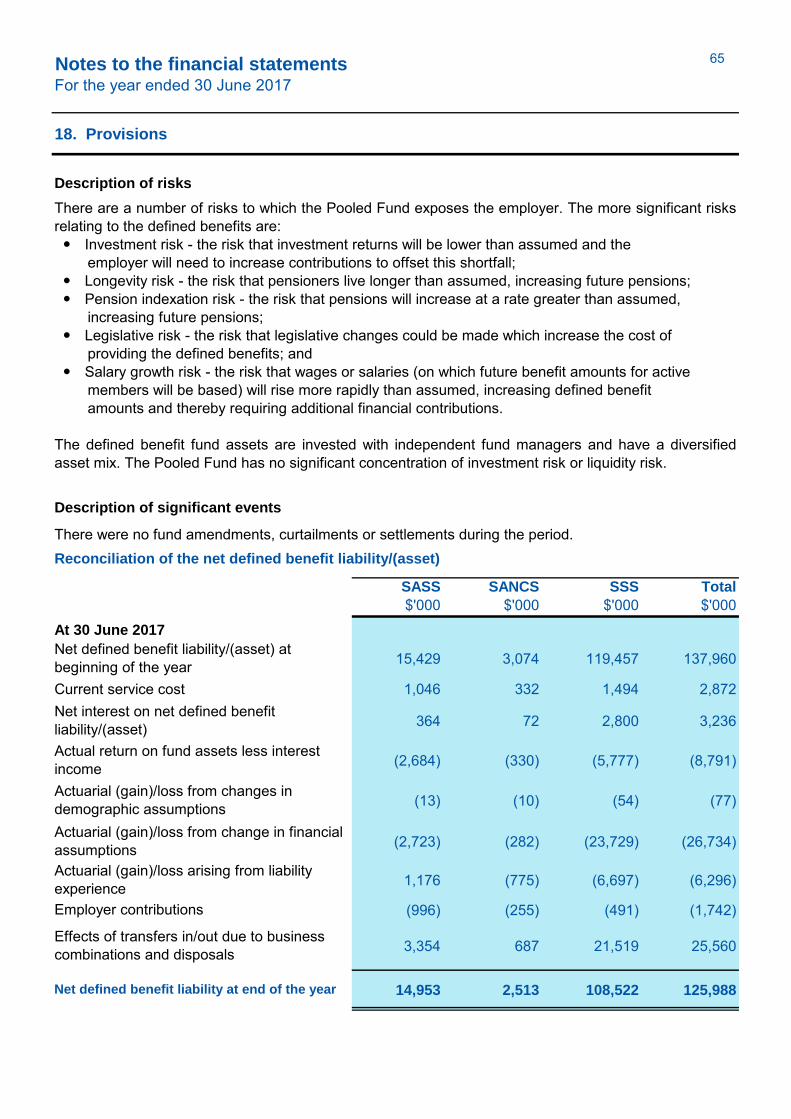
Notes to the financial statementsFor the year ended 30 June 2017
18. Provisions
Description of risks
Description of significant events
There were no fund amendments, curtailments or settlements during the period.
SASS SANCS SSS Total
$'000 $'000 $'000 $'000
At 30 June 2017
15,429 3,074 119,457 137,960
Current service cost 1,046 332 1,494 2,872
364 72 2,800 3,236
(2,684) (330) (5,777) (8,791)
(13) (10) (54) (77)
(2,723) (282) (23,729) (26,734)
1,176 (775) (6,697) (6,296)
(996) (255) (491) (1,742)
3,354 687 21,519 25,560
14,953 2,513 108,522 125,988
There are a number of risks to which the Pooled Fund exposes the employer. The more significant risksrelating to the defined benefits are: Investment risk - the risk that investment returns will be lower than assumed and the employer will need to increase contributions to offset this shortfall; Longevity risk - the risk that pensioners live longer than assumed, increasing future pensions; Pension indexation risk - the risk that pensions will increase at a rate greater than assumed, increasing future pensions; Legislative risk - the risk that legislative changes could be made which increase the cost of providing the defined benefits; and Salary growth risk - the risk that wages or salaries (on which future benefit amounts for active members will be based) will rise more rapidly than assumed, increasing defined benefit amounts and thereby requiring additional financial contributions.
The defined benefit fund assets are invested with independent fund managers and have a diversifiedasset mix. The Pooled Fund has no significant concentration of investment risk or liquidity risk.
Reconciliation of the net defined benefit liability/(asset)
Net defined benefit liability/(asset) at beginning of the year
Net interest on net defined benefit liability/(asset)Actual return on fund assets less interest incomeActuarial (gain)/loss from changes in demographic assumptionsActuarial (gain)/loss from change in financial assumptionsActuarial (gain)/loss arising from liability experienceEmployer contributions
Net defined benefit liability at end of the year
Effects of transfers in/out due to business combinations and disposals
65
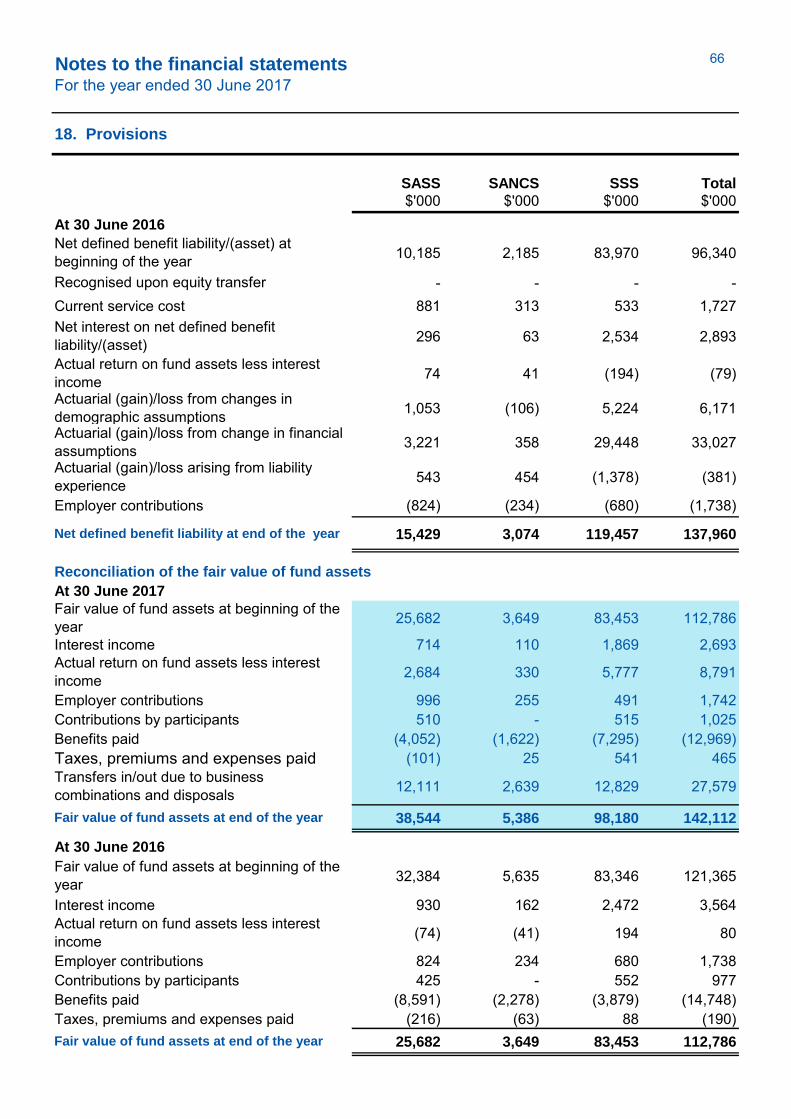
Notes to the financial statementsFor the year ended 30 June 2017
18. Provisions
SASS SANCS SSS Total
$'000 $'000 $'000 $'000 At 30 June 2016
10,185 2,185 83,970 96,340
- - - -Current service cost 881 313 533 1,727
296 63 2,534 2,893
74 41 (194) (79)
1,053 (106) 5,224 6,171
3,221 358 29,448 33,027
543 454 (1,378) (381)
Employer contributions (824) (234) (680) (1,738)
15,429 3,074 119,457 137,960
At 30 June 2017
25,682 3,649 83,453 112,786
Interest income 714 110 1,869 2,693
2,684 330 5,777 8,791
Employer contributions 996 255 491 1,742Contributions by participants 510 - 515 1,025Benefits paid (4,052) (1,622) (7,295) (12,969)Taxes, premiums and expenses paid (101) 25 541 465
12,111 2,639 12,829 27,579
38,544 5,386 98,180 142,112
At 30 June 2016
32,384 5,635 83,346 121,365
Interest income 930 162 2,472 3,564
(74) (41) 194 80
Employer contributions 824 234 680 1,738Contributions by participants 425 - 552 977Benefits paid (8,591) (2,278) (3,879) (14,748)Taxes, premiums and expenses paid (216) (63) 88 (190)
25,682 3,649 83,453 112,786
Actual return on fund assets less interest income
Net defined benefit liability at end of the year
Fair value of fund assets at beginning of the year
Actual return on fund assets less interest income
Fair value of fund assets at end of the year
Fair value of fund assets at beginning of the year
Actual return on fund assets less interest income
Fair value of fund assets at end of the year
Reconciliation of the fair value of fund assets
Transfers in/out due to business combinations and disposals
Net interest on net defined benefit liability/(asset)
Actuarial (gain)/loss from changes in demographic assumptionsActuarial (gain)/loss from change in financial assumptionsActuarial (gain)/loss arising from liability experience
Net defined benefit liability/(asset) at beginning of the yearRecognised upon equity transfer
66
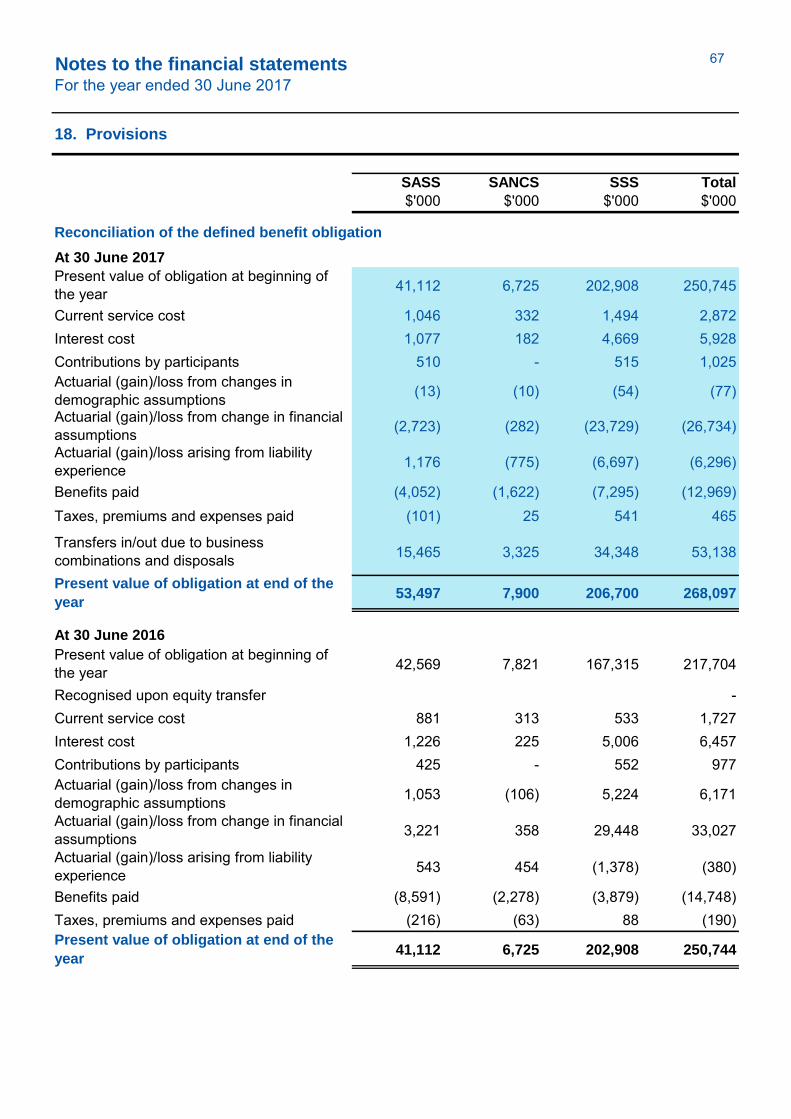
Notes to the financial statementsFor the year ended 30 June 2017
18. Provisions
SASS SANCS SSS Total
$'000 $'000 $'000 $'000
At 30 June 2017
41,112 6,725 202,908 250,745
Current service cost 1,046 332 1,494 2,872Interest cost 1,077 182 4,669 5,928Contributions by participants 510 - 515 1,025
(13) (10) (54) (77)
(2,723) (282) (23,729) (26,734)
1,176 (775) (6,697) (6,296)
Benefits paid (4,052) (1,622) (7,295) (12,969)Taxes, premiums and expenses paid (101) 25 541 465
15,465 3,325 34,348 53,138
53,497 7,900 206,700 268,097
At 30 June 2016
42,569 7,821 167,315 217,704
Recognised upon equity transfer -Current service cost 881 313 533 1,727Interest cost 1,226 225 5,006 6,457Contributions by participants 425 - 552 977
1,053 (106) 5,224 6,171
3,221 358 29,448 33,027
543 454 (1,378) (380)
Benefits paid (8,591) (2,278) (3,879) (14,748)Taxes, premiums and expenses paid (216) (63) 88 (190)
41,112 6,725 202,908 250,744
Present value of obligation at beginning of the year
Actuarial (gain)/loss from changes in demographic assumptionsActuarial (gain)/loss from change in financial assumptionsActuarial (gain)/loss arising from liability experience
Present value of obligation at end of the
year
Present value of obligation at beginning of the year
Actuarial (gain)/loss from changes in demographic assumptions
Reconciliation of the defined benefit obligation
Actuarial (gain)/loss from change in financial assumptionsActuarial (gain)/loss arising from liability experience
Present value of obligation at end of the
year
Transfers in/out due to business combinations and disposals
67

Notes to the financial statementsFor the year ended 30 June 2017
18. Provisions
Fair value of fund assets
Significant
observable
inputs
Unobservable
inputs Total
$'000 $'000 $'000 $'000
Assets category Level 1 Level 2 Level 3
As at 30 June 2017
Cash 3,077,362 9,945 - 3,087,307Australian fixed interest 997 2,499,728 - 2,500,725International fixed interest - 480,991 - 480,991Australian equities 8,947,483 498,572 24 9,446,079International equities 9,033,497 1,869,112 1,150,894 12,053,503Property 926,105 533,191 1,993,812 3,453,108Alternatives 390,899 5,068,137 3,607,020 9,066,056Total as at 30 June 2017 22,376,343 10,959,676 6,751,750 40,087,769
As at 30 June 2016
Short term securities 2,044,454 5,960 - 2,050,414Australian fixed interest 2,724 2,717,866 - 2,720,590International fixed interest (1,358) 835,732 - 834,374Australian equities 9,171,767 549,086 24 9,720,877International equities 9,026,207 2,078,766 988,694 12,093,667Property 1,113,253 618,946 1,918,068 3,650,267Alternatives 470,130 3,122,185 3,523,634 7,115,949Total as at 30 June 2016 21,827,177 9,928,541 6,430,420 38,186,138
2017 2016
Cash 7.7% -Short term securities - 5.4%Australian fixed interest 6.2% 7.1%International fixed interest 1.2% 2.2%Australian equities 23.6% 25.5%International equities 30.1% 31.6%Property 8.6% 9.6%Alternatives 22.6% 18.6%
Total 100% 100%
All Pooled Fund assets are invested by SAS Trustee Corporation at arm's length through independent fund managers and assets are not separately invested for each entity. As such, the disclosures below relate to total assets of the Pooled Fund.
The percentage invested in each asset
class at the reporting date:
Quoted prices
in market for
identical assets
68
Notes to the financial statementsFor the year ended 30 June 2017
18. Provisions
Fair value of entity's own financial instruments
The disclosures below relate to total assets of the Pooled Fund. The fair value of the Pooled Fund assets include as at 30 June 2017 $354.0 million (2016: $189.6 million) in NSW Government bonds.
Level 1 - quoted prices in active markets for identical assets or liabilities. The assets in this level are listed shares; listed unit trusts.Level 2 - inputs other than quoted prices observable for the asset or liability either directly or indirectly. The assets in this level are cash; notes; government, semi-government and corporate bonds; unlisted trusts where quoted prices are available in active markets for identical assets or liabilities.Level 3 - inputs for the asset or liability that are not based on observable market data. The assets in this level are unlisted property; unlisted shares; unlisted infrastructure; distressed debt; hedge funds.
Of the direct properties owned by the Pooled Fund: SAS Trustee Corporation occupies part of a property 100% owned by the Pooled Fund with a fair value of $250 million (30 June 2016: $222 million). Health Administration Corporation occupies part of a property 50% owned by the Pooled Fund with a fair value of $261 million (30 June 2015: $243 million).
Derivatives, including futures and options, can be used by investment managers. However, each manager's investment mandate clearly states that derivatives may only be used to facilitate efficient cashflow management or to hedge the portfolio against market movements and cannot be used for speculative purposes or gearing of the investment portfolio. As such managers make limited use of derivatives.
69
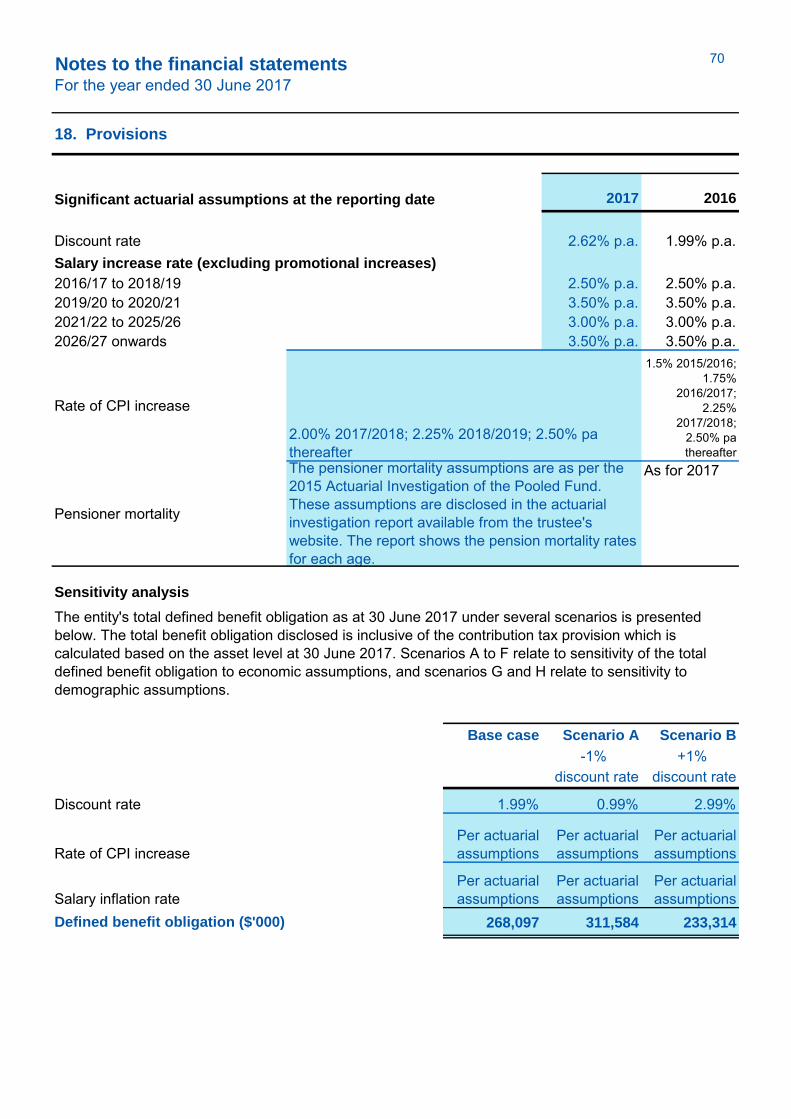
Notes to the financial statementsFor the year ended 30 June 2017
18. Provisions
2017 2016
Discount rate 2.62% p.a. 1.99% p.a.Salary increase rate (excluding promotional increases)
2016/17 to 2018/19 2.50% p.a. 2.50% p.a.2019/20 to 2020/21 3.50% p.a. 3.50% p.a.2021/22 to 2025/26 3.00% p.a. 3.00% p.a.2026/27 onwards 3.50% p.a. 3.50% p.a.
Rate of CPI increase
1.5% 2015/2016; 1.75%
2016/2017; 2.25%
2017/2018; 2.50% pa thereafter
Pensioner mortality
As for 2017
Sensitivity analysis
Base case Scenario A Scenario B
-1% +1% discount rate discount rate
Discount rate 1.99% 0.99% 2.99%
Rate of CPI increasePer actuarial assumptions
Per actuarial assumptions
Per actuarial assumptions
Salary inflation ratePer actuarial assumptions
Per actuarial assumptions
Per actuarial assumptions
268,097 311,584 233,314
Significant actuarial assumptions at the reporting date
Defined benefit obligation ($'000)
The entity's total defined benefit obligation as at 30 June 2017 under several scenarios is presented below. The total benefit obligation disclosed is inclusive of the contribution tax provision which is calculated based on the asset level at 30 June 2017. Scenarios A to F relate to sensitivity of the total defined benefit obligation to economic assumptions, and scenarios G and H relate to sensitivity to demographic assumptions.
2.00% 2017/2018; 2.25% 2018/2019; 2.50% pa thereafterThe pensioner mortality assumptions are as per the 2015 Actuarial Investigation of the Pooled Fund. These assumptions are disclosed in the actuarial investigation report available from the trustee's website. The report shows the pension mortality rates for each age.
70
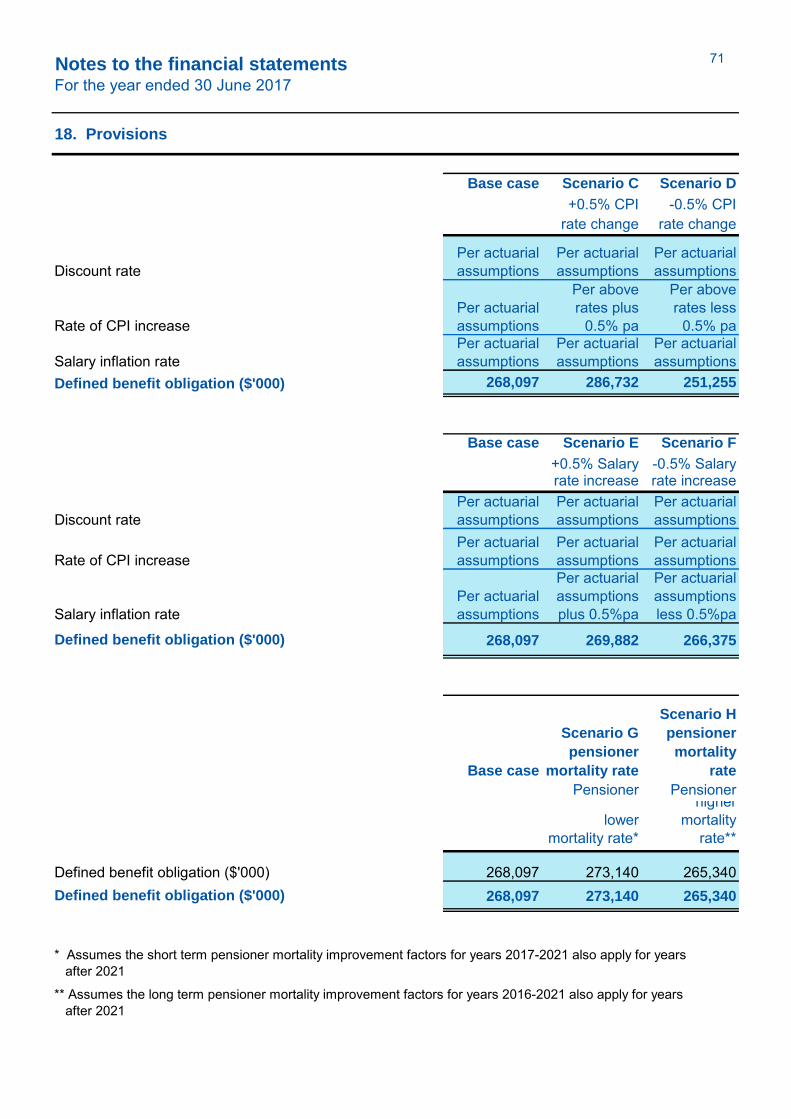
Notes to the financial statementsFor the year ended 30 June 2017
18. Provisions
Base case Scenario C Scenario D
+0.5% CPI -0.5% CPI rate change rate change
Discount ratePer actuarial assumptions
Per actuarial assumptions
Per actuarial assumptions
Rate of CPI increasePer actuarial assumptions
Per above rates plus
0.5% pa
Per above rates less
0.5% pa
Salary inflation ratePer actuarial assumptions
Per actuarial assumptions
Per actuarial assumptions
268,097 286,732 251,255
Base case Scenario E Scenario F
+0.5% Salary -0.5% Salary rate increase rate increase
Discount ratePer actuarial assumptions
Per actuarial assumptions
Per actuarial assumptions
Rate of CPI increasePer actuarial assumptions
Per actuarial assumptions
Per actuarial assumptions
Salary inflation ratePer actuarial assumptions
Per actuarial assumptions plus 0.5%pa
Per actuarial assumptions less 0.5%pa
268,097 269,882 266,375
Base case
Scenario G
pensioner
mortality rate
Scenario H
pensioner
mortality
rate +0.5% Pensioner
-0.5% Pensioner
lower mortality rate*
higher mortality
rate**
Defined benefit obligation ($'000) 268,097 273,140 265,340 268,097 273,140 265,340 Defined benefit obligation ($'000)
Defined benefit obligation ($'000)
* Assumes the short term pensioner mortality improvement factors for years 2017-2021 also apply for years after 2021
** Assumes the long term pensioner mortality improvement factors for years 2016-2021 also apply for years after 2021
Defined benefit obligation ($'000)
71

Notes to the financial statementsFor the year ended 30 June 2017
18. Provisions
Asset-Liability matching strategies
Funding arrangements
Surplus/deficit
SASS SANCS SSS Total
As at June 2017 $'000 $'000 $'000 $'000
Accrued benefits1 40,616 6,328 101,442 148,386Net market value of fund assets (38,545) (5,385) (98,179) (142,109)Net (surplus) / deficit 2,071 943 3,263 6,277
As at June 2016
Accrued benefits - Rural1 16,051 2,668 46,249 64,968Accrued benefits - Greater Sydney1 13,031 2,555 42,680 58,267Net market value of fund assets - Rural (15,327) (2,131) (46,974) (64,431)Net market value of fund assets - Greater Sydney (10,356) (1,520) (36,478) (48,354)Net (surplus) / deficit 3,399 1,572 5,477 10,450
Contribution recommendations SASS SANCS SSS
Recommended contribution rate for 2017 1.9 2.5 1.6Recommended contribution rate for 2016 1.9 2.5 1.6
Economic assumptions
The economic assumptions adopted for the 30 June 2017 AASB 1056 Accounting Standard“Superannuation Entities ”:
1There is no allowance for a contribution tax provision within the accrued benefit figure for AAS 25. Allowance for contribution tax is made when setting the contribution rates.
The Trustee monitors its asset-liability risk continuously in setting its investment strategy. It also monitors cash flows to manage liquidity requirements. No explicit asset-liability matching strategy is used by the Trustee.
The following is a summary of the 30 June 2017 financial position of the Fund calculated in accordancewith AASB 1056 Accounting Standard “Superannuation Entities ”: (2016: in accordance with AAS 25 'Financial Reporting by Superannuation Plans') :
Funding positions are reviewed annually and funding arrangements may be adjusted as required after each annual review.
Funding arrangements are reviewed at least every three years following the release of the triennial actuarial review and was last reviewed following completion of the triennial review as at 30 June 2015. Contribution rates are set after discussions between the employer, STC and NSW Treasury.
72

Notes to the financial statementsFor the year ended 30 June 2017
18. Provisions
Weighted average assumptions Per annum
Expected rate of return on Fund assets backing current pension liabilities 7.4% p.aExpected rate of return on Fund assets backing other liabilities 6.4% p.a
2.2% p.a
SASS SANCS SSS Total
$'000 $'000 $'000 $'000
2018 673 191 526 1,390
SASS SANCS SSS Total
$'000 $'000 $'000 $'000 Impact financial year to 30 June
2017
Profit or Loss
Current service cost 1,046 332 1,494 2,872Net interest 364 72 2,801 3,237
1,410 404 4,295 6,109
Other comprehensive income
Actuarial (gains) losses on liabilities (1,561) (1,066) (30,480) (33,107)Actual return on Fund assets less interest income (2,684) (330) (5,777) (8,791)
(4,245) (1,396) (36,257) (41,898)
Profit or loss component of the defined
benefit cost
Total remeasurement in other
comprehensive income
Expected salary increase rate (excluding promotional salary increases)
Expected employer contributions for the financial year ended 30 June 2018
Expected rate of CPI increase
2.7% to 30 June 2019 then 3.2% pa thereafter
73
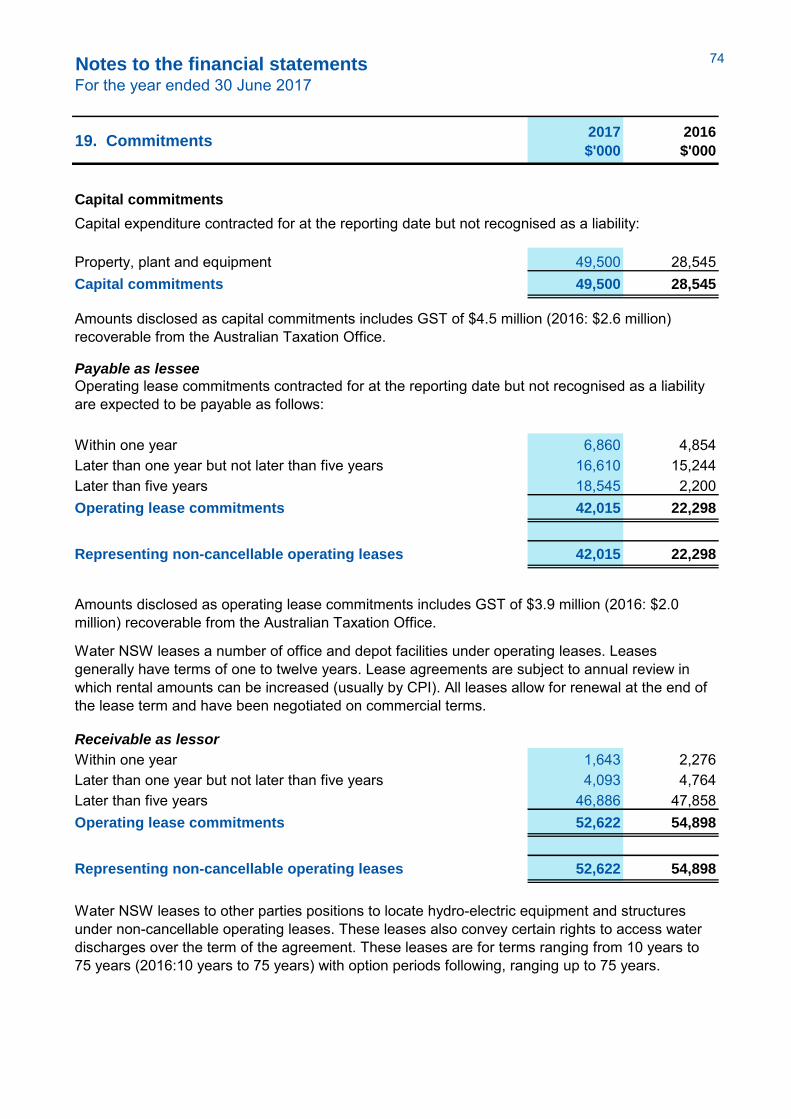
Notes to the financial statementsFor the year ended 30 June 2017
19. Commitments
2017
$'000
2016
$'000
Capital commitments
Property, plant and equipment 49,500 28,545Capital commitments 49,500 28,545
Payable as lessee
Within one year 6,860 4,854Later than one year but not later than five years 16,610 15,244Later than five years 18,545 2,200Operating lease commitments 42,015 22,298
Representing non-cancellable operating leases 42,015 22,298
Receivable as lessor
Within one year 1,643 2,276Later than one year but not later than five years 4,093 4,764Later than five years 46,886 47,858Operating lease commitments 52,622 54,898
Representing non-cancellable operating leases 52,622 54,898
Water NSW leases to other parties positions to locate hydro-electric equipment and structures under non-cancellable operating leases. These leases also convey certain rights to access water discharges over the term of the agreement. These leases are for terms ranging from 10 years to 75 years (2016:10 years to 75 years) with option periods following, ranging up to 75 years.
Water NSW leases a number of office and depot facilities under operating leases. Leases generally have terms of one to twelve years. Lease agreements are subject to annual review in which rental amounts can be increased (usually by CPI). All leases allow for renewal at the end of the lease term and have been negotiated on commercial terms.
Capital expenditure contracted for at the reporting date but not recognised as a liability:
Amounts disclosed as capital commitments includes GST of $4.5 million (2016: $2.6 million) recoverable from the Australian Taxation Office.
Operating lease commitments contracted for at the reporting date but not recognised as a liability are expected to be payable as follows:
Amounts disclosed as operating lease commitments includes GST of $3.9 million (2016: $2.0 million) recoverable from the Australian Taxation Office.
74
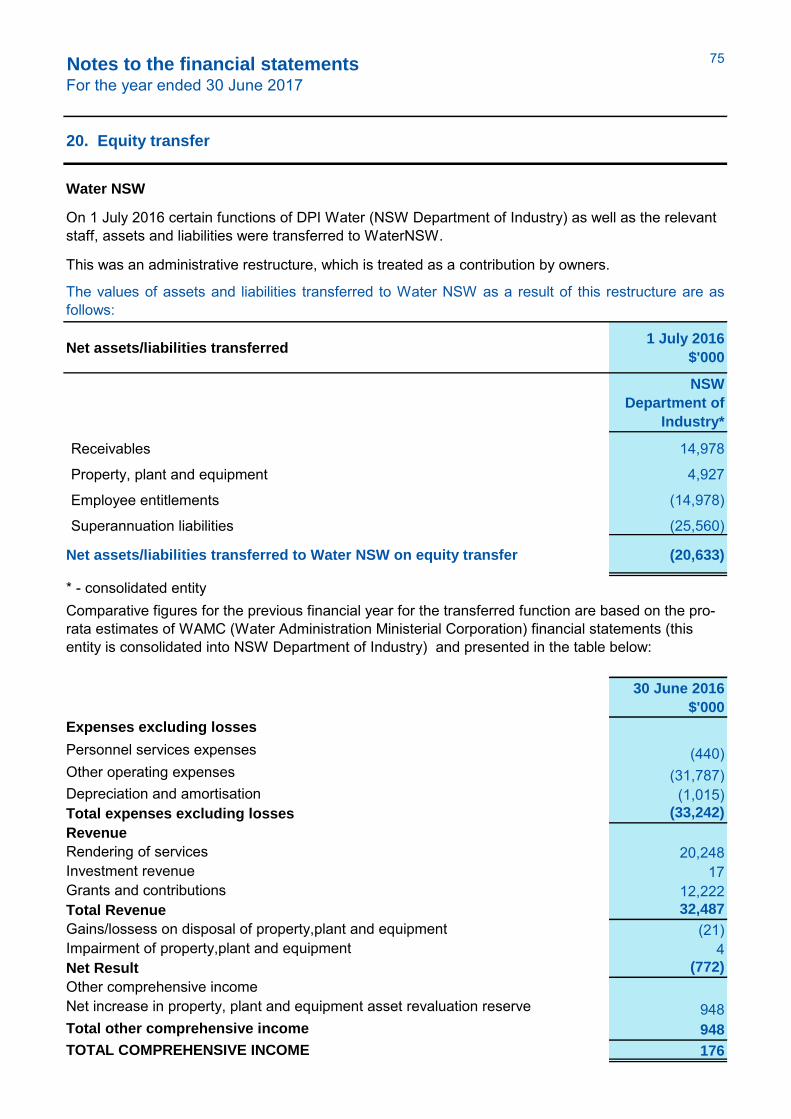
Notes to the financial statementsFor the year ended 30 June 2017
20. Equity transfer
Water NSW
Net assets/liabilities transferred 1 July 2016
$'000
NSW
Department of
Industry*
Receivables 14,978
Property, plant and equipment 4,927
Employee entitlements (14,978)
Superannuation liabilities (25,560)
Net assets/liabilities transferred to Water NSW on equity transfer (20,633)
* - consolidated entity
30 June 2016
$'000
Expenses excluding losses
Personnel services expenses (440)Other operating expenses (31,787)Depreciation and amortisation (1,015)Total expenses excluding losses (33,242)
Revenue
Rendering of services 20,248Investment revenue 17Grants and contributions 12,222Total Revenue 32,487
Gains/lossess on disposal of property,plant and equipment (21)Impairment of property,plant and equipment 4Net Result (772)
Other comprehensive incomeNet increase in property, plant and equipment asset revaluation reserve 948Total other comprehensive income 948
TOTAL COMPREHENSIVE INCOME 176
The values of assets and liabilities transferred to Water NSW as a result of this restructure are asfollows:
On 1 July 2016 certain functions of DPI Water (NSW Department of Industry) as well as the relevant staff, assets and liabilities were transferred to WaterNSW.
This was an administrative restructure, which is treated as a contribution by owners.
Comparative figures for the previous financial year for the transferred function are based on the pro-rata estimates of WAMC (Water Administration Ministerial Corporation) financial statements (this entity is consolidated into NSW Department of Industry) and presented in the table below:
75

Notes to the financial statementsFor the year ended 30 June 2017
21. Contingent liabilities and contingent assets
Details of contingent liabilities are set out below. These are matters in which provisions are not required as it is not probable that a future sacrifice will be required or the amount is not capable of reliable measurement.
Operational activities
Risk exposure occurs as a result of operational activities. These exposures comprise various matters that have or possibly could lead to disputes over past or existing contracts or other operational activities. Some project works undertaken by Water NSW, either on its own behalf or on behalf of third parties, have been subject to delays and disruptions. As a result Water NSW has received and rejected claims from contractors for variations to contracted amounts, which are now the subject of dispute. Irrespective of the legal position with respect to these disputed claims, the amounts are either not material to Water NSW or are the ultimate responsibility of third parties as pass through costs to Water NSW.
Green State Power
Under the Green State Power transfer agreement Water NSW was paid a pre-tax cash amount of $7.15 million by Green State Power to cover potential obligations in the future. The obligations are for potential compensation to the hydro-operator during the first 30 year term for any power station unavailability that is caused by an act or omission of Water NSW (excluding planned works or force majeure). The potential liability is capped (for both Burrinjuck and Keepit combined) to $5 million.
Origin Energy
Under the Operations and Maintenance Agreement for the operation of the Kangaroo-Fitzroy Project with Origin Energy Water NSW has an exposure to pay Origin Energy liquidated damages if its assets are not available for use to transfer water to enable the generation of hydro-electricity. Liquidated damages are calculated on a sliding scale if asset availability falls below 94% in a calendar month. The maximum monthly exposure to liquidated damages is $250,000 if asset availability for the whole of the month is zero. Water NSW's maximum exposure to liquidated damages is $600,000 in any calendar year or about $32.5 million for the 54 year remaining period of the 60 year agreement.
Site contamination
Water NSW has a potential exposure to risk from contaminated land and infrastructure that may contain hazardous materials and environmental incidents. There is an ongoing program for the management of contamination and remediation where required. It is not possible to estimate contingent liabilities reliably, as the need for and the type of management and remediation is dependent on future events that cannot be determined at this time.
76

Notes to the financial statementsFor the year ended 30 June 2017
22. Related parties
2017
$'000
2016
$'000
Remuneration of key management personnel
Short term employee benefits* 4,013 4,504Long term employee benefits 51 52Termination benefits 219 -Post term employee benefits 229 240
4,511 4,796
This comprises compensation relating to:
Directors, excluding Chief Executive Officer* 352 464Senior executives, including Chief Executive Officer 4,160 4,332
4,511 4,796
Key management personnel are those persons having authority and responsibility for planning, directing and controlling the activities of Water NSW, directly or indirectly. This comprises all directors, whether executive or non-executive, and senior executives who lead the various divisions of Water NSW.
The entity has related party relationships with key management personnel (refer (a) below) and their related entities (refer (b) below).
The above disclosures for senior executives are based on accruals of employee benefits during the reporting period in accordance with the requirements of AASB 124 'Related Parties' and AASB 119 'Employee
Benefits' .
Any transactions undertaken with key management personnel or entities related to them are conducted on an arm's length basis on commercial terms and conditions. In accordance with the requirements of TC 16-12 "Related Party Disclosures" Water NSW collects arm's length transactions only in excess of $100,000. Such transactions are disclosed if it is concluded that they are either quantitatively or qualitatively material to the Water NSW’s financial statements. During the current reporting period Water NSW paid memebership fees and participated in the conferences and workshops conducted by Water Services Association of Australia (WSAA) (transactions totalling $177,045 (incl GST - $16,095). CEO of Water NSW is a board member of WSAA. There were no other related party transactions to disclose.
(b) Other transactions with key management personnel
(a) Key management personnel compensation
Remuneration of key management personnel
Remuneration of key management personnel
* - includes R.Aldis remuneraton of $29,737 (excluding GST) for the work as the Chair of the Project Board - Warragamba Dam Wall Raising and Broken Hill Pipeline.
77

Notes to the financial statementsFor the year ended 30 June 2017
22. Related parties
(c) Government-related entities
Related Party
Transaction value
Balance 30/6/2017
receivable/(payable)
$'000 $'000
Sydney Water Corporation 198,188 16,231
NSW Department of Industry1 36,078 9,020
NSW Treasury Corporation 17,431 (665,806)
NSW Treasury 38,200 (38,200)
NSW Treasury 13,297 (13,297)
Office of State Revenue 19,450 (12,697)
1Excluding equity transfer,administered assets and minor grants. For the equity transfer details refer to the note 20. For the administered assets refer to the note 25.
Nature of transaction
Sale of water
Loans, interest repayment
Taxes
Government guarantee fee for 30/06/2017
Dividend for 30/06/2017
NSW Government contributions to operations
Government-related entities are those that are controlled or jointly controlled or significantly influenced by the NSW Government. The aggregate value of the significant transactions and outstanding balances are as follows:
78

Notes to the financial statementsFor the year ended 30 June 2017
23. Auditors remuneration
2017
$'000
2016
$'000
Financial audit of Water NSW 295 350
Auditors remuneration 295 350
79

Notes to the financial statementsFor the year ended 30 June 2017
24. Financial instruments
Category
30 June 2017 30 June 2016
$'000 $'000
Financial assets
Cash and cash equivalents Not applicable 189,218 194,698Trade and other receivables1 82,569 37,189Financial assets 271,787 231,887
Financial liabilities
Trade and other payables Amortised cost 47,575 57,831Borrowings Amortised cost 665,806 658,276Financial liabilities 713,381 716,107
Loans and receivables
Carrying amount
Water NSW's main risks arising from financial instruments are outlined below, together with the entity’s objectives, policies and processes for measuring and managing risk. Further quantitative and qualitative disclosures are included throughout these financial statements.
Credit risk arises from the financial assets of Water NSW, including cash, receivables, and deposits. No collateral is held by Water NSW and no financial guarantees have been granted.
a) Risk management framework
b) Credit risk
The Board has overall responsibility for the establishment and oversight of risk management and reviews and agrees policies for managing identified risks. Risk management policies are established to identify and analyse the risks faced by the entity, as well as to set limits and controls and monitor identified risks. Compliance with policies is reviewed by the Audit and Risk Committee on a continuous basis.
1Excludes statutory receivables payables as well as prepayments and deferred income and which falloutside the scope of AASB 7 'Financial Instruments: Disclosures '.
The totals for each category of financial instruments, measured in accordance with AASB 139 as detailed in the accounting policies to these financials statements, are as follows:
Exposure to credit risk relating to financial assets arises from the potential non-performance by counterparties of contract obligations that could lead to a financial loss to the entity. The maximum exposure to credit risk is generally represented by the carrying amount of the financial assets (net of any allowance for impairment) in the statement of financial position.
Water NSW's principal financial instruments are outlined below. These financial instruments arise directly from operations of the entity, or are required by the entity to finance its operations. Water NSW does not enter into or trade financial instruments including derivative financial instruments for speculative purposes.
80

Notes to the financial statementsFor the year ended 30 June 2017
24. Financial instruments
Cash and cash equivalents
Trade and other receivables
30 June 2017 30 June 2016
$'000 $'000
Past due but not impaired 1,2
31 - 60 days overdue 759 83961 - 90 days overdue 18 699> 90 days overdue 3,717 1,134Current assets 4,494 2,672
Carrying amount
Credit risk related to business with banks and other financial institutions is managed by the Audit and Risk Committee in accordance with approved Board policy. Investment with individual counterparties is limited to T-Corp, and banks with a Moody's rating of A1 or A2.
All trade receivables are recognised at amounts receivable at reporting date. Water NSW monitors collectability of trade debtors on an ongoing basis and has policies in place to recover or write-off amounts outstanding. Trade and other receivables that are neither past due nor impaired are considered to be of high credit quality. An allowance for impairment is raised when there is objective evidence that the entity will not be able to collect all amounts due. This evidence includes past experience, and current and expected changes in economic conditions and debtor credit ratings. Debts which are known to be uncollectible are written off. No interest is earned on trade debtors.
All credit and recovery risks associated with trade debtors have been provided for in the statement of financial position.
The ageing of trade receivables past due but not impaired as well as trade receivables considered impaired is detailed below:
Water NSW also has trade receivables for non water related charges. The majority of such debt relate to government related bodies and are considered low risk.
Under the Water Act 1912 (Water Act) and the Water Management Act 2000 (WM Act) if the New South Wales Office of Water issues a new licence or transfers an existing licence then that licensee automatically becomes a customer of Water NSW under the conditions of that licence. Water NSW does not undertake any credit quality assessment or define any credit limits before accepting new water customers issued such licences. The Water Act allows outstanding monies to be a charged on the land supplied with water, and if this charge is registered against the land title, the debt will pass with the land to any future owner. Given these facts, fees charged on a water access licence are largely perpetual and not standard commercial debt where only court action is available to collect a debt when a debt is considered doubtful, unless security is held against the debt. Generally prospective acquirers of a water access licence undertake searches on the licence they are seeking to acquire to determine whether there is any debt outstanding. If there is, the acquirer discounts the market value of the licence by the debt owing or arranges to settle the debt at the time of acquisition.
Credit risk associated with financial assets, other than receivables, is managed through the selection of counterparties and the establishment of minimum credit rating standards. Water NSW's deposits held with NSW Treasury Corporation (T-Corp) are guaranteed by the State.
81
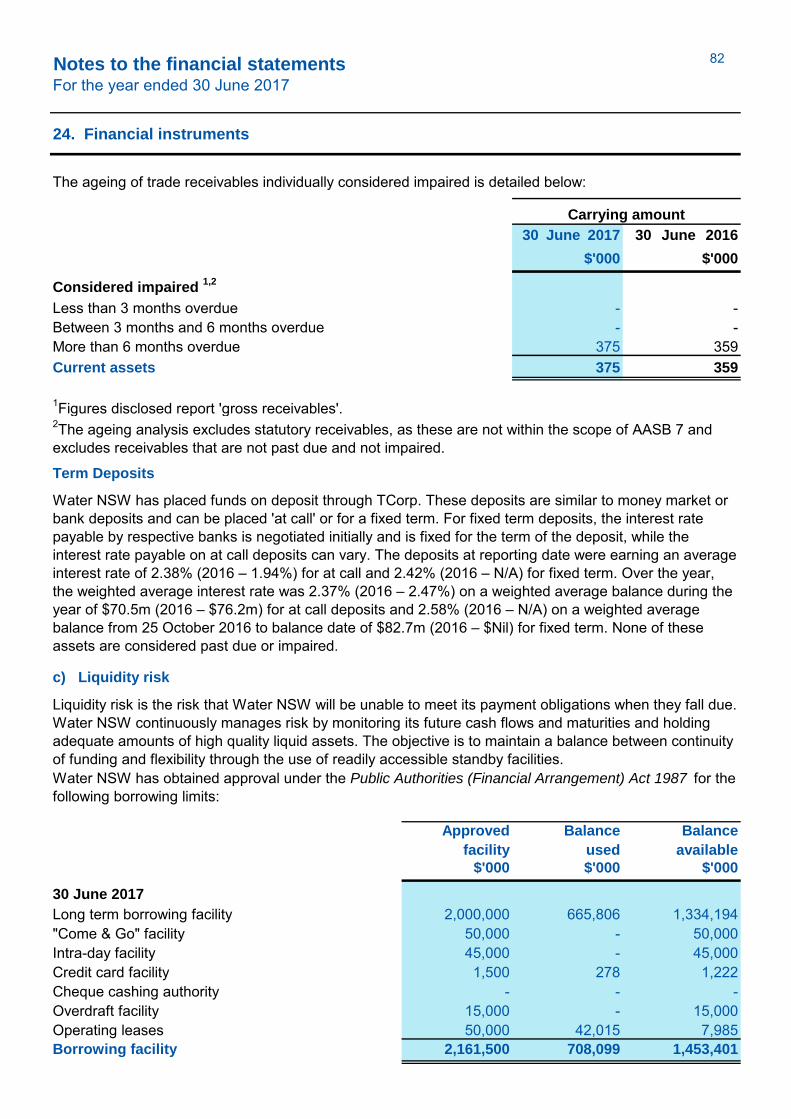
Notes to the financial statementsFor the year ended 30 June 2017
24. Financial instruments
30 June 2017 30 June 2016
$'000 $'000
Considered impaired 1,2
Less than 3 months overdue - -Between 3 months and 6 months overdue - -More than 6 months overdue 375 359Current assets 375 359
1Figures disclosed report 'gross receivables'.
Approved Balance Balance
facility used available
$'000 $'000 $'000
30 June 2017
Long term borrowing facility 2,000,000 665,806 1,334,194"Come & Go" facility 50,000 - 50,000Intra-day facility 45,000 - 45,000Credit card facility 1,500 278 1,222Cheque cashing authority - - -Overdraft facility 15,000 - 15,000Operating leases 50,000 42,015 7,985Borrowing facility 2,161,500 708,099 1,453,401
Carrying amount
Water NSW has placed funds on deposit through TCorp. These deposits are similar to money market or bank deposits and can be placed 'at call' or for a fixed term. For fixed term deposits, the interest rate payable by respective banks is negotiated initially and is fixed for the term of the deposit, while the interest rate payable on at call deposits can vary. The deposits at reporting date were earning an average interest rate of 2.38% (2016 – 1.94%) for at call and 2.42% (2016 – N/A) for fixed term. Over the year, the weighted average interest rate was 2.37% (2016 – 2.47%) on a weighted average balance during the year of $70.5m (2016 – $76.2m) for at call deposits and 2.58% (2016 – N/A) on a weighted average balance from 25 October 2016 to balance date of $82.7m (2016 – $Nil) for fixed term. None of these assets are considered past due or impaired.
Term Deposits
2The ageing analysis excludes statutory receivables, as these are not within the scope of AASB 7 and excludes receivables that are not past due and not impaired.
c) Liquidity risk
Liquidity risk is the risk that Water NSW will be unable to meet its payment obligations when they fall due. Water NSW continuously manages risk by monitoring its future cash flows and maturities and holding adequate amounts of high quality liquid assets. The objective is to maintain a balance between continuity of funding and flexibility through the use of readily accessible standby facilities.Water NSW has obtained approval under the Public Authorities (Financial Arrangement) Act 1987 for the following borrowing limits:
The ageing of trade receivables individually considered impaired is detailed below:
82

Notes to the financial statementsFor the year ended 30 June 2017
24. Financial instruments
Approved Balance Balance
facility used available
$'000 $'000 $'000
30 June 2016
Long term borrowing facility 745,000 658,276 86,724"Come & Go" facility 37,000 - 37,000Intra-day facility 45,000 - 45,000Credit card facility 1,500 181 1,319Cheque cashing authority 202 - 202Overdraft facility 2,000 - 2,000Operating leases 30,000 22,298 7,702Borrowing facility 860,702 680,755 179,947
Less than
1 year 1-5 years
More than
5 years Total
$'000 $'000 $'000 $'000
30 June 2017
Trade and other payables 47,575 - - 47,575Borrowings 51,422 435,205 179,179 665,806Non-derivative financial liability 98,997 435,205 179,179 713,381
30 June 2016
Trade and other payables 57,831 - - 57,831Borrowings 36,380 407,019 214,877 658,276Non-derivative financial liability 94,211 407,019 214,877 716,107
Maturity dates
During the current and prior reporting year there were no defaults of loans payable. No assets have been pledged as collateral. Water NSW's exposure to liquidity risk is deemed insignificant based on prior periods data and current assessment of risk. The contractual maturity of Water NSW's non-derivative fixed rate financial liabilities for the comparative period is shown in the following table:
Water NSW has access to the Transaction Negotiation Authority (TNA) facility of $11.5 Million. Water NSW's Treasury Risk Management Policy establishes prudential limits on the percentage of debt which can mature in any one 12 month financial year. Planned future capital expenditure will be funded in part through T-Corp borrowings. Future committed expenditure is disclosed in Note 19.
The table above discloses the remaining contractual maturity for Water NSW's financial liabilities. The table is based on the undiscounted interest and principal cash flows of financial liabilities according to the earliest date on which Water NSW can be required to pay. The nominal amounts disclosed are the contractual undiscounted cash flows of each class of financial liabilities and therefore may not reconcile to the statement of financial position. The timing of cash flows presented in the table to settle financial liabilities reflect the earliest contractual settlement dates and do not reflect managements expectations that borrowing facilities will be rolled forward.
83

Notes to the financial statementsFor the year ended 30 June 2017
24. Financial instruments
Interest rate risk
2017 2016
$'000 $'000
Fixed rate instruments
Call loans to Authorities 12,000 12,000Commonwealth guaranteed 25,351 24,409Loans State guaranteed 606,942 600,687CPI Indexed Year on year (YOY) loan 4,085 4,085Loans to Authorities 17,428 17,095Fixed rate instruments 665,806 658,276
Variable rate instruments
Cash and cash equivalents (excluding Hour-Glass Cash Facility) 162,209 66,941Variable rate instruments 162,209 66,941
T-Corp manages interest rate risk exposures applicable to specific borrowings of Water NSW in accordance with a debt portfolio mandate agreed between the two parties. T-Corp receives a fee for this service. At reporting date the carrying value of borrowings managed by T-Corp stood at $666 million (2016: $658 million).
The effect on profit and equity due to a reasonably possible change in risk variable is outlined in the information below, for interest rate risk and other price risk. A reasonably possible change in risk variable has been determined after taking into account the economic environment in which the Water NSW operates and the time frame for the assessment (i.e. until the end of the next annual reporting year). The sensitivity analysis is based on risk exposures in existence at the statement of financial position reporting date reporting date. The analysis is performed on the same basis as for 2016. The analysis assumes that all other variables remain constant.
The entity's exposure to interest rate risk is set out below. A reasonably possible change of +/- 100 basis points is used, consistent with current trends in interest rates (based on official RBA interest rate volatility over the last five years). The basis will be reviewed annually and amended where there is a structural change in the level of interest rate volatility.
Exposure to interest rate risk arises primarily through Water NSW's interest bearing liabilities. This risk is minimised by undertaking mainly fixed rate borrowings, through T-Corp. Water NSW does not account for any fixed rate financial instruments at fair value through profit or loss or as available-for-sale. Therefore, for these financial instruments, a change in interest rates would not affect profit or loss or equity.
Market risk is the risk that the fair value or future cash flows of a financial instrument will fluctuate because of changes in market prices. Water NSW's exposures to market risk are primarily through interest rate risks related to borrowings and other price risks associated with the movement in the unit price of the Hour-Glass (Cash) Facility. The entity has negligible exposure to foreign currency risk and does not enter into commodity contracts.
d) Market risk
84
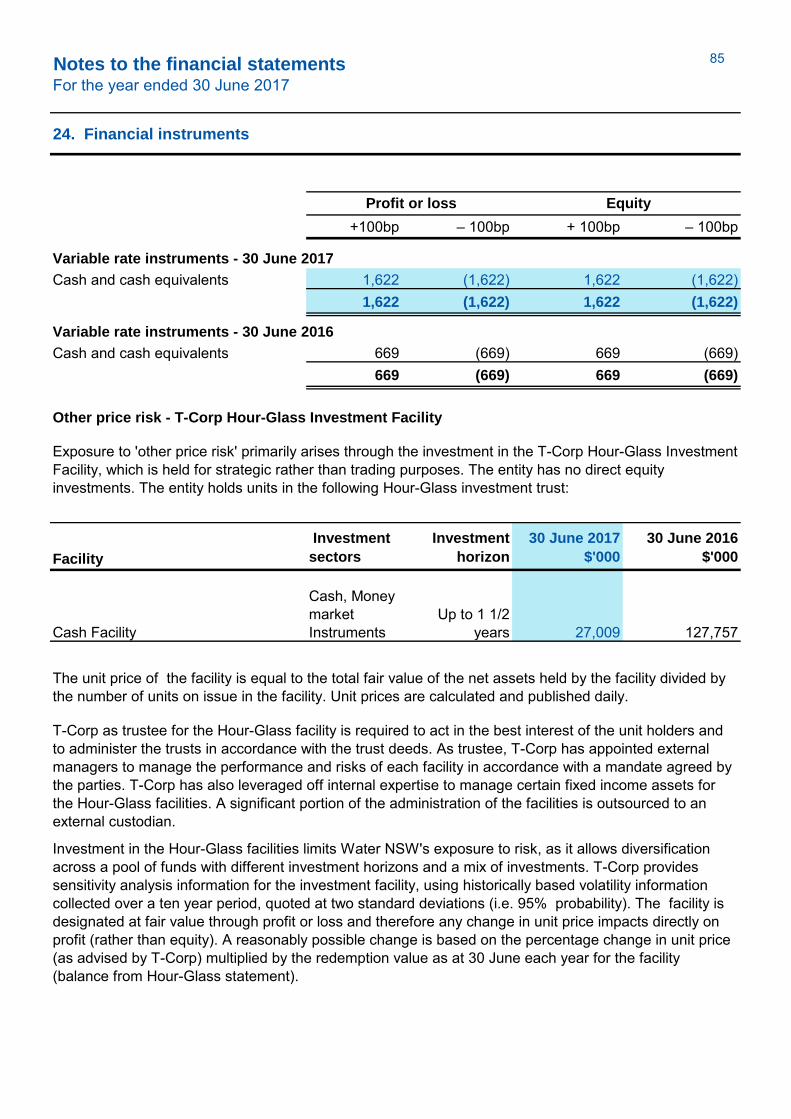
Notes to the financial statementsFor the year ended 30 June 2017
24. Financial instruments
+100bp – 100bp + 100bp – 100bp
Variable rate instruments - 30 June 2017
Cash and cash equivalents 1,622 (1,622) 1,622 (1,622)1,622 (1,622) 1,622 (1,622)
Variable rate instruments - 30 June 2016
Cash and cash equivalents 669 (669) 669 (669)669 (669) 669 (669)
Other price risk - T-Corp Hour-Glass Investment Facility
Facility
Investment
sectors
Investment
horizon
30 June 2017
$'000
30 June 2016
$'000
Cash Facility
Cash, Money market Instruments
Up to 1 1/2 years 27,009 127,757
Exposure to 'other price risk' primarily arises through the investment in the T-Corp Hour-Glass Investment Facility, which is held for strategic rather than trading purposes. The entity has no direct equity investments. The entity holds units in the following Hour-Glass investment trust:
T-Corp as trustee for the Hour-Glass facility is required to act in the best interest of the unit holders and to administer the trusts in accordance with the trust deeds. As trustee, T-Corp has appointed external managers to manage the performance and risks of each facility in accordance with a mandate agreed by the parties. T-Corp has also leveraged off internal expertise to manage certain fixed income assets for the Hour-Glass facilities. A significant portion of the administration of the facilities is outsourced to an external custodian.
Equity
The unit price of the facility is equal to the total fair value of the net assets held by the facility divided by the number of units on issue in the facility. Unit prices are calculated and published daily.
Profit or loss
Investment in the Hour-Glass facilities limits Water NSW's exposure to risk, as it allows diversification across a pool of funds with different investment horizons and a mix of investments. T-Corp provides sensitivity analysis information for the investment facility, using historically based volatility information collected over a ten year period, quoted at two standard deviations (i.e. 95% probability). The facility is designated at fair value through profit or loss and therefore any change in unit price impacts directly on profit (rather than equity). A reasonably possible change is based on the percentage change in unit price (as advised by T-Corp) multiplied by the redemption value as at 30 June each year for the facility (balance from Hour-Glass statement).
85

Notes to the financial statementsFor the year ended 30 June 2017
24. Financial instruments
Change in
unit price 30 June 2017
$'000
30 June 2016
$'000
T-Corp Hour-Glass Investment +/- 1% 270 1,278
Currency risk
Fair value recognised in the statement of financial position
Level 1 Level 2 Level 3 Total
Financial assets $'000 $'000 $'000 $'000
30 June 2017
T-Corp Hour-Glass Investment (Cash) Facility - 27,009 - 27,009
- 27,009 - 27,009
30 June 2016
T-Corp Hour-Glass Investment (Cash) Facility - 127,757 - 127,757
- 127,757 - 127,757
Fair value compared to carrying amount
The following table provides an analysis of financial instruments that are measured subsequent to initial recognition at fair value, grouped into Levels 1 to 3 based on the degree to which the fair value is observable and as set out in Note 2(h):
Impact on profit/loss
e) Fair value measurement
The Hour-Glass Investment Cash Facility is considered a level 2 measurement. Prices are observable, however, no active market exists for these facilities as they are only accessible to government agencies. The input used by Water NSW to assess fair value is the current advised unit rate provided by NSW Treasury Corporation. There were no transfers of financial instruments between levels 1 or 2 during the current and previous reporting years.
Currency risk is the risk that the fair value or future cash flows of a financial instrument will fluctuate because of changes in foreign exchange rates. Water NSW's exposure to foreign currency risk is immaterial. Water NSW limits currency risk by fully hedging foreign currency transactions in excess of $1,000,000 within five days of the exposure arising. The aggregate of all small exposures or an individual exposure to a single currency over $1,000,000 must be similarly hedged. At the reporting date, there are no foreign currency exposures attached to any financial assets or financial liabilities.
Financial instruments are generally recognised at amortised cost, with the exception of the T-Corp Hour-Glass facilities, which are measured at fair value. Cash and cash equivalents, trade and other receivables, trade and other payables and other financial liabilities are short term instruments in nature whose carrying amounts are considered to be a reasonable approximation of their fair values. Borrowings are stated at amortised cost.
86
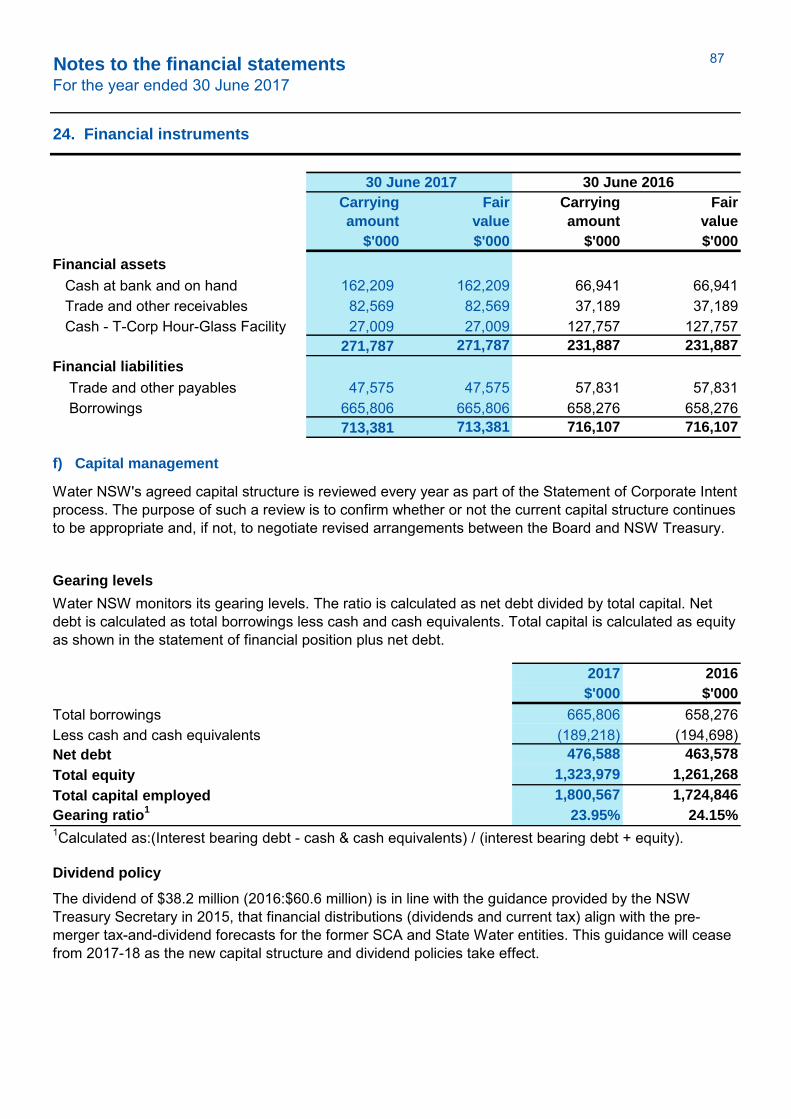
Notes to the financial statementsFor the year ended 30 June 2017
24. Financial instruments
Carrying
amount
Fair
value
Carrying
amount
Fair
value
$'000 $'000 $'000 $'000
Financial assets
Cash at bank and on hand 162,209 162,209 66,941 66,941 Trade and other receivables 82,569 82,569 37,189 37,189 Cash - T-Corp Hour-Glass Facility 27,009 27,009 127,757 127,757
271,787 271,787 231,887 231,887
Financial liabilities
Trade and other payables 47,575 47,575 57,831 57,831 Borrowings 665,806 665,806 658,276 658,276
713,381 713,381 716,107 716,107
Gearing levels
2017 2016
$'000 $'000
Total borrowings 665,806 658,276Less cash and cash equivalents (189,218) (194,698)Net debt 476,588 463,578
Total equity 1,323,979 1,261,268
Total capital employed 1,800,567 1,724,846
Gearing ratio1
23.95% 24.15%
Dividend policy
f) Capital management
The dividend of $38.2 million (2016:$60.6 million) is in line with the guidance provided by the NSW Treasury Secretary in 2015, that financial distributions (dividends and current tax) align with the pre-merger tax-and-dividend forecasts for the former SCA and State Water entities. This guidance will cease from 2017-18 as the new capital structure and dividend policies take effect.
1Calculated as:(Interest bearing debt - cash & cash equivalents) / (interest bearing debt + equity).
30 June 2017 30 June 2016
Water NSW monitors its gearing levels. The ratio is calculated as net debt divided by total capital. Net debt is calculated as total borrowings less cash and cash equivalents. Total capital is calculated as equity as shown in the statement of financial position plus net debt.
Water NSW's agreed capital structure is reviewed every year as part of the Statement of Corporate Intent process. The purpose of such a review is to confirm whether or not the current capital structure continues to be appropriate and, if not, to negotiate revised arrangements between the Board and NSW Treasury.
87
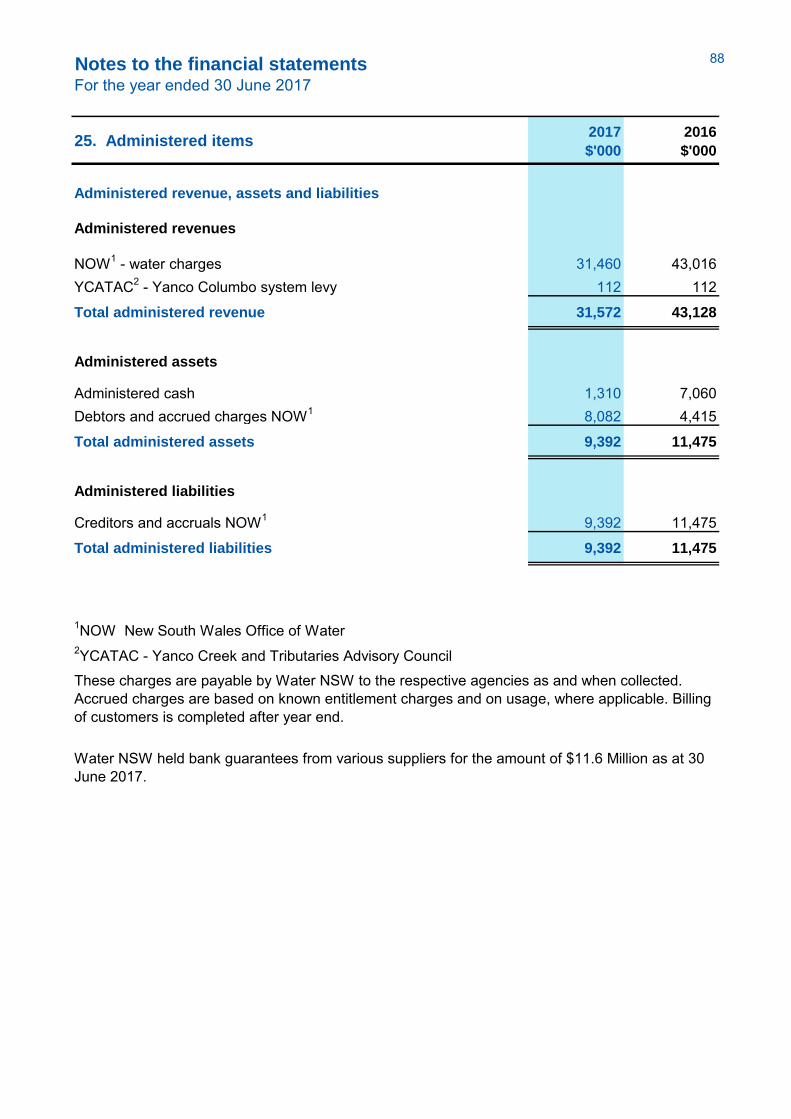
Notes to the financial statementsFor the year ended 30 June 2017
25. Administered items
2017
$'000
2016
$'000
Administered revenue, assets and liabilities
Administered revenues
NOW1 - water charges 31,460 43,016YCATAC2 - Yanco Columbo system levy 112 112
Total administered revenue 31,572 43,128
Administered assets
Administered cash 1,310 7,060Debtors and accrued charges NOW1 8,082 4,415
Total administered assets 9,392 11,475
Administered liabilities
Creditors and accruals NOW1 9,392 11,475
Total administered liabilities 9,392 11,475
2YCATAC - Yanco Creek and Tributaries Advisory Council
Water NSW held bank guarantees from various suppliers for the amount of $11.6 Million as at 30 June 2017.
1NOW New South Wales Office of Water
These charges are payable by Water NSW to the respective agencies as and when collected. Accrued charges are based on known entitlement charges and on usage, where applicable. Billing of customers is completed after year end.
88

Notes to the financial statementsFor the year ended 30 June 2017
26. Events after balance date
End of audited financial statements
No events after the balance date
89
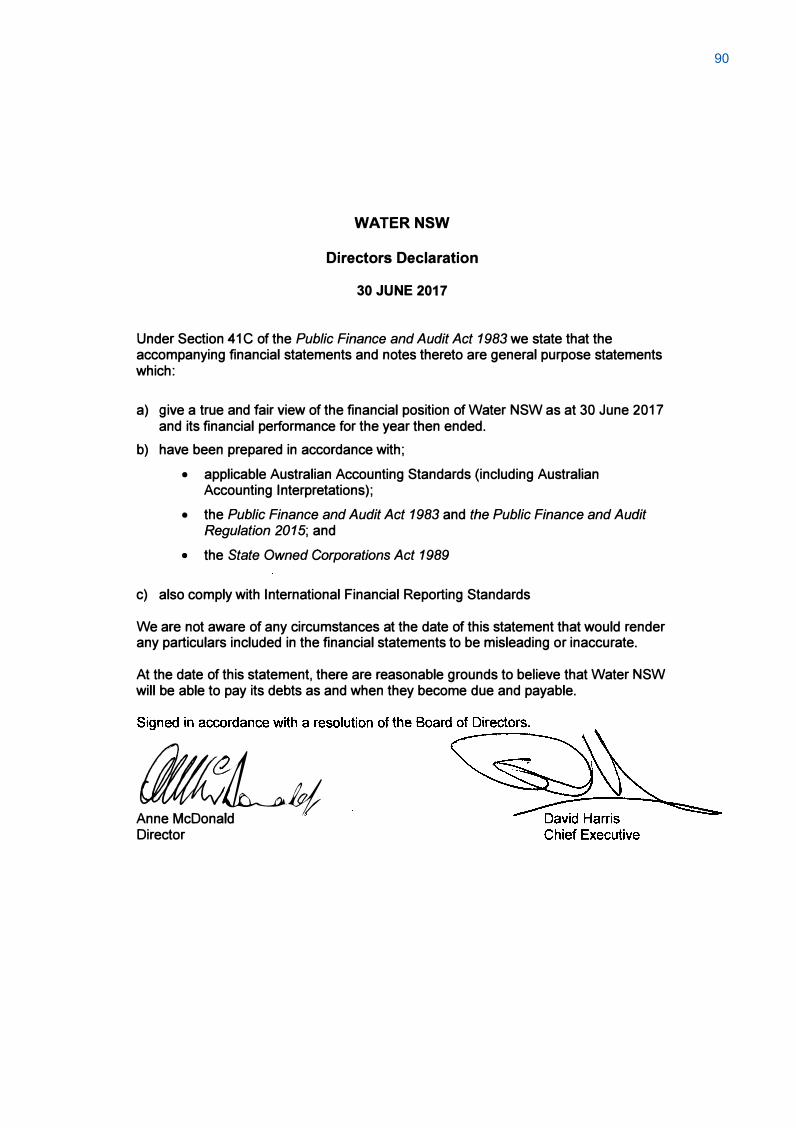
WATERNSW
Directors Declaration
30 JUNE 2017
Under Section 41 C of the Public Finance and Audit Act 1983 we state that the accompanying financial statements and notes thereto are general purpose statements which:
a) give a true and fair view of the financial position of Water NSW as at 30 June 2017and its financial performance for the year then ended.
b) have been prepared in accordance with;
• applicable Australian Accounting Standards (including AustralianAccounting Interpretations);
• the Public Finance and Audit Act 1983 and the Public Finance and AuditRegulation 2015; and
• the State Owned Corporations Act 1989
c) also comply with International Financial Reporting Standards
We are not aware of any circumstances at the date of this statement that would render any particulars included in the financial statements to be misleading or inaccurate.
At the date of this statement, there are reasonable grounds to believe that Water NSW will be able to pay its debts as and when they become due and payable.
fllll:L Anne McDonald
··
Director
90

INDEPENDENT AUDITOR’S REPORT Water NSW
To Members of the New South Wales Parliament
Opinion I have audited the accompanying financial statements of Water NSW (the Corporation), which comprise the statement of financial position as at 30 June 2017, the statement of comprehensive income, statement of changes in equity and statement of cash flows for the year then ended, notes comprising a summary of significant accounting policies and other explanatory information.
In my opinion, the financial statements:
• give a true and fair view of the financial position of the Corporation as at 30 June 2017, and of its financial performance and its cash flows for the year then ended in accordance with Australian Accounting Standards
• are in accordance with section 41B of the Public Finance and Audit Act 1983 (PF&A Act) and the Public Finance and Audit Regulation 2015
• comply with International Financial Reporting Standards
My opinion should be read in conjunction with the rest of this report.
I conducted my audit in accordance with Australian Auditing Standards. My responsibilities under the standards are described in the ‘Auditor’s Responsibilities for the Audit of the Financial Statements’
section of my report.
I am independent of the Corporation in accordance with the requirements of the:
• Australian Auditing Standards • Accounting Professional and Ethical Standards Board’s APES 110 ‘Code of Ethics for
Professional Accountants’ (APES 110).
I have fulfilled my other ethical responsibilities in accordance with the APES 110.
Parliament promotes independence by ensuring the Auditor-General and the Audit Office of New South Wales are not compromised in their roles by:
• providing that only Parliament, and not the executive government, can remove an Auditor-General
• mandating the Auditor-General as auditor of public sector agencies • precluding the Auditor-General from providing non-audit services.
I believe the audit evidence I have obtained is sufficient and appropriate to provide a basis for my audit opinion.
Directors’ Responsibility for the Financial Statements The directors are responsible for the preparation and fair presentation of the financial statements in accordance with Australian Accounting Standards, the PF&A Act and the State Owned Corporations
Act 1989 and the International Financial Reporting Standards and for such internal control as the directors determine is necessary to enable the preparation and fair presentation of the financial statements that are free from material misstatement, whether due to fraud or error.
91
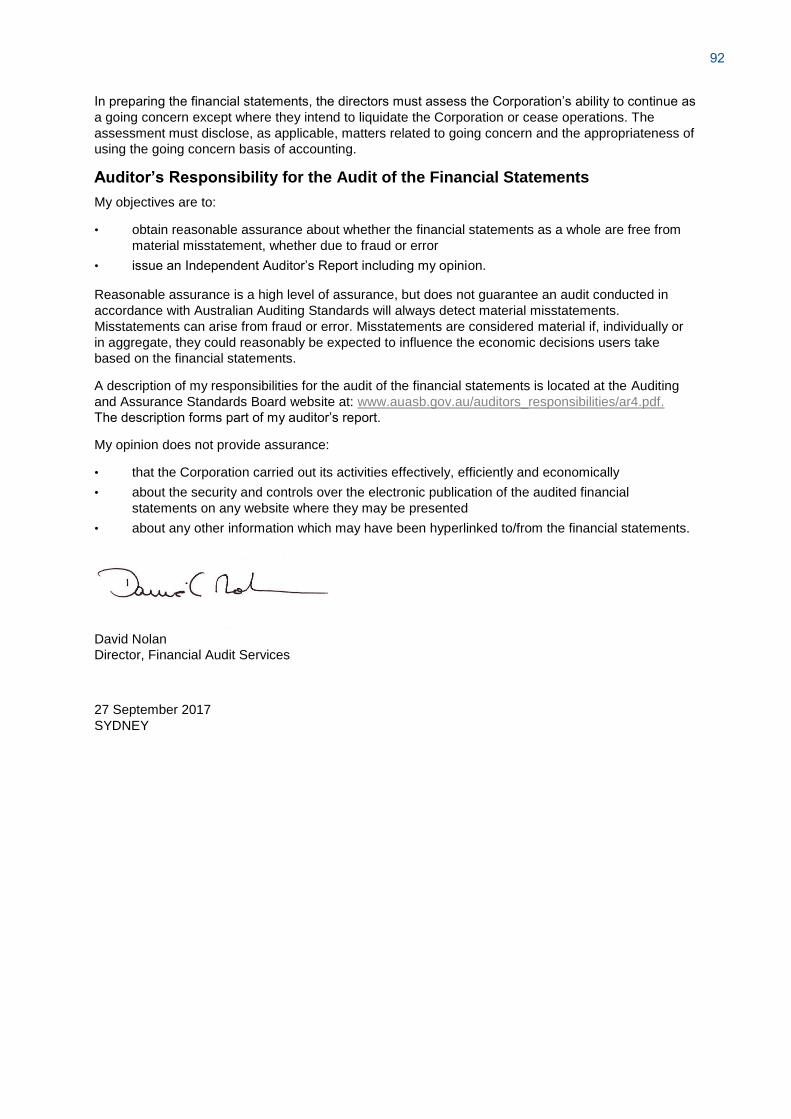
In preparing the financial statements, the directors must assess the Corporation’s ability to continue as
a going concern except where they intend to liquidate the Corporation or cease operations. The assessment must disclose, as applicable, matters related to going concern and the appropriateness of using the going concern basis of accounting.
Auditor’s Responsibility for the Audit of the Financial Statements My objectives are to:
• obtain reasonable assurance about whether the financial statements as a whole are free from material misstatement, whether due to fraud or error
• issue an Independent Auditor’s Report including my opinion.
Reasonable assurance is a high level of assurance, but does not guarantee an audit conducted in accordance with Australian Auditing Standards will always detect material misstatements. Misstatements can arise from fraud or error. Misstatements are considered material if, individually or in aggregate, they could reasonably be expected to influence the economic decisions users take based on the financial statements.
A description of my responsibilities for the audit of the financial statements is located at the Auditing and Assurance Standards Board website at: www.auasb.gov.au/auditors_responsibilities/ar4.pdf. The description forms part of my auditor’s report.
My opinion does not provide assurance:
• that the Corporation carried out its activities effectively, efficiently and economically • about the security and controls over the electronic publication of the audited financial
statements on any website where they may be presented • about any other information which may have been hyperlinked to/from the financial statements.
David Nolan Director, Financial Audit Services
27 September 2017 SYDNEY
92

Appendices
93

Appendix 1 – Corporate Governance Board Members Directors are appointed by the voting shareholders as set out in the WaterNSW Act 2014 and hold their office for a period not exceeding five years.
Anne McDonald – Chair BEc, FCA, FAICD Anne McDonald was a former Director of Sydney Water and has strong experience in the water industry and price regulated businesses. She is currently on the board of three ASX listed companies (Link Group, Spark lnfrastructure and Speciality Fashion Group). Anne has broad based business and financial experience gained through working with a wide cross section of international and domestic companies.
Dr Nicholas Brunton BA, LLB, PhD, FAPI Dr Nicholas Brunton is a partner in the Environmental and Planning Law Group, Henry Davis York Lawyers, Sydney. He is a Member of the Advisory Board for the Australian Centre for Climate Change and Environmental Law at the University of Sydney and a Fellow of the Australian Property Institute. Nicholas has expertise in catchment management and environmental risk management for large organisations as well as pollution management.
Professor Andrew Wilson BMed Sci, MBBS (Hons), PhD, FRACP, FAFPHM Professor Wilson is Director of the University of Sydney node of the Menzies Centre for Health Policy and Professor of Public Health in the School of Public Health. He has also served as Chief Health Officer for NSW. He has specialist qualifications in clinical medicine and public health, and a PhD in epidemiology.
94

Rob Aldis BE (Civil), FAICD Rob Aldis is the former Managing Director of engineering services company Evans Peck and has more than 40 years experience in the engineering and construction sector, particularly in relation to water supply infrastructure. Rob is Chairman of the NorthWestern Roads Group and its subsidiaries, owners and shareholders of the M7 Motorway and NorthConnex Tunnel project in Sydney and a member of the Project Advisory Group for completion of the Pacific Highway in NSW.
Emma Stein BSc (Hons), MBA, FAICD Emma has worked as a non-executive director for listed ASX 50-200, private and government owned Australian and NZ oil and gas, power, energy and utilities, resources, engineering and industrial services companies. Her European executive career (1984-2003) spanned building materials, fuel distribution and energy retailing - as Managing Director of British Fuels Gas she ran the first independent domestic gas retailer, as Gaz de France's UK Managing Director she built a major industrial customer focused gas and electricity retailer.
David Harris - Chief Executive Officer BEc, LLB (Hons) David Harris is the CEO of WaterNSW. Previously David was for a short time CEO of both State Water Corporation and the Sydney Catchment Authority, the two entities that were merged to form WaterNSW. David has over 20 years’ experience in the Australian water industry and has been involved in various key policy and market reforms in the water, energy and utilities industries over that time. From 2002 to 2013 David was a key member of the Executive leadership of Snowy Hydro Limited.
95
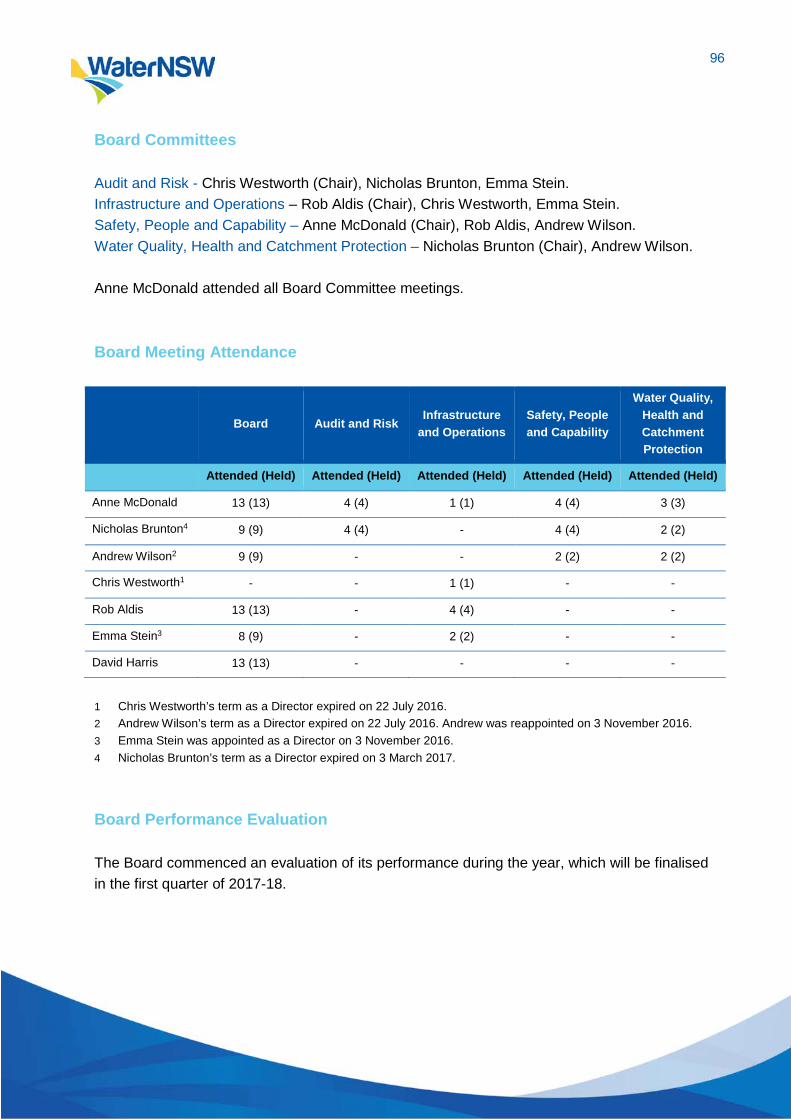
Board Committees Audit and Risk - Chris Westworth (Chair), Nicholas Brunton, Emma Stein. Infrastructure and Operations – Rob Aldis (Chair), Chris Westworth, Emma Stein. Safety, People and Capability – Anne McDonald (Chair), Rob Aldis, Andrew Wilson. Water Quality, Health and Catchment Protection – Nicholas Brunton (Chair), Andrew Wilson. Anne McDonald attended all Board Committee meetings. Board Meeting Attendance
Board Audit and Risk Infrastructure
and Operations Safety, People and Capability
Water Quality, Health and Catchment Protection
Attended (Held) Attended (Held) Attended (Held) Attended (Held) Attended (Held)
Anne McDonald 13 (13) 4 (4) 1 (1) 4 (4) 3 (3)
Nicholas Brunton4 9 (9) 4 (4) - 4 (4) 2 (2)
Andrew Wilson2 9 (9) - - 2 (2) 2 (2)
Chris Westworth1 - - 1 (1) - -
Rob Aldis 13 (13) - 4 (4) - -
Emma Stein3 8 (9) - 2 (2) - -
David Harris 13 (13) - - - -
1 Chris Westworth’s term as a Director expired on 22 July 2016. 2 Andrew Wilson’s term as a Director expired on 22 July 2016. Andrew was reappointed on 3 November 2016. 3 Emma Stein was appointed as a Director on 3 November 2016. 4 Nicholas Brunton’s term as a Director expired on 3 March 2017. Board Performance Evaluation The Board commenced an evaluation of its performance during the year, which will be finalised in the first quarter of 2017-18.
96
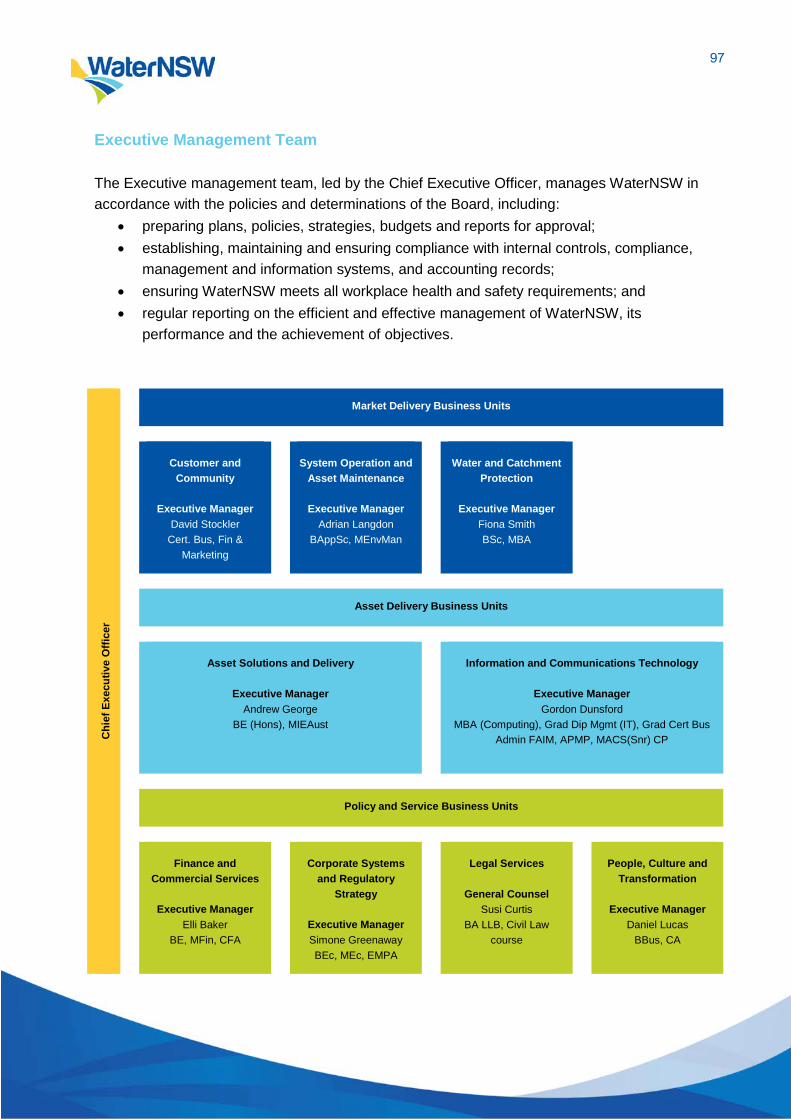
Executive Management Team The Executive management team, led by the Chief Executive Officer, manages WaterNSW in accordance with the policies and determinations of the Board, including:
• preparing plans, policies, strategies, budgets and reports for approval; • establishing, maintaining and ensuring compliance with internal controls, compliance,
management and information systems, and accounting records; • ensuring WaterNSW meets all workplace health and safety requirements; and • regular reporting on the efficient and effective management of WaterNSW, its
performance and the achievement of objectives.
Chi
ef E
xecu
tive
Offi
cer
Market Delivery Business Units
Customer and Community
Executive Manager
David Stockler Cert. Bus, Fin &
Marketing
System Operation and
Asset Maintenance
Executive Manager Adrian Langdon
BAppSc, MEnvMan
Water and Catchment
Protection
Executive Manager Fiona Smith BSc, MBA
Asset Delivery Business Units
Asset Solutions and Delivery
Executive Manager Andrew George
BE (Hons), MIEAust
Information and Communications Technology
Executive Manager
Gordon Dunsford MBA (Computing), Grad Dip Mgmt (IT), Grad Cert Bus
Admin FAIM, APMP, MACS(Snr) CP
Policy and Service Business Units
Finance and Commercial Services
Executive Manager
Elli Baker BE, MFin, CFA
Corporate Systems
and Regulatory Strategy
Executive Manager Simone Greenaway BEc, MEc, EMPA
Legal Services
General Counsel
Susi Curtis BA LLB, Civil Law
course
People, Culture and
Transformation
Executive Manager Daniel Lucas
BBus, CA
97

Executive Team Remuneration
Salary range 2015-16 2016-17
Average salary Male Female Average
salary Male Female
Band 4 + $533,147 1 - $546,651 1 -
Band 4 - - - - - -
Band 3 $339,086 2 1 $346,700 1 1
Band 2 $267,420 3 2 $282,077 3 2
Band 1 $236,346 1 1 $239,968 1 1
The estimated percentage of total employee related expenditure that relates to Executive Team members for 2016-17 is 4% (5% in 2015-16).
98
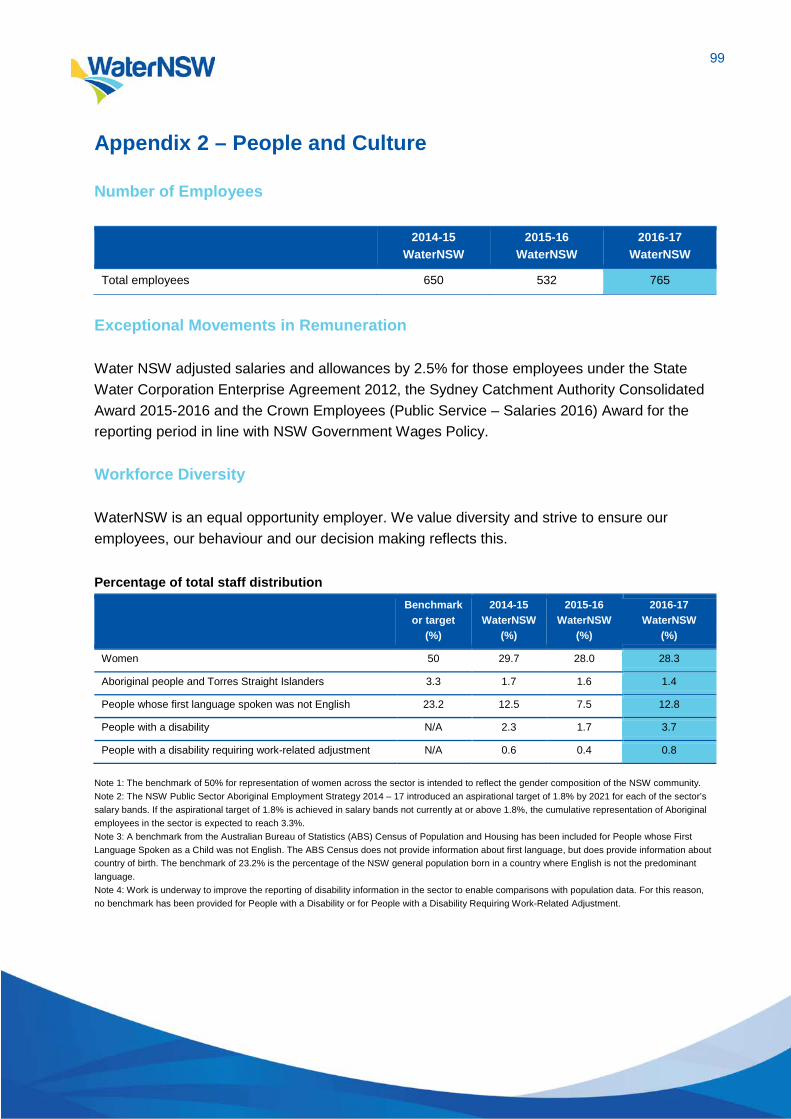
Appendix 2 – People and Culture Number of Employees
2014-15
WaterNSW 2015-16
WaterNSW 2016-17
WaterNSW
Total employees 650 532 765
Exceptional Movements in Remuneration Water NSW adjusted salaries and allowances by 2.5% for those employees under the State Water Corporation Enterprise Agreement 2012, the Sydney Catchment Authority Consolidated Award 2015-2016 and the Crown Employees (Public Service – Salaries 2016) Award for the reporting period in line with NSW Government Wages Policy. Workforce Diversity WaterNSW is an equal opportunity employer. We value diversity and strive to ensure our employees, our behaviour and our decision making reflects this. Percentage of total staff distribution
Benchmark
or target (%)
2014-15 WaterNSW
(%)
2015-16 WaterNSW
(%)
2016-17 WaterNSW
(%)
Women 50 29.7 28.0 28.3
Aboriginal people and Torres Straight Islanders 3.3 1.7 1.6 1.4
People whose first language spoken was not English 23.2 12.5 7.5 12.8
People with a disability N/A 2.3 1.7 3.7
People with a disability requiring work-related adjustment N/A 0.6 0.4 0.8
Note 1: The benchmark of 50% for representation of women across the sector is intended to reflect the gender composition of the NSW community. Note 2: The NSW Public Sector Aboriginal Employment Strategy 2014 – 17 introduced an aspirational target of 1.8% by 2021 for each of the sector’s salary bands. If the aspirational target of 1.8% is achieved in salary bands not currently at or above 1.8%, the cumulative representation of Aboriginal employees in the sector is expected to reach 3.3%. Note 3: A benchmark from the Australian Bureau of Statistics (ABS) Census of Population and Housing has been included for People whose First Language Spoken as a Child was not English. The ABS Census does not provide information about first language, but does provide information about country of birth. The benchmark of 23.2% is the percentage of the NSW general population born in a country where English is not the predominant language. Note 4: Work is underway to improve the reporting of disability information in the sector to enable comparisons with population data. For this reason, no benchmark has been provided for People with a Disability or for People with a Disability Requiring Work-Related Adjustment.
99

Distribution index
Benchmark
or target (%)
2014-15 WaterNSW
(%)
2015-16 WaterNSW
(%)
2016-17 WaterNSW
(%)
Women 100 91 93 95
Aboriginal people and Torres Straight Islanders 100 N/A N/A N/A
People whose first language was not English 100 105 112 111
People with a disability 100 N/A N/A 90
People with a disability requiring work-related adjustment 100 N/A N/A N/A
Note 1: A Distribution Index score of 100 indicates that the distribution of members of the Workforce Diversity group across salary bands is equivalent to that of the rest of the workforce. A score less than 100 means that members of the Workforce Diversity group tend to be more concentrated at lower salary bands than is the case for other staff. The more pronounced this tendency is, the lower the score will be. In some cases, the index may be more than 100, indicating that members of the Workforce Diversity group tend to be more concentrated at higher salary bands than is the case for other staff. Note 2: The Distribution Index is not calculated when the number of employees in the Workforce Diversity group is less than 20 or when the number of other employees is less than 20. Work Health and Safety Safety remains our highest priority. During 2016-17 WaterNSW continued to embed contemporary Work Health and Safety (WHS) procedures across all worksites, along with the rollout of behavioural safety and leadership training. WaterNSW also maintains a certified OHSAS 18001:2007 WHS Management System. These initiatives, along with the efficient management and investigation of incidents have improved our injury management processes and resulted in a reduction in lost time days. There were no prosecutions in 2016-17.
2014-15
WaterNSW 2015-16
WaterNSW 2016-17
WaterNSW
Total compensable injuries 9 4 5
Total lost time days 383 438 20
Average lost time days per compensable injury 19.3 62.5 4.0
Overseas Visits There were no overseas visits undertaken by WaterNSW employees or officers in 2016-17.
100

Personnel Policies and Procedures
Learning and development • Conference Attendance and Presentation • Induction • Learning and Development • Study Assistance • Education Assistance Agreement
Performance management • Counselling and Disciplinary • Disciplinary Guideline & Procedure • Grievance Resolution • Performance Management
Employment conditions and award • Code of Conduct • Excess Employee • Human Resources • Public Interest Disclosures - Reporting
Unethical or Improper Conduct • Recreational Leave Management • Salary Packaging • Secondary Employment • Work Experience • SCA Consolidated Award 2015-16 • State Water Corporation Enterprise
Agreement 2015 • Crown Employees (Public Service Conditions
of Employment) Reviewed Award 2009
Staff welfare • Breastfeeding at Work • Carer's Leave • FACS Leave • Flexible Work Arrangement • Maternity Leave • Part-Time Work • First Aid • Return to Work Program - Occupational
Rehabilitation • Prevention of Bullying and Harassment • Purchased Leave • Working Safely from Home
Recruitment selection • Job Evaluation
101
Appendix 3 – Legislative Framework and Compliance Significant legislation Water NSW Act 2014 Aside from establishing WaterNSW, the objectives of the Water NSW Act are primarily focused on WaterNSW’s ‘capture, store, release’, water quality, declared catchment and storage functions. Water Management Act 2000 and the Water Act 1912 The Water Management Act 2000 controls the extraction of water, the use of water, the construction of works and the carrying out of activities on or near water sources in NSW. The Water Management Act is replacing the long-standing Water Act 1912, which remains in force in some areas of the state. The objectives of the Water Management Act 2000 are to provide for the sustainable and integrated management of the water sources of the state. Protection of the Environment Operations Act 1997 The Protection of the Environment Operations Act 1997 is the primary NSW statute regulating pollution of the environment. Its objectives include the protection, restoration and enhancement of the environment, providing public access to information on pollution and reducing risks to human health and the environment. Relevantly for WaterNSW, it includes offences involving harm to the environment and land pollution, for non-scheduled activities that affect or are located within the WaterNSW declared catchments and controlled areas. Environmental Planning and Assessment Act 1979 The EP&A Act is the primary NSW planning legislation. Its focus is on ensuring development meets the needs of people, protects the environment and encourages the proper management, development and conservation of resources (natural and artificial). Relevantly for WaterNSW, it includes a ‘special provision relating to development in Sydney water catchment relating to water quality.’
102

Changes in Acts and subordinate legislation Water NSW Act 2014 The WaterNSW Operating Licence 2017-22 commenced on 1 July 2017. This new single operating licence replaces the State Water and Sydney Catchment Authority operating licences and delivers a number of important outcomes for WaterNSW and its customers, namely greater clarity and transparency and the opportunity to reduce costs through operational and administrative efficiencies. Water Management Act 2000 and the Water Act 1912 On 1 July 2016 WaterNSW was conferred functions previously performed by the Department of Primary Industries – Water (DPI Water). As a result of the conferral, WaterNSW is responsible for various compliance activities under the Water Management Act 2000 (NSW), Water Act 1912 (NSW) and associated legislative instruments. In October 2016 the Water Management Regulation 2011 was amended to make a number of minor operational changes with respect to those licensing functions that had been conferred upon WaterNSW on 1 July 2016. Significant Judicial Decisions There were no significant judicial decisions affecting WaterNSW or the users of our services in 2016-17.
103
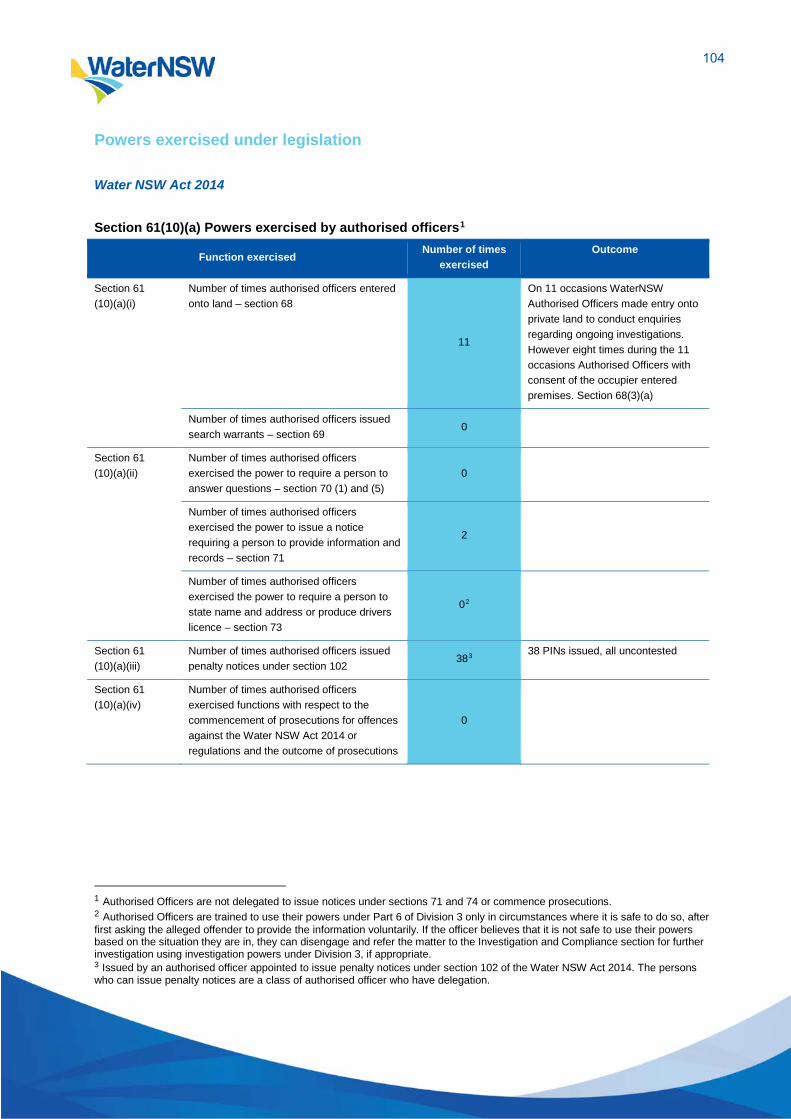
Powers exercised under legislation Water NSW Act 2014 Section 61(10)(a) Powers exercised by authorised officers1
Function exercised Number of times
exercised Outcome
Section 61 (10)(a)(i)
Number of times authorised officers entered onto land – section 68
11
On 11 occasions WaterNSW Authorised Officers made entry onto private land to conduct enquiries regarding ongoing investigations. However eight times during the 11 occasions Authorised Officers with consent of the occupier entered premises. Section 68(3)(a)
Number of times authorised officers issued search warrants – section 69
0
Section 61 (10)(a)(ii)
Number of times authorised officers exercised the power to require a person to answer questions – section 70 (1) and (5)
0
Number of times authorised officers exercised the power to issue a notice requiring a person to provide information and records – section 71
2
Number of times authorised officers exercised the power to require a person to state name and address or produce drivers licence – section 73
02
Section 61 (10)(a)(iii)
Number of times authorised officers issued penalty notices under section 102
383 38 PINs issued, all uncontested
Section 61 (10)(a)(iv)
Number of times authorised officers exercised functions with respect to the commencement of prosecutions for offences against the Water NSW Act 2014 or regulations and the outcome of prosecutions
0
1 Authorised Officers are not delegated to issue notices under sections 71 and 74 or commence prosecutions. 2 Authorised Officers are trained to use their powers under Part 6 of Division 3 only in circumstances where it is safe to do so, after first asking the alleged offender to provide the information voluntarily. If the officer believes that it is not safe to use their powers based on the situation they are in, they can disengage and refer the matter to the Investigation and Compliance section for further investigation using investigation powers under Division 3, if appropriate. 3 Issued by an authorised officer appointed to issue penalty notices under section 102 of the Water NSW Act 2014. The persons who can issue penalty notices are a class of authorised officer who have delegation.
104
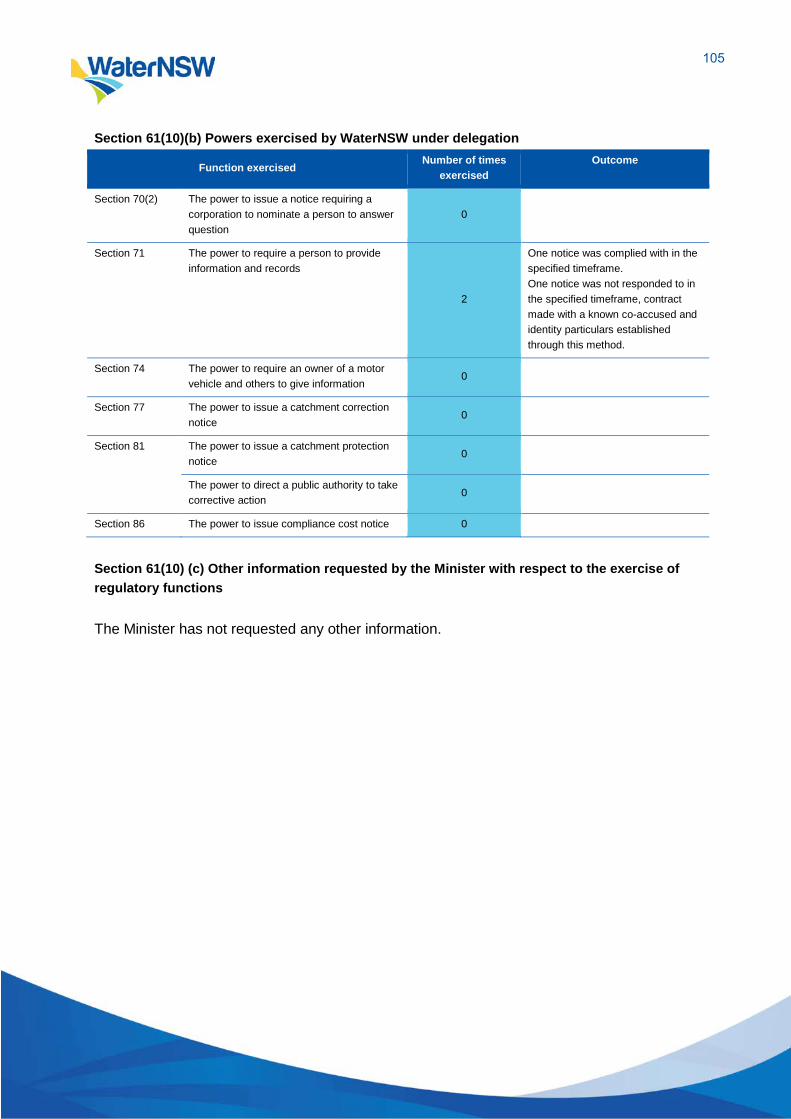
Section 61(10)(b) Powers exercised by WaterNSW under delegation
Function exercised Number of times
exercised Outcome
Section 70(2) The power to issue a notice requiring a corporation to nominate a person to answer question
0
Section 71 The power to require a person to provide information and records 2
One notice was complied with in the specified timeframe. One notice was not responded to in the specified timeframe, contract made with a known co-accused and identity particulars established through this method.
Section 74 The power to require an owner of a motor vehicle and others to give information
0
Section 77 The power to issue a catchment correction notice
0
Section 81 The power to issue a catchment protection notice
0
The power to direct a public authority to take corrective action
0
Section 86 The power to issue compliance cost notice 0
Section 61(10) (c) Other information requested by the Minister with respect to the exercise of regulatory functions The Minister has not requested any other information.
105
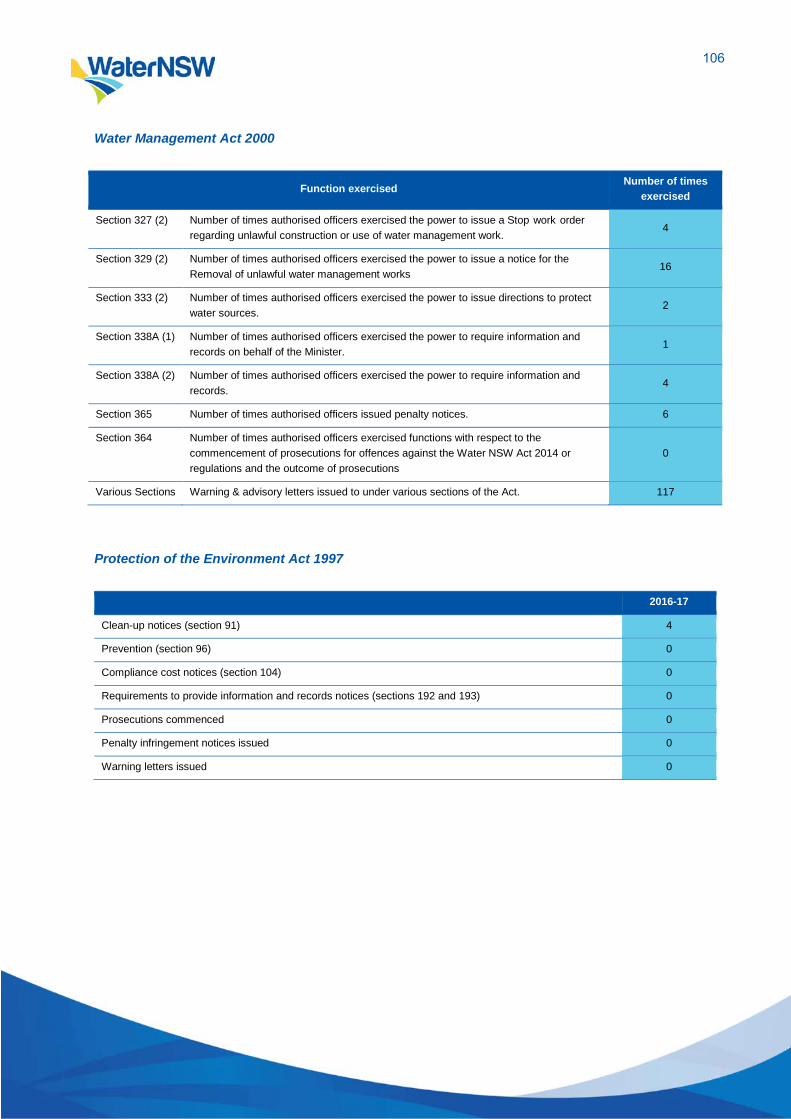
Water Management Act 2000
Function exercised Number of times exercised
Section 327 (2) Number of times authorised officers exercised the power to issue a Stop work order regarding unlawful construction or use of water management work.
4
Section 329 (2) Number of times authorised officers exercised the power to issue a notice for the Removal of unlawful water management works
16
Section 333 (2) Number of times authorised officers exercised the power to issue directions to protect water sources.
2
Section 338A (1) Number of times authorised officers exercised the power to require information and records on behalf of the Minister.
1
Section 338A (2) Number of times authorised officers exercised the power to require information and records.
4
Section 365 Number of times authorised officers issued penalty notices. 6
Section 364 Number of times authorised officers exercised functions with respect to the commencement of prosecutions for offences against the Water NSW Act 2014 or regulations and the outcome of prosecutions
0
Various Sections Warning & advisory letters issued to under various sections of the Act. 117
Protection of the Environment Act 1997
2016-17
Clean-up notices (section 91) 4
Prevention (section 96) 0
Compliance cost notices (section 104) 0
Requirements to provide information and records notices (sections 192 and 193) 0
Prosecutions commenced 0
Penalty infringement notices issued 0
Warning letters issued 0
106
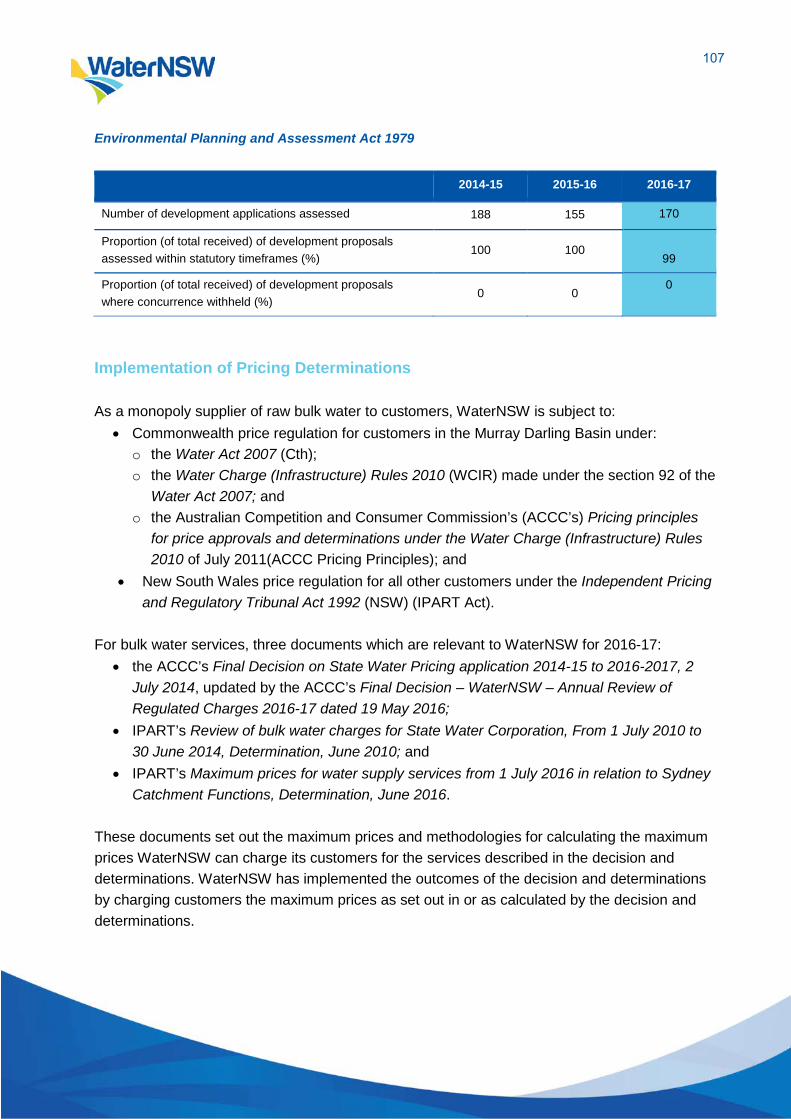
Environmental Planning and Assessment Act 1979
2014-15 2015-16 2016-17
Number of development applications assessed 188 155 170
Proportion (of total received) of development proposals assessed within statutory timeframes (%)
100 100
99
Proportion (of total received) of development proposals where concurrence withheld (%)
0 0 0
Implementation of Pricing Determinations As a monopoly supplier of raw bulk water to customers, WaterNSW is subject to:
• Commonwealth price regulation for customers in the Murray Darling Basin under: o the Water Act 2007 (Cth); o the Water Charge (Infrastructure) Rules 2010 (WCIR) made under the section 92 of the
Water Act 2007; and o the Australian Competition and Consumer Commission’s (ACCC’s) Pricing principles
for price approvals and determinations under the Water Charge (Infrastructure) Rules 2010 of July 2011(ACCC Pricing Principles); and
• New South Wales price regulation for all other customers under the Independent Pricing and Regulatory Tribunal Act 1992 (NSW) (IPART Act).
For bulk water services, three documents which are relevant to WaterNSW for 2016-17:
• the ACCC’s Final Decision on State Water Pricing application 2014-15 to 2016-2017, 2 July 2014, updated by the ACCC’s Final Decision – WaterNSW – Annual Review of Regulated Charges 2016-17 dated 19 May 2016;
• IPART’s Review of bulk water charges for State Water Corporation, From 1 July 2010 to 30 June 2014, Determination, June 2010; and
• IPART’s Maximum prices for water supply services from 1 July 2016 in relation to Sydney Catchment Functions, Determination, June 2016.
These documents set out the maximum prices and methodologies for calculating the maximum prices WaterNSW can charge its customers for the services described in the decision and determinations. WaterNSW has implemented the outcomes of the decision and determinations by charging customers the maximum prices as set out in or as calculated by the decision and determinations.
107
On 1 July 2016, WaterNSW acquired some of the delegated functions of the Water Administration Ministerial Corporation (WAMC) which were previously delegated to the Department of Primary Industries Water (DPI Water). The maximum prices for WAMC functions are determined by IPART under the IPART Act and WaterNSW has historically provided a billing function to DPI Water for these charges. From 1 July 2016, the maximum prices determined by IPART for the WAMC functions are set out in IPART’s Water Administration Ministerial Corporation, Maximum prices for water management services from 1 July 2016, Determination, June 2016. These maximum prices have been billed by WaterNSW on behalf of DPI Water. WaterNSW and DPI Water have determined the split of the revenue reflecting the split of the functions between them. The WaterNSW budget and financial targets in the annual Statement of Corporate Intent are also set to ensure the outcomes in the decision and determinations are met. WaterNSW has robust processes in place to ensure that over the period of the ACCC decision and IPART determinations, it will not exceed the capital and operating expenditure allowances while meeting or exceeding NSW Treasury’s financial targets.
108

Appendix 4 – Access to Information Government Information (Public Access) Act 2009 Proactive release of information Under section 7 of the Government Information (Public Access) Act 2009 (GIPA Act), agencies must regularly review their programs for the release of government information to identify the kinds of information that can be made publicly available. This review must be undertaken at least once every 12 months. During 2016-17 WaterNSW’s program for the proactive release of information included reviews of information held by WaterNSW that may be of interest to the public (that is, not already released proactively), GIPA applications (informal and formal) received to see what categories of information are requested, information produced in the last year that may be of interest to the public to release proactively; and the initiatives, developments or projects that WaterNSW would like the public to know about. WaterNSW focuses on delivery of customer service and aims to make doing business easy for its customers through its online services and customer helpdesk. WaterNSW conducts regular reviews of the content and currency of information available on its website and welcomes any feedback from customers and members of the general public to make accessing our information easier. WaterNSW has proactively released information about our dams, individual dam levels, customer news and updates, major projects, Early Warning Network, flood information, water supply and water quality. WaterNSW has effectively incorporated into its business a number of functions related to the delivery of water services in NSW which were transferred from Department of Primary Industries - Water to WaterNSW on 1 July 2016. Government Information (Public Access) Act 2009 applications received by WaterNSW During the financial year 2016-17 WaterNSW received thirty-four valid applications under the Government Information (Public Access) Act 2009. One application was withdrawn by the applicant. One application was transferred to another agency. Twenty-nine applications were assessed and the outcome communicated to applicants within statutory or agreed timeframes. The processing period for three applications will extend into 2017-18.
109

Applications were decided as follows: • 17 applications were granted in full; • 10 applications were granted in part, this was because there were public interest
considerations against disclosure (as listed in the table at section 14 of the GIPA Act); • 2 applications were refused in full.
Number of applications by type of applicant and outcome
Access granted in full
Access granted in part
Access refused in full
Information not held
Information already
available
Refuse to deal with
application
Refuse to confirm /deny
whether information
is held
Application withdrawn
Media 0 0 0 0 0 0 0 0
Members of Parliament 4 0 0 0 0 0 0 0
Private sector business 0 0 0 0 0 0 0 0
Not for profit organisations or community groups
0 2 0 0 0 0 0 0
Members of the public (application by legal representative)
0 1 0 0 0 0 0 0
Members of the public (other)
13 7 2 0 0 0 0 1
Number of applications by type of application and outcome
Access granted in full
Access granted in part
Access refused in full
Information not held
Information already
available
Refuse to deal with
application
Refuse to confirm /deny
whether information
is held
Application withdrawn
Personal information applications
0 0 0 0 0 0 0 0
Access applications (other than personal information applications)
17 10 2 0 0 0 0 1
Access applications that are partly personal information applications & partly other
0 0 0 0 0 0 0 0
110
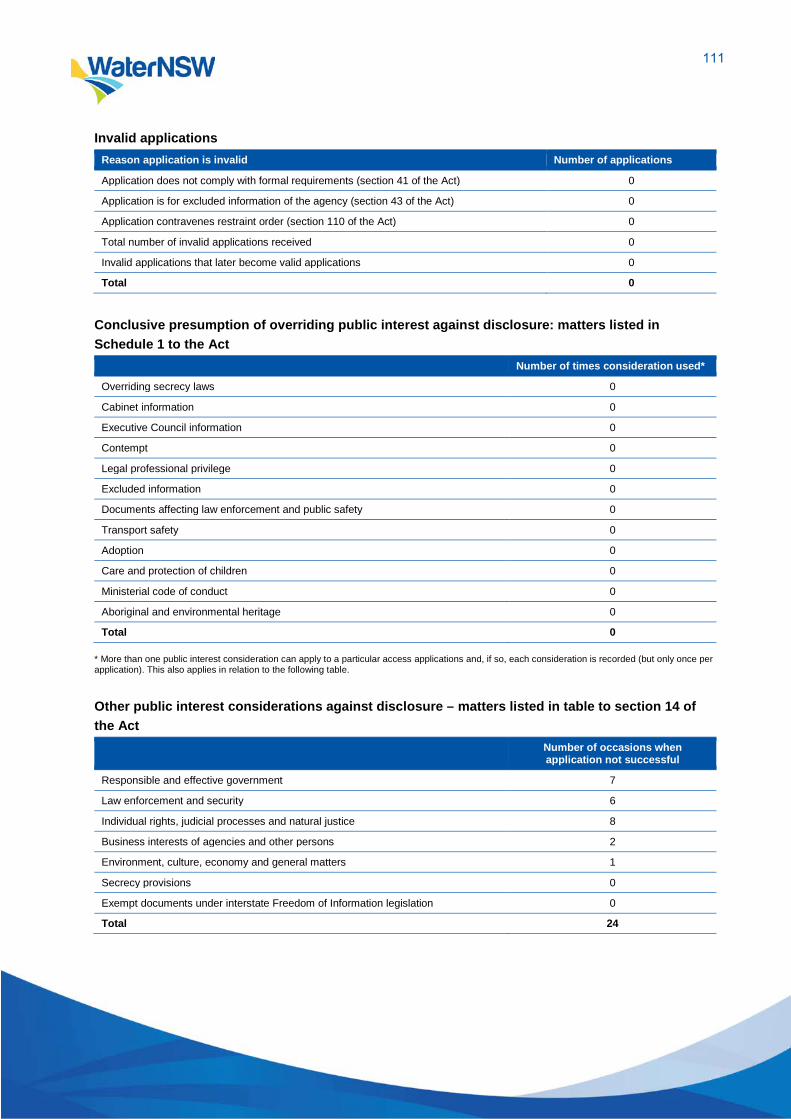
Invalid applications Reason application is invalid Number of applications
Application does not comply with formal requirements (section 41 of the Act) 0
Application is for excluded information of the agency (section 43 of the Act) 0
Application contravenes restraint order (section 110 of the Act) 0
Total number of invalid applications received 0
Invalid applications that later become valid applications 0
Total 0
Conclusive presumption of overriding public interest against disclosure: matters listed in Schedule 1 to the Act
Number of times consideration used*
Overriding secrecy laws 0
Cabinet information 0
Executive Council information 0
Contempt 0
Legal professional privilege 0
Excluded information 0
Documents affecting law enforcement and public safety 0
Transport safety 0
Adoption 0
Care and protection of children 0
Ministerial code of conduct 0
Aboriginal and environmental heritage 0
Total 0 * More than one public interest consideration can apply to a particular access applications and, if so, each consideration is recorded (but only once per application). This also applies in relation to the following table.
Other public interest considerations against disclosure – matters listed in table to section 14 of the Act
Number of occasions when application not successful
Responsible and effective government 7
Law enforcement and security 6
Individual rights, judicial processes and natural justice 8
Business interests of agencies and other persons 2
Environment, culture, economy and general matters 1
Secrecy provisions 0
Exempt documents under interstate Freedom of Information legislation 0
Total 24
111
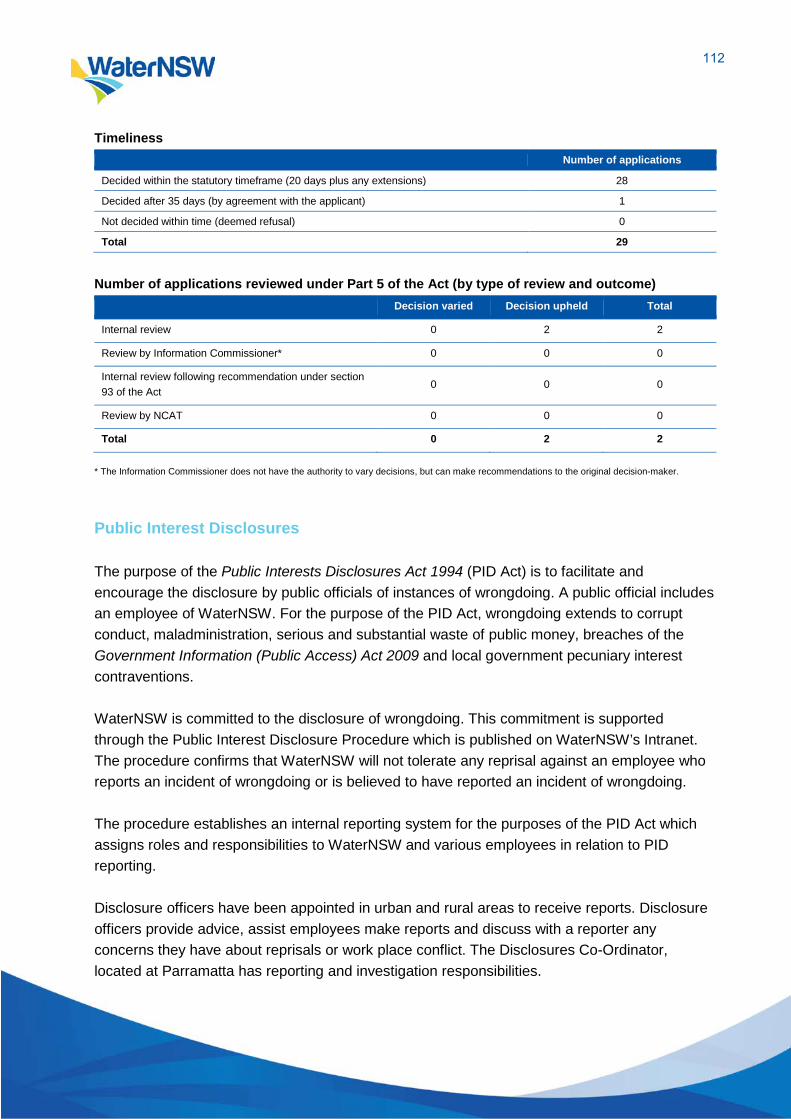
Timeliness Number of applications
Decided within the statutory timeframe (20 days plus any extensions) 28
Decided after 35 days (by agreement with the applicant) 1
Not decided within time (deemed refusal) 0
Total 29
Number of applications reviewed under Part 5 of the Act (by type of review and outcome)
Decision varied Decision upheld Total
Internal review 0 2 2
Review by Information Commissioner* 0 0 0
Internal review following recommendation under section 93 of the Act
0 0 0
Review by NCAT 0 0 0
Total 0 2 2 * The Information Commissioner does not have the authority to vary decisions, but can make recommendations to the original decision-maker.
Public Interest Disclosures The purpose of the Public Interests Disclosures Act 1994 (PID Act) is to facilitate and encourage the disclosure by public officials of instances of wrongdoing. A public official includes an employee of WaterNSW. For the purpose of the PID Act, wrongdoing extends to corrupt conduct, maladministration, serious and substantial waste of public money, breaches of the Government Information (Public Access) Act 2009 and local government pecuniary interest contraventions. WaterNSW is committed to the disclosure of wrongdoing. This commitment is supported through the Public Interest Disclosure Procedure which is published on WaterNSW’s Intranet. The procedure confirms that WaterNSW will not tolerate any reprisal against an employee who reports an incident of wrongdoing or is believed to have reported an incident of wrongdoing. The procedure establishes an internal reporting system for the purposes of the PID Act which assigns roles and responsibilities to WaterNSW and various employees in relation to PID reporting. Disclosure officers have been appointed in urban and rural areas to receive reports. Disclosure officers provide advice, assist employees make reports and discuss with a reporter any concerns they have about reprisals or work place conflict. The Disclosures Co-Ordinator, located at Parramatta has reporting and investigation responsibilities.
112

The Public Interest Disclosure Procedure is designed to complement normal communication channels between managers and their staff. Employees at all times are encouraged to raise matters with their immediate manager but also have the option of making a PID report either internally or to an external oversight agency. On 24 May 2017 the Independent Commission Against Corruption (ICAC) informed the Chief Executive Officer that it had received anonymous allegations of corrupt conduct. The allegations concerned the misuse by a male employee of their corporate credit card on a regular basis and that the policy in relation to attendances at conferences was not being enforced. The ICAC treated the complaint as a public interest disclosure under the PID Act. The status of the complaint continues to apply irrespective of its referral to WaterNSW. In addition to the internal audit process an annual Fraud and Corruption Spot Audit Program has been established. An element of the program is focused on expenses and corporate credit card transactions which involves the assessment of transactions against the expense and corporate credit card policy.
Public interest disclosures 2016-17
Number of public officials who made public interest disclosures 0
Number of public interest disclosures received 1
Primarily about corrupt conduct 1
Primarily about maladministration 0
113
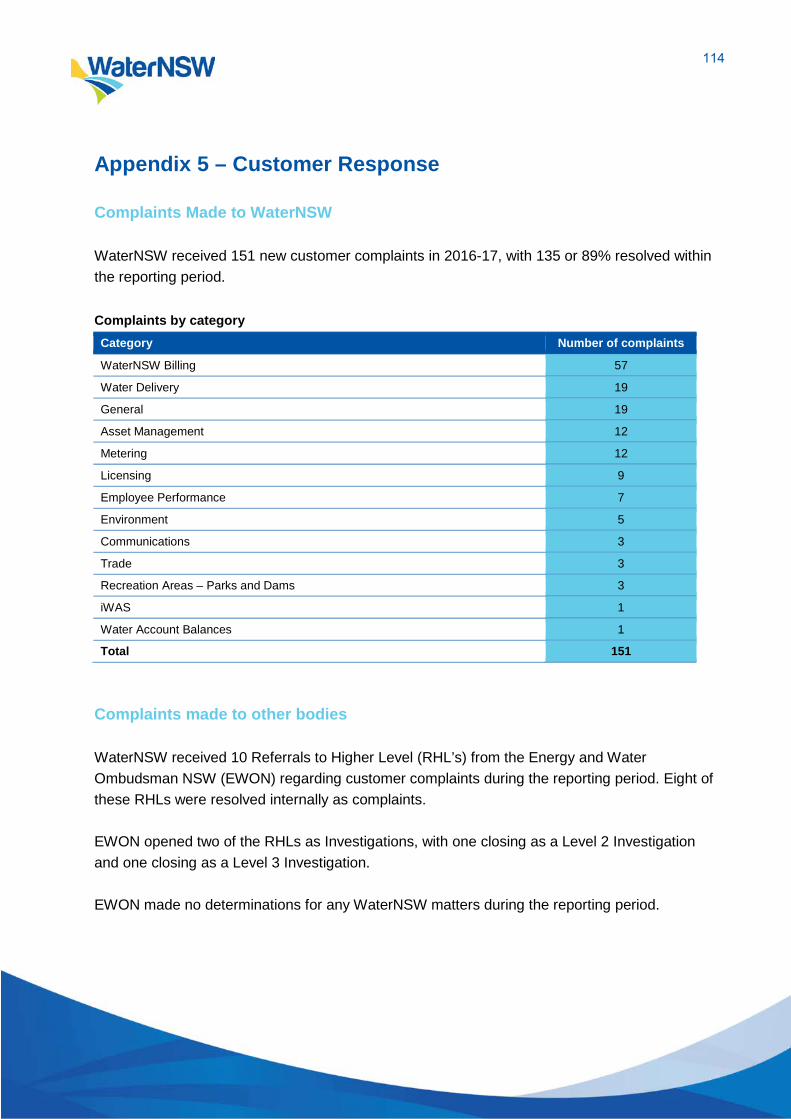
Appendix 5 – Customer Response Complaints Made to WaterNSW WaterNSW received 151 new customer complaints in 2016-17, with 135 or 89% resolved within the reporting period. Complaints by category Category Number of complaints
WaterNSW Billing 57
Water Delivery 19
General 19
Asset Management 12
Metering 12
Licensing 9
Employee Performance 7
Environment 5
Communications 3
Trade 3
Recreation Areas – Parks and Dams 3
iWAS 1
Water Account Balances 1
Total 151 Complaints made to other bodies WaterNSW received 10 Referrals to Higher Level (RHL’s) from the Energy and Water Ombudsman NSW (EWON) regarding customer complaints during the reporting period. Eight of these RHLs were resolved internally as complaints. EWON opened two of the RHLs as Investigations, with one closing as a Level 2 Investigation and one closing as a Level 3 Investigation. EWON made no determinations for any WaterNSW matters during the reporting period.
114

Appendix 6 – Financial Performance Performance In Relation to Budget 2016-17
Budget $’000
2016-17 Actual $’000
2016-17 Variance
$’000 Comments
2017-18 Budget $’000
Revenue 328,269 415,243 86,974 • Revaluation for property, plant and equipment was not included in the budget.
• Revenue earned under the WAMC determination was not included in the budget as the amounts were not certain at the time the budget was prepared.
• Higher than budgeted water sales as a result of a hotter and drier than anticipated summer.
369,527
Operating expenditure
(167,818) (184,238) (16,420) • Expenditure incurred in earning revenue under the WAMC determination was not included in the budget as the amounts were not certain at the time the budget was prepared.
• Lower than budgeted expenditure on contractors due to operational efficiencies realised from the NSW Government’s Bulk Water Reform Program.
(201,303)
Earnings before interest, tax, depreciation and amortisation
160,451 231,005 70,554 • Higher than budgeted revenue partially offset by higher than budgeted operating expenditure.
168,224
Depreciation and amortisation
(58,967) (58,537) 430 • Within expectations. (62,596)
Interest revenue 175 3,378 3,203 • Higher than budgeted cash balance due to lower capital expenditure.
Interest expense (31,124) (32,781) 1,657 • Within expectations. (55,336)
Tax (13,597) (42,913) (29,316) • Higher than budgeted profit before tax. (15,088)
Net profit after tax 56,733 100,062 43,299 • Higher than budgeted profit before tax partially offset by higher than budgeted tax.
35,205
Capital expenditure
(128,077) (63,265) 64,812 • Underspend was driven primarily by re-phasing of the Keepit Dam Safety Upgrade project and strategic deferrals pending confirmation of the ongoing requirement for some assets given related commonwealth funded basin plan initiatives which may render them obsolete.
(448,994)
115

Consultancies
Over $50,000 Engineering
Name E3 Advisory Pty Ltd
Consultancy Industry expertise and delivery advice – Warragamba Dam Raising
Cost $248,460
Name Advisian Pty Ltd
Consultancy Assessment of current and future risks posed by longwall mining
Cost $183,414
Name GHD Pty Ltd
Consultancy Mole River Dam and Dungowan Dam feasibility studies
Cost $119,782
Name Jacobs Group Pty Ltd
Consultancy Mole River Dam feasibility study
Cost $119,782
Name eWater Ltd
Consultancy Mole River Dam and Dungowan Dam feasibility studies
Cost $93,507
Management Services
Name GQI Consulting Pty Ltd
Consultancy Development of communications strategy
Cost $158,440
Marketing
Name McCauley Consulting LP
Consultancy Development of customer strategy
Cost $82,986
Total consultancies equal to or greater than $50,000: $1,014,191
Less than $50,000
Engineering $240,170
Information Technology $25,532
Management services $63,800
Total number of engagements: 13
Total cost of engagements: $329,502
116
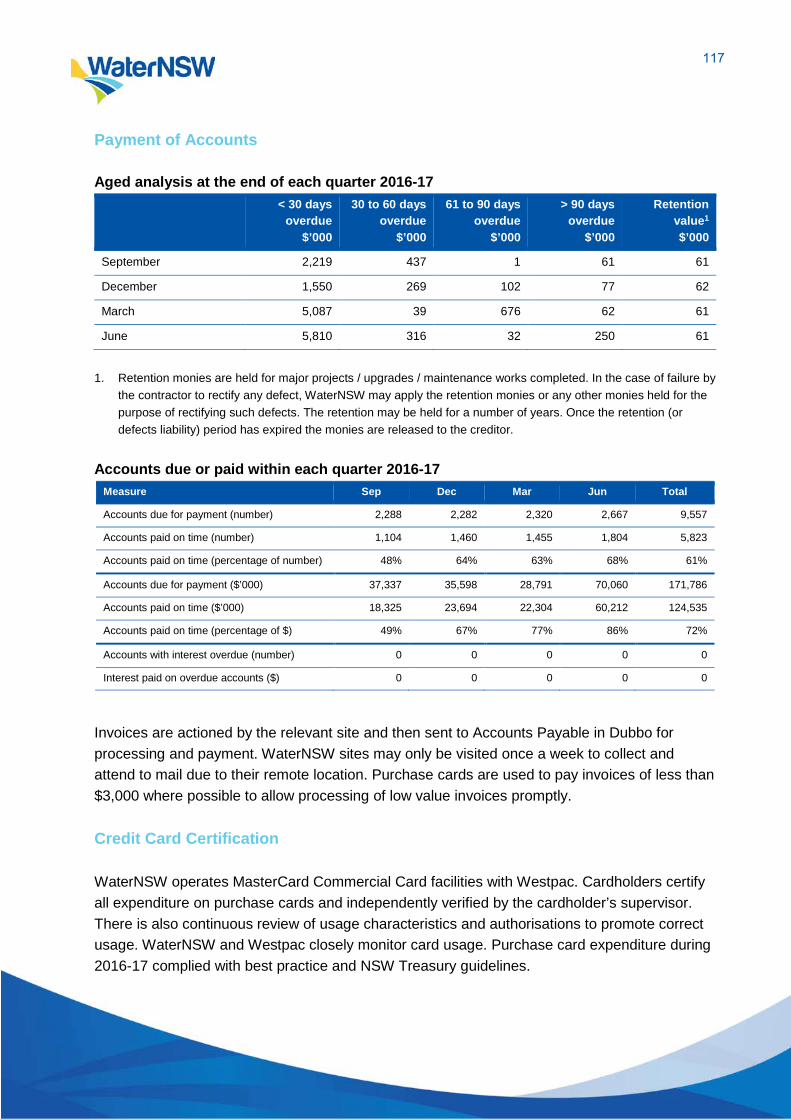
Payment of Accounts Aged analysis at the end of each quarter 2016-17
< 30 days
overdue $’000
30 to 60 days overdue
$’000
61 to 90 days overdue
$’000
> 90 days overdue
$’000
Retention value1
$’000
September 2,219 437 1 61 61
December 1,550 269 102 77 62
March 5,087 39 676 62 61
June 5,810 316 32 250 61
1. Retention monies are held for major projects / upgrades / maintenance works completed. In the case of failure by
the contractor to rectify any defect, WaterNSW may apply the retention monies or any other monies held for the purpose of rectifying such defects. The retention may be held for a number of years. Once the retention (or defects liability) period has expired the monies are released to the creditor.
Accounts due or paid within each quarter 2016-17
Measure Sep Dec Mar Jun Total
Accounts due for payment (number) 2,288 2,282 2,320 2,667 9,557
Accounts paid on time (number) 1,104 1,460 1,455 1,804 5,823
Accounts paid on time (percentage of number) 48% 64% 63% 68% 61%
Accounts due for payment ($’000) 37,337 35,598 28,791 70,060 171,786
Accounts paid on time ($’000) 18,325 23,694 22,304 60,212 124,535
Accounts paid on time (percentage of $) 49% 67% 77% 86% 72%
Accounts with interest overdue (number) 0 0 0 0 0
Interest paid on overdue accounts ($) 0 0 0 0 0
Invoices are actioned by the relevant site and then sent to Accounts Payable in Dubbo for processing and payment. WaterNSW sites may only be visited once a week to collect and attend to mail due to their remote location. Purchase cards are used to pay invoices of less than $3,000 where possible to allow processing of low value invoices promptly. Credit Card Certification WaterNSW operates MasterCard Commercial Card facilities with Westpac. Cardholders certify all expenditure on purchase cards and independently verified by the cardholder’s supervisor. There is also continuous review of usage characteristics and authorisations to promote correct usage. WaterNSW and Westpac closely monitor card usage. Purchase card expenditure during 2016-17 complied with best practice and NSW Treasury guidelines.
117

Investment Performance Water NSW has placed funds on deposit through TCorp. These deposits are similar to money market or bank deposits and can be placed 'at call' or for a fixed term. For fixed term deposits, the interest rate payable by respective banks is negotiated initially and is fixed for the term of the deposit, while the interest rate payable on at call deposits can vary. At 30 June 2017 WaterNSW had $27.0 million invested in as at-call deposits with TCorp’s Hour-glass cash facilities. Performance of these investments is detailed below. Annualised performance of investment facility against benchmark (USB Bank Bill Index)
1 year 3 year 5 year 7 year
Actual performance 2.37 2.53 2.84 3.49
Benchmark performance 1.82 2.22 2.52 3.18
Variance 0.55 0.31 0.32 0.31
WaterNSW also had $115.0 million invested in fixed term deposits at the end of June 2017. The weighted average interest rate earned on these deposits was 2.58% on a weighted average balance of $82.7 million for 2016-17. Liability Performance WaterNSW has a Treasury Risk Management Policy (TRMP) to monitor and control its liability exposure. The key risks monitored by the TRMP are interest rate repricing risk, debt mix risk and liquidity limits.
Performance against Regulatory Benchmark
0%
10%
20%
30%
40%
50%
2017 2018 2019 2020 2021 2022 2023 2024 2025 2026 2027+
% o
f Fac
e Va
lue
Maturity
Benchmark Fixed Indexed
118
Economic Factors Affecting Performance There were no economic factors that affected achievement of WaterNSW’s operating objectives. Land Disposal WaterNSW did not dispose of any land in 2016-17. Cost of Producing Annual Report WaterNSW did not incur any external costs in the production of this Annual Report. Funds Granted to Non-Government Community Organisations WaterNSW did not grant any funds to non-government community organisations in 2016-17. Response to Audit Office Client Service Report significant matters The Audit Office Client Service Report did not identify any significant matters.
119
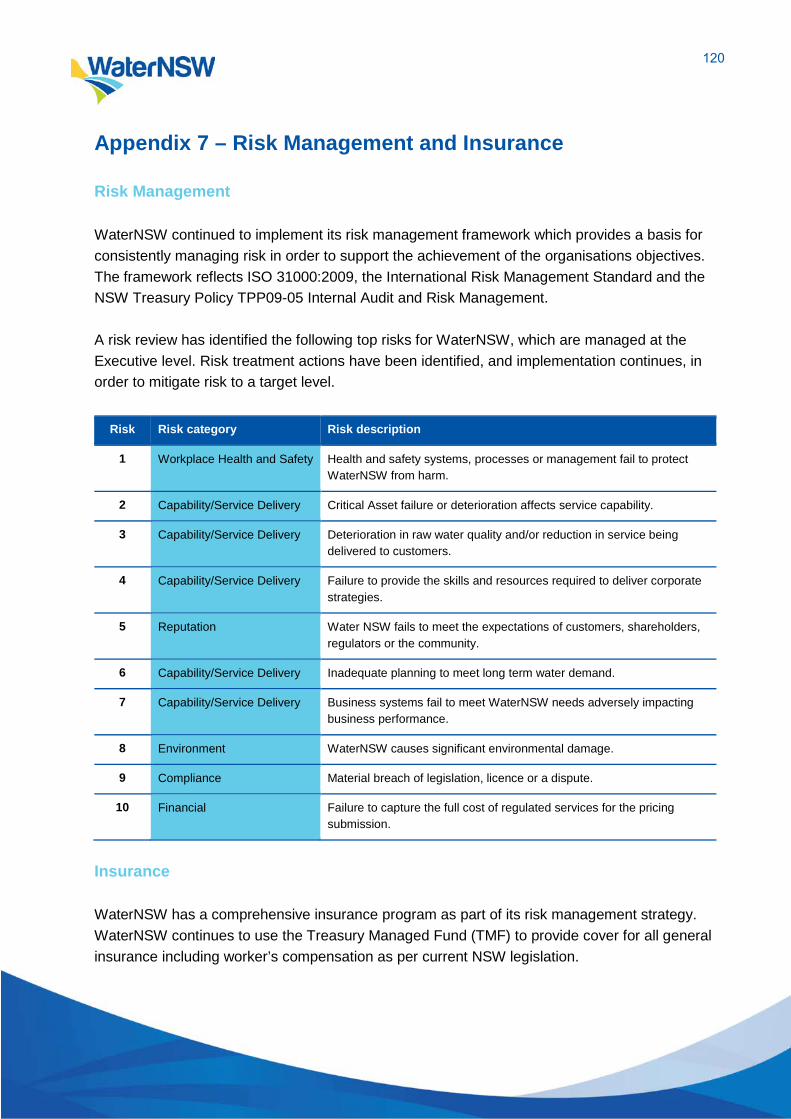
Appendix 7 – Risk Management and Insurance Risk Management WaterNSW continued to implement its risk management framework which provides a basis for consistently managing risk in order to support the achievement of the organisations objectives. The framework reflects ISO 31000:2009, the International Risk Management Standard and the NSW Treasury Policy TPP09-05 Internal Audit and Risk Management. A risk review has identified the following top risks for WaterNSW, which are managed at the Executive level. Risk treatment actions have been identified, and implementation continues, in order to mitigate risk to a target level.
Risk Risk category Risk description
1 Workplace Health and Safety Health and safety systems, processes or management fail to protect WaterNSW from harm.
2 Capability/Service Delivery Critical Asset failure or deterioration affects service capability.
3 Capability/Service Delivery Deterioration in raw water quality and/or reduction in service being delivered to customers.
4 Capability/Service Delivery Failure to provide the skills and resources required to deliver corporate strategies.
5 Reputation Water NSW fails to meet the expectations of customers, shareholders, regulators or the community.
6 Capability/Service Delivery Inadequate planning to meet long term water demand.
7 Capability/Service Delivery Business systems fail to meet WaterNSW needs adversely impacting business performance.
8 Environment WaterNSW causes significant environmental damage.
9 Compliance Material breach of legislation, licence or a dispute.
10 Financial Failure to capture the full cost of regulated services for the pricing submission.
Insurance WaterNSW has a comprehensive insurance program as part of its risk management strategy. WaterNSW continues to use the Treasury Managed Fund (TMF) to provide cover for all general insurance including worker’s compensation as per current NSW legislation.
120
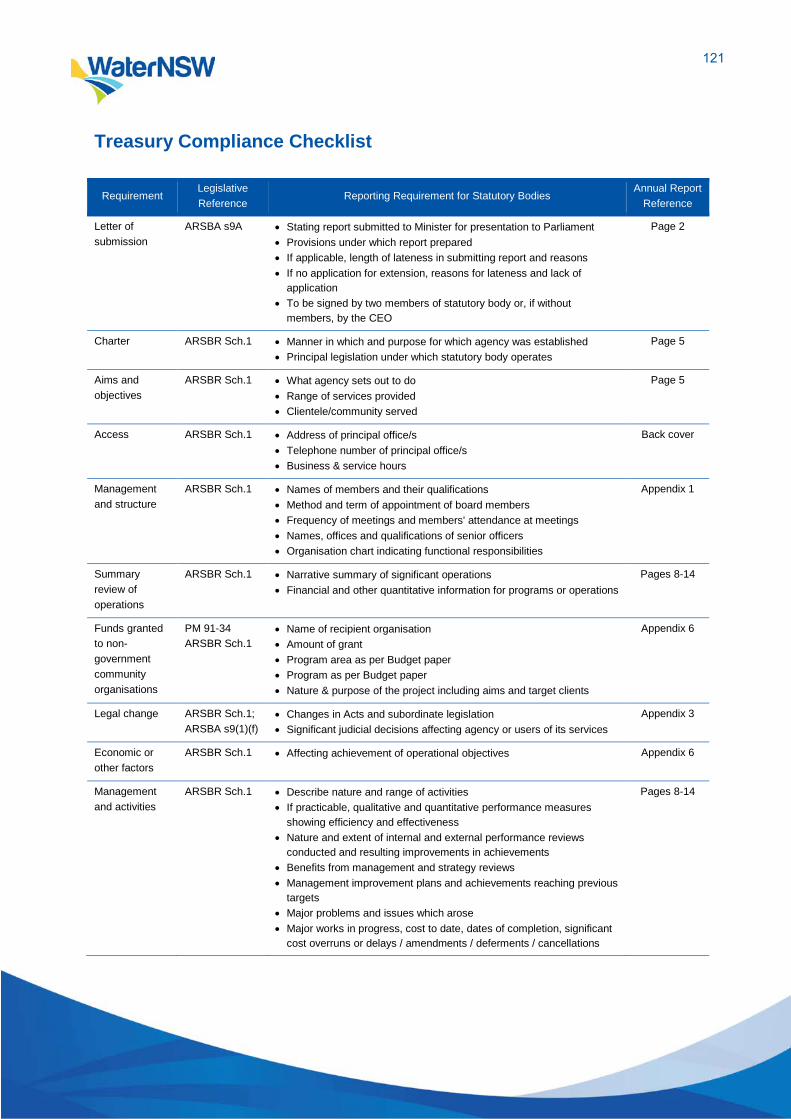
Treasury Compliance Checklist
Requirement Legislative Reference
Reporting Requirement for Statutory Bodies Annual Report
Reference
Letter of submission
ARSBA s9A • Stating report submitted to Minister for presentation to Parliament • Provisions under which report prepared • If applicable, length of lateness in submitting report and reasons • If no application for extension, reasons for lateness and lack of
application • To be signed by two members of statutory body or, if without
members, by the CEO
Page 2
Charter ARSBR Sch.1 • Manner in which and purpose for which agency was established • Principal legislation under which statutory body operates
Page 5
Aims and objectives
ARSBR Sch.1 • What agency sets out to do • Range of services provided • Clientele/community served
Page 5
Access ARSBR Sch.1 • Address of principal office/s • Telephone number of principal office/s • Business & service hours
Back cover
Management and structure
ARSBR Sch.1 • Names of members and their qualifications • Method and term of appointment of board members • Frequency of meetings and members' attendance at meetings • Names, offices and qualifications of senior officers • Organisation chart indicating functional responsibilities
Appendix 1
Summary review of operations
ARSBR Sch.1 • Narrative summary of significant operations • Financial and other quantitative information for programs or operations
Pages 8-14
Funds granted to non-government community organisations
PM 91-34 ARSBR Sch.1
• Name of recipient organisation • Amount of grant • Program area as per Budget paper • Program as per Budget paper • Nature & purpose of the project including aims and target clients
Appendix 6
Legal change ARSBR Sch.1; ARSBA s9(1)(f)
• Changes in Acts and subordinate legislation • Significant judicial decisions affecting agency or users of its services
Appendix 3
Economic or other factors
ARSBR Sch.1 • Affecting achievement of operational objectives Appendix 6
Management and activities
ARSBR Sch.1 • Describe nature and range of activities • If practicable, qualitative and quantitative performance measures
showing efficiency and effectiveness • Nature and extent of internal and external performance reviews
conducted and resulting improvements in achievements • Benefits from management and strategy reviews • Management improvement plans and achievements reaching previous
targets • Major problems and issues which arose • Major works in progress, cost to date, dates of completion, significant
cost overruns or delays / amendments / deferments / cancellations
Pages 8-14
121
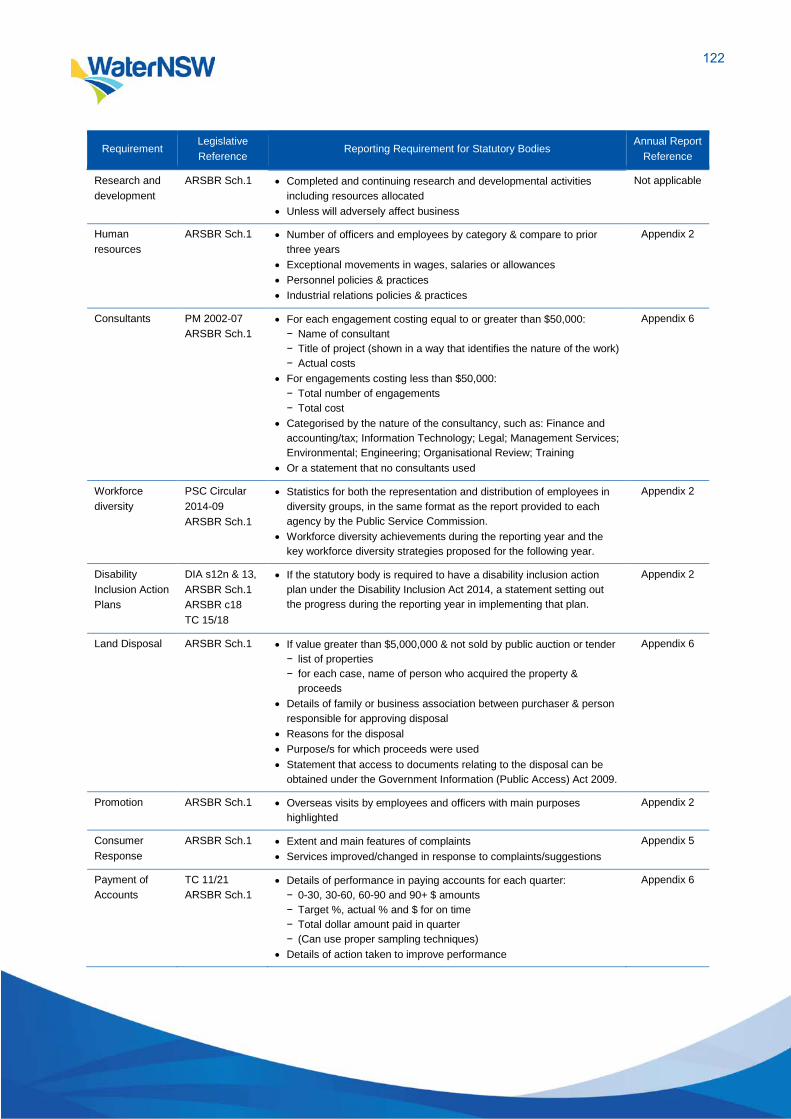
Requirement Legislative Reference
Reporting Requirement for Statutory Bodies Annual Report
Reference
Research and development
ARSBR Sch.1 • Completed and continuing research and developmental activities including resources allocated
• Unless will adversely affect business
Not applicable
Human resources
ARSBR Sch.1 • Number of officers and employees by category & compare to prior three years
• Exceptional movements in wages, salaries or allowances • Personnel policies & practices • Industrial relations policies & practices
Appendix 2
Consultants PM 2002-07 ARSBR Sch.1
• For each engagement costing equal to or greater than $50,000: − Name of consultant − Title of project (shown in a way that identifies the nature of the work) − Actual costs
• For engagements costing less than $50,000: − Total number of engagements − Total cost
• Categorised by the nature of the consultancy, such as: Finance and accounting/tax; Information Technology; Legal; Management Services; Environmental; Engineering; Organisational Review; Training
• Or a statement that no consultants used
Appendix 6
Workforce diversity
PSC Circular 2014-09 ARSBR Sch.1
• Statistics for both the representation and distribution of employees in diversity groups, in the same format as the report provided to each agency by the Public Service Commission.
• Workforce diversity achievements during the reporting year and the key workforce diversity strategies proposed for the following year.
Appendix 2
Disability Inclusion Action Plans
DIA s12n & 13, ARSBR Sch.1 ARSBR c18 TC 15/18
• If the statutory body is required to have a disability inclusion action plan under the Disability Inclusion Act 2014, a statement setting out the progress during the reporting year in implementing that plan.
Appendix 2
Land Disposal ARSBR Sch.1 • If value greater than $5,000,000 & not sold by public auction or tender − list of properties − for each case, name of person who acquired the property &
proceeds • Details of family or business association between purchaser & person
responsible for approving disposal • Reasons for the disposal • Purpose/s for which proceeds were used • Statement that access to documents relating to the disposal can be
obtained under the Government Information (Public Access) Act 2009.
Appendix 6
Promotion ARSBR Sch.1 • Overseas visits by employees and officers with main purposes highlighted
Appendix 2
Consumer Response
ARSBR Sch.1 • Extent and main features of complaints • Services improved/changed in response to complaints/suggestions
Appendix 5
Payment of Accounts
TC 11/21 ARSBR Sch.1
• Details of performance in paying accounts for each quarter: − 0-30, 30-60, 60-90 and 90+ $ amounts − Target %, actual % and $ for on time − Total dollar amount paid in quarter − (Can use proper sampling techniques)
• Details of action taken to improve performance
Appendix 6
122

Requirement Legislative Reference
Reporting Requirement for Statutory Bodies Annual Report
Reference
Time for Payment of Accounts
ARSBR Sch.1; TC 11/21
• Where interest was paid due to late payments, list of instances and reasons for delay which caused late payment.
Appendix 6
Risk management and insurance activities
ARSBR Sch.1 • Report on the risk management & insurance arrangements and activities affecting the agency.
Appendix 7
Multicultural Policies and Services Program
ARSBR Sch.1 ARSBR c18 TC 15/18
• Statement setting out the key multicultural strategies proposed for the following year
• Progress in implementing the statutory body’s multicultural policies and services plan
• Information as to the multicultural policies and services plans of any bodies reporting to the agency
Appendix 2
Work Health and Safety (WHS)
ARSBR Sch.1 ARSBR c18 TC 15/18
• Statement setting out WHS performance • Details of injuries and prosecutions under the Work Health and Safety
Act 2011
Appendix 2
Budgets ARSBA s7(1)(a)(iii) ARSBR c7(1)
• Detailed budget for the year reported on, including details of: − If this is the first budget approved − Adjustments to first budget approved
• Outline budget for following year
Appendix 6
Financial Statements
ARSBA s7(1)(a) (i) -(iia)
• Inclusion of Financial Statements • Controlled Entities’ Financial statements • Audit Opinion on Financial Statements • Response to significant issues raised by Auditor-General
Pages
Identification of audited financial statements
ARSBR c5 • At start and finish Page
Additional matters for inclusion in annual reports
ARSBR c8 • After balance date events having a significant effect in succeeding year on: − Financial operations − Other operations − Clientele/community served
• Total external costs (such as fees for consultants and printing costs) incurred in the production of the report.
• The website at which the report may be accessed (or the statutory body’s website).
Page
Investment performance
ARSBR c10; TC 17/02
• In the form of a comparison with a choice of “Hour Glass investment Facilities” from Treasury Corporation
• Choice of comparison based on nature and term of underlying liability • Stated in terms of annual compound percentage rate of return
Appendix 6
Liability management performance
ARSBR c11; TC 17/02
• Only if debt is greater than $20m • In the form of a comparison, details of agency’s liability portfolio
performance versus benchmark • Benchmark is notional portfolio constructed as risk neutral per
Treasurer
Appendix 6
123

Requirement Legislative Reference
Reporting Requirement for Statutory Bodies Annual Report
Reference
Numbers and remuneration of senior executives
ARSBR c12 PSC Circular 2016-05
• Number of senior executives employed at the end of the reporting yearbroken down by band and then gender within each band, comparedwith the numbers at the end of the previous reporting year
• Average total remuneration package of senior executives in each bandat the end of the reporting year, compared with the average at the endof the previous reporting year
• The percentage of total employee-related expenditure in the reportingyear that relates to senior executives, compared with the percentageat the end of the previous reporting year
Appendix 1
Implementation of Price Determination
IPARTA s18(4) If agency subject to determination or recommendation of Tribunal then: • Statement that it was implemented and details of implementation; or• Reasons for not being implemented.
Appendix 3
Credit card certification
TD 205.01 • Credit card certification to be attached Appendix 6
Government Information (Public Access) Act 2009
GIPAA s125(4), (6) GIPAAR c7, Sch 2; c12, Sch 3
• Details of the agency’s review under s7(3) of the Act during the yearand details of any information made publicly available as a result ofthe review
• Total number of access applications received during the year(including withdrawn applications but not including invalid applications)
• Total number of access applications received that agency refused,either wholly or in part, because the application was for disclosure ofinformation for which there is conclusive presumption of overridingpublic interest against disclosure
• Statistical information as described in Sch 2• Each agency referred to in Sch 3 of the Regulation (subsidiary
agency) is declared to be part of and included in the parent agencyspecified in Sch 3.
Appendix 4
Public Interest Disclosures (PID)
PIDA s31, PIDR c4, PM2013-13
Separately report on: • PIDs made by public officials in performing their day to day functions
as public officials• PIDs not covered above that are made under a statutory or other legal
obligation• All other PIDs.For each PID, a public authority should disclose the followinginformation:• Number of public officials who have made a PID to the public authority• Number of PIDs received by the public authority in total and the
number of PIDs received by the public authority relating to each of thefollowing:o corrupt conducto maladministrationo serious and substantial waste of public or local government moneyo government information contraventionso local government pecuniary interest contraventions
• Number of PIDs finalised• Whether the public authority has a PID policy in place• Actions taken to ensure staff awareness responsibilities under
s6E(1)(b) of the PIDA have been met.
Appendix 4
124
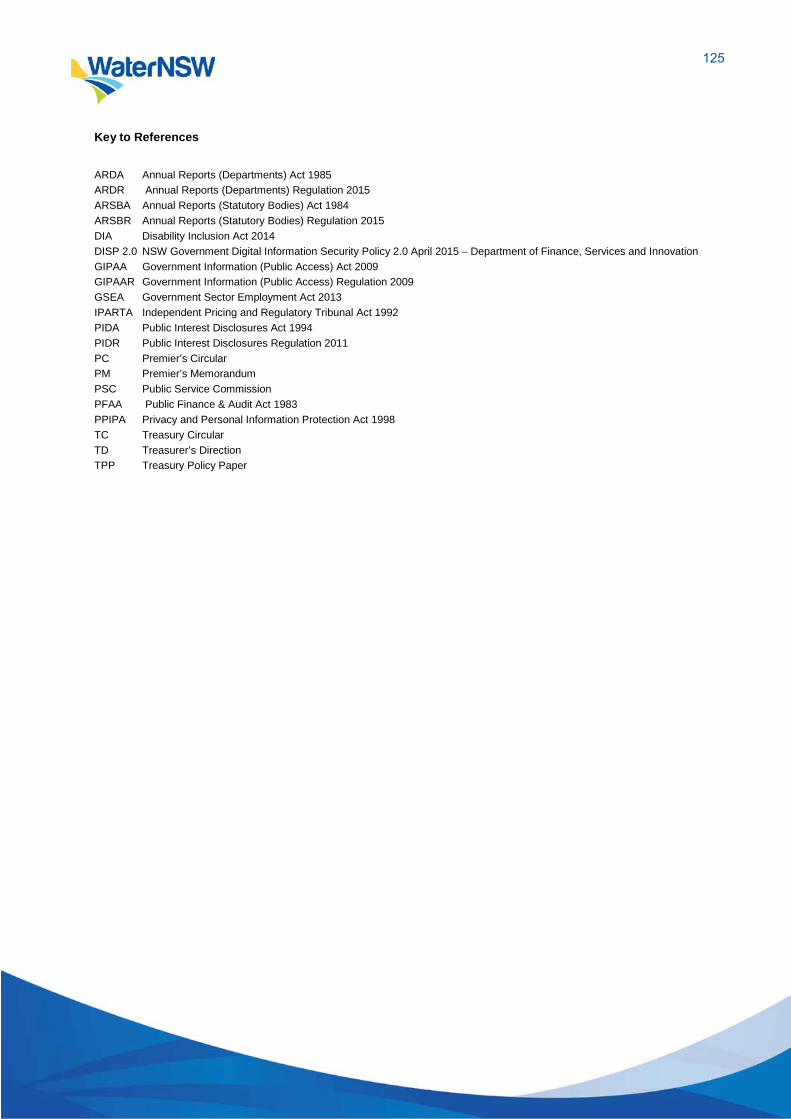
Key to References
ARDA Annual Reports (Departments) Act 1985 ARDR Annual Reports (Departments) Regulation 2015 ARSBA Annual Reports (Statutory Bodies) Act 1984 ARSBR Annual Reports (Statutory Bodies) Regulation 2015 DIA Disability Inclusion Act 2014 DISP 2.0 NSW Government Digital Information Security Policy 2.0 April 2015 – Department of Finance, Services and Innovation GIPAA Government Information (Public Access) Act 2009 GIPAAR Government Information (Public Access) Regulation 2009 GSEA Government Sector Employment Act 2013 IPARTA Independent Pricing and Regulatory Tribunal Act 1992 PIDA Public Interest Disclosures Act 1994 PIDR Public Interest Disclosures Regulation 2011 PC Premier’s Circular PM Premier’s Memorandum PSC Public Service Commission PFAA Public Finance & Audit Act 1983 PPIPA Privacy and Personal Information Protection Act 1998 TC Treasury Circular TD Treasurer’s Direction TPP Treasury Policy Paper
125

Contact Information General enquiries Telephone 1300 662 077 Customer Service [email protected] WaterNSW website www.waternsw.com.au Principal Offices Parramatta Level 14, 169 Macquarie Street Parramatta NSW 2150 PO Box 398, Parramatta NSW 2124 Albury Riverina Highway via Albury NSW 2640 Private Bag 2, Wodonga VIC 3691 Leeton 63 Kurrajong Avenue Leeton NSW 2705 PO Box 1128, Leeton NSW 2705 Dubbo 7 Commercial Avenue Dubbo NSW 2830 PO Box 1018, Dubbo NSW 2831 Tamworth 170 Peel Street Tamworth NSW 2340 PO Box 1251, Tamworth NSW 2340 ABN 21 147 934 787
126


![WaterNSW Operations update - WaterNSW - WaterNSW · Regulated river (high security) [Town Water Supply] 3,195 0 3,195 0 0 0 3,195 Supplementary water 252,468 0 252,468 0 0 0 252,468](https://static.fdocuments.us/doc/165x107/5ebcdae167a54f6c2f7ffbbb/waternsw-operations-update-waternsw-waternsw-regulated-river-high-security.jpg)


